2017 biennial energy report and state energy … biennial energy report and state energy strategy...
TRANSCRIPT
2017 Biennial Energy Report and State Energy Strategy Update
Issues, Analysis & Updates
December 2016 Report to the Legislature
Brian Bonlender, Director

2017 Biennial Energy Report and State Energy Strategy Update i
Acknowledgements
This document was authored by the Washington Department of Commerce State Energy Office.
Michael Furze Assistant Director, Energy Division Tony Usibelli Special Assistant to the Director on Energy and Climate Policy Glenn Blackmon Senior Energy Policy Specialist Angela Burrell Research Analyst Peter Moulton Energy Policy Section Manager, Interagency Coordination Chuck Murray Senior Energy Policy Specialist Greg Nothstein Carbon, Fuel and Data Energy Specialist Elizabeth Osborne Energy Specialist, Northwest Power Council and Energy Office Carolee Sharp Editor
Washington State Department of Commerce State Energy Office 1011 Plum Street SE P.O. Box 42525 Olympia, WA 98504-2525 www.commerce.wa.gov/energy For people with disabilities, this report is available on request in other formats. To submit a request, please call 360-725-4000 or (TTY 360-586-0772).

2017 Biennial Energy Report and State Energy Strategy Update ii
Table of Contents
Executive Summary ....................................................................................................................... iii
Introduction ..................................................................................................................................... 5
Chapter 1 – Energy Independence Act ......................................................................................... 6
Chapter 2 – Clean Energy Fund ................................................................................................... 15
Chapter 3 – Seventh Power Plan ................................................................................................. 17
Chapter 4 – Status of State Energy Strategy Recommendations ............................................. 19
Chapter 5 – Cascadia Rising Functional Exercise ..................................................................... 32
Chapter 6 – Energy Indicators ..................................................................................................... 35
Appendix A: Methodology ........................................................................................................... 75
Appendix B: Energy Indicator Data ............................................................................................. 78

2017 Biennial Energy Report and State Energy Strategy Update iii
Executive Summary
In 1991, the Washington State Legislature passed RCW 43.21F.045, requiring the Department of Commerce to submit biennial energy reports that advise the Governor and the Legislature on energy matters affecting the state.
Commerce’s strategic efforts since the 2014 Biennial Energy Report have increased efficient transportation, building efficiency, and distributed energy. These gains add to the benefits of previous investments in energy efficiency and clean technology. Washington continues to be rated in the top 10 states for energy policy by the American Council for an Energy Efficient Economy.
Although Washington’s low-cost, low-carbon grid offers a unique set of challenges, the state continues to develop the regulatory framework, policy tools, stakeholder partnerships, and resources necessary to continue our state’s long commitment to efficiency and renewable energy. Our major challenge is effectively supporting the diverse stakeholders navigating the early stages of the energy sector’s transformation.
The Seventh Power Plan and utility compliance with I-937, the Energy Independence Act (EIA), offer a path forward. Utilities remain on track to meet all of the current energy efficiency and renewable energy targets of the EIA. The EIA’s cost-cap provisions may undermine the future effectiveness of the renewable energy standard. Commerce intends to examine possible changes to agency rules implementing the cost-cap provision and may recommend statutory changes, if necessary.
In February 2016, the Northwest Power and Conservation Council issued its Seventh Power Plan. This multistate regional roadmap analyzed the electricity needs of the region over the next 20 years. The plan’s least-cost, least-risk planning criteria lead to three conclusions. First, the region can meet nearly all of its new electricity demand through investments in cost-effective energy efficiency. Second, the region will need to find new ways to meet peak electricity demands. Third, the region’s carbon dioxide emissions from the electricity sector could be reduced by 20 million metric tons, from 54 million metric tons in 2015 to 34 million metric tons by 2035, due to retiring coal generation, and could be reduced to 16 million tons by 2035 with investments in efficiency and demand management. Achieving these results may require that Washington utilities adopt higher conservation targets under the EIA.
The Clean Energy Fund (CEF) supports development, demonstration and deployment of clean energy technologies. Washington’s second installment of modest public investment leverages private and non-state funds, helps support second-stage market transformation investment and continues leading edge investment in innovations suggested by the first set of CEF investments. This biennium, CEF continues supporting three areas: renewable energy systems and efficiency upgrades, innovative research, development and demonstration (RD&D) technology, and grid modernization. Advanced manufacturing represents a new focus area. The

2017 Biennial Energy Report and State Energy Strategy Update iv
projects save energy, reduce energy costs, reduce harmful air emissions, and increase energy independence for our state.
Washington has emerged as one of the leading states for deployment of electric vehicles. New state actions have included four important measures:
Reauthorization of the state sales tax incentive for electric vehicles (EV).
Commitment that 20 percent of annual agency passenger vehicle purchases are EVs.
Funding of a state EV infrastructure pilot program with the Washington State Department of Transportation (WSDOT).
Efforts to direct funding from the Volkswagen diesel vehicle settlements to additional electric vehicle infrastructure.
Additional opportunities to expand transportation electrification – from buses and ferries to motorcycles and autonomous vehicles – are already on the horizon.
Commerce continued to work with communities throughout the state to reduce the soft costs of solar energy installation. Washington also collaborated with other West Coast states and cities on improving and expanding energy benchmarking for non-residential buildings.
Cascadia Rising, a four-day functional exercise, brought additional focus to the need for a resilient grid. The exercise tested Commerce’s responsibility as the lead agency for the state’s Emergency Support Function 12 – Energy. Participants responded to a magnitude 9.0 earthquake and tsunami originating from the offshore Cascadia Subduction Zone (CSZ), highlighting the importance of increasing the resilience of the grid as it is transformed.
Cascadia Rising identified both strengths and weaknesses in ESF 12 planning. Specific opportunities include developing pre-disaster collaboration agreements with Oregon and Idaho, forming stronger relationships with energy utilities to increase access to information and operational coordination, and development of a fuel allocation plan that supports coordinated response to the disaster.
The challenge of navigating the early stages of the energy sector’s transformative change is interwoven with the need to reduce greenhouse gas emissions. Commerce will work with other cabinet level agencies to meet the state’s obligations to reduce greenhouse gas emissions while maintaining competitive energy prices. These efforts will need to take into account the shifting federal energy agenda and emerging external considerations, such as the California Independent System Operator, the energy imbalance market and the Volkswagen Settlement Agreement.
While neither issue can be contained by Washington’s borders, the solutions crafted in a low-carbon, low-cost state offer tremendous export potential across the country and the globe. A third round of Clean Energy Funding will build on previous investments and add new areas of innovation that will allow our state to remain a leader in the clean energy economy.
2017 Biennial Energy Report and State Energy Strategy Update 5
Introduction
Background
Every two years, the Department of Commerce (Commerce) State Energy Office provides a status report, recommendations on recent trends in energy prices and expenditures, and updates on a series of energy indicators (RCW 43.21F.045).
This report begins with a brief summary of Washington state utilities’ full compliance with conservation and renewable resource targets under the Energy Independence Act. Chapter 2 summarizes the Clean Energy Fund. Chapter 3 describes the Seventh Power Plan update. In Chapter 4 is the status of action items from the 2012 Washington State Energy Strategy. Chapter 5 provides an overview of the Cascadia Rising exercise, as well as recommendations and next steps on Emergency Support Function 12 (ESF-12) plans. The final chapter and appendices of this report provide a comprehensive treatment of energy system indicator data dating from 1970, although the most recent U.S. Department of Energy data is from 2014.
Washington State Energy Office
Energy drives the economy. The State Energy Office (SEO) strengthens Washington’s communities through four critical activities: energy data analysis, energy policy development, program design and implementation, and emergency energy planning. In January 2016, Commerce incorporated the SEO into a new Energy Division, elevating the position of the office within the agency, and providing additional structure and support to SEO’s responsibilities.
The office follows, analyzes and reports on key energy issues, policies and programs related to alternative fuels, energy efficiency, renewable energy development, greenhouse gas emissions, energy supply, prices, security and reliability. This knowledge base allows SEO to provide expert energy policy support, analysis and information for the Governor, Legislature, Commerce, and other energy decision makers. In addition, SEO acts as a technical and policy resource to Washington members of the Northwest Power and Conservation Council, other state agencies, and state congressional officials on federal and regional energy policies and legislation.
The SEO holds responsibility for ESF-12, ensuring statewide energy security and preparedness by protecting the states’ energy infrastructure, especially electricity, petroleum and natural gas. During energy supply or other energy emergencies, SEO provides assistance to the state emergency operations center, the Governor's Office, energy companies, utilities, local governments, and others. It works to ensure that energy shortages are controlled, reducing impacts on the health and safety of citizens, businesses and our economy.

2017 Biennial Energy Report and State Energy Strategy Update 6
Chapter 1 – Energy Independence Act
Utilities are on track to meet all of the current energy efficiency and renewable energy targets of the Energy Independence Act (I-937). It appears that higher utility conservation targets will be required if the state is to capture all of the cost-effective potential identified in the new Seventh Power Plan. The EIA’s cost cap provisions may undermine the future effectiveness of the renewable energy standard. Commerce intends to examine possible changes to agency rules implementing the cost cap provision and may recommend statutory changes if it concludes that rule changes would not be a workable solution.
Energy Conservation
Every utility has exceeded its energy conservation target in each of the three, two-year performance periods completed since the law took effect in 2010, according to the annual performance reports that each utility submits to Commerce. As a group, achievement exceeded targets by an average of 41 percent. All reported results are subject to review by the Utilities and Transportation Commission (for investor-owned utilities), the Washington State Auditor (for municipal utilities and public utility districts), or an independent auditor (for cooperative utilities). The conservation savings represent a significant resource for Washington utilities. Assuming the utilities meet their 2016-2017 targets as expected, the cumulative amount of energy saved will exceed 10 percent of the electricity delivered to customers in 2009, which is the last year before the law took effect. Individual utility achievements range from 7.1 percent to 11.9 percent. These savings provide an ongoing benefit to the state, since virtually all conservation measures produce savings for multiple years. This cumulative achievement measure compares favorably to the amount of conservation that utilities identified in their initial conservation-potential assessments adopted when the law took effect. In 2009, the utilities identified 955 aMW of conservation potential available through 2020. Assuming the utilities meet their 2017-2018 targets, the utilities will acquire 876 aMW during the first eight years of the 10-year potential, leaving them on track to acquire 100 percent within the first 10-year period.
2017 Biennial Energy Report and State Energy Strategy Update 7
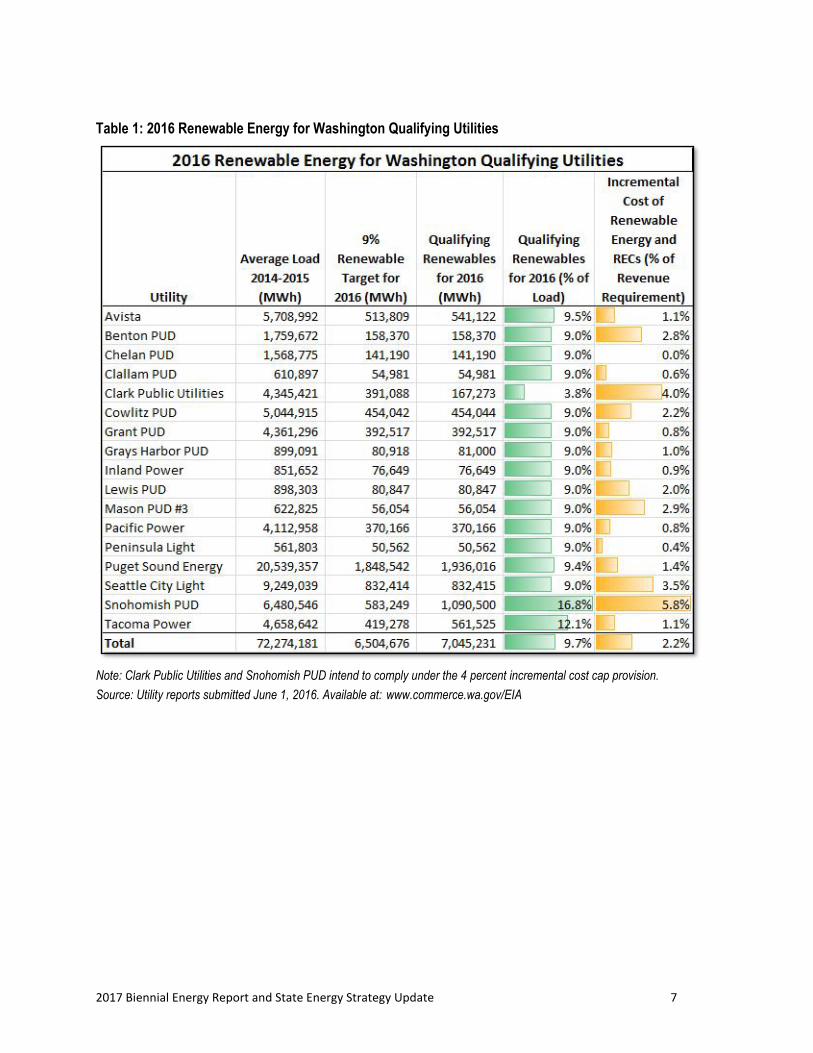
Table 1: 2016 Renewable Energy for Washington Qualifying Utilities
Note: Clark Public Utilities and Snohomish PUD intend to comply under the 4 percent incremental cost cap provision.
Source: Utility reports submitted June 1, 2016. Available at: www.commerce.wa.gov/EIA

2017 Biennial Energy Report and State Energy Strategy Update 8
Table 2: 2014-2015 Conservation Targets and Acquisitions
Source: Utility reports submitted June 1, 2016. Available at: www.commerce.wa.gov/EIA
Future Prospects for Conservation
Our current assessment of the EIA’s conservation mechanism is mostly positive, but the future holds a number of challenges as well. In some cases, utilities have set conservation targets in the current round (2016-2017) that are significantly lower – up to 58 percent lower – than the targets set by those utilities in the first three two-year performance periods. Three of the 17 utilities adopted higher targets for 2016-2017, but the statewide total is 4 percent lower. At 161 aMW, the 17-utility total target for 2016-2017 appears to be below the level required to meet regional conservation targets established in the Seventh Power Plan.1
1 The Seventh Plan shows 336 aMW of conservation development in 2016-2017 in the existing policy scenario, and 368 aMW in the carbon cost scenario. Washington’s share of regional electricity load is about 52 percent, so Washington’s share of the regional target would be approximately 190 aMW.

2017 Biennial Energy Report and State Energy Strategy Update 9
A second challenge facing the state’s conservation programs has to do with the mix of conservation resources that are being acquired by utilities. In the target-setting process, all conservation measures are counted based on the amount of energy saved in a single year. A measure that saves 100 kWh for two years counts equally with a measure that saves 100 kWh for 45 years. Counting all measures based on first-year savings may discourage pursuit of longer-lived, more expensive measures, despite their cost-effectiveness. In 2016, the Commerce revised its rules concerning the conservation target-setting process. The rule review was prompted by the adoption in early 2016 of the Seventh Power Plan, which included revisions to the methodologies used to determine cost-effective conservation potential. A rulemaking was required to enable utilities to use the Seventh Plan methodologies in their individual target-setting. Commerce also updated the rule language in an effort to ensure that utilities take full advantage of the conservation potential identified by the regional council.
Renewable Energy
The renewable energy provisions of the EIA require that utilities serve their customers using a resource portfolio that includes renewable energy. The renewable portfolio standard started in 2012 at 3 percent of retail electricity sales, and it increased in 2016 to 9 percent of sales. The third and final standard of 15 percent takes effect in 2020. Eligible renewable energy is limited to certain fuel types and, in most cases, it must be generated at a plant that started operation after 1999. While hydro power is defined as a renewable resource, only incremental generation due to efficiency improvements may be counted toward the EIA standard. As with the conservation standard, utilities have consistently reported compliance with the renewable energy requirements. In 2016, the 9 percent renewable target was 743 aMW, and the 17 utilities covered by the EIA reported plans to use 804 aMW.2 Wind energy accounts for 71 percent of the resources used to meet the renewable requirement, with incremental hydro generation the No. 2 resource at 12 percent. In 2016, a new resource type was added to the eligibility list – “qualified biomass energy” – and it accounted for 4 percent of the compliance resources. The Legislature allowed a limited amount of energy from pre-1999 biomass generating facilities to count as “qualified biomass energy.” Increasing Significance of the Cost Cap
The renewable requirements of the EIA are limited by two provisions intended to limit the cost burden on utility customers. One provision limits a utility’s costs for renewables to 4 percent of the utility’s retail revenue requirement. This cost cap counts only the “incremental” cost of renewable energy – the additional cost over what a comparable non-renewable resource would cost – plus the
2 The actual renewable percentage is likely less than the amount reported. Snohomish PUD reported renewable energy equal to 16.8% of its load and is unlikely to use the entire amount for EIA compliance.

2017 Biennial Energy Report and State Energy Strategy Update 10
cost of renewable energy credits (RECs).3 The second provision limits a utility’s cost for renewables to 1 percent of its retail revenue requirement. This version of the cost cap counts the total spending on renewables (rather than the incremental cost), but it is available only to utilities that are not experiencing load growth. These cost-cap provisions are expected to play an increasing role in utilities’ EIA compliance approaches, because, unlike the renewable targets themselves, the cost caps do not increase over time. The factors that are likely to contribute to increased use of the cost cap are described below, but the expected increase is not due to any anticipated increase in the cost of renewable energy. To the contrary, renewable energy costs have generally decreased since the EIA was enacted in 2006.4 Utilities are nonetheless reporting higher costs for the renewable energy and RECs used to meet the EIA requirements. In 2014, utilities reported $113 million as the aggregate cost of EIA renewables, and in 2015, the reported amount increased to $116 million. In 2016, when the renewable target changed from 3 percent to 9 percent, utilities reported expenditures of $133 million. The 2016 amount represents 2.2 percent of the retail electricity revenue of the reporting utilities, and an average cost of 1.9 cents per kWh. While the reported statewide overall cost of renewables is well below the 4 percent cost cap, these costs are not spread uniformly across utilities. Some utilities report little or no additional cost for their renewable energy, while others report substantial costs. In 2016, four of the 17 utilities reported incremental costs in excess of 3 percent. Three other utilities reported costs between 2 percent and 3 percent. These seven utilities represent about 40 percent of market covered by the EIA. Substantial Impact of the Cost Cap
The cost cap can have a substantial effect on the amount of renewable energy utilities actually use in serving their customers. The experience of Clark Public Utilities provides an example of this effect, since it reduced Clark’s renewable obligation by 70 percent in 2014. Clark’s target in 2014 under the 3 percent standard was 15.1 aMW. However, Clark used the 1 percent cost cap for no-growth utilities. It identified costs of $88 per MWh for renewable energy credits from the Combine Hills II wind facility. At that cost per REC, Clark met the 1 percent threshold using 4.5 aMW of renewable energy.
3 For example, if the cost of non-renewable electricity cost is 5 cents per kWh and the cost of renewable electricity is 7 cents per kWh, the incremental cost of the renewable electricity is 2 cents per kWh. A REC represents the non-energy or renewable attributes of electricity. One would generally expect the incremental cost of renewable energy to be similar to the cost of a REC. 4 The U.S. Energy Information Administration estimates the levelized cost of energy (LCOE) from a utility-scale wind project entering service in 2022 to be $50.90 per MWh. The LCOE of natural gas plant entering service in 2022 is projected to be $55.80 per MWh. Source: Levelized Cost and Levelized Avoided Cost of New Generation Resources in the Annual Energy Outlook 2016, August 2016, www.eia.gov/forecasts/aeo/pdf/electricity_generation.pdf.

2017 Biennial Energy Report and State Energy Strategy Update 11
In 2016, Clark’s renewable energy requirement under the 9 percent standard would be 44.6 aMW. However, the utility intends to use the 4 percent cost standard in 2016, using RECs that it values at $83 per MWh. This will reduce the amount of renewable energy used to serve Clark’s customers from 9 percent to 3.8 percent – a 57 percent reduction due to the cost cap provision. Snohomish PUD also intends to use the 4 percent cost cap method for its 2016 compliance. However, it was not possible to discern from Snohomish’s report how this will affect the amount of renewable energy and RECs used for compliance. Snohomish’s report indicates that it will exceed both the 9 percent renewable resource target and the 4 percent renewable cost cap. Increased Reporting of Renewable Costs
The growing concern about the effect of the cost cap prompted Commerce to revise its reporting requirements starting in 2016. Utilities previously reported a single amount equal to renewable cost as a percentage of retail revenue. The 2016 report requires information on the cost of each energy source and RECs from individual generating facilities. For each non-REC resource, utilities must identify the non-renewable substitute resource and the cost of that substitute resource. The project-level reporting has revealed great inconsistency among utilities in the costs reported for the same renewable sources. The table below shows the range of costs being reported for a selection of generating facilities. These costs are the reported incremental cost of renewable resources, where a utility is using the renewable energy for compliance, and the reported cost of RECs. Some utilities reported energy or RECs without reporting cost information; the minimum cost figures do not include these non-reporting utilities.
Table 3: WREGIS Facility Reported Cost per MWh
Generating Facility Name (WREGIS ID)
Number of Utilities Reporting
Maximum Reported Cost
(per MWh)
Minimum Reported Cost
(per MWh)
Condon Wind Power Project (W774) 11
(1 with missing cost data)
$65.00 $0.00
Condon Wind Power II (W833) 11
(1 with missing cost data)
$64.53 $0.00
Nine Canyon Wind Project (W684) 5 $54.83 $6.25
Priest Rapids Project (includes Wanapum Dam)
3 $0.11 -$13.84
White Creek Wind 1 (W360) 5 $77.00 $5.00
The utility cost reports also show considerable variety in the methods used to calculate the incremental cost of eligible renewable resources. The statute requires that the levelized cost of the renewable resource be compared to the levelized cost of a reasonably available non-renewable substitute resource, with the substitute resource having the same contract length or

2017 Biennial Energy Report and State Energy Strategy Update 12
facility life.5 Many utilities used some measure of wholesale spot market prices as the substitute resource cost. Other utilities used the cost of purchasing power from the Bonneville Power Administration under its Tier 1 offering. In one case, a utility reported incremental costs that appear to fall outside the statutory framework of comparing the cost of renewable energy to the cost of substitute non-renewable energy. Tacoma Power reported incremental costs of $59,570 for incremental hydro in 2016. The utility’s report explains that this is the additional cost incurred due to using an apprentice labor program in the reconstruction of its hydro facilities. The EIA provides a 20 percent bonus credit for energy from projects that use apprentice labor. Tacoma receives no additional energy as a result of using apprentice labor, but its energy counts for 20 percent more toward EIA compliance. Under the statutory approach, Tacoma would likely have reported a zero or negative amount as incremental cost, since the actual cost of renewable energy from the efficiency improvements apparently was less than the cost Tacoma would have incurred to obtain an equal amount of non-renewable energy. Many utilities recognize that the cost calculations reported to Commerce are not consistent with the requirements that would apply if the utility were actually using the cost cap compliance method. These utilities develop a rough estimate of renewable costs solely for reporting purposes, using a short-term market rate or the current price of BPA Tier 1 power and without performing any levelization calculations. It does not follow that these utilities would expect to claim the same cost amounts if they were electing the cost cap compliance method. Using Legacy Resource Costs as the Substitute for New Renewable Resources
There are a number of reasons that the BPA Tier 1 product is not a good measure of the cost of a non-renewable substitute resource:
The term of the BPA Tier 1 contract is not equal to the various terms of renewable resources being claimed by utilities.
The rates for BPA Tier 1 power are subject to change over time through the agency’s rate case process.
For most utilities, BPA Tier 1 power is not “reasonably available” as a source of additional energy comparable to the additional energy provided by a new renewable resource; utilities entitled to Tier 1 power typically contract for the maximum amount to which they are entitled.6
5 RCW 19.285.050. “Levelized” means the costs are averaged over multiple years, taking account of the effects of inflation and interest. 6 WAC 194-37-190(1)(e) allows a utility to use foregone power purchases from BPA as the measure of substitute resource cost. However, a utility may do so only if it reduces a portion of its entitlement to BPA power.

2017 Biennial Energy Report and State Energy Strategy Update 13
The BPA Tier 1 product does not consist exclusively of non-eligible resources, since it includes small amounts of wind energy.
In sum, the Tier 1 product represents an entitlement to low-cost legacy resources that is not appropriately used in comparing the cost of a new renewable resource to the cost that utility would have incurred in the absence of the EIA’s requirement to use renewable energy to serve customers. This view that the legacy-based Tier 1 product is not appropriate as the substitute resource is supported by BPA’s rationale for establishing a tiered rate structure, where Tier 1 consisted of legacy resources and legacy costs and Tier 2 would consist of new resources and new costs. BPA’s rationale for the tiered rate structure is in a 2012 fact sheet7, which does not address the Washington law specifically:
By setting Tier 2 rates based on the costs of acquiring new power sources, the tiered rate design better facilitates the acquisition of renewable energy. Renewable energy no longer needs to compete against BPA’s embedded cost of power, which is much lower. Instead, renewable energy will compete directly with other new sources of power.8
Alternating Compliance Between the Energy and Cost Approaches
Another potential compliance issue is the alternating use (from year to year) of renewable energy target and the cost cap. The EIA provides a three-year window of eligibility for RECs, and this may permit a utility to arrange the RECs in a way that makes cost-cap compliance feasible even if the utility’s long-term incremental costs are less than 4 percent. If a utility has a mix of RECs that have different costs, it may be able to take three years of its most expensive RECs and use those to meet the cost cap in a single year, while holding its less expensive RECs to meet the energy target in the next year. This approach could open the cost-cap approach to more utilities, even if only every other or every third year, and could lead to a lower overall level of renewable energy use by Washington utilities. Further Review of Cost-Cap Implementation Issues
Commerce finds there is significant potential for improper implementation of cost cap to undermine the effectiveness of the Energy Independence Act and impede our state’s progress
7 www.bpa.gov/news/pubs/FactSheets/fs-201204-bpa-new-tiered-rate-structure-offers-greater-control-over-power-costs.pdf 8 Bonneville Power Administration fact sheet: BPA’s new tiered rate structure offers greater control over power costs, April 2012. www.bpa.gov/news/pubs/FactSheets/fs-201204-bpa-new-tiered-rate-structure-offers-greater-control-over-power-costs.pdf

2017 Biennial Energy Report and State Energy Strategy Update 14
in meeting its clean energy goals. These concerns apply when utilities are determining the incremental cost of renewable energy, and when they are deciding what cost to assign to RECs.
In its 2017-2019 Strategic Initiatives,9 Commerce adopted an approach to examine possible changes to agency rules implementing the cost-cap provision, and may recommend statutory changes if it concludes that rule changes would not be a workable solution.
9 Commerce 2017-2019 Operating Budget Book, p. 99. www.commerce.wa.gov/wp-content/uploads/2016/09/2017-19-Operating-Budget.pdf

2017 Biennial Energy Report and State Energy Strategy Update 15
Chapter 2 – Clean Energy Fund
The state Legislature invested in clean energy development through two appropriations to the Clean Energy Fund (CEF) between 2013 and 2017. The CEF enables a mix of projects to support development, demonstration, and deployment of clean energy technologies. They save energy, reduce energy costs, reduce harmful air emissions, and increase energy independence for our state. CEF investments help strengthen communities all across the state. The fund is also an opportunity to strengthen communities by developing new businesses and jobs.
Since 2013, the Legislature has appropriated $76 million for the CEF. In 2015, it approved over $100 million in capital budget funds to invest in clean energy and energy efficiency development and deployment, which included $40 million for the Washington State Clean Energy Fund.
2013-2015 Clean Energy Fund 1 – Programs ($36 million)
Energy Revolving Loan Fund ($15 million) – Finances use of proven building energy efficiency and renewable energy technologies that currently lack access to capital (residential and commercial sectors).
Status: Fully allocated $14.5 million to two grantees.
Smart Grid Grants to Utilities ($15 million) – Demonstrates improved integration of renewables through energy storage and information technologies, improves reliability, and reduces the costs of intermittent renewable or distributed energy.
Status: Fully allocated $14.5 million to four grantees.
Federal Grant Matching Funds ($6 million) – Washington research institutions develop or demonstrate clean energy technologies that have been demonstrated as viable in prior published work, yet are not commercially available.
Status: Fully allocated $5.8 million to eight projects.
2015-2017 Clean Energy Fund 2 – Programs ($40 million)
Energy Revolving Loan Fund Grants ($10 million) – Matching grants for loan loss reserves or interest rate buy-downs for proven building energy efficiency and renewable energy technologies that currently lack access to capital, generating opportunities within the residential and commercial sectors.
Status: Fully allocated $9.7 million to three grantees.
2017 Biennial Energy Report and State Energy Strategy Update 16
Grid Modernization Grants to Utilities ($13 million) – Matching grants to advance integration of renewables through energy storage and information technology, improved reliability, and reduced costs of intermittent renewable or distributed energy.
Status: Negotiating grant agreements with five utility finalists.
Research Matching Fund Grants ($10 million) – Matching grants to support clean energy research and development awarded from competitive solicitations.
Status: Negotiating grant agreements with eight finalists totaling $7.5 million in match grants. An additional $2.2 million in grants will be available for applications in late 2016.
Credit Enhancement Grants ($6.6 million) – Matching grants for loan loss reserves, interest rate buy-downs and other credit support for the development of new or expansion of existing in-state renewable energy manufacturing.
Status: The Washington Economic Development Finance Authority pre-qualifies applicants for this program. Commerce is currently awaiting the first round of applications for review for interest rate buy-down; $6.6 million is available for grants.

2017 Biennial Energy Report and State Energy Strategy Update 17
Chapter 3 – Seventh Power Plan
In February 2016, The Northwest Power and Conservation Council issued its Seventh Power Plan. The plan, covering Washington, Oregon, Idaho, and Montana, serves as a regional roadmap and directional document for the electricity needs of the region over the next 20 years. Based on least-cost, least-risk planning criteria, it concluded that:
The region can meet nearly all of its new electricity demand through investments in cost-effective energy efficiency. By 2035, the region should invest in approximately 4,300 average megawatts (more than 37 million megawatts hours).
In the near term and over the next 20 years, the region will need to find new ways to meet peak electricity demands. In addition to the capacity contribution of energy efficiency, the plan found that 600 megawatts of demand-response technologies and strategies are cost effective to acquire.
Carbon dioxide emissions from the electricity sector are forecast to decrease from 54 million metric tons in 2015 to 34 million metric tons by 2035 (based on current planned coal plant retirements). Retiring all the remaining coal generation in the region, coupled with additional investments in efficiency and demand management, emissions could fall to 16 million tons by 2035.
Seventh Plan Resource Strategy
Energy Efficiency Development o 1400 average megawatts (aMW) by 2021 o 3000 aMW of cost-effective conservation by 2026 o 4300 aMW by 2035
Expand Use of Demand Response o Develop at least 600 MW of demand-response resources by 2021
Natural Gas o Increase use of existing gas generation to offset coal plant retirements o While there is a very low probability of regional need for new gas-fired
generation prior to 2021, individual utility circumstances and need for capacity and other ancillary services may dictate development
Seventh Power Plan Action Items for States
States can help improve the region’s analytical capabilities, participate in public processes that affect efficiency and resource development outcomes, and help shape regulations or other guidance for utility implementation of the resource strategy. In addition, state agency staff contribute to Northwest Power and Conservation Council advisory committees, the Regional Technical Forum and public processes related to plan implementation at the Bonneville Power Administration.

2017 Biennial Energy Report and State Energy Strategy Update 18
Achieve the regional goal for cost-effective conservation resource acquisition.
Develop and implement methods to identify system specific least-cost resources to maintain resource adequacy.
Expand regional demand response infrastructure.
Support regional market transformation for demand response.
Expand renewable generation technology options considered for Renewable Portfolio Standards (RPS) compliance.
Regional carbon emissions.
In order to track Seventh Plan implementation and adapt as needed, the council, in cooperation with regional stakeholders, will provide:
Annual Resource Adequacy Assessments
Annual Conservation and Demand Response Progress Reports
Mid-Term Assessment of Plan Implementation and Planning Assumptions
Facilitate a discussion to determine the interest in convening a forum to explore the benefits of alternative business models and rate designs to promote energy efficiency when confronted with stable or declining growth in regional electricity demand.
Ensure all-cost effective measures are acquired. Evaluating all HTR sectors is important. In evaluating the sub-sectors highlighted below, considerations should include where data is readily available.
Small and Rural Utilities
Low-Income Households
Moderate-Income Households
Manufactured Homes
Encourage utilities to participate in the processes to establish and improve the implementation of state efficiency codes and federal efficiency standards.
Develop a regional work plan to provide adequate focus on emerging technologies to help ensure adoption.
Actively engage in federal and state standard development.
Develop and deploy best-practice guides for the design and operations of emerging industries.
Monitor and track code compliance in new buildings.
Establish a forum to share research activities, identify and fill research gaps.
Develop guidelines on quantifying non-energy impacts.

2017 Biennial Energy Report and State Energy Strategy Update 19
Chapter 4 – Status of State Energy Strategy Recommendations
The 2012 State Energy Strategy continues to be an important document guiding the direction of Commerce’s energy policy and programmatic activities. Since the 2015 progress update, three significant areas of progress are particularly notable:
Transportation – Washington has emerged as one of the leading states for deployment of electric vehicles. New state actions have included reauthorization of the state sales tax incentive for electric vehicles (EV), commitment for purchase of 20 percent EVs in the state fleet annually, funding of a state EV infrastructure pilot program at WSDOT, and efforts to direct funding from the Volkswagen diesel vehicle settlements to additional electric vehicle infrastructure.
Building Energy Efficiency – Washington collaborated with other West Coast states and cities on improving and expanding energy benchmarking for non-residential buildings. We plan to develop additional benchmarking policies and programs.
Distributed Energy – Commerce has continued to work with communities throughout the state to reduce the soft costs (permitting, electrical interconnection) of solar energy installation. Commerce has recently received a US Department of Energy multi-year grant to build on that work focusing on providing increased access to solar for low-income groups and community solar projects.
Transportation
Electric Vehicle Support
By 2014, Washington State had achieved the distinction of having the highest per capita percentage of electric vehicles with more than 10,000 on the road.10 The rate of electric vehicle adoption continues to increase, with over 20,000 registered plug-in electric passenger cars anticipated on Washington’s roads by the end of 2016.
In 2014, the governor issued Executive Order 14-04 (Washington Carbon Pollution Reduction and Clean Energy Action). It directed the Washington Department of Transportation (WSDOT) to develop an “action plan to advance electric vehicle use, to include recommendations on targeted strategies and policies for financial and non-financial incentives for consumers and businesses, infrastructure funding mechanisms, signage, and building codes.” In February 2015, WSDOT published a Washington State Electric Vehicle Action Plan with 13 specific recommendations to support electrified transportation over the next five years.
10 Top Electric Car States – Which has the Highest Percentage of Electric Cars?, February 3, 2014, Clean Technica.

2017 Biennial Energy Report and State Energy Strategy Update 20
Procurement
In October 2013, Gov. Inslee, Oregon Gov. Kitzhaber, California Gov. Brown, and British Columbia Premier Clark committed to a new set of collective climate and energy actions as part of the Pacific Coast Collaborative. One of the major new commitments was “to expand the use of zero emissions vehicles, aiming for 10 percent of new vehicle purchases (in public and private fleets) by 2016.”11
Following adoption of the Paris climate agreement in December 2015, Gov. Inslee launched an Electric Fleets Initiative that expanded the goal, with 20 percent of annual state passenger vehicle purchases to be electric vehicles by 2017. The Department of Enterprise Services (DES) is preparing a new passenger vehicle master contract for state and local governments that will include a wide array of electric vehicle options. DES has already issued a new master contract for electric vehicle charging infrastructure.
In May 2013, Commerce adopted rules regarding alternative fuel and vehicle procurement by state agencies and universities. To support procurement decisions based upon total cost of ownership, Commerce developed analytical tools to allow agencies to determine the life-cycle costs of vehicles, including the social cost of carbon. The tool has demonstrated that electric vehicles are the least expensive option amongst the passenger vehicles available through the state procurement process. Commerce also formed the Alternative Fuels and Vehicles Technical Advisory Group (AFV-TAG) in 2013 to support rule implementation through joint purchasing programs, technical assistance, and fleet management strategies.
In October 2016, Commerce adopted similar rules for local governments, including cities, counties, public utilities, rural fire districts, ports, and school and transit districts. Beginning June 1, 2018, local governments are expected to use purchasing guidelines based upon the total cost of vehicle ownership and cost-competiveness of alternative fuels. The 65 largest fuel users will be asked to file annual reports detailing their vehicle procurement needs, experiences with alternative fuels and vehicles, and plans for compliance with the new rules. They will be invited to participate in and contribute to regular AFV-TAG meetings.
Charging Infrastructure
The 2014 Legislature appropriated $250,000 for the Joint Transportation Committee to evaluate the status of electric vehicle charging stations and make recommendations on potential business models to expand and sustain an electric vehicle charging network. Their Electric Vehicle Charging Station Networks Study generated a final report on Business Models for Financially Sustainable EV Charging Networks in March 2015.
In 2015, the Legislature directed WSDOT to develop a pilot program to support the deployment of fast-charging infrastructure along highway corridors through combined public-private
11 Pacific Coast Action Plan on Climate and Energy, October 28, 2013.
2017 Biennial Energy Report and State Energy Strategy Update 21
financing. WSDOT adopted rules for an EV Infrastructure Pilot Program in October 2016, and anticipates offering their first round of competitive grant funding in early 2017.
DES is working closely with various agencies to expand electric vehicle charging infrastructure at state-owned and leased facilities. In 2016, the US Department of Energy issued a “Workplace Charging Challenge Partner” award to Washington State in recognition of the state’s leadership in promoting clean transportation options to their employees.
Looking Forward
Commerce, WSDOT, DES and allied agencies continue to seek federal and private funding to promote electric vehicle adoption and expand charging infrastructure throughout the state. With the aid of a US Department of Energy “EV Everywhere” grant, one dozen “ride ‘n drive” outreach events will take place over the next two years at various locations around the state. Led by the Governor’s Office and Washington Department of Ecology, agencies are actively exploring opportunities to utilize Volkswagen Environmental Mitigation and Zero-Emission Vehicle Investment funding to support transportation electrification.
Renewable Fuels Standard
There have been no legislative changes to Washington’s Renewable Fuel Standard since the 2012 State Energy Strategy. The 2015 legislature included a provision in the transportation budget package prohibiting the state from adopting a clean fuel standard by executive order.12
Diesel Engine Fuel Efficiency Improvements
The state Department of Ecology continues as the lead state agency for diesel emissions reduction activities. These activities include reducing locomotive and truck stop idling, and supporting cleaner school buses. Please refer directly to Ecology’s Diesel Emission Reduction Program website13 for up-to-date information on program activities.
In addition, the Department of Ecology fined Volkswagen $176 million under the authority of the Washington Clean Air Act for violations of diesel vehicle emissions testing.14 This is in addition to a series of national-level settlement agreements with Volkswagen. State agencies are actively following the national-level settlement agreements to determine how Washington may receive funding for diesel emissions related activities and transportation electrification.
Commute Trip Reduction (CTR) Program Expansion
The state’s Commute Trip Reduction (CTR) program has continued to expand its activities since publication of the 2012 Washington State Energy Strategy. The CTR program includes more
12 Senate’s Transportation Revenue Bill: ESSB 5987 Sections 106,3; 202,1c; 202,3; 204,3a;206,9; 207,4;208,2; 209,5 13 www.ecy.wa.gov/programs/air/cars/diesel_exhaust_information.htm 14 www.ecy.wa.gov/programs/air/cars/vw.htm
2017 Biennial Energy Report and State Energy Strategy Update 22
than 1,000 work sites with participation by more than 500,000 individuals. In its 2015 report to the Legislature, the Commute Trip Reduction Board recommended broadening the focus from commute trips to all trips, and developing a $20 million per biennium grant program. Additional detailed information on the CTR program is available at WSDOT’s program website.15
Smart Growth and Transportation Planning
Executive Order 14-04 included seven major action items for the transportation sector.
WSDOT, Commerce and Ecology are working with regional transportation planning organizations, counties and cities to develop a program of financial and technical assistance for improved transportation efficiency and comprehensive plan updates.
WSDOT is working on a review of state transportation grant programs to identify ways to increase investment in multimodal transportation options for local governments.
WSDOT has drafted multimodal transportation corridor policies and guidance, focusing new corridor studies on ways to increase transportation choices, foster innovative land use and reduce emissions.
WSDOT is working on a statewide transportation plan that includes alternative revenue sources, least-cost planning, transit-oriented land use, and freight-corridor development. Scheduled for adoption approximately December 2016.
Transportation Systems Management
WSDOT has a variety of transportation system management activities and programs underway, including intelligent transportation systems (ITS) operations,16 smarter highways17, and freight mobility.18
Electric Vehicle Mileage Pricing Pilot
The Washington State Transportation Commission received funding in 2016 to complete the work begun in 2011 to evaluate road usage charges as an alternative to motor vehicle fuel tax to fund future transportation investments. The Commission has formed a road usage charging assessment and steering committee which meeting on a regular basis and has produced a series of reports on approaches to road usage charges.19
15 www.wsdot.wa.gov/Transit/CTR/overview.htm 16 WSDOT, Intelligent Transportation Systems (ITS) operations, www.wsdot.wa.gov/Operations/ITS/ 17 WSDOT, Smarter Highways, www.wsdot.wa.gov/Operations/Traffic/ActiveTrafficManagement 18 WSDOT, Washington State Freight Mobility Plan, www.wsdot.wa.gov/Freight/freightmobilityplan 19 More information is available at the Washington State Road Usage Charge website.
2017 Biennial Energy Report and State Energy Strategy Update 23
Car Sharing and Mileage-Based Insurance
Mileage based car insurance coverage is available in Washington state. Additional information is available from the Office of Washington State Insurance Commissioner.20
Low Carbon Fuel Standard
The 2015 Transportation Revenue Bill, ESSB 598721, discourages the adoption of a state low carbon fuel standard prior to July 1, 2023.22
Advanced Aviation Fuels
The 2012 Legislature established the Aviation Biofuels Work Group. The work group includes representation from the aviation industry, state agencies, public interest groups, ports, national laboratories, and the biofuels industry. Two Aviation Biofuels Update reports were produced, December 2012 and December 2013.23 A final report is anticipated in late 2016. The work group is scheduled to sunset July 1, 2017.
In 2011, two major research consortia led by Washington research institutions received five years ofUS Department of Agriculture funding to explore pathways for producing aviation biofuels from wood. Northwest Advanced Renewables Alliance and Advanced Hardwood Biofuels Northwest are both in the process of completing their final reports. Their studies conclude, as does the Aviation Biofuels Work Group, that while aviation biofuels are becoming more cost-competitive with petroleum-based fuels on an operating basis, depressed petroleum prices coupled with inconsistent state and federal policy environments continue to discourage capital investment in bio-refining.
Buildings Efficiency
Non-Residential Disclosure
The State Energy Strategy recommends that Washington’s Commercial Building Energy Disclosure law be modified to be consistent with more open disclosure polices being implemented. This will enhance the transfer of energy information between utility customers, building owners, tenants and state government.
Commercial building energy benchmarking and disclosure policies require the disclosure of annual building energy consumption information to the market. In Washington, large building owners are required to disclose energy use to prospective clients at time of sale, lease or when
20 www.insurance.wa.gov 21 www.app.leg.wa.gov/billinfo/summary.aspx?bill=5987&year=2015 22 Senate’s Transportation Revenue Bill: ESSB 5987 Sections 106,3; 202,1c; 202,3; 204,3a;206,9; 207,4;208,2; 209,5. 23 Innovate Washington, Aviation Biofuels Update, December 2013.
2017 Biennial Energy Report and State Energy Strategy Update 24
applying for a loan.24 A growing number of jurisdictions are creating websites that provide full public disclosure of annual building energy consumption. For example, California recently revised their policy from a disclosure policy similar to Washington’s to one of full public disclosure.25
Commercial building benchmarking and disclosure programs have been evaluated and there is clear evidence that it drives energy use reductions in large commercial buildings. A recent report by the Institute for Market Transformation documents many benefits of benchmarking programs.26 Between 2010 and 2013, New York City realized a 5.7 percent reduction in building energy use across all buildings covered by the policy. San Francisco adopted the policy in 2009 and has documented a 7.4 percent reduction between 2009 and 2013.
Commerce has staff dedicated to advancing commercial building energy benchmarking in Washington State. Funded primarily by the U.S. Department of Energy, Commerce manages an effort with the states of California, Oregon, Washington and British Columbia to advance benchmarking policies at the local and state level. Project funding continues through 2017. This collaboration has:
Developed a model benchmarking and disclosure policy for state and local government, including coordinated efforts to establish uniform practice in the implementation of policies.
Developed internal expertise in the energy offices of California, Oregon, Washington, and British Columbia.
Developed reporting on the benefits of benchmarking building performance.
Provided outreach and policy support to local government interesting in benchmarking policy adoption.
Commerce also supported two state specific efforts:
Technical support in the development of House bill 1278 in the 15-16 session.
Creation of a coordinated benchmarking support program at the Smart Building Center, located in the Pacific Tower Building in Seattle. Commerce deployed federal funding to the Smart Building Center to assist local government with implementation of new benchmarking policies. Core functions of benchmarking program implementation can be better served if local governments collaborate to support implementation. The core activities include development of data sets of building that must comply with the policy, data management during implementation and data analysis in support of final reporting. Best practices for building energy benchmarking and disclosure polices include a variety
24 RCW 19.27a.170 25 California AB 802, www.energy.ca.gov/benchmarking 26 Hart, Zachary, “The Benefits of Benchmarking Building Performance”, Institute for Market Transformation, 2015. www.imt.org/uploads/resources/files/PCC_Benefits_of_Benchmarking.pdf

2017 Biennial Energy Report and State Energy Strategy Update 25
of customer service functions to assure every building owner can comply. The program will offer these services to a few early adopters of new benchmarking policies.
Residential Disclosure
The State Energy Strategy proposes annual energy use summaries be provided to all residential utility customers. At time of sale or when a property is offered for rent, the annual energy use summary would be disclosed to prospective buyers or renters. For sellers who want to demonstrate recent improvements in housing, a home energy audit can supplement the energy bill disclosure.
Residential energy bill disclosure was recommended and included in HB1278 (15-16 session). It was dropped from the bill after the initial hearings due to concerns from utilities and realtors.
Marketing and Quality Assurance
Marketing is an essential element for increasing adoption of energy efficient practices in the residential sector. The Pacific Northwest utilities have a long history of developing cooperative efficiency programs that include program specifications, training for contractors, quality assurance and marketing. It has been some time since this approach was broadly implemented for home energy retrofits. The State Energy Strategy recommends bringing this type of comprehensive effort to a statewide program.
No action has been taken to coordinate marketing and quality assurance for residential retrofits. There continue to be individual efforts to implement marketing and quality assurance by utilities and programs administered through the Washington State University, Community Energy Efficiency Program. Utilities continue this work through their conservation programs.
Meter-Based Financing
The 2012 Washington State Energy Strategy identified meter-based financing, also known as on-bill financing or on-bill repayment, as a promising alternative to traditional ways of paying for energy efficiency and renewable energy projects. It reduces or eliminates the up-front investment for a consumer or business, and it allows for repayment from the reduction in energy cost savings. Meter-based financing is especially promising in situations where tenants are responsible for utility bills, since the property owner is not required to make an investment.
Craft3, a nonprofit lender, has developed and implemented an on-bill repayment mechanism available to residential customers of Seattle City Light. Commerce supported this program with grant funds from the Clean Energy Revolving Loan Fund. The Seattle City Light/Craft3 program allows customers to finance energy efficiency projects and repay the loan as part of their electric bill. Residential customers can use on-bill financing even if they are replacing non-electric equipment, such as conversion from oil heat or installation of a more efficient natural

2017 Biennial Energy Report and State Energy Strategy Update 26
gas furnace. The program allows customers to rely on their utility bill payment history to establish creditworthiness. Craft3 also offers on-bill repayment to Washington customers of Northwest Natural Gas in Clark County.
Craft3 has completed 574 loans for a total $6.7 million using the on-bill repayment mechanism.
Despite the success of the programs in Seattle and Clark County, other utilities have not adopted on-bill financing as a means to increase the number of customers doing energy upgrades. The availability of conventional financing for energy projects using home equity financing or energy improvement loans has improved since 2012, and interest rates have been very low during this period. These improvements may have reduced the demand for new financing approaches. Nonetheless, it seems unlikely that some market segments, especially rental properties, will be adequately served with conventional financing.
Energy Efficient Property Conversions
In the 2015-16 legislative session, HB 184327 would have created a residential energy efficient pilot program for low and moderate-income single and multi-family buildings, but it did not pass the session. The legislation would have allowed local jurisdictions to exempt these dwellings from property tax for a period of up to six years. The exemption would have applied to both retrofit and new construction that meets specific energy efficiency standards.
Sustaining Investment in Low-Income Weatherization Programs
The Legislature in 2015 expanded its investment in healthy, safe and energy efficient low-income weatherization to include improvements that help children and adults combat asthma. This new program initiative is called Weatherization Plus Health.
Weatherization Plus Health combines energy and cost saving weatherization improvements in low-income homes with measures that reduce health risks and health costs for vulnerable families. It is targeted to improve the home environments for children and adults with asthma.
Washington state is investing $15 million from 2015-2017 to provide weatherization in all counties of the state through its Matchmaker program. Matchmaker matches state dollars with utility and other programs’ investments in weatherization. This biennium $4.3 million is being reserved in Matchmaker for the new Weatherization Plus Health initiative.
27 www.app.leg.wa.gov/billinfo/summary.aspx?bill=1843&year=2015

2017 Biennial Energy Report and State Energy Strategy Update 27
Distributed Energy
Interconnection Standards
Since 2015, Commerce and its non-profit, utility, and city partners in both Oregon and Washington established the Northwest Solar Communities28 program. The U.S. Department of Energy, along with local matching funds, underwrote the creation of the program. Northwest Solar Communities included activities related to streamlining and improving both distributed system interconnection and system permitting. The interconnection products included a best practices guide and interactive web site, new standard forms for faster and easier interconnection and several webinars on permitting.29 These tools and information have been important elements in supporting the rapid increase in distributed energy resources especially residential and small commercial photovoltaic systems.
Commerce received an additional grant from the U.S. Department of Energy in October 2016 to continue its work with Washington and Oregon partners on the development and expansion of solar installation in the region. The new grant will focus on assisting the development of community solar systems, helping low and moderate income individuals install systems, and further investigate the value propositions available from solar deployment.30
Net Metering Policies
Net metering is the compensation arrangement between a utility and a customer with an on-site generation system, typically a solar photovoltaic system. Net metering gives the customer credit for power generation at the utility’s retail rate and allows a customer to bank generation during hours or months when it exceeds the customer’s consumption. Without net metering, a utility might offer a lower rate for electricity that flows back into the grid when generation exceeds consumption.
Net metering policies are set by each utility, subject to limitations set in state law (RCW 80.60). The law requires that utilities offer net metering, but they are not required to offer net metering to systems that exceed 100 kW in size. The obligation to offer net metering does not apply to additional systems after the cumulative capacity of all net metered systems exceeds 0.5 percent of the utility’s peak demand in 1996.
The limitations of the net metering requirement are often misunderstood. They do not prohibit a utility from offering net metering to larger systems or offering net metering above the cumulative cap. The law also does not prohibit a utility from charging a fee to net-metered
28 nwsolarcommunities.org 29 nwsolarcommunities.org/priorities/interconnection 30 Solar Plus Regional Initiative Wins $2 million Grant from U.S. Department of Energy

2017 Biennial Energy Report and State Energy Strategy Update 28
customers, but any special fee has to be justified based on identified costs and policy considerations.
The 2012 Washington State Energy Strategy concluded that Washington’s net metering law is well-designed, and identified three potential improvements. These would expand the maximum size of individual systems and the cumulative capacity of systems that must be offered net metering. The third policy change was to expand the energy banking provision to allow carry over from year to year.
There have been no statutory changes to the net metering law since the 2012 strategy, though legislators have introduced bills to do so every year. Nonetheless, utilities have experienced a sharp increase in the number of solar photovoltaic systems installed under net-metering arrangements. In 2012, no utility was at or near its 0.5 percent net metering threshold. In 2016, most Washington customers are served by utilities that exceed the cumulative threshold. While many utilities are no longer required to offer net metering to customers who install new renewable energy systems, no Washington utility has withdrawn its net metering offer.
Other states have greater penetration of solar photovoltaic systems on their utility grids, and stakeholders there are debating and litigating a variety of changes to compensation and interconnection arrangements. Similar discussions occur in Washington and are likely to be guided by the experience of other states.
Streamlined Permitting for Distributed Energy
Commerce and the Oregon Department of Energy received funding for the U.S. Department of Energy’s Rooftop Solar Challenge program to help reduce the “soft costs” of installation of rooftop solar systems. The funding led to the creation of the Northwest Solar Communities coalition made up for local jurisdictions, utilities, industry partners, and citizens groups. One of the major focus areas of the group is the “streamlining and standardization of the permitting processes and interconnection standards.”
The Northwest Solar Communities initiative wrapped up its work on reducing “soft costs” of rooftop solar with a major advance. The State Building Code Council unanimously approved a change proposed by a coalition of Northwest Solar Communities to expedite permitting of standard solar photovoltaic systems without an engineer’s stamp. While many jurisdictions already follow this routine, the code brings all jurisdictions into alignment. Engineering costs range from $500 to $2500 or more, and can add up to eight weeks for a solar installation. Partners also implemented solar group purchase programs in seven new communities. In just two and a half years, the installed solar capacity in Washington has quintupled, while costs have fallen almost 50 percent.
The U.S. Department of Energy funds and continues to support six Wind Energy Regional Resource Centers. The Northwest Wind Resource and Action Center, operated by Renewable Northwest with involvement from Commerce, worked with the Distributed Wind Energy
2017 Biennial Energy Report and State Energy Strategy Update 29
Association and Northwest SEED to develop model zoning and permitting practices for small-scale distributed wind systems, creating state-specific toolkits. The Permitting Toolkit for Washington is available from the Northwest Wind Resource and Action Center website.31
Distributed Energy in I-937
The 2012 Washington State Energy Strategy identified a number of policy and legislative changes that should be made to reduce obstacles to greater use of distributed energy. Washington has implemented all of these changes through legislation, administrative rule amendments, and agency policy.
Commerce used its rulemaking authority to provide the needed clarification of how the savings from combined and power projects should be counted and the 5 MW limit should be applied for distributed energy systems seeking to qualify for double credit.
The most important change since the 2012 strategy was to establish a process for utilities and project developers to obtain confirmation that a renewable energy project or conservation resource is eligible for credit under the EIA. The Legislature in 2012 authorized Commerce to issue advisory opinions on resource eligibility.
Using this authority, Commerce has addressed numerous complex issues that were unclear in the statute itself. The process also allows developers to obtain routine approvals that may be required by financial backers, and it has enabled the regional renewable energy tracking system to identify projects as Washington-eligible.
Rationalize Distributed Energy Incentives
The 2012 Washington State Energy Strategy identified nine different tax incentive provisions affecting distributed energy systems and recommended a comprehensive review of their purpose and effect. The strategy identified three preferences as priorities.
Retail sales and use tax remittance for renewable energy production equipment (RCW 82.08.962). This tax preference was scheduled to expire in 2013, and the Legislature extended it to January 1, 2020.
Property tax exemption for biodigesters (RCW 82.29A.135). The Legislature did not extend this exemption, which expired on December 21, 2012.
Public utility tax credit for consumer produced power (renewable energy systems) (RCW 82.16.130). This tax preference expires on June 30, 2020. However, because it applies as electricity is generated instead of as a one-time credit, the effective amount of the
31 nwwindcenter.org/sites/default/files/windpermittoolkit_wa_sept-2015v2.pdf

2017 Biennial Energy Report and State Energy Strategy Update 30
credit diminishes each year. The Legislature has not modified or extended this tax preference.32
The taxpayer cost of the renewable energy production credit has increased dramatically since 2012 as the number and size of solar photovoltaic systems has increased. This was particularly pronounced in 2014 and 2015, when the price of solar equipment decreased significantly and the incentive rates established in statute yielded high financial paybacks on new systems. The most recent projection is that the incentive will cost taxpayers $55 million during the 2017-2019 budget period. Most of the cost is due to incentives to encourage use of Washington-manufactured equipment rather than to encourage generation of renewable energy.
Growth in taxpayer cost is expected to slow as a result of the caps established in the statute. However, the caps have also raised concerns because some utilities have chosen to reduce incentive payments to existing system owners as new systems were added.
Stakeholders in the solar industry have proposed legislation to extend and reform the incentive program in every legislative session since 2013. Most states are reducing their solar incentives as system costs are decreasing. Any extension of the Washington program should provide significantly lower incentive levels and better controls to protect against unreasonably high payments to project owners.
Carbon Pricing
Executive Order 14-04 created a Carbon Emissions Reduction Task Force (CERT) made up of 21 leaders from business, labor, health, and public interest organizations. The charter of CERT was to provide the Governor with recommendations on the design and implementation of a market-based carbon pollution program. The CERT provided a final report to the Governor in November 2014. 33 The report produced four findings related to the creation of emissions-based or price-based market mechanisms for greenhouse gas reductions.
Emissions-based or price-based market mechanisms add unique features to an overall carbon emissions reduction policy framework.
Thoughtful and informed policy design, drawing on the lessons learned from other jurisdictions, CERT member perspectives, and additional analysis (see Finding 4), will be required to achieve either an emissions-based or price-based policy approach that is workable for the State of Washington.
Reaching the State’s statutory carbon emissions limits will require a harmonized, comprehensive policy approach.
32 In addition to these priority items, the Legislature also extended until 2017 a reduction in the business tax on manufacture of solar energy equipment and components and expanded it to cover manufacture of solar grade silicon (RCW 82.04.294). 33 www.governor.wa.gov/sites/default/files/documents/CERT_Final_Report.pdf

2017 Biennial Energy Report and State Energy Strategy Update 31
Certain important questions remain unanswered and further analysis will be important to provide the foundation for a well-informed and well-functioning policy approach.
The Climate Legislative and Executive Workgroup (CLEW) was created under Engrossed Second Substitute Senate Bill 5802 (E2SSB 580234) during the 2013 Legislative session. The workgroup was charged with recommending a state program of actions and policies to reduce greenhouse gas (GHG) emissions, that if implemented would ensure achievement of the state’s emissions reductions limits set in Chapter 70.235 by the 2008 legislature.
Engrossed Second Substitute Senate Bill 5802 required preparation by a consultant(s) of a credible evaluation of approaches to reducing greenhouse gas emissions. The evaluation informed the work of the Climate Legislative and Executive Workgroup. In January of 2014 the workgroup produced A Report to the Legislature on the Work of the Climate Legislative and Executive Work Group.35
Subsequent legislative sessions did adopt legislation to create market-based carbon reduction and Governor Inslee subsequently directed the Department of Ecology under the authority of the Washington Clean Air Act to develop rules for a greenhouse gas cap and reduce program. The Clean Air Rule (CAR) was adopted in September 2016 and the first compliance period for reductions will take effect beginning January 1, 2017.36
34 www.apps.leg.wa.gov/billinfo/summary.aspx?bill=5802 35 www.governor.wa.gov/sites/default/files/documents/CLEWfinalCombinedReport20140130.pdf 36 Detailed information on the CAR is available at the Department of Ecology website, www.ecy.wa.gov/programs/air/rules/wac173442/1510docs.html

2017 Biennial Energy Report and State Energy Strategy Update 32
Chapter 5 – Cascadia Rising Functional Exercise
The Department of Commerce participated in Cascadia Rising, a four-day functional exercise, to test our lead agency responsibilities for Emergency Support Function 12 – Energy. This tested our response to a magnitude 9.0 earthquake and tsunami originating from the offshore Cascadia Subduction Zone (CSZ). CSZ identified both strengths and weaknesses in ESF 12 planning. Commerce is evaluating the processes in place for ESF12 responsibilities and will incorporate catastrophic planning and the lessons learned from CSZ into the next planning cycle. Specific opportunities for refining current plans include:
Development of pre-disaster agreements with Oregon and Idaho in regards to ESF 12 with agreements to provide updates and collaborate on resources.
Continued development of strong relationships with energy utilities and increased access to information critical to situational awareness and operational coordination.
Further development of a fuel allocation plan.
Figure 1: Fracture Zones
Current emergency response plans are designed in accordance with federal doctrine contained within the National Incident Management System (NIMS) and Incident Command System (ICS),
Direct Impact to three states and British Columbia
Complete rupture of the 800-mile fault line
Impacts affecting over 140,000 square miles
Ground shaking lasts up to five minutes
Numerous aftershocks with several of M7.0+
Modeled estimates: 1,100 fatalities from earthquake; 13,000 fatalities from tsunami; 24,000 injured
2017 Biennial Energy Report and State Energy Strategy Update 33
which are generally sufficient for smaller, routine disasters. Cascadia Rising provided the first opportunity for all exercise participants, including Commerce, to test their existing plans to a catastrophic disaster in order to identify potential gaps and areas for improvement.
Commerce’s Response Role and Exercise Participation
Using the NIMS and ICS construct, the state Military Department maintains an Emergency Operations Center (EOC), located at Camp Murray, and leverages state agency expertise to support various emergency support functions as part of the command and control structure. The State Energy Office (SEO) within Commerce has lead agency responsibility for Emergency Support Function (ESF) 12 – Energy. This responsibility includes planning, response, and coordination activities before, during, and after an event.
During Cascadia Rising, SEO staff tested the functionality and capacity of existing plans and protocols, including the activation of an Agency Coordination Center located within the Commerce’s Olympia headquarters. Staff used current plans to:
Craft recommendations implementing a Governor’s Energy Emergency.
Develop a fuel allocation and distribution plan based on resource scarcity.
Support the State Emergency Operations Center.
Coordinate requests for fuel, generators, and other energy asset.
Coordinate situational awareness of energy providers.
Commerce Lessons Learned and Recommendations for Improvement
Cascadia Rising delivered on its objective to test emergency operations plans to a catastrophic incident, and all participants learned how response to a disaster of this magnitude would be vastly different from anything previously conceived or experienced in Washington.
Existing emergency operations plans along with their associated procedures for ESF-12 need to be enhanced and designed to accommodate the influx of federal support that will be provided from partner agencies, such as U.S. Department of Energy. Moreover, as the exercise transpired, it became apparent that without enhanced pre-incident planning and a greater refinement of a fuel acquisition and allocation plan, response operations could be jeopardized. The drill also identified opportunities to enhance collaboration with private industry and other state agencies that support ESF-12, including the state Utilities and Transportation Commission.
In an actual event of the scale and scope of the Cascadia, Commerce staff would be engaged long term in planning, coordination, recovery, and restoration activities. While current plans exist to provide guidance on activation requirements, these plans are based on much smaller events in terms of magnitude and impact.
Several opportunities for improvement were identified by Commerce’s internal After Action Report for Cascadia Rising, the statewide 2016 Cascadia Rising AAR, ongoing continuity of
2017 Biennial Energy Report and State Energy Strategy Update 34
operations planning, and the Governor’s Directive 16-19 on preparedness and response to earthquakes and tsunamis. Specifically:
Maintaining the practice of the lead ESF 12 coordinators contacting their counterparts in other affected states for situational awareness and resource recovery.
Development of pre-disaster agreements with Oregon and Idaho in regards to ESF 12 with agreements to provide updates and collaborate on resources
Continued development of strong relationships with energy utilities, increased access to information critical to situational awareness and operational coordination
Increased planning for catastrophic events including devolution of operations to a non-impacted location or governmental entity
Increased incorporation of the Incident Command System (ICS) into Commerce’s existing plans and training activities
Increased frequency of ICS training and exercises
Clarification of federal, state, and local roles in energy supply and infrastructure restoration
Development of a fuel allocation plan
Commerce’s Future State for ESF 12
Cascadia Rising was a successful exercise for Commerce in that it identified both weaknesses and strengths within our current ESF planning framework. Catastrophic planning and response is fundamentally different from that previously identified and conceptualized.
Commerce is currently evaluating the processes in place for our ESF 12 responsibilities. The current state of the ESF plan does not include catastrophic or cyber response, which are both focuses during the next revision cycle.
In addition to incorporating the recommendations from the internal exercise and the statewide exercise AARs into our planning, we are also expanding our cadre of trained staff available to provide response support in the event of an emergency or natural disaster.

2017 Biennial Energy Report and State Energy Strategy Update 35
Chapter 6 – Energy Indicators
Washington’s Energy System
When compared to other states, Washington’s energy system is characterized by relatively clean and low-cost electricity dominated by hydroelectric generators, thermal energy with a larger than typical contribution from biomass, and fairly typical transportation energy. The state’s greenhouse gas footprint is dominated by transportation energy, thanks to the relatively low greenhouse gas emissions related to the electric grid.
Figure 2: Sources and Consumers of Energy in Washington in Calendar Year 2014
Note: The state consumed 1,593 TBtu of energy. Sums may not equal totals due to rounding error. A larger version is after the Appendix.
Energy flows in Washington state have been mapped as shown in Figure 2. Data is for calendar year 2014, the most recent year for which data are available on all sources and consumers of energy. In the figure, the thickness of each line is proportional to the quantity of energy being delivered or consumed; these quantities appear as numeric values on or adjacent to each line, in trillion British thermal units (TBtu). The state consumed 1,593 TBtu of primary energy in 2014. Electric generators used 596 TBtu to produce 314 TBtu of electricity. The four end-use sectors, transportation, industrial, residential, and commercial, consumed 1,336 TBtu.37 The
37 The four-sector total includes energy from the electric sector, which itself is not an end-use sector.

2017 Biennial Energy Report and State Energy Strategy Update 36
transportation sector is the least efficient user of primary energy, delivering only 25 percent of the primary energy as useful energy services, and losing the remainder as waste heat.
In the early 1990s, Commerce developed 23 energy indicators. We have since consolidated them to 17, to illustrate important long-term energy trends in Washington. Commerce does not collect a large amount of primary energy data, but rather depends on regional and national sources. The energy indicators are grounded in the best available information and can be updated on a regular basis. They are based as much as possible on regularly published data from sources in the public domain. The principal source for the indicators is the U.S. Energy Information Administration’s Combined State Energy Data System. Other sources include the U.S. Bureau of Economic Analysis, the U.S. Census Bureau, the President’s Council of Economic Advisors, the Washington State Office of Financial Management, Federal Highway Administration, Oak Ridge National Laboratory Center for Transportation Analysis, and the Washington State Fuel Mix Database.
Collecting and publishing detailed statistics on energy consumption, price, and expenditures for 50 states and the District of Columbia is a large task involving analysis and compilation of fuel and sector-specific data. Thus, comprehensive state information from EIA lags by two to three years. Consequently, the Energy Indicators are limited to analysis of long-term energy trends.
Data for most of the indicators runs from 1970 to 2014; a few are one-year snapshots. For each indicator there is a chart, figure, or table illustrating the trend, and narrative giving additional perspective or describing further aspects of the data. Data sources and links to related data are included for those indicators where the information is available.
See Appendix A for more information on the methodology used to develop and update the indicators.

2017 Biennial Energy Report and State Energy Strategy Update 37
Indicator 1: End-Use Energy Consumption by Sector
State and national energy consumption is often presented through four sectors: transportation, residential, commercial and industrial. Electricity is included in the four primary sectors. Washington’s end-use energy consumption grew at an average rate of 1.8 percent per year between 1970 and 1999. Consumption reached an all-time high of 1,412 trillion Btu (TBtu) in 1999, 67 percent higher than in 1970, before declining 13 percent by 2002 primarily due to a sharp drop in industrial energy consumption. Energy use began to climb again and reached another peak in 2007 before declining about 2 percent during the recession of 2007-2009. By 2014, as the economy recovered, state energy consumption had nearly returned to the level seen in 2007, but was still 4.5 percent less than the 1999 peak, despite a larger population.
Figure 3: End-use Energy Consumption by Sector 1970-2014
Source: EIA State Energy Data System www.eia.doe.gov/emeu/states/seds.html
During the late 1970s and early 1980s, growth in energy consumption was dampened by higher energy prices and changes in the state’s economy, but grew fairly steadily from 1984 to 1999, due to population growth and relatively modest energy prices. The transportation sector accounted for the largest share of growth during this period, growing at an annual rate of 3.3 percent. Since the mid 1990’s, transportation energy consumption has been relatively constant. Commercial energy consumption, which includes service industries such as software, finances, and insurance, grew at a 3.3 percent rate between 1970 and 2000, and has grown at a lower
2017 Biennial Energy Report and State Energy Strategy Update 38
rate of about 0.6 percent since 2000. Residential energy use grew steadily at a 1.5 percent rate from 1970 to 2000, but is virtually unchanged over the past dozen years. Although there is some year-to-year variation due to economic activity, industrial energy consumption is lower in 2014 than it was in 1970. Some of this is due to energy efficiency improvements, but it also reflects structural changes in the state’s economy, such as the decline of the aluminum industry.38
38 During 1999-2002, high electricity prices shut much of the Northwest aluminum industry and consequently industrial sector energy consumption declined by 38 percent.

2017 Biennial Energy Report and State Energy Strategy Update 39
Indicator 2: Primary Energy Consumption by Source
Another way to present energy consumption is by fuel or generation source. Figure 4 shows Washington’s reliance on seven primary39 energy sources: petroleum, hydroelectricity, natural gas, biomass, coal, other renewables (wind, geothermal and solar) and uranium (nuclear).40
Figure 4: Total Primary Energy Consumption by Source, 1970-2014
Sources: EIA State Energy Data System http://www.eia.doe.gov/emeu/states/_seds.html
Washington relies on petroleum, much of which is delivered from Alaska, to meet the largest share of its energy needs – 42 percent of its primary energy needs in 2014. The petroleum share of primary energy use has declined slightly since the beginning of the time series in 1970 when it had a 47 percent share.
Natural gas is the next most frequently consumed primary energy source averaging an 19 percent share over the last five years, a modest increase from 1970 when its share was under
39 The main difference between primary and end-use energy is the treatment of electricity. Electricity must be generated using energy sources such as coal, natural gas, uranium, or falling water. These inputs are counted as primary energy; power plant output is consumed by homes and businesses is end-use electricity. Since over half of energy inputs to thermal power plants are typically lost as waste heat, primary energy consumption is larger than end-use. Note some of the primary energy used to produce electricity in Washington may be for electricity used in other states. Washington typically generates more electricity than is consumed in the state (see Indicator #3). 40 Several other renewable energy sources – geothermal, wind and solar – account for less than 1 percent of primary energy consumption.

2017 Biennial Energy Report and State Energy Strategy Update 40
17 percent. Natural gas is used for heating, electricity generation, and industrial processes. Consumption is variable, depending in particular on winter heating and electricity demand.
Coal is consumed almost exclusively at the TransAlta Centralia Generation facility, while uranium is used only at Energy Northwest’s Columbia Generating Station in Richland. Together, fuel used for electricity generation at coal and nuclear generation plants accounted for 11 percent of Washington’s primary energy consumption in 2014.
Total fossil fuel consumption (petroleum, coal, and natural gas) accounted for 67 percent of primary energy use in 2014, slightly more than in 1970, but down from the peak of 76 percent in 2001. Fossil fuel consumption is somewhat dependent on the severity of our winter weather and the output of the hydroelectric system.
Hydroelectricity has been a key energy source in Washington for many years. It is important to recognize that total annual generation from hydroelectric dams varies widely depending on snowpack and river flows. Generation in 2001 dropped to its lowest level in 35 years, 32 percent lower than the average for the last 30 years. This compares to the peak year in 1997 when generation was 29 percent greater than the average. Hydropower generation in 2014 was about 7 percent below the 20-year average.
Biomass, mainly wood and wood waste products, accounted for about 6.4 percent of primary energy consumption in 2014. The biomass share has declined slightly from the 1980s, but is up significantly since the 1990s. Biomass is primarily burned for electricity and process steam at pulp and paper mills, but is also used for residential heating.

2017 Biennial Energy Report and State Energy Strategy Update 41
Indicator 3: Fuels Consumed for Electricity in Washington
There are two ways to look at energy sources for electricity in Washington. One is to consider sources for electricity generated in-state. Electricity from hydroelectric dams accounted for 69 percent of generation in 2014. Natural gas and nuclear are the next most common sources at 10 and eight percent respectively. Wind and coal have shares of about 6 percent each. The balance is a mix of fossil and renewable fuel sources. Other non-hydro renewable fuel sources, including biomass, wind, waste and landfill gas, is about seven percent of total generation. Wind has grown from nearly zero in 2000 to 6.3 percent in 2014 (Washington ranks ninth for installed wind capacity according to the American Wind Energy Association41). In 2014, power plants in Washington generated 25 percent more electricity than was consumed in the state.
Figure 5: Fuels Consumed for Electricity Generated in Washington During Calendar Year 2014
Another, and perhaps better approach to analyzing the electricity sector, is to focus on the mix of resources used by utilities to serve customers in the state (Figure 6 and Table 8). This approach is often referred to as consumption based accounting in contrast to the generation based accounting. Washington is part of an interconnected, multi-state, regional bulk power
41 www.awea.org/learnabout/publications/reports/upload/3Q2012-Market-Reort_Public-Version.pdf

2017 Biennial Energy Report and State Energy Strategy Update 42
system and utilities purchase electricity generated from a variety of sources throughout the region. The data for estimating the sources of electricity consumed in Washington is collected for the Washington State Fuel Mix Disclosure process42 and includes utility spot market purchases.
Figure 6: Fuels Consumed for Electricity Delivered in Washington During Calendar Year 2014 (see Table 8).
Hydroelectricity was still the dominant source, accounting for 65 percent of the electricity consumed in the state in 2014. Electricity generated from coal accounted for 15 percent of the electricity used by Washington consumers, which is larger than the in-state generation share. This reflects the electricity purchased by some utilities from coal-fired power plants located in other states such as Montana and Wyoming. On a consumption basis natural gas accounted for about 12 percent of Washington’s electricity, while nuclear was responsible for 5 percent. Renewable sources, excluding hydro, accounted for approximately 3 percent of the electricity purchased by utilities for use by Washington consumers. This was less than the generation share, indicating that some of the renewable energy generated in Washington, notably wind, was sold to customers outside the state.
42 Fuel Mix Disclosure reporting is conducted annually and includes electricity consumption data reported by utility. Each utility reports resource category and fuel type for its electricity sales in Washington.

2017 Biennial Energy Report and State Energy Strategy Update 43
Table 7: Fuels Associated with Electricity Generated in Washington, 2014
Fuel Megawatt Hours Mix
Hydropower 79,463,144 68.3%
Nuclear 9,497,321 8.2%
Wind 7,267,794 6.2%
Natural Gas 11,058,815 9.5%
Coal 6,719,928 5.8%
Wood and Wood Derived Fuels 1,526,564 1.3%
Other Gases 336,932 0.3%
Other Biomass 313,080 0.3%
Other 131,267 0.1%
Pumped Storage -4,753 0.0%
Petroleum 23,541 0.0%
Solar Thermal and Photovoltaic 729 0.0%
Total 116,334,363 100%
This table lists fuels used by electric generators physically located in the state.
Table 8: Fuels Associated with Electricity Delivered to Customers in Washington, 2014
Fuel Megawatt Hours Mix
Hydro 59,723,805 65.07%
Coal 14,026,540 15.28%
Natural Gas 10,442,484 11.38%
Nuclear 4,617,391 5.03%
Wind 2,219,613 2.42%
Biomass 300,416 0.33%
Waste 203,960 0.22%
Landfill Gas 104,431 0.11%
Other 59,964 0.07%
Petroleum 59,674 0.07%
Geothermal 17,911 0.02%
Solar 6,618 0.01%
Total 91,782,808 100%
This table lists fuels used to generate the electricity purchased by Washington energy consumers, regardless of where the electricity was generated. www.commerce.wa.gov/Programs/Energy/Office/Utilities/Pages/FuelMix.asp

2017 Biennial Energy Report and State Energy Strategy Update 44
Indicator 4: End-Use Energy Expenditures by Sector
While energy expenditures grew rapidly in the 1970s in Washington, during much of the 1980s and 1990s inflation-adjusted43 expenditures declined or grew modestly despite significant growth in energy consumption. This trend changed in 1999 as inflation adjusted energy prices began to rise. By 2012, energy expenditures reached a peak, an increasing over 100 percent relative to the low price year of 1998. Energy prices, and consequently expenditures, have declined since 2012.
Figure 9: End-use Energy Expenditures by Sector, 1970-2014
Sources: EIA State Energy Data System, President’s Council of Economic Advisors-2005 Annual Economic Report of the President. www.eia.doe.gov/emeu/states/_seds.html
Washington’s residents and institutions energy expenditures peaked at nearly $26 billion in 2012.44 After rising in the early 1980s, inflation-adjusted state energy expenditures declined for a period, and then increased modestly until 1998, primarily as the result of steady population growth. During this period, energy prices generally did not keep pace with inflation. As a result, expenditures remained relatively stable despite significant growth in both population and energy consumption.
43 Fuel prices throughout this document are referred to as “inflation-adjusted” or “real” dollars. This adjusts for the effects of inflation and allows prices for different years to be directly compared. See Appendix A: Methodology for details. 44 Expenditures are expressed in constant 2009 dollars so different years can be directly compared.

2017 Biennial Energy Report and State Energy Strategy Update 45
Except for a brief respite during the 2001-02 recession, energy expenditures increased significantly from 1999 to 2008, growing at an average annual rate of 8 percent in real terms. Most of the increase was due to growing transportation sector energy expenditures. Energy expenditures also increased for the industrial, commercial, and residential sectors, but these sector increases were more modest.
Expenditures decreased sharply during the 2007-09 recession due to a combination of reduced consumption and lower prices. State energy expenditures rose quickly again during 2010-12 as energy prices and consumption rebounded with the U.S. economic recovery. During 2011 and 2012, the West Coast experienced higher gasoline and diesel prices due to several refinery accidents that interrupted regional fuel production. Energy expenditures were lower for 2014 as prices for natural gas and petroleum products have declined.
The transportation sector accounts for the largest share of state energy expenditures: 62 percent in 2014. This proportion has grown in recent years, reflecting the increase in the real price of petroleum fuels. The industrial share of state energy expenditures has declined significantly in the last seven years, while the residential and commercial shares declined modestly.

2017 Biennial Energy Report and State Energy Strategy Update 46
Indicator 5: Energy Consumption per Dollar of Gross State Product
Washington’s economy is becoming less energy intensive – the amount of energy required per dollar of gross state product (GSP) is declining.45 Key reasons are a shift in the state’s economy from manufacturing to high-value businesses that are less energy-intensive and improved energy efficiency across all sectors.
Figure 10: Energy Consumption per Dollar of GSP, 1990-2014
Figure 10 depicts an indicator of the overall energy intensity. In the last 20 years, energy consumption per dollar of GSP 46 declined approximately 51 percent.
The message from the above chart is that Washington’s economy is growing faster than its energy consumption. This is due to a number of factors, chief among them is growth in the state’s economic output and a shift from resource and manufacturing industries to commercial activity based on software, biotech, and other less energy intensive businesses. This trend will likely continue with the decline in production at the energy intensive industries. Gains in energy
45 Economic output (GSP) is in real dollars (millions of chained 2009 dollars). This adjusts for the effects of inflation and allows values for different years to be compared. 46 Because there was a change in definitions for industry classifications used in the definition of GSP in 1997 (from SIC to NAICS), an exact comparison of energy intensity from 1990 to 2005 is not possible. However, at a state- level the change does not appear to have a significant impact.

2017 Biennial Energy Report and State Energy Strategy Update 47
efficiency have also contributed to the reduction in Washington’s energy intensity. We have not tried to determine the relative contribution of these various factors to overall the decline in energy use per unit of GSP.
Another way to look at Washington’s energy intensity is energy consumption per capita (Figure 11). Energy consumption per capita in Washington was relatively constant between 1970 and 1999 with growth in overall state energy use being driven by growth in population. However, since 1999 energy consumption per capita has declined by 22 percent from historical levels to about 188 million Btu in 2014.
Figure 11: Energy Consumption per Capita, 1970-2014
Washington’s annual per capita energy consumption averaged about 250 million Btu from 1970 to 1999, the energy equivalent of about 2,300 gallons of gasoline per person per year. Dips in per capita energy consumption during this period were usually the result of high energy prices or periodic economic downturns. Washington’s trend was similar to the national average from 1970 through 1999. Growth in per capita energy use during the mid-1980s was mainly due to increased transportation fuel use as prices declined and Washingtonians drove more.
More recently our per capita energy consumption appears to have moved to a lower level of around 190 million Btu per capita, or about 20 percent below the historical trend. This was likely due to the decline in industrial energy use that occurred from 1999 to 2002, particularly in the energy-intensive aluminum industry, and because of generally higher energy prices during the last decade. In 2014, Washington’s per capita energy consumption was about 17.5 percent less than the national average.

2017 Biennial Energy Report and State Energy Strategy Update 48
Figure 12: Energy Expenditures per Dollar of GSP, 1980-2014
Sources: EIA State Energy Data System, U.S. Department of Commerce, Bureau of Economic Analysis www.eia.doe.gov/emeu/states/_seds.html. GSP data at Bureau of Economic Analysis, www.bea.gov/regional/gsp/
This indicator divides statewide energy expenditures by economic output, in the form of GSP. The result is an estimate of the significance of energy in Washington’s economy. After peaking at more than 11 cents per dollar of GSP in 1981,47 this value declined through the 1980s and 1990s. In 2000, approximately 5.3 cents was spent on energy in Washington for every dollar of GSP. Two trends contributed to this decline. Washington’s economy was becoming less energy-intensive and real energy prices were declining. However, energy prices began to rise in 1999, increasing Washington’s energy expenditures per dollar of GSP from the low of 4.4 cents in 1998 to 7.3 cents in 2008. The trend sharply reversed itself again in 2009 when energy prices and consumption plummeted during the recession in 2007-2009. The trend resumed its upward course as energy prices sharply rebounded during 2010-12. More recently, energy prices have once declined and the trend line has again changed direction.
47 Because there was a change in definitions for industry classifications used in the definition of GSP in 1997 (from SIC to NAICS), an exact comparison of energy intensity from 1990 to 2005 is not possible. However, at a state level the change does not appear to have a significant impact.
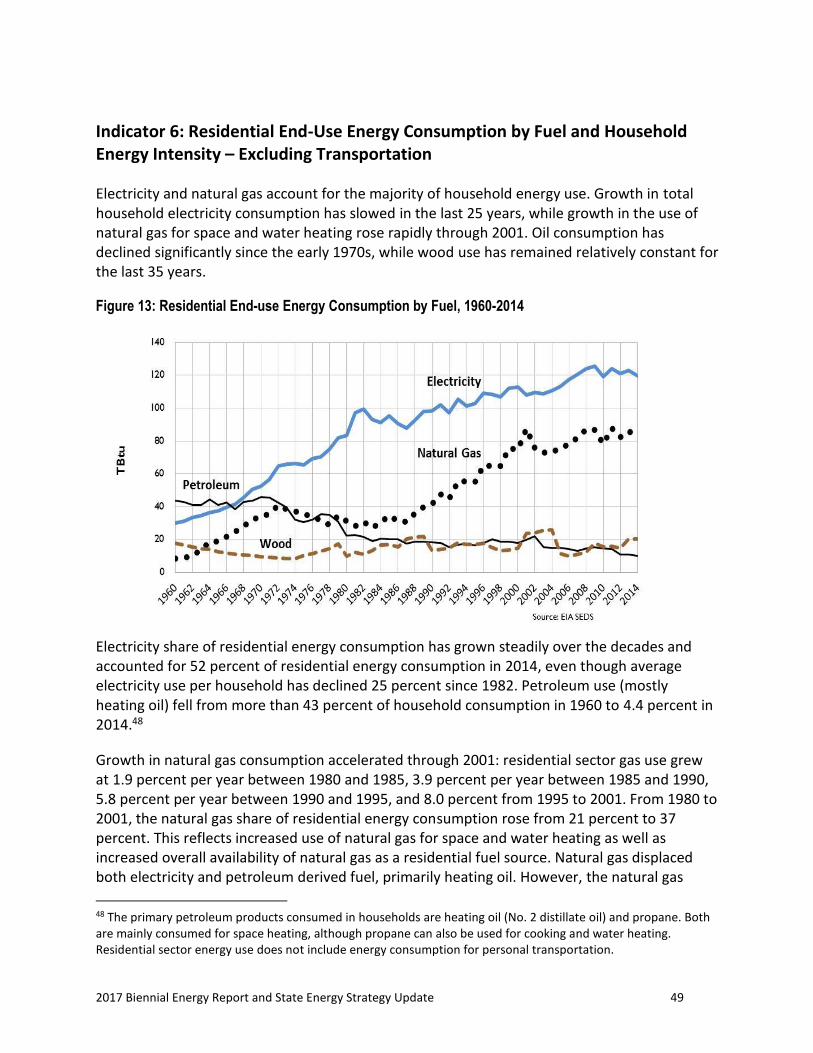
2017 Biennial Energy Report and State Energy Strategy Update 49
Indicator 6: Residential End-Use Energy Consumption by Fuel and Household Energy Intensity – Excluding Transportation
Electricity and natural gas account for the majority of household energy use. Growth in total household electricity consumption has slowed in the last 25 years, while growth in the use of natural gas for space and water heating rose rapidly through 2001. Oil consumption has declined significantly since the early 1970s, while wood use has remained relatively constant for the last 35 years.
Figure 13: Residential End-use Energy Consumption by Fuel, 1960-2014
Electricity share of residential energy consumption has grown steadily over the decades and accounted for 52 percent of residential energy consumption in 2014, even though average electricity use per household has declined 25 percent since 1982. Petroleum use (mostly heating oil) fell from more than 43 percent of household consumption in 1960 to 4.4 percent in 2014.48
Growth in natural gas consumption accelerated through 2001: residential sector gas use grew at 1.9 percent per year between 1980 and 1985, 3.9 percent per year between 1985 and 1990, 5.8 percent per year between 1990 and 1995, and 8.0 percent from 1995 to 2001. From 1980 to 2001, the natural gas share of residential energy consumption rose from 21 percent to 37 percent. This reflects increased use of natural gas for space and water heating as well as increased overall availability of natural gas as a residential fuel source. Natural gas displaced both electricity and petroleum derived fuel, primarily heating oil. However, the natural gas
48 The primary petroleum products consumed in households are heating oil (No. 2 distillate oil) and propane. Both are mainly consumed for space heating, although propane can also be used for cooking and water heating. Residential sector energy use does not include energy consumption for personal transportation.

2017 Biennial Energy Report and State Energy Strategy Update 50
share has remained steady since 2001 in part due to higher gas prices, but also because electricity driven heat pumps have become competitive with natural gas.
Consumption of firewood has varied in response to higher heating fuel prices. It increased in the late 1970s due to high heating oil prices, while it remained stable and declined during much of the 1990s, when energy prices were relatively low. However, when energy prices jumped in 2001, so did wood use as people cut back on their use of natural gas, electricity, and petroleum for heating. Since 2005, wood use has declined, possibly due to higher prices for this fuel, and because of air quality fuel switching programs pursued by the more densely populated counties.
Energy intensity49 in Washington households declined by over one-third between 1970 and 1987. From the late 1980s through the early 2000s household energy intensity remained essentially the same as new home size steadily increased. Over the last several years, household energy intensity has begun a gradual decline.
Figure 14: Residential Energy Consumption per Household, 1970-2014
Sources: EIA State Energy Data System, U.S. Bureau of the Census. www.eia.doe.gov/emeu/states/seds.html
The 1970s were characterized by higher energy prices and diminished oil and natural gas consumption, with natural gas use per household falling by 33 percent between 1970 and 1980.
49 Energy intensity is calculated by dividing total residential sector energy consumption by number of households (excludes transportation fuel unless otherwise noted).
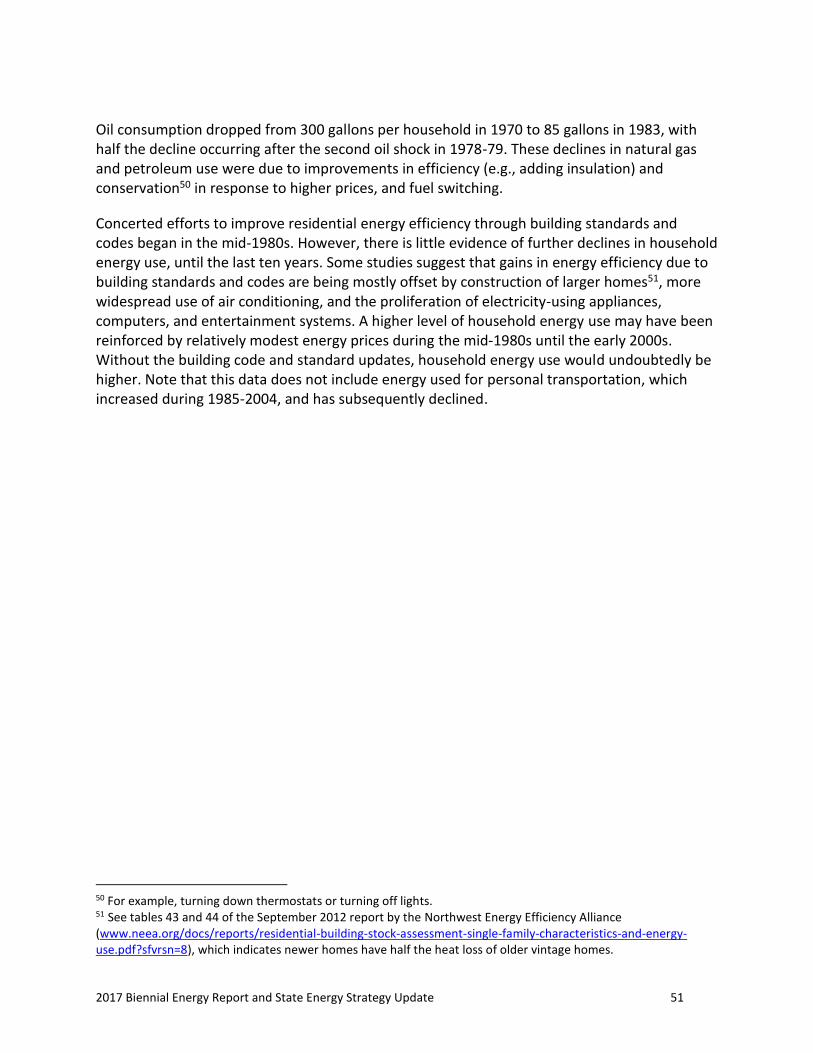
2017 Biennial Energy Report and State Energy Strategy Update 51
Oil consumption dropped from 300 gallons per household in 1970 to 85 gallons in 1983, with half the decline occurring after the second oil shock in 1978-79. These declines in natural gas and petroleum use were due to improvements in efficiency (e.g., adding insulation) and conservation50 in response to higher prices, and fuel switching.
Concerted efforts to improve residential energy efficiency through building standards and codes began in the mid-1980s. However, there is little evidence of further declines in household energy use, until the last ten years. Some studies suggest that gains in energy efficiency due to building standards and codes are being mostly offset by construction of larger homes51, more widespread use of air conditioning, and the proliferation of electricity-using appliances, computers, and entertainment systems. A higher level of household energy use may have been reinforced by relatively modest energy prices during the mid-1980s until the early 2000s. Without the building code and standard updates, household energy use would undoubtedly be higher. Note that this data does not include energy used for personal transportation, which increased during 1985-2004, and has subsequently declined.
50 For example, turning down thermostats or turning off lights. 51 See tables 43 and 44 of the September 2012 report by the Northwest Energy Efficiency Alliance (www.neea.org/docs/reports/residential-building-stock-assessment-single-family-characteristics-and-energy-use.pdf?sfvrsn=8), which indicates newer homes have half the heat loss of older vintage homes.

2017 Biennial Energy Report and State Energy Strategy Update 52
Indicator 7: Residential Household Energy Bill With and Without Transportation
Adjusted for inflation, the average Washington household spent 23 percent more for home energy in 2014 than in the low expenditure year of 1997. Household expenditures peaked in 2008/2009 due to a cold winter and higher natural gas prices.
Figure 15: Residential Energy Expenditures Without Transportation per Household, 1970-2014
In 2014, the average Washington household spent the inflation-adjusted sum of $1,498 (using constant 2009 dollars) for electricity, natural gas, heating oil, and propane delivered to the home. This is $281 more than households spent in 1998, but $195 less than was spent in 2009. When household energy bills spiked in the mid-1980s, increased emphasis on energy conservation and fuel switching from heating oil to natural gas and wood helped mitigate the impact of the oil price shocks. However, there was no immediate substitute for electricity, so when average residential electricity prices increased by 65 percent between 1979 and 1983, due largely to the inclusion in rates of the Washington Public Power Supply System (WPPSS) bond default, the average household electricity bill increased by a similar amount.
During the mid-1980s and through most of the 1990s household energy bills declined due to declining energy prices and fuel switching from expensive electricity and oil to natural gas for heating. Most new homes were being built with natural gas space heat and water heating (78 percent in 1998) and numerous existing households switched to natural gas as well. Electricity
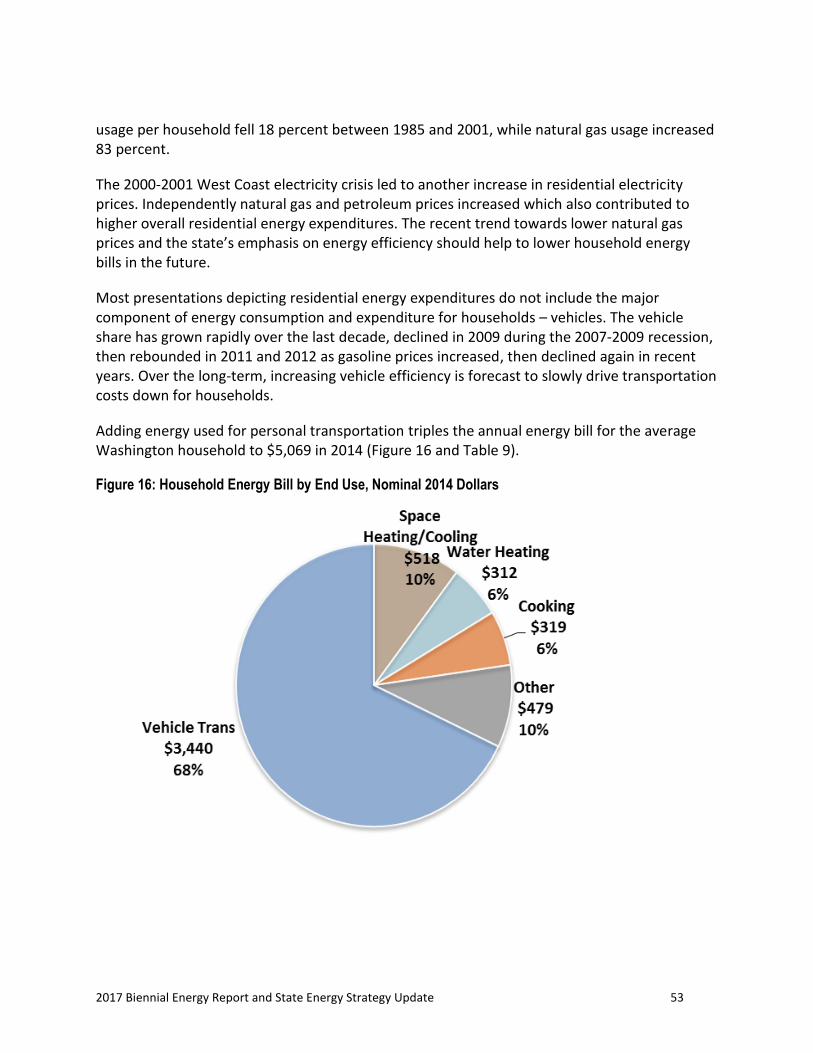
2017 Biennial Energy Report and State Energy Strategy Update 53
usage per household fell 18 percent between 1985 and 2001, while natural gas usage increased 83 percent.
The 2000-2001 West Coast electricity crisis led to another increase in residential electricity prices. Independently natural gas and petroleum prices increased which also contributed to higher overall residential energy expenditures. The recent trend towards lower natural gas prices and the state’s emphasis on energy efficiency should help to lower household energy bills in the future.
Most presentations depicting residential energy expenditures do not include the major component of energy consumption and expenditure for households – vehicles. The vehicle share has grown rapidly over the last decade, declined in 2009 during the 2007-2009 recession, then rebounded in 2011 and 2012 as gasoline prices increased, then declined again in recent years. Over the long-term, increasing vehicle efficiency is forecast to slowly drive transportation costs down for households.
Adding energy used for personal transportation triples the annual energy bill for the average Washington household to $5,069 in 2014 (Figure 16 and Table 9).
Figure 16: Household Energy Bill by End Use, Nominal 2014 Dollars

2017 Biennial Energy Report and State Energy Strategy Update 54
Table 9: Household Energy Bill With Transportation, nominal 2014 Dollars
Average Gas price Methodology
Space Conditioning $518
Water Heating $312
Cooking $319
Other $479
Vehicle Transportation $3,440
Total $5,069
Sources: EIA State Energy Data System; Residential Energy Consumption Survey; Residential Transportation Energy Consumption Survey www.eia.doe.gov/emeu/states/seds.html
After personal transportation, the major categories of household energy expenditures include other uses (lighting, household appliances, and electronic equipment), space conditioning (heating, cooling, and ventilation), water heating, and refrigeration. The “other” uses category has been growing, largely due to the proliferation of computers and electronic equipment. It is now roughly equivalent to space conditioning expenditures.
2017 Biennial Energy Report and State Energy Strategy Update 55
Indicator 8: Commercial End-Use Energy Consumption by Fuel
Electricity and natural gas are the dominant fuels in Washington’s commercial sector. Their use in the commercial sector grew at an average annual rate of more than 5 percent from 1960 to 2000 and at a slower annual rate of about 1 percent after that. In 2014, electricity was 58 percent of end-use energy consumption in the commercial sector, while natural gas was 34 percent.
Figure 17: Commercial Energy Consumption by Fuel, 1960-2014
With a rising use of electricity-consuming equipment, such as computers, printers, and copiers, the commercial sector became increasingly reliant on electricity during the 1970s and 1980s. Sector electricity consumption increased more than four times from 1970 to 2014.
Growth in commercial natural gas use stagnated in the late 1970s and early 1980s, but has grown since. Natural gas use in 2001 was three times the amount in 1970, but dropped to a 20 percent share of total commercial energy consumption in 2002, and has increased only slowly since. Petroleum consumption in 2014 was just over half of the 1970 level, declining from 30 percent share in 1970 to 7 percent in 2014. Coal and wood represent under 2 percent of commercial energy use.
After declining about 15 percent during the 1990s, commercial energy use relative to economic output increased in 2000 and 2001, before resuming a downward trend. Note that in 1997, federal economic reporting moved from the Standard Industrial Classification System (SIC) to the North American Industrial Classification System (NAICS). Energy intensities after 1997

2017 Biennial Energy Report and State Energy Strategy Update 56
should not be compared to intensities before it, or vice versa. A downward trend can be seen in both data sets.
Figure 18: Commercial Sector Energy Consumption per Real Dollar of Sector GSP, 1990-2014
Sources: EIA State Energy Data System; U.S. Department of Commerce, Bureau of Economic Analysis www.eia.doe.gov/emeu/states/seds.html
Washington’s commercial sector has become less energy intensive for the last 15 years.52 From 1990 to 1997, commercial energy consumption in dollars grew only 13 percent while the value of all goods and services produced by the commercial sector grew 30 percent. This decline in commercial energy intensity can be attributed to growth in the economy, shifts to less energy intensive businesses, increased productivity, and improvements in the efficiency of buildings, lighting, and equipment.
The trend appears to have briefly reversed in 2000, with growth in energy use exceeding growth in commercial sector GSP from 2000 to 2001. The change is likely due to an economic downturn at the time. However, the downward trend in energy intensity returned in 2002 as the economy picked up with little or no increase in commercial energy use. Commercial energy intensity ticked upward during the 2007-2009 recession, but has since resumed its downward trend.
52 Because there was a change in definitions for industry classifications used in the definition of GSP in 1997 (from SIC to NAICS), an exact comparison of values before and after 1997 is not possible.

2017 Biennial Energy Report and State Energy Strategy Update 57
Indicator 9: Industrial End-Use Energy Consumption by Fuel
Industrial energy consumption in Washington is more diversified among the different fuels than the other sectors and has varied more over time. Total industrial consumption declined 38 percent between 1998 and 2002. Natural gas and electricity use declined sharply before stabilizing over the last several years.
Figure 19: Industrial Energy Consumption by Fuel, 1960-2014
Energy consumption in Washington’s industrial sector is quite diversified, unlike the residential and commercial sectors, which rely primarily on electricity and natural gas, or the transportation sector that consumes almost exclusively petroleum fuels. Petroleum accounted for 23 percent of industrial consumption in 2014, much of which occurs at refineries, while electricity and natural gas accounted for 29 and 25 percent respectively. Biofuels53 share is sensitive to activity in the timber industry and accounted for 22 percent in 2014; 19 percent during the recession year of 2008. Coal use accounted for less than 1 percent of industrial consumption in 2014, declining from a high of 14 TBtu in 1976 to 2.7 TBtu in 2014.
Energy consumption in the industrial sector varies more than the other sectors, with peaks and valleys that mirror economic activity. When industrial production declines, energy use declines. High energy prices can also contribute to lower production, particularly in energy intensive industries. Peaks in industrial energy use have occurred in 1973, 1988 and 1998. Between the
53 Biofuels consumed in the industrial sector comprise mainly wood and wood waste products such as black liquor or hog fuel. These fuels are primarily burned in industrial boilers to make steam, which can be used directly for industrial processes or to generate electricity for on-site use.

2017 Biennial Energy Report and State Energy Strategy Update 58
1998 consumption peak and 2002 industrial electricity use declined almost 60 percent and natural gas use declined 50 percent. This reflected the decline in aluminum production due to high electricity prices (and low aluminum prices) during 2000-2002 and cuts in production for industries relying on natural gas due to high natural gas prices. Industrial energy use has since rebounded – in 2014 it was 26 percent higher than in 2002, the recent low point following the closure of several aluminum smelters.
Washington’s industrial sector is less energy intensive than it was two decades ago when comparing industrial energy use to industrial GSP.54 Energy intensity in Washington’s industrial sector was relatively constant during the 1990s, but declined significantly from 1998 to 2002 (Figure 20) and has remained relatively constant since.
Figure 20: Industrial Sector Energy Consumption per Real Dollar of Sector GSP, 1990-2014
Sources: EIA State Energy Data System; U.S. Department of Commerce, Bureau of Economic Analysis www.eia.doe.gov/emeu/states/seds.html
54 Because there was a change in definitions for industry classifications used in the definition of GSP in 1997 (from SIC to NAICS), an exact comparison of values before and after 1997 is not possible.

2017 Biennial Energy Report and State Energy Strategy Update 59
Indicator 10: Transportation End-Use Energy Consumption by Fuel
Gasoline55 accounts for just over half of transportation sector energy use in Washington. Petroleum fuels accounted for over 99 percent of transportation energy use in 2014. Washington’s status as a major seaport and aviation hub means significant quantities of aviation and marine fuels are consumed.
Except for the periods between 1978 and 1981, and after 2007-08 (when prices rose significantly), gasoline consumption has generally increased as population grew and demand for travel outstripped gains in vehicle fuel efficiency. Overall, gasoline consumption roughly tracked population growth until 2005. In 2014, consumption was 75 percent greater than in 1970, whereas the state population increased by 106 percent.
Figure 21: Transportation Sector Consumption by Fuel, 1960-2014
Sources: EIA State Energy Data System www.eia.doe.gov/emeu/states/seds.html For price trends see the EIA weekly Gasoline and Diesel Fuel price update at www.eia.gov/petroleum/gasdiesel/
Consumption of distillate fuels in trucks, ships, and railroads grew at a much faster rate than other transportation fuels, reaching levels in 2014 that were nearly five times greater than 1970. However, due to a low base level of diesel use in 1970, the magnitude of this consumption increase (in Btu) was two-thirds the increase for motor gasoline. Aviation fuel
55 Motor gasoline figures include some consumption for off-road uses such as recreational vehicles and agricultural uses. No. 2 distillate, also known as diesel fuel, is used by large trucks, ships, and railroads. The only transportation use for residual fuel is by very large ships. Aviation fuel includes kerosene-based jet fuel used by major airlines, aviation gasoline consumed by smaller airplanes, and military jet fuel.
2017 Biennial Energy Report and State Energy Strategy Update 60
consumption more than doubled between 1970 and 2000, but has since dropped one third due to fuller flights and more efficient aircraft.
Residual fuel consumption is subject to price-induced volatility because it can be stored for long periods of time without degrading. Purchases of this fuel dropped when prices were high, but grew when prices were relatively low. It also varies due to marine traffic at Washington ports and where large ocean going ships choose to purchase their fuel. The volatility of residual fuel use in Washington may indicate tracking and accounting problems with this fuel.

2017 Biennial Energy Report and State Energy Strategy Update 61
Indicator 11: Miles Driven and Transportation Fuel Cost of Driving
Vehicle miles per capita increased during the 1980s, stabilized during the mid-1990s, and began to decline around 2004. Washingtonians drove nearly 40 percent more miles per capita in 2014 than in 1970 (Figure 22). During the same period the fuel cost of driving rose, declined, and then rose again. The fuel cost of driving fell in 2014 and in all likelihood continued to fall through 2016. Precise federal data to illustrate this trend will not be available for nearly two years.
Figure 22: Fuel Cost of Driving and Miles Driven per Capita, 1970-2014
Sources: EIA State Energy Data System; President’s Council of Economic Advisors; Federal Highway Administration, Washington State Department of Transportation, Washington State Office of Financial Management
This indicator contrasts the fuel cost of driving with miles driven per capita in Washington. These two series exhibit a weak inverse relationship. The fuel cost of driving, calculated as real dollar highway energy expenditures divided by vehicle-miles traveled, increased in 1974, 1979-1980, and 2007-2008, and 2011-2012, as a result of high oil price or refinery mishaps. Each time vehicle miles traveled per capita dropped slightly in response to higher prices, discretionary driving was temporarily curtailed. Other factors, such as the health of the economy, congestion, the availability of transit options, and an ageing population, influence per capita VMT as well.

2017 Biennial Energy Report and State Energy Strategy Update 62
The spikes in fuel cost of driving frequently coincided with the beginning of economic downturns, which could also explain the small declines in per capita VMT. Long-term factors such as land-use patterns, commuting habits, and the long lifetimes of vehicles (limiting the ability to switch to fuel efficient vehicles) mean that large swings in fuel prices lead to only small changes in miles driven and fuel consumed in the short run.
Increasing sales of more fuel-efficient vehicles in the early 1980s, combined with declines in the price of highway fuels, caused a rapid drop in the fuel cost of driving, from a high of 17.3 cents per mile in 1981 to 8.2 cents in 1988 (in 2009 dollars). The real price of gasoline changed little over the next 12 years and, as a consequence, new vehicle fuel efficiency declined slightly. Low gasoline prices helped push the fuel cost of driving to an historic low in 1998, but higher fuel prices since then reversed this trend. By 2008 and 2012, the fuel cost of driving had risen almost 150 percent. Per capita vehicle travel increased steadily during the 1980s, then remained relatively stable from 1993 through 2004, then declined during 2006-2013 because of higher fuel prices and a severe recession. Increasing traffic congestion seen over the past several years may also be holding VMT down. The fuel cost of driving reached a peak high of 21.3 cents per mile in 2008, with 2012 a close second at 20.7 cents per mile.

2017 Biennial Energy Report and State Energy Strategy Update 63
Indicator 12: Ground Transportation Sector Fuel Efficiency
Spurred by high gasoline prices and new vehicle efficiency standards, the fuel efficiency of Washington’s existing vehicle fleet increased by more than 45 percent between 1975 and 1992. The increasing popularity of less fuel-efficient vehicles in the 1990s, such as vans, trucks, and sport utility vehicles, temporarily put an end to this upward trend.
Figure 23: New Vehicle Miles per Gallon and Washington State Existing Vehicle Miles per Gallon, 1970-2014
Sources: EIA State Energy Data System; Federal Highway Administration; Washington State Department of Transportation; Oak Ridge National Laboratories Center for Transportation Analysis
Like other sectors, Washington’s transportation sector has become more energy efficient over the years. The average efficiency of Washington’s total vehicle fleet is in shown Figure 23. This metric includes both light and heavy-duty vehicles (freight), and is based on estimated total miles driven, divided by total gasoline and road diesel fuel consumption. It is not directly comparable to the U.S. light-duty fleet efficiency line. Washington’s total vehicle fleet efficiency increased from 12.6 miles per gallon (mpg) in 1975 to 18.7 mpg in 1992. However, this came to an end in the 1990s when Washington’s vehicle fleet efficiency declined by 2.0 miles per gallon. Several factors likely contributed to this decline, including a shift to heavier and/or

2017 Biennial Energy Report and State Energy Strategy Update 64
performance vehicles in the light duty fleet, a rapid increase in freight being moved through the state by heavy-duty trucks, and increasing congestion on our roadways. The last several years suggest that the total vehicle fleet fuel efficiency is improving again.
Gains in the efficiency of the U.S. and Washington light-duty vehicle fleets through the 1980s were due to the replacement of old vehicles with more efficient new models. However, new light-duty vehicle fuel efficiency standards did not change after the mid-1980s. The Corporate Average Fuel Economy (CAFE) standards required automakers to maintain the average fuel efficiency of new vehicles at 27.5 mpg for cars and 20.5 mpg for light trucks (which includes minivans, pickups, and sport-utility vehicles). CAFE had no mandates about how many vehicles could be sold in each category and it did not apply to the largest pickup trucks. As a result, the increasing popularity of trucks and SUVs caused the fuel efficiency of the average new vehicle to drop by two mpg between 1988 and 2002. By 2005, the downward mpg trend reversed itself and the recent adoption of higher national CAFE standards (2007, 2010 and 2012 updates) has contributed to increasing new vehicle fuel efficiency over the past 6 years.
In 2012 the Environmental Protection Agency (EPA) and the National Highway Traffic Safety Administration developed standards to improve the fuel economy of medium- and heavy-duty freight trucks. In the fall of 2016, the EPA issued Phase-2 standards for heavy-duty trucks. These efforts will deliver significant and long-term fuel savings, as heavy trucks travel a large number of miles every year and have long service lifespans.
It is important to note that due to factors such as driving behavior and congestion, the actual on-road fuel efficiency of existing vehicles is less than the new vehicle EPA-rated fuel efficiency shown by the top line in Figure 23. There are two reasons for this difference. First, on-road fuel economy tends to be lower than the EPA composite fuel economy value. Second, vehicles have useful lifespans of 12 to 15 years so the existing light duty vehicle fleet is only slowly replaced by new vehicles with superior (inferior during the 1990s) fuel economy. As a result, the actual on-road efficiency of cars and trucks is lower and trails the new vehicle efficiency trend by a few years. This is reflected in the figure.
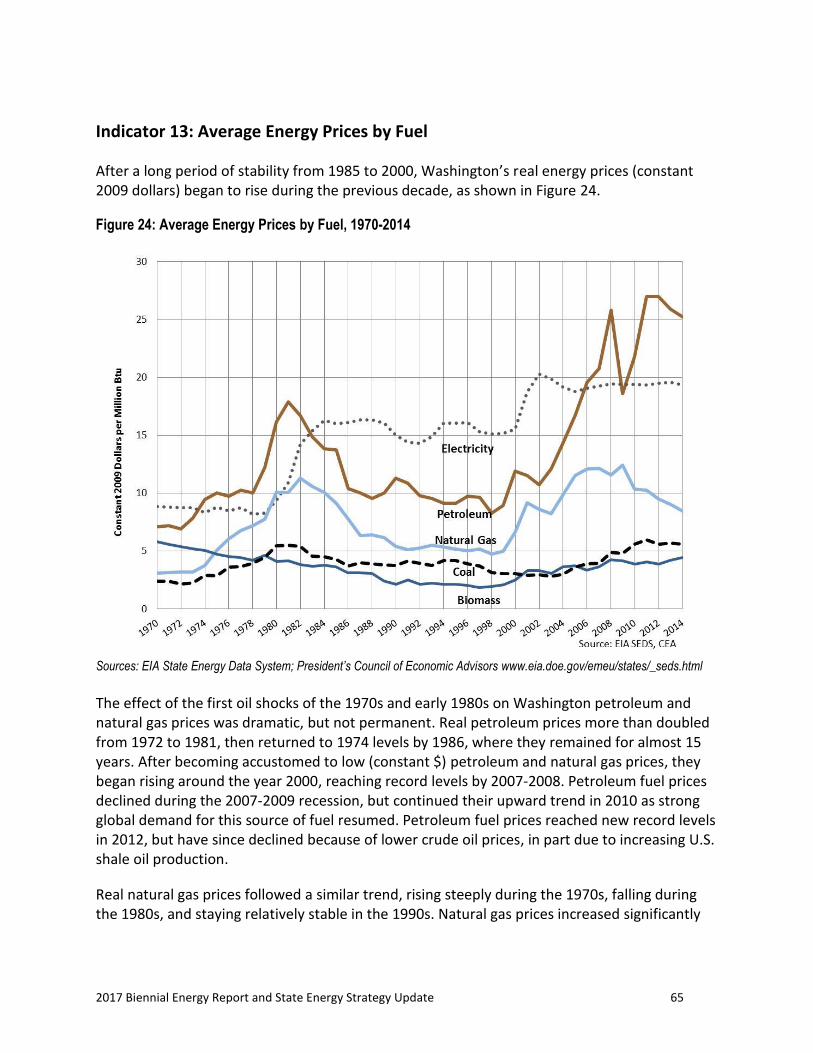
2017 Biennial Energy Report and State Energy Strategy Update 65
Indicator 13: Average Energy Prices by Fuel
After a long period of stability from 1985 to 2000, Washington’s real energy prices (constant 2009 dollars) began to rise during the previous decade, as shown in Figure 24.
Figure 24: Average Energy Prices by Fuel, 1970-2014
Sources: EIA State Energy Data System; President’s Council of Economic Advisors www.eia.doe.gov/emeu/states/_seds.html
The effect of the first oil shocks of the 1970s and early 1980s on Washington petroleum and natural gas prices was dramatic, but not permanent. Real petroleum prices more than doubled from 1972 to 1981, then returned to 1974 levels by 1986, where they remained for almost 15 years. After becoming accustomed to low (constant $) petroleum and natural gas prices, they began rising around the year 2000, reaching record levels by 2007-2008. Petroleum fuel prices declined during the 2007-2009 recession, but continued their upward trend in 2010 as strong global demand for this source of fuel resumed. Petroleum fuel prices reached new record levels in 2012, but have since declined because of lower crude oil prices, in part due to increasing U.S. shale oil production.
Real natural gas prices followed a similar trend, rising steeply during the 1970s, falling during the 1980s, and staying relatively stable in the 1990s. Natural gas prices increased significantly

2017 Biennial Energy Report and State Energy Strategy Update 66
during the previous decade and peaking in 2009. They declined as the shale gas boom delivered new supplies of gas, causing wholesale natural prices to drop sharply.
The average price of electricity, which had been low and stable for years, almost doubled between 1978 and 1984 as the costs of new nuclear power plant projects in Washington, most of which were never completed, were incorporated into electric utility rates. In contrast to oil and natural gas prices, real electricity prices did not decline from the level they reached during the early 1980s. Even though electricity prices in Washington tend to be lower than in other parts of the country, until 2005 electricity was the most expensive primary energy source in Washington (on a Btu basis). Real electricity prices rose in 2000 and 2001 after 15 years of relative stability, and have continued to rise at a very slow rate over the past decade.
Average price trends for coal are similar to the other fossil fuels, but the price swings have been less dramatic, and the difference between coal and the more expensive energy sources has grown. Biofuel prices have been slowly rising since 1988, but are still less expensive than other resources.
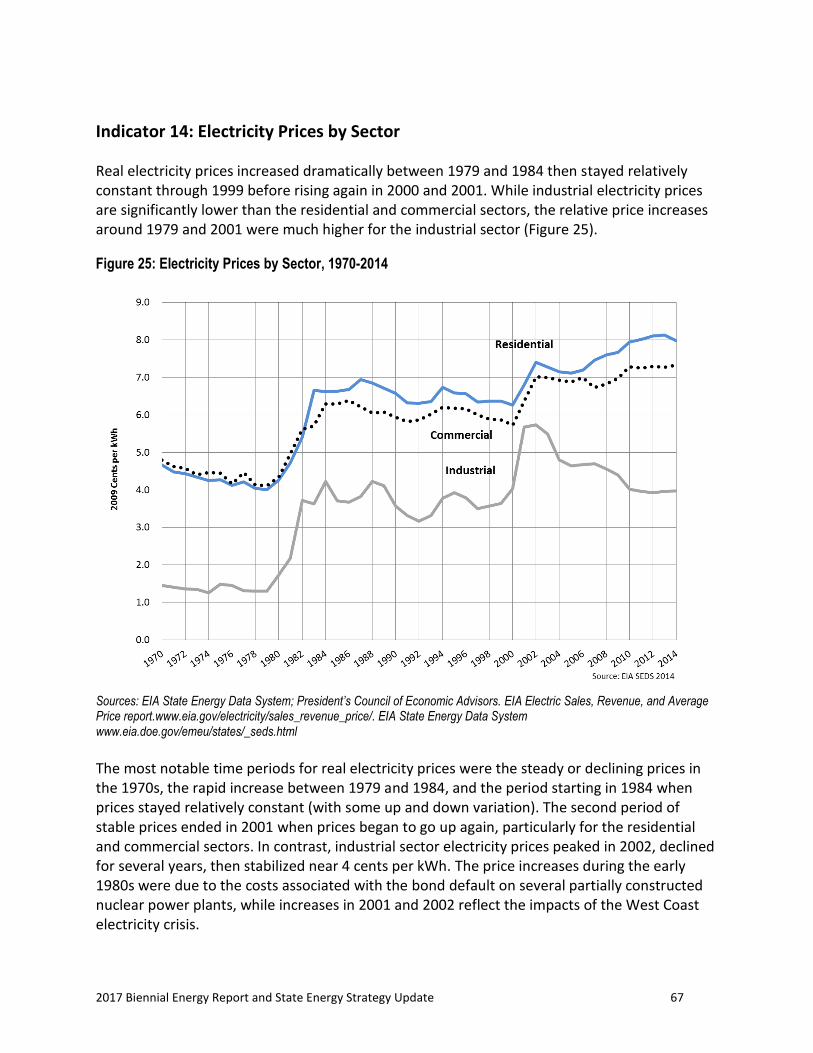
2017 Biennial Energy Report and State Energy Strategy Update 67
Indicator 14: Electricity Prices by Sector
Real electricity prices increased dramatically between 1979 and 1984 then stayed relatively constant through 1999 before rising again in 2000 and 2001. While industrial electricity prices are significantly lower than the residential and commercial sectors, the relative price increases around 1979 and 2001 were much higher for the industrial sector (Figure 25).
Figure 25: Electricity Prices by Sector, 1970-2014
Sources: EIA State Energy Data System; President’s Council of Economic Advisors. EIA Electric Sales, Revenue, and Average Price report.www.eia.gov/electricity/sales_revenue_price/. EIA State Energy Data System www.eia.doe.gov/emeu/states/_seds.html
The most notable time periods for real electricity prices were the steady or declining prices in the 1970s, the rapid increase between 1979 and 1984, and the period starting in 1984 when prices stayed relatively constant (with some up and down variation). The second period of stable prices ended in 2001 when prices began to go up again, particularly for the residential and commercial sectors. In contrast, industrial sector electricity prices peaked in 2002, declined for several years, then stabilized near 4 cents per kWh. The price increases during the early 1980s were due to the costs associated with the bond default on several partially constructed nuclear power plants, while increases in 2001 and 2002 reflect the impacts of the West Coast electricity crisis.

2017 Biennial Energy Report and State Energy Strategy Update 68
Electricity price trends for the residential and commercial sectors from 1970 to 2012 were nearly identical. Industrial sector prices have been more volatile than residential and commercial prices. Industrial electricity prices in 2014 were than 27 percent greater than 1970, versus 171 and 153 percent increases for the residential and commercial sectors.56 On a per unit basis, the average price increase from 1970 through 2014 also varied by sector: 3.3 cents per kWh for residential, 2.5 cents per kWh for commercial, and 2.5 cents per kWh for industrial. Note that these are average costs and Washington exhibits significant variation in price from utility to utility.
56 Industrial electricity prices include the aluminum industry and other Direct Service Industries (DSI) that have historically had access to relatively low-cost electricity from the Bonneville Power Administration. As production in these electricity price sensitive industries (such as aluminum smelters) varies, it can have an impact on average industrial electricity prices. For example, in 2001 when aluminum smelters curtailed production, non-DSI industries paying higher electricity prices made up a larger share of industrial electricity consumption, contributing to the increase in average industrial electricity prices.

2017 Biennial Energy Report and State Energy Strategy Update 69
Indicator 15: Natural Gas Prices by Sector
Real natural gas prices have followed a cyclical pattern over the last 35 years. Prices increased rapidly for all sectors between 1974 and 1982, as U.S. suppliers struggled to meet demand and declined just as rapidly from 1982 to 1991, as new gas supplies were developed. After remaining relatively stable during the 1990s, natural gas prices began to rise around 2000, again reflecting supply constraints and increasing demand. Regional utility natural gas prices spiked during 2000 and 2001 due to market manipulation and shortages in hydroelectricity, which created a need to operate natural gas power plants.
By 2006 and 2007, prices had exceeded the historic highs of 1982 for the residential, commercial and industrial sectors. This reflects supply constraints and growing demand, in part due to the increasing use of natural gas by the utility sector for electricity generation.
Figure 26 also shows a decline for 2008, which not only was a recession year, but reflects the first year that natural gas from shale resources began to enter the market in large quantities. This new natural gas resource is expected to keep natural gas price lower for at least a decade. The trend towards lower natural gas prices for all sectors has continued through 2014.
Figure 26: Natural Gas Prices by Sector, 1970-2014
Sources: EIA State Energy Data System; President’s Council of Economic Advisors www.eia.doe.gov/emeu/states/_seds.html.
2017 Biennial Energy Report and State Energy Strategy Update 70
On a percentage basis, average industrial natural gas prices have been significantly lower than the other sectors, but by 2014 that relative difference had narrowed. Many large industrial customers began to make bulk purchases of commodity gas from suppliers other than their local utilities during the 1990s, helping to keep industrial prices down. However, when prices began to climb in late 1999, the increase was more dramatic for the industrial sector than the other sectors.
During the 1970s’ and 1980’s electric utilities used natural gas to fire relatively small power plants for “peaking,” or seasonal purposes. Consumption was historically low, and weather dependent, with gas often being purchased on the spot market when needed. Over the past fifteen years, utilities have shifted to larger combined cycle gas turbine plants to provide electricity, which require a more secure supply of natural gas.

2017 Biennial Energy Report and State Energy Strategy Update 71
Indicator 16: Gasoline Prices
Washington state gasoline prices, expressed in constant dollars 57, first peaked in 1981, and then declined to a historic low in 1998. Prices first exceeded the 1981 peak in 2006, and reached an all-time high in 2012. Since 2012, gasoline prices have steadily declined with preliminary results indicating annual constant dollar prices under 2.5 cents per gallon for 2015.
Figure 27: Washington State Gasoline Prices, 1970-2014
Sources: EIA State Energy Data System; President’s Council of Economic Advisors. For fuel-price trends see EIA’s weekly Gasoline and Diesel Fuel price update, www.eia.gov/petroleum/gasdiesel/.
For more than 30 years, except from 1979 to 1982 when prices spiked due to the Middle East conflict, inflation-adjusted gasoline prices in Washington were relatively stable. Since 2003, gasoline prices have generally increased. After peaking in 1981 at $2.83 per gallon (2009 dollars), prices dropped to pre-oil crisis levels by 1986. In 1998, following the 1997 Asian financial crisis, gasoline prices fell to their lowest level in nearly 30 years, but rose again beginning in 1999, reflecting increasing world oil demand and prices. A downturn in the world economy in 2001 briefly interrupted the climb in prices, but by 2006 the price of a gallon of
57 Gasoline prices from EIA include state and federal gasoline taxes but they do not include local sales tax.

2017 Biennial Energy Report and State Energy Strategy Update 72
gasoline in Washington had exceeded the peak price observed in 1981. Gasoline reached $3.52 per gallon in 2008 but fell dramatically during the subsequent recession. With economic recovery in the U.S. and the world, gasoline prices began increasing in 2010 and reached a new peak in 2012 of $3.74 per gallon.
A large share of petroleum for Washington comes from Alaska, but increasing amounts are arriving from the Canadian oil sands and by rail from the Bakken region of North Dakota. Gasoline prices in Washington, even excluding taxes, tend to be higher than the national average, reflecting the isolation of the west coast petroleum supply system.

2017 Biennial Energy Report and State Energy Strategy Update 73
Indicator 17: Energy-Related Carbon Dioxide Emissions
Statewide energy-related carbon dioxide emissions from 1980 through 2014 are determined and posted by the EIA, and are showing Figure 28 below for Washington State.58 Washington’s reliance on fossil fuels has led to steady growth in emissions of carbon dioxide, the principal human-caused greenhouse gas. Petroleum use, primarily for transportation, accounted for 68 percent of CO2 emissions from energy use in Washington in 2014.59 In 1970, the share for petroleum related CO2 emissions was 78 percent.
Figure 28: Carbon Dioxide Emissions from Energy Use by Fuel Source, 1960-2014
Sources: EIA, CO2 Energy Emissions by State. For more information on CO2 emissions see EIA State Level Energy Related Carbon Dioxide Emissions, www.eia.gov/environment/emissions/state/analysis/
To address climate change, Washington State has set several greenhouse gas (GHG) emission limits for the next several decades. The 2020 limit is a return to the 1990 GHG emission level. The orange line in Figure 28 illustrates the 1990 level of energy-related CO2 emissions. This is not the same as the state limit of 1990 level of GHG emissions, which includes CO2, methane
58 Independently the state also produces a GHG emission inventory that differs from the EIA estimates shown below in the following ways: the state inventory includes gases other than carbon dioxide, the state inventory goes beyond energy related carbon dioxide emissions and includes process emissions, and the state inventory includes other sectors of the economy such as agriculture and forestry. 59 2012 was a strong hydropower year and a relatively mild winter. Coal and natural gas consumption were much lower in 2012, which boosted the petroleum share of energy related CO2 emissions.

2017 Biennial Energy Report and State Energy Strategy Update 74
and other gases. However, the figure is indicative of the size of the reduction that must be realized for the state to meet the 2020 GHG emission limit. The time series suggests that energy related CO2 emissions peaked in the last decade and are now slowly declining.
Washington’s continued dependence on fossil fuels, particularly petroleum, for energy has led to growth in emissions of CO2, for much of the last 25 years. After dipping in the early 1980s, growth in CO2 emissions accelerated after 1983 as the economy recovered from a protracted recession and oil prices plummeted. Washington’s CO2 emissions from energy use grew more than 70 percent between 1983 and 2001. Emissions dropped in 2002 as a result of lower energy use due to a recession, the partial shutdown of the Northwest aluminum industry and higher energy prices. In addition, the 9/11 terrorist attacks curtailed emissions associated with airline travel. Emissions returned to a slow growth pattern from 2002 through 2007, then declined due to the 2008-2009 recession and higher energy prices. Despite an economic recovery and state population growth energy related CO2 emissions have remained below previous peak levels. Several factors are likely to have produced the recent moderation in energy related CO2 emissions including: increasing federal vehicle fuel economy standards, energy conservation measures being pursued by electric and natural gas utilities, several mild winters which reduce building heating requirements and lower natural gas prices which has reduced electricity generation at coal-fired power plants.
Examining the figure on a fuel basis, we see that the consumption of petroleum products, the vast majority for transportation, has accounted for most of the growth in Washington’s energy-related CO2 emissions since 1970. Emissions from coal exhibit the largest relative increase since 1970 and are almost entirely from one source, the Centralia steam plant, which burns coal to produce electricity. Natural gas contains less carbon per unit of energy than other fossil fuels, but because of higher levels of consumption now accounts for a larger share of Washington’s CO2 emissions than coal.

2017 Biennial Energy Report and State Energy Strategy Update 75
Appendix A: Methodology
Introduction
Most publicly available comprehensive energy data at the state level originate with surveys and estimates developed by the Energy Information Administration (EIA), an independent branch of the U.S. Department of Energy. We rely heavily on the EIA’s State Energy Data System (SEDS) to produce Energy Indicators and other products. However, we modify data from the EIA, based on years of experience with their components, to more accurately portray energy use in Washington. This includes the exclusion of non-energy uses of petroleum and the calculation of primary energy use for hydroelectricity generation.
Excluded Petroleum Products
We exclude the consumption of petroleum products for non-energy purposes. This includes asphalt, road oil, waxes, and lubricants from the transportation and industrial sectors. These are easily removed series that are clearly not used as energy sources.
In the last biennial report, we indicated that we would evaluate the items included in the SEDS petroleum category in order to remove petroleum products not related to the production or consumption of energy. We identified and removed the following products, and this exclusion has been made through all of the indicators: asphalt and road oil, petrochemical feedstock, lubricants, petroleum coke, special naphtha, unfinished oils, unfractionated stream, waxes, and aggregated items in ‘miscellaneous petroleum’. These petroleum items are primarily used in the industrial sector, such as petroleum used as feedstock for paints and solvents or to make waxes to coat packaging. The focus of this analysis is energy consumption in Washington, rather than the supply of, and demand for, petroleum products or other fossil fuels. Excluding these non-energy uses provides the most accurate picture of the consumption of energy in the state.
Hydroelectric Conversion
One last methodological note regarding the differences readers may notice here compared to other tallies of state primary energy use. In a steam-powered generator, as much as two-thirds of the energy in the fuel that is consumed is not converted to electricity, but is lost as waste heat due to thermal inefficiencies. Hydroelectric power generation does not experience thermal losses, but the EIA assigns losses to it equivalent to an average loss rate for fossil fuel powered generation, in an effort to enable comparison of primary energy consumption between individual states. We remove those imputed losses from our primary energy totals. This difference does not affect depictions of sector end-use consumption of energy, as these do not show primary consumption.

2017 Biennial Energy Report and State Energy Strategy Update 76
Methodology Summary
In summary, non-energy petroleum products used in the industrial sector and the calculation of primary energy use for hydroelectricity generation require modifications to standard views of energy consumption to accurately portray the trends depicted in these Indicators.
Fuel Prices
Fuel prices are shown in real dollars and are also referred to as inflation-adjusted dollars. The actual (or nominal) prices in each year have been adjusted to real or constant dollars reflecting the value of a dollar in the year 2009 (the constant year). This is done by multiplying the nominal prices by a gross domestic purchases index for the U.S. for each year (where the value in 2009 equals one). This adjusts for the effects of inflation and allows prices for different years to be compared.
Sector Definitions
Residential sector: An energy-consuming sector that consists of living quarters for private households. Common uses of energy associated with this sector include space heating, water heating, air conditioning, lighting, refrigeration, cooking, and running a variety of other appliances. The residential sector excludes institutional living quarters. Note that various EIA programs differ in sectoral coverage.
Commercial sector: An energy-consuming sector that consists of service-providing facilities and equipment of businesses; federal, state, and local governments; and other private and public organizations, such as religious, social, or fraternal groups. The commercial sector includes institutional living quarters and sewage treatment facilities. Common uses of energy associated with this sector include space heating, water heating, air conditioning, lighting, refrigeration, cooking, and running a wide variety of other equipment. Note: This sector includes generators that produce electricity and/or useful thermal output primarily to support the activities of the above-mentioned commercial establishments.
Industrial sector: An energy-consuming sector that consists of all facilities and equipment used for producing, processing, or assembling goods. The industrial sector encompasses the following types of activity manufacturing (NAICS codes 31-33); agriculture, forestry, fishing and hunting (NAICS code 11); mining, including oil and gas extraction (NAICS code 21); and construction (NAICS code 23). Overall energy use in this sector is largely for process heat and cooling and powering machinery, with lesser amounts used for facility heating, air conditioning, and lighting. Fossil fuels are also used as raw material inputs to manufactured products. Note: This sector includes generators that produce electricity and/or useful thermal output primarily to support the above-mentioned industrial activities.
Transportation sector: An energy-consuming sector that consists of all vehicles whose primary purpose is transporting people and/or goods from one physical location to another. Included

2017 Biennial Energy Report and State Energy Strategy Update 77
are automobiles; trucks; buses; motorcycles; trains, subways, and other rail vehicles; aircraft; and ships, barges, and other waterborne vehicles. Vehicles whose primary purpose is not transportation (e.g., construction cranes and bulldozers, farming vehicles, and warehouse tractors and forklifts) are classified in the sector of their primary use.
Electric power sector: An energy-consuming sector that consists of electricity generators and combined heat and power plants whose primary business is to sell electricity, or electricity and heat, to the public, i.e., NAICS code 22 plants.

2017 Biennial Energy Report and State Energy Strategy Update 78
Appendix B: Energy Indicator Data
A-1
Indicators 1 end use energy consumption by sector, 2 primary energy consumption by source.
indicator 1, trillion Btu indicator 2, trillion Btu
year res comm ind trans total biomass coal hydro nuclear NG petrol. renew. oth. year
1970 142 61.7 349 289 841 66.5 5.9 243 28.7 158 447 0 1970
1971 147 65.9 355 296 864 67.2 6.4 250 27.7 165 459 0 1971
1972 157 76.7 390 300 924 67.0 36.6 262 31.5 180 480 0 1972
1973 152 87.2 400 327 966 66.2 65.0 239 48.3 208 496 0 1973
1974 144 84.6 385 327 940 65.2 54.2 287 43.4 191 474 0 1974
1975 142 82.8 347 349 921 64.3 76.2 290 36.4 171 478 0 1975
1976 146 84.6 342 365 938 71.4 81.2 326 26.6 155 487 0 1976
1977 151 86.3 351 375 964 78.3 102.4 231 46.5 149 520 0 1977
1978 154 85.9 358 403 1,001 81.0 84.7 307 45.3 133 546 0 1978
1979 165 94.1 347 434 1,041 77.5 99.0 274 39.3 166 552 0 1979
1980 148 94.9 356 413 1,012 88.3 91.0 287 22.3 135 541 0 1980
1981 161 105.6 378 403 1,048 94.9 90.9 326 22.5 131 534 0 1981
1982 164 118.2 342 377 1,001 91.1 74.1 305 40.2 114 524 0 1982
1983 153 116.2 332 363 965 104.4 80.2 300 38.1 112 476 0 1983
1984 160 124.3 389 390 1,062 110.3 82.3 290 57.6 132 544 0 1984
1985 168 138.4 355 411 1,073 112.0 93.7 268 85.4 140 552 0 1985
1986 157 116.6 375 480 1,129 117.7 63.3 275 89.3 122 623 0 1986
1987 157 120.9 386 494 1,157 122.5 95.7 242 57.7 136 630 0 1987
1988 169 133.6 415 517 1,235 127.4 99.1 236 63.6 151 663 0 1988
1989 179 130.3 388 558 1,255 108.2 96.7 248 64.7 168 686 0 1989
1990 172 130.1 396 568 1,266 93.4 85.6 303 60.8 168 688 0 1990
1991 182 133.7 372 577 1,265 73.9 89.1 310 44.3 179 690 0 1991
1992 172 127.3 384 643 1,327 95.4 106.1 235 59.6 181 752 0 1992
1993 196 136.3 381 590 1,304 96.5 97.8 231 74.9 230 697 1 1993
1994 192 137.3 395 607 1,332 96.3 106.9 225 70.4 263 717 1 1994
1995 192 140.4 390 631 1,353 90.1 69.8 283 72.9 264 736 1 1995
1996 210 148.1 380 620 1,358 89.7 90.9 339 58.7 284 728 1 1996
1997 209 148.2 395 636 1,387 94.2 80.5 354 65.5 268 745 1 1997
1998 204 147.3 426 601 1,378 87.1 103.5 271 72.6 303 707 1 1998
1999 220 157.7 422 612 1,412 89.1 96.9 330 63.6 302 718 1 1999
2000 220 161.1 367 624 1,372 89.2 106.2 273 89.7 298 742 1 2000
2001 239 168.7 301 597 1,306 92.7 99.4 188 86.2 322 718 1 2001
2002 232 157.6 262 582 1,232 87.6 100.8 265 94.5 240 692 5 2002
2003 223 159.6 266 583 1,231 95.7 118.2 242 79.4 256 681 7 2003
2004 225 158.6 268 601 1,253 92.6 112.5 239 93.7 270 693 8 2004
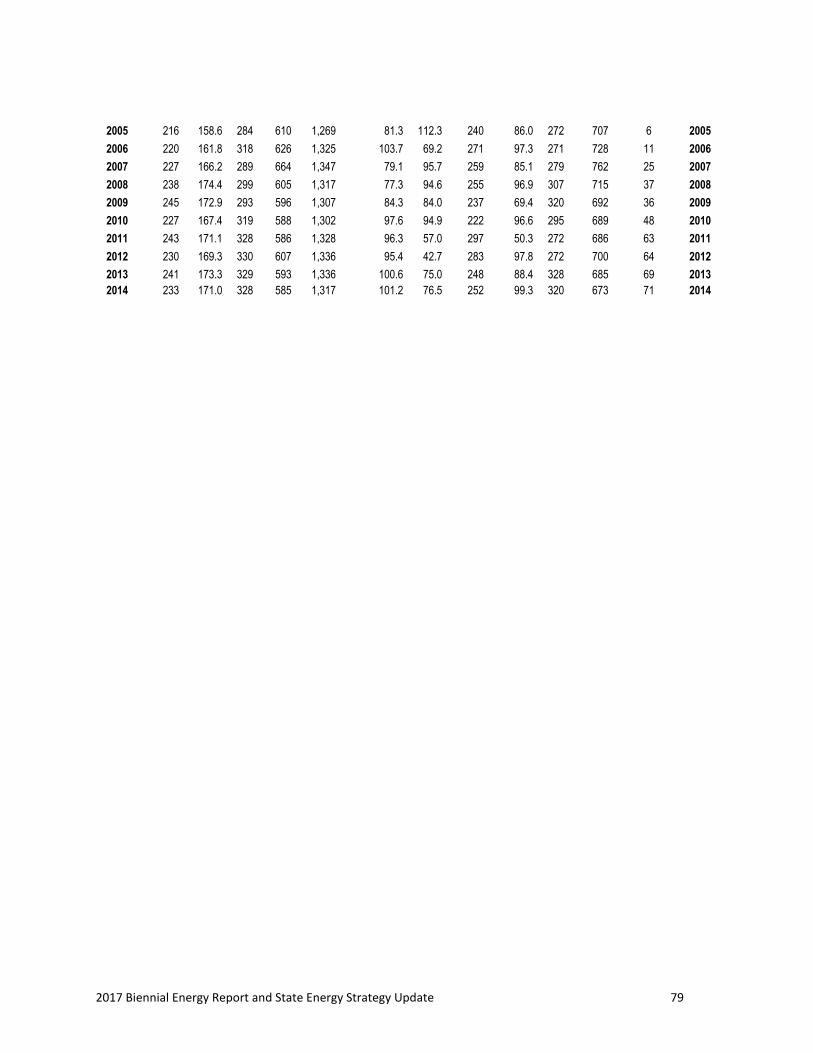
2017 Biennial Energy Report and State Energy Strategy Update 79
2005 216 158.6 284 610 1,269 81.3 112.3 240 86.0 272 707 6 2005
2006 220 161.8 318 626 1,325 103.7 69.2 271 97.3 271 728 11 2006
2007 227 166.2 289 664 1,347 79.1 95.7 259 85.1 279 762 25 2007
2008 238 174.4 299 605 1,317 77.3 94.6 255 96.9 307 715 37 2008
2009 245 172.9 293 596 1,307 84.3 84.0 237 69.4 320 692 36 2009
2010 227 167.4 319 588 1,302 97.6 94.9 222 96.6 295 689 48 2010
2011 243 171.1 328 586 1,328 96.3 57.0 297 50.3 272 686 63 2011
2012 230 169.3 330 607 1,336 95.4 42.7 283 97.8 272 700 64 2012
2013 241 173.3 329 593 1,336 100.6 75.0 248 88.4 328 685 69 2013
2014 233 171.0 328 585 1,317 101.2 76.5 252 99.3 320 673 71 2014

2017 Biennial Energy Report and State Energy Strategy Update 80
A-2
Indicators 4 end use energy expenditures by sector, 5 energy consumption per GSP (index) 6 energy consumption per capita, 7 energy expenditures per GSP (index)
indicator 4, billion 2005$ ind. 5 2000=1
indicator 6 mmBtu/person
ind. 7 2000=1
year res. comm. ind. trans. WA US year
1970 1,237 512 771 2,722 247 274 1970
1971 1,267 534 783 2,695 251 275 1971
1972 1,350 644 844 2,622 269 284 1972
1973 1,348 709 884 2,936 280 292 1973
1974 1,369 724 1,066 3,795 268 280 1974
1975 1,375 772 1,149 4,043 258 267 1975
1976 1,427 802 1,151 4,271 258 279 1976
1977 1,519 868 1,214 4,500 260 282 1977
1978 1,516 838 1,263 4,655 261 285 1978
1979 1,722 976 1,405 5,870 262 284 1979
1980 1,808 1,135 1,746 7,187 245 268 1.90 1980
1981 2,146 1,409 2,057 7,691 248 257 2.08 1981
1982 2,370 1,720 2,354 6,716 234 243 2.05 1982
1983 2,495 1,643 2,057 5,687 224 238 1.78 1983
1984 2,481 1,765 2,647 5,867 244 249 1.81 1984
1985 2,558 1,891 2,149 5,819 243 245 1.74 1985
1986 2,322 1,600 1,774 4,914 253 244 1.40 1986
1987 2,293 1,621 1,816 5,020 256 249 1.35 1987
1988 2,409 1,693 2,112 4,923 267 259 1.32 1988
1989 2,515 1,673 2,186 5,483 265 259 1.34 1989
1990 2,469 1,645 2,061 6,295 1.64 260 254 1.33 1990
1991 2,466 1,631 1,933 6,238 1.60 252 250 1.28 1991
1992 2,317 1,624 1,813 6,049 1.62 258 253 1.17 1992
1993 2,589 1,727 1,854 5,703 1.55 248 253 1.14 1993
1994 2,633 1,804 1,959 5,900 1.54 248 256 1.14 1994
1995 2,613 1,842 1,981 6,044 1.55 247 258 1.15 1995
1996 2,812 1,929 1,837 6,686 1.48 244 265 1.16 1996
1997 2,758 1,889 1,905 6,599 1.43 a
245 264 0.99 b
1997
1998 2,691 1,861 2,007 5,253 1.10 240 259 0.84 1998
1999 2,859 1,965 2,109 6,252 1.04 242 260 0.87 1999
2000 3,012 2,089 2,219 8,095 1.00 233 257 1.00 2000
2001 3,496 2,461 1,997 7,134 0.97 219 247 1.00 2001
2002 3,526 2,501 1,568 6,500 0.90 204 248 0.91 2002
2003 3,314 2,476 1,714 7,649 0.89 202 247 0.96 2003
2004 3,450 2,566 1,810 9,221 0.89 203 251 1.06 2004
2005 3,663 2,646 2,190 11,092 0.86 203 247 1.15 2005
2006 3,904 2,818 2,402 12,816 0.86 208 243 1.25 2006
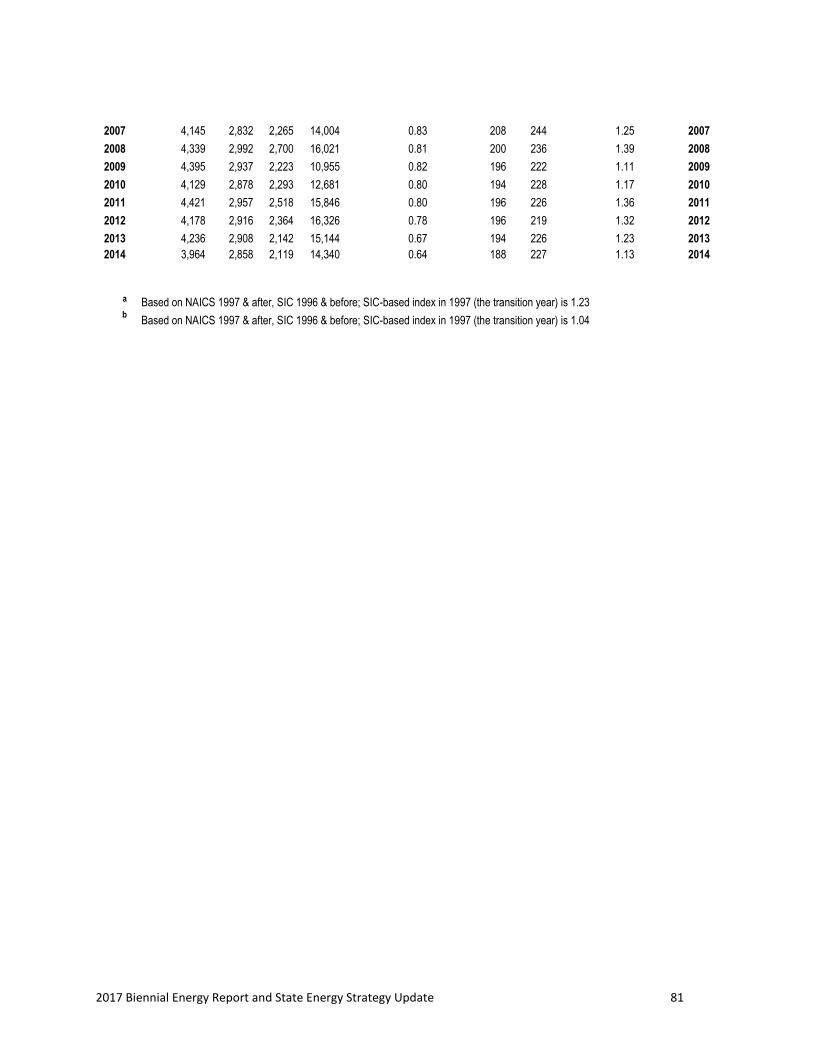
2017 Biennial Energy Report and State Energy Strategy Update 81
2007 4,145 2,832 2,265 14,004 0.83 208 244 1.25 2007
2008 4,339 2,992 2,700 16,021 0.81 200 236 1.39 2008
2009 4,395 2,937 2,223 10,955 0.82 196 222 1.11 2009
2010 4,129 2,878 2,293 12,681 0.80 194 228 1.17 2010
2011 4,421 2,957 2,518 15,846 0.80 196 226 1.36 2011
2012 4,178 2,916 2,364 16,326 0.78 196 219 1.32 2012
2013 4,236 2,908 2,142 15,144 0.67 194 226 1.23 2013
2014 3,964 2,858 2,119 14,340 0.64 188 227 1.13 2014
a Based on NAICS 1997 & after, SIC 1996 & before; SIC-based index in 1997 (the transition year) is 1.23 b
Based on NAICS 1997 & after, SIC 1996 & before; SIC-based index in 1997 (the transition year) is 1.04
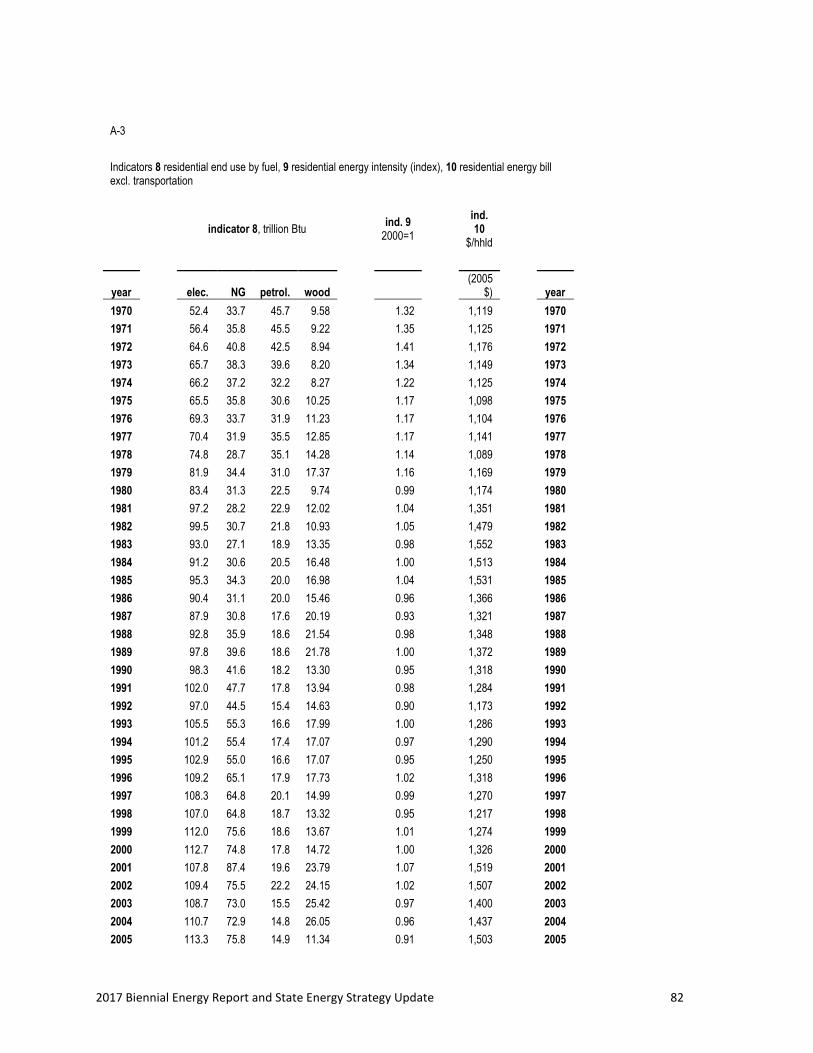
2017 Biennial Energy Report and State Energy Strategy Update 82
A-3
Indicators 8 residential end use by fuel, 9 residential energy intensity (index), 10 residential energy bill excl. transportation
indicator 8, trillion Btu ind. 9 2000=1
ind. 10
$/hhld
year elec. NG petrol. wood
(2005 $) year
1970 52.4 33.7 45.7 9.58 1.32 1,119 1970
1971 56.4 35.8 45.5 9.22 1.35 1,125 1971
1972 64.6 40.8 42.5 8.94 1.41 1,176 1972
1973 65.7 38.3 39.6 8.20 1.34 1,149 1973
1974 66.2 37.2 32.2 8.27 1.22 1,125 1974
1975 65.5 35.8 30.6 10.25 1.17 1,098 1975
1976 69.3 33.7 31.9 11.23 1.17 1,104 1976
1977 70.4 31.9 35.5 12.85 1.17 1,141 1977
1978 74.8 28.7 35.1 14.28 1.14 1,089 1978
1979 81.9 34.4 31.0 17.37 1.16 1,169 1979
1980 83.4 31.3 22.5 9.74 0.99 1,174 1980
1981 97.2 28.2 22.9 12.02 1.04 1,351 1981
1982 99.5 30.7 21.8 10.93 1.05 1,479 1982
1983 93.0 27.1 18.9 13.35 0.98 1,552 1983
1984 91.2 30.6 20.5 16.48 1.00 1,513 1984
1985 95.3 34.3 20.0 16.98 1.04 1,531 1985
1986 90.4 31.1 20.0 15.46 0.96 1,366 1986
1987 87.9 30.8 17.6 20.19 0.93 1,321 1987
1988 92.8 35.9 18.6 21.54 0.98 1,348 1988
1989 97.8 39.6 18.6 21.78 1.00 1,372 1989
1990 98.3 41.6 18.2 13.30 0.95 1,318 1990
1991 102.0 47.7 17.8 13.94 0.98 1,284 1991
1992 97.0 44.5 15.4 14.63 0.90 1,173 1992
1993 105.5 55.3 16.6 17.99 1.00 1,286 1993
1994 101.2 55.4 17.4 17.07 0.97 1,290 1994
1995 102.9 55.0 16.6 17.07 0.95 1,250 1995
1996 109.2 65.1 17.9 17.73 1.02 1,318 1996
1997 108.3 64.8 20.1 14.99 0.99 1,270 1997
1998 107.0 64.8 18.7 13.32 0.95 1,217 1998
1999 112.0 75.6 18.6 13.67 1.01 1,274 1999
2000 112.7 74.8 17.8 14.72 1.00 1,326 2000
2001 107.8 87.4 19.6 23.79 1.07 1,519 2001
2002 109.4 75.5 22.2 24.15 1.02 1,507 2002
2003 108.7 73.0 15.5 25.42 0.97 1,400 2003
2004 110.7 72.9 14.8 26.05 0.96 1,437 2004
2005 113.3 75.8 14.9 11.34 0.91 1,503 2005

2017 Biennial Energy Report and State Energy Strategy Update 83
2006 117.5 77.8 14.1 10.06 0.91 1,569 2006
2007 120.7 82.2 12.9 11.12 0.93 1,638 2007
2008 124.0 87.1 14.5 12.44 0.96 1,690 2008
2009 125.5 86.7 15.3 17.55 0.97 1,693 2009
2010 119.1 78.0 14.6 15.32 0.89 1,576 2010
2011 124.1 87.9 14.1 15.67 0.95 1,679 2011
2012 121.2 82.2 10.7 14.62 0.90 1,594 2012
2013 122.8 86.1 10.6 20.19 0.94 1,611 2013
2014 119.7 82.1 10.2 20.19 0.91 1,498 2014

2017 Biennial Energy Report and State Energy Strategy Update 84
A-4
Indicators 12 commercial end use by fuel, 13 commercial energy intensity (index), 14 industrial end use by fuel, 15 industrial energy intensity (index)
indicator 12, trillion Btu
ind. 13 2000=1
indicator 14, trillion Btu
ind. 15
2000=1
year elec. NG petro
l coal,w
d elec. NG petrol
. biomas
s coal
(2005 $) year
1970 22.9 19.5 18.75 0.52 88.5 98.3 100.5 56.8 5.09 1970
1971 24.7 21.7 18.74 0.71 84.7 101.3 105.4 57.8 5.33 1971
1972 33.0 24.5 18.61 0.57 97.1 106.7 124.7 57.9 3.44 1972
1973 35.2 34.0 17.65 0.40 93.1 127.9 117.2 57.9 3.92 1973
1974 34.3 34.8 15.16 0.35
103.3 113.6 105.0 56.7 6.48 1974
1975 35.4 33.3 13.58 0.47 95.4 96.0 90.5 53.9 10.9
1 1975
1976 37.8 33.0 13.39 0.52
102.8 82.0 82.9 59.9
14.24 1976
1977 37.7 31.3 14.88 2.38 94.0 79.4 99.9 65.2 12.4
1 1977
1978 41.2 26.5 14.90 3.33
108.5 71.4 99.4 66.5
12.18 1978
1979 44.1 34.9 12.46 2.60
109.2 86.8 79.0 59.8
12.48 1979
1980 47.2 32.4 12.14 3.14
108.4 67.0 95.8 78.3 7.09 1980
1981 60.9 30.1 12.14 2.57
119.8 70.0 98.3 82.6 7.67 1981
1982 61.9 32.2 20.62 3.44 97.7 49.6 106.5 79.9 7.95 1982
1983 62.3 30.0 19.52 4.51
106.5 53.1 76.2 90.3 5.58 1983
1984 61.4 33.8 24.86 4.23
115.1 65.6 111.0 92.1 4.52 1984
1985 64.7 36.9 32.47 4.35
101.8 65.7 91.1 91.7 4.49 1985
1986 64.2 33.0 17.51 1.97
103.8 55.6 107.7 99.8 7.38 1986
1987 67.2 33.4 18.70 1.59
109.2 67.9 104.3 98.0 5.89 1987
1988 70.7 37.6 22.61 2.75
127.3 71.2 109.3 101.1 5.27 1988
1989 70.4 39.7 16.14 3.34
129.2 75.6 97.5 80.8 4.95 1989
1990 73.4 39.8 13.38 2.60 1.57
140.9 80.8 94.2 75.0 5.20 1.60 1990
1991 75.0 43.0 11.91 2.99 1.55
141.3 82.2 89.4 54.7 4.28 1.56 1991
1992 76.9 39.0 7.36 3.26 1.42
132.4 82.4 93.2 72.6 3.37 1.56 1992
1993 78.3 45.3 7.41 4.52 1.47
126.2 95.8 86.7 68.9 3.51 1.55 1993
1994 79.8 44.8 8.03 3.96 1.44
117.9 112.2 91.5 69.6 3.88 1.58 1994

2017 Biennial Energy Report and State Energy Strategy Update 85
1995 81.6 44.4 9.61 3.88 1.45
119.0 114.6 86.7 64.8 4.23 1.64 1995
1996 85.8 50.0 8.37 2.91 1.47
108.5 118.6 86.5 63.0 2.98 1.51 1996
1997 86.0 49.0 9.29 2.94 1.06
a 118.1 116.6 86.5 70.1 3.22
1.23
b
1997
1998 88.3 47.7 7.73 2.51 0.99
130.0 139.3 88.7 64.9 2.69 1.29 1998
1999 91.1 53.5 9.36 2.68 0.97
137.0 131.0 85.7 65.7 2.18 1.22 1999
2000 95.7 52.6 8.89 2.92 1.00
121.1 87.3 93.2 62.2 2.82 1.00 2000
2001 93.9 59.1 10.08 4.65 1.04 66.0 77.6 97.6 57.3 2.89 0.91 2001
2002 93.9 47.8 10.78 4.76 0.96 55.7 69.7 83.7 50.2 2.28 0.79 2002
2003 95.7 49.1 8.86 5.00 0.95 62.0 67.6 81.1 53.1 2.09 0.82 2003
2004 96.3 49.8 6.37 4.85 0.92 65.7 69.7 79.5 51.2 1.85 0.84 2004
2005 95.9 51.2 8.56 1.82 0.90 75.5 68.9 81.7 57.1 1.48 0.77 2005
2006 97.5 52.8 8.55 1.69 0.88 75.1 72.9 86.4 81.3 2.01 0.82 2006
2007
101.0 55.1 7.28 1.80 0.86 70.8 75.4 84.9 55.1 3.19 0.70 2007
2008
101.9 57.9 11.55 1.89 0.89 72.1 78.0 91.0 55.5 2.95 0.75 2008
2009
102.6 57.4 9.22 2.48 0.90 79.8 73.4 79.9 56.8 3.51 0.77 2009
2010 98.4 53.0 12.12 2.45 0.85 90.9 73.6 82.3 69.8 2.73 0.82 2010
2011
100.3 58.1 9.90 2.36 0.85 95.3 78.5 83.2 69.4 1.83 0.84 2011
2012 99.8 55.0 11.67 2.06 0.81 94.1 80.5 81.4 72.7 2.10 0.80 2012
2013
101.2 57.7 11.23 2.39 0.73 92.9 83.6 80.2 70.6 2.01 0.66 2013
2014 99.1 56.8 11.77 2.39 0.69 95.6 82.9 76.4 71.0 2.71 0.65 2014
a Based on NAICS definitions from 1997 forward; SIC definitions 1996 and earlier. SIC-based index in 1997 is
1.19. b Based on NAICS definitions from 1997 forward; SIC definitions 1996 and earlier. SIC-based index in 1997 is
1.21.

2017 Biennial Energy Report and State Energy Strategy Update 86
A-5
Indicators 16 transportation end use by fuel, 17a travel per capita, 17b fuel cost of driving, 18 transportation energy intensity
indicator 16, trillion Btu ind.17a mi/person
ind.17b ¢/mi
indicator 18, mi/gal
year gasoline distillate av. fuel resid. (2005 $) WAa USb USc year
1970 185 23.0 61.1 12.7 5,968 11.61 13.8 13.0 1970
1971 189 26.2 66.6 7.5 6,066 11.08 13.8 13.0 1971
1972 195 29.9 61.1 6.1 6,365 10.29 14.0 12.9 1972
1973 205 38.9 67.4 7.3 6,671 10.62 14.0 12.8 1973
1974 205 37.6 70.5 7.9 6,360 13.69 13.6 13.1 1974
1975 211 38.5 80.1 13.3 6,476 13.42 13.7 13.1 13.2 1975
1976 223 46.6 74.2 14.7 6,791 13.15 13.8 14.3 13.1 1976
1977 235 48.5 69.2 16.4 7,128 13.03 14.1 15.1 13.4 1977
1978 245 53.6 65.8 31.8 7,457 12.27 14.6 16.0 13.6 1978
1979 235 58.7 72.7 59.4 7,416 14.09 15.7 16.2 13.9 1979
1980 220 55.9 69.3 63.6 6,920 17.16 16.3 19.3 14.9 1980
1981 222 56.2 69.4 51.3 6,962 17.13 16.6 20.7 15.4 1981
1982 223 49.1 73.0 29.6 7,189 14.78 17.2 21.3 16.0 1982
1983 231 46.5 73.1 10.3 7,421 12.25 17.3 21.2 16.2 1983
1984 238 48.7 88.8 10.4 7,674 13.64 15.3 21.2 16.6 1984
1985 226 59.1 87.6 34.5 7,759 12.47 16.4 21.6 16.6 1985
1986 241 82.0 97.2 56.2 7,878 10.05 15.6 22.2 16.7 1986
1987 264 67.9 106.1 51.1 8,219 10.12 15.4 22.3 17.2 1987
1988 261 71.9 117.4 60.9 8,674 9.23 16.4 22.2 17.8 1988
1989 278 72.9 117.0 84.5 8,975 9.67 16.3 21.8 18.2 1989
1990 276 67.6 127.6 89.5 9,028 10.41 17.1 21.5 18.8 1990
1991 280 68.5 121.6 99.7 9,250 9.36 17.9 21.6 19.5 1991
1992 285 73.6 137.4 139.2 9,606 9.01 18.7 21.2 19.5 1992
1993 297 68.0 126.6 93.1 8,761 9.40 17.1 21.3 19.3 1993
1994 297 86.7 123.3 91.7 8,841 9.78 16.7 20.8 19.4 1994
1995 304 82.0 131.5 104.1 9,003 9.73 16.9 21.0 19.6 1995
1996 318 88.7 128.0 77.2 8,873 10.83 16.2 20.9 19.6 1996
1997 316 102.8 128.4 79.1 9,017 9.87 17.0 20.7 19.8
1997
1998 320 86.5 125.9 58.8 9,031 8.20 17.3 20.6 19.8 1998
1999 325 103.4 127.1 47.8 9,041 9.81 16.5 20.2 19.6 1999
2000 325 109.1 141.9 41.7 9,048 11.69 16.8 20.2 20.8 2000
2001 325 98.5 124.4 39.4 8,982 10.67 17.0 20.1 21.0 2001
2002 330 107.9 103.8 33.2 9,066 9.60 17.0 20.0 20.9 2002
2003 328 108.6 100.3 37.6 9,021 11.35 17.0 20.1 20.8 2003
2004 327 113.0 110.0 41.0 9,026 13.13 17.0 19.8 20.9 2004
2005 332 113.7 106.1 48.9 8,867 15.66 16.8 20.4 21.1 2005
2006 334 138.8 106.3 39.0 8,865 17.47 16.6 20.6 21.3 2006

2017 Biennial Energy Report and State Energy Strategy Update 87
2007 334 142.2 116.8 62.7 8,776 18.36 16.7 21.2 22.0 2007
2008 322 130.9 114.7 28.3 8,434 21.26 16.7 21.5 21.7 2008
2009 324 114.2 104.3 43.9 8,461 14.97 17.3 22.9 21.8 2009
2010 318 110.5 110.0 40.6 8,505 16.93 17.6 23.2 21.5 2010
2011 314 120.8 93.8 48.8 8,415 20.47 17.8 22.9 21.5 2011
2012 311 111.2 110.7 62.2 8,326 20.69 17.8 24.4 21.6 2012
2013 324 106.6 90.5 60.2 8,313 19.89 17.3 25.2 21.7 2013
2014 324 113.4 95.4 40.8 8,273 19.07 17.4 25.0 21.5 2014
a All Washington on-road vehicles, regardless of class b
(for reference) Registered U.S. light duty vehicles c
(for reference) U.S. new light duty vehicle fuel efficiency rating

2017 Biennial Energy Report and State Energy Strategy Update 88
A-6
Indicators 20 energy prices by fuel, 21 electricity prices by sector, 22 natural gas prices by sector
indicator 20, 2005$/mmBtu indicator 21, ¢/kWh indicator 22, ¢/therma
year petrol. elec. NG biomass coal res. comm. ind'l. res. comm. ind'l utility year
1970 7.08 8.85 3.11 5.82 2.41 4.66 4.80 1.45 58.2 46.0 16.6 0.0 1970
1971 7.18 8.79 3.13 5.58 2.42 4.48 4.62 1.41 56.7 44.6 17.5 0.0 1971
1972 6.94 8.75 3.20 5.39 2.16 4.43 4.58 1.36 55.5 43.9 18.0 0.0 1972
1973 7.85 8.75 3.18 5.19 2.24 4.34 4.41 1.34 56.1 45.1 19.3 0.0 1973
1974 9.45 8.34 3.76 5.08 2.92 4.25 4.46 1.26 58.8 44.2 26.8 0.0 1974
1975 10.00 8.81 5.09 4.71 2.86 4.28 4.45 1.49 69.4 55.7 41.0 0.0 1975
1976 9.72 8.47 6.06 4.55 3.62 4.13 4.17 1.45 78.1 64.5 50.4 0.0 1976
1977 10.28 8.75 6.79 4.43 3.66 4.22 4.46 1.31 84.9 72.7 57.7 0.0 1977
1978 10.00 8.17 7.19 4.22 3.95 4.05 4.13 1.30 88.1 72.2 63.7 61.3 1978
1979 12.26 8.29 7.75 4.61 4.46 4.01 4.12 1.30 92.4 81.1 68.6 64.7 1979
1980 16.15 9.35 10.07 4.11 5.44 4.27 4.35 1.73 113.5 103.2 92.0 77.1 1980
1981 17.88 10.91 10.07 4.17 5.49 4.72 4.96 2.17 117.8 104.6 90.4 78.5 1981
1982 16.70 14.24 11.29 3.84 5.40 5.41 5.62 3.71 126.3 114.3 102.3 108.9 1982
1983 14.87 15.39 10.59 3.71 4.55 6.65 5.71 3.63 122.8 108.7 93.9 94.5 1983
1984 13.84 16.31 10.06 3.78 4.50 6.63 6.29 4.22 117.7 104.7 88.9 88.5 1984
1985 13.72 16.01 9.12 3.63 4.29 6.63 6.29 3.71 110.7 91.4 79.9 79.2 1985
1986 10.41 16.08 7.76 3.11 3.71 6.68 6.39 3.67 98.5 83.9 59.7 48.0 1986
1987 10.01 16.35 6.36 3.14 4.00 6.95 6.22 3.82 87.6 72.7 46.4 41.7 1987
1988 9.58 16.33 6.40 3.06 3.88 6.85 6.06 4.22 86.4 72.1 46.6 49.2 1988
1989 10.00 16.04 6.14 2.41 3.82 6.72 6.07 4.11 82.5 70.3 44.1 78.4 1989
1990 11.32 15.01 5.39 2.12 3.76 6.58 5.94 3.57 72.9 60.1 39.5 45.3 1990
1991 10.88 14.42 5.14 2.52 4.13 6.32 5.82 3.32 65.7 57.1 39.2 55.5 1991
1992 9.77 14.33 5.25 2.15 3.95 6.31 5.87 3.17 68.5 59.2 39.9 44.7 1992
1993 9.53 14.89 5.49 2.23 3.75 6.36 6.02 3.31 69.6 60.4 42.9 52.0 1993
1994 9.13 16.05 5.35 2.15 4.18 6.73 6.21 3.78 73.9 63.6 38.3 63.8 1994
1995 9.11 16.05 5.17 2.15 4.16 6.59 6.18 3.92 74.9 63.7 34.9 58.1 1995
1996 9.73 16.10 5.04 2.03 3.92 6.56 6.16 3.79 70.9 60.3 33.5 61.9 1996
1997 9.66 15.29 5.17 1.86 3.73 6.34 6.01 3.50 68.9 57.8 38.5 72.4
1997
1998 8.30 15.11 4.75 1.96 3.13 6.37 5.89 3.57 70.7 57.5 31.9 41.3 1998
1999 8.94 15.16 4.98 2.11 3.06 6.37 5.87 3.64 69.7 58.0 33.5 32.7 1999
2000 11.92 15.56 6.64 2.50 3.07 6.27 5.73 4.03 83.9 70.5 47.0 62.2 2000
2001 11.52 18.72 9.16 3.32 2.89 6.80 6.38 5.68 112.9 99.5 57.9 88.6 2001
2002 10.74 20.31 8.61 3.30 2.98 7.40 7.02 5.74 106.5 94.1 54.9 38.8 2002
2003 12.10 19.85 8.26 3.08 2.82 7.27 6.99 5.49 94.7 82.9 67.9 36.7 2003
2004 14.37 19.14 9.89 3.64 3.02 7.15 6.93 4.81 108.2 102.7 85.5 50.7 2004
2005 16.72 18.76 11.51 3.74 3.60 7.11 6.88 4.64 124.6 110.1 108.4 70.6 2005
2006 19.58 19.06 12.10 3.38 3.91 7.20 7.00 4.68 136.8 122.6 101.0 59.7 2006

2017 Biennial Energy Report and State Energy Strategy Update 89
2007 20.75 19.24 12.13 3.64 3.97 7.46 6.73 4.69 138.9 124.0 98.1 61.7 2007
2008 25.80 19.43 11.58 4.27 4.90 7.60 6.83 4.56 127.8 112.4 103.2 83.8 2008
2009 18.62 19.41 12.41 4.15 4.81 7.67 6.97 4.40 135.4 119.0 113.4 51.4 2009
2010 21.82 19.39 10.36 3.88 5.60 7.94 7.28 4.02 117.1 100.4 89.6 53.0 2010
2011 26.97 19.37 10.24 4.07 5.98 8.01 7.25 3.96 115.7 97.9 89.0 53.4 2011
2012 26.99 19.47 9.49 3.89 5.58 8.10 7.30 3.92 109.6 90.7 81.0 41.3 2012
2013 25.91 19.58 9.02 4.19 5.70 8.13 7.28 3.96 103.0 83.3 75.7 42.1 2013
2014 25.25 19.36 8.46 4.46 5.59 7.97 7.33 3.98 93.4 79.7 75.4 45.3 2014
a 1 therm = 100,000
Btu
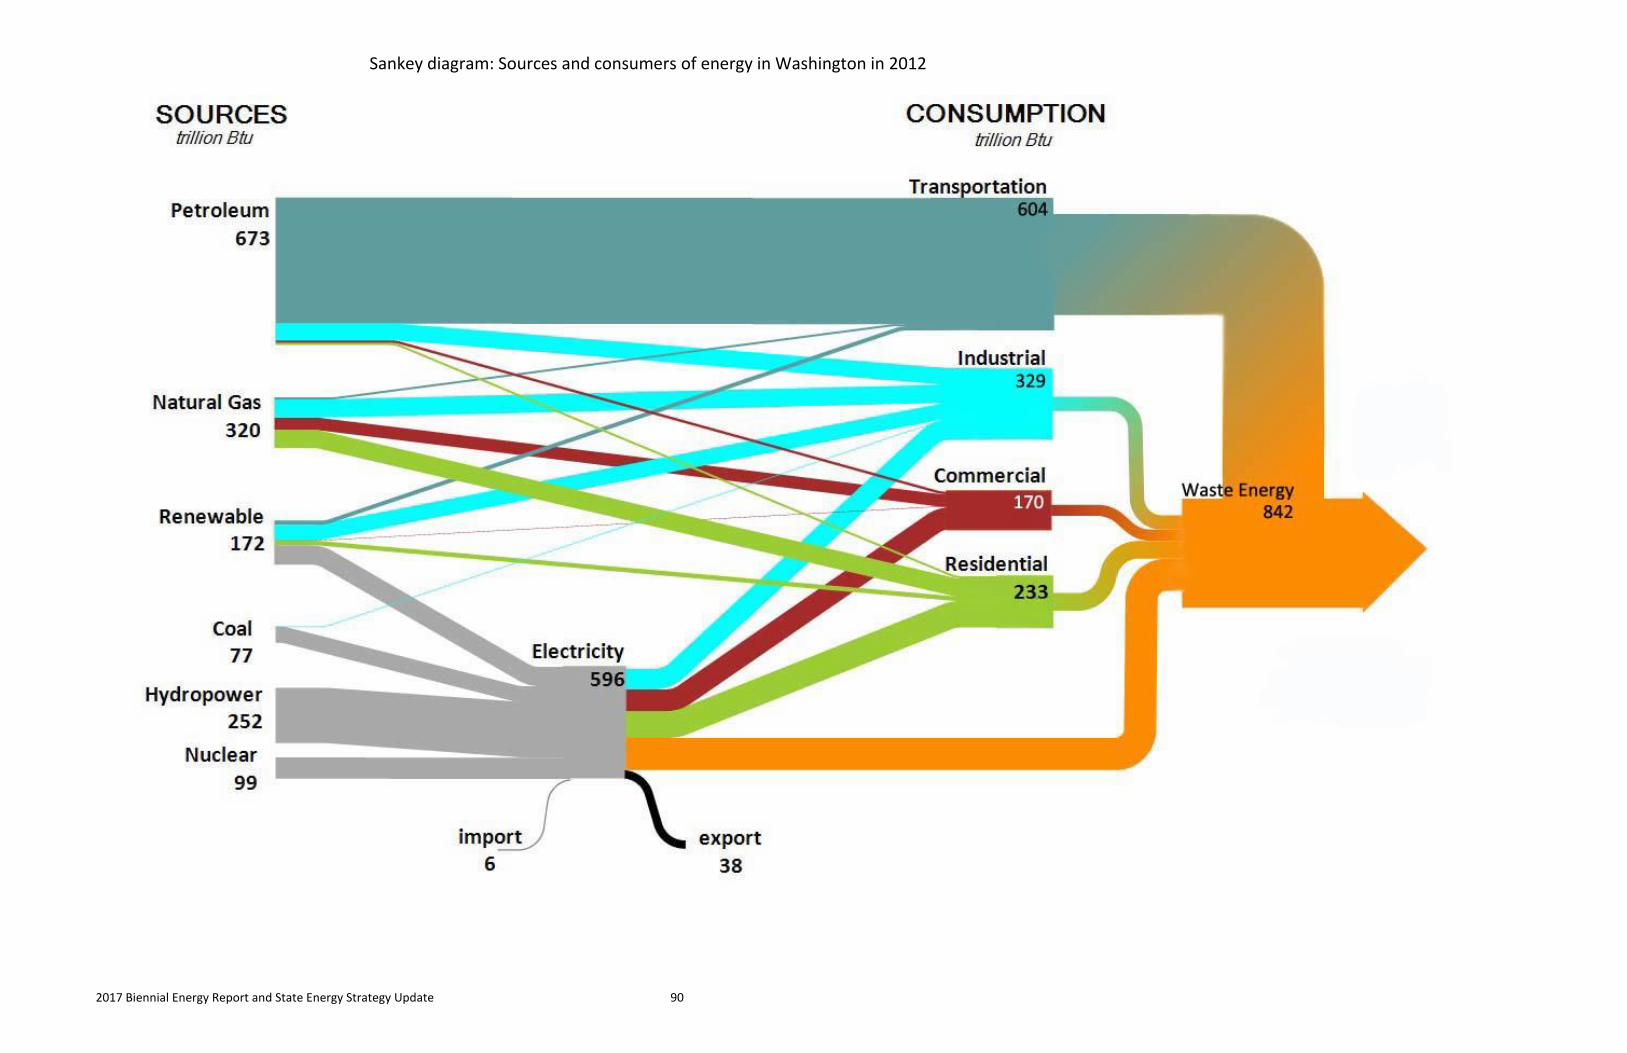
2017 Biennial Energy Report and State Energy Strategy Update 90
Sankey diagram: Sources and consumers of energy in Washington in 2012