2017 · 3 section one bahrain insurance market 4 section two performance of insurance firms 8...
TRANSCRIPT

1
2017

2
His Royal Highness Prince
Khalifa Bin Salman Al Khalifa
The Prime Minster
His Majesty
King Hamad Bin Isa Al Khalifa
King of The Kingdom of Bahrain
His Royal Highness Prince
Salman Bin Hamad Al Khalifa
The Crown Prince, Deputy
Supreme Commander and
First Deputy Premier

3
Section One
Bahrain Insurance Market
4
Section Two
Performance of Insurance Firms
8
Section Three
Highlights of Insurance Business by Class
10
Section Four
Statistical Data Gross Premiums of Insurance Firms Operating in Bahrain Net Written Premiums of Insurance Firms Operating in Bahrain Net Premiums Earned of Insurance Firms Operating in Bahrain Gross Claims of Insurance Firms Operating in Bahrain Net Claims of Insurance Firms Operating in Bahrain Number of Insurance Policies Issued by Insurance Firms Operating in Bahrain
17 18 19 20 21 22 23
Section Five
Financial Data Key Performance Figures of Insurance Firms Consolidated Data of Insurance Firms – Income Statement
24 25 26
Index

4

5
BD' 000 2017 2016 % ∆ 2017 2016 % ∆
Long-term 52,422 51,620 2% 30,734 33,000 -7%
Fire, Property & Liability 33,930 40,314 -16% 73,581 8,249 792%
Miscellaneous Financial Loss 3,349 3,614 -7% 2,842 494 476%
Marine & Aviation 6,425 5,966 8% 1,370 1,864 -26%
Motor 80,909 78,879 3% 75,317 67,509 12%
Engineering 16,305 18,092 -10% 41,109 1,548 2556%
Medical 66,264 62,108 7% 42,817 41,992 2%
Others 9,084 11,449 -21% 4,746 3,584 32%
Total 268,689 272,043 -1.2% 272,515 158,239 72%
Note: Certain items have been restated or reclassified and have been retrospectively adjusted in 2016.
Gross Premiums Gross Claims
Chart 1-1: Gross Premiums of Insurance Firms Operating in Bahrain for the year 2017
Main Highlights

6
2017 2016 2015 2014 2013 2012 2011 2010 2009 2008
Bahraini Insurance Firms 24 25 25 25 25 26 27 27 27 25
Overseas Insurance Firms (Foreign
Branches)12 11 11 11 11 11 11 11 11 11
Insurance Licensees Limited to
Operation Outside Bahrain25 25 25 28 32 33 37 41 46 46
Representative Offices 4 4 4 5 5 5 5 5 5 6
Insurance Brokers 31 31 31 31 31 31 33 33 32 32
Insurance Consultants 4 4 4 4 5 5 5 5 4 4
Loss Adjusters 13 13 11 11 11 11 11 11 11 12
Actuaries 29 27 27 23 31 30 27 25 24 21
Insurance Pools & Syndicates 2 2 2 2 2 2 2 2 2 2
Insurance Ancillary Services 7 6 6 6 6 3 3 2 2 2
Insurance Managers 4 4 5 3 3 3 3 3 3 2
Insurance Society 1 1 1 1 1 1 1 1 1 0
TOTAL 156 153 152 150 163 161 165 166 168 163
Table 1-1: Insurance Firms and Organisations Authorised in Bahrain (2008 - 2017)

7
Bahraini Non Bah. Bahraini Non Bah. Bahraini Non Bah. Bahraini Non Bah. Total % of Bah.
2017 842 284 44 55 188 200 1,074 539 1,613 67%
2016 851 291 52 62 194 206 1,097 559 1,656 66%
2015 799 295 57 69 192 212 1,048 576 1,624 65%
2014 832 286 63 83 186 194 1,081 563 1,644 66%
2013 824 304 70 78 196 191 1,090 573 1,663 66%
Bahraini Ins. Firms Overseas Ins. FirmsReinsurance /
Retakaful FirmsT O T A L
Bahraini67%
Non-Bahraini33%
Table 1-2: Bahrain Insurance Market Manpower (2013-2017)
Chart 1-2: Bahrain Insurance Market Manpower in 2017

8
9
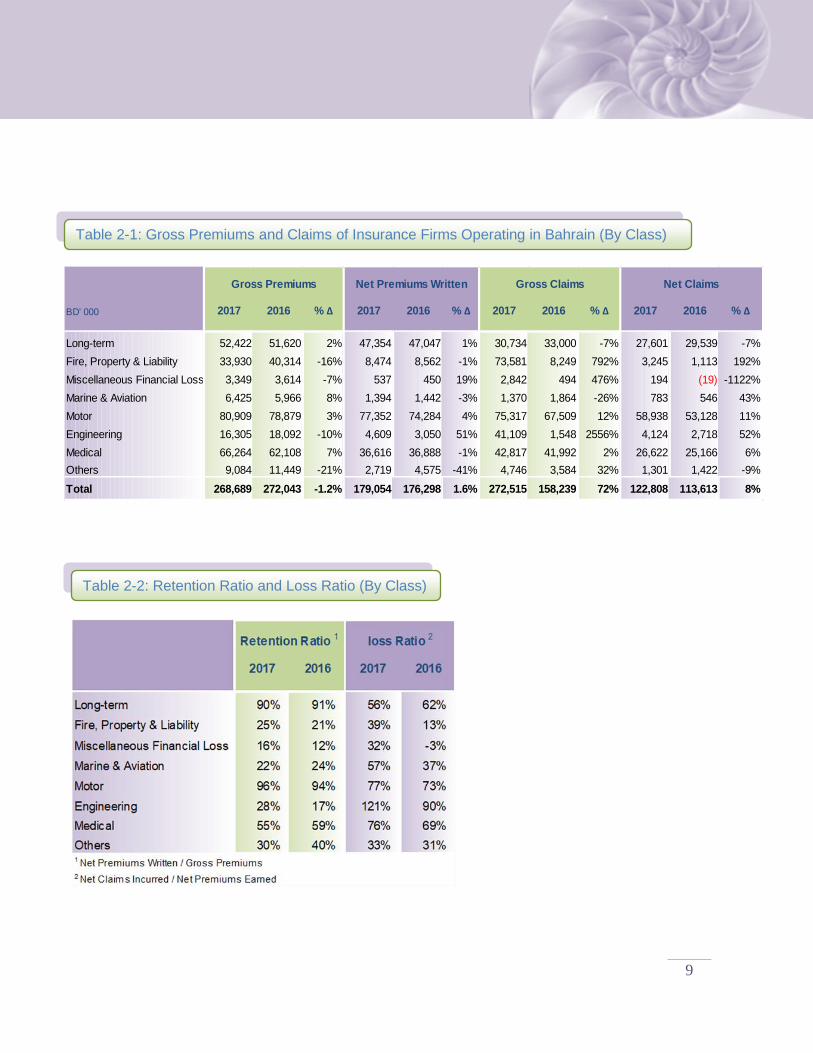
BD' 000 2017 2016 % ∆ 2017 2016 % ∆ 2017 2016 % ∆ 2017 2016 % ∆
Long-term 52,422 51,620 2% 47,354 47,047 1% 30,734 33,000 -7% 27,601 29,539 -7%
Fire, Property & Liability 33,930 40,314 -16% 8,474 8,562 -1% 73,581 8,249 792% 3,245 1,113 192%
Miscellaneous Financial Loss 3,349 3,614 -7% 537 450 19% 2,842 494 476% 194 (19) -1122%
Marine & Aviation 6,425 5,966 8% 1,394 1,442 -3% 1,370 1,864 -26% 783 546 43%
Motor 80,909 78,879 3% 77,352 74,284 4% 75,317 67,509 12% 58,938 53,128 11%
Engineering 16,305 18,092 -10% 4,609 3,050 51% 41,109 1,548 2556% 4,124 2,718 52%
Medical 66,264 62,108 7% 36,616 36,888 -1% 42,817 41,992 2% 26,622 25,166 6%
Others 9,084 11,449 -21% 2,719 4,575 -41% 4,746 3,584 32% 1,301 1,422 -9%
Total 268,689 272,043 -1.2% 179,054 176,298 1.6% 272,515 158,239 72% 122,808 113,613 8%
Net ClaimsGross Premiums Gross ClaimsNet Premiums Written
Table 2-1: Gross Premiums and Claims of Insurance Firms Operating in Bahrain (By Class)
Table 2-2: Retention Ratio and Loss Ratio (By Class)

10

11
LONG-TERM INSURANCE:
Long-term Insurance coverage includes the following policies: • Group life assurance; • Group credit life assurance; • Level and decreasing term assurance; • Unit-linked assurance; • Participating with profit policies; and • Children’s education policies.
This is in addition to the ancillary benefits that are normally attached to such types of life assurance.
BD '000 Gross Premiums Gross Claims
2013 62,767 33,883
2014 60,837 37,415
2015 55,028 39,923
2016 51,620 33,000
2017 52,422 30,734
Long-term 20%
General80%
Chart 3-1: Gross Premiums of Long-term Insurance Firms for the year 2017
Table 3-1: Gross Premiums & Claims of Long-term Insurance for the last five years

12
FIRE, PROPERTY & LIABILITY INSURANCE:
BD '000 Gross Premiums Gross Claims
2013 47,200 24,013
2014 49,010 27,202
2015 47,319 2,189
2016 40,314 8,249
2017 33,930 73,581
Fire, Property &
Liability 13%
Other Insurance
s87%
Table 3-2: Gross Premiums & Claims of Fire, Property & Liability Insurance for the last five years
Chart 3-2: Gross Premiums of Fire, Property & Liability Insurance for the year 2017

13
MARINE & AVIATION INSURANCE:
BD '000 Gross Premiums Gross Claims
2013 6,079 1,135
2014 7,939 590
2015 7,367 1,381
2016 5,966 1,864
2017 6,425 1,370
Marine & Aviation
2%
Other Insurances
98%
Chart 3-3: Gross Premiums of Marine & Aviation Insurance for the year 2017
Table 3-3: Gross Premiums & Claims of Marine & Aviation Insurance for the last Five years

14
MOTOR INSURANCE:
BD '000 Gross Premiums Gross Claims
2013 68,047 57,731
2014 73,114 60,612
2015 76,157 65,715
2016 78,879 67,509
2017 80,909 75,317
Motor30%
Other Insurances
70%
Chart 3-4: Gross Premiums of Motor Insurance for the year 2017
Table 3-4: Gross Premiums & Claims of Motor Insurance for the last five years

15
MEDICAL INSURANCE:
BD '000 Gross Premiums Gross Claims
2013 40,833 30,817
2014 47,894 32,585
2015 52,198 38,481
2016 62,108 41,992
2017 66,264 42,817
Medical25%Other
Insurances75%
Chart 3-5: Gross Premiums of Medical Insurance for the year 2017
Table 3-5: Gross Premiums & Claims of Medical Insurance for the last five years

16
Other Insurances
11%
Other Classes of Insurance
89%
OTHER CLASSES OF INSURANCE: Other Classes of insurance have been grouped to
include the following:
Miscellaneous Financial Loss
Engineering
Others
BD '000 Gross Premiums Gross Claims
2013 33,478 27,825
2014 35,151 13,498
2015 34,737 7,237
2016 33,155 5,625
2017 28,739 48,697
Table 3-6: Gross Premiums & Claims for Other Classes of Insurance for the last five years
Chart 3-6: Gross Premiums for Other Classes of Insurance for the year 2017

17

18
Conventional
FirmsTakaful Firms
2017 24,522 6,349 30,871 21,552 52,422
2016 22,752 7,912 30,664 20,956 51,620
2017 14,316 3,754 18,070 4,074 22,144
2016 19,854 4,091 23,945 4,447 28,392
2017 4,271 1,349 5,620 0 5,620
2016 4,163 1,542 5,705 0 5,705
2017 1,648 908 2,555 793 3,349
2016 1,405 894 2,299 1,315 3,614
2017 3,795 713 4,509 439 4,947
2016 3,912 833 4,745 692 5,436
2017 1,465 13 1,478 0 1,478
2016 526 4 530 0 530
2017 57,188 19,205 76,393 4,516 80,909
2016 54,752 19,352 74,104 4,775 78,879
2017 4,567 1,261 5,828 10,478 16,305
2016 7,187 1,554 8,741 9,351 18,092
2017 3,137 1,683 4,820 1,346 6,166
2016 3,441 1,316 4,757 1,460 6,217
2017 36,248 23,678 59,927 6,337 66,264
2016 37,148 18,625 55,773 6,335 62,108
2017 3,406 3,490 6,897 2,188 9,084
2016 4,700 4,308 9,007 2,442 11,449
2017 154,564 62,403 216,967 51,722 268,689
2016 159,841 60,430 220,270 51,772 272,043TOTAL
Marine cargo, marine hull
Aviation
Motor
Engineering
Liability
Medical (≤1 year)
Fire
Damage to property
Miscellaneous financial loss
BD '000
Others
Bahraini Insurance Firms
Bahraini
Insurance Firms
Overseas
Insurance FirmsGRAND TOTAL
Long-term
Table 4-1: Gross Premiums of Insurance Firms Operating in Bahrain

19
Conventional
FirmsTakaful Firms
2017 22,428 4,258 26,686 20,668 47,354
2016 21,053 5,856 26,909 20,138 47,047
2017 2,723 415 3,138 2,821 5,959
2016 2,359 583 2,942 3,247 6,189
2017 459 196 655 0 655
2016 286 184 470 0 470
2017 228 32 260 277 537
2016 195 80 275 175 450
2017 904 149 1,053 341 1,394
2016 883 148 1,031 413 1,444
2017 0 0 0 0 0
2016 0 (2) (2) 0 (2)
2017 55,190 18,009 73,199 4,152 77,352
2016 51,527 18,423 69,949 4,335 74,284
2017 640 140 780 3,828 4,609
2016 735 238 973 2,077 3,050
2017 639 219 859 1,003 1,861
2016 559 154 713 1,190 1,903
2017 16,164 17,684 33,848 2,768 36,616
2016 17,828 14,644 32,472 4,415 36,888
2017 1,182 297 1,479 1,240 2,719
2016 2,361 900 3,261 1,314 4,575
2017 100,556 41,400 141,957 37,098 179,054
2016 97,787 41,207 138,994 37,304 176,298
Engineering
Liability
Medical (≤1 year)
Others
TOTAL
Motor
Long-term
Fire
Damage to property
Miscellaneous financial loss
Marine cargo, marine hull
Aviation
BD '000
Bahraini
Insurance Firms
Overseas
Insurance FirmsGRAND TOTAL
Bahraini Insurance Firms
Table 4-2: Net Premiums Written for Insurance Firms Operating in Bahrain

20
Conventional
FirmsTakaful Firms
2017 22,684 6,237 28,921 20,679 49,600
2016 21,096 6,550 27,646 20,116 47,762
2017 2,309 483 2,791 2,814 5,605
2016 2,429 567 2,996 3,438 6,434
2017 437 197 634 0 634
2016 191 158 349 0 349
2017 258 72 330 277 607
2016 205 70 275 472 747
2017 877 142 1,019 354 1,373
2016 897 152 1,049 448 1,497
2017 0 0 0 0 0
2016 0 (1) (1) 0 (1)
2017 53,798 18,067 71,865 4,233 76,098
2016 50,118 18,379 68,497 4,375 72,872
2017 682 248 930 2,472 3,402
2016 660 279 939 2,095 3,034
2017 610 450 1,060 1,059 2,119
2016 503 93 595 1,385 1,981
2017 15,572 16,764 32,336 2,603 34,939
2016 17,826 14,165 31,991 4,489 36,480
2017 1,179 291 1,471 2,477 3,948
2016 2,451 990 3,442 1,142 4,583
2017 98,406 42,951 141,357 36,967 178,325
2016 96,377 41,402 137,778 37,959 175,737
Long-term
Fire
Damage to property
Medical (≤1 year)
Others
TOTAL
Miscellaneous financial loss
Marine cargo, marine hull
Aviation
Motor
Engineering
Liability
Bahraini Insurance Firms
Bahraini
Insurance Firms
Overseas
Insurance FirmsGRAND TOTAL
BD '000
Table 4-3: Net Premiums Earned for Insurance Firms Operating in Bahrain

21
Conventional
FirmsTakaful Firms
2017 18,223 1,828 20,051 10,683 30,734
2016 20,426 1,760 22,186 10,814 33,000
2017 57,625 346 57,971 13,163 71,134
2016 1,915 1,044 2,959 1,767 4,726
2017 1,382 187 1,569 0 1,569
2016 750 107 857 0 857
2017 530 1,713 2,243 599 2,842
2016 (666) 2,480 1,814 (1,320) 494
2017 1,034 315 1,349 21 1,370
2016 965 386 1,351 513 1,864
2017 0 0 0 0 0
2016 0 0 0 0 0
2017 54,335 17,289 71,624 3,692 75,317
2016 44,393 18,392 62,785 4,724 67,509
2017 2,128 201 2,329 38,780 41,109
2016 1,925 1,748 3,673 (2,125) 1,548
2017 230 575 805 72 877
2016 489 70 559 2,107 2,666
2017 24,248 14,076 38,324 4,493 42,817
2016 25,335 12,446 37,781 4,211 41,992
2017 1,852 2,219 4,071 675 4,746
2016 1,923 1,256 3,180 404 3,584
2017 161,588 38,749 200,336 72,178 272,515
2016 97,456 39,689 137,144 21,095 158,239TOTAL
Marine cargo, marine hull
Aviation
Motor
Engineering
Liability
Medical (≤1 year)
Long-term
Fire
Damage to property
Miscellaneous financial loss
Others
Overseas
Insurance Firms
Bahraini
Insurance Firms
GRAND
TOTAL
BD '000
Bahraini Insurance Firms
Table 4-4: Gross Claims for Insurance Firms Operating in Bahrain

22
Conventional
FirmsTakaful Firms
2017 16,255 925 17,180 10,421 27,601
2016 18,766 395 19,161 10,378 29,539
2017 1,445 117 1,562 1,353 2,915
2016 606 114 720 403 1,123
2017 153 15 168 0 168
2016 59 77 136 0 136
2017 108 55 163 30 194
2016 50 9 59 (78) (19)
2017 720 39 759 24 783
2016 318 (39) 280 266 546
2017 0 0 0 0 0
2016 0 0 0 0 0
2017 42,517 13,220 55,737 3,202 58,938
2016 35,477 13,243 48,720 4,408 53,128
2017 776 61 837 3,287 4,124
2016 933 101 1,034 1,684 2,718
2017 147 33 180 (18) 162
2016 41 (12) 29 (175) (146)
2017 12,051 12,861 24,912 1,710 26,622
2016 12,396 11,146 23,541 1,625 25,166
2017 317 536 852 448 1,301
2016 998 215 1,213 208 1,422
2017 74,488 27,862 102,350 20,458 122,808
2016 69,644 25,249 94,893 18,720 113,613TOTAL
Marine cargo, marine hull
Aviation
Motor
Engineering
Liability
Medical (≤1 year)
Long-term
Fire
Damage to property
Miscellaneous financial loss
Others
Bahraini Insurance Firms
BD '000
Bahraini
Insurance Firms
Overseas
Insurance Firms
GRAND
TOTAL
Table 4-5: Net Claims for Insurance Firms Operating in Bahrain

23
Conventional
FirmsTakaful Firms
2017 73,421 10,758 84,179 10,780 94,959
2016 72,537 18,425 90,962 5,880 96,842
2017 8,066 8,891 16,957 2,135 19,092
2016 7,901 10,084 17,985 2,531 20,516
2017 2,833 2,921 5,754 0 5,754
2016 2,650 2,197 4,847 0 4,847
2017 4,963 3,543 8,506 1,292 9,798
2016 5,712 2,935 8,647 3,143 11,790
2017 15,071 4,477 19,548 3,048 22,596
2016 15,343 4,462 19,805 3,196 23,001
2017 20 1 21 0 21
2016 17 1 18 0 18
2017 4,181,397 152,609 4,334,006 35,530 4,369,536
2016 3,959,904 141,100 4,101,004 37,924 4,138,928
2017 1,356 1,575 2,931 1,018 3,949
2016 1,547 1,235 2,782 1,209 3,991
2017 3,588 1,507 5,095 1,234 6,329
2016 3,219 1,241 4,460 1,217 5,677
2017 2,577 1,789 4,366 449 4,815
2016 2,601 850 3,451 151 3,602
2017 16,477 5,975 22,452 4,147 26,599
2016 16,543 5,366 21,909 1,325 23,234
2017 4,309,769 194,046 4,503,815 59,633 4,563,448
2016 4,087,974 187,896 4,275,870 56,576 4,332,446
Overseas
Insurance Firms
Bahraini
Insurance FirmsGRAND TOTAL
Others
TOTAL
Bahraini Insurance Firms
BD '000
Marine cargo, marine hull
Aviation
Motor
Engineering
Liability
Medical (≤1 year)
Long-term
Fire
Damage to property
Miscellaneous financial loss
Table 4-6: Number of Insurance Policies Issued for Insurance Firms Operating in Bahrain

24

25
2017 2016 2017 2016 2017 2016 2017 2016
Assets
General Insurance Business
Total investments in group undertakings and
participating interests 219,040 219,602 7,702 7,624 0 0 226,742 227,226
Total Investments 355,851 307,791 42,785 24,444 69,978 30,593 468,614 362,828
Deposits with ceding undertakings 0 192 0 0 0 0 0 192
Total reinsurance assets 173,794 141,551 0 0 51,307 15,547 225,100 157,098Total Insurance receivables 104,485 131,055 0 0 10,077 12,135 114,562 143,191Total other receivables 27,336 25,961 6,080 2,905 5,251 4,592 38,667 33,458
Tangible assets 11,925 10,286 1,337 720 100 102 13,362 11,108Total cash at bank and in hand 154,864 164,136 4,607 2,961 6,937 8,326 166,409 175,424Total prepayments and accrued income 35,243 29,532 4,779 5,437 2,347 2,295 42,369 37,264Total other assets 1,341 1,039 13,074 857 95 706 14,511 2,602
T. Shareholders assets (Takaful) 80,365 44,948 80,365 44,948
Total General insurance business assets 1,083,878 1,031,146 65,425 64,069 146,092 74,297 1,295,395 1,169,511
Long-Term Business Assets 854,640 706,713 18,965 28,143 342 66,188 873,947 801,043
Linked long term assets 6,548 6,069 16,621 17,258 139,356 104,884 162,525 128,211
Total Assets 1,945,066 1,743,927 181,375 154,419 285,791 245,368 2,412,231 2,143,714
Liabilities
Shareholders liabilities (Takaful) 29,101 12,085 29,101 12,085
Total General insurance business liabilities 626,129 578,514 71,248 71,231 85,883 54,560 783,260 704,304
Long term business liabilities 775,108 636,706 21,036 24,515 174,242 160,343 970,386 821,563
Total Liabilities 1,401,237 1,215,219 121,385 107,831 260,125 214,902 1,782,747 1,537,953
Capital Resources 1
Eligible Paid-up ordinary shares 137,060 143,245 65,089 60,125 - - 202,149 203,370
Total Tier 1 Capital 510,557 498,552 59,127 46,078 - - 569,683 544,630
Total Capital Resources 340,849 299,747 50,329 44,883 21,684 25,466 412,862 370,096
Notes: Capital Resources in accordance with CBB rules.
BD '000
Bahraini Insurance Firms Overseas Insurance
Firms Total
Conventional Takaful
Table 5-1: Key Performance Figures of Insurance Firms – Financial Position

26
2017 2016 2017 2016 2017 2016 2017 2016
Gross Premiums/Contributions 706,166 699,336 65,173 63,906 51,724 51,770 823,063 815,013
Reinsurance/Retakaful Ceded 193,530 213,187 21,762 20,751 14,626 14,467 229,917 248,405
Net Premiums/Contributions Written 512,637 486,149 43,411 43,156 37,098 37,303 593,146 566,608
Net Premiums/Contributions Earned 498,185 475,668 44,949 43,802 36,858 38,074 579,992 557,543
Total Underwriting Revenue 498,185 475,668 48,606 47,490 31,281 40,794 578,072 563,952
Total Claims and Expenses 518,127 495,854 49,369 46,521 29,206 39,922 596,701 582,297
Underwriting Profit (Loss) (20,079) (20,329) (762) 969 2,075 641 (18,766) (18,719)
Net Investment Income 51,066 46,919 470 290 2,543 2,710 54,079 49,919
Net Profit (Loss) of Conventional 39,218 30,625 - - 4,742 3,390 43,960 34,015
(292) 1,260
1,282 520
Notes: Results include both Bahrain and non-Bahrain business.
Takaful Net Income
Surplus (deficit) of Takaful Funds
Profit (loss) of Shareholders Fund
BD '000
Bahraini Insurance Firms
(i nclude Bahrain & Non-Bahrain
business)
Overseas
Insurance Firms Total
Conventional Takaful
Table 5-2: Consolidated data of Insurance Firms – Income Statements

27
Central Bank of Bahrain
Insurance Supervision Directorate
P.O. Box: 27
Manama, Kingdom of Bahrain
Tel: +973 17 547303
Fax: +973 17 535170
www.cbb.gov.bh