2017 / 2018 annual report - gov
TRANSCRIPT

2017 / 2018
Annual Report
Building a better life for all through an enabling and sustainable world class information and communication technologies environment

I have the honour of submitting the
2017/18 Annual Report of the Department
in terms of the Public Finance Management Act, 1999
MR ROBERT NKUNA
Director General
31 August 2018

Contents
PART A: GENERAL INFORMATION 1
1. DEPARTMENT GENERAL INFORMATION 2
2. LIST OF ABBREVIATIONS/ACRONYMS 3
3. FOREWORD BY THE MINISTER 7
4. STATEMENT BY THE DEPUTY MINISTER 10
5. REPORT OF THE ACCOUNTING OFFICER 12
6. STATEMENT OF RESPONSIBILITY AND CONFIRMATION OF ACCURACY FOR THE ANNUAL REPORT 22
7. STRATEGIC OVERVIEW 23
7.1 Vision 23
7.2 Mission 23
7.3 Values 23
8. LEGISLATIVE AND OTHER MANDATES 23
9. ORGANISATIONAL STRUCTURE 27
10. ENTITIES REPORTING TO THE MINISTER 28
PART B: PERFORMANCE INFORMATION 31
1. AUDITOR GENERAL’S REPORT: PREDETERMINED OBJECTIVES 32
2. OVERVIEW OF DEPARTMENTAL PERFORMANCE 32
2.1 Service Delivery Environment 32
2.2 Service Delivery Improvement Plan 35
2.3 Organisational Environment 35
2.4 Key Policy Developments and Legislative Changes 36
3. STRATEGIC OUTCOME ORIENTED GOALS 36
4. PERFORMANCE INFORMATION BY PROGRAMME 38
4.1 Programme 1: Administration 38
4.2 Programme 2: ICT International Affairs 42
4.3 Programme 3: ICT Policy, Research and Capacity Development 49
4.4 Programme 4: ICT Enterprise Development and SOE Oversight 54
4.5 Programme 5: ICT Infrastructure Support 59
5. TRANSFER PAYMENTS 63
5.1 Transfer Payments to Public Entities 63
5.2 Transfer Payments to all Organisations other than Public Entities 65
6. CONDITIONAL GRANTS 66
6.1 Conditional Grants and Earmarked Funds Paid 66

6.2 Conditional Grants and Earmarked Funds Received 66
7. DONOR FUNDS 66
7.1 Donor Funds Received 66
8. CAPITAL INVESTMENT 68
8.1 Capital Investment, Maintenance and Asset Management Plan 68
PART C: GOVERNANCE 69
1. INTRODUCTION 70
2. RISK MANAGEMENT 71
3. FRAUD AND CORRUPTION 75
4. MINIMISING CONFLICT OF INTEREST 75
5. CODE OF CONDUCT 76
6. HEALTH, SAFETY AND ENVIRONMENTAL ISSUES 76
7. PORTFOLIO COMMITTEES 77
8. SCOPA RESOLUTIONS 78
9. PRIOR MODIFICATIONS TO AUDIT REPORTS 78
10. INTERNAL CONTROL UNIT 80
11. INTERNAL AUDIT AND AUDIT COMMITTEES 81
12. AUDIT COMMITTEE REPORT 86
PART D: HUMAN RESOURCE MANAGEMENT 88
1. INTRODUCTION 89
2. OVERVIEW OF HUMAN RESOURCES 89
3. HUMAN RESOURCES OVERSIGHT STATISTICS 92
PART E: FINANCIAL INFORMATION 130
1. REPORT OF THE AUDITOR GENERAL 131
2. ANNUAL FINANCIAL STATEMENTS 148

PART A GENERAL
INFORMATION
page 1

1. DEPARTMENT GENERAL INFORMATION
PHYSICAL ADDRESS: iParioli Office Park
1166 Park Street
Hatfield, Pretoria
POSTAL ADDRESS: Private Bag X860
Pretoria
0001
TELEPHONE NUMBER: 027 12 427 8000
FAX NUMBER: 027 12 427 8561
EMAIL ADDRESS: [email protected]
WEBSITE ADDRESS: www.dtps.gov.za
page 2

2. LIST OF ABBREVIATIONS/ACRONYMS
AFS Annual Financial Statement
AGSA Auditor-General of South Africa
AIDS Acquired immunodeficiency syndrome
APP Annual Performance Plan
ATM Automated teller machine
ATU African Telecommunication Union
AU African Union
AU CICT African Union Committee on Information and Communication Technologies
BAC Bid Adjudication Committee
BAS Basic Accounting System
BBI Broadband Infraco
BEC Bid Evaluation Committee
BRICS Brazil, Russia, India, China and South Africa
BRICS IMC Brazil, Russia, India, China and South Africa Inter-Ministerial Committee
CA Council of Administration
CA Chartered Accountant
CFO Chief Financial Officer
CIPC Companies Intellectual Property Commission
COE Compensation of employees
CSD Central Supplier Database
CTO Commonwealth Telecommunication Organisation
CYN Chinese Yuan
DBSA Development Bank of Southern Africa
DDG Deputy Director General
DDGs Deputy Directors-General
DEC Departmental Executive Committee
DG Director-General
DPSA Department of Public Service and Administration
DTPS Department of Telecommunications and Postal Services
DTT Digital Terrestrial Television
ECA Electronic Communications Act
ERP Enterprise Resource Planning
ESEID Economic Sectors, Employment and Infrastructure Development Cluster
ETOEs Extra Territorial Offices of Exchange
page 3

EXCO Executive Committee
FY Financial year
HCT HIV counselling and testing
HDIs Historically disadvantaged individuals
HIV Human Immunodeficiency Virus
HR Human resource
HRA Human Resource Administration
HRD Human resource development
IBM International Business Machines
ICASA Independent Communications Authority of South Africa
ICT Information and communications technology
ICTs Information and communications technologies
IMT International Mobile Telecommunications
iNESI Ikamva National e-Skills Institute
ISPs Internet Service Providers
IT Information technology
ITU International Telecommunications Union
ITU-R International Telecommunications Union Radiocommunication
KPIs Key performance indicators
Ltd Limited
MEC Member of Executive Committee
MHz Megahertz
MMS Middle Management Service
MoU Memorandum of Understanding
MP Member of Parliament
MSA Master Service Agreement
MTEF Medium Term Expenditure Framework
N/A Not applicable
NDP National Development Plan
NEMISA National Electronic Media Institute of South Africa
NHI National Health Insurance
NPC National Planning Commission
NQF National Qualifications Framework
NRFP National Radio Frequency Plan
OECD Organisation for Economic Cooperation and Development
OPSCOM Operations Committee
PAPU Pan African Postal Union
page 4

PERSAL Personnel and Salary System
PFMA Public Finance Management Act
PILAR Procedure on Incapacity Leave and Ill-health Retirement
PMDS Performance Management and Development System
PSA Public Service and Administration
PSC Public Service Commission
PSCBC Public Service Commission Bargaining Council
PSETA Public Service Sector Education and Training Authority
PTY Proprietary
REC Risk and Ethics Committee
RSA Republic of South Africa
SA South Africa
SA Connect South Africa Connect
SADC Southern African Development Community
SADC SCOM Southern African Development Community Sub-Committee
SAPO South African Post Office
SAPS South African Police Service
SARB South African Reserve Bank
SBD4 Standard Bidding Document 4
SCM Supply Chain Management
SDIP Service Delivery Improvement Plan
SDM Service delivery model
SHAR SADC Home and Away Roaming
SHERQ Safety, Health, Environment, Risk and Quality
SIP Strategic Integrated Project
SITA State Information Technology Agency
SIU Special Investigating Unit
SMEs Small and Medium Enterprises
SMME Small Medium and Micro Enterprise
SMMEs Small Medium and Micro Enterprises
SMS Senior Management Service
SOC State Owned Company
SOE State Owned Enterprise
TB Tuberculosis
TMC Top Management Committee
TUT Tshwane University of Technology
TV Television
page 5

UN United Nations
UPU Universal Postal Union
USAASA Universal Service and Access Agency of South Africa
USAF Universal Service and Access Fund
VIP Very Important Person
WRC-19 World Radiocommunication Conference 2019
WTDC World Telecommunication Development Conference
ZACR ZA Central Registry
.za DNA Domain Name Authority of South Africa
page 6

3. FOREWORD BY THE MINISTER
DR SIYABONGA CWELE
I am humbled in providing the Foreword to this Annual Report in a year in which South Africa is celebrating the centenary of the birth of Tata Nelson Mandela and Mama Albertina Sisulu. These giants of the struggle for humanity journeyed through life, from the Eastern Cape to the heartland of the struggle against Apartheid in Gauteng, in parallel routes. Their journeys are a study in persistence ultimately defeating injustice.
In many ways, this Annual Report reflects the strides we are making in our tenacious efforts to embrace technology as we contribute to achieving the goals of the National Development Plan, which include the creation of a modern and inclusive society by 2030.
Addressing the International Telecommunication Union (ITU) in 1995, former President Mandela said the following; “.many of us will not live to see the flowering of the information age. But our children will. They are our greatest asset. And it is our responsibility to give them the skills and insight to build the information societies of the future. The young people of the world must be empowered to participate in the building of the information age. They must become the citizens of the global information society. And we must create the best conditions for their participation”.
This is the vision, which guides our work. Over the past year, we have continued to work with our partners in organised labour, organised business and other government institutions to implement the National Integrated ICT White Paper Policy. The policy seeks to achieve universal access to modern communications infrastructure and services, lowering the cost to access these services and providing skills, especially to the youth, as preparation for confronting the Fourth Industrial Revolution. The era of the Fourth Industrial Revolution is truly upon us as emergent technologies, big data, artificial intelligence and robotics become a reality.
This year, the Department, through Broadband lnfraco and SITA, started connecting government facilities in the eight districts, which have been identified, for the rollout of SA Connect, the country’s broadband plan and strategy. We are incorporating the lessons we are learning in this pilot phase to accelerate the rollout of this infrastructure. We are also seeking new funding models, which include engaging developmental finance institutions, which include the New Development Bank. In the coming months, we shall connect more government facilities to the transformative power of the internet.
page 7

We have prepared legislation to give effect to the White Paper. In the past year, we gazetted the Electronic Communications Amendment Act for public comment, which inter alia, creates the legislative environment for the establishment of the Wireless Open Access Network (WOAN). We have also established the National Rapid Deployment Coordinating Centre to assist network providers by reducing time and costs for deploying their telecommunication infrastructure.
Cabinet approved the National e-Strategy, the e-Government Strategy and the ICT SMME Development Strategy, which aims to accelerate the development, growth, and sustainability of small and medium enterprises in the ICT sector. This is meant to stimulate the creation of jobs and for greater economic inclusion, while also aiming to enhance entrepreneurship, increase the usage of ICT tools for all small businesses, and to improve their profitability and competitiveness.
Cabinet approved the framework for the establishment of a State ICT Infrastructure Company and the State IT Company. The State ICT Infrastructure Company will be formed through the merger of Sentech and Broadband lnfraco. The State IT Company will be formed through the reconfiguration of the State Information Technology Agency.
In the coming months, we shall process the Postal Services Amendment Bill, the ICT Sector Commission and Tribunal Bill and the Digital Development Fund Bill.
Our pursuit of transformative policies is balanced by the need to empower our people. The Internet for All, driven by Sentech, is one such example. This initiative brings technology and skills training to the rural areas of our country. The project is being piloted in three provinces. We are planning to expand it to other provinces by the end of this financial year. In addition, NEMISA and .zaDNA will provide the much needed digital skills training in the country.
The spotlight of the world will be firmly on SA as we host the ITU Telecom World 2018. We aim through this conference to attract investment into the country, showcase the capabilities of our SMMEs and seek partnerships for skills development with large ICT companies of other countries. We shall also host the meeting of BRICS Ministers who are responsible for ICT, to consolidate the work that has been done over the past three years. We shall continue to engage like-minded countries as we seek to protect the interests of developing nations in multilateral platforms.
We remain focused on the need to contribute to financial inclusion, especially in rural areas. In the current financial year, this effort has been strengthened by the partnership between the SA Post Office and the SA Social Security Agency to pay social grants. We expect that this capacity that is being built by the State will, over time, be extend to other services. We are awaiting response from the South African Reserve Bank for the application for a banking license for the Postbank submitted in 2017.
page 8

page 9
Through our direct engagements with communities and through monitoring the media, we are reminded of the need to lower the cost to communicate. This is one of the priorities for the Department. We expect that the Independent Communications Authority of SA and the Competition Commission will release reports, which will guide us on the interventions needed to lower data costs by March 2019. We are also providing some relief to some communities by rolling out free Wi Fi services through the Universal Service and Access Agency of SA and Sentech.
We acknowledge the recommendations of the Auditor General and will ensure that the Department acts upon them.
MinisterDepartment of Telecommunications and Postal Services

4. STATEMENT BY THE DEPUTY MINISTER
MS STELLA NDABENI-ABRAHAMS
It gives me great pleasure to present this statement as the Department tables the 2017/18 Annual Report for 2017/18 financial year thereby outlining the achievements we made during this period as well as giving key highlights of what we plan to implement going forward.
Parallel to the development of this Annual Report, the Department is also preparing to host the International Telecommunications Union (ITU) Telecoms World 2018 Conference in Durban in September this year. A key legacy project for the ITU conference is the African Centre for the Fourth Industrial Revolution. Whilst located in South Africa, the centre will service Africa to ensure that the continent is at the cutting edge of ICTs and further enable conformance standards testing of technologies such as 3D printing,
biotechnologies and blockchain, amongst others as well as enable the development and manufacturing of local technologies. Hosting of the ITU Telecom World will further expose 40 ICT SMMEs to opportunities through exhibition at the SA pavilion and participation in the ITU Global Awards.
South Africa is further pursuing candidature for the Council of the ITU, which is the highest decision making body of the Union and holds the key to being part of decisions that bring about transformation in the ICT landscape. Similarly, South Africa has always been playing an active role in regional activities, hence we are at the forefront of supporting our candidate, Dr. Cosmas Zavazava from Zimbabwe for the position of Director of the Development Bureau of ITU.
In the period under review, the Department finalised and obtained Cabinet approval for the National e-Strategy, e-Government Strategy and ICT SMME Development Strategy. The ICT SMME Strategy seeks to accelerate development, growth, and sustainability of small and medium enterprises in the ICT sector with the objective of job creation and economic inclusion as well as to enhance entrepreneurship, increase the usage of ICT tools by all small businesses, and improve their profitability and competitiveness.
In the 2018/19 financial year, the focus would be on facilitating the establishment of 30 Internet Service Providers (ISPs) in the 8 National Health Insurance sites prioritised by government as well as open opportunities to more ICT SMMEs via the ITU World and BRICS ICT Ministers’ Meeting.
We have made great strides in the development of a National e-Strategy, and we will now focus on the development of a comprehensive National Digital Skills Strategy with an aim to identify the ICT skills gap in our country. The Department has in the interim introduced
page 10

page 11
iNeSI Bill in Parliament in March 2018, which seeks to create a public entity that will facilitate development of e-skills capacity in the country. Although technology has advanced rapidly in the last few years, our skills base has not developed at the requisite pace in order to keep up with the demands for skills brought about by these developments, hence the development of this strategy.
Furthermore, as part of implementing the National e-Strategy, in 2018/19 FY, the Department will focus on facilitating the establishment of the Presidential Advisory Council on the Fourth Industrial Revolution as announced by the President in the State of the Nation Address.
With regards to the National Integrated ICT White Paper, Cabinet approved the publication of the following Bills for public comment: Electronic Communications Amendment Bill, Postal Services Amendment Bill and iKamva National e-Skills Institute Bill. It is envisaged that in the 2018/19 financial year the Department will further develop and pass the necessary legislations that will enable full implementation of the White Paper and give the sector more certainty about the policy environment they operate in.
The Department has made strides with regards to the facilitating and monitoring Operations of the Virtual Cyber Security Hub and contributing to Outcome 3 (“All people in South Africa are and feel safe”). Managing and mitigating Cyber Security threats is a task for us all but the Department recognises its special responsibility to lead the national effort required through the monitoring of the operations of the Virtual Cybersecurity Hub.
As we move into the new financial year, I would like to thank Minister Siyabonga Cwele for his support and encouragement during the challenges we faced in the past year, Director-General Robert Nkuna and his management team for the energy and focus they have invested in the Department, the staff of the DTPS for their continued hard work and dedication.
Ms Stella Ndabeni-AbrahamsDeputy MinisterDepartment of Telecommunications and Postal Services

5. REPORT OF THE ACCOUNTING OFFICER
MR ROBERT NKUNA: DIRECTOR-GENERAL
OVERVIEW OF THE OPERATIONS OF THE DEPARTMENT
The vision for the ICT Sector, as encapsulated in the National Development Plan states: “By 2030, ICT will underpin the development of a dynamic information society and knowledge economy that is more inclusive and prosperous. A seamless information infrastructure will meet the needs of citizens, business and the public sector, providing access to the wide range of services required for effective economic and social participation - at a cost and quality at least equal to SA’s competitors.” During the 2017/18 financial year, the Department has made extensive strides towards the NPC’s vision through vigorous implementation of the National ICT White Paper which saw the development of several draft Bills as well as three imperative ICT strategies
which will support the development of an ICT sector that creates favourable conditions for the accelerated and shared growth of the economy and ensure increased uptake and usage of ICTs by the majority of the South African population, thus bridging the digital divide.
During the 2017/18 financial year the Department continued with extensive stakeholder consultations on the National Integrated ICT Policy White Paper. This included engagements with the National ICT Forum on White Paper implementation, focusing on the Wireless Open Access Network and spectrum issues. Furthermore, the Department held a significant number of engagements with wide range of public and private sector stakeholders on the proposed legislation emanating from the White Paper.
Over the past financial year, several draft bills have been prepared to give effect to the White Paper. These include the Electronic Communications Amendment Bill, Postal Services Amendment Bill, iKamva National e-Skills Institute Bill, ICT Sector Commission and Tribunal Bill and the Digital Development Fund Bill. Cabinet approved publication of the Electronic Communications Amendment Bill, Postal Services Amendment Bill and iKamva National e-Skills Institute Bill, for public consultation. Hence these bills were published for public comment after which public hearings were held. The consultations are nearly concluded. Additional Bills will be submitted for Cabinet to approve commencement of public consultation in the 2018/19 financial year.
Other critical milestones achieved in the 2017/18 financial year included finalisation and obtaining of approval from Cabinet for the National e-Strategy, the ICT SMME Development Strategy and the e-Government Strategy. The National e-Strategy will focus on creating the necessary knowledge base and skills for participation in the Digital Society while stimulating sector growth and innovation. This will be done by driving public and private ICT investment, especially in network upgrades and expansion (particularly in broadband) and development of local content and applications. The ICT SMME Development Strategy seeks to accelerate the development, growth, and sustainability of Small and Medium Enterprises in the ICT sector with the objective of job creation and economic inclusion while also aiming to enhance entrepreneurship, increase the usage of ICT tools by all small businesses, and improve their profitability and competitiveness. The e-Government Strategy will guide the digital
page 12

transformation and modernisation of the public service to improve service delivery to our citizens. The Department will focus extensively on facilitating the implementation of these three strategies in the 2018/19 financial year.
The Department also made great strides towards rationalisation of our State Owned Companies. Cabinet approved the framework for the establishment of a State ICT Infrastructure Company and State IT Company. The State ICT Infrastructure Company will be formed through the merger of Sentech and Broadband Infraco. The State IT Company will be formed through the reconfiguration of the State Information Technology Agency.
Although the Broadband roll-out project was delayed largely due to inability of the Department to finalise the appointment of implementing agents as well as fiscal constraints, it has commenced with the implementation of Phase 1 of SA Connect which is focused at providing Broadband connectivity to the 8 NHI Sites. The Department has, through a Tripartite Master Services Agreement, mandated its entities, SITA and BBI, to implement Phase 1 of SA Connect. The Department also issued Government Orders to these SOEs with regard to the connectivity of identified sites.
The Department itself has implemented numerous interventions stemming from the recommendations of the Climate and Culture Survey that was conducted in 2016. Such interventions have immensely improved the current climate and culture of the organisation, impacting positively on organisational performance and service delivery as a whole. In this regard, the Department committed to achieving 17 annual targets in its 2017/18 Annual Performance Plan. At the end of the reporting period, the Department had achieved 82% of its commitments, while spending 95% of its budget allocation.
OVERVIEW OF THE FINANCIAL RESULTS OF THE DEPARTMENT
Departmental receipts
Departmental receipts
2017/2018 2016/2017
Estimate
Actual Amount
Collected
(Over) / Under
Collection Estimate
Actual Amount
Collected
(Over) / Under
Collection
R’000 R’000 R’000 R’000 R’000 R’000
Sale of goods and services other than capital assets 366 57 309 58 51 7
Transfers received 244 - 244 - - -
Interest, dividends and rent on land 653,263 1,140,001 (486,738) 507,383 831,077 (323,694)
Sale of capital assets 300 713 (413) - - -
Financial transactions in assets and liabilities 240 334 (94) 652 283 369
Total 654,413 1,141,105 (486,692) 508,093 831,411 (323,318)
page 13
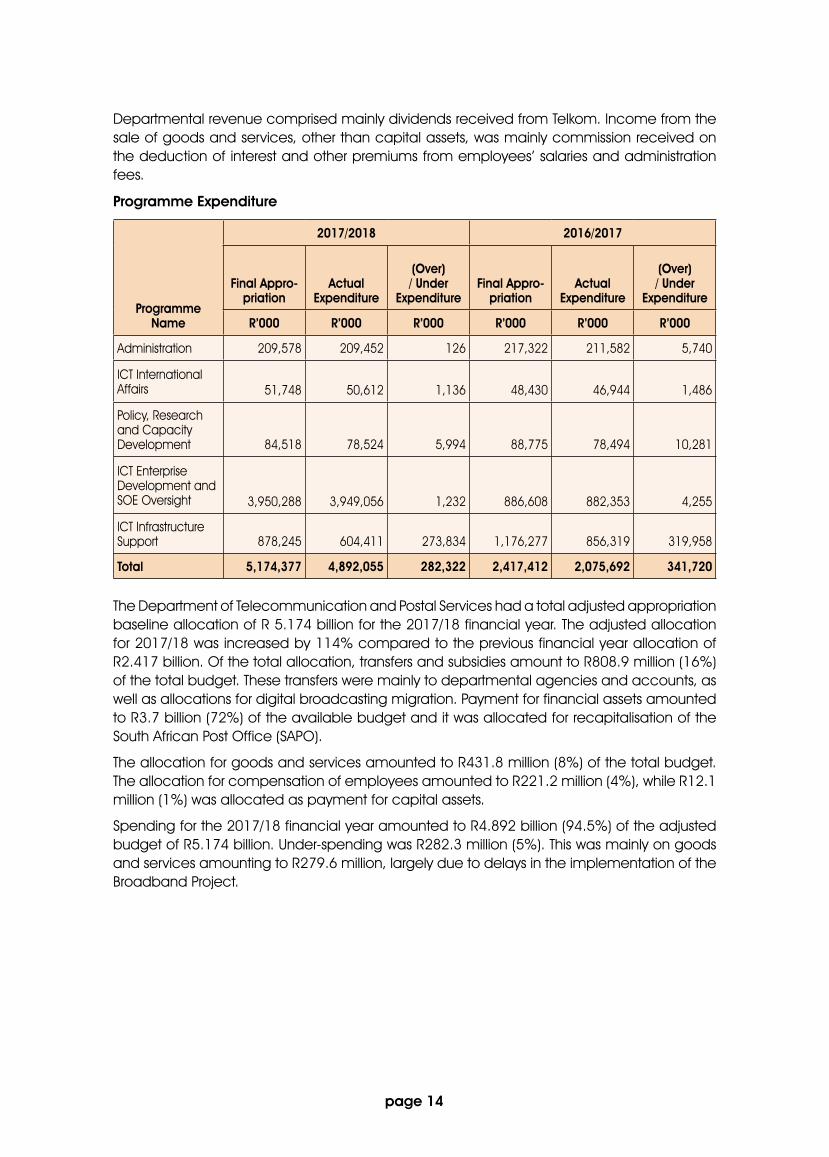
Departmental revenue comprised mainly dividends received from Telkom. Income from the sale of goods and services, other than capital assets, was mainly commission received on the deduction of interest and other premiums from employees’ salaries and administration fees.
Programme Expenditure
Programme Name
2017/2018 2016/2017
Final Appro-priation
Actual Expenditure
(Over) / Under
ExpenditureFinal Appro-
priationActual
Expenditure
(Over) / Under
Expenditure
R’000 R’000 R’000 R’000 R’000 R’000
Administration 209,578 209,452 126 217,322 211,582 5,740
ICT International Affairs 51,748 50,612 1,136 48,430 46,944 1,486
Policy, Research and Capacity Development 84,518 78,524 5,994 88,775 78,494 10,281
ICT Enterprise Development and SOE Oversight 3,950,288 3,949,056 1,232 886,608 882,353 4,255
ICT Infrastructure Support 878,245 604,411 273,834 1,176,277 856,319 319,958
Total 5,174,377 4,892,055 282,322 2,417,412 2,075,692 341,720
The Department of Telecommunication and Postal Services had a total adjusted appropriation baseline allocation of R 5.174 billion for the 2017/18 financial year. The adjusted allocation for 2017/18 was increased by 114% compared to the previous financial year allocation of R2.417 billion. Of the total allocation, transfers and subsidies amount to R808.9 million (16%) of the total budget. These transfers were mainly to departmental agencies and accounts, as well as allocations for digital broadcasting migration. Payment for financial assets amounted to R3.7 billion (72%) of the available budget and it was allocated for recapitalisation of the South African Post Office (SAPO).
The allocation for goods and services amounted to R431.8 million (8%) of the total budget. The allocation for compensation of employees amounted to R221.2 million (4%), while R12.1 million (1%) was allocated as payment for capital assets.
Spending for the 2017/18 financial year amounted to R4.892 billion (94.5%) of the adjusted budget of R5.174 billion. Under-spending was R282.3 million (5%). This was mainly on goods and services amounting to R279.6 million, largely due to delays in the implementation of the Broadband Project.
page 14

THE SPENDING TRENDS PER PROGRAMME ARE OUTLINED BELOW:
Programme 1: Administration
The programme had a final budget of R209.6 million and expenditure amounted to R209.5 million (99%) in the 2017/18 financial year, compared to expenditure of R211.6 million in the 2016/17 financial year. Cost drivers included in goods and services were security, cleaning services, rentals and travel costs.
Programme 2: ICT International Affairs
The programme had a final budget of R51.7 million and expenditure amounted to R50.6 million (98%) in the 2017/18 financial year, compared to expenditure of R46.9 million in the 2016/17 financial year. R25.9 million (50%) of the adjusted budget was transfer payments for membership fees to international organisations, compared to R26.2 million paid in the 2016/17 financial year.
Programme 3: Policy, Research and Capacity Development
The programme had a final budget of R84.5 million and expenditure amounted to R78.5 million (93%) in the 2017/18 financial year. The expenditure trends remained constant in this programme when compared to spending in the 2016/17 financial year.
Programme 4: ICT Enterprise Development and SOE Oversight
The programme had a final budget of R3.9 billion and expenditure amounted to R3.9 billion (100%) in the 2017/18 financial year, as compared to expenditure of R882 million in the 2016/17 financial year. This was mainly due to an allocation of R3.7 billion for recapitalisation of the South African Post Office.
Programme 5: ICT Infrastructure Support
The programme had a final budget of R878 million and expenditure amounted to R604.4 million (68.8%) in the 2017/18 financial year as compared to expenditure of R856 million in the 2016/17 financial year. The net reduction was due to the budget reductions of R510 million during the adjustment period on the transfer payments for the Broadcasting Digital Migration project and the increase in transfers to Sentech for the Dual Illumination Project (R193 million) as well as the Migration of Digital Signals project (R53 million).
Goods and services expenditure increased by R12.4 million in the 2016/17 financial year, to R18.9 million in the 2017/18 financial year. This amount includes an advance of R4.9 million paid to Broadband Infraco to commence with the rolling out of the Broadband project.
Virements / Roll-overs
Virements as reflected in the Appropriation Statement were applied in terms of Section 43(1) of the Public Financial Management Act, 1999 (Act of 1999) which stipulates that virements may not exceed 8% of the amount appropriated under that main division. Funds amounting to R9.9 million representing 1% of the main division were transferred from Programme 5 to Programme 1 and Programme 2 to defray excess expenditure, mainly on goods and services, to fund the shortfall in the audit costs, operating lease, property payments, travel and subsistence, software, intangible assets and International membership fees. Funds were moved from Programme 1 to Programme 4 to cover the shortfall in compensation of employees.
page 15

Unauthorised, Irregular, Fruitless and Wasteful Expenditure
The Department did not incur any unauthorised expenditure during the period under review.
The irregular expenditure of R228 thousand was incurred in the 2017/18 financial year. The Department has developed a plan to address all irregular expenditure incurred in the 2017/18 and previous financial years that not as yet been condoned. Supply chain policy and procedure is under review to ensure that internal controls are tightened for the prevention of irregular expenditure.
The amount incurred for fruitless expenditure this year totals R15 thousand, comprising R1 thousand for traffic fines and R14 thousand for no shows. Investigation processes are underway to establish the facts before any action can be taken to implement consequence management effectively. R15 thousand was written off from expenditure incurred in the year under review. The amount recovered totalled R2 thousand, of which R1 thousand is from the financial year under review and R1 thousand is from previous financial years. The Department maintains a register of fruitless and wasteful expenditure and the policies on losses and debt were reviewed in the year under review. Losses are written off in accordance with the loss and debt policies as well as chapters 9, 11 and 12 of the Treasury Regulations. There are punitive measures against perpetrators and awareness campaigns are carried out to avoid recurrence of fruitless and wasteful expenditure.
FUTURE PLANS OF THE DEPARTMENT
The 2018/19 financial year can be viewed as the “year of implementation” as the Department will largely focus, amongst other things, on facilitating the implementation of the three strategies, namely the National e-Strategy, the ICT SMME Development Strategy and the e-Government Strategy. The Department will also continue with implementation of the National Integrated ICT White Paper and the implementation of SA Connect.
Implementation of the National Integrated ICT Policy White Paper
In the 2018/19 financial year, the Department will continue to develop ICT legislation required to give effect to the National Integrated ICT Policy White Paper through introducing the Electronic Communications Amendment Bill and the Postal Services Amendment Bill to Parliament. The Department will also focus on gazetting the Digital Development Fund Bill and the ICT Commission and Tribunal Bill for public consultation.
The INESI Bill, which seeks to create a public entity that will be a national catalyst and change agent for developing e-Skills capacity in the country, was introduced in Parliament in March 2018. The focus henceforth will be on its implementation.
Implementation of the National e-Strategy
As part of facilitating the implementation of the National e-Strategy in the 2018/19 financial year, the Department will focus on the development of a comprehensive National Digital Skills Strategy with the ICT skills gap in South Africa, determining policy objectives for achieving e-literacy and the aim of identifying digital skills as well as developing an institutional approach to addressing the disconnect between supply and demand side skills.
Implementation of the National e-Strategy will also concentrate on the development of the SAPO e-Commerce platform focused on the e-Mall. The development of an e-Commerce platform will contribute towards achieving the objectives of the developmental state agenda based on exploiting the already available SAPO logistical infrastructure.
page 16

Furthermore, as part of implementing the National e-Strategy, in the 2018/19 financial year, the Department will focus on facilitating the establishment of the Presidential Advisory Council on the Fourth Industrial Revolution as announced by the President in the State of the Nation Address.
Implementation of the ICT SMME Development Strategy
The ICT SMME Development Strategy focuses on key interventions to accelerate the development, growth and sustainability of Small, Medium and Micro Enterprises in the ICT sector, and aims to facilitate increase in the levels of uptake and usage of ICTs by the small business sector. In this regard, in the 2018/19 financial year, the focus will be on facilitating the establishment of 30 internet service providers (ISPs) in the 8 National Health Insurance sites prioritised by government as well as opening opportunities to more ICT SMMEs via the ITU World and BRICS ICT Ministers’ Meeting, taking place in July and September 2018.
Implementation of the e-Government Strategy
The implementation of the e-Government Strategy and Roadmap is essential for the transformation and modernisation of public service delivery. SITA is the lead agency in this digital transformation of government services, collaborating with the various government departments to realise a digital government that embraces citizen-centricity. In the 2018/19 financial year, SITA with support from the DTPS will focus on developing the National e-Services Portal, which will ensure that government can deliver services and transact and communicate with citizens in real time.
Broadband Connectivity
With regards to Broadband roll-out, the Department’s key objective is to provide access to quality, affordable, safe, ubiquitous high-speed broadband. To achieve this the Department has commenced with the implementation of Phase 1 of SA Connect which is focused at providing Broadband connectivity to the 8 NHI Sites. The Department has mandated its entities, SITA and BBI, to implement Phase 1 of SA Connect which is focused on 570 sites for the 2018/19 financial year, of which 327 Sites are to be completed by the first half of this financial year.
Furthermore, in the 2018/19 financial year, the Department will put in place a National Rapid Deployment Coordination Centre, in line with the Rapid Deployment Policy, to expedite the rapid deployment of electronic communication facilities.
SOC Rationalisation
Cabinet approved the framework for the establishment of a State ICT Infrastructure Company and State IT Company. In the 2018/19 financial year, the Department will focus on the development of the draft legislation for both companies. Such legislation is aimed at increasing investment in ICT infrastructure, improving the performance of the SOEs under the DTPS portfolio and promoting innovation and transformation of the ICT sector as a catalyst for economic growth.
Hosting of the BRICS Ministerial Meeting and the ITU Telecom World
The Department will also host two major events, namely the ITU Telecom World 2018 and the 2018 BRICS ICT Ministerial Meeting. The ITU Telecom World 2018 provides an excellent
page 17

page 18
opportunity to position South Africa as the leading ICT country in Africa and as a hub for development through ICTs. The BRICS ICT Minister’s meeting, under the theme “Advancing Inclusive Growth through Industry and SMME participation” provides a solid opportunity to both SOEs and ICT SMMEs to gain a foothold in opportunities provided by the BRICS platform and to seize the advantage by promoting locally produced ICT solutions and products and giving impetus to ICT industrial growth and development.
It must be noted that the future projects of the Department are anchored in an endeavour to prepare South Africa for the Fourth Industrial Revolution. Key initiatives in this regard will include coordinating the establishment of the Presidential Advisory Council on the 4IR to ensure that our country is in a position to seize the opportunities and manage the challenges of rapid advances in information and communication technology. Focus will also be on the establishment of the Digital Transformation Centre to build capacity around standardisation, intellectual property management and conformance testing to boost localization and the manufacturing of new technologies. In addition, we will focus on big data and new technologies such as the transition to 5G networks so as to ensure that South Africa is up to speed and remains relevant in this fast changing technological era.
Public Private Partnership
None.
Discontinued activities / activities to be discontinued
None.
New or proposed activities
None.
Supply Chain Management
The Department did not have unsolicited bid proposals during the year under review. Irregular expenditure has been dealt with in line with the guidelines from National Treasury. The Supply Chain Management (SCM) policies, procedures and delegations are currently under review to ensure tighter internal controls to prevent irregular expenditure. All the bid committees are in place, namely: Specification, Evaluation and Adjudication. There are capacity constraints in the supply chain unit that are negatively impacting on addressing irregular expenditure from previous financial years. There are negotiations in place to bring in more resources to assist in addressing the irregular expenditure.
page 19
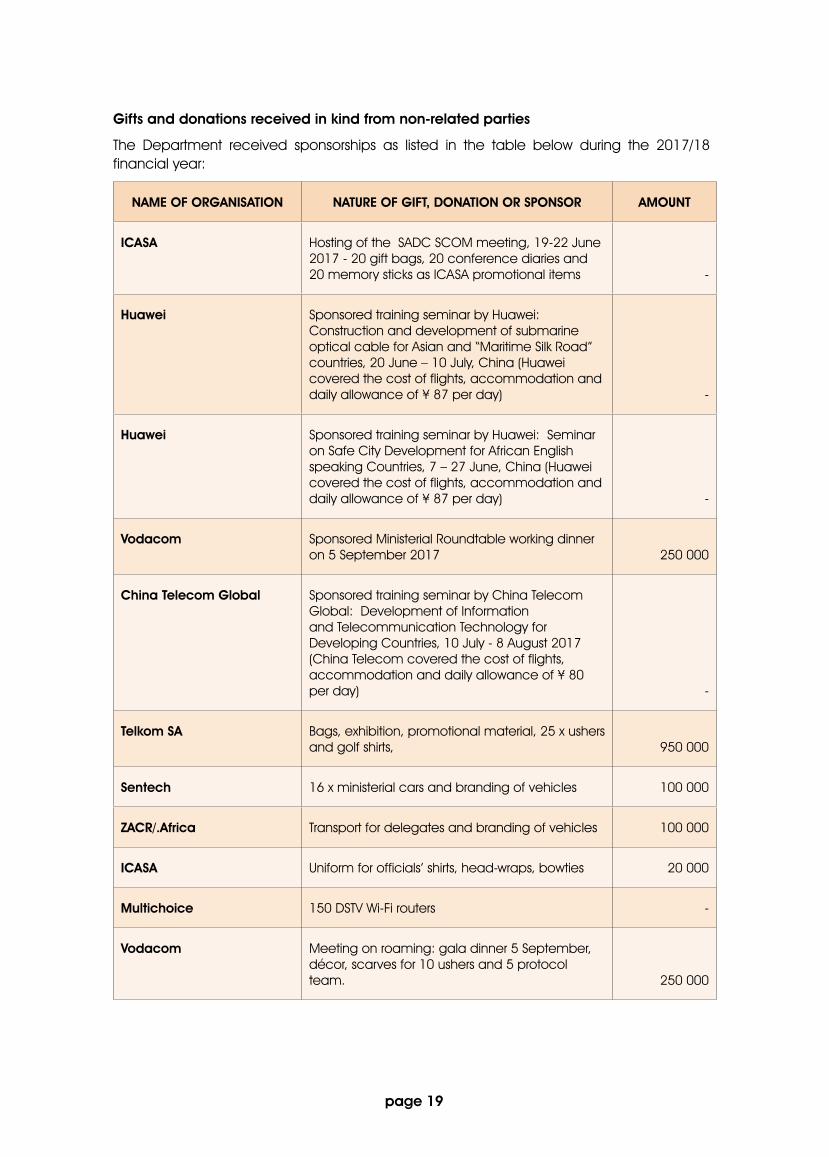
Gifts and donations received in kind from non-related parties
The Department received sponsorships as listed in the table below during the 2017/18 financial year:
NAME OF ORGANISATION NATURE OF GIFT, DONATION OR SPONSOR AMOUNT
ICASA Hosting of the SADC SCOM meeting, 19-22 June 2017 - 20 gift bags, 20 conference diaries and 20 memory sticks as ICASA promotional items -
Huawei Sponsored training seminar by Huawei: Construction and development of submarine optical cable for Asian and “Maritime Silk Road” countries, 20 June – 10 July, China (Huawei covered the cost of flights, accommodation and daily allowance of ¥ 87 per day) -
Huawei Sponsored training seminar by Huawei: Seminar on Safe City Development for African English speaking Countries, 7 – 27 June, China (Huawei covered the cost of flights, accommodation and daily allowance of ¥ 87 per day) -
Vodacom Sponsored Ministerial Roundtable working dinner on 5 September 2017 250 000
China Telecom Global Sponsored training seminar by China Telecom Global: Development of Information and Telecommunication Technology for Developing Countries, 10 July - 8 August 2017 (China Telecom covered the cost of flights, accommodation and daily allowance of ¥ 80 per day) -
Telkom SA Bags, exhibition, promotional material, 25 x ushers and golf shirts, 950 000
Sentech 16 x ministerial cars and branding of vehicles 100 000
ZACR/.Africa Transport for delegates and branding of vehicles 100 000
ICASA Uniform for officials’ shirts, head-wraps, bowties 20 000
Multichoice 150 DSTV Wi-Fi routers -
Vodacom Meeting on roaming: gala dinner 5 September, décor, scarves for 10 ushers and 5 protocol team. 250 000

page 20
NAME OF ORGANISATION NATURE OF GIFT, DONATION OR SPONSOR AMOUNT
MTN Internet café: 2 x laptops, Wi-Fi connection, 1 x printer -
Brand SA Notebooks, pens, paper bags, folders -
Liquidtelecom Cocktail dinner 4 September, décor, entertainment, solar power banks, scarves, golf shirts for ushers and team DTPs 250 000
USAASA 20 umbrellas for ministers and VVIPs -
NEMISA Video conferencing -
Huawei Gala dinner and entertainment 07 September
o Venue including menu 168 559
o Décor and equipment 88 355
o Golf T-shirts 25 000
o Lanyards 9 000
o Background wall 30 000
o 20 x ushers (3-7 Sep 2017) 75 000
o Programme Director & DJ 26 000
o 25 tables @ R2 500 each 62 500
o 50 x power set @ R350 each 17 000
Golf day – 5 Septembero Branded golf T-shitso Capso 38 x cooler-bags with snacks and drinkso Cocktail and drinkso Prizes for winners 70 000
Subtotal 2 242 164

page 21
Exemptions and deviations received from the National Treasury
None.
Events after the reporting date
Following engagement between the DTPS, National Treasury and Telkom with regards to the sale of Telkom shares, it was decided that the Telkom shares will no longer be sold as initially indicated in the allocation letter received during the adjusted budget.
The Department received a final arbitration award on 4th June 2018 that orders the Minister of Communications and the Director-General of Communications to pay Draft FCB a material amount for premature termination of a contract. The contingent liability on DraftFCB as at 31 March 2018 was R39.8 million. This amount will be paid by the DTPS as the matter was not transferred to the Department of Communications.
Acknowledgement
I would like to sincerely thank the Minister and the Deputy Minister for their strategic leadership and guidance. I would also like to acknowledge and appreciate the Department’s employees, the governance committees and the executive team for their tireless dedication to achieving the Department’s objectives, which resulted in achieving 82% of its planned targets.
Appreciation also goes to our Parliamentary Oversight Committees as well as our State Owned Entities (SOEs) for their support and contribution towards achieving the planned government outcomes. Last, but not least, I acknowledge and appreciate the invaluable partnerships forged with the ICT Industry as we work together towards strengthening the ICT Sector and increase our contribution towards socio-economic growth and development.
Conclusion
Despite the current funding and human resource challenges experienced by the Department and the country as a whole, the Department will do its utmost to carry out its mandate and achieve its strategic goals and objectives in line with the National Development Plan and the Medium Term Strategic Framework.
Approval and sign off

6. STATEMENT OF RESPONSIBILITY AND CONFIRMATION OF ACCURACY FOR THE ANNUAL REPORT
To the best of my knowledge and belief, I confirm the following:
All information and amounts disclosed throughout the annual report are consistent.
The Annual Report is complete, accurate and is free from any omissions.
The Annual Report has been prepared in accordance with the guidelines on annual reports as issued by National Treasury.
The Annual Financial Statements (Part E) have been prepared in accordance with the modified cash standard and the relevant frameworks and guidelines issued by National Treasury.
The Accounting Officer is responsible for the preparation of the Annual Financial Statements and for the judgements made in this information.
The Accounting Officer is responsible for establishing and implementing a system of internal control that has been designed to provide reasonable assurance as to the integrity and reliability of the performance information, the human resources information and the Annual Financial Statements.
The external auditors are engaged to express an independent opinion on the Annual Financial Statements.
In my opinion, the Annual Report fairly reflects the operations, the performance information, the human resources information and the financial affairs of the Department for the financial year ended 31 March 2018.
Yours faithfully
page 22

7. STRATEGIC OVERVIEW
7.1 VISION
South Africa as a global leader in the development and use of information and communication technologies for socio-economic development.
7.2 MISSION
Building a better life for all through an enabling and sustainable world class information and communication technologies environment.
7.3 VALUES
• Transparency;
• Respect;
• Accountability;
• Fairness;
• Integrity;
• Excellence; and
• Innovation.
8. LEGISLATIVE AND OTHER MANDATES
8.1 Constitutional Mandates
The legislative mandate of the Department of Telecommunications and Postal Services is embedded in the legislation as reflected in the table below:
Name of Act Purpose
Sentech Act, 1996 (Act No. 63 of 1996) To provide for the transfer of all the shares of the South African Broadcasting Corporation in Sentech (Pty.) Ltd. to the State; for the conversion of Sentech (Pty.) Ltd. from a private to a public company, Sentech Ltd.; for the control of Sentech Ltd.; and for matters connected therewith.
page 23

Name of Act Purpose
Former States Posts and Telecommunications Act, 1996 (Act No. 5 of 1996)
To provide for the integration of the Departments of Posts and Telecommunications of the former Republics of Transkei, Bophuthatswana, Venda and Ciskei with Telkom SA Limited and the South African Post Office Limited; and to provide for the transfer of the postal and the telecommunications enterprises conducted by those departments as well as certain land used by them for that purpose to the said companies; and to provide for matters connected therewith.
Former States Broadcasting Reorganisation Act, 1996 (Act No. 91 of 1996)
To provide for the integration of the Departments of Posts and Telecommunications of the former Republics of Transkei, Bophuthatswana, Venda and Ciskei with Telkom SA Limited and the South African Post Office Limited; and to provide for the transfer of the postal and the telecommunications enterprises conducted by those departments as well as certain land used by them for that purpose to the said companies; and to provide for matters connected therewith.
Postal Service Act, 1998 (Act No. 124 of 1998) To make new provision for the regulation of postal services; for the operational functions of the postal company, including its universal service obligations; for structural matters relating to postal services as well as the operation of the Postbank and National Savings Certificates; and to consolidate certain provisions relating to the postal company and amend or repeal others; and to provide for matters connected therewith.
Department of Communications Rationalisation Act, 1998 (Act No. 10 of 1998)
To provide for the rationalisation of the Department of Communications; and to provide for matters connected therewith.
Electronic Communications and Transactions Act, 2002 (Act No. 25 of 2002)
To provide for the facilitation and regulation of electronic communications and transactions; to provide for the development of a national e-strategy for the Republic; to promote universal access to electronic communications and transactions and the use of electronic transactions by Small, Medium and Micro-sized Enterprises (SMMEs); to provide for human resource development in electronic transactions; to prevent abuse of information systems; to encourage the use of e-Government services; and to provide for matters connected therewith.
page 24

Name of Act Purpose
Electronic Communications Act, 2005 (Act No. 36 of 2005)
To promote convergence in the broadcasting, broadcasting signal distribution and telecommunications sectors and to provide the legal framework for convergence of these sectors; to make new provision for the regulation of electronic communications services, electronic communications network services and broadcasting services; to provide for the granting of new licenses and new social obligations; to provide for the control of the radio frequency spectrum; to provide for the continued existence of the Universal Service Agency and the Universal Service Fund; and to provide for matters incidental thereto. (NB: The DTPS is responsible for the administration of the Act, with the exception of the following sections [Section 4(5), Section 5(6), and Chapter 9].
Independent Communications Authority of South Africa, 2000 (Act No. 13 of 2000)
The Independent Communication Authority may make recommendations to the Minister on policy matters and amendments to the Electronic Communications Act, No 36 of 2005 and the Postal Services Act, No 124 of 1998, which accord with the objects of these Acts to promote development in the electronic transactions, postal and electronic communications sectors. Furthermore, in so far as policy made, and policy directions issued, by the Minister in terms of the Postal Services Act, No 124 of 1998, Electronic Communications Act, No 36 of 2005 and any other applicable law.
South African Post Bank Limited Act, 2010 (Act No. 9 of 2010)
To provide for the incorporation of the Postbank Division of the South African Post Office; to provide for the transfer of the enterprise of that Division to the postbank company; to provide for the governance and functions of the Postbank company; and to provide for matters connected therewith.
South African Post Office SOC Ltd Act, 2011 (Act No. 22 of 2011 )
To provide for the continued corporate existence of the South African Post Office and its subsidiaries; to provide for its governance and staff; and to provide for matters connected therewith.
page 25

Name of Act Purpose
State Information Technology Agency Act, 1998 (Act No. 88 of 1998)
To provide for the establishment of a company that will provide information technology, information systems and related services to, or on behalf of, participating departments and in regard to these services, act as an agent of the South African Government; and to provide for matters connected therewith.
Broadband Infraco Act, No. 33 of 2007. To provide for the main objects and powers of Broadband Infraco (Proprietary) Limited; to provide for the borrowing powers of Broadband Infraco (Proprietary) Limited; to provide for servitudes and additional rights in favour of Broadband Infraco (Proprietary) Limited; to provide for the expropriation of land or any right in land by the Minister on behalf of Broadband Infraco (Proprietary) Limited; to provide for the conversion of Broadband Infraco (Proprietary) Limited into a public company having a share capital incorporated in terms of the Companies Act, 1973; and to provide for matters connected therewith.
In relation to the Independent Communications Authority of South Africa Act, No 13 of 2000 and the Electronic Communications Act, No 36 of 2005 mentioned in the table above, the Memorandum of Understanding (MoU) between the Minister of Telecommunications and Postal Services and the Minister of Communications comes into effect. The Memorandum of Understanding was entered to implement certain matters relating to the transfer of powers and functions under the Independent Communications Authority of South Africa Act, No 13 of 2000 and the Electronic Communications Act, No 36 of 2005. The MoU was concluded with the aim of creating a framework, within which both Ministers can co-operate on the implementation of certain matters relating to the assignment of powers and functions under the Independent Communications Authority of South Africa Act, No 13 of 2000 and the Electronic Communications Act, No 36 of 2005, to regulate their relationship and mutual co-operation regarding the laws assigned to them, and to assist both Ministers in giving effect to the constitutional obligation of implementing national legislation; developing and implementing national policy; and coordinating functions entrusted to them.
In executing its role, the Department is also guided, amongst others, by:
• The Constitution of the Republic of South Africa, 1996 (Act 108 of 1996);
• The Public Service Act, 1994 (Act 103 of 1994) as amended; and
• The Public Finance Management Act, 1999 (Act 1 of 1999) as amended.
page 26

page 27
9. ORGANISATIONAL STRUCTURE
De
put
y M
inis
ter
Ms
Ste
lla N
da
be
ni A
bra
ham
s, M
P
Dire
cto
r-G
ene
ral
Mr R
ob
ert
Nku
na
Min
iste
rD
r Siy
ab
ong
a C
we
le, M
P
DD
G:
ICT
Infra
stru
ctu
reSu
pp
ort
Mr T
Ng
ob
eni
DD
G:
ICT
Ente
rpris
eD
eve
lop
me
nt &
SOE
Ove
rsig
htM
r O S
hele
mb
e
Actin
g D
DG
:In
form
atio
n So
cie
tyD
eve
lop
me
nt &
Rese
arc
hM
s J
Mo
rwa
ne
Actin
g D
DG
:IC
TPo
licy
& S
trate
gy
Ms
M M
ase
mo
la
DD
G:
Inte
rna
tiona
l Af
fairs
& T
rad
eM
s N
Jo
rda
n-D
yani
DD
G:
Adm
inist
ratio
nM
s TG
Ma
nzin
i

10. ENTITIES REPORTING TO THE MINISTER/MEC
Name of Entity Legislative Mandate Financial Relationship Nature of Operations
NEMISA The National Electronic Media Institute of South Africa was established as a non-profit institute of education by the Department of Communications in terms of the Companies Act (1973). It is listed as a schedule 3A public entity in terms of the Public Finance Management Act (1999).
Transfer of funds Offers national certificates and short courses in the areas of television production, animation and radio production. The institute’s programmes are structured to enhance the market readiness of students in a wide range of broadcasting disciplines.
USAASA The Universal Service and Access Agency of South Africa was established in terms of section 80 of the Electronic Communications Act (ECA) No. 36 of 2005 as a statutory body. It is listed as a Schedule 3A public entity in terms of the Public Finance Management Act 1 of 1999.
Transfer of funds To promote universal service and access in under-serviced areas.
USAF The Universal Service and Access Fund was established in terms of section 89 (1) of the Electronic Communications Act (2005).
Transfer of funds To make payments for subsidies towards the provision of ICT services, as well as the construction or extension of electronic communications for needy person in under-serviced areas.
Za.DNA Za.DNA is a statutory, not-for-profit entity established in terms of Chapter Ten of the Electronic Communications and Transactions (ECT) Act 25 of 2002.
Self-funded To administer, manage and regulate the .Za namespace.
page 28

Name of Entity Legislative Mandate Financial Relationship Nature of Operations
SAPO The South African Post Office is a government business enterprise that is required to provide postal and related services to the public. It derives its mandate from the South African Post Office SOC Ltd Act (2011) and the South African Postbank Limited Act (2010).
Transfer of funds It has an exclusive mandate to conduct postal services, and makes provision for the regulation of postal services and operational functions of the postal company, including universal service obligations and the financial services activities of Postbank.
SITA The State Information Technology Agency is governed by the State Information Technology Agency Act (1998), as amended. The Agency is responsible for the provision of IT services to Government. The Act separates the Agency’s services into mandatory services and non-mandatory.
Self-funded Provisioning and procurement of ICT goods and services on behalf of government departments and public entities.
page 29

page 30
Name of Entity Legislative Mandate Financial Relationship Nature of Operations
BBI Broadband Infraco’s legislative mandate is set out in the Broadband Infraco Act no. 33 of 2007.The main objectives as set out in the Broadband Infraco Act are to expand the availability and affordability of access to electronic communications:
• Including but not limited to under-developed and under-serviced areas;
• In support of projects of national interest;
• In accordance with the Electronic Communications Act and commensurate with international best practice and pricing; and
• Through the provision of electronic communications network services and electronic communications services.
Self-funded Ensures that the high capacity connectivity and bandwidth requirements for specific projects of national interest are met.
SENTECH Sentech was licensed through the Telecommunications Amendment Act (2001) as a state owned enterprise to provide common carrier broadcasting signal distribution services to licensed broadcasters in South Africa.
Transfer of funds Provides signal distribution services in the broadcasting industry.

page 31
PART B PERFORMANCE
INFORMATION

1. AUDITOR GENERAL’S REPORT: PREDETERMINED OBJECTIVES
The AGSA currently performs certain audit procedures on the performance information to provide reasonable assurance in the form of an audit conclusion. The audit conclusion on the performance against predetermined objectives is included in the report to management, with material findings being reported under the Predetermined Objectives heading in the Report on other legal and regulatory requirements section of the auditor’s report.
Refer to page 131 of the Report of the Auditor General, published as Part E: Financial Information.
2. OVERVIEW OF DEPARTMENTAL PERFORMANCE
2.1 Service Delivery Environment
During the period under review the Department of Telecommunications and Postal Services found itself operating in an environment in which the current ICT infrastructure market, particularly in relation to broadband, is characterised by fundamental market problems of ineffective competition, infrastructure sharing bottlenecks, unnecessary duplication of infrastructure, and inefficient use of scarce resources. However, in an effort to respond to such an environment, the Department achieved certain critical milestones including the full implementation of the National Integrated ICT Policy White Paper, the finalisation and Cabinet approval of the National e-Strategy, the ICT SMME Development Strategy as well as the e-Government Strategy, amongst others. The achievement of such crucial targets resulted in the Department achieving 82% of its planned commitments as outlined in its 2017/18 Annual Performance Plan. These achievements are highlighted below:
National Integrated ICT Policy White Paper
The approval of the National Integrated Information and Communication Technologies (ICT) Policy White Paper, in September 2016, marked a significant milestone towards using technology to build a seamless information infrastructure which will underpin a dynamic and connected vibrant information society and a knowledge economy that is more inclusive, equitable and prosperous, as envisaged in the National Development Plan (NDP). The White Paper is an integrated and holistic policy that covers the ICT and postal sectors and sets out the framework of how government wants to provide access to modern communications infrastructure and services to facilitate the entry of new players and meaningful participation of all citizens, including those in rural areas. This is so as to use ICT to facilitate faster shared economic growth, improve service delivery and radically transform society.
During the reporting period, extensive stakeholder engagements have been held on the National Integrated ICT Policy White Paper. These included engagements with the National ICT Forum on White Paper Implementation, focusing on the Wireless Open Access Network and spectrum issues as well as a significant number of meetings with wide-ranging public and private sector stakeholders on the proposed legislation emanating from the White Paper.
page 32

Over the past financial year, several draft bills have been prepared to give effect to the White Paper. These include the Electronic Communications Amendment Bill, Postal Services Amendment Bill, iKamva National e-Skills Institute Bill, ICT Sector Commission and Tribunal Bill and Digital Development Fund Bill. Cabinet approved the publication of the following bills for public comment: Electronic Communications Amendment Bill, Postal Services Amendment Bill and iKamva National e-Skills Institute Bill. Extensive public hearings were held and the consultation is nearing conclusion. In addition to draft legislation, other requirements of the White Paper have also been achieved such as the publication of the ICT SMME strategy, National e-Strategy and e-Government strategy.
National e-Strategy
The National e-Strategy addresses the two aspects of creating the necessary knowledge base and skills for participation in the Digital Society. These include the mass skilling of South Africans and the generation of necessary ICT knowledge and skills for daily use. The second aspect will address the production of skilled scientists, practitioners and business managers to generate South African products that though addressing South African needs can compete favourably in international markets. Furthermore, the National e-Strategy should stimulate demand and sector growth and innovation by driving public and private ICT investment, especially in network upgrades and expansion (particularly in broadband) and development of local content and applications. Furthermore, the National e-Strategy seeks to prepare South Africa for fundamental changes, opportunities, and challenges brought by the Fourth Industrial Revolution.
The current ICT skills gap in South Africa is hindering the country’s ability to improve performance and competitiveness not only of the ICT sector but all other relevant sectors. This skills gap is constraining the drive towards heightened innovation in the ICT sector in an endeavour to sustainably address the unacceptable burdens of poverty and unemployment.
During the period under review, the Department finalised the National e-Strategy through extensive public consultations in all 9 provinces following which the National e-Strategy was presented to Cabinet and approved in December 2017. Furthermore, the National e-Strategy Implementation Plan was also developed in March 2018.
ICT SMME Development Strategy
Government is aware that to address problems confronting our economy and to reverse the unemployment rate requires a radical policy shift that recognises the urgent need to invest in Small, Medium and Micro Enterprises (SMMEs) as they are key drivers of economic growth and job creation. Research by Global Entrepreneurship Monitor shows that small businesses are significant contributors to job creation, creating more than 50 percent of all employment opportunities in South Africa. SMMEs have the potential to create and expand employment opportunities, develop entrepreneurial skills and enhance market opportunities. Compared to the rest of Africa and the world, South Africa is said to have the lowest entrepreneurship activity. This means our country is yet to see the true value and benefits of SMMEs.
page 33

In the period under review, the Department finalised and obtained Cabinet approval of the ICT SMME Development Strategy. The ICT SMME Development Strategy seeks to accelerate the development, growth, and sustainability of Small and Medium Enterprises in the ICT sector with the objective of job creation and economic inclusion. The Strategy also aims to enhance entrepreneurship, increase the usage of ICT tools by all small businesses, and improve their profitability and competitiveness. Furthermore, the Department also developed the ICT SMME Strategy Implementation Plan in March 2018.
e-Government Strategy
The DTPS has developed a coherent National e-Government Strategy and Roadmap which provides direction for the implementation of e-Government and serves as a guide for digital transformation and modernising the public service to improve service delivery to our citizens.
The National e-Government Strategy and Roadmap guides the digital transformation of public service in South Africa into an inclusive digital society where all citizens can benefit from the opportunities offered by digital technologies to improve their quality of life. This will contribute towards reducing poverty and inequality by ensuring that government services are delivered to all citizens through the use of ICTs.
The implementation of this e-Government Strategy and Roadmap is therefore essential for the transformation and modernisation of public service delivery as it provides an enormous opportunity to deliver Government services without having to rely on manual processes that require human intervention. Following the Cabinet approval of the e-Government Strategy in November 2017, the Department also developed the e-Government Strategy Implementation Plan in March 2018.
Broadband Connectivity
The National Development Plan (2012) (NDP), South Africa Connect: the National Broadband Policy and Strategy (2013) (SA Connect) and the recommendations captured in the National ICT Advisory Review Panel Report (2015) (ICT Panel Report) have identified that, despite the policy and regulatory framework, network roll-out is skewed towards urban areas. The prospects of providers rolling out modern broadband services in rural and less affluent areas without government intervention are minimal. Broadband has been recognised by provinces as a key enabler for economic development. All provinces are actively pursuing broadband plans/strategies, and are at different levels of implementation. The Department continues to play the key role of coordinating and collaborating with provinces through Provincial Broadband Steering Committees to achieve alignment with SA Connect objectives. In addition to fiscal constraints, in the 2017/18 financial year, the project was delayed largely due to inability of the Department to finalise the appointment of implementing agents because of extensive consultations with the National Treasury on the most feasible options.
However, during the period under review, the Department formally mandated the State Owned Companies SITA and Broadband Infraco to roll-out Phase 1 of SA connect. In this regard, a Tripartite Master Services Agreement was signed between DTPS, SITA and BBI. The Department also finalised the Infrastructure Roll-out Plan and established District Task Teams through Provincial Steering Committees. The task teams will facilitate SA Connect implementation at district level. The Department issued a government order to SITA for the connection of 63 and an additional 194 sites while a
page 34

further government order was issued to BBI for the connection of 313 sites. Furthermore, a draft MoU between DTPS and DBSA is near finalisation. Under this MoU, DBSA will conduct a comprehensive feasibility study to develop a bankable funding proposal for SA Connect Phase 2.
2.2 Service Delivery Improvement Plan
The Department developed a draft Service Delivery Improvement Plan (SDIP) in compliance with the requirements of Public Service Regulation 2016 and the White Paper on the Transformation of Service Delivery (Batho Pele), with the assistance of DPSA.
However, as part of the revision of the organisational structure, the Department developed a new Service Delivery Model which impacted on the draft Service Delivery Improvement Plan. Therefore, the draft SDIP of the Department, which focuses on the main services offered by the Department to the identified beneficiaries as well as the actual and the desired standards of such services, is in the process of being developed accordingly. Following the revision of the SDIP and its subsequent approval, the Department will commence with its implementation and the monitoring and evaluation of such implementation.
2.3 Organisational Environment
Given the historical challenges of the Department which negatively impacted on the organisation’s climate and staff morale, the Department conducted an Organisational Culture and Climate Survey with all its staff members in the 2016/17 financial year. The results of the Survey informed the development of an Action Plan to improve the organisational climate and culture so as to positively impact on organisational performance and service delivery. In the 2017/18 financial year, the Department focused extensive energy and resources on the implementation of the Climate and Culture Survey Action Plan which yielded the successful implementation of 29 identified initiatives that stemmed from the recommendations of the Climate and Culture Survey results. Such interventions focused on improving transparency and communication with all staff members from the hosting of Brown Bag Sessions, to the communication of decisions taken at management structures as well as the implementation of a Framework for Governance Structures so as to create platforms for consultation of all staff members when taking decisions impacting on DTPS. Interventions were also taken to improve inter-branch collaboration in an effort to break down the silo-mentality especially with regards to the implementation of key projects that cut across multiple branches.
With regards to human resource related matters, as at end of March 2018, the Department had a total head count of 292 staff on its establishment. 279 of these posts were filled, and thirteen (13) posts were vacant and funded which equates to a 4.45% vacancy rate. The Department was allocated a total adjusted and exclusively earmarked amount of R221.2 million for compensation of employees in the 2017/18 financial year. At the end of March 2018, the Department had spent R219.8 million. The main reason for the underspending was the grading of salary levels 9 and 11 in the Administration Branch, which were not graded by the DPSA as anticipated. Amongst the key appointments made during the 2017/18 financial year were the Deputy Director-General ICT International Affairs and Trade and the Chief Director Broadband.
page 35

page 36
In terms of information technologies, the Department made significant strides in relation to the digital transformation of the Department’s manual business processes. To make DTPS to lead by example in the use of ICT in the public sector as an ICT Department, the DTPS implemented the digitisation of the manual workflow for the leave management process as well as rolling out a unified communication and collaboration platform.
2.4 Key Policy Developments and Legislative Changes
Following the Cabinet approval of the National Integrated ICT Policy White Paper in September 2016, the Department has commenced with its implementation of the [which “outlines the overarching policy framework for the transformation of South Africa into an inclusive and innovative digital and knowledge society”]. Over the short to medium term, the Department will continue to develop the ICT legislation required to give effect to the National Integrated ICT Policy White Paper. This include the Electronic Communications Amendment Bill, Postal Services Amendment Bill, iKamva National e-Skills Institute Bill, ICT Sector Commission and Tribunal Bill and Digital Development Fund Bill, amongst others.
3. STRATEGIC OUTCOME ORIENTED GOALS
Broadband connectivity that provide secure and affordable access for all citizens to education, health and other government services and stimulates economic development.
Through the strategic objective of coordinating broadband connectivity to achieve 100% population coverage, the Department is contributing to Outcome 6 (“An efficient, competitive and responsive economic infrastructure network”). Relating to the strategic objective, the Department focused on project managing the roll-out of the Broadband Connectivity Implementation Plan Phase 1 towards connecting 2 700 identified sites. In this regards, the Department has formally mandated SITA and Broadband Infraco to roll-out Phase 1 of SA Connect and a Tripartite Master Services Agreement was signed between DTPS, SITA and BBI. The Department also issued a Government order to SITA for the connection of 63 and additional 194 sites while a second Government Order was issued to BBI for the connection of 313 sites.
The Department made strides with regards to facilitating and monitoring operations of the Virtual Cyber Security Hub and contributing to Outcome 3 (“All people in South Africa are and feel safe”). The Department has taken bold and ambitious approaches to tackling many the threats our country faces in cyberspace. Managing and mitigating those threats is a task that the Department recognises as its special national responsibility to lead through the operations of the Virtual Cybersecurity Hub.
With regards to conducting preliminary technical and regulatory studies to inform South Africa’s Draft position for the WRC-19, the Department conducted preliminary studies in preparation for WRC-19 and developed an approved technical and regulatory studies report, with methodology and a preliminary draft South African position.

page 37
South Africa has a modern, sustainable and competitive postal and telecommunications sector.
As part of developing and implementing ICT policy and legislation aimed at improving access to and affordability of ICTs, the Department has developed draft ICT legislation in line with the Integrated ICT Policy White Paper. As part of implementing the National Integrated ICT Policy White Paper, the Department has revised several prioritised Bills which were submitted to Cabinet. Following Cabinet approval, the ECA Bill, PSA Bill and iNESI Bill were gazetted for public consultation. This is in line with Outcome 6 (“An efficient, competitive and responsive economic infrastructure network”). Output 5: Communication and Information technology, which is aimed at reducing cost of communication, increase our broadband penetration and to reduce the digital divide in both urban and rural contexts.
With regards to promoting the growth and sustainability of ICT SMMEs through the development and implementation of the ICT SMME Strategy, the Department finalised and obtained Cabinet approval of this strategy in November 2017. The ICT SMME Strategy Implementation Plan was also developed and approved in March 2018 for implementation in the 2018/19 financial year.
In its effort to advance South Africa’s National ICT interests in regional and international forums with the aim of obtaining partnerships for economic growth and development, the Department has participated in various fora and developed South African Positions in fora such as the BRICS Partnership Programme on the establishment of the BRICS Institute for Future Networks, the reduction of Cost to Communicate for affordable, reliable, accessible and secure ICT Infrastructure within SADC; WTDC focused on a developmental agenda on the internet and digital economy and on the reform of UPU in favour of equitable representation and democratic decision making.
An Inclusive information society and knowledge economy driven through a comprehensive e-Strategy and access to government service.
The DTPS finalised the National e-Strategy which was approved by Cabinet in November 2017. The Department also finalised and obtained Cabinet approval of the e-Government Strategy in November 2017. The National e-Strategy Implementation Plan as well as the e-Government Strategy Implementation Plan were also developed and approved in March 2018 for implementation in the 2018/19 financial year. These are essential for the transformation and modernisation of the ICT Sector and for improved public service delivery.
Optimally functional Department and SOCs that effectively deliver on their respective mandates.
In an effort to ensure the improved performance of SOCs though pro-active and stringent oversight, the Department undertook monitoring and evaluation of performance and compliance of SOCs against strategic plans and relevant prescripts. In order to create a high performing organisation to enable achievement of the Department’s mandate, the Department has furthermore implemented the recommendations stemming from the Climate and Culture Action Plan to improve the current climate and culture within the Department thus optimising the delivery of its mandate.

page 38
4. PERFORMANCE INFORMATION BY PROGRAMME
4.1 Programme 1: Administration
The purpose of Programme 1 is to provide strategic leadership, management and support services to the Department. The Programme consists of the following 6 sub-programmes:
- Ministry;
- Departmental Management;
- Internal Audit;
- Corporate Services;
- Financial Management; and
- Office Accommodation.
The Strategic Objective for the 2017/18 Financial Year was:
- Create a high performing organisation to enable achievement of the Department’s mandate.

Stra
teg
ic o
bje
ctiv
es,
pe
rfo
rma
nce
ind
ica
tors
, pla
nne
d t
arg
ets
and
ac
tua
l ac
hie
vem
ent
s
Pro
gra
mm
e 1
: A
dm
inis
tra
tion
STRA
TEG
IC
OBJ
ECTI
VES
PERF
ORM
ANC
E IN
DIC
ATO
R
ACTU
AL
ACHI
EVEM
ENT
2016
/17
PLAN
NED
TA
RGET
20
17/1
8
ACTU
AL A
CHI
EVEM
ENT
2017
/18
DEV
IATI
ON
FRO
M
PLAN
NED
TAR
GET
TO
AC
TUAL
AC
HIEV
EMEN
T FO
R 20
17/1
8
CO
MM
ENT
ON
D
EVIA
TIO
NS
Cre
ate
a hi
gh
perfo
rmin
g or
gani
satio
n to
ena
ble
achi
evem
ent
of th
e D
epar
tmen
t’s
man
date
Appr
oved
or
gani
satio
nal
stru
ctur
e th
at
supp
orts
the
stra
tegy
•A
need
as
sess
men
t was
co
nduc
ted
wth
all
the
bran
ches
of
the
Dep
artm
ent.
•A
serv
ice
Del
iver
y M
odel
(SD
M)
alig
ned
to th
e D
epar
tmen
t’s
man
date
was
de
velo
ped
in
cons
ulta
tion
with
DPS
A an
d su
bmitt
ed fo
r ap
prov
al.
Org
anisa
tiona
l st
ruct
ure
appr
oved
and
im
plem
ente
d
•Th
e D
epar
tmen
t did
not
fully
ac
hiev
e th
e se
t tar
get o
f de
velo
ping
and
impl
emen
ting
the
revi
sed
orga
nisa
tiona
l st
ruct
ure.
•Ho
wev
er, i
n pu
rsui
t of d
eliv
erin
g on
this
targ
et th
e D
epar
tmen
t de
velo
ped
and
obta
ined
ap
prov
al o
f the
hig
h-le
vel
func
tiona
l stru
ctur
e as
wel
l as
the
DTP
S va
lue
chai
n an
d hi
gh
leve
l bus
ines
s pr
oces
ses.
•Fu
rther
mor
e, a
n an
alys
is of
em
ploy
ee q
ualif
icat
ions
and
ex
perie
nce
was
con
duct
ed fo
r al
l em
ploy
ees
as p
art o
f the
or
gani
satio
nal r
evie
w p
roce
ss.
The
Dep
artm
ent
was
una
ble
to
final
ise th
e re
view
of
the
orga
nisa
tiona
l st
ruct
ure
and
mig
rate
sta
ff to
the
revi
sed
stru
ctur
e as
pl
anne
d.
•Th
e pr
ogre
ss o
n th
e re
view
of t
he
orga
nisa
tiona
l st
ruct
ure
was
se
rious
ly h
ampe
red
by in
itial
del
ays
in fi
nalis
ing
the
Serv
ice
Del
iver
y M
odel
.
•Ho
wev
er e
xten
sive
prog
ress
has
bee
n m
ade
and
it is
envi
sage
d th
at
the
revi
ew o
f the
or
gani
satio
nal
stru
ctur
e w
ill be
co
nclu
ded
in th
e fir
st q
uarte
r of t
he
2018
/19
finan
cial
ye
ar.
page 39

STRA
TEG
IC
OBJ
ECTI
VES
PERF
ORM
ANC
E IN
DIC
ATO
R
ACTU
AL
ACHI
EVEM
ENT
2016
/17
PLAN
NED
TA
RGET
20
17/1
8
ACTU
AL A
CHI
EVEM
ENT
2017
/18
DEV
IATI
ON
FRO
M
PLAN
NED
TAR
GET
TO
AC
TUAL
AC
HIEV
EMEN
T FO
R 20
17/1
8
CO
MM
ENT
ON
D
EVIA
TIO
NS
Cre
ate
a hi
gh
perfo
rmin
g or
gani
satio
n to
ena
ble
achi
evem
ent
of th
e D
epar
tmen
t’s
man
date
Qua
rterly
pro
gres
s re
ports
on
impl
emen
tatio
n ag
ains
t Act
ion
Plan
•Th
e D
epar
tmen
t co
nduc
ted
an
exte
nsiv
e C
limat
e an
d C
ultu
re s
urve
y.
•An
Act
ion
Plan
to
prio
ritise
the
impl
emen
tatio
n of
the
reco
mm
enda
tions
of
the
Clim
ate
and
Cul
ture
sur
vey
was
dev
elop
ed
and
iden
tifie
d in
terv
entio
ns w
ere
impl
emen
ted.
Clim
ate
and
Cul
ture
Sur
vey
Actio
n Pl
an
impl
emen
ted
and
mon
itore
d
•Th
e D
epar
tmen
t ful
ly a
chie
ved
the
targ
et o
f mon
itorin
g an
d im
plem
entin
g th
e C
limat
e an
d C
ultu
re S
urve
y Ac
tion
Plan
du
ring
the
repo
rting
per
iod.
•In
impl
emen
ting
all
inte
rven
tions
as
iden
tifie
d in
th
e C
limat
e an
d C
ultu
re S
urve
y Ac
tion
Plan
, the
Dep
artm
ent
unde
rtook
29
prio
rity
inte
rven
tions
with
in th
e re
porti
ng
perio
d, in
line
with
the
Actio
n Pl
an.
--
page 40

Strategy to overcome areas of under-performance
The Department acknowledges its under-performance with regards to approving and implementing the Organisational Structure. This was largely as a result of the delays in the finalisation of the Service Delivery Model as well as the appointment of the service provider and the prolonged procurement process. The Department plans to prioritise and expedite the approval and implementation of the organisational structure in the 2018/19 financial year. Furthermore, specific focus will be given to planning in line with the availability of requisite skills to achieve a specific target.
Changes to planned targets
There were no changes to the planned targets during the reporting period.
Linking performance with budgets
Spending was R209.4 million in the 2017/18 financial year and R211.5 million in the 2016/17 financial year. Spending under goods and services declined from R109.2 million in the 2016/17 to R95.9 million in the 2017/18 financial year. Spending on Operating Lease declined from R41 million to R33.7 million in the year under review. The spending rate under this programme is at 99.9%.
Sub-programme expenditure
Sub- Programme
Name
2017/18 2016/17
Final Appropria-
tionActual
Expenditure(Over)/Under Expenditure
Final Appropriation
Actual Expenditure
(Over)/Under Expenditure
R’000 R’000 R’000 R’000 R’000 R’000
Ministry 4 228 4 228 - 4 358 4 211 147
Departmental Management 48 058 47 986 72 52 802 52 052 750
Internal Audit 5 402 5 402 - 7 162 3 939 3 223
Corporate Services 74 279 74 242 37 71 577 70 486 1 091
Financial Management 74 775 74 758 17 76 210 75 681 529
Office Accom-modation 2 836 2 836 - 5 213 5 213 -
Total 209 578 209 452 126 217 322 211 582 5 740
page 41

page 42
4.2 Programme 2: ICT International Affairs
The purpose of Programme 2 is to ensure alignment between South Africa’s international activities and agreements in the field of ICT and South Africa’s foreign policy. The ICT International Affairs Programme consists of the following sub-programmes:
- International Affairs coordinates the functions and responsibilities of the Department to meet South Africa’s international ICT obligations through bi-laterals, multi-laterals and tri-laterals; and
- ICT Trade/Partnerships develop and advance the country’s interests in international trade forums through participation in World Trade Organisation ICT related initiatives and other international trade agreements, such as the South African European Union Trade Agreement and bilateral agreements with counterpart countries. South Africa’s national interests are also promoted in these forums.
The strategic objective for the 2017/18 Financial Year is listed below:
- Advance South Africa’s National ICT interest in Regional and International Forums towards attaining partnerships for economic growth and development.

Stra
teg
ic o
bje
ctiv
es,
pe
rfo
rma
nce
ind
ica
tors
, pla
nne
d t
arg
ets
and
ac
tua
l ac
hie
vem
ent
s
Pro
gra
mm
e 2
: IC
T In
tern
atio
nal A
ffairs
STRA
TEG
IC
OBJ
ECTI
VES
PERF
ORM
ANC
E IN
DIC
ATO
RAC
TUAL
AC
HIEV
EMEN
T 20
16/1
7PL
ANN
ED T
ARG
ET
2017
/18
ACTU
AL A
CHI
EVEM
ENT
2017
/18
DEV
IATI
ON
FRO
M
PLAN
NED
TAR
GET
TO
AC
TUAL
AC
HIEV
EMEN
T FO
R 20
17/1
8C
OM
MEN
T O
N
DEV
IATI
ON
S
Adva
nce
Sout
h Af
rica’
s N
atio
nal IC
T in
tere
st in
Reg
iona
l an
d In
tern
atio
nal
Foru
ms
tow
ards
at
tain
ing
partn
ersh
ips
for e
cono
mic
gro
wth
an
d de
velo
pmen
t
Num
ber o
f RS
A Po
sitio
ns
deve
lope
d on
id
entif
ied
focu
s ar
eas
•Th
e RS
A Po
sitio
n fo
r BR
ICS
was
dev
elop
ed
and
appr
oved
ocu
sing
on s
kills
deve
lopm
ent.
•Th
e RS
A Pr
ogra
mm
e of
Ac
tion
outlin
ing
prio
rity
area
s of
coo
pera
tion
was
dev
elop
ed a
nd
subm
itted
to th
e BR
ICS
IMC
.
•Th
e D
epar
tmen
t also
he
ld b
ilate
ral m
eetin
gs
with
the
Indi
an a
nd
Chi
nese
em
bass
ies
to
pres
ent R
SA's
plan
s fo
r th
e BR
ICS
ICT A
gend
a.
One
(1) R
SA P
ositio
n de
velo
ped
in p
ursu
it of
BRI
CS
Partn
ersh
ip
Prog
ram
me
on th
e es
tabl
ishm
ent o
f the
BR
ICS
Insti
tute
for
Futu
re N
etw
orks
•Th
e ta
rget
was
fully
ach
ieve
d as
pl
anne
d.
•Th
e D
epar
tmen
t dev
elop
ed
the
RSA
Posit
ion
with
in th
e BR
ICS
Partn
ersh
ip P
rogr
amm
e on
the
esta
blish
men
t of t
he B
RIC
S In
stitu
te
for F
utur
e N
etw
orks
focu
sing
on
area
s of
inno
vatio
n, lo
cal IC
T skil
ls,
rese
arch
and
dev
elop
men
t. In
th
is RS
A en
gage
d w
ith a
ll BRI
CS
partn
ers.
•Fu
rther
mor
e, a
n Im
plem
enta
tion
Plan
focu
sing
on a
reas
of l
ocal
IC
T skil
ls, in
nova
tion,
rese
arch
an
d de
velo
pmen
t for
the
BRIC
S In
stitu
te fo
r Fut
ure
Net
wor
ks w
as
deve
lope
d an
d co
nsid
ered
by
NEM
ISA fo
r inc
lusio
n in
thei
r 20
18/1
9 AP
P.
--
page 43

STRA
TEG
IC
OBJ
ECTI
VES
PERF
ORM
ANC
E IN
DIC
ATO
RAC
TUAL
AC
HIEV
EMEN
T 20
16/1
7PL
ANN
ED T
ARG
ET
2017
/18
ACTU
AL A
CHI
EVEM
ENT
2017
/18
DEV
IATI
ON
FRO
M
PLAN
NED
TAR
GET
TO
AC
TUAL
AC
HIEV
EMEN
T FO
R 20
17/1
8C
OM
MEN
T O
N
DEV
IATI
ON
S
Adva
nce
Sout
h Af
rica’
s N
atio
nal IC
T in
tere
st in
Reg
iona
l an
d In
tern
atio
nal
Foru
ms
tow
ards
at
tain
ing
partn
ersh
ips
for e
cono
mic
gro
wth
an
d de
velo
pmen
t
Num
ber o
f RS
A Po
sitio
ns
deve
lope
d on
id
entif
ied
focu
s ar
eas
•Th
e RS
A Po
sitio
n fo
r SA
DC
was
dev
elop
ed
and
adva
nced
at
the
SAD
C S
CO
M
and
SAD
C M
inist
eria
l m
eetin
g an
d fo
cuse
d on
regi
onal
inte
grat
ion
and
infra
struc
ture
de
velo
pmen
t. SA
DC
ad
opte
d Re
gion
al
Inte
rnet
Exc
hang
e Po
ints
as w
ell a
s ad
opte
d po
licie
s to
ens
ure
that
tra
ffic
is ro
oted
loca
lly to
re
duce
cos
ts.
One
(1) R
SA P
ositio
n de
velo
ped
for S
ADC
fo
cuse
d to
war
ds th
e re
duct
ion
of C
ost
to C
omm
unic
ate
for a
fford
able
, re
liabl
e, a
cces
sible
an
d se
cure
ICT
Infra
struc
ture
•Th
e ta
rget
was
fully
ach
ieve
d as
pl
anne
d.
•Th
e D
epar
tmen
t, in
col
labo
ratio
n w
ith IC
ASA,
dev
elop
ed th
e RS
A po
sitio
n pa
per o
n SA
DC
Se
cond
Pha
se o
f Glid
e Pa
th
that
was
pre
sent
ed a
t the
SAD
C
ICT M
inist
eria
l mee
ting
tow
ards
re
gion
al in
tegr
atio
n w
hich
w
as h
oste
d by
Sou
th A
frica
in
Sept
embe
r 201
7.
•Fu
rther
mor
e, th
e RS
A St
atus
Rep
ort
on th
e SA
DC
Sec
ond
Phas
e of
G
lide
Path
was
dev
elop
ed.
--
Adva
nce
sout
h Af
rica’
s N
atio
nal IC
T in
tere
st in
Reg
iona
l an
d In
tern
atio
nal
Foru
ms
tow
ards
at
tain
ing
partn
ersh
ips
for e
cono
mic
gro
wth
an
d de
velo
pmen
t
Num
ber o
f RS
A Po
sitio
ns
deve
lope
d on
id
entif
ied
focu
s ar
eas
-O
ne (1
) RSA
Pos
ition
deve
lope
d fo
r W
TDC
focu
sed
on
deve
lopm
enta
l ag
enda
on
the
inte
rnet
and
dig
ital
econ
omy
•Th
e ta
rget
was
fully
ach
ieve
d as
pl
anne
d.
•Th
e RS
A Po
sitio
n fo
r WTD
C w
as
deve
lope
d an
d ad
vanc
ed a
t the
W
TDC
.
•Fu
rther
mor
e, a
n O
utco
mes
Rep
ort
on th
e de
velo
pmen
tal a
gend
a in
the
WTD
C w
as a
lso d
evel
oped
so
as
to fo
llow
up
on th
e re
solu
tions
of t
he C
onfe
renc
e at
a
Nat
iona
l, Re
gion
al a
nd G
loba
l le
vel in
term
s of
pro
gram
mes
for
impl
emen
tatio
n.
--
page 44

STRA
TEG
IC
OBJ
ECTI
VES
PERF
ORM
ANC
E IN
DIC
ATO
RAC
TUAL
AC
HIEV
EMEN
T 20
16/1
7PL
ANN
ED T
ARG
ET
2017
/18
ACTU
AL A
CHI
EVEM
ENT
2017
/18
DEV
IATI
ON
FRO
M
PLAN
NED
TAR
GET
TO
AC
TUAL
AC
HIEV
EMEN
T FO
R 20
17/1
8C
OM
MEN
T O
N
DEV
IATI
ON
S
Adva
nce
Sout
h Af
rica’
s N
atio
nal IC
T in
tere
st in
Reg
iona
l an
d In
tern
atio
nal
Foru
ms
tow
ards
at
tain
ing
partn
ersh
ips
for e
cono
mic
gro
wth
an
d de
velo
pmen
t
Num
ber o
f RS
A Po
sitio
ns
deve
lope
d on
id
entif
ied
focu
s ar
eas
•SA
was
ele
cted
to
the
Cou
ncil o
f Ad
min
istra
tion
(CA)
of
UPU.
•SA
also
eng
aged
all
coun
terp
arts
thro
ugh
dipl
omat
ic c
hann
els
on
supp
ort f
or re
-ele
ctio
n.
•RS
A po
sitio
n pa
per
for t
he In
tern
atio
nal
Posta
l Pro
gram
me
was
dev
elop
ed w
hich
fo
cuse
d on
dev
elop
ing
the
posta
l sec
tor f
or
enha
nced
ser
vice
deliv
ery;
regu
latio
ns
of E
TOEs
; ref
orm
of
the
UPU,
e-c
omm
erce
an
d fin
anci
al s
ervic
es
in th
e po
stal s
ecto
r for
fin
anci
al in
clus
ion.
•Th
e RS
A Po
sitio
n an
d C
abin
et m
anda
te w
as
adva
nced
at t
he U
PU
Con
gres
s.
One
(1) R
SA P
ositio
n de
velo
ped
for t
he
refo
rm o
f UPU
in
favo
ur o
f equ
itabl
e re
pres
enta
tion
and
dem
ocra
tic d
ecisi
on
mak
ing
•Th
e ta
rget
was
fully
ach
ieve
d as
pl
anne
d.
•RS
A Po
sitio
n fo
r the
refo
rm o
f UPU
w
as d
evel
oped
and
adv
ance
d at
th
e UP
U C
ounc
il of A
dmin
istra
tion
(CA)
in O
ctob
er a
nd a
t the
Af
rican
Uni
on C
omm
ittee
on
Info
rmat
ion
and
Com
mun
icat
ion
Tech
nolo
gies
[AU
CIC
T] in
N
ovem
ber.
•SA
was
ele
cted
as
one
of th
e m
embe
rs to
fina
lise
the
UPU
posit
ion
on th
e re
form
of t
he U
PU
Unio
n an
d ha
s be
en a
ttend
ing
to
all r
espo
nsib
ilitie
s as
man
date
d.
•Fu
rther
mor
e, a
Sta
tus
Repo
rt an
d re
com
men
datio
ns o
n th
e re
form
of
UPU
was
also
dev
elop
ed. T
hese
re
com
men
datio
ns w
ill se
rve
as
furth
er in
put t
o de
liber
atio
ns o
n Re
form
at t
he C
A le
vel.
--
page 45

STRA
TEG
IC
OBJ
ECTI
VES
PERF
ORM
ANC
E IN
DIC
ATO
RAC
TUAL
AC
HIEV
EMEN
T 20
16/1
7PL
ANN
ED T
ARG
ET
2017
/18
ACTU
AL A
CHI
EVEM
ENT
2017
/18
DEV
IATI
ON
FRO
M
PLAN
NED
TAR
GET
TO
AC
TUAL
AC
HIEV
EMEN
T FO
R 20
17/1
8C
OM
MEN
T O
N
DEV
IATI
ON
S
Adva
nce
Sout
h Af
rica’
s N
atio
nal IC
T in
tere
st in
Reg
iona
l an
d In
tern
atio
nal
Foru
ms
tow
ards
at
tain
ing
partn
ersh
ips
for e
cono
mic
gro
wth
an
d de
velo
pmen
t
Num
ber o
f pa
rtner
ship
s se
cure
d fo
r the
D
igita
l Eco
nom
y
-2
partn
ersh
ips
secu
red
for t
he
Dig
ital E
cono
my
tow
ards
ICT
ente
rpris
e de
velo
pmen
t, SM
ME
grow
th, e
-skil
ls an
d in
nova
tion
in lin
e w
ith th
e IC
T SM
ME
Stra
tegy
•Th
e ta
rget
with
rega
rds
to s
ecur
ing
2 pa
rtner
ship
s w
as n
ot a
chie
ved
as p
lann
ed.
•Ef
forts
wer
e m
ade
with
rega
rds
to
secu
ring
Partn
ersh
ips
with
IBM
and
In
telSa
t.
•Th
e pr
opos
ed d
raft
MO
U fro
m IB
M
was
revis
ed b
y th
e D
epar
tmen
t an
d sh
ared
with
IBM
for f
urth
er
lega
l scr
utin
y. IB
M c
omm
ence
d w
ith p
rom
otin
g th
e tra
inin
g Pr
ogra
mm
e on
30
Janu
ary
2018
•Th
e In
telSa
t Agr
eem
ent w
as
nego
tiate
d an
d fin
alise
d in
whi
ch
Sent
ech
signe
d an
d sh
ared
w
ith In
telsa
t and
Did
usec
. Dat
a w
as c
olle
cted
and
six
sites
wer
e id
entif
ied
by th
e D
epar
tmen
t in
Mar
ch 2
018,
whi
ch w
ere
map
ped
for c
onne
ctio
n.
Albe
it th
at
exte
nsive
en
gage
men
ts w
ere
held
in
rela
tion
to
secu
ring
iden
tifie
d pa
rtner
ship
s, th
e D
epar
tmen
t was
un
able
to s
ecur
e su
ch p
artn
ersh
ips
thro
ugh
signe
d Pa
rtner
ship
Ag
reem
ents.
•Th
e co
nclu
sion
of th
e Pa
rtner
ship
Ag
reem
ent
betw
een
DTP
S an
d IB
M w
as
dela
yed
due
to
prol
onge
d le
gal
scru
tiny
by re
leva
nt
stake
hold
ers.
How
ever
, in
April
2018
, a le
tter
signe
d by
the
DG
w
as s
ubm
itted
to
IBM
requ
estin
g co
mm
ence
men
t of
the
Skills
Pr
ogra
mm
e.
The
Partn
ersh
ip
Agre
emen
t be
twee
n D
TPS
and
IBM
will
be s
igne
d on
16
May
201
8.
page 46

STRA
TEG
IC
OBJ
ECTI
VES
PERF
ORM
ANC
E IN
DIC
ATO
RAC
TUAL
AC
HIEV
EMEN
T 20
16/1
7PL
ANN
ED T
ARG
ET
2017
/18
ACTU
AL A
CHI
EVEM
ENT
2017
/18
DEV
IATI
ON
FRO
M
PLAN
NED
TAR
GET
TO
AC
TUAL
AC
HIEV
EMEN
T FO
R 20
17/1
8C
OM
MEN
T O
N
DEV
IATI
ON
S
•O
n th
e e-
Com
mer
ce P
artn
ersh
ip,
a dr
aft b
usin
ess
case
on
SAPO
as
an
e-C
omm
erce
Hub
w
as d
evel
oped
and
a d
raft
Agre
emen
t bet
wee
n D
TPS
and
UPU
was
also
dev
elop
ed. T
he d
raft
Agre
emen
t foc
used
on
faci
litatin
g th
e bu
ildin
g of
cap
acity
in S
APO
to
bec
ome
an e
-Com
mer
ce
Hub
and
prov
ide
a pl
atfo
rm
to S
MEs
. The
Dep
artm
ent h
eld
enga
gem
ents
with
SAP
O a
nd U
PU
as w
ell a
s w
ith N
atio
nal T
reas
ury
on th
e e-
Com
mer
ce C
oope
ratio
n Ag
reem
ent.
•W
ith re
fere
nce
to
the
e-C
omm
erce
pr
ojec
t with
SA
PO a
nd U
PU,
the
conc
lusio
n of
the
prop
osed
Pa
rtner
ship
Ag
reem
ent w
ill be
prio
ritise
d th
roug
h di
scus
sion
betw
een
DTP
S an
d N
atio
nal T
reas
ury.
page 47

Strategy to overcome areas of under-performance
The Department acknowledges its under-performance on the target related to 2 partnerships secured for the Digital Economy towards ICT enterprise development, SMME growth, e-skills and innovation in line with the ICT SMME Strategy. The Department has prioritised the signing of the Partnership Agreement with relevant stakeholders as well as holding consultations with National Treasury. However, going forward, during the setting of targets for the ICT International Affairs Branch, the Department will take into consideration the extended duration needed for extensive stakeholder engagement, as well as the dependency on external stakeholders, especially when international partners are involved.
Changes to planned targets
There were no changes to the planned targets during the reporting period.
Linking performance with budgets
Spending was R50.6 million in the 2017/18 financial year and was R46.9 million in the 2016/17 financial year. The variance was mainly due to increased spending in the Compensation of Employees. Transfer payments for membership fees to international ICT organisations decreased from R26.1 million in the 2016/17 financial year to R25.9 million in the 2017/18 financial year.
Sub-programme expenditure
Sub-Programme Name
2017/18 2016/17
Final Appropria-
tionActual
Expenditure(Over)/Under Expenditure
Final Appropria-
tionActual
Expenditure
(Over) / Under
Expenditure
R’000 R’000 R’000 R’000 R’000 R’000
International Affairs 12 730 12 502 228 14 751 13 434 1 317
ICT Trade /Partnership 39 018 38 110 908 33 679 33 510 169
Total 51 748 50 612 1 136 48 430 46 944 1 486
page 48

page 49
4.3 Programme 3: ICT Policy, Research and Capacity Development
The purpose of Programme 3 is to develop ICT policies and legislation that support the development of an ICT sector that creates favourable conditions for the accelerated and shared growth of the economy. The intention is to develop strategies that increase the uptake and usage of ICT by the majority of the South African population, in order to bridge the digital divide.
The ICT Policy, Research and Capacity Development Programme consists of the following sub-programmes:
- ICT Policy Development drafts legislation, regulations, policy and guidelines that govern the broadcasting, telecommunications, postal and IT sectors, thus ensuring broad-based economic development within the ICT sector;
- Economic and Market Analysis is responsible for economic analysis and growth projections. This sub-programme also undertakes market research to explore areas that require policy intervention;
- Research is responsible for understanding the ICT landscape and delivering a National ICT Strategy;
- Information Society Development renders delivery management services in support of an ICT information society, development and usage; and
- Capacity Development provides direction for the advancement of e-Skills graduates and society in general, functioning effectively in the emerging information society.
The Strategic Objectives for the 2017/18 financial year are listed below:
- Develop and implement ICT policy and legislation aimed at improving access and affordability of ICTs
- Promote growth and sustainability of ICT SMMEs through development and implementation of the ICT SMME strategy; and
- Develop and implement a National e-Strategy that will give priority to e-government services.

page 50
Stra
teg
ic o
bje
ctiv
es,
pe
rfo
rma
nce
ind
ica
tors
, pla
nne
d t
arg
ets
and
ac
tua
l ac
hie
vem
ent
s
Pro
gra
mm
e 3
: IC
T Po
licy,
Re
sea
rch
and
Ca
pa
city
De
velo
pm
ent
STRA
TEG
IC
OBJ
ECTI
VES
PERF
ORM
ANC
E IN
DIC
ATO
R
ACTU
AL
ACHI
EVEM
ENT
2016
/17
PLAN
NED
TA
RGET
20
17/1
8AC
TUAL
AC
HIEV
EMEN
T 20
17/1
8
DEV
IATI
ON
FRO
M
PLAN
NED
TAR
GET
TO
AC
TUAL
AC
HIEV
EMEN
T FO
R 20
17/1
8C
OM
MEN
T O
N
DEV
IATI
ON
S
Dev
elop
and
im
plem
ent
ICT
polic
y an
d le
gisla
tion
aim
ed
at im
prov
ing
acce
ss a
nd
affo
rdab
ility
of
ICTs
Dra
ft IC
T le
gisla
tion
in
line
with
the
Nat
iona
l In
tegr
ated
ICT
Polic
y W
hite
Pap
er
The
Dep
artm
ent
deve
lope
d dr
aft
ICT
legi
slatio
n w
hich
was
su
bmitt
ed a
nd
appr
oved
by
the
Acco
untin
g O
ffice
r.
Dra
ft IC
T le
gisla
tion
deve
lope
d in
line
with
th
e N
atio
nal
Inte
grat
ed IC
T Po
licy
Whi
te
Pape
r
•Th
e D
epar
tmen
t ful
ly a
chie
ved
the
targ
et o
f dev
elop
ing
the
draf
t IC
T le
gisla
tion
in li
ne w
ith
the
Nat
iona
l Int
egra
ted
ICT
Polic
y W
hite
Pap
er.
•Th
e D
epar
tmen
t dev
elop
ed
the
Elec
troni
c C
omm
unic
atio
ns
Amen
dmen
t (EC
A) B
ill, Ik
amva
N
atio
nal e
-Skil
ls In
stitu
te (i
NES
I) Bi
ll an
d th
e Po
stal
Ser
vice
s Am
endm
ent B
ill an
d ob
tain
ed
appr
oval
from
Cab
inet
to g
azet
te
for p
ublic
con
sulta
tion,
whi
ch
com
men
ced
in th
e 4th
Qua
rter o
f th
e re
porti
ng p
erio
d.
•Th
e IN
ESI B
ill w
as in
trodu
ced
in
Parlia
men
t in
Mar
ch 2
018.
--

page 51
STRA
TEG
IC
OBJ
ECTI
VES
PERF
ORM
ANC
E IN
DIC
ATO
R
ACTU
AL
ACHI
EVEM
ENT
2016
/17
PLAN
NED
TA
RGET
20
17/1
8AC
TUAL
AC
HIEV
EMEN
T 20
17/1
8
DEV
IATI
ON
FRO
M
PLAN
NED
TAR
GET
TO
AC
TUAL
AC
HIEV
EMEN
T FO
R 20
17/1
8C
OM
MEN
T O
N
DEV
IATI
ON
S
Prom
ote
grow
th
and
sust
aina
bilit
y of
ICT
SMM
Es
thro
ugh
deve
lopm
ent a
nd
impl
emen
tatio
n of
the
ICT
SMM
E St
rate
gy
Appr
oved
ICT
SMM
E St
rate
gyTh
e D
epar
tmen
t de
velo
ped
the
ICT
SMM
E St
rate
gy.
ICT
SMM
E D
evel
opm
ent
Stra
tegy
ap
prov
ed
•Th
e D
epar
tmen
t ful
ly a
chie
ved
the
set t
arge
t.
•Th
e IC
T SM
ME
Dev
elop
men
t St
rate
gy w
as fi
nalis
ed a
nd
appr
oved
by
Cab
inet
in
Nov
embe
r 201
7.
•Pr
ior t
o fin
alisa
tion
and
subm
issio
n fo
r Cab
inet
app
rova
l, th
e IC
T SM
ME
Dev
elop
men
t Stra
tegy
un
derw
ent e
xten
sive
publ
ic
cons
ulta
tions
in a
ll 9
Prov
ince
s.
•Fu
rther
mor
e, th
e IC
T SM
ME
Dev
elop
men
t Stra
tegy
Im
plem
enta
tion
Plan
was
fina
lised
an
d ap
prov
ed in
qua
rter 4
, for
im
plem
enta
tion
in th
e 20
18/1
9 fin
anci
al y
ear.
--

page 52
STRA
TEG
IC
OBJ
ECTI
VES
PERF
ORM
ANC
E IN
DIC
ATO
R
ACTU
AL
ACHI
EVEM
ENT
2016
/17
PLAN
NED
TA
RGET
20
17/1
8AC
TUAL
AC
HIEV
EMEN
T 20
17/1
8
DEV
IATI
ON
FRO
M
PLAN
NED
TAR
GET
TO
AC
TUAL
AC
HIEV
EMEN
T FO
R 20
17/1
8C
OM
MEN
T O
N
DEV
IATI
ON
S
Dev
elop
and
im
plem
ent
a N
atio
nal
e-St
rate
gy th
at
will
give
prio
rity
to
e-G
over
nmen
t se
rvic
es
Appr
oved
Nat
iona
l e-
Stra
tegy
Th
e dr
aft N
atio
nal
e-St
rate
gy w
as
pres
ente
d to
th
e G
over
nmen
t C
lust
er S
yste
m
for f
urth
er in
put
follo
win
g w
hich
it
was
app
rove
d by
th
e C
abin
et fo
r ga
zetti
ng fo
r pub
lic
com
men
t.
Nat
iona
l e-
Stra
tegy
ap
prov
ed
•Th
e D
epar
tmen
t ful
ly a
chie
ved
the
targ
et.
•Th
e N
atio
nal e
-Stra
tegy
was
fin
alise
d an
d ap
prov
ed b
y C
abin
et in
Nov
embe
r 201
7.
•Pr
ior t
o fin
alisa
tion
and
subm
issio
n fo
r Cab
inet
app
rova
l, th
e N
atio
nal
e-St
rate
gy u
nder
wen
t ext
ensiv
e pu
blic
con
sulta
tions
in a
ll 9
Prov
ince
s.
•Fu
rther
mor
e, th
e N
atio
nal
e-St
rate
gy Im
plem
enta
tion
Plan
w
as d
evel
oped
and
app
rove
d in
M
arch
201
8 fo
r im
plem
enta
tion
in
the
2018
/19
finan
cial
yea
r.
--
Dev
elop
and
im
plem
ent
a N
atio
nal
e-St
rate
gy th
at
will
give
prio
rity
to
e-G
over
nmen
t se
rvic
es
Appr
oved
e-
Gov
ernm
ent
Stra
tegy
The
Nat
iona
l e-
Gov
ernm
ent
Stra
tegy
and
Ro
adm
ap (3
-ye
ar e
-ser
vice
s pr
ogra
mm
e) w
as
deve
lope
d.
e-G
over
nmen
t St
rate
gy
appr
oved
•Th
e D
epar
tmen
t ful
ly a
chie
ved
the
targ
et.
•Th
e e-
Gov
ernm
ent S
trate
gy
was
fina
lised
and
app
rove
d by
C
abin
et in
Nov
embe
r 201
7.
•Pr
ior t
o fin
alisa
tion
and
subm
issio
n fo
r Cab
inet
app
rova
l, th
e e-
Gov
ernm
ent S
trate
gy
unde
rwen
t ext
ensiv
e pu
blic
co
nsul
tatio
ns in
all
9 Pr
ovin
ces.
•Fu
rther
mor
e, th
e e-
Gov
ernm
ent
Stra
tegy
Impl
emen
tatio
n Pl
an
was
dev
elop
ed a
nd a
ppro
ved
in
Mar
ch 2
018
for i
mpl
emen
tatio
n in
th
e 20
18/1
9 fin
anci
al y
ear.
--

Strategy to overcome areas of under-performance
The Department achieved all the planned targets for the reporting period and therefore there are no issues to address with regard to under-performance.
Changes to planned targets
There were no changes to the planned targets during the reporting period.
Linking performance with budgets
Spending was R78.5 million for the 2017/18 financial year and R78.8 million in the 2016/17 financial year. There was an underspending of R5.9 million in the 2017/18 financial year largely due to underspending on Consultants, Business and Advisory Services, Travel and Subsistence and Compensation of Employees.
Sub-programme expenditure
Sub- Programme
Name
2017/2018 2016/2017
Final Appropriation
ActualExpenditure
(Over)/Under Expenditure
Final Appropriation
Actual
Expenditure(Over)/Under Expenditure
R’000 R’000 R’000 R’000 R’000 R’000
ICT Policy Development 11 373 10 045 1 328 15 326 12 491 2 835
Economic and Market Analysis 8 737 8 727 10 4 901 3 468 1 433
Research 8 876 6 923 1 953 6 998 6 912 86
Information Society Development 46 477 43 819 2 658 51 673 46 138 5 535
Capacity Development 9 055 9 010 45 9 877 9 485 392
Total 84 518 78 524 5 994 88 775 78 494 10 281
page 53

page 54
4.4 Programme 4: ICT Enterprise Development and SOE Oversight
The purpose of Programme 4 is to oversee and manage Government’s shareholding interest in ICT public entities and to facilitate growth and development of Small, Medium and Micro Enterprises (SMMEs) in the ICT sector.
The ICT Enterprise Development and SOE Oversight Programme consists of the following sub-programmes:
– Public Entity Oversight provides oversight relating to State Owned Companies by managing Government’s shareholder interest in public enterprises to support the attainment of key national goals and strategic priorities;
– Small, Medium and Micro Enterprise (SMME) Development facilitates the growth and development of ICT SMMEs; and
– ICT Support oversees and manages transfers to public entities and State Owned Companies responsible for the management and protection of South Africa’s ICT environment.
The Strategic Objectives for the 2017/18 financial year are listed below:
– Improve performance of SOCs through proactive and stringent oversight.

Stra
teg
ic o
bje
ctiv
es,
pe
rfo
rma
nce
ind
ica
tors
, pla
nne
d t
arg
ets
and
ac
tua
l ac
hie
vem
ent
s
Pro
gra
mm
e 4
: IC
T En
terp
rise
De
velo
pm
ent
and
SO
E O
vers
ight
STRA
TEG
IC
OBJ
ECTI
VES
PERF
ORM
ANC
E IN
DIC
ATO
R
ACTU
AL
ACHI
EVEM
ENT
2016
/17
PLAN
NED
TAR
GET
20
17/1
8
ACTU
AL A
CHI
EVEM
ENT
2017
/18
DEV
IATI
ON
FRO
M
PLAN
NED
TAR
GET
TO
AC
TUAL
AC
HIEV
EMEN
T FO
R 20
17/1
8C
OM
MEN
T O
N
DEV
IATI
ON
S
Impr
ove
perfo
rman
ce o
f SO
Cs
thro
ugh
proa
ctiv
e an
d st
ringe
nt o
vers
ight
Appr
oved
man
date
s fo
r Sta
te IT
Com
pany
an
d St
ate
ICT
Infra
stru
ctur
e C
ompa
ny
•Th
e D
epar
tmen
t de
velo
ped
Asse
ssm
ent
Repo
rts o
n Ra
tiona
lisat
ion
of
BBI,
SITA
, SEN
TEC
H an
d SA
PO.
•Al
l SO
C
ratio
nalis
atio
n as
sess
men
t re
ports
wer
e co
nsol
idat
ed
to d
evel
op th
e C
onso
lidat
ed
Asse
ssm
ent
Repo
rt on
SO
C
ratio
nalis
atio
n.
Impl
emen
tatio
n of
the
SOC
Ra
tiona
lisat
ion
Repo
rt fo
cusin
g on
the
Stat
e IC
T In
frast
ruct
ure
Com
pany
and
Sta
te
IT C
ompa
ny
•Th
e D
epar
tmen
t ful
ly a
chie
ved
the
targ
et o
f im
plem
entin
g th
e SO
C R
atio
nalis
atio
n Re
port
focu
sing
on th
e St
ate
ICT
Infra
stru
ctur
e C
ompa
ny a
nd
Stat
e IT
Com
pany
.
•D
urin
g th
e fir
st q
uarte
r of t
he
repo
rting
per
iod,
the
SOC
Ra
tiona
lisat
ion
repo
rt w
as
final
ised.
•St
emm
ing
from
the
reco
mm
enda
tions
of t
he S
OC
Ra
tiona
lisat
ion
repo
rt, th
e M
anda
tes
for t
he n
ew S
tate
IT
Com
pany
and
the
new
Sta
te
ICT
Infra
stru
ctur
e C
ompa
ny w
ere
deve
lope
d an
d su
bmitt
ed to
C
abin
et fo
r app
rova
l.
--
page 55

page 56
STRA
TEG
IC
OBJ
ECTI
VES
PERF
ORM
ANC
E IN
DIC
ATO
R
ACTU
AL
ACHI
EVEM
ENT
2016
/17
PLAN
NED
TAR
GET
20
17/1
8
ACTU
AL A
CHI
EVEM
ENT
2017
/18
DEV
IATI
ON
FRO
M
PLAN
NED
TAR
GET
TO
AC
TUAL
AC
HIEV
EMEN
T FO
R 20
17/1
8C
OM
MEN
T O
N
DEV
IATI
ON
S
Impr
ove
perfo
rman
ce o
f SO
Cs
thro
ugh
proa
ctiv
e an
d st
ringe
nt o
vers
ight
Cor
pora
tised
Po
stba
nk-
Cor
pora
tisat
ion
of
the
Post
bank
and
lic
ensin
g fa
cilit
ated
•Th
e D
epar
tmen
t ful
ly a
chie
ved
the
targ
et.
•D
urin
g th
e fir
st q
uarte
r of t
he
repo
rting
per
iod
the
Min
ister
ap
poin
ted
the
Post
bank
Boa
rd
mem
bers.
•Th
e D
epar
tmen
t fin
alise
d th
e pr
efer
red
optio
n fo
r the
Ban
k C
ontro
lling
Com
pany
.
•W
ith re
gard
s to
the
licen
sing
of
the
Post
bank
, the
Dep
artm
ent
faci
litat
ed th
e ap
plic
atio
n fo
r th
e lic
ensin
g of
the
Post
bank
an
d en
gage
d ac
cord
ingl
y w
ith
the
Sout
h Af
rican
Res
erve
Ban
k (S
ARB)
.
•Fu
rther
mor
e, th
e D
epar
tmen
t fa
cilit
ated
and
mon
itore
d th
e de
velo
pmen
t of t
he P
ostb
ank
prod
uct a
nd s
ervi
ces
offe
rings
.
--

page 57
STRA
TEG
IC
OBJ
ECTI
VES
PERF
ORM
ANC
E IN
DIC
ATO
R
ACTU
AL
ACHI
EVEM
ENT
2016
/17
PLAN
NED
TAR
GET
20
17/1
8
ACTU
AL A
CHI
EVEM
ENT
2017
/18
DEV
IATI
ON
FRO
M
PLAN
NED
TAR
GET
TO
AC
TUAL
AC
HIEV
EMEN
T FO
R 20
17/1
8C
OM
MEN
T O
N
DEV
IATI
ON
S
Impr
ove
perfo
rman
ce o
f SO
Cs
thro
ugh
proa
ctiv
e an
d st
ringe
nt o
vers
ight
4 qu
arte
rly S
tate
of
SOC
Rep
orts
on
the
leve
l of p
erfo
rman
ce
and
com
plia
nce
of
SOC
s
Perfo
rman
ce a
nd
com
plia
nce
of S
OC
s ag
ains
t stra
tegi
c pl
ans
and
rele
vant
pr
escr
ipts
wer
e m
onito
red
and
eval
uate
d th
roug
h th
e de
velo
pmen
t of
cons
olid
ated
Sta
te
of S
OC
s re
ports
for
quar
ter f
our o
f the
20
15/1
6 fin
anci
al
year
as
wel
l as
for
quar
ters
one
, tw
o an
d th
ree
of th
e 20
16/1
7 fin
anci
al
year
.
Serv
ice
deliv
ery
perfo
rman
ce a
nd
com
plia
nce
of S
OC
ag
ains
t stra
tegi
c pl
ans
and
rele
vant
pr
escr
ipts
mon
itore
d an
d ev
alua
ted
and
quar
terly
sta
te o
f th
e SO
Cs
repo
rts
deve
lope
d
•Th
e D
epar
tmen
t ful
ly a
chie
ved
the
targ
et.
•In
an
effo
rt to
mon
itor a
nd
eval
uate
the
Serv
ice
deliv
ery
perfo
rman
ce a
nd c
ompl
ianc
e of
SO
Cs
agai
nst s
trate
gic
plan
s an
d re
leva
nt p
resc
ripts
th
e C
onso
lidat
ed Q
uarte
rly
Stat
e of
the
SOC
s Re
ports
wer
e de
velo
ped
and
subm
itted
to
the
Min
ister
.
•Fu
rther
mor
e, q
uarte
rly J
oint
Pe
rform
ance
Rev
iew
mee
tings
w
ere
held
with
Chi
ef E
xecu
tive
Offi
cers
of t
he S
OC
s an
d th
e D
epar
tmen
tal E
xecu
tive
Com
mitt
ee (D
EC) t
o ad
dres
s iss
ues
of p
erfo
rman
ce a
gain
st
plan
s.
--

Strategy to overcome areas of under-performance
The Department achieved all the planned targets for the reporting period and therefore there are no issues to address with regard to under-performance.
Changes to planned targets
There were no changes to the planned targets during the reporting period.
Linking performance with budgets
Spending was R 3.9 billion in the 2017/18 financial year and R882.4 million in the 2016/17 financial year. The increase was mainly in Payment for Financial Assets of R 3.7 billion in the 2017/18 financial year paid to the South African Post Office for recapitalisation.
Sub-programme expenditure
Sub- Programme
Name
2017/2018 2016/2017
Final Appropriation
ActualExpenditure
(Over)/Under Expenditure
Final Appropriation
Actual
Expenditure(Over)/Under Expenditure
R’000 R’000 R’000 R’000 R’000 R’000
Public Entity Oversight 3 937 113 3 937 113 - 872 547 869 830 2 717
Small, Medium and Macro Enterprise Development 5 134 4 430 704 5 797 4 427 1 370
ICT Support 8 041 7 513 528 8 264 8 096 168
Total 3 950 288 3 949 056 1 232 886 608 882 353 4 255
page 58

page 59
4.5 Programme 5: ICT Infrastructure Support
The purpose of Programme 5 is to promote investment in robust, reliable, secure and affordable ICT infrastructure that supports the provision of a multiplicity of applications and services.
The ICT Infrastructure Support Programme consists of the following sub-programmes:
- Broadband is responsible for developing and facilitating the implementation of the Broadband Policy, Strategy and Implementation Plan as well as ensuring that broadband goals are achieved; and
- Digital Terrestrial Television is responsible for the conversion from analogue to digital television transmission technology with the ultimate goal of releasing valuable frequency spectrum for next generation mobile broadband and other applications.
The Strategic Objective for the 2016/17 Financial Year is listed below:
- Coordinate Broadband connectivity to achieve 100% population coverage; and
- Develop and implement ICT Policy and legislation aimed at improving access and affordability of ICTs.

Stra
teg
ic o
bje
ctiv
es,
pe
rfo
rma
nce
ind
ica
tors
, pla
nne
d t
arg
ets
and
ac
tua
l ac
hie
vem
ent
s
Pro
gra
mm
e 5
: IC
T In
fra
stru
ctu
re S
upp
ort
STRA
TEG
IC
OBJ
ECTI
VES
PERF
ORM
ANC
E IN
DIC
ATO
R
ACTU
AL
ACHI
EVEM
ENT
2016
/17
PLAN
NED
TAR
GET
20
17/1
8AC
TUAL
AC
HIEV
EMEN
T 20
17/1
8
DEV
IATI
ON
FRO
M
PLAN
NED
TAR
GET
TO
AC
TUAL
AC
HIEV
EMEN
T FO
R 20
17/1
8C
OM
MEN
T O
N
DEV
IATI
ON
S
Coo
rdin
ate
Broa
dban
d co
nnec
tivity
to
achi
eve
100%
po
pula
tion
cove
rage
Num
ber o
f id
entif
ied
gove
rnm
ent
insti
tutio
ns
conn
ecte
d
The
Dep
artm
ent
revie
wed
diff
eren
t pr
ocur
emen
t op
tions
whi
ch
incl
uded
the
utilis
atio
n of
the
capa
city
of I
CT
Stat
e-O
wne
d En
titie
s.
Proj
ect M
anag
e th
e ro
ll-ou
t of
the
Broa
dban
d C
onne
ctivi
ty
Impl
emen
tatio
n Pl
an P
hase
1
tow
ards
con
nect
ing
2700
iden
tifie
d sit
es
•Th
e D
epar
tmen
t did
not
fully
ac
hiev
e th
e se
t tar
get o
f Pr
ojec
t Man
agin
g th
e ro
ll-ou
t of
Bro
adba
nd C
onne
ctivi
ty
Impl
emen
tatio
n Pl
an P
hase
1
tow
ards
con
nect
ing
2700
id
entif
ied
sites
.
•D
urin
g th
e re
porti
ng p
erio
d th
e D
epar
tmen
t for
mal
ly m
anda
ted
the
Stat
e O
wne
d C
ompa
nies
(SITA
and
Br
oadb
and
Infra
co) t
o ro
ll-ou
t Ph
ase
1 of
SA
conn
ect.
In
this
rega
rd, a
Trip
artit
e M
aste
r Se
rvic
es A
gree
men
t was
sig
ned
betw
een
DTP
S, S
ITA
and
BBI.
•Th
e D
epar
tmen
t iss
ued
a G
over
nmen
t ord
er to
SITA
for
the
conn
ectio
n of
63
and
addi
tiona
l 194
site
s w
hile
a
seco
nd G
over
nmen
t Ord
er
was
issu
ed to
BBI
for t
he
conn
ectio
n of
313
site
s.
•D
raft
MoU
bet
wee
n D
TPS
and
DBS
A is
near
fina
lisat
ion.
Und
er
this
MoU
, DBS
A w
ill co
nduc
t a
com
preh
ensiv
e fe
asib
ility
study
to d
evel
op a
ban
kabl
e fu
ndin
g pr
opos
al fo
r SA
Con
nect
Pha
se 2
.
The
Dep
artm
ent w
as
unab
le to
con
nect
the
num
ber o
f ide
ntifie
d go
vern
men
t Ins
titut
ion
as
plan
ned.
•Th
e br
oadb
and
roll-
out w
as
dela
yed
larg
ely
due
to in
abilit
y of
th
e D
epar
tmen
t to
fina
lise
the
appo
intm
ent o
f im
plem
entin
g ag
ents
beca
use
of e
xten
sive
cons
ulta
tions
w
ith th
e N
atio
nal
Treas
ury.
•Fu
rther
mor
e, th
e sig
ning
of M
SA
betw
een
the
Dep
artm
ent a
nd
the
impl
emen
ting
agen
ts as
wel
l as
the
deve
lopm
ent
of im
plem
enta
tion
(infra
struc
ture
ro
ll-ou
t) pl
ans
took
long
er th
an
antic
ipat
ed.
page 60

STRA
TEG
IC
OBJ
ECTI
VES
PERF
ORM
ANC
E IN
DIC
ATO
R
ACTU
AL
ACHI
EVEM
ENT
2016
/17
PLAN
NED
TAR
GET
20
17/1
8AC
TUAL
AC
HIEV
EMEN
T 20
17/1
8
DEV
IATI
ON
FRO
M
PLAN
NED
TAR
GET
TO
AC
TUAL
AC
HIEV
EMEN
T FO
R 20
17/1
8C
OM
MEN
T O
N
DEV
IATI
ON
S
Coo
rdin
ate
Broa
dban
d co
nnec
tivity
to
achi
eve
100%
po
pula
tion
cove
rage
Ope
ratio
nal V
irtua
l C
yber
secu
rity
Hub
-O
pera
tions
of t
he
Virtu
al C
yber
secu
rity
Hub
faci
litate
d an
d m
onito
red
•Th
e D
epar
tmen
t ful
ly ac
hiev
ed th
e ta
rget
.
•D
urin
g th
e re
porti
ng p
erio
d th
e D
epar
tmen
t fac
ilitat
ed
the
Ope
ratio
ns o
f the
Vi
rtual
Cyb
erse
curit
y Hu
b an
d de
velo
ped
quar
terly
m
onito
ring
repo
rts in
this
rega
rd.
--
Dev
elop
and
im
plem
ent
ICT P
olic
y an
d le
gisla
tion
aim
ed a
t im
prov
ing
acce
ss
and
affo
rdab
ility
of
ICTs
Appr
oved
pr
elim
inar
y Te
chni
cal a
nd
Regu
lato
ry
studi
es re
port
in
prep
arat
ion
for
WRC
- 19
•Th
e D
epar
tmen
t to
geth
er w
ith
ICAS
A re
view
ed
and
upda
ted
the
NRF
P ta
king
into
co
nsid
erat
ion
the
outc
omes
of
WRC
-15.
•In
dev
elop
ing
the
plan
the
Dep
artm
ent
took
into
co
nsid
erat
ion
the
ICT W
hite
Pap
er,
SA C
onne
ct, D
TT
Polic
y an
d ot
her
rele
vant
pol
icie
s.
Prel
imin
ary
tech
nica
l and
re
gula
tory
stu
dies
co
nduc
ted
to
info
rm D
raft
SA’s
posit
ion
for W
RC-1
9
•Th
e D
epar
tmen
t ful
ly ac
hiev
ed th
e se
t tar
get
with
rega
rds
to c
ondu
ctin
g pr
elim
inar
y te
chni
cal a
nd
regu
lato
ry s
tudi
es to
info
rm
the
draf
t SA’
s po
sitio
n fo
r WRC
-19
.
•Pr
elim
inar
y Te
chni
cal a
nd
Regu
lato
ry s
tudi
es w
ere
cond
ucte
d an
d an
app
rove
d te
chni
cal a
nd re
gula
tory
stu
dies
repo
rt, w
ith m
etho
ds
and
a pr
elim
inar
y dr
aft S
A po
sitio
n, in
pre
para
tion
for
WRC
-19
was
dev
elop
ed.
•Fu
rther
mor
e, th
e SA
pr
elim
inar
y po
sitio
n w
as
subm
itted
at S
ADC
dur
ing
the
2nd
SAD
C m
eetin
g in
Zam
bia
and,
sub
mitt
ed a
s pa
rt of
SA
DC
to th
e AT
U W
orkin
g Pa
rty
in J
uly
2017
as
wel
l as
at 2
nd
ATU
mee
ting
in S
eneg
al.
--
page 61

Strategy to overcome areas of under performance
The Department acknowledges its under-performance with regard to the target related to broadband connectivity. The challenge was largely due to delays with regards to the appointment of the service provider as well as funding constraints which impacted on the delivery of the targets. However, as a strategy to overcome the area of under-performance, the Department has issued a Government order to SITA for the connection and a second Government Order was issued to BBI for the connection. Furthermore, the Department is conducting a comprehensive feasibility study to develop a bankable funding proposal for SA Connect Phase 2.
Changes to planned targets
There were no changes to the planned targets during the reporting period.
Linking performance with budgets
Spending was R604.4 million in the 2017/18 financial year and R856.3 million in the 2016/17 financial year. The underspending of R273.8 million in the 2017/18 financial year against the allocation of R878.2 million was mainly due to delays in the implementation of the Broadband project.
Sub-programme expenditure
Sub- Programme
Name
2017/2018 2016/2017
Final Appropriation
ActualExpenditure
(Over)/Under Expenditure
Final Appropriation
Actual Expenditure
(Over)/Under Expenditure
R’000 R’000 R’000 R’000 R’000 R’000
Broadband 313 147 39 313 273 834 346 893 26 935 319 958
Digital Terrestrial Television 565 098 565 098 - 829 384 829 384 -
Total 878 245 604 411 273 834 1 176 277 856 319 319 958
page 62

5. TRANSFER PAYMENTS5.1 Transfer payments to public entities
Name of Public Entity
Services rendered by the public entity
Amount transferred to
the public entity
Amount spent by the public
entity
Achievements of the public entity
NEMISA To provide a national integrated e-skills development management system towards sustainable socio-economic development in South Africa
R85.8 million R84.8 million 4 322 e-literacy leaders trained;
686 ICT practitioners trained;
1 710 sector users trained;
165 e-learners trained
NEMISA’s In-house training division provided broadcasting courses, including NQF Level 4 & 5, to South TV which disseminates its content to local communities through WhatsApp.
SAPO To provide postal and financial services
R3.9 billion R3.7 billion An amount of R3.7 billion was utilised to settle the long-term loan. SAPO registered 280 553 DTT beneficiaries and 174 713 DTT set top boxes were issued from October 2017 to March 2018
USAASA To promote universal service and access in underserviced areas
R75.7 million
R27.4 million (roll over from 2016/17 financial year)
R159.5 million
*Expenditure exceeded transfer due to utilisation of the rolled-over funds from the FY 2016/17 to cover the shortfall incurred in the current financial year
SAP/ERP system supported for USAASA/USAF business processes and operations.
Completion of quarterly risk management activities as per the approved risk management plan.
page 63

page 64
Name of Public Entity
Services rendered by the public entity
Amount transferred to
the public entity
Amount spent by the public
entity
Achievements of the public entity
USAF USAF utilised the contributions from licensees exclusively for payment of subsidies to needy persons, undeserved areas and schools.
To provide incentives to network licensees to construct and maintain networks in underserviced areas.
R133.7 million
R29.5 million (roll over from 2016/17 financial year)
R271.8 million
*Expenditure exceeded transfer due to utilisation of the rolled-over funds from the FY 2016/17 to cover for the shortfall incurred in the current financial year.
- Rolled-out broadband infrastructure at OR Tambo and UMgungundlovu District Municipalities as follows:
- At Nyandeni Local Municipality a total of 212 sites have been rolled-out which includes 30 primary health facilities, 150 public education institutions, 10 public institutions, 2 municipal offices and 20 Wi-Fi hotspots.
- At Impendle Local Municipality a total of 61 sites have been rolled-out which includes 5 primary health facilities, 30 public education institutions, 5 public institutions, 1 municipal office and 20 Wi-Fi hotspots.
- 103 680 set-top boxes and antennae were distributed to qualifying needy TV- owning households.
SENTECH To provide common carrier broadcasting signal distribution services to licensed broadcasters in South Africa.
R246 million R180 million SENTECH continued to support the dual illumination broadcast phase until the digital migration process is resolved.

5.2 Transfer payments to all organisations other than public entities
The table below reflects the transfer payments made for the period 1 April 2017 to 31 March 2018.
Name of transferee
Type of organisation
Purpose for which the funds were
used
Did the Dept.
comply with s38 (1) (j) of the PFMA
Amount transferred
(R’000)
Amount spent by the entity
Reasons for the funds
unspent by the entity
African Telecom-munications Union (ATU)
Continental ICT Organisation
Membership fees
yes 1 006 1 006 -
Universal Postal Union (UPU)
Global Postal Organisation
Membership fees yes 5 522 5 522 -
Pan African Postal Union (PAPU)
UN Specialised Organisation (Postal)
Membership fees
yes 1 031 1 031 -
International Tele-communications Union (ITU)
UN Specialised ICT Organisation
Membership fees
yes 16 816 16 816 -
Commonwealth Telecommunica-tion Organisation (CTO)
International ICT Organisation for Commonwealth members
Membership fees
yes 426 426 -
Organisation for Economic Cooperation and Development (OECD)
Continental ICT Organisation
Membership fees
yes 158 158 -
DONA Foundation International Organisation
Membership fees yes 1 005 1 005 -
TOTAL 25 964 25 964
The table below reflects the transfer payments which were budgeted for in the period 1 April 2017 to 31 March 2018, but no transfer payments were made.
Name of transferee
Purpose for which the funds were to
be used
Amount budgeted for
(R’000)
Amount transferred
(R’000)
Reasons why funds were not
transferred
None
page 65

6. CONDITIONAL GRANTS 6.1 Conditional grants and earmarked funds paid
The Department does not have conditional grants.
6.2 Conditional grants and earmarked funds received
The Department does not have conditional grants.
7. DONOR FUNDS 7.1 Donor Funds Received
The Department received donations as per the table below in the 2017/18 financial year.
Name of Organisation Nature of Gift, Donation or Sponsor Amount
ICASA Hosting of the SADC SCOM meeting, 19-22 June 2017 - 20 gift bags, 20 conference diaries and 20 memory sticks as ICASA promotional items -
Huawei Sponsored training seminar by Huawei: Construction and development of submarine optical cable for Asian and “Maritime Silk road” countries, 20 June – 10 July, China (Huawei covered the cost of flights, accommodation and daily allowance of ¥87 per day) -
Huawei Sponsored training seminar by Huawei: Seminar on Safe City Development for African English speaking Countries, 7 – 27 June, China (Huawei covered the cost of flights, accommodation and daily allowance of ¥87 per day) -
Vodacom Sponsored Ministerial Roundtable working dinner on 5 September 2017 250 000
China Telecom Global Sponsored training seminar by China Telecom Global: Development of Information and Telecommunication Technology for Developing Countries, 10 July - 8 August 2017 (China Telecom covered the cost of flights, accommodation and daily allowance of ¥80 per day) -
Telkom SA Bags, exhibition, promotional material, 25 x ushers and golf shirts 950 000
Sentech 16 x ministerial cars and branding of vehicles 100 000
ZACR/.Africa Transport for delegates and branding of vehicles 100 000
ICASA Uniform for officials shirts, head-wraps, bowties 20 000
Multichoice 150 DSTV Wi-Fi routers -
Vodacom Meeting on roaming: gala dinner 5 September, décor, scarfs for 10 ushers and 5 protocol team 250 000
MTN Internet café: 2 x laptops, Wi-Fi connection, 1 x printer -
page 66

page 67
Name of Organisation Nature of Gift, Donation or Sponsor Amount
Brand SA Notebooks, pens paper bags, folders -
Liquidtelecom Cocktail dinner 4 September, décor, entertainment, solar power banks, scarfs, golf shirts for ushers and team DTPs 250 000
USAASA 20 umbrellas for ministers and VVIPs -
NEMISA Video conferencing -
Huawei Gala dinner and entertainment 07 September
- Venue including menu
- Décor and equipment
- Golf T-shirt
- Lanyards
- Background wall
- 20 x ushers (3-7 Sep 2017)
- Programme Director & DJ
- 25 tables @ R2 500 each
- 50 x power set @ R350 each
168 559
88 355
25 000
9 000
30 000
75 000
26 000
62 500
17 000
Golf day – 5 September
- Branded golf T-shits
- Caps
- 38 x cooler bags with snacks and drinks
- Cocktail and drinks
- Prizes for winners 70 000
Subtotal 2 242 164

page 68
8. CAPITAL INVESTMENT
8.1 Capital investment, maintenance and asset management plan
No Capital investments were made or maintained by the Department of Telecommunications and Postal services.
The Department maintained an updated and accurate Asset Register which adheres to the requirements of National Treasury, and the Departmental Asset Acquisition, Maintenance and Disposal Plan were also updated and revised.
Due to a proper asset management strategy of replacing and disposing of old and redundant equipment that no longer supports effective service delivery, the Department reduced its assets holdings in the period under review.
Assets that could not be cost effectively repaired or refurbished were disposed of by means of auctioning to DTPS staff, donation to schools and scrapping in an environmentally friendly manner.
All asset theft and losses were dealt with in line with departmental policy on the management of losses. During the period under review all losses due to theft were investigated and recommendations were made whether to recover the loss or to write it off. The number of losses due to theft were relatively low. All losses were removed from the asset register after authorisation was obtained.
New asset additions are updated automatically when invoices are captured for payment, all new assets are barcoded before distribution and the asset locations were also updated when the responsible official received the asset.
Annual assets verification was undertaken to ensure that all changes in the asset register are updated and that the responsible officials sign for their inventories as asset owners. During the year ad-hoc stock takes were undertaken when the need arose.
Asset reconciliation is done on a monthly as well as on a quarterly basis for the Interim Financial Statement to ensure that all asset acquisitions and disposals are accounted for. All asset classifications are checked to ensure correctness.
A physical verification of all assets was done to determine the condition of assets that need to be replaced, maintained or disposed of from the asset register.
The following reflects the current state of the Department’s capital stock:
– Good condition: 79%
– Fair condition: 17%
– Bad condition: 4%
There were no major maintenance projects undertaken during the financial year under review. The maintenance and repairs done were due to normal wear and tear of assets and maintenance cost was mainly due to the aging fleet. Three-year service warranties are included when acquiring new assets from suppliers.

page 69
PART C GOVERNANCE

1. INTRODUCTIONThe Department is committed to maintaining the highest standards of governance and recognises the need for good governance to ensure the following:
– Convergence of the work of different programmes to implement the mandate of the Department.
– Alignment of different functions aimed at achieving similar outcomes, to alleviate duplication and resource wastage.
– Institutionalisation of an ethical and compliant culture to circumvent fraud, corruption and the abuse of State resources.
– Accountable management, monitoring and reporting on the implementation of commitments detailed in the Strategic Plan and Annual Performance Plan of the Department.
The Department has an approved framework that establishes the governance structures and comprehensively articulate the terms of reference of each structure. The effective and full implementation of the framework is being pursued in the current financial year. The following governance structures are in place:
– Executive Committee (EXCO). EXCO meetings are attended by the Minister (Chairperson), Deputy Minister, Director-General and Deputy Directors-General (DDGs). The EXCO deals with strategic policy issues that form the basis for the Executive Authority’s engagement with Cabinet, Parliament and other key stakeholders. Meetings were held by the Executive Authority with the Department’s executives to provide strategic direction on key projects as well as Parliamentary and Cabinet related matters.
– Departmental Executive Committee (DEC). DEC meetings are attended by the Director-General (Chairperson) and DDGs. The DEC monitors the implementation of the Department’s Strategic Plan and addresses constraints relating to the implementation thereof. Its main role involves processing and providing direction and guidance on the implementation of strategic objectives. The Chief Audit Executive and the Director: Risk Management attend as ex-officio members. Twenty-two (22) DEC meetings were held during the 2017/18 financial year.
– Top Management Committee (TMC). TMC meetings are attended by the Director-General (Chairperson), DDGs, Chief Directors and Directors. TMC monitors the implementation and reporting on the Department’s Annual Performance Plan and identifies constraints that require decisions and resolution by the DEC. The Chief Audit Executive and the Director: Risk Management attend as ex-officio members. Four (4) TMC meetings were held during the 2017/18 financial year.
– Operations Committee (OPSCOM). Opscom meetings are attended by the DDG: Administration (Chairperson), Director: HRA, Director: HRD, Chief Financial Officer, Acting Chief Director: Communications, Chief Information Officer, Compliance Officer, Chief Director: SPM and representatives from each line branch. The Chief Audit Executive and the Director: Risk Management attend as ex-officio members. OPSCOM is responsible for the management of the Department’s internal Policy Register, ensuring that all internal operations policies that are due for review are reviewed and that changes are effected to comply with legislative and other changes that support the objectives of the Department to ensure an aligned and supportive policy environment. OPSCOM convened four (4) meetings in the 2017/18 financial year.
page 70

2. RISK MANAGEMENT
2.1 Risk Management Approach
The Department uses the Top-Down Risk Management approach and assesses, manages and reports on all significant risks and related mitigation plans consistently, in line with its defined risk management and reporting protocols. The approach fosters the management of risks from Top Management (Executive and Senior Management Level managing strategic risks) to (Middle Management Service MMS Level managing operational risks) within respective branches.
2.2 Risk Management Policy and Strategy.
The Risk Management Directorate updated the Risk Management Framework (Policy, Strategy, Risk Assessment and Identification Methodology and Implementation Plan). These documents were presented to and approved by the Operations Committee, the Risk and Ethics Committee and signed-off by the Accounting Officer during the period under review.
The approved Risk Appetites and Tolerance Framework is used to measure the level of acceptable risks throughout the Department. A risk strategy ensures effective implementation of risk management systems and processes.
The approved Departmental Risk Appetite and Tolerance Levels have assisted with the determination of the points at which risks are considered significant and require mitigations to be implemented to manage the risk exposures to acceptable levels.
2.3 Risk Aware Culture
There are various processes to ensure the commitment of the entire Department e.g. risk awareness workshops throughout the Department, risk management posters, brochures and suggestion boxes in all the Department’s premises, displaying risk management messages in all the departmental monitors and uploading of enabling documents in the intranet for ease of access by all employees.
2.4 Risk Management Structure
Risk Management Directorate comprises two officials: Director and Deputy Director.
2.5 Risk Assessments
A Top Down Approach to risk assessments is followed which requires strategic risk assessment to be completed first and thereafter operational risks assessment on the basis of the risks and appetite levels identified and assessed at the strategic level.
The 2017/18 strategic and operational risks assessments were completed on time with relevant reports presented to Departmental Executive and Risk and Ethics Committees for consideration and approval, the Audit Committee for noting and the Accounting Officer for sign-off.
page 71

2.6 Management of risks
Management of both strategic and operational risks and the implementation of the respective risk mitigation plans were monitored on a quarterly basis. Progress reports were compiled and presented on a quarterly basis to the Departmental Executive Committee (DEC), Risk and Ethics Committee (REC) and Audit Committee (AC).
Strategic Risk Management
The Department has identified and managed 13 strategic and 67 operational risks during the 2017/18 financial year. Although the Department developed and implemented controls to manage these risks to acceptable risk appetite levels, it was not successful in managing all these risks to acceptable levels with some of the root causes being impacted by factors outside the Department’s control. The following were the main factors that led to the Department not being able to manage some risks to acceptable risk appetite levels:
a) Budgetary constraints due to the general Government expenditure reduction measures. This had a significant impact on the Broadband Connectivity project;
b) Capacity constraints due to insufficient allocation for Compensation of Employees (COE);
c) Lack of Standard Operating Procedures (SOPs);
The Department has developed risk mitigation measures for both the strategic and operational risk indicated above and its implementation is monitored by the Departmental Executive Committee, the Risk and Ethics Committee and the Audit Committee.
2017/18 strategic and operational risk registers inclusive of risk mitigation plans have been signed-off by the respective Risk Owners (DDGs of the relevant Branches).
Challenges were experienced with the management of risks in some areas in the 2017/18 financial year. Actions are in place to address these challenges to ensure improved management of risks in the 2018/19 financial year. The following were the key challenges:
Challenge Action plan
1. Delays in finalising operational, fraud and project risk registers due to unavailability of relevant officials and capacity constraints in the Risk Management Directorate.
Key project risk assessments have been planned for and commenced with in Q1 of 2018/19:
1) Broadband;
2) Organisational structure; and
3) ITU Telecom World 2018.
Fraud and operational will also be monitored and updated on a quarterly basis to ensure timely completion in future years.
2. Delays in the procurement of risk management system due to inadequate budget compared to proposals received.
Decisions will be made to allocate adequate budget for the system that will meet the scope and standards for risk management for procurement in the 2019/20 financial year.
page 72

Challenge Action plan
3. Not able to implement all risk mitigation plans due to inadequate risk bearing capacity (financial and human resources).
Planning and allocation of resources for 2018/19 has been informed by the Department’s risk profile. Further, a robust monitoring of the implementation of the risk mitigation plans will improve the management of the identified risks. This will be followed in future years too.
2.7 Value Add
Risk Management systems and processes have assisted the Department in the achievement of objectives by ensuring that the following are taken into account in the management of the Department’s service delivery mandate:
a) Influencing the strategic planning process – The strategic planning process considered the risk universe of the Department in the development of the 2018/19 Annual Performance Plan and update of mid-term strategic objectives; and
b) Key root causes or challenges have also been considered in the determination of the 2018/19 Annual Performance Plan and update of mid-term strategic objectives, e.g. availability of resources (financial, human and other relevant resources), etc.
Plans to improve the value add include but are not limited to the following:
a) Procurement of a risk management system to modernise the current manual system; and
b) Conducting risk assessments for key projects commencing in the 2018/19 financial year.
2.8 Risk and Ethics Committee (REC)
To ensure the integrity and reliability of the Risk Management processes, the Department has established an REC to assist the Accounting Officer with overseeing the effectiveness of the Department’s risk management systems, practices and procedures and to provide recommendations for improvement.
The Committee is constituted of eight (8) members consisting of one (1) independent non-executive member and seven (7) internal senior management members formally appointed by the Accounting Officer with a blend of skills and knowledge required to address all departmental risk exposures.
On the 31st of October 2017, the contract of the REC Chairperson who was also a member of the Audit Committee expired and was not extended as he was serving for a third (3rd) term. Our Charter allows members to serve for a maximum of 3 terms. The REC is currently chaired by the other independent non-executive member. National Treasury is invited to observe the effectiveness of the REC meetings and provide advice where necessary.
The REC operates in terms of approved terms of reference contained in a Departmental Risk Management Committee Charter. The Risk and Ethics Committee met four (4) times during the year under review and continued to provide objective oversight so as to assist the Accounting Officer in embedding the risk management culture throughout the Department.
page 73

The table below indicates the names of the REC Members and the meetings they have attended during the period under review:
Names DesignationMeetings attended Notes
Adv. C. Weapond Independent Chairperson until 31/10/2017
2 of 2 The member’s contract ended on 31/10/2017.
Ms M. Mokoka Independent Chairperson from 01/11/2017
4 of 4 -
Ms A. Mokgabudi Internal member 3 of 4 -
Mr L. Petzer Internal member 3 of 4 -
Mr F. Osman Internal member 4 of 4 -
Mr M. Ntshingila Internal member 4 of 4 -
Mr M. Sebola Internal member 3 of 4 -
Mr L. Ndlovu Internal member 3 of 4 -
Ms JK Masemola Internal member from 01/11/2017
1of 2 The member replaced Mr Soldaat from the 1st of November 2017.
Mr R. Soldaat Internal member until 31/10/2017
1 of 2 The member was replaced by the CFO (Ms JK Masemola).
Mr E. Adom Internal member until 30 June 2017
n/a Mr Adom retired from the Department on the 30th of June 2017.
2.9 Audit Committee
The Audit Committee of the Department has, during the year under review, independently monitored the effectiveness of risk management throughout the Department and made valuable contributions to the Department’s system of risk management.
The Audit Committee provided oversight responsibility through a number of mechanisms including direct reporting by the Risk Management Directorate to the Audit Committee on progress made in the implementation of risk management systems and processes.
The Chairperson of the Risk and Ethics Committee also served as a member of the Audit Committee which further enhanced and harmonised the Audit Committee’s oversight responsibilities.
page 74

page 75
3. FRAUD AND CORRUPTION
3.1 Fraud Prevention Plan and Implementation
A revised Fraud Prevention Framework (Strategy, Policy, Investigation Procedure, Implementation Plan and Whistle Blowing Policy) was considered and approved by the Operations, Departmental Executive and Risk and Ethics Committees and implemented throughout the year.
3.2 Mechanisms to Report Fraud and Corruption
Fraud Prevention awareness was provided to ensure that all Departmental officials and external stakeholders are aware of the systems and protocols to be followed when reporting any allegations of fraud or corruption. The awareness campaign included, among other things, fraud prevention posters displayed in all the Department‘s premises, fraud content on the Departmental monitors and induction of new employees, etc.
The Department used the National Anti-Corruption Hotline [operated and managed by the Public Services Commission (PSC)] for whistle blowing purposes. Employees were encouraged to report any suspected corrupt, fraudulent, criminal or unethical practices using the Hotline number.
Implementation of the Fraud Prevention Plan was monitored through implementation reports presented to the Risk and Ethics Committee on a quarterly basis reporting cases and actions.
The Risk and Ethics and Audit Committees oversaw the fraud prevention systems and processes within the Department. Cases were reported to these structures on a regular basis for advice and recommendations on the actions be taken. Where officials were convicted, the necessary processes were followed in accordance with the Department’s policies and procedures including disciplinary procedures and/or SIU investigations where warranted.
4. MINIMISING CONFLICT OF INTERESTFinancial disclosures are conducted through the e-Disclosure system provided by the Department of Public Service and Administration and managed by the Public Service Commission.
The Department has duly appointed an Ethics Officer who has successfully coordinated the timely completion, verification and submission of financial disclosures by all SMS and relevant non-SMS officials (Level 11, Level 12 and all levels within Finance and SCM units). The Department achieved a 100% timely submission of financial disclosures.
The Ethics Officer also considered and followed up on findings received from the Public Service Commission regarding non-compliance with the financial disclosures legislation. Appropriate actions are taken on these findings after thorough analysis and investigations of the matters thus reported.
Systems and processes implemented to prevent conflict of interest in SCM include all Bid Committee members signing a code of conduct and declaration of interest; Departmental Bid Adjudication Committee members sign a declaration of interest at each meeting. In a case where a conflict of interest is declared regarding a matter to be

considered, the affected member is requested to recuse themselves from discussions, considerations and decisions on the matter at hand; and SBD 4 Documents are signed by all prospective bidders to ensure that any interest is declared.
5. CODE OF CONDUCTThe Department adheres to the Public Service Code of Conduct contained in the Public Service Regulations, 2016. The Ethics Officer has developed Ethics and Integrity Frameworks (Policy, Strategy and Implementation Plan) that sets the tone with regard to ethics and integrity throughout the Department.
The Department has also developed a Financial Disclosures Policy that sets the principles and standards to be followed during financial disclosures. This policy is aligned to the Public Service Regulations, 2016 which requires for all public servants to comply with regard to ethics, integrity and disclosures.
An awareness programme has been put in place throughout the Department to ensure all officials are aware of their responsibilities regarding ethics and integrity, code of conduct and financial disclosures. The awareness programme included workshops, the display of ethics, integrity and financial disclosures messages on the Department’s monitors and uploading enabling documents on the intranet for ease of access.
The Ethics Officer conducts the relevant investigations on ethics, integrity and financial disclosure non-compliance matters when they are identified. Ethics, integrity and financial disclosure reports are compiled on a regular basis and are presented or submitted to the relevant governance structures (REC, AC, EA, PSC and DPSA). These include quarterly reports on the effectiveness of the implementation of ethics and integrity systems and processes.
6. HEALTH, SAFETY AND ENVIRONMENTAL ISSUESThe Department has a SHERQ (Safety, Health, Environment, Risk and Quality) policy in place which is aimed at the provision of a positive health and safety working environment. Furthermore, the Department has appointed fire marshals who are due to undergo training to equip them to execute their assigned duties. A draft Emergency Execution Plan has been developed. The City of Tshwane Disaster and Fire Department has yet to be consulted to approval.
page 76

7. PORTFOLIO COMMITTEES
7.1 Date and subject of briefing to the Portfolio Committee
MEETING DATE: SUBJECT MATTER
2 May 2017 Briefing by Department on its Strategic Plan and Annual Performance Plan (APP)
17 May 2017 Briefing by Department on Broadband roll-out (update)
23 May 2017 Briefing by the Department on its ICT White Paper Policy
13 June 2017 Briefing by the Department on a progress report on SA Connect
15 August 2017 Briefing by the Department on its 3rd Quarter performance
22 August 2017 Briefing by the Department on Cybersecurity, e-Government, national e-Strategy and SMME strategy
5 September 2017 Briefing by the Department on Rationalisation of ICT SOCs and its impact on broadband rollout
3 October 2017 Briefing by the Department on 2016/17 Annual Report
10 October 2017 Briefing by the Department on proposed legislation emanating from National Integrated ICT Policy White Paper
31 October 2017 Briefing by the Department on Cost to Communicate and Spectrum licensing
07 November 2017 Briefing by the Department on Communications Infrastructure Rapid Deployment: Department briefing, with Minister
20 February 2018 Briefing by the the Department on Quarter 1 & 2 performance
27 February 2018 Briefing by the Department on the National e-Strategy and e-Government Strategy implementation
13 March 2018 Briefing by the Department on ICT SMME Development Strategy implementation and Cost to Communicate update
page 77

During engagements with the Department, the Portfolio Committee made recommendations on several key issues which included the following:
– Cost containment – with a recommendation that the Department must continuously take into account cost containment measures when the Annual Performance Plan and budget is prepared.
– Legislation – with a recommendation that the proposed legislation must include all other proposed policies such as the Rapid Deployment Guidelines. These were quick wins to ensure a rapid turnaround time during the implementation of the broadband network.
– Cost to Communicate – with a recommendation that the Cost to Communicate Report must be considered, prioritised and form part of the operational indicators of the Department.
– Capacity – with a recommendation that sufficient capacity (financial and human resources) must be aligned to the indicators as reflected in the Annual Performance Plan.
– Fourth Industrial Revolution – with a recommendation that the Department must prioritise and specifically focus on initiatives related to the 4th Industrial Revolution.
8. SCOPA RESOLUTIONS
None.
9. PRIOR MODIFICATIONS TO AUDIT REPORTS
Nature of qualification, disclaimer, adverse opinion and
matters of non-complianceFinancial year in which it first arose
Progress made in clearing / resolving the matter
Three quotations not obtained 2015/16 Supply Chain Management processes are centralised to ensure that there is adherence to the correct process during procurement of goods and services
Non-compliance identified in the hygiene and cleaning services tender
2016/17 Documents submitted by suppliers are verified against the Central Supplier Database (CSD) as well as the Companies Intellectual Property Commission (CIPC) system before a tender is awarded. A new evaluation criteria has been developed to ensure that the evaluation of tenders is objective.
No consequence management for irregular expenditure incurred
2016/17 A team was appointed to ensure that all cases of irregular expenditure are addressed.
page 78

Nature of qualification, disclaimer, adverse opinion and
matters of non-complianceFinancial year in which it first arose
Progress made in clearing / resolving the matter
The financial statements submitted for auditing contained material findings
2015/16 A team was established to review the financial statements to ensure that there are no misstatements in the financial statements. It was communicated to all key stakeholders that information submitted for annual financial statements must be signed off by management to ensure credibility and accuracy of the information.
Payment not made to suppliers within 30 days
2010/11 The process to monitor 30 day payments has been strengthened as follows:
A central point to receive invoices has been established and staff equipped with clear procedures when receiving an invoice.
Turnaround times have been set per each milestone of processing the invoice supported by a tracking register where each official sign off receipt and release of the invoice at the milestone.
Internal Audit did not assess transfers made to the public entities.
2016/17 The process of developing the audit plan included assessing the plan to ensure that it is compliant with legislative requirements. The 2017/18 annual internal audit plan included a transfer payment audit.
Irregular expenditure not reported to the National Treasury.
2016/17 The processes in the Finance Unit have been integrated so that compliance matters are reported to National Treasury on a monthly basis.
The Department has an institutionalised process known as the Integrated Action Plan, which is under the leadership of the Chief Financial Officer. It entails consolidating findings from all assurance providers including the Auditor General South Africa, ensuring that a robust process is followed to identify the root causes. Subsequent to the robust root cause analysis an action plan was developed, with emphasis on integrated systematic resolution of the matters raised. The Integrated Action Plan Committee has been put in place to provide strategic support to line managers in terms of tracking progress and addressing thorny issues. The Integrated Action Plan Committee has responsibility for reporting progress made on the implementation of the Integrated Action Plan to OPSCOM and the Department’s Executive Committee. Additionally, progress is reported quarterly to the Audit Committee.
The process outlined above has resulted in significant progress being made on resolving issues.
page 79

10. INTERNAL CONTROL UNITThe Departmental Executive Committee provides monitoring and oversight of the system of internal control of the Department, with independent assurance provided by Internal Audit. The Risk Management process assists with ensuring that management implements internal control measures that mitigate the risks that impact on the achievement of the strategic objectives.
The various branches in the Department take full responsibility for ensuring that internal control measures are institutionalised in each business process and are integrated across the Department. The Administration Branch plays an important role in ensuring that compliance with relevant processes and policies is achieved. The Administration Branch has implemented monitoring and quality assurance assessments that ensures that key processes are adhered to, and management structures such as the Operations Committee Meeting (OPSCOM) provide oversight and manage the policy development process through a register of policies and through ensuring that policies are vetted prior to presentation to the Departmental Executive Committee for final consideration and approval.
The following areas require enhancement as it pertains to internal controls. The Management has commissioned number of initiatives to fast track improvement:
– The System of Performance Management and Development has been subjected to comprehensive review. The Department has appointed an independent service provider to investigate the current PMDS and enhance the system. The Department has developed an action plan to address the recommendations of this investigation, and its implementation is monitored by the governance and management structures.
– Supply Chain Management process, policies and standard operating procedures are being reviewed comprehensively, to ensure that they clearly outline internal control measures that are adequate and effective. The CFO supported by Internal Audit and SCM Staff, is leading this strategic initiative, which is in its final stages.
– Irregular, Fruitless and Wasteful Expenditure processes are enhanced within the SCM review process ensuring that policies and standard operating procedures are adequately addressing the internal controls to prevent, detect and correct the expenditure. The establishment of governance and management structures have been finalised to monitor and track irregular expenditure. An irregular expenditure plan has been developed to address irregular expenditure incurred in the current and previous financial years.
– Development of Standard Operating Procedures and Digitization of critical DTPS business processes have been prioritised. This initiative will ensure effective implementation and monitoring of internal controls across the organisation.
– Project Management – developing comprehensive project plans with milestones, improvement of project risks identification and key strategic projects are incorporated in the monitoring processes of the Departmental Executive Committee.
– The Integrated Action Plan is one of the strategic initiative in place to ensure that the Department implements adequate and effective internal controls. Implementation of the, plan is periodically monitored and reported accordingly.
The following key frameworks are at the initial phase of development and their implementation will further strengthen the governance/control environment of the Department:
page 80

– Integrated Governance Framework – which will outline all the overarching governance principles and seek to adopt formally principles that are embedded in the various leading practice frameworks that are already implemented across the Department.
– Compliance Management and Monitoring Matrix – which seeks to ensure identification of the compliance universe, development of compliance indicators and mapping of the governance and management structures to ensure they are responsible for monitoring compliance.
– Combined Assurance Framework – which will govern the coordination of assurance efforts in the Department ensuring that it contributes to optimal service delivery.
11. INTERNAL AUDIT AND AUDIT COMMITTEES
11.1 Internal Audit
The mandate of Internal Audit is to provide an independent and objective assurance and consulting service designed to add value and to continuously improve the operations of the Department. It should assist the Department to accomplish its objectives by bringing a systematic, disciplined approach to evaluating and improving the effectiveness of Governance, Risk Management and Control processes.
The Internal Audit Unit is established within the DTPS through the PFMA and Treasury Regulations as a key component or structure of good corporate governance. The Internal Audit Unit reports functionally to the Audit Committee and administratively to the Director General. Its activities are governed by an approved Internal Audit Charter. Internal Audit Services are delivered in line with the Institute of Internal Auditors’ International Professional Practice Framework. The following key activities are performed in this regard, contributing to ensuring that there is good corporate governance, which contributes to the Department’s effective delivery of its strategic goals and objectives:
– Assess and make appropriate recommendations for improving the governance processes for:
• Making strategic and operational decisions.
• Overseeing risk management and control.
• Promoting appropriate ethics and values within the organisation.
• Ensuring effective organisational performance management and accountability.
• Communicating risk and control information to appropriate areas of the organisation.
• Coordinating the activities of, and communicating information among, the oversight structures, external and internal auditors, other assurance providers, and management.
– Evaluate the effectiveness of and contribute to the improvement of risk management processes.
– Evaluate the adequacy and effectiveness of controls in responding to risks within the Department’s governance, operations, and information systems regarding the:
• Achievement of the organisation’s strategic objectives.
page 81

page 82
• Reliability and integrity of financial and operational information.
• Effectiveness and efficiency of operations and programme.
• Safeguarding of assets.
• Compliance with laws, regulations, policies, procedures, and contracts.
The graph above depicts the performance of DTPS Internal Audit. The audit engagements completed for the financial year 2017/18 equal 90% of the revised Annual Internal Audit Plan approved by the Accounting Officer. The DTPS Internal Audit had human resource capacity challenges and some client delays in engagements during the financial year that resulted in 10% not being finalised. Gaps in human resource capacity were evident due to the post of Deputy Director Internal Audit being vacant and the temporary incapacity of the Director Internal Audit. The Chief Audit Executive in collaboration with the Human Resource Administration has driven the recruitment process of the Deputy Director Internal Audit in responding to the vacancy and the process is at its final stage. The Director General was requested to approve the process of insourcing capacity. The DPTS Internal Audit will strengthen its project management and client engagement processes going forward to ensure timely finalisation of the Annual Internal Audit Plan.
The overall judgment of the System of Internal Control of the DTPS is based on the finalised audit engagements related to the financial year 2017/18 and Chief Audit Executive interaction with departmental governance and management structures. The DTPS system of internal control is ineffective, taking into account the number of areas that require significant enhancement and the lack of some key frameworks such as an Integrated Governance Framework and an Internal Control Framework to institutionalise the effective implementation of internal controls. The development and documentation of comprehensive operating procedures for all departmental business processes remains a root cause of some control deficiencies identified during audit engagements. Although management has prioritised the digitisation of business processes in the new financial year, a holistic approach should be implemented that will ensure that prior to digitization by the IT Directorate, business processes and standard operating procedures should be
DTPS INTERNAL AUDIT PERFORMANCE30
25
20
15
10
5
0
100%
16%
100%90%
10%
Approved AuditEngagements
17/18
Deferred AuditEngagements
18/19
Revised Approved Audit Engagements
for 17/18
Executed and Finalised Audit Engagements
17/18
Audit Engagements not Finalised

page 83
prioritised and documented across the Department. The records management of the Department need enhancement to ensure that they are managed in compliance with the Archives Framework. Both business processes and records management require appropriate budget allocations in the next budget circle.
However, Management has made some progress in ensuring that certain key frameworks are in place to establish the control environment. This is demonstrated by having developed and approved the following frameworks:
– Strategic Planning, Monitoring and Evaluation Framework, which has contributed significantly to the development of a robust strategy and management of performance information.
– Risk Management Framework, which also assisted in inculcating the culture of risk management; however, review of risk management reveals that the Management and Risk Management Directorates need to work hard to ensure that risk management is embedded into daily operations of the Department, yielding the required strategic value.
– ICT Governance Framework, which enabled the establishment of a sound ICT Governance environment. However, there were deficiencies identified at internal controls level within certain IT business processes.
Management has ensured that operational policies are developed, approved and timeously reviewed through the Operations Committee.
The Integrated Action Plan (IAP) was implemented during the financial year to address all assurance providers’ (Internal Audit; MPAT and AGSA) findings. Management established the Integrated Action Plan Committee to monitor implementation of the IAP; significant work is required to ensure that the agreed integrated action plans are implemented timeously. This is evident from the fact that only 37% of all action plans with agreed timelines were implemented. The Department also developed a Framework for effective consulting on and establishment of governance and management structures, which will be implemented in the new financial year.
The following overall audit opinions substantiate the reported status of internal controls above:
RATING OF THE INTERNAL CONTROLS IN RELATION TO MANAGING THE RISKS
RATING DEFINITION
INADEQUATEAudit results indicate that control procedures are non-existent or poorly designed – not managing risks
INEFFECTIVEAudit results indicate that control procedures are designed; appropriatly, however are not effectively implemented or are not sufficiently effective to mitigate risks
INEFFICIENTAudit results indicate that control procedures need enhancement to effectively mitigate risks
ADEQUATE AND EFFECTIVEAudit results indicate that control procedures are mitigating risks

page 84
AUDIT ENGAGEMENTS OVERALL OPINION
Follow up audit of the Departmental Integrated Action plan INEFFECTIVE
Review of Interim Financial Statements Q1 to Q 3 - 2017/18 INEFFICIENT
Review of Quarterly Performance Report Q1 to Q4 - 2017/18 INEFFICIENT
SOC Oversight – Transfer payments audit INEFFECTIVE
Review of Risk Management Process INEFFECTIVE
Review of the Annual Performance Report 2016/17 INEFFICIENT
Review of the Annual Financial Statements 2016/17 INEFFICIENT
External Network review INEFFECTIVE
Review of DTPS Delegations Framework INEFFECTIVE
Review of The Disaster Recovery and Business Continuity Plan INADEQUATE
Network CORE switch configuration reviews INADEQUATE
Application & General Controls – Electronic Organisational Performance Management System
INADEQUATE
11.2 Audit Committee
Key activities and objectives of the Audit Committee
The Audit Committee is an independent governance structure established in terms of section 76 and 77 of the PFMA, read in conjunction with the Treasury Regulations. Its key function is to provide oversight over the Department with regard to the following:
– Responsibility for the Internal Audit Function as it relates to its effectiveness;
– External Audit function – Auditor General of South Africa (AGSA);
– Departmental financial management processes including – Accounting and Reporting (AFS); Accounting Policies; Expenditure Management;
– Management discharge of their responsibility pertaining to AGSA management and audit report;
– Departmental Risk Management;
– Internal Controls;
– Performance Information;
– Human Resource Management Governance;
– Ethics and Forensic/ Other Investigations; and
– Overall effective governance of the Department by Senior Management.

page 85
The Audit Committee operates in accordance with written terms of reference (the Audit Committee Charter) which deals adequately with its membership, authority and responsibilities. The Audit Committee meets as and when necessary with the Executive Authority and the Auditor General.
The Audit Committee held ordinary meetings and special meetings during the 2017/18 financial year. However, no Audit Committee meetings were held in Quarter 4 due to the recruitment of new members.
The table below discloses relevant information on the Audit Committee members:
Name QualificationsInternal or external
Date appointed
Date Resigned
No. of Meetings attended
Adv. W. E Huma (Chairperson)
B.Proc, Bachelor of Law (LLB), Master of Laws (LLM), Fellow Institute of Directors and Post Graduate Diploma: Company Direction (Governance)
External 09/09/2011 30/11/2017 10
Adv. Collen Weapond (Member)
LLB, MTech (forensic investigation)
B. Com Honours (IT) UCT
Master’s in Business System (Course work Completed at Wismar Germany)
Certificate in Policing (TUT)
Diploma in Business Management (SABMT)
External 01/07/2011 30/11/2017 07
Ms. K Selane (Member)
CA (SA) External 01/04/2014 N/A 08
Ms. P Mvulane (Member)
CA (SA) External 01/04/2014 N/A 07
Dr. Prittish Dala (Member)
Bachelor of Information Technology (NQF 7)
Baccalaureus Scientiae Cum Honoribus (NQF 8)
Master of Information Technology (NQF 9)
D. Phil. in Information Technology (NQF 10)
External 28/03/2018 N/A N/A
Mr. Vincent Botto (Member)
Bachelor of Accounting Sciences (NQF 7)
Baccalaureus Artium in Law (NQF 7)
Baccalaureus Legum (NQF 7)
Magister Legum (NQF 8)
External 28/03/2018 N/A N/A

page 86
12. AUDIT COMMITTEE REPORT
We are pleased to present our report for the financial year ended 31 March 2018, in terms of section 3.1.13 of the Treasury Regulations.
Audit Committee Responsibility
The Audit Committee reports that it has complied with its responsibilities arising from Section 38 (1) (a) (ii) of the Public Finance Management Act and Treasury Regulations section 3.1. The Audit Committee also reports that it has adopted appropriate formal terms of reference as its Audit Committee Charter, has regulated its affairs in compliance with this charter and has discharged all its responsibilities as contained therein.
The Effectiveness of Internal Control
The system of internal control was not entirely adequate and effective, for the year under review. This is evident from the internal control deficiencies highlighted by the Internal Audit and Auditor General South Africa (AGSA). The areas requiring attention from management and are closely monitored by the Audit Committee relate to the following:
– Finalisation of the governance frameworks such as Integrated Governance Framework that will set the correct tone for the effective implementation of the internal controls.
– Prioritisation of key and strategic areas where the digitisation and documentation of business processes, supported by comprehensive standard operating procedures is paramount to the achievement of the strategic objectives.
– Effective Management oversight on the implementation of the Integrated Action Plans to address all assurance providers findings (including Internal Audit, AGSA, and MPAT).
– The Disaster Recovery and Business Continuity Plan; IT controls over the Application that manages Departmental Performance Information and Records Management.
– Fast track the implementation of the Irregular Expenditure Management Plan and Supply Chain Management enhancement initiatives.
– Ensuring that Risk Management is progressing to the next level, where it is embedded into the day to day operations and it enables better decision making to improve business processes.
THE QUALITY OF IN-YEAR MANAGEMENT; QUARTERLY AND ANNUAL REPORTS SUBMITTED IN TERMS OF THE PFMA AND THE DIVISION OF REVENUE ACT
The Audit Committee is satisfied with the content and quality of quarterly reports prepared and issued by the Accounting Officer during the year under review. The Audit Committee has noted and commended Management for the improvement as it relate to the overall achievements of the performance targets, however encourage management to ensure that targets specifically for key initiatives such as Broadband Rollout must be executed and monitored better going forward.

page 87
EVALUATION OF FINANCIAL STATEMENTS
The Audit Committee has:
– reviewed and discussed the audited annual financial statements submitted to the AGSA with Management;
– reviewed the Auditor General’s management report and managements responses thereto;
– reviewed the accounting policies and practices;
– reviewed the Department’s compliance with legal and regulatory provisions;
– reviewed significant adjustments resulting from the audit; and
– reviewed information on pre-determined objectives to be included in the annual report.
INTERNAL AUDIT
The Audit Committee has reviewed the performance of the Internal Audit Activity, and the adequacy of its resources. The Audit Committee is of the opinion that the Internal Audit Activity is not performing at an optimum level due to capacity constraints. The Internal Audit Activity completed only 90% of the approved Annual Internal Audit Plan. The CAE committed to improve the internal audit methodology towards creating efficiencies and the organisational structure was being reviewed to provide for adequate capacity. Audit Committee is closely monitoring both interventions.
AUDITOR GENERAL - SOUTH AFRICA
The Audit Committee did meet with the Auditor General South Africa during the 2017/2018 financial year to ensure that there were no unresolved issues. The Audit Committee also concurred with the overall opinion of the Auditor General South Africa and instituted a process where Management was required to develop corrective actions that seeks to address the systemic issues.
CONCLUSION
The Audit Committee wishes to thank the Director-General, Finance Team, and Departmental Executive Committee for their continued commitment to good governance within the Department. Our appreciation is also extended to the former chairperson Adv. W. E Huma and member Adv. Collen Weapond for their role in ensuring the effectiveness of the Audit Committee.
Special appreciation further bequeathed to the Assurance Providers both the Internal Audit and AGSA, who continued to provide the strategic support to the committee and strengthened the governance agenda in the Department.
Ms P. Mvulane Chairperson of the Audit CommitteeDepartment of Telecommunications and Postal Services21 August 2018

page 88
PART D HUMAN RESOURCE
MANAGEMENT

1. INTRODUCTION The information contained in this part of the Annual Report has been prescribed by the Minister for the Public Service and Administration for all departments in the Public Service.
2. OVERVIEW OF HUMAN RESOURCES
The status of human resources in the Department
The Department has an approved Service Delivery Model (SDM) aligned to its mandate which informed the development of the functional structure of the Department. The Department has commenced with the process of developing an organisational structure that is aligned to the Strategy; in the financial year 2018/19 the structure will be finalised for implementation in the 2019/20 financial year.
As at 31 March 2018, the total number of funded posts on the establishment for the Department was two hundred and ninety two (292) which were captured on the PERSAL system. Of these positions, two hundred and seventy nine (279) positions were filled and thirteen (13) positions were vacant which equates to a 4.45% vacancy rate.
Human resource priorities for the year under review and the impact of these
– Filling of critical funded vacant positions – The vacancy rate of the Department was kept below the set standard of 10% by the Department of Public Service and Administration (DPSA). The appointment of individuals in critical positions assisted the Department to implement its Annual Performance Plan and Business Plans targets.
– Approval of the Service Delivery Model and the functional Structure for the Department – this will ensure the development of an Organisational Structure aligned to the mandate of the Department in the 2018/19 financial year with implementation in the 2019/20 financial year.
– Implementation of recommendations emanating from the Culture and Climate Survey conducted in the 2016/17 financial year – a more conducive Climate and Culture in the Department.
– Training and development of employees in line with the approved Workplace Skills Plan – Skilled workforce contributing to the implementation of the Department’s Annual Performance Plan and Business Plans.
– Alignment of individual performance agreements with the strategic priorities of the Department – this ensured a better performance rate in the Department.
– Appointment and skilling of interns in line with the Internship Programme of the Department – Fifteen (15) interns were appointed and trained and provided valuable assistance in key areas of the Department.
Workforce planning and key strategies to attract and recruit a skilled and capable workforce
– The Department has an approved HR Plan for the MTEF Period 2015 to 2018.
– Key vacancies were filled according to funds available.
– The Workplace Skills Plan was successfully implemented to ensure a skilled workforce.
page 89

Employee Performance Management
– The Department has a Performance Management System which is implemented. Quality assurance was done by the Human Resource Development Unit to ensure alignment of Performance Agreements to the Annual Performance Plan and Business Plans of the Department. This included quality assurance workshops on the compilation of performance agreements and the alignment thereof to the strategic objectives of the Department.
– Performance review documents, bi-annual and annual, were also quality assured for alignment with the Performance Agreements.
– Annual PMDS workshops were conducted with all Branches.
– 2016/17 Annual assessments for SMS and non-SMS members were finalised and the decision of the Executive Authority was implemented.
– In cases of non-compliance, letters were issued to Branch Heads to take disciplinary action against members who did not compile and submit performance agreements and/or performance assessments.
Employee wellness programmes
The Department has engaged service providers to provide employee assistance programmes. The Department also subscribes to the National Calendar of Events. During this period, two (2) screening events were implemented with a fourteen (14) percent level of utilisation of these events (thirty eight (38) employees participated).
ACHIEVEMENTS AND CHALLENGES
Achievements
– Two (2) critical positions were filled i.e. Deputy Director-General ICT International Affairs and Trade and Chief Director Broadband.
– A project to update the personal information of employees was completed.
– Several HR Policies were reviewed and approved.
– Reporting to the Department of Labour took place on 12 January 2018, in terms of Section 21 of the Employment Equity Act, Act 55 of 1998.
– The Department reports annually to the Department of Public Service and Administration on the implementation of its Human Resource Plan. Priorities and challenges are also reported on.
– The functional structure for the Department in line with its mandate was completed and approved.
– The implementation of twenty nine (29) identified interventions as per the Culture and Climate Survey conducted in 2016/17 was completed. These interventions included the roll-out of an electronic leave system, hosting of inter-branch engagements to break down silos and ensure synergy in the implementation of cross-cutting projects, development and approval of a framework on governance structures and the hosting of several Brown Bag sessions with all staff to discuss key internal Departmental issues and ICT sector trends and developments.
– Provision of Employee Health and Wellness interventions i.e. counselling services, health and wellness checks and voluntary counselling and testing.
– Development of a Leadership Charter and a Competency Matrix.
page 90

– Work Place Skills Plan developed, implemented and submitted to the PSETA. Three hundred and fourteen (314) interventions targeting one hundred and eighty one (181) employees (65% of establishment) were implemented.
– Quarterly Training Reports were submitted to the PSETA.
– The Department implemented its PMDS policy in the year under review. This included signing of performance agreements, conducting bi-annual reviews and concluding annual appraisals. Subsequently, employees were rewarded with performance incentives according to their achievement of targets. It should however be noted that cash bonuses were awarded to non-SMS members only.
– The Internship Programme was effectively implemented with fifteen (15) interns appointed.
Challenges
– Difficulty in attracting and retaining critical, scarce skills with the required competencies in the Broadband and Spectrum environments. The Department is unable to compete with market related salaries for employees in these specific fields.
– Inadequate budget for Compensation of Employees, which leads to capacity constraints at all branches and which is having an impact on service delivery. Personnel Head Count will have to be reduced further in the 2018/19 financial year. Only critical vacancies will be filled to ensure the Department remains within its allocated CoE budget.
– The finalisation of the organisational structure of the Department. This affects the process of recruitment as it pertains to determination of critical posts. Some current vacant posts might not be a priority in the new structure hence they are not filled.
– Finalisation of disciplinary matters within the legislative time-frames. Disciplinary cases in general are not finalised within the prescribed timeframes.
– Currently female representation is at thirty eight percent (38%) against the target of fifty percent (50%) on senior management level and efforts to close the gap are not yielding results.
– Currently the male representation at non-SMS level is at thirty four percent (34%) against the target of fifty percent (50%) and efforts to close the gap are not yielding results.
Future Plans/Goals
– To finalise the process of designing an organisational structure.
– Aligning of budget structure with new organisational structure.
– To compile an HR Plan aligned to the new organisational structure for the 2019 / 2021 MTEF period.
– To identify and implement further interventions to improve the climate and culture in the Department.
– To analyse trends on disciplinary cases and implement corrective measures to ensure finalisation of disciplinary matters within the legislative time-frames.
– Empowerment of management by means of management training interventions such as leadership development and Project and Programme Management.
page 91

– Performance Management – implementation of new DPSA directives for SMS and non-SMS employees.
– Prioritisation of the appointment of female employees in vacant and funded senior management positions in the Department to reach the 50% target. The prioritisation will be institutionalised through the Employment Equity Plan.
– Prioritisation of the appointment of male employees in vacant and funded non-SMS positions in the Department to reach the 50% target. The prioritisation will be institutionalised through the Employment Equity Plan.
3. HUMAN RESOURCES OVERSIGHT STATISTICS
3.1 Personnel Related Expenditure
The following tables summarise the final audited personnel related expenditure by programme and by salary bands. In particular, it provides an indication of the following:
– Amount spent on personnel
– Amount spent on salaries, overtime, homeowner’s allowances and medical aid.
Table 3.1.1 Personnel expenditure by programme for the period 1 April 2017 to 31 March 2018
Programme
Total expenditure
(R’000)
Personnel expenditure
(R’000)
Training expenditure
(R’000)
Professional and special
services expenditure
(R’000)
Personnel expenditure
as a % of total
expenditure
Average personnel cost per
employee (R’000)
Programme 1: Administration 209 452 102 890 1 330 0 49.1 668
Programme 2: International Affairs and Trade 50 612 16 978 34 0 33.5 1 061
Programme 3: Policy Research and Capacity Development 78 524 52 089 553 0 66.3 766
Programme 4: ICT Enterprise Development and SOE Oversight 3 949 056 27 858 275 0 0.7 844
Programme 5: ICT Infrastructure Support 604 411 20 028 418 0 3.3 910
Total 4 892 055 219 843 2 610 0 4.5 750
PLEASE NOTE: The average personnel cost per employee in Programme 1 includes the 14 interns who are appointed additional to the establishment as their expenditure is costed against Programme 1.
page 92

Table 3.1.2 Personnel costs by salary band for the period 1 April 2017 to 31 March 2018
Salary band
Personnel expenditure
(R’000)% of total
personnel cost No. of employees
Average personnel cost per employee
(R’000)
Lower skilled (Levels 1-2) 0 0 0 0
Skilled (level 3-5) 2 122 0.97 9 236
Highly skilled production (levels 6-8) 31 756 14.44 90 353
Highly skilled supervision (levels 9-12) 65 398 29.75 99 661
Senior and top management (levels 13-16) 106 197 48.31 98 1 084
Contract (Levels 1-2) 1 250 0.57 30 42
Contract (Levels 3-5) 0 0 0 0
Contract (Levels 6-8) 1 789 0.81 5 358
Contract (Levels 9-12) 1 661 0.76 5 332
Contract (Levels 13-16) 8 795 4 10 880
Other (Medical aid for former employees who retired and overtime for SAPS VIP Protectors) 874 0.40 0 0
Total 219 843 100 346 635
Table 3.1.3 Salaries, Overtime, Home Owners Allowance and Medical Aid by programme for the period 1 April 2017 to 31 March 2018
Programme
Salaries OvertimeHome Owners
Allowance Medical Aid
Amount (R’000
Salaries as a % of personnel
costsAmount (R’000)
Overtime as a % of personnel
costsAmount (R’000)
HOA as a % of
personnel costs
Amount (R’000)
Medical aid as a % of
personnel costs
Programme 1: Adminis-tration 68 092 66.2 801 0.8 1 448 1.4 2 955 2.9
Programme 2: International Affairs and Trade 9 017 53.1 31 0.2 355 2.1 460 2.7
page 93

Programme
Salaries OvertimeHome Owners
Allowance Medical Aid
Amount (R’000
Salaries as a % of personnel
costsAmount (R’000)
Overtime as a % of personnel
costsAmount (R’000)
HOA as a % of
personnel costs
Amount (R’000)
Medical aid as a % of
personnel costs
Programme 3: Policy Re-search and Capacity De-velopment 34 047 65.4 40 0.1 750 1.4 1 239 2.4
Programme 4: ICT Enter-prise Devel-opment and SOE Over-sight 18 472 66.3 14 0 232 0.8 477 1.7
Programme 5: ICT Infrastructure Support 13 755 68.7 1 2 287 1.4 331 1.7
Total 143 382 65.2 886 0.4 3 072 1.4 5 461 2.5
Table 3.1.4 Salaries, Overtime, Home Owners Allowance and Medical Aid by salary band for the period 1 April 2017 to 31 March 2018
Salary band
Salaries OvertimeHome Owners
Allowance Medical Aid
Amount (R’000
Salaries as a % of personnel
costsAmount (R’000)
Overtime as a % of personnel
costsAmount (R’000)
HOA as a % of
personnel costs
Amount (R’000)
Medical aid as a % of
personnel costs
Skilled (level 1-2) 0 0 0 0 0 0 0 0
Skilled (level 3-5) 1 389 65.5 7 0.3 122 5.7 212 10
Highly skilled production (levels 6-8) 22 174 69.8 227 0.7 1 091 3.4 2 117 6.7
Highly skilled supervision (levels 9-12 45 400 69.4 137 0.2
705
1.1 1 428 2.2
Senior management (level 13-16) 63 181 59.5 0 0 1 086 1.0 1 168 1.1
Contract (Levels 1-2) 1 248 99.8 3 0.2 0 0 0 0
page 94

Salary band
Salaries OvertimeHome Owners
Allowance Medical Aid
Amount (R’000
Salaries as a % of personnel
costsAmount (R’000)
Overtime as a % of personnel
costsAmount (R’000)
HOA as a % of
personnel costs
Amount (R’000)
Medical aid as a % of
personnel costs
Contract (Levels 3-5) 0 0 0 0 0 0 0 0
Contract (Levels 6-8) 1 251 69.9 0 0 53 3 74 4.1
Contract (Levels 9-12) 987 59.4 0 0 15 0.9 29 1.8
Contract (Levels 13-16) 7 752 88.1 0 0 0 0 73 0.8
Other (includes medical aid subsidy for former employees who retired and overtime payment to SAPS employees) 0 0 512 58.6 0 0 360 41.3
Total 143 382 65.2 886 0.4 3 072 1.4 5 461 2.5
3.2 Employment and Vacancies
The tables in this section summarise the position with regard to employment and vacancies.
The following tables summarise the number of posts on the establishment, the number of employees, the vacancy rate, and whether there are any staff additional to the establishment.
This information is presented in terms of three key variables:
– programme;
– salary band; and
– critical occupations.
page 95

Table 3.2.1 Employment and vacancies by programme as on 31 March 2018
Programme
Number of posts on approved establishment
Number of posts filled Vacancy rate
Number of employees
additional to the establishment
Programme 1: Administration 148 140 5.41 14
Programme 2: International Affairs and Trade 17 16 5.88 0
Programme 3: Policy Research and Capacity Development 71 68 4.23 0
Programme 4: ICT Enterprise Development and SOE Oversight 33 33 0 0
Programme 5: ICT Infrastructure Support 23 22 4.35 0
Total 292 279 4.45 14
PLEASE NOTE: – Funded posts were reduced from 304 to 292 due to compensation budget constraints during the 2017/18 financial year.
– Interns were appointed additional to the establishment, however the costing is done against the Administration Branch (Programme 1).
page 96

Table 3.2.2 Employment and vacancies by salary band as on 31 March 2018
Salary band
Number of posts on
approved establishment
Number of posts filled Vacancy rate
Number of employees additional
to the establishment
Lower skilled ( 1-2) 0 0 0 0
Skilled(3-5) 22 8 63.64 0
Highly skilled production (6-8) 79 79 0 0
Highly skilled supervision (9-12) 88 89 1.14 0
Senior management (13-16) 103 90 12.62 0
Contract (Levels 1-2) 0 0 0 14
Contract (Levels 3 -5) 0 0 0 0
Contract (Levels 6 -8) 0 5 0 0
Contract (Levels 9 -12) 0 2 0 0
Contract (Levels 13 - 16) 0 6 0 0
Total 292 279 4.45 14
PLEASE NOTE: – Only permanent posts are indicated on structure. Employees appointed on contract are placed against a permanent post.
– Areas where the number of posts filled are more than the number of posts on the establishment, are due to employees who are placed out of adjustment against a post (example: grade progression / accelerated grade progression, etc.)
Table 3.2.3 Employment and vacancies by critical occupations as on 31 March 2018
Critical occupation
Number of posts on
approved establishment
Number of posts filled Vacancy rate
Number of employees additional
to the establishment
Administrative related 53 52 1.89 0
Communication and Information related 2 2 0 0
Finance and Economics related 1 0 100 0
Financial Clerks and Credit Controllers 3 2 33.33 0
Finance and related professionals 12 12 0 0
Head of Department 1 1 0 0
Human Resources and Organisational Development 5 5 0 0
Human Resource related 7 7 0 0
Information Technology related 4 4 0 0
page 97

Critical occupation
Number of posts on
approved establishment
Number of posts filled Vacancy rate
Number of employees additional
to the establishment
Language Practitioners, Interpreters and Other Communication related 4 4 0 0
Library Mail and related Clerks 8 8 0 0
Logistical Support personnel 13 13 0 0
Messengers, Porters and Deliverers 3 3 0 0
Other Administrative and related Clerks and Organisers 42 39 7.14 14
Other Information Technology personnel 7 7 0 0
Other Occupations 3 2 33.33 0
Risk Management and Security Services 1 1 0 0
Secretaries and other Keyboard Clerks 24 24 0 0
Senior Management 99 93 6.06 0
Total 292 279 4.45 14
page 98

3.3 Filling of SMS Posts
The tables in this section provide information on employment and vacancies as it relates to members of the Senior Management Service by salary level. It also provides information on advertising and filling of SMS posts, reasons for not complying with prescribed timeframes and disciplinary steps taken.
Table 3.3.1 SMS post information as on 31 March 2018
SMS Level
Total number of funded SMS posts
Total number of SMS posts
filled% of SMS
posts filled
Total number of SMS posts
vacant% of SMS
posts vacant
Salary 16 (including DG, Minister, Deputy Minister and Special Advisors) 5 4 80 1 20
Salary Level 15 6 4 66.7 2 33.3
Salary Level 14 29 28 96.6 1 3.4
Salary Level 13 63 60 95.2 3 4.8
Total 103 96 93.2 7 6.8
Table 3.3.2 SMS post information as on 30 September 2017
SMS Level
Total number of funded SMS posts
Total number of SMS posts
filled% of SMS
posts filled
Total number of SMS posts
vacant% of SMS
posts vacant
Salary 16 (including DG, Minister, Deputy Minister and Special Advisors) 5 4 80 1 20
Salary Level 15 6 4 66.7 2 33.3
Salary Level 14 30 28 93.3 2 6.7
Salary Level 13 65 62 95.4 3 4.6
Total 106 98 92.5 8 10.1
page 99

Table 3.3.3 Advertising and filling of SMS posts for the period 1 April 2017 to 31 March 2018
SMS Level
Advertising Filling of Posts
Number of vacancies per level advertised in 6 months of becoming
vacant
Number of vacancies per level filled in 6
months of becoming vacant
Number of vacancies per level not filled in 6 months but filled in 12
months
Director-General/ Head of Department 0 0 0
Salary Level 16 0 0 0
Salary Level 15 0 0 0
Salary Level 14 1 0 0
Salary Level 13 2 0 0
Total 3 0 0
Table 3.3.4 Reasons for not having complied with the filling of funded vacant SMS - Advertised within 6 months and filled within 12 months after becoming vacant for the period 1 April 2017 to 31 March 2018
Reasons for vacancies not advertised within six months
Posts had to be re-prioritised to ensure the Department remain within its allocated compensation of employees’ budget over the MTEF period; as a result the headcount of the Department must be significantly reduced.
Reasons for vacancies not filled within twelve months
Posts had to be re-prioritised to ensure the Department remain within its allocated compensation of employees’ budget over the MTEF period; as a result the headcount of the Department must be significantly reduced.
Table 3.3.5 Disciplinary steps taken for not complying with the prescribed timeframes for filling SMS posts within 12 months for the period 1 April 2017 to 31 March 2018
Reasons for vacancies not advertised within six months
None
Reasons for vacancies not filled within six months
None
page 100

3.4 Job Evaluation
Within a nationally determined framework, executing authorities may evaluate or re-evaluate any job in his or her organisation. In terms of the Regulations all vacancies on salary levels 9 and higher must be evaluated before they are filled. The following table summarises the number of jobs that were evaluated during the year under review. The table also provides statistics on the number of posts that were upgraded or downgraded.
Table 3.4.1 Job Evaluation by salary band for the period 1 April 2017 to 31 March 2018
Salary band
Number of posts on
approved establish-
ment
Number of Jobs
evaluated
% of posts evaluated by salary
bands
Posts Upgraded Posts downgraded
Number% of posts evaluated Number
% of posts evaluated
Lower skilled (Levels1-2) 0 0 0 0 0 0 0
Skilled (Levels 3-5) 22 0 0 0 0 0 0
Highly skilled production (Levels 6-8) 79 2 2.5 0 0 0 0
Highly skilled supervision (Levels 9-12) 88 63 71.6 1 1.6 11 17.5
Senior Management Service Band A 63 0 0 0 0 0 0
Senior Management Service Band B 29 0 0 0 0 0 0
Senior Management Service Band C 6 0 0 0 0 0 0
Senior Management Service Band D 5 0 0 0 0 0 0
Total 292 65 22.3 1 1.5 11 17
The following table provides a summary of the number of employees whose positions were upgraded due to their post being upgraded. The number of employees might differ from the number of posts upgraded since not all employees are automatically absorbed into the new posts and some of the posts upgraded could also be vacant.
page 101

Table 3.4.2 Profile of employees whose positions were upgraded due to their posts being upgraded for the period 1 April 2017 to 31 March 2018
Gender African Asian Coloured White Total
Female 0 0 0 0 0
Male 1 0 0 0 1
Total 1 0 0 0 1
Employees with a disability 0
Table 3.4.3 Employees with salary levels higher than those determined by job evaluation by occupation for the period 1 April 2017 to 31 March 2018
OccupationNumber of employees Job evaluation level
Remuneration level Reason for deviation
Assistant Director: Events Co-ordination
2 8 9 It was determined by the DPSA, after an analysis of information submitted by the Department, that the functions performed by these posts do not justify a grading of posts at Assistant Director-level. Furthermore, the analysis conducted on these posts indicated that they are performing production functions. These are functions expected of administration officers’ posts: it was indicated that the Department should reconsider its organisational structure and rename the posts. If necessary, the Department may create a proper supervisory post, if justifiable from organisational and functional decomposition.
Assistant Director: IT Security
1 8 9
Assistant Director: Resource Centre
1 8 9
Assistant Director: Graphic Design
2 8 9
Assistant Director: IT Training
1 8 9
page 102

OccupationNumber of employees Job evaluation level
Remuneration level Reason for deviation
Personal Assistant to Director-General
1 7 11 DPSA circular on benchmark job descriptions and grading levels and implementation guidelines for jobs of Secretaries and Personal Assistants dated 31 December 2016.
Personal Assistant to Deputy Director-General
3 7 9
Total number of employees whose salaries exceeded the level determined by job evaluation 11
Percentage of total employed 3.8%
Table 3.4.4 Profile of employees who have salary levels higher than those determined by job evaluation for the period 1 April 2017 to 31 March 2018
Gender African Asian Coloured White Total
Female 6 1 0 3 10
Male 1 0 0 0 1
Total 7 1 0 3 11
Employees with a disability 0 0 0 0 0
page 103

3.5 Employment Changes
This section provides information on changes in employment over the financial year. Turnover rates provide an indication of trends in the employment profile of the Department. The following tables provide a summary of turnover rates by salary band and critical occupations.
Table 3.5.1 Annual turnover rates by salary band for the period 1 April 2017 to 31 March 2018
Salary band
Number of employees at beginning of period 1 April
2017
Appointments and transfers into the Department
Terminations and transfers out of
the Department Turnover rate
Lower skilled ( Levels 1-2) 0 0 0 0
Skilled (Levels3-5) 9 0 0 0
Highly skilled production (Levels 6-8) 83 1 6 7.23
Highly skilled supervision (Levels 9-12) 94 2 5 5.32
Senior Management Service Bands A 61 1 6 9.84
Senior Management Service Bands B 29 1 1 3.45
Senior Management Service Bands C 3 0 0 0
Senior Management Service Bands D 0 0 0 0
Contract (Levels 3-5) 2 0 2 100
Contract (Levels 6-8) 2 3 0 0
Contract (Levels 9-12) 4 1 4 100
Contract (Band A) 4 0 1 25
Contract (Band D) (including DG, Minister, Deputy Minister and Special Advisors) 4 1 1 25
Total 295 10 26 8.81
page 104

Table 3.5.2 Annual turnover rates by critical occupation for the period 1 April 2017 to 31 March 2018
Critical occupation
Number of employees at beginning of period 1 April
2017
Appointments and transfers into the Department
Terminations and transfers out of
the Department Turnover rate
Administrative related 61 2 6 9.84
Communication and Information related 4 0 1 25
Finance and Economics related 2 0 1 50
Finance and related professionals 12 0 1 8.33
Head of Department 1 0 0 0
Human Resources and Organisational Development 5 0 0 0
Human Resource related 6 1 0 0
Information Technology related 5 0 0 0
Language Practitioners, Interpreters and Other Communication related 4 0 1 25
Library Mail and related Clerks 8 1 1 12.5
Logistical Support personnel 15 0 1 6.67
Messengers, Porters and Deliverers 3 1 1 33.33
Other Administrative and related Clerks and Organisers 47 0 1 2.13
Other Information Technology personnel 7 0 0 0
Other occupations 2 1 1 50
Risk Management and Security Services 1 0 0 0
Secretaries and other Keyboard Clerks 26 2 4 15.38
Senior Management 86 2 7 8.14
TOTAL 295 10 26 8.81
page 105

Table 3.5.3 Reasons why staff left the Department for the period 1 April 2017 to 31 March 2018
Termination Type Number % of Total Resignations
Death 0 0
Resignation 8 30.77
Expiry of contract 7 26.92
Dismissal – operational changes 0 0
Dismissal – misconduct 1 3.85
Dismissal – inefficiency 0 0
Discharged due to ill-health 1 3.85
Retirement 3 11.54
Transfer to other Public Service Departments 6 23.08
Other 0 0
Total 26 100
Total number of employees who left as a % of total employment 8.81
Table 3.5.4 Promotions by critical occupation for the period 1 April 2017 to 31 March 2018
OccupationEmployees 1
April 2017
Promotions to another salary
level
Salary level promotions as a % of
employees by occupation
Progressions to another notch within a salary
level
Notch progression as a % of
employees by occupation
Administrative related 61 0 0 38 62.3
Communication and Information related 4 0 0 1 25
Finance and Economics related 2 0 0 0 0
Finance and related professionals 12 0 0 7 58.3
Head of Department 1 0 0 0 0
Human Resources and Organisational Development 5 0 0 3 60
Human Resource related 6 0 0 3 50
Information Technology related 5 2 40 1 20
Language Practitioners, Interpreters and other Communication related 4 0 0 0 0
page 106

OccupationEmployees 1
April 2017
Promotions to another salary
level
Salary level promotions as a % of
employees by occupation
Progressions to another notch within a salary
level
Notch progression as a % of
employees by occupation
Library Mail and related Clerks 8 0 0 7 87.5
Logistical Support personnel 15 0 0 6 40
Messengers, Porters and Deliverers 3 0 0 2 66.7
Other Administrative and related Clerks and Organisers 47 1 2.1 25 53.2
Other Information Technology personnel 7 0 0 5 71.4
Other occupations 2 0 0 0 0
Risk Management and Security Services 1 0 0 1 100
Secretaries and other Keyboard Clerks 26 0 0 16 61.5
Senior Management 86 1 1.16 69 80.2
TOTAL 295 4 1.4 184 62.4
Table 3.5.5 Promotions by salary band for the period 1 April 2017 to 31 March 2018
Salary BandEmployees 1
April 2017
Promotions to another salary
level
Salary bands promotions as a % of
employees by salary level
Progressions to another notch within a salary
level
Notch progression as a % of
employees by salary bands
Lower skilled ( Levels 1-2) 0 0 0 0 0
Skilled (Levels3-5) 9 0 0 8 88.9
Highly skilled production (Levels 6-8) 83 0 0 51 61.4
Highly skilled supervision (Levels 9-12) 94 3 3.2 55 58.5
Senior Management (Level 13-16) 95 1 1.1 68 71.6
Contract (Levels 3-5) 2 0 0 0 0
Contract (Levels 6-8) 2 0 0 1 50
Contract (Levels 9-12) 4 0 0 0 0
Contract (Levels 13-16) 6 0 0 1 16.7
Total 295 4 1.4 184 62.4
page 107

3.6 Employment Equity
Table 3.6.1 Total number of employees (including employees with disabilities) in each of the following occupational categories as on 31 March 2018
Occupational category
Male Female
TotalAfrican Coloured Indian White African Coloured Indian White
Legislators, senior officials and managers 50 3 3 4 30 2 3 1 96
Professionals 32 0 0 5 43 3 1 7 91
Technicians and associate professionals 19 2 1 0 51 5 1 5 84
Clerks 4 0 0 0 4 0 0 0 8
Elementary occupations 0 0 0 0 0 0 0 0 0
Total 105 5 4 9 128 10 5 13 279
Employees with disabilities 4 0 0 0 1 1 0 0 6
Interns (Appointed additional to the establishment) 9 0 0 0 5 0 0 0 14
PLEASE NOTE: The total number of employees excludes the interns but includes employees with disabilities.
Table 3.6.2 Total number of employees (including employees with disabilities) in each of the following occupational bands as on 31 March 2018
Occupational band
Male Female
TotalAfrican Coloured Indian White African Coloured Indian White
Top Management 4 1 0 0 3 0 0 0 8
Senior Management 46 2 3 4 27 2 3 1 88
Professionally qualified and experienced specialists and mid-management 32 0 0 5 43 3 1 7 91
page 108

Occupational band
Male Female
TotalAfrican Coloured Indian White African Coloured Indian White
Skilled technical and academically qualified workers, junior management, supervisors, foreman and superintendents 19 2 1 0 51 5 1 5 84
Semi-skilled and discretionary decision making 4 0 0 0 4 0 0 0 8
Unskilled and defined decision making 0 0 0 0 0 0 0 0 0
Total 105 5 4 9 128 10 5 13 279
Interns (Appointed additional to the establishment) 9 0 0 0 5 0 0 0 14
Table 3.6.3 Recruitment for the period 1 April 2017 to 31 March 2018
Occupational band
Male Female
TotalAfrican Coloured Indian White African Coloured Indian White
Top Management 0 0 0 0 1 0 0 0 1
Senior Management 2 0 0 0 0 0 0 0 2
Professionally qualified and experienced specialists and mid-management 0 0 0 0 3 0 0 0 3
Skilled technical and academically qualified workers, junior management, supervisors, foreman and superintendents 2 0 0 0 2 0 0 0 4
Semi-skilled and discretionary decision making 0 0 0 0 0 0 0 0 0
page 109

Occupational band
Male Female
TotalAfrican Coloured Indian White African Coloured Indian White
Unskilled and defined decision making 0 0 0 0 0 0 0 0 0
Total 4 0 0 0 6 0 0 0 10
Employees with disabilities 0 0 0 0 0 0 0 0 0
PLEASE NOTE: Only two employees were recruited as permanent employees on the staff establishment of the Department, 1 African male on Senior Management level and one African female on skilled technical and academically qualified workers. All other employees are part of the establishment of the Deputy Minister who were moved to the Department as part of the Cabinet reshuffle on 30 March 2017.
Table 3.6.4 Promotions for the period 1 April 2017 to 31 March 2018
Occupational band
Male Female
TotalAfrican Coloured Indian White African Coloured Indian White
Top Management 0 0 0 0 1 0 0 0 1
Senior Management 0 0 0 0 0 0 0 0 0
Professionally qualified and experienced specialists and mid-management 1 0 0 0 2 0 0 0 3
Skilled technical and academically qualified workers, junior management, supervisors, foreman and superintendents 0 0 0 0 0 0 0 0 0
Semi-skilled and discretionary decision making 0 0 0 0 0 0 0 0 0
Unskilled and defined decision making 0 0 0 0 0 0 0 0 0
Total 1 0 0 0 3 0 0 0 4
Employees with disabilities 0 0 0 0 0 0 0 0 0
page 110

Table 3.6.5 Terminations for the period 1 April 2017 to 31 March 2018
Occupational band
Male Female
TotalAfrican Coloured Indian White African Coloured Indian White
Top Management 0 0 0 0 1 0 0 0 1
Senior Management 3 0 1 0 2 0 1 0 7
Professionally qualified and experienced specialists and mid-management 2 0 0 1 6 0 1 0 10
Skilled technical and academically qualified workers, junior management, supervisors, foreman and superintendents 1 0 0 0 3 1 0 1 6
Semi-skilled and discretionary decision making 1 0 0 0 1 0 0 0 2
Unskilled and defined decision making 0 0 0 0 0 0 0 0 0
Total 7 0 1 1 13 1 2 1 26
Employees with disabilities 0 0 0 0 0 0 0 0 0
Table 3.6.6 Disciplinary action for the period 1 April 2017 to 31 March 2018
Disciplinary action
Male Female
TotalAfrican Coloured Indian White African Coloured Indian White
Failure to comply with rules/regulations of BAC and BEC 3 0 1 0 3 0 0 0 7
Insubordination, failure to comply with lawful instruction 0 0 0 0 1 0 0 0 1
Gross misconduct and insubordination 0 0 0 0 0 0 1 0 1
Total 3 0 1 0 4 0 1 0 9
page 111

Table 3.6.7 Skills development for the period 1 April 2017 to 31 March 2018
Occupational category
Male Female
TotalAfrican Coloured Indian White African Coloured Indian White
Legislators, senior officials and managers 41 1 2 3 29 1 1 2 80
Professionals 17 0 0 0 17 1 1 0 36
Technicians and associate professionals 4 0 0 0 5 0 0 0 9
Clerks 16 0 1 0 33 5 0 1 56
Elementary occupations 0 0 0 0 0 0 0 0 0
Total 78 1 3 3 84 7 2 3 181
Employees with disabilities 3 0 0 0 1 1 0 0 5
page 112

3.7 Signing of Performance Agreements by SMS Members
All members of the SMS must conclude and sign performance agreements within specific timeframes. Information regarding the signing of performance agreements by SMS members, the reasons for not complying within the prescribed timeframes and disciplinary steps taken are presented here.
Table 3.7.1 Signing of Performance Agreements by SMS members as on 31 May 2017
SMS LevelTotal number of
funded SMS postsTotal number of SMS
members
Total number of signed
performance agreements
Signed performance agreements as % of total number of SMS
members
Salary Level 16 (include DG, Minister, Deputy Minister and Special Advisors) 5 1 1 100
Salary Level 15 66 (include 2 members
acting at this level) 6 100
Salary Level 14 2926 (exclude 2 acting
on salary level 15) 26 100
Salary Level 13 63 60 58 97%
Total 103 93 91 98
Table 3.7.2 Reasons for not having concluded performance agreements for all SMS members as on 31 March 2018
Reasons
– One employee provided a reason for late submission.
– One employee did not provide a reason for late submission.
Table 3.7.3 Disciplinary steps taken against SMS members for not having concluded performance agreements as on 31 March 2018
Reasons
– The matter is currently under investigation.
page 113

3.8 Performance Rewards
To encourage good performance, the Department has granted the following performance rewards during the year under review. The information is presented in terms of race, gender, disability, salary bands and critical occupations.
PLEASE NOTE: Payment of performance awards for the 2016/2017 performance cycle.
Table 3.8.1 Performance rewards by race, gender and disability for the period 1 April 2017 to 31 March 2018
Race and Gender
Beneficiary Profile Cost
Number of beneficiaries
Number of employees
% of total within group
Cost (R’000)
Average cost per employee
African
Male 30 105 28.6 821 27 367
Female 66 128 51.6 1 617 24 500
Asian
Male 1 4 25 18 18 000
Female 3 5 60 102 34 000
Coloured
Male 0 5 0 0 0
Female 8 10 80 206 25 750
White
Male 4 9 44.4 164 41 000
Female 12 13 92.3 346 28 833
Total 124 279 44.4 3 273 26 395
page 114

Table 3.8.2 Performance rewards by salary band for personnel below Senior Management Service for the period 1 April 2017 to 31 March 2018
Salary band
Beneficiary Profile Cost Total cost as a % of the total
personnel expenditure
Number of beneficiaries
Number of employees
% of total within salary
bandsTotal Cost
(R’000)Average cost per employee
Lower skilled (Levels 1-2) 0 0 0 0 0 0
Skilled (level 3-5) 6 6 100 68 11 333 3.2
Highly skilled production (level 6-8) 60 82 73.2 1 236 20 600 3.9
Highly skilled supervision (level 9-12) 57 87 65.5 1 944 34 105 3
Skilled (Levels3-5) (Contract) 0 2 0 0 0 0
Highly skilled production (Levels 6-8) (Contract) 1 2 50 25 25 000 1.4
Highly skilled supervision (Levels 9-12) (Contract) 0 4 0 0 0 0
Total 124 183 67.8 3 273 26 395 1.5
page 115

page 116
Table 3.8.3 Performance rewards by critical occupation for the period 1 April 2017 to 31 March 2018
Critical occupation
Beneficiary Profile Cost
Number of beneficiaries
Number of employees
% of total within
occupationTotal Cost
(R’000)Average cost per employee
Administrative related 31 52 59.6 1 155 37 258
Communication and Information related 2 2 100 59 29 500
Finance and Economics related 0 0 0 0 0
Financial Clerks and Credit Controllers 2 2 100 32 16 000
Finance and related Professionals 9 12 75 210 23 333
Head of Department 0 1 0 0 0
Human Resources and Organisational Development 3 5 60 59 19 667
Human Resource related 2 7 28.6 86 43 000
Information Technology related 1 4 25 43 43 000
Language Practitioners, Interpreters and other Communication related 3 4 75 111 37 000
Library Mail and related Clerks 4 8 50 44 11 000
Logistical Support personnel 11 13 84.6 240 21 818
Messengers, Porters and Deliverers 1 3 33.3 8 8 000
Other Administrative and related Clerks and Organisers 28 39 71.8 577 20 607
Other Information Technology personnel 6 7 85.7 180 30 000
Other occupations 0 2 0 0 0
Risk Management and Security Services 1 1 100 33 33 000
Secretaries and other Keyboard Clerks 20 24 83.3 435 21 750
Senior Management 0 93 0 0 0
Total 124 279 44.4 3 273 26 395

page 117
Table 3.8.4 Performance related rewards (cash bonus), by salary band for Senior Management Service for the period 1 April 2017 to 31 March 2018
Salary band
Beneficiary Profile CostTotal cost as a % of the
total personnel expenditure
Number of beneficiaries
Number of employees
% of total within salary
bandsTotal Cost
(R’000)Average cost per employee
Band A 0 60 0 0 0 0
Band B 0 28 0 0 0 0
Band C 0 4 0 0 0 0
Band D 0 4 0 0 0 0
Total 0 96 0 0 0 0

page 118
3.9 Foreign Workers
The tables below summarise the employment of foreign nationals in the Department in terms of salary band and major occupation.
Table 3.9.1 Foreign workers by salary band for the period 1 April 2017 to 31 March 2018
Salary band
01 April 2017 31 March 2018 Change
Number % of total Number % of total Number % Change
Total 0 0 0 0 0 0
Table 3.9.2 Foreign workers by major occupation for the period 1 April 2017 to 31 March 2018
Major occupation
01 April 2017 31 March 2018 Change
Number % of total Number % of total Number % Change
Total 0 0 0 0 0 0

page 119
3.10 Leave Utilisation
The Public Service Commission identified the need for careful monitoring of sick leave within the Public Service. The following tables provide an indication of the use of sick leave and disability leave. In both cases, the estimated cost of the leave is also provided.
Table 3.10.1 Sick leave for the period 1 January 2017 to 31 December 2017
Salary band Total days
% Days with medical
certification
Number of employees using sick
leave
% of total employees using sick
leave
Average days per
employeeEstimated
Cost (R’000)
Lower skills (Level 1-2) 0 0 0 0 0 0
Skilled (levels 3-5) 41 58.5 8 3 5 35
Highly skilled production (levels 6-8) 589 71 68 25.7 9 825
Highly skilled supervision (levels 9 -12) 738 72.8 105 39.6 7 1 977
Top and senior management (levels 13-16) 364 76.1 70 26.4 5 1 417
Contract (Levels 1-2) 14 71.4 6 2.3 2 6
Contract (Levels 6-8) 19 89.5 2 0.8 10 30
Contract (Levels 9-12) 16 93.8 4 1.5 4 51
Contract (Levels 13-16) 4 50 2 0.8 2 20
Total 1 785 72.8 265 100 7 4 361
Table 3.10.2 Disability leave (temporary and permanent) for the period 1 January 2017 to 31 December 2017
Salary band Total days
% Days with medical
certification
Number of employees
using disability
leave
% of total employees
using disability
leave
Average days per
employeeEstimated
Cost (R’000)
Lower skilled (Levels 1-2) 0 0 0 0 0 0
Skilled (Levels 3-5) 0 0 0 0 0 0
Highly skilled production (Levels 6-8) 46 100 2 50 23 71
Highly skilled supervision (Levels 9-12) 0 0 0 0 0 0
Senior management (Levels 13-16) 15 100 2 50 8 54
Total 61 100 4 100 15 126

page 120
The table below summarises the utilisation of annual leave. The wage agreement concluded with trade unions in the PSCBC in 2000 requires management of annual leave to prevent high levels of accrued leave being paid at the time of termination of service.
Table 3.10.3 Annual Leave for the period 1 January 2017 to 31 December 2017
Salary band Total days takenNumber of employees
using annual leave Average per employee
Lower skilled (Levels 1-2) 0 0 0
Skilled Levels 3-5) 236 10 24
Highly skilled production (Levels 6-8) 2 199 91 24
Highly skilled supervision(Levels 9-12) 2 696 124 22
Senior management (Levels 13-16) 2 042 98 21
Contract (Levels 1-2) 175 28 6
Contract (Levels 6-8) 75 5 15
Contract (Levels 9-12) 46 9 5
Contract (Levels 13-16) 112 9 12
Total 7 581 374 20
Table 3.10.4 Capped leave for the period 1 January 2017 to 31 December 2017
Salary band
Total days of capped leave
taken
Number of employees using
capped leave
Average number of days taken per
employee
Average capped leave per
employee as on 31 December 2017
Lower skilled (Levels 1-2) 0 0 0 0
Skilled Levels 3-5) 0 0 0 20
Highly skilled production (Levels 6-8) 0 0 0 9
Highly skilled supervision(Levels 9-12) 1 1 1 11
Senior management (Levels 13-16) 0 0 0 31
Total 1 1 1 18

page 121
The following table summarises payments made to employees as a result of leave that was not taken.
Table 3.10.5 Leave pay-outs for the period 1 April 2017 to 31 March 2018
ReasonTotal amount
(R’000)Number of employees
Average per employee (R’000)
Leave pay-out for 2017/18 due to non-utilisation of leave for the previous cycle 56 1 56 000
Capped leave pay-outs on termination of service for 2017/18 358 2 179 000
Current leave payout on termination of service for 2017/18 881 18 48 944
Total 1 294 21 61 619

page 122
3.11 HIV/AIDS & Health Promotion Programmes
Table 3.11.1 Steps taken to reduce the risk of occupational exposure
Units/categories of employees identified to be at high risk of contracting HIV & related diseases (if any)
Key steps taken to reduce the risk
No categories identified
Table 3.11.2 Details of Health Promotion and HIV/AIDS Programmes (tick the applicable boxes and provide the required information)
Question Yes No Details, if yes
1. Has the Department designated a member of the SMS to implement the provisions contained in Part VI E of Chapter 1 of the Public Service Regulations, 2016? If so, provide her/his name and position.
X Mr ES Gumbi
2. Does the Department have a dedicated unit or has it designated specific staff members to promote the health and well-being of your employees? If so, indicate the number of employees who are involved in this task and the annual budget that is available for this purpose.
X Mr ES GumbiMr TB ShakwaneR200 000-00
3. Has the Department introduced an Employee Assistance or Health Promotion Programme for your employees? If so, indicate the key elements/services of this Programme.
X Counselling services
4. Has the Department established (a) committee(s) as contemplated in Part VI E.5 (e) of Chapter 1 of the Public Service Regulations, 2016? If so, please provide the names of the members of the committee and the stakeholder(s) that they represent.
X
5. Has the Department reviewed its employment policies and practices to ensure that these do not unfairly discriminate against employees on the basis of their HIV status? If so, list the employment policies/practices so reviewed.
X
6. Has the Department introduced measures to protect HIV-positive employees or those perceived to be HIV-positive from discrimination? If so, list the key elements of these measures.
X • Protection of disclosure and confidentiality are incorporated in the HIV and AIDS and TB Management Policy.
7. Does the Department encourage its employees to undergo Voluntary Counselling and Testing? If so, list the results that you have you achieved.
X • Two (2) screening events were conducted in 2017/2018.
• World Aids Day commemorated.• Thirty Eight (38) employees
participated in the HCT screening sessions.
8. Has the Department developed measures/indicators to monitor & evaluate the impact of its health promotion programme? If so, list these measures/indicators.
X

page 123
3.12 Labour Relations
Table 3.12.1 Collective agreements for the period 1 April 2017 to 31 March 2018
Total number of Collective agreements
None
The following table summarises the outcome of disciplinary hearings conducted within the Department for the year under review.
Table 3.12.2 Misconduct and disciplinary hearings finalised for the period 1 April 2017 to 31 March 2018
Outcomes of disciplinary hearings Number % of total
Correctional counselling 0 0
Verbal warning 0 0
Written warning 0 0
Final written warning 0 0
Suspended without pay 0 0
Fine 0 0
Demotion 0 0
Dismissal 1 100
Not guilty 0 0
Case withdrawn 0 0
Total 1 100
Total number of disciplinary hearings finalised 1
Table 3.12.3 Types of misconduct addressed at disciplinary hearings for the period 1 April 2017 to 31 March 2018
Type of misconduct Number % of total
Failure to comply with rules/regulations regulating DBAC and DBEC 7 87.5
Failure to comply with lawful instructions 1 12.5
Total 8 100

page 124
Table 3.12.4 Grievances lodged for the period 1 April 2017 to 31 March 2018
Grievances Number % of Total
Number of grievances resolved 6 85.71
Number of grievances not resolved 1 14.28
Total number of grievances lodged 7 100
Table 3.12.5 Disputes lodged with councils for the period 1 April 2017 to 31 March 2018
Disputes Number % of Total
Number of disputes upheld 4 100
Number of disputes dismissed 0 0
Total number of disputes lodged 4 100
Table 3.12.6 Strike actions for the period 1 April 2017 to 31 March 2018
Total number of person working days lost 0
Total cost working days lost 0
Amount recovered as a result of no work no pay (R’000) 0
Table 3.12.7 Precautionary suspensions for the period 1 April 2017 to 31 March 2018
Number of people suspended 0
Number of people whose suspension exceeded 30 days 0
Average number of days suspended 0
Cost of suspension (R’000) 0

page 125
3.13 Skills Development
This section highlights the efforts of the Department with regard to skills development.
Table 3.13.1 Training needs identified for the period 1 April 2017 to 31 March 2018
Occupational category Gender
Number of employees
as at 1 April 2017
Training needs identified at start of the reporting period
Learnerships
Skills pro-grammes & other short
coursesOther forms of training Total
Legislators, senior officials and managers
Female 39 0 52 26 78
Male 63 0 48 32 80
ProfessionalsFemale 58 0 41 8 49
Male 39 0 27 12 39
Technicians and associate professionals
Female 61 0 12 5 17
Male 24 0 7 1 8
Clerks Female 5 0 70 16 86
Male 6 0 13 5 18
Elementary occupationsFemale 0 0 0 0 0
Male 0 0 0 0 0
Sub TotalFemale 163 0 175 55 230
Male 132 0 95 50 145
Total 295 0 270 105 375

page 126
Table 3.13.2 Training provided for the period 1 April 2017 to 31 March 2018
Occupational category Gender
Number of employees as at 1 April
2017
Training provided within the reporting period
Learnerships
Skills pro-grammes & other short
coursesOther forms of training Total
Legislators, senior officials and managers
Female 39 0 31 24 55
Male 63 0 53 30 83
ProfessionalsFemale 58 0 23 11 34
Male 39 0 22 15 37
Technicians and associate professionals
Female 61 0 6 2 8
Male 24 0 5 0 5
Clerks Female 5 0 50 20 70
Male 6 0 16 6 22
Elementary occupationsFemale 0 0 0 0 0
Male 0 0 0 0 0
Sub TotalFemale 163 0 110 57 167
Male 132 0 96 51 147
Total 295 0 206 108 314
3.14 Injury on Duty
The following tables provide basic information on injury on duty.
Table 3.14.1 Injury on duty for the period 1 April 2017 to 31 March 2018
Nature of injury on duty Number % of total
Required basic medical attention only 1 100
Temporary total disablement 0 0
Permanent disablement 0 0
Fatal 0 0
Total 1 100

page 127
3.15 Utilisation of Consultants
The following tables relate information on the utilisation of consultants in the Department. In terms of the Public Service Regulations “consultant’ means a natural or juristic person or a partnership who or which provides in terms of a specific contract on an ad hoc basis any of the following professional services to a Department against remuneration received from any source:
a) The rendering of expert advice;
b) The drafting of proposals for the execution of specific tasks; and
c) The execution of a specific task which is of a technical or intellectual nature, but excludes an employee of a Department.
Table 3.15.1 Report on consultant appointments using appropriated funds for the period 1 April 2017 to 31 March 2018
Project title
Total number of consultants that
worked on projectDuration
(work days)Contract value in
Rand
Organisational climate and culture survey 1 515 1 246 600
To develop a draft Digital Development Fund Bill 5 210 425 220
Policy Brief on outcomes and impact of Spectrum Auctioning in identified countries 1 9 32 500
To undertake a survey of transformation of the top 100 ICT sector companies 6 60 356 343
Drafting of the ICT Sector Commission and Tribunal Legislation Bill 1 23 462 350
Appointment of Evaluation Panel members to evaluate proposal for organisational structure 2 90 495 900
Total number of projectsTotal individual
consultantsTotal duration
work daysTotal contract value in
Rand
6 16 907 3 018 913

page 128
Table 3.15.2 Analysis of consultant appointments using appropriated funds, in terms of Historically Disadvantaged Individuals (HDIs) for the period 1 April 2017 to 31 March 2018
Project titlePercentage ownership by
HDI groups
Percentage management by HDI
groups
Number of consultants from HDI groups that
worked on the project
Organisational climate and culture survey 26.70% 26.70% 1
To develop a draft Digital Development Fund Bill 100% 100% 1
Policy Brief on outcomes and impact of Spectrum Auctioning in identified countries 0% 0% 0
To undertake a survey of transformation of the top 100 ICT sector companies 100% 100% 6
Drafting of the ICT Sector Commission and Tribunal Legislation Bill 0% 0% 0
Appointment of Evaluation Panel members to evaluate proposal for organisational structure 0% 0% 0
Table 3.15.3 Report on consultant appointments using donor funds for the period 1 April 2017 to 31 March 2018
Project titleTotal Number of
consultants that worked on project
Durationwork days
Donor and contract value in Rand
None 0 0 0
Total number of projectsTotal individual
consultantsTotal duration
Work daysTotal contract value in
Rand
None 0 0 0
Table 3.15.4 Analysis of consultant appointments using donor funds, in terms of Historically Disadvantaged Individuals (HDIs) for the period 1 April 2017 to 31 March 2018
Project titlePercentage ownership
by HDI groups
Percentage management by HDI
groups
Number of consultants from HDI groups that
worked on the project
None 0 0 0

page 129
3.16 Severance Packages
Table 3.16.1 Granting of employee initiated severance packages for the period 1 April 2017 to 31 March 2018
Salary band
Number of applications
received
Number of applications
referred to the MPSA
Number of applications
supported by MPSA
Number of packages
approved by Department
Lower skilled (Levels 1-2) 0 0 0 0
Skilled Levels 3-5) 0 0 0 0
Highly skilled production (Levels 6-8) 0 0 0 0
Highly skilled supervision (Levels 9-12) 0 0 0 0
Senior management (Levels 13-16) 0 0 0 0
Total 0 0 0 0

page 130
PART E FINANCIAL
INFORMATION

page 131
Report of the auditor-general to Parliament on vote no. 32: Department of Telecommunications and Postal Services
REPORT ON THE AUDIT OF THE FINANCIAL STATEMENTS
Opinion
1. I have audited the financial statements of the Department of Telecommunications and Postal Services set out on pages 148 to 236, which comprise the appropriation statement, the statement of financial position as at 31 March 2018, the statement of financial performance statement, of changes in net assets, and cash flow statement for the year then ended, as well as the notes to the financial statements, including a summary of significant accounting policies.
2. In my opinion, the financial statements present fairly, in all material respects, the financial position of the Department of Telecommunications and Postal Services as at 31 March 2018, and its financial performance and cash flows for the year then ended in accordance with the Modified Cash Standard and the requirements of the Public Finance Management Act of South Africa, 1999 (Act No. 1 of 1999) (PFMA).
Basis for opinion
3. I conducted my audit in accordance with the International Standards on Auditing (ISAs). My responsibilities under those standards are further described in the auditor-general’s responsibilities for the audit of the financial statements section of this auditor’s report.
4. I am independent of the Department in accordance with the International Ethics Standards Board for Accountants’ Code of ethics for professional accountants (IESBA code) and the ethical requirements that are relevant to my audit in South Africa. I have fulfilled my other ethical responsibilities in accordance with these requirements and the IESBA code.
5. I believe that the audit evidence I have obtained is sufficient and appropriate to provide a basis for my opinion.
Emphasis of matter
6. I draw attention to the matter below. My opinion is not modified in respect of this matter.
Material underspending of the vote
7. As disclosed in the appropriation statement, the Department materially underspent the budget on ICT infrastructure support by R273 834 000 due to the delay in implementing the SA connect broadband project.

page 132
Other matter
8. I draw attention to the matter below. My opinion is not modified in respect of this matter.
Unaudited supplementary schedules
9. The supplementary information set out on pages 237 to 255 does not form part of the financial statements and is presented as additional information. I have not audited these schedules and, accordingly, l do not express an opinion on them.
Responsibilities of the accounting officer for the financial statements
10. The accounting officer is responsible for the preparation and fair presentation of the financial statements in accordance with MCS and the requirements of the PFMA and for such internal control as the accounting officer determines is necessary to enable the preparation of financial statements that are free from material misstatement, whether due to fraud or error.
11. In preparing the financial statements, the accounting officer is responsible for assessing the Department’s ability to continue as a going concern, disclosing, as applicable, matters relating to going concern and using the going concern basis of accounting unless the accounting officer either intends to liquidate the Department or to cease operations, or has no realistic alternative but to do so.
Auditor-general’s responsibilities for the audit of the financial statements
12. My objectives are to obtain reasonable assurance about whether financial statements as a whole are free from material misstatement, whether due to fraud or error, and to issue an auditor’s report that includes my opinion. Reasonable assurance is a high level of assurance, but is not a guarantee that an audit conducted in accordance with the ISAs will always detect a material misstatement when it exists. Misstatements can arise from fraud or error and are considered material if, individually or in aggregate, they could reasonably be expected to influence the economic decisions of users taken on the basis of these financial statements.
13. A further description of my responsibilities for the audit of the financial statements is included in the annexure to this auditor’s report.
REPORT ON THE AUDIT OF THE ANNUAL PERFORMANCE REPORT
Introduction and scope
14. In accordance with the Public Audit Act of South Africa, 2004 (Act No. 25 of 2004) (PAA) and the general notice issued in terms thereof, I have a responsibility to report material findings on the reported performance information against predetermined objectives for selected programmes presented in the annual performance report. I performed procedures to identify findings but not to gather evidence to express assurance.

page 133
15. My procedures address the reported performance information, which must be based on the approved performance planning documents of the Department. I have not evaluated the completeness and appropriateness of the performance indicators/ measures included in the planning documents. My procedures also did not extend to any disclosures or assertions relating to planned performance strategies and information in respect of future periods that may be included as part of the reported performance information. Accordingly, my findings do not extend to these matters.
16. I evaluated the usefulness and reliability of the reported performance information in accordance with the criteria developed from the performance management and reporting framework, as defined in the general notice, for the following selected programmes presented in the annual performance report of the Department for the year ended 31 March 2018:
Programmes Pages in the annual performance report
Programme 3 - ICT policy, research and capacity development 49 - 53
Programme 4 - ICT enterprise development and SOC oversight 54 - 58
Programme 5 - ICT infrastructure support 59 - 62
17. I performed procedures to determine whether the reported performance information was properly presented and whether performance was consistent with the approved performance planning documents. I performed further procedures to determine whether the indicators and related targets were measurable and relevant, and assessed the reliability of the reported performance information to determine whether it was valid, accurate and complete.
18. I did not raise any material findings on the usefulness and reliability of the reported performance information for the following programmes:
Programme 3 - ICT policy, research and capacity development
Programme 4 - ICT enterprise development and SOC oversight
Programme 5 - ICT infrastructure support
Other matter
19. I draw attention to the matter below.
Achievement of planned targets
20. Refer to the annual performance report on pages 31 to 62 for information on the achievement of planned targets for the year and explanations provided for the under/ over achievement of a significant number of targets.

page 134
REPORT ON THE AUDIT OF COMPLIANCE WITH LEGISLATION
Introduction and Scope
21. In accordance with the PAA and the general notice issued in terms thereof, I have a responsibility to report material findings on the compliance of the Department with specific matters in key legislation. I performed procedures to identify findings but not to gather evidence to express assurance.
22. The material findings on compliance with specific matters in key legislations are as follows:
Annual Financial Statements, Performance and Annual Report
23. The financial statements submitted for auditing were not prepared in accordance with the prescribed financial reporting framework and supported by full and proper records, as required by section 40(1) (a) and (b) of the PFMA. Material misstatements of compensation of employees, employee benefits, irregular expenditure and tangible assets identified by the auditors in the submitted financial statements, were corrected, resulting in the financial statements receiving an unqualified audit opinion.
Procurement and Contract Management
24. Invitation for competitive bidding was not advertised for a required minimum period, as required by treasury regulations 16A6.3(c). This non-compliance was identified in the procurement processes for the Travel Management Services.
Expenditure Management
25. Effective and appropriate steps were not taken to prevent irregular expenditure amounting to R228 000.00, as disclosed in note 27 to the annual financial statements, as required by section 38(1) (c) (ii) of the PFMA and treasury regulation 9.1.1.
Consequence Management
26. I was unable to obtain sufficient appropriate audit evidence that disciplinary steps were taken against officials who had incurred irregular expenditure as required by section 38(1) (h) (iii) of the PFMA. This was due to proper and complete records that were not maintained as evidence to support the investigations into irregular expenditure.
OTHER INFORMATION
27. The accounting officer is responsible for the other information. The other information comprises the information included in the annual report. The other information does not include the financial statements, the auditor’s report and those selected programmes presented in the annual performance report that have been specifically reported in this auditor’s report.

page 135
28. My opinion on the financial statements and findings on the reported performance information and compliance with legislation do not cover the other information and I do not express an audit opinion or any form of assurance conclusion thereon.
29. In connection with my audit, my responsibility is to read the other information and, in doing so, consider whether the other information is materially inconsistent with the financial statements and the selected programmes presented in the annual performance report, or my knowledge obtained in the audit, or otherwise appears to be materially misstated.
30. If, based on the work I have performed, I conclude that there is a material misstatement in this other information, I am required to report that fact.
31. I did not receive the other information prior to the date of this auditor’s report. When I do receive and read this information, if I conclude that there is a material misstatement therein, I am required to communicate the matter to those charged with governance and request that the other information be corrected. If the other information is not corrected, I may have to retract this auditor’s report and re-issue an amended report as appropriate. However, if it is corrected this will not be necessary.
INTERNAL CONTROL DEFICIENCIES
32. I considered internal control relevant to my audit of financial statements, reported performance information and compliance with applicable legislation; however, my objective was not to express any form of assurance on it. The matters reported below are limited to the significant internal control deficiencies that resulted in the findings on compliance with legislation included in this report.
Leadership
33. The leadership did not exercise oversight responsibility to ensure that consequence management was fully implemented in the Department and that adequate controls were implemented to prevent non-compliance with supply chain management regulations.
Financial and Performance Management
34. The financial statements contained material misstatements due to a lack of review of financial statements submitted for audit against the supporting schedules submitted to the finance section for the preparation of the financial statements. As a result, material adjustments were made to the financial statements submitted for auditing.

page 136
OTHER REPORTS
35. I draw attention to the following engagements conducted by various parties that had, or could have, an impact on the matters reported in the Department’s financial statements, reported performance information, compliance with applicable legislation and other related matters. These reports did not form part of my opinion on the financial statements or my findings on the reported performance information or compliance with legislation.
36. An investigation by the Special Investigating Unit was initiated in terms of Presidential Proclamation No.R.10 of 2014 as published in Government Gazette No.37369 dated 24 February 2014 into the broadcasting digital migration process project. The investigation was still in progress at the end of the financial year.
Pretoria31 July 2018

page 137
Annexure – Auditor-General’s responsibility for the audit
1. As part of an audit in accordance with the ISAs, I exercise professional judgement and maintain professional scepticism throughout my audit of the financial statements, and the procedures performed on reported performance information for selected programmes and on the Department’s compliance with respect to the selected subject matters.
Financial statements
2. In addition to my responsibility for the audit of the financial statements as described in this auditor’s report, I also:
• identify and assess the risks of material misstatement of the financial statements whether due to fraud or error, design and perform audit procedures responsive to those risks, and obtain audit evidence that is sufficient and appropriate to provide a basis for my opinion. The risk of not detecting a material misstatement resulting from fraud is higher than for one resulting from error, as fraud may involve collusion, forgery, intentional omissions, misrepresentations, or the override of internal control;
• obtain an understanding of internal control relevant to the audit in order to design audit procedures that are appropriate in the circumstances, but not for the purpose of expressing an opinion on the effectiveness of the Department’s internal control;
• evaluate the appropriateness of accounting policies used and the reasonableness of accounting estimates and related disclosures made by the accounting officer;
• conclude on the appropriateness of the accounting officer’s use of the going concern basis of accounting in the preparation of the financial statements. I also conclude, based on the audit evidence obtained, whether a material uncertainty exists related to events or conditions that may cast significant doubt on the Department’s ability to continue as a going concern. If I conclude that a material uncertainty exists, I am required to draw attention in my auditor’s report to the related disclosures in the financial statements about the material uncertainty or, if such disclosures are inadequate, to modify the opinion on the financial statements. My conclusions are based on the information available to me at the date of this auditor’s report. However, future events or conditions may cause the Department to cease continuing as a going concern; and
• evaluate the overall presentation, structure and content of the financial statements, including the disclosures, and whether the financial statements represent the underlying transactions and events in a manner that achieves fair presentation.
Communication with those charged with governance
3. I communicate with the accounting officer regarding, among other matters, the planned scope and timing of the audit and significant audit findings, including any significant deficiencies in internal control that I identify during my audit.
4. I also confirm to the accounting officer that I have complied with relevant ethical requirements regarding independence, and communicate all relationships and other matters that may reasonably be thought to have a bearing on my independence and, where applicable, related safeguards.

page 138
Vote No. 32: Department of Telecommunications and Postal Services
Accounting Policies
SUMMARY OF SIGNIFICANT ACCOUNTING POLICIES
The financial statements have been prepared in accordance with the following policies which have been applied consistently in all material aspects unless otherwise indicated. Management has concluded that the financial statements present fairly the Department’s primary and secondary information.
The historical cost convention has been used except where otherwise indicated. Management has used assessments and estimates in preparing the annual financial statements. These are based on the best information available at the time of preparation.
Where appropriate and meaningful additional information has been disclosed to enhance the usefulness of the financial statements and to comply with the statutory requirements of the Public Finance Management (PFMA) Act 1 of 1999 (as amended by Act 29 of 1999) and the Treasury Regulations issued in terms of the PFMA and the annual Division of Revenue Act.
1. BASIS OF PREPARATION
The financial statements have been prepared in accordance with the Modified Cash Standard.
2. GOING CONCERN
The financial statements have been prepared on a going concern basis.
3. PRESENTATION CURRENCY
Amounts have been presented in the currency of the South African Rand (R) which is also the functional currency of the Department.
4. ROUNDING
Unless otherwise stated financial figures have been rounded to the nearest one thousand Rand (R’000).
5. FOREIGN CURRENCY TRANSLATION
Cash flows arising from foreign currency transactions are translated into South African Rands using the exchange rates prevailing at the date of payment/receipt.

page 139
6. COMPARATIVE INFORMATION
6.1 Prior period comparative information
Prior period comparative information has been presented in the current year’s financial statements. Where necessary figures included in the prior period financial statements have been reclassified to ensure that the format in which the information is presented is consistent with the format of the current year’s financial statements.
6.2 Current year comparison with budget
A comparison between the approved final budget and actual amounts for each programme and economic classification is included in the appropriation statement.
7. REVENUE
7.1 Appropriated funds
Appropriated funds comprise Departmental allocations as well as direct charges against revenue fund (i.e. statutory appropriation).
Appropriated funds are recognised in the statement of financial performance on the date the appropriation becomes effective. Adjustments made in terms of the adjustments budget process are recognised in the statement of financial performance on the date the adjustments become effective.
The net amount of any appropriated funds due to/from the relevant revenue fund at the reporting date is recognised as a payable/receivable in the statement of financial position.
7.2 Departmental revenue
Departmental revenue is recognised in the statement of financial performance when received and is subsequently paid into the relevant revenue fund unless stated otherwise.
Any amount owing to the relevant revenue fund at the reporting date is recognised as a payable in the statement of financial position.
7.3 Accrued Departmental revenue
Accruals in respect of Departmental revenue (excluding tax revenue) are recorded in the notes to the financial statements when:
• it is probable that the economic benefits or service potential associated with the transaction will flow to the Department; and
• the amount of revenue can be measured reliably.

page 140
The accrued revenue is measured at the fair value of the consideration receivable.
Accrued tax revenue (and related interest and/penalties) is measured at amounts receivable from collecting agents.
Write-offs are made according to the Department’s debt write-off policy.
8. EXPENDITURE
8.1 Compensation of Employees
8.1.1 Salaries and Wages
Salaries and wages are recognised in the statement of financial performance on the date of payment.
8.1.2 Social Contributions
Social contributions made by the Department in respect of current employees are recognised in the statement of financial performance on the date of payment.
Social contributions made by the Department in respect of ex-employees are classified as transfers to households in the statement of financial performance on the date of payment.
8.2 Other Expenditure
Other expenditure (such as goods and services transfers and subsidies and payments for capital assets) is recognised in the statement of financial performance on the date of payment. The expense is classified as a capital expense if the total consideration paid is more than the capitalisation threshold.
8.3 Accruals and Payables not Recognised
Accruals and payables not recognised are recorded in the notes to the financial statements when the goods are received or in the case of services when they are rendered to the Department or in the case of transfers and subsidies when they are due and payable.
Accruals and payables not recognised are measured at cost.
8.4 Leases
8.4.1 Operating Leases
Operating lease payments made during the reporting period are recognised as current expenditure in the statement of financial performance on the date of payment.

page 141
The operating lease commitments are recorded in the notes to the financial statements.
8.4.2 Finance Leases
Finance lease payments made during the reporting period are recognised as capital expenditure in the statement of financial performance on the date of payment.
The finance lease commitments are recorded in the notes to the financial statements and are not apportioned between the capital and interest portions.
Finance lease assets acquired at the end of the lease term are recorded and measured at the lower of:
• cost being the fair value of the asset; or
• the sum of the minimum lease payments made including any payments made to acquire ownership at the end of the lease term excluding interest.
9. AID ASSISTANCE
9.1 Aid Assistance Received
Aid assistance received in cash is recognised in the statement of financial performance when received. In-kind aid assistance is recorded in the notes to the financial statements on the date of receipt and is measured at fair value.
Aid assistance not spent for the intended purpose and any unutilised funds from aid assistance that are required to be refunded to the donor are recognised as a payable in the statement of financial position.
9.2 Aid Assistance Paid
Aid assistance paid is recognised in the statement of financial performance on the date of payment. Aid assistance payments made prior to the receipt of funds are recognised as a receivable in the statement of financial position.
10. CASH AND CASH EQUIVALENTS
Cash and cash equivalents are stated at cost in the statement of financial position.
Bank overdrafts are shown separately on the face of the statement of financial position as a current liability.
For the purposes of the cash flow statement cash and cash equivalents comprise cash on hand deposits held other short-term highly liquid investments and bank overdrafts.

page 142
11. PREPAYMENTS AND ADVANCES
Prepayments and advances are recognised in the statement of financial position when the Department receives or disburses the cash.
Prepayments and advances are initially and subsequently measured at cost.
Prepayments and advances are expensed when invoices/claims are received for goods/services delivered/rendered.
12. LOANS AND RECEIVABLES
Loans and receivables are recognised in the statement of financial position at cost plus accrued interest where interest is charged less amounts already settled or written-off. Write-offs are made according to the Department’s write-off policy.
13. INVESTMENTS
Investments are recognised in the statement of financial position at cost.
14. FINANCIAL ASSETS
14.1 Financial Assets (not covered elsewhere)
A financial asset is recognised initially at its cost plus transaction costs that are directly attributable to the acquisition or issue of the financial asset.
At the reporting date the Department will measure its financial assets at cost less amount already settled or written-off except for recognised loans and receivables which are measured at cost plus accrued interest where interest is charged less amounts already settled or written-off.
14.2 Impairment of Financial Assets
Where there is an indication of impairment of a financial asset an estimation of the reduction in the recorded carrying value to reflect the best estimate of the amount of the future economic benefits expected to be received from that asset is recorded in the notes to the financial statements.
15. PAYABLES
Loans and payables are recognised in the statement of financial position at cost.

page 143
16. CAPITAL ASSETS
16.1 Immovable Capital Assets
Immovable capital assets are initially recorded in the notes to the financial statements at cost. Immovable capital assets acquired through a non-exchange transactions are measured at fair value as at the date of acquisition.
Where the cost of immovable capital assets cannot be determined reliably the immovable capital assets are measured at fair value for recording in the asset register.
Immovable capital assets are subsequently carried at cost and are not subject to depreciation or impairment.
Subsequent expenditure that is of a capital nature is added to the cost of the asset at the end of the capital project unless the immovable asset is recorded by another Department in which case the completed project costs are transferred to that Department.
16.2 Movable Capital Assets
Movable capital assets are initially recorded in the notes to the financial statements at cost. Movable capital assets acquired through a non-exchange transactions are measured at fair value as at the date of acquisition.
Where the cost of movable capital assets cannot be determined reliably the movable capital assets are measured at fair value and where fair value cannot be determined; the movable assets are measured at R1.
All assets acquired prior to 1 April 2002 (or a later date as approved by the OAG) may be recorded at R1.
Movable capital assets are subsequently carried at cost and are not subject to depreciation or impairment.
Subsequent expenditure that is of a capital nature is added to the cost of the asset at the end of the capital project unless the movable asset is recorded by another Department/entity in which case the completed project costs are transferred to that Department.
16.3 Intangible Assets
Intangible assets are initially recorded in the notes to the financial statements at cost. Intangible assets acquired through a non-exchange transaction are measured at fair value as at the date of acquisition.
Internally generated intangible assets are recorded in the notes to the financial statements when the Department commences the development phase of the project.
Where the cost of intangible assets cannot be determined reliably the intangible capital assets are measured at fair value and where fair value cannot be determined; the intangible assets are measured at R1.

page 144
All assets acquired prior to 1 April 2002 (or a later date as approved by the OAG) may be recorded at R1.
Intangible assets are subsequently carried at cost and are not subject to depreciation or impairment.
Subsequent expenditure that is of a capital nature is added to the cost of the asset at the end of the capital project unless the intangible asset is recorded by another department/entity in which case the completed project costs are transferred to that Department.
17. PROVISIONS AND CONTINGENTS
17.1 Provisions
Provisions are recorded in the notes to the financial statements when there is a present legal or constructive obligation to forfeit economic benefits as a result of events in the past and it is probable that an outflow of resources embodying economic benefits or service potential will be required to settle the obligation and a reliable estimate of the obligation can be made. The provision is measured as the best estimate of the funds required to settle the present obligation at the reporting date.
17.2 Contingent Liabilities
Contingent liabilities are recorded in the notes to the financial statements when there is a possible obligation that arises from past events and whose existence will be confirmed only by the occurrence or non-occurrence of one or more uncertain future events not within the control of the Department or when there is a present obligation that is not recognised because it is not probable that an outflow of resources will be required to settle the obligation or the amount of the obligation cannot be measured reliably.
17.3 Contingent Assets
Contingent assets are recorded in the notes to the financial statements when a possible asset arises from past events and whose existence will be confirmed by the occurrence or non-occurrence of one or more uncertain future events not within the control of the Department.
17.4 Commitments
Commitments (other than for transfers and subsidies) are recorded at cost in the notes to the financial statements when there is a contractual arrangement or an approval by management in a manner that raises a valid expectation that the Department will discharge its responsibilities thereby incurring future expenditure that will result in the outflow of cash.

page 145
18. UNAUTHORISED EXPENDITURE
Unauthorised expenditure is recognised in the statement of financial position until such time as the expenditure is either:
•approved by Parliament or the Provincial Legislature with funding and the related funds are received; or
•approved by Parliament or the Provincial Legislature without funding and is written off against the appropriation in the statement of financial performance; or
•transferred to receivables for recovery.
Unauthorised expenditure is measured at the amount of the confirmed unauthorised expenditure.
19. FRUITLESS AND WASTEFUL EXPENDITURE
Fruitless and wasteful expenditure is recorded in the notes to the financial statements when confirmed. The amount recorded is equal to the total value of the fruitless and/or wasteful expenditure incurred.
Fruitless and wasteful expenditure is removed from the notes to the financial statements when it is resolved or transferred to receivables for recovery.
Fruitless and wasteful expenditure receivables are measured at the amount that is expected to be recoverable and are de-recognised when settled or subsequently written-off as irrecoverable.
20. IRREGULAR EXPENDITURE
Irregular expenditure is recorded in the notes to the financial statements when confirmed. The amount recorded is equal to the total value of the irregularity unless it is impracticable to determine in which case reasons therefore are provided in the note.
Irregular expenditure is removed from the note when it is either condoned by the relevant authority transferred to receivables for recovery or not condoned and is not recoverable.
Irregular expenditure receivables are measured at the amount that is expected to be recoverable and are de-recognised when settled or subsequently written-off as irrecoverable.
21. CHANGES IN ACCOUNTING POLICIES ACCOUNTING ESTIMATES AND ERRORS
Changes in accounting policies that are effected by management have been applied retrospectively in accordance with MCS requirements except to the extent that it is impracticable to determine the period-specific effects or the cumulative effect of the change in policy. In such instances the Department shall restate the opening balances of assets liabilities and net assets for the earliest period for which retrospective restatement is practicable.

page 146
Changes in accounting estimates are applied prospectively in accordance with MCS requirements.
Correction of errors is applied retrospectively in the period in which the error has occurred in accordance with MCS requirements except to the extent that it is impracticable to determine the period-specific effects or the cumulative effect of the error. In such cases the Department shall restate the opening balances of assets liabilities and net assets for the earliest period for which retrospective restatement is practicable.
22. EVENTS AFTER THE REPORTING DATE
Events after the reporting date that are classified as adjusting events have been accounted for in the financial statements. The events after the reporting date that are classified as non-adjusting events after the reporting date have been disclosed in the notes to the financial statements.
23. CAPITALISATION RESERVE
The capitalisation reserve comprises of financial assets and/or liabilities originating in a prior reporting period but which are recognised in the statement of financial position for the first time in the current reporting period. Amounts are recognised in the capitalisation reserves when identified in the current period and are transferred to the National/Provincial Revenue Fund when the underlying asset is disposed and the related funds are received.
24. RECOVERABLE REVENUE
Amounts are recognised as recoverable revenue when a payment made in a previous financial year becomes recoverable from a debtor in the current financial year. Amounts are either transferred to the National/Provincial Revenue Fund when recovered or are transferred to the statement of financial performance when written-off.
25. RELATED PARTY TRANSACTIONS
A related party transaction is a transfer of resources services or obligations between the reporting entity and a related party. Related party transactions within the Minister’s portfolio are recorded in the notes to the financial statements when the transaction is not at arm’s length.
Key management personnel are those persons having the authority and responsibility for planning directing and controlling the activities of the Department. The number of individuals and their full compensation is recorded in the notes to the financial statements.

page 147
26. PUBLIC-PRIVATE PARTNERSHIPS
Public Private Partnerships are accounted for based on the nature and/or the substance of the partnership. The transaction is accounted for in accordance with the relevant accounting policies.
A summary of the significant terms of the PPP agreement the parties to the agreement and the date of commencement thereof together with the description and nature of the concession fees received the unitary fees paid rights and obligations of the Department are recorded in the notes to the financial statements.
27. EMPLOYEE BENEFITS
The value of each major class of employee benefit obligation (accruals payables not recognised and provisions) is disclosed in the Employee Benefits Note.

page 148
TELE
CO
MM
UNIC
ATIO
NS
AND
PO
STAL
SER
VIC
ES –
VO
TE 3
2
APPR
OPR
IATI
ON
STA
TEM
ENT
for t
he y
ear e
nded
31
Mar
ch 2
018
App
rop
riatio
n p
er p
rog
ram
me
2017
/18
2016
/17
Vote
d fu
nds
and
dire
ct c
harg
es
Adju
sted
Ap
pro
pri-
atio
nSh
iftin
g o
f Fu
nds
Vire
men
t
Fina
l Ap
-p
rop
ria-
tion
Actu
al E
x-p
end
iture
Varia
nce
Exp
end
i-tu
re a
s %
of
fina
l a
pp
rop
ri-a
tion
Fina
l Ap
-p
rop
ria-
tion
Actu
al E
x-p
end
iture
R'00
0R'
000
R'00
0R'
000
R'00
0R'
000
%R'
000
R'00
0 P
rog
ram
me
1.
Adm
inist
ratio
n19
8 13
0-
11 4
4820
9 57
820
9 45
212
699
.9%
217
322
211
582
2.In
tern
atio
nal A
ffairs
and
Trad
e50
920
-82
851
748
50 6
121
136
97.8
%48
430
46 9
443.
Polic
y R
esea
rch
and
Cap
acity
Dev
elop
men
t85
523
-(1
005
)84
518
78 5
245
994
92.9
%88
775
78 4
944.
ICT
Ente
rpris
e D
evel
opm
ent a
nd O
vers
ight
3 95
1 69
1-
(1 4
03)
3 95
0 28
83
949
056
1 23
210
0.0%
886
608
882
353
5.IC
T In
frast
ruct
ure
Supp
ort
888
113
-(9
868
)87
8 24
560
4 41
127
3 83
468
.8%
1 17
6 27
785
6 31
9TO
TAL
5 17
4 37
7-
-5
174
377
4 89
2 05
528
2 32
294
.5%
2 41
7 41
22
075
692
Reco
ncili
atio
n w
ith S
tate
men
t of F
ina
ncia
l Per
form
anc
e Ad
d:
Dep
artm
enta
l rec
eipt
s 1
141
106
831
411
N
RF re
ceip
ts
--
Ai
d as
sista
nce
-
-
Actu
al a
mou
nts
per
Sta
tem
ent o
f Fin
anc
ial P
erfo
rma
nce
(Tot
al
Reve
nue)
6
315
483
3 24
8 82
3Ad
d:
Aid
assis
tanc
e
--
Pr
ior y
ear u
naut
horis
ed e
xpen
ditu
re a
ppro
ved
with
out f
undi
ng
Act
ual a
mou
nts
per
Sta
tem
ent o
f Fin
anc
ial P
erfo
rma
nce
Exp
end
iture
4
892
055
2 07
5 69
2

page 149
Ap
pro
pria
tion
per
eco
nom
ic c
lass
ifica
tion
2017
/18
2016
/17
Adju
sted
Ap
pro
pri-
atio
nSh
if tin
g o
f Fu
nds
Vire
men
t
Fina
l Ap
-p
rop
ria-
tion
Actu
al E
x-p
end
iture
Varia
nce
Exp
end
i-tu
re a
s %
of
fina
l a
pp
rop
ri-a
tion
Fina
l Ap
-p
rop
ria-
tion
Actu
al E
x-p
end
iture
R'00
0R'
000
R'00
0R'
000
R'00
0R'
000
%R'
000
R'00
0
C
urre
nt p
aym
ents
655
647
(1 8
27)
(763
)65
3 05
737
2 13
428
0 92
357
.0%
695
254
358
853
C
ompe
nsat
ion
of e
mpl
oyee
s22
1 20
6-
-22
1 20
621
9 84
31
363
99.4
%21
3 71
320
5 24
8
Sa
larie
s an
d w
ages
191
867
4 48
068
719
7 03
419
5 99
11
043
99.5
%18
7 78
318
2 40
7
So
cial
con
tribu
tions
29 3
39(4
480
)(6
87)
24 1
7223
852
320
98.7
%25
930
22 8
41
G
oods
and
ser
vice
s43
4 44
1(1
827
)(7
63)
431
851
152
291
279
560
35.3
%48
1 54
115
3 60
5
Ad
min
istra
tive
fees
1 35
415
7(9
)1
502
1 35
514
790
.2%
1 67
71
445
Ad
verti
sing
2 36
827
6(1
50)
2 49
42
120
374
85.0
%3
960
3 31
2
M
inor
ass
ets
1 26
9(2
88)
(250
)73
133
639
546
.0%
1 04
511
4
Au
dit c
osts
: Ext
erna
l3
857
1 58
71
519
6 96
36
962
110
0.0%
6 49
96
499
Bu
rsar
ies:
Em
ploy
ees
2 27
6(6
29)
-1
647
1 29
135
678
.4%
1 02
381
7
C
ater
ing:
Dep
artm
enta
l act
iviti
es1
698
483
(126
)2
055
1 77
128
486
.2%
2 16
61
794
C
omm
unic
atio
n (G
&S)
5 58
611
(154
)5
443
5 24
519
896
.4%
6 35
15
714
C
ompu
ter s
ervi
ces
11 2
87(2
685
)(1
630
)6
972
6 97
11
100.
0%6
431
5 72
6
C
onsu
ltant
s: B
usin
ess
and
advi
sory
ser
vice
s30
1 40
43
119
(5 4
81)
299
042
25 4
4527
3 59
78.
5%11
659
8 87
2
Le
gal s
ervi
ces
4 10
083
513
95
074
5 07
4-
100.
0%8
285
7 45
4
C
ontra
ctor
s3
264
(519
)1
913
4 65
84
101
557
88.0
%3
107
2 80
3
Ag
ency
and
sup
port
/ out
sour
ced
ser v
ices
2 33
7(2
048
)(1
0)27
93
276
1.1%
311
697
24
En
terta
inm
ent
326
(190
)(7
)12
950
7938
.8%
209
23

page 150
Ap
pro
pria
tion
per
eco
nom
ic c
lass
ifica
tion
2017
/18
2016
/17
Adju
sted
Ap
pro
pri-
atio
nSh
iftin
g o
f Fu
nds
Vire
men
t
Fina
l Ap
-p
rop
ria-
tion
Actu
al E
x-p
end
iture
Varia
nce
Exp
end
i-tu
re a
s %
of
fina
l a
pp
rop
ri-a
tion
Fina
l Ap
-p
rop
ria-
tion
Actu
al E
x-p
end
iture
R'00
0R'
000
R'00
0R'
000
R'00
0R'
000
%R'
000
R'00
0
Fl
eet s
ervi
ces
(incl
udin
g go
vern
men
t mot
or
trans
port)
661
511
-1
172
1 15
913
98.9
%1
210
1 19
4
In
vent
ory:
Clo
thin
g m
ater
ial a
nd
acce
ssor
ies
-24
-24
231
95.8
%-
-
In
vent
ory:
Fue
l oi
l and
gas
21(1
4)-
7-
7-
--
In
vent
ory:
Mat
eria
ls an
d su
pplie
s27
(27)
--
--
-27
20
In
vent
ory:
Oth
er s
uppl
ies
23(2
3)-
--
--
61-
C
onsu
mab
le s
uppl
ies
204
15-
219
178
4181
.3%
263
226
C
onsu
mab
le: S
tatio
nery
prin
ting
and
offic
e su
pplie
s6
603
(1 1
52)
(37)
5 41
44
826
588
89.1
%6
973
6 28
1
O
pera
ting
leas
es29
852
1 37
03
686
34 9
0834
434
474
98.6
%42
763
41 8
37
Pr
oper
ty p
aym
ents
13 7
33(2
264
)89
712
366
12 3
5016
99.9
%12
073
12 0
64
Tra
nspo
rt pr
ovid
ed: D
epar
tmen
tal a
ctiv
ity14
0(1
40)
--
--
--
-
T ra
vel a
nd s
ubsis
tenc
e23
692
7 93
216
731
791
30 8
6292
997
.1%
33 1
2431
547
Tra
inin
g an
d de
velo
pmen
t9
261
(6 1
47)
-3
114
2 61
050
483
.8%
12 8
029
955
O
pera
ting
paym
ents
995
245
(92)
1 14
81
002
146
87.3
%2
370
912
Ve
nues
and
faci
litie
s7
448
(2 7
26)
(1 1
38)
3 58
43
109
475
86.7
%5
277
4 48
3
Re
ntal
and
hirin
g65
546
0-
1 11
51
014
101
90.9
%48
948
9
Tr
ans
fers
and
sub
sid
ies
806
713
1 70
751
380
8 93
380
8 93
12
100.
0%1
057
493
1 05
7 49
3

page 151
Ap
pro
pria
tion
per
eco
nom
ic c
lass
ifica
tion
2017
/18
2016
/17
Adju
sted
Ap
pro
pri-
atio
nSh
if tin
g o
f Fu
nds
Vire
men
t
Fina
l Ap
-p
rop
ria-
tion
Actu
al E
x-p
end
iture
Varia
nce
Exp
end
i-tu
re a
s %
of
fina
l a
pp
rop
ri-a
tion
Fina
l Ap
-p
rop
ria-
tion
Actu
al E
x-p
end
iture
R'00
0R'
000
R'00
0R'
000
R'00
0R'
000
%R'
000
R'00
0
Pr
ovin
ces
and
mun
icip
aliti
es-
-14
1414
-10
0.0%
1717
Pr
ovin
cial
age
ncie
s an
d fu
nds
--
--
--
-4
4
M
unic
ipal
ities
--
1414
14-
100.
0%13
13
M
unic
ipal
age
ncie
s an
d fu
nds
--
1414
14-
100.
0%13
13
D
epar
tmen
tal a
genc
ies
and
acco
unts
295
181
--
295
181
295
181
-10
0.0%
790
789
790
789
D
epar
tmen
tal a
genc
ies
(non
-bus
ines
s en
titie
s)29
5 18
1-
-29
5 18
129
5 18
1-
100.
0%79
0 78
979
0 78
9
Fo
reig
n go
vern
men
ts a
nd in
tern
atio
nal
orga
nisa
tions
25 5
3243
4-
25 9
6625
964
210
0.0%
26 1
3626
136
Pu
blic
cor
pora
tions
and
priv
ate
ente
rpris
es48
6 00
0-
-48
6 00
048
6 00
0-
100.
0%24
0 05
024
0 05
0
Pu
blic
cor
pora
tions
486
000
--
486
000
486
000
-10
0.0%
240
000
240
000
O
ther
tran
sfer
s to
pub
lic
corp
orat
ions
486
000
--
486
000
486
000
-10
0.0%
240
000
240
000
P r
ivat
e en
terp
rises
--
--
--
-50
50
O
ther
tran
sfer
s to
priv
ate
ente
rpris
es-
--
--
--
5050
N
on-p
rofit
inst
itutio
ns-
--
--
--
2525
Ho
useh
olds
-1
273
499
1 77
21
772
-10
0.0%
476
476
So
cial
ben
efits
-77
047
01
240
1 24
0-
100.
0%31
831
8
O
ther
tran
sfer
s to
hou
seho
lds
-50
329
532
532
-10
0.0%
158
158

page 152
Ap
pro
pria
tion
per
eco
nom
ic c
lass
ifica
tion
2017
/18
2016
/17
Adju
sted
Ap
pro
pri-
atio
nSh
if tin
g o
f Fu
nds
Vire
men
t
Fina
l Ap
-p
rop
ria-
tion
Actu
al E
x-p
end
iture
Varia
nce
Exp
end
i-tu
re a
s %
of
fina
l a
pp
rop
ri-a
tion
Fina
l Ap
-p
rop
ria-
tion
Actu
al E
x-p
end
iture
R'00
0R'
000
R'00
0R'
000
R'00
0R'
000
%R'
000
R'00
0
Pa
ymen
ts fo
r ca
pita
l ass
ets
12 0
1712
0-
12 1
3710
740
1 39
788
.5%
14 6
189
299
M
achi
nery
and
equ
ipm
ent
9 06
2(2
300
)(7
24)
6 03
84
728
1 31
078
.3%
7 15
35
098
Tra
nspo
rt eq
uipm
ent
4 60
0(2
674
)-
1 92
61
926
-10
0.0%
200
-
O
ther
mac
hine
r y a
nd e
quip
men
t4
462
374
(724
)4
112
2 80
21
310
68.1
%6
953
5 09
8
So
ftwar
e an
d ot
her i
ntan
gibl
e as
sets
2 95
52
420
724
6 09
96
012
8798
.6%
7 46
54
201
Pa
ymen
t for
fina
ncia
l ass
ets
3 70
0 00
0-
250
3 70
0 25
03
700
250
-10
0.0%
650
047
650
047
5 17
4 37
7-
-5
174
377
4 89
2 05
528
2 32
294
.5%
2 41
7 41
22
075
692

page 153
Prog
ram
me
1: A
DM
INIS
TRAT
ION
2017
/18
2016
/17
Adju
sted
Ap
pro
pri-
atio
nSh
iftin
g o
f Fu
nds
Vire
men
t
Fina
l Ap
-p
rop
ria-
tion
Actu
al E
x-p
end
iture
Varia
nce
Exp
end
i-tu
re a
s %
of
fina
l a
pp
rop
ri-a
tion
Fina
l Ap
-p
rop
ria-
tion
Actu
al E
x-p
end
iture
R'00
0R'
000
R'00
0R'
000
R'00
0R'
000
%R'
000
R'00
0
Sub
-pro
gra
mm
e
1.M
inist
ry4
011
217
-4
228
4 22
8-
100.
0%4
358
4 21
1
2.D
epar
tmen
tal M
anag
emen
t38
859
6 31
12
888
48 0
5847
986
7299
.9%
52 8
0252
052
3.In
tern
al A
udit
7 49
7(2
095
)-
5 40
25
402
-10
0.0%
7 16
23
939
4.C
orpo
rate
Ser
vice
s74
626
(1 9
21)
1 57
474
279
74 2
4237
100.
0%71
577
70 4
86
5.Fi
nanc
ial M
anag
emen
t69
539
(1 7
50)
6 98
674
775
74 7
5817
100.
0%76
210
75 6
81
6.O
ffice
Acc
omm
odat
ion
3 59
8(7
62)
-2
836
2 83
6-
100.
0%5
213
5 21
3
198
130
-11
448
209
578
209
452
126
99.9
%21
7 32
221
1 58
2
Econ
omic
cla
ssifi
catio
n
C
urre
nt p
aym
ents
190
556
(749
)9
111
198
918
198
792
126
99.9
%20
5 64
920
4 10
6
C
ompe
nsat
ion
of e
mpl
oyee
s10
3 80
4-
(828
)10
2 97
610
2 89
086
99.9
%96
366
94 8
23
Sa
larie
s an
d w
ages
92 6
13(1
204
)(6
9)91
340
91 2
5486
99.9
%85
439
83 9
89
So
cial
con
tribu
tions
11 1
911
204
(759
)11
636
11 6
36-
100.
0%10
927
10 8
34
G
oods
and
ser
vice
s86
752
(749
)9
939
95 9
4295
902
4010
0.0%
109
283
109
283
Ad
min
istra
tive
fees
653
8831
772
772
-10
0.0%
719
719
Ad
verti
sing
1 20
643
0-
1 63
61
629
799
.6%
1 07
91
079
M
inor
ass
ets
553
(307
)-
246
245
199
.6%
8080
Au
dit c
osts
: Ext
erna
l3
807
1 62
91
527
6 96
36
962
110
0.0%
6 49
96
499

page 154
Prog
ram
me
1: A
DM
INIS
TRAT
ION
2017
/18
2016
/17
Adju
sted
Ap
pro
pri-
atio
nSh
iftin
g o
f Fu
nds
Vire
men
t
Fina
l Ap
-p
rop
ria-
tion
Actu
al E
x-p
end
iture
Varia
nce
Exp
end
i-tu
re a
s %
of
fina
l a
pp
rop
ri-a
tion
Fina
l Ap
-p
rop
ria-
tion
Actu
al E
x-p
end
iture
R'00
0R'
000
R'00
0R'
000
R'00
0R'
000
%R'
000
R'00
0
Bu
rsar
ies:
Em
ploy
ees
730
(106
)-
624
624
-10
0.0%
311
311
C
ater
ing:
Dep
artm
enta
l act
iviti
es91
4(2
90)
-62
461
95
99.2
%1
270
1 27
0
C
omm
unic
atio
n (G
&S)
1 61
51
044
-2
659
2 65
9-
100.
0%3
096
3 09
6
C
ompu
ter s
ervi
ces
8 39
5(3
072
)-
5 32
35
323
-10
0.0%
5 51
25
512
C
onsu
ltant
s: B
usin
ess
and
advi
sory
ser
vice
s3
638
(2 8
45)
-79
379
3-
100.
0%2
165
2 16
5
Le
gal s
ervi
ces
4 10
083
513
95
074
5 07
4-
100.
0%7
454
7 45
4
C
ontra
ctor
s1
539
(755
)1
913
2 69
72
697
-10
0.0%
2 63
22
632
Ag
ency
and
sup
port
/ out
sour
ced
serv
ices
30(2
5)-
53
260
.0%
2424
En
terta
inm
ent
48(1
2)-
3628
877
.8%
1010
Fl
eet s
ervi
ces
(incl
udin
g go
vern
men
t mot
or
trans
port)
656
279
-93
593
5-
100.
0%86
086
0
In
vent
ory:
Clo
thin
g m
ater
ial a
nd
acce
ssor
ies
-24
-24
231
95.8
%-
-
In
vent
ory:
Fue
l oi
l and
gas
21(1
4)-
7-
7-
--
In
vent
ory:
Mat
eria
ls an
d su
pplie
s12
(12)
--
--
-18
18
In
vent
ory:
Oth
er s
uppl
ies
23(2
3)-
--
--
--
C
onsu
mab
le s
uppl
ies
166
(34)
-13
213
2-
100.
0%18
518
5
C
onsu
mab
le: S
tatio
nery
prin
ting
and
offic
e su
pplie
s4
426
(1 8
38)
-2
588
2 58
8-
100.
0%4
192
4 19
2

page 155
Prog
ram
me
1: A
DM
INIS
TRAT
ION
2017
/18
2016
/17
Adju
sted
Ap
pro
pri-
atio
nSh
iftin
g o
f Fu
nds
Vire
men
t
Fina
l Ap
-p
rop
ria-
tion
Actu
al E
x-p
end
iture
Varia
nce
Exp
end
i-tu
re a
s %
of
fina
l a
pp
rop
ri-a
tion
Fina
l Ap
-p
rop
ria-
tion
Actu
al E
x-p
end
iture
R'00
0R'
000
R'00
0R'
000
R'00
0R'
000
%R'
000
R'00
0
O
pera
ting
leas
es28
716
1 29
63
704
33 7
1633
709
710
0.0%
41 0
4741
047
Pr
oper
ty p
aym
ents
12 5
85(1
573
)89
711
909
11 9
09-
100.
0%11
699
11 6
99
Tra
vel a
nd s
ubsis
tenc
e8
533
5 45
21
728
15 7
1315
713
-10
0.0%
17 1
8017
180
Tra
inin
g an
d de
velo
pmen
t1
038
292
-1
330
1 33
0-
100.
0%1
467
1 46
7
O
pera
ting
paym
ents
731
(68)
-66
366
21
99.8
%82
082
0
Ve
nues
and
faci
litie
s2
157
(1 6
10)
-54
754
7-
100.
0%50
550
5
Re
ntal
and
hirin
g32
060
6-
926
926
-10
0.0%
459
459
Tr
ans
fers
and
sub
sid
ies
-62
951
31
142
1 14
2-
100.
0%34
634
6
Pr
ovin
ces
and
mun
icip
aliti
es-
-14
1414
-10
0.0%
1717
Pr
ovin
ces
--
--
--
-4
4
Pr
ovin
cial
age
ncie
s an
d fu
nds
--
--
--
-4
4
M
unic
ipal
ities
--
1414
14-
100.
0%13
13
M
unic
ipal
age
ncie
s an
d fu
nds
--
1414
14-
100.
0%13
13
D
epar
tmen
tal a
genc
ies
and
acco
unts
--
--
--
-4
4
D
epar
tmen
tal a
genc
ies
(non
-bus
ines
s en
titie
s)-
--
--
--
44
Pu
blic
cor
pora
tions
and
priv
ate
ente
rpris
es-
--
--
--
4040
Pr
ivat
e en
terp
rises
--
--
--
-40
40

page 156
Prog
ram
me
1: A
DM
INIS
TRAT
ION
2017
/18
2016
/17
Adju
sted
Ap
pro
pri-
atio
nSh
iftin
g o
f Fu
nds
Vire
men
t
Fina
l Ap
-p
rop
ria-
tion
Actu
al E
x-p
end
iture
Varia
nce
Exp
end
i-tu
re a
s %
of
fina
l a
pp
rop
ri-a
tion
Fina
l Ap
-p
rop
ria-
tion
Actu
al E
x-p
end
iture
R'00
0R'
000
R'00
0R'
000
R'00
0R'
000
%R'
000
R'00
0
O
ther
tran
sfer
s to
priv
ate
ente
rpris
es-
--
--
--
4040
Ho
useh
olds
-62
949
91
128
1 12
8-
100.
0%28
528
5
So
cial
ben
efits
-16
847
063
863
8-
100.
0%25
125
1
O
ther
tran
sfer
s to
hou
seho
lds
-46
129
490
490
-10
0.0%
3434
Pa
ymen
ts fo
r ca
pita
l ass
ets
7 57
412
01
574
9 26
89
268
-10
0.0%
11 2
807
083
M
achi
nery
and
equ
ipm
ent
5 56
9(2
300
)-
3 26
93
269
-10
0.0%
4 19
53
262
Tra
nspo
rt eq
uipm
ent
4 60
0(2
674
)-
1 92
61
926
-10
0.0%
200
-
O
ther
mac
hine
ry a
nd e
quip
men
t96
937
4-
1 34
31
343
-10
0.0%
3 99
53
262
So
ftwar
e an
d ot
her i
ntan
gibl
e as
sets
2 00
52
420
1 57
45
999
5 99
9-
100.
0%7
085
3 82
1
Pa
ymen
t for
fina
ncia
l ass
ets
--
250
250
250
-10
0.0%
4747
198
130
-11
448
209
578
209
452
126
99.9
%21
7 32
221
1 58
2

page 157
Sub
-pro
gra
mm
e 1.
1: M
INIS
TRY
2017
/18
2016
/17
Adju
sted
Ap
pro
pri-
atio
nSh
iftin
g o
f Fu
nds
Vire
men
t
Fina
l Ap
-p
rop
ria-
tion
Actu
al E
x-p
end
iture
Varia
nce
Exp
end
i-tu
re a
s %
of
fina
l a
pp
rop
ri-a
tion
Fina
l Ap
-p
rop
ria-
tion
Actu
al E
x-p
end
iture
Econ
omic
cla
ssifi
catio
nR'
000
R'00
0R'
000
R'00
0R'
000
R'00
0%
R'00
0R'
000
Cur
rent
pa
ymen
ts4
011
217
-4
228
4 22
8-
100.
0%4
358
4 21
1
Com
pens
atio
n of
em
ploy
ees
4 01
121
7-
4 22
84
228
-10
0.0%
4 35
84
211
Tot
al
4 01
121
7-
4 22
84
228
-10
0.0%
4 35
84
211

page 158
Sub
-pro
gra
mm
e 1.
2: D
EPAR
TMEN
TAL
MAN
AGEM
ENT
2017
/18
2016
/17
Adju
sted
Ap
pro
pri-
atio
nSh
iftin
g o
f Fu
nds
Vire
men
t
Fina
l Ap
-p
rop
ria-
tion
Actu
al E
x-p
end
iture
Varia
nce
Exp
end
i-tu
re a
s %
of
fina
l a
pp
rop
ri-a
tion
Fina
l Ap
-p
rop
ria-
tion
Actu
al E
x-p
end
iture
Econ
omic
cla
ssifi
catio
n R'
000
R'00
0R'
000
R'00
0R'
000
R'00
0%
R'00
0R'
000
Cur
rent
pa
ymen
ts38
849
6 02
02
597
47 4
6647
394
7299
.8%
51 9
0851
688
Com
pens
atio
n of
em
ploy
ees
26 4
10(2
75)
(828
)25
307
25 2
6146
99.8
%25
354
25 1
34
Sala
ries
and
wag
es23
441
(275
)(6
9)23
097
23 0
5146
99.8
%23
154
23 0
00
Soci
al c
ontri
butio
ns2
969
-(7
59)
2 21
02
210
-10
0.0%
2 20
02
134
Goo
ds a
nd s
ervi
ces
12 4
396
295
3 42
522
159
22 1
3326
99.9
%26
554
26 5
54
Adm
inist
rativ
e fe
es41
585
3153
153
1-
100.
0%45
545
5
Adve
rtisin
g29
4(1
96)
-98
971
99.0
%-
-
Min
or a
sset
s31
1(2
61)
-50
491
98.0
%57
57
Audi
t cos
ts: E
xter
nal
307
-1
527
1 83
41
834
-10
0.0%
2 91
12
911
Burs
arie
s: E
mpl
oyee
s60
225
-28
528
5-
100.
0%54
54
Cat
erin
g: D
epar
tmen
tal a
ctiv
ities
729
(283
)-
446
441
598
.9%
1 04
51
045
Com
mun
icat
ion
(G&
S)40
495
1-
1 35
51
355
-10
0.0%
1 35
31
353
Con
sulta
nts:
Bus
ines
s an
d ad
viso
ry s
ervi
ces
-43
9-
439
439
-10
0.0%
732
732
Lega
l ser
vice
s10
01
116
139
1 35
51
355
-10
0.0%
1 86
91
869
Con
tract
ors
221
(137
)-
8484
-10
0.0%
141
141
Agen
cy a
nd s
uppo
rt / o
utso
urce
d se
rvic
es30
(30)
--
--
-17
17
Ente
rtain
men
t8
14-
2218
481
.8%
88

page 159
Sub
-pro
gra
mm
e 1.
2: D
EPAR
TMEN
TAL
MAN
AGEM
ENT
2017
/18
2016
/17
Adju
sted
Ap
pro
pri-
atio
nSh
iftin
g o
f Fu
nds
Vire
men
t
Fina
l Ap
-p
rop
ria-
tion
Actu
al E
x-p
end
iture
Varia
nce
Exp
end
i-tu
re a
s %
of
fina
l a
pp
rop
ri-a
tion
Fina
l Ap
-p
rop
ria-
tion
Actu
al E
x-p
end
iture
Econ
omic
cla
ssifi
catio
n R'
000
R'00
0R'
000
R'00
0R'
000
R'00
0%
R'00
0R'
000
Flee
t ser
vice
s (in
clud
ing
gove
rnm
ent m
otor
tra
nspo
rt)-
82-
8282
-10
0.0%
7676
Inve
ntor
y: F
uel
Oil
and
Gas
21(1
4)7
--
--
--
Inve
ntor
y: M
ater
ials
and
supp
lies
6(6
)-
--
--
44
Inve
ntor
y: O
ther
sup
plie
s23
(23)
--
--
--
-
Con
sum
able
sup
plie
s78
(39)
-39
39-
100.
0%57
57
Con
sum
able
: Sta
tione
ry p
rintin
g an
d of
fice
supp
lies
764
(192
)-
572
572
-10
0.0%
980
980
Ope
ratin
g le
ases
400
200
-60
059
37
98.8
%64
864
8
Prop
erty
pay
men
ts92
(92)
--
--
-28
628
6
Trans
port
prov
ided
: Dep
artm
enta
l act
ivity
140
(140
)-
--
--
--
Trave
l and
sub
siste
nce
6 23
25
719
1 72
813
679
13 6
79-
100.
0%15
040
15 0
40
Train
ing
and
deve
lopm
ent
128
229
-35
735
7-
100.
0%10
410
4
Ope
ratin
g pa
ymen
ts9
135
-14
414
31
99.3
%25
225
2
Venu
es a
nd fa
cilit
ies
1 46
7(1
449
)-
1818
-10
0.0%
108
108
Rent
al a
nd h
iring
200
(38)
-16
216
2-
100.
0%35
735
7
Tra
nsfe
rs a
nd s
ubsi
die
s-
-29
129
129
1-
100.
0%97
97
Prov
ince
s an
d m
unic
ipal
ities
--
11
1-
100.
0%-
-

page 160
Sub
-pro
gra
mm
e 1.
2: D
EPAR
TMEN
TAL
MAN
AGEM
ENT
2017
/18
2016
/17
Adju
sted
Ap
pro
pri-
atio
nSh
iftin
g o
f Fu
nds
Vire
men
t
Fina
l Ap
-p
rop
ria-
tion
Actu
al E
x-p
end
iture
Varia
nce
Exp
end
i-tu
re a
s %
of
fina
l a
pp
rop
ri-a
tion
Fina
l Ap
-p
rop
ria-
tion
Actu
al E
x-p
end
iture
Econ
omic
cla
ssifi
catio
n R'
000
R'00
0R'
000
R'00
0R'
000
R'00
0%
R'00
0R'
000
Mun
icip
aliti
es-
-1
11
-10
0.0%
--
Mun
icip
al a
genc
ies
and
fund
s-
-1
11
-10
0.0%
--
Publ
ic c
orpo
ratio
ns a
nd p
rivat
e en
terp
rises
--
--
--
-34
34
Priv
ate
ente
rpris
es-
--
--
--
3434
Oth
er tr
ansf
ers
to p
rivat
e en
terp
rises
--
--
--
-34
34
Hous
ehol
ds-
-29
029
029
0-
100.
0%63
63
Soci
al b
enef
its-
-27
527
527
5-
100.
0%36
36
Oth
er tr
ansf
ers
to h
ouse
hold
s-
-15
1515
-10
0.0%
2727
Paym
ents
for c
ap
ital a
sset
s10
291
-30
130
1-
100.
0%79
726
7
Mac
hine
ry a
nd e
quip
men
t10
280
-29
029
0-
100.
0%79
726
7
Oth
er m
achi
nery
and
equ
ipm
ent
1028
0-
290
290
-10
0.0%
797
267
Softw
are
and
othe
r int
angi
ble
asse
ts-
11-
1111
-10
0.0%
--
Tot
al
38 8
596
311
2 88
848
058
47 9
8672
99.9
%52
802
52 0
52

page 161
Sub
-pro
gra
mm
e 1.
3: IN
TERN
AL A
UDIT
20
17/1
820
16/1
7
Adju
sted
Ap
pro
pri-
atio
nSh
if tin
g o
f Fu
nds
Vire
men
t
Fina
l Ap
-p
rop
ria-
tion
Actu
al E
x-p
end
iture
Varia
nce
Exp
end
i-tu
re a
s %
of
fina
l a
pp
rop
ri-a
tion
Fina
l Ap
-p
rop
ria-
tion
Actu
al E
x-p
end
iture
Eco
nom
ic c
lass
ifica
tion
R'00
0R'
000
R'00
0R'
000
R'00
0R'
000
%R'
000
R'00
0
Cur
rent
pa
ymen
ts5
417
(104
)-
5 31
35
313
-10
0.0%
4 62
13
787
Com
pens
atio
n of
em
ploy
ees
4 67
432
-4
706
4 70
6-
100.
0%4
302
3 46
8
Sala
ries
and
wag
es4
226
(66)
-4
160
4 16
0-
100.
0%3
865
3 03
1
Soci
al c
ontri
butio
ns44
898
-54
654
6-
100.
0%43
743
7
Goo
ds a
nd s
ervi
ces
743
(136
)-
607
607
-10
0.0%
319
319
Adm
inist
rativ
e fe
es30
(25)
-5
5-
100.
0%-
-
Min
or a
sset
s-
4-
44
-10
0.0%
--
Burs
arie
s: E
mpl
oyee
s80
(43)
-37
37-
100.
0%15
15
Com
mun
icat
ion
(G&
S)10
8(4
3)-
6565
-10
0.0%
4040
Com
pute
r ser
vice
s40
(40)
--
--
--
-
Con
sulta
nts:
Bus
ines
s an
d ad
viso
ry s
ervi
ces
--
--
--
-5
5
Ente
rtain
men
t4
(2)
-2
2-
100.
0%1
1
Flee
t ser
vice
s (in
clud
ing
gove
rnm
ent m
otor
tra
nspo
rt)-
19-
1919
-10
0.0%
5757
Con
sum
able
: Sta
tione
ry p
rintin
g an
d of
fice
supp
lies
354
-39
39-
100.
0%5
5
Ope
ratin
g le
ases
80(1
6)-
6464
-10
0.0%
5353
Trave
l and
sub
siste
nce
9414
-10
810
8-
100.
0%9
9

page 162
Sub
-pro
gra
mm
e 1.
3: IN
TERN
AL A
UDIT
20
17/1
820
16/1
7
Adju
sted
Ap
pro
pri-
atio
nSh
if tin
g o
f Fu
nds
Vire
men
t
Fina
l Ap
-p
rop
ria-
tion
Actu
al E
x-p
end
iture
Varia
nce
Exp
end
i-tu
re a
s %
of
fina
l a
pp
rop
ri-a
tion
Fina
l Ap
-p
rop
ria-
tion
Actu
al E
x-p
end
iture
Eco
nom
ic c
lass
ifica
tion
R'00
0R'
000
R'00
0R'
000
R'00
0R'
000
%R'
000
R'00
0
Train
ing
and
deve
lopm
ent
250
(95)
-15
515
5-
100.
0%13
113
1
Ope
ratin
g pa
ymen
ts22
87-
109
109
-10
0.0%
33
Tra
nsfe
rs a
nd s
ubsi
die
s-
4-
44
-10
0.0%
7676
Hous
ehol
ds-
4-
44
-10
0.0%
7676
Soci
al b
enef
its-
--
--
--
7474
Oth
er tr
ansf
ers
to h
ouse
hold
s-
4-
44
-10
0.0%
22
Paym
ents
for c
ap
ital a
sset
s2
080
(1 9
95)
-85
85-
100.
0%2
465
76
Mac
hine
ry a
nd e
quip
men
t80
5-
8585
-10
0.0%
6576
Oth
er m
achi
nery
and
equ
ipm
ent
805
-85
85-
100.
0%65
76
Softw
are
and
othe
r int
angi
ble
asse
ts2
000
(2 0
00)
--
--
-2
400
-
Tot
al
7 49
7(2
095
)-
5 40
25
402
-10
0.0%
7 16
23
939

page 163
Sub
-pro
gra
mm
e 1.
4: C
ORP
ORA
TE S
ERVI
CES
20
17/1
820
16/1
7
Adju
sted
Ap
pro
pri-
atio
nSh
if tin
g o
f Fu
nds
Vire
men
t
Fina
l Ap
-p
rop
ria-
tion
Actu
al E
x-p
end
iture
Varia
nce
Exp
end
i-tu
re a
s %
of
fina
l a
pp
rop
ri-a
tion
Fina
l Ap
-p
rop
ria-
tion
Actu
al E
x-p
end
iture
Eco
nom
ic c
lass
ifica
tion
R'00
0R'
000
R'00
0R'
000
R'00
0R'
000
%R'
000
R'00
0
Cur
rent
pa
ymen
ts73
886
(6 9
83)
-66
903
66 8
6637
99.9
%65
816
65 5
89
Com
pens
atio
n of
em
ploy
ees
48 1
0926
-48
135
48 0
9837
99.9
%42
481
42 2
54
Sala
ries
and
wag
es43
331
(911
)-
42 4
2042
383
3799
.9%
37 2
0936
982
Soci
al c
ontri
butio
ns4
778
937
-5
715
5 71
5-
100.
0%5
272
5 27
2
Goo
ds a
nd s
ervi
ces
25 7
77(7
009
)-
18 7
6818
768
-10
0.0%
23 3
3523
335
Adm
inist
rativ
e fe
es10
0(1
5)-
8585
-10
0.0%
106
106
Adve
rtisin
g90
063
2-
1 53
21
532
-10
0.0%
1 07
81
078
Min
or a
sset
s21
9(3
2)-
187
187
-10
0.0%
1414
Burs
arie
s: E
mpl
oyee
s27
0(6
3)-
207
207
-10
0.0%
122
122
Cat
erin
g: D
epar
tmen
tal a
ctiv
ities
180
(25)
-15
515
5-
100.
0%22
422
4
Com
mun
icat
ion
(G&
S)81
958
-87
787
7-
100.
0%1
468
1 46
8
Com
pute
r ser
vice
s8
333
(3 0
15)
-5
318
5 31
8-
100.
0%5
498
5 49
8
Con
sulta
nts:
Bus
ines
s an
d ad
viso
ry s
ervi
ces
3 63
8(3
284
)-
354
354
-10
0.0%
1 42
81
428
Lega
l ser
vice
s4
000
(281
)-
3 71
93
719
-10
0.0%
5 58
55
585
Con
tract
ors
700
(135
)-
565
565
-10
0.0%
1 50
31
503
Ente
rtain
men
t30
(23)
-7
7-
100.
0%1
1
Flee
t ser
vice
s (in
clud
ing
gove
rnm
ent m
otor
tra
nspo
rt)41
34-
7575
-10
0.0%
9696

page 164
Sub
-pro
gra
mm
e 1.
4: C
ORP
ORA
TE S
ERVI
CES
20
17/1
820
16/1
7
Adju
sted
Ap
pro
pri-
atio
nSh
if tin
g o
f Fu
nds
Vire
men
t
Fina
l Ap
-p
rop
ria-
tion
Actu
al E
x-p
end
iture
Varia
nce
Exp
end
i-tu
re a
s %
of
fina
l a
pp
rop
ri-a
tion
Fina
l Ap
-p
rop
ria-
tion
Actu
al E
x-p
end
iture
Eco
nom
ic c
lass
ifica
tion
R'00
0R'
000
R'00
0R'
000
R'00
0R'
000
%R'
000
R'00
0
Inve
ntor
y: C
loth
ing
mat
eria
l and
acc
esso
ries
-2
-2
2-
100.
0%-
-
Inve
ntor
y: M
ater
ials
and
supp
lies
--
--
--
-1
1
Con
sum
able
sup
plie
s6
52-
5858
-10
0.0%
4747
Con
sum
able
: Sta
tione
ry p
rintin
g an
d of
fice
supp
lies
1 15
010
5-
1 25
51
255
-10
0.0%
1 87
61
876
Ope
ratin
g le
ases
394
113
-50
750
7-
100.
0%57
457
4
Prop
erty
pay
men
ts1
335
(1 0
94)
-24
124
1-
100.
0%-
-
Trave
l and
sub
siste
nce
1 76
4(3
60)
-1
404
1 40
4-
100.
0%1
666
1 66
6
Train
ing
and
deve
lopm
ent
600
104
-70
470
4-
100.
0%1
193
1 19
3
Ope
ratin
g pa
ymen
ts48
8(2
65)
-22
322
3-
100.
0%35
635
6
Venu
es a
nd fa
cilit
ies
690
(161
)-
529
529
-10
0.0%
397
397
Rent
al a
nd h
iring
120
644
-76
476
4-
100.
0%10
210
2
Tra
nsfe
rs a
nd s
ubsi
die
s-
625
-62
562
5-
100.
0%9
9
Publ
ic c
orpo
ratio
ns a
nd p
rivat
e en
terp
rises
--
--
--
-6
6
Priv
ate
ente
rpris
es-
--
--
--
66
Oth
er tr
ansf
ers
to p
rivat
e en
terp
rises
--
--
--
-6
6
Hous
ehol
ds-
625
-62
562
5-
100.
0%3
3
Soci
al b
enef
its-
168
-16
816
8-
100.
0%-
-

page 165
Sub
-pro
gra
mm
e 1.
4: C
ORP
ORA
TE S
ERVI
CES
20
17/1
820
16/1
7
Adju
sted
Ap
pro
pri-
atio
nSh
if tin
g o
f Fu
nds
Vire
men
t
Fina
l Ap
-p
rop
ria-
tion
Actu
al E
x-p
end
iture
Varia
nce
Exp
end
i-tu
re a
s %
of
fina
l a
pp
rop
ri-a
tion
Fina
l Ap
-p
rop
ria-
tion
Actu
al E
x-p
end
iture
Eco
nom
ic c
lass
ifica
tion
R'00
0R'
000
R'00
0R'
000
R'00
0R'
000
%R'
000
R'00
0
Oth
er tr
ansf
ers
to h
ouse
hold
s-
457
-45
745
7-
100.
0%3
3
Paym
ents
for c
ap
ital a
sset
s74
04
437
1 57
46
751
6 75
1-
100.
0%5
752
4 88
8
Mac
hine
ry a
nd e
quip
men
t74
023
-76
376
3-
100.
0%1
356
1 35
6
Oth
er m
achi
nery
and
equ
ipm
ent
740
23-
763
763
-10
0.0%
1 35
61
356
Softw
are
and
othe
r int
angi
ble
asse
ts-
4 41
41
574
5 98
85
988
-10
0.0%
4 39
63
532
Tot
al
74 6
26(1
921
)1
574
74 2
7974
242
3710
0.0%
71 5
7770
486

page 166
Sub
-pro
gra
mm
e 1.
5: F
INAN
CIA
L M
ANAG
EMEN
T20
17/1
820
16/1
7
Adju
sted
Ap
pro
pri-
atio
nSh
iftin
g o
f Fu
nds
Vire
men
t
Fina
l Ap
-p
rop
ria-
tion
Actu
al E
x-p
end
iture
Varia
nce
Exp
end
i-tu
re a
s %
of
fina
l a
pp
rop
ri-a
tion
Fina
l Ap
-p
rop
ria-
tion
Actu
al E
x-p
end
iture
Eco
nom
ic c
lass
ifica
tion
R'00
0R'
000
R'00
0R'
000
R'00
0R'
000
%R'
000
R'00
0
Cur
rent
pa
ymen
ts64
795
863
6 51
472
172
72 1
5517
100.
0%73
733
73 6
18
Com
pens
atio
n of
em
ploy
ees
20 6
00-
-20
600
20 5
973
100.
0%19
871
19 7
56
Sala
ries
and
wag
es18
236
(211
)-
18 0
2518
022
310
0.0%
17 4
4817
333
Soci
al c
ontri
butio
ns2
364
211
-2
575
2 57
5-
100.
0%2
423
2 42
3
Goo
ds a
nd s
ervi
ces
44 1
9586
36
514
51 5
7251
558
1410
0.0%
53 8
6253
862
Adm
inist
rativ
e fe
es10
843
-15
115
1-
100.
0%15
815
8
Adve
rtisin
g12
(6)
-6
-6
-1
1
Min
or a
sset
s23
(18)
-5
5-
100.
0%9
9
Audi
t cos
ts: E
xter
nal
3 50
01
629
-5
129
5 12
81
100.
0%3
588
3 58
8
Burs
arie
s: E
mpl
oyee
s32
0(2
25)
-95
95-
100.
0%12
012
0
Cat
erin
g: D
epar
tmen
tal a
ctiv
ities
518
-23
23-
100.
0%1
1
Com
mun
icat
ion
(G&
S)28
478
-36
236
2-
100.
0%23
523
5
Com
pute
r ser
vice
s22
(17)
-5
5-
100.
0%14
14
Con
tract
ors
618
(483
)1
913
2 04
82
048
-10
0.0%
988
988
Agen
cy a
nd s
uppo
rt / o
utso
urce
d se
rvic
es-
5-
53
260
.0%
77
Ente
rtain
men
t6
(1)
-5
14
20.0
%-
-
Flee
t ser
vice
s (in
clud
ing
gove
rnm
ent m
otor
tra
nspo
rt)61
514
4-
759
759
-10
0.0%
631
631

page 167
Sub
-pro
gra
mm
e 1.
5: F
INAN
CIA
L M
ANAG
EMEN
T20
17/1
820
16/1
7
Adju
sted
Ap
pro
pri-
atio
nSh
iftin
g o
f Fu
nds
Vire
men
t
Fina
l Ap
-p
rop
ria-
tion
Actu
al E
x-p
end
iture
Varia
nce
Exp
end
i-tu
re a
s %
of
fina
l a
pp
rop
ri-a
tion
Fina
l Ap
-p
rop
ria-
tion
Actu
al E
x-p
end
iture
Eco
nom
ic c
lass
ifica
tion
R'00
0R'
000
R'00
0R'
000
R'00
0R'
000
%R'
000
R'00
0
Inve
ntor
y: C
loth
ing
mat
eria
l and
acc
esso
ries
-22
-22
211
95.5
%-
-
Inve
ntor
y: M
ater
ials
and
supp
lies
6(6
)-
--
--
1313
Con
sum
able
sup
plie
s82
(47)
-35
35-
100.
0%81
81
Con
sum
able
: Sta
tione
ry p
rintin
g an
d of
fice
supp
lies
2 47
7(1
755
)-
722
722
-10
0.0%
1 33
11
331
Ope
ratin
g le
ases
26 2
44-
3 70
429
948
29 9
48-
100.
0%34
954
34 9
54
Prop
erty
pay
men
ts9
158
1 37
489
711
429
11 4
29-
100.
0%11
018
11 0
18
Trave
l and
sub
siste
nce
443
79-
522
522
-10
0.0%
465
465
Train
ing
and
deve
lopm
ent
6054
-11
411
4-
100.
0%39
39
Ope
ratin
g pa
ymen
ts21
2(2
5)-
187
187
-10
0.0%
209
209
Tra
nsfe
rs a
nd s
ubsi
die
s-
-22
222
222
2-
100.
0%16
416
4
Prov
ince
s an
d m
unic
ipal
ities
--
1313
13-
100.
0%17
17
Prov
ince
s-
--
--
--
44
Prov
inci
al a
genc
ies
and
fund
s-
--
--
--
44
Mun
icip
aliti
es-
-13
1313
-10
0.0%
1313
Mun
icip
al a
genc
ies
and
fund
s-
-13
1313
-10
0.0%
1313
Dep
artm
enta
l age
ncie
s an
d ac
coun
ts-
--
--
--
44
Dep
artm
enta
l age
ncie
s (n
on-b
usin
ess
entit
ies)
--
--
--
-4
4

page 168
Sub
-pro
gra
mm
e 1.
5: F
INAN
CIA
L M
ANAG
EMEN
T20
17/1
820
16/1
7
Adju
sted
Ap
pro
pri-
atio
nSh
iftin
g o
f Fu
nds
Vire
men
t
Fina
l Ap
-p
rop
ria-
tion
Actu
al E
x-p
end
iture
Varia
nce
Exp
end
i-tu
re a
s %
of
fina
l a
pp
rop
ri-a
tion
Fina
l Ap
-p
rop
ria-
tion
Actu
al E
x-p
end
iture
Eco
nom
ic c
lass
ifica
tion
R'00
0R'
000
R'00
0R'
000
R'00
0R'
000
%R'
000
R'00
0
Hous
ehol
ds-
-20
920
920
9-
100.
0%14
314
3
Soci
al b
enef
its-
-19
519
519
5-
100.
0%14
114
1
Oth
er tr
ansf
ers
to h
ouse
hold
s-
-14
1414
-10
0.0%
22
Paym
ents
for c
ap
ital a
sset
s4
744
(2 6
13)
-2
131
2 13
1-
100.
0%2
266
1 85
2
Mac
hine
ry a
nd e
quip
men
t4
739
(2 6
08)
-2
131
2 13
1-
100.
0%1
977
1 56
3
Trans
port
equi
pmen
t4
600
(2 6
74)
-1
926
1 92
6-
100.
0%20
0-
Oth
er m
achi
nery
and
equ
ipm
ent
139
66-
205
205
-10
0.0%
1 77
71
563
Softw
are
and
othe
r int
angi
ble
asse
ts5
(5)
--
--
-28
928
9
Paym
ent f
or fi
nanc
ial a
sset
s-
-25
025
025
0-
100.
0%47
47
Tot
al
69 5
39(1
750
)6
986
74 7
7574
758
1710
0.0%
76 2
1075
681

page 169
Sub
-pro
gra
mm
e 1
.6:
OFF
ICE
ACC
OM
MO
DAT
ION
2017
/18
2016
/17
Ad
just
ed
A
pp
rop
ri-a
tion
Shift
ing
o
f Fun
ds
Vire
me
nt
Fina
l Ap
-p
rop
ria-
tion
Ac
tua
l Ex
pe
ndi-
ture
Varia
nce
Exp
end
i-tu
re a
s %
o
f fin
al
ap
pro
pri-
atio
n
Fina
l Ap
-p
rop
ria-
tion
Ac
tua
l Ex
pe
ndi-
ture
Ec
ono
mic
cla
ssifi
ca
tion
R'00
0R'
000
R'00
0R'
000
R'00
0R'
000
%R'
000
R'00
0
Cur
rent
pa
yme
nts
3 59
8(7
62)
-2
836
2 83
6-
100.
0%5
213
5 21
3
Go
od
s a
nd s
erv
ice
s3
598
(762
)-
2 83
62
836
-10
0.0%
5 21
35
213
Op
era
ting
lea
ses
1 59
899
9-
2 59
72
597
-10
0.0%
4 81
84
818
Pro
pe
rty p
aym
ent
s2
000
(1 7
61)
-23
923
9-
100.
0%39
539
5
To
tal
3 59
8(7
62)
-2
836
2 83
6-
100.
0%5
213
5 21
3

page 170
Prog
ram
me
2: IC
T IN
TERN
ATIO
NAL
AFF
RAIR
S20
17/1
820
16/1
7
Adju
sted
Ap
pro
pri-
atio
nSh
iftin
g o
f Fu
nds
Vire
men
t
Fina
l Ap
-p
rop
ria-
tion
Actu
al E
x-p
end
iture
Varia
nce
Exp
end
i-tu
re a
s %
of
fina
l a
pp
rop
ri-a
tion
Fina
l Ap
-p
rop
ria-
tion
Actu
al E
x-p
end
iture
R'00
0R'
000
R'00
0R'
000
R'00
0R'
000
%R'
000
R'00
0
Sub
pro
gra
mm
e
1.In
tern
atio
nal A
ffairs
13 7
18(9
88)
-12
730
12 5
0222
898
.2%
14 7
5113
434
2.IC
T T ra
de/P
artn
ersh
ip37
202
988
828
39 0
1838
110
908
97.7
%33
679
33 5
10
50 9
20-
828
51 7
4850
612
1 13
697
.8%
48 4
3046
944
Econ
omic
cla
ssifi
catio
n
C
urre
nt p
aym
ents
25 0
18(4
38)
828
25 4
0824
615
793
96.9
%21
469
20 2
56
C
ompe
nsat
ion
of e
mpl
oyee
s16
150
-82
816
978
16 9
78-
100.
0%13
941
12 7
28
Sa
larie
s an
d w
ages
13 0
121
505
828
15 3
4515
345
-10
0.0%
11 2
5011
250
So
cial
con
tribu
tions
3 13
8(1
505
)-
1 63
31
633
-10
0.0%
2 69
11
478
G
oods
and
ser
vice
s8
868
(438
)-
8 43
07
637
793
90.6
%7
528
7 52
8
Ad
min
istra
tive
fees
400
(179
)-
221
129
9258
.4%
225
225
Ad
verti
sing
222
(202
)-
2020
-10
0.0%
264
264
M
inor
ass
ets
61(3
1)-
301
293.
3%3
3
Bu
rsar
ies:
Em
ploy
ees
180
(180
)-
--
--
--
C
ater
ing:
Dep
artm
enta
l act
iviti
es10
017
-11
710
611
90.6
%75
75
C
omm
unic
atio
n (G
&S)
490
(144
)-
346
299
4786
.4%
341
341
C
onsu
ltant
s: B
usin
ess
and
advi
sory
ser
vice
s7
(7)
--
--
-23
223
2
In
frast
ruct
ure
and
plan
ning
ser
vice
s-
--
--
--
--

page 171
Prog
ram
me
2: IC
T IN
TERN
ATIO
NAL
AFF
RAIR
S20
17/1
820
16/1
7
Adju
sted
Ap
pro
pri-
atio
nSh
iftin
g o
f Fu
nds
Vire
men
t
Fina
l Ap
-p
rop
ria-
tion
Actu
al E
x-p
end
iture
Varia
nce
Exp
end
i-tu
re a
s %
of
fina
l a
pp
rop
ri-a
tion
Fina
l Ap
-p
rop
ria-
tion
Actu
al E
x-p
end
iture
R'00
0R'
000
R'00
0R'
000
R'00
0R'
000
%R'
000
R'00
0
C
ontra
ctor
s1
685
(406
)-
1 27
976
351
659
.7%
110
110
En
terta
inm
ent
175
(160
)-
154
1126
.7%
44
Fl
eet s
ervi
ces
(incl
udin
g go
vern
men
t mot
or
trans
port)
-5
-5
-5
-16
16
In
vent
ory:
Mat
eria
ls an
d su
pplie
s1
(1)
--
--
--
-
C
onsu
mab
le s
uppl
ies
-2
-2
11
50.0
%6
6
C
onsu
mab
le: S
tatio
nery
prin
ting
and
offic
e su
pplie
s26
5(1
97)
-68
617
89.7
%26
126
1
O
pera
ting
leas
es15
7(7
7)-
8075
593
.8%
5858
Pr
oper
ty p
aym
ents
-47
-47
47-
100.
0%12
12
Tra
vel a
nd s
ubsis
tenc
e3
829
942
-4
771
4 77
1-
100.
0%4
333
4 33
3
Tra
inin
g an
d de
velo
pmen
t25
6(1
70)
-86
3452
39.5
%13
113
1
O
pera
ting
paym
ents
-74
-74
686
91.9
%27
27
V e
nues
and
faci
litie
s84
035
9-
1 19
91
189
1099
.2%
1 43
01
430
Re
ntal
and
hirin
g20
0(1
30)
-70
691
98.6
%-
-
Tr
ans
fers
and
sub
sid
ies
25 5
3243
8-
25 9
7025
968
210
0.0%
26 2
6326
263
F o
reig
n go
vern
men
ts a
nd in
tern
atio
nal
orga
nisa
tions
25 5
3243
4-
25 9
6625
964
210
0.0%
26 1
3626
136
N
on-p
rofit
inst
itutio
ns-
--
--
--
2525

page 172
Prog
ram
me
2: IC
T IN
TERN
ATIO
NAL
AFF
RAIR
S20
17/1
820
16/1
7
Adju
sted
Ap
pro
pri-
atio
nSh
iftin
g o
f Fu
nds
Vire
men
t
Fina
l Ap
-p
rop
ria-
tion
Actu
al E
x-p
end
iture
Varia
nce
Exp
end
i-tu
re a
s %
of
fina
l a
pp
rop
ri-a
tion
Fina
l Ap
-p
rop
ria-
tion
Actu
al E
x-p
end
iture
R'00
0R'
000
R'00
0R'
000
R'00
0R'
000
%R'
000
R'00
0
Ho
useh
olds
-4
-4
4-
100.
0%10
210
2
So
cial
ben
efits
--
--
--
--
-
O
ther
tran
sfer
s to
hou
seho
lds
-4
-4
4-
100.
0%10
210
2
Pa
ymen
ts fo
r ca
pita
l ass
ets
370
--
370
2934
17.
8%69
842
5
M
achi
nery
and
equ
ipm
ent
370
--
370
2934
17.
8%69
842
5
O
ther
mac
hine
ry a
nd e
quip
men
t37
0-
-37
029
341
7.8%
698
425
50 9
20-
828
51 7
4850
612
1 13
697
.8%
48 4
3046
944

page 173
Sub
-pro
gra
mm
e 2.
1: IN
TERN
ATIO
NAL
AFF
AIRS
2017
/18
2016
/17
Adju
sted
Ap
pro
pri-
atio
nSh
if tin
g o
f Fu
nds
Vire
men
t
Fina
l Ap
-p
rop
ria-
tion
Actu
al E
x-p
end
iture
Varia
nce
Exp
end
i-tu
re a
s %
of
fina
l a
pp
rop
ri-a
tion
Fina
l Ap
-p
rop
ria-
tion
Actu
al E
x-p
end
iture
Eco
nom
ic c
lass
ifica
tion
R'00
0R'
000
R'00
0R'
000
R'00
0R'
000
%R'
000
R'00
0
Cur
rent
pa
ymen
ts13
548
(992
)-
12 5
5612
469
8799
.3%
14 2
4213
029
Com
pens
atio
n of
em
ploy
ees
9 73
9(5
54)
-9
185
9 18
5-
100.
0%9
940
8 72
7
Sala
ries
and
wag
es7
429
618
-8
047
8 04
7-
100.
0%7
661
7 66
1
Soci
al c
ontri
butio
ns2
310
(1 1
72)
-1
138
1 13
8-
100.
0%2
279
1 06
6
Goo
ds a
nd s
ervi
ces
3 80
9(4
38)
-3
371
3 28
487
97.4
%4
302
4 30
2
Adm
inist
rativ
e fe
es25
0(1
79)
-71
71-
100.
0%96
96
Adve
rtisin
g18
0(1
60)
-20
20-
100.
0%18
218
2
Min
or a
sset
s39
(9)
-30
129
3.3%
33
Burs
arie
s: E
mpl
oyee
s11
0(1
10)
--
--
--
-
Cat
erin
g: D
epar
tmen
tal a
ctiv
ities
801
-81
81-
100.
0%50
50
Com
mun
icat
ion
(G&
S)35
5(1
23)
-23
221
121
90.9
%24
124
1
Con
sulta
nts:
Bus
ines
s an
d ad
viso
ry s
ervi
ces
--
--
--
-22
522
5
Con
tract
ors
180
(180
)-
--
--
110
110
Ente
rtain
men
t12
5(1
10)
-15
411
26.7
%4
4
Flee
t ser
vice
s (in
clud
ing
gove
rnm
ent m
otor
tra
nspo
rt)-
5-
5-
5-
1616
Con
sum
able
sup
plie
s-
1-
11
-10
0.0%
33

page 174
Sub
-pro
gra
mm
e 2.
1: IN
TERN
ATIO
NAL
AFF
AIRS
2017
/18
2016
/17
Adju
sted
Ap
pro
pri-
atio
nSh
if tin
g o
f Fu
nds
Vire
men
t
Fina
l Ap
-p
rop
ria-
tion
Actu
al E
x-p
end
iture
Varia
nce
Exp
end
i-tu
re a
s %
of
fina
l a
pp
rop
ri-a
tion
Fina
l Ap
-p
rop
ria-
tion
Actu
al E
x-p
end
iture
Eco
nom
ic c
lass
ifica
tion
R'00
0R'
000
R'00
0R'
000
R'00
0R'
000
%R'
000
R'00
0
Con
sum
able
: Sta
tione
ry p
rintin
g an
d of
fice
supp
lies
150
(110
)-
4037
392
.5%
158
158
Ope
ratin
g le
ases
100
(20)
-80
755
93.8
%58
58
Prop
erty
pay
men
ts-
--
--
--
1212
Trave
l and
sub
siste
nce
1 74
948
7-
2 23
62
236
-10
0.0%
2 46
52
465
Train
ing
and
deve
lopm
ent
181
(170
)-
115
645
.5%
9898
Ope
ratin
g pa
ymen
ts-
10-
105
550
.0%
2323
Venu
es a
nd fa
cilit
ies
110
359
-46
946
81
99.8
%55
855
8
Rent
al a
nd h
iring
200
(130
)-
7069
198
.6%
--
Tra
nsfe
rs a
nd s
ubsi
die
s-
4-
44
-10
0.0%
22
Hous
ehol
ds-
4-
44
-10
0.0%
22
Oth
er tr
ansf
ers
to h
ouse
hold
s-
4-
44
-10
0.0%
22
Paym
ents
for c
ap
ital a
sset
s17
0-
-17
029
141
17.1
%50
740
3
Mac
hine
ry a
nd e
quip
men
t17
0-
-17
029
141
17.1
%50
740
3
Oth
er m
achi
nery
and
equ
ipm
ent
170
--
170
2914
117
.1%
507
403
Tot
al
13 7
18(9
88)
-12
730
12 5
0222
898
.2%
14 7
5113
434

page 175
Sub
-pro
gra
mm
e 2.
2: IC
T TR
ADE/
PART
NER
SHIP
2017
/18
2016
/17
Adju
sted
Ap
pro
pri-
atio
nSh
if tin
g o
f Fu
nds
Vire
men
t
Fina
l Ap
-p
rop
ria-
tion
Actu
al E
x-p
end
iture
Varia
nce
Exp
end
i-tu
re a
s %
of
fina
l a
pp
rop
ri-a
tion
Fina
l Ap
-p
rop
ria-
tion
Actu
al E
x-p
end
iture
Eco
nom
ic c
lass
ifica
tion
R'00
0R'
000
R'00
0R'
000
R'00
0R'
000
%R'
000
R'00
0
Cur
rent
pa
ymen
ts11
470
554
828
12 8
5212
146
706
94.5
%7
227
7 22
7
Com
pens
atio
n of
em
ploy
ees
6 41
155
482
87
793
7 79
3-
100.
0%4
001
4 00
1
Sala
ries
and
wag
es5
583
887
828
7 29
87
298
-10
0.0%
3 58
93
589
Soci
al c
ontri
butio
ns82
8(3
33)
-49
549
5-
100.
0%41
241
2
Goo
ds a
nd s
ervi
ces
5 05
9-
-5
059
4 35
370
686
.0%
3 22
63
226
Adm
inist
rativ
e fe
es15
0-
-15
058
9238
.7%
129
129
Adve
rtisin
g42
(42)
--
--
-82
82
Min
or a
sset
s22
(22)
--
--
--
-
Burs
arie
s: E
mpl
oyee
s70
(70)
--
--
--
-
Cat
erin
g: D
epar
tmen
tal a
ctiv
ities
2016
-36
2511
69.4
%25
25
Com
mun
icat
ion
(G&
S)13
5(2
1)-
114
8826
77.2
%10
010
0
Con
sulta
nts:
Bus
ines
s an
d ad
viso
ry s
ervi
ces
7(7
)-
--
--
77
Con
tract
ors
1 50
5(2
26)
-1
279
763
516
59.7
%-
-
Ente
rtain
men
t50
(50)
--
--
--
-
Inve
ntor
y: M
ater
ials
and
supp
lies
1(1
)-
--
--
--
Con
sum
able
sup
plie
s-
1-
1-
1-
33
Con
sum
able
: Sta
tione
ry p
rintin
g an
d of
fice
supp
lies
115
(87)
-28
244
85.7
%10
310
3

page 176
Sub
-pro
gra
mm
e 2.
2: IC
T TR
ADE/
PART
NER
SHIP
2017
/18
2016
/17
Adju
sted
Ap
pro
pri-
atio
nSh
if tin
g o
f Fu
nds
Vire
men
t
Fina
l Ap
-p
rop
ria-
tion
Actu
al E
x-p
end
iture
Varia
nce
Exp
end
i-tu
re a
s %
of
fina
l a
pp
rop
ri-a
tion
Fina
l Ap
-p
rop
ria-
tion
Actu
al E
x-p
end
iture
Eco
nom
ic c
lass
ifica
tion
R'00
0R'
000
R'00
0R'
000
R'00
0R'
000
%R'
000
R'00
0
Ope
ratin
g le
ases
57(5
7)-
--
--
--
Prop
erty
pay
men
ts-
47-
4747
-10
0.0%
--
Trave
l and
sub
siste
nce
2 08
045
5-
2 53
52
535
-10
0.0%
1 86
81
868
Train
ing
and
deve
lopm
ent
75-
-75
2946
38.7
%33
33
Ope
ratin
g pa
ymen
ts-
64-
6463
198
.4%
44
Venu
es a
nd fa
cilit
ies
730
--
730
721
998
.8%
872
872
Tra
nsfe
rs a
nd s
ubsi
die
s25
532
434
-25
966
25 9
642
100.
0%26
261
26 2
61
Fore
ign
gove
rnm
ents
and
inte
rnat
iona
l or
gani
satio
ns25
532
434
-25
966
25 9
642
100.
0%26
136
26 1
36
Non
-pro
fit in
stitu
tions
--
--
--
-25
25
Hous
ehol
ds-
--
--
--
100
100
Oth
er tr
ansf
ers
to h
ouse
hold
s-
--
--
--
100
100
Paym
ents
for c
ap
ital a
sset
s20
0-
-20
0-
200
-19
122
Mac
hine
ry a
nd e
quip
men
t20
0-
-20
0-
200
-19
122
Oth
er m
achi
nery
and
equ
ipm
ent
200
--
200
-20
0-
191
22
Tot
al
37 2
0298
882
839
018
38 1
1090
897
.7%
33 6
7933
510

page 177
Prog
ram
me
3: P
OLI
CY
RES
EARC
H AN
D C
APAC
ITY
DEV
ELO
PMEN
T20
17/1
820
16/1
7
Adju
sted
Ap
pro
pri-
atio
nSh
iftin
g o
f Fu
nds
Vire
men
t
Fina
l Ap
-p
rop
ria-
tion
Actu
al E
x-p
end
iture
Varia
nce
Exp
end
i-tu
re a
s %
of
fina
l a
pp
rop
ri-a
tion
Fina
l Ap
-p
rop
ria-
tion
Actu
al E
x-p
end
iture
R'00
0R'
000
R'00
0R'
000
R'00
0R'
000
%R'
000
R'00
0
Sub
pro
gra
mm
e
1.IC
T Po
licy
Dev
elop
men
t12
358
(985
)-
11 3
7310
045
1 32
888
.3%
15 3
2612
491
2.Ec
onom
ic a
nd M
arke
t Ana
lysis
4 66
44
073
-8
737
8 72
710
99.9
%4
901
3 46
8
3.Re
sear
ch7
881
(67)
1 06
28
876
6 92
31
953
78.0
%6
998
6 91
2
4.In
form
atio
n So
ciet
y D
evel
opm
ent
51 7
79(3
235
)(2
067
)46
477
43 8
192
658
94.3
%51
673
46 1
38
5.C
apac
ity D
evel
opm
ent
8 84
121
4-
9 05
59
010
4599
.5%
9 87
79
485
85 5
23-
(1 0
05)
84 5
1878
524
5 99
492
.9%
88 7
7578
494
Econ
omic
cla
ssifi
catio
n
C
urre
nt p
aym
ents
84 8
76(4
30)
(1 0
05)
83 4
4177
676
5 76
593
.1%
88 0
9377
838
C
ompe
nsat
ion
of e
mpl
oyee
s52
905
--
52 9
0552
089
816
98.5
%55
691
52 6
42
Sa
larie
s an
d w
ages
45 3
301
581
-46
911
46 4
1549
698
.9%
48 2
6446
858
So
cial
con
tribu
tions
7 57
5(1
581
)-
5 99
45
674
320
94.7
%7
427
5 78
4
G
oods
and
ser
vice
s31
971
(430
)(1
005
)30
536
25 5
874
949
83.8
%32
402
25 1
96
Ad
min
istra
tive
fees
8016
4-
244
242
299
.2%
393
249
Ad
verti
sing
440
68-
508
310
198
61.0
%56
717
2
M
inor
ass
ets
377
(20)
-35
77
350
2.0%
248
16
Bu
rsar
ies:
Em
ploy
ees
560
76-
636
492
144
77.4
%23
423
4
C
ater
ing:
Dep
artm
enta
l act
iviti
es17
559
4-
769
546
223
71.0
%36
232
4

page 178
Prog
ram
me
3: P
OLI
CY
RES
EARC
H AN
D C
APAC
ITY
DEV
ELO
PMEN
T20
17/1
820
16/1
7
Adju
sted
Ap
pro
pri-
atio
nSh
iftin
g o
f Fu
nds
Vire
men
t
Fina
l Ap
-p
rop
ria-
tion
Actu
al E
x-p
end
iture
Varia
nce
Exp
end
i-tu
re a
s %
of
fina
l a
pp
rop
ri-a
tion
Fina
l Ap
-p
rop
ria-
tion
Actu
al E
x-p
end
iture
R'00
0R'
000
R'00
0R'
000
R'00
0R'
000
%R'
000
R'00
0
C
omm
unic
atio
n (G
&S)
2 27
3(8
31)
-1
442
1 30
613
690
.6%
1 60
81
397
C
ompu
ter s
ervi
ces
-25
-25
25-
100.
0%62
62
C
onsu
ltant
s: B
usin
ess
and
advi
sory
ser
vice
s11
793
3 53
6(1
005
)14
324
13 1
351
189
91.7
%5
928
5 49
9
C
ontra
ctor
s40
592
-63
262
111
98.3
%16
046
Ag
ency
and
sup
port
/ out
sour
ced
serv
ices
1 79
3(1
523
)-
270
-27
0-
48-
En
terta
inm
ent
60(1
7)-
4310
3323
.3%
102
7
Fl
eet s
ervi
ces
(incl
udin
g go
vern
men
t mot
or
trans
port)
519
2-
197
196
199
.5%
279
263
In
vent
ory:
Mat
eria
ls an
d su
pplie
s14
(14)
--
--
-6
1
In
vent
ory:
Oth
er s
uppl
ies
--
--
--
-5
-
C
onsu
mab
le s
uppl
ies
1324
-37
2017
54.1
%31
19
C
onsu
mab
le: S
tatio
nery
prin
ting
and
offic
e su
pplie
s1
305
654
-1
959
1 52
843
178
.0%
1 51
51
370
O
pera
ting
leas
es64
015
2-
792
429
363
54.2
%52
148
7
Pr
oper
ty p
aym
ents
-25
-25
25-
100.
0%24
223
3
Tra
vel a
nd s
ubsis
tenc
e4
649
982
-5
631
4 77
485
784
.8%
5 97
14
578
T ra
inin
g an
d de
velo
pmen
t6
750
(6 0
62)
-68
855
313
580
.4%
10 4
597
777
O
pera
ting
paym
ents
3028
6-
316
217
9968
.7%
910
45

Prog
ram
me
3: P
OLI
CY
RES
EARC
H AN
D C
APAC
ITY
DEV
ELO
PMEN
T20
17/1
820
16/1
7
Adju
sted
Ap
pro
pri-
atio
nSh
iftin
g o
f Fu
nds
Vire
men
t
Fina
l Ap
-p
rop
ria-
tion
Actu
al E
x-p
end
iture
Varia
nce
Exp
end
i-tu
re a
s %
of
fina
l a
pp
rop
ri-a
tion
Fina
l Ap
-p
rop
ria-
tion
Actu
al E
x-p
end
iture
R'00
0R'
000
R'00
0R'
000
R'00
0R'
000
%R'
000
R'00
0
Ve
nues
and
faci
litie
s87
468
3-
1 55
71
132
425
72.7
%2
721
2 38
7
Re
ntal
and
hirin
g10
0(1
6)-
8419
6522
.6%
3030
Tr
ans
fers
and
sub
sid
ies
-43
0-
430
430
-10
0.0%
2828
Pu
blic
cor
pora
tions
and
priv
ate
ente
rpris
es-
--
--
--
55
Pr
ivat
e en
terp
rises
--
--
--
-5
5
O
ther
tran
sfer
s to
priv
ate
ente
rpris
es-
--
--
--
55
Ho
useh
olds
-43
0-
430
430
-10
0.0%
2323
So
cial
ben
efits
-39
8-
398
398
-10
0.0%
99
O
ther
tran
sfer
s to
hou
seho
lds
-32
-32
32-
100.
0%14
14
Pa
ymen
ts fo
r ca
pita
l ass
ets
647
--
647
418
229
64.6
%65
462
8
M
achi
nery
and
equ
ipm
ent
647
--
647
418
229
64.6
%65
462
8
O
ther
mac
hine
ry a
nd e
quip
men
t64
7-
-64
741
822
964
.6%
654
628
85 5
23-
(1 0
05)
84 5
1878
524
5 99
492
.9%
88 7
7578
494
page 179

page 180
Sub
-pro
gra
mm
e 3.
1: IC
T PO
LIC
Y D
EVEL
OPM
ENT
2017
/18
2016
/17
Adju
sted
Ap
pro
pri-
atio
nSh
iftin
g o
f Fu
nds
Vire
men
t
Fina
l Ap
-p
rop
ria-
tion
Actu
al E
x-p
end
iture
Varia
nce
Exp
end
i-tu
re a
s %
of
fina
l a
pp
rop
ri-a
tion
Fina
l Ap
-p
rop
ria-
tion
Actu
al E
x-p
end
iture
Econ
omic
cla
ssifi
catio
n R'
000
R'00
0R'
000
R'00
0R'
000
R'00
0%
R'00
0R'
000
Cur
rent
pa
ymen
ts12
358
(1 0
59)
-11
299
9 98
61
313
88.4
%15
206
12 3
71
Com
pens
atio
n of
em
ploy
ees
8 65
0-
-8
650
8 46
918
197
.9%
10 8
299
926
Sala
ries
and
wag
es7
045
626
-7
671
7 51
415
798
.0%
9 31
58
786
Soci
al c
ontri
butio
ns1
605
(626
)-
979
955
2497
.5%
1 51
41
140
Goo
ds a
nd s
ervi
ces
3 70
8(1
059
)-
2 64
91
517
1 13
257
.3%
4 37
72
445
Adm
inist
rativ
e fe
es30
(7)
-23
212
91.3
%32
19
Adve
rtisin
g-
1-
11
-10
0.0%
--
Min
or a
sset
s40
--
40-
40-
103
Burs
arie
s: E
mpl
oyee
s15
0(3
3)-
117
311
42.
6%21
21
Cat
erin
g: D
epar
tmen
tal a
ctiv
ities
2087
-10
781
2675
.7%
1616
Com
mun
icat
ion
(G&
S)23
092
-32
222
795
70.5
%30
330
3
Con
sulta
nts:
Bus
ines
s an
d ad
viso
ry s
ervi
ces
970
(970
)-
--
--
1 20
477
5
Con
tract
ors
20(1
9)-
1-
1-
3535
Ente
rtain
men
t20
(7)
-13
211
15.4
%73
-
Flee
t ser
vice
s (in
clud
ing
gove
rnm
ent m
otor
tra
nspo
rt)-
6-
65
183
.3%
204
Inve
ntor
y: M
ater
ials
and
supp
lies
2(2
)-
--
--
1-
Con
sum
able
sup
plie
s2
4-
61
516
.7%
33

page 181
Sub
-pro
gra
mm
e 3.
1: IC
T PO
LIC
Y D
EVEL
OPM
ENT
2017
/18
2016
/17
Adju
sted
Ap
pro
pri-
atio
nSh
iftin
g o
f Fu
nds
Vire
men
t
Fina
l Ap
-p
rop
ria-
tion
Actu
al E
x-p
end
iture
Varia
nce
Exp
end
i-tu
re a
s %
of
fina
l a
pp
rop
ri-a
tion
Fina
l Ap
-p
rop
ria-
tion
Actu
al E
x-p
end
iture
Econ
omic
cla
ssifi
catio
n R'
000
R'00
0R'
000
R'00
0R'
000
R'00
0%
R'00
0R'
000
Con
sum
able
: Sta
tione
ry p
rintin
g an
d of
fice
supp
lies
410
349
-75
957
818
176
.2%
162
83
Ope
ratin
g le
ases
120
70-
190
132
5869
.5%
150
116
Prop
erty
pay
men
ts-
25-
2525
-10
0.0%
--
Trave
l and
sub
siste
nce
1 38
4(8
16)
-56
827
029
847
.5%
1 81
081
0
Train
ing
and
deve
lopm
ent
190
--
190
6312
733
.2%
241
241
Ope
ratin
g pa
ymen
ts-
2-
22
-10
0.0%
--
Venu
es a
nd fa
cilit
ies
120
159
-27
910
617
338
.0%
280
-
Rent
al a
nd h
iring
--
--
--
-16
16
Tra
nsfe
rs a
nd s
ubsi
die
s-
7-
77
-10
0.0%
22
Hous
ehol
ds-
7-
77
-10
0.0%
22
Soci
al b
enef
its-
7-
77
-10
0.0%
--
Oth
er tr
ansf
ers
to h
ouse
hold
s-
--
--
--
22
Paym
ents
for c
ap
ital a
sset
s-
67-
6752
1577
.6%
118
118
Mac
hine
ry a
nd e
quip
men
t-
67-
6752
1577
.6%
118
118
Oth
er m
achi
nery
and
equ
ipm
ent
-67
-67
5215
77.6
%11
811
8
Tot
al
12 3
58(9
85)
-11
373
10 0
451
328
88.3
%15
326
12 4
91

page 182
Sub
-pro
gra
mm
e 3.
2: E
CO
NO
MIC
AN
D M
ARKE
T AN
ALYS
IS20
17/1
820
16/1
7
Adju
sted
Ap
pro
pri-
atio
nSh
iftin
g o
f Fu
nds
Vire
men
t
Fina
l Ap
-p
rop
ria-
tion
Actu
al E
x-p
end
iture
Varia
nce
Exp
end
i-tu
re a
s %
of
fina
l a
pp
rop
ri-a
tion
Fina
l Ap
-p
rop
ria-
tion
Actu
al E
x-p
end
iture
Econ
omic
cla
ssifi
catio
nR'
000
R'00
0R'
000
R'00
0R'
000
R'00
0%
R'00
0R'
000
Cur
rent
pa
ymen
ts4
664
4 05
2-
8 71
68
706
1099
.9%
4 86
13
428
Com
pens
atio
n of
em
ploy
ees
2 47
7-
-2
477
2 46
710
99.6
%2
981
2 57
0
Sala
ries
and
wag
es2
206
51-
2 25
72
257
-10
0.0%
2 71
32
322
Soci
al c
ontri
butio
ns27
1(5
1)-
220
210
1095
.5%
268
248
Goo
ds a
nd s
ervi
ces
2 18
74
052
-6
239
6 23
9-
100.
0%1
880
858
Adm
inist
rativ
e fe
es10
1-
1111
-10
0.0%
207
Adve
rtisin
g-
28-
2828
-10
0.0%
--
Burs
arie
s: E
mpl
oyee
s30
29-
5959
-10
0.0%
5353
Cat
erin
g: D
epar
tmen
tal a
ctiv
ities
-2
-2
2-
100.
0%1
1
Com
mun
icat
ion
(G&
S)1
291
(1 2
22)
-69
69-
100.
0%10
610
6
Con
sulta
nts:
Bus
ines
s an
d ad
viso
ry s
ervi
ces
-5
762
-5
762
5 76
2-
100.
0%-
-
Con
tract
ors
10(1
0)-
--
--
--
Ente
rtain
men
t10
(10)
--
--
--
-
Flee
t ser
vice
s (in
clud
ing
gove
rnm
ent m
otor
tra
nspo
rt)-
8-
88
-10
0.0%
44
Inve
ntor
y: M
ater
ials
and
supp
lies
1(1
)-
--
--
--
Con
sum
able
sup
plie
s-
--
--
--
33

page 183
Sub
-pro
gra
mm
e 3.
2: E
CO
NO
MIC
AN
D M
ARKE
T AN
ALYS
IS20
17/1
820
16/1
7
Adju
sted
Ap
pro
pri-
atio
nSh
iftin
g o
f Fu
nds
Vire
men
t
Fina
l Ap
-p
rop
ria-
tion
Actu
al E
x-p
end
iture
Varia
nce
Exp
end
i-tu
re a
s %
of
fina
l a
pp
rop
ri-a
tion
Fina
l Ap
-p
rop
ria-
tion
Actu
al E
x-p
end
iture
Econ
omic
cla
ssifi
catio
nR'
000
R'00
0R'
000
R'00
0R'
000
R'00
0%
R'00
0R'
000
Con
sum
able
: Sta
tione
ry p
rintin
g an
d of
fice
supp
lies
150
(72)
-78
78-
100.
0%53
353
3
Prop
erty
pay
men
ts-
--
--
--
2011
Trave
l and
sub
siste
nce
555
(394
)-
161
161
-10
0.0%
198
105
Train
ing
and
deve
lopm
ent
70(5
8)-
1212
-10
0.0%
2418
Ope
ratin
g pa
ymen
ts-
--
--
--
847
-
Venu
es a
nd fa
cilit
ies
60(1
1)-
4949
-10
0.0%
7117
Paym
ents
for c
ap
ital a
sset
s-
21-
2121
-10
0.0%
4040
Mac
hine
ry a
nd e
quip
men
t-
21-
2121
-10
0.0%
4040
Oth
er m
achi
nery
and
equ
ipm
ent
-21
-21
21-
100.
0%40
40
Tot
al
4 66
44
073
-8
737
8 72
710
99.9
%4
901
3 46
8

page 184
Sub
-pro
gra
mm
e 3.
3: R
ESEA
RCH
2017
/18
2016
/17
Adju
sted
Ap
pro
pri-
atio
nSh
iftin
g o
f Fu
nds
Vire
men
t
Fina
l Ap
-p
rop
ria-
tion
Actu
al E
x-p
end
iture
Varia
nce
Exp
end
i-tu
re a
s %
of
fina
l a
pp
rop
ri-a
tion
Fina
l Ap
-p
rop
ria-
tion
Actu
al E
x-p
end
iture
Econ
omic
cla
ssifi
catio
nR'
000
R'00
0R'
000
R'00
0R'
000
R'00
0%
R'00
0R'
000
Cur
rent
pa
ymen
ts7
711
(306
)1
062
8 46
76
551
1 91
677
.4%
6 93
96
879
Com
pens
atio
n of
em
ploy
ees
4 08
8-
-4
088
3 74
933
991
.7%
4 29
54
235
Sala
ries
and
wag
es3
802
(64)
-3
738
3 39
933
990
.9%
3 89
13
831
Soci
al c
ontri
butio
ns28
664
-35
035
0-
100.
0%40
440
4
Goo
ds a
nd s
ervi
ces
3 62
3(3
06)
1 06
24
379
2 80
21
577
64.0
%2
644
2 64
4
Adm
inist
rativ
e fe
es10
40-
5050
-10
0.0%
6868
Adve
rtisin
g30
0(2
90)
-10
19
10.0
%17
217
2
Min
or a
sset
s16
--
161
156.
3%4
4
Burs
arie
s: E
mpl
oyee
s30
--
30-
30-
--
Cat
erin
g: D
epar
tmen
tal a
ctiv
ities
1052
-62
62-
100.
0%10
210
2
Com
mun
icat
ion
(G&
S)15
5-
-15
511
441
73.5
%12
712
7
Com
pute
r ser
vice
s-
25-
2525
-10
0.0%
--
Con
sulta
nts:
Bus
ines
s an
d ad
viso
ry s
ervi
ces
600
-1
062
1 66
292
373
955
.5%
434
434
Con
tract
ors
10-
-10
-10
-7
7
Agen
cy a
nd s
uppo
rt / o
utso
urce
d se
rvic
es50
0(3
06)
-19
4-
194
--
-
Ente
rtain
men
t10
--
102
820
.0%
11
Flee
t ser
vice
s (in
clud
ing
gove
rnm
ent m
otor
tra
nspo
rt)5
5-
1010
-10
0.0%
33

page 185
Sub
-pro
gra
mm
e 3.
3: R
ESEA
RCH
2017
/18
2016
/17
Adju
sted
Ap
pro
pri-
atio
nSh
iftin
g o
f Fu
nds
Vire
men
t
Fina
l Ap
-p
rop
ria-
tion
Actu
al E
x-p
end
iture
Varia
nce
Exp
end
i-tu
re a
s %
of
fina
l a
pp
rop
ri-a
tion
Fina
l Ap
-p
rop
ria-
tion
Actu
al E
x-p
end
iture
Econ
omic
cla
ssifi
catio
nR'
000
R'00
0R'
000
R'00
0R'
000
R'00
0%
R'00
0R'
000
Inve
ntor
y: M
ater
ials
and
supp
lies
1(1
)-
--
--
--
Con
sum
able
sup
plie
s1
1-
2-
2-
22
Con
sum
able
: Sta
tione
ry p
rintin
g an
d of
fice
supp
lies
405
--
405
307
9875
.8%
436
436
Prop
erty
pay
men
ts-
--
--
--
146
146
Trave
l and
sub
siste
nce
1 11
0-
-1
110
834
276
75.1
%71
671
6
Train
ing
and
deve
lopm
ent
100
--
100
991
99.0
%31
31
Ope
ratin
g pa
ymen
ts-
168
-16
816
8-
100.
0%-
-
Venu
es a
nd fa
cilit
ies
360
--
360
206
154
57.2
%38
138
1
Rent
al a
nd h
iring
--
--
--
-14
14
Tra
nsfe
rs a
nd s
ubsi
die
s-
306
-30
630
6-
100.
0%-
-
Soci
al b
enef
its-
306
-30
630
6-
100.
0%-
-
Paym
ents
for c
ap
ital a
sset
s17
0(6
7)-
103
6637
64.1
%59
33
Mac
hine
ry a
nd e
quip
men
t17
0(6
7)-
103
6637
64.1
%59
33
Oth
er m
achi
nery
and
equ
ipm
ent
170
(67)
-10
366
3764
.1%
5933
Tot
al
7 88
1(6
7)1
062
8 87
66
923
1 95
378
.0%
6 99
86
912

page 186
Sub
-pro
gra
mm
e 3.
4: IN
FORM
ATIO
N S
OC
IETY
D
EVEL
OPM
ENT
2017
/18
2016
/17
Adju
sted
Ap
pro
pri-
atio
nSh
iftin
g o
f Fu
nds
Vire
men
t
Fina
l Ap
-p
rop
ria-
tion
Actu
al E
x-p
end
iture
Varia
nce
Exp
end
i-tu
re a
s %
of
fina
l a
pp
rop
ri-a
tion
Fina
l Ap
-p
rop
ria-
tion
Actu
al E
x-p
end
iture
Econ
omic
cla
ssifi
catio
nR'
000
R'00
0R'
000
R'00
0R'
000
R'00
0%
R'00
0R'
000
Cur
rent
pa
ymen
ts51
368
(3 3
52)
(2 0
67)
45 9
4943
423
2 52
694
.5%
51 2
1045
675
Com
pens
atio
n of
em
ploy
ees
34 9
97(2
35)
-34
762
34 4
7628
699
.2%
34 6
1433
331
Sala
ries
and
wag
es30
158
522
-30
680
30 6
80-
100.
0%30
062
29 6
36
Soci
al c
ontri
butio
ns4
839
(757
)-
4 08
23
796
286
93.0
%4
552
3 69
5
Goo
ds a
nd s
ervi
ces
16 3
71(3
117
)(2
067
)11
187
8 94
72
240
80.0
%16
596
12 3
44
Adm
inist
rativ
e fe
es30
130
-16
016
0-
100.
0%27
315
5
Adve
rtisin
g14
032
9-
469
280
189
59.7
%39
5-
Min
or a
sset
s32
1(2
0)-
301
629
52.
0%23
49
Burs
arie
s: E
mpl
oyee
s35
080
-43
043
0-
100.
0%16
016
0
Cat
erin
g: D
epar
tmen
tal a
ctiv
ities
145
453
-59
840
119
767
.1%
243
205
Com
mun
icat
ion
(G&
S)59
729
9-
896
896
-10
0.0%
1 07
286
1
Com
pute
r ser
vice
s-
--
--
--
6262
Con
sulta
nts:
Bus
ines
s an
d ad
viso
ry s
ervi
ces
10 1
31(7
246
)(2
067
)81
836
845
045
.0%
4 29
04
290
Con
tract
ors
-62
1-
621
621
-10
0.0%
118
4
Agen
cy a
nd s
uppo
rt / o
utso
urce
d se
rvic
es1
293
(1 2
17)
-76
-76
-48
-
Ente
rtain
men
t20
--
206
1430
.0%
286
Flee
t ser
vice
s (in
clud
ing
gove
rnm
ent m
otor
tra
nspo
rt)-
173
-17
317
3-
100.
0%25
225
2

page 187
Sub
-pro
gra
mm
e 3.
4: IN
FORM
ATIO
N S
OC
IETY
D
EVEL
OPM
ENT
2017
/18
2016
/17
Adju
sted
Ap
pro
pri-
atio
nSh
iftin
g o
f Fu
nds
Vire
men
t
Fina
l Ap
-p
rop
ria-
tion
Actu
al E
x-p
end
iture
Varia
nce
Exp
end
i-tu
re a
s %
of
fina
l a
pp
rop
ri-a
tion
Fina
l Ap
-p
rop
ria-
tion
Actu
al E
x-p
end
iture
Econ
omic
cla
ssifi
catio
nR'
000
R'00
0R'
000
R'00
0R'
000
R'00
0%
R'00
0R'
000
Inve
ntor
y: M
ater
ials
and
supp
lies
10(1
0)-
--
--
51
Inve
ntor
y: O
ther
sup
plie
s-
--
--
--
5-
Con
sum
able
sup
plie
s10
19-
2919
1065
.5%
2311
Con
sum
able
: Sta
tione
ry p
rintin
g an
d of
fice
supp
lies
340
377
-71
756
515
278
.8%
384
318
Ope
ratin
g le
ases
520
82-
602
297
305
49.3
%37
137
1
Prop
erty
pay
men
ts-
--
--
--
7676
Trave
l and
sub
siste
nce
1 60
02
192
-3
792
3 50
928
392
.5%
3 24
72
947
Train
ing
and
deve
lopm
ent
400
(14)
-38
637
97
98.2
%3
258
582
Ope
ratin
g pa
ymen
ts30
116
-14
647
9932
.2%
6345
Venu
es a
nd fa
cilit
ies
334
535
-86
977
198
88.7
%1
989
1 98
9
Rent
al a
nd h
iring
100
(16)
-84
1965
22.6
%-
-
Tra
nsfe
rs a
nd s
ubsi
die
s-
117
-11
711
7-
100.
0%26
26
Publ
ic c
orpo
ratio
ns a
nd p
rivat
e en
terp
rises
--
--
--
-5
5
Priv
ate
ente
rpris
es-
--
--
--
55
Oth
er tr
ansf
ers
to p
rivat
e en
terp
rises
--
--
--
-5
5
Hous
ehol
ds-
117
-11
711
7-
100.
0%21
21
Soci
al b
enef
its-
85-
8585
-10
0.0%
99

page 188
Sub
-pro
gra
mm
e 3.
4: IN
FORM
ATIO
N S
OC
IETY
D
EVEL
OPM
ENT
2017
/18
2016
/17
Adju
sted
Ap
pro
pri-
atio
nSh
iftin
g o
f Fu
nds
Vire
men
t
Fina
l Ap
-p
rop
ria-
tion
Actu
al E
x-p
end
iture
Varia
nce
Exp
end
i-tu
re a
s %
of
fina
l a
pp
rop
ri-a
tion
Fina
l Ap
-p
rop
ria-
tion
Actu
al E
x-p
end
iture
Econ
omic
cla
ssifi
catio
nR'
000
R'00
0R'
000
R'00
0R'
000
R'00
0%
R'00
0R'
000
Oth
er tr
ansf
ers
to h
ouse
hold
s-
32-
3232
-10
0.0%
1212
Paym
ents
for c
ap
ital a
sset
s41
1-
-41
127
913
267
.9%
437
437
Mac
hine
ry a
nd e
quip
men
t41
1-
-41
127
913
267
.9%
437
437
Oth
er m
achi
nery
and
equ
ipm
ent
411
--
411
279
132
67.9
%43
743
7
Tot
al
51 7
79(3
235
)(2
067
)46
477
43 8
192
658
94.3
%51
673
46 1
38

page 189
Sub
-pro
gra
mm
e 3.
5: C
APAC
ITY
DEV
ELO
PMEN
T20
17/1
820
16/1
7
Adju
sted
Ap
pro
pri-
atio
nSh
iftin
g o
f Fu
nds
Vire
men
t
Fina
l Ap
-p
rop
ria-
tion
Actu
al E
x-p
end
iture
Varia
nce
Exp
end
i-tu
re a
s %
of
fina
l a
pp
rop
ri-a
tion
Fina
l Ap
-p
rop
ria-
tion
Actu
al E
x-p
end
iture
Econ
omic
cla
ssifi
catio
nR'
000
R'00
0R'
000
R'00
0R'
000
R'00
0%
R'00
0R'
000
Cur
rent
pa
ymen
ts8
775
235
-9
010
9 01
0-
100.
0%9
877
9 48
5
Com
pens
atio
n of
em
ploy
ees
2 69
323
5-
2 92
82
928
-10
0.0%
2 97
22
580
Sala
ries
and
wag
es2
119
446
-2
565
2 56
5-
100.
0%2
283
2 28
3
Soci
al c
ontri
butio
ns57
4(2
11)
-36
336
3-
100.
0%68
929
7
Goo
ds a
nd s
ervi
ces
6 08
2-
-6
082
6 08
2-
100.
0%6
905
6 90
5
Con
sulta
nts:
Bus
ines
s an
d ad
viso
ry s
ervi
ces
925
990
-6
082
6 08
2-
100.
0%-
-
Train
ing
and
deve
lopm
ent
5 99
0(5
990
)-
--
--
6 90
56
905
Paym
ents
for c
ap
ital a
sset
s66
(21)
-45
-45
--
-
Mac
hine
ry a
nd e
quip
men
t66
(21)
-45
-45
--
-
Oth
er m
achi
nery
and
equ
ipm
ent
66(2
1)-
45-
45-
--
Tot
al
8 84
121
4-
9 05
59
010
4599
.5%
9 87
79
485

Prog
ram
me
4: IC
T EN
TERP
RISE
DEV
ELO
PMEN
T AN
D
OVE
RSIG
HT20
17/1
820
16/1
7
Adju
sted
Ap
pro
pri-
atio
nSh
iftin
g o
f Fu
nds
Vire
men
t
Fina
l Ap
-p
rop
ria-
tion
Actu
al E
x-p
end
iture
Varia
nce
Exp
end
i-tu
re a
s %
of
fina
l a
pp
rop
ri-a
tion
Fina
l Ap
-p
rop
ria-
tion
Actu
al E
x-p
end
iture
R'00
0R'
000
R'00
0R'
000
R'00
0R'
000
%R'
000
R'00
0
Sub
pro
gra
mm
e
1.Pu
blic
Ent
ity O
vers
ight
3 93
9 30
2(9
17)
(1 2
72)
3 93
7 11
33
937
113
-10
0.0%
872
547
869
830
2.Sm
all
Med
ium
and
Mic
ro E
nter
prise
Dev
elop
men
t4
800
334
-5
134
4 43
070
486
.3%
5 79
74
427
3.IC
T Su
ppor
t7
589
583
(131
)8
041
7 51
352
893
.4%
8 26
48
096
3 95
1 69
1-
(1 4
03)
3 95
0 28
83
949
056
1 23
210
0.0%
886
608
882
353
Econ
omic
cla
ssifi
catio
n
C
urre
nt p
aym
ents
34 3
42(2
)(1
403
)32
937
32 1
1881
997
.5%
34 0
7030
345
C
ompe
nsat
ion
of e
mpl
oyee
s27
736
-12
227
858
27 8
58-
100.
0%26
076
25 1
82
Sa
larie
s an
d w
ages
21 6
013
326
5024
977
24 9
77-
100.
0%23
297
22 5
43
So
cial
con
tribu
tions
6 13
5(3
326
)72
2 88
12
881
-10
0.0%
2 77
92
639
G
oods
and
ser
vice
s6
606
(2)
(1 5
25)
5 07
94
260
819
83.9
%7
994
5 16
3
Ad
min
istra
tive
fees
1156
-67
598
88.1
%14
166
Ad
verti
sing
100
15-
115
5758
49.6
%1
958
1 79
7
M
inor
ass
ets
3038
(12)
5641
1573
.2%
104
6
Au
dit c
osts
: Ext
erna
l50
(42)
(8)
--
--
--
Bu
rsar
ies:
Em
ploy
ees
351
(178
)-
173
138
3579
.8%
167
167
C
ater
ing:
Dep
artm
enta
l act
iviti
es34
28-
6257
591
.9%
224
60
C
omm
unic
atio
n (G
&S)
590
(2)
(8)
580
565
1597
.4%
490
478
page 190

Prog
ram
me
4: IC
T EN
TERP
RISE
DEV
ELO
PMEN
T AN
D
OVE
RSIG
HT20
17/1
820
16/1
7
Adju
sted
Ap
pro
pri-
atio
nSh
iftin
g o
f Fu
nds
Vire
men
t
Fina
l Ap
-p
rop
ria-
tion
Actu
al E
x-p
end
iture
Varia
nce
Exp
end
i-tu
re a
s %
of
fina
l a
pp
rop
ri-a
tion
Fina
l Ap
-p
rop
ria-
tion
Actu
al E
x-p
end
iture
R'00
0R'
000
R'00
0R'
000
R'00
0R'
000
%R'
000
R'00
0
C
ompu
ter s
ervi
ces
2043
4(9
5)35
935
9-
100.
0%-
-
C
onsu
ltant
s: B
usin
ess
and
advi
sory
ser
vice
s2
146
(483
)(1
313
)35
024
326
6.9%
1 26
321
3
C
ontra
ctor
s-
38-
3818
2047
.4%
1615
Ag
ency
and
sup
port
/ out
sour
ced
serv
ices
14-
(10)
4-
4-
25-
En
terta
inm
ent
12(1
)(7
)4
4-
100.
0%56
1
Fl
eet s
ervi
ces
(incl
udin
g go
vern
men
t mot
or
trans
port)
-9
-9
27
22.2
%-
-
In
vent
ory:
Oth
er s
uppl
ies
--
--
--
-32
-
C
onsu
mab
le s
uppl
ies
-10
-10
73
70.0
%21
5
C
onsu
mab
le: S
tatio
nery
prin
ting
and
offic
e su
pplie
s26
717
1(3
7)40
138
615
96.3
%48
726
1
O
pera
ting
leas
es16
9-
(18)
151
151
-10
0.0%
221
164
Pr
oper
ty p
aym
ents
-37
0-
370
369
199
.7%
--
T ra
vel a
nd s
ubsis
tenc
e1
764
(99)
(89)
1 57
61
504
7295
.4%
1 87
01
686
Tra
inin
g an
d de
velo
pmen
t71
7(2
49)
-46
827
519
358
.8%
257
195
O
pera
ting
paym
ents
174
(50)
(92)
3230
293
.8%
497
3
V e
nues
and
faci
litie
s15
7(6
7)16
425
421
440
84.3
%16
546
Tr
ans
fers
and
sub
sid
ies
216
083
2-
216
085
216
085
-10
0.0%
201
403
201
403
page 191

page 192
Prog
ram
me
4: IC
T EN
TERP
RISE
DEV
ELO
PMEN
T AN
D
OVE
RSIG
HT20
17/1
820
16/1
7
Adju
sted
Ap
pro
pri-
atio
nSh
iftin
g o
f Fu
nds
Vire
men
t
Fina
l Ap
-p
rop
ria-
tion
Actu
al E
x-p
end
iture
Varia
nce
Exp
end
i-tu
re a
s %
of
fina
l a
pp
rop
ri-a
tion
Fina
l Ap
-p
rop
ria-
tion
Actu
al E
x-p
end
iture
R'00
0R'
000
R'00
0R'
000
R'00
0R'
000
%R'
000
R'00
0
D
epar
tmen
tal a
genc
ies
and
acco
unts
216
083
--
216
083
216
083
-10
0.0%
201
401
201
401
D
epar
tmen
tal a
genc
ies
(non
-bus
ines
s en
titie
s)21
6 08
3-
-21
6 08
321
6 08
3-
100.
0%20
1 40
120
1 40
1
Ho
useh
olds
-2
-2
2-
100.
0%2
2
O
ther
tran
sfer
s to
hou
seho
lds
-2
-2
2-
100.
0%2
2
Pa
ymen
ts fo
r ca
pita
l ass
ets
1 26
6-
-1
266
853
413
67.4
%1
135
605
M
achi
nery
and
equ
ipm
ent
1 26
6-
-1
266
853
413
67.4
%1
135
605
O
ther
mac
hine
ry a
nd e
quip
men
t1
266
--
1 26
685
341
367
.4%
1 13
560
5
Pa
ymen
t for
fina
ncia
l ass
ets
3 70
0 00
0-
-3
700
000
3 70
0 00
0-
100.
0%65
0 00
065
0 00
0
3 95
1 69
1-
(1 4
03)
3 95
0 28
83
949
056
1 23
210
0.0%
886
608
882
353

Sub
-pro
gra
mm
e 4.
1: P
UBLI
C E
NTI
TY O
VERS
IGHT
2017
/18
2016
/17
Adju
sted
Ap
pro
pri-
atio
nSh
iftin
g o
f Fu
nds
Vire
men
t
Fina
l Ap
-p
rop
ria-
tion
Actu
al E
x-p
end
iture
Varia
nce
Exp
end
i-tu
re a
s %
of
fina
l a
pp
rop
ri-a
tion
Fina
l Ap
-p
rop
ria-
tion
Actu
al E
x-p
end
iture
Econ
omic
cla
ssifi
catio
nR'
000
R'00
0R'
000
R'00
0R'
000
R'00
0%
R'00
0R'
000
Cur
rent
pa
ymen
ts22
873
(921
)(1
272
)20
680
20 6
80-
100.
0%20
444
18 0
98
Com
pens
atio
n of
em
ploy
ees
18 1
56(1
35)
-18
021
18 0
21-
100.
0%16
929
16 1
84
Sala
ries
and
wag
es12
994
3 19
2-
16 1
8616
186
-10
0.0%
15 2
5314
508
Soci
al c
ontri
butio
ns5
162
(3 3
27)
-1
835
1 83
5-
100.
0%1
676
1 67
6
Goo
ds a
nd s
ervi
ces
4 71
7(7
86)
(1 2
72)
2 65
92
659
-10
0.0%
3 51
51
914
Adm
inist
rativ
e fe
es3
38-
4141
-10
0.0%
5748
Adve
rtisin
g-
--
--
--
40-
Min
or a
sset
s16
33(1
2)37
37-
100.
0%31
4
Audi
t cos
ts: E
xter
nal
50(4
2)(8
)-
--
--
-
Burs
arie
s: E
mpl
oyee
s27
1(1
58)
-11
311
3-
100.
0%11
511
5
Cat
erin
g: D
epar
tmen
tal a
ctiv
ities
1737
-54
54-
100.
0%41
41
Com
mun
icat
ion
(G&
S)44
0(6
2)(8
)37
037
0-
100.
0%29
029
0
Com
pute
r ser
vice
s-
3(1
)2
2-
100.
0%-
-
Con
sulta
nts:
Bus
ines
s an
d ad
viso
ry s
ervi
ces
2 05
6(9
43)
(1 1
13)
--
--
1 05
99
Con
tract
ors
-17
-17
17-
100.
0%10
9
Agen
cy a
nd s
uppo
rt / o
utso
urce
d se
rvic
es10
-(1
0)-
--
--
-
Ente
rtain
men
t10
-(7
)3
3-
100.
0%19
1
Inve
ntor
y: O
ther
sup
plie
s-
--
--
--
16-
Con
sum
able
sup
plie
s-
6-
66
-10
0.0%
204
Con
sum
able
: Sta
tione
ry p
rintin
g an
d of
fice
supp
lies
112
155
-26
726
7-
100.
0%14
814
8
Ope
ratin
g le
ases
169
-(1
8)15
115
1-
100.
0%16
416
4
page 193

page 194
Sub
-pro
gra
mm
e 4.
1: P
UBLI
C E
NTI
TY O
VERS
IGHT
2017
/18
2016
/17
Adju
sted
Ap
pro
pri-
atio
nSh
iftin
g o
f Fu
nds
Vire
men
t
Fina
l Ap
-p
rop
ria-
tion
Actu
al E
x-p
end
iture
Varia
nce
Exp
end
i-tu
re a
s %
of
fina
l a
pp
rop
ri-a
tion
Fina
l Ap
-p
rop
ria-
tion
Actu
al E
x-p
end
iture
Econ
omic
cla
ssifi
catio
nR'
000
R'00
0R'
000
R'00
0R'
000
R'00
0%
R'00
0R'
000
Prop
erty
pay
men
ts-
320
-32
032
0-
100.
0%-
-
Trave
l and
sub
siste
nce
847
186
-1
033
1 03
3-
100.
0%96
296
2
Train
ing
and
deve
lopm
ent
415
(229
)-
186
186
-10
0.0%
119
73
Ope
ratin
g pa
ymen
ts17
4(7
0)(9
2)12
12-
100.
0%34
1-
Venu
es a
nd fa
cilit
ies
127
(77)
(3)
4747
-10
0.0%
8346
Tra
nsfe
rs a
nd s
ubsi
die
s21
6 08
32
-21
6 08
521
6 08
5-
100.
0%20
1 40
120
1 40
1
Dep
artm
enta
l age
ncie
s an
d ac
coun
ts21
6 08
3-
-21
6 08
321
6 08
3-
100.
0%20
1 40
120
1 40
1
Dep
artm
enta
l age
ncie
s (n
on-b
usin
ess
entit
ies)
216
083
--
216
083
216
083
-10
0.0%
201
401
201
401
Hous
ehol
ds-
2-
22
-10
0.0%
--
Oth
er tr
ansf
ers
to h
ouse
hold
s-
2-
22
-10
0.0%
--
Paym
ents
for c
ap
ital a
sset
s34
62
-34
834
8-
100.
0%70
233
1
Mac
hine
ry a
nd e
quip
men
t34
62
-34
834
8-
100.
0%70
233
1
Oth
er m
achi
nery
and
equ
ipm
ent
346
2-
348
348
-10
0.0%
702
331
Paym
ent f
or fi
nanc
ial a
sset
s3
700
000
--
3 70
0 00
03
700
000
-10
0.0%
650
000
650
000
Tot
al
3 93
9 30
2(9
17)
(1 2
72)
3 93
7 11
33
937
113
-10
0.0%
872
547
869
830

Sub
-pro
gra
mm
e 4.
2: S
MAL
L M
EDIU
M A
ND
MIC
RO
ENTE
RPRI
SE D
EVEL
OPM
ENT
2017
/18
2016
/17
Adju
sted
Ap
pro
pri-
atio
nSh
iftin
g o
f Fu
nds
Vire
men
t
Fina
l Ap
-p
rop
ria-
tion
Actu
al E
x-p
end
iture
Varia
nce
Exp
end
i-tu
re a
s %
of
fina
l a
pp
rop
ri-a
tion
Fina
l Ap
-p
rop
ria-
tion
Actu
al E
x-p
end
iture
Econ
omic
cla
ssifi
catio
nR'
000
R'00
0R'
000
R'00
0R'
000
R'00
0%
R'00
0R'
000
Cur
rent
pa
ymen
ts4
710
336
-5
046
4 43
061
687
.8%
5 54
54
175
Com
pens
atio
n of
em
ploy
ees
3 96
452
-4
016
4 01
6-
100.
0%3
722
3 58
2
Sala
ries
and
wag
es3
364
206
-3
570
3 57
0-
100.
0%3
183
3 18
3
Soci
al c
ontri
butio
ns60
0(1
54)
-44
644
6-
100.
0%53
939
9
Goo
ds a
nd s
ervi
ces
746
284
-1
030
414
616
40.2
%1
823
593
Adm
inist
rativ
e fe
es-
--
--
--
759
Adve
rtisin
g10
015
-11
557
5849
.6%
159
38
Min
or a
sset
s-
5-
51
420
.0%
732
Burs
arie
s: E
mpl
oyee
s80
(20)
-60
2535
41.7
%52
52
Cat
erin
g: D
epar
tmen
tal a
ctiv
ities
5-
-5
-5
-17
39
Com
mun
icat
ion
(G&
S)10
0-
-10
086
1486
.0%
8674
Con
sulta
nts:
Bus
ines
s an
d ad
viso
ry s
ervi
ces
9026
0-
350
2432
66.
9%19
919
9
Con
tract
ors
-21
-21
120
4.8%
66
Agen
cy a
nd s
uppo
rt / o
utso
urce
d se
rvic
es4
--
4-
4-
25-
Ente
rtain
men
t2
(1)
-1
1-
100.
0%37
-
Flee
t ser
vice
s (in
clud
ing
gove
rnm
ent m
otor
tra
nspo
rt)-
9-
92
722
.2%
--
Con
sum
able
sup
plie
s-
4-
41
325
.0%
--
page 195

page 196
Sub
-pro
gra
mm
e 4.
2: S
MAL
L M
EDIU
M A
ND
MIC
RO
ENTE
RPRI
SE D
EVEL
OPM
ENT
2017
/18
2016
/17
Adju
sted
Ap
pro
pri-
atio
nSh
iftin
g o
f Fu
nds
Vire
men
t
Fina
l Ap
-p
rop
ria-
tion
Actu
al E
x-p
end
iture
Varia
nce
Exp
end
i-tu
re a
s %
of
fina
l a
pp
rop
ri-a
tion
Fina
l Ap
-p
rop
ria-
tion
Actu
al E
x-p
end
iture
Econ
omic
cla
ssifi
catio
nR'
000
R'00
0R'
000
R'00
0R'
000
R'00
0%
R'00
0R'
000
Con
sum
able
: Sta
tione
ry p
rintin
g an
d of
fice
supp
lies
3516
-51
3615
70.6
%25
428
Ope
ratin
g le
ases
--
--
--
-57
-
Prop
erty
pay
men
ts-
50-
5049
198
.0%
--
Trave
l and
sub
siste
nce
150
(85)
-65
2441
36.9
%24
561
Train
ing
and
deve
lopm
ent
150
(20)
-13
089
4168
.5%
128
112
Ope
ratin
g pa
ymen
ts-
20-
2018
290
.0%
156
3
Venu
es a
nd fa
cilit
ies
3010
-40
-40
-82
-
Paym
ents
for c
ap
ital a
sset
s90
(2)
-88
-88
-25
225
2
Mac
hine
ry a
nd e
quip
men
t90
(2)
-88
-88
-25
225
2
Oth
er m
achi
nery
and
equ
ipm
ent
90(2
)-
88-
88-
252
252
Tot
al
4 80
033
4-
5 13
44
430
704
86.3
%5
797
4 42
7

Sub
-pro
gra
mm
e 4.
3: IC
T SU
PPO
RT20
17/1
820
16/1
7
Adju
sted
Ap
pro
pri-
atio
nSh
iftin
g o
f Fu
nds
Vire
men
t
Fina
l Ap
-p
rop
ria-
tion
Actu
al E
x-p
end
iture
Varia
nce
Exp
end
i-tu
re a
s %
of
fina
l a
pp
rop
ri-a
tion
Fina
l Ap
-p
rop
ria-
tion
Actu
al E
x-p
end
iture
Econ
omic
cla
ssifi
catio
nR'
000
R'00
0R'
000
R'00
0R'
000
R'00
0%
R'00
0R'
000
Cur
rent
pa
ymen
ts6
759
583
(131
)7
211
7 00
820
397
.2%
8 08
18
072
Com
pens
atio
n of
em
ploy
ees
5 61
683
122
5 82
15
821
-10
0.0%
5 42
55
416
Sala
ries
and
wag
es5
243
(72)
505
221
5 22
1-
100.
0%4
861
4 85
2
Soci
al c
ontri
butio
ns37
315
572
600
600
-10
0.0%
564
564
Goo
ds a
nd s
ervi
ces
1 14
350
0(2
53)
1 39
01
187
203
85.4
%2
656
2 65
6
Adm
inist
rativ
e fe
es8
18-
2618
869
.2%
99
Adve
rtisin
g-
--
--
--
1 75
91
759
Min
or a
sset
s14
--
143
1121
.4%
--
Cat
erin
g: D
epar
tmen
tal a
ctiv
ities
12(9
)-
33
-10
0.0%
1010
Com
mun
icat
ion
(G&
S)50
60-
110
109
199
.1%
114
114
Com
pute
r ser
vice
s20
431
(94)
357
357
-10
0.0%
--
Con
sulta
nts:
Bus
ines
s an
d ad
viso
ry s
ervi
ces
-20
0(2
00)
--
--
55
Con
sum
able
sup
plie
s-
--
--
--
11
Con
sum
able
: Sta
tione
ry p
rintin
g an
d of
fice
supp
lies
120
-(3
7)83
83-
100.
0%85
85
Trave
l and
sub
siste
nce
767
(200
)(8
9)47
844
731
93.5
%66
366
3
Train
ing
and
deve
lopm
ent
152
--
152
-15
2-
1010
Venu
es a
nd fa
cilit
ies
--
167
167
167
-10
0.0%
--
page 197

page 198
Sub
-pro
gra
mm
e 4.
3: IC
T SU
PPO
RT20
17/1
820
16/1
7
Adju
sted
Ap
pro
pri-
atio
nSh
iftin
g o
f Fu
nds
Vire
men
t
Fina
l Ap
-p
rop
ria-
tion
Actu
al E
x-p
end
iture
Varia
nce
Exp
end
i-tu
re a
s %
of
fina
l a
pp
rop
ri-a
tion
Fina
l Ap
-p
rop
ria-
tion
Actu
al E
x-p
end
iture
Econ
omic
cla
ssifi
catio
nR'
000
R'00
0R'
000
R'00
0R'
000
R'00
0%
R'00
0R'
000
Tra
nsfe
rs a
nd s
ubsi
die
s-
--
--
--
22
Hous
ehol
ds-
--
--
--
22
Oth
er tr
ansf
ers
to h
ouse
hold
s-
--
--
--
22
Paym
ents
for c
ap
ital a
sset
s83
0-
-83
050
532
560
.8%
181
22
Mac
hine
ry a
nd e
quip
men
t83
0-
-83
050
532
560
.8%
181
22
Oth
er m
achi
nery
and
equ
ipm
ent
830
--
830
505
325
60.8
%18
122
Tot
al
7 58
958
3(1
31)
8 04
17
513
528
93.4
%8
264
8 09
6

Prog
ram
me
5: IC
T IN
FRA
STRU
CTU
RE S
UPPO
RT20
17/1
820
16/1
7
Adju
sted
Ap
pro
pri-
atio
nSh
iftin
g o
f Fu
nds
Vire
men
t
Fina
l Ap
-p
rop
ria-
tion
Actu
al E
x-p
end
iture
Varia
nce
Exp
end
i-tu
re a
s %
of
fina
l a
pp
rop
ri-a
tion
Fina
l Ap
-p
rop
ria-
tion
Actu
al E
x-p
end
iture
R'00
0R'
000
R'00
0R'
000
R'00
0R'
000
%R'
000
R'00
0
Sub
pro
gra
mm
e
1.Br
oadb
and
323
015
-(9
868
)31
3 14
739
313
273
834
12.6
%34
6 89
326
935
2.D
igita
l Ter
rest
rial T
elev
ision
565
098
--
565
098
565
098
-10
0.0%
829
384
829
384
888
113
-(9
868
)87
8 24
560
4 41
127
3 83
468
.8%
1 17
6 27
785
6 31
9
Econ
omic
cla
ssifi
catio
n
C
urre
nt p
aym
ents
320
855
(208
)(8
294
)31
2 35
338
933
273
420
12.5
%34
5 97
326
308
C
ompe
nsat
ion
of e
mpl
oyee
s20
611
-(1
22)
20 4
8920
028
461
97.8
%21
639
19 8
73
Sa
larie
s an
d w
ages
19 3
11(7
28)
(122
)18
461
18 0
0046
197
.5%
19 5
3317
767
So
cial
con
tribu
tions
1 30
072
8-
2 02
82
028
-10
0.0%
2 10
62
106
G
oods
and
ser
vice
s30
0 24
4(2
08)
(8 1
72)
291
864
18 9
0527
2 95
96.
5%32
4 33
46
435
Ad
min
istra
tive
fees
210
28(4
0)19
815
345
77.3
%19
918
6
Ad
verti
sing
400
(35)
(150
)21
510
411
148
.4%
92-
M
inor
ass
ets
248
32(2
38)
4242
-10
0.0%
610
9
Bu
rsar
ies:
Em
ploy
ees
455
(241
)-
214
3717
717
.3%
311
105
C
ater
ing:
Dep
artm
enta
l act
iviti
es47
513
4(1
26)
483
443
4091
.7%
235
65
C
omm
unic
atio
n (G
&S)
618
(56)
(146
)41
641
6-
100.
0%81
640
2
C
ompu
ter s
ervi
ces
2 87
2(7
2)(1
535
)1
265
1 26
41
99.9
%85
715
2
C
onsu
ltant
s: B
usin
ess
and
advi
sory
ser
vice
s28
3 82
02
918
(3 1
63)
283
575
11 4
9327
2 08
24.
1%2
071
763
page 199

Prog
ram
me
5: IC
T IN
FRA
STRU
CTU
RE S
UPPO
RT20
17/1
820
16/1
7
Adju
sted
Ap
pro
pri-
atio
nSh
iftin
g o
f Fu
nds
Vire
men
t
Fina
l Ap
-p
rop
ria-
tion
Actu
al E
x-p
end
iture
Varia
nce
Exp
end
i-tu
re a
s %
of
fina
l a
pp
rop
ri-a
tion
Fina
l Ap
-p
rop
ria-
tion
Actu
al E
x-p
end
iture
R'00
0R'
000
R'00
0R'
000
R'00
0R'
000
%R'
000
R'00
0
Le
gal s
ervi
ces
--
--
--
-83
1-
C
ontra
ctor
s-
12-
122
1016
.7%
189
-
Ag
ency
and
sup
port
/ out
sour
ced
serv
ices
500
(500
)-
--
--
311
600
-
En
terta
inm
ent
31-
-31
427
12.9
%37
1
Fl
eet s
ervi
ces
(incl
udin
g go
vern
men
t mot
or
trans
port)
-26
-26
26-
100.
0%55
55
In
vent
ory:
Mat
eria
ls an
d su
pplie
s-
--
--
--
31
In
vent
ory:
Oth
er s
uppl
ies
--
--
--
-24
-
C
onsu
mab
le s
uppl
ies
2513
-38
1820
47.4
%20
11
C
onsu
mab
le: S
tatio
nery
prin
ting
and
offic
e su
pplie
s34
058
-39
826
313
566
.1%
518
197
O
pera
ting
leas
es17
0(1
)-
169
7099
41.4
%91
681
Pr
oper
ty p
aym
ents
1 14
8(1
133
)-
15-
15-
120
120
T ra
vel a
nd s
ubsis
tenc
e4
917
655
(1 4
72)
4 10
04
100
-10
0.0%
3 77
03
770
Tra
inin
g an
d de
velo
pmen
t50
042
-54
241
812
477
.1%
488
385
O
pera
ting
paym
ents
603
-63
2538
39.7
%11
617
V e
nues
and
faci
litie
s3
420
(2 0
91)
(1 3
02)
2727
-10
0.0%
456
115
Re
ntal
and
hirin
g35
--
35-
35-
--
page 200

page 201
Prog
ram
me
5: IC
T IN
FRA
STRU
CTU
RE S
UPPO
RT20
17/1
820
16/1
7
Adju
sted
Ap
pro
pri-
atio
nSh
iftin
g o
f Fu
nds
Vire
men
t
Fina
l Ap
-p
rop
ria-
tion
Actu
al E
x-p
end
iture
Varia
nce
Exp
end
i-tu
re a
s %
of
fina
l a
pp
rop
ri-a
tion
Fina
l Ap
-p
rop
ria-
tion
Actu
al E
x-p
end
iture
R'00
0R'
000
R'00
0R'
000
R'00
0R'
000
%R'
000
R'00
0
Tr
ans
fers
and
sub
sid
ies
565
098
208
-56
5 30
656
5 30
6-
100.
0%82
9 45
382
9 45
3
D
epar
tmen
tal a
genc
ies
and
acco
unts
79 0
98-
-79
098
79 0
98-
100.
0%58
9 38
458
9 38
4
D
epar
tmen
tal a
genc
ies
(non
-bus
ines
s en
titie
s)79
098
--
79 0
9879
098
-10
0.0%
589
384
589
384
Pu
blic
cor
pora
tions
and
priv
ate
ente
rpris
es48
6 00
0-
-48
6 00
048
6 00
0-
100.
0%24
0 00
524
0 00
5
Pu
blic
cor
pora
tions
486
000
--
486
000
486
000
-10
0.0%
240
000
240
000
O
ther
tran
sfer
s to
pub
lic c
orpo
ratio
ns48
6 00
0-
-48
6 00
048
6 00
0-
100.
0%24
0 00
024
0 00
0
Pr
ivat
e en
terp
rises
--
--
--
-5
5
O
ther
tran
sfer
s to
priv
ate
ente
rpris
es-
--
--
--
55
Ho
useh
olds
-20
8-
208
208
-10
0.0%
6464
So
cial
ben
efits
-20
4-
204
204
-10
0.0%
5858
O
ther
tran
sfer
s to
hou
seho
lds
-4
-4
4-
100.
0%6
6
Pa
ymen
ts fo
r ca
pita
l ass
ets
2 16
0-
(1 5
74)
586
172
414
29.4
%85
155
8
M
achi
nery
and
equ
ipm
ent
1 21
0-
(724
)48
615
932
732
.7%
471
178
O
ther
mac
hine
ry a
nd e
quip
men
t1
210
-(7
24)
486
159
327
32.7
%47
117
8
So
ftwar
e an
d ot
her i
ntan
gibl
e as
sets
950
-(8
50)
100
1387
13.0
%38
038
0
888
113
-(9
868
)87
8 24
560
4 41
127
3 83
468
.8%
1 17
6 27
785
6 31
9

Sub
-pro
gra
mm
e 5.
1: B
ROAD
BAN
D20
17/1
820
16/1
7
Adju
sted
Ap
pro
pri-
atio
nSh
iftin
g o
f Fu
nds
Vire
men
t
Fina
l Ap
-p
rop
ria-
tion
Actu
al E
x-p
end
iture
Varia
nce
Exp
end
i-tu
re a
s %
of
fina
l a
pp
rop
ri-a
tion
Fina
l Ap
-p
rop
ria-
tion
Actu
al E
x-p
end
iture
Econ
omic
cla
ssifi
catio
nR'
000
R'00
0R'
000
R'00
0R'
000
R'00
0%
R'00
0R'
000
Cur
rent
pa
ymen
ts32
0 85
5(2
08)
(8 2
94)
312
353
38 9
3327
3 42
012
.5%
345
973
26 3
08
Com
pens
atio
n of
em
ploy
ees
20 6
11-
(122
)20
489
20 0
2846
197
.8%
21 6
3919
873
Sala
ries
and
wag
es19
311
(728
)(1
22)
18 4
6118
000
461
97.5
%19
533
17 7
67
Soci
al c
ontri
butio
ns1
300
728
-2
028
2 02
8-
100.
0%2
106
2 10
6
Goo
ds a
nd s
ervi
ces
300
244
(208
)(8
172
)29
1 86
418
905
272
959
6.5%
324
334
6 43
5
Adm
inist
rativ
e fe
es21
028
(40)
198
153
4577
.3%
199
186
Adve
rtisin
g40
0(3
5)(1
50)
215
104
111
48.4
%92
-
Min
or a
sset
s24
832
(238
)42
42-
100.
0%61
09
Burs
arie
s: E
mpl
oyee
s45
5(2
41)
-21
437
177
17.3
%31
110
5
Cat
erin
g: D
epar
tmen
tal a
ctiv
ities
475
134
(126
)48
344
340
91.7
%23
565
Com
mun
icat
ion
(G&
S)61
8(5
6)(1
46)
416
416
-10
0.0%
816
402
Com
pute
r ser
vice
s2
872
(72)
(1 5
35)
1 26
51
264
199
.9%
857
152
Con
sulta
nts:
Bus
ines
s an
d ad
viso
ry s
ervi
ces
283
820
2 91
8(3
163
)28
3 57
511
493
272
082
4.1%
2 07
176
3
Lega
l ser
vice
s-
--
--
--
831
-
Con
tract
ors
-12
-12
210
16.7
%18
9-
Agen
cy a
nd s
uppo
rt / o
utso
urce
d se
rvic
es50
0(5
00)
--
--
-31
1 60
0-
Ente
rtain
men
t31
--
314
2712
.9%
371
page 202

page 203
Sub
-pro
gra
mm
e 5.
1: B
ROAD
BAN
D20
17/1
820
16/1
7
Adju
sted
Ap
pro
pri-
atio
nSh
iftin
g o
f Fu
nds
Vire
men
t
Fina
l Ap
-p
rop
ria-
tion
Actu
al E
x-p
end
iture
Varia
nce
Exp
end
i-tu
re a
s %
of
fina
l a
pp
rop
ri-a
tion
Fina
l Ap
-p
rop
ria-
tion
Actu
al E
x-p
end
iture
Econ
omic
cla
ssifi
catio
nR'
000
R'00
0R'
000
R'00
0R'
000
R'00
0%
R'00
0R'
000
Flee
t ser
vice
s (in
clud
ing
gove
rnm
ent m
otor
tra
nspo
rt)-
26-
2626
-10
0.0%
5555
Inve
ntor
y: M
ater
ials
and
supp
lies
--
--
--
-3
1
Inve
ntor
y: O
ther
sup
plie
s-
--
--
--
24-
Con
sum
able
sup
plie
s25
13-
3818
2047
.4%
2011
Con
sum
able
: Sta
tione
ry p
rintin
g an
d of
fice
supp
lies
340
58-
398
263
135
66.1
%51
819
7
Ope
ratin
g le
ases
170
(1)
-16
970
9941
.4%
916
81
Prop
erty
pay
men
ts1
148
(1 1
33)
-15
-15
-12
012
0
Trave
l and
sub
siste
nce
4 91
765
5(1
472
)4
100
4 10
0-
100.
0%3
770
3 77
0
Train
ing
and
deve
lopm
ent
500
42-
542
418
124
77.1
%48
838
5
Ope
ratin
g pa
ymen
ts60
3-
6325
3839
.7%
116
17
Venu
es a
nd fa
cilit
ies
3 42
0(2
091
)(1
302
)27
27-
100.
0%45
611
5
Rent
al a
nd h
iring
35-
-35
-35
--
-
Tra
nsfe
rs a
nd s
ubsi
die
s-
208
-20
820
8-
100.
0%69
69
Publ
ic c
orpo
ratio
ns a
nd p
rivat
e en
terp
rises
--
--
--
-5
5
Priv
ate
ente
rpris
es-
--
--
--
55
Oth
er tr
ansf
ers
to p
rivat
e en
terp
rises
--
--
--
-5
5

page 204
Sub
-pro
gra
mm
e 5.
1: B
ROAD
BAN
D20
17/1
820
16/1
7
Adju
sted
Ap
pro
pri-
atio
nSh
iftin
g o
f Fu
nds
Vire
men
t
Fina
l Ap
-p
rop
ria-
tion
Actu
al E
x-p
end
iture
Varia
nce
Exp
end
i-tu
re a
s %
of
fina
l a
pp
rop
ri-a
tion
Fina
l Ap
-p
rop
ria-
tion
Actu
al E
x-p
end
iture
Econ
omic
cla
ssifi
catio
nR'
000
R'00
0R'
000
R'00
0R'
000
R'00
0%
R'00
0R'
000
Hous
ehol
ds-
208
-20
820
8-
100.
0%64
64
Soci
al b
enef
its-
204
-20
420
4-
100.
0%58
58
Oth
er tr
ansf
ers
to h
ouse
hold
s-
4-
44
-10
0.0%
66
Paym
ents
for c
ap
ital a
sset
s2
160
-(1
574
)58
617
241
429
.4%
851
558
Mac
hine
ry a
nd e
quip
men
t1
210
-(7
24)
486
159
327
32.7
%47
117
8
Oth
er m
achi
nery
and
equ
ipm
ent
1 21
0-
(724
)48
615
932
732
.7%
471
178
Softw
are
and
othe
r int
angi
ble
asse
ts95
0-
(850
)10
013
8713
.0%
380
380
Tot
al
323
015
-(9
868
)31
3 14
739
313
273
834
12.6
%34
6 89
326
935

Sub
-pro
gra
mm
e 5.
2: D
IGIT
AL T
ERRE
STRI
AL T
ELEV
ISIO
N20
17/1
820
16/1
7
Adju
sted
Ap
pro
pri-
atio
nSh
iftin
g o
f Fu
nds
Vire
men
t
Fina
l Ap
-p
rop
ria-
tion
Actu
al E
x-p
end
iture
Varia
nce
Exp
end
i-tu
re a
s %
of
fina
l a
pp
rop
ri-a
tion
Fina
l Ap
-p
rop
ria-
tion
Actu
al E
x-p
end
iture
Econ
omic
cla
ssifi
catio
nR'
000
R'00
0R'
000
R'00
0R'
000
R'00
0%
R'00
0R'
000
Tra
nsfe
rs a
nd s
ubsi
die
s56
5 09
8-
-56
5 09
856
5 09
8-
100.
0%82
9 38
482
9 38
4
Dep
artm
enta
l age
ncie
s an
d ac
coun
ts79
098
--
79 0
9879
098
-10
0.0%
589
384
589
384
Dep
artm
enta
l age
ncie
s (n
on-b
usin
ess
entit
ies)
79 0
98-
-79
098
79 0
98-
100.
0%58
9 38
458
9 38
4
P ubl
ic c
orpo
ratio
ns a
nd p
rivat
e en
terp
rises
486
000
--
486
000
486
000
-10
0.0%
240
000
240
000
Publ
ic c
orpo
ratio
ns48
6 00
0-
-48
6 00
048
6 00
0-
100.
0%24
0 00
024
0 00
0
Oth
er tr
ansf
ers
to p
ublic
cor
pora
tions
486
000
--
486
000
486
000
-10
0.0%
240
000
240
000
Tot
al
565
098
--
565
098
565
098
-10
0.0%
829
384
829
384
page 205

TELECOMMUNICATIONS AND POSTAL SERVICES – VOTE 32NOTES TO THE APPROPRIATION STATEMENT
for the year ended 31 March 2018 1 Detail of transfers and subsidies as per Appropriation Act (after Virement):
Detail of these transactions can be viewed in the note on Transfers and Subsidies and Annexure 1 (A-G) to the Annual
Financial Statements.
2 Detail of specifically and exclusively appropriated amounts voted (after Virement):Detail of these transactions can be viewed in note 1 (Annual Appropriation) to the Annual Financial Statements.
3 Detail on payments for financial assetsDetail of these transactions per programme can be viewed in the Note to Payments for Financial Assets to the Annual
Financial Statements.
4 Explanations of material variances from Amounts Voted (after virement):
4.1 Per programme: Final
Appropriation
Actual
Expenditure
Variance Variance as a %
of Final
AppropriationR’000 R’000 R’000 %
Administration 209 328 209 202 126 0.06Current payments 198 918 198 792 126 0.06Transfers and subsidies 1 142 1 142 - -Payment for capital assets 9 268 9 268 - -
International Affairs and Trade
51 748 50 612 1 136 2.2Current payments 25 408 24 615 793 3.1Transfers and subsidies 25 970 25 968 2 -Payment for capital assets 379 29 341 92.2
Policy Research and Capacity
Development 84 518 78 524 5 994 7.1Current payments 83 441 77 676 5 765 6.9Transfers and subsidies 430 430 - -Payment for capital assets 647 418 229 35.4The variance is under compensation of employees due to vacansies that could not be filled and goods and services mainly due to less travel and use of consultants than budgeted for.
ICT Enterprise Development
and Oversight 250 288 249 056 1 232 0.49Current payments 32 937 32 118 819 2.49Transfers and subsidies 216 085 216 085 - -Payment for capital assets 1 266 853 413 32.62
page 206

TELECOMMUNICATIONS AND POSTAL SERVICES – VOTE 32NOTES TO THE APPROPRIATION STATEMENT
for the year ended 31 March 2018
Final
Appropriation
Actual
Expenditure
Variance Variance as a %
of Final
AppropriationR’000 R’000 R’000 %
ICT Infrastructure Support 878 245 604 411 273 834 31.2
Current payments 312 353 38 933 273 420 87.5
Transfers and subsidies 565 306 565 306 - -
Payment for capital assets 586 172 414 70.6
The variance is mainly under goods and services:Consultants: business and advisory services amounting to R267 million which was not spent due to the delay in implementing the SA Connect programme (Broadband).
4.2 Per economic classification:
Final
Appropriation
Actual
Expenditure
Variance
Variance as
a %
of Final
Appropriation
R’000 R’000 R’000 %
Current expenditure
Compensation of employees 221 206 219 843 1 363 0.6
Goods and services 431 851 157 191 274 660 63.6
Transfers and subsidiesProvinces and municipalities 14 14 - -
Departmental agencies and accounts 295 181 295 181 - -
Public corporations and private enterprises 486 000 486 000 - -
Foreign govern and international organisations 25 966 25 964 2 -
Households 1 772 1 772 - -
Payments for capital assets Machinery and equipment 6 038 4 728 1 310 21.7
Software and other intangible assets 6 099 6 012 87 1.4
Payments for financial assets 3 700 250 3 700 250 - -
– The underspending in goods and services is mainly due to delays in implementing the SA Connect programme (Broadband) amounting to R267 million.
– The underspending in machinery and equipment is mainly due to less machinery replaced than anticipated.
page 207

TELECOMMUNICATIONS AND POSTAL SERVICES – VOTE 32
STATEMENT OF FINANCIAL PERFORMANCE
for the year ended 31 March 2018
2017/18 2016/17
Note R'000 R'000
REVENUE
Annual appropriation 1 5 174 377 2 417 412
Departmental revenue 2 1 141 106 831 411
TOTAL REVENUE 6 315 483 3 248 823
EXPENDITURE
Current expenditure
Compensation of employees 4 219 843 205 248
Goods and services 5 152 291 153 605
Interest and rent on land 6 - -
Total current expenditure 372 134 358 853
Transfers and subsidies
Transfers and subsidies 8 808 931 1 057 493
Total transfers and subsidies 808 931 1 057 493
Expenditure for capital assets
Tangible assets 9 4 728 5 098
Intangible assets 9 6 012 4 201
Total expenditure for capital assets 10 740 9 299
Payments for financial assets 7 3 700 250 650 047
TOTAL EXPENDITURE 4 892 055 2 075 692
SURPLUS/(DEFICIT) FOR THE YEAR 1 423 428 1 173 131
Reconciliation of Net Surplus/(Deficit) for the year
Voted Funds 282 322 341 720
Annual appropriation 17 282 322 341 720
Departmental revenue and NRF Receipts 18 1 141 106 831 411
SURPLUS/(DEFICIT) FOR THE YEAR 1 423 428 1 173 131
page 208

TELECOMMUNICATIONS AND POSTAL SERVICES – VOTE 32
STATEMENT OF FINANCIAL POSITION
for the year ended 31 March 2018
2017/18 2016/17
Note R'000 R'000
ASSETS
Current Assets 278 237 337 435
Unauthorised expenditure 10 4 741 4 741
Cash an cash equivalents 11 265 726 329 339
Prepayments and advances 13 7 273 3 132
Receivables 14 497 223
Non-Current Assets 8 649 485 4 125 435
Investments 15 7 291 241 2 767 241
Receivables 14 7 014 6 964
Loans 16 1 351 130 1 351 130
Other financial assets 12 100 100
TOTAL ASSETS 8 927 722 4 462 870
LIABILITIES
Current Liabilities 282 554 341 744
Voted funds to be surrendered to the Revenue Fund 17 282 322 341 720
Departmental revenue and NRF Receipts to be
surrendered to the Revenue Fund 18 16 4
Payables 19 216 20
TOTAL LIABILITIES 282 554 341 744
NET ASSETS 8 645 168 4 121 126
Represented by:
Capitalisation reserve 8 642 371 4 118 371
Recoverable revenue 2 797 2 755
TOTAL 8 645 168 4 121 126
page 209

TELECOMMUNICATIONS AND POSTAL SERVICES – VOTE 32
STATEMENT OF CHANGES IN NET ASSETS
for the year ended 31 March 2018
NET ASSETS 2017/18 2016/17
Note R'000 R'000
Capitalisation Reserves
Opening balance 4 118 371 2 767 241
Transfers:
Movement in Equity 4 524 000 -
Other movements - 1 351 130
Closing balance 8 642 371 4 118 371
Recoverable revenue
Opening balance 2 755 2 567
Transfers 42 188
Irrecoverable amounts written off 7.2 (177) (14)
Debts recovered (included in departmental receipts) (166) (307)
Debts raised 385 509
Closing balance 2 797 2 755
TOTAL 8 645 168 4 121 126
page 210

TELECOMMUNICATIONS AND POSTAL SERVICES – VOTE 32CASH FLOW STATEMENT
for the year ended 31 March 2018
2017/18 2016/17
Note R'000 R'000
CASH FLOWS FROM OPERATING ACTIVITIES
Receipts 5 468 167 2 418 010
Annual appropriated funds received 1.1 5 174 377 2 417 412
Departmental revenue received 2 391 334
Interest received 2.2 293 399 264
Net (increase)/ decrease in working capital (4 269) 275
Surrendered to Revenue Fund (1 482 814) (936 613)
Surrendered to RDP Fund/donor - -
Current payments (372 134) (358 853)
Interest paid 6 - -
Payments for financial assets (3 700 250) (650 047)
Transfers and subsidies paid (808 931) (1 057 493)
Net cash flow available from operating activities 20 (900 231) (584 721)
CASH FLOWS FROM INVESTING ACTIVITIES
Payments for capital assets 9 (10 740) (9 299)
Proceeds from sale of capital assets 713 -
(Increase)/decrease in loans - (1 351 130)
(Increase)/decrease in investments (4 524 000) -
(Increase)/decrease in other financial assets - -
Net cash flows from investing activities (4 534 027) (1 360 429)
CASH FLOWS FROM FINANCING ACTIVITIES
Distribution/dividend received 846 603 830 813
Increase/(decrease) in net assets 4 524 042 1 351 318
Net cash flows from financing activities 5 370 645 2 182 131
Net increase/(decrease) in cash and cash equivalents (63 613) 236 981
Cash and cash equivalents at beginning of period 329 339 92 358
Cash and cash equivalents at end of period 21 265 726 329 339
page 211

TELECOMMUNICATIONS AND POSTAL SERVICES – VOTE 32
NOTES TO THE ANNUAL FINANCIAL STATEMENTS
for the year ended 31 March 2018
1 Annual Appropriation
1.1 Annual Appropriation
Included are funds appropriated in terms of the Appropriation Act and the Adjustments Appropriation Act for
National Departments (Voted funds):
2017/18 2016/17
Final Appropria-
tion
Actual Funds
Received
Funds not requested/
not receivedFinal
Appropriation
Appropria-tion
Received
Programmes R'000 R'000 R'000 R'000 R'000
Administration 209 905 209 905 - 217 322 217 322
International Affairs and Trade 51 748 51 748 - 48 430 48 430
Policy Research and Capacity
Development 84 518 84 518 - 88 775 88 775
ICT Enterprise Development and
Oversight 3 950 288 3 950 288 - 886 608 886 608
ICT Infrastructure Support 877 918 877 918 - 1 176 277 1 176 277
Total 5 174 377 5 174 377 - 2 417 412 2 417 412
page 212

TELECOMMUNICATIONS AND POSTAL SERVICES – VOTE 32
NOTES TO THE ANNUAL FINANCIAL STATEMENTS
for the year ended 31 March 2018
2017/18 2016/17
Note R'000 R'000
2 Departmental RevenueSales of goods and services other than capital assets 2.1 57 51Interest dividends and rent on land 2.2 1 140 002 831 077Transactions in financial assets and liabilities 2.3 334 283Transfer received - -Sales of capital assets 2.4 713 -Total revenue collected 1 141 106 831 411
Departmental revenue collected 1 141 106 831 411
2.1 Sales of goods and services other than capital
assets2
Sales of goods and services produced by the
Department 57 51
Administrative fees 57 4
Other sales - 47
Total 57 51
2.2 Interest dividends and rent on land 2
Interest 293 399 264
Dividends 846 603 830 813
Total 1 140 002 831 077
The increase in interest is due to Interest earned by USAF from DTT funds invested with commercial banks that had to be paid over to National Treasury.
2017/18 2016/17
Note R'000 R'000
2.3 Transactions in financial assets and liabilities 2
Receivables - 251Other Receipts including Recoverable Revenue 334 32Total 334 283
2.4 Sale of Capital Assets 2
Tangible Assets
Building and other fixed structures - - Machinery and equipment 713 - Heritage asset - - Total 713 -
page 213

TELECOMMUNICATIONS AND POSTAL SERVICES – VOTE 32
NOTES TO THE ANNUAL FINANCIAL STATEMENTS
for the year ended 31 March 2018
3 Cash received not recognised (not included in note 2)
2017/18
Name of Entity
Opening balance
R’000
Amount paid to Revenue
Fund R’000
Balance R’000
None - - -
Total - - -
Cash received not recognised (not included in note 2)
2015/16
Name of Entity
Amount received
R’000
Amount paid to Revenue
Fund R’000
Balance R’000
None - - -
Total - - -
2017/18 2016/17
Note R'000 R'0004 Compensation of Employees
4.1 Salaries and wages
Basic salary 143 382 136 090Performance award 3 273 2 734Service Based 165 121Compensative/circumstantial 3 090 3 143Periodic payments - -Other non-pensionable allowances 46 081 40 319Total 195 991 182 407
4.2 Social Contributions
Employer contributionsPension 18 368 17 424Medical 5 461 5 395Bargaining Council 23 22Total 23 852 22 841Total compensation of employees 219 843 205 248
Average number of employees 296 300
The increase in compensation of employees is due to vacant positions filled and general salary adjustments
in the Public Service.
page 214

TELECOMMUNICATIONS AND POSTAL SERVICES – VOTE 32
NOTES TO THE ANNUAL FINANCIAL STATEMENTS
for the year ended 31 March 2018
2017/18 2016/17
Note R'000 R'000
5 Goods and services
Administrative fees 1 355 1 444
Advertising 2 120 3 315
Minor assets 5.1 336 113
Bursaries (employees) 1 291 816
Catering 1 771 1 793
Communication 5 245 5 717
Computer services 5.2 6 971 5 726
Consultants: Business and advisory services 25 445 8 873
Legal services 5 074 7 454
Contractors 4 101 2 804
Agency and support / outsourced services 3 24
Entertainment 50 23
Audit cost – external 5.3 6 962 6 499
Fleet services 1 159 1 193
Inventory 5.4 23 21
Consumables 5.5 5 004 6 505
Operating leases 34 434 41 837
Property payments 5.6 12 350 12 065
Rental and hiring 1 014 488
Travel and subsistence 5.7 30 862 31 546
Venues and facilities 3 109 4 483
Training and development 2 610 9 955
Other operating expenditure 5.8 1 002 911
Total 152 291 153 605
The increase in consultants: business advisory services is mainly due to a payment to the CSIR for the cyber security hub operation. The decrease in legal services is due to less litigation in the Department. The increase in contractors is due to increased repairs and maintenance. The decline in operating leases is due to renegotiated building rental agreement. Under training and development the decline is due to e-Skills training that was carried out by Nemisa on behalf of the Department.
5.1 Minor assets 5
Tangible assets 330 113Machinery and equipment 330 113Intangible assets - -
Software 6 -
Total 336 113
5.2 Computer services 5
SITA computer services 5 881 4 204External computer service providers 1 090 1 522
Total 6 971 5 726
page 215

TELECOMMUNICATIONS AND POSTAL SERVICES – VOTE 32
NOTES TO THE ANNUAL FINANCIAL STATEMENTS
for the year ended 31 March 2018
2017/18 2016/17
Note R'000 R'0005.3 Audit cost – external 5
Regularity audits 5 128 3 588Investigations 1 834 2 911Total 6 962 6 499
The decline under investigations is due to 2 of the 3 forensic investigations by the SIU within the Department that has been completed. Increase in regularity audits includes payment of the outstanding invoices for the previous financial year audit.
5.4 Inventory 5Clothing material and accessories 23 -Fuel oil and gas - -Materials and supplies - 21Other supplies - -Total 23 21
5.5 Consumables 5
Consumable supplies 179 225 Uniform and clothing 8 23 Household supplies 39 13
Building material and suppliers 7 - IT consumables 107 132Other consumables 18 57
Stationery printing and office supplies 4 825 6 280Total 5 004 6 505
5.6 Property payments 5
Municipal services 3 500 3 336Property management fees 11 18Property maintenance and repairs 884 -Other 7 955 8 711Total 12 350 12 065
The cleaning and security services for property are included under other.
5.7 Travel and subsistence 5Local 18 884 18 741Foreign 11 978 12 805Total 30 862 31 546
page 216

TELECOMMUNICATIONS AND POSTAL SERVICES – VOTE 32
NOTES TO THE ANNUAL FINANCIAL STATEMENTS
for the year ended 31 March 2018
2017/18 2016/17
Note R'000 R'000
5.8 Other operating expenditure 5
Professional bodies membership and subscription fees 137 90Resettlement costs 136 125Other (Includes printing and publication services) 729 696Total 1 002 911
6 Interest and Rent on Land
Interest paid - -Total - -
7 Payments for financial assets
Material losses through criminal conduct - - Theft 7.3 - -Extension of loans for policy purposes 3 700 000 650 000Other material losses written off 7.1 68 18Debts written off 7.2 177 22
Forex losses 7.4 5 7Total 3 700 250 650 047
The increase in payment for financial assets: Extension of loans for policy purposes is due to funds advanced to the South African Post Office (SAPO) for recapitalisation. SAPO in return issued a share to government worth R3 7 billion during the financial year under review.
7.1 Other material losses written off 7
Nature of losses
Income tax 18 -
No shows 11 -
Key replacement 6 -
Traffic fine 6 -
Damaged rented vehicles 27 18
Total 68 18
7.2 Debts written off 7
Nature of debts written off
Recoverable revenue written off
Supplier overpayments 151 -
Stolen Laptop 18 -
Bursary Debt -Employee 8 -
Ex-employee debts - 13
Non-employee - 1Total 177 14
page 217

TELECOMMUNICATIONS AND POSTAL SERVICES – VOTE 32
NOTES TO THE ANNUAL FINANCIAL STATEMENTS
for the year ended 31 March 2018
2017/18 2016/17
Note R'000 R'000
Other debts written off
Advances outstanding - -
Ex-employee debts - 8
Total - 8
Total debt written off 177 22
7.3 Forex losses 7
Nature of losses
Foreign exchange - travel and subsistence 5 7
Total 5 7
8 Transfers and Subsidies
Provinces and municipalities 37 14 17Departmental agencies and accounts ANNEX 1A 295 181 790 789Foreign governments and international organisations ANNEX 1C 25 964 26 136Public corporations and private enterprises ANNEX 1B 486 000 240 051Non-profit institutions ANNEX 1D - 25Households ANNEX 1E 1 772 475
Total 808 931 1 057 493
The decline under Departmental agencies is due to Broadcasting Digital Migration funds to USAF which were R509 million in the 2016/17 financial year and amount to R69 million in the current financial year. The increase of transfers and subsidies to public corporations of R246 million is due to R53 million allocated for the migration of signal and R193 million for dual illumination for the BDM project allocated to Sentech.
9 Expenditure for capital assets
Tangible assets 4 728 5 098Machinery and equipment 31 4 728 5 098
Intangible assets 6 012 4 201
Software 32 6 012 4 201Total 10 740 9 299
Tangible assets: in the current financial year less computer equipment purchased and vehicles to the value of R1 9 million were procured. Under intangible assets the Microsoft applications license was renewed with additional users.
page 218

TELECOMMUNICATIONS AND POSTAL SERVICES – VOTE 32
NOTES TO THE ANNUAL FINANCIAL STATEMENTS
for the year ended 31 March 2018
9.1 Analysis of funds utilised to acquire capital assets
- 2017/18
Voted Funds Aid assistance TOTAL
R'000 R'000 R'000Tangible assets 4 728 - 4 728Machinery and equipment 4 728 - 4 728Intangible assets 6 012 - 6 012Software 6 012 - 6 012Total 10 740 - 10 740
9.2 Analysis of funds utilised to acquire capital assets
- 2016/17
Voted Funds Aid assistance TOTAL
R'000 R'000 R'000Tangible assets 5 098 - 5 098Machinery and equipment 5 098 - 5 098Intangible assets 4 201 - 4 201Software 4 201 - 4 201Total 9 299 - 9 299
2017/18 2016/17
Note R'000 R'00010 Unauthorised Expenditure
10.1 Reconciliation of unauthorised expenditure
Opening balance 4 741 4 741Unauthorised expenditure - discovered in the
current year (as restated) - -
Closing balance 4 741 4 741
10.2 Analysis of unauthorised expenditure awaiting
authorisation per economic classification
Transfers and subsidies 4 741 4 741
Total 4 741 4 741
10.3 Analysis of unauthorised expenditure awaiting
authorisation per typeUnauthorised expenditure relating to overspending
of the vote or a main division within the vote 4 741 4 741
Total 4 741 4 741
page 219

TELECOMMUNICATIONS AND POSTAL SERVICES – VOTE 32
NOTES TO THE ANNUAL FINANCIAL STATEMENTS
for the year ended 31 March 2018
2017/18 2016/17
Note R'000 R'000
11 Cash and Cash Equivalents
Consolidated Paymaster General Account 265 382 329 193Cash on hand 35 35Investments (Domestic) 309 111
Total 265 726 329 339
The unspent funds are mainly due to delays in the implementation of the SA Connect programme (Broadband).
12 Other Financial Assets
Non-Current
Local
Deposit Municipality 100 100Total 100 100Security deposit Gaborone - -Total - -
Total Non-Current other financial assets 100 100
13 Prepayments and Advances
Travel and subsistence 191 204Advances paid 13.1 7 082 2 928
Total 7 273 3 132
13.1 Advances paid
National departments Annex 6 7 082 2 928
Total 7 082 2 928
The increase in prepayments is due to advance payment to BBI for SA connect project.
2017/18 2016/17
Current Non-current Total CurrentNon-
current Total
Note R’000 R’000 R’000 R’000 R’000 R’00014 Receivables
Claims recoverable
14.1
Annex 4 300 - 300 16 - 16Recoverable
expenditure 14.2 11 1 621 1 632 - 1 621 1 621Staff debt 14.3 186 133 319 191 29 220Other debtors 14.4 - 5 260 5 260 16 5 314 5 330
Total 497 7 014 7 511 223 6 964 7 187
page 220

TELECOMMUNICATIONS AND POSTAL SERVICES – VOTE 32
NOTES TO THE ANNUAL FINANCIAL STATEMENTS
for the year ended 31 March 2018
2017/18 2016/17
Note R'000 R'00014.1 Claims recoverable 14
National departments 300 16Total 300 16
Claims for various departments. See also annexure 4.
14.2 Recoverable expenditure (disallowance
accounts)
14
Disallowance payments - fraud 1 632 1 621
Total 1 632 1 621
Fraudulent orders and invoices to the amount of R1 649 120 and payment of R28 000 withheld.
14.3 Staff debt 14
Debt accounts 319 220
Total 319 220
Various employee debts.
14.4 Other debtors 14
Ex-employees 324 416Suppliers 4 822 4 903Clearing accounts (79) 11Non-employees 193 -
Total 5 260 5 330
14.5 Fruitless and wasteful expenditure 14
Opening balance - -Less amounts recovered 2 25Less amounts written off - -Transfers from note 28 Fruitless and Wasteful
expenditure (2) (25)
Total - -
14.6 Impairment of receivables
Estimate of impairment of receivables 6 983 6 794
Total 6 983 6 794
page 221

TELECOMMUNICATIONS AND POSTAL SERVICES – VOTE 32
NOTES TO THE ANNUAL FINANCIAL STATEMENTS
for the year ended 31 March 2018
2017/18 2016/17
Note R'000 R'00015 Investments
Non-Current
Shares and other equity
Telkom SA Limited 2 070 381 2 070 381South African Post Office Limited 5 217 116 693 116Sentech (Pty) (Ltd) 1 1Vodacom Group Limited 3 743 3 743
Total 7 291 241 2 767 241
Total non-current 7 291 241 2 767 241
Analysis of non-current investmentsOpening balance 2 767 241 2 767 241Disposals for cash - -Non-cash movements 4 524 000 -Closing balance 7 291 241 2 767 241
SAPO issued additional shares to Government worth R4 524 billion .
16 Loans
Public corporations 1 351 130 1 351 130Total 1 351 130 1 351 130
Analysis of BalanceOpening balance - -
Transferred 1 351 130 1 351 130Closing balance 1 351 130 1 351 130
The loan was transferred from Public Enterprises in terms of section 42 of the Public Finance Management Act and relates to BBI.
17 Voted Funds to be Surrendered to the Revenue Fund
Opening balance 341 720 105 156Transfer from statement of financial performance 282 322 341 720Add: Unauthorised expenditure for current year - -Paid during the year (341 720) (105 156)
Closing balance 282 322 341 720
page 222

TELECOMMUNICATIONS AND POSTAL SERVICES – VOTE 32
NOTES TO THE ANNUAL FINANCIAL STATEMENTS
for the year ended 31 March 2018
2017/18 2016/17
Note R'000 R'00018 Departmental revenue and NRF Receipts to be
surrendered to the Revenue FundOpening balance 4 50Transfer from Statement of Financial Performance 1 141 106 831 411Paid during the year (1 141 094) (831 457)Closing balance 16 4
19 Payables - current
Clearing accounts 19.1 1Other payables 19.2 216 19
Total 216 20
19.1 Clearing accounts 19
Salary deductions - 1Leave days to be utilised for departmental debt - -Travel and subsistence - -State guarantee - -
Total - 1
19.2 Other payables 19
Income tax due to SARS 197Supplier invoices - legal dispute 19 19
Total 216 19
20 Net cash flow available from operating activities
Net surplus/(deficit) as per Statement of Financial
Performance 1 423 428 1 173 131Add back non cash/cash movements not deemed
operating activities (2 323 659) (1 757 852)(Increase)/decrease in receivables – current (324) (154)(Increase)/decrease in prepayments and advances (4141) 593Increase/(decrease) in payables – current 196 (164)Proceeds from sale of assets (713) -Proceeds from sale of investments (846 603) (830 813)Expenditure on capital assets 10 740 9 299Surrenders to Revenue Fund (1 482 814) (936 613)Surrenders to RDP Fund/Donor - -Net cash flow generated by operating activities (900 231) (584 721)
page 223

TELECOMMUNICATIONS AND POSTAL SERVICES – VOTE 32
NOTES TO THE ANNUAL FINANCIAL STATEMENTS
for the year ended 31 March 2018
2017/18 2016/17
Note R'000 R'00021 Reconciliation of cash and cash equivalents for cash
flow purposesConsolidated Paymaster General account 265 382 329 193Cash on hand 35 35Cash with commercial banks (Local) 309 111Total 265 726 329 339
22 Contingent liabilities and contingent assets
22.1 Contingent liabilities
Liable to Nature
Housing loan guarantees Employees Annex 3A - 104
Other guarantees Annex 3A 511 452 4 077 867Claims against the
department Annex 3B 61 951 89 467Intergovernmental
payables (unconfirmed) Annex 5 162 43
Total 573 565 4 167 481
The decline under other guarantees is due to R3 7 billion paid by SAPO to banks to settle borrowed funds. The decline under claims against the Department is as a result of R30 million being moved to contingent assets.
22.2 Contingent assets
Nature of contingent asset
Counter claim submitted 36 077 5 743
Payment of legal costs - 1 000
SAPO TBVC States loan conversion - 650 000
Total 36 077 656 743
The amount of R650 million was allocated to SAPO during the 2016/17 financial year for recapitalization to implement its turnaround strategy. The payment was made as payment for financial assets and SAPO issued shares to government.
23 Commitments
Current expenditure 63 722 24 312
Approved and contracted 63 722 24 290
Approved but not yet contracted - -
Capital Expenditure 170 189
Approved and contracted 170 189
Total Commitments 63 892 24 479
The commitments are mainly for cleaning and security services, pest control and for BBI SA Connect project and are for more than a year.
page 224

TELECOMMUNICATIONS AND POSTAL SERVICES – VOTE 32
NOTES TO THE ANNUAL FINANCIAL STATEMENTS
for the year ended 31 March 2018
24 Accruals and payables not recognised
24.1 Accruals 30 days 30+ days
2017/18
R'000
Total
2016/17
R'000
Total
Listed by economic classification
Goods and services 44 51 95 103
Capital assets - - - -
Total 44 51 95 103
Listed by programme level
Administration 40 39
ICT International Affairs and Trade 32 7
Policy Research and Capacity Development 14 49
ICT Enterprise Development and Oversight 1 -
ICT Infrastructure Support 8 8
Total 95 103
24.2 Payables not recognised 30 days 30+ days
2017/18
R'000
Total
2016/17
R'000
Total
Listed by economic classification
Goods and services 3 382 2 138 5 520 4 794
Capital assets - - - 1 285
Total 3 382 2 138 5 520 6 079
Listed by programme level
Administration 3 865 4 519
ICT International Affairs and Trade 711 244
Policy Research and Capacity Development 654 993
ICT Enterprise Development and Oversight 104 104
ICT Infrastructure Support 186 219
Total 5 520 6 079
page 225

TELECOMMUNICATIONS AND POSTAL SERVICES – VOTE 32
NOTES TO THE ANNUAL FINANCIAL STATEMENTS
for the year ended 31 March 2018
2017/18 2016/17
Note R'000 R'000
25 Employee benefits
Leave entitlement 7 816 8 835
Service bonus (Thirteenth cheque) 4 502 4 311
Performance awards 3 273 2 734
Capped leave commitments 2 554 2 724
Long service awards 125 165
Total 18 270 18 769
Leave entitlement: The leave cycle is from January to December whilst the financial reporting period is from April to March 2018. Officials are entitled to leave as and when required and not as accrued. Others is Long service awards provisions.
26 Lease commitments
26.1 Operating leases expenditure
For the 2017/18 financial
year
Machinery and
equipment Total
R'000 R'000
Not later than 1 year 803 803Later than 1 year and not later than
5 years 605 605
Total lease commitments 1 408 1 408
For the 2016/17 financial year
Machinery and
equipment Total
R'000 R'000
Not later than 1 year 1 382 1 362Later than 1 year and not later than
5 years 792 792
Total lease commitments 2 174 2 174
Leases in respect of photocopy machines.
2017/18 2016/17
Note R'000 R'000
27 Irregular expenditure
27.1 Reconciliation of irregular expenditure
Opening balance 225 992 223 377
Prior period error - -
As restated 225 992 223 377
Add: Irregular expenditure - relating to prior year - -
Add: Irregular expenditure - relating to current year 228 2 615
Less: Amounts condoned - -
Irregular expenditure awaiting condonation 226 220 225 992
page 226

TELECOMMUNICATIONS AND POSTAL SERVICES – VOTE 32
NOTES TO THE ANNUAL FINANCIAL STATEMENTS
for the year ended 31 March 2018
2017/18 2016/17
Note R'000 R'000Analysis of awaiting condonation per age
classification
Current year 228 2 615
Prior years 225 992 223 377
Total 226 220 225 992
A complete irregular expenditure register exist with detail information with regard to the above.
27.2 Details of irregular expenditure - current year 2017/18
Incident
Disciplinary steps taken/
criminal proceedings
R'000
HR procedure not followed. In process 159Procurement procedures not
followed In process 9Procurement procedure not
followed In process 3Procurement procedure not
followed In process 57
Total 228
27.3 Details of irregular expenditure - under investigation current
year 2017/18Incident R'000
Procurement process still being investigated 3 017
3 017
2017/18 2016/17
28 Fruitless and wasteful expenditure Note R'000 R'000
28.1 Reconciliation of fruitless and wasteful
expenditureOpening balance 11 973 11 983Prior period error - -As restated 11 973 11 983Fruitless and wasteful expenditure – relating to
current year 15 16Less: Amounts resolved (15) (1)Less: Amounts transferred to receivables for
recovery 14.5 (2) (25)Closing balance 11 971 11 973
28.2 Analysis of awaiting resolution per economic classification
Current 11 971 11 973
Total 11 971 11 973
page 227

TELECOMMUNICATIONS AND POSTAL SERVICES – VOTE 32
NOTES TO THE ANNUAL FINANCIAL STATEMENTS
for the year ended 31 March 2018
28.3 Analysis of Current Year's Fruitless and wasteful expenditure
Incident
Disciplinary steps taken/
criminal proceedings Note
2017/18
R’000
Traffic fines In process 1
No Shows In process 14
Total 15
A complete fruitless and wasteful expenditure register exists with detailed information with regard to the above.
No. of Individuals
2017/18 R'000
2016/17 R'00029 Key management personnel
Political office bearers (provide detail below) 3 4 993 4 970
Officials:
Level 15 to 16 10 15 311 14 081
Level 14 6 8 103 7 349
Total 28 407 26 400
30 Impairment: other
Other - -
Total - -
31 Movable Tangible Capital Assets
MOVEMENT IN MOVABLE TANGIBLE CAPITAL ASSETS PER ASSET REGISTER FOR THE YEAR ENDED 31 MARCH
2018
Opening balance
Value adjustments Additions Disposals
Closing balance
R'000 R’000 R'000 R'000 R'000
MACHINERY AND EQUIPMENT 70 872 - 4 728 9 097 66 503
Transport assets 4 732 - 1 926 2 481 4 177
Computer equipment 33 114 - 2 234 5 656 29 692
Furniture and office equipment 13 442 (41) 319 206 13 514
Other machinery and
equipment 19 584 41 249 754 19 120
TOTAL MOVABLE TANGIBLE
CAPITAL ASSETS 70 872 - 4 728 9 097 66 503
page 228

TELECOMMUNICATIONS AND POSTAL SERVICES – VOTE 32
NOTES TO THE ANNUAL FINANCIAL STATEMENTS
for the year ended 31 March 2018
31.1 AdditionsADDITIONS TO MOVABLE TANGIBLE CAPITAL ASSETS PER ASSET REGISTER FOR THE YEAR ENDED 31 MARCH
2018
Cash Non-cash Total
R'000 R'000 R'000
MACHINERY AND EQUIPMENT 4 728 - 4 728
Transport assets 1 926 - 1 926
Computer equipment 2 234 - 2 234
Furniture and office equipment 319 - 319
Other machinery and equipment 249 - 249
TOTAL ADDITIONS TO MOVABLE
TANGIBLE CAPITAL ASSETS 4 728 - 4 728
31.2 DisposalsDISPOSALS OF MOVABLE TANGIBLE CAPITAL ASSETS PER ASSET REGISTER FOR THE YEAR ENDED 31 MARCH
2017
Sold for cash
Non-cash
disposals Total disposals
Cash
received
Actual
R’000 R'000 R'000 R'000
MACHINERY AND EQUIPMENT 4 702 4 395 9 097 713
Transport assets 2 481 - 2 481 641
Computer equipment 2 078 3 578 5 656 22
Furniture and office equipment 6 200 206 1
Other machinery and equipment 137 617 754 149
TOTAL DISPOSAL OF MOVABLE
TANGIBLE CAPITAL ASSETS 4 702 4 395 9 097 713
31.3 Movement for 2016/17
MOVEMENT IN MOVABLE TANGIBLE CAPITAL ASSETS PER ASSET REGISTER FOR THE YEAR ENDED 31 MARCH 2017Opening
balance
Prior period
error Additions Disposals
Closing
balance
R'000 R'000 R'000 R'000 R'000MACHINERY AND EQUIPMENT 70 857 5 098 5 083 70 872Transport assets 4 732 - - - 4 732Computer equipment 33 670 - 3 769 4 325 33 114Furniture and office equipment 12 920 - 967 454 13 442Other machinery and
equipment 19 535 - 353 304 19 584
TOTAL MOVABLE TANGIBLE
CAPITAL ASSETS 70 857 - 5 098 5 083 70 872
page 229

TELECOMMUNICATIONS AND POSTAL SERVICES – VOTE 32
NOTES TO THE ANNUAL FINANCIAL STATEMENTS
for the year ended 31 March 2018
31.4 Minor assets
MOVEMENT IN MINOR ASSETS PER THE ASSET REGISTER FOR THE YEAR ENDED 31 MARCH 2018
Intangible assets
Machinery and
equipment Total
R'000 R'000 R'000Opening balance 7 10 850 10 857Additions 6 134 140Disposals - 1 509 1509TOTAL MINOR ASSETS 13 9 475 9 488
Intangible assets
Machinery and
equipment TotalNumber of R1 minor assets - 133 133Number of minor assets at
cost 2 3 884 3 884TOTAL NUMBER MINOR ASSETS 2 4 017 4 019
MOVEMENT IN MINOR ASSETS PER THE ASSET REGISTER FOR THE YEAR ENDED 31 MARCH 2017
Intangible assets
Machinery and
equipment Total
R'000 R'000 R'000
Opening balance 7 11 385 11 392
Prior period error - - -
Additions - 72 72
Disposals - 607 607TOTAL MINOR ASSETS 7 10 850 10 857
Intangible
assets
Machinery
and
equipment Total
Number of R1 minor assets - 142 142Number of minor assets at
cost 3 4 371 4 574TOTAL NUMBER MINOR ASSETS 3 4 513 4 516
31.5 Movable assets written off
MOVABLE ASSETS WRITTEN OFF FOR THE YEAR ENDED 31 MARCH 2018
Intangible assets
Machinery and
equipment Total
R'000 R'000 R'000
Assets written off - 24 24TOTAL MOVABLE ASSETS WRITTEN OFF - 24 24
page 230

TELECOMMUNICATIONS AND POSTAL SERVICES – VOTE 32
NOTES TO THE ANNUAL FINANCIAL STATEMENTS
for the year ended 31 March 2018
MOVABLE ASSETS WRITTEN OFF FOR THE YEAR ENDED 31 MARCH 2017
Intangible assets
Machinery and
equipment Total
R'000 R'000 R'000
Assets written off - 79 79TOTAL MOVABLE ASSETS WRITTEN OFF - 79 79
32 Intangible Capital Assets
MOVEMENT IN INTANGIBLE CAPITAL ASSETS PER ASSET REGISTER FOR THE YEAR ENDED 31 MARCH 2018
Opening balance Additions Disposals
Closing balance
R'000 R'000 R'000 R'000
Software 6 722 6 012 4 933 7 801Patent Licences Copyright Brand names
Trademarks 369 - - 369TOTAL INTANGIBLE CAPITAL ASSETS 7 091 6 012 4 933 8 170
32.1 ADDITIONS TO INTANGIBLE CAPITAL ASSETS PER ASSET REGISTER FOR THE YEAR ENDED 31 MARCH 2018
Cash Non-cash Total
R'000 R'000 R'000Software 6 012 - 6 012TOTAL ADDITIONS TO INTANGIBLE CAPITAL ASSETS 6 012 - 6 012
32.2 Disposals
DISPOSALS OF INTANGIBLE CAPITAL ASSETS PER ASSET REGISTER FOR THE YEAR ENDED 31 MARCH 2018
Non-cash disposal
Total disposals
Cash received Actual
R'000 R'000 R'000
Software 4 933 4 933 -TOTAL DISPOSAL OF INTANGIBLE CAPITAL ASSETS 4 933 4 933 -
32.3 Movement for 2016\17
MOVEMENT IN INTANGIBLE CAPITAL ASSETS PER ASSET REGISTER FOR THE YEAR ENDED 31 MARCH 2017
Opening balance Additions Disposals
Closing balance
R'000 R'000 R'000 R'000Software 2 807 4 201 286 6 722Patents licences copyright brand names
trademarks 369 - - 369TOTAL INTANGIBLE CAPITAL ASSETS 3 176 4 201 286 7 091
page 231

TELECOMMUNICATIONS AND POSTAL SERVICES – VOTE 32
NOTES TO THE ANNUAL FINANCIAL STATEMENTS
for the year ended 31 March 2018
33 Immovable Tangible Capital AssetsMOVEMENT IN IMMOVABLE TANGIBLE CAPITAL ASSETS PER ASSET REGISTER FOR THE YEAR ENDED 31 MARCH
2018
Opening balance Additions Disposals
Closing balance
R'000 R'000 R'000 R'000
BUILDINGS AND OTHER FIXED STRUCTURES 18 - - 18
Non-residential buildings 18 - - 18
TOTAL IMMOVABLE TANGIBLE CAPITAL ASSETS 18 - - 18
33.1 Movement for 2016/17 MOVEMENT IN IMMOVABLE TANGIBLE CAPITAL ASSETS PER ASSET REGISTER FOR THE YEAR ENDED 31 MARCH
2017
Opening balance
Prior period error Additions Disposals
Closing balance
R'000 R'000 R'000 R'000 R'000BUILDINGS AND OTHER FIXED
STRUCTURES 18 - - - 18Non-residential buildings 18 - - - 18
TOTAL IMMOVABLE TANGIBLE
CAPITAL ASSETS 18 - - - 18
page 232

TELECOMMUNICATIONS AND POSTAL SERVICES – VOTE 32
NOTES TO THE ANNUAL FINANCIAL STATEMENTS
for the year ended 31 March 2018
34 Related party relationships
34.1 Investment entities: Telkom SA Limited; South African Post Office Limited; Vodacom Group Limited; Broadband
Infraco; SITA and SENTECH.
34.2 Other: Universal Service and Access Agency of South Africa; Universal Service and Access Fund; National
Electronic Media Institute of South Africa; .ZA Domain Name Authority and DPW.
2017/18
R'000
35 Non-adjusting events after the reporting date
In the 2018/19 Financial year there is a likehood that the Department will be part of a
proclamation for reorganisation of state and will need to comply with section 42 of the
PFMA.
page 233
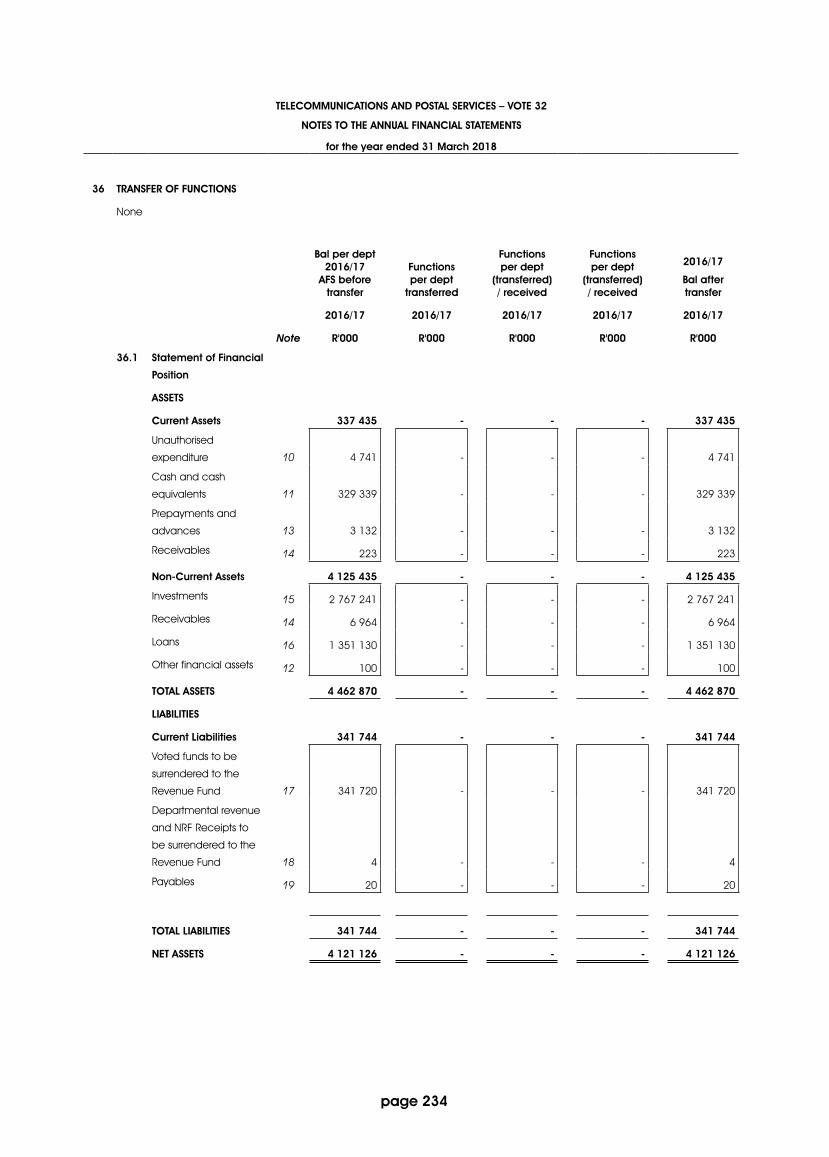
TELECOMMUNICATIONS AND POSTAL SERVICES – VOTE 32
NOTES TO THE ANNUAL FINANCIAL STATEMENTS
for the year ended 31 March 2018
36 TRANSFER OF FUNCTIONS
None
Bal per dept 2016/17
AFS before transfer
Functions per dept
transferred
Functions per dept
(transferred) / received
Functions per dept
(transferred) / received
2016/17
Bal after transfer
2016/17 2016/17 2016/17 2016/17 2016/17
Note R'000 R'000 R'000 R'000 R'000
36.1 Statement of Financial
Position
ASSETS
Current Assets 337 435 - - - 337 435
Unauthorised
expenditure 10 4 741 - - - 4 741
Cash and cash
equivalents 11 329 339 - - - 329 339
Prepayments and
advances 13 3 132 - - - 3 132
Receivables 14 223 - - - 223
Non-Current Assets 4 125 435 - - - 4 125 435
Investments 15 2 767 241 - - - 2 767 241
Receivables 14 6 964 - - - 6 964
Loans 16 1 351 130 - - - 1 351 130
Other financial assets 12 100 - - - 100
TOTAL ASSETS 4 462 870 - - - 4 462 870
LIABILITIES
Current Liabilities 341 744 - - - 341 744
Voted funds to be
surrendered to the
Revenue Fund 17 341 720 - - - 341 720
Departmental revenue
and NRF Receipts to
be surrendered to the
Revenue Fund 18 4 - - - 4
Payables 19 20 - - - 20
TOTAL LIABILITIES 341 744 - - - 341 744
NET ASSETS 4 121 126 - - - 4 121 126
page 234

page 235
TELECOMMUNICATIONS AND POSTAL SERVICES – VOTE 32
NOTES TO THE ANNUAL FINANCIAL STATEMENTS
for the year ended 31 March 2018
Bal per dept 2016/17
AFS before transfer
Functions per dept
transferred
Functions per dept
(transferred) / received
Functions per dept
(transferred) / received
2016/17 Bal after transfer
2016/17 2016/17 2016/17 2016/17 2016/17
Note R'000 R'000 R'000 R'000 R'000
36.2 Disclosure Notes
Contingent liabilities 22.1 4 450 500 - - - 4 450 500
Contingent assets 22.2 6 743 - - - 6 743
Commitments 23 24 479 - - - 24 479
Accruals 24 103 - - - 103
Payables not
recognised 24 6 079 6 079
Employee benefits 25 18 779 - - - 18 779
Lease commitments -
operating lease 26 2 174 - - - 2 174
Irregular expenditure 27 225 984 - - - 225 984
Fruitless and wasteful
expenditure 28 11 973 - - - 11 973
Impairment 14.6 6 794 - - - 6 794
Movable tangible
capital assets 31 70 872 - - - 70 872
Immovable tangible
capital assets 33 18 - - - 18
Intangible capital
assets 32 7 091 - - - 7 091

TELE
CO
MM
UNIC
ATIO
NS
AND
PO
STAL
SER
VIC
ES –
VO
TE 3
2
NO
TES
TO T
HE A
NN
UAL
FIN
ANC
IAL
STAT
EMEN
TS
for t
he y
ear e
nded
31
Mar
ch 2
018
37. S
TATE
MEN
T O
F C
ON
DIT
ION
AL G
RAN
TS A
ND
OTH
ER T
RAN
SFER
S TO
MUN
ICIP
ALIT
IES
NAM
E O
F M
UNIC
IPAL
ITY
GRA
NT
ALLO
CAT
ION
TRAN
SFER
Div
ision
of
Reve
nue
Act
Roll
Ove
rsAd
just
men
tsTo
tal
Avai
labl
eAc
tual
Tra
nsfe
rFu
nds
With
held
Re-a
lloca
tions
by
Nat
iona
l Tre
asur
y or
N
atio
nal D
epar
tmen
t
R'00
0R'
000
R'00
0R'
000
R'00
0R'
000
R'00
0
*City
of T
shw
ane
--
--
13-
-
*Cap
e To
wn
--
--
1-
-
Tota
l-
--
-14
--
*Veh
icle
licen
ce fe
es f
ines
and
pen
altie
s.
page 236

TELE
CO
MM
UNIC
ATIO
NS
AND
PO
STAL
SER
VIC
ES –
VO
TE 3
2
ANN
EXUR
ES T
O T
HE A
NN
UAL
FIN
ANC
IAL
STAT
EMEN
TS
for t
he y
ear e
nded
31
Mar
ch 2
018
ANN
EXUR
E 1A
STAT
EMEN
T O
F TR
ANSF
ERS
TO D
EPAR
TMEN
TAL
AGEN
CIE
S AN
D A
CC
OUN
TS
DEP
ARTM
ENT/
AGEN
CY/
ACC
OUN
T
TRAN
SFER
ALL
OC
ATIO
NTR
ANSF
ER20
16/1
7
Adju
sted
a
pp
rop
ria-
tion
Roll
Ove
rsAd
just
men
tsTo
tal
Ava
ilab
leAc
tua
l Tr
ans
fer
% o
f Av
aila
ble
fu
nds
trans
ferre
d
App
rop
ria-
tion
Act
R'00
0R'
000
R'00
0R'
000
R'00
0%
R'00
0
Uni
vers
al S
ervi
ce a
nd A
cces
s Ag
ency
of S
outh
Afri
ca:
Ope
ratio
ns
75 6
84-
-75
684
75 6
8410
0%69
045
Uni
vers
al S
ervi
ce a
nd A
cces
s Fu
nd: O
pera
tions
54
614
--
54 6
1454
614
100%
55 1
56
Uni
vers
al S
ervi
ce a
nd A
cces
s Fu
nd: B
DM
pro
ject
man
agem
ent
79 0
98-
-79
098
79 0
9810
0%58
9 38
4
Nat
iona
l Ele
ctro
nic
Med
ia In
stitu
te o
f SA:
Ope
ratio
ns
43 7
85-
-43
785
43 7
8510
0%77
200
Nat
iona
l Ele
ctro
nic
Med
ia In
stitu
te o
f SA:
INES
I 42
000
--
42 0
0042
000
100%
-
ISET
T SE
TA (S
kills
deve
lopm
ent l
evy)
-
--
--
-
SAB
C -
TV L
icen
ses
--
--
-4
Tota
l29
5 18
1-
-29
5 18
129
5 18
179
0 78
9
page 237

TELE
CO
MM
UNIC
ATIO
NS
AN
D P
OST
AL
SERV
ICES
– V
OTE
32
AN
NEX
URES
TO
TH
E A
NN
UAL
FIN
AN
CIA
L ST
ATEM
ENTS
for t
he y
ea
r end
ed
31
Ma
rch
2018
AN
NEX
URE
1BST
ATEM
ENT
OF
TRA
NSF
ERS/
SUBS
IDIE
S TO
PUB
LIC
CO
RPO
RATI
ON
S A
ND
PRI
VATE
EN
TERP
RISE
S
NAM
E O
F PU
BLIC
CO
RPO
RATI
ON
/PR
IVAT
E EN
TERP
RISE
TRAN
SFER
ALL
OC
ATIO
NEX
PEN
DIT
URE
2016
/17
Adju
sted
a
pp
rop
ria-
tion
Act
Roll
Ove
rsAd
just
men
tsTo
tal
Ava
ilab
leAc
tua
l Tr
ans
fer
% o
f Av
aila
ble
fu
nds
trans
ferre
dC
ap
ital
Cur
rent
App
rop
ria-
tion
Act
R'0
00
R'0
00
R'0
00
R'0
00
R'0
00
% R
'000
R
'000
R
'000
Pu
blic
cor
por
atio
ns T
rans
fers
24
6 00
0-
-24
6 00
024
6 00
010
0.0%
246
000
--
Sen
tech
: Dig
itisa
tion
mig
ratio
n-
Cap
ital
53 0
00-
-53
000
53 0
0010
0.0%
53 0
00-
- S
ente
ch: D
ual I
llum
inat
ion
Cap
ital
193
000
--
193
000
193
000
100.
0%19
3 00
0-
-
Sub
sid
ies
240
000
--
240
000
240
000
100.
0%-
240
000
240
000
SA
P ost
Offi
ce L
td
240
000
--
240
000
240
000
100.
0%-
240
000
240
000
Sub
-tot
al:
Pub
lic c
orp
ora
tions
48
6 00
0-
-48
6 00
048
6 00
010
0.0%
246
000
240
000
240
000
Priv
ate
ent
erp
rises
T
rans
fers
-
--
--
--
51 C
laim
s ag
ains
t the
sta
te -
vario
us
--
--
--
-51
Sub
sid
ies
--
--
--
--
Sub
-tot
al:
Priv
ate
ent
erp
rises
-
--
--
--
51
TO
TAL
486
000
--
486
000
486
000
100.
0%24
6 00
024
0 00
024
0 05
1
page 238

TELE
CO
MM
UNIC
ATIO
NS
AN
D P
OST
AL
SERV
ICES
– V
OTE
32
AN
NEX
URES
TO
TH
E A
NN
UAL
FIN
AN
CIA
L ST
ATEM
ENTS
for t
he y
ea
r end
ed
31
Ma
rch
2018
AN
NEX
URE
1C
STAT
EMEN
T O
F TR
AN
SFER
S TO
FO
REIG
N G
OVE
RNM
ENT
AN
D IN
TERN
ATIO
NA
L O
RGA
NIS
ATIO
NS
FORE
IGN
GO
VERN
MEN
TS /
INTE
RNAT
ION
AL
ORG
AN
ISAT
ION
S
TRA
NSF
ER A
LLO
CAT
ION
EXPE
ND
ITUR
E20
16/1
7
Ad
just
ed
a
pp
rop
riatio
n A
ct
Roll
Ove
rsA
dju
stm
ent
sTo
tal
Ava
ilab
leA
ctu
al
Tra
nsfe
r
% o
f A
vaila
ble
fu
nds
tra
nsfe
rre
dA
pp
rop
riatio
n A
ct
R'00
0R'
000
R'00
0R'
000
R'00
0%
R'00
0
Tra
nsfe
rs
*Af
rica
n Te
lec
om
mun
ica
tions
Uni
on
(ATU
) 1
091
-(8
5)1
006
1 00
610
0%1
044
*Un
ive
rsa
l Po
sta
l Uni
on
(UPU
) 5
228
-29
45
522
5 52
210
0%5
960
*Pa
n Af
rica
n Po
sta
l Uni
on
(PAP
U)
1 00
3-
281
031
1 03
110
0%1
033
*In
tern
atio
nal T
ele
co
mm
unic
atio
ns U
nio
n (IT
U)
16 3
12-
504
16 8
1616
816
100%
17 5
81
* C
om
mo
nwe
alth
Te
lec
om
mun
ica
tion
Org
ani
satio
n (C
TO)
416
-11
427
426
100%
352
Org
ani
satio
n fo
r Ec
ono
mic
Co
op
era
tion
and
D
eve
lop
me
nt
482
-(3
23)
159
158
99%
166
DO
NA
Foun
da
tion
1 00
0-
51
005
1 00
510
0%-
Tota
l25
532
-43
425
966
25 9
6426
136
* Na
tiona
l Tre
asu
ry a
pp
rova
l ob
tain
ed
to in
cre
ase
tra
nsfe
r pa
yme
nts
to in
tern
atio
nal o
rga
nisa
tions
in te
rms
of s
ec
tion
43(1
) of t
he P
ublic
Fin
anc
e
Ma
nag
em
ent
Ac
t and
6.3
.1(a
) of t
he T
rea
sury
Re
gul
atio
ns.
page 239

TELE
CO
MM
UNIC
ATIO
NS
AN
D P
OST
AL
SERV
ICES
– V
OTE
32
AN
NEX
URES
TO
TH
E A
NN
UAL
FIN
AN
CIA
L ST
ATEM
ENTS
for t
he y
ea
r end
ed
31
Ma
rch
2018
AN
NEX
URE
1D
STAT
EMEN
T O
F TR
AN
SFER
S TO
NO
N-P
ROFI
T IN
STIT
UTIO
NS
NO
N-P
ROFI
T IN
STIT
UTIO
NS
TRA
NSF
ER A
LLO
CAT
ION
EXPE
ND
ITUR
E20
16/1
7
Ad
just
ed
a
pp
rop
riatio
n A
ct
Roll
Ove
rsA
dju
stm
ent
sTo
tal
Ava
ilab
leA
ctu
al
Tra
nsfe
r
% o
f Ava
ilab
le
fund
s tr
ans
ferr
ed
Ap
pro
pria
tion
Ac
t
R'00
0R'
000
R'00
0R'
000
R'00
0%
R'00
0
Tra
nsfe
rs
Univ
ers
al P
ost
al U
nio
n-
--
--
25
Tota
l-
--
--
25
page 240

TELE
CO
MM
UNIC
ATIO
NS
AN
D P
OST
AL
SERV
ICES
– V
OTE
32
AN
NEX
URES
TO
TH
E A
NN
UAL
FIN
AN
CIA
L ST
ATEM
ENTS
for t
he y
ea
r end
ed
31
Ma
rch
2018
AN
NEX
URE
1E
STAT
EMEN
T O
F TR
AN
SFER
S TO
HO
USEH
OLD
S
HO
USEH
OLD
S
TRA
NSF
ER A
LLO
CAT
ION
EXPE
ND
ITUR
E20
16/1
7
Ad
just
ed
a
pp
rop
riatio
n A
ct
Roll
Ove
rsA
dju
stm
ent
sTo
tal A
vaila
ble
Ac
tua
l Tra
nsfe
r
% o
f Ava
ilab
le
fund
s tr
ans
ferr
ed
Ap
pro
pria
tion
Ac
t
R'00
0R'
000
R'00
0R'
000
R'00
0%
R'00
0
Tra
nsfe
rs
H/H
EM
PL S
/BEN
:LEA
VE G
RATU
ITY
--
--
1 24
031
7
H/H
:PM
T/RE
FUN
D&
REM
-AC
T/G
RCE
--
--
4236
H/H
: CLA
IMS
AGAI
NST
TH
E ST
ATE
(CA
SH)
--
--
447
-
* H
/H: D
ON
ATIO
NS
GIF
TS A
ND
SP
ON
SORS
HIP
S-
--
-43
122
Tota
l-
--
-1
772
475
page 241

TELE
CO
MM
UNIC
ATIO
NS
AN
D P
OST
AL
SERV
ICES
– V
OTE
32
AN
NEX
URES
TO
TH
E A
NN
UAL
FIN
AN
CIA
L ST
ATEM
ENTS
for t
he y
ea
r end
ed
31
Ma
rch
2018
AN
NEX
URE
1FST
ATEM
ENT
OF
GIF
TS D
ON
ATIO
NS
AN
D S
PON
SORS
HIP
S RE
CEI
VED
NA
ME
OF
ORG
AN
ISAT
ION
NAT
URE
OF
GIF
T D
ON
ATIO
N O
R SP
ON
SORS
HIP
2017
/18
2016
/17
R'00
0R'
000
Rec
eiv
ed
in c
ash
No
ne
Sub
tota
l-
-
Rec
eiv
ed
in k
ind
2016
/17
Fina
ncia
l ye
ar
.za
DN
AM
ain
sp
ons
or f
or c
onf
ere
nce
pa
cka
ge
dur
ing
the
Ho
stin
g o
f the
5th
Afri
ca
n In
tern
et
Go
vern
anc
e F
oru
m 1
6-18
Oc
tob
er 2
016
- R7
35 2
11.0
2-
735
Bro
ad
ba
nd In
frac
oH
ost
ing
of t
he 5
th A
fric
an
Inte
rne
t Go
vern
anc
e F
oru
m 1
6-18
Oc
tob
er 2
016
- sp
ons
ore
d 3
00 b
ag
s-
-H
UAW
EI T
ec
hno
log
ies
SAH
ost
ing
of t
he 5
th A
fric
an
Inte
rne
t Go
vern
anc
e F
oru
m 1
6-18
Oc
tob
er 2
016
- N
etw
ork
ing
Co
ckt
ail
din
ner -
R21
1 90
3.00
-21
1H
UAW
EI T
ec
hno
log
ies
SAH
ost
ing
of t
he 5
th A
fric
an
Inte
rne
t Go
vern
anc
e F
oru
m 1
6-18
Oc
tob
er 2
016
- W
iFi 3
G
Rout
er &
Po
we
r Ba
nks
= R
112
582.
98-
112
GO
OG
LE S
AH
ost
ing
of t
he 5
th A
fric
an
Inte
rne
t Go
vern
anc
e F
oru
m 1
6-18
Oc
tob
er 2
016
- sp
ons
ore
d E
qui
pm
ent
for I
nte
rne
t Ca
fé =
R30
0 51
5.58
-30
0ZA
CR
Ho
stin
g o
f the
5th
Afri
ca
n In
tern
et G
ove
rna
nce
Fo
rum
16-
18 O
cto
be
r 201
6 -
spo
nso
red
De
leg
ate
tra
nsp
orta
tion
= R
165
000.
00-
165
eTh
ekw
ini M
unic
ipa
lity
Ho
stin
g o
f the
5th
Afri
ca
n In
tern
et G
ove
rna
nce
Fo
rum
16-
18 O
cto
be
r 201
6 -
spo
nso
red
Op
eni
ng /G
ala
Din
ner =
R50
0 00
0.00
-50
0
page 242

TELE
CO
MM
UNIC
ATIO
NS
AN
D P
OST
AL
SERV
ICES
– V
OTE
32
AN
NEX
URES
TO
TH
E A
NN
UAL
FIN
AN
CIA
L ST
ATEM
ENTS
for t
he y
ea
r end
ed
31
Ma
rch
2018
AN
NEX
URE
1FST
ATEM
ENT
OF
GIF
TS D
ON
ATIO
NS
AN
D S
PON
SORS
HIP
S RE
CEI
VED
NA
ME
OF
ORG
AN
ISAT
ION
NAT
URE
OF
GIF
T D
ON
ATIO
N O
R SP
ON
SORS
HIP
2017
/18
2016
/17
R'00
0R'
000
ZAC
R &
.za
DN
AH
ost
ing
of t
he 5
th A
fric
an
Inte
rne
t Go
vern
anc
e F
oru
m 1
6-18
Oc
tob
er 2
016
- sp
ons
ore
d C
losin
g D
inne
r = R
100
000
00-
100
Inno
vatio
n Af
rica
Min
iste
rial S
umm
it 20
16 -
Afri
ca
Bra
ins
An o
ffic
ial w
as
spo
nso
red
for e
co
nom
y fli
ght
tic
ket (
$1 1
08/R
14 7
36.4
0) &
ho
tel
ac
co
mm
od
atio
n in
Na
irob
i ($1
040
/R13
832
) at t
his
me
etin
g-
29In
tern
atio
nal C
ent
re fo
r Tra
de
and
Su
sta
ina
ble
De
velo
pm
ent
e-C
om
me
rce
Co
nfe
renc
e in
Ca
pe
To
wn
est
. Va
lue
d R
5 50
0.00
(flig
hts
and
a
cc
om
mo
da
tion)
22-
23 M
arc
h 20
17-
5Th
e In
tern
et S
oc
iety
Inte
rne
t Eng
ine
erin
g T
ask
Fo
rce
Me
etin
g 2
6 to
31
Ma
rch
2017
Chi
ca
go
Illin
ois
- 3
offi
cia
ls -
spo
nso
rshi
p o
f ec
ono
my
cla
ss fl
ight
tic
ket
hote
l ac
co
mm
od
atio
n a
nd a
pe
r d
iem
of $
300
($75
pe
r da
y)
--
Afric
an
Unio
n C
om
miss
ion
(AUC
)M
ain
sp
ons
or f
or a
full
da
y c
onf
ere
nce
pa
cka
ge
dur
ing
the
ho
stin
g o
f the
AU-
SAD
C
Valid
atio
n W
ork
sho
p 2
3-24
Ma
rch
2017
= R
22 5
00.0
0-
23Br
oa
db
and
Infra
co
Ho
stin
g o
f the
AU-
SAD
C V
alid
atio
n W
ork
sho
p 2
3-24
Ma
rch
2017
sp
ons
ore
d 5
0 b
ag
s
in k
ind
--
ICA
SAH
ost
ing
of t
he A
U-SA
DC
Va
lida
tion
Wo
rksh
op
23-
24 M
arc
h 20
17 -
40
gift
ba
gs
with
IC
ASA
pro
mo
tiona
l ite
ms
spo
nso
red
kin
d v
alu
ed
at R
4500
.00
-5
2017
/18
Fina
ncia
l ye
ar
ICA
SAH
ost
ing
of t
he S
ADC
SC
OM
me
etin
g 1
9-22
Jun
e 2
017
- 20
gift
ba
gs
20
co
nfe
renc
e
dia
ries
and
20
me
mo
ry s
ticks
as
ICA
SA p
rom
otio
nal i
tem
s-
Hua
we
i
Spo
nso
red
tra
inin
g S
em
ina
r by
Hua
we
i: C
ons
truc
tion
and
de
velo
pm
ent
of s
ubm
arin
e
op
tica
l ca
ble
for A
sian
and
“M
arit
ime
Silk
roa
d”
co
untri
es
20
June
– 1
0 Ju
ly C
hina
(H
uaw
ei c
ove
red
the
co
st o
f flig
hts
ac
co
mm
od
atio
n a
nd d
aily
allo
wa
nce
of ¥
87
p
er d
ay)
-
Hua
we
i
Spo
nso
red
tra
inin
g S
em
ina
r by
Hua
we
i: S
em
ina
r on
Safe
City
De
velo
pm
ent
for
Afric
an
Eng
lish
spe
akin
g C
oun
trie
s 7
– 2
7 Ju
ne C
hina
(Hua
we
i co
vere
d th
e c
ost
of
flig
hts
ac
co
mm
od
atio
n a
nd d
aily
allo
wa
nce
of ¥
87
pe
r da
y)-
page 243
(co
ntin
ued
)

TELE
CO
MM
UNIC
ATIO
NS
AN
D P
OST
AL
SERV
ICES
– V
OTE
32
AN
NEX
URES
TO
TH
E A
NN
UAL
FIN
AN
CIA
L ST
ATEM
ENTS
for t
he y
ea
r end
ed
31
Ma
rch
2018
AN
NEX
URE
1FST
ATEM
ENT
OF
GIF
TS D
ON
ATIO
NS
AN
D S
PON
SORS
HIP
S RE
CEI
VED
NA
ME
OF
ORG
AN
ISAT
ION
NAT
URE
OF
GIF
T D
ON
ATIO
N O
R SP
ON
SORS
HIP
2017
/18
2016
/17
R'00
0R'
000
Vod
ac
om
Spo
nso
red
Min
iste
rial R
oun
dta
ble
wo
rkin
g d
inne
r on
5 Se
pte
mb
er 2
017
250
Chi
na T
ele
co
m G
lob
al
Spo
nso
red
tra
inin
g S
em
ina
r by
Chi
na T
ele
co
m G
lob
al:
De
velo
pm
ent
of I
nfo
rma
tion
and
Te
lec
om
mun
ica
tion
Tec
hno
log
y fo
r De
velo
pin
g C
oun
trie
s 1
0 Ju
ly -
8 A
ugus
t 20
17 (C
hina
Te
lec
om
co
vere
d th
e c
ost
of f
light
s a
cc
om
mo
da
tion
and
da
ily
allo
wa
nce
of ¥
80
pe
r da
y)-
Sub
tota
l25
02
185
TOTA
L25
02
185
page 244
(co
ntin
ued
)

page 245
TELE
CO
MM
UNIC
ATIO
NS
AND
PO
STAL
SER
VIC
ES –
VO
TE 3
2
ANN
EXUR
ES T
O T
HE A
NN
UAL
FIN
ANC
IAL
STAT
EMEN
TS
for t
he y
ear e
nded
31
Mar
ch 2
018
ANN
EXUR
E 1G
STAT
EMEN
T O
F G
IFTS
DO
NAT
ION
S AN
D S
PON
SORS
HIPS
MAD
E
NAT
URE
OF
GIF
T D
ON
ATIO
N O
R SP
ON
SORS
HIP
2017
/18
2016
/17
R'00
0R'
000
Mad
e in
kin
d
Dur
ing
the
2016
/17
finan
cial
yea
r:
Non
e-
-
Dur
ing
the
2017
/18
finan
cial
yea
r:
Non
e-
-

page 246
TELE
CO
MM
UNIC
ATIO
NS
AND
PO
STAL
SER
VIC
ES –
VO
TE 3
2
ANN
EXUR
ES T
O T
HE A
NN
UAL
FIN
ANC
IAL
STAT
EMEN
TSfo
r the
yea
r end
ed 3
1 M
arch
201
8
ANN
EXUR
E 2A
STAT
EMEN
T O
F IN
VEST
MEN
TS IN
AN
D A
MO
UNTS
OW
ING
BY/
TO N
ATIO
NAL
/PRO
VIN
CIA
L PU
BLIC
EN
TITE
S
Nam
e of
pub
lic e
ntity
Stat
e En
tity’
s PF
MA
Sche
dule
ty
pe (s
tate
ye
ar e
nd
if no
t 31
Mar
ch)
% o
f sha
res
held
Num
ber o
f sha
res
held
Cos
t of i
nves
tmen
t R'0
00N
et A
sset
Val
ue
of in
vest
men
t
R'
000
Prof
it/(L
oss)
for t
he y
ear
R'00
0Lo
sses
gu
aran
teed
2017
/18
2016
/17
201
7/18
2
016/
17
201
7/18
2
016/
17
201
7/18
2
016/
17
201
7/18
2
016/
17
Yes/
No
Nat
iona
l/Pro
vinc
ial
Publ
ic E
ntity
Unive
rsal S
ervic
e an
d Ac
cess
Age
ncy
of
Sout
h Af
rica
3A10
0%10
0%-
--
--
-(8
4 16
0)(6
7 27
9)N
o
Unive
rsal S
ervic
e an
d Ac
cess
Fun
d3A
100%
100%
--
--
--
(206
802
)65
6 94
7N
o
¹Tel
kom
SA
Limite
d2
39%
39%
207
038
058
207
038
058
-2
070
381
--
3 15
8 00
03
854
000
No
²Sou
th A
frica
n Po
st O
ffice
Ltd
210
0%10
0%69
3 11
5 88
269
3 11
5 87
95
217
116
693
116
5 21
7 11
669
3 11
6(9
16 9
83)
(986
852
)N
o
Nat
iona
l Ele
ctro
nic
Med
ia In
stitu
te o
f So
uth
Afric
a3A
100%
100%
--
--
--
(5 0
06)
(1 5
38)
No
³Sen
tech
(Pty
) Ltd
3B10
0%10
0%2
000
2 00
075
892
75 8
921
920
014
1 76
7 47
215
2 79
210
4 15
3N
o

page 247
TELE
CO
MM
UNIC
ATIO
NS
AND
PO
STAL
SER
VIC
ES –
VO
TE 3
2
ANN
EXUR
ES T
O T
HE A
NN
UAL
FIN
ANC
IAL
STAT
EMEN
TSfo
r the
yea
r end
ed 3
1 M
arch
201
8
ANN
EXUR
E 2A
STAT
EMEN
T O
F IN
VEST
MEN
TS IN
AN
D A
MO
UNTS
OW
ING
BY/
TO N
ATIO
NAL
/PRO
VIN
CIA
L PU
BLIC
EN
TITE
S (c
ontin
ued)
Nam
e of
pub
lic e
ntity
Stat
e En
tity’
s PF
MA
Sche
dule
ty
pe (s
tate
ye
ar e
nd
if no
t 31
Mar
ch)
% o
f sha
res
held
Num
ber o
f sha
res
held
Cos
t of i
nves
tmen
t R'0
00N
et A
sset
Val
ue
of in
vest
men
t
R'
000
Prof
it/(L
oss)
for t
he y
ear
R'00
0Lo
sses
gu
aran
teed
2017
/18
2016
/17
201
7/18
2
016/
17
201
7/18
2
016/
17
201
7/18
2
016/
17
201
7/18
2
016/
17
Yes/
No
⁴�Vod
acom
Gro
up
Limite
d2
0.03
%0.
03%
63 6
5863
658
-3
743
--
15 5
62 0
0013
126
000
No
Broa
dban
d In
fraco
SO
C L
imite
d2
74%
74%
7474
7474
715
987
750
008
(121
473
)(1
27 4
60)
No
SITA
3A10
0%10
0%1
11
12
895
203
2 73
4 48
616
0 71
716
0 83
9N
o
TOTA
L90
0 21
9 67
390
0 21
9 67
05
293
082
2 84
3 20
710
748
320
5 94
5 08
217
699
085
16 7
18 8
10
¹ Com
prise
d of
207
038
058
sha
res
@ R
10 p
er s
hare
.
² Com
prise
d of
693
115
879
sha
res
@ R
1 pe
r sha
re. (
The
Sout
h Af
rican
Pos
t Offi
ce L
td is
sued
287
176
058
sha
res
for t
he TB
VC lo
an c
onve
rted
to e
quity
and
205
000
000
sha
res
for 2
013/
14 M
TEF
fund
al
loca
tion
for t
he c
orpo
ratis
atio
n of
the
Postb
ank
as a
ppro
ved
by th
e M
inist
er o
f Fin
ance
on
7 Ap
ril 20
14).
³ Com
prise
d of
998
sha
res
@ R
1 pe
r sha
re.
⁴ Com
prise
d of
63
658
shar
es R
58.8
0 pe
r sha
re.

TELE
CO
MM
UNIC
ATIO
NS
AN
D P
OST
AL
SERV
ICES
– V
OTE
32
AN
NEX
URES
TO
TH
E A
NN
UAL
FIN
AN
CIA
L ST
ATEM
ENTS
for t
he y
ea
r end
ed
31
Ma
rch
2018
AN
NEX
URE
3AST
ATEM
ENT
OF
FIN
AN
CIA
L G
UARA
NTE
ES IS
SUED
AS
AT 3
1 M
ARC
H 2
018
- LO
CA
L
GUA
RAN
TOR
INST
ITUT
ION
Gua
rant
ee in
resp
ect
of
Orig
ina
l g
uara
ntee
d
cap
ital
am
ount
Op
enin
g
ba
lanc
e 1
April
201
7
Gua
rant
ees
dra
w d
owns
d
urin
g th
e ye
ar
Gua
ran-
teed
re-
pa
ymen
ts/
canc
elle
d/
red
uced
/ re
lea
sed
d
urin
g th
e ye
ar
Reva
lua
-tio
ns
Clo
sing
b
ala
nce
31
Ma
rch
2018
Gua
rant
eed
in
tere
st fo
r ye
ar e
nded
31
Ma
rch
2018
Rea
lised
lo
sses
not
re
cove
rab
le
i.e. c
laim
s p
aid
out
R'00
0R'
000
R'00
0R'
000
R'00
0R'
000
R'00
0R'
000
LOC
ALHo
usin
gSt
anda
rd B
ank
10
410
4-
104
--
Sub
tota
l10
410
4-
104
--
--
Oth
er
Stan
dard
Ban
kSo
uth
Afric
an P
ost
Offi
ce L
td27
0 00
027
0 00
0-
270
000
--
-
ABSA
Sout
h Af
rican
Pos
t O
ffice
Ltd
800
000
400
000
400
000
800
000
--
-
Inve
stec
Sout
h Af
rican
Pos
t O
ffice
Ltd
700
000
600
000
100
000
700
000
--
-
Ned
bank
Sout
h Af
rican
Pos
t O
ffice
Ltd
800
000
-80
0 00
080
0 00
0-
--
Stan
dard
ban
kSo
uth
Afric
an P
ost
Offi
ce L
td90
0 00
0-
900
000
900
000
--
-
Firs
t Nat
iona
l Ban
kSo
uth
Afric
an P
ost
Offi
ce L
td50
0 00
0-
500
000
500
000
--
-
page 248

page 249
TELE
CO
MM
UNIC
ATIO
NS
AN
D P
OST
AL
SERV
ICES
– V
OTE
32
AN
NEX
URES
TO
TH
E A
NN
UAL
FIN
AN
CIA
L ST
ATEM
ENTS
for t
he y
ea
r end
ed
31
Ma
rch
2018
AN
NEX
URE
3AST
ATEM
ENT
OF
FIN
AN
CIA
L G
UARA
NTE
ES IS
SUED
AS
AT 3
1 M
ARC
H 2
018
- LO
CA
L
GUA
RAN
TOR
INST
ITUT
ION
Gua
rant
ee in
resp
ect
of
Orig
ina
l g
uara
ntee
d
cap
ital
am
ount
Op
enin
g
ba
lanc
e 1
April
201
7
Gua
rant
ees
dra
w d
owns
d
urin
g th
e ye
ar
Gua
ran-
teed
re-
pa
ymen
ts/
canc
elle
d/
red
uced
/ re
lea
sed
d
urin
g th
e ye
ar
Reva
lua
-tio
ns
Clo
sing
b
ala
nce
31
Ma
rch
2018
Gua
rant
eed
in
tere
st fo
r ye
ar e
nded
31
Ma
rch
2018
Rea
lised
lo
sses
not
re
cove
rab
le
i.e. c
laim
s p
aid
out
R'00
0R'
000
R'00
0R'
000
R'00
0R'
000
R'00
0R'
000
Stan
dard
Ban
kSo
uth
Afric
an P
ost
Offi
ce L
td86
500
-86
500
65
Inve
stec
Sout
h Af
rican
Pos
t O
ffice
Ltd
76 0
00-
76 0
0060
Ned
bank
Sout
h Af
rican
Pos
t O
ffice
Ltd
86 5
00-
86 5
0066
Stan
dard
ban
kSo
uth
Afric
an P
ost
Offi
ce L
td97
000
-97
000
74
Firs
t Nat
iona
l Ban
kSo
uth
Afric
an P
ost
Offi
ce L
td54
000
-54
000
40
Sub
tota
l4
370
000
1 27
0 00
02
700
000
3 97
0 00
0-
400
000
305
-
Tota
l4
370
104
1 27
0 10
42
700
000
3 97
0 10
4-
400
000
305
-
(co
ntin
ued
)

page 250
TELE
CO
MM
UNIC
ATIO
NS
AN
D P
OST
AL
SERV
ICES
– V
OTE
32
AN
NEX
URES
TO
TH
E A
NN
UAL
FIN
AN
CIA
L ST
ATEM
ENTS
for t
he y
ea
r end
ed
31
Ma
rch
2018
AN
NEX
URE
3AST
ATEM
ENT
OF
FIN
AN
CIA
L G
UARA
NTE
ES IS
SUED
AS
AT 3
1 M
ARC
H 2
018
- LO
CA
L
GUA
RAN
TOR
INST
ITUT
ION
Gua
rant
ee in
resp
ect
of
Orig
ina
l g
uara
ntee
d
cap
ital
am
ount
Op
enin
g
ba
lanc
e 1
April
201
7
Gua
rant
ees
dra
w d
owns
d
urin
g th
e ye
ar
Gua
ran-
teed
re-
pa
ymen
ts/
canc
elle
d/
red
uced
/ re
lea
sed
d
urin
g th
e ye
ar
Reva
lua
-tio
ns
Clo
sing
b
ala
nce
31
Ma
rch
2018
Gua
rant
eed
in
tere
st fo
r ye
ar e
nded
31
Ma
rch
2018
Rea
lised
lo
sses
not
re
cove
rab
le
i.e. c
laim
s p
aid
out
R'00
0R'
000
R'00
0R'
000
R'00
0R'
000
R'00
0R'
000
Oth
erTe
lkom
SA
Ltd
Nat
exis
Banq
ue-
--
N
atex
is Ba
nque
252
891
107
865
--
3 28
011
1 14
52
Subt
otal
252
891
107
865
--
3 28
011
1 14
52
-
Tota
l4
623
099
1 37
8 07
32
700
000
3 97
0 20
83
280
511
145
307
-
(co
ntin
ued
)

TELE
CO
MM
UNIC
ATIO
NS
AN
D P
OST
AL
SERV
ICES
– V
OTE
32
AN
NEX
URES
TO
TH
E A
NN
UAL
FIN
AN
CIA
L ST
ATEM
ENTS
for t
he y
ea
r end
ed
31
Ma
rch
2018
AN
NEX
URE
3B
STAT
EMEN
T O
F C
ON
TIN
GEN
T LI
ABI
LITI
ES A
S AT
31
MA
RCH
201
8
NAT
URE
OF
LIA
BILI
TYO
pe
ning
b
ala
nce
1 A
pril
201
7
Lia
bili
ties
inc
urre
d d
urin
g
the
ye
ar
Lia
bili
ties
pa
id/
ca
nce
lled
/ re
duc
ed
dur
ing
th
e y
ea
r
Lia
bili
tes
rec
ove
rab
le
(Pro
vid
e d
eta
ils
here
und
er)
Clo
sing
b
ala
nce
31
Ma
rch
2018
R'00
0R'
000
R'00
0R'
000
R'00
0
Cla
ims
ag
ain
st t
he D
ep
art
me
nt
Poss
ible
leg
al c
laim
600
-60
0-
-
Poss
ible
leg
al c
laim
37 0
392
111
--
39 1
50
Poss
ible
leg
al c
laim
5 28
632
1-
-5
607
Poss
ible
leg
al c
laim
10 2
8975
4-
-11
043
Poss
ible
leg
al c
laim
20-
20-
-
Poss
ible
leg
al c
laim
20-
20-
-
Poss
ible
leg
al c
laim
30 0
00-
30 0
00-
-
Poss
ible
leg
al c
laim
20-
20-
-
Poss
ible
leg
al c
laim
20-
20-
-
Poss
ible
leg
al c
laim
30-
30-
-
Poss
ible
leg
al c
laim
300
-30
0-
-
Poss
ible
leg
al c
laim
5 84
330
8-
-6
151
TOTA
L89
467
3 49
431
010
-61
951
page 251

TELE
CO
MM
UNIC
ATIO
NS
AN
D P
OST
AL
SERV
ICES
– V
OTE
32
AN
NEX
URES
TO
TH
E A
NN
UAL
FIN
AN
CIA
L ST
ATEM
ENTS
for t
he y
ea
r end
ed
31
Ma
rch
2018
AN
NEX
URE
4
CLA
IMS
REC
OVE
RABL
E
GO
VERN
MEN
T EN
TITY
Con
firm
ed b
ala
nce
outs
tand
ing
U
ncon
firm
ed b
ala
nce
outs
tand
ing
T
ota
l C
ash
in tr
ans
it a
t yea
r end
20
17/1
8*
31
/03/
2018
31/0
3/20
17
31
/03/
2018
31/0
3/20
17
31
/03/
2018
31/0
3/20
17
Rec
eip
t da
te
up to
six
(6)
wor
king
da
ys
afte
r yea
r en
d
Am
ount
R'0
00
R'0
00
R'0
00
R'0
00
R'0
00
R'0
00
R'
000
DEP
ARTM
ENTS
Rura
l Dev
elop
men
t-
7-
--
7-
-
Offi
ce o
f the
Chi
ef L
and
Cla
ims
Com
miss
ione
r-
9-
--
9-
-
SITA
300
--
-30
0-
--
Tota
l30
016
--
300
16-
page 252

TELE
CO
MM
UNIC
ATIO
NS
AN
D P
OST
AL
SERV
ICES
– V
OTE
32
AN
NEX
URES
TO
TH
E A
NN
UAL
FIN
AN
CIA
L ST
ATEM
ENTS
for t
he y
ea
r end
ed
31
Ma
rch
2018
AN
NEX
URE
5
INTE
R-G
OVE
RNM
ENT
PAYA
BLES
GO
VERN
MEN
T EN
TITY
Con
firm
ed b
ala
nce
outs
tand
ing
U
ncon
firm
ed b
ala
nce
outs
tand
ing
T
ota
l C
ash
in tr
ans
it a
t yea
r end
20
17/1
8*
31
/03/
2018
31/0
3/20
17
31
/03/
2018
31/0
3/20
17
31
/03/
2018
31/0
3/20
17
Pa
ymen
t d
ate
up
to s
ix
(6) w
orki
ng
da
ys b
efor
e ye
ar e
nd
Am
ount
R'0
00
R'0
00
R'0
00
R'0
00
R'0
00
R'0
00
R
'000
DEP
ARTM
ENTS
Cur
rent
SAPS
38-
-38
--
-
Cor
rect
iona
l Ser
vice
s82
82-
Limpo
po P
ro G
ov:P
ublic
Wor
sks
Road
&
Infra
stru
ctur
e3
3-
DO
C33
33-
Dep
artm
ent o
f Tra
nspo
rt an
d Pu
blic
Wor
ks6
6-
IPID
-43
TOTA
L IN
TERG
OVE
RNM
ENTA
L16
2-
--
162
43
page 253

TELE
CO
MM
UNIC
ATIO
NS
AN
D P
OST
AL
SERV
ICES
– V
OTE
32
AN
NEX
URES
TO
TH
E A
NN
UAL
FIN
AN
CIA
L ST
ATEM
ENTS
for t
he y
ea
r end
ed
31
Ma
rch
2018
AN
NEX
URE
6
INVE
NTO
RYN
ote
201
7/18
201
6/17
Qua
ntity
R'0
00
Q
uant
ity R
'000
Inve
nto
ry
Op
eni
ng b
ala
nce
111
238
15
Add
/(Le
ss):
Ad
just
me
nts
to p
rior y
ea
r ba
lanc
es
--
--
Add
: Ad
diti
ons
/Pur
cha
ses
- C
ash
9121
210
9
Add
: Ad
diti
ons
- N
on-
ca
sh-
--
-
(Le
ss):
Disp
osa
ls
--
--
(Le
ss):
Issue
s
(91)
(212
)(2
3)(9
)
Add
/(Le
ss):
Adju
stm
ent
s(7
)(1
)(2
14)
(14)
Clo
sing
ba
lanc
e4
-11
1
page 254

page 255
TELE
CO
MM
UNIC
ATIO
NS
AN
D P
OST
AL
SERV
ICES
– V
OTE
32
AN
NEX
URES
TO
TH
E A
NN
UAL
FIN
AN
CIA
L ST
ATEM
ENTS
for t
he y
ea
r end
ed
31
Ma
rch
2018
AN
NEX
URE
8A
INTE
R-EN
TITY
AD
VAN
CES
PA
ID (n
ote
14)
EN
TITY
Co
nfirm
ed
ba
lanc
e
out
sta
ndin
gUn
co
nfirm
ed
ba
lanc
e
out
sta
ndin
gTo
tal
31/0
3/20
1831
/03/
2017
31/0
3/20
1831
/03/
2017
31/0
3/20
1831
/03/
2017
R'00
0R'
000
R'00
0R'
000
R'00
0R'
000
NAT
ION
AL
DEP
ART
MEN
TS
Inte
rna
tiona
l Re
latio
ns a
nd C
oo
pe
ratio
ns2
182
--
2 92
82
182
2 92
8
Sub
tota
l2
182
--
2 92
82
182
2 92
8
PUBL
IC E
NTI
TIES
Bro
ad
ba
nd In
frac
o4
900
4 90
0-
Sub
tota
l4
900
--
-4
900
-
TOTA
L 7
082
--
2 92
87
082
2 92
8

page 256

page 257

page 258


Department of Telecommunications and Postal ServicesiParioli Office Park1166 Park Street
HatfieldPretoria0001
Private Bag X860Pretoria0001
Tel: +27.12.427.8000www.dtps.gov.za
RP291/2018
ISBN: 978-0-621-46534-1