annual report 2019/2020 - gov
TRANSCRIPT

AnnuAl RepoRt2019/2020


PUBLIC ENTERPRISES I Annual Report 2019/2020
1
DEPARTMENT OF PUBLIC ENTERPRISES
VOTE NO. 09
ANNUAL REPORT2019/2020 FINANCIAL YEAR

2

PUBLIC ENTERPRISES I Annual Report 2019/2020
3
CONTENTSPART A: GENERAL INFORMATION 5
1. DEPARTMENTAL GENERAL INFORMATION 6
2. GLOSSARY OF ACRONYMS 7
3. FOREWORD BY THE MINISTER 8
4. DEPUTY MINISTER’S STATEMENT 10
5. REPORT OF THE ACCOUNTING OFFICER 11
6. STATEMENT OF RESPONSIBILITY AND CONFIRMATION OF ACCURACY OF THE ANNUAL REPORT 15
7. STRATEGIC OVERVIEW 16
7.1. Vision 16
7.2. Mission 16
7.3. Values 16
8. LEGISLATIVE AND OTHER MANDATES 16
9. ORGANISATIONAL STRUCTURE 17
10. ENTITIES REPORTING TO THE MINISTER 18
PART B: PERFORMANCE INFORMATION 19
1. AUDITOR GENERAL’S REPORT: PRE-DETERMINED OBJECTIVES 20
2. OVERVIEW OF DEPARTMENTAL PERFORMANCE 20
2.1 Performance Delivery Environment 20
2.2 Service Delivery Improvement Plan 21
2.3 Organisational Environment 21
2.4 Key Policy Developments and Legislative Changes 22
3. STRATEGIC OUTCOME ORIENTED GOALS 22
4. PERFORMANCE INFORMATION BY PROGRAMME 23
4.1 PROGRAMME 1 – ADMINISTRATION AND CORPORATE MANAGEMENT 23
4.2 PROGRAMME 2 – SOC GOVERNANCE AND PERFORMANCE 25
4.3 PROGRAMME 3 – BUSINESS ENHANCEMENT AND INDUSTRIALISATION 28
5. TRANSFER PAYMENTS 38
5.1 Transfer payments to public entities 38
5.2 Transfer payments to all organisations other than public entities 38

4
6. CAPITAL INVESTMENT 38
7. DONOR FUNDS RECEIVED 38
8. CAPITAL INVESTMENT 38
PART C: GOVERNANCE 39
1. INTRODUCTION 40
2. RISK MANAGEMENT 40
3. FRAUD AND CORRUPTION 40
4. MINIMISING CONFLICT OF INTEREST 41
5. CODE OF CONDUCT 41
6. HEALTH SAFETY AND ENVIRONMENTAL ISSUES 41
7. PORTFOLIO COMMITTEE 42
8. SCOPA RESOLUTIONS 43
9. PRIOR MODIFICATIONS TO AUDIT REPORTS 44
10. INTERNAL CONTROL UNIT 44
11. INTERNAL AUDIT AND AUDIT COMMITTEES 44
12. AUDIT COMMITTEE REPORT 46
13. B-BBEE COMPLIANCE PERFORMANCE INFORMATION 48
PART D: HUMAN RESOURCE MANAGEMENT 49
1. INTRODUCTION 50
2. OVERVIEW OF HUMAN RESOURCES 50
3. HUMAN RESOURCES OVERSIGHT STATISTICS 51
PART E: FINANCIAL INFORMATION 69
1. REPORT OF THE AUDITOR GENERAL 70
2. ANNUAL FINANCIAL STATEMENTS 76

PART A GENERAL INFORMATION

6
1. DEPARTMENTAL GENERAL INFORMATION
PHYSICAL ADDRESS: 80 Hamilton Street
Arcadia
Pretoria
POSTAL ADDRESS: Private Bag X15
Hatfield
0028
TELEPHONE NUMBER/S: 027 12 431 1000
FAX NUMBER: 027 086 501 2624
EMAIL ADDRESS: [email protected]
WEBSITE ADDRESS: www.dpe.gov.za
PUBLIC ENTERPRISES I Annual Report 2019/2020
7
MOA Memorandum of Agreement
MOI Memorandum of Incorporation
MDS Market Demand Strategy
MISS Minimum Information Security Standards
MTEF Medium-Term Expenditure Framework
MSC Modified Cash Standard
MTSF Medium-Term Strategic Framework
MW Megawatts
MYPD Multi-Year Price Determination
NCPM National Corridor Performance Measurement
NDP National Development Plan
NEHAWU National Education, Health and Allied Workers’ Union
NGP New Growth Path
NT National Treasury
OHS Occupational Health and Safety
PDP Personal Development Plans
PFMA Public Finance Management Act
PSA Public Service Association
PRC Presidential Review Committee
PSEC Presidential State-Owned Enterprises Council
PSJV Pooling and Sharing Joint Venture
SA EXPRESS
South African Express Airways
SAFCOL South African Forestry Company Ltd
SCM Supply Chain Management
SHC Shareholder Compacts
SMS Senior Management Service
SOC State Owned Company
SOE State Owned Enterprise
StatsSA Statistics South Africa
TFR Transnet Freight Rail
TNPA Transnet National Ports Authority
TOR Terms of Reference
UCLF Unplanned Capability Loss Factor
WSP Workplace Skills Plan
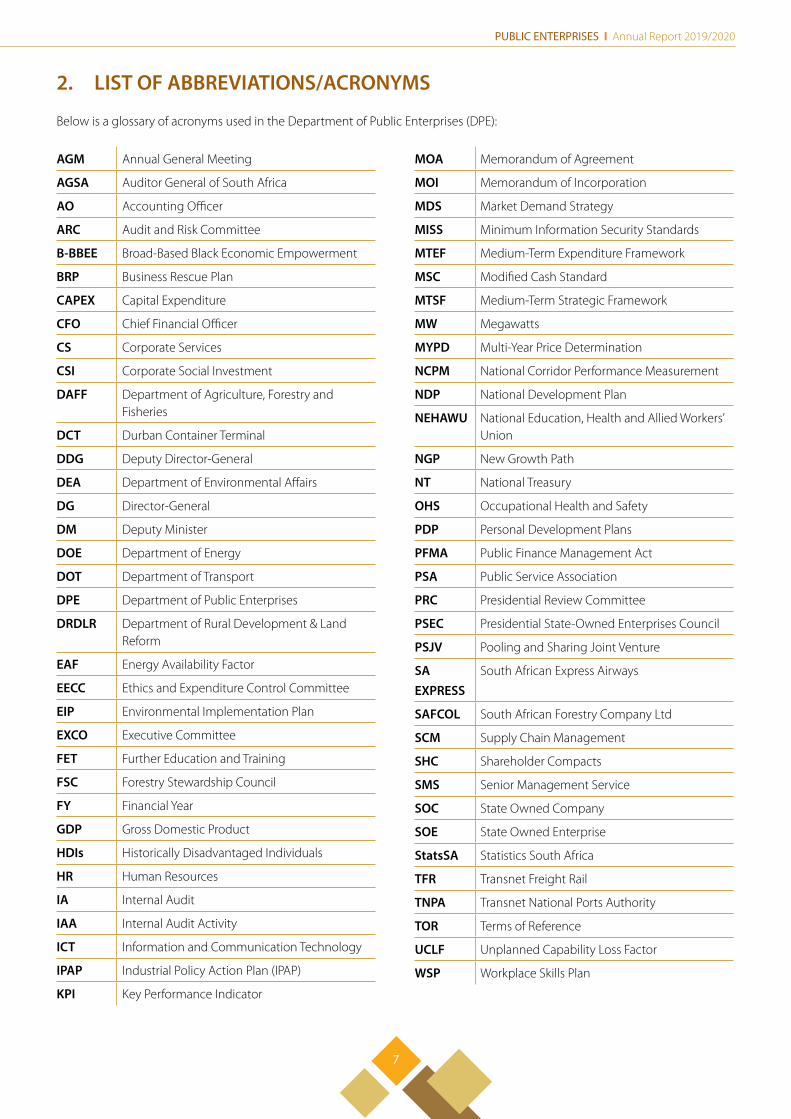
2. LIST OF ABBREVIATIONS/ACRONYMS
Below is a glossary of acronyms used in the Department of Public Enterprises (DPE):
AGM Annual General Meeting
AGSA Auditor General of South Africa
AO Accounting Officer
ARC Audit and Risk Committee
B-BBEE Broad-Based Black Economic Empowerment
BRP Business Rescue Plan
CAPEX Capital Expenditure
CFO Chief Financial Officer
CS Corporate Services
CSI Corporate Social Investment
DAFF Department of Agriculture, Forestry and Fisheries
DCT Durban Container Terminal
DDG Deputy Director-General
DEA Department of Environmental Affairs
DG Director-General
DM Deputy Minister
DOE Department of Energy
DOT Department of Transport
DPE Department of Public Enterprises
DRDLR Department of Rural Development & Land Reform
EAF Energy Availability Factor
EECC Ethics and Expenditure Control Committee
EIP Environmental Implementation Plan
EXCO Executive Committee
FET Further Education and Training
FSC Forestry Stewardship Council
FY Financial Year
GDP Gross Domestic Product
HDIs Historically Disadvantaged Individuals
HR Human Resources
IA Internal Audit
IAA Internal Audit Activity
ICT Information and Communication Technology
IPAP Industrial Policy Action Plan (IPAP)
KPI Key Performance Indicator

8
The damage caused by state capture has proven to be
extensive and some of the SOCs (SAA and SA Express) have
had to seek the protection of the courts through business
rescue to restructure and attract new capital.
Further, effort into the restructuring of these SOCs, the cost
of their operations relative to revenues raised, the tariff
structure compared to other developing countries, the return
on capital investment and assets deployed are areas that
require particular attention going forward if the aspirations
of post COVID-19 are to be achieved. We have started these
conversations with the boards, and we are asking questions
about the type of partnerships and strategies that will enable
leveraging of state assets.
The eradication of malfeasance and state capture needs to
be matched by appropriate policies, regulations, monitoring
tools and systems; and structures to discourage misbehaviour.
The Department is working furiously in this regard, and
guidance will be given to SOCs to ensure that at the coalface,
vigilant capacity is put in place. These initiatives are to ensure
that the precipitous history of bad corporate governance,
malfeasance and corruption is not repeated.
Our people deserve better.
In addition, law enforcement agencies are investigating all
instances of state capture and corruption in the SOCs and
the signs that good progress is being made in this regard
are there. Moreover, Eskom and Transnet have initiated civil
and criminal proceedings against individuals and companies
implicated in corruption to recover funds that may have been
stolen or contracts which may have been unduly awarded.
We are aware that the steps taken to stabilise the SOCs
will require time, as we need to address deep embedded
structural, financial and operational challenges. We are
also cognisant of the speed that is required to address the
drag that the SOCs are placing on the economy – through
dependence on the fiscus, unaffordable administered
prices, inefficient corporate arrangements, value destroying
operational and capital expenditure and their conspiratorial
role in malfeasance, amongst others.
The future that we intend to craft of these entities is one
where there is clarity on their contribution to the GDP.
Currently, their contribution to the GDP is 5% and, through
conservative estimates, with a multiplier effect of 15%.
3. FOREWORD BY THE MINISTER
BUILDING FINANCIALLY SUSTAINABLE AND OPERATIONALLY ROBUST STATE-OWNED COMPANIES
South Africa’s State-Owned Enterprises (SOEs) provide critical
economic infrastructure, enable growth, distribute essential
services and are the preferred infrastructure development
partners to African countries.
However, their perilous financial state has been further
exposed during this past financial year. This is the unavoidable
consequence of years of state capture during which criminal
activities involving the looting of funds from the SOCs’ lack
of assets maintenance and rampant mismanagement,
including the absence of consequences for malfeasance and
maladministration thrived.
When I assumed the role in 2018, the SOCs were rejuvenated
by introducing new boards and management with the
necessary experience and knowledge to ensure their
financial stability. This remains inadequate in resetting the
SOCs towards financial sustainability.
Mr Pravin J. Gordhan

PUBLIC ENTERPRISES I Annual Report 2019/2020
9
The Department needs to be able to set revenue targets
driven by a reflection of what will be comparable to other
developing countries. Further, how much of the national
budget should the SOCs’ contribution be since in countries
like Malaysia, their SOCs contribute 5% of national budget,
this is after a radical transformation of their portfolio, which
included attraction of strategic equity partners and listing on
their national bourse.
The portfolio should be able to deliver reliable electricity,
freight logistics, sustainable utility services, public transport
services, well priced indigenous world class manufactured
products in all sectors these SOCs are participating in. In the
same vein as we lead the government effort on the rest of
the portfolio, these are the kinds of aspirations that inform
the repositioning of the SOC portfolio in general.
On the continent there is movement towards ensuring
connection and industrialisation. The Single African Air
Transport Market (SAATM) and the African Continental Free
Trade Area (AfCFTA) envisioned by the African Union are just
some of the initiatives that are coming to the fore. We need
to be able to define a role for SOCs beyond our borders and
ensuring that they will perform in collaboration with others
within and outside the continent.
A different narrative around our SOCs is possible. We intend
to ensure that it is achieved, for the sake of our people
MR PRAVIN J. GORDHAN, MP
MINISTER OF PUBLIC ENTERPRISES

10
4. DEPUTY MINISTER’S STATEMENT
My appointment to the Department of Public Enterprises
came after the sixth democratic elections, where among
many other key focus areas in the ruling party’s manifesto,
stabilising State Owned Enterprises (SOEs) was one of them.
Many SOCs under the Department of Public Enterprises
(DPE) found themselves in serious financial and governance
problems that affected their operations. The gravity of the
work needed to be done to turn around these strategic assets
of the state looked insurmountable. The work to destabilise
the SOCs under this portfolio had taken root. However, it
has not been without its challenges. There has been hard
decisions that had to be made, and harder ones to palate.
We are still a long way until we turn the tide and put the
SOCs on a path of financial sustainability and operational
excellence. Although having put in place competent directors
to the Boards of South African Express Airways (SA Express),
Denel and other SOCs, the problems persisted because of the
historical issues.
SA Express has been placed under provisional liquidation
and its future will be determined by the liquidation process.
The dire financial situation of the airline has since been
exacerbated by the negative impact of the COVID-19
pandemic, which has immensely affected airlines globally.
The country’s arms manufacturer, Denel, also finds itself under
difficult conditions. We are working with the Denel Board to
resolve the short-term liquidity challenges the company is
facing, where payment of salaries are a challenge.
During the period under review, it is apparent that the sooner
we implement the future state and ownership structures of
the SOEs, the sooner SOEs will be able to play both their
economic and developmental role.
Phumulo Masualle (MP)
Deputy Minister of Public Enterprises
Phumulo Masualle

PUBLIC ENTERPRISES I Annual Report 2019/2020
11
resulting in stage 6 load shedding in December 2019. Eskom
is currently implementing the Generation Recovery Plan
to improve plant performance. In order to improve plant
performance for Medupi and Kusile’s new units, Eskom
is currently implementing defects correction to improve
the performance. Eskom’s total debt increased to R480
billion (2018/19: R440 billion) by the end of 2019/20. Cash
generation from operations of R39 billion is insufficient to
cover debt obligations. The entity recorded a loss of R16.7
billion (2018/19 R20.7 billion) at the end of the 2019/20
financial year.
The two airlines, South African Express Airways (SA Express)
and South African Airways (SAA) were placed under business
rescue in December 2019 and February 2020 respectively. A
business rescue plan for SAA was finalised and will be followed
by a proposed restructuring process which the Department
believes is fundamental and will create a solid base for the
emergence of a competitive, viable and sustainable national
airline for the country.
The persistent deterioration of the diamond operation has
negatively impacted the financial position of Alexkor, which
reported a loss of R9 million by the second quarter of the
2019/20 financial year and the prospects of improving the
diamond production are minimal. The Department has
subsequently proposed a number of strategic options for
consideration by Government on the future role of the entity.
As a result of these challenges, the DPE has an enormous
responsibility of ensuring that the SOCs in its portfolio are
effecting the Government’s priorities with respect to social
and economic development. In so doing, an appropriate
balance between financial and broader developmental
goals needs to be achieved without compromising the
competiveness of the enterprises.
In order for the SOCs’ performance to be improved, it
will require changes in the SOCs’ operational models and
improved environment within which the SOCs operate.
Evidently, this must be augmented by value-added efforts
in the execution of the oversight function and capacity to
ensure that SOCs are financially sustainable while executing
key priorities of government. The reform of the SOCs remain
an essential part of the work programme of the Department
to curtail further losses experienced by some SOCs and to
ensure that losses are significantly reduced.
5. REPORT OF THE ACCOUNTING OFFICER
1.1 OVERVIEW OF THE OPERATIONS OF THE DEPARTMENT
The 2019/20 Financial year was a challenging one for the
Department of Public Enterprises (DPE) and the State
Owned Companies (SOCs) in its portfolio. In the context of
a depressed economy, SOCs have a fundamental role to play
in leveraging growth of the economy by delivering essential
services, such as energy and freight transport.
The calendar year ended on a muted note where South
Africa’s economy expanded at the slowest pace since
the global financial crisis. Statistics South Africa (Stats SA)
reported a gross domestic product which shrank at 1.4% in
the last quarter of 2019. The economy only grew by 0,2%
in 2019, the lowest reading since 2009 when the economy
contracted by 1,5%.
As a result, the SOCs within the DPE portfolio had a fair
share of blows which encroached the sustainability of State
Owned Companies (SOCs). During the period under review,
Eskom generation performance has deteriorated further,
Mr Kgathatso Tlhakudi

12
trajectory is improved, the DPE has tabled a new strategy
framed to support the reform of the SOCs in line with the
institutional plans as outlined in the 2019-2024 Medium-
Term Strategic Framework (MTSF).
The year ahead is expected to be equivalently a challenging
one but with improved oversight tools, the Department will
fulfil its mandate as the Government Shareholder and ensure
that the operations of SOCs are fully aligned to the national
priorities. To ensure that the current SOCs’ performance
1.2 OVERVIEW OF THE FINANCIAL RESULTS OF THE DEPARTMENT
1.2.1 Departmental receipts
Departmental receipts 2019/2020 2018/2019
Estimate Actual amount collected
(Over) /Under collection
Estimate Actual amount
collected
(Over)/Under collection
R’000 R’000 R’000 R’000 R’000 R’000
Sales of goods and services other than capital assets
97 65 32 60 64 (4)
Interest, dividends and rent on land 2 - 2 1 - 1
Sales of capital assets - - 16 17 (1)
Transactions in financial assets and liabilities
115 44 71 140 285 (145)
TOTAL 214 109 105 217 366 (149)
1.2.2 Revenue narrative
The DPE does not generate revenue as revenue collection is not part of its core function.
1.2.3 Programme expenditure
Programme Name 2019/20 2018/19
Final appropriation
Actual expenditure
(Over)/Under expenditure
Final appropriation
Actual expenditure
(Over)/Under expenditure
R’000 R’000 R’000 R’000 R’000 R’000
Administration 163 121 149 077 14 044 151 979 136 031 15 948
State-owned Companies’ Governance Assurance and Performance
41 613 36 880 4 733 39 084 33 490 5 594
Business Enhancement, Transformation and Industrialisation
56 678 296 56 660 432 17 864 6 331 851 6 305 272 26 579
TOTAL 56 883 030 56 846 389 36 641 6 522 914 6 474 793 48 121

PUBLIC ENTERPRISES I Annual Report 2019/2020
13
1.2.7 Future plans of the Department
• Stabilisation of SOCs through repurposing these strategic
companies to support growth and development.
• Continuous exploration of resources and capabilities
of SOCs to promote inclusive growth, investment and
creation of jobs.
• Refocus mandates /orientation of SOCs to ensure that
they have viable business and operating models.
• Greater focus on SOCs’ operational performances.
1.2.8 Public Private Partnerships
The Department has no public private partnerships registered
with National Treasury.
1.2.9 Discounted activities/activities to be discontinued
The Department has neither discontinued any activities nor
will it discontinue any planned activities.
1.2.10 New proposed activities
None
1.2.11 Supply chain management
The Department did not experience unsolicited bid proposals
during the 2019/20 financial year. Three bid committees (i.e
Bid Specification Committee, Bid Evaluation Committee
and Bid Adjudication Committee) have been established
to ensure compliance in the bidding process and the
implementation of the Departmental Financial and Supply
Chain Management Policies and Delegations to manage and
prevent irregular expenditure. The Department trained the
relevant bid committee members to ensure that they were
able to carry out their responsibilities.
1.2.12 Gifts/ donation received in kind from non-related parties
There were no gifts/donations received by the department
from non-related parties in the year under review.
1.2.4 Expenditure narrative
The Department has spent 99.9% (R56.846 billion of R56.883
billion) of the total budget, of which R246.4 million was for
departmental operations and R56.6 billion was the capital
injection for SOCs. The Department received R26 billion
which was tabled in the Special Appropriation Bill, (2019) to
assist Eskom with its financial obligations. During the 2019/20
medium-term budget adjustment, an additional amount of
R30.6 billion was received and earmarked for Eskom (R23
billion), SA Express (R300 million), SAA (R5.5 billion) and
Denel (R1.8 billion) for working capital and settlement of
outstanding debts.
The under expenditure of R36 million primarily relates to
compensation of employees (R21 million) and goods and
services (R15 million). This was as a result of unfilled posts and
non-implementation of the development of the Green Paper
for the Shareholder Management Bill.
1.2.5 Virements/roll overs
A virement approval has been granted by National Treasury to
shift R17.562 billion for recapitalisation in respect of Eskom’s
financial obligations from Programme 2: SOCs’ Governance
Assurance and Performance to Programme 3: Business
Enhancement, Transformation and Industrialisation.
No roll over request was submitted to National Treasury.
1.2.6 A description of the reasons for unauthorised, fruitless and wasteful expenditure and the amount involved as well as steps taken to address and prevent a recurrence
The Department did not incur any unauthorised expenditure.
The fruitless and wasteful expenditure of R730 thousand
reported in the Annual Financial Statements relates to
production of episodes for a TV discussion programme
about SOCs, storage of the production set and travel
and subsistence. This matter is still under investigation to
determine the root cause. The Department continues to
implement control measures in place as well as monitor,
detect and address fruitless and wasteful expenditure to
ensure compliance with the Public Finance Management Act
(PFMA, Act 1 of 1999 as amended).

14
1.2.13 Exemption and deviations received from National Treasury
The Department received no exemptions from National
Treasury except for the deviations from the bidding process,
which is in accordance with Treasury Regulations and
Treasury Instruction number 3 of 2016/17.
1.2.14 Events after the reporting date
The Department received the article summons on 2 June
2020 from a service provider, which could result in a
contingent liability. Furthermore, a labour dispute matter
was settled after 31 March 2020.
The post of Director-General for the Department was filled
in July 2020.
In April 2020 it was announced that the article support
package towards COVID-19 must be prioritised. During the
Special Adjustment Budget, the Department’s budget for
the 2020/21 financial year was reduced by 20%, which is
R61.9 million of R309 million (these funds exclude payments
for financial assets). This comprises R30 million from
Compensation of Employees (COEs) and R31.9 million from
Goods and Services. These reductions were implemented
across all three programmes of the Department.
1.2.15 Other
There were no other material facts or circumstances to be
reported.
Conclusion
I would like to express my gratitude to Minister Pravin
Gordhan, Deputy Minister Phumulo Masualle and the
DPE staff for their patronage and commitment during the
financial year under review.
___________________
Mr Kgathatso Tlhakudi
Accounting Officer
Department of Public Enterprises

PUBLIC ENTERPRISES I Annual Report 2019/2020
15
6. STATEMENT OF RESPONSIBILITY AND CONFIRMATION OF ACCURACY FOR THE ANNUAL REPORT
To the best of my knowledge and belief, I confirm the
following:
All information and amounts disclosed throughout the
Annual Report are consistent.
The annual report is complete, accurate and free from any
omissions.
The Annual Report has been prepared in accordance with
the guidelines on the annual report as issued by National
Treasury.
The Annual Financial Statements (Part E) have been prepared
in accordance with the modified cash standards and the
relevant frameworks and guidelines issued by the National
Treasury.
The Accounting Officer is responsible for the preparation of
the Annual Financial Statements and the judgements made
in this information.
The Accounting Officer is responsible for establishing and
implementing a system of internal control that has been
designed to provide reasonable assurance as to the integrity
and reliability of the performance information, the human
resources information and the annual financial statements.
The external auditors are engaged to express an independent
opinion on the annual financial statements.
In my opinion, the Annual Report fairly reflects the operations,
the performance information, the human resources
information and the financial affairs of the Department for
the financial year ended 31 March 2020.
Yours faithfully
___________________
Mr Kgathatso Tlhakudi
Accounting Officer

16
7. STRATEGIC OVERVIEW
7.3 Values
Our values are a key enabler of performance and underpin
the delivery of the DPE’s vision and mission. They are as
follows: -
Trusting – Having confidence in the character, ability,
strength and commitment of each other ;
Enabling – An environment that supports our people, our
economy and our nation ;
Caring – Treating employees and others with concern,
kindness and empathy;
Leading – Providing clear direction, guidance and forward
thinking;
Transparent – Ensuring visibility and accessibility of
information relating to our business practices;
Prudent – Applying skill and good judgement in the use
and application of resources and reducing risk ;
Responsive – Responding quickly, appropriately and
effectively; and
Relevant – Always being capable of addressing current
needs.
8. LEGISLATIVE AND OTHER MANDATESThe DPE is mandated to perform shareholder oversight on
behalf of Government over seven SOCs that play a key role
in enabling economic growth, creating jobs and promoting
the industrialisation and transformation of the economy. All
SOCs are incorporated as companies in accordance with the
provisions of the Companies Act (Act 71 of 2008). Except
for Denel, all the SOCs are established in terms of their own
enabling legislation which sets out the purpose, mandate and
objectives for which they were founded. The Department is
the administrator and custodian of all legislation in relation to
the establishment of SOCs.
In terms of section 63 (2) of the Public Finance Management
Act (PFMA Act 1 of 1999), as amended, the Minister of Public
Enterprises has, inter alia, the responsibility of ensuring that
the SOCs comply with the PFMA legislation.
7.1 Vision
To create an enabling environment in which SOCs add real
economic value by focussing on operational excellence,
commercial viability and fiscal prudence. This will drive
developmental objectives, industrialisation, job creation and
skills development.
In our view, this simplified vision statement reflects an
end-state in which sustainable SOCs support economic
growth by enabling industrialisation, job creation and skills
development. Well-directed and effectively overseen, our
SOCs will continue to actively enable the goals of the NDP.
7.2 Mission
To provide clear strategic direction and oversight to the
Department’s SOCs, seeking to ensure that:
• they are financially sustainable, adequately funded and
operationally robust;
• their operating models keep pace with global
development and innovation;
• they provide reliable, high-quality and cost-effective
services and infrastructure to industry and our citizens;
• they secure investment and funding for strategic
industrial development; and
• they align with national developmental objectives.

PUBLIC ENTERPRISES I Annual Report 2019/2020
17
9. ORGANISATIONAL STRUCTURE
MinisterPublic Enterprises
Deputy MinisterPublic Enterprises
Director-General
Programme 2SOC Governance,
Assurance & Performance
Energy Resources
Business Enhancement,
Transformation & Industrialisation
Financial Assessment &
Investment
Corporate Management
Research & Economic Modelling
SOC Governance, Assurance & Performance
Transport & Defence
Programme 3Business Enhancement,
Transformation & Industrialisation
Programme 1Administration

18
10. ENTITIES REPORTING TO THE MINISTER
The table below indicates the entities that report to the Minister:
Name of Entity Legislative Mandate
Financial Relationship
Nature of Operations
Alexkor Alexkor Limited Act (Act 116 of 1992)
Shareholder Representative
A diamond mining company that operates primarily in Alexander Bay and the greater Namaqualand area.
Denel None Shareholder Representative
Denel is responsible for manufacturing defence equipment and maintains sovereign and strategic defence capabilities on behalf of the State.
South African Express Airways
South African Express Act (Act 34 of 2007)
Shareholder Representative
SA Express is a domestic and regional air carrier.
South African Airways
South African Airways (Act 5 of 2007)
Shareholder Representative
South African Airways is the South African national airline.
South African Forestry Company
Management of State Forests Act (Act 128 of 1992)
Shareholder Representative
SAFCOL is Government’s forestry company which conducts timber harvesting, timber processing and related activities both domestically and regionally.
Eskom Eskom Conversion Act (Act 13 of 2001)
Shareholder Representative
Eskom generates, transmits and distributes electricity to industrial, mining, commercial, agricultural and residential customers and redistributors.
Transnet Legal Succession to the South African Transport Services Act (Act 9 of 1989)
Shareholder Representative
Transnet is a freight and logistics company responsible for pipelines, ports, and rail transport infrastructure and operations in South Africa.

19
PART B PERFORMANCE INFORMATION

20
reported under the Predetermined Objectives heading in the
Report on other legal and regulatory requirements section of
the auditor’s report.
Refer to page 70 for the Report of the Auditor-General,
published as Part E: Financial Information.
1. AUDITOR GENERAL’S REPORT: PREDETERMINED OBJECTIVES
The AGSA currently performs certain audit procedures on the
performance information to provide reasonable assurance in
the form of an audit conclusion. The audit conclusion on the
performance against predetermined objectives is included
in the report to management, with material findings being
2. OVERVIEW OF DEPARTMENTAL PERFORMANCE
2.1 Service Delivery Environment
The 2019/20 financial year marks the first year of the new
Administration and the publication of the 2019-2024 Medium-
Term Strategic Framework (MTSF). The MTSF outlines seven
priorities and provides a medium-term roadmap that informs
the institutional plans to achieve the NDP’s goals. The DPE
mainly supports the implementation of MTSF priority 1 –
Capable, Ethical and Developmental State and MTSF priority
2 – Economic Transformation and Job Creation.
At the January 2020 Cabinet Lekgotla it was resolved that:
“By 2030, South Africa needs to be served by a set of efficient,
financially sound and well-governed SOEs that address the
country’s developmental objectives in areas where neither the
executive arms of government nor private enterprises are able
to do so effectively. These enterprises must deliver quality and
reliable service at a cost that enables South Africa to be globally
competitive. To live up to these expectations, SOEs will require
clear public-interest mandates, which are consistently enforced.
Government will take further measures to ensure that all state-
owned companies fulfil their economic and developmental
mandates. We will need to confront the reality that the challenges
at some of our SOEs are structural – that they do not have a
sufficient revenue stream to fund their operational costs. These
SOEs cannot borrow their way out of their financial difficulties,
and we will therefore undertake a process of consultation with
all stakeholders to review the funding model of SOEs and other
measures”
The Department has an important portfolio of SOCs in
its stable and remains instrumental in ensuring reliable,
affordable security of supply in a host of sectors ranging
from energy to freight logistics. Ensuring that SOCs are self-
sufficient, with sustainable financing and effective operations
remains a major difficulty. It is paramount that all SOCs must
be self-sustaining so that there is no need for Government
to provide in any funding if the entity is operating efficiently
and is able to undertake a specific developmental mandate
to support the realisation of the NDP’s goals.
The financial sustainability of SOCs was the order of the day
in the period under review. Funding for the SOCs emerged
as one of the major challenges, with the roll-out of the build
programme and grounding of airlines being on the spotlight.
Eskom generation performance has been poor. As at 31
March 2020, Energy Availability Factor (EAF) has deteriorated
to 66.65% compared to 69.95% recorded for the period
ended March 2019. Deterioration in EAF has resulted in
Eskom implementing stage 6 load shedding for the first time
in December 2019. The deterioration in the EAF was mainly
due to increase in plant break downs (Unplanned Capability
Loss Factor). The Unplanned Capability Loss Factor (UCLF)
increased to 22.97% from 18.31% from the prior year. Poor
maintenance philosophy and aging poor station (average
38 years) contributed to high UCLF. Poor performance
of Medupi and Kusile units also contributed to low EAF.
Eskom is currently resolving the plant defects problems
at Medupi and Kusile power stations. Notwithstanding the
satisfactory operational performance in the Transmission and
Distribution Divisions in the period under review, risks also
exist in the Transmission and Distribution environments. To
effectively mitigate against these risks and ensure sustained
improvement, Eskom has during the 2019/20 financial year
undertaken a review to define improvement focus areas.
These areas include initiatives for replacement of assets in
poor condition, system expansion for growth and reliability,
security upgrades and improvement actions for leading risk
indicators. The escalating Municipal arrears debt remains a
great threat to Eskom sustainability. Municipal arrears debt
reached an amount of R28.04 billion in March 2020, an
increase of R8.2 billion over the past 12 months.

PUBLIC ENTERPRISES I Annual Report 2019/2020
21
streams. The options to address the entity’s sustainability
going forward have been proposed and the assessment of
the optimal option, including consultations with relevant
stakeholders, is currently underway.
2.2 Service Delivery Improvement Plan
The Department’s mandate does not directly provide services
directly to the citizens. However, its function has a direct
influence on the SOCs under the DPE portfolio. These SOCs
play a pivotal role in the country’s critical economic sectors.
The entities’ sustainability is required to work in the best
interest of the public to achieve the developmental goals of
the Government.
2.3 Organisational Environment
The DPE’s shareholder oversight role has come under
scrutiny, particularly the corporate governance practices,
financial and operational monitoring of the SOCs, supported
by various oversight instruments. The existing DPE oversight
instruments and methodology were proven to be ineffective
to curtail the challenges within the SOCs that crippled
their ability to be both financially and operationally viable.
The operational effectiveness of the SOC is at the core of a
thriving and profitable business. It is important therefore
to strengthen both the SOC and DPE systems, policies,
processes, and practices that are equivalent to their industry
peers. The delivery system of the Department will be
improved and appropriate expertise will be consulted to
augment the Department’s capacity.
The State Owned Enterprises (SOE) are currently experiencing
a number of challenges, including governance, policy
and regulatory, financial and operational issues. Having
undertaken a comprehensive review of the SOEs across all
spheres of Government, the Presidential Review Committee
(PRC) on SOEs made a number of recommendations for
strengthening the role of SOEs and ensuring that, whilst
remaining financially viable, they respond to a clearly
defined public mandate. These recommendations included
a proposal that Government enact a single overarching law
(a so-called “SOE Act”) governing all state-owned entities.
In supporting the SOCs’ sustainability outcome, transparency
in terms of reliable and constructive information to
drive accountability will be key to promote the desired
performance of the SOCs. The SOCs’ institutional stability is
therefore the key factor to success.
Government’s financial support to Eskom per year for the
next 10 years was pronounced by Minister of Finance during
the 2019 Budget Speech. The funds were further accelerated
through the Special Appropriation Bill and an amount of R59
billion was allocated for the 2019/20 and 2020/21 financial
years, with the amount split into R26 billion and R33 billion
for the respective financial years. The additional financial
support was to assist Eskom to service its debt obligations.
SAA and SA Express have been relying on debt to fund their
operations, which have not been sustainable. As a result, the
airlines have experienced significant financial challenges
since 2011/12 resulting in their current poor financial
performance and continued to operate at a loss which
posed a major concern on the sustainability of the airlines.
As a result, both South African Airways and SA Express were
placed under business rescue on 6 December 2019 and 6
February 2020 respectively to facilitate the rehabilitation of
the financially distressed airlines.
The performance of the sea ports continued to be below
satisfactory level with key measures not being realised across
the three strategic container terminals (i.e. Durban, Cape
Town and Ngqura). Port equipment remained a critical
bottleneck in improving the efficiency of terminal operations
and berth productivity levels were unsatisfactory, resulting in
long turnaround times for vessels and service or productivity
levels across the container system below expected levels.
The aptitude of Transnet to procure replacement parts to
maintain its ports and rail equipment including rolling stock
will require clear cut long-term localisation strategy (Demand
Plan). The strategy will address the maintenance backlogs and
other efficiency challenges that are persistently contributing
to the poor performance of the national freight systems (in
particular rail and ports) and will also identify initiatives to
improve the system’s future desired performance.
Over the years, SAFCOL continued to manage its assets in a
sustainable manner by ensuring that both its plantations and
sawmill are certified in terms of Forestry Stewardship Council
(FSC). Whereas SAFCOL’s focus has been on optimal value
creation, there is a need to improve operational efficiencies
through investment into new technologies to create higher
demand for its products and therefore attract new markets.
A development of an implementable strategy is essential for
SAFCOL to compete in new markets that will improve the
company’s revenue streams.
The year under review was also marked by Alexkor’s liquidity
challenges due to lack of sustainable revenue generating

22
In June 2020, President Cyril Ramaphosa appointed members to the Presidential State-Owned Enterprises Council (PSEC) to strengthen the framework governing SOEs. Among its priorities, the Council’s mandate is to develop an overarching Act governing SOEs and determine an appropriate Government Shareholder Ownership Model. The Department as a shareholder representative for Government with oversight responsibility for SOEs will provide secretariat support to PSEC.
The financial position of Alexkor deteriorated significantly over the period, which required a change of the current operating model of the entity. Alexkor depends on the proceeds from the Joint Venture Diamond Operations and over the past three years the operations experienced a number of challenges resulting in operating losses. The Department is exploring future options for the two entities to determine the optimal operating structure and overall
strategic role.
Over the years, Denel has been relying on Government
Guarantees which in turn increased the company’s debt
burden of the capital structure. The turnaround strategy
was developed to address Denel’s business model,
operational efficiency and liquidity issues in order to return
to sustainability performance. However, the implementation
of the strategy has been largely impeded by the ongoing
liquidity challenges and the entity has been unable to
raise capital to resuscitate the operations. Although Denel
continued to raise its order intake, the strength of its balance
sheet remains a challenge.
2.4 Key Policy Developments and Legislative Changes
None.
3. STRATEGIC OUTCOME ORIENTED GOALS
The SOCs under the Department’s portfolio contribute to a
number of outcomes including improving the productivity
of the economy, accelerating investment, promoting
industrialisation and advanced manufacturing and
uplifting the communities in which these SOCs operate.
The Department, through its oversight function, ensures that
the SOCs’ investments and operational activities contribute
to these outcomes.
During the year under review, the Department developed
the Board Evaluation Framework (“the Framework”) with
the intention to drive continuous improvement in Board
effectiveness to achieve governance outcomes, strategic
organisational outcomes and impacts. In the context of
revenue generating SOCs that need to balance the dual
mandate of being self-sufficient and commercially viable,
while delivering on developmental/social priorities for
the public good, an effective Board needs to be able
to demonstrate how the extent of achievement of the
governance outcomes translates into SOC value creation.
Therefore, Board effectiveness is about effective strategic
leadership, effective oversight and accountability for
performance, and effective management of board structures
and operations, delegations, stakeholder relationships and
ethical leadership. These outcomes are linked to the extent
of achievement of SOC value creation.
The Department is cognisant that the Framework is only
one part of the interventions to a more holistic approach to
improve oversight and accountability. There are a number
of corresponding enabling processes with potential impact
to successfully implement the Framework. This includes
the requirement for an extensive parallel review of the
Department’s oversight tools, such as the Memoranda of
Incorporation (MOI) and the methodology for compacting on
strategic key performance areas. The implementation of the
Framework will continue in the 2020/21 financial year, with
the anticipation that board effectiveness will be measured in
line with the minimum standards of the Framework.
ESKOM
The Department successfully published a Special Paper
on Eskom detailing the road map for the separation and
unbundling of the entity. This was in-line with the President’s
announcement that Eskom will be unbundled into three
separate companies under Eskom Holdings to deal with the
lack of transparency and accountability currently found in
the vertically integrated monopolistic structure. Eskom has,
to date, achieved functional unbundling (Divisionalisation)
milestones and timelines as prescribed in the special
paper, it is envisaged that the legal unbundling will be fully
implemented by December 2022, with the Transmission entity
fully established by December 2021. However, the dates and

PUBLIC ENTERPRISES I Annual Report 2019/2020
23
milestones have interdependencies to the policy, regulation
and market rules that the Government is still to outline and
develop. Operationally, the Department continues to engage
Eskom on its Generation Recovery Nine-point plan to restore
the integrity of plant and avert the supply constraints.
Medupi Power Station is almost complete. Medupi’s last
unit is expected to be in commercial operation by the end
of March 2021. The focus on Medupi will be on improving
plant performance through plant defects correction. Already
Medupi unit 3 has been corrected and it has been performing
well. Construction at Kusile Power Station is progressing well.
One unit at Kusile has also been contributing 800MW to the
grid. Eskom is planning to commercialise two units by 31
March 2021. Eskom will be applying lessons learned from
Medupi in order to improve plant performance and latent
defects at Kusile Power Station.
TRANSNET
The levels of economic growth were lower than expected
during the year under review which presented unique
challenges for SOCs, in particular Transnet. Nonetheless,
the entity managed to achieve certain levels of operational
sustainability that laid solid support in placing the economy
on a recovery trajectory.
The 2014-2019 MTSF set targets through the Transnet Freight
Rail (TFR), to move rail addressable volumes from roads by
increasing tonnage moved on rail from 207 to 330 mtpa by
2019. From 2014/15 to the 2016/17 financial year, Transnet
moved 225mpta, 224mpta and 219mpta respectively against
the 330mpta target. Over the three years, the volumes moved
by rail declined. In the 2017/18 financial year, Transnet moved
a total of 226mpta, which was 32% lower than the 330 MTSF
target. Subsequently, in the 2018/19 financial year, Transnet
railed only 215mpta, which was 38% lower than the MTSF
target. The lower performance was mainly as a result of the
negative Growth Domestic Product (GDP) growth made up
of negative contribution from the mining, agriculture and
manufacturing sectors, and low volume commitments from
clients. Despite the unfavourable economic conditions that
have impeded the desired domestic economic growth, TFR
intends to improve its reliability in terms of services rendered,
efficiencies and predictability of the services and cost
effective services to its customers.
4. PERFORMANCE INFORMATION BY PROGRAMME4.1 PROGRAMME 1 – ADMINISTRATION AND
CORPORATE MANAGEMENT
The programme includes the Ministry, the Office of the
Director-General and Support Services. The programme
is currently made up of the following sub-programmes:
Ministry; Management; Corporate Services; Chief Financial
Officer; Human Resources; Communications; Strategic
Planning, Monitoring and Evaluation; Internal Audit and
Office Accommodation.
Sub-programmes and strategic objectives for Corporate Services:
� Security and Facilities Management
Provides a safe and secure environment and internal
administration and facilities services to internal customers.
� Information Management and Technology
Provides information technology services and applications as strategic tools for business enablement, coupled with comprehensive records management, knowledge management, library and information services.
� Office of the Chief Financial Officer
Provides effective and efficient financial management services to ensure compliance with various legislation, including the Public Finance Management Act, 1999 (PFMA Act No 1 of 1999) as amended and Treasury Regulations.
� Human Resources
Assists line management to implement operational excellence and develop the human capital potential in the Department.
� Communications
Repositions the DPE as a strong shareholder Department; makes the DPE brand relevant and meaningful to ordinary South Africans; provides impactful media relations and media communication; and improves employee engagement.
� Strategic Planning, Monitoring and Evaluation
Coordinates, manages and oversees the outcomes-based performance reporting of the Department; implements performance monitoring and evaluation processes for individual programmes and business units as a mechanism for measuring delivery of our strategic objectives; and reports to various stakeholders.

24
� Internal Audit
Provides independent and objective assurance and
consulting, internal audit services to add value and improve
the Department’s operations; and assists the Department to
accomplish its objectives by bringing a systematic, disciplined
approach to evaluate and improve the effectiveness of risk
management, control and governance processes.
Performance outputs to achieve the strategic objectives
The programme had two targets for the financial year and one target was achieved. The details of the progress made are provided
in the table below:
Programme 1: Administration and Corporate Management
Strategic objectives Actual achievement 2018/19
Planned target 2019/20
Actual achievement 2019/20
Deviation from planned target to actual achievement for 2019/20
Comment on deviations
Promote the development of a strong shareholder
Shareholder Management Policy developed, but was not submitted to Cabinet
Green Paper for the SOE Bill developed
Not achieved
Green Paper for the SOE Bill not developed
The PSEC has been mandated to develop the overarching Act governing the SOEs
None
Promote alignment and efficiency across institutional model
22 training interventions provided in line with the Workplace Skills Plan (WSP)
20 training interventions provided (WSP)
Achieved
42 training interventions provided
There were additional training interventions required
None
Performance indicators
Programme 1: Administration and Corporate Management
Performance indicator
Actual achievement 2018/19
Planned target 2019/20
Actual achievement 2019/20
Deviation from planned target to actual achievement for 2019/20
Comment on deviations
Government Shareholder Management Bill adopted into law by 2020/21
Shareholder Management Policy developed, but was not submitted to Cabinet
Green Paper for the SOE Bill developed
Not achieved
Green Paper for the SOE Bill not developed
The PSEC has been mandated to develop the overarching Act governing the SOEs
None
Number of training interventions provided
22 training interventions provided in line with the Workplace Skills Plan (WSP)
20 training interventions provided (WSP)
Achieved
42 training interventions provided
There were additional training interventions required
None
Strategy to overcome areas of underperformance
The PSEC members were appointed by the President to
support the government’s reposition of the SOEs and the
Council will also be responsible for the development of the
SOE Bill.
Changes to planned targets
There were no changes to the planned targets during the
financial year.
Linking performance with budgets
Expenditure on the programme amounts to R149.1 million or 91.4% of the total budget of R163.1 million in 2019/20,
while expenditure for the 2018/19 financial year totalled
R136 million or 89.5% of the total budget of R151.9 million.
The primary cost drivers under Goods and Services include
Travel and Subsistence, Operating Lease, Property Payments,
Computer Services and Audit Fees.

PUBLIC ENTERPRISES I Annual Report 2019/2020
25
Programme expenditure
Programme: Administration
2019/20 2018/19
Final appropriation
Actual expenditure
(Over)/Under expenditure
Final appropriation
Actual expenditure
(Over)/Under expenditure
Ministry 42 115 39 367 2 748 29 052 22 265 6 786
Management 11 466 10 962 504 14 197 11 894 2 303
Communications 31 817 28 864 2 953 36 803 33 627 3 176
Chief Financial Officer 21 193 20 784 409 17 649 17 166 483
Human Resources 29 805 24 355 5 450 29 124 27 547 1 577
Internal Audit 7 338 5 539 1 799 4 624 3 586 1 038
Corporate Services 4 050 3 870 180 3 799 3 218 581
Office Accommodation 15 337 15 335 2 16 731 16 728 3
Total 163 121 149 077 14 044 151 979 136 031 15 948
4.2 PROGRAMME 2 – SOC GOVERNANCE ASSURANCE AND PERFORMANCE
• Financial Assessment and Investment Support analyses
SOCs’ capital planning, operational performance, funding
of capital programmes and proposed restructuring
proposals; and advises on appropriate action.
Strategic objectives
Ensure effective shareholder oversight of SOCs by:
• Providing governance and legal systems.
• Developing and maintaining shareholder risk profiles and
mitigating strategies for Government’s SOCs.
• Monitoring, evaluating and reporting on the financial
and non-financial performance of SOCs and proposing
intervention measures when required.
Purpose of the programme:
To provide and enforce SOCs’ governance, legal assurance,
financial and non-financial performance monitoring,
evaluation and reporting systems, in support of the
shareholder, to ensure alignment with the government’s
priorities.
Sub-programmes and strategic objectives:
• Management comprises the office of the Deputy
Director-General, which provides strategic leadership and
management of the programmes’ personnel.
• Legal provides external legal services and support,
including transaction and contract management support
to sector teams and the commercial activities of SOCs
within their portfolio.
• Governance develops, monitors and advises on legislative,
corporate governance and shareholder management
systems for the Department and SOCs in its portfolio.
The sub-programme develops and implements risk and
compliance management guidelines and systems for
shareholder risk.

26
Detailed information on the two sub-programmes is as follows:
4.2.1 Sub-programme: Governance, Legal Assurance, Risk Profiling and Mitigation
Performance outputs to achieve the strategic objectives
The sub-programme had four targets for the financial year and all targets were achieved. Details of the progress made are provided
in the table below:
Sub-programme: Governance, Legal Assurance, Risk Profiling and Mitigation
Strategic objective Actual achievement 2018/19
Planned target 2019/20
Actual achievement 2019/20
Deviation from planned target to actual achievement for 2019
Comment on deviations
Promote the development of a strong shareholder
Five existing Boards reviewed and five new Boards appointed
Board performance evaluation framework developed
Achieved
Board performance evaluation framework was developed
None None
None Report on monitoring SOC compliance with the norms and standards on MOIs produced
Achieved
Report on monitoring SOC compliance with the norms and standards on MOIs was produced
None None
Shareholder Anti-Fraud and Corruption Hotline established and maintained
80% Achieved
87,5%
The minimum performance standard of 80% was informed by the baseline number of reports that was registered in the 2018/19 financial year and the uncertainty around the target
None
Report on review of governance and risk practices produced
Draft SOC Risk Integrity Management Framework developed
Achieved
Draft SOC Risk Integrity Management Framework was developed
None None
Sub-programme performance indicators
Sub-programme: Governance, Legal Assurance, Risk Profiling and Mitigation
Performance indicators
Actual achievement 2018/19
Planned target 2019/20
Actual achievement 2019/20
Deviation from planned target to actual achievement for 2019/20
Comment on deviations
Board Performance Evaluation Framework developed
Five existing Boards reviewed and five new Boards appointed
Board Performance Evaluation Framework developed
Achieved
Board Performance Evaluation Framework was developed
None None
Report on monitoring of SOC compliance with the norms and standards on MOIs
None Report on monitoring SOC compliance with the norms and standards on MOIs produced
Achieved
Report on monitoring SOC compliance with the norms and standards on MOIs was produced
None None

PUBLIC ENTERPRISES I Annual Report 2019/2020
27
Sub-programme: Governance, Legal Assurance, Risk Profiling and Mitigation
Performance indicators
Actual achievement 2018/19
Planned target 2019/20
Actual achievement 2019/20
Deviation from planned target to actual achievement for 2019/20
Comment on deviations
Percentage of Anti-Fraud and Corruption Hotline incidents reports forwarded to the relevant authorities
Shareholder Anti-Fraud and Corruption Hotline established and maintained
80% Achieved
87,5%
The minimum performance standard of 80% was informed by the baseline number of reports that was registered in the 2018/19 financial year and the uncertainty around the target
None
Develop SOC Risk Integrity Management Framework
Report on review of governance and risk practices produced
Draft SOC Risk Integrity Management Framework developed
Achieved
Draft SOC Risk Integrity Management Framework was developed
None None
Strategy to overcome areas of underperformance
There were no deviations from the planned targets.
Changes to Planned Targets
There were no changes to the planned targets during the financial year.
1.1.2 Sub-programme: Financial Assessment and Investment Support
Performance outputs to achieve the strategic objectives
The sub-programme had three targets for the financial year and all targets were achieved. Details of the progress made are
provided in the table below:
Sub-programme: Financial Assessment and Investment Support
Strategic Objective Actual achievement 2018/19
Planned target 2019/20
Actual achievement 2019/20
Deviation from planned target to actual achievement for 2019/20
Comment on deviations
Promote independent financial sustainability of SOCs
27 SOCs’ financial review reports produced
28 Achieved
28
None None
7 SOCs’ corporate plans reviewed
7 Achieved
7
None None
None 2 Achieved
2
None None

28
Sub-programme Performance Indicators
Sub-programme: Financial Assessment and Investment Support
Performance indicators Actual achievement 2018/19
Planned target 2019/20
Actual achievement 2019/20
Deviation from planned target to actual achievement for 2019/20
Comment on deviations
Number of SOC financial review reports assessed
27 SOCs’ financial review reports produced
28 Achieved
28
None None
Number of SOC corporate plans reviewed
7 SOCs’ corporate plans reviewed
7 Achieved
7
None None
Number of consolidated progress reports on SOCs’ audit findings
None 2 Achieved
2
None None
Strategy to overcome areas of underperformance
There were no deviations from the planned targets.
Changes to Planned Targets
There were no changes to the planned targets during the financial year.
Linking performance with budgets
Expenditure on the programme amounted to R 36.9 million in the 2019/20 financial year, as compared to R 33. 5 million in the
2018/19 financial year. The spending on goods and services was mainly due to payments made to the State Attorney in respect
of litigation matters.
Programme Expenditure
Sub-Programme Legal and Governance
2019/20 2018/19
Final appropriation
Actual expenditure
(Over)/Under expenditure
Final appropriation
Actual expenditure
(Over)/Under expenditure
R’000 R’000 R’000 R’000 R’000 R’000
Management 2 989 1 978 1 011 2 989 2 739 250
Legal 13 714 11 104 2 610 14 830 12 066 2 764
Governance 12 451 11 627 824 9 565 8 782 783
Financial Assessment and Investment Support
12 459 12 172 287 11 700 9 903 1 797
Total 41 613 36 880 4 733 39 084 33 490 5 594
4.3. PROGRAMME 3 – BUSINESS ENHANCEMENT AND INDUSTRIALISATION
Purpose of the programme
To provide sector oversight to enhance the business of SOCs by advancing industrialisation, transformation, intergovernmental relations and international collaboration services, and support the Shareholder to strategically position and enhance the operations of SOCs.
The sub-programmes in this programme are as follows:
Business Enhancement Services – develops and co- ordinates the implementation of SOCs’ strategies to leverage localisation programmes. Provides intergovernmental coordination and support to programmes and SOCs in relation to economic development programmes, as agreed with provincial and local governments. It maintains a register of commitments made by SOCs and lobbies for the implementation of special programmes focusing on skills development, transformation and the youth.
Energy Resources – exercises shareholder oversight over
Eskom, Alexkor and SAFCOL.

PUBLIC ENTERPRISES I Annual Report 2019/2020
29
• Conducting reviews, research and modelling of pipelines and new business enhancement opportunities within the SOCs.
• Assessing operations of SOCs and developing mitigating instruments in conjunction with policy departments, regulatory bodies and industry.
• Conducting research, modelling job creation and transforming instruments for SOCs to inter alia inform
compact alignment imperatives.
Performance outputs to achieve the strategic objectives
The sub-programme had six targets for the financial year and
four targets were achieved. The details of the progress made
are provided in the table below:
Research and Economic Modelling – conducts cost
benefit analysis reviews on business enhancement
and transformation initiatives and develops economic
sustainability models for proposed work packages and
projects.
Transport and Defence – exercises shareholder oversight
over Transnet, South African Express, South African Airways
and Denel.
4.3.1 Sub-programme: Business Enhancement and Industrialisation
Programme Strategic Objectives
To contribute to the enhancement of the performance of SOCs on an ongoing basis by:
Sub-programme: Business Enhancement and Industrialisation
Strategic objectives
Actual achievement 2018/19
Planned target 2019/20
Actual achievement 2019/20
Deviation from planned target to actual achievement for 2019/20
Comment on deviations
Accelerate development of skills to support the needs of the economy
Four quarterly reports on SOCs’ contribution to the development of scarce and critical skills
Four (4) Quarterly monitoring reports on SOCs’ contribution to the skills development produced
Achieved
Four (4) quarterly monitoring reports on SOCs’ contribution to the skills development produced
None None
Accelerate transformation of the South African economy
Annual Report on CSI strategic and high impact projects implemented
Four (4) quarterly reports on the monitoring of SOCs’ CSI programmes
Achieved
Four (4) quarterly reports on the monitoring of SOCs’ CSI programmes completed
None None
None Report on social impact assessment of SOCs’ CSI programme produced
Not achieved
Report on social impact assessment of SOCs’ CSI programmes not produced
Report was not concluded due to delayed conclusion of the bid evaluation process
The study will be completed in the 2020/21 financial year
Position SOCs to support re-industrialisation of the South African economy
Development of the Industrialisation Strategic Framework
Assessment of SOCs’ quarterly reports on the implementation of the Localisation Strategic Framework
Not achieved
Assessment of SOCs’ quarterly reports on the implementation of the Localisation Strategic Framework was not completed
Delay in finalising the quarterly monitoring report
The report will be finalised in the 2020/21 financial year
None DPE Africa Strategy reviewed
Achieved
DPE Africa Strategy was reviewed
None None
SOC environmental research conducted
DPE EIP produced Achieved
DPE EIP was produced
None None

30
Sub-programme performance indicators
Sub-programme: Business Enhancement and Industrialisation
Performance indicators
Actual achievement 2018/19
Planned target 2019/20
Actual achievement 2019/20
Deviation from planned target to actual achievement for 2019/20
Comment on deviations
Monitoring reports on SOCs’ contribution to the development of scarce and critical skills produced
Four quarterly reports on SOCs’ contribution to the development of scarce and critical skills
Four (4) quarterly monitoring reports on SOCs’ contribution to the skills development produced
Achieved
Four (4) quarterly monitoring reports on SOCs’ contribution to the skills development was produced
None None
Monitoring of SOCs’ CSI programmes
Annual Report on CSI strategic and high impact projects implemented
Four (4) quarterly reports on the monitoring of SOCs’ CSI programmes
Achieved
Four (4) quarterly reports on the monitoring of SOCs’ CSI programmes completed
None None
Report on social impact assessment of SOCs’ CSI programmes
None Report on social impact assessment of SOCs’ CSI programme produced
Not achieved
Report on social impact assessment of SOCs’ CSI programmes not produced
Report was not concluded due to delayed conclusion of the bid evaluation process
The study will be completed in the 2020/21 financial year
Monitor Implementation of the Localisation Strategic Framework
Development of the Industrialisation Strategic Framework
Assessment of SOCs’ quarterly reports on the implementation of the Localisation Strategic Framework
Not achieved
Assessment of SOCs’ quarterly reports on the implementation of the Localisation Strategic Framework was not completed
Delay in finalising the quarterly monitoring report
The report will be finalised in the 2020/21 financial year
Review DPE’s Africa Strategy
New Indicator DPE’s Africa Strategy Reviewed
Achieved
DPE’s Africa Strategy reviewed
None None
Develop Environmental Implementation Plan (EIP) for DPE
SOC environmental research conducted
DPE EIP produced Achieved
DPE EIP was produced
None None
Strategy to overcome areas of under performance
The Department has put in place actions to catch up on the
non-achieved targets, in particular the impact assessment
of SOCs’ CSI programme and assessment of SOCs’ quarterly
reports on the implementation of the Localisation Strategic
Framework.
Changes to planned targets
There were no changes to the planned targets during the
financial year.
4.3.2 Sub-programme: Energy and Resources
The sub-programme is responsible for the following SOCs:
Eskom SOC Limited
Supports the security of supply by:
• Examining Eskom maintenance plans, operational
practices, electricity generation and distribution
efficiency, and its reserve margin on an ongoing basis.
• Ensuring that Eskom supplies electricity by monitoring,
evaluating and engaging Eskom on system security and
the new Build Programme to alleviate constraints on an
ongoing basis.
• Facilitates engagement between Eskom and other
spheres of government to address municipal debt on an
ongoing basis.

PUBLIC ENTERPRISES I Annual Report 2019/2020
31
• Monitors the roll out of the capital investment programme
to ensure that it is delivered on time, is of appropriate
quality and within budget on an ongoing basis.
Alexkor SOC Limited
• Ensure increased diamond production and promote the
financial stability of the joint venture by monitoring the
implementation of Alexkor’s strategy to promote financial
sustainability and monitoring the pooling and sharing
joint venture turnaround strategy, on a quarterly basis.
• Ensure collaboration and alignment of the two SOCs,
to provide a clear indication to market by developing a
collaborative model with the African Exploration Mining
and Finance Corporation over the medium-term.
• Contribute to developing sustainable economic
activities linked to the agricultural sector by continuously
supporting and coordinating the joint efforts of the DPE
with the Department of Mineral Resources (DMR) and
the Department of Rural Development and Land Reform
(DRDLR) to stabilise the Richtersveld region and make use
of revenues.
SAFCOL SOC Limited
• Oversee the implementation of the land restitution
strategy for claims over the Komatiland Forests Land
Claims Settlement Model, to ensure meaningful benefits
to the successful land claimants over the medium-term.
• Oversee the implementation of SAFCOL’s corporate
strategy over the medium-term.
• Engage with DRDLR, the Department of Agriculture,
Forestry and Fisheries (DAFF), and the Department of
Trade and Industry (DTI) to ensure the warehousing of the
shares held by SAFCOL and shares in the four privatised
forestry companies.
• Reduce reliance on the sawlog market by supporting
the development of the new business strategy over the
medium-term.
Performance outputs to achieve the strategic objectives
The sub-programme had seven targets for the financial year
and five targets were achieved. Details of the progress made
are provided in the table below:
Sub-programme: Energy and Resources
Strategic objectives Actual achievement 2018/19
Planned target 2019/20
Actual achievement 2019/20
Deviation from planned target to actual achievement for 2019/20
Comment on deviations
Promote commercial viability of SOCs’ operations
Three (3) Shareholder Compacts (2019/20) (Eskom, Alexkor and SAFCOL)
Three (3) Shareholder Compacts (2020/21) signed (Eskom, Alexkor and SAFCOL)
Not achieved
3 Shareholder Compacts not signed
Assumptions relating to some compact targets had to be reviewed as a result of the SOCs’ financial constraints
The 2020/21 Shareholder Compact will be finalised during the 2020/21 financial year
Review report of Eskom’s generation fleet and life of plants
4 Achieved
4
None None
Draft report on Eskom’s future operating model reviewed
4 Achieved
4
None None
None MoA with State Organ/s into the review of the State Forestry Assets developed
Achieved
MoA with State Organs on the review of State Forestry Assets was developed
None None

32
Sub-programme: Energy and Resources
Strategic objectives Actual achievement 2018/19
Planned target 2019/20
Actual achievement 2019/20
Deviation from planned target to actual achievement for 2019/20
Comment on deviations
Study on State-Owned Mining Assets to propose an optimum structure completed
4 Not achieved
0
There was a change of approach with regard to the proposed optimal shareholding structure arising from a drastic decline of the company’s financial position
The implementation of the shareholding structure has been deferred to the 2020/21 financial year
Accelerate capital project delivery
Four (4) quarterly assessment reports on the delivery of Eskom’s Build Programme (Medupi & Kusile)
Four (4) Assessment reports on the delivery of Eskom’s Build Programme (Medupi, Kusile and Power Delivery Projects)
Achieved
Four (4) Assessment reports on the delivery of Eskom’s Build Programme (Medupi, Kusile and Power Delivery Projects) completed
None None
Assessment report on the electricity generation reserve margin to evaluate whether 19% is sustained and produced
Four (4) Assessment reports on the electricity generation reserve margin to evaluate whether 19% is sustained
Achieved
Four (4) Assessment reports on the electricity generation reserve margin to evaluate whether 19% is sustained completed
None None
Sub-programme performance indicators
Sub-programme: Energy and Resources
Performance indicators
Actual achievement 2018/19
Planned target 2019/20
Actual achievement 2019/20
Deviation from planned target to actual achievement for 2019/20
Comment on deviations
Number of Shareholder Compacts signed (Eskom, Alexkor and SAFCOL)
3 Shareholder Compacts (2020/21) signed (Eskom, Alexkor and SAFCOL)
3 Shareholder Compacts (2020/21) signed (Eskom, Alexkor and SAFCOL)
Not achieved
3 Shareholder Compacts were not signed
Assumptions relating to some compact targets had to be reviewed as a result of the SOCs’ financial constraints
The 2020/21 Shareholder Compact will be finalised during the 1st quarter of the 2020/21 financial year
Review report on performance of Eskom’s fleet produced
Review report of Eskom’s generation fleet and life of plants
4 Achieved
4
None None
Report on the implementation of Eskom’s Turnaround Plan
Draft report on Eskom’s future operating model reviewed
4 Achieved
4
None None

PUBLIC ENTERPRISES I Annual Report 2019/2020
33
Sub-programme: Energy and Resources
Performance indicators
Actual achievement 2018/19
Planned target 2019/20
Actual achievement 2019/20
Deviation from planned target to actual achievement for 2019/20
Comment on deviations
Develop MoA with State Organ/s on the review of State Forestry Assets
None MoA with State Organ/s on the review of State Forestry Assets developed
Achieved
MoA with State Organs on the review of State Forestry Assets was developed
None None
Reports on the implementation of Alexkor’s proposed shareholding optimal Structure
Study on State-Owned Mining Assets to propose an optimum structure completed
4 Not achieved
0
There was a change of approach with regard to the proposed optimal shareholding structure arising from a drastic decline of the company’s financial position
The implementation of the shareholding structure has been deferred to the 2020/21 financial year
Number of progress reports on the delivery of Eskom’s Build Programme (Medupi, Kusile and Power Delivery Projects)
Four (4) quarterly assessment reports on the delivery of Eskom’s Build Programme (Medupi & Kusile)
Four (4) assessment reports on the delivery of Eskom’s Build Programme (Medupi, Kusile and Power Delivery Projects)
Achieved
Four (4) assessment reports on the delivery of Eskom’s Build Programme (Medupi, Kusile and Power Delivery Projects) completed
None None
Assessment report on the electricity generation reserve margin to evaluate whether 19% is sustained
Assessment report on the electricity generation reserve margin to evaluate whether 19% is sustained and produced
Four (4) assessment reports on the electricity generation reserve margin to evaluate whether 19% is sustained
Achieved
Four (4) assessment reports on the electricity generation reserve margin to evaluate whether 19% is sustained completed
None None
Strategy to overcome areas of underperformance
Due to Alexkor’s serious financial challenges experienced
during the year under review, the proposed shareholding
optimal structure was not implemented. Relevant
stakeholders including the Richtersveld Community will be
consulted on the proposed operating structure and Cabinet
approval will be sought.
The 2020/21 Shareholder Compacts were not concluded due
to the delayed process in finalising the 2019/20 Shareholder
Compacts. To date, the draft 2020/21 Shareholder Compacts
have been finalised and will be concluded in the first quarter
of the 2020/21 financial year.
Changes to planned targets
There were no changes to the planned targets during the
financial year.

34
4.3.3 Sub-programme: Transport and Defence
The sub-programme is responsible for the following SOCs:
• Transnet SOC Limited
• South African Express Airways SOC Limited
• South African Airways SOC Limited
• Denel SOC Limited
4.3.3.1 The sub-programme’s purpose is as follows:
Transnet SOC Limited
• Provides oversight on Transnet’s implementation of
the Market Demand Strategy (MDS) to optimise the
economic impact of infrastructure investment on the
economy by monitoring the roll-out of Transnet’s Capital
Expenditure Programme quarterly and annually, to assess
any significant deviations from corporate plans and
potential cost overruns and time delays on major capital
projects.
South African Express Airways SOC Limited and South African Airways SOC Limited
• Develops a strategic proposal for the optimal group
structure of the State owned airlines to assist in
rationalising the structures of these airlines as well as to
unify their operations.
• Facilitates the review of commercial arrangements as
and when required to support the financial position
of the company and ensure its long-term financial and
commercial sustainability.
Denel SOC Limited
• Oversees the development of a long-term growth
strategy to achieve financial stability and the growth of
manufacturing export products on an ongoing basis.
• Leverages off the company’s advances in manufacturing
capability through securing work packages in support
of the industrialisation drive aligned with the Industrial
Policy Action Plan (IPAP) over the medium-term.
• Ensures Denel’s ongoing sustainability by monitoring the
implementation of the multi-year turnaround plan over
the medium-term.
• Ensures proper balance between the need to develop
indigenous capabilities in response to national defence
equipment requirements and the need to cooperate and
collaborate with international armaments companies
in the context of high development costs and the
importance of having access to selected markets on an
ongoing basis.
4.3.3.2 Sub-programme objectives
• To promote commercial viability of SOCs’ operations.
4.3.3.3 Performance outputs to achieve the strategic objectives
The sub-programme had six targets for the financial year and three targets were achieved. Details of the progress made are
provided in the table below:
Sub-programme: Transport and Defence
Strategic objectives
Actual achievement 2018/19
Planned target 2019/20
Actual achievement 2019/20
Deviation from planned target to actual achievement for 2019/20
Comment on deviations
Promote commercial viability of SOCs’ operations
Four (4) Shareholder Compacts (2019/20) signed (Transnet, SA Express, SAA and Denel)
Four (4) Shareholder Compacts (2020/21) signed (Transnet, SA Express, SAA and Denel)
Not achieved
No Shareholder Compacts (2020/21) (Transnet, SA Express, SAA and Denel) were signed
Transnet Shareholder Compacts were not finalised due to delays in finalising the 2019/20 financial year.
Due to financial challenges Denel, SAA and SA Express were not finalised.
None
Report on implementation of Denel’s Restructuring Plan reviewed
4 Achieved
4
None None

PUBLIC ENTERPRISES I Annual Report 2019/2020
35
Sub-programme: Transport and Defence
Strategic objectives
Actual achievement 2018/19
Planned target 2019/20
Actual achievement 2019/20
Deviation from planned target to actual achievement for 2019/20
Comment on deviations
Assessed increase in tonnage moved on rail to 235 mtpa by 2019
Assess increase in tonnage moved on rail to 235 mtpa by 2019
Achieved
Increase in tonnage moved on rail to 235 mtpa by 2019 assessed
None None
Assessed improvement on operational performance of sea ports and inland terminals from 28 to 35 average GCM/H by 2019
Assess improvement on operational performance of sea ports and inland terminals from 28 to 35 average GCM/H by 2019
Achieved
Improvement of operational performance of sea ports and inland terminals from 28 to 35 average GCM/H by 2019 was assessed
None None
New indicator Report on implementation of SAA and SA Express Turnaround Plans completed
Not achieved
Report on implementation of SAA and SA Express Turnaround Plans was not completed
Both SAA and SA Express were put under business rescue
None
Report on implementation of aviation optimal group corporate structure produced
Report on the implementation of the approved optimal corporate structure for the State-owned airlines completed
Not achieved
Report on the implementation of the approved optimal Corporate structure for the State-Owned airlines was not completed
Both SAA and SA Express were put under business rescue
None
4.3.3.4 Sub-programme Performance Indicators
Sub-programme: Transport and Defence
Performance indicators
Actual achievement 2018/19
Planned target 2019/20
Actual achievement 2019/20
Deviation from planned target to actual achievement for 2019/20
Comment on deviations
Number of Shareholder Compacts signed (Transnet, SAA, SA Express and Denel)
Four (4) Shareholder Compacts (2019/20) signed (Transnet, SA Express, SAA and Denel)
Four (4) Shareholder Compacts (2020/21) signed (Transnet, SAA, SA Express and Denel)
Not achieved
Four (4) Shareholder Compacts (2020/21) signed (Transnet, SAA, SA Express and Denel) not signed
Transnet Shareholder Compacts were not finalised due to delays in finalising the 2019/20 financial year.
Due to financial challenges Denel, SAA and SA Express Shareholder Compacts were not finalised.
None
Report on the implementation of the Restructuring Plan for Denel
Report on the implementation of Denel’s Restructuring Plan reviewed
4 Achieved
4
None None

36
Sub-programme: Transport and Defence
Performance indicators
Actual achievement 2018/19
Planned target 2019/20
Actual achievement 2019/20
Deviation from planned target to actual achievement for 2019/20
Comment on deviations
Assess increase in tonnage moved on rail to 330 mtpa by 2019
Assessed increase in tonnage moved on rail to 330 mtpa by 2019
Assess increase in tonnage moved on rail to 235 mtpa by 2019
Achieved
Increase in tonnage moved on rail to 235 mtpa by 2019 assessed
None None
Assess improvement of operational performance of sea ports and inland terminals from 28 to 35 average GCM/H by 2019
Assessed improvement of operational performance of sea ports and inland terminals from 28 to 35 average GCM/H by 2019
Assess improvement of operational performance of sea ports and inland terminals from 28 to 35 average GCM/H by 2019
Achieved
Improvement of operational performance of sea ports and inland terminals from 28 to 35 average GCM/H by 2019 assessed
None None
Report on implementation of SAA and SA Express Turnaround Plans
New indicator Report on implementation of SAA and SA Express Turnaround Plans completed
Not achieved
Report on implementation of SAA and SA Express Turnaround Plans was not completed
Both SAA and SA Express were put under business rescue
Business Rescue Plan to map the way forward
Optimal Corporate Structure for the State-Owned airlines
Report on implementation of aviation Optimal Group Corporate Structure produced
Report on the implementation of the approved Optimal Corporate Structure for the State-Owned airlines completed
Not achieved
Report on the implementation of the approved Optimal Corporate Structure for the State-Owned airlines was not completed
Both SAA and SA Express were put under Business Rescue
Business Rescue Plan to map the way forward
4.3.3.5 Strategy to overcome areas of underperformance
The implementation of the turnaround plans was disrupted
by SAA being placed under voluntary business rescue on 6
December 2019 and SA Express being placed under business
rescue as a result of a court order on 6 February 2020.
In addition, the decision for consolidation and implementation
of the optimal corporate structure for the state-owned
airlines was not carried out due to the Business Rescue Plan
process (BRP) initiated within SAA.
Financial challenges experienced by SOCs have an effect
on the timely finalisation of the 2019/20 SHC which
further delayed the 2020/21 SHC negotiation process. The
Department will strengthen the development of the SHC
by initiating the negotiation process to commence in the
2020/21 financial year.
4.3.3.6 Changes to Planned Targets
The indicators that were addressing work around airlines
were not done as per the plans. These indicators are: “Report
on implementation of SAA and SA Express Turnaround
Plans” and “Optimal Corporate Structure for the state-owned
airlines”.
The reasons are that the airlines went under business rescue,
which meant that any plans regarding this work could not
be done. Subsequently, SA Express is facing liquidation now.
4.3.4 Sub-programme: Research and Economic Modelling
The sub-programme is responsible for the following:
• Economic modelling – Appropriate macroeconomic
modelling and research to enhance links between
industrial policy, macroeconomic policy and the role

PUBLIC ENTERPRISES I Annual Report 2019/2020
37
4.3.4.2 The objective of the Sub-programme is:
• To accelerate transformation of the South African
economy.
4.3.4.3 Performance outputs to achieve the strategic objectives
The sub-programme had two targets for the financial year
and all targets were achieved. The details of the progress
made are provided in the table below:
of SOCs in economic development. To conduct socio-
economic impact assessment as a result of SOCs’
economic activities.
• Research modelling – conduct topical research to
inform the development of policies and strategies.
4.3.4.1 Sub-programme purpose
• To conduct cost benefit analysis reviews of proposed
business enhancement and transformation initiatives.
• To develop economic sustainability models for proposed
work packages and projects.
Sub-programme: Research and Economic Modelling
Strategic objective Actual achievement 2018/19
Planned target 2019/20
Actual achievement 2019/20
Deviation from planned target to actual achievement for 2019/20
Comment on deviations
Accelerate transformation of the South African economy
One (1) Socio-Economic Impact Assessment of Transnet’s selected capital projects produced
Socio-Economic Impact Assessment Report of Eskom’s selected capital projects completed
Achieved
Socio-Economic Impact Assessment Report of Eskom’s selected capital projects completed
None None
Two macro-economic and industry-specific researches conducted
10 Achieved
10
None None
4.3.4.4 Sub-Programme Performance Indicators
Sub-programme: Research and Economic Modelling
Performance indicators
Actual achievement 2018/19
Planned target 2019/20
Actual achievement 2019/20
Deviation from planned target to actual achievement for 2019/20
Comment on deviations
Socio–Economic Impact Assessment
Reports of SOCs’ selected capital projects completed
One (1) Socio-Economic Impact Assessment of Transnet’s selected capital projects produced
Socio-Economic Impact Assessment Report of Eskom’s selected capital projects completed
Achieved
Socio-Economic Impact Assessment Report of Eskom’s projects was completed
None None
Number of industry-specific researches conducted
Two (2) macro-economic and industry-specific researches conduced
10 Achieved
10
None None
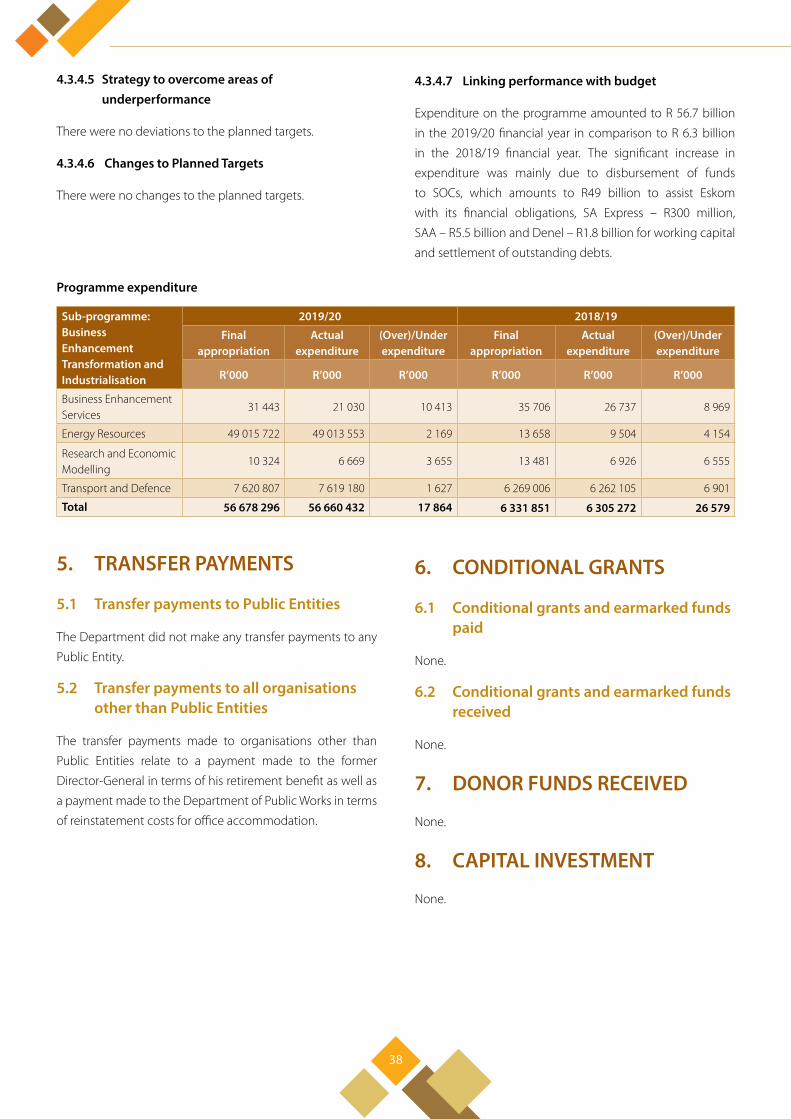
38
4.3.4.7 Linking performance with budget
Expenditure on the programme amounted to R 56.7 billion
in the 2019/20 financial year in comparison to R 6.3 billion
in the 2018/19 financial year. The significant increase in
expenditure was mainly due to disbursement of funds
to SOCs, which amounts to R49 billion to assist Eskom
with its financial obligations, SA Express – R300 million,
SAA – R5.5 billion and Denel – R1.8 billion for working capital
and settlement of outstanding debts.
4.3.4.5 Strategy to overcome areas of underperformance
There were no deviations to the planned targets.
4.3.4.6 Changes to Planned Targets
There were no changes to the planned targets.
Programme expenditure
Sub-programme: Business Enhancement Transformation and Industrialisation
2019/20 2018/19
Final appropriation
Actual expenditure
(Over)/Under expenditure
Final appropriation
Actual expenditure
(Over)/Under expenditure
R’000 R’000 R’000 R’000 R’000 R’000
Business Enhancement Services
31 443 21 030 10 413 35 706 26 737 8 969
Energy Resources 49 015 722 49 013 553 2 169 13 658 9 504 4 154
Research and Economic Modelling
10 324 6 669 3 655 13 481 6 926 6 555
Transport and Defence 7 620 807 7 619 180 1 627 6 269 006 6 262 105 6 901
Total 56 678 296 56 660 432 17 864 6 331 851 6 305 272 26 579
5. TRANSFER PAYMENTS
5.1 Transfer payments to Public Entities
The Department did not make any transfer payments to any
Public Entity.
5.2 Transfer payments to all organisations other than Public Entities
The transfer payments made to organisations other than
Public Entities relate to a payment made to the former
Director-General in terms of his retirement benefit as well as
a payment made to the Department of Public Works in terms
of reinstatement costs for office accommodation.
6. CONDITIONAL GRANTS
6.1 Conditional grants and earmarked funds paid
None.
6.2 Conditional grants and earmarked funds received
None.
7. DONOR FUNDS RECEIVED
None.
8. CAPITAL INVESTMENT
None.

PART C GOVERNANCE

40
1. INTRODUCTION
how risks should be consistently managed across the
organisation. The Framework was reviewed in line with the
need to ensure alignment with the department’s operations,
improvements recommended by assurance providers
and the need to ensure alignment with best practice. The
following risk governance documents were also reviewed
to ensure that the department maintains a system of risk
management that is consistent with prescripts applicable in
the government: The Risk Management Policy and the Risk
Appetite Statement.
The aforementioned governance guidelines are critical in
ensuring that a top-down risk management philosophy
within the Department is adopted and that all employees
manage risks within their span of control on a daily basis.
The Department will continue to design and implement
processes to improve the maturity of risk practices. In the
next financial year, the focus will be to utilise additional
resources provided to the Risk Management Unit to foster
a risk awareness culture, to strengthen the monitoring of
risk at business unit level and foster accountability in the
management of risk across the organisation.
The Department has established systems and governance
structures to oversee its processes to improve accountability.
These systems and structures are crucial in promoting good
governance within the Department and ensuring that the
Department complies with legislative requirements.
2. RISK MANAGEMENTRisk Management forms one of the key management tools
within the DPE. The risk management process was utilised
to identify potential threats and challenges in relation to the
predetermined objectives and Key Performance Indicators
(KPIs) for the period under review. The identified strategic
risks and operational risks were approved by the Executive
Committee (EXCO). The Audit and Risk Committee (ARC)
oversaw that management, the Risk Management Unit,
Strategic Planning, Monitoring and Evaluation (SPME) and
Internal Audit (IA) actively played their respective assurance
roles.
While monitoring and evaluation of risk occurred throughout
the year, the achievement of some KPIs was affected by risks
that emerged during the performance period; risks that were
out of the control of the Department and structural changes
in the administration of some SOCs. Additional information
on actual performance and reasons for deviation are set
under Programme Performance Information.
The Department maintains and implements a Risk
Management Framework which seeks to direct and guide
3. FRAUD AND CORRUPTIONThe DPE has adopted a zero tolerance on fraud and corruption.
The message is driven from the top to the rest of the
Department. The Department maintains a Fraud Prevention
Plan to respond to identified fraud risks. The Whistle-Blowing
Policy has been reviewed to ensure firm commitment against
fraud and corruption. Ongoing fraud and risk awareness have
been conducted to ensure that stakeholders are versed with
all mechanisms put in place to prevent, detect and respond
to incidents of fraud and corruption. Various measures are
maintained and implemented to protect the identity of
whistle blowers. Whistleblowing boxes have been placed in
secure areas and a Fraud and Corruption Hotline has been
maintained since its establishment and is independently
managed to encourage stakeholders to blow the whistle
on maladministration without the fear of reprisals. Some
matters reported through the hotline have been referred
to law enforcement agencies, while others are awaiting
decision on prosecution. The Department has the Ethics and
Expenditure Control Committee (EECC) and the ARC that
oversee the Department’s response to fraud risks and actual
incidents.
Additional human resource capacity was brought in to
bolster the Department’s overall efforts to respond to
incidents of maladministration concerning SOCs. In the
next financial year, work will continue to improve processes
to oversee and manage fraud risks within the Department
and across all SOCs. This will include the establishment of
a dedicated unit for fraud and corruption, enhancement of
governance arrangements concerning fraud risks, the review

PUBLIC ENTERPRISES I Annual Report 2019/2020
41
and enhancement of anti-fraud and corruption capacity in
the Department and across all SOCs.
The reported cases are captured in a register and
reported to EXCO and the Minister on a monthly basis,
including any progress made on investigations and where
recommendations where issued through forensic reports, to
make sure that such recommendations are implemented by
SOCs.
4. MINIMISING CONFLICT OF INTERESTThe Department monitors conflict of interest through
enforcement of annual disclosure of financial interest by
all relevant employees as required by the Public Service
Regulations (PSR). Officials are also required to request the
Minister’s approval to conduct remunerated work outside of
the public service. Employees are also regularly made aware
and reminded to disclose conflict of interest and to recuse
themselves from initiatives wherein they may be conflicted
in carrying out their responsibilities. The measures are also
adopted in the procurement of goods and services, especially
for officials who are appointed to the bid evaluation and bid
adjudication committees.
On the SOC front, the Department has constantly requested
SOCs through various engagements to highlight the need for
disclosure and to promote awareness relating to conflict of
interest. The Department is currently developing Norms and
Standards on managing and reporting conflict of interest as
part of the SOC Risk and Integrity Management Framework.
The work is planned to be completed in the 2020/21 financial
year.
The objective of the norms and standards is to foster across
all SOCs, the rigorous assessment and consistent disclosure
of conflict of interest relating to the leadership team,
employees of the organisation, service providers in high
value procurement initiatives and business partners (e.g.
strategic equity partners, agents and so forth).
5. CODE OF CONDUCTThe Department has implemented a focused training
programme aligned to the Public Service Code of Conduct
in the form of training, awareness and workshops designed
to address conflict resolution in the workplace paying
specific attention to harnessing and assisting officials with
best measures of understanding and resolving conflicts for
the benefit of both the officials and the organisation. The
training interventions also catered for one on one education
on financial disclosures and its implications to officials and
the government at large. During the year under review, one
formal disciplinary proceeding was invoked through the
application of the Disciplinary Code and Procedure of the
Public Service occasioned by acts of misconduct.
6. HEALTH SAFETY AND ENVIRONMENTAL ISSUESThe Organisation Health and Safety (OHS) Committee
was reviewed during the year under review, following the
implementation of the re-aligned structure, which resulted
in migration of some of the officials within the Department.
An induction session was offered to the newly appointed
OHS Committee members facilitated by the Department
of Employment and Labour. Subsequent to the induction,
all members attended the mandatory OHS training as
stipulated by the Act. The committee is fully functional and
has scheduled quarterly meetings to discuss and analyse
health and safety matters within the Department and make
recommendations to the Director-General.
The Department of Employment and Labour inspected
the building during the 2019/20 financial year and three
transgressions / findings were addressed and resolved within
the stipulated time frame.

42
7. PORTFOLIO COMMITTEE
The DPE accounts to the Public Committee on Public Enterprises and Communication Portfolio Committee. During the period
under review, the DPE attended meetings of its Portfolio Committee as follows:
DATE AGENDA MATTERS RAISED BY THE PC RESOLUTIONS ON HOW THE DEPARTMENT ADDRESSED THE MATTERS
02/07/19 Election of the Chairperson
Internal process which does not require the Department.
None
03/07/19 Annual performance plans of DPE
The Department should forward the report on the audit findings to the Committee as soon as it has been released.
This was done as part of the quarterly financial and operational performance reporting to the committee.
10/07/19 Consideration of the Budget Vote Report
Internal process which does not require the department
None
21/08/19 Members’ induction Internal process which does not require the department
None
04/09/19 Briefing by Denel on governance
Denel should provide quarterly reports on progress on its turnaround plan and how it is responding to socio-economic challenges. Report on the value and capabilities of non-core assets.
Denel dealt with some of these issues when it appeared again before the committee, on the annual reporting and AFS.
10/09/19 Special Appropriation for Eskom
The company’s business model was found to be outdated and operational structures inefficient.
Eskom would review all its procurement contracts, and there was a possibility to recover some monies from OEMs. The Department was also engaging with some contractors and its capacity was also being built for the necessary oversight to Eskom.
18/09/19 Briefing by Alexkor and SAA
Diamond theft and its processing being done in India without any beneficiation to SA. Concern about the Johannesburg office costs, whereas the actual operations of the entity are at Alexandra Bay.
The PC noted progress made in the implementation of the LTTS and committed to support all efforts aimed at stabilising the company.
Alexkor was considering options around the closure of the Johannesburg office and would keep the PC updated.
SAA was in the process of securing the 2-engine flights in order to reduce the fuel costs.
08/10/19 DPE Annual Reporting and AFS
Vacant positions within the department. Concern over the absence of legislation to control the mandates of SOCs.
This matter is being addressed with the priority to appoint the Director-General.
09/10/19 Eskom Annual Reporting and AFS
The increase of the municipal debt is a serious concern. The use of diesel and costs thereof are huge and wanted to know plans are in place to reduce this.
Liquidity problems and reputational damage within Eskom as a result of the State Capture. Lack of an activist approach in resolving the community problems, especially in Soweto.
Admission that the IMTT had not yielded any results. The unbundling plan seeks to deconcentrate the risk on Eskom and the paper will soon be released by the President. Eskom continues to engage with some coal suppliers to renegotiate contracts in an effort to reduce baseload costs of electricity.
The company will also do something to better communicate with the Soweto communities, for lasting solutions.
23/10/19 Transnet Annual Reporting and AFS
Expedite the filling of vacancies in the management. Concern over the under-expenditure on primary health care. Escalation of the multi-purpose pipeline costs and litigations by service providers are serious concerns. Saldanha community complains of unfair discrimination in terms of procurement processes.
There is only 7% vacancy rate and measures are in place to fill this gap and also restructure the institution.
There will be regular reporting to the committee on progress.

PUBLIC ENTERPRISES I Annual Report 2019/2020
43
DATE AGENDA MATTERS RAISED BY THE PC RESOLUTIONS ON HOW THE DEPARTMENT ADDRESSED THE MATTERS
30/10/19 Safcol Annual Reporting, AFS and update on the land claims
Concern over the slow progress in resolving land claims, lack of beneficiation for the youth and community. Non-achievement of targets and what is being done about it.
Progress was being made (e.g. Makhado claims). There is a programme of reskilling people which will lead to diversification of products in order to increase revenue. The problems were due to previous leadership instability.
06/11/19 Denel Annual Reporting and AFS
Weak control systems resulting in irregular and fruitless expenditure. Denel’s inability to honour its contractual obligations. Concern on the non-achievement of 16 out of 26 performance targets. Lack of skills transfer programmes within the institution.
The Board is committed to dealing with governance issues for future growth of the company and will keep the committee informed for a better oversight. There is no intention of selling assets that would compromise the capabilities of the company. Denel is in discussions with the National Treasury to improve its control systems (esp. SCM processes). There are plans in place to implement succession programmes.
13/11/19 Briefing by DPE on the medium-term financial and operational performance
DPE’s mechanism to correct red audit findings in SOCs. Non-tabling of AFS to Parliament by SAA, SA Express and Alexkor. DPE’s plans in mitigating non-achievement of targets by some SOCs.
DPE continues to work closely with SOCs in the implementation of their audit plans. Failure to table AFS is a result of financial challenges within these entities and this matter is receiving attention.
27/11/19 Alexkor Annual Reporting and AFS
What is being done to address the community and small miners concerns? What is being done to resolve the status of the PSJV? Lack of detailed strategy to improve operational and financial performance of the company.
Alexkor has not done an exploration study and there is no technical expertise at the mine, hence the company is not aware of the diamond magnitude. The success of the company should be about the beneficiation of the Northern Cape people and this is currently not the case. The Administrator is conducting a cost benefit analysis on the relocation of the company headquarters.
12/02/20 Consideration of the PC Programme
Internal process which does not require the Department
None
26/02/20 SONA implications and third quarter financial and operational performance
- Concern on vacancies and acting positions
- Lack of transparency regarding the SAA and SA Express financials
- This was a matter the department was prioritising, starting with the appointment of the DG.
- A follow-up meeting with the Business Rescue Practitioners to brief the committee.
04/03/20 Stakeholder engagement on Eskom
Presentations by stakeholders None
11/03/20 Stakeholder engagement on Transnet
Presentations by stakeholders None
8. STANDING COMMITTEE ON PUBLIC ACCOUNTS (SCOPA) RESOLUTIONS
RESOLUTION NO.
SUBJECT DETAILS RESPONSE BY THE DEPARTMENT RESOLVED (YES/NO)
1. SA Express non-tabling of AFS
The Minister had written to the Speaker of the National Assembly saying that the SA Express would not meet the submission date of its financial documentation and Annual Report.
The Annual Report was ultimately tabled and further engagements with the committee leading to the business rescue and liquidation of the company took place.
Yes
2. Alexkor non-tabling of AFS
The Minister had written to the Speaker of the National Assembly saying that Alexkor would not meet the submission date of its financial documentation and Annual Report.
The Annual Report was ultimately tabled.
Yes

44
RESOLUTION NO.
SUBJECT DETAILS RESPONSE BY THE DEPARTMENT RESOLVED (YES/NO)
3. SAA non-tabling of AFS
The Minister had written to the Speaker of the National Assembly saying that SAA would not meet the submission date of its financial documentation and Annual Report.
Engagements with the committee have taken place, even leading to the business rescue process.
On-going
4. Municipal debt to Eskom
The escalating debt owed by municipalities to Eskom, from R9,8 billion in 2017 to R26 billion in 2019.
The IMTT had not yielded the desired results and the matter now rests with the Deputy President.
On-going
5. SCOPA oversight recommendations to Eskom
The purpose of the meeting was for Eskom to address the Report of the SCOPA on its oversight visit to Eskom and the Medupi and Kusile projects in 2019 and to consider the power utility’s response to the 23 recommendations set out in the report.
Eskom presented its report on all the committee’s recommendations.
Yes
9. PRIOR MODIFICATION OF AUDIT REPORTS
None.
10. INTERNAL CONTROL
The Internal Control function under Governance, Legal Assurance, Risk Profiling and Mitigation Unit is fully functional.
11. INTERNAL AUDIT AND AUDIT COMMITTEE
11.1 INTERNAL AUDIT
The Internal Audit Activity (IAA) is responsible for evaluating
the control environment and assisting the Audit and Risk
Committee (ARC) to fulfil its responsibilities. The IAA also
provides the ARC and the Director-General (DG) with
independent, objective assurance and consulting services
on governance, risk management and control processes
to ensure they are adequate and effective in helping the
department achieve its objectives. The purpose, authority
and responsibility of the IAA is stated in the Internal Audit
Charter which is endorsed by the DG and approved by the
ARC.
11.2 INTERNAL AUDIT OBJECTIVES
The objective of the IAA is to provide independent, objective
assurance and consulting services designed to add value
and improve the Department’s operations. It assists the
Department to accomplish its objectives by bringing a
systematic disciplined approach to evaluate and improve
the effectiveness of risk management, internal controls, and
governance processes.
11.3 INTERNAL AUDIT KEY ACTIVITIES
The IAA through engagement with internal stakeholders (DPE
SMS), the ARC and the AGSA developed a comprehensive
three-year rolling plan, incorporating an annual plan that
was approved by the ARC. The IAA executed the risk-based
audit engagements as per the annual plan. Included in
areas reviewed are Financial Management, Interim Financial
Statements, Supply Chain & Asset Management, Departmental
Planning Review (Strategic, Annual Performance Plan and
Operational Plan), Performance Information Review, Review
of the Annual Report (2018/19 AR), Human Resources,
Business Enhancement Services (Energy & Resources /
Transport & Defence), Financial Assessment & Investment
Support, Information Technology, Office of the Director-
General, Governance & Legal Assurance, Internal Quality
Reviews, Audit Follow-Ups (AG Management Report, Risk
Profiling & Mitigation, Security & Facilities (S&F) Management
and High-Level Review of Draft Annual Financial Statements
and Annual Performance Report (Financial Statements)
reviews. The IAA provides recommendations to management
with regard to governance, risk management and controls

PUBLIC ENTERPRISES I Annual Report 2019/2020
45
processes. A follow-up on agreed management action plans
is performed using the implementation date provided by
management. The IAA also provides management advisory
services when requested by management as and when
necessary; and prepares and reports quarterly to the ARC
progress against the approved Annual Audit Plan.
The IAA successfully completed 100% (15 out of 15) of the
audit assignments as set in the approved IAA Annual Audit
Plan. The IAA continued to increase its audit coverage in line
with newly identified (emerging) risks, management and
ARC requests.
11.4 AUDIT AND RISK COMMITTEE
The Department has established an Audit and Risk
Committee (ARC) in line with Section 77(c) of the PFMA
(1999 as amended). The ARC is an oversight body providing
independent oversight over governance, risk management
and control processes of the Department. Their mandate and
responsibilities are clearly defined in the ARC’s charter and
five ARC meetings were convened for the year under review.
11.4.1. Audit & Risk Committee objectives and key activities
The overall objective and key activities of the ARC is to
support the DG and Executive Management in fulfilling
their respective oversight responsibilities for the financial
reporting process, the audit process and systems of internal
control, governance and risk management, including:
• The integrity of the Department’s financial reporting;
• Compliance with legal and regulatory obligations;
• The effectiveness of the Department’s enterprise-wide
risk management and internal control system; and
• Oversight of the effectiveness and efficiency of the
internal auditors, as well as the independence of internal
and external auditors.
11.4.2. Attendance of ARC meetings and membership
In the 2019/20 financial year, the ARC consisted of the three
members listed below. All the ARC members, including the
Chairperson, are independent, which is in line with optimal
corporate governance practice.
The table below provides relevant information on the ARC members:
Name Qualifications Internal/external
Date appointed Date Resigned
No. of Meetings attended
Mr. Reginald Haman (Chairperson)
- Masters Degree in Business Administration (MBA)
- Executive Leadership Programme
- Post-Graduate Diploma in Business Administration (PDBA)
- Graduate Diploma in Company Direction (GDCD)
- National Higher Diploma: School of Science
- National Diploma: School of Science
External 01 November 2015 N/A 4/5
Ms. Modi Dolamo - Masters in Financial Management
- Chartered Accountant (CA-SA)
- B Com (Hons) and Certificate in Theory of Accounting (CTA)
- Bachelor of Commerce (Accounting)
External 01 April 2014 N/A 5/5
Ms. Zanele Monnakgotla
- Masters in Finance
- Masters in Tax
- Management Advance Programme
- Bachelor of Laws
- Bachelor of Commerce
External 01 October 2017 N/A 4/5

46
12. AUDIT COMMITTEE REPORT
The Audit and Risk Committee is pleased to present its report for the financial year ended 31 March 2020.
Audit Committee Responsibility
The Audit and Risk Committee reports that it has complied with its responsibilities arising from Section 38(1)(a)(ii) of the Public
Finance Management Act and Treasury Regulation 3.1.13. The Audit and Risk Committee adopted appropriate formal terms of
reference as its Audit and Risk Committee Charter. The Audit and Risk Charter regulated the affairs of the Audit and Risk Committee
and in compliance with this Charter the Committee has discharged all its responsibilities as contained therein.
The Effectiveness of Internal Control
We note with appreciation the 100% completion of the Internal Audit Activity’s risk based operational plan for the year under
review. The Audit and Risk Committee reviewed findings reported by internal audit and is aware of some control deficiencies with
room for improvement in the following areas reviewed by internal audit during the year under review:
• Review of the (2018/19) Annual Report (AR);
• Financial Management;
• Governance and Legal Assurance Service;
• Supply Chain and Asset Management;
• Interim Financial Statements,
• Quarterly Performance Information Report;
• Human Resources Management;
• Business Enhancement Services (Energy & Resources / Transport & Defence);
• Financial Assessment and Investment Support;
• Information and Communication Technology (ICT);
• Office of the Director-General;
• Departmental Planning Review (Strategic, Annual Performance Plan and Operational Plan);
• High-Level Review of Draft Annual Financial Statements;
• Follow-up reviews included:
- AGSA Management Report;
- Risk Profiling & Mitigation;
- Security and Facilities (S&F) Management; and
• Internal Quality Reviews.
The Internal Audit Activity (IAA) provided value adding recommendations to management with regard to the Department’s
governance, risk management and controls processes. IAA also served as a coordinator for some forensic investigations which the
department undertook. A follow-up on agreed management action plans will be performed in the next financial year to review
the extent to which the recommendations were implemented as well as the results there-to. IAA prepared and reported on a
quarterly basis to the Audit and Risk Committee progress against the approved annual internal audit plan.
The quality of performance information reporting still requires significant work, though there is substantial improvement
compared to previous years.

PUBLIC ENTERPRISES I Annual Report 2019/2020
47
The Audit and Risk Committee takes note of the network and system security vulnerability assessment in relation to the
Department’s ICT as part of the Information Technology General Controls review and trusts that management will take the
necessary steps in respect of areas highlighted in the report.
The effectiveness of the Internal Audit Activity
The Internal Audit unit performed a wide range of operational, financial, compliance and information-technology audits. In
addition to these planned audits, the unit also attended to certain management requests. The system of internal control within
the department and the control environment was reasonably effective as seen from the various reports issued by internal audit
and the Auditor General of South Africa. The ARC is still not satisfied with the capacity of the Internal Audit Activity and is of the
view that capacitation of the unit should be prioritised in order to internal audit to function optimally to enable the department
to benefit fully from a fully capacitated internal audit activity.
Enterprise Risk Management
The Audit and Risk Committee is responsible for the oversight of the Department’s risk management activities. A strategic
and operational risk assessment for the year under review was conducted. The Committee has reviewed the risk registers on a
quarterly basis and has recommended certain improvements to be made. Moreover, a culture of risk management needs to be
embedded in the daily activities of the Department to ensure effective enterprise wide risk management. The Committee will
monitor progress with regard to this.
In-Year Management and Monthly/Quarterly Report
The audit committee reports that, during the year under review, it was presented with regular quarterly management reports to
enable it to:
• Monitor the integrity, accuracy and reliability of the performance of the department;
• Review the disclosure in the financial reports of the department and the context in which statements on the financial health
of the department are made; and
• Review all material information presented together with management accounts.
The reports were discussed with the Department’s officials. Progress has been made in the development and quality of these
management reports and the department has been reporting monthly and quarterly to all the relevant stakeholder Departments
as required by the PFMA.
Evaluation of Financial Statements
The Audit and Risk Committee reviewed the Annual Financial Statements prepared by the Department before submission to the
Auditor General of South Africa.
Auditor General’s Report
The Audit and Risk Committee has reviewed the AGSA’s annual audit report and the management letter and concur therewith.
The ARC notes the emphasis of matter items as disclosed in the report. The ARC accepts the conclusion of the Auditor General on
the annual financial statements and the annual performance information report, and will work with management to monitor this
regression to ensure it is adequately addressed.
Mr Reginald Haman Chairperson of the Audit and Risk Committee
Date: 30 September 2020

48
13. B-BBEE COMPLIANCE PERFORMANCE INFORMATION
The following table has been completed in accordance with the compliance to the B-BBEE requirements of the B-BBEE Act (2013)
as determined by the Department of Trade and Industry.
Has the Department applied any relevant Code of Good Practice (BBBEE Certificate Level 1-8) with regard to the following:
Criteria Response Yes/No
Discussion (include a discussion on your response and indicate what measures have been taken to comply)
Determining qualification criteria for the issuing of licences, concessions or other authorisation in respect of economic activity in terms of any law?
Yes Mosela & Sizwentsaluba Gobodo were appointed to verify and issue a B-BBEE certificate.
Developing and implementing a preferential procurement policy? Yes PPFA (2017), where it is feasible DPE bids stipulate pre-qualifications for prospective bidders.
Determining qualification criteria for the sale of an SOE? No N/A
Developing criteria for entering into partnerships with the private sector?
No N/A
Determining criteria for the awarding of incentives, grants and investment scheme in support of B-BBEE?
Yes Bids that were awarded and required B-BBEE certificate/ affidavit were granted B-BBEE points.

PART D HUMAN RESOURCE MANAGEMENT

50
1. INTRODUCTION
The information contained in this part of the annual report has been prescribed by the Minister of Public Service and Administration
for all departments in the public service.
2. OVERVIEW OF HUMAN RESOURCES
1.1 Overview of human resources in the Department
The Department employed 181 individuals and has a total
of 212 approved posts on the organisational structure. The
staff turnover of 7.3% and the delay in the filling of vacancies
resulted in the high vacancy rate of 15%. Additional
descriptive statistics are provided in the tables below. Two
duly authorised employee unions, the National Education,
Health and Allied Workers’ Union (NEHAWU) and the
Public Service Association (PSA) represent workers. On
the management side, the Department deploys a Labour
Relations Unit to facilitate a conducive working environment
for all staff. To this end, the Departmental Bargaining Chamber
met four times in the period under review.
The Department’s three highest priorities during the 2019/20
financial year were (1) to fill key funded posts, (2) to implement
the re-aligned organisational structure, and (3) to implement
20 Human Resource Development (HRD) interventions. Of
these, the HRD interventions were exceeded and successfully
implemented, thus developing and maintaining required
human resource competencies in line with the mission of
the Department and its annual pre-determined objectives
and the Workplace Skills Plan (WSP). The remaining priorities
could not be accomplished due to a number of factors,
primarily relating to budget cuts by National Treasury for
compensation of employees.
During the period under review, the approved re-aligned
organisational structure was implemented and a Migration
and Placement Committee within the Department was
established to ensure that the right employees with the right
mix of skills are placed in the right positions. In addition, a WSP
was developed following the skills gaps identified through
the submission of Personal Development Plans (PDPs). As
part of the implementation of the WSP, a number of training
and development interventions were identified (including
workshops and relevant conferences). The Department
continued to service at least 47 bursaries as allocated to
employees for the 2019 academic year.
The new Regulations and Directives issued by DPSA required
the Performance Management and Development System
(PDMS) Policy for non-SMS employees to be reviewed. The
Policy was reviewed and implemented during the 2019/20
performance cycle. Departmental awareness with regard
to changes to the policy was conducted during the year
under review. The compliance rate for the submission of
performance agreements was maintained at well above 90%
in the 2019/20 financial year.
In terms of compliance to employment equity targets as
set by the Government, the Department employed 1.7% of
people with disabilities during the 2019/20 financial year.
In addition, the Department employed 43% females and
57% males on Senior Management Service (SMS), which is a
decline from the previous year due to turnover and the non-
filling of funded vacant positions. Affirmative action measures
will have to be implemented to fast-track the representation
of designated groups.
A comprehensive and structured Employee Health and
Wellness Programme (EHWP) was developed and successfully
implemented. The programme was complemented by the
outsourced health services provider with the 24-hour online
access. There was consistent compliance in reporting on the
four pillars set by DPSA.
The Department implemented the re-aligned organisational
structure with effect from 1 January 2019”. However, more is
still required to fully implement areas of improvement that
are being identified on the implemented structure and once
these amendments have been approved, the improved areas
will be implemented in the 2020/21 financial year.
An ongoing challenge for the Department is the filling of
vacancies, the current vacancy rate is 15% and this will have
to be prioritised in the next cycle within the limited budget
allocation for compensation of employees due to National
Treasury budget cuts.

PUBLIC ENTERPRISES I Annual Report 2019/2020
51
3. HUMAN RESOURCES OVERSIGHT STATISTICS
The department provides the following key information on human resources. All the financial amounts agree with the amounts
disclosed in the annual financial statements.
3.1 Personnel-related expenditure
The following tables summarise the final audited personnel related expenditure by programme and by salary bands. In particular,
it provides an indication of the following:
• Amount spent on personnel
• Amount spent on salaries, overtime, homeowner’s allowances and medical aid.
Table 3.1.1 Personnel expenditure by programme for the period 1 April 2019 to 31 March 2020
Programme
Total expenditure
Personnel expenditure
Training expenditure
Professional and special
services expenditure
Personnel expenditure
as a % of total expenditure
Average personnel cost per employee
R’000 R’000 R’000 R’000 R’000 R’000
DPE: ADMINISTRATION 149 077,00 72 107,00 849,00 4 311,00 48,40 721,00
DPE: SOC Governance Assurance & Performance
36 880,00 28 198,00 0,00 1 662,00 76,50 881,00
DPE: Business Enhancement, Transformation & Industrialisation
56 660 432,00 48 884,00 0,00 6 177,00 0,10 959,00
Total 56 846 389,00 149 189,00 849,00 12 150,00 0,30 815,00
Table 3.1.2 Personnel costs by salary band for the period 1 April 2019 to 31 March 2020
Salary band
Personnel expenditure
% of total personnel cost
No of employees
Average personnel cost per employee
R’000 R’000 R’000 R’000
Unskilled (Levels 1-2) 110,00 0,10 1,00 110 000,00
Skilled (Levels 3-5) 2 472,00 1,70 14,00 176 571,00
Highly skilled production (Levels 6-8) 22 228,00 14,90 48,00 463 083,00
Highly skilled supervision (Levels 9 - 12) 46 462,00 31,10 63,00 737 492,00
Senior and Top management (Levels >= 13) 77 917,00 52,20 57,00 1 366 965,00
Total 149 189,00 100,00 183,00 815 240,00
Table 3.1.3 Salaries, overtime, home owner’s allowance and medical aid by programme for the period 1 April 2019 to 31 March 2020
Programme
Salaries Overtime Home owner’s allowance Medical aid
Amount R’000
Salaries as a % of
personnel costs
Amount R’000
Overtime as a % of
personnel costs
Amount R’000
HOA as a % of personnel
costs
Amount R’000
Medical aid as a % of
personnel cost
DPE Administration 65 114,00 90,30 523,00 0,70 960,00 1,30 1 625,00 2,30
DPE: SOC Governance Assurance & Performance
25 763,00 91,40 110,00 0,40 150,00 0,50 375,00 1,30
DPE: Business Enhancement, Transformation & Industrialisation
44 150,00 90,30 0,00 0,00 656,00 1,30 717,00 1,50
TOTAL 135 027,00 90,50 633,00 0,40 1 793,00 1,20 2 717,00 1,80

52
Table 3.1.4 Salaries, overtime, home owner’s allowance and medical aid by salary band for the period 1 April 2019 to 31 March 2020
Salary band
Salaries Overtime Home owner’s allowance
Medical aid
Amount R’000
Salaries as a % of
personnel costs
Amount R’000
Overtime as a % of
personnel costs
Amount R’000
HOA as a % of
personnel costs
Amount R’000
Medical aid as a % of
personnel cost
Unskilled (Levels 1-2) 110,00 0,10 0,00 0,00 0,00 0,00 0,00 0,00
Skilled (Levels 3-5) 2 056,00 1,40 4,00 0,00 84,00 0,10 164,00 0,10
Highly skilled production (Levels 6-8)
18 053,00 12,10 374,00 0,30 704,00 0,50 1 107,00 0,70
Highly skilled supervision (Levels 9-12)
40 385,00 27,10 255,00 0,20 561,00 0,40 1 001,00 0,70
Senior Management (Levels >= 13)
74 423,00 49,90 0,00 0,00 422,00 0,30 445,00 0,30
TOTAL 135 027,00 90,50 633,00 0,40 1 793,00 1,20 2 717,00 1,80
3.2 Employment and vacancies
Table 3.2.1 Employment and vacancies by programme as at 31 March 2020
Programme
Number of posts on approved establishment
Number of posts filled
Vacancy rate Number of employees additional to the
establishment
DPE:Administration 117,00 100,00 14,50 1,00
DPE: SOC Governance Assurance & Performance 38,00 32,00 15,80 0,00
DPE: Business Enhancement, Transformation & Industrialisation
59,00 51,00 13,60 3,00
Total 214,00 183,00 14,50 4,00
Table 3.2.2 Employment and vacancies by salary band as at 31 March 2020
Salary band
Number of posts on approved
establishment
Number of posts filled
Vacancy rate Number of employees additional to the
establishment
Lower Skilled (Levels 1-2) 2,00 1,00 50,00 0,00
Skilled (Levels 3-5) 15,00 14,00 6,70 0,00
Highly Skilled Production (Levels 6-8) 50,00 48,00 4,00 0,00
Highly Skilled Supervision (Levels 9-12) 72,00 63,00 12,50 0,00
Senior Management (Levels >= 13) 73,00 55,00 24,70 4,00
Other Occupations 2,00 2,00 0,00 0,00
Total 214,00 183,00 14,50 4,00
Table 3.2.3 Employment and vacancies by critical occupations as at 31 March 2020
Critical occupation
Number of posts on approved
establishment
Number of posts filled
Vacancy rate Number of employees additional to the
establishment
Administrative related, Permanent 33,00 28,00 15,20 0,00
Client inform clerks (switchboard recept inform clerks) Permanent
4,00 4,00 0,00 0,00
Communication and information related, Permanent 6,00 6,00 0,00 0,00
Finance and economics related, Permanent 13,00 12,00 7,70 0,00

PUBLIC ENTERPRISES I Annual Report 2019/2020
53
Critical occupation
Number of posts on approved
establishment
Number of posts filled
Vacancy rate Number of employees additional to the
establishment
Financial clerks and credit controllers, Permanent 7,00 7,00 0,00 0,00
Food services aids and waiters Permanent 5,00 4,00 20,00 0,00
Head of Department/Chief Executive Officer 1,00 0,00 100,00 0,00
Human Resources & Organisation Development & related
12,00 11,00 8,30 0,00
Information Technology related 8,00 6,00 25,00 0,00
Library mail and related clerks 10,00 8,00 20,00 0,00
Logistical support personnel 6,00 6,00 0,00 0,00
Messengers porters and deliveries 3,00 3,00 0,00 0,00
Secretaries & Other keyboards operating clerks 29,00 29,00 0,00 0,00
Security Officers 2,00 2,00 0,00 0,00
Other occupations 2,00 2,00 0,00 0,00
Senior Managers 73,00 55,00 24,70 4,00
TOTAL 214,00 183,00 14,50 4,00
3.3 Filling of SMS posts
Table 3.3.1 SMS post information as at 31 March 2020
SMS LevelTotal number of funded
SMS postsTotal number of SMS posts filled
% of SMS posts filled
Total number of SMS posts vacant
% of SMS posts vacant
Director-General/HOD 1 0 0 1 100
Salary level 16 1
Salary level 15 9 5 56 4 44
Salary level 14 20 19 95 1 5
Salary level 13 43 30 70 13 30
TOTAL 73 55 75 18 25
Table 3.3.2 SMS post information as at 30 September 2019
SMS LevelTotal number of funded
SMS postsTotal number of SMS posts filled
% of SMS posts filled
Total number of SMS posts vacant
% of SMS posts vacant
Director-General/HOD 1 0 0 1 100
Salary level 16 2 2 100 0 0
Salary level 15 7 3 55 4 57
Salary level 14 20 17 85 3 15
Salary level 13 45 32 71 13 29
TOTAL 75 54 72 21 28
Table 3.3.3 Advertising and filling of SMS posts for the period 1 April 2019 to 31 March 2020
SMS Level
Advertising Filling of Posts
Number of vacancies per level advertised in 6
months of becoming vacant
Number of vacancies per level filled in 6 months of
becoming vacant
Number of vacancies per level not filled in 6 months
but filled in 12 months
Director-General/ Head of Department 0 0 0
Salary Level 16 0 0 0
Salary Level 15 0 0 0
Salary Level 14 0 0 0
Salary Level 13 0 0 0
Total 0 0 0

54
Table 3.3.4 Reasons for not having complied with the filling of funded vacant SMS posts advertised within 6 months after becoming vacant for the period 1 April 2019 to 31 March 2020
Reasons for vacancies not advertised within 6 months
Vacancies have been escalated for reprioritisation, advertising and filling.
Reasons for vacancies not being filled within 12 months
Vacancies have been escalated for reprioritisation, advertising and filling.
Table 3.3.5 Disciplinary steps taken for not complying with the prescribed timeframes for filling SMS posts within 12 months for the period 1 April 2019 to 31 March 2020
Reasons for vacancies not advertised within 6 months
No disciplinary action taken
Reasons for vacancies not filled within 6 months
No disciplinary action taken
3.4 Job Evaluation
Table 3.4.1 Job Evaluation by salary band for the period 1 April 2019 to 31 March 2020
Salary band
Number of posts approved and establishment
Number of jobs
evaluated
% of posts evaluated by salary bands
Posts upgraded Posts downgraded
Number % of posts evaluated
Number % of posts evaluated
Unskilled (levels 1-2) 2 0 0 0 0 0 0
Skilled (levels 3-5) 15 0 0 0 0 0 0
Highly skilled production (levels 6-8)
50 0 0 0 0 0 0
Highly skilled supervision (levels 9-12)
72 0 0 0 0 0 0
Senior Management Service Band A
43 0 0 0 0 0 0
Senior Management Service Band B
20 0 0 0 0 0 0
Senior Management Service Band C
9 0 0 0 0 0 0
Senior Management Service Band D
1 1 100 0 0 0 0
Deputy Minister 1 0 0 0 0 0 0
Minister 1 0 0 0 0 0
TOTAL 214 1 0,5 0 0 0 0
Table 3.4.2 Profile of employees whose positions were upgraded due to their posts being upgraded for the period 1 April 2019 to 31 March 2020
Gender African Asian Coloured White TOTAL
Female 0 0 0 0 0
Male 0 0 0 0 0
TOTAL 0 0 0 0 0
Employees with disability 0 0 0 0 0
TOTAL 0 0 0 0 0

PUBLIC ENTERPRISES I Annual Report 2019/2020
55
Table 3.4.3 Employees with salary levels higher than those determined by job evaluation by occupation for the period 1 April 2019 to 31 March 2020
OccupationNumber of employees
Job evaluation level
Remuneration level
Reason for deviation
Total number of employees whose salaries exceeded the level determined by job evaluation
1 7 8 Grade progression due to an employee being on the same salary level for a continuous period of 15 years
Percentage of total employed 0,5
Table 3.4.4 Profile of employees who have salary levels higher than those determined by job evaluation for the period 1 April 2019 to 21 March 2020
Gender African Asian Coloured White TOTAL
Female 0 0 0 0 0
Male 0 0 0 0 0
TOTAL 0 0 0 0 0
Employees with disability
0 0 0 0 0 0
TOTAL 0 0 0 0 0 0
Total number of employees whose salaries exceeded the grades determined by job evaluation 0
=3.5 Employment changes
Table 3.5.1 Annual turnover rates by salary band for the period 1 April 2019 to 31 March 2020
Salary band
Number of employees at beginning of period
1 April 2019
Appointments and transfers into the
Department
Terminations and transfers out of the
Department
Turnover rate
Skilled (levels 3-5) 11,00 5,00 2,00 18,20
Highly skilled production (levels 6-8) 44,00 4,00 3,00 6,80
Highly skilled supervision (levels 9-12) 67,00 4,00 5,00 7,50
Senior Management Services Bands A 31,00 4,00 4,00 12,90
Senior Management Services Bands B 17,00 1,00 0,00 0,00
Senior Management Services Bands C 5,00 1,00 0,00 0,00
Senior Management Services Bands D 0,00 1,00 0,00 0,00
Deputy Minister 0 1 0 0
Minister 1 0 0 0
TOTAL 176,00 21,00 14,00 8,00
Table 3.5.2 Annual turnover rates by critical occupation for the period 1 April 2019 to 31 March 2020
Critical occupation
Number of employees at beginning of period
April 2019
Appointments and transfers into the
Department
Terminations and transfers out of the
Department
Turnover rate
Administrative related, Permanent 31,00 3,00 1,00 3,20
Client inform clerks (switch receipt inform clerks), Permanent
3,00 1,00 1,00 33,30
Communication and information related, Permanent 6,00 0,00 1,00 16,70
Finance and economics related, Permanent 12,00 0,00 2,00 16,70
Financial clerks and credit controllers, Permanent 7,00 0,00 0,00 0,00
Food services aids and waiters, Permanent 4,00 5,00 1,00 25,00

56
Critical occupation
Number of employees at beginning of period
April 2019
Appointments and transfers into the
Department
Terminations and transfers out of the
Department
Turnover rate
Head of department/chief executive officer, Permanent 0,00 0,00 0,00 0,00
Human resources & organisational development & related prof, Permanent
11,00 1,00 1,00 9,10
Information technology related, Permanent 5,00 1,00 0,00 0,00
Library mail and related clerks, Permanent 6,00 0,00 0,00 0,00
Logistical support personnel, Permanent 5,00 1,00 0,00 0,00
Messengers, porters and deliverers, Permanent 4,00 0,00 1,00 25,00
Security officers, Permanent 2,00 0,00 0,00 0,00
Secretaries and Keyboard operating clerks 25,00 1,00 2,00 8,00
Senior managers, Permanent 54,00 7,00 4,00 7,40
Other Occupations 1 1 0,00 0,00
TOTAL 176,00 21,00 14,00 8,00
Table 3.5.3 Reasons why staff left the Department for the period 1 April 2019 to 31 March 2020
Termination type Number % of total resignations
Death 0 0
Resignation 10 71,40
Expiry of contract 2 14,30
Dismissal – operational changes 0 0
Dismissal – misconduct 0 0
Dismissal – inefficiency 0 0
Discharged due to ill-health 0 0
Retirement 1 8
Transfer to other Public Service Departments 1 7,10
Other 0 7,10
TOTAL 14 100
Total number of employees who left as a % of total employment
7.7%
Table 3.5.4 Promotions by critical occupation for the period 1 April 2019 to 31 March 2020
Occupation
Employees 1 April 2019
Promotion to another salary level
Salary level promotions as a % of employees by occupation
Progressions to another notch within a salary
level
Notch progression as a % of employees by occupation
Administrative related, Permanent 25 1 4 14 56
Client inform clerks (switch receipt inform clerks), Permanent
2 1 4 14 56
Communication and information related, Permanent
6 0 0 0 0
Finance and economics related, Permanent 11 0 0 4 67
Financial clerks and credit controllers, Permanent
7 0 0 11 100
Food services aids and waiters, Permanent 8 0 0 7 100
Head of department/chief executive officer, Permanent
1 0 0 2 25
Human resources & organisational development & related prof, Permanent
10 0 0 0 0

PUBLIC ENTERPRISES I Annual Report 2019/2020
57
Occupation
Employees 1 April 2019
Promotion to another salary level
Salary level promotions as a % of employees by occupation
Progressions to another notch within a salary
level
Notch progression as a % of employees by occupation
Information technology related, Permanent 6 3 50 3 50
Library mail and related clerks, Permanent 7 6 86 6 86
Logistical support personnel, Permanent 6 3 50 3 50
Messengers, porters and deliverers, Permanent 3 0 0 0 0
Security officers, Permanent 2 2 100 2 100
Secretaries and keyboard operating clerks 33 26 79 26 79
Senior managers, Permanent 55 38 69 38 69
Other Occupations 2 0 0 0 0
TOTAL 183 122 67 122 67
Table 3.5.5 Promotions by salary band for the period 1 April 2019 to 31 March 2020
Salary Band
Employees 1 April 2019
Promotion to another salary level
Salary level promotions as a % of employees by salary level
Progressions to another notch within a salary
level
Notch progression as a % of employees by salary bands
Skilled (level 3-5) 11 0 0 4 36
Highly skilled production (levels 6-8) 52 1 2 39 75
Highly skilled supervision (levels 9-12) 63 0 0 45 71
Senior Management (levels 13-16) 55 0 0 38 69
Other occupations 2 0 0 0 0
Total 183 1 0,5 126 69
3.6 Employment equity
Table 3.6.1 Total number of employees (including employees with disabilities) in each of the following occupational categories as at 31 March 2020
Occupational category
Male Female
TotalAfrican Coloured Indian White African Coloured Indian White
Legislators, senior officials and managers, Permanent
29 2 2 0 20 1 1 2 57
Professionals, Permanent 15 0 1 0 16 1 0 4 37
Technicians and associate professionals, Permanent
23 0 0 1 45 1 3 73
Clerks, Permanent 5 1 0 0 9 1 0 0 16
Service and sales workers, Permanent
0 0 0 0 0 0 0 0 0
Total 72 3 3 1 90 4 1 9 183
Table 3.6.2 Total number of employees (including employees with disabilities) in each of the following occupational bands as at 31 March 2020
Occupational band
Male Female
TotalAfrican Coloured Indian White African Coloured Indian White
Top management 4 0 2 0 1 0 0 1 8
Senior management 25 2 0 0 19 1 1 1 49
Professionally qualified and experienced specialists and mid-management
15 0 1 0 16 1 0 4 37

58
Occupational band
Male Female
TotalAfrican Coloured Indian White African Coloured Indian White
Skilled technical and academically qualified workers, junior management, supervisors, foremen and superintendents
23 0 0 1 45 1 0 3 73
Semi-skilled and discretionary decision making
5 1 0 0 9 1 0 0 16
Unskilled and defined decision making
0 0 0 0 0 0 0 0 0
Total 72 3 3 1 90 4 1 9 183
Table 3.6.3 Recruitment for the period 1 April 2019 to 31 March 2020
Occupational band
Male Female
TotalAfrican Coloured Indian White African Coloured Indian White
Top management 1 0 0 0 0 0 0 0 1
Senior management 4 0 0 2 0 0 1 7
Professionally qualified and experienced specialists and mid-management
3 2 0 0 0 0 0 0 5
Skilled technical and academically qualified workers, junior management, supervisors, foremen and superintendents
2 0 0 0 2 0 0 0 4
Semi-skilled and discretionary decision making
0 0 0 0 4 0 0 0 4
Unskilled and defined decision making 0 0 0 0 0 0 0 0 0
Total 10 2 0 0 8 0 0 1 21
Employees with disabilities 0 0 0 0 0 0 0 0 0
Table 3.6.4 Promotions for the period 1 April 2019 to 31 March 2020
Occupational Band
Male Female
TotalAfrican Coloured Indian White African Coloured Indian White
Top management 0 0 0 0 0 0 0 0 0
Senior management 0 0 0 0 0 0 0 0 0
Professionally qualified and experienced specialists and mid-management
0 0 0 0 0 0 0 0 0
Skilled technical and academically qualified workers, junior management, supervisors, foremen and superintendents
0 0 0 0 0 0 0 0 0
Semi-skilled and discretionary decision making 0 0 0 0 0 0 0 0 0
Total 0 0 0 0 0 0 0 0 0
Employees with disabilities 0 0 0 0 0 0 0 0 0

PUBLIC ENTERPRISES I Annual Report 2019/2020
59
Table 3.6.5 Terminations for the period 1 April 2019 to 31 March 2020
Occupational band
Male Female
TotalAfrican Coloured Indian White African Coloured Indian White
Top management 0 0 0 0 0 0 0 0 0
Senior management, 1 2 0 0 0 0 1 0 4
Professionally qualified and experienced specialists and mid-management
4 0 0 0 1 0 0 0 5
Skilled technical and academically qualified workers, junior management, supervisors, foremen
3 0 0 0 0 0 0 0 3
Semi-skilled and discretionary decision making 0 0 0 0 0 2 0 0 2
Total 8 2 0 0 1 2 1 0 14
Table 3.6.6 Disciplinary action for the period 1 April 2019 to 31 March 2020
Disciplinary action
Male Female
TotalAfrican Coloured Indian White African Coloured Indian White
Gross dishonesty 0 0 0 0 0 0 0 0 0
Total 0 0 0 0 0 0 0 0 0
Table 3.6.7 Skills development for the period 1 April 2019 to 31 March 2020
Occupational category
Male Female
TotalAfrican Coloured Indian White African Coloured Indian White
Legislators, senior officials and managers
27 2 1 0 20 1 1 2 54
Professionals 14 0 1 0 15 1 0 4 35
Technicians and associate professionals
11 0 0 1 14 0 0 2 28
Clerks 12 0 0 0 32 1 0 1 46
Plant and machine operators and assemblers
0 0 0 0 0 0 0 0 0
Elementary occupations 3 1 0 0 11 0 0 0 15
TOTAL 67 3 2 1 92 3 1 9 178
Employees with disabilities 1 0 0 0 0 0 0 2 3
3.7 Signing of performance agreements by SMS members
Table 3.7.1 Signing of a performance agreement by SMS members as at 31 May 2019
SMS level Total number of funded SMS posts
Total number of SMS members
Total number of signed performance agreements
Signed performance agreements as % of total number of SMS members
Director-General/HOD 1 0 0 0
Salary level 15 9 6 2 33
Salary level 14 20 19 17 89
Salary level 13 43 30 27 90
TOTAL 73 55 46 83

60
Table 3.7.2 Reasons for not having concluded a performance agreement with all SMS members as at 31 March 2019
Reasons
The senior managers involved were either on leave due to ill-health, in disagreement with managers regarding their performance agreement or new appointments.
Table 3.7.3 Disciplinary steps taken against SMS members for not having concluded performance agreements as at 31 March 2019
Reasons
None
3.8 Performance rewards
Table 3.8.1 Performance rewards by race, gender and disability for the period 1 April 2018 to 31 March 2019
Race and gender
Beneficiary profile Cost
Number of beneficiaries
Number of employees
% of total within group
Cost R’000 Average cost per employee
African 28 71 39 717 26
Male 41 90 44 777 19
Female 0 0 0 0 0
Indian 1 1 100 56 56
Female 1 2 50 31 31
Male 0 0 0 0 0
Coloured 2 4 50 45 23
Female 1 3 33 47 47
Male 0 0 0 0 0
White 3 9 33 101 34
Female 0 1 0 0 0
Male 76 181 42 1774 23
TOTAL 28 71 39 717 26
Table 3.8.2 Performance rewards by salary band for personnel below senior management level for the period 1 April 2018 to 31 March 2019
Salary band
Beneficiary profile Cost
Total cost as a % of the total
personnel expenditure
Number of beneficiaries
Number of employees
% of total within salary bands
Total cost (R’000)
Average cost per
employee (R’000)
Skilled (Levels 3-5) 0 11 0 0 0 0
Highly skilled production (Levels 6-8) 31 52 60 385 12 0,3
Highly skilled supervision (Levels 9-12) 30 64 47 727 24 0,5
Total 61 126 48 1112 18 0,7

PUBLIC ENTERPRISES I Annual Report 2019/2020
61
Table 3.8.3 Performance rewards by critical occupation for the period 1 April 2018 to 31 March 2019
Critical occupation
Beneficiary profile Cost
Number of beneficiaries
Number of employees
% of total within salary
bandsTotal cost
(R’000)
Average cost per employee
(R’000)
Administrative related 14 25 56 257 18
Client inform clerks (switch board reception information clerks)
0 2 0 0 0
Communication and information related 2 6 33 39 19,5
Financial and economic related 4 11 36 74 18,5
Financial and related professionals
Financial clerks and credit controllers 7 7 100 112 16
Food services aids 0 8 0 0 0
Head of department/chief executive officer 0 0 0 0 0
Human resources related 9 10 90 174 19
Information technology related 0 6 0 0 0
Library mail and related clerks 2 7 29 26 13
Material-recording and transport clerks 4 6 67 81 20
Messengers, porters and deliverers 0 3 0 0 0
Secretaries & other keyboard operating clerks 20 33 60 348 17
Security officers 0 2 0 0 0
Senior managers 14 55 25 663 47
Total 76 181 42 1774 23
Table 3.8.4 Performance related rewards (cash bonus), by salary band for Senior Management level for the period 1 April 2018 to 31 March 2019
Salary band
Beneficiary profile Cost Total cost as a % of the total
personnel expenditure
Number of beneficiaries
Number of employees
% of total within salary
bands Total cost (R’000)
Average cost per employee
(R’000)
Band A 8 30 27 354 44 0,23
Band B 6 19 32 309 52 0,2
Band C 0 6 0 0 0 0
Band D 0 0 0 0 0 0
Total 14 55 25 663 47 0,5
3.9 Foreign workers
Table 3.9.1 Foreign workers by salary band for the period 1 April 2019 to 31 March 2020
Salary band
1 April 2019 31 March 2020 Change
Number % of total Number % of total Number % Change
Lower skilled (Levels 3-5) 0 0 0 0 0 0
Highly skilled production (Levels 6-8) 0 0 0 0 0 0
Highly skilled supervision (Levels 9-12) 0 0 0 0 0 0
Senior Management (Levels 13-16) 2 100 3 100 1 33
Total 2 100 3 100 1 33

62
Table 3.9.2 Foreign workers by major occupation for the period 1 April 2019 to 31 March 2020
Major occupation
1 April 2019 31 March 2020 Change
Number % of Total Number % of total Number % Change
Senior management 2 100 3 100 1 33
Total 2 100 3 100 1 33
1.10 Leave utilisation
Table 3.10.1 Sick leave for the period 1 January 2019 to December 2020
Salary band
Total days % of days with medical certifi-
cation
Number of employees using sick
leave
% of total employees using sick
leave
Average days per
employee
Estimated cost (R’000)
Skilled (Levels 3-5) 66,00 77,30 9 5.90 7 62,00
Highly skilled production (Levels 6-8) 387,00 65,10 47,00 30,90 8,00 642,00
Highly skilled supervision (Levels 9-12) 390,00 60,00 54,00 35,50 7,00 390,00
Top and senior management (Levels 13-16)
368,00 80,70 42,00 27,60 9,00 368,00
TOTAL 1 211,00 68,90 152,00 100,00 8,00 3 441,00
Table 3.10.2 Disability leave (temporary and permanent) for the period 1 January 2019 to 31 December 2019
Salary band Total days
% of days with medical certifi-
cation
Number of employees using sick
leave
% of total employees using sick
leave
Average days per
employee
Estimated cost (R’000)
Skilled (Levels 3-5) 0 0 0 0 0 0
Highly skilled production (Levels 6-8) 18 100 2 67 0 18,2
Highly skilled supervision (Levels 9-12) 0 0 0 0 0 0
Top and senior management (Levels 13-16) 7 100 1 33 7 30,5
TOTAL 25 100 3 100 8 48,7
Table 3.10.3 Annual leave for the period 1 January 2019 to 31 December 2019
Salary band Total days takenNumber of employees
using annual leaveAverage per
employee
Lower skills (Levels 1-2) 6,00 1,00 6,00
Skilled (Levels 3-5) 165 13,00 13,00
Highly skilled production (levels 6-8) 1250 55,00 23,00
Highly skilled supervision (Levels 9-12) 1 680 66,00 25,00
Senior management (Levels 13-16) 1256 57,00 22,00
Total 4357 192,00 23,00
Table 3.10.4 Capped leave for the period 1 January 2019 to 31 December 2019
Salary bandTotal days of
capped leave taken
Number of employees using
capped leave
Average number of days taken per
employee
Average capped leave per employee as at 31 March 2020
Skilled (Levels 3-5) 0,00 0,00 0,00 0,00
Highly skilled production (levels 6-8) 10,00 1,00 10,00 21,00
Highly skilled supervision (Levels 9-12) 0,00 0,00 0,00 33,00
Senior management (Levels 13-16) 0,00 0,00 0,00 34,00
Total 10,00 10,00 10,00 29,00

PUBLIC ENTERPRISES I Annual Report 2019/2020
63
Table 3.10.5 Leave payout for the period 1 April 2019 to 31 December 2019
Reason Total amountNumber of employees
Average per employee
(R’000) (R’000)
ANNUAL - DISCOUNTING: WITH RESIGNATION (WORK DAYS) 315,00 7,00 45 000,00
ANNUAL - DISCOUNTING: UNUSED VACATION CREDITS (WORK DAYS) 206,00 3,00 68 667,00
ANNUAL - GRATUITY: DEATH/RETIREMENT/MEDICAL RETIREMENT (WORK) 44,00 1,00 44 000,00
Total 569,00 11,00
3.11 HIV/AIDS & Health Promotion Programmes
Table 3.11.1 Steps taken to reduce the risk of occupational exposure
Units/categories of employees identified to be at high risk of contracting HIV and related diseases (if any)
Key steps taken to reduce the risk
No employees have been classified as high risk Not applicable
Table 3.11.2 Details of health promotion and HIV/AIDS programmes (tick the applicable boxes and provide the required information)
Question Yes No Details, if yes
1. Has the Department designated a member of the SMS to implement the provisions contained in Part VI E of Chapter 1 of the Public Service Regulations 2001? If so, provide her/his name and positon.
X Tshegofatso Motaung. Chief Director: SHR and OM
2. Does the Department have a dedicated unit or has it designated specific staff members to promote the Health and well-being of employees? If so, indicate the number of employees who are involved in this task and the annual budget that is available for this purpose.
X R1 094 00.00
3. Has the Department introduced an Employee Assistance or Health Promotion Programme for employees? If so, indicate the key elements/services of this programme.
X Health Screenings are provided on a quarterly basis, Psycho-social assistance and monthly health awareness through the internal communication platform.
4. Has the Department established a committee as contemplated in Part VI E.5 (e) of Chapter 1 of the Public Service Regulations, 2001? If so, please provide names of members of the committee and the stakeholders that they represent.
X There is no dedicated committee to implement Part VI E.5(e).
5. Has the Department reviewed its employment policies and practices to ensure that these do not unfairly discriminate against employees on the unfair discrimination against employees on the basis of their HIV status? If so, list the employment policies/practices reviewed.
X Employee Health and Wellness Policy, Recruitment Policy and Leave Policy.
6. Has the Department introduced measures to protect HIV-positive protect HIV-positive employees or those perceived to be HIV-positive from discrimination? If so, list the key elements of these measures.
X Through the Management of HIV/AIDS in the Workplace, the Department has appointed a Wellness Service Provider to provide support for those infected and affected.
7. Does the Department encourage its employees to Undergo voluntary counselling and testing (VCT)? If so, list the results that you have achieved.
X The Department has partnered with Government Medical Scheme (GEMS) to conduct quarterly Voluntary counselling and testing (VCT) and 41% of employees tested in the financial year 2019/20.
8. Has the Department developed measures/indicators to monitor & evaluate the impact of its health Promotion programme? If so, list these measures/indicators to monitor & evaluate the impact of its health.
X The quarterly participation of employees in the wellness events and the increase in utilisation of services offered by the department.

64
3.12 Labour relations
Table 3.12.1 Collective agreements for the period 1 April 2018 to 31 March 2019
Subject matter Date
Total number of collective agreements 0
Table 3.12.2 Misconduct and disciplinary hearings finalised for the period 1 April 2019 to 31 March 2020
Outcomes of disciplinary hearings Number % of total
Correctional counselling 0 0
Verbal warning 0 0
Written warning 0 0
Final written warning 0 0
Suspended without pay 0 0
Fine 0 0
Demotion 0 0
Dismissal 0 0
Not guilty 0 0
Case withdrawn 0 0
Total 0 0
Total number of disciplinary hearings finalised 0
Table 3.12.3 Types of misconduct addressed at disciplinary hearings for the period 1 April 2019 to 31 March 2020
Type of misconduct Number % of total
Non-compliance to disclosure of all financial interests 0 0
Performing remunerative work without authority 0 0
Refusal to comply with lawful instruction/insubordination 0 0
Poor work performance for reasons other than incapacity 0 0
Damage to State property and unauthorised use 1 100
Total 1 100
Table 3.12.4 Grievances logged for the period 1 April 2019 to 31 March 2020
Grievances Number % of total
Number of grievances resolved 2 66.6
Number of grievances not resolved 1 33.3
TOTAL NUMBER OF GRIEVANCES 3 100
LODGED
Table 3.12.5 Disputes logged with councils for the period 1 April 2019 to 31 March 2020
Disputes Number % of total
Number of disputes upheld 0 0
Number of disputes dismissed 0 0
TOTAL NUMBER OF DISPUTES 0 0
LODGED 0 0
Table 3.12.6 Strike action for the period 1 April 2019 to 31 March 2020
Total number of persons working days lost 0
Total cost of working days lost 0
Amount recovered as a result of no work no pay (R’000) 0

PUBLIC ENTERPRISES I Annual Report 2019/2020
65
Table 3.12.7 Precautionary suspensions for the period 1 April 2019 to 31 March 2020
Number of people suspended 1
Number of people whose suspension exceeded 30 days 0
Average number of days suspended 8
Cost of suspension (R’000) R42 667.43
3.13 Skills development
Table 3.13.1 Training needs identified for the period 1 April 2019 to 31 March 2020
Occupational category Gender
Number of employees
as on 1 April 2020
Training needs to be identified at start of the reporting period
Internship
Skills programmes and other short
coursesOther forms of training Total
Legislators, senior officials and managers Female 24 0 15 0 15
Male 30 0 19 0 19
Professionals Female 20 0 14 0 14
Male 15 0 3 0 3
Technicians and associate professionals Female 16 0 12 0 12
Male 12 0 4 0 4
Administration/Clerks Female 34 0 4 0 4
Male 12 0 10 0 10
Elementary occupations Female 11 0 5 0 5
Male 4 0 0 0 0
Sub Total Female 105 0 0 0
Male 73 0 0 0
Total 178 0 77 0 77
Table 3.13.2 Training provided for the period 1 April 2019 to 31 March 2020
Occupational category Gender
Number of employees as at 1 April
2019
Training needs identified at the start of the reporting period
Internship
Skills programmes and other short
coursesOther forms of training Total
Legislators, senior officials and managers Female 24 0 12 2 14
Male 30 0 8 4 12
Professionals Female 20 0 2 6 8
Male 15 0 6 4 10
Technicians and associate professionals Female 16 0 13 6 19
Male 12 0 16 2 18
Clerks Female 34 0 16 3 19
Male 12 0 9 2 11
Elementary occupations Female 11 0 1 0 1
Male 4 0 0 0 0
Sub Total Female 105 0 85 29 114
Male 73 0
Total 178 0 85 29 114

66
Table 3.13.3 Injury on duty for the period 1 April 2019 to 31 March 2020
Nature of injury on duty Number % of total
Required basic medical attention only 0 0
Temporary total disability 0 0
Permanent disability 0 0
Fatal 0 0
Total 0 0
3.14 Severance packages
Table 3.14.1 Granting of employee initiated severance packages for the period 1 April 2019 to 31 March 2020
Salary band
Number of applications
received
Number of applications
referred to the MPSA
Number of applications
supported by MPSA
Number of packages approved by the Department
Skilled (Levels 3-5) 0 0 0 0
Highly skilled production (Levels 6-8) 0 0 0 0
Highly skilled supervision (Levels 9-12) 0 0 0 0
Senior management (Levels 13-16) 0 0 0 0
Total 0 0 0 0
3.15 Utilisation of consultants
Table 3.15.1 Report on consultant appointments using appropriated funds for the period 1 April 2019 to 31 March 2020
Project titleTotal number of consultants that worked on the project
Duration (work days)
Contract value in Rand
Forensic investigation into the relationship between Alexkor, Alexkor PSJV and its Marine Mining contractors 7 40 976 060.55
Forensic investigation into various allegations at DPE 4 90 972 207.63
Co-sourced internal audit and forensic investigation 3 20 448 594.88
Co-sourced internal audit service 9 160 1 581 486.26
Development and implementation of the enterprise architecture 7 120 177 744.00
Maintenance and support of Microsoft Share-point 2013 platform 4 130 694 267.09
Provision of IT technical support service 2 9 61 857.42
Maintenance and support of the opentext (edocs) Document Management System 3 21 128 340.00
Verification and awarding of B-BBEE certificate for the DPE 4 60 63 250.00
Facilitation of the strategic planning session 4 30 499 995.00
Impact assessment study of the corporatisation of NPA on Transnet SOC Limited 5 100 5 849 900.00
Audit of indemnity claim for 2018-2019 5 21 326 790.90
Re-design, maintaining and hosting of the DPE intranet and website 1 240 580 011.70
Legal advice 3 22 6 506 637.39
Legal advice on SAA business rescue 3 16 446 941.75
Development of a Board Evaluation Instrument 4 101 815 925.00
Review of Annual Financial Statements 7 7 60 352.00

PUBLIC ENTERPRISES I Annual Report 2019/2020
67
Total number of projects Total individual consultantsTotal duration
work days Total contract value in Rand
16 25 370 20 190 999.19
Table 3.15.2 Analysis of consultant appointments using appropriated funds, in terms of Historically Disadvantaged Individuals (HDIs) for the period 1 April 2019 – 31 March 2020
Project title Percentage ownership HDI
groups
Percentage management by HDI group
Number of consultants from HDI groups that
work on a project
Forensic investigation into the relationship between Alexkor, Alexkor PSJV & its marine mining contractors
61.60% 61.60% 7
Forensic investigation into various allegations at the DPE 100% 100% 4
Co-sourced internal audit and forensic services 100% 50% 3
Co-sourced internal audit 100% 25% 5
Development and implementation of the enterprise architecture 55% 33% 3
Maintenance and support of Microsoft Share-point 2013 platform 51% 51% 3
Provision of IT technical support service 100% 100% 2
Maintenance and support of the open text (edocs) Document Management System
51% 51% 1
Verification of B-BBEE certificate for DPE 100% 60% 3
Facilitation of the strategic planning session n/a 25% 1
Impact Assessment Study of the corporatisation of the NPA on Transnet SOC Limited and its operating division
100% 100% 2
Audit indemnity claims for 2018-2019 100% 100% 5
Re-design, maintenance and hosting of the DPE intranet and website 100% 33% 4
Legal advice 70% 70% 4
Legal advice on business rescue for SAA 33.33% 35% 3
Development of a Board Performance Evaluation Framework 51% 51% 2
Review of Annual Financial Statements 98% 98% 3
Table 3.15.3 Report on consultant appointments using Donor funds for the period 1 April 2019 to 31 March 2020
None.
Table 3.15.4 Analysis of consultant appointments using donor funds, in terms of Historically Disadvantaged Individuals (HDIs) for the period 1 April 2019 to 31 March 2020
None.

68

PART E FINANCIAL INFORMATION

70
Report of the Auditor-General to Parliament on Vote no.9: Department of Public Enterprises
Report on the audit of the financial statements
Opinion
1. I have audited the financial statements of the Department of Public Enterprises set out on pages 76 to 120, which comprise
the appropriation statement, statement of financial position as at 31 March 2020, statement of financial performance,
statement of changes in net assets and cash flow statement for the year then ended, as well as the notes to the financial
statements, including a summary of significant accounting policies.
2. In my opinion, the financial statements present fairly, in all material respects, the financial position of the Department of
Public Enterprises as at 31 March 2020, and its financial performance and cash flows for the year then ended in accordance
with Modified Cash Standard (MCS) as prescribed by the National Treasury and the requirements of the Public Finance
Management Act of South Africa, 1999 (Act No.1 of 1999) (PFMA).
Basis for opinion
3. I conducted my audit in accordance with the International Standards on Auditing (ISAs). My responsibilities under those
standards are further described in the auditor-general’s responsibilities for the audit of the financial statements section of
this auditor’s report.
4. I am independent of the department in accordance with sections 290 and 291 of the Code of ethics for professional
accountants and parts 1 and 3 of the International Code of Ethics for Professional Accountants (including International
Independence Standards) of the International Ethics Standards Board for Accountants (IESBA codes) as well as the ethical
requirements that are relevant to my audit in South Africa. I have fulfilled my other ethical responsibilities in accordance with
these requirements and the IESBA codes.
5. I believe that the audit evidence I have obtained is sufficient and appropriate to provide a basis for my opinion.
Emphasis of matter
6. I draw attention to the matter below. My opinion is not modified in respect of this matter.
Restatement of corresponding figures
7. As disclosed in note 32 to the financial statements, the corresponding figures for 31 March 2019 were restated as a result of
an error in the financial statements of the department at, and for the year ended, 31 March 2020.
Other matter
8. I draw attention to the matter below. My opinion is not modified in respect of this matter.
Unaudited supplementary schedules
9. The supplementary information set out on pages 121 to 130 does not form part of the financial statements and is presented
as additional information. I have not audited these schedules and, accordingly, I do not express an opinion on them.
Responsibilities of the accounting officer for the financial statements
10. The accounting officer is responsible for the preparation and fair presentation of the financial statements in accordance with
the MCS and the requirements of the PFMA, and for such internal control as the accounting officer determines is necessary
to enable the preparation of financial statements that are free from material misstatement, whether due to fraud or error.

PUBLIC ENTERPRISES I Annual Report 2019/2020
71
11. In preparing the financial statements, the accounting officer is responsible for assessing the department’s ability to continue
as a going concern, disclosing, as applicable, matters relating to going concern and using the going concern basis of
accounting unless the appropriate governance structure either intends to liquidate the department or to cease operations,
or has no realistic alternative but to do so.
Auditor-general’s responsibilities for the audit of the financial statements
12. My objectives are to obtain reasonable assurance about whether the financial statements as a whole are free from material
misstatement, whether due to fraud or error, and to issue an auditor’s report that includes my opinion. Reasonable assurance
is a high level of assurance but is not a guarantee that an audit conducted in accordance with the ISAs will always detect a
material misstatement when it exists. Misstatements can arise from fraud or error and are considered material if, individually
or in aggregate, they could reasonably be expected to influence the economic decisions of users taken on the basis of these
financial statements.
13. A further description of my responsibilities for the audit of the financial statements is included in the annexure to this
auditor’s report.
Report on the audit of the annual performance report
Introduction and scope
14. In accordance with the Public Audit Act of South Africa, 2004 (Act No. 25 of 2004) (PAA) and the general notice issued in
terms thereof, I have a responsibility to report on the usefulness and reliability of the reported performance information
against predetermined objectives for the selected programme presented in the annual performance report. I performed
procedures to identify material findings but not to gather evidence to express assurance.
15. My procedures address the usefulness and reliability of the reported performance information, which must be based on the
approved performance planning documents of the department. I have not evaluated the completeness and appropriateness
of the performance measures included in the planning documents. My procedures do not examine whether the actions
taken by the department enabled service delivery. My procedures also do not extend to any disclosures or assertions relating
to planned performance strategies and information in respect of future periods that may be included as part of the reported
performance information. Accordingly, my findings do not extend to these matters.
16. I evaluated the usefulness and reliability of the reported performance information in accordance with the criteria developed
from the performance management and reporting framework, as defined in the general notice, for the following selected
programme presented in the annual performance report of the department for the year ended 31 March 2020:
Programme Pages in the annual performance reportProgramme 3 – Business Enhancement and Industrialisation 28 – 38
17 I performed procedures to determine whether the reported performance information was properly presented and whether
performance was consistent with the approved performance planning documents. I performed further procedures to
determine whether the indicators and related targets were measurable and relevant, and assessed the reliability of the
reported performance information to determine whether it was valid, accurate and complete.
18. I did not identify any material findings on the usefulness and reliability of the reported performance information for this
programme:
• Programme 3 – Business Enhancement and Industrialisation

72
Other matters
19. I draw attention to the matters below.
Achievement of planned targets
20. Refer to the annual performance report on pages 19 to 38 for information on the achievement of planned targets for the
year and explanations provided for the under-/overachievement of a significant number of targets.
Adjustment of material misstatements
21. I identified material misstatements in the annual performance report submitted for auditing. These material misstatements
were in the reported performance information of Programme 3 – Business Enhancement and Industrialisation. As
management subsequently corrected the misstatements, I did not raise any material findings on the usefulness and
reliability of the reported performance information.
Report on the audit of compliance with legislation
Introduction and scope
22. In accordance with the PAA and the general notice issued in terms thereof, I have a responsibility to report material findings
on the department’s compliance with specific matters in key legislation. I performed procedures to identify findings but not
to gather evidence to express assurance.
23. The material findings on compliance with specific matters in key legislation are as follows:
Annual financial statements, performance and annual report
24. The financial statements submitted for auditing were not prepared in accordance with the prescribed financial reporting
framework as required by section 40(1) (b) of the PFMA. Material misstatements on disclosures for prior period error, related
parties and impairments of investments identified by the auditors in the submitted financial statements were corrected,
resulting in the financial statements receiving an unqualified opinion.
Other information
25. The accounting officer is responsible for the other information. The other information comprises the information included in
the annual report. The other information does not include the financial statements, the auditor’s report and those selected
programmes presented in the annual performance report that have been specifically reported in this auditor’s report.
26. My opinion on the financial statements and findings on the reported performance information and compliance with
legislation do not cover the other information and I do not express an audit opinion or any form of assurance conclusion
thereon.
27. In connection with my audit, my responsibility is to read the other information and, in doing so, consider whether the other
information is materially inconsistent with the financial statements and the selected programme presented in the annual
performance report, or my knowledge obtained in the audit, or otherwise appears to be materially misstated.
28. If based on the work we have performed, we conclude that there is a material misstatement in the other information; we are
required to report that fact. We have nothing to report in this regard.

PUBLIC ENTERPRISES I Annual Report 2019/2020
73
Internal control deficiencies
29. I considered internal control relevant to my audit of the financial statements, reported performance information and
compliance with applicable legislation; however, my objective was not to express any form of assurance on it. The matters
reported below are limited to the significant internal control deficiencies that resulted in the findings on compliance with
legislation included in this report.
30. Controls implemented by management for the review of the annual financial statements and the reported performance
information were not adequate as material misstatements were identified in the annual financial statements and the
reported performance information.
Pretoria
30 September 2020

74
Annexure – Auditor-General’s responsibility for the audit
1. As part of an audit in accordance with the ISAs, I exercise professional judgement and maintain professional scepticism
throughout my audit of the financial statements and the procedures performed on reported performance information for
selected programmes and on the department’s compliance with respect to the selected subject matters.
Financial statements
2. In addition to my responsibility for the audit of the financial statements as described in this auditor’s report, I also:
• identify and assess the risks of material misstatement of the financial statements, whether due to fraud or error; design and
perform audit procedures responsive to those risks; and obtain audit evidence that is sufficient and appropriate to provide
a basis for my opinion. The risk of not detecting a material misstatement resulting from fraud is higher than for one resulting
from error, as fraud may involve collusion, forgery, intentional omissions, misrepresentations or the override of internal control.
• obtain an understanding of internal control relevant to the audit in order to design audit procedures that are appropriate in
the circumstances, but not for the purpose of expressing an opinion on the effectiveness of the department’s internal control.
• evaluate the appropriateness of accounting policies used and the reasonableness of accounting estimates and related
disclosures made by the accounting officer.
• conclude on the appropriateness of the accounting officer’s use of the going concern basis of accounting in the preparation of
the financial statements. I also conclude, based on the audit evidence obtained, whether a material uncertainty exists relating
to events or conditions that may cast significant doubt on the ability of the Department of Public Enterprises to continue as
a going concern. If I conclude that a material uncertainty exists, I am required to draw attention in my auditor’s report to the
related disclosures in the financial statements about the material uncertainty or, if such disclosures are inadequate, to modify
my opinion on the financial statements. My conclusions are based on the information available to me at the date of this
auditor’s report. However, future events or conditions may cause a department to cease operating as a going concern.
• evaluate the overall presentation, structure and content of the financial statements, including the disclosures, and determine
whether the financial statements represent the underlying transactions and events in a manner that achieves fair presentation.
Communication with those charged with governance
3. I communicate with the accounting officer regarding, among other matters, the planned scope and timing of the audit and
significant audit findings, including any significant deficiencies in internal control that I identified during my audit.
4. I also confirm to the accounting officer that I have complied with relevant ethical requirements regarding independence, and
communicate all relationships and other matters that may reasonably be thought to have a bearing on my independence
and, where applicable, actions taken to eliminate threats or safeguards applied.

PUBLIC ENTERPRISES I Annual Report 2019/2020
75
Table of ContentsAppropriation Statement 76
Notes to the Appropriation Statement 94
Statement of Financial Performance 95
Statement of Financial Position 96
Statement of Changes in Net Assets 97
Cash Flow Statement 98
Notes to the Annual Financial Statements (including Accounting policies) 99
Annexures 121

76
DEP
ART
MEN
T O
F PU
BLIC
EN
TERP
RISE
SVO
TE 0
9
APP
ROPR
IATI
ON
STA
TEM
ENT
FOR
THE
YEA
R EN
DED
31
MA
RCH
202
0
App
ropr
iatio
n pe
r pro
gram
me
2019
/20
2018
/19
Adj
uste
d A
ppro
pria
tion
Shift
ing
of
Fund
sVi
rem
ent
Fina
l A
ppro
pria
tion
Act
ual
Expe
nditu
reVa
rian
ceEx
pend
iture
as
% o
f fin
al
appr
opri
atio
n
Fina
l A
ppro
pria
tion
Act
ual
Expe
nditu
re
R’00
0R’
000
R’00
0R’
000
R’00
0R’
000
%R’
000
R’00
0
Prog
ram
me
1.
Adm
inis
trat
ion
163
121
--
163
121
149
077
14 0
4491
.4%
151
979
136
031
2.
Stat
e-ow
ned
Com
pani
es
Gov
erna
nce
Ass
uran
ce a
nd
Perf
orm
ance
41 6
13-
-41
613
36 8
804
733
88.6
%39
084
33 4
90
3.
Busi
ness
Enh
ance
men
t, Tr
ansf
orm
atio
n an
d In
dust
rial
isat
ion
56 6
78 2
96-
-56
678
296
56 6
60 4
3217
864
100.
0%6
331
851
6 30
5 27
2
TOTA
L56
883
030
--
56 8
83 0
3056
846
389
36 6
4199
.9%
6 52
2 91
46
474
793
2019
/20
2018
/19
Fina
l A
ppro
pria
tion
Act
ual
Expe
nditu
reFi
nal
App
ropr
iatio
nA
ctua
l Ex
pend
iture
TOTA
L (b
roug
ht fo
rwar
d)56
883
030
56 8
46 3
896
522
914
6 47
4 79
3
Reco
ncili
atio
n w
ith s
tate
men
t of fi
nanc
ial p
erfo
rman
ce
AD
D
Dep
artm
enta
l rec
eipt
s10
936
6
Aid
ass
ista
nce
11 3
4511
348
Act
ual a
mou
nts
per s
tate
men
t of fi
nanc
ial p
erfo
rman
ce (t
otal
reve
nue)
56 8
94 4
846
534
628
AD
D
Aid
ass
ista
nce
-63
5
Act
ual a
mou
nts
per s
tate
men
t of fi
nanc
ial p
erfo
rman
ce (t
otal
exp
endi
ture
)56
846
389
6 47
5 42
8

Annual Financial Statements
77
DEP
ART
MEN
T O
F PU
BLIC
EN
TERP
RISE
SVO
TE 0
9
APP
ROPR
IATI
ON
STA
TEM
ENT
FOR
THE
YEA
R EN
DED
31
MA
RCH
202
0
App
ropr
iatio
n pe
r eco
nom
ic c
lass
ifica
tion
2019
/20
2018
/19
Adj
uste
d A
ppro
pria
tion
Shift
ing
of
Fund
sVi
rem
ent
Fina
l A
ppro
pria
tion
Act
ual
Expe
nditu
reVa
rian
ceEx
pend
iture
as
% o
f fina
l ap
prop
riat
ion
Fina
l A
ppro
pria
tion
Act
ual
expe
nditu
re
R’00
0R’
000
R’00
0R’
000
R’00
0R’
000
%R’
000
R’00
0
Econ
omic
cla
ssifi
catio
n
Curr
ent p
aym
ents
274
270
(4 1
22)
-27
0 14
823
3 99
236
156
86.6
%26
3 58
621
5 49
4
Com
pens
atio
n of
em
ploy
ees
170
228
--
170
228
149
189
21 0
3987
.6%
170
770
143
813
Sala
ries
and
wag
es15
7 38
6(2
998
)-
154
388
135
027
19 3
6187
.5%
154
602
130
347
Soci
al c
ontr
ibut
ions
12 8
422
998
-15
840
14 1
631
677
89.4
%16
168
13 4
66
Goo
ds a
nd s
ervi
ces
104
042
(4 1
22)
-99
920
84 8
0315
117
84.9
%92
816
71 6
81
Adm
inis
trat
ive
fees
1 56
2(1
001
)-
561
545
1697
.1%
1 04
11
037
Adv
ertis
ing
2 26
3(2
020
)-
243
237
697
.6%
1 37
575
2
Min
or a
sset
s16
543
3-
598
590
898
.6%
1 46
41
406
Aud
it co
sts:
Exte
rnal
3 55
429
8-
3 85
23
851
110
0.0%
3 96
23
962
Burs
arie
s: Em
ploy
ees
898
(350
)-
548
548
-99
.9%
617
617
Cate
ring:
Dep
artm
enta
l act
iviti
es96
1(7
37)
-22
413
985
62.3
%26
619
1
Com
mun
icat
ion
5 17
9(1
629
)-
3 55
03
081
469
86.8
%2
984
2 28
9
Com
pute
r ser
vice
s5
360
1 35
9-
6 71
96
702
1799
.7%
5 50
85
400
Cons
ulta
nts:
Busi
ness
and
ad
viso
ry s
ervi
ces
32 7
24(1
2 06
9)-
20 6
5512
151
8 50
458
.8%
16 1
456
582
Infra
stru
ctur
e an
d pl
anni
ng
serv
ices
--
--
--
-19
118
9
Lega
l ser
vice
s3
466
11 0
86-
14 5
5214
211
341
97.7
%6
190
6 18
8
Cont
ract
ors
4 36
4(1
336
)-
3 02
81
466
1 56
248
.4%
4 05
61
420
Age
ncy
and
supp
ort /
ou
tsou
rced
ser
vice
s48
5(9
1)-
394
391
399
.2%
590
188
Ente
rtai
nmen
t32
--
32-
32-
333
Flee
t ser
vice
s (in
clud
ing
gove
rnm
ent m
otor
tran
spor
t)1
072
(2)
-1
070
1 07
0-
100.
0%80
078
5
Cons
umab
le s
uppl
ies
437
226
-66
362
538
94.3
%1
573
1 42
3

78
DEP
ART
MEN
T O
F PU
BLIC
EN
TERP
RISE
SVO
TE 0
9
APP
ROPR
IATI
ON
STA
TEM
ENT
FOR
THE
YEA
R EN
DED
31
MA
RCH
202
0
App
ropr
iatio
n pe
r eco
nom
ic c
lass
ifica
tion
2019
/20
2018
/19
Adj
uste
d A
ppro
pria
tion
Shift
ing
of
Fund
sVi
rem
ent
Fina
l A
ppro
pria
tion
Act
ual
Expe
nditu
reVa
rian
ceEx
pend
iture
as
% o
f fina
l ap
prop
riat
ion
Fina
l A
ppro
pria
tion
Act
ual
expe
nditu
re
R’00
0R’
000
R’00
0R’
000
R’00
0R’
000
%R’
000
R’00
0
Cons
umab
le: S
tatio
nery
, prin
ting
and
office
sup
plie
s1
511
(355
)-
1 15
61
081
7593
.5%
1 43
41
430
Ope
ratin
g le
ases
11 2
662
110
-13
376
13 3
679
99.9
%15
939
15 9
26
Prop
erty
pay
men
ts4
085
897
-4
982
4 98
02
100.
0%3
677
3 67
2
Tran
spor
t pro
vide
d:
Dep
artm
enta
l act
ivity
260
(260
)-
--
--
50-
Trav
el a
nd s
ubsi
sten
ce18
757
800
-19
557
15 7
283
829
80.4
%20
368
14 9
41
Trai
ning
and
dev
elop
men
t1
162
(300
)-
862
849
1398
.4%
810
809
Ope
ratin
g pa
ymen
ts2
448
(199
)-
2 24
92
244
599
.8%
1 94
51
880
Venu
es a
nd fa
cilit
ies
1 45
0(4
76)
-97
487
310
189
.7%
1 23
458
0
Rent
al a
nd h
iring
581
(506
)-
7575
-99
.7%
564
12
Tran
sfer
s an
d su
bsid
ies
5 32
23
285
-8
607
8 12
847
994
.4%
1 05
31
041
Prov
ince
s an
d m
unic
ipal
ities
114
-15
15-
100.
0%12
12
Mun
icip
aliti
es11
4-
1515
-10
0.0%
1212
Mun
icip
al b
ank
acco
unts
114
-15
15-
100.
0%12
12
Publ
ic c
orpo
ratio
ns a
nd p
rivat
e en
terp
rises
1 02
52
977
-4
002
3 57
442
889
.3%
--
Publ
ic c
orpo
ratio
ns-
2 97
7-
2 97
72
976
110
0.0%
--
Oth
er tr
ansf
ers
to p
ublic
co
rpor
atio
ns-
2 97
7-
2 97
72
976
110
0.0%
--
Priv
ate
ente
rpris
es1
025
--
1 02
559
842
758
.3%
--
Oth
er tr
ansf
ers
to p
rivat
e en
terp
rises
1 02
5-
-1
025
598
427
58.3
%-
-
Hou
seho
lds
4 28
630
4-
4 59
04
539
5198
.9%
1 04
11
029
Soci
al b
enefi
ts4
286
304
-4
590
4 53
951
98.9
%1
041
1 02
9

Annual Financial Statements
79
DEP
ART
MEN
T O
F PU
BLIC
EN
TERP
RISE
SVO
TE 0
9
APP
ROPR
IATI
ON
STA
TEM
ENT
FOR
THE
YEA
R EN
DED
31
MA
RCH
202
0
App
ropr
iatio
n pe
r eco
nom
ic c
lass
ifica
tion
2019
/20
2018
/19
Adj
uste
d A
ppro
pria
tion
Shift
ing
of
Fund
sVi
rem
ent
Fina
l A
ppro
pria
tion
Act
ual
Expe
nditu
reVa
rian
ceEx
pend
iture
as
% o
f fina
l ap
prop
riat
ion
Fina
l A
ppro
pria
tion
Act
ual
expe
nditu
re
R’00
0R’
000
R’00
0R’
000
R’00
0R’
000
%R’
000
R’00
0
Paym
ents
for c
apita
l ass
ets
3 43
879
5-
4 23
34
228
599
.9%
9 27
09
253
Mac
hine
ry a
nd e
quip
men
t3
288
912
-4
200
4 19
73
99.9
%8
813
8 79
7
Oth
er m
achi
nery
and
equ
ipm
ent
3 28
891
2-
4 20
04
197
399
.9%
8 81
38
797
Inta
ngib
le a
sset
s15
0(1
17)
-33
312
93.9
%45
745
6
Paym
ents
for fi
nanc
ial a
sset
s56
600
000
42-
56 6
00 0
4256
600
041
110
0.0%
6 24
9 00
56
249
005
TOTA
L56
883
030
--
56 8
83 0
3056
846
389
36 6
4199
.9%
6 52
2 91
46
474
793

80
Prog
ram
me
1: A
dmin
istr
atio
n
2019
/20
2018
/19
Adj
uste
d A
ppro
pria
tion
Shift
ing
of
Fund
sVi
rem
ent
Fina
l A
ppro
pria
tion
Act
ual
Expe
nditu
reVa
rian
ceEx
pend
iture
as
% o
f fina
l ap
prop
riat
ion
Fina
l A
ppro
pria
tion
Act
ual
expe
nditu
re
R’00
0R’
000
R’00
0R’
000
R’00
0R’
000
%R’
000
R’00
0
Sub
prog
ram
me
1.1
Min
istr
y30
908
11 2
07-
42 1
1539
367
2 74
893
.5%
29 0
5222
265
1.2
Man
agem
ent
20 8
52(9
386
)-
11 4
6610
962
504
95.6
%14
197
11 8
94
1.3
Com
mun
icat
ions
40 2
28(8
411
)-
31 8
1728
864
2 95
390
.7%
36 8
0333
627
1.4
Chi
ef F
inan
cial
Offi
cer
19 3
671
826
-21
193
20 7
8440
998
.1%
17 6
4917
166
1.5
Hum
an R
esou
rces
29 3
3247
3-
29 8
0524
355
5 45
081
.7%
29 1
2427
547
1.6
Inte
rnal
Aud
it6
888
450
-7
338
5 53
91
799
75.5
%4
624
3 58
6
1.7
Corp
orat
e Se
rvic
es3
977
73-
4 05
03
870
180
95.6
%3
799
3 21
8
1.8
Offi
ce A
ccom
mod
atio
n11
569
3 76
8-
15 3
3715
335
210
0.0%
16 7
3116
728
Tota
l for
sub
pro
gram
mes
163
121
--
163
121
149
077
14 0
4491
.4%
151
979
136
031
Econ
omic
cla
ssifi
catio
n
Curr
ent p
aym
ents
155
447
(3 8
50)
-15
1 59
713
7 60
913
988
90.8
%14
1 72
612
5 80
6
Com
pens
atio
n of
em
ploy
ees
85 4
21-
-85
421
72 1
0713
314
84.4
%81
667
69 6
44
Sala
ries
and
wag
es79
076
(1 1
69)
-77
907
65 1
1512
792
83.6
%73
850
62 9
93
Soci
al c
ontr
ibut
ions
6 34
51
169
-7
514
6 99
352
193
.1%
7 81
76
651
Goo
ds a
nd s
ervi
ces
70 0
26(3
850
)-
66 1
7665
501
675
99.0
%60
059
56 1
62
Adm
inis
trat
ive
fees
1 56
2(1
029
)-
533
517
1697
.0%
1 04
11
037
Adv
ertis
ing
2 26
3(2
020
)-
243
237
697
.6%
1 29
775
2
Min
or a
sset
s16
543
3-
598
590
898
.6%
1 46
41
406
Aud
it co
sts:
Exte
rnal
3 55
429
8-
3 85
23
851
110
0.0%
3 9
62
3 9
62
Burs
arie
s: Em
ploy
ees
898
(350
)-
548
548
-99
.9%
617
6
17
Cate
ring:
Dep
artm
enta
l act
iviti
es91
2(7
44)
-16
810
662
62.9
% 2
19
171
Com
mun
icat
ion
4 26
0(1
584
)-
2 67
62
667
999
.7%
2 1
32
1 9
33
Com
pute
r ser
vice
s5
360
1 35
9-
6 71
96
702
1799
.7%
5 5
08
5 4
00
Cons
ulta
nts:
Busi
ness
and
ad
viso
ry s
ervi
ces
12 5
94(8
249
)-
4 34
54
311
3499
.2%
2 22
52
221
DEP
ART
MEN
T O
F PU
BLIC
EN
TERP
RISE
SVO
TE 0
9
APP
ROPR
IATI
ON
STA
TEM
ENT
FOR
THE
YEA
R EN
DED
31
MA
RCH
202
0

Annual Financial Statements
81
Prog
ram
me
1: A
dmin
istr
atio
n
2019
/20
2018
/19
Adj
uste
d A
ppro
pria
tion
Shift
ing
of
Fund
sVi
rem
ent
Fina
l A
ppro
pria
tion
Act
ual
Expe
nditu
reVa
rian
ceEx
pend
iture
as
% o
f fina
l ap
prop
riat
ion
Fina
l A
ppro
pria
tion
Act
ual
expe
nditu
re
R’00
0R’
000
R’00
0R’
000
R’00
0R’
000
%R’
000
R’00
0
Infra
stru
ctur
e an
d pl
anni
ng
serv
ices
--
--
--
-19
118
9
Lega
l ser
vice
s49
98
738
-9
237
9 23
16
99.9
%67
967
8
Cont
ract
ors
2 76
8(2
232
)-
536
491
4591
.6%
1 94
01
285
Age
ncy
and
supp
ort /
ou
tsou
rced
ser
vice
s48
5(9
1)-
394
391
399
.2%
590
188
Ente
rtai
nmen
t-
--
--
--
33
Flee
t ser
vice
s (in
clud
ing
gove
rnm
ent m
otor
tran
spor
t)1
072
(2)
-1
070
1 07
0-
100.
0%80
078
5
Cons
umab
le s
uppl
ies
437
226
-66
362
538
94.3
%1
515
1 42
3
Cons
umab
le: S
tatio
nery
, prin
ting
and
office
sup
plie
s1
511
(369
)-
1 14
21
068
7493
.5%
1 43
41
430
Ope
ratin
g le
ases
11 2
662
110
-13
376
13 3
679
99.9
%15
939
15 9
26
Prop
erty
pay
men
ts4
085
897
-4
982
4 98
02
100.
0%3
677
3 67
2
Tran
spor
t pro
vide
d:
Dep
artm
enta
l act
ivity
260
(260
)-
--
--
50-
Trav
el a
nd s
ubsi
sten
ce10
511
920
-11
431
11 1
1631
597
.2%
11 2
1310
046
Trai
ning
and
dev
elop
men
t1
162
(300
)-
862
849
1398
.4%
810
809
Ope
ratin
g pa
ymen
ts2
448
(395
)-
2 05
32
049
499
.8%
1 76
31
699
Venu
es a
nd fa
cilit
ies
1 37
3(7
00)
-67
366
310
98.5
%89
752
9
Rent
al a
nd h
iring
581
(506
)-
7575
-99
.7%
931
Tran
sfer
s an
d su
bsid
ies
4 26
82
981
-7
249
7 19
950
99.3
%97
896
8
Prov
ince
s an
d m
unic
ipal
ities
114
-15
15-
100.
0%12
12
Mun
icip
aliti
es11
4-
1515
-10
0.0%
1212
Mun
icip
al b
ank
acco
unts
114
-15
15-
100.
0%12
12
DEP
ART
MEN
T O
F PU
BLIC
EN
TERP
RISE
SVO
TE 0
9
APP
ROPR
IATI
ON
STA
TEM
ENT
FOR
THE
YEA
R EN
DED
31
MA
RCH
202
0
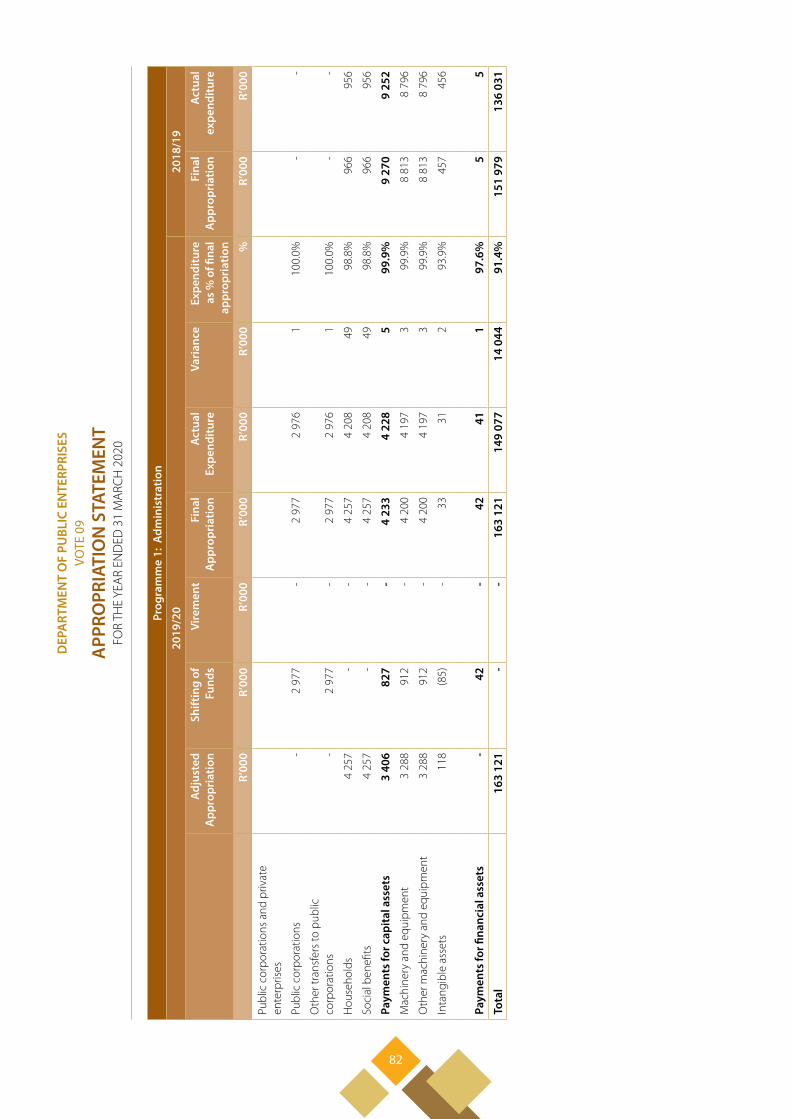
82
Prog
ram
me
1: A
dmin
istr
atio
n
2019
/20
2018
/19
Adj
uste
d A
ppro
pria
tion
Shift
ing
of
Fund
sVi
rem
ent
Fina
l A
ppro
pria
tion
Act
ual
Expe
nditu
reVa
rian
ceEx
pend
iture
as
% o
f fina
l ap
prop
riat
ion
Fina
l A
ppro
pria
tion
Act
ual
expe
nditu
re
R’00
0R’
000
R’00
0R’
000
R’00
0R’
000
%R’
000
R’00
0
Publ
ic c
orpo
ratio
ns a
nd p
rivat
e en
terp
rises
Publ
ic c
orpo
ratio
ns-
2 97
7-
2 97
72
976
110
0.0%
--
Oth
er tr
ansf
ers
to p
ublic
co
rpor
atio
ns-
2 97
7-
2 97
72
976
110
0.0%
--
Hou
seho
lds
4 25
7-
-4
257
4 20
849
98.8
%96
695
6
Soci
al b
enefi
ts4
257
--
4 25
74
208
4998
.8%
966
956
Paym
ents
for c
apita
l ass
ets
3 40
682
7-
4 23
34
228
599
.9%
9 27
09
252
Mac
hine
ry a
nd e
quip
men
t3
288
912
-4
200
4 19
73
99.9
%8
813
8 79
6
Oth
er m
achi
nery
and
equ
ipm
ent
3 28
891
2-
4 20
04
197
399
.9%
8 81
38
796
Inta
ngib
le a
sset
s11
8(8
5)-
3331
293
.9%
457
456
Paym
ents
for fi
nanc
ial a
sset
s-
42-
4241
197
.6%
55
Tota
l16
3 12
1-
-16
3 12
114
9 07
714
044
91.4
%15
1 97
913
6 03
1
DEP
ART
MEN
T O
F PU
BLIC
EN
TERP
RISE
SVO
TE 0
9
APP
ROPR
IATI
ON
STA
TEM
ENT
FOR
THE
YEA
R EN
DED
31
MA
RCH
202
0

Annual Financial Statements
83
1.1
Min
istr
y
2019
/20
2018
/19
Econ
omic
cla
ssifi
catio
n
Adj
uste
d A
ppro
pria
tion
Shift
ing
of
Fund
sVi
rem
ent
Fina
l A
ppro
pria
tion
Act
ual
Expe
nditu
reVa
rian
ceEx
pend
iture
as
% o
f fina
l ap
prop
riat
ion
Fina
l A
ppro
pria
tion
Act
ual
expe
nditu
re
R’00
0R’
000
R’00
0R’
000
R’00
0R’
000
%R’
000
R’00
0
Curr
ent p
aym
ents
30 7
5211
207
-41
959
39 2
592
700
93.6
%28
584
21 8
06
Com
pens
atio
n of
em
ploy
ees
23 0
95-
-23
095
20 4
652
630
88.6
%20
620
13 9
67
Goo
ds a
nd s
ervi
ces
7 65
711
207
-18
864
18 7
9470
99.6
%7
964
7 83
9
Tran
sfer
s an
d su
bsid
ies
156
--
156
108
4869
.2%
468
459
Hou
seho
lds
156
--
156
108
4869
.2%
468
459
1.2
Man
agem
ent
2019
/20
2018
/19
Econ
omic
cla
ssifi
catio
n
Adj
uste
d A
ppro
pria
tion
Shift
ing
of
Fund
sVi
rem
ent
Fina
l A
ppro
pria
tion
Act
ual
Expe
nditu
reVa
rian
ceEx
pend
iture
as
% o
f fina
l ap
prop
riat
ion
Fina
l A
ppro
pria
tion
Act
ual
expe
nditu
re
R’00
0R’
000
R’00
0R’
000
R’00
0R’
000
%R’
000
R’00
0
Curr
ent p
aym
ents
16 7
83(9
386
)-
7 39
76
894
503
93.2
%13
835
11 5
33
Com
pens
atio
n of
em
ploy
ees
6 07
4-
-6
074
5 63
044
492
.7%
9 78
29
772
Goo
ds a
nd s
ervi
ces
10 7
09(9
386
)-
1 32
31
264
5995
.6%
4 05
31
761
Tran
sfer
s an
d su
bsid
ies
4 06
9-
-4
069
4 06
81
100.
0%36
236
1
Hou
seho
lds
4 06
9-
-4
069
4 06
81
100.
0%36
236
1
DEP
ART
MEN
T O
F PU
BLIC
EN
TERP
RISE
SVO
TE 0
9
APP
ROPR
IATI
ON
STA
TEM
ENT
FOR
THE
YEA
R EN
DED
31
MA
RCH
202
0

84
1.3
Com
mun
icat
ions
2019
/20
2018
/19
Econ
omic
cla
ssifi
catio
n
Adj
uste
d A
ppro
pria
tion
Shift
ing
of
Fund
sVi
rem
ent
Fina
l A
ppro
pria
tion
Act
ual
Expe
nditu
reVa
rian
ceEx
pend
iture
as
% o
f fina
l ap
prop
riat
ion
Fina
l A
ppro
pria
tion
Act
ual
expe
nditu
re
R’00
0R’
000
R’00
0R’
000
R’00
0R’
000
%R’
000
R’00
0Cu
rren
t pay
men
ts36
895
(6 6
95)
-30
200
27 2
512
949
90.2
%29
796
26 6
23Co
mpe
nsat
ion
of e
mpl
oyee
s17
477
--
17 4
7714
644
2 83
383
.8%
17 1
0314
570
Goo
ds a
nd s
ervi
ces
19 4
18(6
695
)-
12 7
2312
607
116
99.1
%12
693
12 0
53
Tran
sfer
s an
d su
bsid
ies
19-
-19
19-
100.
0%13
613
6H
ouse
hold
s19
--
1919
-10
0.0%
136
136
Paym
ents
for c
apita
l ass
ets
3 31
4(1
716
)-
1 59
81
594
499
.7%
6 87
16
868
Mac
hine
ry a
nd e
quip
men
t3
196
(1 6
31)
-1
565
1 56
32
99.9
%6
414
6 41
2
Soft
war
e an
d ot
her i
ntan
gibl
e as
sets
118
(85)
-33
312
93.9
%45
745
6
1.4
Chie
f Fin
anci
al O
ffice
r20
19/2
020
18/1
9
Econ
omic
cla
ssifi
catio
n
Adj
uste
d A
ppro
pria
tion
Shift
ing
of
Fund
sVi
rem
ent
Fina
l A
ppro
pria
tion
Act
ual
Expe
nditu
reVa
rian
ceEx
pend
iture
as
% o
f fina
l ap
prop
riat
ion
Fina
l A
ppro
pria
tion
Act
ual
expe
nditu
re
R’00
0R’
000
R’00
0R’
000
R’00
0R’
000
%R’
000
R’00
0Cu
rren
t pay
men
ts19
356
(631
)-
18 7
2518
317
408
97.8
%17
632
17 1
49Co
mpe
nsat
ion
of e
mpl
oyee
s11
832
--
11 8
3211
522
310
97.4
%10
432
9 99
4
Goo
ds a
nd s
ervi
ces
7 52
4(6
31)
-6
893
6 79
598
98.6
%7
200
7 15
5
Tran
sfer
s an
d su
bsid
ies
114
-15
15-
100.
0%12
12Pr
ovin
ces
& M
unic
ipal
ities
114
-15
15-
100.
0%12
12
Paym
ents
for c
apita
l ass
ets
-2
411
-2
411
2 41
1-
100.
0%-
-M
achi
nery
and
equ
ipm
ent
-2
411
-2
411
2 41
1-
100.
0%-
-
Paym
ents
for fi
nanc
ial a
sset
s-
42-
4241
197
.6%
55
DEP
ART
MEN
T O
F PU
BLIC
EN
TERP
RISE
SVO
TE 0
9
APP
ROPR
IATI
ON
STA
TEM
ENT
FOR
THE
YEA
R EN
DED
31
MA
RCH
202
0

Annual Financial Statements
85
1.5
Hum
an R
esou
rces
2019
/20
2018
/19
Econ
omic
cla
ssifi
catio
n
Adj
uste
d A
ppro
pria
tion
Shift
ing
of
Fund
sVi
rem
ent
Fina
l A
ppro
pria
tion
Act
ual
Expe
nditu
reVa
rian
ceEx
pend
iture
as
% o
f fina
l ap
prop
riat
ion
Fina
l A
ppro
pria
tion
Act
ual
expe
nditu
re
R’00
0R’
000
R’00
0R’
000
R’00
0R’
000
%R’
000
R’00
0
Curr
ent p
aym
ents
29 2
27(2
636
)-
26 5
9121
143
5 44
879
.5%
26 7
2525
162
Com
pens
atio
n of
em
ploy
ees
19 6
94-
-19
694
14 4
695
225
73.5
%17
282
15 8
86
Goo
ds a
nd s
ervi
ces
9 53
3(2
636
)-
6 89
76
674
223
96.8
%9
443
9 27
6
Tran
sfer
s an
d su
bsid
ies
132
977
-2
990
2 98
91
100.
0%-
-
Publ
ic c
orpo
ratio
ns a
nd p
rivat
e en
terp
rises
-
2 97
7-
2 97
72
976
110
0.0%
--
Hou
seho
lds
13-
1313
-10
0.0%
--
Paym
ents
for c
apita
l ass
ets
9213
2-
224
223
199
.6%
2 39
92
385
Mac
hine
ry a
nd e
quip
men
t92
132
-22
422
31
99.6
%2
399
2 38
5
1.6
Inte
rnal
Aud
it
2019
/20
2018
/19
Econ
omic
cla
ssifi
catio
n
Adj
uste
d A
ppro
pria
tion
Shift
ing
of
Fund
sVi
rem
ent
Fina
l A
ppro
pria
tion
Act
ual
Expe
nditu
reVa
rian
ceEx
pend
iture
as
% o
f fina
l ap
prop
riat
ion
Fina
l A
ppro
pria
tion
Act
ual
expe
nditu
re
R’00
0R’
000
R’00
0R’
000
R’00
0R’
000
%R’
000
R’00
0
Curr
ent p
aym
ents
6 88
845
0-
7 33
85
539
1 79
975
.5%
4 62
43
586
Com
pens
atio
n of
em
ploy
ees
3 83
3-
-3
833
2 09
91
734
54.8
%3
186
2 25
8
Goo
ds a
nd s
ervi
ces
3 05
545
0-
3 50
53
440
6598
.1%
1 43
81
328
DEP
ART
MEN
T O
F PU
BLIC
EN
TERP
RISE
SVO
TE 0
9
APP
ROPR
IATI
ON
STA
TEM
ENT
FOR
THE
YEA
R EN
DED
31
MA
RCH
202
0

86
1.7
Corp
orat
e Se
rvic
es
2019
/20
2018
/19
Econ
omic
cla
ssifi
catio
n
Adj
uste
d A
ppro
pria
tion
Shift
ing
of
Fund
sVi
rem
ent
Fina
l A
ppro
pria
tion
Act
ual
Expe
nditu
reVa
rian
ceEx
pend
iture
as
% o
f fina
l ap
prop
riat
ion
Fina
l A
ppro
pria
tion
Act
ual
expe
nditu
re
R’00
0R’
000
R’00
0R’
000
R’00
0R’
000
%R’
000
R’00
0
Curr
ent p
aym
ents
3 97
773
-4
050
3 87
018
095
.6%
3 79
93
218
Com
pens
atio
n of
em
ploy
ees
3 41
6-
-3
416
3 27
813
896
.0%
3 26
23
196
Goo
ds a
nd s
ervi
ces
561
73-
634
592
4293
.4%
537
22
1.8
Offi
ce A
ccom
mod
atio
n
2019
/20
2018
/19
Econ
omic
cla
ssifi
catio
n
Adj
uste
d A
ppro
pria
tion
Shift
ing
of
Fund
sVi
rem
ent
Fina
l A
ppro
pria
tion
Act
ual
Expe
nditu
reVa
rian
ceEx
pend
iture
as
% o
f fina
l ap
prop
riat
ion
Fina
l A
ppro
pria
tion
Act
ual
expe
nditu
re
R’00
0R’
000
R’00
0R’
000
R’00
0R’
000
%R’
000
R’00
0
Curr
ent p
aym
ents
11 5
693
768
-15
337
15 3
352
100.
0%16
731
16 7
28
Goo
ds a
nd s
ervi
ces
11 5
693
768
-15
337
15 3
352
100.
0%16
731
16 7
28
DEP
ART
MEN
T O
F PU
BLIC
EN
TERP
RISE
SVO
TE 0
9
APP
ROPR
IATI
ON
STA
TEM
ENT
FOR
THE
YEA
R EN
DED
31
MA
RCH
202
0

Annual Financial Statements
87
Prog
ram
me
2: S
tate
-ow
ned
Com
pani
es G
over
nanc
e A
ssur
ance
and
Per
form
ance
2019
/20
2018
/19
Adj
uste
d A
ppro
pria
tion
Shift
ing
of
Fund
sVi
rem
ent
Fina
l A
ppro
pria
tion
Act
ual
Expe
nditu
reVa
rian
ceEx
pend
iture
as
% o
f fina
l ap
prop
riat
ion
Fina
l A
ppro
pria
tion
Act
ual
expe
nditu
re
R’00
0R’
000
R’00
0R’
000
R’00
0R’
000
%R’
000
R’00
0
Sub
prog
ram
me
2.1
Man
agem
ent
3 12
0(1
31)
-2
989
1 97
81
011
66.2
%2
989
2 73
9
2.2
Leg
al12
231
1 48
3-
13 7
1411
104
2 61
081
.0%
14 8
3012
066
2.3
Gov
erna
nce
11 5
8986
2-
12 4
5111
627
824
93.4
%9
565
8 78
2
2.4
Fin
anci
al A
sses
smen
t and
In
vest
men
t Sup
port
14 6
73(2
214
)-
12 4
5912
172
287
97.7
%11
700
9 90
3
Tota
l for
sub
pro
gram
mes
41 6
13-
-41
613
36 8
804
733
88.6
%39
084
33 4
90
Econ
omic
cla
ssifi
catio
n
Curr
ent p
aym
ents
40 5
59(2
60)
-40
299
35 9
954
304
89.3
%39
084
33 4
90
Com
pens
atio
n of
em
ploy
ees
31 6
59-
-31
659
28 1
983
461
89.1
%30
132
26 3
18
Sala
ries
and
wag
es28
849
(250
)-
28 5
9925
762
2 83
790
.1%
27 4
5024
154
Soci
al c
ontr
ibut
ions
2 81
025
0-
3 06
02
436
624
79.6
%2
682
2 16
4
Goo
ds a
nd s
ervi
ces
8 90
0(2
60)
-8
640
7 79
784
390
.2%
8 95
27
172
Cate
ring:
Dep
artm
enta
l ac
tiviti
es16
1-
179
851
.7%
1915
Com
mun
icat
ion
312
(24)
-28
817
511
360
.6%
290
150
Cons
ulta
nts:
Busi
ness
and
ad
viso
ry s
ervi
ces
3 53
4(1
871
)-
1 66
31
663
-10
0.0%
350
36
Lega
l ser
vice
s2
967
2 28
9-
5 25
64
923
333
93.7
%5
511
5 51
0
Cont
ract
ors
--
--
--
-76
012
4
Trav
el a
nd s
ubsi
sten
ce2
007
(683
)-
1 32
41
000
324
75.5
%1
950
1 31
4
Venu
es a
nd fa
cilit
ies
6428
-92
2864
30.4
%60
12
Rent
al a
nd h
iring
--
--
--
-12
11
Tran
sfer
s an
d su
bsid
ies
1 05
426
0-
1 31
488
542
967
.4%
--
Publ
ic c
orpo
ratio
ns a
nd p
rivat
e en
terp
rises
1
025
--
1 02
559
842
758
.3%
--
DEP
ART
MEN
T O
F PU
BLIC
EN
TERP
RISE
SVO
TE 0
9
APP
ROPR
IATI
ON
STA
TEM
ENT
FOR
THE
YEA
R EN
DED
31
MA
RCH
202
0

88
Prog
ram
me
2: S
tate
-ow
ned
Com
pani
es G
over
nanc
e A
ssur
ance
and
Per
form
ance
2019
/20
2018
/19
Adj
uste
d A
ppro
pria
tion
Shift
ing
of
Fund
sVi
rem
ent
Fina
l A
ppro
pria
tion
Act
ual
Expe
nditu
reVa
rian
ceEx
pend
iture
as
% o
f fina
l ap
prop
riat
ion
Fina
l A
ppro
pria
tion
Act
ual
expe
nditu
re
R’00
0R’
000
R’00
0R’
000
R’00
0R’
000
%R’
000
R’00
0
Priv
ate
ente
rpris
es1
025
--
1 02
559
842
758
.3%
--
Oth
er tr
ansf
ers
to p
rivat
e en
terp
rises
1 02
5-
-1
025
598
427
58.3
%-
-
Hou
seho
lds
2926
0-
289
287
299
.3%
--
Soci
al b
enefi
ts29
260
-28
928
72
99.3
%-
-
Tota
l41
613
--
41 6
1336
880
4 73
388
.6%
39 0
8433
490
2.1
Man
agem
ent
2019
/20
2018
/19
Econ
omic
cla
ssifi
catio
n
Adj
uste
d A
ppro
pria
tion
Shift
ing
of
Fund
sVi
rem
ent
Fina
l A
ppro
pria
tion
Act
ual
Expe
nditu
reVa
rian
ceEx
pend
iture
as
% o
f fina
l ap
prop
riat
ion
Fina
l A
ppro
pria
tion
Act
ual
expe
nditu
re
R’00
0R’
000
R’00
0R’
000
R’00
0R’
000
%R’
000
R’00
0
Curr
ent p
aym
ents
3 12
0(2
24)
-2
896
1 88
61
010
65.1
%2
989
2 73
9
Com
pens
atio
n of
em
ploy
ees
2 59
1-
-2
591
1 76
282
968
.0%
2 49
22
486
Goo
ds a
nd s
ervi
ces
529
(224
)-
305
124
181
40.7
%49
725
3
Tran
sfer
s an
d su
bsid
ies
-93
-93
921
98.9
%-
-
Hou
seho
lds
-93
-93
921
98.9
%-
-
DEP
ART
MEN
T O
F PU
BLIC
EN
TERP
RISE
SVO
TE 0
9
APP
ROPR
IATI
ON
STA
TEM
ENT
FOR
THE
YEA
R EN
DED
31
MA
RCH
202
0

Annual Financial Statements
89
2.2
Lega
l20
19/2
020
18/1
9
Econ
omic
cla
ssifi
catio
n
Adj
uste
d A
ppro
pria
tion
Shift
ing
of
Fund
sVi
rem
ent
Fina
l A
ppro
pria
tion
Act
ual
Expe
nditu
reVa
rian
ceEx
pend
iture
as
% o
f fina
l ap
prop
riat
ion
Fina
l A
ppro
pria
tion
Act
ual
expe
nditu
re
R’00
0R’
000
R’00
0R’
000
R’00
0R’
000
%R’
000
R’00
0Cu
rren
t pay
men
ts11
206
1 31
6-
12 5
2210
340
2 18
282
.6%
14 8
3012
066
Com
pens
atio
n of
em
ploy
ees
7 77
1-
-7
771
6 12
41
647
78.8
%8
102
6 06
6G
oods
and
ser
vice
s3
435
1 31
6-
4 75
14
216
535
88.7
%6
728
6 00
0
Tran
sfer
s an
d su
bsid
ies
1 02
516
7-
1 19
276
442
864
.1%
--
Publ
ic c
orpo
ratio
ns a
nd p
rivat
e en
terp
rises
1 02
5-
-1
025
598
427
58.3
%-
-H
ouse
hold
s-
167
-16
716
61
99.4
%-
-
2.3
Gov
erna
nce
2019
/20
2018
/19
Econ
omic
cla
ssifi
catio
n
Adj
uste
d A
ppro
pria
tion
Shift
ing
of
Fund
sVi
rem
ent
Fina
l A
ppro
pria
tion
Act
ual
Expe
nditu
reVa
rian
ceEx
pend
iture
as
% o
f fina
l ap
prop
riat
ion
Fina
l A
ppro
pria
tion
Act
ual
expe
nditu
re
R’00
0R’
000
R’00
0R’
000
R’00
0R’
000
%R’
000
R’00
0Cu
rren
t pay
men
ts11
589
862
-12
451
11 6
2782
493
.4%
9 56
58
782
Com
pens
atio
n of
em
ploy
ees
9 64
1-
-9
641
8 82
082
191
.5%
8 85
58
525
Goo
ds a
nd s
ervi
ces
1 94
886
2-
2 81
02
807
399
.9%
710
257
2.4
Fina
ncia
l Ass
essm
ent a
nd In
vest
men
t Sup
port
2019
/20
2018
/19
Econ
omic
cla
ssifi
catio
n
Adj
uste
d A
ppro
pria
tion
Shift
ing
of
Fund
sVi
rem
ent
Fina
l A
ppro
pria
tion
Act
ual
Expe
nditu
reVa
rian
ceEx
pend
iture
as
% o
f fina
l ap
prop
riat
ion
Fina
l A
ppro
pria
tion
Act
ual
expe
nditu
re
R’00
0R’
000
R’00
0R’
000
R’00
0R’
000
%R’
000
R’00
0Cu
rren
t pay
men
ts14
644
(2 2
14)
-12
430
12 1
4328
797
.7%
11 7
009
903
Com
pens
atio
n of
em
ploy
ees
11 6
56-
-11
656
11 4
9316
398
.6%
10 6
839
241
Goo
ds a
nd s
ervi
ces
2 98
8(2
214
)-
774
650
124
84.0
%1
017
662
Tran
sfer
s an
d su
bsid
ies
29-
-29
29-
100.
0%H
ouse
hold
s29
--
2929
-10
0.0%
DEP
ART
MEN
T O
F PU
BLIC
EN
TERP
RISE
SVO
TE 0
9
APP
ROPR
IATI
ON
STA
TEM
ENT
FOR
THE
YEA
R EN
DED
31
MA
RCH
202
0

90
Prog
ram
me
3: B
usin
ess
Enha
ncem
ent,
Tran
sfor
mat
ion
and
Indu
stri
alis
atio
n
2019
/20
2018
/19
Adj
uste
d A
ppro
pria
tion
Shift
ing
of
Fund
sVi
rem
ent
Fina
l A
ppro
pria
tion
Act
ual
Expe
nditu
reVa
rian
ceEx
pend
iture
as
% o
f fina
l ap
prop
riat
ion
Fina
l A
ppro
pria
tion
Act
ual
expe
nditu
re
R’00
0R’
000
R’00
0R’
000
R’00
0R’
000
%R’
000
R’00
0
Sub
prog
ram
me
3.1
Ene
rgy
Reso
urce
s49
013
732
1 99
0-
49 0
15 7
2249
013
553
2 16
910
0.0%
13 6
589
504
3.2
Res
earc
h an
d Ec
onom
ic
Mod
ellin
g12
524
(2 2
00)
-10
324
6 66
93
655
64.6
%13
481
6 92
6
3.3
Tra
nspo
rt a
nd D
efen
ce7
620
013
794
-7
620
807
7 61
9 18
01
627
100.
0%6
269
006
6 26
2 10
5
3.4
Bus
ines
s En
hanc
emen
t Ser
vice
s32
027
(584
)-
31 4
4321
030
10 4
1366
.9%
35 7
0626
737
Tota
l for
sub
pro
gram
mes
56 6
78 2
96-
56 6
78 2
9656
660
432
17 8
6410
0.0%
6 33
1 85
16
305
272
Econ
omic
cla
ssifi
catio
n
Curr
ent p
aym
ents
78 2
64(1
2)-
78 2
5260
388
17 8
6477
.2%
82 7
7656
199
Com
pens
atio
n of
em
ploy
ees
53 1
48-
-53
148
48 8
844
264
92.0
%58
971
47 8
52
Sala
ries
and
wag
es49
461
(1 5
79)
-47
882
44 1
503
732
92.2
%53
302
43 2
00
Soci
al c
ontr
ibut
ions
3 68
71
579
-5
266
4 73
453
289
.9%
5 66
94
652
Goo
ds a
nd s
ervi
ces
25 1
16(1
2)-
25 1
0411
504
13 6
0045
.8%
23 8
058
347
Adm
inis
trat
ive
fess
-28
-28
28-
100.
0%-
-
Adv
ertis
ing
--
--
--
-78
-
Cate
ring:
Dep
artm
enta
l ac
tiviti
es33
6-
3925
1464
.1%
284
Com
mun
icat
ion
607
(21)
-58
623
934
740
.9%
562
206
Cons
ulta
nts:
Busi
ness
and
ad
viso
ry s
ervi
ces
16 5
96(1
949
)-
14 6
476
177
8 47
042
.2%
13 5
704
325
Lega
l Ser
vice
s-
59-
5958
198
.3%
--
Cont
ract
ors
1 59
689
62
492
975
1 51
739
.1%
1 35
611
Ente
rtai
nmen
t32
--
32-
32-
30-
Cons
umab
le s
uppl
ies
--
--
--
-58
-
Cons
umab
le:
Stat
ione
ry,p
rintin
g an
d offi
ce
supp
lies
-14
-14
131
92.9
%-
-
DEP
ART
MEN
T O
F PU
BLIC
EN
TERP
RISE
SVO
TE 0
9
APP
ROPR
IATI
ON
STA
TEM
ENT
FOR
THE
YEA
R EN
DED
31
MA
RCH
202
0

Annual Financial Statements
91
Prog
ram
me
3: B
usin
ess
Enha
ncem
ent,
Tran
sfor
mat
ion
and
Indu
stri
alis
atio
n
2019
/20
2018
/19
Adj
uste
d A
ppro
pria
tion
Shift
ing
of
Fund
sVi
rem
ent
Fina
l A
ppro
pria
tion
Act
ual
Expe
nditu
reVa
rian
ceEx
pend
iture
as
% o
f fina
l ap
prop
riat
ion
Fina
l A
ppro
pria
tion
Act
ual
expe
nditu
re
R’00
0R’
000
R’00
0R’
000
R’00
0R’
000
%R’
000
R’00
0
Trav
el a
nd s
ubsi
sten
ce6
239
563
-6
802
3 61
23
190
53.1
%7
205
3 58
1
Ope
ratin
g pa
ymen
ts-
196
-19
619
51
99.5
%18
218
1
Venu
es a
nd fa
cilit
ies
1319
6-
209
182
2787
.1%
277
39
Rent
al a
nd h
iring
-45
9-
Tran
sfer
s an
d su
bsid
ies
-44
-44
44-
100.
0%75
73
Hou
seho
lds
-44
-44
44-
100.
0%75
73
Soci
al b
enefi
ts-
44-
4444
-10
0.0%
7573
Paym
ents
for c
apita
l ass
ets
32(3
2)-
--
--
--
Soft
war
e an
d ot
her i
ntan
gibl
e as
sets
32
(32)
--
--
--
-
Paym
ents
for fi
nanc
ial a
sset
s56
600
000
--
56 6
00 0
0056
600
000
-10
0.0%
6 24
9 00
06
249
000
Tota
l56
678
296
--
56 6
78 2
9656
660
432
17 8
6410
0.0%
6 33
1 85
16
305
272
3.1
Ener
gy R
esou
rces
2019
/20
2018
/19
Econ
omic
cla
ssifi
catio
n
Adj
uste
d A
ppro
pria
tion
Shift
ing
of
Fund
sVi
rem
ent
Fina
l A
ppro
pria
tion
Act
ual
Expe
nditu
reVa
rian
ceEx
pend
iture
as
% o
f fina
l ap
prop
riat
ion
Fina
l A
ppro
pria
tion
Act
ual
expe
nditu
re
R’00
0R’
000
R’00
0R’
000
R’00
0R’
000
%R’
000
R’00
0
Curr
ent p
aym
ents
13 7
321
990
-15
722
13 5
532
169
86.2
%13
658
9 50
4
Com
pens
atio
n of
em
ploy
ees
9 91
61
919
-11
835
11 7
3897
99.2
%10
151
8 52
2
Goo
ds a
nd s
ervi
ces
3 81
671
-3
887
1 81
52
072
46.7
%3
507
982
Paym
ents
for fi
nanc
ial a
sset
s49
000
000
--
49 0
00 0
0049
000
000
-10
0.0%
--
DEP
ART
MEN
T O
F PU
BLIC
EN
TERP
RISE
SVO
TE 0
9
APP
ROPR
IATI
ON
STA
TEM
ENT
FOR
THE
YEA
R EN
DED
31
MA
RCH
202
0

92
3.2
Rese
arch
and
Eco
nom
ic M
odel
ling
2019
/20
2018
/19
Adj
uste
d A
ppro
pria
tion
Shift
ing
of
Fund
sVi
rem
ent
Fina
l A
ppro
pria
tion
Act
ual
Expe
nditu
reVa
rian
ceEx
pend
iture
as
% o
f fina
l ap
prop
riat
ion
Fina
l A
ppro
pria
tion
Act
ual
expe
nditu
re
Econ
omic
cla
ssifi
catio
nR’
000
R’00
0R’
000
R’00
0R’
000
R’00
0%
R’00
0R’
000
Curr
ent p
aym
ents
12 4
92(2
168
)-
10 3
246
669
3 65
564
.6%
13 4
286
873
Com
pens
atio
n of
em
ploy
ees
7 80
0-
-7
800
6 38
51
415
81.9
%9
019
6 02
2
Goo
ds a
nd s
ervi
ces
4 69
2(2
168
)-
2 52
428
42
240
11.3
%4
409
851
Tran
sfer
s an
d su
bsid
ies
--
--
--
-53
53
Hou
seho
lds
--
--
--
5353
Paym
ents
for c
apita
l ass
ets
32(3
2)-
--
--
--
Soft
war
e an
d ot
her i
ntan
gibl
e as
sets
32
(32)
--
--
--
-
3.3
Tran
spor
t and
Def
ence
2019
/20
2018
/19
Adj
uste
d A
ppro
pria
tion
Shift
ing
of
Fund
sVi
rem
ent
Fina
l A
ppro
pria
tion
Act
ual
Expe
nditu
reVa
rian
ceEx
pend
iture
as
% o
f fina
l ap
prop
riat
ion
Fina
l A
ppro
pria
tion
Act
ual
expe
nditu
re
Econ
omic
cla
ssifi
catio
nR’
000
R’00
0R’
000
R’00
0R’
000
R’00
0%
R’00
0R’
000
Curr
ent p
aym
ents
20 0
1379
4-
20 8
0719
180
1 62
792
.2%
20 0
0613
105
Com
pens
atio
n of
em
ploy
ees
15 2
88(2
223
)-
13 0
6512
005
1 06
091
.9%
15 6
3811
842
Goo
ds a
nd s
ervi
ces
4 72
53
017
-7
742
7 17
556
792
.7%
4 36
81
263
Paym
ents
for fi
nanc
ial a
sset
s7
600
000
--
7 60
0 00
07
600
000
-10
0.0%
6 24
9 00
06
249
000
DEP
ART
MEN
T O
F PU
BLIC
EN
TERP
RISE
SVO
TE 0
9
APP
ROPR
IATI
ON
STA
TEM
ENT
FOR
THE
YEA
R EN
DED
31
MA
RCH
202
0

Annual Financial Statements
93
3.4
Busi
ness
Enh
ance
men
t Ser
vice
s
2019
/20
2018
/19
Econ
omic
cla
ssifi
catio
n
Adj
uste
d A
ppro
pria
tion
Shift
ing
of
Fund
sVi
rem
ent
Fina
l A
ppro
pria
tion
Act
ual
Expe
nditu
reVa
rian
ceEx
pend
iture
as
% o
f fina
l ap
prop
riat
ion
Fina
l A
ppro
pria
tion
Act
ual
expe
nditu
re
R’00
0R’
000
R’00
0R’
000
R’00
0R’
000
%R’
000
R’00
0
Curr
ent p
aym
ents
32 0
27(6
28)
-31
399
20 9
8610
413
66.8
%35
684
26 7
17
Com
pens
atio
n of
em
ploy
ees
20 1
4430
4-
20 4
4818
756
1 69
291
.7%
24 1
6321
466
Goo
ds a
nd s
ervi
ces
11 8
83(9
32)
-10
951
2 23
08
721
20.4
%11
521
5 25
1
Tran
sfer
s an
d su
bsid
ies
-44
-44
44-
100%
2220
Hou
seho
lds
-44
-44
44-
100%
2220
DEP
ART
MEN
T O
F PU
BLIC
EN
TERP
RISE
SVO
TE 0
9
APP
ROPR
IATI
ON
STA
TEM
ENT
FOR
THE
YEA
R EN
DED
31
MA
RCH
202
0

94
DEPARTMENT OF PUBLIC ENTERPRISESVOTE 09
NOTES TO THE APPROPRIATION STATEMENTFOR THE YEAR ENDED 31 MARCH 2020
1. Details of transfers and subsidies as per Appropriation Act (after Virement):
Details of these transactions can be viewed in the note on Transfers and subsidies, disclosure notes and Annexure 1 (A-H)
to the Annual Financial Statements.
2. Details of specifically and exclusively appropriated amounts voted (after Virement):
Details of these transactions can be viewed in note 1 (Annual Appropriation) to the Annual Financial Statements.
3. Details on payments for financial assets
Details of these transactions per programme can be viewed in the note on Payments for financial assets to the Annual
Financial Statements.
4. Explanations of material variances from Amounts Voted (after Virement):
4.1 Per programme
Final Appropriation
Actual Expenditure
Variance R’000 Variance as a % of Final
Appropriation
Administration 163 121 149 077 14 044 8.61
State-owned Companies Governance Assurance and Performance
41 613 36 880 4 733 11.37
Business Enhancement, Transformation and Industrialisation
56 678 296 56 660 432 17 864 0.03
Total 56 883 030 56 846 389 36 641 0.06
4.2 Per economic classification
Final Appropriation
Actual Expenditure
Variance Variance as a % of Final
Appropriation
R’000 R’000 R’000 R’000
Current payments 270 148 233 992 36 156 13.38
Compensation of employees 170 228 149 189 21 039 12.36
Goods and services 99 920 84 803 15 117 15.13
Transfers and subsidies 8 607 8 128 479 5.57
Provinces and municipalities 15 15 - -
Public corporations and private enterprises 4 002 3 574 42810.69
Households 4 590 4 539 51 1.11
Payments for capital assets 4 233 4 228 5 0.12
Machinery and equipment 4 200 4 197 3 0.07
Intangible assets 33 31 2 6.06
Payments for financial assets 56 600 042 56 600 041 1 0.00
Total 56 883 030 56 846 389 36 641 0.06
Note: The under expenditure primarily relates to compensation of employees and goods and services. This is as a result of unfilled posts and non-implementation of the development of the Green Paper for the Shareholder Management Bill.

Annual Financial Statements
95
DEPARTMENT OF PUBLIC ENTERPRISESVOTE 09
STATEMENT OF FINANCIAL PERFORMANCEFOR THE YEAR ENDED 31 MARCH 2020
Note 2019/2020 2018/19
R’000 R’000
REVENUE
Annual appropriation 1 56 883 030 6 522 914
Departmental revenue 2 109 366
Aid assistance 3 11 345 11 348
TOTAL REVENUE 56 894 484 6 534 628
EXPENDITURE
Current expenditure
Compensation of employees 4 149 189 143 813
Goods and services 5 84 803 71 681
Aid assistance 3 - 635
Total current expenditure 233 992 216 129
Transfers and subsidies
Transfers and subsidies 7 8 128 1 041
Total transfers and subsidies 8 128 1 041
Expenditure for capital assets
Tangible assets 8 4 197 8 797
Intangible assets 8 31 456
Total expenditure for capital assets 4 228 9 253
Payments for financial assets 6 56 600 041 6 249 005
TOTAL EXPENDITURE 56 846 389 6 475 428
SURPLUS/(DEFICIT) FOR THE YEAR 48 095 59 200
Reconciliation of Net Surplus/(Deficit) for the year
Voted funds 36 641 48 121
Annual appropriation 36 641 48 121
Departmental revenue and NRF Receipts 2 109 366
Aid assistance 3 11 345 10 713
SURPLUS/(DEFICIT) FOR THE YEAR 48 095 59 200

96
DEPARTMENT OF PUBLIC ENTERPRISESVOTE 09
STATEMENT OF FINANCIAL POSITIONAS AT 31 MARCH 2020
Note 2019/2020 2018/19
R’000 R’000ASSETS
Current assets 207 307 207 266
Cash and cash equivalents 9 206 495 206 543
Prepayments and advances 10 790 643
Receivables 11 22 80
Non-current assets 188 998 923 132 398 963
Investments 12 188 998 133 132 398 133
Receivables 11 790 830
TOTAL ASSETS 189 206 230 132 606 229
LIABILITIES
Current liabilities 207 055 207 054
Voted funds to be surrendered to the Revenue Fund 13 36 641 48 121
Departmental revenue and NRF Receipts to be surrendered to the Revenue Fund 14 - 2
Payables 15 138
Aid assistance unutilised 3 170 276 158 931
Non-current liabilities
Payables 16 371 371
TOTAL LIABILITIES 207 426 207 425
NET ASSETS 188 998 804 132 398 804
Represented by:
Capitalisation reserve 188 998 133 132 398 133
Recoverable revenue 671 671
TOTAL 188 998 804 132 398 804

Annual Financial Statements
97
DEPARTMENT OF PUBLIC ENTERPRISESVOTE 09
STATEMENT OF CHANGES IN NET ASSETSFOR THE YEAR ENDED 31 MARCH 2020
Note 2019/20 2018/19
R’000 R’000
Capitalisation Reserves
Opening balance 132 398 133 103 140 375
Transfers:
Movement in Equity 56 600 000 6 249 000
Movement in Operational Funds
Other movements - 23 008 758
Closing balance 188 998 133 132 398 133
Recoverable revenue
Opening balance 671 -
Debts raised - 671
Closing balance 671 671
TOTAL 188 998 804 132 398 804
Note: Movement in Equity includes an amount of R26 billion that was tabled in the Special Appropriation Bill, 2019 to assist ESKOM with its financial obligations. An additional amount of R30.6 billion was earmarked for Eskom (R23 billion), SA Express (R300 million), SAA (R5.5 billion) and Denel (R1.8 billion) for working capital and settlement of outstanding debts. An amount of R671 thousand is for debts owed to the department.

98
DEPARTMENT OF PUBLIC ENTERPRISESVOTE 09
CASH FLOW STATEMENT FOR THE YEAR ENDED 31 MARCH 2020
Note 2019/20 2018/19
R’000 R’000
CASH FLOWS FROM OPERATING ACTIVITIES
Receipts 56 894 484 6 534 611
Annual appropriated funds received 1.1 56 883 030 6 522 914
Departmental revenue received 2 109 349
Aid assistance received 3 11 345 11 348
Net (increase)/decrease in working capital 49 2 191
Surrendered to Revenue Fund (48 232) (16 669)
Current payments (233 992) (216 129)
Payments for financial assets (56 600 041) (6 249 005)
Transfers and subsidies paid (8 128) (1 041)
Net cash flow available from operating activities 17 4 140 53 958
CASH FLOWS FROM INVESTING ACTIVITIES
Payments for capital assets 8 (4 228) (9 253)
Proceeds from sale of capital assets 2.2 - 17
(Increase)/decrease in investments (56 600 000) (29 257 758)
(Increase)/decrease in non-current receivables 40
Net cash flows from investing activities (56 604 188) (29 266 994)
CASH FLOWS FROM FINANCING ACTIVITIES
Increase/(decrease) in net assets 56 600 000 29 258 429
Increase/(decrease) in non-current payables - (144)
Net cash flows from financing activities 56 600 000 29 258 285
Net increase/(decrease) in cash and cash equivalents (48) 45 249
Cash and cash equivalents at beginning of period 206 543 161 294
Cash and cash equivalents at end of period 9 206 495 206 543

Annual Financial Statements
99
DEPARTMENT OF PUBLIC ENTERPRISESVOTE 09
NOTES TO THE ANNUAL FINANCIAL STATEMENTS FOR THE YEAR ENDED 31 MARCH 2020
PART A: ACCOUNTING POLICIESSummary of significant accounting policies
The financial statements have been prepared in accordance with the following policies, which have been applied consistently
in all material aspects, unless otherwise indicated. Management has concluded that the financial statements present fairly the
department’s primary and secondary information.
The historical cost convention has been used, except where otherwise indicated. Management has used assessments and
estimates in preparing the annual financial statements. These are based on the best information available at the time of
preparation.
Where appropriate and meaningful, additional information has been disclosed to enhance the usefulness of the financial
statements and to comply with the statutory requirements of the Public Finance Management Act (PFMA), Act 1 of 1999 (as
amended by Act 29 of 1999), and the Treasury Regulations issued in terms of the PFMA and the annual Division of Revenue Act.
1 Basis of preparation
The financial statements have been prepared in accordance with the Modified Cash Standard.
2 Going concern
The financial statements have been prepared on a going concern basis.
3 Presentation currency
Amounts have been presented in the currency of the South African Rand (R) which is also the functional currency of the department.
4 Rounding
Unless otherwise stated financial figures have been rounded to the nearest one thousand Rand (R’000).
5 Foreign currency translation
Cash flows arising from foreign currency transactions are translated into South African Rands using the spot exchange rates prevailing at the date of payment / receipt.
6 Comparative information
6.1 Prior period comparative information
Prior period comparative information has been presented in the current year’s financial statements. Where necessary figures included in the prior period financial statements have been reclassified to ensure that the format in which the information is presented is consistent with the format of the current year’s financial statements.
6.2 Current year comparison with budget
A comparison between the approved, final budget and actual amounts for each programme and economic classification is included in the appropriation statement.
7 Revenue
7.1 Appropriated funds
Appropriated funds comprises departmental allocations as well as direct charges against the revenue fund (i.e. statutory appropriation).
Appropriated funds are recognised in the statement of financial performance on the date the appropriation becomes effective. Adjustments made in terms of the adjustments budget process are recognised in the statement of financial performance on the date the adjustments become effective.
The net amount of any appropriated funds due to / from the relevant revenue fund at the reporting date is recognised as a payable / receivable in the statement of financial position.

100
DEPARTMENT OF PUBLIC ENTERPRISESVOTE 09
NOTES TO THE ANNUAL FINANCIAL STATEMENTS FOR THE YEAR ENDED 31 MARCH 2020
7.2 Departmental revenue
Departmental revenue is recognised in the statement of financial performance when received and is subsequently paid into the relevant revenue fund, unless stated otherwise.
Any amount owing to the relevant revenue fund at the reporting date is recognised as a payable in the statement of financial position.
7.3 Accrued departmental revenue
Accruals in respect of departmental revenue (excluding tax revenue) are recorded in the notes to the financial statements when:
• it is probable that the economic benefits or service potential associated with the transaction will flow to the department; and
• the amount of revenue can be measured reliably.
The accrued revenue is measured at the fair value of the consideration receivable.
Accrued tax revenue (and related interest and / penalties) is measured at amounts receivable from collecting agents.
Write-offs are made according to the department’s debt write-off policy.
8 Expenditure
8.1 Compensation of employees
8.1.1 Salaries and wages
Salaries and wages are recognised in the statement of financial performance on the date of payment.
8.1.2 Social contributions
Social contributions made by the department in respect of current employees are recognised in the statement of financial performance on the date of payment.
Social contributions made by the department in respect of ex-employees are classified as transfers to households in the statement of financial performance on the date of payment.
8.2 Other expenditure
Other expenditure (such as goods and services, transfers and subsidies and payments for capital assets) is recognised in the statement of financial performance on the date of payment. The expense is classified as a capital expense if the total consideration paid is more than the capitalisation threshold.
8.3 Accruals and payables not recognised
Accruals and payables not recognised are recorded in the notes to the financial statements at cost at the reporting date.
8.4 Leases
8.4.1 Operating leases
Operating lease payments made during the reporting period are recognised as current expenditure in the statement of financial performance on the date of payment.
The operating lease commitments are recorded in the notes to the financial statements.
9 Aid Assistance
9.1 Aid assistance received
Aid assistance received in cash is recognised in the statement of financial performance when received. In-kind aid assistance is recorded in the notes to the financial statements on the date of receipt and is measured at fair value.
Aid assistance not spent for the intended purpose and any unutilised funds from aid assistance that are required to be refunded to the donor are recognised as a payable in the statement of financial position.

Annual Financial Statements
101
DEPARTMENT OF PUBLIC ENTERPRISESVOTE 09
NOTES TO THE ANNUAL FINANCIAL STATEMENTS FOR THE YEAR ENDED 31 MARCH 2020
9.2 Aid assistance paid
Aid assistance paid is recognised in the statement of financial performance on the date of payment. Aid assistance payments made prior to the receipt of funds are recognised as a receivable in the statement of financial position.
10 Cash and cash equivalents
Cash and cash equivalents are stated at cost in the statement of financial position.
Bank overdrafts are shown separately on the face of the statement of financial position as a current liability.
For the purposes of the cash flow statement, cash and cash equivalents comprise cash on hand, deposits held, other short-term highly liquid investments and bank overdrafts.
11 Prepayments and advances
Prepayments and advances are recognised in the statement of financial position when the department receives or disburses the cash.
Prepayments and advances are initially and subsequently measured at cost.
12 Loans and receivables
Loans and receivables are recognised in the statement of financial position at cost plus accrued interest, where interest is charged, less amounts already settled or written-off. Write-offs are made according to the department’s write-off policy.
13 Investments
Investments are recognised in the statement of financial position at cost.
14 Financial assets
14.1 Financial assets (not covered elsewhere)
A financial asset is recognised initially at its cost plus transaction costs that are directly attributable to the acquisition or issue of the financial asset.
At the reporting date, financial assets are measured at cost, less amounts already settled or written-off, except for recognised loans and receivables, which are measured at cost plus accrued interest, where interest is charged, less amounts already settled or written-off.
14.2 Impairment of financial assets
Where there is an indication of impairment of a financial asset, an estimation of the reduction in the recorded carrying value, to reflect the best estimate of the amount of the future economic benefits expected to be received from that asset, is recorded in the notes to the financial statements.
15 Payables
Payables recognised in the statement of financial position are recognised at cost.
16 Capital Assets
16.1 Movable capital assets
Movable capital assets are initially recorded in the notes to the financial statements at cost. Movable capital assets acquired through a non-exchange transaction is measured at fair value as at the date of acquisition.
Where the cost of movable capital assets cannot be determined reliably, the movable capital assets are measured at fair value and where fair value cannot be determined; the movable assets are measured at R1.
All assets acquired prior to 1 April 2002 (or a later date as approved by the OAG) may be recorded at R1.
Movable capital assets are subsequently carried at cost and are not subject to depreciation or impairment.
Subsequent expenditure that is of a capital nature forms part of the cost of the existing asset when ready for use.

102
DEPARTMENT OF PUBLIC ENTERPRISESVOTE 09
NOTES TO THE ANNUAL FINANCIAL STATEMENTS FOR THE YEAR ENDED 31 MARCH 2020
16.2 Intangible assets
Intangible assets are initially recorded in the notes to the financial statements at cost. Intangible assets acquired through a non-exchange transaction are measured at fair value as at the date of acquisition.
Internally generated intangible assets are recorded in the notes to the financial statements when the department commences the development phase of the project.
Where the cost of intangible assets cannot be determined reliably, the intangible capital assets are measured at fair value and where fair value cannot be determined; the intangible assets are measured at R1.
All assets acquired prior to 1 April 2002 (or a later date as approved by the OAG) may be recorded at R1.
Intangible assets are subsequently carried at cost and are not subject to depreciation or impairment.
Subsequent expenditure of a capital nature forms part of the cost of the existing asset when ready for use.
17 Contingents
17.1 Contingent liabilities
Contingent liabilities are recorded in the notes to the financial statements when there is a possible obligation that arises from past events, and whose existence will be confirmed only by the occurrence or non-occurrence of one or more uncertain future events not within the control of the department or when there is a present obligation that is not recognised because it is not probable that an outflow of resources will be required to settle the obligation or the amount of the obligation cannot be measured reliably.
18 Capital Commitments
Capital Commitments are recorded at cost in the notes to the financial statements when there is a contractual arrangement or an approval by management in a manner that raises a valid expectation that the department will discharge its responsibilities thereby incurring future expenditure that will result in the outflow of cash.
19 Fruitless and wasteful expenditure
Fruitless and wasteful expenditure is recorded in the notes to the financial statements when confirmed. The amount recorded is equal to the total value of the fruitless and or wasteful expenditure incurred.
Fruitless and wasteful expenditure is removed from the notes to the financial statements when it is resolved or transferred to receivables for recovery.
Fruitless and wasteful expenditure receivables are measured at the amount that is expected to be recoverable and are de-recognised when settled or subsequently written-off as irrecoverable.
20 Irregular expenditure
Irregular expenditure is recorded in the notes to the financial statements when confirmed. The amount recorded is equal to the value of the irregular expenditure incurred unless it is impracticable to determine, in which case reasons therefor are provided in the note.
Irregular expenditure is removed from the note when it is either condoned by the relevant authority, transferred to receivables for recovery or not condoned and is not recoverable.
Irregular expenditure receivables are measured at the amount that is expected to be recoverable and are de-recognised when settled or subsequently written-off as irrecoverable.

Annual Financial Statements
103
DEPARTMENT OF PUBLIC ENTERPRISESVOTE 09
NOTES TO THE ANNUAL FINANCIAL STATEMENTS FOR THE YEAR ENDED 31 MARCH 2020
21 Changes in accounting policies, accounting estimates and errors
Changes in accounting policies that are effected by management have been applied retrospectively in accordance with MCS requirements, except to the extent that it is impracticable to determine the period-specific effects or the cumulative effect of the change in policy. In such instances the department shall restate the opening balances of assets, liabilities and net assets for the earliest period for which retrospective restatement is practicable.
Changes in accounting estimates are applied prospectively in accordance with MCS requirements.
Correction of errors is applied retrospectively in the period in which the error has occurred in accordance with MCS requirements, except to the extent that it is impracticable to determine the period-specific effects or the cumulative effect of the error. In such cases the department shall restate the opening balances of assets, liabilities and net assets for the earliest period for which retrospective restatement is practicable.
22 Events after the reporting date
Events after the reporting date that are classified as adjusting events have been accounted for in the financial statements. The events after the reporting date that are classified as non-adjusting events after the reporting date have been disclosed in the notes to the financial statements.
23 Capitalisation reserve
The capitalisation reserve comprises of financial assets and/or liabilities originating in a prior reporting period but which are recognised in the statement of financial position for the first time in the current reporting period. Amounts are recognised in the capitalisation reserves when identified in the current period and are transferred to the National Revenue Fund when the underlying asset is disposed and the related funds are received.
24 Recoverable revenue
Amounts are recognised as recoverable revenue when a payment made in a previous financial year becomes recoverable from a debtor in the current financial year. Amounts are either transferred to the National Revenue Fund when recovered or are transferred to the statement of financial performance when written-off.
25 Related party transactions
A related party transaction is a transfer of resources, services or obligations between the reporting entity and a related party. Related party transactions within the Minister’s portfolio are recorded in the notes to the financial statements when the transaction is not at arm’s length.
Key management personnel are those persons having the authority and responsibility for planning, directing and controlling the activities of the department. The number of individuals and their full compensation is recorded in the notes to the financial statements.
26 Employee benefits
The value of each major class of employee benefit obligation (accruals, payables not recognised and provisions) is disclosed in the Employee benefits note.

104
DEPARTMENT OF PUBLIC ENTERPRISESVOTE 09
NOTES TO THE ANNUAL FINANCIAL STATEMENTS FOR THE YEAR ENDED 31 MARCH 2020
PART B: EXPLANATORY NOTES1. Annual Appropriation
1.1 Annual Appropriation
Included are funds appropriated in terms of the Appropriation Act (and the Adjustments Appropriation Act) for National
Departments (Voted funds) and Provincial Departments:
2019/20 2018/19
Final appropriation
Actual funds received
Funds not requested/not
received
Final appropriation
Appropriation received
Funds not requested /
not received
R’000 R’000 R’000 R’000 R’000
Administration 163 121 163 121 - 151 979 151 979 -
State-owned Companies Governance Assurance and Performance 41 613 41 613 - 39 084 39 084 -
Business Enhancement, Transformation and Industrialisation 56 678 296 56 678 296 - 6 331 851 6 331 851 -
Total 56 883 030 56 883 030 - 6 522 914 6 522 914 -
2. Departmental revenue
Note 2019/20 2018/19
R’000 R’000
Sales of goods and services other than capital assets 2.1 65 64
Sales of capital assets 2.2 - 17
Transactions in financial assets and liabilities 2.3 44 285
Total revenue collected 109 366
Departmental revenue collected 109 366
2.1 Sales of goods and services other than capital assets
2019/20 2018/19
R’000 R’000
Sales of goods and services produced by the department 65 64
Sales by market establishment 37 37
Other sales 28 27
Total 65 64
2.2 Sale of capital assets
2019/20 2018/19
R’000 R’000
Tangible assets - 17
Machinery and equipment - 17
Total - 17

Annual Financial Statements
105
DEPARTMENT OF PUBLIC ENTERPRISESVOTE 09
NOTES TO THE ANNUAL FINANCIAL STATEMENTS FOR THE YEAR ENDED 31 MARCH 2020
2.3 Transactions in financial assets and liabilities
2019/20 2018/19
R’000 R’000
Receivables 44 285
Total 44 285
3. Aid assistance
2019/20 2018/19
R’000 R’000
Opening Balance 158 931 148 218
Transferred from statement of financial performance 11 345 10 713
Closing Balance 170 276 158 931
3.1 Analysis of balance by source
2019/20 2018/19
R’000 R’000
Aid assistance from other sources 170 276 158 931
Closing balance 170 276 158 931
3.2 Analysis of balance
2019/20 2018/19
R’000 R’000
Aid assistance unutilised 170 276 158 931
Closing balance 170 276 158 931
3.3 Aid assistance expenditure per economic classification
2019/20 2018/19
R’000 R’000
Current - 635
Total aid assistance expenditure - 635
4. Compensation of employees
4.1 Salaries and Wages
2019/20 2018/19
R’000 R’000
Basic salary 100 919 98 027
Performance award 1 715 1 947
Compensative/circumstantial 3 109 2 985
Other non-pensionable allowances 29 283 27 387
Total 135 026 130 346

106
DEPARTMENT OF PUBLIC ENTERPRISESVOTE 09
NOTES TO THE ANNUAL FINANCIAL STATEMENTS FOR THE YEAR ENDED 31 MARCH 2020
4.2 Social contributions
2019/20 2018/19
R’000 R’000
Employer contributions
Pension 11 429 10 932
Medical 2 717 2 519
Bargaining council 17 16
Total 14 163 13 467
Total compensation of employees 149 189 143 813
Average number of employees 183 180
5. Goods and services
Note 2019/20 2018/19
R’000 R’000
Administrative fees 544 1 036
Advertising 237 752
Minor assets 5.1 590 1 406
Bursaries (employees) 548 617
Catering 141 191
Communication 3 079 2 290
Computer services 5.2 6 702 5 401
Consultants: Business and advisory services 12 150 6 582
Infrastructure and planning services - 188
Legal services 14 211 6 188
Contractors 1 465 1 421
Agency and support / outsourced services 391 187
Entertainment - 3
Audit cost – external 5.3 3 851 3 962
Fleet services 1 070 786
Consumables 5.4 1 705 2 853
Operating leases 13 367 15 926
Property payments 5.5 4 980 3 671
Rental and hiring 75 13
Travel and subsistence 5.6 15 730 14 938
Venues and facilities 873 580
Training and development 849 809
Other operating expenditure 5.7 2 245 1 881
Total 84 803 71 681
5.1 Minor assets
2019/20 2018/19
R’000 R’000
Tangible assets 590 1 406
Machinery and equipment 590 1 406
Total 590 1 406

Annual Financial Statements
107
DEPARTMENT OF PUBLIC ENTERPRISESVOTE 09
NOTES TO THE ANNUAL FINANCIAL STATEMENTS FOR THE YEAR ENDED 31 MARCH 2020
5.2 Computer services
2019/20 2018/19
R’000 R’000
SITA computer services 2 301 1 911
External computer service providers 4 401 3 490
Total 6 702 5 401
5.3 Audit cost – External
2019/20 2018/19
R’000 R’000
Regularity audits 3 851 3 962
Total 3 851 3 962
5.4 Consumables
2019/20 2018/19
R’000 R’000
Consumable supplies 624 1 424
Uniform and clothing - 23
Household supplies 424 563
Building material and supplies - 60
Communication accessories 55 18
IT consumables 60 92
Other consumables 85 668
Stationery, printing and office supplies 1 081 1 429
Total 1 705 2 853
5.5 Property payments
2019/20 2018/19
R’000 R’000
Municipal services 2 525 1 488
Property management fees 119 74
Property maintenance and repairs - 85
Other 2 336 2 024
Total 4 980 3 671
5.6 Travel and subsistence
2019/20 2018/19
R’000 R’000
Local 11 364 12 743
Foreign 4 366 2 195
Total 15 730 14 938

108
DEPARTMENT OF PUBLIC ENTERPRISESVOTE 09
NOTES TO THE ANNUAL FINANCIAL STATEMENTS FOR THE YEAR ENDED 31 MARCH 2020
5.7 Other operating expenditure
2019/20 2018/19
R’000 R’000
Professional bodies, membership and subscription fees 1 007 841
Other 1 238 1 040
Total 2 245 1 881
6. Payments for financial assets
Note 2019/20 2018/19
R’000 R’000
Purchase of equity 56 600 000 6 249 000
Debts written off 6.1 41 5
Total 56 600 041 6 249 005
Note: The amount of R26 billion was tabled in the Special Appropriation Bill, 2019 to assist ESKOM with its financial obligations. An additional amount of R30.6 billion was earmarked for Eskom (R23 billion), SA Express (R300 million), SAA (R5.5 billion) and Denel (R1.8 billion) for working capital and settlement of outstanding debts.
6.1 Debts written off
2019/20 201819
R’000 R’000
Nature of debts written off
Departmental debts written-off 41 5
Total debt written off 41 5
7. Transfers and subsidies
2019/20 2018/19
R’000 R’000
Note
Provinces and municipalities 15 12
Public corporations and private enterprises Annexure 1D 3 574 -
Households Annexure 1G 4 539 1 029
Total 8 128 1 041
Note: The increase in transfers and subsidies is attributed to payment made to the former Director-General in terms of his retirement benefit. Transfers and subsidies also include payment made to the department of Public Works in terms of reinstatement cost for office accommodation.

Annual Financial Statements
109
DEPARTMENT OF PUBLIC ENTERPRISESVOTE 09
NOTES TO THE ANNUAL FINANCIAL STATEMENTS FOR THE YEAR ENDED 31 MARCH 2020
8. Expenditure for capital assets
Note 2019/20 2018/19
R’000 R’000
Tangible assets 4 197 8 797
Machinery and equipment 29.1 4 197 8 797
Intangible assets 31 456
Software 31.1 31 456
Total 4 228 9 253
8.1 Analysis of funds utilised to acquire capital assets – 2019/20
Voted funds Aid assistance Total
R’000 R’000 R’000
Tangible assets 4 197 - 4 197
Machinery and equipment 4 197 - 4 197
Intangible assets 31 31
Software 31 - 31
Total 4 228 - 4 228
8.2 Analysis of funds utilised to acquire capital assets – 2018/19
Voted funds Aid assistance Total
R’000 R’000 R’000
Tangible assets 8 797 - 8 797
Machinery and equipment 8 797 - 8 797
Intangible assets 456 - 456
Software 456 - 456
Total 9 253 - 9 253
9. Cash and cash equivalents
Note 2019/20 2018/19
R’000 R’000
Consolidated Paymaster General Account 36 162 47 555
Cash on hand 57 57
Investments (Domestic)* 170 276 158 931
Total 206 495 206 543
* This amount is ring fenced against the disbursement of funds to beneficiaries of Telkom Shares after Telkom was acquired by Government.

110
DEPARTMENT OF PUBLIC ENTERPRISESVOTE 09
NOTES TO THE ANNUAL FINANCIAL STATEMENTS FOR THE YEAR ENDED 31 MARCH 2020
10. Prepayments and advances
Note 2019/20 2018/19
R’000 R’000
Advances paid (Not expensed) 10.1 790 643
Total 790 643
10.1 Advances paid (Not expensed)
Balance as at 1 April 2019
Less: Amount expensed in current year
Add or Less: Other
Add: Current Year advances
Balance as at 31 March 2020
Note R’000 R’000 R’000 R’000 R’000National departments 10 643 (553) - 700 790
Total 643 (553) - 700 790
Balance as at 1 April 2018
Less: Amount expensed in current year
Add or Less: Other
Add: Current Year advances
Balance as at 31 March 2019
Note R’000 R’000 R’000 R’000 R’000National departments 10 833 (790) - 600 643
Total 833 (790) - 600 643
11. Receivables
2019/20 2018/19Current Non-current Total Current Non-current Total
Note R’000 R’000 R’000 R’000 R’000 R’000Recoverable expenditure 11.1 - - - 36 - 36
Staff debt 11.2 24 15 39 44 12 56
Fruitless and wasteful expenditure 11.3 - 12 12 - 14 14
Other receivables 11.4 (2) 763 761 - 804 804
Total 22 790 812 80 830 910
11.1 Recoverable expenditure (disallowance accounts)
Note 2019/20 2018/19
11 R’000 R’000
Diners club - 36
Total - 36
11.2 Staff debt
Note 2019/20 2018/19
11 R’000 R’000
Other 39 56
Total 39 56
11.3 Fruitless and wasteful expenditure
Note 2019/20 2018/19
11 R’000 R’000
Opening balance 14 17
Less amounts written off (2) (3)
Total 12 14

Annual Financial Statements
111
DEPARTMENT OF PUBLIC ENTERPRISESVOTE 09
NOTES TO THE ANNUAL FINANCIAL STATEMENTS FOR THE YEAR ENDED 31 MARCH 2020
11.4 Other receivables
Note 2019/20 2018/1911 R’000 R’000
Suppliers 671 677
Ex-employees 92 127
National department (2) -
Total 761 804
12. InvestmentNote 2019/20 2018/19
R’000 R’000Non-CurrentShares and other equityAlexkor SOC Ltd 400 000 400 000
Denel SOC Ltd 7 976 376 6 176 376
Eskom SOC Ltd 132 000 000 83 000 000
Safcol SOC Ltd 318 013 318 013
Transnet SOC Ltd 12 660 986 12 660 986
South African Express SOC Ltd 2 134 000 1 834 000
South African Airways SOC Ltd 33 508 758 28 008 758
Total 188 998 133 132 398 133
Analysis of non-current investmentsOpening balance 132 398 133 103 140 375
Additions in cash 56 600 000 6 249 000
Non-cash movements - 23 008 758
Closing balance 188 998 133 132 398 133
12.1 Impairment of investments
Note 2019/20 2018/19R’000 R’000
Estimate of impairment of investmentAlexkor SOC Ltd 199 302 66 639
South African Express Airways (Pty) Ltd 2 134 000 1 593 625
Denel 7 976 376 -
South African Airways 33 508 758 -
Total 43 818 436 1 660 264
Note: The impairment of investments is based on the difference between the cost of investment and the net asset value at reporting date.
The impairments are estimates as these figures are based on provisional amounts and are still subject to the SOC’s external audit process and therefore subject to change.
The total impairment for the current financial year amounts to R43.8 billion which is in respect of Alexcor, SA Express, Denel and SAA.
The total cost of investment in SA Express, Denel and SAA have been impaired wholly as the future economic benefits of these investments are reflected at negative asset values.
The other three SOCs have not been impaired since the cost of investment of Eskom, Transnet, SAFCOL are lower than their net asset value.

112
DEPARTMENT OF PUBLIC ENTERPRISESVOTE 09
NOTES TO THE ANNUAL FINANCIAL STATEMENTS FOR THE YEAR ENDED 31 MARCH 2020
13. Voted funds to be surrendered to the Revenue Fund
Note 2019/20 2018/19
R’000 R’000
Opening balance 48 121 16 283
Transfer from statement of financial performance 36 641 48 121
Paid during the year (48 121) (16 283)
Closing balance 36 641 48 121
14. Departmental revenue and NRF Receipts to be surrendered to the Revenue Fund
Note 2019/20 2018/19
R’000 R’000
Opening balance 2 22
Transfer from Statement of Financial Performance 109 366
Paid during the year (111) (386)
Closing balance - 2
15. Payables – current
Note 2019/20 2018/19
R’000 R’000
Clearing accounts 15.1 138 -
Total 138 -
15.1 Clearing accounts
Note 2019/20 2018/19
15 R’000 R’000
SARS 136 -
Pension Fund 2 -
Total 138 -
16. Payables – non-current
2019/20 2018/19
R’000 R’000 R’000 R’000 R’000
Note One to two years
Two to three years
More than three years Total Total
Advances received 16.1 - - 371 371 371
Total - - 371 371 371
16.1 Advances received
Note 2019/20 2018/19
R’000 R’000
Public entities Annexure 8B
371 371
Total 371 371

Annual Financial Statements
113
DEPARTMENT OF PUBLIC ENTERPRISESVOTE 09
NOTES TO THE ANNUAL FINANCIAL STATEMENTS FOR THE YEAR ENDED 31 MARCH 2020
17. Net cash flow available from operating activities
2019/20 2018/19
R’000 R’000
Net surplus/(deficit) as per Statement of Financial Performance 48 095 59 200
Add back non cash/cash movements not deemed operating activities (43 955) (5 242)
(Increase)/decrease in receivables 58 2 167
(Increase)/decrease in prepayments and advances (147) 218
Increase/(decrease) in payables – current 138 (194)
Proceeds from sale of capital assets - (17)
Expenditure on capital assets 4 228 9 253
Surrenders to Revenue Fund (48 232) (16 669)
Net cash flow generated by operating activities 4 140 53 958
18. Reconciliation of cash and cash equivalents for cash flow purposes
Note 2019/20 2018/19
R’000 R’000
Consolidated Paymaster General account 36 162 47 555
Cash on hand 57 57
Cash with commercial banks (Local) 170 276 158 931
Total 206 495 206 543
19. Contingent liabilities and contingent assets
19.1 Contingent liabilities
Note 2019/20 2018/19
R’000 R’000
Liable to NatureOther guarantees Annex 3A 353 086 632 308 206 667
Claims against the department Annex 3B 575 536 578 042
Total 353 662 168 308 784 709
Note: According to section 70 of the PFMA, Act1 of 1999 (as amended by Act 29 of 1999) the Department is responsible for reporting on all
guarantees that were issued to Public Entities under its control. Any payment under a guarantee will be a direct charge against the National Revenue
Fund via the Department.
The guarantee exposure is equal to the sum of the closing balances, accrued interest and revaluation adjustments on inflation linked bonds due
to changes to the inflation rates. An amount R 308.206 billion on other guarantees has been reinstated to include revaluation due to inflation rate
movement as per National Treasury instruction note 3 of 2019.
20. Capital Commitments
Note 2019/20 2018/19
R’000 R’000
Class of assetsComputer Equipment 2 544 -
Other Machinery and Equipment 12 -
Total 2 556 -
Note: This note has been amended in terms of the revised Modified Cash Standards which require a disclosure of only capital expenditure commitment,
and as a result 2018/19 figure has been restated.

114
DEPARTMENT OF PUBLIC ENTERPRISESVOTE 09
NOTES TO THE ANNUAL FINANCIAL STATEMENTS FOR THE YEAR ENDED 31 MARCH 2020
21. Accruals and payables not recognised
21.1 Accruals
2019/20 2018/19
R’000 R’000
Listed by economic classification
30 Days 30+ Days Total Total
Goods and services 834 - 834 3 826
Capital Assets 14 - 14 -
Total 848 - 848 3 826
Listed by programme level
Administration 842 3 587
SOC Governance Assurance & Performance 6 154
Business Enhancement & Industrialisation - 85
Total 848 3 826
22. Employee benefits
Note 2019/20 2018/19
R’000 R’000
Leave entitlement 6 418 4 775
Service bonus 3 021 2 774
Performance awards 1 277 2 562
Capped leave commitments 1 525 1 464
Total 12 241 11 575
23. Lease commitments
23.1 Operating leases
2019/20 Specialised military
equipment
Land Buildings and other fixed structures
Machinery and
equipment
Total
R’000 R’000 R’000 R’000 R’000
Not later than 1 year - - 12 012 394 12 406
Later than 1 year and not later than 5 years - - 7 304 466 7 770
Total lease commitments - - 19 316 860 20 176
2018/19 Specialised military
equipment
Land Buildings and other fixed structures
Machinery and
equipment
Total
R’000 R’000 R’000 R’000 R’000
Not later than 1 year - - 11 174 280 11 454
Later than 1 year and not later than 5 years - - 19 316 174 19 490
Total lease commitments - - 30 490 454 30 944

Annual Financial Statements
115
DEPARTMENT OF PUBLIC ENTERPRISESVOTE 09
NOTES TO THE ANNUAL FINANCIAL STATEMENTS FOR THE YEAR ENDED 31 MARCH 2020
24. Irregular expenditure
24.1 Reconciliation of irregular expenditure
Note 2019/20 2018/19
R’000 R’000
Opening balance 821 821
Less: Prior year amounts condoned (821) -
Closing balance - 821
Analysis of awaiting condonation per age classification
Prior years - 821
Total - 821
24.2 Details of irregular expenditure condoned
Incident Condoned by (relevant authority) 2019/20R’000
Appointment of a supplier without a valid tax clearance certificate.
National Treasury 471
Allocation of points to a supplier without BEE certificate
National Treasury 350
Total 821
24.3 Details of irregular expenditure under assessment (not included in the main note)
Incident 2019/20R’000
Forensic Services 974
Total 974
25. Fruitless and wasteful expenditure
25.1 Reconciliation of fruitless and wasteful expenditure
2019/20 2018/19
R’000 R’000
Opening balance 713 27
Fruitless and wasteful expenditure – relating to prior year - 532
Fruitless and wasteful expenditure – relating to current year 27 181
Less : Amounts resolved (written off and recovered) (9) (27)
Closing balance 731 713
25.2 Details of current and prior year fruitless and wasteful expenditure – added current year (under determination and investigation)
Incident Disciplinary steps taken/criminal proceedings 2019/20R’000
No shows and cancellation fees Conduct investigation to determine the cause 27Total 27

116
DEPARTMENT OF PUBLIC ENTERPRISESVOTE 09
NOTES TO THE ANNUAL FINANCIAL STATEMENTS FOR THE YEAR ENDED 31 MARCH 2020
25.3 Details of fruitless and wasteful expenditure written off
Incident 2019/20R’000
No show 9
Total 9
25.4 Details of fruitless and wasteful expenditures under assessment (not included in the main note)
Incident 2019/20R’000
Settlement agreement between service provider and the department 1 010
Total 1 010
26. Related Party Transaction
26.1 Payments made
2019/20 2018/19ESKOM 49 000 000 -
SAA 5 500 000 5 000 000
SA Express 300 000 1 249 000
Denel 1 800 000 -
Total 56 600 000 6 249 000
26.2 Other
Other 2019/20 2018/19Guarantees issued/received Annex 3A 38 737 199 61 892 247
Total 38 737 199 61 892 247
Related party relationship and the nature thereof
Name of Entity Relationship Nature of OperationsAlexkor
Shareholder Representative
A diamond mining company that operates primarily in Alexander Bay and the greater Namaqualand area.
Denel Denel is responsible for manufacturing defence equipment and maintains sovereign and strategic defence capabilities on behalf of the state.
South African Express Airways SA Express is a domestic and regional air carrier.
South African Airways South African Airways is the South African national airline.
South African Forestry Company
SAFCOL is government’s forestry company which conducts timber harvesting, timber processing and related activities both domestically and regionally.
Eskom Eskom generates, transmits and distributes electricity to industrial, mining, commercial, agricultural and residential customers and redistributors.
Transnet Transnet is a freight and logistics company responsible for pipelines, ports, and rail transport infrastructure and operations in South Africa.
27. Key management personnel
No. of Individuals 2019/20 2018/19R’000 R’000
Political office bearers 2 3 895 2 402
Officials:
Level 15 to 16 11 15 475 15 746
Level 14 (incl. CFO if at a lower level) 19 26 193 23 420
Total 45 563 41 568

Annual Financial Statements
117
DEPARTMENT OF PUBLIC ENTERPRISESVOTE 09
NOTES TO THE ANNUAL FINANCIAL STATEMENTS FOR THE YEAR ENDED 31 MARCH 2020
28. Non-adjusting events after reporting date2019/20
Nature of event R’000Zam Projects 16 900
Total 16 900
Note: The Department received summons on the 02 June 2020 from a service provider.
29. Movable Tangible Capital Assets
MOVEMENT IN MOVABLE TANGIBLE CAPITAL ASSETS PER ASSET REGISTER FOR THE YEAR ENDED 31 MARCH 2020
Opening balance
Value adjustments
Additions Disposals Closing Balance
R’000 R’000 R’000 R’000 R’000
MACHINERY AND EQUIPMENT 38 730 - 4 197 548 42 379
Transport assets 6 118 - 2 411 - 8 529
Computer equipment 18 989 - 1 307 407 19 889
Furniture and office equipment 4 746 - 80 132 4 694
Other machinery and equipment 8 877 - 399 9 9 267
TOTAL MOVABLE TANGIBLE CAPITAL ASSETS 38 730 - 4 197 548 42 379
29.1 Additions
ADDITIONS TO MOVABLE TANGIBLE CAPITAL ASSETS PER ASSET REGISTER FOR THE YEAR ENDED 31 MARCH 2020
Cash Non-cash (Capital Work in Progress
current costs and finance
lease payments)
Received current, not
paid(Paid current year, received
prior year)
Total
R’000 R’000 R’000 R’000 R’000
MACHINERY AND EQUIPMENT 4 197 - - - 4 197
Transport assets 2 411 - - - 2 411
Computer equipment 1 307 - - - 1 307
Furniture and office equipment 80 - - - 80
Other machinery and equipment 399 - - - 399
TOTAL ADDITIONS TO MOVABLE TANGIBLE CAPITAL ASSETS 4 197 - - - 4 197

118
DEPARTMENT OF PUBLIC ENTERPRISESVOTE 09
NOTES TO THE ANNUAL FINANCIAL STATEMENTS FOR THE YEAR ENDED 31 MARCH 2020
29.2 Disposals
DISPOSALS OF MOVABLE TANGIBLE CAPITAL ASSETS PER ASSET REGISTER FOR THE YEAR ENDED 31 MARCH 2020Sold for cash Non-cash
disposalTotal disposals Cash Received
ActualR’000 R’000 R’000 R’000
MACHINERY AND EQUIPMENT 57 491 548Computer equipment 48 359 407 -
Furniture and office equipment - 132 132 -
Other machinery and equipment 9 - 9 -
TOTAL DISPOSAL OF MOVABLE TANGIBLE CAPITAL ASSETS 57 491 548
29.3 Movement for 2018/19
MOVEMENT IN TANGIBLE CAPITAL ASSETS PER ASSET REGISTER FOR THE YEAR ENDED 31 MARCH 2019Opening balance
Prior period error
Additions Disposals Closing Balance
R’000 R’000 R’000 R’000 R’000MACHINERY AND EQUIPMENT 34 481 - 8 817 (4 568) 38 730Transport assets 6 118 - - - 6 118
Computer equipment 17 772 - 3 964 (2 747) 18 989
Furniture and office equipment 3 765 - 1 509 (528) 4 746
Other machinery and equipment 6 826 - 3 344 (1 293) 8 877
TOTAL MOVABLE TANGIBLE CAPITAL ASSETS 34 481 - 8 817 (4 568) 38 730
30. Minor assets
MOVEMENT IN MINOR ASSETS PER THE ASSET REGISTER FOR THE YEAR ENDED AS AT 31 MARCH 2020Specialised
military assetsIntangible
assetsHeritage assets Machinery and
equipmentBiological assets Total
R’000 R’000 R’000 R’000 R’000 R’000
Opening balance - 64 - 5 416 - 5 480
Value adjustments - - - (2) - (2)
Additions - - - 590 - 590
Disposals - - - (481) - (481)
TOTAL MINOR ASSETS - 64 - 5 523 - 5 587
Specialised military assets
Intangible assets
Heritage assets Machinery and equipment
Biological assets Total
Number of R1 minor assets - - - 165 - 165
Number of minor assets at cost - 19 - 3 800 - 3 819
TOTAL NUMBER OF MINOR ASSETS - 19 3 965 - 3 984

Annual Financial Statements
119
DEPARTMENT OF PUBLIC ENTERPRISESVOTE 09
NOTES TO THE ANNUAL FINANCIAL STATEMENTS FOR THE YEAR ENDED 31 MARCH 2020
MOVEMENT IN MINOR ASSETS PER THE ASSET REGISTER FOR THE YEAR ENDED AS AT 31 MARCH 2019
Specialised military assets
Intangible assets
Heritage assets Machinery and equipment
Biological assets Total
R’000 R’000 R’000 R’000 R’000 R’000Opening balance - 50 - 4 530 - 4 580Additions - 14 - 1 392 - 1 406Disposals - - - (506) - (506)TOTAL MINOR ASSETS - 64 - 5 416 - 5 480
Specialised military assets
Intangible assets
Heritage assets Machinery and equipment
Biological assets Total
Number of R1 minor assets - - - 165 - 165
Number of minor assets at cost - 19 - 3 706 - 3 725
TOTAL NUMBER OF MINOR ASSETS - 19 - 3 871 - 3 890
31. Intangible Capital Assets
MOVEMENT IN INTANGIBLE CAPITAL ASSETS PER ASSET REGISTER FOR THE YEAR ENDED 31 MARCH 2020Opening balance
Value adjustments
Additions Disposals Closing Balance
R’000 R’000 R’000 R’000 R’000SOFTWARE 3 653 - 31 - 3 684TOTAL INTANGIBLE CAPITAL ASSETS 3 653 - 31 - 3 684
31.1 Additions
ADDITIONS TO INTANGIBLE CAPITAL ASSETS PER ASSET REGISTER FOR THE YEAR ENDED 31 MARCH 2020Cash Non-Cash (Develop-
ment work in progress – current costs)
Received current year, not
paid(Paid current year, received
prior year)
Total
R’000 R’000 R’000 R’000 R’000SOFTWARE 31 - - - 31
TOTAL ADDITIONS TO INTANGIBLE CAPITAL ASSETS 31 - - - 31
31.2 Movement for 2018/19
MOVEMENT IN INTANGIBLE CAPITAL ASSETS PER ASSET REGISTER FOR THE YEAR ENDED 31 MARCH 2019Opening balance
Prior period error
Additions Disposals Closing Balance
R’000 R’000 R’000 R’000 R’000SOFTWARE 3 197 - 456 - 3 653
TOTAL INTANGIBLE CAPITAL ASSETS 3 197 - 456 - 3 653

120
DEPARTMENT OF PUBLIC ENTERPRISESVOTE 09
NOTES TO THE ANNUAL FINANCIAL STATEMENTS FOR THE YEAR ENDED 31 MARCH 2020
32. Prior Period Error
32.1 Correction of prior period errors
Note Amount before error correction
Prior period error 2019/20
RestatedAmount
2018/19 2018/19 2018/19
R’000 R’00 R’000 0 R’000
Liabilities:
Contingent Liabilities 19 301 009 549 7 775 160 308 784 709
Net effect 301 009 549 7 775 160 308 784 709
Note: The guarantee exposure is equal to the sum of the closing balances, accrued interest and revaluation adjustments on inflation linked bonds due
to changes to the inflation rate.
The amount of R301 billion reported in 2018/19 did not include the inflation rate of R7.775 million and this resulted in an error. An amount of R 308.206
billion on other guarantees has been restated to include revaluation due to inflation rate movement as per National Treasury instruction note 3 of 2019

Annual Financial Statements
121
DEP
ART
MEN
T O
F PU
BLIC
EN
TERP
RISE
SVO
TE 0
9
AN
NEX
URE
TO
TH
E A
NN
UA
L FI
NA
NCI
AL
STAT
EMEN
TS F
OR
THE
YEA
R EN
DED
31
MA
RCH
202
0
AN
NEX
URE
1A
STAT
EMEN
T O
F CO
ND
ITIO
NA
L G
RAN
TS A
ND
OTH
ER T
RAN
SFER
S PA
ID T
O M
UN
ICIP
ALI
TIES
NA
ME
OF
MU
NIC
IPA
LITY
GRA
NT
ALL
OCA
TIO
NTR
AN
SFER
SPEN
T20
18/1
9
DoR
A
and
othe
r tr
ansf
ers
Roll
Ove
rsA
djus
t-m
ents
Tota
l Av
aila
ble
Act
ual
Tran
sfer
Fund
s W
ithhe
ld
Re-a
lloca
-tio
ns b
y N
atio
nal
Trea
sury
or
Nat
ion-
al D
epar
t-m
ent
Am
ount
re
ceiv
ed
by
mun
ici-
palit
y
Am
ount
sp
ent b
y m
unic
ipal
-it
yU
nspe
nt
fund
s
% o
f av
aila
ble
fund
s sp
ent b
y m
unic
i-pa
lity
Div
isio
n of
Re
venu
e A
ctA
ctua
l tr
ansf
er
R’00
0R’
000
R’00
0R’
000
R’00
0R’
000
%R’
000
R’00
0R’
000
%R’
000
R’00
0
City
of T
shw
ane
Met
ropo
litan
M
unic
ipal
ity-
--
-15
--
--
--
-12
TOTA
L-
--
-15
--
--
--
-12

122
AN
NEX
URE
1D
STAT
EMEN
T O
F TR
AN
SFER
S/SU
BSID
IES
TO P
UBL
IC C
ORP
ORA
TIO
NS
AN
D P
RIVA
TE E
NTE
RPRI
SES
NA
ME
OF
PUBL
IC
CORP
ORA
TIO
N/P
RIVA
TE
ENTE
RPRI
SE
TRA
NSF
ER A
LLO
CATI
ON
EXPE
ND
ITU
RE20
19/2
0
Adj
uste
dA
ppro
-pr
iatio
n A
ctRo
ll O
vers
Adj
ustm
ents
Tota
l Av
aila
ble
Act
ual
Tran
sfer
% o
f Av
aila
ble
fund
s Tr
ansf
erre
d
Capi
tal
Curr
ent
Fina
l A
ppro
pria
tion
R’00
0R’
000
R’00
0R’
000
R’00
0%
R’00
0R’
000
R’00
0
Publ
ic C
orpo
ratio
ns
Tra
nsfe
rs
Dep
artm
ent o
f Pub
lic W
orks
2 9
76-
- 2
976
2 9
76 1
00.0
%
Priv
ate
Ente
rpri
ses
2 9
76-
- 2
976
2 9
76 1
00.0
%-
--
Tran
sfer
s
EY S
tuar
t59
8-
-59
859
810
0.0%
100
.0%
598
--
598
598
--
-
TOTA
L3
574
--
3 57
43
574
100
.0%
--
-
DEP
ART
MEN
T O
F PU
BLIC
EN
TERP
RISE
SVO
TE 0
9
AN
NEX
URE
TO
TH
E A
NN
UA
L FI
NA
NCI
AL
STAT
EMEN
TS F
OR
THE
YEA
R EN
DED
31
MA
RCH
202
0

Annual Financial Statements
123
AN
NEX
URE
1G
STAT
EMEN
T O
F TR
AN
SFER
S TO
HO
USE
HO
LDS
HO
USE
HO
LDS
TRA
NSF
ER A
LLO
CATI
ON
EXPE
ND
ITU
RE20
19/2
0
Adj
uste
dA
ppro
-pr
iatio
n A
ctRo
ll O
vers
Adj
ust-
men
tsTo
tal
Avai
labl
eA
ctua
l Tr
ansf
er
% o
f Av
aila
ble
fund
s Tr
ansf
erre
dFi
nal
App
ropr
iatio
n
R’00
0R’
000
R’00
0R’
000
R’00
0%
R’00
0
Tran
sfer
s
Leav
e G
ratu
ity47
1-
-47
147
110
0%1
029
Retir
emen
t ben
efit
4 06
8-
-4
068
4 06
810
0%-
TOTA
L4
539
--
4 53
94
539
100%
1 02
9
DEP
ART
MEN
T O
F PU
BLIC
EN
TERP
RISE
SVO
TE 0
9
AN
NEX
URE
TO
TH
E A
NN
UA
L FI
NA
NCI
AL
STAT
EMEN
TS F
OR
THE
YEA
R EN
DED
31
MA
RCH
202
0

124
AN
NEX
URE
2A
STAT
EMEN
T O
F IN
VEST
MEN
TS IN
AN
D A
MO
UN
TS O
WIN
G B
Y/TO
NAT
ION
AL/
PRO
VIN
CIA
L PU
BLIC
EN
TITI
ES
Nam
e of
Pub
lic E
ntit
y
State Entity’s PFMA Schedule type (state year end if not 31 March)
% Held 19/20
N
umbe
r of s
hare
s he
ldCo
st o
f inv
estm
ent
Net
Ass
et v
alue
of i
nves
tmen
tPr
ofit/
(Los
s) fo
r the
yea
r
Losses guaranteed
R’00
0R’
000
R’00
0% Held 18/19
2019
/20
2018
/19
2019
/20
2018
/19
2019
/20
2018
/19
2019
/20
2018
/19
Yes/No
Nat
iona
l/Pro
vinc
ial P
ublic
En
tity
Ale
xkor
SO
C L
TD2
100
100
400
000
000
400
000
000
400
000
400
000
200
698
205
698
(5 0
00)
(149
591
)N
o
Den
el S
OC
Ltd
210
010
01
225
057
663
1 22
5 05
6 66
37
976
376
6 17
6 37
6(1
568
000
)(1
694
000
)(1
672
)(1
749
)N
o
Esko
m S
OC
Ltd
210
010
013
2 00
0 00
0 00
1 83
000
000
001
13
2 00
0 00
0 83
000
000
19
3 94
6 00
0 15
1 64
4 00
0 (1
6 96
6 00
0)(2
0 82
0 00
0)N
o
Safc
ol S
OC
Ltd
210
010
031
8 01
3 25
4 31
8 01
3 25
4 31
8 01
3 31
8 01
3 2
980
000
3 18
9 31
7 (2
16 0
00)
(117
635
) N
o
Tran
snet
SO
C L
td2
100
100
12 6
60 9
86 3
10
12 6
60 9
86 3
10
12 6
60 9
86
12 6
60 9
86
129
955
000
148
631
000
4 13
6 00
0 6
047
000
No
Sout
h A
frica
n Ex
pres
s SO
C L
td2
100
100
*452
*4
52
2 13
4 00
0 1
834
000
No
Sout
h A
frica
n A
irway
s SO
C L
td2
100
100
** 1
3 00
8 75
8 15
4 **
13 0
08 7
58 1
54
33 5
08 7
58
28 0
08 7
58(1
3 08
2 00
0)(1
2 77
0 00
0)(5
188
000
)(5
045
000
)N
o
TO
TAL
159
612
815
834
110
612
814
834
188
998
133
132
398
133
312
431
698
289
206
015
(18
240
672)
(20
086
975)
Not
e: *
The
num
ber o
f sha
res h
eld
in re
spec
t of S
A Ex
pres
s exc
lude
s sha
res s
till t
o be
issu
ed fo
r R1.
549
billi
on in
vest
men
t (20
18/1
9 - 2
019/
20) fi
nanc
ial y
ear.
**Th
e nu
mbe
r of s
hare
s hel
d in
resp
ect o
f SAA
exc
lude
s sha
res s
till t
o be
issu
ed fo
r R20
.5 b
illio
n in
vest
men
t (20
17/1
8 - 2
019/
20) fi
nanc
ial y
ear.
DEP
ART
MEN
T O
F PU
BLIC
EN
TERP
RISE
SVO
TE 0
9
AN
NEX
URE
TO
TH
E A
NN
UA
L FI
NA
NCI
AL
STAT
EMEN
TS F
OR
THE
YEA
R EN
DED
31
MA
RCH
202
0

Annual Financial Statements
125
AN
NEX
URE
2B
STAT
EMEN
T O
F IN
VEST
MEN
TS IN
AN
D A
MO
UN
TS O
WIN
G B
Y/TO
EN
TITI
ES (C
ON
TIN
UED
)
Nam
e of
Pub
lic E
ntit
yN
atur
e of
bus
ines
s
Cost
of i
nves
tmen
tN
et A
sset
val
ue o
f In
vest
men
tA
mou
nts
owin
g to
Ent
ities
Am
ount
s ow
ing
by E
ntiti
es
R’00
0R’
000
R’00
0R’
000
2019
/20
2018
/19
2019
/20
2018
/19
2019
/20
2018
/19
2019
/20
2018
/19
Cont
rolle
d en
titie
s
Ale
xkor
Lim
ited
Min
ing
400
000
400
000
200
698
205
698
Den
el (P
ty) L
tdM
anuf
actu
ring
of A
rms
7 97
6 37
66
176
376
(1 5
68 0
00)
(1 6
94 0
00)
Esko
m L
imite
dEn
ergy
132
000
000
83 0
00 0
0019
3 94
6 00
0 15
1 64
4 00
0
SAFC
OL
Lim
ited
Fore
stry
318
013
318
013
2 98
0 00
0 3
189
317
Tran
snet
Lim
ited
Tran
spor
t12
660
986
12
660
986
129
955
000
148
631
000
Sout
h A
frica
n Ex
pres
s A
irway
s (P
ty)L
td
Tran
spor
t2
134
000
1 83
4 00
0
Sout
h A
frica
n A
irway
sTr
ansp
ort
33 5
08 7
58
28 0
08 7
58(1
3 08
2 00
0)(1
2 77
0 00
0)
TOTA
L
188
998
133
132
398
133
312
431
698
289
206
015
Not
e: T
he n
et a
sset
val
ue o
f the
inve
stm
ent a
nd p
rofit
/loss
for t
he y
ear e
nded
31
Mar
ch 2
020
is ba
sed
on p
rovi
siona
l am
ount
s and
is st
ill su
bjec
t to
the
SOCs
ext
erna
l aud
it pr
oces
s and
ther
efor
e su
bjec
t to
chan
ge.
For S
outh
Afri
can
Expr
ess A
irway
s, th
e am
ount
refle
cted
in D
epar
tmen
t’s fi
nanc
ial s
tate
men
ts d
iffer
s fro
m th
e am
ount
refle
cted
in S
AX fi
nanc
ial s
tate
men
ts d
ue to
diff
eren
t acc
ount
ing
fram
ewor
ks. T
he S
OC’
s rep
ort
in te
rms o
f Int
erna
tiona
l Fin
anci
al R
epor
ting
Stan
dard
s (IF
RS) a
nd th
e D
epar
tmen
t use
s Mod
ified
Cas
h Ba
sis o
f Acc
ount
ing.
Dep
artm
ent’s
Fin
anci
al S
tate
men
ts
Mod
ified
Cas
h Ba
sis
of A
ccou
ntin
gTr
ansa
ctio
n D
etai
lsSA
X’ F
inan
cial
Sta
tem
ents
IF
RS A
ccou
ntin
g
Shar
es v
alue
d @
Conv
ertib
le lo
an
Paid
R1
40 m
illio
nTo
acq
uire
SA
Exp
ress
sha
res
and
acqu
ire lo
anRe
capi
talis
e SA
Exp
ress
R57
mill
ion
-
-R3
57 m
illio
n
Tran
sfer
red
R445
mill
ion
R445
mill
ion
-
Paid
dur
ing
2018
/19
R1.2
49 b
illio
nR1
.249
bill
ion
Paid
dur
ing
the
year
R300
mill
ion
R 30
0 m
illio
n
Tota
l (20
19/2
0)
R2.1
34 b
illio
nR2
.051
bill
ion
DEP
ART
MEN
T O
F PU
BLIC
EN
TERP
RISE
SVO
TE 0
9
AN
NEX
URE
TO
TH
E A
NN
UA
L FI
NA
NCI
AL
STAT
EMEN
TS F
OR
THE
YEA
R EN
DED
31
MA
RCH
202
0

126
AN
NEX
URE
3A
STAT
EMEN
T O
F FI
NA
NCI
AL
GU
ARA
NTE
ES IS
SUED
AS
AT 3
1 M
ARC
H 2
020
– LO
CAL
Gua
rant
or
inst
itutio
nG
uara
ntee
in
resp
ect o
f
Ori
gina
l gu
aran
teed
ca
pita
l am
ount
Ope
ning
ba
lanc
e 1
Apr
il 20
19O
ther
M
ovem
ents
Gua
rant
ees
draw
dow
nsdu
ring
the
year
Gua
rant
ees
repa
ymen
ts/
canc
elle
d/
redu
ced
duri
ng
the
year
Reva
luat
ion
due
to fo
reig
n cu
rren
cy
mov
emen
tsCl
osin
g ba
lanc
e31
Mar
ch 2
020
Reva
luat
ions
du
e to
infla
tion
rate
mov
emen
ts
Acc
rued
gu
aran
teed
in
tere
st fo
r ye
ar e
nded
31
Mar
ch 2
020
R’00
0R’
000
R’00
0R’
000
R’00
0R’
000
R’00
0R’
000
R’00
0O
ther
SA E
xpre
ssSA
Exp
ress
cov
enan
ts b
reac
hed
123
000
123
000
--
--
123
000
--
Wor
king
Cap
ital
--
--
--
--
-
Lett
ers
of C
redi
t40
300
40 3
00-
--
-40
300
--
New
Gua
rant
ee Ju
ne 2
018
1 74
0 00
0-
--
--
--
-
SAA
SAA
Rec
apita
lisat
ion
1 30
0 00
078
4 66
5-
--
-78
4 66
5-
24 8
56
Goi
ng C
once
rn 1
1 60
0 00
01
448
000
-78
000
--
1 52
6 00
0-
32 7
08
Goi
ng C
once
rn 2
5 00
6 00
03
908
811
--
-19
6 98
94
105
800
-95
762
Goi
ng C
once
rn 3
6 48
8 00
05
001
011
-2
900
359
1 50
0 00
0-
6 40
1 37
0-
129
036
Goi
ng C
once
rn 4
4 72
0 00
04
119
800
-2
600
000
2 00
0 00
0-
4 71
9 80
0-
47 0
13
Den
elN
ote
Prog
ram
me
3 43
0 00
03
430
000
--
--
3 43
0 00
0-
-
Gen
eral
Fac
ility
1
000
000
--
1 00
0 00
0-
-1
000
000
--
Egyp
t Mis
sile
Exp
ort C
ontr
act
2 50
0 00
0-
--
--
--
-
Esko
m
Esko
m b
onds
– E
S23
-17
927
192
-1
856
562
--
19 7
83 7
54-
364
150
Esko
m b
onds
– E
S26
-28
851
239
-4
046
701
--
32 8
97 9
40-
1 28
4 58
8
Esko
m b
onds
– E
S33
-33
904
491
-62
5 11
9-
-34
529
610
-11
9 63
4
Esko
m b
onds
– E
S42
-15
200
612
-5
708
049
--
20 9
08 6
61-
772
101
Esko
m b
onds
– E
L28
-5
278
241
--
--
5 27
8 24
12
589
425
83 2
28
Esko
m b
onds
– E
L29
-3
709
000
--
--
3 70
9 00
01
665
529
37 5
92
Esko
m b
onds
– E
L30
-3
664
990
--
--
3 66
4 99
01
391
272
20 1
28
Esko
m b
onds
– E
L31
-4
076
329
--
--
4 07
6 32
9 1
312
438
37 4
12
Esko
m B
onds
- EL
36
-3
753
000
--
--
3 75
3 00
01
045
045
18 0
91
Esko
m B
onds
- EL
37
-3
811
000
-27
000
--
3 83
8 00
01
068
714
18 5
01
Pape
r Iss
ued
Floa
t Rat
e N
otes
-4
000
000
--
--
4 00
0 00
0-
45 8
14
Shor
t Ter
m N
otes
-1
130
000
-4
495
000
--
5 62
5 00
0-
-
Util
ised
142
064
526
--
--
--
--
Unu
tilis
ed p
ortio
n 2
935
474
--
--
--
--
TOTA
L17
2 94
7 30
014
4 16
1 68
1-
23 3
36 7
903
500
000
196
989
164
195
460
9 07
2 42
33
130
614
DEP
ART
MEN
T O
F PU
BLIC
EN
TERP
RISE
SVO
TE 0
9
AN
NEX
URE
TO
TH
E A
NN
UA
L FI
NA
NCI
AL
STAT
EMEN
TS F
OR
THE
YEA
R EN
DED
31
MA
RCH
202
0

Annual Financial Statements
127
AN
NEX
URE
3A
(CO
NTI
NU
ED)
STAT
EMEN
T O
F FI
NA
NCI
AL
GU
ARA
NTE
ES IS
SUED
AS
AT 3
1 M
ARC
H 2
020
– FO
REIG
N
Gua
rant
or
inst
itutio
nG
uara
ntee
in
resp
ect o
f
Ori
gina
l gu
aran
teed
ca
pita
l am
ount
Ope
ning
bal
ance
1
Apr
il 20
19
Oth
er
Mov
emen
tsG
uara
ntee
s dr
aw d
owns
duri
ng th
e ye
ar
Gua
rant
ees
repa
ymen
ts/
canc
elle
d/
redu
ced
duri
ng
the
year
Reva
luat
ion
due
to fo
reig
n cu
rren
cy
mov
emen
tsCl
osin
g ba
lanc
e31
Mar
ch 2
020
Reva
luat
ions
du
e to
in
flatio
n ra
te
mov
emen
ts
Acc
rued
gu
aran
teed
in
tere
st fo
r ye
ar e
nded
31
Mar
ch 2
020
R’00
0R’
000
R’00
0R’
000
R’00
0R’
000
R’00
0R’
000
R’00
0O
ther
Tran
snet
Euro
-Ran
d m
ediu
m te
rm
note
(Tra
nche
1) #
2 00
0 00
0 2
000
000
- -
- -
2 00
0 00
0-
257
425
Euro
-Ran
d m
ediu
m te
rm
note
(Tra
nche
2) #
1 50
0 00
0 1
500
000
- -
- -
1 50
0 00
0-
411
Esko
m
AfD
B (Z
AR)
10 6
30 0
00
7 36
9 39
7 -
128
870
714
121
6
784
146
-77
920
AfD
B (E
UR)
10 2
62 4
57
9 82
3 73
6 -
577
503
977
280
1 92
1 65
0 11
345
609
-
Wor
ld B
ank
(IBRD
) USD
4 93
9 60
2 2
666
591
(2 6
06 7
38)
375
230
78 9
60
85 7
87
441
910
-4
497
Wor
ld B
ank
(IBRD
) ZA
R22
831
023
30
011
268
2
606
738
- 1
611
071
31
006
935
-1
229
030
AfD
B -S
ERE
USD
73 6
49
109
830
- -
8 90
7 23
863
12
4 78
6-
470
AfD
B -C
TF U
SD80
9 51
0 61
3 21
1 -
-
144
091
757
302
-30
1
Wor
ld B
ank
(IBRD
) CTF
(USD
250m
)1
992
925
506
061
- -
- 11
8 91
4 62
4 97
5-
651
AFD
B ZA
R (P
rivat
e Se
ctor
)1
800
000
1 26
6 66
7 -
- 13
3 33
3
1 13
3 33
4-
14 2
42
AFD
B U
SD (P
rivat
e Se
ctor
)2
581
034
2 66
6 96
1 -
- 28
4 57
1 56
4 55
0 2
946
940
-13
908
AFD
(ZA
R) -
SERE
980
840
766
281
- -
61 3
03
- 70
4 97
8-
20 6
71
AFD
(ZA
R)2
273
055
2 27
3 05
5 -
- -
- 2
273
055
-85
264
KFW
DFI
(ZA
R)
3 93
4 50
0
3 93
4 50
0 -
-
19
6 72
5
3 73
7 77
5-
2
069
KFW
(USD
)
1 35
3 38
0 -
- -
-
--
-
MIG
A
8 46
3 52
5
7 65
2 43
2 -
- -
1
551
782
9 20
4 21
4-
19
175
AfD
B A
loan
(USD
)
14
8 25
0
13
6 82
0 -
- -
22
210
15
9 03
0-
1
199
AfD
B B
loan
(USD
)
1
4 30
6 12
5
1
3 97
9 81
0 -
-
8 1
58
3
293
115
17 2
64 7
67-
130
155
AfD
B Se
nior
Uns
ecur
ed Z
AR
5
292
354
4
998
334
- -
294
020
4
704
314
-
78 9
25
CD
B Sh
ort-T
erm
(USD
)-Med
upi/
Kusi
le-
7
243
425
- -
7
337
100
93
675
-
-
-
CD
B Lo
ng-T
erm
(USD
)-Med
upi
20
131
950
14
486
850
- -
-
3 40
4 10
0 17
890
950
-
30 1
13
CD
B Lo
ng-t
erm
(USD
) Kus
ile
3
2 99
8 50
0
7 96
7 76
8 -
14
162
880
-
4 49
1 08
6 26
621
734
-
42 8
85
USD
1bn
bon
d
1
4 11
5 00
0
1
4 48
6 85
0 -
- -
3
404
100
17 8
90 9
50
-
15
9 17
5
DEP
ART
MEN
T O
F PU
BLIC
EN
TERP
RISE
SVO
TE 0
9
AN
NEX
URE
TO
TH
E A
NN
UA
L FI
NA
NCI
AL
STAT
EMEN
TS F
OR
THE
YEA
R EN
DED
31
MA
RCH
202
0

128
Gua
rant
or
inst
itutio
nG
uara
ntee
in
resp
ect o
f
Ori
gina
l gu
aran
teed
ca
pita
l am
ount
Ope
ning
bal
ance
1
Apr
il 20
19
Oth
er
Mov
emen
tsG
uara
ntee
s dr
aw d
owns
duri
ng th
e ye
ar
Gua
rant
ees
repa
ymen
ts/
canc
elle
d/
redu
ced
duri
ng
the
year
Reva
luat
ion
due
to fo
reig
n cu
rren
cy
mov
emen
tsCl
osin
g ba
lanc
e31
Mar
ch 2
020
Reva
luat
ions
du
e to
in
flatio
n ra
te
mov
emen
ts
Acc
rued
gu
aran
teed
in
tere
st fo
r ye
ar e
nded
31
Mar
ch 2
020
R’00
0R’
000
R’00
0R’
000
R’00
0R’
000
R’00
0R’
000
R’00
0Sy
ndic
ate
loan
-Cre
dit F
acili
ty
Agr
eem
ent
15
000
000
15
000
000
- -
-
15 0
00 0
00-
208
752
AFD
B ZA
R (P
ublic
Sec
tor)
2
900
000
- -
- -
-
--
AFD
B U
SD (P
ublic
Sec
tor)
346
000
- -
- -
-
--
AFD
Tra
nche
1
1 44
1 30
5 -
- -
-
--
-
New
Dev
elop
men
t Ban
k (N
DB)
2
534
184
- -
155
926
-
37 2
56
193
182
-
11
Unu
tilis
ed G
uara
ntee
s
2
2 86
0 83
1 -
- -
--
--
-
Tota
l
208
499
999
151
459
847
-
15
400
409
11
705
549
19
156
179
174
310
886
-2
377
249
DEP
ART
MEN
T O
F PU
BLIC
EN
TERP
RISE
SVO
TE 0
9
AN
NEX
URE
TO
TH
E A
NN
UA
L FI
NA
NCI
AL
STAT
EMEN
TS F
OR
THE
YEA
R EN
DED
31
MA
RCH
202
0

Annual Financial Statements
129
AN
NEX
URE
3B
STAT
EMEN
T O
F CO
NTI
NG
ENT
LIA
BILI
TIES
AS
AT 3
1 M
ARC
H 2
020
Nat
ure
of L
iabi
lity
Ope
ning
Ba
lanc
e Li
abili
ties
incu
rred
dur
ing
the
year
Liab
ilitie
s pa
id/
canc
elle
d/re
duce
d du
ring
th
e ye
ar
Liab
ilitie
s re
cove
rabl
e (P
rovi
de
deta
ils
here
unde
r)
Clos
ing
Bala
nce
1 A
pril
2019
31 M
arch
202
0
R’00
0R’
000
R’00
0R’
000
R’00
0
Clai
ms
agai
nst t
he d
epar
tmen
t
Equi
ty A
llian
ce (P
ty) L
td v
s G
over
nmen
t of R
SA 5
72 0
00-
- -
572
000
Zam
Pro
ject
s2
038
-(2
038
)-
-
Labo
ur D
ispu
tes
4 00
479
1(1
259
)-
3 53
6
TOTA
L57
8 04
279
1(3
297
)-
575
536
Not
e: A
n am
ount
of R
1.2
59 m
illio
n in
resp
ect o
f lab
our d
isput
e m
atte
r was
sett
led
afte
r the
repo
rtin
g da
tes.
DEP
ART
MEN
T O
F PU
BLIC
EN
TERP
RISE
SVO
TE 0
9
AN
NEX
URE
TO
TH
E A
NN
UA
L FI
NA
NCI
AL
STAT
EMEN
TS F
OR
THE
YEA
R EN
DED
31
MA
RCH
202
0

130
AN
NEX
URE
8A
INTE
R-EN
TITY
AD
VAN
CES
PAID
(not
e 10
)
ENTI
TY
Confi
rmed
bal
ance
out
stan
ding
Unc
onfir
med
bal
ance
out
stan
ding
TOTA
L
31/0
3/20
2031
/03/
2019
31/0
3/20
2031
/03/
2019
31/0
3/20
2031
/03/
2019
R’00
0R’
000
R’00
0R’
000
R’00
0R’
000
NAT
ION
AL
DEP
ART
MEN
TS
Dep
artm
ent o
f Int
erna
tiona
l Rel
atio
ns a
nd C
oope
ratio
ns-
-79
064
379
064
3
Tota
l-
-79
064
379
064
3
AN
NEX
URE
8B
INTE
R-EN
TITY
AD
VAN
CES
RECE
IVED
(not
e 16
)
ENTI
TY
Confi
rmed
bal
ance
out
stan
ding
Unc
onfir
med
bal
ance
out
stan
ding
TOTA
L
31/0
3/20
2031
/03/
2019
31/0
3/20
2031
/03/
2019
31/0
3/20
2031
/03/
2019
R’00
0R’
000
R’00
0R’
000
R’00
0R’
000
PUBL
IC E
NTI
TIES
Non
-Cur
rent
16 d
ays
of a
ctiv
ism
aga
inst
wom
en a
nd c
hild
abu
se37
137
1-
-37
137
1
TOTA
L37
137
1-
-37
137
1
DEP
ART
MEN
T O
F PU
BLIC
EN
TERP
RISE
SVO
TE 0
9
AN
NEX
URE
TO
TH
E A
NN
UA
L FI
NA
NCI
AL
STAT
EMEN
TS F
OR
THE
YEA
R EN
DED
31
MA
RCH
202
0

PUBLIC ENTERPRISES I Annual Report 2019/2020
131
NOTES:

132
NOTES:


DEPARTMENTAL INFORMATION
Physical address80 Hamilton StreetArcadiaPretoria
Postal addressPrivate Bag X15Hatfield0028
Telephone: +27 12 431 1000Fax: +27 086 501 2624E-mail: [email protected]: www.dpe.gov.za
RP298/2020ISBN: 978-0-621-4838-1
Title of Publication: Department of Public Enterprises: Annual Report 2019/2020