2016.06.17 design flows - meaford
TRANSCRIPT


o
o


File: 598-3486
Date: 26-May-16
Updated: 17-Jun-16
By: L. Waters
Check By: R. Alexander
Site Area 0.50 ha
Number of Units in Building A 72 units
Number of Residential Units 72 units
Person Per Residential Unit (typical) 2.5 persons/unit
Residential Population 180.0 persons
Domestic Water Design Flows
Residential (per MOE Design of Water Works 3.4.2) 450 L/C-day
Total Domestic Water Design Flows
Average Residential Daily Flow (per MOE Design of Water Works 3.4.2) 0.94 L/sec
Max Day Peak Factor (per MOE Design of Water Works 3.4.2) 2.75
Max Day Demand Flow (per MOE Design of Water Works 3.4.2) 2.58 L/sec
* used minimum peaking factor for systems servicing 500 persons
Peak Hour Factor (per MOE Design of Water Works 3.4.2) 4.13
Peak Hour Flow (per MOE Design of Water Works 3.4.2) 3.87 L/sec
Collingwood St. - Water Design Criteria
J:\500\598 - Lorablue Holdings Inc\3486-Collingwood St\Design\2016.06.17 Design Flows

Meaford Mews - Collingwood St
Fire Protection Volume Calculation - Building 1 Completed By: LW/RA
CFCA File: 598-3486 Page 1
Water Supply for Public Fire Protection - 1999
Fire Underwriters Survey Part II - Guide for Determination of Required Fire Flow
1. An estimate of fire flow required for a given area may be determined by the formula:
F = 220 * C * sqrt A
where
F = the required fire flow in litres per minute
C = coefficient related to the type of construction
= 1.5 for wood frame construction (structure essentially all combustible)
= 1.0 for ordinary construction (brick or other masonry walls, combustible floor and interior)
= 0.8 for non-combustible construction (unprotected metal structural components)
= 0.6 for fire-resistive construction (fully protected frame, floors, roof)
A = The total floor area in square metres (including all storeys, but excluding basements at least
50 percent below grade) in the building considered.
Proposed Buildings ordinary construction
1.5 number of floors being considered 1.0 C
1215.1 sq.m. floor area
1822.7 sq.m. total floor area
Therefore F= 9,000 L/min (rounded to nearest 1000 L/min)
Fire flow determined above shall not exceed:
30,000 L/min for wood frame construction
30,000 L/min for ordinary construction
25,000 L/min for non-combustible construction
25,000 L/min for fire-resistive construction
2. Values obtained in No. 1 may be reduced by as much as 25% for occupancies having low contents fire hazard or may
be increased by up to 25% surcharge for occupancies having a high fire hazard.
Non-Combustible -25% Free Burning 15%
Limited Combustible -15% Rapid Buring 25%
Combustible No Charge
Low fire Hazard occupancy for dwellings 0% reduction
0 L/min reduction
Note: Flow determined shall not be less than 2,000 L/min
3. Sprinklers - The value obtained in No. 2 above may be reduced by up to 50% for complete automatic sprinkler
protection.
Buildings will not have automatic sprinklers (typical 30% reduction)
0 L/min reduction
June 17, 2016
J:\500\598 - Lorablue Holdings Inc\3486-Collingwood St\Design\2016.06.17 FUS V1 6/17/2016 3:56 PM

Meaford Mews - Collingwood St
Fire Protection Volume Calculation - Building 1 Completed By: LW/RA
CFCA File: 598-3486 Page 2
Water Supply for Public Fire Protection - 1999
Fire Underwriters Survey Part II - Guide for Determination of Required Fire Flow
4. Exposure - To the value obtained in No. 2, a percentage should be added for structures exposed within 45 metres
by the fire area under consideration. The percentage shall depend upon the height, area, and construction of the
building(s) being exposed, the separation, openings in the exposed building(s), the length and height of exposure,
the provision of automatic sprinklers and/or outside sprinklers in the building(s) esposed, the occupancy of the
exposed building(s) and the effect of hillside locations on the possible spread of fire.
Separation Charge Separation Charge
0 to 3 m 25% 20.1 to 30 m 10%
3.1 to 10 m 20% 30.1 to 45 m 5%
10.1 to 20 m 15%
Exposed buildings
Name Distance
North Adjacent Dwelling 32.0 5% 450
South Adjacent Dwelling 31.8 5% 450
East Adjacent Dwelling 44.9 5% 450
West Adjacent Dwelling 6.5 20% 1800
3,150 L/min Surcharge
Required Duration of Fire Flow
Determine Required Fire Flow Flow Required Duration
L/min (hours)
No.1 9,000 2,000 or less 1.0
No. 2 0 reduction 3,000 1.25
No. 3 0 reduction 4,000 1.5
No. 4 3,150 surcharge 5,000 1.75
6,000 2.0
Required Flow: 12,150 L/min 8,000 2.0
Rounded to nearest 1000l/min: 12,000 L/min or 200.0 L/s 10,000 2.0
3,170 USGPM 12,000 2.5
14,000 3.0
16,000 3.5
Determine Required Fire Storage Volume 18,000 4.0
20,000 4.5
Flow from above 12,000 L/min 22,000 5.0
24,000 5.5
Required duration 2.50 hours 26,000 6.0
28,000 6.5
Therefore: 1,800,000 Litres or 30,000 7.0
1,800 cu.m. is the required fire storage volume. 32,000 7.5
34,000 8.0
36,000 8.5
38,000 9.0
40,000 and over 9.5
June 17, 2016
J:\500\598 - Lorablue Holdings Inc\3486-Collingwood St\Design\2016.06.17 FUS V1 6/17/2016 3:56 PM

Meaford Mews - Collingwood St
Fire Protection Volume Calculation - Building 1 Completed By: LW/RA
CFCA File: 598-3486 Page 3
Fire Protection Water Supply Guideline
Part 3 of the Ontario Building Code (2006)
Q = KVSTOT
Q = minimum supply of water in litres (L)
K = water supply coefficient
V = total building volume in cubic metres
STOT = total of spatial coefficient values from property line exposures on all sides
C Building classification per OBC 3.1.2.1
K = 23.0 Group C (Table 1 OFM guideline)
V = 5467.95 1822.65sqm total floor area by 3m height
STOT = 1 STOT Need Not Exceed 2.0
Q = L
Based on ranges listed in Table 2 (OFM guideline), the required minimum water supply flow rate is 9000 L/min
150 L/s
125762.85
June 17, 2016
J:\500\598 - Lorablue Holdings Inc\3486-Collingwood St\Design\2016.06.17 FUS V1 6/17/2016 3:56 PM

File: 598-3486
Date: 26-May-16
Updated: 17-Jun-16
By: L. Waters
Check By: R. Alexander
Developed Site Area 0.50 ha
Number of Units in Building A 72 units
Total Number of Residential Units 72 units
Person Per Residential Unit (typical) 2.5 persons/unit
Residential Population 180 persons
Unit Sewage flows
Residential (per MOE Design of Sewage Works, Section 5.5.2.1) 450 L/C-day
Infiltration (typical) 0.23 L/s/ha
Total Design Sewage Flows
Infiltration/Inflow Residential 0.12 L/sec
Average Daily Residential Flow (MOE Design of Sewage Works 5.5.2.1) 0.94 L/sec
Residential Peak Factor (MOE Design of Sewage Works 5.5.2.1) 4.2
Total Peak Daily Flow (per MOE Design of Sewage Works 5.5.2.1) 4.02 L/sec
Collingwood St. - Sanitary Design Criteria
J:\500\598 - Lorablue Holdings Inc\3486-Collingwood St\Design\2016.06.17 Design Flows


Project:
Project No.:
File:
Design by:
Date:
Land Use Area (ha) RC
Roof/Paved Area 0.08 0.90
Gravel Area 0.03 0.75
Grassed Area 0.39 0.25
Total 0.50 0.39
Land Use Area (ha) RC
Roof/Paved Area 0.41 0.90
Grassed Area 0.09 0.25
Total 0.50 0.78
Event
Adjustment
Coefficient Return Event RC
Event
Adjustment
Coefficient Return Event RC
RC2 1.00 0.39 RC2 1.00 0.78
RC5 1.00 0.39 RC5 1.00 0.78
RC10 1.00 0.39 RC10 1.00 0.78
RC25 1.10 0.43 RC25 1.10 0.86
RC50 1.20 0.46 RC50 1.20 0.94
RC100 1.25 0.48 RC100 1.25 0.98
Notes: 1) Areas measured from site plan
2) RC values taken as the typical values from the Municipality of Meaford Engineering Design Standards
3) Event adjustment coefficients as per Municipality of Meaford Engineering Design Standards
Post-Development (Controlled Area)
Collingwood St Redevelopment
598-3486
Runoff Coefficients
LW
June 17, 2016
Pre-Development
Pre-Development Post-Development (Controlled Area)
*Areas measured from site survey.
J:\500\598 - Lorablue Holdings Inc\3486-Collingwood St\Design\2016.06.17 Modified Rational Method
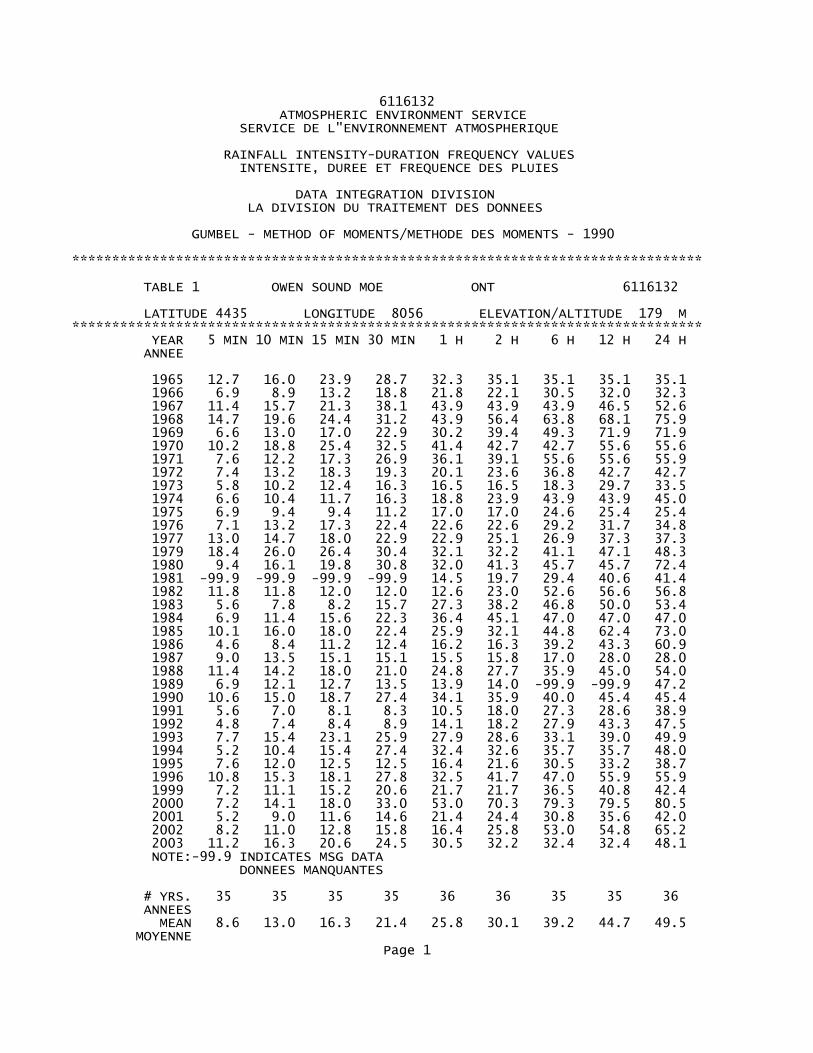
6116132 ATMOSPHERIC ENVIRONMENT SERVICE SERVICE DE L"ENVIRONNEMENT ATMOSPHERIQUE
RAINFALL INTENSITY-DURATION FREQUENCY VALUES INTENSITE, DUREE ET FREQUENCE DES PLUIES
DATA INTEGRATION DIVISION LA DIVISION DU TRAITEMENT DES DONNEES
GUMBEL - METHOD OF MOMENTS/METHODE DES MOMENTS - 1990
*******************************************************************************
TABLE 1 OWEN SOUND MOE ONT 6116132
LATITUDE 4435 LONGITUDE 8056 ELEVATION/ALTITUDE 179 M******************************************************************************* YEAR 5 MIN 10 MIN 15 MIN 30 MIN 1 H 2 H 6 H 12 H 24 H ANNEE
1965 12.7 16.0 23.9 28.7 32.3 35.1 35.1 35.1 35.1 1966 6.9 8.9 13.2 18.8 21.8 22.1 30.5 32.0 32.3 1967 11.4 15.7 21.3 38.1 43.9 43.9 43.9 46.5 52.6 1968 14.7 19.6 24.4 31.2 43.9 56.4 63.8 68.1 75.9 1969 6.6 13.0 17.0 22.9 30.2 39.4 49.3 71.9 71.9 1970 10.2 18.8 25.4 32.5 41.4 42.7 42.7 55.6 55.6 1971 7.6 12.2 17.3 26.9 36.1 39.1 55.6 55.6 55.9 1972 7.4 13.2 18.3 19.3 20.1 23.6 36.8 42.7 42.7 1973 5.8 10.2 12.4 16.3 16.5 16.5 18.3 29.7 33.5 1974 6.6 10.4 11.7 16.3 18.8 23.9 43.9 43.9 45.0 1975 6.9 9.4 9.4 11.2 17.0 17.0 24.6 25.4 25.4 1976 7.1 13.2 17.3 22.4 22.6 22.6 29.2 31.7 34.8 1977 13.0 14.7 18.0 22.9 22.9 25.1 26.9 37.3 37.3 1979 18.4 26.0 26.4 30.4 32.1 32.2 41.1 47.1 48.3 1980 9.4 16.1 19.8 30.8 32.0 41.3 45.7 45.7 72.4 1981 -99.9 -99.9 -99.9 -99.9 14.5 19.7 29.4 40.6 41.4 1982 11.8 11.8 12.0 12.0 12.6 23.0 52.6 56.6 56.8 1983 5.6 7.8 8.2 15.7 27.3 38.2 46.8 50.0 53.4 1984 6.9 11.4 15.6 22.3 36.4 45.1 47.0 47.0 47.0 1985 10.1 16.0 18.0 22.4 25.9 32.1 44.8 62.4 73.0 1986 4.6 8.4 11.2 12.4 16.2 16.3 39.2 43.3 60.9 1987 9.0 13.5 15.1 15.1 15.5 15.8 17.0 28.0 28.0 1988 11.4 14.2 18.0 21.0 24.8 27.7 35.9 45.0 54.0 1989 6.9 12.1 12.7 13.5 13.9 14.0 -99.9 -99.9 47.2 1990 10.6 15.0 18.7 27.4 34.1 35.9 40.0 45.4 45.4 1991 5.6 7.0 8.1 8.3 10.5 18.0 27.3 28.6 38.9 1992 4.8 7.4 8.4 8.9 14.1 18.2 27.9 43.3 47.5 1993 7.7 15.4 23.1 25.9 27.9 28.6 33.1 39.0 49.9 1994 5.2 10.4 15.4 27.4 32.4 32.6 35.7 35.7 48.0 1995 7.6 12.0 12.5 12.5 16.4 21.6 30.5 33.2 38.7 1996 10.8 15.3 18.1 27.8 32.5 41.7 47.0 55.9 55.9 1999 7.2 11.1 15.2 20.6 21.7 21.7 36.5 40.8 42.4 2000 7.2 14.1 18.0 33.0 53.0 70.3 79.3 79.5 80.5 2001 5.2 9.0 11.6 14.6 21.4 24.4 30.8 35.6 42.0 2002 8.2 11.0 12.8 15.8 16.4 25.8 53.0 54.8 65.2 2003 11.2 16.3 20.6 24.5 30.5 32.2 32.4 32.4 48.1 NOTE:-99.9 INDICATES MSG DATA DONNEES MANQUANTES
# YRS. 35 35 35 35 36 36 35 35 36 ANNEES MEAN 8.6 13.0 16.3 21.4 25.8 30.1 39.2 44.7 49.5 MOYENNE
Page 1

6116132 STD. DEV. 3.1 3.9 5.0 7.7 10.3 12.3 12.6 12.8 13.6 ECART-TYPE SKEW 1.14 1.02 .23 .15 .65 1.19 .91 .84 .54 DISSYMETRIE KURTOSIS 4.62 5.48 2.61 2.38 3.12 5.03 5.01 3.70 3.04 KURTOSIS
WARNING / AVERTISSEMENT YEAR 1979 HAD VALUE GREATER THAN 100 YEAR STORM. EN 1979 L"INTENSITE DE LA PLUIE A DE PASSE CELLE POUR UNE PERIODE DE RETOUR DE 100 ANS DATA/LA VALEUR = 18.4 100 YEAR/ANNEE = 18.4
WARNING / AVERTISSEMENT YEAR 1979 HAD VALUE GREATER THAN 100 YEAR STORM. EN 1979 L"INTENSITE DE LA PLUIE A DE PASSE CELLE POUR UNE PERIODE DE RETOUR DE 100 ANS DATA/LA VALEUR = 26.0 100 YEAR/ANNEE = 25.2
WARNING / AVERTISSEMENT YEAR 2000 HAD VALUE GREATER THAN 100 YEAR STORM. EN 2000 L"INTENSITE DE LA PLUIE A DE PASSE CELLE POUR UNE PERIODE DE RETOUR DE 100 ANS DATA/LA VALEUR = 70.3 100 YEAR/ANNEE = 68.8
WARNING / AVERTISSEMENT YEAR 2000 HAD VALUE GREATER THAN 100 YEAR STORM. EN 2000 L"INTENSITE DE LA PLUIE A DE PASSE CELLE POUR UNE PERIODE DE RETOUR DE 100 ANS DATA/LA VALEUR = 79.3 100 YEAR/ANNEE = 78.7
NOTE: -99.9 INDICATES LESS THAN 10 YEARS OF DATA AVAILABLE INDIQUE MOINS DE 10 ANNEES DE DONNEES DISPONIBLES ATMOSPHERIC ENVIRONMENT SERVICE SERVICE DE L"ENVIRONNEMENT ATMOSPHERIQUE
RAINFALL INTENSITY-DURATION FREQUENCY VALUES INTENSITE, DUREE ET FREQUENCE DES PLUIES
GUMBEL - METHOD OF MOMENTS/METHODE DES MOMENTS - 1990*******************************************************************************
TABLE 2 OWEN SOUND MOE ONT 6116132
LATITUDE 4435 LONGITUDE 8056 ELEVATION/ALTITUDE 179 M*******************************************************************************
RETURN PERIOD RAINFALL AMOUNTS (MM) PERIODE DE RETOUR QUANTITIES DE PLUIE (MM)
DURATION 2 5 10 25 50 100 # YEARS DUREE YR/ANS YR/ANS YR/ANS YR/ANS YR/ANS YR/ANS ANNEES 5 MIN 8.1 10.9 12.7 15.0 16.7 18.4 35 10 MIN 12.4 15.8 18.1 21.0 23.1 25.2 35 15 MIN 15.4 19.8 22.7 26.4 29.1 31.8 35 30 MIN 20.2 26.9 31.4 37.1 41.3 45.4 35 1 H 24.1 33.2 39.2 46.8 52.4 58.0 36 2 H 28.1 39.0 46.2 55.3 62.1 68.8 36 6 H 37.2 48.3 55.7 65.0 71.9 78.7 35 12 H 42.6 53.9 61.5 70.9 78.0 85.0 35 24 H 47.3 59.3 67.3 77.4 84.9 92.3 36
RETURN PERIOD RAINFALL RATES (MM/HR)-95% CONFIDENCE' LIMITSPage 2

6116132 INTENSITE DE LA PLUIE PAR PERIODE DE RETOUR (MM/H)-LIMITES DE CONFIANCE DE 95%
DURATION 2 YR/ANS 5 YR/ANS 10 YR/ANS 25 YR/ANS 50 YR/ANS 100 YR/ANS DUREE 5 MIN 97.6 130.4 152.1 179.6 200.0 220.2 +/- 11.3 +/- 19.0 +/- 25.7 +/- 34.7 +/- 41.5 +/- 48.3 10 MIN 74.5 95.0 108.6 125.8 138.5 151.1 +/- 7.1 +/- 11.9 +/- 16.1 +/- 21.7 +/- 25.9 +/- 30.2 15 MIN 61.8 79.3 90.9 105.6 116.5 127.3 +/- 6.0 +/- 10.2 +/- 13.7 +/- 18.5 +/- 22.1 +/- 25.8 30 MIN 40.3 53.9 62.8 74.1 82.5 90.9 +/- 4.7 +/- 7.8 +/- 10.6 +/- 14.3 +/- 17.1 +/- 19.9 1 H 24.1 33.2 39.2 46.8 52.4 58.0 +/- 3.1 +/- 5.2 +/- 7.0 +/- 9.4 +/- 11.3 +/- 13.2 2 H 14.0 19.5 23.1 27.7 31.1 34.4 +/- 1.9 +/- 3.1 +/- 4.2 +/- 5.7 +/- 6.8 +/- 7.9 6 H 6.2 8.1 9.3 10.8 12.0 13.1 +/- .6 +/- 1.1 +/- 1.5 +/- 2.0 +/- 2.3 +/- 2.7 12 H 3.6 4.5 5.1 5.9 6.5 7.1 +/- .3 +/- .5 +/- .7 +/- 1.0 +/- 1.2 +/- 1.4 24 H 2.0 2.5 2.8 3.2 3.5 3.8 +/- .2 +/- .3 +/- .4 +/- .5 +/- .6 +/- .7
ATMOSPHERIC ENVIRONMENT SERVICE SERVICE DE L"ENVIRONNEMENT ATMOSPHERIQUE
RAINFALL INTENSITY-DURATION FREQUENCY VALUES INTENSITE, DUREE ET FREQUENCE DES PLUIES
GUMBEL - METHOD OF MOMENTS/METHODE DES MOMENTS - 1990*******************************************************************************
TABLE 3 OWEN SOUND MOE ONT 6116132
LATITUDE 4435 LONGITUDE 8056 ELEVATION/ALTITUDE 179 M*******************************************************************************
INTERPOLATION EQUATION / EQUATION D"INTERPOLATION: R = A * T ** B R = RAINFALL RATE / INTENSITE DE LA PLUIE (MM /HR) T = TIME IN HOURS / TEMPS EN HEURES
STATISTICS 2 YR 5 YR 10 YR 25 YR 50 YR 100 YR STATISTIQUES ANS ANS ANS ANS ANS ANS
MEAN OF R 36.0 47.3 54.8 64.3 71.4 78.4 MOYENNE DE R STD. DEV. R 34.7 45.5 52.7 61.7 68.4 75.1 ECART-TYPE STD. ERROR 10.5 14.0 16.4 19.6 21.9 24.2 ERREUR STANDARD COEFF. (A) 21.4 28.1 32.5 38.1 42.3 46.4 COEFFICIENT (A) EXPONENT (B) -.708 -.714 -.716 -.719 -.720 -.721 EXPOSANT (B) MEAN % ERROR 9.9 11.8 12.6 13.3 13.7 14.1 % D'ERREUR
Page 3

PROJECT: Collingwood St Redevelopement
PROJECT No.: 598-3468
DATE: 6/17/2016
DESIGN: LW
CHECK: RA
IDF Location Owen Sound Intensity (mm/hr): 57.10
Return Period 5 yr
Time of Concentration (min) 15
Coeff A 21.4
Coeffic B -0.708
Runoff Coeff (Unadjusted) 0.39 Flow (m3/s) 0.03
Runoff Coefficient (Adjusted) 0.39
Area (ha) 0.50
IDF Location Owen Sound Intensity (mm/hr): 57.10
Return Period 5 yr
Time of Concentration (min) 15
Coeff A 21.4
Coeffic B -0.708
Runoff Coeff (unadjusted) 0.78 Uncont. Flow (m3/s) 0.06
Runoff Coefficient (Adjusted) 0.78
Area (ha) 0.50
Target Flow (m3/s) 0.03
REQUIRED STORAGE VOLUME: 29.0
Td i Td QUncont Sd
min mm/hr sec m 3 /s m 3
10 76.09 600 0.084 27.0
15 57.10 900 0.063 28.7
20 46.58 1200 0.051 29.0
25 39.77 1500 0.044 28.5
30 34.96 1800 0.039 27.4
35 31.34 2100 0.035 26.0
40 28.52 2400 0.031 24.2
Storage Volume Determination (Detailed)
Modified Rational Method Storage Sizing
Pre-Development Scenario Data
Inputs Outputs
Post-Development Scenario Data
Inputs Outputs
IntensityB) d= A (T)d(Ti
Peak Flow• A)d(T• ipost• C0.0028 = postQ
Storage2) / c+ Td(TpreQ-d• Tpost= QdS
dS
Qpr
J:\500\598 - Lorablue Holdings Inc\3486-Collingwood St\Design\2016.06.17 Modified Rational Method

PROJECT: Collingwood St Redevelopement
PROJECT No.: 598-3468
DATE: 6/17/2016
DESIGN: LW
CHECK: RA
IDF Location Owen Sound Intensity (mm/hr): 126.07
Return Period 100 yr
Time of Concentration (min) 15
Coeff A 46.4
Coeffic B -0.721
Runoff Coeff (Unadjusted) 0.39 Flow (m3/s) 0.09
Runoff Coefficient (Adjusted) 0.48
Area (ha) 0.50
IDF Location Owen Sound Intensity (mm/hr): 126.07
Return Period 100 yr
Time of Concentration (min) 15
Coeff A 46.4
Coeffic B -0.721
Runoff Coeff (unadjusted) 0.78 Uncont. Flow (m3/s) 0.17
Runoff Coefficient (Adjusted) 0.98
Area (ha) 0.50
Target Flow (m3/s) 0.09
REQUIRED STORAGE VOLUME: 79.4
Td i Td QUncont Sd
min mm/hr sec m 3 /s m 3
10 168.87 600 0.233 75.3
15 126.07 900 0.174 79.2
20 102.45 1200 0.141 79.4
25 87.23 1500 0.120 77.4
30 76.48 1800 0.105 74.0
35 68.44 2100 0.094 69.5
40 62.16 2400 0.086 64.1
Storage Volume Determination (Detailed)
Modified Rational Method Storage Sizing
Pre-Development Scenario Data
Inputs Outputs
Post-Development Scenario Data
Inputs Outputs
IntensityB) d= A (T)d(Ti
Peak Flow• A)d(T• ipost• C0.0028 = postQ
Storage2) / c+ Td(TpreQ-d• Tpost= QdS
dS
Qpr
J:\500\598 - Lorablue Holdings Inc\3486-Collingwood St\Design\2016.06.17 Modified Rational Method

PROJECT: Collingwood St Redevelopement
PROJECT No.: 598-3468
DATE: 6/17/2016
DESIGN: LW
CHECK: RA
IDF Location Owen Sound Intensity (mm/hr): 57.10
Return Period 5 yr
Time of Concentration (min) 15
Coeff A 21.4
Coeffic B -0.708
Runoff Coeff (Unadjusted) 0.39 Flow (m3/s) 0.03
Runoff Coefficient (Adjusted) 0.39
Area (ha) 0.50
IDF Location Owen Sound Intensity (mm/hr): 126.07
Return Period 100 yr
Time of Concentration (min) 15
Coeff A 46.4
Coeffic B -0.721
Runoff Coeff (unadjusted) 0.78 Uncont. Flow (m3/s) 0.08
Runoff Coefficient (Adjusted) 0.98
Area (ha) 0.50
Target Flow (m3/s) 0.03
REQUIRED STORAGE VOLUME: 161.1
Td i Td QUncont Sd
min mm/hr sec m 3 /s m 3
10 168.87 600 0.233 116.3
15 126.07 900 0.174 128.4
20 102.45 1200 0.141 136.8
25 87.23 1500 0.120 143.0
30 76.48 1800 0.105 147.8
35 68.44 2100 0.094 151.4
40 62.16 2400 0.086 154.3
45 57.10 2700 0.079 156.5
50 52.92 3000 0.073 158.2
55 49.40 3300 0.068 159.4
60 46.40 3600 0.064 160.3
65 43.80 3900 0.060 160.8
70 41.52 4200 0.057 161.1
75 39.50 4500 0.054 161.1
80 37.71 4800 0.052 160.9
85 36.10 5100 0.050 160.5
90 34.64 5400 0.048 159.9
Storage Volume Determination (Detailed)
Modified Rational Method Storage Sizing
Inputs Outputs
Pre-Development Scenario Data
Inputs Outputs
Post-Development Scenario Data
IntensityB) d= A (T)d(Ti
Peak Flow• A)d(T• ipost• C0.0028 = postQ
Storage2) / c+ Td(TpreQ-d• Tpost= QdS
dS
Qpr
J:\500\598 - Lorablue Holdings Inc\3486-Collingwood St\Design\2016.06.17 Modified Rational Method

PROJECT: Collingwood St Redevelopement
PROJECT No.: 598-3468
DATE: 6/17/2016DESIGN: LW
CHECK: RA
Orifice Type = Plate (i.e. Plate, Tube)
Invert Elevation = 177.29 m
Diameter of Orifice = 90 mm
Area of Orifice (A) = 0.006 sq.m
Orifice Coefficient (Cd) = 0.64 (Plate = 0.64, Tube = 0.82)
Calculation of Head
Centroid Elevation = 177.34 m
Water Elevation = 180.70 m
Upstream Head*, (h) = 3.37 m
Qa = (Cd)(A)(2gh)^0.5
Actual Controlled Discharge, Qa = 0.033 cms
*Head is based upon orifice area @ orifice face not Vena Contracta
Control Orifice Design Summary
J:\500\598 - Lorablue Holdings Inc\3486-Collingwood St\Design\2016.06.17 Orifice Sizing

Project: Meaford Mews Towers
Project No.: 598-3486
FILE: Super Pipe Storage
DATE: June 17, 2016
DESIGN: LW
Max. Allowable Water Elevation: 180.70 m
From MH# To MH# Length Diameter Storage Vol.
(m) (mm) (m3)
1 2 31.7 1200 35.9
2 3 17.5 1200 19.8
3 4 28.3 1200 32.0
CB Leads 24.4 300 1.7
SUM 89.4
MH# Max. Elev T/G Elev. Inv Elev Pipe Dia. Depth Base Diam. Storage Vol.
(m) (m) (m) (mm) (m) (mm) (m3)
1 180.70 180.66 177.29 1200 3.41 2400 13.9
2 180.70 180.80 177.50 1200 3.20 3000 19.1
3 180.70 180.65 177.68 1200 3.02 2400 10.9
4 180.70 180.65 177.85 1200 2.85 2400 10.1
CB# Max. Elev T/G Elev. Inv Elev Depth Base Area Storage Vol.
(m) (m) (m) (m) (m2) (m
3)
1 180.70 180.50 177.77 2.93 0.37 1.1
2 180.70 150.60 177.70 3.00 0.37 1.1
SUM 56.2
CB# Max. Elev T/G Elev. Depth Ponded Area Storage Vol.
(m) (m) (m) (m2) (m
3)
1 180.70 180.50 0.20 508 33.8
2 180.70 180.60 0.10 83 2.8
3 180.70 180.65 0.05 26 0.4
4 180.70 180.65 0.05 26 0.4
SUM 36.6
Total Storage (m3): 182.1
Required Storage (m3): 161.1
Storage Sizing
Pipe Storage
Structure Storage
Surface Storage
J:\500\598 - Lorablue Holdings Inc\3486-Collingwood St\Design\2016.06.17 Storage Page 1 of 1

Project Information & LocationProject Name Meaford Mews Towers Project Number 598-3486
City Meaford State/ Province Ontario
Country Canada Date 5/30/2016
Designer Information EOR Information (optional)
Name Rebecca Alexander Name
Company C.F. Crozier & Associates Company
Phone # 905-875-0026 Phone #
Email [email protected] Email
Stormwater Treatment RecommendationThe recommended Stormceptor Model(s) which achieve or exceed the user defined water quality objective for each site within the project are listed in the below Sizing Summary table.
Brief Stormceptor Sizing Report - Meaford Mews
Site Name Meaford Mews
Target TSS Removal (%) 80
TSS Removal (%) Provided 81
Recommended Stormceptor Model STC 300
Stormceptor Sizing SummaryStormceptor Model % TSS Removal
Provided% Runoff Volume Captured Provided
STC 300 81 98STC 750 88 100
STC 1000 88 100STC 1500 88 100STC 2000 90 100STC 3000 91 100STC 4000 93 100STC 5000 93 100STC 6000 94 100STC 9000 96 100
STC 10000 96 100STC 14000 97 100
Stormceptor MAX Custom Custom
The recommended Stormceptor Model achieves the water quality objectives based on the selected inputs, historical rainfall records and selected particle size distribution.
Stormceptor Brief Sizing Report – Page 1 of 2

Notes
• Stormceptor performance estimates are based on simulations using PCSWMM for Stormceptor, which uses the EPA Rainfall and Runoff modules.• Design estimates listed are only representative of specific project requirements based on total suspended solids (TSS) removal defined by the selected PSD, and based on stable site conditions only, after construction is completed.• For submerged applications or sites specific to spill control, please contact your local Stormceptor representative for further design assistance.
Drainage Area
Total Area (ha) 0.5
Imperviousness % 82.0
Water Quality Objective
TSS Removal (%) 80.0
Runoff Volume Capture (%) 90.00
Oil Spill Capture Volume (L)
Peak Conveyed Flow Rate (L/s)
Water Quality Flow Rate (L/s)
Rainfall
Station Name OWEN SOUND MOE
State/Province Ontario
Station ID # 6132
Years of Records 40
Latitude 44°35'N
Longitude 80°56'W
Up Stream Storage
Storage (ha-m) Discharge (cms)
0.000 0.000
0.017 0.030
Particle Size Distribution (PSD)The selected PSD defines TSS removal
Fine DistributionParticle Diameter
(microns)Distribution
%Specific Gravity
20.0 20.0 1.30
60.0 20.0 1.80
150.0 20.0 2.20
400.0 20.0 2.65
2000.0 20.0 2.65
Up Stream Flow Diversion
Max. Flow to Stormceptor (cms)
Sizing Details
For Stormceptor Specifications and Drawings Please Visit: http://www.imbriumsystems.com/technical-specifications
Stormceptor Brief Sizing Report – Page 2 of 2

KEY PLAN
SCALE: N.T.S.
SUBJECT
PROPERTY
The HarbourEdge Building,
40 Huron Street, Suite 301,
Collingwood, ON L9Y 4R3
705 446-3510 T
705 446-3520 F
www.cfcrozier.ca
J:\500\598 - Lorablue Holdings Inc\3486-Collingwood St\CAD\CIVIL\1SHEET\3486-001.dwg, FIG. 1, 6/20/2016 3:45:50 PM, lwaters

KEY PLAN
SCALE: N.T.S.
SUBJECT
PROPERTY
The HarbourEdge Building,
40 Huron Street, Suite 301,
Collingwood, ON L9Y 4R3
705 446-3510 T
705 446-3520 F
www.cfcrozier.ca
J:\500\598 - Lorablue Holdings Inc\3486-Collingwood St\CAD\CIVIL\1SHEET\3486-001.dwg, FIG. 2, 6/20/2016 3:45:14 PM, lwaters