2016 small business credit survey: report on women-owned …€¦ · this small business credit...
TRANSCRIPT
SMALL BUSINESS CREDIT SURVEY
REPORT ON WOMEN-OWNED FIRMS
2016
Published November 2017
New York • Kansas CityF E D E R A L R E S E R V E B A N K S o f

2016 SMALL BUSINESS CREDIT SURVEY | REPORT ON WOMEN-OWNED FIRMS
TABLE OF CONTENTS
i ACKNOWLEDGMENTS
iii EXECUTIVE SUMMARY
1 FIRM CHARACTERISTICS
6 PERFORMANCE & CREDIT RISK
8 FINANCIAL CHALLENGES
9 FINANCING AND DEBT
10 NONAPPLICANTS
16 DEMAND FOR FINANCING
19 CREDIT APPLICATIONS
20 LOAN & LINE OF CREDIT PRODUCTS
21 CREDIT SOURCES
22 FINANCING APPROVAL
25 FINANCING SHORTFALLS
26 LENDER SATISFACTION
27 METHODOLOGY
29 PARTNER ORGANIZATIONS

i2016 SMALL BUSINESS CREDIT SURVEY | REPORT ON WOMEN-OWNED FIRMS
ACKNOWLEDGMENTS
This Small Business Credit Survey (SBCS) is made possible through collaboration with more than 400 business organizations in communities across the United States. The Federal Reserve Banks thank the national, regional, and community partners who share valuable insights about small business financing needs and collaborate with us to promote and distribute the survey.1 We also thank the National Opinion Research Center (NORC) at the University of Chicago for assistance with weighting the survey data to be statistically representative of the nation’s small business population.2
Special thanks to colleagues within the Federal Reserve System, particularly the Community Affairs Officers,3 and representatives from the U.S. Department of the Treasury, U.S. Small Business Administration, the Association for Enterprise Opportunity (AEO), and The Aspen Institute for their support for this project.
We particularly thank the following individuals:
Daniel Davis, Community Development Officer, Federal Reserve Bank of St. Louis
Menna Demessie, Vice President, Policy Analysis & Research, Congressional Black Caucus Foundation
Annie Donovan, Director, CDFI Fund, U.S. Department of the Treasury
Ingrid Gorman, Research and Insights Director, Association for Enterprise Opportunity
Tammy Halevy, Senior Vice President, New Initiatives, Association for Enterprise Opportunity
Kausar Hamdani, Senior Vice President, Federal Reserve Bank of New York
Gina Harman, Chief Executive Officer, Accion USA
Brian Headd, Chief Economic Advisor, U.S. Small Business Administration
Joyce Klein, Director, FIELD, The Aspen Institute
Joy Lutes, Vice President of External Affairs, National Association of Women Business Owners
John Moon, District Manager, Community Development, Federal Reserve Bank of San Francisco
Chad Moutray, Chief Economist, National Association of Manufacturers
Robin Prager, Senior Adviser, Federal Reserve Board of Governors
Alicia Robb, Chief Executive Officer, Next Wave Ventures
Lauren Rosenbaum, Communications Manager, U.S. Network, Accion
Lauren Stebbins, Vice President, Small Business Initiatives, Opportunity Finance Network
Jeffrey Stout, Director, State Small Business Credit Initiative, U.S. Department of the Treasury
Storm Taliaferrow, Manager of Membership & Impact Assessment, National Association for Latino Community Asset Builders (NALCAB)
Richard Todd, Vice President, Federal Reserve Bank of Minneapolis
Holly Wade, Director of Research and Policy Analysis, National Federation of Independent Business
Eric Weaver, Chief Executive Officer, Opportunity Fund
Kristin Westmoreland, Vice President, Center for Capital Markets Competitiveness, U.S. Chamber of Commerce
Allison Kroeger Zeller, Director of Research, National Retail Federation
1 For a full list of community partners, please see p. 29.2 For complete information about the Survey Methodology, please see p. 27.3 Joseph Firschein, Board of Governors of the Federal Reserve System; Todd Greene, Federal Reserve Bank of Atlanta; Prabal Chakrabarti, Federal Reserve
Bank of Boston; Alicia Williams, Federal Reserve of Chicago; Paul Kaboth, Federal Reserve Bank of Cleveland; Roy Lopez, Federal Reserve Bank of Dallas; Tammy Edwards, Federal Reserve Bank of Kansas City; Michael Grover, Federal Reserve Bank of Minneapolis; Theresa Singleton, Federal Reserve Bank of Philadelphia; Sandy Tormoen, Federal Reserve Bank of Richmond; Yvonne Sparks, Federal Reserve Bank of St. Louis; and David Erickson, Federal Reserve Bank of San Francisco.

ii2016 SMALL BUSINESS CREDIT SURVEY | REPORT ON WOMEN-OWNED FIRMS
ACKNOWLEDGMENTS (CONTINUED)
This report is the result of the collaborative effort, input, and analysis of the following teams:
REPORT TEAM Jessica Battisto, Federal Reserve Bank of New York
Dell Gines, Federal Reserve Bank of Kansas City
Claire Kramer Mills, Federal Reserve Bank of New York
SURVEY DATA AND METHODOLOGY MANAGER Ellyn Terry, Federal Reserve Bank of Atlanta
SURVEY DATA AND METHODOLOGY TEAM Brett Barkley, Federal Reserve Bank of Cleveland
Jessica Battisto, Federal Reserve Bank of New York
Scott Lieberman, Federal Reserve Bank of New York
Emily Wavering, Federal Reserve Bank of Richmond
PARTNERSHIPS MANAGER Emily Mitchell, Federal Reserve Bank of Atlanta
SURVEY OUTREACH TEAM Leilani Barnett, Federal Reserve Bank of San Francisco
Bonnie Blankenship, Federal Reserve Bank of Cleveland
Jeanne Milliken Bonds, Federal Reserve Bank of Richmond
Nathaniel Borek, Federal Reserve Bank of Philadelphia
Laura Choi, Federal Reserve Bank of San Francisco
Brian Clarke, Federal Reserve Bank of Boston
Joselyn Cousins, Federal Reserve Bank of San Francisco
Chelsea Cruz, Federal Reserve Bank of New York
Peter Dolkart, Federal Reserve Bank of Richmond
Ian Galloway, Federal Reserve Bank of San Francisco
Dell Gines, Federal Reserve Bank of Kansas City
Jennifer Giovannitti, Federal Reserve Bank of Richmond
Melody Head, Federal Reserve Bank of San Francisco
Michou Kokodoko, Federal Reserve Bank of Minneapolis
Lisa Locke, Federal Reserve Bank of St. Louis
Shannon McKay, Federal Reserve Bank of Richmond
Emily Mitchell, Federal Reserve Bank of Atlanta
Craig Nolte, Federal Reserve Bank of San Francisco
Drew Pack, Federal Reserve Bank of St. Louis
Emily Perlmeter, Federal Reserve Bank of Dallas
E. Kathleen Ranalli, Federal Reserve Bank of Cleveland
Javier Silva, Federal Reserve Bank of New York
We thank all of the above for their contributions to this successful national effort.
Claire Kramer Mills, PhD Assistant Vice President and Community Affairs Officer Federal Reserve Bank of New YorkThe views expressed in the following pages are those of the authors and do not necessarily represent the views of the Federal Reserve System.

iii2016 SMALL BUSINESS CREDIT SURVEY | REPORT ON WOMEN-OWNED FIRMS
EXECUTIVE SUMMARY
Majority women-owned firms, where 51 percent or more of the business is owned by women, are an important segment of U.S. businesses.1 Since 2007, women- owned firms in the United States, both the self-employed and firms with employees (“employer firms”),2 have been growing—in number and as a share of all U.S. firms.3 As of 2015, women-owned firms totaled over one million and accounted for one-fifth of U.S. firms.4 Among women-owned employer firms, jobs and annual receipts have grown since 2012.5 Between 2007 and 2015, the share of employment by small women-owned firms increased by twenty percent, while the share of employment by all small firms declined by about four percent.6
This report uses a unique dataset to examine the experiences of women-owned small employer firms, especially as compared to their men-owned peers.7 Small employer firms have traditionally played an important role in U.S. job creation,8 and women-owned firms are an emerging share of the sec-tor.5 Understanding the opportunities and challenges facing this growing segment of women-owned employers can provide insight into future economic contributions of the sector overall.
Even as their numbers grow, businesses owned and/or managed by women are encountering significant performance and financial challenges and growth limits.9 Women-owned firms historically have had lower survival rates, profits, employment, and sales than businesses owned by men10—what has been called the “entrepreneurship gender gap.”11 Moreover, Kauffman Firm
Survey findings from 2004 to 2006 indicate women-owned firms start with less capital than their male counterparts, and raise less debt and equity in their early years.12 This disparity can have long-term effects, since startup and growth capital are key contribu-tors to future business success.13
The Small Business Credit Survey offers insights into the sources and implications of the “entrepreneurship gender gap” by comparing women- and men-owned firms’ credit risk, collateral, performance, credit applications, and success rates. Overall, the survey finds:
Majority women-owned firms with employees start small and stay small
� Women-owned small employer firms (hereafter, “women-owned firms”) report lower revenues and fewer employees than men-owned small employer firms (hereaf-ter, “men-owned firms”)— at all ages and stages of development. Women-owned firms are also more likely to report profit-ability challenges at early (five years or less) and later (more than 5 years) stages of maturity.14
� Only 22% of women-owned firms had scaled to $1 million or more in annual revenues in 2016, compared to 36% of men-owned firms.
Women-owned firms are concentrated in less capital-intensive industries
� Women-owned firms are concentrated in industries such as education and health-care, and in professional services and real
estate. These industries comprise 40% of all women-owned firms.
� Men-owned firms, in contrast, are con-centrated in professional services and real estate and non-manufacturing goods production & associated services.
Women-owned firms are more likely to experience financial challenges and growth limits than men-owned firms
� A higher share of women-owned firms reported profitability challenges (31% were operating at a loss, compared to 25% of men-owned firms). Women-owned firms were also more likely to report higher credit risk, with 41% identifying as medium/high credit risk compared to 33% of men-owned firms.
� Such differences are particularly striking for early stage firms, where more than half of women-owned firms (53%) identified as medium/high credit risk, compared to 40% men-owned firms. However, among firms that have survived six or more years, the credit risk differences between women- and men-owned firms are indis-tinguishable (33% of women-owned firms are medium/high credit risk, compared to 29% of men-owned).
� Women-owned firms are more likely to report experiencing financial challenges in the previous 12 months: 64% compared to 58% of men-owned firms.
� While the types of financial challenges that women-owned firms experience are similar to those men face—including accessing credit, meeting operating ex-penses, and purchasing inventory—women
1 Center for Women’s Business Research (2009), The Economic Impact of Women-Owned Businesses in the United States.2 Employer firms in this report are defined as having at least one employee in addition to the owner(s).3 The largest and fastest-growing segment of women entrepreneurs is non-employers, or the self-employed. The Small Business Credit Survey collects data on both
self-employed and employer firms. Future analysis will focus on self-employed women.4 Based on calculations from the US Census Annual Survey of Entrepreneurs (2015).5 Based on calculations from the US Census Survey of Business Owners (2012) and Annual Survey of Entrepreneurs (2014 and 2015).6 Based on calculations from the US Census Survey of Business Owners (2007) and Annual Survey of Entrepreneurs (2015).7 Small employer firms have between one and 499 full- or part-time employees in addition to the owner(s). 20% of small employer firms are majority women-owned,
65% are majority men-owned, and 15% are equally owned.8 Bureau of Labor Statistics, Business Employment Dynamics. For 2017 Q1 job gains and losses by size of firm, see: https://www.bls.gov/web/cewbd/table_a.txt.9 Premier Quantitative Consulting, Inc. for National Women’s Business Council (2015), Undercapitalization as a Contributing Factor to Business Failure for Women
Entrepreneurs. Coleman & Robb for National Women’s Business Council (2014), Access to Capital by High-Growth Women-Owned Businesses.. 10 Fairlie & Robb (2009), Gender Differences in Business Performance: Evidence from the Characteristics of Business Owners Survey.11 New York City (2015), The State of Women Entrepreneurs in New York City: The Landscape and Opportunity.12 Coleman and Robb (2009), A Comparison of New Firm Financing by Gender: Evidence from the Kauffman Firm Survey Data.13 Coleman and Robb for National Women’s Business Council (2014), Access to Capital by High-Growth Women-Owned Businesses.14 See Appendix.
iv2016 SMALL BUSINESS CREDIT SURVEY | REPORT ON WOMEN-OWNED FIRMS
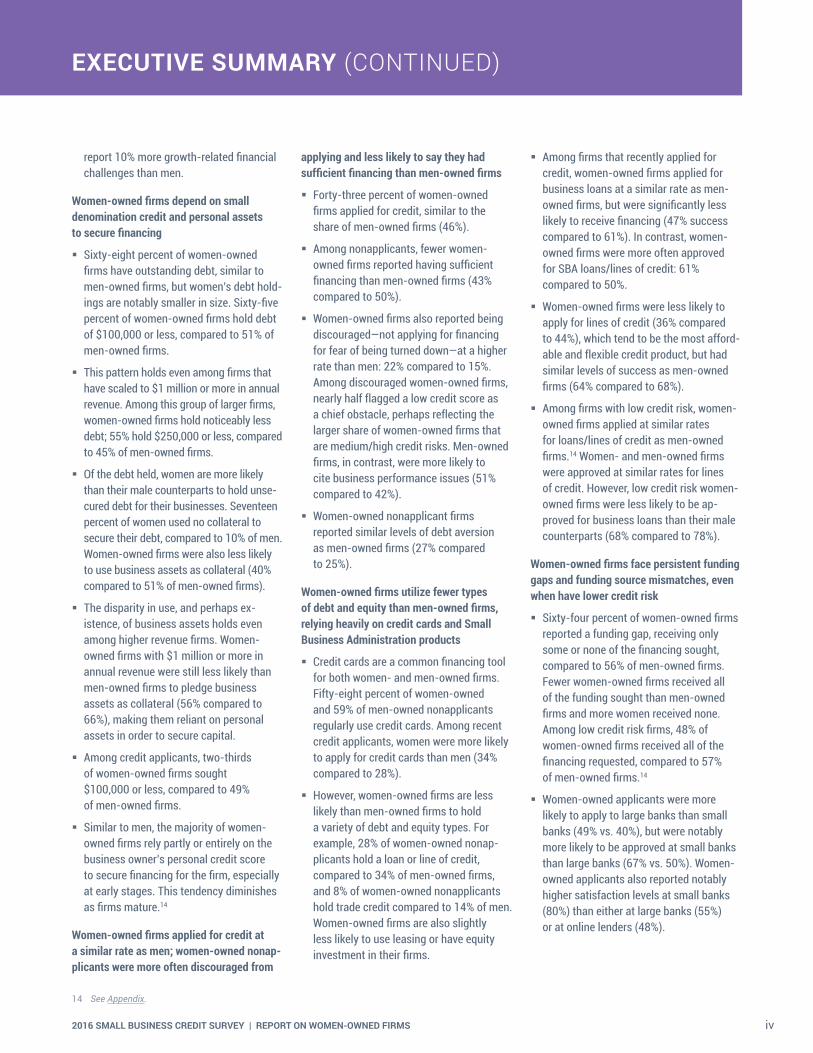
EXECUTIVE SUMMARY (CONTINUED)
report 10% more growth-related financial challenges than men.
Women-owned firms depend on small denomination credit and personal assets to secure financing
� Sixty-eight percent of women-owned firms have outstanding debt, similar to men-owned firms, but women’s debt hold-ings are notably smaller in size. Sixty-five percent of women-owned firms hold debt of $100,000 or less, compared to 51% of men-owned firms.
� This pattern holds even among firms that have scaled to $1 million or more in annual revenue. Among this group of larger firms, women-owned firms hold noticeably less debt; 55% hold $250,000 or less, compared to 45% of men-owned firms.
� Of the debt held, women are more likely than their male counterparts to hold unse-cured debt for their businesses. Seventeen percent of women used no collateral to secure their debt, compared to 10% of men. Women-owned firms were also less likely to use business assets as collateral (40% compared to 51% of men-owned firms).
� The disparity in use, and perhaps ex-istence, of business assets holds even among higher revenue firms. Women-owned firms with $1 million or more in annual revenue were still less likely than men-owned firms to pledge business assets as collateral (56% compared to 66%), making them reliant on personal assets in order to secure capital.
� Among credit applicants, two-thirds of women-owned firms sought $100,000 or less, compared to 49% of men-owned firms.
� Similar to men, the majority of women-owned firms rely partly or entirely on the business owner’s personal credit score to secure financing for the firm, especially at early stages. This tendency diminishes as firms mature.14
Women-owned firms applied for credit at a similar rate as men; women-owned nonap-plicants were more often discouraged from
applying and less likely to say they had sufficient financing than men-owned firms
� Forty-three percent of women-owned firms applied for credit, similar to the share of men-owned firms (46%).
� Among nonapplicants, fewer women-owned firms reported having sufficient financing than men-owned firms (43% compared to 50%).
� Women-owned firms also reported being discouraged—not applying for financing for fear of being turned down—at a higher rate than men: 22% compared to 15%. Among discouraged women-owned firms, nearly half flagged a low credit score as a chief obstacle, perhaps reflecting the larger share of women-owned firms that are medium/high credit risks. Men-owned firms, in contrast, were more likely to cite business performance issues (51% compared to 42%).
� Women-owned nonapplicant firms reported similar levels of debt aversion as men-owned firms (27% compared to 25%).
Women-owned firms utilize fewer types of debt and equity than men-owned firms, relying heavily on credit cards and Small Business Administration products
� Credit cards are a common financing tool for both women- and men-owned firms. Fifty-eight percent of women-owned and 59% of men-owned nonapplicants regularly use credit cards. Among recent credit applicants, women were more likely to apply for credit cards than men (34% compared to 28%).
� However, women-owned firms are less likely than men-owned firms to hold a variety of debt and equity types. For example, 28% of women-owned nonap-plicants hold a loan or line of credit, compared to 34% of men-owned firms, and 8% of women-owned nonapplicants hold trade credit compared to 14% of men. Women-owned firms are also slightly less likely to use leasing or have equity investment in their firms.
� Among firms that recently applied for credit, women-owned firms applied for business loans at a similar rate as men-owned firms, but were significantly less likely to receive financing (47% success compared to 61%). In contrast, women-owned firms were more often approved for SBA loans/lines of credit: 61% compared to 50%.
� Women-owned firms were less likely to apply for lines of credit (36% compared to 44%), which tend to be the most afford-able and flexible credit product, but had similar levels of success as men-owned firms (64% compared to 68%).
� Among firms with low credit risk, women-owned firms applied at similar rates for loans/lines of credit as men-owned firms.14 Women- and men-owned firms were approved at similar rates for lines of credit. However, low credit risk women-owned firms were less likely to be ap-proved for business loans than their male counterparts (68% compared to 78%).
Women-owned firms face persistent funding gaps and funding source mismatches, even when have lower credit risk
� Sixty-four percent of women-owned firms reported a funding gap, receiving only some or none of the financing sought, compared to 56% of men-owned firms. Fewer women-owned firms received all of the funding sought than men-owned firms and more women received none. Among low credit risk firms, 48% of women-owned firms received all of the financing requested, compared to 57% of men-owned firms.14
� Women-owned applicants were more likely to apply to large banks than small banks (49% vs. 40%), but were notably more likely to be approved at small banks than large banks (67% vs. 50%). Women-owned applicants also reported notably higher satisfaction levels at small banks (80%) than either at large banks (55%) or at online lenders (48%).
14 See Appendix.

12016 SMALL BUSINESS CREDIT SURVEY | REPORT ON WOMEN-OWNED FIRMS Source: Small Business Credit Survey, Federal Reserve Banks
FIRM CHARACTERISTICS
1 Gender of firm owner(s) is classified based on 51% or more ownership by a given gender. If there is no majority, then the firm is equally owned.2 SBCS responses throughout this report are weighted using Census data to represent the US small business population on the following dimensions:
firm age, number of employees, industry, geography, and gender of owner.3 Percentages may not sum to 100 due to rounding.
AGE OF FIRM2,3 (% of employer firms)
Majority women-owned (N=2,880) Equally owned (N=1,260) Majority men-owned (N=4,894)
0–2 years
24%
19%
22%
3–5 years
14% 13%15%
6–10 years
18% 19%
24%
11–15 years
12% 14%13%
16–20 years
10% 9%
10%
21+ years
22%
26%
15%
Women-owned firms tend to be younger than men-owned firms.
20% of small employer firms are women-owned.
GENDER OF FIRM OWNER(S)1,2 (% of employer firms) N=9,034
65%Majority men- owned
20%Majority women- owned
15%Equally owned

22016 SMALL BUSINESS CREDIT SURVEY | REPORT ON WOMEN-OWNED FIRMS Source: Small Business Credit Survey, Federal Reserve Banks
FIRM CHARACTERISTICS (CONTINUED)
REVENUE SIZE OF FIRM1 (% of employer firms)
* Categories have been simplified for readability. Actual categories are: ≤$100K, $100,001–$1M, $1,000,001–$10M, >$10M.
Majority women-owned (N=2,791) Equally owned (N=1,205) Majority men-owned (N=4,753)
>$10M$1M–$10M$100K–$1MAnnual revenue
≤$100K
29%21%
16%
50% 54%49%
20% 23%30%
2% 2% 6%
1 Percentages may not sum to 100 due to rounding.2 SBCS responses throughout this report are weighted using Census data to represent the US small business population on the following dimensions:
firm age, number of employees, industry, geography, and gender of owner.3 Employer firms are those that reported having at least one full-time or part-time employee. Does not include self-employed or firms where the
owner is the only employee.4 Use of contract workers presented for women-owned firms. For equally owned and men-owned firms, see Appendix.
Women-owned firms generally have smaller revenues and fewer employees than men-owned firms.
Employees
Majority women-owned (N=2,880) Equally owned (N=1,260) Majority men-owned (N=4,894)
NUMBER OF EMPLOYEES2,3 (% of employer firms)
1–4 5–9 10–19 20–49 50–499
60% 57%52%
17% 13% 7%3%19%
13% 8%3%19%
13% 10%6%
N=2,878 N=1,341
43% of women-owned firms use contract workers.4
Median number of contract workers per women-owned firm: 3

32016 SMALL BUSINESS CREDIT SURVEY | REPORT ON WOMEN-OWNED FIRMS Source: Small Business Credit Survey, Federal Reserve Banks
CENSUS DIVISION1,2 (% of employer firms)
16% | 19% | 16%Pacific
11% | 14% | 10%West South Central
4% | 4% | 5%East South Central
7% | 10% | 7%Mountain
7% | 9% | 7%West North Central
14% | 13% | 14%East North Central
13% | 10% | 15%Middle Atlantic
5% | 4% | 5%New England
22% | 17% | 19%South Atlantic
FIRM CHARACTERISTICS (CONTINUED)
Majority Women-owned (N=2,880) Equally owned (N=1,260) Majority Men-owned (N=4,894)
GEOGRAPHIC LOCATION1,3 (% of employer firms)
Urban Rural
86% 14%
73% 27%
84% 16%
Majority women-owned (N=2,880)
Equally owned (N=1,260)
Majority men-owned (N=4,894)
1 SBCS responses throughout this report are weighted using Census data to represent the US small business population on the following dimensions: firm age, number of employees, industry, geography, and gender of owner.
2 Percentages may not sum to 100 due to rounding.3 Urban and rural definitions come from Centers for Medicare & Medicaid Services. See Appendix for more detail.

42016 SMALL BUSINESS CREDIT SURVEY | REPORT ON WOMEN-OWNED FIRMS Source: Small Business Credit Survey, Federal Reserve Banks
FIRM CHARACTERISTICS (CONTINUED)
1 SBCS responses throughout this report are weighted using Census data to represent the US small business population on the following dimensions: firm age, number of employees, industry, geography, and gender of owner.
2 Firm industry is classified based on the description of what the business does, as provided by the survey participant. See Appendix for definitions of each industry.3 Percentages may not sum to 100 due to rounding.
Two out of five women-owned firms are in the healthcare and education, or professional services and real estate industries.
INDUSTRY1,2,3 (% of employer firms)
Healthcare and education
Professional services and real estate
Business support and consumer services
Retail
Leisure and hospitality
Non-manufacturing goods production & associated services
Finance and insurance
Manufacturing
21%13%
10%
19%
21%
15%
13%
8%
21%
8%
4%
16%
14%
12%
12%
4%
3%
10%
16%
18%
20%
15%
4%
3%
Majority women-owned (N=2,880) Equally owned (N=1,260) Majority men-owned (N=4,894)

52016 SMALL BUSINESS CREDIT SURVEY | REPORT ON WOMEN-OWNED FIRMS Source: Small Business Credit Survey, Federal Reserve Banks
FIRM CHARACTERISTICS (CONTINUED)
1 A firm is classified as minority-owned if more than half of the business is owned and controlled by minority group members.2 Growing firms are defined as those that increased revenues and employees in the prior 12 months and plan to increase or maintain their number of employees.
RACE/ETHNICITY OF OWNER1 (% of employer firms) BUSINESS STAGE2 OF FIRM (% of employer firms)
Majority women-owned (N=2,521)
Equally owned (N=1,071)
Majority men-owned (N=3,912)
Majority women-owned (N=2,793)
Equally owned (N=1,224)
Majority men-owned (N=4,781)
Non-minority Not growingMinority Growing
77%
23%
87%
13%
81%
19%
69%
31%
71%
29%
73%
27%
AGE OF FIRM’S PRIMARY FINANCIAL DECISION MAKER (% of employer firms)
Majority women-owned (N=2,874) Equally owned (N=1,255) Majority men-owned (N=4,885)
36-45 46-55 56-65 Over 65
10%7% 8%
20%
34%
27%
9%
18%
29% 30%
16%
20%
30% 30%
12%
Under 36
62016 SMALL BUSINESS CREDIT SURVEY | REPORT ON WOMEN-OWNED FIRMS Source: Small Business Credit Survey, Federal Reserve Banks
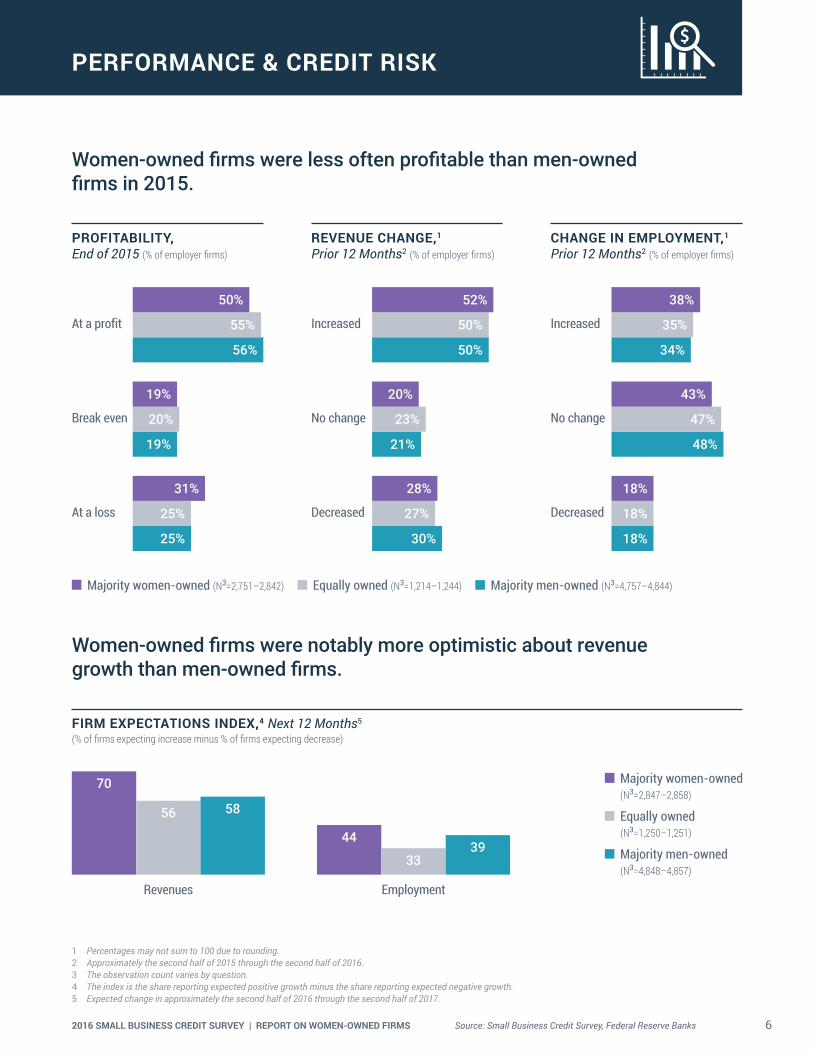
PERFORMANCE & CREDIT RISK
Women-owned firms were less often profitable than men-owned firms in 2015.
PROFITABILITY, End of 2015 (% of employer firms)
REVENUE CHANGE,1 Prior 12 Months2 (% of employer firms)
CHANGE IN EMPLOYMENT,1 Prior 12 Months2 (% of employer firms)
Women-owned firms were notably more optimistic about revenue growth than men-owned firms.
FIRM EXPECTATIONS INDEX,4 Next 12 Months5 (% of firms expecting increase minus % of firms expecting decrease)
Revenues
3339
56 58
70
44
Employment
Majority women-owned (N3=2,751–2,842) Equally owned (N3=1,214–1,244) Majority men-owned (N3=4,757–4,844)
At a profit
Break even
At a loss
50%
56%
55%
19%
19%
20%
31%
25%
25%
Increased
No change
Decreased
52%
50%
50%
28%
30%
27%
Increased
No change
Decreased
38%
35%
34%
43%
47%
48%
18%
18%
18%
1 Percentages may not sum to 100 due to rounding.2 Approximately the second half of 2015 through the second half of 2016.3 The observation count varies by question.4 The index is the share reporting expected positive growth minus the share reporting expected negative growth.5 Expected change in approximately the second half of 2016 through the second half of 2017.
Majority women-owned (N3=2,847–2,858)
Equally owned (N3=1,250–1,251)
Majority men-owned (N3=4,848–4,857)
20%
21%
23%

72016 SMALL BUSINESS CREDIT SURVEY | REPORT ON WOMEN-OWNED FIRMS Source: Small Business Credit Survey, Federal Reserve Banks
PERFORMANCE & CREDIT RISK (CONTINUED)
1 Self-reported business credit score or personal credit score, depending on which is used to obtain financing for their business. If the firm uses both, the highest risk rating is used. ‘Low credit risk’ is a 80-100 business credit score or 720+ personal credit score. ‘Medium/high credit risk’ is a 1–79 business credit score or a <720 personal credit score.
2 The observation count varies by age of firm.
However, gender differences by credit risk are driven by women-owned startups; among firms older than five years, credit risk is indistinguishable by the owner’s gender.
Women-owned firms were more likely to report being medium or high credit risk than men-owned firms.
CREDIT RISK1 OF FIRM (% of employer firms)
31% 33%
69% 67%
59%
41%
Low credit risk Medium/high credit risk
LOW CREDIT RISK1 BY AGE OF FIRM (% of employer firms)
Majority women-owned (N=2,060)
Equally owned (N=893)
Majority men-owned (N=3,253)
≤5 years in business
>5 years in business
Majority women-owned (N2=534–1,526)
Equally owned (N2=201–692)
Majority men-owned (N2=682–2,571)
47%63%
60%
67%
71%73%

82016 SMALL BUSINESS CREDIT SURVEY | REPORT ON WOMEN-OWNED FIRMS Source: Small Business Credit Survey, Federal Reserve Banks
FINANCIAL CHALLENGES
SHARE OF FIRMS WITH FINANCIAL CHALLENGES,1 Prior 12 Months2 (% of employer firms)
Majority women-owned
(N=2,844)
Equally owned (N=1,236)
Majority men-owned
(N=4,815)
64% of women-owned firms faced financial challenges in the prior 12 months.2
58% 58%
64%
Women-owned firms experienced similar financial challenges to men-owned firms and most frequently used personal funds to fill gaps.
FINANCIAL CHALLENGES,3 Prior 12 Months2 (% of employer firms)
Credit availability or funds for expansion
Debt paymentsOperating expenses Purchasing inventory to fulfill contracts
None of the above
39%43%
47%
34% 35%38%
24% 24%27%
15% 16%19%
42% 42%36%
Majority women-owned (N=2,844) Equally owned (N=1,236) Majority men-owned (N=4,815)
1 Financial challenges are listed in the “Financial Challenges” chart.2 Approximately the second half of 2015 through the second half of 2016.3 Respondents could select multiple options.4 Response options ‘negotiated terms with lender,’ ‘did not pay-debt went to collections,’ ‘unsure,’ and ‘other’ not shown in chart. See Appendix for more detail.5 Actions taken shown for women-owned firms. For equally owned and men-owned firms, see Appendix.
ACTIONS TAKEN AS A RESULT OF FINANCIAL CHALLENGES,3,4,5 Prior 12 Months2 N=1,243(% of women-owned firms reporting financial challenges)
Used personal funds
Cut staff, hours, and/or downsized operations
Made a late payment
Took out additional debt
78%
44% 44% 41%
92016 SMALL BUSINESS CREDIT SURVEY | REPORT ON WOMEN-OWNED FIRMS Source: Small Business Credit Survey, Federal Reserve Banks
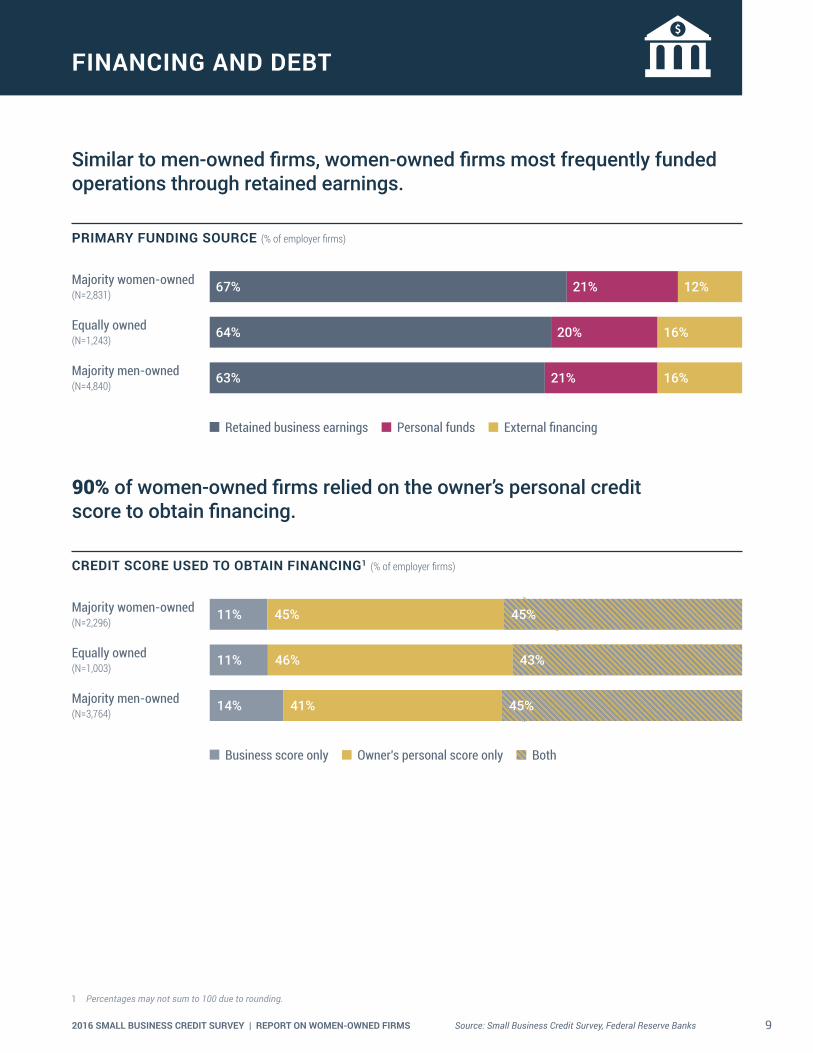
Similar to men-owned firms, women-owned firms most frequently funded operations through retained earnings.
PRIMARY FUNDING SOURCE (% of employer firms)
FINANCING AND DEBT
1 Percentages may not sum to 100 due to rounding.
Retained business earnings Personal funds External financing
67% 21% 12%
64% 20% 16%
63% 21% 16%
Majority women-owned (N=2,831)
Equally owned (N=1,243)
Majority men-owned (N=4,840)
90% of women-owned firms relied on the owner’s personal credit score to obtain financing.
CREDIT SCORE USED TO OBTAIN FINANCING1 (% of employer firms)
Business score only Owner's personal score only Both
11% 45% 45%
11% 46% 43%
14% 41% 45%
Majority women-owned (N=2,296)
Equally owned (N=1,003)
Majority men-owned (N=3,764)
102016 SMALL BUSINESS CREDIT SURVEY | REPORT ON WOMEN-OWNED FIRMS Source: Small Business Credit Survey, Federal Reserve Banks
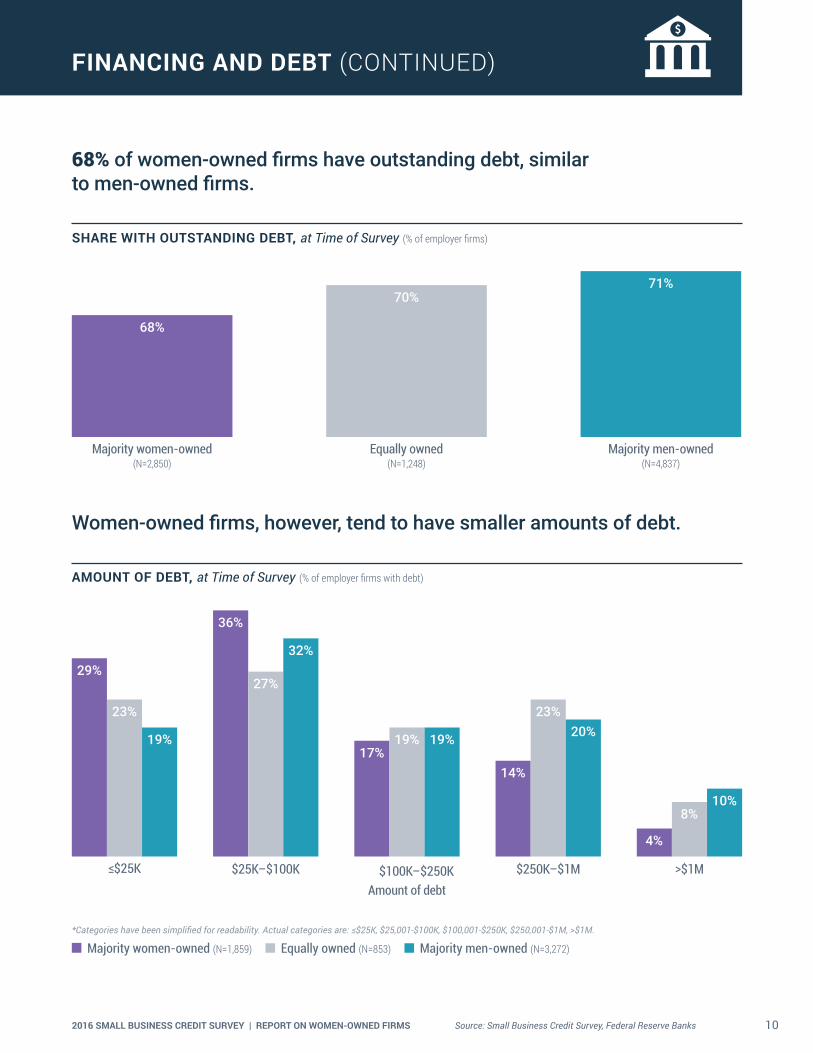
68% of women-owned firms have outstanding debt, similar to men-owned firms.
SHARE WITH OUTSTANDING DEBT, at Time of Survey (% of employer firms)
FINANCING AND DEBT (CONTINUED)
68%
Majority women-owned (N=2,850)
70%
Equally owned (N=1,248)
71%
Majority men-owned (N=4,837)
Women-owned firms, however, tend to have smaller amounts of debt.
AMOUNT OF DEBT, at Time of Survey (% of employer firms with debt)
≤$25K $25K–$100K $100K–$250KAmount of debt
$250K–$1M >$1M
29%
23%
19%
36%
17%14%
4%
27%
19%
23%
8%
32%
19% 20%
10%
Majority women-owned (N=1,859) Equally owned (N=853) Majority men-owned (N=3,272)
*Categories have been simplified for readability. Actual categories are: ≤$25K, $25,001-$100K, $100,001-$250K, $250,001-$1M, >$1M.

112016 SMALL BUSINESS CREDIT SURVEY | REPORT ON WOMEN-OWNED FIRMS Source: Small Business Credit Survey, Federal Reserve Banks
FINANCING AND DEBT (CONTINUED)
Women-owned firms tend to have smaller amounts of debt, even when controlling for revenue size of firm.
AMOUNT OF DEBT BY REVENUE SIZE OF FIRM,1 at Time of Survey (% of employer firms with debt)
≤$1M ANNUAL REVENUES
≤$25K $25K–$100K $100K–$250K $250K–$1M >$1M
36%
28%26%
40%
14%9%
1%
32%
19%17%
4%
40%
18%14%
3%
1 Percentages may not sum to 100 due to rounding.
Amount of debt
>$1M ANNUAL REVENUES
≤$25K $25K–$100K $100K–$250K $250K–$1M >$1M
9%5% 7%
23% 23%
33%
12%15% 17%
41%
21%18%
21%
32%
22%
Amount of debt
Majority women-owned (N=759) Equally owned (N=371) Majority men-owned (N=1,877)
*Categories have been simplified for readability. Actual categories are: ≤$25K, $25,001-$100K, $100,001-$250K, $250,001-$1M, >$1M.
Majority women-owned (N=1,049) Equally owned (N=456) Majority men-owned (N=1,328)
*Categories have been simplified for readability. Actual categories are: ≤$25K, $25,001-$100K, $100,001-$250K, $250,001-$1M, >$1M.

122016 SMALL BUSINESS CREDIT SURVEY | REPORT ON WOMEN-OWNED FIRMS Source: Small Business Credit Survey, Federal Reserve Banks
FINANCING AND DEBT (CONTINUED)
Women-owned firms with debt are less likely to have collateralized debt compared to men-owned firms.
COLLATERAL USED TO SECURE DEBT1 (% of employer firms with debt)
1 Respondents could select multiple options. Response options ‘unsure’ and ‘other’ not shown in chart. See Appendix for more detail.
Personal guarantee
Business assets
Personal assets
Portions of future sales
None
53%55%
62%
40%
51%
36%
9%
10%
35%
8%
17%
57%
41%
9%
10%
Majority women-owned (N=1,972) Equally owned (N=912) Majority men-owned (N=3,513)
17% of women-owned firms hold unsecured debt.

132016 SMALL BUSINESS CREDIT SURVEY | REPORT ON WOMEN-OWNED FIRMS Source: Small Business Credit Survey, Federal Reserve Banks
FINANCING AND DEBT (CONTINUED)
Regardless of revenue size, women-owned firms were less likely to use business assets as collateral than similar-sized men-owned firms.
COLLATERAL USED TO SECURE DEBT BY REVENUE SIZE OF FIRM1 (% of employer firms with debt)
1 Respondents could select multiple options. Response options ‘unsure’ and ‘other’ not shown in chart. See Appendix for more detail.
≤$1M ANNUAL REVENUES
Majority women-owned (N=1,101) Equally owned (N=477) Majority men-owned (N=1,410)
Personal guarantee Business assets Personal assets Portions of future sales None
51% 50%
60%
35% 35%
8% 19%
51%
41%
9%12%
44%37%
8%11%
>$1M ANNUAL REVENUES
Personal guarantee Business assets Personal assets Portions of future sales None
Majority women-owned (N=813) Equally owned (N=396) Majority men-owned (N=2,017)
66%74%
67%
56%
39%
10% 10%
76%
45%
8%4%
66%
34%
9% 7%

142016 SMALL BUSINESS CREDIT SURVEY | REPORT ON WOMEN-OWNED FIRMS Source: Small Business Credit Survey, Federal Reserve Banks
NONAPPLICANTS
1 Approximately the second half of 2015 through the second half of 2016.2 Response option ‘other’ not shown. See Appendix for detail.3 Discouraged firms are those that did not apply for financing because they believed they would be turned down.4 Discouraged firms were asked why they believed they would be turned down.5 Respondents could select multiple options. Response options ‘other’ and ‘unsure’ not shown. See Appendix for detail.
PRIMARY REASON FOR NOT APPLYING2 (% of nonapplicants)
Fewer women-owned firms reported sufficient financing as the reason for not applying, and a higher share were discouraged than men-owned firms.
Sufficient financing Debt averse Discouraged3 Credit cost high/ search too difficult
43% 27% 22% 7%
46% 31% 15% 7%
50% 25% 15% 8%
Majority women-owned (N=1,568)
Equally owned (N=671)
Majority men-owned (N=2,496)
DISCOURAGED3 FIRMS’ CREDIT CHALLENGES4,5 (% of discouraged nonapplicants)
Majority women-owned (N=260) Equally owned (N=74) Majority men-owned (N=294)
48%
32% 32%
42%36%
27%
5%
35%25%
39%
1%
51%
37%
24%
5%
Low credit score
Weak business performance
Insufficient credit history
Insufficient collateral
Unfair lending practices
SHARE OF FIRMS THAT DID NOT APPLY FOR FINANCING, Prior 12 Months1 (% of employer firms)
57%
Majority women-owned (N=2,880)
60%
Equally owned (N=1,260)
54%
Majority men-owned (N=4,894)
152016 SMALL BUSINESS CREDIT SURVEY | REPORT ON WOMEN-OWNED FIRMS Source: Small Business Credit Survey, Federal Reserve Banks
NONAPPLICANTS (CONTINUED)
1 Respondents could select multiple options. Response options ‘other’ and ‘unsure’ not shown in chart. See Appendix for more detail.
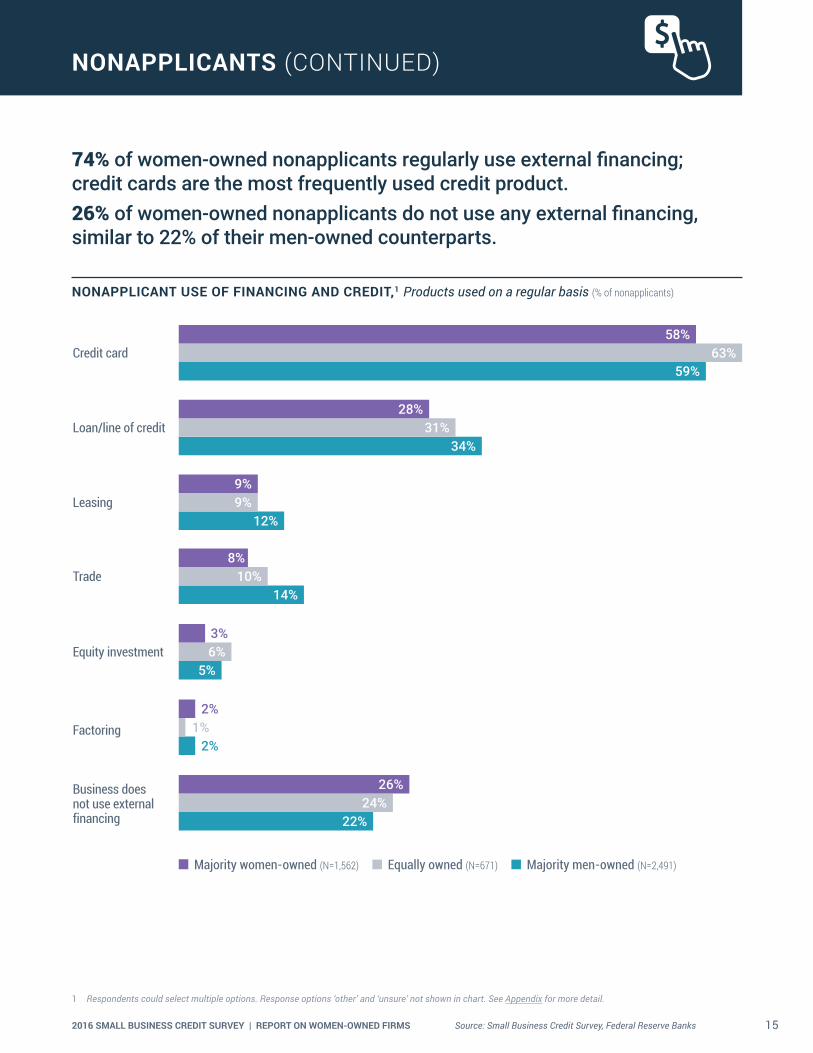
74% of women-owned nonapplicants regularly use external financing; credit cards are the most frequently used credit product.26% of women-owned nonapplicants do not use any external financing, similar to 22% of their men-owned counterparts.
NONAPPLICANT USE OF FINANCING AND CREDIT,1 Products used on a regular basis (% of nonapplicants)
Credit card
Loan/line of credit
Leasing
Trade
Equity investment
Factoring
Business does not use external financing
58%63%
59%
28%
34%
12%
14%
5%
2%
22%
9%
8%
3%
2%
26%
31%
9%
10%
6%
1%
24%
Majority women-owned (N=1,562) Equally owned (N=671) Majority men-owned (N=2,491)
162016 SMALL BUSINESS CREDIT SURVEY | REPORT ON WOMEN-OWNED FIRMS Source: Small Business Credit Survey, Federal Reserve Banks
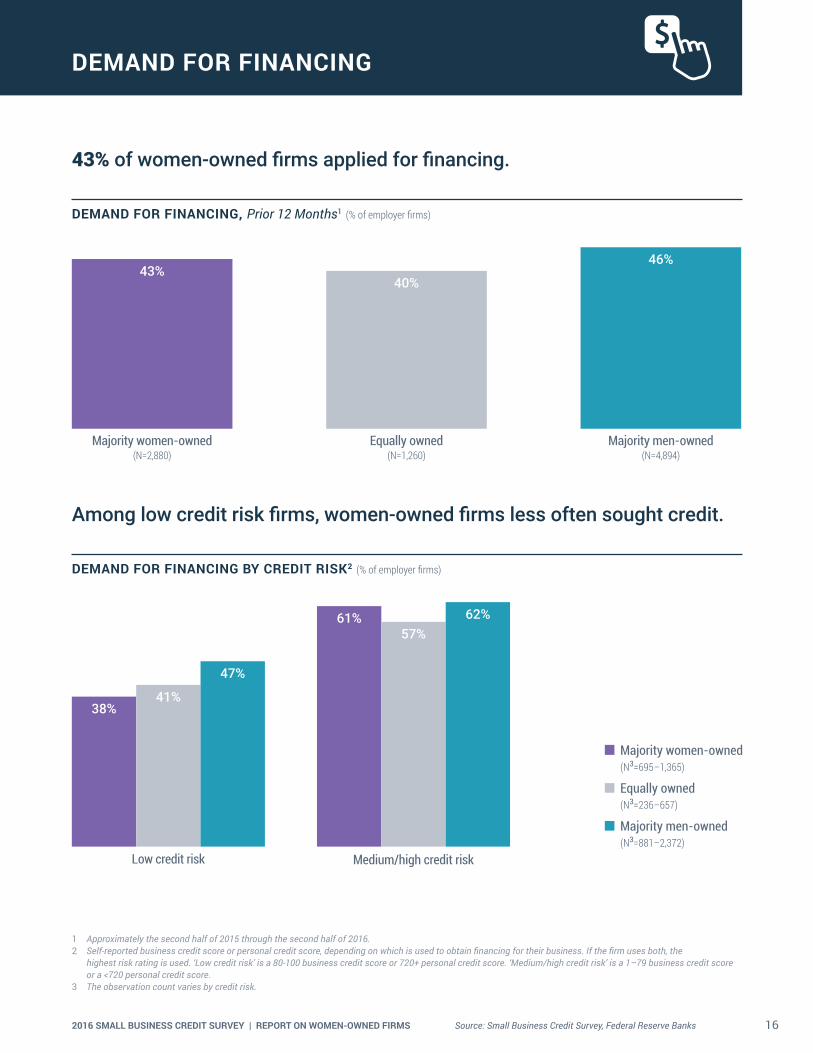
DEMAND FOR FINANCING
DEMAND FOR FINANCING, Prior 12 Months1 (% of employer firms)
43%
Majority women-owned (N=2,880)
40%
Equally owned (N=1,260)
Majority men-owned (N=4,894)
DEMAND FOR FINANCING BY CREDIT RISK2 (% of employer firms)
Low credit risk
57%62%
41%
47%
38%
61%
Medium/high credit risk
Majority women-owned (N3=695–1,365)
Equally owned (N3=236–657)
Majority men-owned (N3=881–2,372)
1 Approximately the second half of 2015 through the second half of 2016.2 Self-reported business credit score or personal credit score, depending on which is used to obtain financing for their business. If the firm uses both, the
highest risk rating is used. ‘Low credit risk’ is a 80-100 business credit score or 720+ personal credit score. ‘Medium/high credit risk’ is a 1–79 business credit score or a <720 personal credit score.
3 The observation count varies by credit risk.
43% of women-owned firms applied for financing.
Among low credit risk firms, women-owned firms less often sought credit.
46%

172016 SMALL BUSINESS CREDIT SURVEY | REPORT ON WOMEN-OWNED FIRMS Source: Small Business Credit Survey, Federal Reserve Banks
DEMAND FOR FINANCING (CONTINUED)
1 Respondents could select multiple options.
Both women- and men-owned firms were most commonly seeking financing for business expansion.
REASONS FOR APPLYING1 (% of employer firms)
Expand business/new opportunity Operating expenses Refinance Other reason
64% 48% 20% 9%
60% 47% 27% 6%
65% 42% 24% 8%
Majority women-owned (N=1,271)
Equally owned (N=566)
Majority men-owned (N=2,314)
67% of women-owned applicants sought $100K or less, compared to 49% of men-owned firms.
TOTAL AMOUNT OF FINANCING SOUGHT (% of applicants)
≤$25K $25K–$100K $100K–$250K $250K–$1M >$1M
28%
21%
15%
39%
16%13%
4%
35%
17% 18%
9%
34%
21% 20%
10%
Majority women-owned (N=1,249) Equally owned (N=557) Majority men-owned (N=2,273)
*Categories have been simplified for readability. Actual categories are: ≤$25K, $25,001-$100K, $100,001-$250K, $250,001-$1M, >$1M.
Amount of financing sought

182016 SMALL BUSINESS CREDIT SURVEY | REPORT ON WOMEN-OWNED FIRMS Source: Small Business Credit Survey, Federal Reserve Banks
Women-owned applicants tended to seek smaller amounts of financing even when their revenue size was comparable.
TOTAL AMOUNT OF FINANCING SOUGHT BY REVENUE SIZE OF FIRM1 (% of applicants)
DEMAND FOR FINANCING (CONTINUED)
1 Percentages may not sum to 100 due to rounding.
≤$1M ANNUAL REVENUES
≤$25K $25K–$100K $250K–$1M >$1M
36%
26%22%
44%
12%7% 1%
37%
16% 15%
6%
43%
18%14%
2%
Majority women-owned (N=671) Equally owned (N=279) Majority men-owned (N=849)
*Categories have been simplified for readability. Actual categories are: ≤$25K, $25,001-$100K, $100,001-$250K, $250,001-$1M, >$1M.
>$1M ANNUAL REVENUES
≤$25K $25K–$100K $100K–$250K $250K–$1M >$1M
3%7%
4%
26% 27%32%
12%
28%
18%
31%
16%21%
25%30%
21%
Majority women-owned (N=541) Equally owned (N=259) Majority men-owned (N=1,381)
*Categories have been simplified for readability. Actual categories are: ≤$25K, $25,001-$100K, $100,001-$250K, $250,001-$1M, >$1M.
Amount of financing sought
$100K–$250KAmount of financing sought

192016 SMALL BUSINESS CREDIT SURVEY | REPORT ON WOMEN-OWNED FIRMS Source: Small Business Credit Survey, Federal Reserve Banks
CREDIT APPLICATIONS
Similar to men-owned firms, women-owned firms most frequently applied for loans/lines of credit.
FINANCING AND CREDIT PRODUCTS SOUGHT1 (% of applicant firms)
Loan/line of credit
Credit card
Trade
Equity investment
Leasing
Factoring
85%85%85%
34%
28%
10%
11%
10%
7%
8%
7%
7%
6%
29%
9%
12%
11%
5%
Majority women-owned (N=1,275) Equally owned (N=567) Majority men-owned (N=2,324)
1 Respondents could select multiple options. Response option ‘other’ not shown in chart. See Appendix for more detail.
202016 SMALL BUSINESS CREDIT SURVEY | REPORT ON WOMEN-OWNED FIRMS Source: Small Business Credit Survey, Federal Reserve Banks
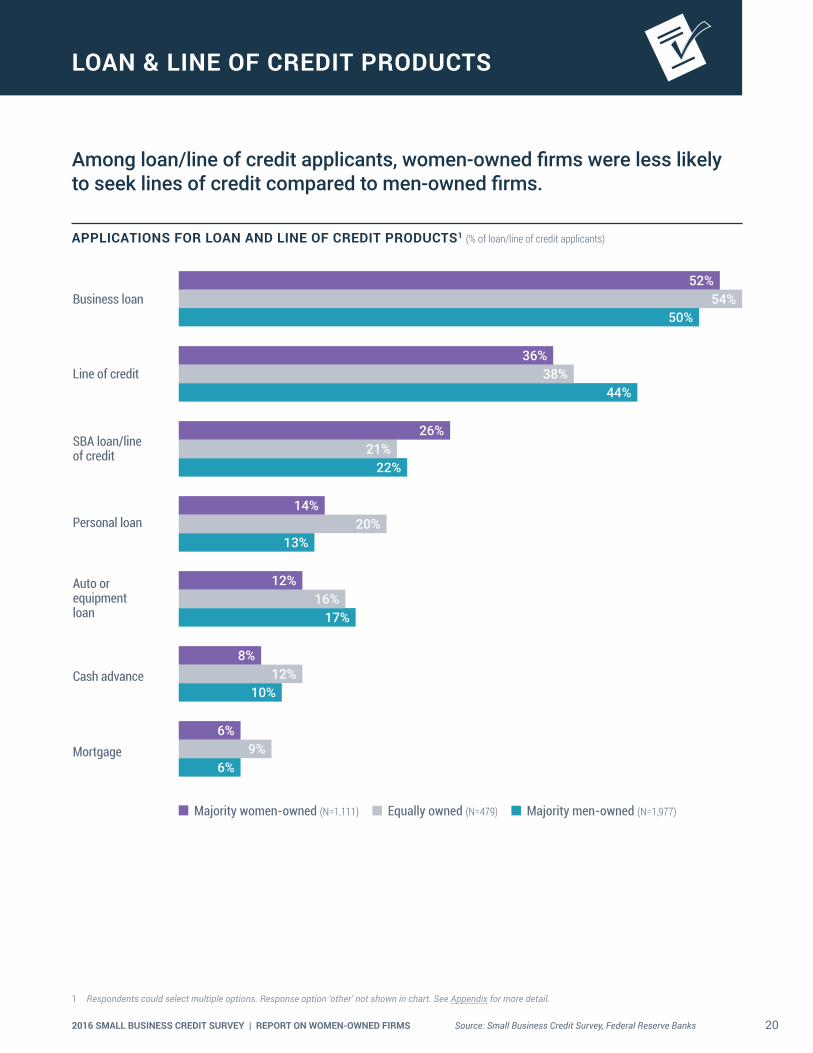
LOAN & LINE OF CREDIT PRODUCTS
Among loan/line of credit applicants, women-owned firms were less likely to seek lines of credit compared to men-owned firms.
APPLICATIONS FOR LOAN AND LINE OF CREDIT PRODUCTS1 (% of loan/line of credit applicants)
Business loan
Line of credit
SBA loan/line of credit
Personal loan
Auto or equipment loan
Cash advance
Mortgage
52%54%
50%
36%
44%
22%
13%
17%
10%
6%
26%
14%
12%
8%
6%
38%
21%
20%
16%
12%
9%
Majority women-owned (N=1,111) Equally owned (N=479) Majority men-owned (N=1,977)
1 Respondents could select multiple options. Response option ‘other’ not shown in chart. See Appendix for more detail.

212016 SMALL BUSINESS CREDIT SURVEY | REPORT ON WOMEN-OWNED FIRMS Source: Small Business Credit Survey, Federal Reserve Banks
CREDIT SOURCES
Women-owned firms considered both chance of success and relationship with lender when applying for credit.
TOP TWO FACTORS1 INFLUENCING WHERE FIRMS APPLY (% of applicants)
Women-owned(N=1,269)
Equally owned(N=563)
Men-owned(N=2,317)
1 57% 66% 59%
2 55% 54% 50%
Perceived chance of being fundedExisting relationship with lender
1 Respondents could select multiple options. Response options ‘price,’ ‘ease of application process,’ ‘speed of decision,’ ‘flexibility of product offerings,’ ‘referral,’ and ‘other’ not shown in table. See Appendix for more detail.
2 Respondents could select multiple options. Response option ‘other’ not shown in chart. See Appendix for more detail.3 Respondents were provided a list of large banks (those with at least $10B in total deposits) operating in their state.4 ‘Online lenders’ are defined as nonbank alternative and marketplace lenders, including Lending Club, OnDeck, CAN Capital, and PayPal Working Capital.5 Community development financial institutions (CDFIs) are financial institutions that provide credit and financial services to underserved markets and populations.
CDFIs are certified by the CDFI Fund at the U.S. Department of the Treasury
Women-owned firms less often applied at small banks compared to equally owned and men-owned firms.
CREDIT SOURCES APPLIED TO2 (% of loan/line of credit applicants)
Large bank3 Small bank Online lender4 Credit union CDFI5
Majority women-owned (N=1,111) Equally owned (N=479) Majority men-owned (N=1,977)
49%
42%
52%
40%
23%
11% 10%
50%
19%
11%7%
48%
20%
10% 3%
222016 SMALL BUSINESS CREDIT SURVEY | REPORT ON WOMEN-OWNED FIRMS Source: Small Business Credit Survey, Federal Reserve Banks
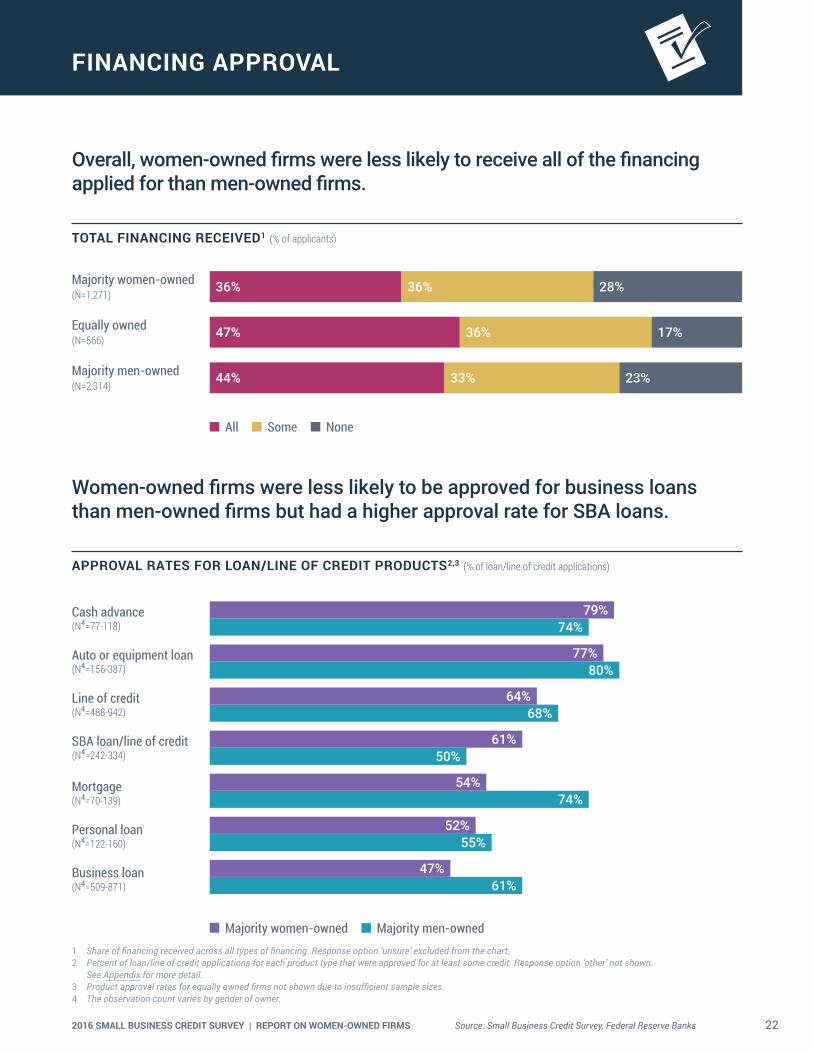
FINANCING APPROVAL
Women-owned firms were less likely to be approved for business loans than men-owned firms but had a higher approval rate for SBA loans.
APPROVAL RATES FOR LOAN/LINE OF CREDIT PRODUCTS2,3 (% of loan/line of credit applications)
Overall, women-owned firms were less likely to receive all of the financing applied for than men-owned firms.
TOTAL FINANCING RECEIVED1 (% of applicants)
1 Share of financing received across all types of financing. Response option ‘unsure’ excluded from the chart.2 Percent of loan/line of credit applications for each product type that were approved for at least some credit. Response option ‘other’ not shown.
See Appendix for more detail.3 Product approval rates for equally owned firms not shown due to insufficient sample sizes.4 The observation count varies by gender of owner.
All Some None
28%36%36%
17%36%47%
23%33%44%
79%74%
77%
64%
61%50%
54%
52%
47%61%
55%
74%
68%
80%
Majority women-owned (N=1,271)
Cash advance(N4=77-118)
Auto or equipment loan(N4=156-387)
Line of credit(N4=488-942)
SBA loan/line of credit(N4=242-334)
Mortgage(N4=70-139)
Personal loan(N4=122-160)
Business loan(N4=509-871)
Equally owned (N=566)
Majority men-owned (N=2,314)
Majority women-owned Majority men-owned

232016 SMALL BUSINESS CREDIT SURVEY | REPORT ON WOMEN-OWNED FIRMS Source: Small Business Credit Survey, Federal Reserve Banks
FINANCING APPROVAL (CONTINUED)
Women-owned firms at all credit risk levels were more often approved for SBA loans compared to men-owned firms. Low credit risk women applicants were less successful in securing business loans than men-owned firms with similar credit risk.
APPROVAL RATES FOR LOAN/LINE OF CREDIT PRODUCTS BY CREDIT RISK1,2,3 (% of loan/line of credit applications)
1 Percent of loan/line of credit applications for each product type that were approved for at least some credit. Response options ‘cash advance,’ ‘mortgage,’ ‘personal loan,’ and ‘other’ not shown due to insufficient sample sizes.
2 Product approval rates for equally owned firms not shown due to insufficient sample sizes.3 Self-reported business credit score or personal credit score, depending on which is used to obtain financing for their business. If the firm uses both, the highest risk
rating is used. ‘Low credit risk’ is a 80-100 business credit score or 720+ personal credit score. ‘Medium/high credit risk’ is a 1–79 business credit score or a <720 personal credit score.
4 The observation count varies by gender of owner.
LOW CREDIT RISK
Majority women-owned Majority men-owned
SBA loan/line of credit (N4=111-169)
Business loan (N4=208-421)
Line of credit (N4=262-503)
Auto or equipment loan (N4=83-200)
MEDIUM/HIGH CREDIT RISK
SBA loan/line of credit (N4=98-115)
Business loan (N4=219-270)
Line of credit (N4=126-224)
Auto or equipment loan (N4=52-100)
Majority women-owned Majority men-owned
76%
44%
68%
33%
80%
40%
100%
56%
63%
28%
78%
35%
83%
38%
95%
55%

242016 SMALL BUSINESS CREDIT SURVEY | REPORT ON WOMEN-OWNED FIRMS Source: Small Business Credit Survey, Federal Reserve Banks
FINANCING APPROVAL (CONTINUED)
Both women- and men-owned firms were most successful at small banks.
1 Percent of loan/line of credit applications at each source that were approved for at least some credit. Response options ‘CDFI’ and ‘other’ not shown due to insufficient sample sizes.
2 Source approval rates for equally owned firms not shown due to insufficient sample sizes.3 Respondents were provided a list of large banks (those with at least $10B in total deposits) operating in their state.4 ‘Online lenders’ are defined as nonbank alternative and marketplace lenders, including Lending Club, OnDeck, CAN Capital, and Paypal Working Capital.5 The observation count varies by gender of owner.
APPROVAL RATE BY SOURCE OF LOAN/LINE OF CREDIT1,2 (% of loan/line of credit applications)
Majority women-owned Majority men-owned
Large bank3
(N5=541-986) Small bank(N5=500-955)
Online lender4
(N5=193-287)Credit union
(N5=91-122)
50%
67%
56%
41%
56%
65% 65%
44%

252016 SMALL BUSINESS CREDIT SURVEY | REPORT ON WOMEN-OWNED FIRMS Source: Small Business Credit Survey, Federal Reserve Banks
FINANCING SHORTFALLS
28% of women-owned applicants were not approved for any financing.64% had a financing shortfall, meaning they obtained less than the amount sought.
SHARE WITH A FINANCING SHORTFALL (% of applicants)
1 Respondents could select multiple options. Response options ‘unfair lending practices,’ ‘unsure,’ and ‘other’ not shown in chart. See Appendix for more detail.
64%
Majority women-owned (N=1,258)
53%
Equally owned (N=562)
56%
Majority men-owned (N=2,292)
Women-owned firms cited low credit scores more often than men-owned firms as their chief credit obstacle.
REASONS FOR CREDIT DENIAL1 (% of applicants with a financing shortfall)
Equally owned (N=208)
Majority men-owned
(N=894)
Majority women-owned
(N=578)
Insufficient collateral
Insufficient credit history
Too much debt already
Weak business performance
Low credit score
30%
29%
30%
29%
34%
30%
34%
33%
29%
31%
31%
26%
31%
27%
27%
262016 SMALL BUSINESS CREDIT SURVEY | REPORT ON WOMEN-OWNED FIRMS Source: Small Business Credit Survey, Federal Reserve Banks
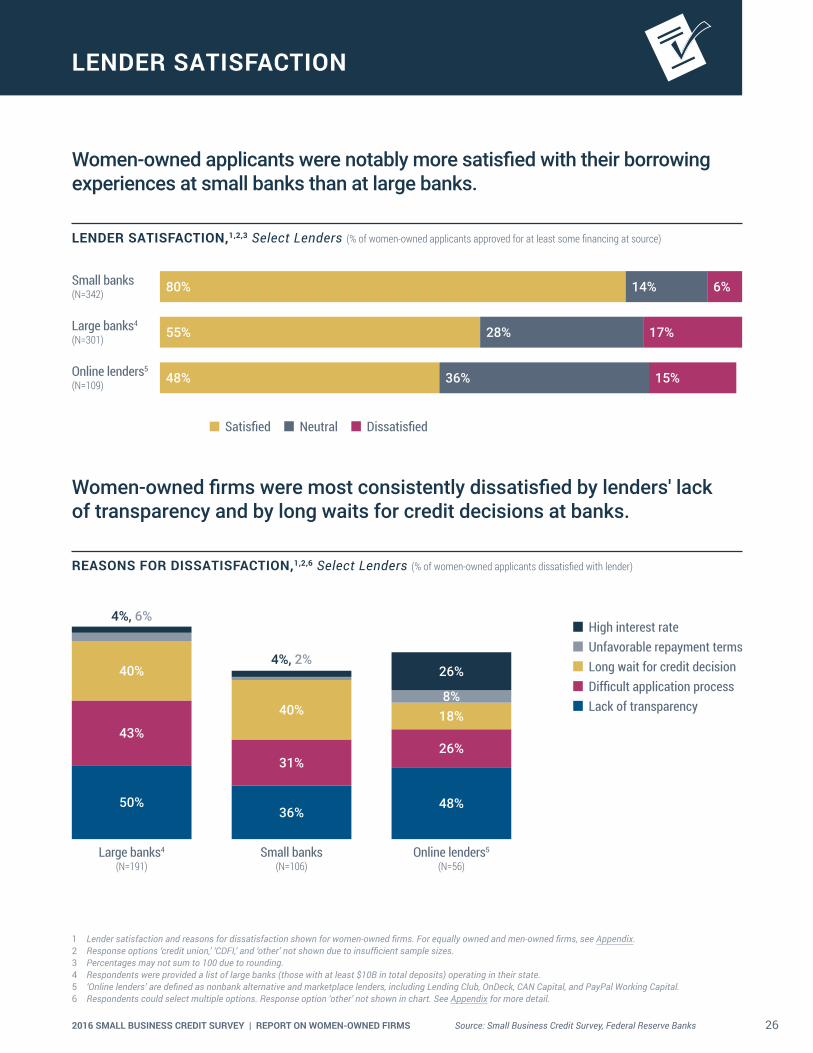
LENDER SATISFACTION
Women-owned applicants were notably more satisfied with their borrowing experiences at small banks than at large banks.
LENDER SATISFACTION,1,2,3 Select Lenders (% of women-owned applicants approved for at least some financing at source)
Women-owned firms were most consistently dissatisfied by lenders' lack of transparency and by long waits for credit decisions at banks.
REASONS FOR DISSATISFACTION,1,2,6 Select Lenders (% of women-owned applicants dissatisfied with lender)
Small banks(N=106)
Online lenders5
(N=56)
High interest rate Unfavorable repayment terms Long wait for credit decision Difficult application process Lack of transparency
48%
26%
18%
26%
8%
36%
31%
40%
40%4%, 2%
4%, 6%
Large banks4
(N=191)
50%
43%
40%
1 Lender satisfaction and reasons for dissatisfaction shown for women-owned firms. For equally owned and men-owned firms, see Appendix.2 Response options ‘credit union,’ ‘CDFI,’ and ‘other’ not shown due to insufficient sample sizes.3 Percentages may not sum to 100 due to rounding.4 Respondents were provided a list of large banks (those with at least $10B in total deposits) operating in their state.5 ‘Online lenders’ are defined as nonbank alternative and marketplace lenders, including Lending Club, OnDeck, CAN Capital, and PayPal Working Capital.6 Respondents could select multiple options. Response option ‘other’ not shown in chart. See Appendix for more detail.
Satisfied Neutral Dissatisfied
80% 14% 6%
55% 28% 17%
48% 36% 15%
Small banks(N=342)
Large banks4
(N=301)
Online lenders5
(N=109)

272016 SMALL BUSINESS CREDIT SURVEY | REPORT ON WOMEN-OWNED FIRMS
METHODOLOGY
DATA COLLECTION The Small Business Credit Survey (SBCS) uses a convenience sample of establish-ments. Businesses are contacted by email through a diverse set of organizations that serve the small business community.1 Prior SBCS participants and small businesses on publicly available email lists2 are also contacted directly by one of the twelve Federal Reserve Banks.
The survey instrument is an online question-naire that typically takes 6 to 12 minutes to complete, depending upon the intensity of a firm’s search for financing. The question-naire uses question branching and flows based upon responses to survey questions. For example, financing applicants receive a different line of questioning than non- applicants. Therefore, the number of observations for each question varies according to how many firms receive and complete a particular question.
WEIGHTING A sample for the SBCS is not selected randomly; thus, the SBCS may be subject to biases not present with surveys that do select firms randomly. For example, there are likely small employer firms not on one of our con-tact lists and this may lead to a noncoverage bias. In this report, we control for potential biases by weighting the sample data so that the weighted distribution of firms in the SBCS matches the distribution of the small (1 to
499 employees) firm population in the United States by number of employees, age, industry, geographic location (census division and urban or rural location), and gender of owner. We collaborate with the National Opinion Research Center (NORC) in order to calculate these weights. The data used for weighting come from data collected by the U.S. Census Bureau.3 While weighting the data makes the sample considerably more representative of the small firm population, the SBCS is still potentially affected by nonresponse bias, something that should be taken into consider-ation when interpreting the results.
COMPARISONS TO PAST REPORTS Because previous SBCS reports have varied in terms of the population scope, geographic coverage, and weighting methodology, the survey reports are not directly comparable across time.
For example, both employer and nonem-ployer firm results from the 2014 survey are combined into one report (published in 2015) while employers and nonemployers are divided into separate reports for the 2015 and 2016 surveys (published in 2016 and 2017, respectively).
Moreover, geographic coverage and weighting strategies varied from year to year. In the employer/nonemployer combined report using 2014 survey data, geographic coverage includes only 10 states and data are weighted
by firm age, nonemployer/employer, number of employees (if employer firm), state, and industry. The employer report using 2015 survey data covers 26 states and is weighted by firm age, number of employees, and indus-try. The employer report using 2016 survey data includes respondents from all 50 states and the District of Columbia. The data are weighted by firm age, number of employees, industry, and geographic location (census division and urban or rural location).
In addition to being weighted by different firm characteristics over time, the categories used within each characteristic have also differed across survey years (there were three employ-ee size categories in 2015, and five employee size categories in 2016). Further, respondents are weighted according to the composition of firms in the geographic area of coverage.
In addition to population scope, geographic coverage, and weighting differences, some of the survey questions have also changed slightly from year to year, making some ques-tion comparisons impossible even when using a time-consistent weighting approach.
This report contains the subset of firms who answered the gender of owner survey question. Unfortunately, due to potential nonresponse bias, these results should not be compared to the report on employer firms, which contains all employer firms, regardless if they provided demographic owner information.
1 For a full list of community partners, please see p. 29.2 System for Award Management (SAM) Entity Management Extracts Public Data Package, Small Business Association (SBA) Dynamic Small Business
Search (DSBS), state-maintained lists of certified disadvantaged business enterprises (DBEs), state and local government Procurement Vendor Lists, state and local government-maintained lists of small or disadvantaged small businesses, a list of veteran-owned small businesses maintained by the Department of Veterans Affairs.
3 Age of firm data come from the 2014 Business Dynamics Statistics. Industry, employee size, and geographic location data are from the 2014 County Business Patterns. We use data from the Center for Medicare and Medicaid Services to classify a business’s zip code as urban or rural. Gender of owner and race/ethnicity of owner data come from the 2012 Survey of Business Owners.

282016 SMALL BUSINESS CREDIT SURVEY | REPORT ON WOMEN-OWNED FIRMS
CREDIBILITY INTERVALSThe analysis in this report is aided by the use of credibility intervals. Where there are large differences in estimates between types of businesses, we perform additional checks on the data to determine whether the difference appears significant. The results of these tests
help guide our analysis and help us decide what ultimately is included in the report. In order to determine whether a difference is sig-nificant, we develop credibility intervals using a balanced half-sample approach.4 Because the SBCS does not come from a probability-based sample, the credibility intervals we
develop should be interpreted as model-based measures of deviation from the true national population values.5 Ninety-five percent cred-ibility intervals for key statistics are listed in Table 1. More granular results with smaller observation counts will generally have larger credibility intervals.
4 Wolter (2007), “Introduction to Variance Estimation.”5 AAPOR (2013), “Task Force on Non-probability Sampling.”
METHODOLOGY (CONTINUED)
Table 1: Credibility Intervals for Key Statistics in the 2016 Report on Women-Owned Firms
Majority women-owned Majority men-owned
Percent Credibility Interval
Percent Credibility Interval
Percent that applied 42.7% +/-2.5% 46.3% +/-2.0%
Percent with outstanding debt 68.5% +/-2.1% 71.2% +/-1.6%
Profitability index1 18.5% +/-5.3% 30.9% +/-3.1%
Revenue growth index1 24.3% +/-4.7% 20.4% +/-3.0%
Employment growth index1 20.0% +/-4.2% 15.6% +/-2.6%
Loan/line of credit approval rate2 72.5% +/-3.2% 77.9% +/-2.7%
Seeking financing to cover operating expenses3 48.0% +/-4.8% 41.9% +/-2.7%
Seeking financing to expand/pursue new opportunity3 64.2% +/-3.4% 64.6% +/-3.4%
Percent of nonapplicants that are discouraged4 21.6% +/-3.7% 15.4% +/-2.0%
Table notes:1 For profitability, the index is the share profitable minus the share with losses during the 12 months prior to the survey. For revenue and employment growth,
it is the share reporting positive growth minus the share reporting negative growth.2 The share of loan and line of credit applicants that were approved for at least some financing.3 Percent of applicants4 Discouraged firms are those that did not apply for financing because they believed they would be turned down.

292016 SMALL BUSINESS CREDIT SURVEY | REPORT ON WOMEN-OWNED FIRMS
PARTNER ORGANIZATIONS
NATIONAL PARTNER ORGANIZATIONS � Accion U.S. Network
� Association for Enterprise Opportunity (AEO)
� National Association for Latino Community Asset Building
� National Association of Manufacturers
� National Association of Women Business Owners
� NFIB Research Foundation
� National League of Cities
� National Retail Federation
� Opportunity Finance Network (OFN)
� U.S. Chamber of Commerce
AFFILIATES OF NATIONAL PARTNER ORGANIZATIONS � Accion Chicago
� Accion New Mexico
� Alabama MicroEnterprise Network (AMEN)
� AltCap
� Anchor Financial Services
� Asian Pacific Islander Small Business Program
� Avenida Guadalupe Association
� BBIF Florida
� CAP Services Inc.
� CDC Small Business Finance
� CIELO
� City First Enterprises
� City of Austin Small Business Program
� City of Chicago
� City of Dallas—Office of Economic Development
� City of San Diego
� Colorado Enterprise Fund
� Common Capital
� Community Business Partnership
� Community Concepts Finance Corporation
� Community Investment Corporation
� Community Loan Fund of the Capital Region, Inc.
� Cooperative Fund of New England
� DC Department of Small & Local Business Development
� Economic and Community Development Institute
� Entrepreneur Works Fund
� FINANTA
� Fresno CDFI
� Golden State Certified Development Corporation
� Green America's Green Business Network
� Gulf Coast Renaissance Corporation
� HAP
� Hispanic Economic Development Corporation
� IICDC
� Jefferson Economic Development Institute
� Kansas City, Missouri Business Customer Service Center
� LAUNCH
� Lower 9th Ward Neighborhood Empowerment Network Association (NENA)
� MACED
� Main Street Launch
� Main Street Project
� Maryland Capital Enterprises, Inc.
� Microenterprise Resources, Initiatives and Training (MERIT)
� National Coalition of 100 Black Women Central Florida Chapter
� Natural Capital Investment Fund
� Neighborhood Lending Partners
� NeighborWorks of Western Vermont
� Northern Initiatives
� Northwest Pennsylvania Regional Planning and Development Commission
� Ohio Council of Retail Merchants
� Opportunities Credit Union
� Opportunity Fund
� Pacific Coast Regional Small Business Development Corporation
� Pacific Community Ventures
� Pacific Island Knowledge 2 Action Resources
� Partners for the Common Good
� Pathway Lending
� PIDC
� PPEP Microbusiness & Housing Development Corporation
� Rural Enterprise Assistance Project-REAP
� San Antonio for Growth on the Eastside, Inc. (SAGE)
� Santa Cruz Community Credit Union
� SBCP
� SF OEWD
� South Dakota Retailers Association
� Start Small Think Big
� Tampa Bay BBIC
� The Community Economic Development Fund Foundation, Inc.
� The Enterprise Center Capital Corporation

302016 SMALL BUSINESS CREDIT SURVEY | REPORT ON WOMEN-OWNED FIRMS
PARTNER ORGANIZATIONS (CONTINUED)
� The Wright Way Up Of Atlanta, Inc.
� Tierra del Sol Housing Corporation
� TILT Forward Network
� TruFund Financial Services, Inc.
� Uptima Business Bootcamp
� Women's Opportunities Resource Center
� WORC
� World Beyond Boundaries
FEDERAL RESERVE BANK OF ATLANTA � Alabama Chamber of Commerce
� Alabama Department of Commerce
� Alabama Department of Economic and Community Affairs
� Alabama Micro Enterprise Network (AMEN)
� Alabama SBDC Network
� Albany Business League
� American Sugar Cane League
� BancorpSouth
� Chatham Business Association
� Chattanooga Area Chamber of Commerce
� Cherokee County Chamber of Commerce
� Citizens National Bank
� Clarksville Area Chamber of Commerce
� Coastal Alabama Business Chamber
� Coastal Georgia Indicators Coalition
� Committee of 100
� Community Bank of Mississippi
� Community Enterprise Investments, Inc.
� Economic Development Commission of Florida's Space Coast
� Florida Bank of Commerce
� Florida Capital Bank
� Florida Chamber of Commerce
� Florida SBDC at FIU
� Florida SBDC at University of West Florida College of Business
� Florida SBDC Network
� Gainesville Area Chamber of Commerce
� Georgia Council for Arts
� Georgia Department of Community Affairs
� Georgia Florida Alliance
� Georgia Hispanic Chamber
� Georgia Micro Enterprise Network (GMEN)
� Georgia Minority Supplier Development Council
� Georgia SBDC
� Greater Fort Lauderdale Convention and Visitors Bureau
� Greater New Orleans, Inc.
� Gulf Coast Business Council
� Hispanic Chamber of Commerce of Louisiana
� Home Builders Association of Greater Knoxville
� Home Builders Association of Tennessee
� Hope Enterprise Corporation
� Huntsville Chamber of Commerce
� Jackson State SBDC
� Jackson State University
� Jeff Davis Parish Economic Development & Tourism Commission
� Kingsport Chamber
� Louisiana Chamber of Commerce
� Louisiana Economic Development
� Louisiana SBDC
� Meridian East Mississippi Business Development Corp.
� Metro Atlanta Chamber
� Middle Tennessee Association of Realtors
� Mississippi Manufacturing Association
� Mississippi Minority Business Alliance, Inc.
� Mississippi SBA
� Mobile Area Chamber of Commerce
� Montgomery Chamber of Commerce
� New Orleans Chamber of Commerce
� New Orleans Metropolitan Convention and Visitors Bureau
� New Orleans Regional Committee of Business Economists
� North Alabama Revolving Loan Fund
� Northeast Florida Association of Realtors
� NOW Corp
� Pathway Lending
� Regions Bank, Jackson, MS
� South Florida Manufacturers Association
� Southern Region Minority Supplier Development Council
� Southern University at New Orleans SBDC Management Institute
� SW Louisiana Economic Development Alliance
� Tech Square Labs
� Technology Association of Georgia
� Tennessee Chamber of Commerce
� The New Orleans Board of Trade

312016 SMALL BUSINESS CREDIT SURVEY | REPORT ON WOMEN-OWNED FIRMS
� United Bank, Atmore, AL
� United Way of Southeast Louisiana
� University of Georgia SBDC
� University of Georgia SBDC Network
� USDA
� Village Micro Fund
� Wells Fargo
� Women's Business Enterprise Council South
FEDERAL RESERVE BANK OF BOSTON � Cape Cod Chamber of Commerce
� City of Boston
� Commonwealth of Massachusetts, Operational Services Division
� Greater Boston Chamber of Commerce
� Greater Concord Chamber of Commerce
� Greater Manchester Chamber of Commerce
� Greater Nashua Chamber of Commerce
� Greater Providence Chamber of Commerce
� HarborOneU
� Interise
� Massachusetts Small Business Development Center
� Metro South Chamber of Commerce
� Middlesex County Chamber of Commerce
� New Bedford Area Chamber
� New Hampshire Business & Industry Association
� North Central Massachusetts Chamber of Commerce
� Plymouth Area Chamber of Commerce
� Retailers Association of Massachusetts
� Rhode Island Small Business Development Center
� Souhegan Valley Chamber of Commerce
� Worcester Regional Chamber of Commerce
FEDERAL RESERVE BANK OF CLEVELAND � CityWide Development Corp
� Commerce Lexington
� Dayton Area Chamber of Commerce
� Dayton HRC
� Gannon University SBDC
� Indiana County Chamber of Commerce
� Kentucky Small Business Development Center
� Manufacturer & Business Association
� Youngstown/Warren Regional Chamber
FEDERAL RESERVE BANK OF KANSAS CITY � Adams County Economic Development
� Albuquerque Hispano Chamber of Commerce
� Boulder SBDC
� Catholic Charities
� CML Collective, LLC
� Denver Metro Chamber of Commerce
� Fab Lab ICC at Independence Community College
� Greater Fremont Development Council
� Greater Kansas City Hispanic Chamber Commerce
� Greater Oklahoma City Chamber of Commerce
� Greater Omaha Chamber
� Kauffman Foundation
� KC SourceLink
� McPherson Chamber of Commerce
� Missouri Chamber of Commerce and Industry
� Mountain Plains MSDC
� Nebraska Enterprise Fund
� Nebraska Extension
� NetWork Kansas
� NM Economic Development Department
� North Kansas City Business Council
� Office of Minority and Women Business, Kansas Department of Commerce
� OK Dept. of Career & Technology Education
� Overland Park Chamber of Commerce
� REI Oklahoma
� Santa Fe Business Incubator
� Southeast Missouri State University-Institute for Regional Innovation and Entrepreneurship
� The Colorado Office of Economic Development and International Trade
� The Finance New Mexico project (Holly Co publishers)
� Wichita Hispanic Chamber of Commerce
� Wichita Metro Chamber of Commerce
� Women's Business Center
� Wyoming Business Council
PARTNER ORGANIZATIONS (CONTINUED)

322016 SMALL BUSINESS CREDIT SURVEY | REPORT ON WOMEN-OWNED FIRMS
FEDERAL RESERVE BANK OF MINNEAPOLIS � Affinity Plus Federal Credit Union
� African Development Center of Minnesota
� Bemidji Area Chamber of Commerce
� Central (CERT) Certification Program, The City of Saint Paul
� Community Reinvestment Fund, USA
� Dakota Resources
� Entrepreneur Fund
� Four Band Community Fund
� Initiative Foundation
� Iverson Corner Drug
� Metro Independent Business Alliance
� MetroNorth Chamber
� Metropolitan Consortium of Community Developers
� Metropolitan Economic Development Association (MEDA)
� Minnesota American Indian Chamber of Commerce
� Minnesota Chamber of Commerce
� Minnesota District, U.S. Small Business Administration
� Minnesota Indian Business Alliance (MNIBA)
� MJB home center
� Neighborhood Development Center
� New Ulm Area Chamber of Commerce
� North 65 Chamber of Commerce
� Northwest Minnesota Foundation
� Park Rapids Lakes Area Chamber of Commerce
� PGC
� Pinnacle
� Progress Plus
� Quarks American Bento
� RP Broadcasting, Inc.
� The Dive Depot
� Top Shelf Hockey Shop
� Vadnais Heights Economic Development Corporation
� Wisconsin Indian Business Alliance
� Worthington Area Chamber of Commerce
FEDERAL RESERVE BANK OF NEW YORK � BOC Capital Corp.
� Bridgeport Regional Business Council
� Capital for Change
� Connecticut Business and Industry Association
� Connecticut Economic Resource Center (CERC)
� Connecticut Office of Business and Industry Development
� Connecticut Small Business Development Center
� Dept. of Economic and Comm. Dev., Connecticut Office of Small Business Affairs
� Empire State Development
� Endeavor
� Greater Bridgeport Latino Network
� Greater Newark Enterprise Corp.
� Intersect Fund
� Metro Hartford Alliance
� New Jersey Community Capital (NJCC)
� New Jersey Innovation Institute @ NJIT
� New Jersey Institute of Technology
� NJ Economic Development Authority
� NYC Department of Small Business Services
� Polsky Center for Entrepreneurship and Innovation
� reSET
� Rising Tide Capital
� Rutgers University Graduate School
� Statewide Hispanic Chamber of Commerce of New Jersey
� Statewide Hispanic Chamber of Commerce of NJ
� The Business Council of Fairfield County
� The WorkPlace
� UCEDC, a nonprofit economic development corporation
� USDA Rural Development
� Women's Center for Entrepreneurship
FEDERAL RESERVE BANK OF PHILADELPHIA � Delaware Small Business Development Center
� Latin American Economic Development Association
� Pennsylvania SBDC Lead Office
� SEDA-Council of Governments
� Upper Bucks Chamber of Commerce
PARTNER ORGANIZATIONS (CONTINUED)
332016 SMALL BUSINESS CREDIT SURVEY | REPORT ON WOMEN-OWNED FIRMS
FEDERAL RESERVE BANK OF RICHMOND � Asheville Area Chamber of Commerce
� Baltimore Community Lending
� Blowing Rock Chamber of Commerce
� Botetourt County Chamber of Commerce
� Carolina Small Business Development Fund
� CommunityWorks
� Danville Pittsylvania County Chamber of Commerce
� Falls Church Chamber of Commerce
� Franklin-Southampton Area Chamber of Commerce
� Garrett County Chamber of Commerce
� Greater Raleigh Chamber of Commerce
� Greater Winston-Salem Chamber of Commerce
� Greensboro Chamber of Commerce
� Henderson County Chamber of Commerce
� Howard County Chamber of Commerce
� Latino Economic Development Center
� Leadership Maryland
� Loudoun County Chamber of Commerce
� Maryland Capital Enterprises, Inc.
� Maryland Economic Development Association (MEDA)
� Maryland Governor's Office of Minority Affairs
� Maryland Hispanic Chamber of Commerce
� Maryland Southern Region Small Business Development Center
� Natural Capital Investment Fund (NCIF)
� Neighborhood BusinessWorks, Maryland Department of Housing and Community Development
� North Carolina District Office, U.S. Small Business Administration
� North Carolina Small Business and Technology Development Center (NC SBTDC)
� North Carolina Small Business Center Network, North Carolina Community College System (SBCN)
� Northern Virginia Chamber of Commerce
� Richmond SCORE
� Roxboro Area Chamber of Commerce
� RVA Works
� South Carolina Association for Community Economic Development (SCACED)
� South Carolina Department of Commerce
� State Delegation District and State Directors, Congressional Offices
� Unlimited Future, Inc.
� Virginia Peninsula Chamber of Commerce
� Virginia Small Business Development Center Network
� Virginia Small Business Financing Authority
� West Virginia Small Business Development Center
� Windsor-Bertie County Chamber of Commerce
� Women Presidents' Educational Organization—DC (WPEO-DC)
� Yadkin County Chamber of Commerce
FEDERAL RESERVE BANK OF ST. LOUIS � Arkansas Innovation Hub
� Arkansas Small Business and Technology Development Center
� Arkansas State Chamber of Commerce
� Communities Unlimited
� Community Services Microbusiness Program
� Community Ventures
� eFactory-Missouri State University Business Incubator
� Entrepreneur Center at Mississippi Development Authority
� Green River Area Development District
� Justine Peterson (CDFI)
� LiftFund
� Mid-South Minority Business Continuum
� Office of Entrepreneurship-KY Cabinet for Economic Development
� Southern Illinois University—Office of Economic & Regional Development
� Tennessee Small Business Development Center-Memphis
� Winrock International
PARTNER ORGANIZATIONS (CONTINUED)

342016 SMALL BUSINESS CREDIT SURVEY | REPORT ON WOMEN-OWNED FIRMS
FEDERAL RESERVE BANK OF SAN FRANCISCO � Accion San Diego
� California Small Business Association
� Chamber of Commerce Hawaii
� College of the Canyons Small Business Development Center
� Clearinghouse CDFI
� Council for Native Hawaiian Advancement
� Enterprise Honolulu (Oahu Economic Development Board)
� Fresno SBA Office
� Hawaii Alliance for Community Based Economic Development
� Hawaii Green Infrastructure Authority
� Hawaii Small Business Development Center
� Honolulu Business Network
� Local First Arizona
� Los Angeles Regional SBDC
� Main Street BIDCO Capital
� Maricopa Small Business Development Center
� Maui Economic Development Board
� National Development Council—Greater Salt Lake Area
� Nevada Small Business Development Center
� Northern Nevada SCORE
� Orange County / Inland Empire Regional SBDC
� Orange County SBDC
� Pacific Asian Consortium in Employment (PACE)
� Patsy T. Mink Center for Business & Leadership
� SBA, Hawaii District Office
� State of Hawaii Department of Commerce and Consumer Affairs Business Action Center
� State of Hawaii, Department of Business, Economic Development & Tourism
� The Kohala Center
� University of La Verne SBDC
� USDA Rural Development
� Valley Small Business Development Corporation
� Women's Economic Ventures
PARTNER ORGANIZATIONS (CONTINUED)