small business credit survey
TRANSCRIPT

Atlanta • Boston • Chicago • Cleveland • Dallas • Kansas City • Minneapolis New York • Philadelphia • Richmond • St. Louis • San Francisco
F E D E R A L R E S E RV E B A N K S o f
SMALL BUSINESS CREDIT SURVEY2021 REPORT ON FIRMS OWNED BY PEOPLE OF COLOR

SMALL BUSINESS CREDIT SURVEY | 2021 REPORT ON FIRMS OWNED BY PEOPLE OF COLOR
TABLE OF CONTENTS
I ACKNOWLEDGMENTS
II EXECUTIVE SUMMARY
1 KEY DEMOGRAPHICS FOR EMPLOYER FIRMS
5 PERFORMANCE & CHALLENGES5 Revenue and Employment Change,
Prior 12 Months6 Effects of the Pandemic on Operations7 Effects of the Pandemic on Sales
and Supply Chain8 Financial Challenges, Prior 12 Months9 Coping with Financial Challenges
and Use of Personal Funds10 Financial Condition
11 EMERGENCY FUNDING11 Pandemic-Related Emergency
Funding Applications12 PPP Nonapplicants13 PPP Applications and Bank Usage14 PPP Applications by Source15 Application Outcomes
16 LOOKING AHEAD16 Performance Expectations,
Next 12 Months17 Expected Challenges Resulting from
the Pandemic, Next 12 Months18 Survival Expectations19 Plans to Apply for Emergency
Assistance in the Future
20 DEBT & FINANCING20 Debt Outstanding21 Financial Services Providers22 Satisfaction with Primary Financial
Services Providers23 Demand for Non-Emergency Financing,
Prior 12 Months25 Nonapplicants26 Financing Needs and Outcomes28 Financing Received
30 FINANCING APPLICATIONS30 Loan, Line of Credit, and Cash
Advance Applications 32 Loan, Line of Credit, and Cash
Advance Approvals
34 NONEMPLOYER FIRMS35 Pandemic Sales Impact and
Financial Condition36 Financial Challenges, Prior 12 Months37 Pandemic-Related Emergency
Funding Applications38 PPP Application Sources and Outcomes39 Pandemic-Related Expected Challenges
and Survival Expectations40 Financing Demand and Outcomes

iSMALL BUSINESS CREDIT SURVEY | 2021 REPORT ON FIRMS OWNED BY PEOPLE OF COLOR
The Small Business Credit Survey is made possible through collaboration with business and civic organizations in communities across the United States. The Federal Reserve Banks thank the national, regional, and community partners who share valuable insights about small business financing needs and collaborate with us to promote and distribute the survey.1 We also thank the National Opinion Research Center (NORC) at the University of Chicago for assistance with weighting the survey data to be statistically representative of the nation’s small business population.2
Special thanks to colleagues within the Federal Reserve System, especially the Community Affairs Officers,3 and to representatives from the US Small Business Administration; America’s SBDC, the nationwide network of Small Business Development Centers; the US Department of the Treasury; the Consumer Financial Protection Bureau; the Opportunity Finance Network; Accion; and The Aspen Institute for their ongoing support for the Small Business Credit Survey.
This report is the result of the collaborative effort, input, and analysis of the following teams:
REPORT AND SURVEY TEAM4 Jessica Battisto, Federal Reserve Bank of New YorkMels de Zeeuw, Federal Reserve Bank of AtlantaRebecca Landau, Federal Reserve Bank of New YorkLucas Misera, Federal Reserve Bank of ClevelandAlvaro Sánchez, Federal Reserve Bank of PhiladelphiaAnn Marie Wiersch, Federal Reserve Bank of ClevelandJanelle Williams, Federal Reserve Bank of Atlanta
SURVEY ADVISORSClaire Kramer Mills, Federal Reserve Bank of New YorkMark Schweitzer, Federal Reserve Bank of Cleveland
PARTNER COMMUNICATIONS LEADSGrace Guynn, Federal Reserve Bank of AtlantaMary Hirt, Federal Reserve Bank of Atlanta
PARTNER OUTREACH LEADSBrian Clarke, Federal Reserve Bank of BostonJanelle Williams, Federal Reserve Bank of Atlanta
OUTREACH TEAM Leilani Barnett, Federal Reserve Bank of San FranciscoBrian Clarke, Federal Reserve Bank of Boston
Emily Corcoran, Federal Reserve Bank of RichmondJoselyn Cousins, Federal Reserve Bank of San FranciscoNaomi Cytron, Federal Reserve Bank of San FranciscoPeter Dolkart, Federal Reserve Bank of RichmondEmily Engel, Federal Reserve Bank of ChicagoIan Galloway, Federal Reserve Bank of San FranciscoDell Gines, Federal Reserve Bank of Kansas CityDesiree Hatcher, Federal Reserve Bank of ChicagoMelody Head, Federal Reserve Bank of San FranciscoMary Hirt, Federal Reserve Bank of AtlantaTreye Johnson, Federal Reserve Bank of ClevelandJason Keller, Federal Reserve Bank of ChicagoGarvester Kelley, Federal Reserve Bank of ChicagoSteven Kuehl, Federal Reserve Bank of ChicagoMichou Kokodoko, Federal Reserve Bank of MinneapolisLisa Locke, Federal Reserve Bank of St. LouisCraig Nolte, Federal Reserve Bank of San FranciscoDrew Pack, Federal Reserve Bank of ClevelandEmily Ryder Perlmeter, Federal Reserve Bank of DallasAlvaro Sánchez, Federal Reserve Bank of PhiladelphiaJavier Silva, Federal Reserve Bank of New YorkMarva Williams, Federal Reserve Bank of Chicago
We thank all of the above for their contributions.
Ann Marie Wiersch, Community Development Policy Advisor, Federal Reserve Bank of Cleveland
1 For a full list of community partners, please visit www.fedsmallbusiness.org.2 For complete information about the survey methodology, please see Methodology.3 Joseph Firschein, Board of Governors of the Federal Reserve System; Karen Leone de Nie, Federal Reserve Bank of Atlanta; Prabal Chakrabarti, Federal Reserve
Bank of Boston; Daniel Sullivan, Federal Reserve Bank of Chicago; Emily Garr Pacetti, Federal Reserve Bank of Cleveland; Roy Lopez, Federal Reserve Bank of Dallas; Tammy Edwards, Federal Reserve Bank of Kansas City; Alene Tchourumoff, Federal Reserve Bank of Minneapolis; Tony Davis, Federal Reserve Bank of New York; Theresa Singleton, Federal Reserve Bank of Philadelphia; Christy Cleare, Federal Reserve Bank of Richmond; Daniel Davis, Federal Reserve Bank of St. Louis; and Laura Choi, Federal Reserve Bank of San Francisco.
4 The Report and Survey Team appreciates the thoughtful comments, managerial support, and guidance from the following colleagues: Lisa Nelson from the Federal Reserve Bank of Cleveland; Brent Meyer, Veronika Penciakova, Nick Parker, and Kevin Foster from the Federal Reserve Bank of Atlanta; and Barbara Lipman and Marysol Weindorf from the Board of Governors of the Federal Reserve System. Valuable assistance with this publication was provided by Heather Ann from the Federal Reserve Bank of Cleveland.
The views expressed in the following pages are those of the report team and do not necessarily represent the views of the Federal Reserve System.
ACKNOWLEDGMENTS

iiSMALL BUSINESS CREDIT SURVEY | 2021 REPORT ON FIRMS OWNED BY PEOPLE OF COLOR
EXECUTIVE SUMMARY
1 Mills, Claire Kramer and Jessica Battisto. 2020. “Double Jeopardy: COVID-19’s Concentrated Health and Wealth Effects in Black Communities.” Federal Reserve Bank of New York. August. www.fedsmallbusiness.org/medialibrary/FedSmallBusiness/files/2020/DoubleJeopardy_COVID19andBlackOwnedBusinesses.
Misera, Lucas. 2020. “An Uphill Battle: COVID-19’s Outsized Toll on Minority-owned Firms.” Federal Reserve Bank of Cleveland. October. doi.org/10.26509/frbc-cd-20201008.
Federal Reserve Bank of Atlanta. 2019. “Small Business Credit Survey 2019 Report on Minority-owned Firms.” December. www.fedsmallbusiness.org/ survey/2019/report-on-minority-owned-firms.
2 Bauer, Lauren, Kristen Broady, Wendy Edelberg, and Jimmy O’Donnell. 2020. “Ten Facts about COVID-19 and the U.S. Economy.” The Brookings Institution. September. www.brookings.edu/research/ten-facts-about-covid-19-and-the-u-s-economy/.
3 Smallemployerfirmshavebetween1and499full-orpart-timepaidemployees,inadditiontotheowner(s),onpayroll.Nonemployerfirmshavenopaid employeesotherthantheowner(s).
4 Klein, Joyce. 2017. “Bridging the Divide: How Business Ownership Can Help Close the Racial Wealth Gap.” The Aspen Institute. January. www.aspeninstitute.org/wp-content/uploads/2017/01/Bridging-the-Divide.pdf.
Association for Enterprise Opportunity. 2017. “The Tapestry of Black Business Ownership in America: Untapped Opportunities for Success.” March. aeoworks.org/images/uploads/fact_sheets/AEO_Black_Owned_Business_Report_02_16_17_FOR_WEB.pdf.
Stoll, Michael A., Steven Raphael, and Harry J. Holzer. 2001. “Why Are Black Employers More Likely Than White Employers to Hire Blacks?” Institute for Research on Poverty. Discussion Paper 1236-01. August. www.irp.wisc.edu/publications/dps/pdfs/dp123601.pdf.
Toussaint-Coumeau, Maude, Robin Newberger, and Mark O’Dell. 2019. “Small Business Performance in Industries in LMI Neighborhoods after the Great Recession:Atlanta,Baltimore,Chicago,Houston,andLosAngeles.”ProfitWiseNewsandViews(No.3).FederalReserveBankofChicago. www.chicagofed.org/publications/profitwise-news-and-views/2019/small-business-performance-in-industries-in-lmi-neighborhoods-after-the-great-recession.
5 Based on authors’ calculations from the US Census Bureau’s 2018 Annual Business Survey.6 Toussaint-Coumeau,MaudeandVictoriaWilliams.2020.“SecularTrendsinMinority-OwnedBusinessesandSmallBusinessFinance.”“ProfitWiseNewsand
Views(No.2).”May.FederalReserveBankofChicago.www.chicagofed.org/publications/profitwise-news-and-views/2020/secular-trends-minority-owned- businesses-small-business-finance.
7 TheSBCSusesCensus-definedcategoriesofraceandethnicity.Throughoutthisreport,weusesimplified,mutuallyexclusiverace/ethnicitylabels.Forexample,alabelof“white”refersto“non-Hispanicwhite”andalabelof“Hispanic”referstoallfirmsownedbyindividualsofHispanicethnicity,regardlessoftheirrace.
The COVID-19 pandemic has deeply im-pacted communities of color and small busi-nesses of color, in many cases to a greater extent than their white counterparts. Prior to the pandemic, small businesses owned by people of color, in aggregate, faced greater challenges than white-owned firms.1 The 2020 Small Business Credit Survey (SBCS) provides evidence that the pandemic exacer-bated those challenges, an important finding as those businesses continue to weather the impact of the COVID-19 pandemic.
At the time of the 2020 SBCS—six months after the onset of the pandemic—the US economy had undergone a significant contraction of economic activity.2 The SBCS finds that firms owned by people of color, both small employer firms and nonemployer firms,3 were among the firms most likely to experience financial and operational challenges stemming from the pandemic. The challenges these firms are facing are concerning, given the important role the firms play in wealth building and employ-ment in communities of color and, more broadly, in the overall economy.4
While firms owned by people of color account for just 18% of small employers,5 they are a rapidly growing segment of small businesses, increasing at a rate of 11% com-pared to white-owned firms (1%) between 2014 and 2016.6 Yet firms of color continue to face structural barriers in acquiring the capital, knowledge, and market access
necessary for growth. The SBCS finds that firms owned by people of color tend to have weaker banking relationships, experience worse outcomes on credit applications, and are more reliant on personal funds.
The challenges that firms of color dispropor-tionately face make it important to disaggre-gate small business outcomes by race and ethnicity of firm ownership. Understanding the differences between the experiences of Black-, Asian-, and Hispanic-owned firms can help policymakers better address the unique needs of small businesses of color and implement programs to support the sur-vival of these small firms and their recovery from the effects of the pandemic.
SURVEY FINDINGSThe SBCS provides data on small business performance, financing needs and deci-sions, and borrowing outcomes. The 2020 SBCS, which was fielded in September and October 2020, yielded 9,693 responses from small employer firms in all 50 states and the District of Columbia. This report shows results by four race/ethnicity categories: white, Black or African American, Hispanic or Latino, and Asian or Pacific Islander.7 For select key statistics, this report also provides results for 4,531 nonemployer firms, which are firms with no employees on payroll other than the owner(s) of the business. Given that the vast majority of firms of color are nonemployers, information
on this segment of firms is crucial to understanding the ecosystem for firms owned by people of color. This 2021 Small Business Credit Survey Report on Firms Owned by People of Color, therefore, offers unique insight into important segments of the small business population.
Key performance indicators declined substantially for the majority of employer firms between 2019 and 2020. However, firms owned by people of color reported more significant negative effects on busi-ness revenue, employment, and operations as a result of the COVID-19 pandemic.
� Declines in revenue and employment between 2019 and 2020 were most severe for firms owned by people of color. Ninety percent of Asian-owned firms reported a decrease in revenue, the most of any group of business owners. Moreover, the majority of Asian-owned firms (54%) also reported a decrease in employment during the same period.
� Firms owned by people of color were more likely to report that they reduced business operations in response to the COVID-19 pandemic. Sixty-seven percent of Asian- and Black-owned firms reported reducing their operations, followed by 63% of Hispanic-owned firms and 54% of white-owned firms.
� Asian-owned firms were most likely to report an expected sales decline in 2020

iiiSMALL BUSINESS CREDIT SURVEY | 2021 REPORT ON FIRMS OWNED BY PEOPLE OF COLOR
due to the pandemic (93%). Sales declines were also reported by 86% and 85% of Black- and Hispanic-owned firms, respec-tively, while 79% of white-owned firms reported a decrease in sales.
� At the time of the survey, firms of color were more likely than white-owned firms to report poor or fair financial conditions. While 79% of Asian-owned firms and 77% of Black-owned firms reported that their financial condition was poor or fair, 54% of white-owned firms reported similar conditions.
Firms owned by people of color faced significant financial stress in 2020, more so than their white-owned counterparts.
� Ninety-two percent of Black-owned firms reported experiencing financial challenges in 2020 (up from 85% in 2019), followed by Asian-owned firms (89%, up from 70%) and Hispanic-owned firms (85%, up from 78%). White-owned firms were the least likely to report financial challenges (79%, up from 65% in 2019).
� Nearly three quarters of Asian- and Black-owned firms reported difficulties paying their operating expenses compared to 63% of white-owned firms. Moreover, 53% of Black-owned firms reported difficulty accessing credit, the most of any group.
� Black business owners were the most likely to tap into their personal funds in response to their firms’ financial challenges (74%) compared to Hispanic-owned firms (65%), Asian-owned firms (65%), and white-owned firms (61%). Almost half of Black-owned firms (46%) reported concerns about personal credit scores or loss of personal assets as a result of late payments, the highest share among the owner groups. In contrast, white-owned firms were the most likely to report that there was no impact on the owner’s personal finances.
The Paycheck Protection Program (PPP) was the most commonly sought form of emergency assistance funding among employer firms. Firms owned by people of color, and particularly Black-owned firms, were less likely to receive all of the PPP funding that they requested.
� Only 61% of Black-owned firms applied for a PPP loan compared to 85% of Asian-owned firms, the largest share of any group.
� While 79% of white-owned firms received all of the PPP funding they sought, that share dropped to 43% for Black-owned firms. Black-owned applicant firms were five times as likely as white-owned firms to receive none of the PPP funding for which they applied (20% compared to 4%).
� When Black-owned firms applied for PPP funds at large banks, 41% received all of the funding sought (compared to 71% for white-owned firms). When applying to small banks, 48% of Black-owned firms received the full share (versus 80% for white-owned firms), and 24% were fully approved at online lenders (versus 49% for white-owned firms).
� Among those that did not seek PPP, most did not expect to qualify for the loan or loan forgiveness. Further, firms owned by people of color were more likely than white-owned firms to report that they missed the deadline or were unaware of the program, while white-owned firms disproportionately reported that they did not need funding.
At the time of the survey, firms owned by people of color expected revenue, employment, and operational challenges to persist into 2021 or beyond.
� Sixty-three percent of Asian-owned firms expected their revenues to decrease in the 12 months following the survey, while smaller shares of Hispanic-, white- and Black-owned firms (39%, 38% and 37%, respectively) anticipated declines.
� Most firms expected that sales would not return to “normal” (that is, 2019 levels) until the second half of 2021 or later. At the time of the survey, 81% of Asian-owned firms expected sales would not reach normal until at least the second half of 2021, compared to 72% of Black-owned firms, 70% of white-owned firms, and 64% of Hispanic-owned firms.
� Forty-eight percent of Black-owned firms expect credit availability will be a challenge as a result of the pandemic, compared to 40% of Hispanic-owned firms, 38% of Asian-owned firms, and 30% of white-owned firms.
Even among firms with good credit scores, firms owned by people of color were less likely to have their financing needs met than white-owned firms.
� Across owner groups, Black-owned firms that applied for traditional forms of financing were least likely to receive all of the financing they sought (13%). Hispanic- and Asian-owned firms (20% and 31%, respectively) were also less likely than white-owned firms (40%) to receive all of the financing for which they applied.
� Even among firms with good credit scores, Black-owned firms were half as likely as white-owned firms to receive all of the financing they sought (24% versus 48%).
Firms owned by people of color reported differences in their use of financial services and satisfaction with their providers.
� Firms owned by people of color were twice as likely as white-owned firms to report that they did not use a financial services provider. Twelve percent of Black- and Hispanic-owned firms did not use financial service providers, followed by 11% of Asian-owned firms and 6% of white-owned firms.
� Firms owned by people of color were less satisfied than white-owned firms with the support they received from their primary financial services provider during the pandemic. Larger shares of white-owned firms were satisfied with small banks, large banks, and credit unions compared to firms of color.
Nonemployer firms of color experienced sharp sales declines and poor financial con-ditions. They also sought different forms of pandemic-related emergency assistance.
� Similar to Asian-owned employer firms, Asian-owned nonemployer firms were more likely than other nonemployer firms
EXECUTIVE SUMMARY (Continued)

ivSMALL BUSINESS CREDIT SURVEY | 2021 REPORT ON FIRMS OWNED BY PEOPLE OF COLOR
to report declines in revenues in the 12 months prior to the survey, with 90% experiencing a decrease in sales. About half of Asian-owned nonemployer firms (52%) reported their financial condition as poor, compared to 38% of Hispanic-owned nonemployer firms, 36% of Black-owned nonemployer firms, and 28% of white-owned nonemployer firms.
� While PPP was the top source of emer-gency assistance for employer firms, nonemployer firms—particularly nonem-ployer firms of color—were just as likely or even more likely to seek Economic Injury Disaster loans as PPP loans.
� Regardless of the race or ethnicity of the owner, nonemployer firms were less likely than employer firms to apply for PPP loans and were less likely to be approved.
� Applications for enhanced unemployment insurance benefits were particularly com-mon among Asian owners of nonemployer firms (45% applied). Among owners of Black, Hispanic, and white nonemployer firms, about 3 in 10 applied.
ABOUT THE SURVEYThe SBCS is an annual survey of firms with fewer than 500 employees. These types of firms represent 99.7% of all employer estab-lishments in the United States.8 Respondents are asked to report information about their business performance, financing needs and choices, and borrowing experiences. Responses to the SBCS provide insights on the dynamics behind lending trends and shed light on various segments of the small business population.
METHODOLOGY The SBCS uses a convenience sample of establishments. Businesses are contacted by email through a diverse set of organiza-
tions that serve the small business com-munity.9 Prior SBCS participants and small businesses on publicly available email lists10 are also contacted directly by the Federal Reserve Banks. The survey instrument is an online questionnaire that typically takes 6 to 12 minutes to complete, depending upon the intensity of a firm’s search for financing. The questionnaire uses question branching and flows based on responses to survey questions. For example, financing applicants receive a different line of questioning than nonapplicants. Therefore, the number of observations for each question varies by how many firms receive and complete a particular question.
A sample for the SBCS is not selected randomly; thus, the SBCS may be subject to biases not present with surveys that do sample firms randomly. For example, there are likely small employer firms not on our contact lists, a situation which could lead to noncoverage bias. To control for potential biases, the sample data are weighted so the weighted distribution of firms in the SBCS matches the distribution of the small firm (1 to 499 employees) population in the United States by number of employees, age, industry, geographic location (census divi-sion and urban or rural location), gender of owner(s), and race or ethnicity of owner(s). The weighting methodology was developed in collaboration with the National Opinion Research Center (NORC) at the University of Chicago. The data used to construct the weights originate from the US Census Bureau. For more information on the report and weighting methodology, please refer to the Small Business Credit Survey 2021 Report on Employer Firms Methodology section.11
Pages 34–40 in this report include data pertaining to nonemployer firms. Similar to employer firms, responses from nonemploy-er firms in the Small Business Credit Survey are weighted to represent the distribution of
nonemployer firms across the United States. These weights are based on the firm's age, industry, rural or urban location of a firm, the race and ethnicity of a firm's ownership, and the gender of a firm's ownership. The data for these variables are obtained from the US Census Bureau. The weighting process used for nonemployers differs somewhat from the process for employer firms. For instance, due to data limitations, weights are constructed based on national data, compared to state-level data for employer firms. Additionally, the age and gender of ownership variables are based on fewer strata for employer firms. For further infor-mation on the SBCS weighting methodology for nonemployer firms, please refer to the Small Business Credit Survey 2019 Report on Nonemployer Firms Methodology section.
Whenever this report refers to “Asian,” “Black,” “Hispanic,” or “white,” the report and the data refer to the race and ethnicity of the majority of the firms’ ownership: non-Hispanic Asian-owned, non-Hispanic Black-owned, Hispanic- or Latino-owned, or non-Hispanic white-owned. When this report refers to "firms of color" or "firms owned by people of color," the data refer to firms for which more than 50% of a firm's ownership is Asian, Black, or Hispanic. When specified, firms owned by people of color will also include majority Native American ownership. Consistent with the approach taken by the US Census Bureau, in cases where a firm is owned equally by owners who are white and owners who are from a racial or ethnic minority group, or in cases in which at least half of the firm is owned by another entity (for example, shareholders or a trust), that firm is classified as “white.” When observa-tion counts are too low to provide reliable estimates for specific race or ethnicity categories, results are displayed only for categories with sufficiently high counts or for firms of color collectively.
8 US Census Bureau, 2018 County Business Patterns.9 For more information on partnerships, please visit www.fedsmallbusiness.org/partnership10 SystemforAwardManagement(SAM)EntityManagementExtractsPublicDataPackage;SmallBusinessAdministration(SBA)DynamicSmallBusiness
Search(DSBS);state-maintainedlistsofcertifieddisadvantagedbusinessenterprises(DBEs);stateandlocalgovernmentProcurementVendorLists,including minority-andwomen-ownedbusinessenterprises(MWBEs);stateandlocalgovernment-maintainedlistsofsmallordisadvantagedsmallbusinesses;and a list of veteran-owned small businesses maintained by the Department of Veterans Affairs.
11 Some results displayed in the charts that depict changes over time may differ from the 2016 Small Business Credit Survey: Report on Minority-Owned Firms due tochangesintheweightingmethodologyandtheadditionofobservationsforwhichrace,ethnicity,andgenderofthefirms’owner(s)wasimputed.
EXECUTIVE SUMMARY (Continued)

1SMALL BUSINESS CREDIT SURVEY | 2021 REPORT ON FIRMS OWNED BY PEOPLE OF COLOR
KEY DEMOGRAPHICS FOR EMPLOYER FIRMS
Small business revenue size is closely associated with firms’ financial well-being, resiliency, and profitability. For example, firms with higher annual revenues are more likely to successfully obtain the financing needed to operate and grow. These outcomes are particularly relevant to firms of color because research shows that they generate considerably smaller revenues, on average, than their white counterparts. The SBCS finds that about half of Black-owned small employer firms (52%) operated on $100,000 or less in revenue in 2020, followed by Hispanic- and Asian-owned firms (30% and 18%, respectively). As firms work through the effects of the pandemic, revenue size provides important context for firms’ ability to access the capital they need to recover.
Similarly, the smallest firms with respect to employment also tend to be the most vulnerable to economic downturns such as the one sparked by the COVID-19 pandemic.1 The majority of small employer firms across each racial and ethnic group employed fewer than five workers. Seventy-six percent of Black-owned firms employed fewer than five employees, the largest share of any group, followed by Hispanic-, Asian-, and white-owned firms (69%, 60%, and 52%, respectively).
1 Liu, Sifan and Joseph Parilla. 2020. “What the Great Recession Can Tell Us about the COVID-19 Small Business Crisis.” The Brookings Institution. The Avenue. March. www.brookings.edu/blog/the-avenue/2020/03/25/what-the-great-recession-can-tell-us-about-the-covid-19-small-business-crisis/.
2 Categorieshavebeencondensedandsimplifiedforreadability.Actualresponseoptionsare:≤$25K,$25,001–$50K,$50,001–$100K,$100,001–$500K,$500,001–$1M,$1,000,001–$5M,$5,000,001–$10M,>$10M.
3 The percentages shown in this chart may differ from those reported by the US Census because our weighting methodology does not incorporate cross- tabulationsofdemographicvariables.Therefore,thefiguresinthischartareacloserrepresentationofoursurveyrespondentsratherthanthemostpreciseestimate of the national small business population.
REVENUE SIZE OF FIRM2 (% of employer firms)
>$1M $100K–$1M ≤$100K
13%
50%
37%
18%
52%
30%
30%
50%
20%
52%
37%
11%
Black N=1,137
Hispanic N=827
Asian N=650
White N=6,723
NUMBER OF EMPLOYEES3 (% of employer firms)
50–499 employees 20–49 employees 5–19 employees 1–4 employees
52%
32%
10%6%
60%
30%7%
69%
24%5%
76%
18%
Black N=1,182
Hispanic N=859
Asian N=665
White N=6,880
4%, 2% 2% 3%

2SMALL BUSINESS CREDIT SURVEY | 2021 REPORT ON FIRMS OWNED BY PEOPLE OF COLOR
KEY DEMOGRAPHICS FOR EMPLOYER FIRMS(Continued)
Credit risk, which is based on the self-reported credit score of a business or its owner, is an important factor that lenders consider in their credit decisions. However, disparities in credit risk between firms owned by people of color and white-owned firms heighten barriers to rais-ing capital and expanding the business. Studies show gaps in access to credit and capital for firms owned by people of color can, in part, be attributed to lower levels of wealth among Black and Hispanic business owners, lower revenues, and insufficient credit histories.1 These factors—especially wealth and credit history—likely contribute to differences in credit scores between business owners of color and white business owners.
While this report includes findings based on the credit risk of firms, we acknowledge that questions remain around the use of credit scores in decisions to approve financing given the structural limitations that disadvantage people and firms of color.
1 Fairlie, Robert and Alicia Robb. 2010. “Disparities in Capital Access between Minority and Non-Minority-Owned Businesses: The Troubling Reality of Capital Limitations Faced by MBEs.” US Department of Commerce, Minority Business Development Agency. January. archive.mbda.gov/page/executive-summary- disparities-capital-access-between-minority-and-non-minority-businesses.html. Brevoort,Kenneth,PhilippGrim,andMichelleKambara.2015.“DataPoint:CreditInvisibles.”TheCFPBOfficeofResearch.May.files.consumerfinance.gov/f/201505_cfpb_data-point-credit-invisibles.pdf.
2 Percentages may not sum to 100 due to rounding.3 Creditriskisdeterminedbytheself-reportedbusinesscreditscoreorpersonalcreditscore,dependingonwhichisusedtoobtainfinancingfortheirbusiness.
Ifthefirmusesboth,thehigherriskratingisused.“Lowcreditrisk”isa80–100businesscreditscoreor720+personalcreditscore.“Mediumcreditrisk” isa50–79businesscreditscoreora620–719personalcreditscore.“Highcreditrisk”isa1–49businesscreditscoreora<620personalcreditscore.
CREDIT RISK OF FIRM2,3 (% of employer firms)
Black N=887
24%
43%
33%
Hispanic N=680
Asian N=480
White N=4,953
Low credit risk Medium credit risk High credit risk
8%
20%
72%
5%
23%
72%
8%
42%
49%
3SMALL BUSINESS CREDIT SURVEY | 2021 REPORT ON FIRMS OWNED BY PEOPLE OF COLOR
KEY DEMOGRAPHICS FOR EMPLOYER FIRMS(Continued)
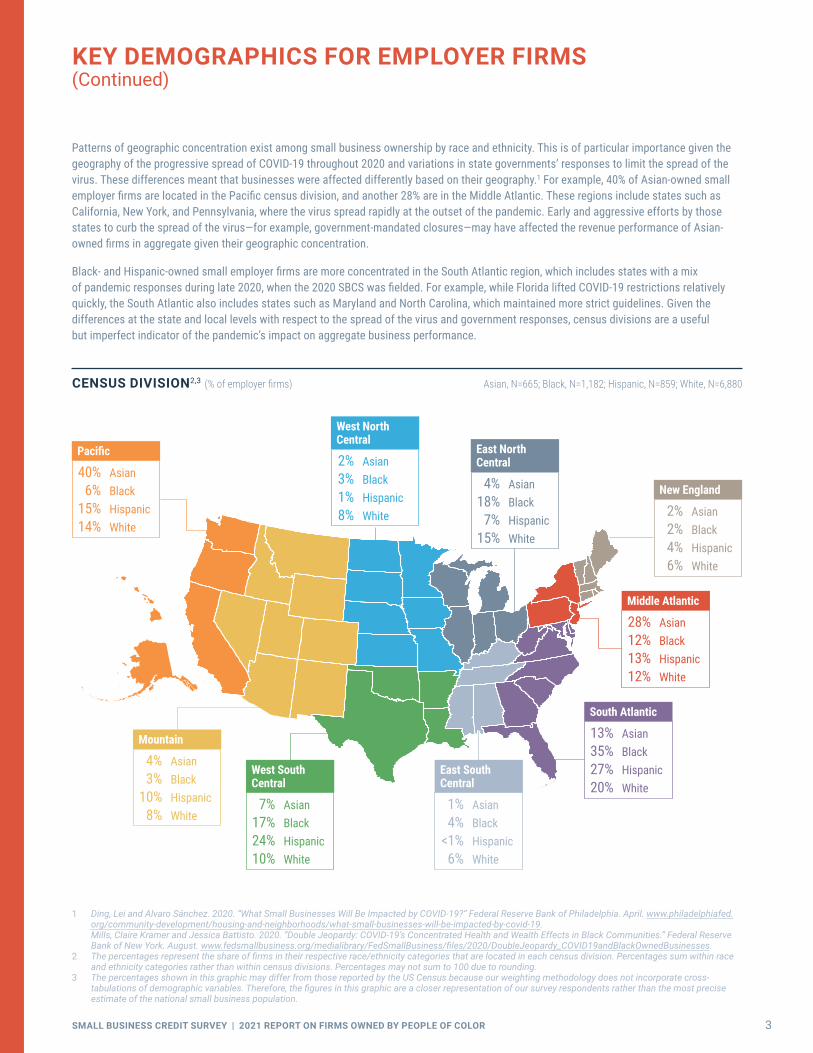
Patterns of geographic concentration exist among small business ownership by race and ethnicity. This is of particular importance given the geography of the progressive spread of COVID-19 throughout 2020 and variations in state governments’ responses to limit the spread of the virus. These differences meant that businesses were affected differently based on their geography.1 For example, 40% of Asian-owned small employer firms are located in the Pacific census division, and another 28% are in the Middle Atlantic. These regions include states such as California, New York, and Pennsylvania, where the virus spread rapidly at the outset of the pandemic. Early and aggressive efforts by those states to curb the spread of the virus—for example, government-mandated closures—may have affected the revenue performance of Asian-owned firms in aggregate given their geographic concentration.
Black- and Hispanic-owned small employer firms are more concentrated in the South Atlantic region, which includes states with a mix of pandemic responses during late 2020, when the 2020 SBCS was fielded. For example, while Florida lifted COVID-19 restrictions relatively quickly, the South Atlantic also includes states such as Maryland and North Carolina, which maintained more strict guidelines. Given the differences at the state and local levels with respect to the spread of the virus and government responses, census divisions are a useful but imperfect indicator of the pandemic’s impact on aggregate business performance.
1 Ding, Lei and Alvaro Sánchez. 2020. “What Small Businesses Will Be Impacted by COVID-19?” Federal Reserve Bank of Philadelphia. April. www.philadelphiafed.org/community-development/housing-and-neighborhoods/what-small-businesses-will-be-impacted-by-covid-19. Mills, Claire Kramer and Jessica Battisto. 2020. “Double Jeopardy: COVID-19’s Concentrated Health and Wealth Effects in Black Communities.” Federal Reserve Bank of New York. August. www.fedsmallbusiness.org/medialibrary/FedSmallBusiness/files/2020/DoubleJeopardy_COVID19andBlackOwnedBusinesses.
2 Thepercentagesrepresenttheshareoffirmsintheirrespectiverace/ethnicitycategoriesthatarelocatedineachcensusdivision.Percentagessumwithinraceand ethnicity categories rather than within census divisions. Percentages may not sum to 100 due to rounding.
3 The percentages shown in this graphic may differ from those reported by the US Census because our weighting methodology does not incorporate cross- tabulationsofdemographicvariables.Therefore,thefiguresinthisgraphicareacloserrepresentationofoursurveyrespondentsratherthanthemostpreciseestimate of the national small business population.
CENSUS DIVISION2,3 (% of employer firms) Asian, N=665; Black, N=1,182; Hispanic, N=859; White, N=6,880
East North Central
4% Asian 18% Black 7% Hispanic 15% White
East South Central
1% Asian 4% Black <1% Hispanic 6% White
West South Central
7% Asian 17% Black 24% Hispanic 10% White
Mountain
4% Asian 3% Black 10% Hispanic 8% White
South Atlantic
13% Asian35% Black 27% Hispanic20% White
West North Central
2% Asian 3% Black 1% Hispanic 8% White
New England
2% Asian 2% Black 4% Hispanic 6% White
Pacific
40% Asian 6% Black 15% Hispanic 14% White
Middle Atlantic
28% Asian 12% Black 13% Hispanic 12% White
4SMALL BUSINESS CREDIT SURVEY | 2021 REPORT ON FIRMS OWNED BY PEOPLE OF COLOR
KEY DEMOGRAPHICS FOR EMPLOYER FIRMS(Continued)
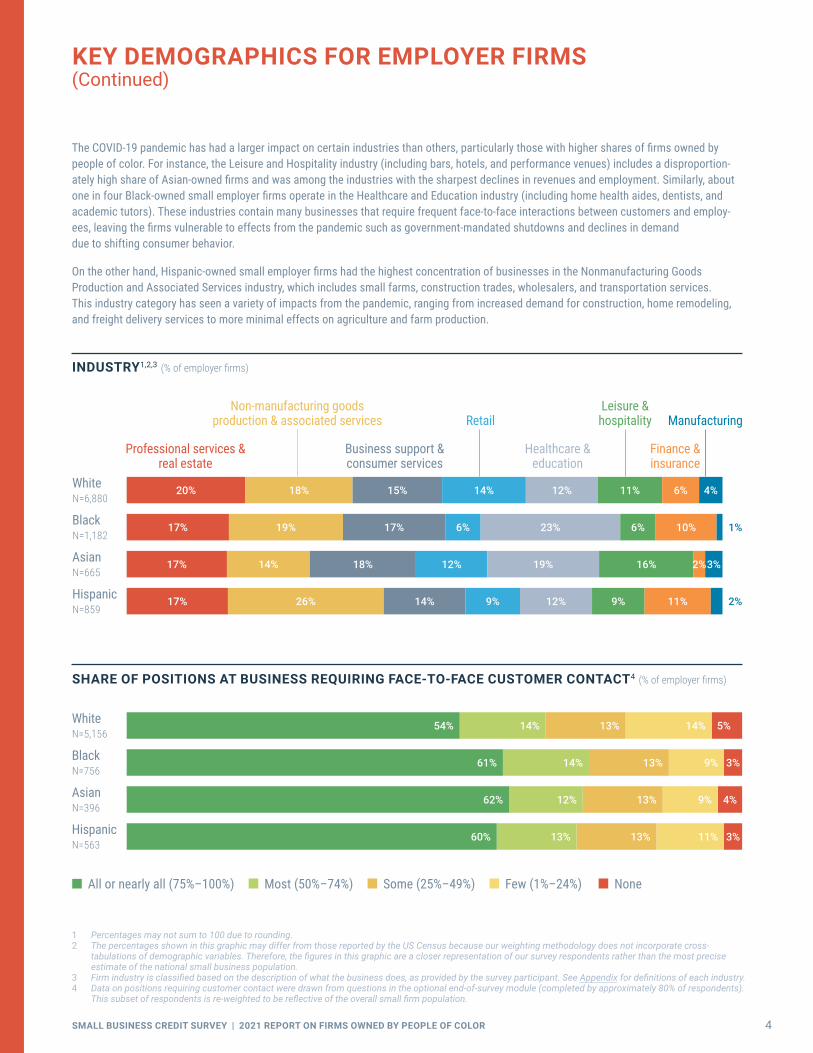
The COVID-19 pandemic has had a larger impact on certain industries than others, particularly those with higher shares of firms owned by people of color. For instance, the Leisure and Hospitality industry (including bars, hotels, and performance venues) includes a disproportion-ately high share of Asian-owned firms and was among the industries with the sharpest declines in revenues and employment. Similarly, about one in four Black-owned small employer firms operate in the Healthcare and Education industry (including home health aides, dentists, and academic tutors). These industries contain many businesses that require frequent face-to-face interactions between customers and employ-ees, leaving the firms vulnerable to effects from the pandemic such as government-mandated shutdowns and declines in demand due to shifting consumer behavior.
On the other hand, Hispanic-owned small employer firms had the highest concentration of businesses in the Nonmanufacturing Goods Production and Associated Services industry, which includes small farms, construction trades, wholesalers, and transportation services. This industry category has seen a variety of impacts from the pandemic, ranging from increased demand for construction, home remodeling, and freight delivery services to more minimal effects on agriculture and farm production.
1 Percentages may not sum to 100 due to rounding.2 The percentages shown in this graphic may differ from those reported by the US Census because our weighting methodology does not incorporate cross-
tabulationsofdemographicvariables.Therefore,thefiguresinthisgraphicareacloserrepresentationofoursurveyrespondentsratherthanthemostpreciseestimate of the national small business population.
3 Firmindustryisclassifiedbasedonthedescriptionofwhatthebusinessdoes,asprovidedbythesurveyparticipant.SeeAppendixfordefinitionsofeachindustry.4 Dataonpositionsrequiringcustomercontactweredrawnfromquestionsintheoptionalend-of-surveymodule(completedbyapproximately80%ofrespondents).
Thissubsetofrespondentsisre-weightedtobereflectiveoftheoverallsmallfirmpopulation.
INDUSTRY1,2,3 (% of employer firms)
White N=6,880
Asian N=665
17% 14% 18% 12% 19% 16% 3%2%
Hispanic N=859
17% 26% 14% 9% 12% 9% 11% 2%
Black N=1,182
1%17% 19% 17% 6% 23% 6% 10%
20% 18% 15% 14% 12% 11% 6% 4%
Professional services & real estate
Business support & consumer services
Healthcare & education
Finance & insurance
Non-manufacturing goods production & associated services Retail
Leisure & hospitality Manufacturing
SHARE OF POSITIONS AT BUSINESS REQUIRING FACE-TO-FACE CUSTOMER CONTACT4 (% of employer firms)
White N=5,156
Asian N=396
Hispanic N=563
Black N=756
All or nearly all (75%–100%) Most (50%–74%) Some (25%–49%) Few (1%–24%) None
5%14%13%14%54%
3%9%13%14%61%
4%9%13%12%62%
3%11%13%13%60%
5SMALL BUSINESS CREDIT SURVEY | 2021 REPORT ON FIRMS OWNED BY PEOPLE OF COLOR
90%
EMPLOYER FIRM PERFORMANCE (% of employer firms)
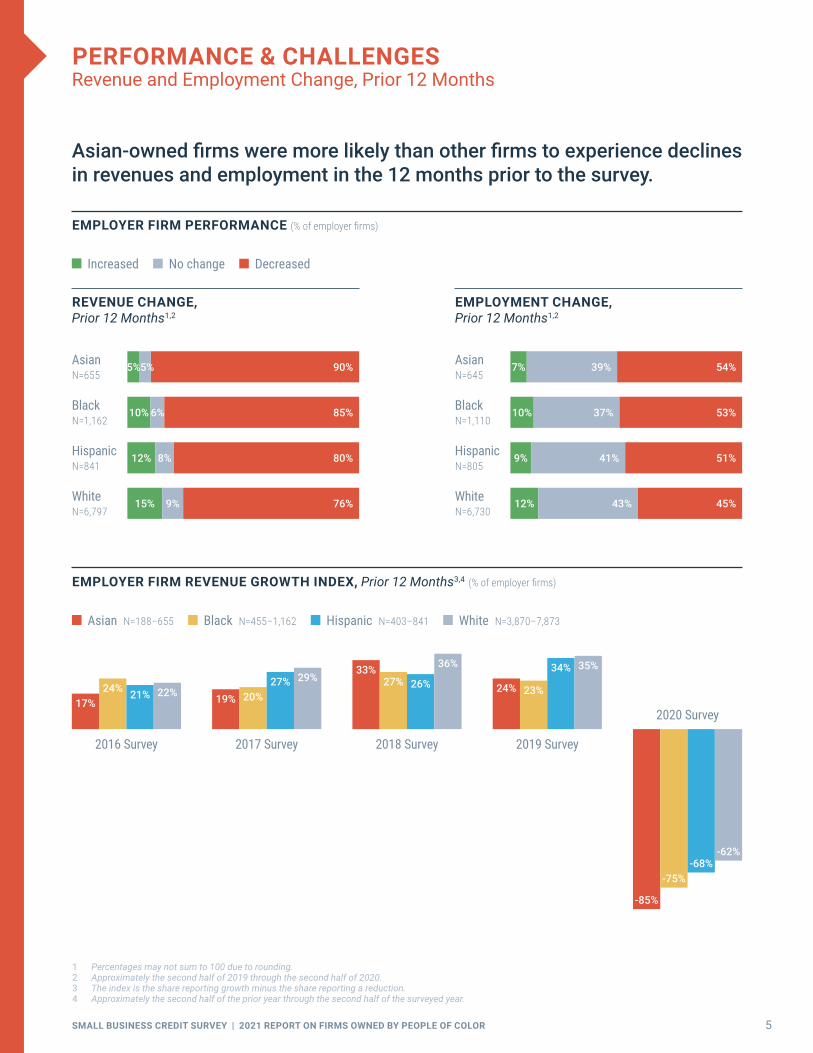
PERFORMANCE & CHALLENGESRevenue and Employment Change, Prior 12 Months
Asian-owned firms were more likely than other firms to experience declines in revenues and employment in the 12 months prior to the survey.
1 Percentages may not sum to 100 due to rounding.2 Approximately the second half of 2019 through the second half of 2020.3 The index is the share reporting growth minus the share reporting a reduction.4 Approximately the second half of the prior year through the second half of the surveyed year.
Increased No change Decreased
REVENUE CHANGE, Prior 12 Months1,2
EMPLOYMENT CHANGE, Prior 12 Months1,2
White N=6,797
White N=6,730
Hispanic N=841
Black N=1,162
Black N=1,110
15% 9% 76%
12% 8% 80%
10% 85%6%
5%5%Asian N=655
Asian N=645
Hispanic N=805
12% 43% 45%
10% 37% 53%
7% 39% 54%
9% 41% 51%
EMPLOYER FIRM REVENUE GROWTH INDEX, Prior 12 Months3,4 (% of employer firms)
2020 Survey
-85%
-75%-68%
-62%
24% 23%
34% 35%
2019 Survey
33%27% 26%
36%
2018 Survey
19% 20%27% 29%
2017 Survey 2016 Survey
17%24% 21% 22%
Asian N=188–655 Black N=455–1,162 Hispanic N=403–841 White N=3,870–7,873

6SMALL BUSINESS CREDIT SURVEY | 2021 REPORT ON FIRMS OWNED BY PEOPLE OF COLOR
PERFORMANCE & CHALLENGESEffects of the Pandemic on Operations
Overall, firms owned by people of color were more likely than white- owned firms to report that they reduced their operations in response to the pandemic. Asian-owned firms were more likely than others to have temporarily closed.
EFFECTS OF THE PANDEMIC ON BUSINESS OPERATIONS1 (% of employer firms)
Asian N=663
Black N=1,172
Hispanic N=857
White N=6,858
No significant impact5%
Expanded operations 3%
3%
3%2%2%
5%
5%
Temporarily closed 33%
26%27%
25%
Modified operations 43%
39%44%
49%
Reduced operations 67%67%
63%54%
1 Respondentscouldselectmultipleoptions.Forexample,afirmmayhavetemporarilyclosed,andthenreopenedwithreducedoperations.“Temporarilyclosed”includesfirmsthatremainedclosedatthetimeofsurveyandfirmsthathadclosedforatimebuthavesincereopened.
2 Select options shown. See Appendix for more detail.3 Respondents could select multiple options.
Asian N=638
White N=6,291
Black N=1,116
Hispanic N=809
Owner(s)' personal/ family obligations
Government mandate affecting clients' businesses
Change in demand for products/services
Government mandate affecting my business
DRIVERS OF OPERATIONAL CHANGES DURING THE PANDEMIC2,3 (% of employer firms that temporarily closed or reduced/modified operations)
9%
12%17%
12%
34%
39%37%
37%
58%
52%53%
59%
55%
50%52%
64%

7SMALL BUSINESS CREDIT SURVEY | 2021 REPORT ON FIRMS OWNED BY PEOPLE OF COLOR
PERFORMANCE & CHALLENGESEffects of the Pandemic on Sales and Supply Chain
93% of Asian-owned firms and 86% of Black-owned firms reported sales declines as a result of the pandemic.
1 Percentages may not sum to 100 due to rounding.
IMPACT OF THE PANDEMIC ON THE AVAILABILITY OF GOODS AND SERVICES IN FIRMS’ SUPPLY CHAINS (% of employer firms)
White N=6,841
Hispanic N=855
Black N=1,170
17% 44% 21% 3% 15%
29% 38% 17% 4% 12%
31% 34% 12% 5% 18%
32% 37% 13% 3% 15%Asian N=663
Large decrease in availability
Moderate decrease in availability
Little or no change in availability
Large or moderate increase in availability
Business does not rely on suppliers
EXPECTED IMPACT OF THE PANDEMIC ON TOTAL SALES FOR 20201 (% of employer firms)
Asian N=660
Black N=1,163
Hispanic N=852
White N=6,832
IncreaseNo changeDecrease of 25% or less/unsure of degree of decline
Decrease of more than 25%
3% 5%7%
10%8%4%
8% 10%
24%21%
25%29%
69%65%
60%
50%

8SMALL BUSINESS CREDIT SURVEY | 2021 REPORT ON FIRMS OWNED BY PEOPLE OF COLOR
PERFORMANCE & CHALLENGESFinancial Challenges, Prior 12 Months
Firms owned by people of color were more likely than white-owned firms to report their firms experienced financial challenges in the prior 12 months.
1 Prior 12 months is approximately the second half of the prior year through the second half of the surveyed year.2 Respondents could select multiple options.3 Select options shown. See Appendix for more detail.4 Approximately the second half of 2019 through the second half of 2020.
SHARE OF FIRMS WITH FINANCIAL CHALLENGES, Prior 12 Months1 (% of employer firms)
TYPES OF FINANCIAL CHALLENGES, Prior 12 Months2,3,4 (% of employer firms)
Asian N=660
Black N=1,178
Hispanic N=853
White N=6,847
75% 74%
64% 63%58%
51% 51%
40%
51%
59%
50%
42% 40%
53%
37%
30%
Credit availabilityMaking payments on debt
Paying rentPaying operating expenses
2017 Survey 2018 Survey 2019 Survey 2020 Survey
Black N=465–1,178
Asian N=196–660
Hispanic N=420–853
White N=3,952–6,847
71%
83%
66%
62%
69%
78%
69%
62%
78%
85%
70%
65%
85%
92%
89%
79%

9SMALL BUSINESS CREDIT SURVEY | 2021 REPORT ON FIRMS OWNED BY PEOPLE OF COLOR
PERFORMANCE & CHALLENGESCoping with Financial Challenges and Use of Personal Funds
Black small-business owners were most likely to have used personal funds in response to their firms’ financial challenges.
1 Respondents could select multiple options.2 Approximately the second half of 2019 through the second half of 2020.3 Select response options shown. See Appendix for more detail.4 Dataonpersonalfinancesweredrawnfromquestionsintheoptionalend-of-surveymodule(completedbyapproximately80%ofrespondents).
Thissubsetofrespondentsisre-weightedtobereflectiveoftheoverallsmall-firmpopulation.
ACTIONS TAKEN TO ADDRESS FINANCIAL CHALLENGES, Prior 12 Months1,2,3 (% of employer firms reporting financial challenges)
EFFECTS OF THE FIRMS’ FINANCIAL CHALLENGES ON THE PRIMARY OWNERS' PERSONAL FINANCES1,2,3,4 (% of employer firms)
Black N=1,079
Asian N=587
Hispanic N=736
White N=5,404
Took out debt
Obtained funds through grants, crowdfunding, donations, etc.
Cut staff, hours, and/or downsized operations
Used personal funds
49% 36%
43% 51%
59%40%
46%52%
59%53%
57%54%
65%74%
65%61%
Black N=748
Asian N=387
Hispanic N=552
White N=5,031
No challenges or no impact on personal finances
Worked a second job or extra hours outside of this business
Borrowed funds from spouse/other family or friends
Concerns about personal credit score or loss personal assets due to late payments
Did not draw a salary/ reduced salary
10%7%
14%22%
16%25%
16%13%
34%38%
32%18%
37%46%
34%23%
64%63%
61%63%
One in five white-owned firms reported no impact on the owners’ personal finances.
Nearly half of Black-owned firms reported concerns about personal credit scores or the loss of personal assets.

10SMALL BUSINESS CREDIT SURVEY | 2021 REPORT ON FIRMS OWNED BY PEOPLE OF COLOR
FINANCIAL CONDITION, At Time of Survey1,2 (% of employer firms)
Poor Fair Good Very good Excellent
PERFORMANCE & CHALLENGESFinancial Condition
Asian-owned firms were approximately twice as likely as white-owned firms to report their firms were in poor financial condition.
1 Percentages may not sum to 100 due to rounding.2 At time of survey, September through October 2020.
White N=6,865
20% 34% 26% 13% 7%
Asian N=663
43% 36% 15% 4% 2%
Black N=1,178
35% 42% 17% 4% 2%
Hispanic N=852
28% 39% 25% 6% 3%

11SMALL BUSINESS CREDIT SURVEY | 2021 REPORT ON FIRMS OWNED BY PEOPLE OF COLOR
EMERGENCY FUNDINGPandemic-Related Emergency Funding Applications
Paycheck Protection Program (PPP) loans were the most common form of emergency assistance funding firms sought, overall. Black-owned firms were least likely to apply for PPP loans.
1 ThePaycheckProtectionProgram(PPP)andEconomicInjuryDisasterLoan(EIDL)areadministeredthroughtheUSSmallBusinessAdministration. Main Street Lending Program option not shown. See Appendix for more detail.
2 Respondents could select multiple options.
APPLICATIONS FOR EMERGENCY ASSISTANCE FUNDS1,2 (% of employer firms)
Asian N=659
White N=6,804
Hispanic N=834
Black N=1,162
Asian-owned firms disproportionately sought grants during the pandemic.
Did not complete emergency assistance funding application
6%
10%
12%
9%
Grant from state/local government fund
EIDL grant
EIDL loan
PPP loan
Loan from state/local government fund
8%
10%
9%
7%
42%
28%
24%
26%
45%
41%
32%
34%
60%
61%
52%
45%
85%
61%
73%
82%
Only 6 in 10 Black-owned firms applied for a PPP loan. They were just as likely to apply for an EIDL loan as a PPP loan.
12SMALL BUSINESS CREDIT SURVEY | 2021 REPORT ON FIRMS OWNED BY PEOPLE OF COLOR
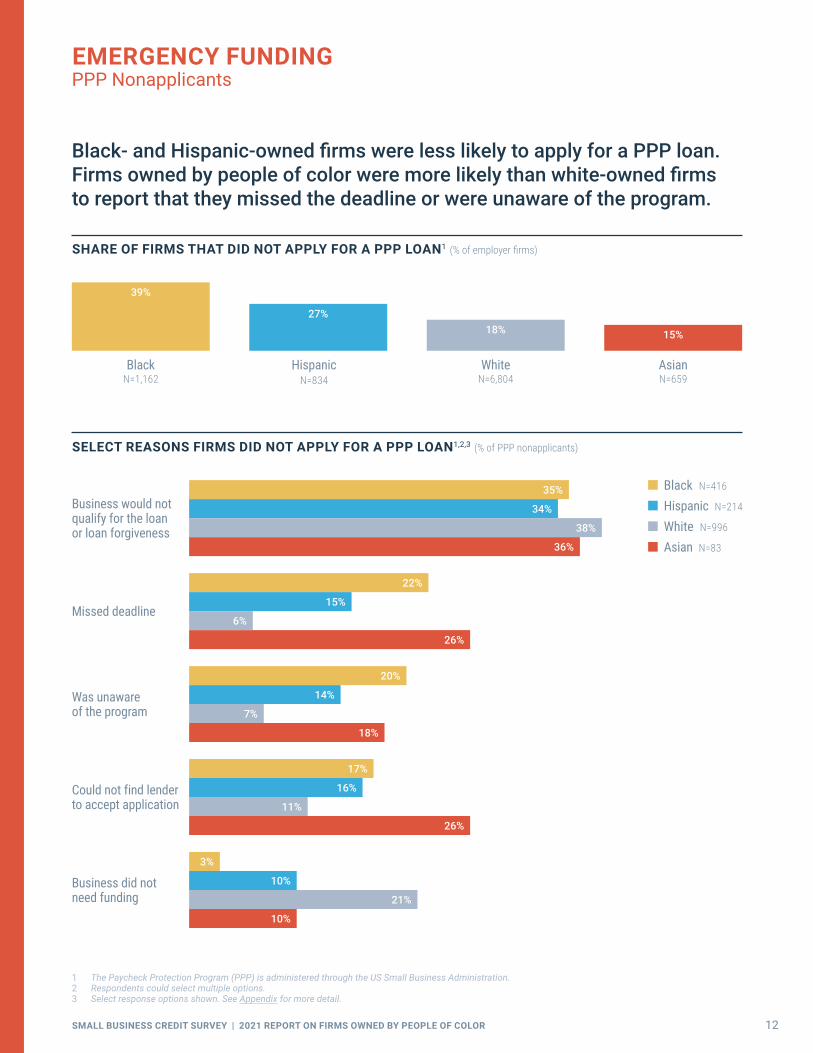
EMERGENCY FUNDINGPPP Nonapplicants
1 ThePaycheckProtectionProgram(PPP)isadministeredthroughtheUSSmallBusinessAdministration.2 Respondents could select multiple options.3 Select response options shown. See Appendix for more detail.
Black- and Hispanic-owned firms were less likely to apply for a PPP loan. Firms owned by people of color were more likely than white-owned firms to report that they missed the deadline or were unaware of the program.
SELECT REASONS FIRMS DID NOT APPLY FOR A PPP LOAN1,2,3 (% of PPP nonapplicants)
Black N=416
Hispanic N=214
White N=996
Asian N=83
Business did not need funding
10%
3%
10%
21%
Could not find lender to accept application
26%
17%
16%
11%
Was unaware of the program
18%
20%
14%
7%
Missed deadline
26%
22%
15%
6%
Business would not qualify for the loan or loan forgiveness
36%
35%
34%
38%
SHARE OF FIRMS THAT DID NOT APPLY FOR A PPP LOAN1 (% of employer firms)
39%
27%18% 15%
BlackN=1,162
Hispanic N=834
White N=6,804
Asian N=659
13SMALL BUSINESS CREDIT SURVEY | 2021 REPORT ON FIRMS OWNED BY PEOPLE OF COLOR
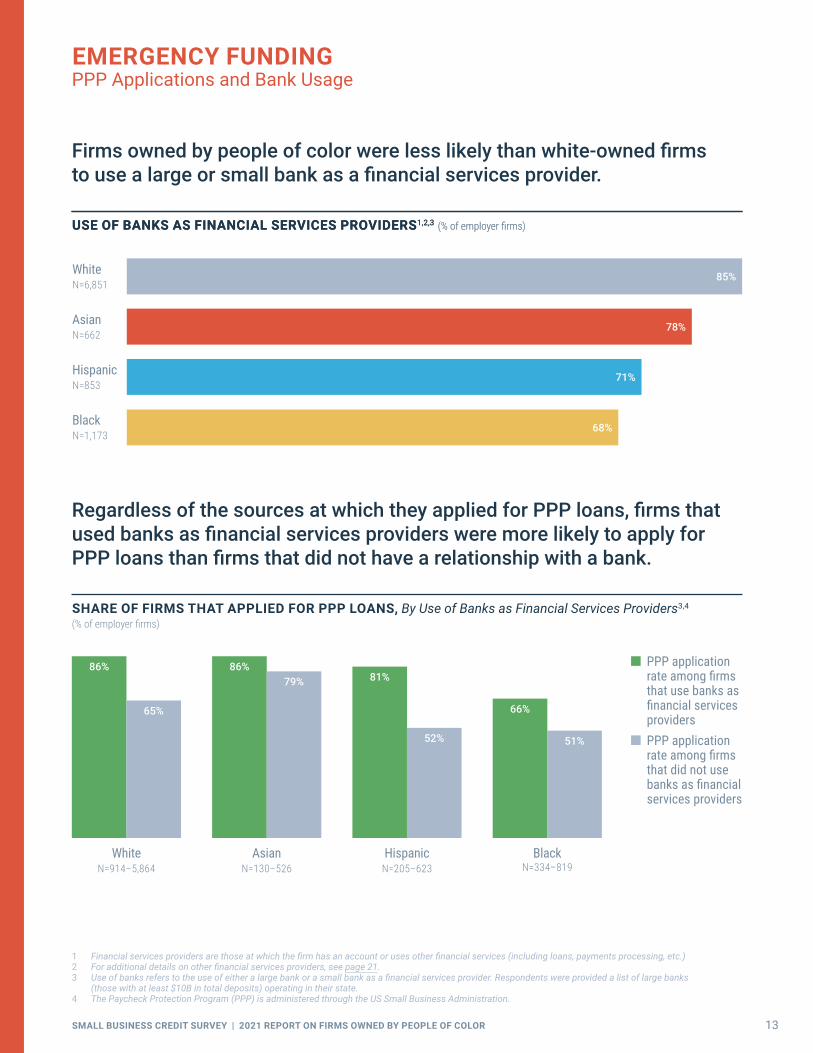
EMERGENCY FUNDINGPPP Applications and Bank Usage
Firms owned by people of color were less likely than white-owned firms to use a large or small bank as a financial services provider.
USE OF BANKS AS FINANCIAL SERVICES PROVIDERS1,2,3 (% of employer firms)
Regardless of the sources at which they applied for PPP loans, firms that used banks as financial services providers were more likely to apply for PPP loans than firms that did not have a relationship with a bank.
Black N=1,173
68%
White N=6,851
85%
Asian N=662
78%
Hispanic N=853
71%
1 Financialservicesprovidersarethoseatwhichthefirmhasanaccountorusesotherfinancialservices(includingloans,paymentsprocessing,etc.)2 Foradditionaldetailsonotherfinancialservicesproviders,seepage 21.3 Useofbanksreferstotheuseofeitheralargebankorasmallbankasafinancialservicesprovider.Respondentswereprovidedalistoflargebanks
(thosewithatleast$10Bintotaldeposits)operatingintheirstate.4 ThePaycheckProtectionProgram(PPP)isadministeredthroughtheUSSmallBusinessAdministration.
SHARE OF FIRMS THAT APPLIED FOR PPP LOANS, By Use of Banks as Financial Services Providers3,4 (% of employer firms)
PPP application rate among firms that use banks as financial services providers
PPP application rate among firms that did not use banks as financial services providers
66%
51%
Black N=334–819
81%
52%
Hispanic N=205–623
86%79%
Asian N=130–526
86%
65%
White N=914–5,864
USE OF BANKS AS FINANCIAL SERVICES PROVIDERS1,2,3 (% of employer firms)

14SMALL BUSINESS CREDIT SURVEY | 2021 REPORT ON FIRMS OWNED BY PEOPLE OF COLOR
EMERGENCY FUNDINGPPP Applications by Source
While firms across race and ethnicity were similarly likely to apply for PPP loans at large banks, white- and Asian-owned firms more often applied at small banks than did Black- and Hispanic-owned firms.
PPP APPLICATIONS AT SOURCE1,2,3 (% of employer firm PPP applicants)
1 Response option “other” not shown. See Appendix for more detail.2 ThePaycheckProtectionProgram(PPP)isadministeredthroughtheUSSmallBusinessAdministration.3 Respondents could select multiple options; respondents may have submitted more than one application.4 Respondentswereprovidedalistoflargebanks(thosewithatleast$10Bintotaldeposits)operatingintheirstate.5 “Onlinelenders,”alsocalledfintechlenders,arenonbanksthatlendonline.ExamplesincludeLendingClub,OnDeck,CANCapital,PaypalWorkingCapital,
Kabbage, etc.6 “Financecompany”includesnonbanklenderssuchasmortgagecompanies,equipmentdealers,insurancecompanies,autofinancecompanies,etc.7 Communitydevelopmentfinancialinstitutions(CDFIs)arefinancialinstitutionsthatprovidecreditandfinancialservicestounderservedmarkets
andpopulations.CDFIsarecertifiedbytheCDFIFundattheUSDepartmentoftheTreasury.
White N=5,733
Asian N=565
Hispanic N=616
Black N=709
Credit union
Online lender5
Large bank4
Small bank
Finance company6
CDFI72%
6%
4%
2%
2%
4%
7%
3%
3%
8%
5%
6%
9%
24%
11%
8%
46%
46%
48%
42%
44%
31%
34%
50%
White-owned firms were most likely to apply for a PPP loan through a small bank.
Black-owned firms were three times as likely as white-owned firms to apply for a PPP loan through an online lender.
15SMALL BUSINESS CREDIT SURVEY | 2021 REPORT ON FIRMS OWNED BY PEOPLE OF COLOR
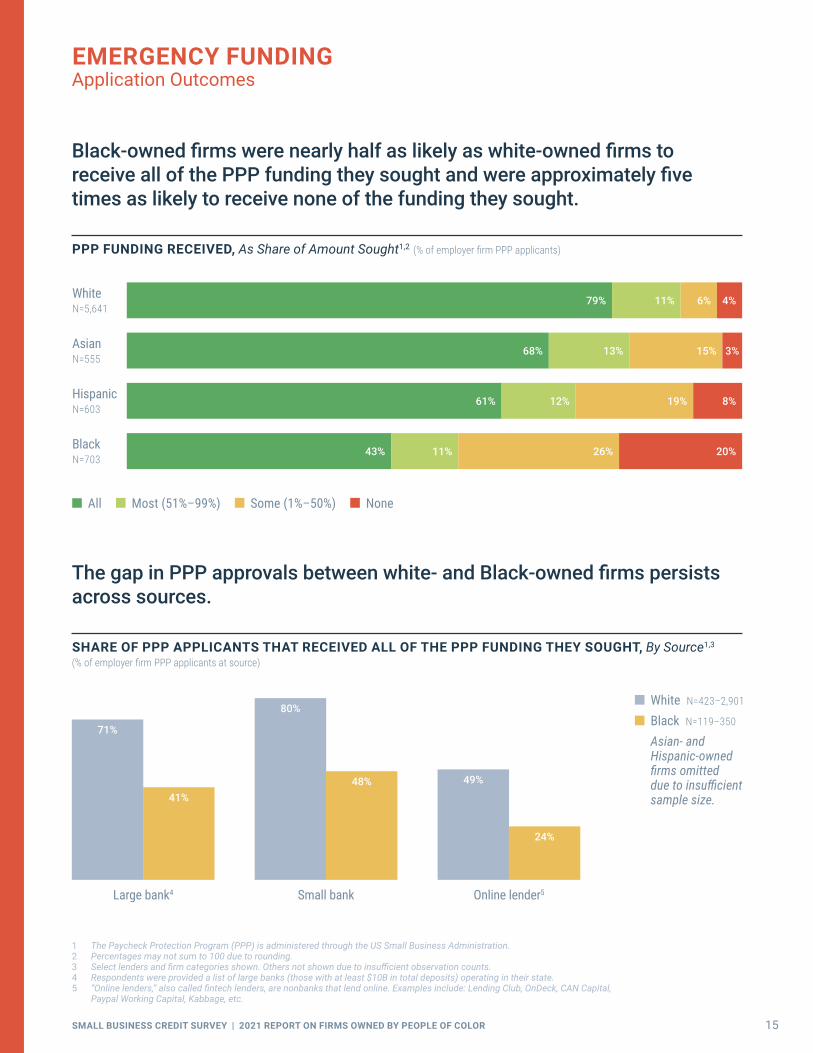
EMERGENCY FUNDINGApplication Outcomes
Black-owned firms were nearly half as likely as white-owned firms to receive all of the PPP funding they sought and were approximately five times as likely to receive none of the funding they sought.
1 ThePaycheckProtectionProgram(PPP)isadministeredthroughtheUSSmallBusinessAdministration.2 Percentages may not sum to 100 due to rounding.3 Selectlendersandfirmcategoriesshown.Othersnotshownduetoinsufficientobservationcounts.4 Respondentswereprovidedalistoflargebanks(thosewithatleast$10Bintotaldeposits)operatingintheirstate.5 “Onlinelenders,”alsocalledfintechlenders,arenonbanksthatlendonline.Examplesinclude:LendingClub,OnDeck,CANCapital,
Paypal Working Capital, Kabbage, etc.
PPP FUNDING RECEIVED, As Share of Amount Sought1,2 (% of employer firm PPP applicants)
All Most (51%–99%) Some (1%–50%) None
Black N=703
White N=5,641
Asian N=555
Hispanic N=603
43% 11% 26% 20%
61% 12% 19% 8%
68% 13% 15% 3%
79% 11% 6% 4%
The gap in PPP approvals between white- and Black-owned firms persists across sources.
SHARE OF PPP APPLICANTS THAT RECEIVED ALL OF THE PPP FUNDING THEY SOUGHT, By Source1,3 (% of employer firm PPP applicants at source)
49%
24%
Online lender5
80%
48%
Small bank
71%
41%
Large bank4
White N=423–2,901
Black N=119–350
Asian- and Hispanic-owned firms omitted due to insufficient sample size.

16SMALL BUSINESS CREDIT SURVEY | 2021 REPORT ON FIRMS OWNED BY PEOPLE OF COLOR
LOOKING AHEADPerformance Expectations, Next 12 Months
Black-owned firms were more likely than other firms to expect increases in revenues and employment, while Asian-owned firms were less optimistic about growth in the next 12 months.
1 Next 12 months is approximately the second half of 2020 through the second half of 2021.2 Percentages may not sum to 100 due to rounding.3 The index is the share reporting expected growth minus the share reporting a reduction. 4 Expected change in approximately the second half of the surveyed year through the second half of the following year.
EMPLOYER FIRM EXPECTATIONS (% of employer firms)
Will increase No change Will decrease
REVENUE CHANGE, Next 12 Months1,2
EMPLOYMENT CHANGE, Next 12 Months1,2
Asian N=642
21% 52% 27%
Hispanic N=821
34% 49% 17%
42% 39% 19%Black N=1,121
23% 63%14%Asian N=660
38%42% 20%White N=6,832
41% 39%21%Hispanic N=849
48% 37%15%Black N=1,169
31% 53% 15%White N=6,725
Asian-owned firms saw the largest year-on-year drop in their revenue growth expectations.
EMPLOYER FIRM REVENUE EXPECTATIONS INDEX, Next 12 Months3,4 (% of employer firms)
2020 Survey
-40%
2019 Survey 2018 Survey 2017 Survey 2016 Survey
10%2% 3%
47%
69%63% 59%53%
74%70% 64%61%75%76%
64%58%
78%70%
57%
Asian N=192–660 Hispanic N=408–849 White N=3,852–7,892 Black N=448–1,169
17SMALL BUSINESS CREDIT SURVEY | 2021 REPORT ON FIRMS OWNED BY PEOPLE OF COLOR
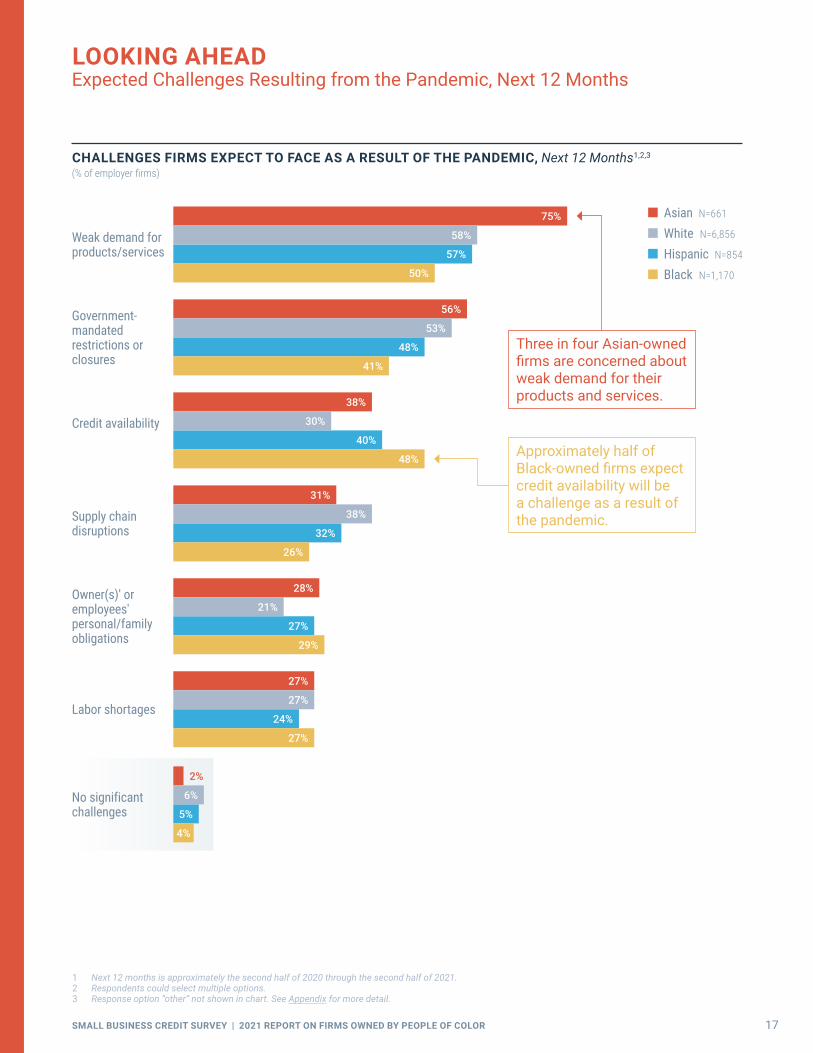
LOOKING AHEADExpected Challenges Resulting from the Pandemic, Next 12 Months
1 Next 12 months is approximately the second half of 2020 through the second half of 2021.2 Respondents could select multiple options.3 Response option “other” not shown in chart. See Appendix for more detail.
CHALLENGES FIRMS EXPECT TO FACE AS A RESULT OF THE PANDEMIC, Next 12 Months1,2,3 (% of employer firms)
Asian N=661
White N=6,856
Hispanic N=854
Black N=1,170
Supply chain disruptions
Credit availability
Government- mandated restrictions or closures
Weak demand for products/services
Owner(s)′ or employees′ personal/family obligations
Labor shortages
No significant challenges
27%
24%
27%
27%
2%
5%
4%
6%
28%
27%
29%
21%
31%
32%
26%
38%
38%
40%
48%
30%
56%
48%
41%
53%
75%
57%
50%
58%
Three in four Asian-owned firms are concerned about weak demand for their products and services.
Approximately half of Black-owned firms expect credit availability will be a challenge as a result of the pandemic.

18SMALL BUSINESS CREDIT SURVEY | 2021 REPORT ON FIRMS OWNED BY PEOPLE OF COLOR
LOOKING AHEADSurvival Expectations
At the time of the survey, 81% of Asian-owned firms expected that sales would not return to normal until at least the second half of 2021.
EXPECTED TIMING OF SALES’ RETURN TO “NORMAL” (I.E., 2019 LEVELS)1,2,3 (% of employer firms)
Black N=767
Hispanic N=571
Asian N=400
White N=5,203
4%9%
16% 17%
38%
20% 22%
29%
2022 or later
43%
52%
42% 41%
Second half of 2021
15%19% 20%
14%
First half of 2021Already normal/ end of 2020
LIKELIHOOD FIRMS WILL SURVIVE WITHOUT ADDITIONAL GOVERNMENT ASSISTANCE UNTIL SALES RETURN TO NORMAL1,2 (% of employer firms for which sales had not yet returned to normal)
1 Percentages may not sum to 100 due to rounding.2 Dataonsalesrecoveryandfirmsurvivalexpectationsweredrawnfromquestionsintheoptionalend-of-surveymodule(completedbyapproximately
80%ofrespondents).Thissubsetofrespondentsisre-weightedtobereflectiveoftheoverallsmall-firmpopulation.3 At time of survey, September through October 2020.
Very unlikely Somewhat unlikely Neither likely nor unlikely Somewhat likely Very likely
White N=4,571
Black N=726
Hispanic N=535
Asian N=388
11% 19% 13% 29% 28%
17% 17% 11% 34% 20%
14% 16% 18% 32% 21%
13% 22% 14% 30% 20%

19SMALL BUSINESS CREDIT SURVEY | 2021 REPORT ON FIRMS OWNED BY PEOPLE OF COLOR
61% 21% 17%
72% 15% 14%
77% 15% 8%
81% 14% 5%
LOOKING AHEADPlans to Apply for Emergency Assistance in the Future
Firms owned by people of color were more likely than white-owned firms to report that they would apply for future government-provided emergency assistance it if was made available.
FIRMS’ PLANS TO APPLY FOR FUTURE GOVERNMENT-PROVIDED EMERGENCY ASSISTANCE FUNDING IF IT WAS MADE AVAILABLE1,2 (% of employer firms)
Would apply Unsure Would not apply
White N=6,871
Asian N=665
Black N=1,177
Hispanic N=859
1 Percentages may not sum to 100 due to rounding.2 The survey was administered in September and October of 2020, after the close of 2020 PPP funding and prior to the announcement of new PPP funding.
Therefore,respondentswereaskedabouttheirfirms’intenttoapplyforhypothetical,undefinedfuturegovernment-providedfunding.
20SMALL BUSINESS CREDIT SURVEY | 2021 REPORT ON FIRMS OWNED BY PEOPLE OF COLOR
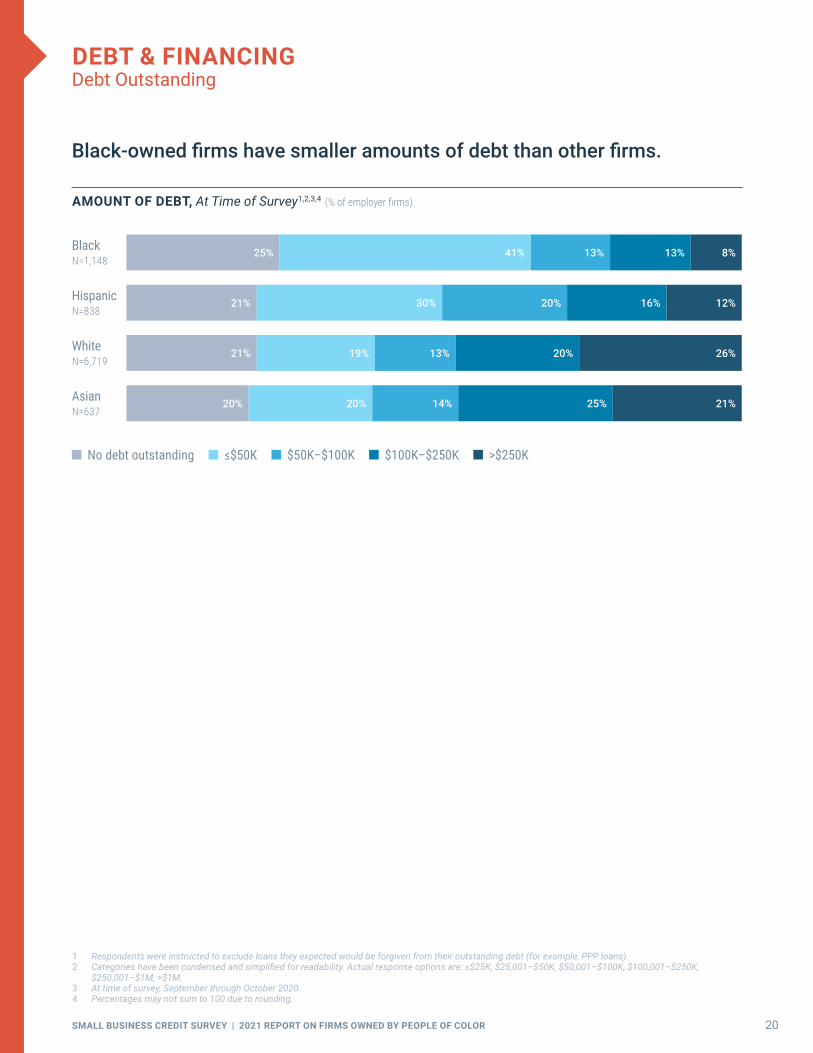
DEBT & FINANCINGDebt Outstanding
Black-owned firms have smaller amounts of debt than other firms.
1 Respondentswereinstructedtoexcludeloanstheyexpectedwouldbeforgivenfromtheiroutstandingdebt(forexample,PPPloans).2 Categorieshavebeencondensedandsimplifiedforreadability.Actualresponseoptionsare:≤$25K,$25,001–$50K,$50,001–$100K,$100,001–$250K,
$250,001–$1M,>$1M.3 At time of survey, September through October 2020.4 Percentages may not sum to 100 due to rounding.
AMOUNT OF DEBT, At Time of Survey1,2,3,4 (% of employer firms)
No debt outstanding ≤$50K $50K–$100K $100K–$250K >$250K
Asian N=637
Black N=1,148
Hispanic N=838
White N=6,719
25% 41% 13% 13% 8%
21% 30% 20% 16% 12%
21% 19% 13% 20% 26%
20% 20% 14% 25% 21%
21SMALL BUSINESS CREDIT SURVEY | 2021 REPORT ON FIRMS OWNED BY PEOPLE OF COLOR
DEBT & FINANCINGFinancial Services Providers
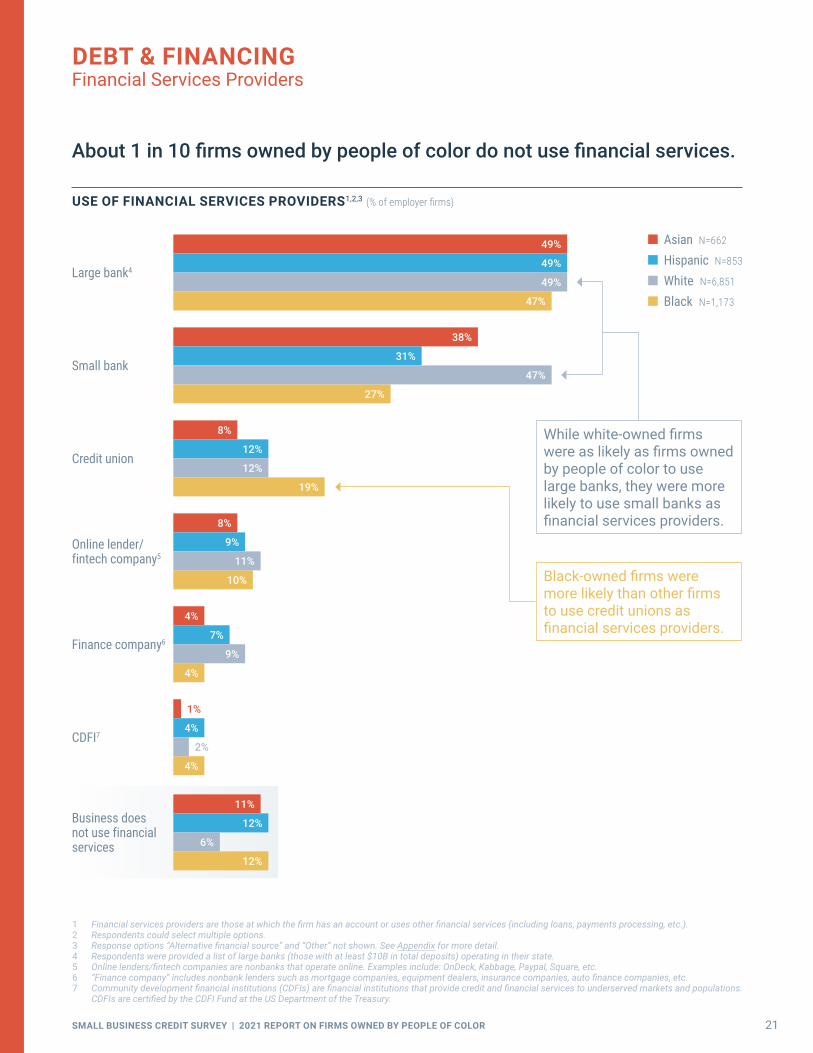
About 1 in 10 firms owned by people of color do not use financial services.
1 Financialservicesprovidersarethoseatwhichthefirmhasanaccountorusesotherfinancialservices(includingloans,paymentsprocessing,etc.).2 Respondents could select multiple options.3 Responseoptions“Alternativefinancialsource”and“Other”notshown.SeeAppendix for more detail.4 Respondentswereprovidedalistoflargebanks(thosewithatleast$10Bintotaldeposits)operatingintheirstate.5 Onlinelenders/fintechcompaniesarenonbanksthatoperateonline.Examplesinclude:OnDeck,Kabbage,Paypal,Square,etc.6 “Financecompany”includesnonbanklenderssuchasmortgagecompanies,equipmentdealers,insurancecompanies,autofinancecompanies,etc.7 Communitydevelopmentfinancialinstitutions(CDFIs)arefinancialinstitutionsthatprovidecreditandfinancialservicestounderservedmarketsandpopulations.
CDFIsarecertifiedbytheCDFIFundattheUSDepartmentoftheTreasury.
USE OF FINANCIAL SERVICES PROVIDERS1,2,3 (% of employer firms)
Online lender/ fintech company5
Credit union
Small bank
Large bank4
Finance company6
CDFI7
Business does not use financial services
Asian N=662
Hispanic N=853
White N=6,851
Black N=1,173
While white-owned firms were as likely as firms owned by people of color to use large banks, they were more likely to use small banks as financial services providers.
Black-owned firms were more likely than other firms to use credit unions as financial services providers.
1%
11%
12%
12%
6%
4%
2%
4%
4%
4%
7%
9%
8%
10%
9%
11%
8%
19%
12%
12%
38%
27%
31%
47%
49%
47%
49%
49%

22SMALL BUSINESS CREDIT SURVEY | 2021 REPORT ON FIRMS OWNED BY PEOPLE OF COLOR
DEBT & FINANCINGSatisfaction with Primary Financial Services Providers
Firms owned by people of color were less satisfied than white-owned firms with the support from their primary financial services provider during the pandemic. Regardless of owner race or ethnicity, firms were less satisfied with online lenders than with banks and credit unions.
SATISFACTION WITH SUPPORT FROM PRIMARY FINANCIAL SERVICES PROVIDER DURING THE PANDEMIC1,2 (% of employer firms that use provider)
1 Forthischart,"firmsofcolor"includesNativeAmerican-ownedfirms,inadditiontoBlack-,Asian-,andHispanic-ownedfirms.2 Satisfactionisavailableforonlyrespondents’primaryfinancialservicesproviders.Selectprovidersshown.SeeAppendix for details.3 Respondentswereprovidedalistoflargebanks(thosewithatleast$10Bintotaldeposits)operatingintheirstate.4 Onlinelenders/fintechcompaniesarenonbanksthatoperateonline.Examplesinclude:OnDeck,Kabbage,Paypal,Square,etc.
35% 39% 26%
43% 34% 23%
39% 41% 20%
65% 26% 9%
31% 38% 31%
52% 27% 20%
16% 34% 50%
19% 41% 40%
White N=2,589
Firms of color N=670
Small bank
White N=2,743
Firms of color N=1,150
Large bank3
White N=359
Firms of color N=216
Credit union
White N=218
Firms of color N=128
Online lender/fintech company4
Satisfied Neutral Dissatisfied

23SMALL BUSINESS CREDIT SURVEY | 2021 REPORT ON FIRMS OWNED BY PEOPLE OF COLOR
DEBT & FINANCINGDemand for Non-Emergency Financing, Prior 12 Months
Black-owned firms were more likely than other firms to apply for non-emergency financing in the 12 months prior to the survey.
1 Excludes emergency funding applications.2 Approximately the second half of 2019 through the second half of 2020.3 Categorieshavebeencondensedandsimplifiedforreadability.Actualresponseoptionsare:≤$25K,$25,001–$50K,$50,001–$100K,$100,001–$250K,
$250,001–$1M,>$1M.4 Percentages may not sum to 100 due to rounding.
SHARE THAT APPLIED FOR FINANCING, Prior 12 Months1,2 (% of employer firms) Application rate excludes PPP and other pandemic-related emergency funding applications.
46%
39%37% 36%
Black N=1,141
Hispanic N=812
White N=6,705
Asian N=645
One-quarter of Black- and Hispanic-owned firms that applied for financing sought $25,000 or less.
TOTAL AMOUNT OF FINANCING SOUGHT, Prior 12 Months1,2,3,4 (% of employer firm applicants)
≤$25K $25K–$100K >$100K
Asian N=244
Hispanic N=329
Black N=504
White N=2,430
9% 32% 58%
15% 32% 54%
25% 38% 37%
26% 41% 33%

24SMALL BUSINESS CREDIT SURVEY | 2021 REPORT ON FIRMS OWNED BY PEOPLE OF COLOR
DEBT & FINANCINGDemand for Non-Emergency Financing, Prior 12 Months (Continued)
In 2020, firms owned by people of color were more likely than white-owned firms to apply for financing to meet operating expenses.
1 Excludes emergency funding applications.2 Respondents could select multiple options.3 Select response options shown. See Appendix for more detail.
SELECT REASONS FOR APPLYING1,2,3 (% of employer firm applicants)
Black N=240–509 White N=1,839–2,426 Asian N=69–245 Hispanic N=205–331
Meet operating expenses (including wages, rent, etc.)
Expand business, pursue new opportunities, or acquire business assets
2020 Survey
2019 Survey
2020 Survey
2019 Survey
43%
64%
54%
38%
55%
68%
54%
39%
69%
58%
32%
35%
56%
63%
40%

25SMALL BUSINESS CREDIT SURVEY | 2021 REPORT ON FIRMS OWNED BY PEOPLE OF COLOR
DEBT & FINANCINGNonapplicants
In aggregate, 63% of all employer firms were nonapplicants, meaning they did not apply for non-emergency financing in the prior 12 months.1 The majority of nonapplicant firms owned by people of color needed funds but chose not to apply, compared to 44% of white-owned firms.
1 Approximately the second half of 2019 through the second half of 2020.2 Percentages may not sum to 100 due to rounding.3 Discouragedfirmsarethosethatdidnotapplyforfinancingbecausetheybelievedtheywouldbeturneddown.
REASONS FIRMS DID NOT APPLY FOR FINANCING2 (% of employer firm nonapplicants)
24%
26%
34%
5%
7%
4%
31%
32%
19%
9%
8%
38%
27%
19%
7%
5%
4%
56%
24%
10%
4%
3%
Had sufficient financing
Debt averse Discouraged3
Credit cost too high
Application process too difficult or confusing
Other
Black N=608
White N=4,108
Hispanic N=465
Asian N=381
1%
2%

26SMALL BUSINESS CREDIT SURVEY | 2021 REPORT ON FIRMS OWNED BY PEOPLE OF COLOR
DEBT & FINANCINGFinancing Needs and Outcomes
FUNDING NEEDS AND OUTCOMES
To gauge funding success and shortfalls, we combine applicants’ financing outcomes and nonapplicants’ reasons for not applying. Firms that had their funding needs met emerge in two forms:
1) Applicant firms that received the full amount of financing sought; or
2) Nonapplicant firms that did not apply for financing because they already had sufficient financing.
The remaining firms have unmet funding needs. When applicant firms did not obtain the full amount of financing sought, we consider them to have a financing shortfall. When nonapplicant firms reported they did not have sufficient financing, we consider them to have unmet funding needs.
The chart on the next page highlights differences in funding needs and outcomes by firm owners' race and ethnicity. We find that:
See chart on next page
Financing shortfalls were most common among Black-owned firms and least common among white-owned firms.
Most firms of color did not have their financing needs met, whereas half of white-owned firms did.
Firms of color, and particularly Asian-owned firms, were more likely than white-owned firms to have unmet funding needs.

27SMALL BUSINESS CREDIT SURVEY | 2021 REPORT ON FIRMS OWNED BY PEOPLE OF COLOR
DEBT & FINANCINGFinancing Needs and Outcomes (Continued)
FUNDING NEEDS AND OUTCOMES, Prior 12 Months1,2,3 (% of employer firms)
1 Prior 12 months is approximately the second half of 2019 through the second half of 2020.2 Excludes emergency funding applications.3 Percentages may not sum to the combined shares shown due to rounding.4 Discouragedfirmsarethosethatdidnotapplyforfinancingbecausetheybelievedtheywouldbeturneddown.5 Responseoption“other”includes“creditcostwastoohigh,”“applicationprocesswastoodifficultorconfusing,”and“other.”SeeAppendix for more detail.
White N=6,506
37% Applied
for financing
9% Received none 8% Received some 6% Received most
14% Received all
63% Did not apply for financing
36% Had sufficient financing
15% Debt averse 7% Discouraged4
6% Other5
22%
50%
28%
Black N=1,103
46% Applied
for financing
21% Received none14% Received some 4% Received most
6% Received all
54% Did not apply for financing
13% Had sufficient financing
14% Debt averse19% Discouraged4
9% Other5
39%
19%
42%
Asian N=622
36% Applied
for financing
8% Received none12% Received some 4% Received most
10% Received all
64% Did not apply for financing
20% Had sufficient financing
21% Debt averse12% Discouraged4
12% Other5
24%
31%
46%
Hispanic N=792
39% Applied
for financing
15% Received none11% Received some 4% Received most
8% Received all
61% Did not apply for financing
24% Had sufficient financing
17% Debt averse12% Discouraged4
10% Other5
31%
31%
38%
Had a financing shortfall Financing needs met Have unmet funding needs

28SMALL BUSINESS CREDIT SURVEY | 2021 REPORT ON FIRMS OWNED BY PEOPLE OF COLOR
DEBT & FINANCINGFinancing Received
1 Percentages may not sum to 100 due to rounding.2 Excludes emergency funding applications3 Creditriskisdeterminedbytheself-reportedbusinesscreditscoreorpersonalcreditscore,dependingonwhichisusedtoobtainfinancingfortheirbusiness.
Ifthefirmusesboth,thehigherriskratingisused.“Lowcreditrisk”isa80–100businesscreditscoreor720+personalcreditscore.“Mediumcreditrisk”is a50–79businesscreditscoreora620–719personalcreditscore.“Highcreditrisk”isa1–49businesscreditscoreora<620personalcreditscore.
Just 13% of Black-owned firms received all of the non-emergency financing they sought in the 12 months prior to the survey, compared to 40% of white-owned firms.
TOTAL FINANCING RECEIVED1,2 (% of employer firm applicants)
All Most (51%–99%) Some (1%–50%) None
Black N=495
White N=2,398
Asian N=241
Hispanic N=327
31% 12% 35% 23%
20% 11% 29% 39%
13% 9% 32% 46%
40% 16% 21% 24%
Black-owned firms with high credit scores were half as likely as their white counterparts to receive all of the non-emergency financing they sought.
TOTAL FINANCING RECEIVED BY CREDIT RISK OF FIRM1,2,3 (% of employer firm applicants)
All Some/Most None
LOW CREDIT RISK MEDIUM/HIGH CREDIT RISK
White N=604
21% 46% 34%
Asian N=56
15% 49% 35%
10% 40% 50%Black N=256
48% 21%31%White N=1,220
33%25% 42%Hispanic N=119
37% 20%44%Asian N=127
24% 36%41%Black N=128
16% 41% 44%Hispanic N=150
29SMALL BUSINESS CREDIT SURVEY | 2021 REPORT ON FIRMS OWNED BY PEOPLE OF COLOR
DEBT & FINANCINGFinancing Received (Continued)
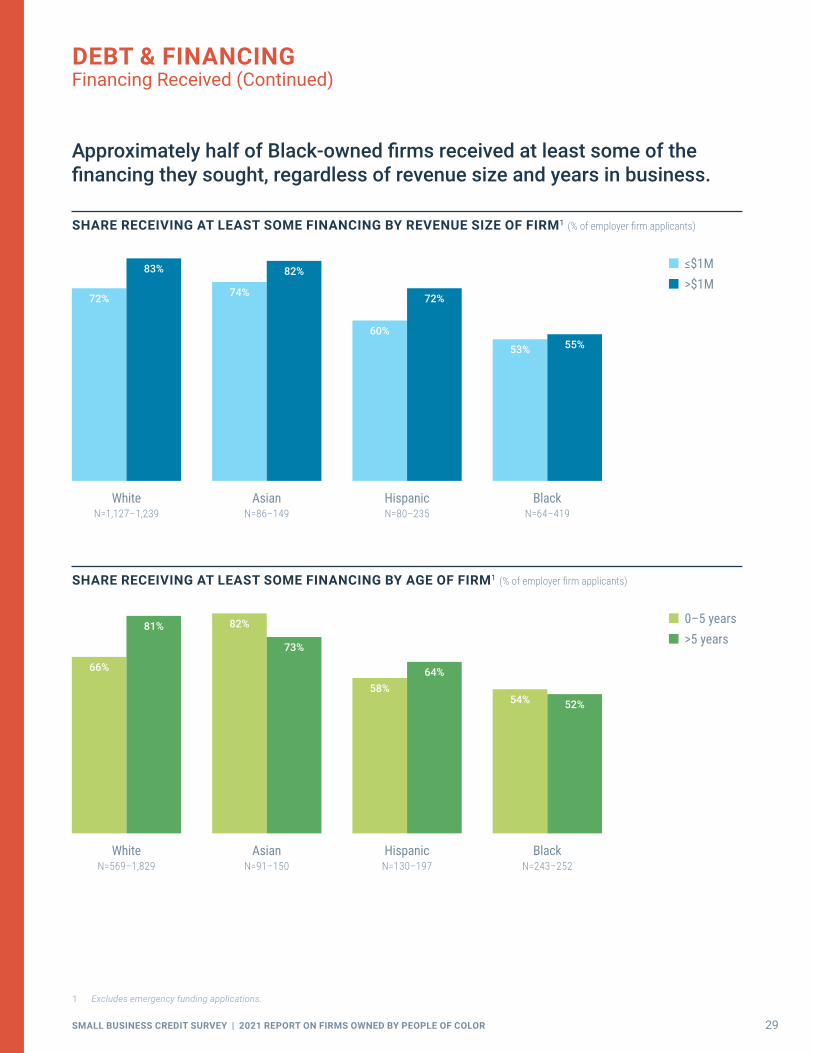
Approximately half of Black-owned firms received at least some of the financing they sought, regardless of revenue size and years in business.
1 Excludes emergency funding applications.
SHARE RECEIVING AT LEAST SOME FINANCING BY REVENUE SIZE OF FIRM1 (% of employer firm applicants)
≤$1M >$1M
Black N=64–419
Hispanic N=80–235
Asian N=86–149
White N=1,127–1,239
53% 55%60%
72%74%
82%
72%
83%
SHARE RECEIVING AT LEAST SOME FINANCING BY AGE OF FIRM1 (% of employer firm applicants)
0–5 years >5 years
Black N=243–252
Hispanic N=130–197
Asian N=91–150
White N=569–1,829
54% 52%58%
64%
82%
73%
66%
81%
30SMALL BUSINESS CREDIT SURVEY | 2021 REPORT ON FIRMS OWNED BY PEOPLE OF COLOR
FINANCING APPLICATIONSLoan, Line of Credit, and Cash Advance Applications
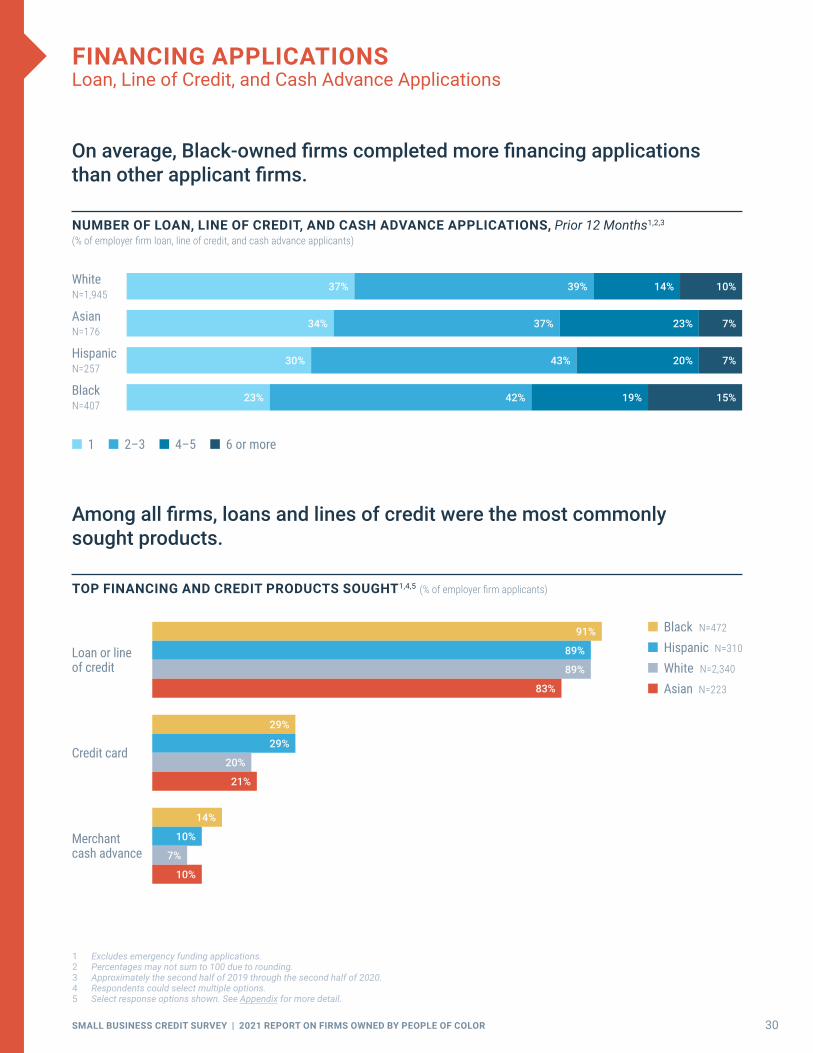
On average, Black-owned firms completed more financing applications than other applicant firms.
NUMBER OF LOAN, LINE OF CREDIT, AND CASH ADVANCE APPLICATIONS, Prior 12 Months1,2,3 (% of employer firm loan, line of credit, and cash advance applicants)
1 Excludes emergency funding applications.2 Percentages may not sum to 100 due to rounding.3 Approximately the second half of 2019 through the second half of 2020.4 Respondents could select multiple options.5 Select response options shown. See Appendix for more detail.
23% 42% 19% 15%
37% 39% 14% 10%
34% 37% 23% 7%
30% 43% 20% 7%
Among all firms, loans and lines of credit were the most commonly sought products.
TOP FINANCING AND CREDIT PRODUCTS SOUGHT1,4,5 (% of employer firm applicants)
Merchant cash advance
Credit card
Loan or line of credit
Black N=472
Hispanic N=310
White N=2,340
Asian N=223
91%
89%
89%
83%
29%
29%
20%
21%
14%
10%
7%
10%
White N=1,945
Hispanic N=257
Black N=407
Asian N=176
1 2–3 4–5 6 or more

31SMALL BUSINESS CREDIT SURVEY | 2021 REPORT ON FIRMS OWNED BY PEOPLE OF COLOR
FINANCING APPLICATIONSLoan, Line of Credit, and Cash Advance Applications (Continued)
Firms owned by people of color more often turned to large banks for financing, while white-owned firms more often applied to small banks.
1 Respondents could select multiple options.2 Excludes emergency funding applications.3 Response option “other” not shown in chart. See Appendix for more detail.4 Respondentswereprovidedalistoflargebanks(thosewithatleast$10Bintotaldeposits)operatingintheirstate.5 “Onlinelenders,”alsocalledfintechlenders,arenonbanksthatlendonline.Examplesinclude:LendingClub,OnDeck,CANCapital,PaypalWorkingCapital,
Kabbage, etc.6 “Financecompany”includesnonbanklenderssuchasmortgagecompanies,equipmentdealers,insurancecompanies,autofinancecompanies,etc.7 Communitydevelopmentfinancialinstitutions(CDFIs)arefinancialinstitutionsthatprovidecreditandfinancialservicestounderservedmarketsandpopulations.
CDFIsarecertifiedbytheCDFIFundattheUSDepartmentoftheTreasury.
CREDIT SOURCES APPLIED TO1,2,3 (% of employer firm loan, line of credit, and cash advance applicants)
Finance company6
Online lender5
Small bank
Large bank4
Credit union
CDFI7
Hispanic N=238
Black N=368
Asian N=165
White N=1,774
Hispanic-owned firms were most likely to apply to a large bank.
Black-owned firms were more likely than other firms to apply to an online lender.
11%
16%
4%
8%
57%
49%
42%
41%
3%
3%
7%
7%
27%
36%
40%
45%
17%
18%
13%
15%
22%
30%
19%
19%

32SMALL BUSINESS CREDIT SURVEY | 2021 REPORT ON FIRMS OWNED BY PEOPLE OF COLOR
FINANCING APPLICATIONSLoan, Line of Credit, and Cash Advance Approvals
Black-owned applicant firms were half as likely as white-owned applicant firms to be fully approved for loans, lines of credit, and cash advances.
1 Percentages may not sum to 100 due to rounding.2 Excludes emergency funding applications.3 Approximately the second half of the prior year through the second half of the surveyed year.
OUTCOMES OF LOAN, LINE OF CREDIT, AND MERCHANT CASH ADVANCE APPLICANTS, Prior 12 Months1,2,3 (% of employer firm loan, line of credit, and cash advance applicants)
Fully approved Partially approved Denied
Black N=350
White N=1,688
Asian N=155
Hispanic N=226
55% 23% 22%
32% 29% 39%
24% 27% 49%
45% 26% 30%
SHARE OF LOAN, LINE OF CREDIT, AND MERCHANT CASH ADVANCE APPLICANTS THAT WERE AT LEAST PARTIALLY APPROVED, Prior 12 Months2,3 (% of employer firm loan, line of credit, and cash advance applicants)
White N=1,407–2,129
Asian N=61–155
Hispanic N=150–226
Black N=192–350
2017 Survey 2018 Survey 2019 Survey 2020 Survey
66%
80%
57%
81%
68%
77%
67%
84%
73%
79%
64%
84%
61%
71%
51%
78%

33SMALL BUSINESS CREDIT SURVEY | 2021 REPORT ON FIRMS OWNED BY PEOPLE OF COLOR
29%
58%
36%
68%
45%
75%
34%
65%
77%
40%
FINANCING APPLICATIONSLoan, Line of Credit, and Cash Advance Approvals (Continued)
SHARE OF LOAN, LINE OF CREDIT, AND MERCHANT CASH ADVANCE APPLICANTS THAT WERE AT LEAST PARTIALLY APPROVED, By Source1 (% of employer firm loan, line of credit, and cash advance applicants at source)
1 Excludes emergency funding applications.2 “Financecompany”includesnonbanklenderssuchasmortgagecompanies,equipmentdealers,insurancecompanies,autofinancecompanies,etc.3 “Onlinelenders,”alsocalledfintechlenders,arenonbanksthatlendonline.Examplesinclude:LendingClub,OnDeck,CANCapital,PaypalWorkingCapital,
Kabbage, etc.4 Respondentswereprovidedalistoflargebanks(thosewithatleast$10Bintotaldeposits)operatingintheirstate.
White N=109–737
Black N=52–167
Asian- and Hispanic-owned firms omitted due to insufficient sample size.
The share of white-owned applicant firms that were fully approved fell after the onset of the pandemic but still remained higher than the pre-pandemic share of Black- and Hispanic-owned applicant firms that were fully approved.
LOAN, LINE OF CREDIT, AND CASH ADVANCE APPLICANTS RECEIVING ALL FINANCING SOUGHT, Before and After March 1, 20201 (% of employer firm loan, line of credit, and cash advance applicants)
Before March 1, 2020
After March 1, 2020
Hispanic N=113–152
Black N=113–283
Asian N=71–104
White N=827–1,120
31% 31%32%
20%
58%
35%
63%
47%
Large bank4
Online lender3
Small bank
Finance company2
Credit union

34SMALL BUSINESS CREDIT SURVEY | 2021 REPORT ON FIRMS OWNED BY PEOPLE OF COLOR
NONEMPLOYER FIRMS
1 USSmallBusinessAdministrationOfficeofAdvocacy.“2020SmallBusinessProfile.”cdn.advocacy.sba.gov/wp-content/uploads/2020/06/04144224/ 2020-Small-Business-Economic-Profile-US.pdf.
2 Based on authors’ calculations of the US Census Bureau, 2012 Survey of Business Owners.3 Based on authors’ calculations of the 2020 Small Business Credit Survey.
FINDINGS FOR NONEMPLOYER FIRMS
Nonemployer firms—firms that have no paid employees other than the owner(s)—represent the overwhelming majority of small businesses across the country. In fact, of the 31.7 million small businesses across the country, 25.7 million of them are nonemployer firms.1 Moreover, a disproportionate share of firms owned by people of color are nonemployer firms. In all, 96% and 91% of Black- and Hispanic- owned firms are nonemployer firms, respectively, compared to 78% and 75% of white- and Asian-owned firms.2 Therefore, pandemic-related challenges faced by the nonemployer firms outlined in this section of the report are particularly relevant for firms of color.
A future report will describe findings from the 2020 SBCS for nonemployers in greater detail, but given the share of firms of color that are nonemployers, these data are helpful to understanding the pandemic’s impact on firms owned by people of color.
According to the 2020 SBCS, nonemployer firms were more likely to be in poor or fair financial condition, were less likely to have successfully accessed emergency funding, and reported poorer outcomes when applying for financing than small employer firms. The challenges facing these firms are significant because for 59% of nonemployers, the firms are the primary source of income for the owners’ households.3 Other key findings include:
Approximately half of Asian-owned nonemployer firms reported poor financial conditions. They were most likely among all firms to apply for emergency assistance funding in response to the pandemic.
Just 3 in 10 Black-owned nonemployer firms applied for a PPP loan, and those nonemployer firms were less likely than their employer firm counterparts to receive all of the PPP funds they sought.
Eighty-seven percent of Hispanic-owned nonemployer firms expected sales declines through 2020 due to the pandemic.
While white-owned nonemployer firms encountered fewer financial difficulties than nonemployers of color, they reported worse financial conditions than white-owned employer firms.

35SMALL BUSINESS CREDIT SURVEY | 2021 REPORT ON FIRMS OWNED BY PEOPLE OF COLOR
NONEMPLOYER FIRMSPandemic Sales Impact and Financial Condition
Compared to other nonemployer firms, Asian-owned nonemployer firms reported the most significant impact on sales as a result of the pandemic. They were most likely to report their firm was in “poor” financial condition at the time of the survey.
EXPECTED IMPACT OF THE PANDEMIC ON TOTAL SALES FOR 20201 (% of nonemployer firms)
1 Percentages may not sum to 100 due to rounding.2 At time of survey, September through October 2020.
Asian N=252
Hispanic N=401
White N=2,887
Black N=824
7% 7%5% 4%
Increase
9%13% 13%5%
No change
12%
25%22% 24%
Decrease of 25% or less/unsure of degree of decline
78%
62%59%
56%
Decrease of more than 25%
FINANCIAL CONDITION, At Time of Survey1,2 (% of nonemployer firms)
Poor Fair Good Very good Excellent
White N=2,946
Asian N=257
Hispanic N=410
Black N=841
52% 34% 10% 3%
28% 37% 23% 9% 4%
36% 45% 13% 5%
38% 39% 16% 6%
<1%
1%
1%

36SMALL BUSINESS CREDIT SURVEY | 2021 REPORT ON FIRMS OWNED BY PEOPLE OF COLOR
NONEMPLOYER FIRMSFinancial Challenges, Prior 12 Months
Nonemployer firms of color were more likely than white-owned firms to experience financial challenges in the 12 months prior to the survey.
1 Approximately the second half of 2019 through the second half of 2020.2 Respondents could select multiple options.3 Select options shown. See Appendix for more detail.
25%
35%
25%
44%
61%59%
54% 53%
29%
35%
27%
35%
48%
41%
29%
39%42%
48%
40%
46%
TYPES OF FINANCIAL CHALLENGES, Prior 12 Months1,2,3 (% of nonemployer firms)
Credit availabilityPurchasing inventory to fulfill contracts
Making payments on debt
Paying rentPaying operating expenses
Asian N=256 Hispanic N=409 White N=2,942 Black N=843
SHARE OF FIRMS WITH FINANCIAL CHALLENGES, Prior 12 Months1 (% of nonemployer firms)
White N=2,942
78%
Hispanic N=409
89%
Black N=843
88%
Asian N=256
87%

37SMALL BUSINESS CREDIT SURVEY | 2021 REPORT ON FIRMS OWNED BY PEOPLE OF COLOR
NONEMPLOYER FIRMSPandemic-Related Emergency Funding Applications
Approximately 3 in 10 nonemployer firm owners applied for enhanced unemployment insurance benefits; Asian firm owners most often applied.
1 The CARES Act gives states the option of extending unemployment compensation to independent contractors and other self-employed workers who areordinarilyineligibleforunemploymentbenefits.
2 ThePaycheckProtectionProgram(PPP)andEconomicInjuryDisasterLoan(EIDL)areadministeredthroughtheUSSmallBusinessAdministration.3 Respondents could select multiple options. 4 Select response options shown. See Appendix for more detail.5 Excludesenhancedunemploymentinsurancebenefits.
FIRM OWNERS’ APPLICATIONS FOR ENHANCED UNEMPLOYMENT INSURANCE BENEFITS1 (% of nonemployer firms)
Asian-owned nonemployer firms had higher application rates than other nonemployer firms across the most common emergency assistance funds.
APPLICATION FOR EMERGENCY ASSISTANCE FUNDS2,3,4,5 (% of nonemployer firms)
22%
35% 34%32%
45%
35%33%
29% 29%
20% 21% 22%
46%
34%
41%43% 42%
28%26%
33%
Did not complete emergency assistance funding applications
Grant from state/local government fund
EIDL grantEIDL loanPPP loan
Asian N=249 White N=2,892 Hispanic N=397 Black N=809
White N=2,691
29%
Asian N=234
45%
Hispanic N=376
30%
Black N=765
29%

38SMALL BUSINESS CREDIT SURVEY | 2021 REPORT ON FIRMS OWNED BY PEOPLE OF COLOR
NONEMPLOYER FIRMSPPP Application Sources and Outcomes
Black-owned nonemployer firms that applied for PPP loans were less likely than other firms to apply at banks and more often turned to online lenders.
PPP APPLICATIONS AT SOURCE1,2,3 (% of nonemployer PPP applicants)
Hispanic N=127 White N=947 Asian N=104 Black N=201
6% 6%
Finance company6
3%4% 3%4%7% 7%
CDFI7
7% 7%
14%
Credit union
19% 19%
26%
Online lender5
25%
38% 36%
23%
Small bank
45%41% 41%
37%
Large bank4
Among PPP applicants, white-owned nonemployer firms were twice as likely as Black-owned firms to receive all of the PPP funding they sought.
PPP FUNDING RECEIVED, As Share of Amount Sought1,8 (% of nonemployer PPP applicants)
57% 10% 18% 16%
62% 8% 13% 17%
31% 8% 25% 37%
48% 5% 21% 26%
Black N=209
White N=927
Asian N=103
Hispanic N=124
All Most (51%–99%) Some (1%–50%) None
1 ThePaycheckProtectionProgram(PPP)isadministeredthroughtheUSSmallBusinessAdministration.2 Respondents could select multiple options; respondents may have submitted more than one application.3 Response option “other” not shown. See Appendix for more detail.4 Respondentswereprovidedalistoflargebanks(thosewithatleast$10Bintotaldeposits)operatingintheirstate.5 “Onlinelenders,”alsocalledfintechlenders,arenonbanksthatlendonline.Examplesinclude:LendingClub,OnDeck,CANCapital,PaypalWorkingCapital,
Kabbage, etc.6 “Financecompany”includesnonbanklenderssuchasmortgagecompanies,equipmentdealers,insurancecompanies,autofinancecompanies,etc.7 Communitydevelopmentfinancialinstitutions(CDFIs)arefinancialinstitutionsthatprovidecreditandfinancialservicestounderservedmarketsand
populations.CDFIsarecertifiedbytheCDFIFundattheUSDepartmentoftheTreasury.8 Percentages may not sum to 100 due to rounding.
12%
20%
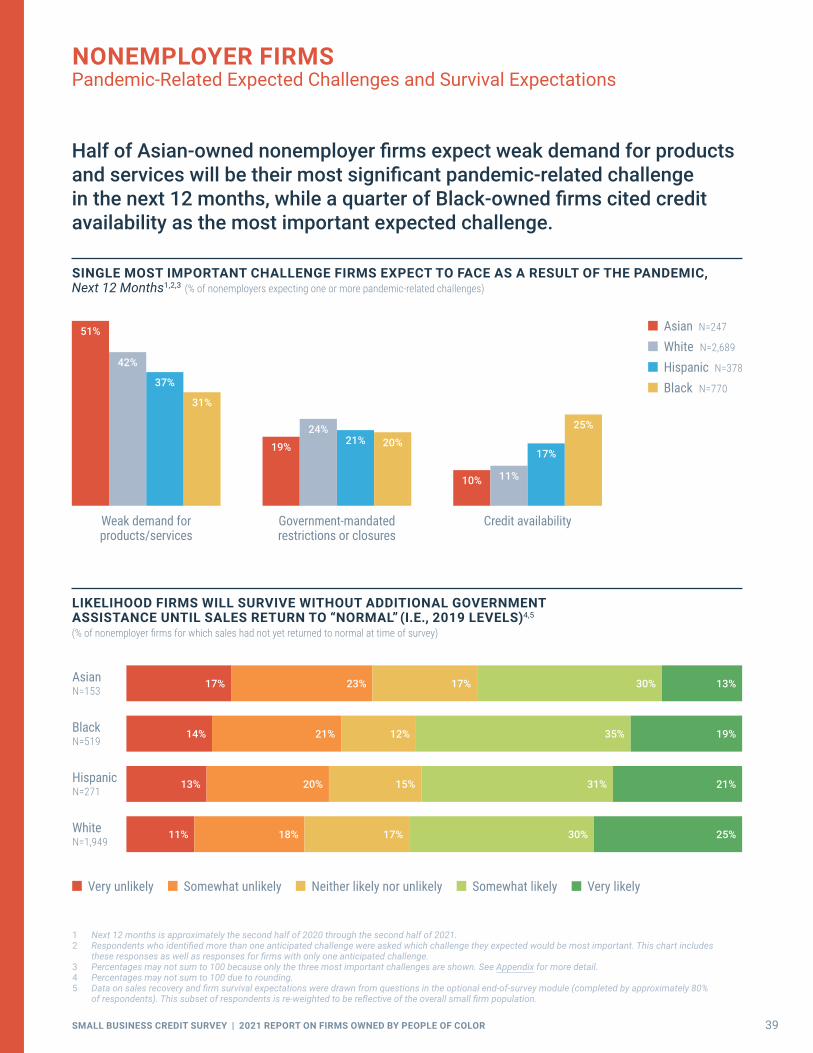
39SMALL BUSINESS CREDIT SURVEY | 2021 REPORT ON FIRMS OWNED BY PEOPLE OF COLOR
NONEMPLOYER FIRMSPandemic-Related Expected Challenges and Survival Expectations
Half of Asian-owned nonemployer firms expect weak demand for products and services will be their most significant pandemic-related challenge in the next 12 months, while a quarter of Black-owned firms cited credit availability as the most important expected challenge.
1 Next 12 months is approximately the second half of 2020 through the second half of 2021.2 Respondentswhoidentifiedmorethanoneanticipatedchallengewereaskedwhichchallengetheyexpectedwouldbemostimportant.Thischartincludes
theseresponsesaswellasresponsesforfirmswithonlyoneanticipatedchallenge.3 Percentages may not sum to 100 because only the three most important challenges are shown. See Appendix for more detail.4 Percentages may not sum to 100 due to rounding.5 Dataonsalesrecoveryandfirmsurvivalexpectationsweredrawnfromquestionsintheoptionalend-of-surveymodule(completedbyapproximately80%
ofrespondents).Thissubsetofrespondentsisre-weightedtobereflectiveoftheoverallsmallfirmpopulation.
SINGLE MOST IMPORTANT CHALLENGE FIRMS EXPECT TO FACE AS A RESULT OF THE PANDEMIC, Next 12 Months1,2,3 (% of nonemployers expecting one or more pandemic-related challenges)
Asian N=247
White N=2,689
Hispanic N=378
Black N=770
10% 11%
17%
25%
Credit availability
21%19%
24%20%
Government-mandated restrictions or closures
31%
37%
51%
42%
Weak demand for products/services
LIKELIHOOD FIRMS WILL SURVIVE WITHOUT ADDITIONAL GOVERNMENT ASSISTANCE UNTIL SALES RETURN TO “NORMAL” (I.E., 2019 LEVELS)4,5 (% of nonemployer firms for which sales had not yet returned to normal at time of survey)
Very unlikely Somewhat unlikely Neither likely nor unlikely Somewhat likely Very likely
White N=1,949
Asian N=153
Black N=519
Hispanic N=271
13% 20% 15% 31% 21%
17% 23% 17% 30% 13%
14% 21% 12% 35% 19%
11% 18% 17% 30% 25%

40SMALL BUSINESS CREDIT SURVEY | 2021 REPORT ON FIRMS OWNED BY PEOPLE OF COLOR
NONEMPLOYER FIRMSFinancing Demand and Outcomes
1 Prior 12 months is approximately the second half of 2019 through the second half of 2020.2 Excludes emergency funding applications.3 Percentages may not sum to 100 due to rounding.
SHARE THAT APPLIED FOR FINANCING, Prior 12 Months1,2 (% of nonemployer firms) 2020 application rate excludes PPP and other pandemic-related emergency funding applications.
28%
26%
24%23%
Black N=820
Hispanic N=393
Asian N=249
White N=2,879
Compared to other nonemployer firms that applied for financing, Black-owned firms were less likely to receive all of the financing they sought.
TOTAL FINANCING RECEIVED, Prior 12 Months1,2,3 (% of nonemployer applicants)
White N=580
Hispanic N=97
22% 11% 38% 30%
26% 11% 23% 40%
Black N=221
Asian-owned firms not shown due to insufficient sample size.
All Most (51%–99%) Some (1%–50%) None
10% 5% 28% 57%