2016 eu-wide stress test · 2016 eu-wide stress test: credit risk irb banco santander s.a. (mln...
TRANSCRIPT
Bank Name Banco Santander S.A.
LEI Code 5493006QMFDDMYWIAM13
Country Code ESBa
2016 EU-wide Stress Test
Actual
(starting year)Baseline Scenario Adverse Scenario
(mln EUR, %) 31/12/2015 31/12/2018 31/12/2018
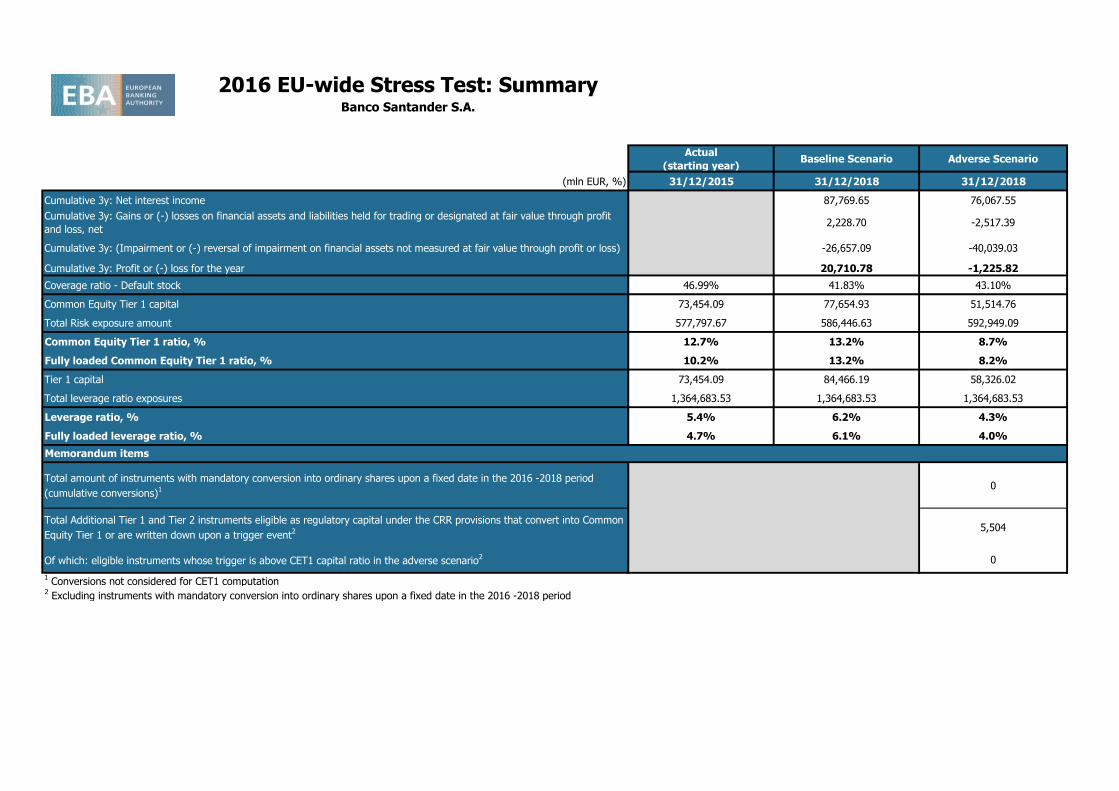
Cumulative 3y: Net interest income 87,769.65 76,067.55
Cumulative 3y: Gains or (-) losses on financial assets and liabilities held for trading or designated at fair value through profit
and loss, net2,228.70 -2,517.39
Cumulative 3y: (Impairment or (-) reversal of impairment on financial assets not measured at fair value through profit or loss) -26,657.09 -40,039.03
Cumulative 3y: Profit or (-) loss for the year 20,710.78 -1,225.82
Coverage ratio - Default stock 46.99% 41.83% 43.10%
Common Equity Tier 1 capital 73,454.09 77,654.93 51,514.76
Total Risk exposure amount 577,797.67 586,446.63 592,949.09
Common Equity Tier 1 ratio, % 12.7% 13.2% 8.7%
Fully loaded Common Equity Tier 1 ratio, % 10.2% 13.2% 8.2%
Tier 1 capital 73,454.09 84,466.19 58,326.02
Total leverage ratio exposures 1,364,683.53 1,364,683.53 1,364,683.53
Leverage ratio, % 5.4% 6.2% 4.3%
Fully loaded leverage ratio, % 4.7% 6.1% 4.0%
Total amount of instruments with mandatory conversion into ordinary shares upon a fixed date in the 2016 -2018 period
(cumulative conversions)1 0
Total Additional Tier 1 and Tier 2 instruments eligible as regulatory capital under the CRR provisions that convert into Common
Equity Tier 1 or are written down upon a trigger event2 5,504
Of which: eligible instruments whose trigger is above CET1 capital ratio in the adverse scenario2 0
1 Conversions not considered for CET1 computation
2 Excluding instruments with mandatory conversion into ordinary shares upon a fixed date in the 2016 -2018 period
2016 EU-wide Stress Test: SummaryBanco Santander S.A.
Memorandum items
2016 EU-wide Stress Test:
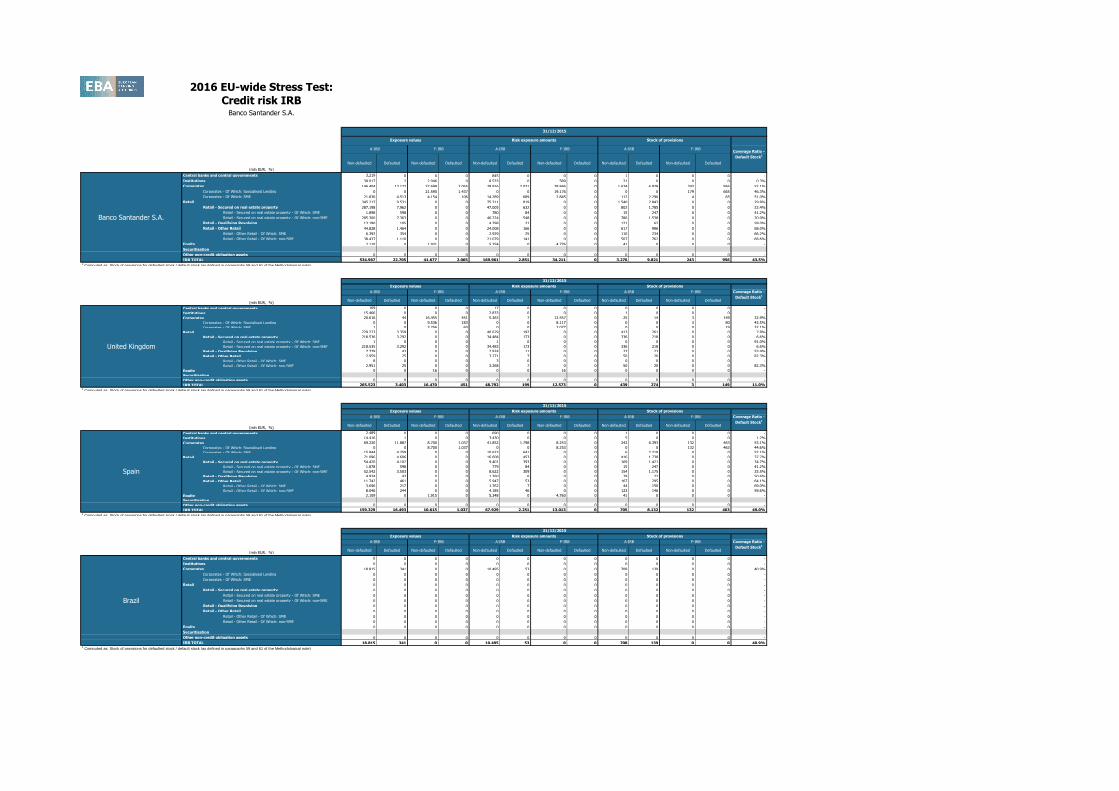
Credit risk IRBBanco Santander S.A.
(mln EUR, %)
Non-defaulted Defaulted Non-defaulted Defaulted Non-defaulted Defaulted Non-defaulted Defaulted Non-defaulted Defaulted Non-defaulted Defaulted
Central banks and central governments 3,219 0 0 0 845 0 0 0 1 0 0 0 -
Institutions 38,017 2 2,046 0 8,533 0 589 0 21 0 0 0 0.3%
Corporates 146,404 13,172 37,699 2,065 79,916 2,031 28,846 0 1,674 6,978 243 956 52.1%
Corporates - Of Which: Specialised Lending 0 0 21,590 1,437 0 0 19,176 0 0 0 179 665 46.3%
Corporates - Of Which: SME 21,836 4,513 4,154 106 14,289 689 2,845 0 112 2,290 4 65 51.0%
Retail 345,217 9,531 0 0 75,311 819 0 0 1,540 2,843 0 0 29.8%
Retail - Secured on real estate property 287,198 7,962 0 0 47,005 632 0 0 802 1,785 0 0 22.4%
Retail - Secured on real estate property - Of Which: SME 1,898 598 0 0 780 84 0 0 15 247 0 0 41.2%
Retail - Secured on real estate property - Of Which: non-SME 285,300 7,363 0 0 46,224 548 0 0 786 1,538 0 0 20.9%
Retail - Qualifying Revolving 13,190 105 0 0 4,298 21 0 0 121 62 0 0 59.0%
Retail - Other Retail 44,828 1,464 0 0 24,008 166 0 0 617 996 0 0 68.0%
Retail - Other Retail - Of Which: SME 6,392 354 0 0 2,929 25 0 0 110 234 0 0 66.2%
Retail - Other Retail - Of Which: non-SME 38,437 1,110 0 0 21,079 141 0 0 507 762 0 0 68.6%
Equity 2,110 0 1,931 0 5,354 0 4,776 0 41 0 0 0 -
Securitisation
Other non-credit obligation assets 0 0 0 0 0 0 0 0 0 0 0 0 -
IRB TOTAL 534,967 22,705 41,677 2,065 169,961 2,851 34,211 0 3,276 9,821 243 956 43.5%1 Computed as: Stock of provisions for defaulted stock / default stock (as defined in paragraphs 59 and 61 of the Methodological note)
(mln EUR, %)Non-defaulted Defaulted Non-defaulted Defaulted Non-defaulted Defaulted Non-defaulted Defaulted Non-defaulted Defaulted Non-defaulted Defaulted
Central banks and central governments 169 0 0 0 17 0 0 0 0 0 0 0 -
Institutions 15,466 0 0 0 2,833 0 0 0 1 0 0 0 -
Corporates 20,616 44 16,455 451 5,263 7 12,557 0 25 14 3 149 32.9%
Corporates - Of Which: Specialised Lending 0 0 9,536 183 0 0 8,117 0 0 0 3 80 43.5%
Corporates - Of Which: SME 1 0 3,256 60 0 0 2,077 0 0 0 0 19 32.1%
Retail 229,273 3,359 0 0 40,679 192 0 0 413 261 0 0 7.8%
Retail - Secured on real estate property 218,536 3,292 0 0 34,484 173 0 0 336 218 0 0 6.6%
Retail - Secured on real estate property - Of Which: SME 1 0 0 0 1 0 0 0 0 0 0 0 91.0%
Retail - Secured on real estate property - Of Which: non-SME 218,535 3,292 0 0 34,483 173 0 0 336 218 0 0 6.6%
Retail - Qualifying Revolving 7,779 43 0 0 2,924 11 0 0 27 23 0 0 53.4%
Retail - Other Retail 2,959 25 0 0 3,271 7 0 0 50 20 0 0 82.3%
Retail - Other Retail - Of Which: SME 8 0 0 0 3 0 0 0 0 0 0 0 -
Retail - Other Retail - Of Which: non-SME 2,951 25 0 0 3,268 7 0 0 50 20 0 0 82.3%
Equity 0 0 16 0 0 0 16 0 0 0 0 0 -
Securitisation
Other non-credit obligation assets 0 0 0 0 0 0 0 0 0 0 0 0 -
IRB TOTAL 265,523 3,403 16,470 451 48,792 199 12,573 0 439 274 3 149 11.0%1 Computed as: Stock of provisions for defaulted stock / default stock (as defined in paragraphs 59 and 61 of the Methodological note)
(mln EUR, %)Non-defaulted Defaulted Non-defaulted Defaulted Non-defaulted Defaulted Non-defaulted Defaulted Non-defaulted Defaulted Non-defaulted Defaulted
Central banks and central governments 2,489 0 0 0 690 0 0 0 1 0 0 0 -
Institutions 14,416 1 0 0 3,430 0 0 0 5 0 0 0 1.2%
Corporates 69,220 11,887 8,700 1,037 41,852 1,798 8,253 0 242 6,393 132 463 53.1%
Corporates - Of Which: Specialised Lending 0 0 8,700 1,037 0 0 8,253 0 0 0 132 463 44.6%
Corporates - Of Which: SME 15,844 4,259 0 0 10,623 641 0 0 6 2,219 0 0 52.1%
Retail 71,096 4,606 0 0 16,608 453 0 0 416 1,738 0 0 37.7%
Retail - Secured on real estate property 54,420 4,102 0 0 9,401 393 0 0 169 1,421 0 0 34.7%
Retail - Secured on real estate property - Of Which: SME 1,878 598 0 0 779 84 0 0 15 247 0 0 41.2%
Retail - Secured on real estate property - Of Which: non-SME 52,542 3,503 0 0 8,622 309 0 0 154 1,175 0 0 33.5%
Retail - Qualifying Revolving 4,934 43 0 0 1,260 6 0 0 79 22 0 0 50.6%
Retail - Other Retail 11,742 461 0 0 5,947 53 0 0 167 295 0 0 64.1%
Retail - Other Retail - Of Which: SME 3,696 217 0 0 1,762 7 0 0 44 150 0 0 69.0%
Retail - Other Retail - Of Which: non-SME 8,046 244 0 0 4,185 46 0 0 123 146 0 0 59.6%
Equity 2,109 0 1,915 0 5,348 0 4,760 0 41 0 0 0 -
Securitisation
Other non-credit obligation assets 0 0 0 0 0 0 0 0 0 0 0 0 -
IRB TOTAL 159,329 16,493 10,615 1,037 67,929 2,251 13,013 0 705 8,132 132 463 49.0%1 Computed as: Stock of provisions for defaulted stock / default stock (as defined in paragraphs 59 and 61 of the Methodological note)
(mln EUR, %)Non-defaulted Defaulted Non-defaulted Defaulted Non-defaulted Defaulted Non-defaulted Defaulted Non-defaulted Defaulted Non-defaulted Defaulted
Central banks and central governments 0 0 0 0 0 0 0 0 0 0 0 0 -
Institutions 0 0 0 0 0 0 0 0 0 0 0 0 -
Corporates 18,815 341 0 0 10,495 53 0 0 708 139 0 0 40.9%
Corporates - Of Which: Specialised Lending 0 0 0 0 0 0 0 0 0 0 0 0 -
Corporates - Of Which: SME 0 0 0 0 0 0 0 0 0 0 0 0 -
Retail 0 0 0 0 0 0 0 0 0 0 0 0 -
Retail - Secured on real estate property 0 0 0 0 0 0 0 0 0 0 0 0 -
Retail - Secured on real estate property - Of Which: SME 0 0 0 0 0 0 0 0 0 0 0 0 -
Retail - Secured on real estate property - Of Which: non-SME 0 0 0 0 0 0 0 0 0 0 0 0 -
Retail - Qualifying Revolving 0 0 0 0 0 0 0 0 0 0 0 0 -
Retail - Other Retail 0 0 0 0 0 0 0 0 0 0 0 0 -
Retail - Other Retail - Of Which: SME 0 0 0 0 0 0 0 0 0 0 0 0 -
Retail - Other Retail - Of Which: non-SME 0 0 0 0 0 0 0 0 0 0 0 0 -
Equity 0 0 0 0 0 0 0 0 0 0 0 0 -
Securitisation
Other non-credit obligation assets 0 0 0 0 0 0 0 0 0 0 0 0 -
IRB TOTAL 18,815 341 0 0 10,495 53 0 0 708 139 0 0 40.9%1 Computed as: Stock of provisions for defaulted stock / default stock (as defined in paragraphs 59 and 61 of the Methodological note)
Brazil
A-IRB F-IRB A-IRB F-IRB
Spain
31/12/2015
Exposure values Risk exposure amounts Stock of provisions
Coverage Ratio -
Default Stock1
A-IRB F-IRB
Coverage Ratio -
Default Stock1
A-IRB F-IRB A-IRB F-IRB A-IRB F-IRB
United Kingdom
31/12/2015
Exposure values Risk exposure amounts Stock of provisions
F-IRB A-IRB F-IRB
31/12/2015
Exposure values Risk exposure amounts Stock of provisions
Coverage Ratio -
Default Stock1
A-IRB F-IRB A-IRB
Banco Santander S.A.
F-IRB A-IRB F-IRB A-IRB F-IRB
31/12/2015
Exposure values Risk exposure amounts Stock of provisions
Coverage Ratio -
Default Stock1
A-IRB
2016 EU-wide Stress Test:
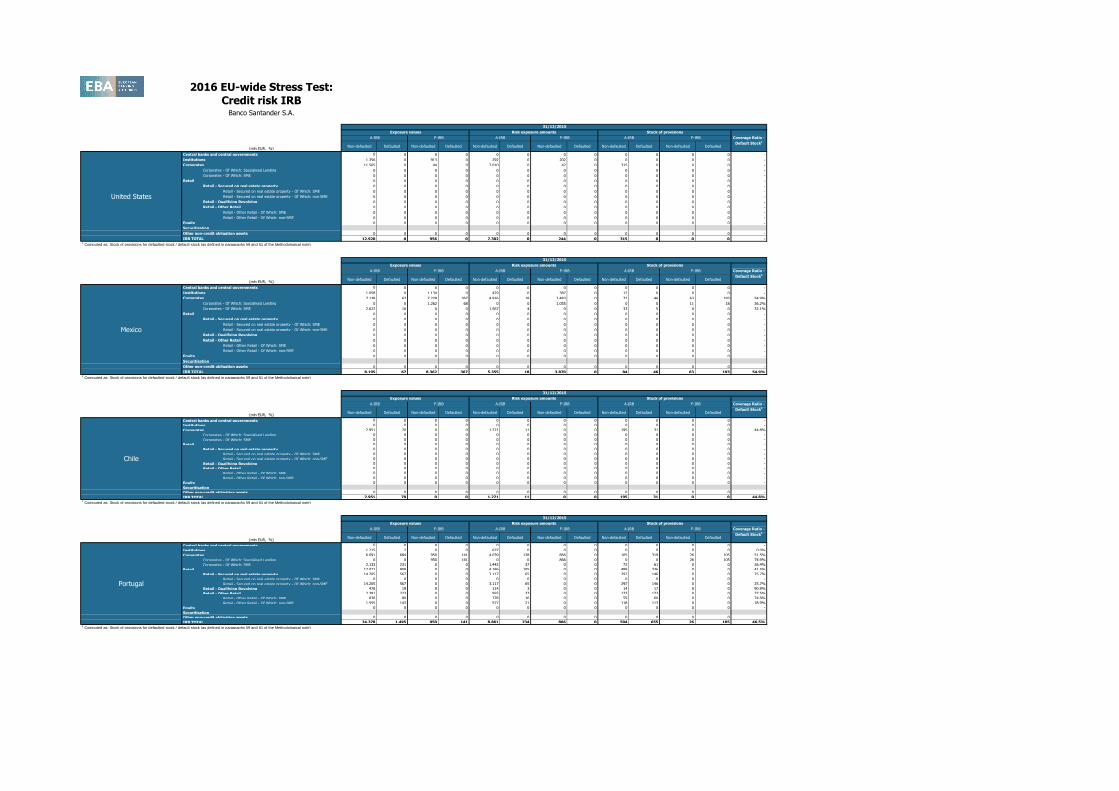
Credit risk IRBBanco Santander S.A.
(mln EUR, %)Non-defaulted Defaulted Non-defaulted Defaulted Non-defaulted Defaulted Non-defaulted Defaulted Non-defaulted Defaulted Non-defaulted Defaulted
Central banks and central governments 0 0 0 0 0 0 0 0 0 0 0 0 -
Institutions 1,356 0 913 0 292 0 202 0 0 0 0 0 -
Corporates 11,565 0 44 0 7,010 0 42 0 315 0 0 0 -
Corporates - Of Which: Specialised Lending 0 0 0 0 0 0 0 0 0 0 0 0 -
Corporates - Of Which: SME 0 0 0 0 0 0 0 0 0 0 0 0 -
Retail 0 0 0 0 0 0 0 0 0 0 0 0 -
Retail - Secured on real estate property 0 0 0 0 0 0 0 0 0 0 0 0 -
Retail - Secured on real estate property - Of Which: SME 0 0 0 0 0 0 0 0 0 0 0 0 -
Retail - Secured on real estate property - Of Which: non-SME 0 0 0 0 0 0 0 0 0 0 0 0 -
Retail - Qualifying Revolving 0 0 0 0 0 0 0 0 0 0 0 0 -
Retail - Other Retail 0 0 0 0 0 0 0 0 0 0 0 0 -
Retail - Other Retail - Of Which: SME 0 0 0 0 0 0 0 0 0 0 0 0 -
Retail - Other Retail - Of Which: non-SME 0 0 0 0 0 0 0 0 0 0 0 0 -
Equity 0 0 0 0 0 0 0 0 0 0 0 0 -
Securitisation
Other non-credit obligation assets 0 0 0 0 0 0 0 0 0 0 0 0 -
IRB TOTAL 12,920 0 956 0 7,302 0 244 0 315 0 0 0 -1 Computed as: Stock of provisions for defaulted stock / default stock (as defined in paragraphs 59 and 61 of the Methodological note)
(mln EUR, %)Non-defaulted Defaulted Non-defaulted Defaulted Non-defaulted Defaulted Non-defaulted Defaulted Non-defaulted Defaulted Non-defaulted Defaulted
Central banks and central governments 0 0 0 0 0 0 0 0 0 0 0 0 -
Institutions 1,058 0 1,134 0 429 0 387 0 12 0 0 0 -
Corporates 7,138 67 7,228 367 4,926 18 3,483 0 72 46 63 193 54.9%
Corporates - Of Which: Specialised Lending 0 0 1,262 68 0 0 1,055 0 0 0 11 18 26.2%
Corporates - Of Which: SME 2,622 16 0 0 1,567 4 0 0 33 5 0 0 32.1%
Retail 0 0 0 0 0 0 0 0 0 0 0 0 -
Retail - Secured on real estate property 0 0 0 0 0 0 0 0 0 0 0 0 -
Retail - Secured on real estate property - Of Which: SME 0 0 0 0 0 0 0 0 0 0 0 0 -
Retail - Secured on real estate property - Of Which: non-SME 0 0 0 0 0 0 0 0 0 0 0 0 -
Retail - Qualifying Revolving 0 0 0 0 0 0 0 0 0 0 0 0 -
Retail - Other Retail 0 0 0 0 0 0 0 0 0 0 0 0 -
Retail - Other Retail - Of Which: SME 0 0 0 0 0 0 0 0 0 0 0 0 -
Retail - Other Retail - Of Which: non-SME 0 0 0 0 0 0 0 0 0 0 0 0 -
Equity 0 0 0 0 0 0 0 0 0 0 0 0 -
Securitisation
Other non-credit obligation assets 0 0 0 0 0 0 0 0 0 0 0 0 -
IRB TOTAL 8,195 67 8,362 367 5,355 18 3,870 0 84 46 63 193 54.9%1 Computed as: Stock of provisions for defaulted stock / default stock (as defined in paragraphs 59 and 61 of the Methodological note)
(mln EUR, %)Non-defaulted Defaulted Non-defaulted Defaulted Non-defaulted Defaulted Non-defaulted Defaulted Non-defaulted Defaulted Non-defaulted Defaulted
Central banks and central governments 0 0 0 0 0 0 0 0 0 0 0 0 -
Institutions 0 0 0 0 0 0 0 0 0 0 0 0 -
Corporates 2,951 70 0 0 1,271 11 0 0 195 31 0 0 44.8%
Corporates - Of Which: Specialised Lending 0 0 0 0 0 0 0 0 0 0 0 0 -
Corporates - Of Which: SME 0 0 0 0 0 0 0 0 0 0 0 0 -
Retail 0 0 0 0 0 0 0 0 0 0 0 0 -
Retail - Secured on real estate property 0 0 0 0 0 0 0 0 0 0 0 0 -
Retail - Secured on real estate property - Of Which: SME 0 0 0 0 0 0 0 0 0 0 0 0 -
Retail - Secured on real estate property - Of Which: non-SME 0 0 0 0 0 0 0 0 0 0 0 0 -
Retail - Qualifying Revolving 0 0 0 0 0 0 0 0 0 0 0 0 -
Retail - Other Retail 0 0 0 0 0 0 0 0 0 0 0 0 -
Retail - Other Retail - Of Which: SME 0 0 0 0 0 0 0 0 0 0 0 0 -
Retail - Other Retail - Of Which: non-SME 0 0 0 0 0 0 0 0 0 0 0 0 -
Equity 0 0 0 0 0 0 0 0 0 0 0 0 -
Securitisation
Other non-credit obligation assets 0 0 0 0 0 0 0 0 0 0 0 0 -
IRB TOTAL 2,951 70 0 0 1,271 11 0 0 195 31 0 0 44.8%1 Computed as: Stock of provisions for defaulted stock / default stock (as defined in paragraphs 59 and 61 of the Methodological note)
(mln EUR, %)Non-defaulted Defaulted Non-defaulted Defaulted Non-defaulted Defaulted Non-defaulted Defaulted Non-defaulted Defaulted Non-defaulted Defaulted
Central banks and central governments 0 0 0 0 0 0 0 0 0 0 0 0 -
Institutions 1,215 2 0 0 637 0 0 0 0 0 0 0 0.0%
Corporates 6,091 684 950 141 4,039 128 866 0 105 319 26 105 51.5%
Corporates - Of Which: Specialised Lending 0 0 950 141 0 0 866 0 0 0 26 105 74.9%
Corporates - Of Which: SME 2,133 231 0 0 1,443 37 0 0 72 61 0 0 26.4%
Retail 17,071 809 0 0 4,186 105 0 0 488 336 0 0 41.5%
Retail - Secured on real estate property 14,205 567 0 0 3,117 65 0 0 297 146 0 0 25.7%
Retail - Secured on real estate property - Of Which: SME 0 0 0 0 0 0 0 0 0 0 0 0 -
Retail - Secured on real estate property - Of Which: non-SME 14,205 567 0 0 3,117 65 0 0 297 146 0 0 25.7%
Retail - Qualifying Revolving 476 19 0 0 114 3 0 0 14 17 0 0 90.9%
Retail - Other Retail 2,391 223 0 0 955 37 0 0 177 173 0 0 77.5%
Retail - Other Retail - Of Which: SME 836 80 0 0 378 16 0 0 59 60 0 0 74.8%
Retail - Other Retail - Of Which: non-SME 1,555 143 0 0 577 21 0 0 118 113 0 0 78.9%
Equity 0 0 0 0 0 0 0 0 0 0 0 0 -
Securitisation
Other non-credit obligation assets 0 0 0 0 0 0 0 0 0 0 0 0 -
IRB TOTAL 24,378 1,495 950 141 8,861 234 866 0 594 655 26 105 46.5%1 Computed as: Stock of provisions for defaulted stock / default stock (as defined in paragraphs 59 and 61 of the Methodological note)
Portugal
A-IRB F-IRB A-IRB F-IRB
Chile
31/12/2015
Exposure values Risk exposure amounts Stock of provisions
Coverage Ratio -
Default Stock1
A-IRB F-IRB
Stock of provisions
Coverage Ratio -
Default Stock1
A-IRB F-IRB A-IRB F-IRB A-IRB F-IRB
Mexico
31/12/2015
Exposure values Risk exposure amounts
A-IRB F-IRB A-IRB F-IRB
United States
31/12/2015
Exposure values Risk exposure amounts Stock of provisions
Coverage Ratio -
Default Stock1
A-IRB F-IRB
Stock of provisions
Coverage Ratio -
Default Stock1
A-IRB F-IRB A-IRB F-IRB A-IRB F-IRB
31/12/2015
Exposure values Risk exposure amounts
2016 EU-wide Stress Test:
Credit risk IRBBanco Santander S.A.
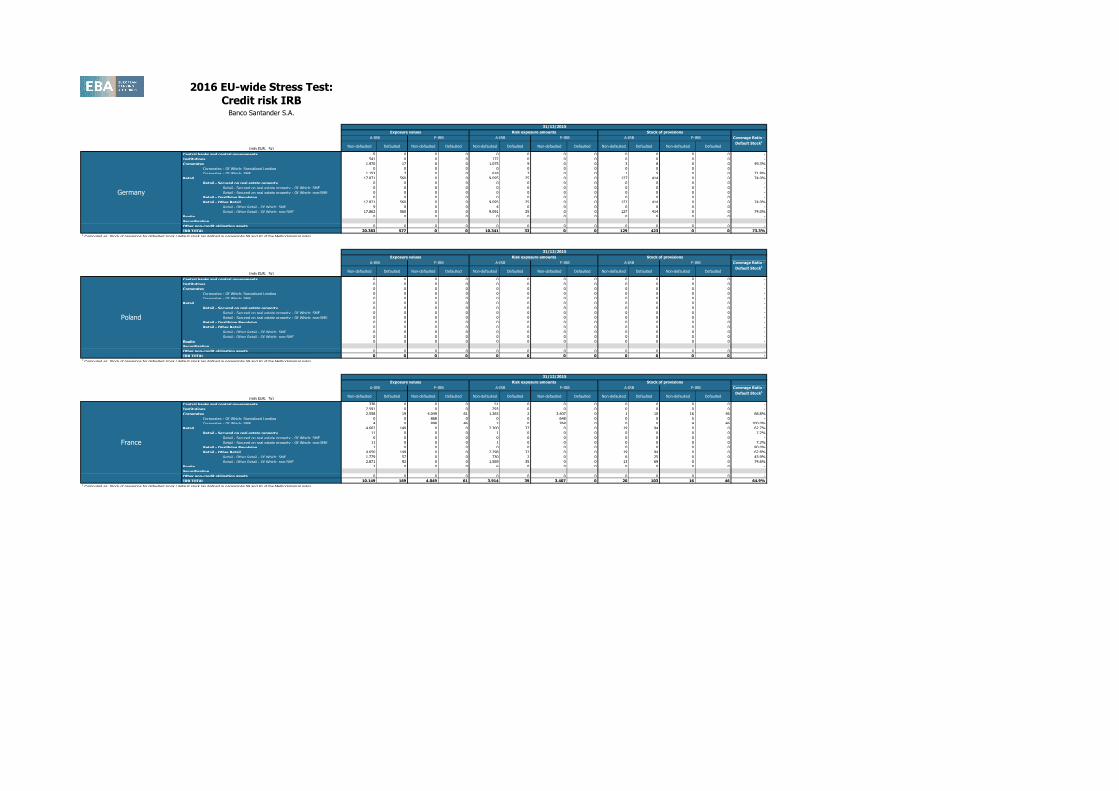
(mln EUR, %)Non-defaulted Defaulted Non-defaulted Defaulted Non-defaulted Defaulted Non-defaulted Defaulted Non-defaulted Defaulted Non-defaulted Defaulted
Central banks and central governments 0 0 0 0 0 0 0 0 0 0 0 0 -
Institutions 541 0 0 0 172 0 0 0 0 0 0 0 -
Corporates 1,970 17 0 0 1,075 9 0 0 3 8 0 0 49.3%
Corporates - Of Which: Specialised Lending 0 0 0 0 0 0 0 0 0 0 0 0 -
Corporates - Of Which: SME 1,153 7 0 0 618 7 0 0 1 5 0 0 71.8%
Retail 17,871 560 0 0 9,095 25 0 0 127 414 0 0 74.0%
Retail - Secured on real estate property 0 0 0 0 0 0 0 0 0 0 0 0 -
Retail - Secured on real estate property - Of Which: SME 0 0 0 0 0 0 0 0 0 0 0 0 -
Retail - Secured on real estate property - Of Which: non-SME 0 0 0 0 0 0 0 0 0 0 0 0 -
Retail - Qualifying Revolving 0 0 0 0 0 0 0 0 0 0 0 0 -
Retail - Other Retail 17,871 560 0 0 9,095 25 0 0 127 414 0 0 74.0%
Retail - Other Retail - Of Which: SME 9 0 0 0 4 0 0 0 0 0 0 0 -
Retail - Other Retail - Of Which: non-SME 17,862 560 0 0 9,091 25 0 0 127 414 0 0 74.0%
Equity 0 0 0 0 0 0 0 0 0 0 0 0 -
Securitisation
Other non-credit obligation assets 0 0 0 0 0 0 0 0 0 0 0 0 -
IRB TOTAL 20,383 577 0 0 10,341 33 0 0 129 423 0 0 73.3%1 Computed as: Stock of provisions for defaulted stock / default stock (as defined in paragraphs 59 and 61 of the Methodological note)
(mln EUR, %)Non-defaulted Defaulted Non-defaulted Defaulted Non-defaulted Defaulted Non-defaulted Defaulted Non-defaulted Defaulted Non-defaulted Defaulted
Central banks and central governments 0 0 0 0 0 0 0 0 0 0 0 0 -
Institutions 0 0 0 0 0 0 0 0 0 0 0 0 -
Corporates 0 0 0 0 0 0 0 0 0 0 0 0 -
Corporates - Of Which: Specialised Lending 0 0 0 0 0 0 0 0 0 0 0 0 -
Corporates - Of Which: SME 0 0 0 0 0 0 0 0 0 0 0 0 -
Retail 0 0 0 0 0 0 0 0 0 0 0 0 -
Retail - Secured on real estate property 0 0 0 0 0 0 0 0 0 0 0 0 -
Retail - Secured on real estate property - Of Which: SME 0 0 0 0 0 0 0 0 0 0 0 0 -
Retail - Secured on real estate property - Of Which: non-SME 0 0 0 0 0 0 0 0 0 0 0 0 -
Retail - Qualifying Revolving 0 0 0 0 0 0 0 0 0 0 0 0 -
Retail - Other Retail 0 0 0 0 0 0 0 0 0 0 0 0 -
Retail - Other Retail - Of Which: SME 0 0 0 0 0 0 0 0 0 0 0 0 -
Retail - Other Retail - Of Which: non-SME 0 0 0 0 0 0 0 0 0 0 0 0 -
Equity 0 0 0 0 0 0 0 0 0 0 0 0 -
Securitisation
Other non-credit obligation assets 0 0 0 0 0 0 0 0 0 0 0 0 -
IRB TOTAL 0 0 0 0 0 0 0 0 0 0 0 0 -1 Computed as: Stock of provisions for defaulted stock / default stock (as defined in paragraphs 59 and 61 of the Methodological note)
(mln EUR, %)Non-defaulted Defaulted Non-defaulted Defaulted Non-defaulted Defaulted Non-defaulted Defaulted Non-defaulted Defaulted Non-defaulted Defaulted
Central banks and central governments 336 0 0 0 51 0 0 0 0 0 0 0 -
Institutions 2,591 0 0 0 293 0 0 0 0 0 0 0 -
Corporates 2,558 19 4,049 61 1,263 2 3,407 0 1 10 16 46 68.8%
Corporates - Of Which: Specialised Lending 0 0 868 0 0 0 648 0 0 0 5 0 -
Corporates - Of Which: SME 4 0 898 46 2 0 768 0 0 0 4 46 100.0%
Retail 4,662 149 0 0 2,300 37 0 0 19 94 0 0 62.7%
Retail - Secured on real estate property 11 0 0 0 1 0 0 0 0 0 0 0 7.2%
Retail - Secured on real estate property - Of Which: SME 0 0 0 0 0 0 0 0 0 0 0 0 -
Retail - Secured on real estate property - Of Which: non-SME 11 0 0 0 1 0 0 0 0 0 0 0 7.2%
Retail - Qualifying Revolving 1 0 0 0 0 0 0 0 0 0 0 0 80.0%
Retail - Other Retail 4,650 149 0 0 2,298 37 0 0 19 94 0 0 62.8%
Retail - Other Retail - Of Which: SME 1,779 57 0 0 730 2 0 0 6 25 0 0 43.9%
Retail - Other Retail - Of Which: non-SME 2,871 92 0 0 1,569 35 0 0 13 69 0 0 74.6%
Equity 2 0 0 0 6 0 0 0 0 0 0 0 -
Securitisation
Other non-credit obligation assets 0 0 0 0 0 0 0 0 0 0 0 0 -
IRB TOTAL 10,149 169 4,049 61 3,914 39 3,407 0 20 103 16 46 64.9%1 Computed as: Stock of provisions for defaulted stock / default stock (as defined in paragraphs 59 and 61 of the Methodological note)
France
Stock of provisions
Coverage Ratio -
Default Stock1
A-IRB F-IRB A-IRB F-IRB A-IRB F-IRB
Poland
31/12/2015
Exposure values Risk exposure amounts
A-IRB F-IRB A-IRB F-IRB
Germany
31/12/2015
Exposure values Risk exposure amounts Stock of provisions
Coverage Ratio -
Default Stock1
A-IRB F-IRB
Stock of provisions
Coverage Ratio -
Default Stock1
A-IRB F-IRB A-IRB F-IRB A-IRB F-IRB
31/12/2015
Exposure values Risk exposure amounts
2016 EU-wide Stress Test:
Credit risk IRBBanco Santander S.A.
(mln EUR, %)
Central banks and central governments
Institutions
Corporates
Corporates - Of Which: Specialised Lending
Corporates - Of Which: SME
Retail
Retail - Secured on real estate property
Retail - Secured on real estate property - Of Which: SME
Retail - Secured on real estate property - Of Which: non-SME
Retail - Qualifying Revolving
Retail - Other Retail
Retail - Other Retail - Of Which: SME
Retail - Other Retail - Of Which: non-SME
Equity
Securitisation
Other non-credit obligation assets
IRB TOTAL1 Computed as: Stock of provisions for defaulted stock / default stock (as defined in paragraphs 59 and 61 of the Methodological note)
Brazil
Spain
United Kingdom
Banco Santander S.A.
Impairment
rate
Stock of
Provisions
Coverage Ratio -
Default Stock1
Impairment
rate
Stock of
Provisions
Coverage Ratio -
Default Stock1
Impairment
rate
Stock of
Provisions
Coverage Ratio -
Default Stock1
Impairment
rate
Stock of
Provisions
Coverage Ratio -
Default Stock1
Impairment
rate
Stock of
Provisions
Coverage Ratio -
Default Stock1
Impairment
rate
Stock of
Provisions
Coverage Ratio -
Default Stock1
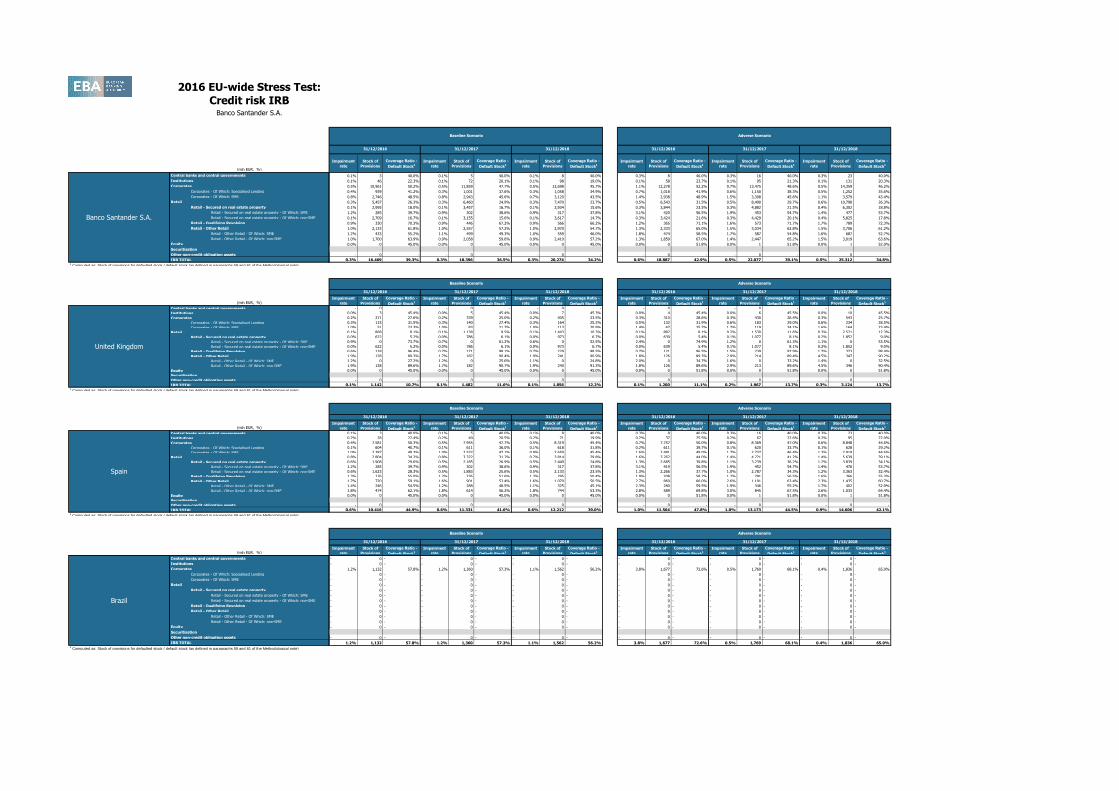
0.1% 3 40.0% 0.1% 5 40.0% 0.1% 8 40.0% 0.3% 8 40.0% 0.3% 16 40.0% 0.3% 23 40.0%
0.1% 46 22.3% 0.1% 72 20.1% 0.1% 98 19.0% 0.1% 58 23.7% 0.1% 95 21.3% 0.1% 131 20.3%
0.5% 10,961 50.2% 0.5% 11,859 47.7% 0.5% 12,698 45.7% 1.1% 12,278 52.2% 0.7% 13,475 48.6% 0.5% 14,359 46.2%
0.4% 939 41.2% 0.3% 1,001 37.6% 0.3% 1,058 34.9% 0.7% 1,018 41.9% 0.6% 1,150 38.3% 0.5% 1,252 35.6%
0.8% 2,746 48.5% 0.8% 2,943 45.6% 0.7% 3,120 43.5% 1.4% 2,938 48.9% 1.5% 3,308 45.6% 1.1% 3,579 43.4%
0.3% 5,457 26.3% 0.3% 6,460 24.9% 0.3% 7,470 23.7% 0.5% 6,543 31.5% 0.5% 8,490 29.7% 0.6% 10,798 26.3%
0.1% 2,995 18.0% 0.1% 3,457 16.7% 0.1% 3,934 15.6% 0.3% 3,844 23.5% 0.3% 4,882 21.5% 0.4% 6,302 18.8%
1.2% 285 39.7% 0.9% 302 38.6% 0.9% 317 37.8% 3.1% 420 56.5% 1.9% 453 54.7% 1.4% 477 53.7%
0.1% 2,709 16.7% 0.1% 3,155 15.6% 0.1% 3,617 14.7% 0.3% 3,424 21.6% 0.3% 4,429 20.1% 0.4% 5,825 17.8%
0.9% 330 70.3% 0.9% 446 67.2% 0.9% 566 66.2% 1.2% 365 71.1% 1.6% 573 71.7% 1.7% 789 72.3%
1.0% 2,133 61.8% 1.0% 2,557 57.2% 1.0% 2,970 54.7% 1.3% 2,333 65.0% 1.5% 3,034 62.8% 1.5% 3,706 61.2%
1.2% 433 55.2% 1.1% 499 49.3% 1.0% 559 46.0% 1.8% 474 58.5% 1.7% 587 54.8% 1.6% 687 52.7%
1.0% 1,700 63.9% 0.9% 2,058 59.6% 0.9% 2,410 57.2% 1.3% 1,859 67.0% 1.4% 2,447 65.2% 1.5% 3,019 63.6%
0.0% 0 45.0% 0.0% 0 45.0% 0.0% 0 45.0% 0.0% 0 51.8% 0.0% 1 51.8% 0.0% 1 52.0%
- 0 - - 0 - - 0 - - 0 - - 0 - - 0 -
0.3% 16,469 39.3% 0.3% 18,396 36.5% 0.3% 20,274 34.2% 0.6% 18,887 42.9% 0.5% 22,077 39.1% 0.5% 25,312 34.8%
Impairment
rate
Stock of
Provisions
Coverage Ratio -
Default Stock1
Impairment
rate
Stock of
Provisions
Coverage Ratio -
Default Stock1
Impairment
rate
Stock of
Provisions
Coverage Ratio -
Default Stock1
Impairment
rate
Stock of
Provisions
Coverage Ratio -
Default Stock1
Impairment
rate
Stock of
Provisions
Coverage Ratio -
Default Stock1
Impairment
rate
Stock of
Provisions
Coverage Ratio -
Default Stock1
- 0 - - 0 - - 0 - - 0 - - 0 - - 0 -
0.0% 3 45.4% 0.0% 5 45.4% 0.0% 7 45.3% 0.0% 4 45.4% 0.0% 6 45.5% 0.0% 10 45.5%
0.2% 271 27.6% 0.2% 339 25.0% 0.2% 405 23.5% 0.3% 310 28.6% 0.3% 430 26.4% 0.3% 543 25.7%
0.3% 115 31.5% 0.3% 140 27.4% 0.3% 164 25.2% 0.5% 132 31.9% 0.6% 183 29.0% 0.6% 234 28.5%
1.0% 51 23.3% 1.0% 83 21.7% 1.0% 113 20.9% 1.4% 67 25.7% 1.7% 119 24.1% 1.6% 164 23.4%
0.1% 868 8.1% 0.1% 1,138 9.5% 0.1% 1,443 10.3% 0.1% 887 8.1% 0.2% 1,530 11.6% 0.3% 2,571 12.3%
0.0% 622 5.2% 0.0% 786 6.1% 0.0% 973 6.7% 0.0% 639 5.4% 0.1% 1,077 8.1% 0.2% 1,852 9.0%
0.9% 0 73.7% 0.7% 0 61.2% 0.6% 0 52.5% 2.4% 0 74.9% 1.2% 0 61.3% 1.1% 0 53.5%
0.0% 622 5.2% 0.0% 786 6.1% 0.0% 973 6.7% 0.0% 639 5.4% 0.1% 1,077 8.1% 0.2% 1,852 9.0%
0.6% 118 96.4% 0.7% 171 98.1% 0.7% 229 98.5% 0.7% 121 96.5% 1.5% 239 97.9% 1.7% 373 98.4%
1.9% 128 89.3% 1.7% 182 90.4% 1.9% 241 90.9% 1.8% 126 89.3% 2.9% 214 89.4% 4.5% 347 90.2%
1.2% 0 27.2% 1.2% 0 25.6% 1.1% 0 24.8% 2.0% 0 34.7% 1.6% 0 33.2% 1.4% 0 32.5%
1.9% 128 89.6% 1.7% 182 90.7% 1.9% 240 91.3% 1.8% 126 89.6% 2.9% 213 89.6% 4.5% 346 90.4%
0.0% 0 45.0% 0.0% 0 45.0% 0.0% 0 45.0% 0.0% 0 51.8% 0.0% 0 51.8% 0.0% 0 51.8%
- 0 - - 0 - - 0 - - 0 - - 0 - - 0 -
0.1% 1,142 10.7% 0.1% 1,482 11.6% 0.1% 1,856 12.2% 0.1% 1,200 11.1% 0.2% 1,967 13.7% 0.3% 3,124 13.7%
Impairment
rate
Stock of
Provisions
Coverage Ratio -
Default Stock1
Impairment
rate
Stock of
Provisions
Coverage Ratio -
Default Stock1
Impairment
rate
Stock of
Provisions
Coverage Ratio -
Default Stock1
Impairment
rate
Stock of
Provisions
Coverage Ratio -
Default Stock1
Impairment
rate
Stock of
Provisions
Coverage Ratio -
Default Stock1
Impairment
rate
Stock of
Provisions
Coverage Ratio -
Default Stock1
0.1% 3 40.0% 0.1% 5 40.0% 0.1% 8 40.0% 0.3% 8 40.0% 0.3% 16 40.0% 0.3% 23 40.0%
0.2% 28 22.4% 0.2% 49 20.5% 0.2% 71 19.9% 0.2% 37 25.5% 0.2% 67 22.6% 0.2% 95 22.0%
0.4% 7,581 50.3% 0.5% 7,955 47.7% 0.5% 8,319 45.4% 0.7% 7,757 50.0% 0.8% 8,369 47.0% 0.6% 8,848 44.6%
0.1% 604 40.7% 0.1% 611 36.0% 0.1% 618 31.8% 0.2% 611 39.7% 0.1% 620 33.7% 0.1% 628 29.2%
1.0% 2,387 49.3% 1.0% 2,532 47.1% 0.9% 2,659 45.4% 1.6% 2,481 49.0% 1.7% 2,737 46.4% 1.3% 2,919 44.6%
0.8% 2,804 34.2% 0.8% 3,322 31.7% 0.7% 3,814 29.8% 1.6% 3,762 44.0% 1.4% 4,721 41.2% 1.4% 5,639 39.1%
0.6% 1,908 29.6% 0.5% 2,185 26.9% 0.5% 2,449 24.8% 1.3% 2,685 39.8% 1.1% 3,239 36.2% 1.2% 3,839 34.1%
1.2% 285 39.7% 0.9% 302 38.6% 0.9% 317 37.8% 3.1% 419 56.5% 1.9% 452 54.7% 1.4% 476 53.7%
0.6% 1,623 28.3% 0.5% 1,883 25.6% 0.5% 2,133 23.5% 1.3% 2,266 37.7% 1.0% 2,787 34.3% 1.2% 3,363 32.4%
1.3% 176 55.0% 1.2% 236 51.6% 1.3% 295 50.4% 1.9% 208 58.7% 1.7% 291 56.5% 1.6% 366 55.3%
1.7% 720 59.1% 1.6% 901 53.4% 1.6% 1,070 50.5% 2.7% 869 66.0% 2.6% 1,191 63.4% 2.3% 1,435 60.7%
1.4% 246 54.5% 1.2% 288 48.5% 1.1% 325 45.1% 2.3% 280 59.5% 1.9% 346 55.2% 1.7% 402 52.9%
1.8% 474 62.1% 1.8% 614 56.2% 1.8% 744 53.3% 2.8% 589 69.8% 3.0% 845 67.5% 2.6% 1,033 64.4%
0.0% 0 45.0% 0.0% 0 45.0% 0.0% 0 45.0% 0.0% 0 51.8% 0.0% 1 51.8% 0.0% 1 51.8%
- 0 - - 0 - - 0 - - 0 - - 0 - - 0 -
0.6% 10,416 44.9% 0.6% 11,331 41.6% 0.6% 12,212 39.0% 1.0% 11,564 47.8% 1.0% 13,173 44.5% 0.9% 14,606 42.1%
Impairment
rate
Stock of
Provisions
Coverage Ratio -
Default Stock1
Impairment
rate
Stock of
Provisions
Coverage Ratio -
Default Stock1
Impairment
rate
Stock of
Provisions
Coverage Ratio -
Default Stock1
Impairment
rate
Stock of
Provisions
Coverage Ratio -
Default Stock1
Impairment
rate
Stock of
Provisions
Coverage Ratio -
Default Stock1
Impairment
rate
Stock of
Provisions
Coverage Ratio -
Default Stock1
- 0 - - 0 - - 0 - - 0 - - 0 - - 0 -
- 0 - - 0 - - 0 - - 0 - - 0 - - 0 -
1.2% 1,132 57.8% 1.2% 1,360 57.3% 1.1% 1,562 56.2% 3.8% 1,677 72.6% 0.5% 1,769 68.1% 0.4% 1,836 65.0%
- 0 - - 0 - - 0 - - 0 - - 0 - - 0 -
- 0 - - 0 - - 0 - - 0 - - 0 - - 0 -
- 0 - - 0 - - 0 - - 0 - - 0 - - 0 -
- 0 - - 0 - - 0 - - 0 - - 0 - - 0 -
- 0 - - 0 - - 0 - - 0 - - 0 - - 0 -
- 0 - - 0 - - 0 - - 0 - - 0 - - 0 -
- 0 - - 0 - - 0 - - 0 - - 0 - - 0 -
- 0 - - 0 - - 0 - - 0 - - 0 - - 0 -
- 0 - - 0 - - 0 - - 0 - - 0 - - 0 -
- 0 - - 0 - - 0 - - 0 - - 0 - - 0 -
- 0 - - 0 - - 0 - - 0 - - 0 - - 0 -
- 0 - - 0 - - 0 - - 0 - - 0 - - 0 -
1.2% 1,132 57.8% 1.2% 1,360 57.3% 1.1% 1,562 56.2% 3.8% 1,677 72.6% 0.5% 1,769 68.1% 0.4% 1,836 65.0%
31/12/2016 31/12/2017
Baseline Scenario Adverse Scenario
31/12/2018 31/12/2016 31/12/2017 31/12/2018
31/12/2016 31/12/2017 31/12/2018 31/12/2016 31/12/2017 31/12/2018
Baseline Scenario Adverse Scenario
31/12/2016 31/12/2017 31/12/2018
Baseline Scenario Adverse Scenario
31/12/2016 31/12/2017 31/12/2018
31/12/2017 31/12/2018 31/12/2016 31/12/2017 31/12/201831/12/2016
Baseline Scenario Adverse Scenario
2016 EU-wide Stress Test:
Credit risk IRBBanco Santander S.A.
(mln EUR, %)
Central banks and central governments
Institutions
Corporates
Corporates - Of Which: Specialised Lending
Corporates - Of Which: SME
Retail
Retail - Secured on real estate property
Retail - Secured on real estate property - Of Which: SME
Retail - Secured on real estate property - Of Which: non-SME
Retail - Qualifying Revolving
Retail - Other Retail
Retail - Other Retail - Of Which: SME
Retail - Other Retail - Of Which: non-SME
Equity
Securitisation
Other non-credit obligation assets
IRB TOTAL1 Computed as: Stock of provisions for defaulted stock / default stock (as defined in paragraphs 59 and 61 of the Methodological note)
(mln EUR, %)
Central banks and central governments
Institutions
Corporates
Corporates - Of Which: Specialised Lending
Corporates - Of Which: SME
Retail
Retail - Secured on real estate property
Retail - Secured on real estate property - Of Which: SME
Retail - Secured on real estate property - Of Which: non-SME
Retail - Qualifying Revolving
Retail - Other Retail
Retail - Other Retail - Of Which: SME
Retail - Other Retail - Of Which: non-SME
Equity
Securitisation
Other non-credit obligation assets
IRB TOTAL1 Computed as: Stock of provisions for defaulted stock / default stock (as defined in paragraphs 59 and 61 of the Methodological note)
(mln EUR, %)
Central banks and central governments
Institutions
Corporates
Corporates - Of Which: Specialised Lending
Corporates - Of Which: SME
Retail
Retail - Secured on real estate property
Retail - Secured on real estate property - Of Which: SME
Retail - Secured on real estate property - Of Which: non-SME
Retail - Qualifying Revolving
Retail - Other Retail
Retail - Other Retail - Of Which: SME
Retail - Other Retail - Of Which: non-SME
Equity
Securitisation
Other non-credit obligation assets
IRB TOTAL1 Computed as: Stock of provisions for defaulted stock / default stock (as defined in paragraphs 59 and 61 of the Methodological note)
(mln EUR, %)
Central banks and central governments
Institutions
Corporates
Corporates - Of Which: Specialised Lending
Corporates - Of Which: SME
Retail
Retail - Secured on real estate property
Retail - Secured on real estate property - Of Which: SME
Retail - Secured on real estate property - Of Which: non-SME
Retail - Qualifying Revolving
Retail - Other Retail
Retail - Other Retail - Of Which: SME
Retail - Other Retail - Of Which: non-SME
Equity
Securitisation
Other non-credit obligation assets
IRB TOTAL1 Computed as: Stock of provisions for defaulted stock / default stock (as defined in paragraphs 59 and 61 of the Methodological note)
Portugal
Chile
Mexico
United States
Impairment
rate
Stock of
Provisions
Coverage Ratio -
Default Stock1
Impairment
rate
Stock of
Provisions
Coverage Ratio -
Default Stock1
Impairment
rate
Stock of
Provisions
Coverage Ratio -
Default Stock1
Impairment
rate
Stock of
Provisions
Coverage Ratio -
Default Stock1
Impairment
rate
Stock of
Provisions
Coverage Ratio -
Default Stock1
Impairment
rate
Stock of
Provisions
Coverage Ratio -
Default Stock1
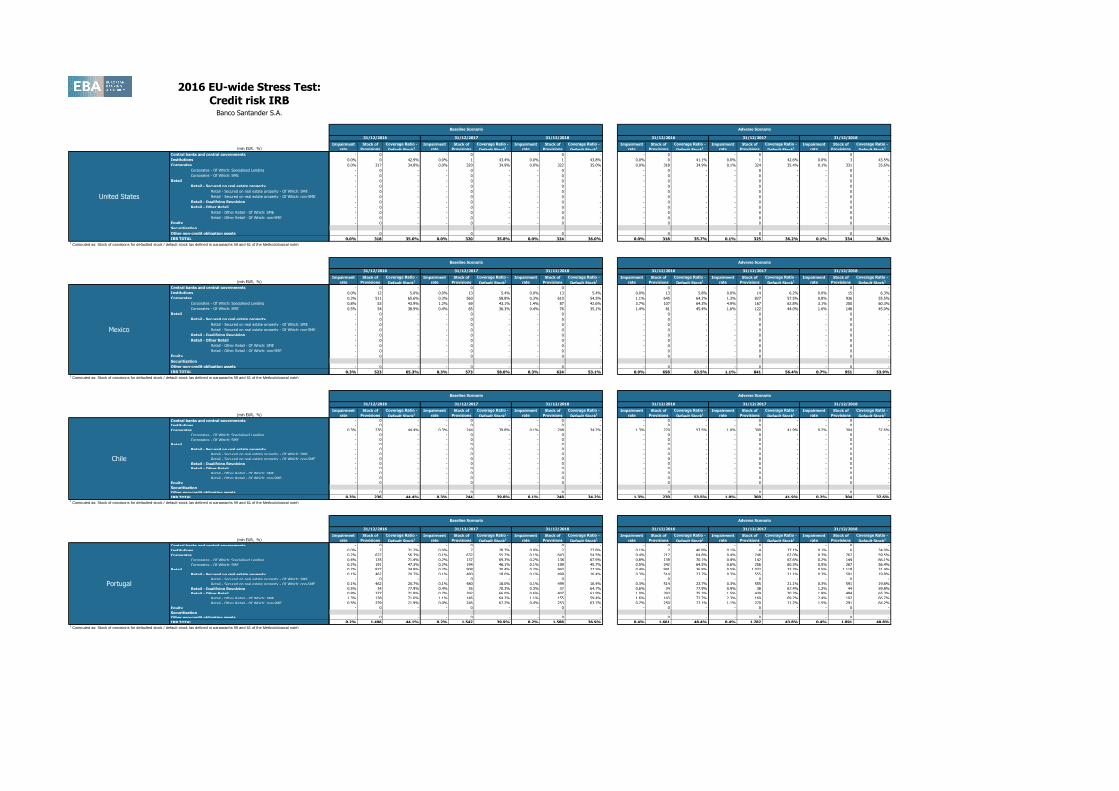
- 0 - - 0 - - 0 - - 0 - - 0 - - 0 -
0.0% 0 42.9% 0.0% 1 43.4% 0.0% 1 43.8% 0.0% 0 41.1% 0.0% 1 42.6% 0.0% 3 43.5%
0.0% 317 34.8% 0.0% 320 34.9% 0.0% 322 35.0% 0.0% 318 34.9% 0.1% 324 35.4% 0.1% 331 35.6%
- 0 - - 0 - - 0 - - 0 - - 0 - - 0 -
- 0 - - 0 - - 0 - - 0 - - 0 - - 0 -
- 0 - - 0 - - 0 - - 0 - - 0 - - 0 -
- 0 - - 0 - - 0 - - 0 - - 0 - - 0 -
- 0 - - 0 - - 0 - - 0 - - 0 - - 0 -
- 0 - - 0 - - 0 - - 0 - - 0 - - 0 -
- 0 - - 0 - - 0 - - 0 - - 0 - - 0 -
- 0 - - 0 - - 0 - - 0 - - 0 - - 0 -
- 0 - - 0 - - 0 - - 0 - - 0 - - 0 -
- 0 - - 0 - - 0 - - 0 - - 0 - - 0 -
- 0 - - 0 - - 0 - - 0 - - 0 - - 0 -
- 0 - - 0 - - 0 - - 0 - - 0 - - 0 -
0.0% 318 35.6% 0.0% 320 35.8% 0.0% 324 36.0% 0.0% 318 35.7% 0.1% 325 36.2% 0.1% 334 36.5%
Impairment
rate
Stock of
Provisions
Coverage Ratio -
Default Stock1
Impairment
rate
Stock of
Provisions
Coverage Ratio -
Default Stock1
Impairment
rate
Stock of
Provisions
Coverage Ratio -
Default Stock1
Impairment
rate
Stock of
Provisions
Coverage Ratio -
Default Stock1
Impairment
rate
Stock of
Provisions
Coverage Ratio -
Default Stock1
Impairment
rate
Stock of
Provisions
Coverage Ratio -
Default Stock1
- 0 - - 0 - - 0 - - 0 - - 0 - - 0 -
0.0% 12 5.0% 0.0% 13 5.4% 0.0% 13 5.4% 0.0% 13 5.8% 0.0% 14 6.2% 0.0% 15 6.3%
0.3% 511 65.6% 0.3% 560 58.8% 0.3% 610 54.5% 1.1% 645 64.2% 1.3% 827 57.5% 0.8% 936 55.5%
0.8% 53 43.9% 1.2% 69 43.1% 1.4% 87 42.6% 3.7% 107 64.3% 4.9% 167 62.8% 3.1% 200 60.3%
0.5% 54 38.9% 0.4% 65 36.3% 0.4% 76 35.1% 1.4% 81 45.4% 1.6% 122 44.0% 1.0% 148 45.0%
- 0 - - 0 - - 0 - - 0 - - 0 - - 0 -
- 0 - - 0 - - 0 - - 0 - - 0 - - 0 -
- 0 - - 0 - - 0 - - 0 - - 0 - - 0 -
- 0 - - 0 - - 0 - - 0 - - 0 - - 0 -
- 0 - - 0 - - 0 - - 0 - - 0 - - 0 -
- 0 - - 0 - - 0 - - 0 - - 0 - - 0 -
- 0 - - 0 - - 0 - - 0 - - 0 - - 0 -
- 0 - - 0 - - 0 - - 0 - - 0 - - 0 -
- 0 - - 0 - - 0 - - 0 - - 0 - - 0 -
- 0 - - 0 - - 0 - - 0 - - 0 - - 0 -
0.3% 523 65.3% 0.3% 573 58.0% 0.3% 624 53.1% 0.9% 658 63.5% 1.1% 841 56.4% 0.7% 951 53.9%
Impairment
rate
Stock of
Provisions
Coverage Ratio -
Default Stock1
Impairment
rate
Stock of
Provisions
Coverage Ratio -
Default Stock1
Impairment
rate
Stock of
Provisions
Coverage Ratio -
Default Stock1
Impairment
rate
Stock of
Provisions
Coverage Ratio -
Default Stock1
Impairment
rate
Stock of
Provisions
Coverage Ratio -
Default Stock1
Impairment
rate
Stock of
Provisions
Coverage Ratio -
Default Stock1
- 0 - - 0 - - 0 - - 0 - - 0 - - 0 -
- 0 - - 0 - - 0 - - 0 - - 0 - - 0 -
0.3% 236 44.4% 0.3% 244 39.8% 0.1% 248 34.2% 1.3% 270 53.5% 1.0% 300 41.9% 0.2% 304 37.6%
- 0 - - 0 - - 0 - - 0 - - 0 - - 0 -
- 0 - - 0 - - 0 - - 0 - - 0 - - 0 -
- 0 - - 0 - - 0 - - 0 - - 0 - - 0 -
- 0 - - 0 - - 0 - - 0 - - 0 - - 0 -
- 0 - - 0 - - 0 - - 0 - - 0 - - 0 -
- 0 - - 0 - - 0 - - 0 - - 0 - - 0 -
- 0 - - 0 - - 0 - - 0 - - 0 - - 0 -
- 0 - - 0 - - 0 - - 0 - - 0 - - 0 -
- 0 - - 0 - - 0 - - 0 - - 0 - - 0 -
- 0 - - 0 - - 0 - - 0 - - 0 - - 0 -
- 0 - - 0 - - 0 - - 0 - - 0 - - 0 -
- 0 - - 0 - - 0 - - 0 - - 0 - - 0 -
0.3% 236 44.4% 0.3% 244 39.8% 0.1% 248 34.2% 1.3% 270 53.5% 1.0% 300 41.9% 0.2% 304 37.6%
Impairment
rate
Stock of
Provisions
Coverage Ratio -
Default Stock1
Impairment
rate
Stock of
Provisions
Coverage Ratio -
Default Stock1
Impairment
rate
Stock of
Provisions
Coverage Ratio -
Default Stock1
Impairment
rate
Stock of
Provisions
Coverage Ratio -
Default Stock1
Impairment
rate
Stock of
Provisions
Coverage Ratio -
Default Stock1
Impairment
rate
Stock of
Provisions
Coverage Ratio -
Default Stock1
- 0 - - 0 - - 0 - - 0 - - 0 - - 0 -
0.0% 2 31.2% 0.0% 2 28.7% 0.0% 2 27.8% 0.1% 2 40.8% 0.1% 4 37.1% 0.1% 6 34.0%
0.2% 622 56.3% 0.1% 632 55.2% 0.1% 643 54.5% 0.4% 717 64.8% 0.4% 746 62.0% 0.3% 767 59.5%
0.4% 135 71.4% 0.2% 137 69.3% 0.2% 138 67.9% 0.8% 139 70.1% 0.4% 142 67.6% 0.2% 144 66.1%
0.2% 191 47.3% 0.2% 194 46.1% 0.1% 199 45.7% 0.5% 242 64.5% 0.6% 256 60.3% 0.5% 267 56.4%
0.2% 872 34.8% 0.2% 908 30.4% 0.2% 943 27.5% 0.4% 941 36.8% 0.5% 1,032 33.3% 0.5% 1,118 31.4%
0.1% 462 20.7% 0.1% 480 18.0% 0.1% 499 16.4% 0.3% 514 23.7% 0.3% 555 21.1% 0.3% 591 19.8%
- 0 - - 0 - - 0 - - 0 - - 0 - - 0 -
0.1% 462 20.7% 0.1% 480 18.0% 0.1% 499 16.4% 0.3% 514 23.7% 0.3% 555 21.1% 0.3% 591 19.8%
0.5% 34 77.9% 0.4% 35 70.3% 0.3% 37 64.7% 0.6% 34 77.9% 0.9% 38 67.4% 1.2% 44 59.8%
0.8% 377 71.8% 0.7% 392 66.0% 0.6% 407 61.9% 1.0% 393 75.3% 1.5% 439 70.3% 1.8% 484 65.3%
1.3% 138 71.6% 1.1% 146 64.2% 1.1% 155 59.4% 1.6% 143 72.7% 2.3% 169 69.2% 2.4% 192 66.7%
0.5% 239 71.9% 0.4% 246 67.2% 0.4% 253 63.7% 0.7% 250 77.1% 1.1% 270 71.2% 1.5% 291 64.2%
- 0 - - 0 - - 0 - - 0 - - 0 - - 0 -
- 0 - - 0 - - 0 - - 0 - - 0 - - 0 -
0.2% 1,496 44.1% 0.2% 1,542 39.9% 0.2% 1,588 36.9% 0.4% 1,661 48.4% 0.4% 1,782 43.8% 0.4% 1,891 40.8%
31/12/2016 31/12/2017
Baseline Scenario Adverse Scenario
31/12/2018 31/12/2016 31/12/2017 31/12/2018
31/12/2016 31/12/2017 31/12/2018 31/12/2016 31/12/2017 31/12/2018
Baseline Scenario Adverse Scenario
31/12/2016 31/12/2017
Baseline Scenario Adverse Scenario
31/12/2018 31/12/2016 31/12/2017 31/12/2018
31/12/2016 31/12/2017 31/12/2018 31/12/2016 31/12/2017 31/12/2018
Baseline Scenario Adverse Scenario
2016 EU-wide Stress Test:
Credit risk IRBBanco Santander S.A.
(mln EUR, %)
Central banks and central governments
Institutions
Corporates
Corporates - Of Which: Specialised Lending
Corporates - Of Which: SME
Retail
Retail - Secured on real estate property
Retail - Secured on real estate property - Of Which: SME
Retail - Secured on real estate property - Of Which: non-SME
Retail - Qualifying Revolving
Retail - Other Retail
Retail - Other Retail - Of Which: SME
Retail - Other Retail - Of Which: non-SME
Equity
Securitisation
Other non-credit obligation assets
IRB TOTAL1 Computed as: Stock of provisions for defaulted stock / default stock (as defined in paragraphs 59 and 61 of the Methodological note)
(mln EUR, %)
Central banks and central governments
Institutions
Corporates
Corporates - Of Which: Specialised Lending
Corporates - Of Which: SME
Retail
Retail - Secured on real estate property
Retail - Secured on real estate property - Of Which: SME
Retail - Secured on real estate property - Of Which: non-SME
Retail - Qualifying Revolving
Retail - Other Retail
Retail - Other Retail - Of Which: SME
Retail - Other Retail - Of Which: non-SME
Equity
Securitisation
Other non-credit obligation assets
IRB TOTAL1 Computed as: Stock of provisions for defaulted stock / default stock (as defined in paragraphs 59 and 61 of the Methodological note)
(mln EUR, %)
Central banks and central governments
Institutions
Corporates
Corporates - Of Which: Specialised Lending
Corporates - Of Which: SME
Retail
Retail - Secured on real estate property
Retail - Secured on real estate property - Of Which: SME
Retail - Secured on real estate property - Of Which: non-SME
Retail - Qualifying Revolving
Retail - Other Retail
Retail - Other Retail - Of Which: SME
Retail - Other Retail - Of Which: non-SME
Equity
Securitisation
Other non-credit obligation assets
IRB TOTAL1 Computed as: Stock of provisions for defaulted stock / default stock (as defined in paragraphs 59 and 61 of the Methodological note)
France
Poland
Germany
Impairment
rate
Stock of
Provisions
Coverage Ratio -
Default Stock1
Impairment
rate
Stock of
Provisions
Coverage Ratio -
Default Stock1
Impairment
rate
Stock of
Provisions
Coverage Ratio -
Default Stock1
Impairment
rate
Stock of
Provisions
Coverage Ratio -
Default Stock1
Impairment
rate
Stock of
Provisions
Coverage Ratio -
Default Stock1
Impairment
rate
Stock of
Provisions
Coverage Ratio -
Default Stock1
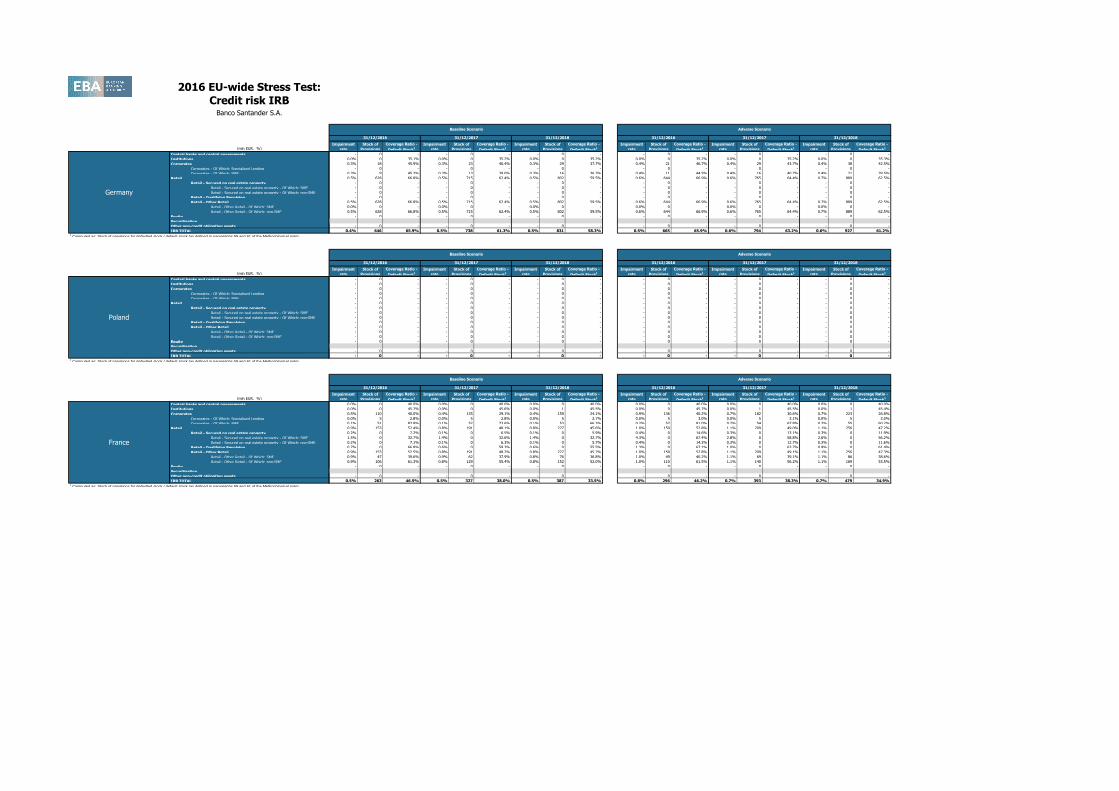
- 0 - - 0 - - 0 - - 0 - - 0 - - 0 -
0.0% 0 35.1% 0.0% 0 35.2% 0.0% 0 35.2% 0.0% 0 35.2% 0.0% 0 35.2% 0.0% 0 35.3%
0.3% 18 45.9% 0.3% 23 40.4% 0.3% 29 37.7% 0.4% 21 46.7% 0.4% 29 43.7% 0.4% 38 42.5%
- 0 - - 0 - - 0 - - 0 - - 0 - - 0 -
0.3% 9 45.2% 0.3% 13 39.0% 0.3% 16 36.3% 0.4% 11 44.5% 0.4% 16 40.7% 0.4% 21 39.5%
0.5% 628 66.8% 0.5% 715 62.4% 0.5% 802 59.5% 0.6% 644 66.9% 0.6% 765 64.4% 0.7% 889 62.5%
- 0 - - 0 - - 0 - - 0 - - 0 - - 0 -
- 0 - - 0 - - 0 - - 0 - - 0 - - 0 -
- 0 - - 0 - - 0 - - 0 - - 0 - - 0 -
- 0 - - 0 - - 0 - - 0 - - 0 - - 0 -
0.5% 628 66.8% 0.5% 715 62.4% 0.5% 802 59.5% 0.6% 644 66.9% 0.6% 765 64.4% 0.7% 889 62.5%
0.0% 0 - 0.0% 0 - 0.0% 0 - 0.0% 0 - 0.0% 0 - 0.0% 0 -
0.5% 628 66.8% 0.5% 715 62.4% 0.5% 802 59.5% 0.6% 644 66.9% 0.6% 765 64.4% 0.7% 889 62.5%
- 0 - - 0 - - 0 - - 0 - - 0 - - 0 -
- 0 - - 0 - - 0 - - 0 - - 0 - - 0 -
0.4% 646 65.9% 0.5% 738 61.3% 0.5% 831 58.3% 0.5% 665 65.9% 0.6% 794 63.2% 0.6% 927 61.2%
Impairment
rate
Stock of
Provisions
Coverage Ratio -
Default Stock1
Impairment
rate
Stock of
Provisions
Coverage Ratio -
Default Stock1
Impairment
rate
Stock of
Provisions
Coverage Ratio -
Default Stock1
Impairment
rate
Stock of
Provisions
Coverage Ratio -
Default Stock1
Impairment
rate
Stock of
Provisions
Coverage Ratio -
Default Stock1
Impairment
rate
Stock of
Provisions
Coverage Ratio -
Default Stock1
- 0 - - 0 - - 0 - - 0 - - 0 - - 0 -
- 0 - - 0 - - 0 - - 0 - - 0 - - 0 -
- 0 - - 0 - - 0 - - 0 - - 0 - - 0 -
- 0 - - 0 - - 0 - - 0 - - 0 - - 0 -
- 0 - - 0 - - 0 - - 0 - - 0 - - 0 -
- 0 - - 0 - - 0 - - 0 - - 0 - - 0 -
- 0 - - 0 - - 0 - - 0 - - 0 - - 0 -
- 0 - - 0 - - 0 - - 0 - - 0 - - 0 -
- 0 - - 0 - - 0 - - 0 - - 0 - - 0 -
- 0 - - 0 - - 0 - - 0 - - 0 - - 0 -
- 0 - - 0 - - 0 - - 0 - - 0 - - 0 -
- 0 - - 0 - - 0 - - 0 - - 0 - - 0 -
- 0 - - 0 - - 0 - - 0 - - 0 - - 0 -
- 0 - - 0 - - 0 - - 0 - - 0 - - 0 -
- 0 - - 0 - - 0 - - 0 - - 0 - - 0 -
- 0 - - 0 - - 0 - - 0 - - 0 - - 0 -
Impairment
rate
Stock of
Provisions
Coverage Ratio -
Default Stock1
Impairment
rate
Stock of
Provisions
Coverage Ratio -
Default Stock1
Impairment
rate
Stock of
Provisions
Coverage Ratio -
Default Stock1
Impairment
rate
Stock of
Provisions
Coverage Ratio -
Default Stock1
Impairment
rate
Stock of
Provisions
Coverage Ratio -
Default Stock1
Impairment
rate
Stock of
Provisions
Coverage Ratio -
Default Stock1
0.0% 0 40.0% 0.0% 0 40.0% 0.0% 0 40.0% 0.0% 0 40.0% 0.0% 0 40.0% 0.0% 0 40.0%
0.0% 0 45.7% 0.0% 0 45.6% 0.0% 1 45.5% 0.0% 0 45.7% 0.0% 1 45.5% 0.0% 1 45.4%
0.5% 110 40.0% 0.4% 135 29.1% 0.4% 159 24.1% 0.9% 136 40.2% 0.7% 182 30.6% 0.7% 223 26.8%
0.0% 5 2.8% 0.0% 5 2.8% 0.0% 5 2.7% 0.0% 5 3.0% 0.0% 5 3.1% 0.0% 5 3.0%
0.1% 51 83.8% 0.1% 52 73.6% 0.1% 53 66.3% 0.2% 52 81.0% 0.2% 54 67.8% 0.2% 55 60.2%
0.9% 153 52.4% 0.8% 191 48.1% 0.8% 227 45.6% 1.0% 159 52.8% 1.1% 209 49.0% 1.1% 256 47.2%
0.2% 0 7.2% 0.1% 0 6.5% 0.1% 0 5.9% 0.4% 0 14.6% 0.3% 0 13.1% 0.3% 0 11.9%
1.5% 0 32.7% 1.4% 0 32.6% 1.4% 0 32.7% 4.3% 0 67.4% 2.8% 0 58.8% 2.6% 0 56.2%
0.2% 0 7.1% 0.1% 0 6.3% 0.1% 0 5.7% 0.4% 0 14.3% 0.3% 0 12.7% 0.3% 0 11.6%
0.7% 0 66.8% 0.6% 0 59.3% 0.6% 0 55.5% 1.3% 0 67.1% 1.0% 0 63.7% 0.9% 0 61.4%
0.9% 153 52.5% 0.8% 191 48.2% 0.8% 227 45.7% 1.0% 159 52.8% 1.1% 209 49.1% 1.1% 256 47.3%
0.9% 47 39.6% 0.9% 62 37.9% 0.8% 76 36.8% 1.0% 49 40.2% 1.1% 69 39.1% 1.1% 86 38.6%
0.9% 106 61.3% 0.8% 129 55.4% 0.8% 152 52.0% 1.0% 110 61.5% 1.1% 140 56.2% 1.1% 169 53.5%
- 0 - - 0 - - 0 - - 0 - - 0 - - 0 -
- 0 - - 0 - - 0 - - 0 - - 0 - - 0 -
0.5% 263 46.5% 0.5% 327 38.0% 0.5% 387 33.5% 0.8% 296 46.2% 0.7% 393 38.3% 0.7% 479 34.9%
31/12/2016 31/12/2017 31/12/2018 31/12/2016 31/12/2017 31/12/2018
Baseline Scenario Adverse Scenario
31/12/2016 31/12/2017
Baseline Scenario Adverse Scenario
31/12/2018 31/12/2016 31/12/2017 31/12/2018
31/12/2016 31/12/2017 31/12/2018 31/12/2016 31/12/2017 31/12/2018
Baseline Scenario Adverse Scenario
2016 EU-wide Stress Test:
Credit risk STABanco Santander S.A.
Non-defaulted Defaulted Non-defaulted Defaulted Non-defaulted Defaulted
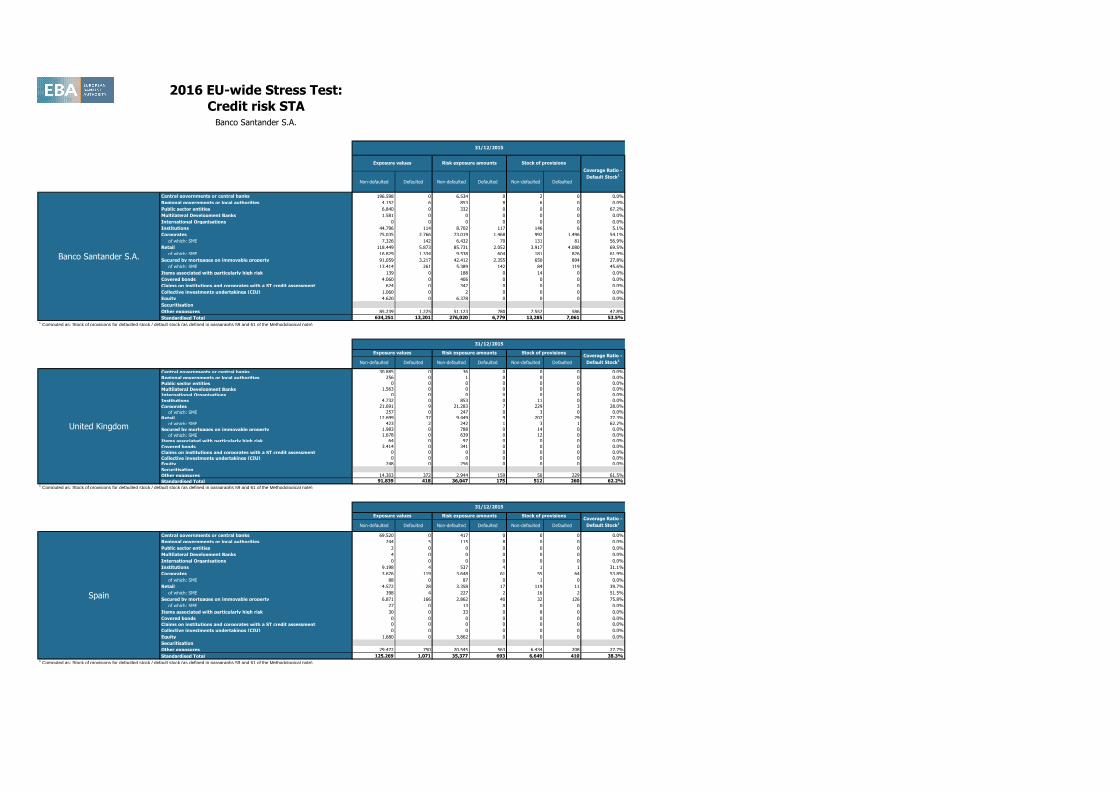
Central governments or central banks 196,598 0 6,534 0 2 0 0.0%
Regional governments or local authorities 4,152 6 853 8 6 0 0.0%
Public sector entities 6,840 0 332 0 0 0 67.2%
Multilateral Development Banks 1,581 0 0 0 0 0 0.0%
International Organisations 0 0 0 0 0 0 0.0%
Institutions 44,796 114 8,702 117 146 6 5.1%
Corporates 75,035 2,766 73,019 1,468 992 1,496 54.1%
of which: SME 7,326 142 6,432 70 131 81 56.9%
Retail 118,449 5,873 85,731 2,052 3,917 4,080 69.5%
of which: SME 16,829 1,334 9,538 604 181 826 61.9%
Secured by mortgages on immovable property 91,059 3,217 42,412 2,355 650 894 27.8%
of which: SME 13,414 261 5,389 142 84 119 45.6%
Items associated with particularly high risk 139 0 188 0 14 0 0.0%
Covered bonds 4,060 0 406 0 0 0 0.0%
Claims on institutions and corporates with a ST credit assessment 624 0 342 0 0 0 0.0%
Collective investments undertakings (CIU) 1,060 0 2 0 0 0 0.0%
Equity 4,620 0 6,378 0 0 0 0.0%
Securitisation
Other exposures 85,239 1,225 51,123 780 7,557 586 47.8%
Standardised Total 634,251 13,201 276,020 6,779 13,285 7,061 53.5%1 Computed as: Stock of provisions for defaulted stock / default stock (as defined in paragraphs 59 and 61 of the Methodological note)
Non-defaulted Defaulted Non-defaulted Defaulted Non-defaulted Defaulted
Central governments or central banks 30,885 0 36 0 0 0 0.0%
Regional governments or local authorities 256 0 1 0 0 0 0.0%
Public sector entities 0 0 0 0 0 0 0.0%
Multilateral Development Banks 1,563 0 0 0 0 0 0.0%
International Organisations 0 0 0 0 0 0 0.0%
Institutions 4,732 0 853 0 11 0 0.0%
Corporates 21,691 9 21,283 7 229 3 28.0%
of which: SME 257 0 247 0 3 0 0.0%
Retail 12,699 37 9,449 9 207 29 77.3%
of which: SME 423 2 242 1 3 1 62.2%
Secured by mortgages on immovable property 1,983 0 788 0 14 0 0.0%
of which: SME 1,678 0 639 0 12 0 0.0%
Items associated with particularly high risk 64 0 97 0 0 0 0.0%
Covered bonds 3,414 0 341 0 0 0 0.0%
Claims on institutions and corporates with a ST credit assessment 0 0 0 0 0 0 0.0%
Collective investments undertakings (CIU) 0 0 0 0 0 0 0.0%
Equity 248 0 256 0 0 0 0.0%
Securitisation
Other exposures 14,303 372 2,944 159 50 229 61.5%
Standardised Total 91,839 418 36,047 175 512 260 62.2%1 Computed as: Stock of provisions for defaulted stock / default stock (as defined in paragraphs 59 and 61 of the Methodological note)
Non-defaulted Defaulted Non-defaulted Defaulted Non-defaulted Defaulted
Central governments or central banks 69,520 0 417 0 0 0 0.0%
Regional governments or local authorities 244 5 115 8 0 0 0.0%
Public sector entities 2 0 0 0 0 0 0.0%
Multilateral Development Banks 4 0 0 0 0 0 0.0%
International Organisations 0 0 0 0 0 0 0.0%
Institutions 9,198 4 537 4 1 1 31.1%
Corporates 3,676 119 3,648 61 55 64 53.8%
of which: SME 88 0 87 0 1 0 0.0%
Retail 4,572 28 3,358 17 119 11 39.7%
of which: SME 398 4 227 2 16 2 51.5%
Secured by mortgages on immovable property 6,871 166 2,862 40 32 126 75.8%
of which: SME 27 0 13 0 0 0 0.0%
Items associated with particularly high risk 30 0 33 0 8 0 0.0%
Covered bonds 0 0 0 0 0 0 0.0%
Claims on institutions and corporates with a ST credit assessment 0 0 0 0 0 0 0.0%
Collective investments undertakings (CIU) 0 0 0 0 0 0 0.0%
Equity 1,680 0 3,862 0 0 0 0.0%
Securitisation
Other exposures 29,472 750 20,545 563 6,434 208 27.7%
Standardised Total 125,269 1,071 35,377 693 6,649 410 38.3%1 Computed as: Stock of provisions for defaulted stock / default stock (as defined in paragraphs 59 and 61 of the Methodological note)
Spain
Exposure values Risk exposure amounts Stock of provisionsCoverage Ratio -
Default Stock1
United Kingdom
31/12/2015
31/12/2015
Exposure values Risk exposure amounts Stock of provisionsCoverage Ratio -
Default Stock1
Banco Santander S.A.
31/12/2015
Exposure values Risk exposure amounts Stock of provisions
Coverage Ratio -
Default Stock1
2016 EU-wide Stress Test:
Credit risk STABanco Santander S.A.
Non-defaulted Defaulted Non-defaulted Defaulted Non-defaulted Defaulted
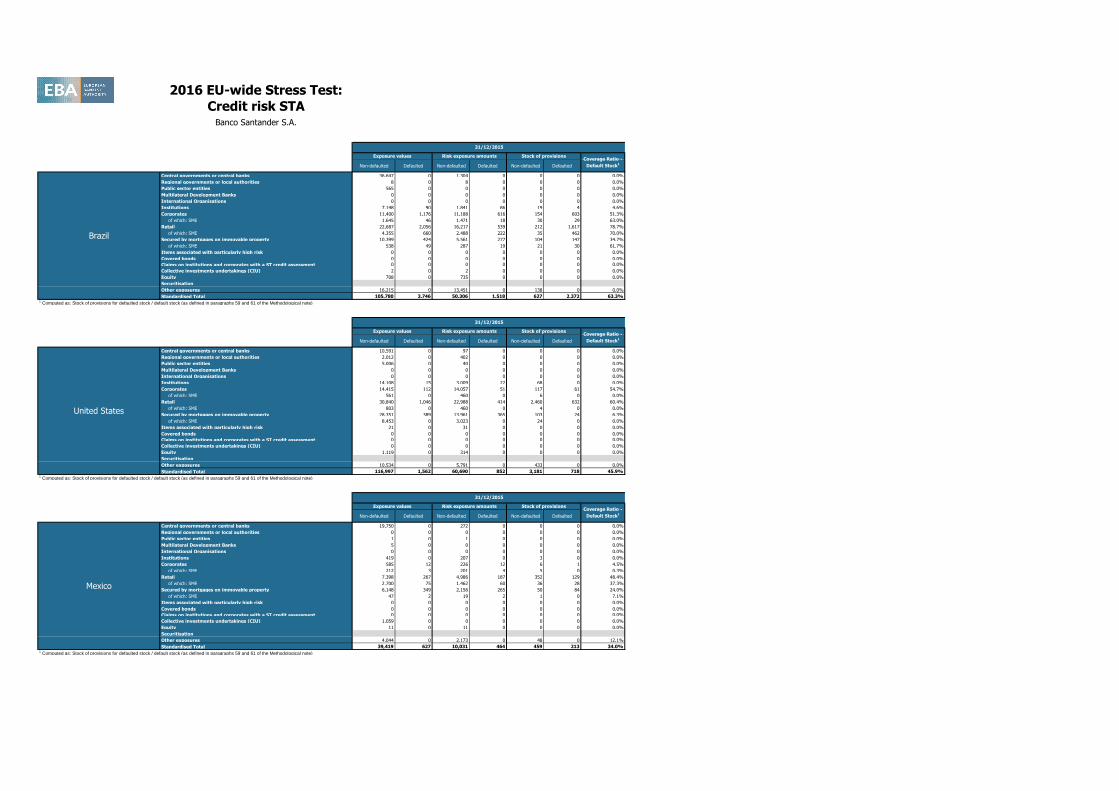
Central governments or central banks 36,647 0 1,304 0 0 0 0.0%
Regional governments or local authorities 8 0 8 0 0 0 0.0%
Public sector entities 565 0 0 0 0 0 0.0%
Multilateral Development Banks 0 0 0 0 0 0 0.0%
International Organisations 0 0 0 0 0 0 0.0%
Institutions 7,148 90 1,841 86 19 4 4.6%
Corporates 11,400 1,176 11,188 616 154 603 51.3%
of which: SME 1,645 46 1,471 18 30 29 63.0%
Retail 22,687 2,056 16,217 539 212 1,617 78.7%
of which: SME 4,355 660 2,488 222 35 462 70.0%
Secured by mortgages on immovable property 10,399 424 5,561 277 104 147 34.7%
of which: SME 538 49 287 19 21 30 61.7%
Items associated with particularly high risk 0 0 0 0 0 0 0.0%
Covered bonds 0 0 0 0 0 0 0.0%
Claims on institutions and corporates with a ST credit assessment 0 0 0 0 0 0 0.0%
Collective investments undertakings (CIU) 2 0 2 0 0 0 0.0%
Equity 708 0 735 0 0 0 0.0%
Securitisation
Other exposures 16,215 0 13,451 0 138 0 0.0%
Standardised Total 105,780 3,746 50,306 1,518 627 2,372 63.3%1 Computed as: Stock of provisions for defaulted stock / default stock (as defined in paragraphs 59 and 61 of the Methodological note)
Non-defaulted Defaulted Non-defaulted Defaulted Non-defaulted Defaulted
Central governments or central banks 10,591 0 97 0 0 0 0.0%
Regional governments or local authorities 2,012 0 402 0 0 0 0.0%
Public sector entities 5,006 0 40 0 0 0 0.0%
Multilateral Development Banks 0 0 0 0 0 0 0.0%
International Organisations 0 0 0 0 0 0 0.0%
Institutions 14,108 15 3,009 22 68 0 0.0%
Corporates 14,415 112 14,057 51 117 61 54.7%
of which: SME 561 0 460 0 6 0 0.0%
Retail 30,840 1,046 22,988 414 2,460 632 60.4%
of which: SME 803 0 460 0 4 0 0.0%
Secured by mortgages on immovable property 28,351 389 13,961 365 103 24 6.3%
of which: SME 8,453 0 3,023 0 24 0 0.0%
Items associated with particularly high risk 21 0 31 0 0 0 0.0%
Covered bonds 0 0 0 0 0 0 0.0%
Claims on institutions and corporates with a ST credit assessment 0 0 0 0 0 0 0.0%
Collective investments undertakings (CIU) 0 0 0 0 0 0 0.0%
Equity 1,119 0 314 0 0 0 0.0%
Securitisation
Other exposures 10,534 0 5,791 0 433 0 0.0%
Standardised Total 116,997 1,562 60,690 852 3,181 718 45.9%1 Computed as: Stock of provisions for defaulted stock / default stock (as defined in paragraphs 59 and 61 of the Methodological note)
Non-defaulted Defaulted Non-defaulted Defaulted Non-defaulted Defaulted
Central governments or central banks 19,750 0 272 0 0 0 0.0%
Regional governments or local authorities 0 0 0 0 0 0 0.0%
Public sector entities 1 0 1 0 0 0 0.0%
Multilateral Development Banks 5 0 0 0 0 0 0.0%
International Organisations 0 0 0 0 0 0 0.0%
Institutions 419 0 207 0 3 0 0.0%
Corporates 585 12 226 12 6 1 4.5%
of which: SME 212 3 201 4 5 0 0.3%
Retail 7,398 267 4,986 187 352 129 48.4%
of which: SME 2,700 75 1,462 60 36 28 37.3%
Secured by mortgages on immovable property 6,148 349 2,156 265 50 84 24.0%
of which: SME 47 2 19 2 1 0 7.1%
Items associated with particularly high risk 0 0 0 0 0 0 0.0%
Covered bonds 0 0 0 0 0 0 0.0%
Claims on institutions and corporates with a ST credit assessment 0 0 0 0 0 0 0.0%
Collective investments undertakings (CIU) 1,059 0 0 0 0 0 0.0%
Equity 11 0 11 0 0 0 0.0%
Securitisation
Other exposures 4,044 0 2,173 0 48 0 12.1%
Standardised Total 39,419 627 10,031 464 459 213 34.0%1 Computed as: Stock of provisions for defaulted stock / default stock (as defined in paragraphs 59 and 61 of the Methodological note)
Mexico
Exposure values Risk exposure amounts Stock of provisionsCoverage Ratio -
Default Stock1
United States
31/12/2015
Exposure values Risk exposure amounts Stock of provisionsCoverage Ratio -
Default Stock1
Brazil
31/12/2015
Exposure values Risk exposure amounts Stock of provisionsCoverage Ratio -
Default Stock1
31/12/2015
2016 EU-wide Stress Test:
Credit risk STABanco Santander S.A.
Non-defaulted Defaulted Non-defaulted Defaulted Non-defaulted Defaulted
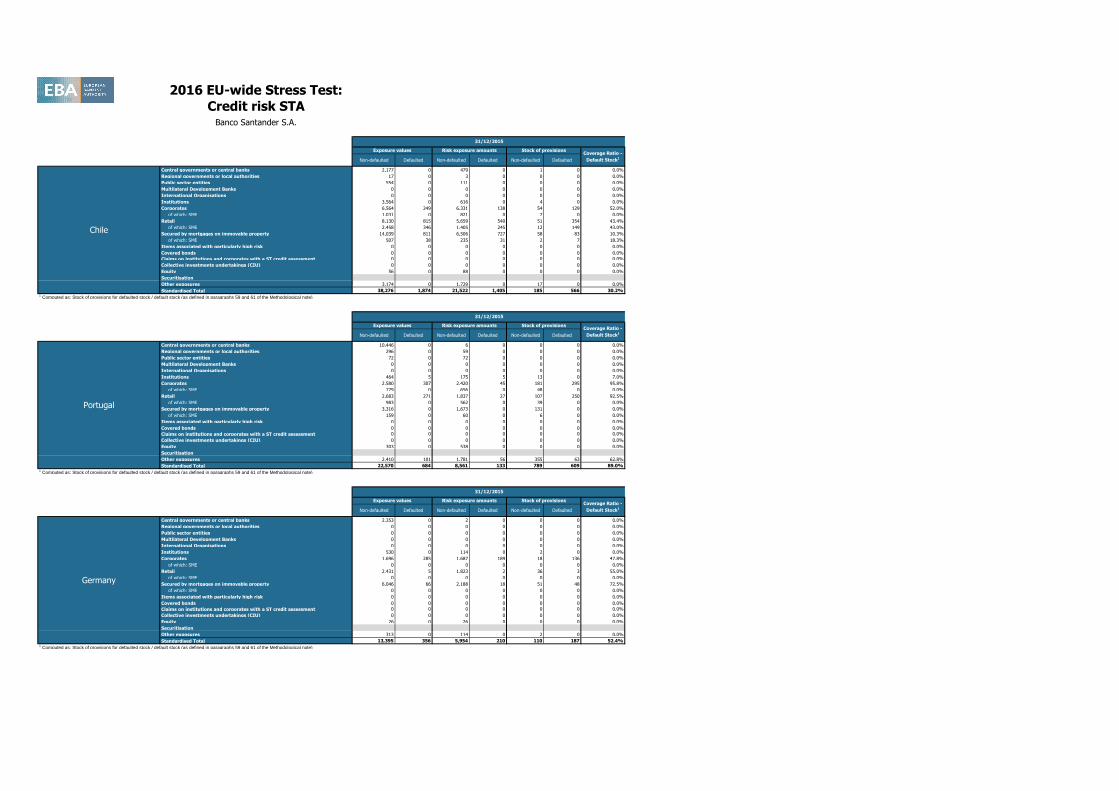
Central governments or central banks 2,177 0 479 0 1 0 0.0%
Regional governments or local authorities 17 0 3 0 0 0 0.0%
Public sector entities 554 0 111 0 0 0 0.0%
Multilateral Development Banks 0 0 0 0 0 0 0.0%
International Organisations 0 0 0 0 0 0 0.0%
Institutions 3,564 0 616 0 4 0 0.0%
Corporates 6,564 249 6,331 138 54 129 52.0%
of which: SME 1,031 0 821 0 7 0 0.0%
Retail 8,130 815 5,659 540 51 354 43.4%
of which: SME 2,458 346 1,405 245 12 149 43.0%
Secured by mortgages on immovable property 14,039 811 6,506 727 58 83 10.3%
of which: SME 507 38 235 31 2 7 18.3%
Items associated with particularly high risk 0 0 0 0 0 0 0.0%
Covered bonds 0 0 0 0 0 0 0.0%
Claims on institutions and corporates with a ST credit assessment 0 0 0 0 0 0 0.0%
Collective investments undertakings (CIU) 0 0 0 0 0 0 0.0%
Equity 56 0 88 0 0 0 0.0%
Securitisation
Other exposures 3,174 0 1,729 0 17 0 0.0%
Standardised Total 38,276 1,874 21,522 1,405 185 566 30.2%1 Computed as: Stock of provisions for defaulted stock / default stock (as defined in paragraphs 59 and 61 of the Methodological note)
Non-defaulted Defaulted Non-defaulted Defaulted Non-defaulted Defaulted
Central governments or central banks 10,446 0 6 0 0 0 0.0%
Regional governments or local authorities 296 0 59 0 0 0 0.0%
Public sector entities 72 0 72 0 0 0 0.0%
Multilateral Development Banks 0 0 0 0 0 0 0.0%
International Organisations 0 0 0 0 0 0 0.0%
Institutions 464 5 175 5 13 0 7.0%
Corporates 2,580 307 2,420 45 181 295 95.8%
of which: SME 779 0 656 0 48 0 0.0%
Retail 2,683 271 1,837 27 107 250 92.5%
of which: SME 983 0 562 0 39 0 0.0%
Secured by mortgages on immovable property 3,316 0 1,673 0 131 0 0.0%
of which: SME 159 0 60 0 6 0 0.0%
Items associated with particularly high risk 0 0 0 0 0 0 0.0%
Covered bonds 0 0 0 0 0 0 0.0%
Claims on institutions and corporates with a ST credit assessment 0 0 0 0 0 0 0.0%
Collective investments undertakings (CIU) 0 0 0 0 0 0 0.0%
Equity 303 0 538 0 0 0 0.0%
Securitisation
Other exposures 2,410 101 1,781 56 355 63 62.8%
Standardised Total 22,570 684 8,561 133 789 609 89.0%1 Computed as: Stock of provisions for defaulted stock / default stock (as defined in paragraphs 59 and 61 of the Methodological note)
Non-defaulted Defaulted Non-defaulted Defaulted Non-defaulted Defaulted
Central governments or central banks 2,353 0 2 0 0 0 0.0%
Regional governments or local authorities 0 0 0 0 0 0 0.0%
Public sector entities 0 0 0 0 0 0 0.0%
Multilateral Development Banks 0 0 0 0 0 0 0.0%
International Organisations 0 0 0 0 0 0 0.0%
Institutions 530 0 114 0 2 0 0.0%
Corporates 1,696 285 1,687 189 18 136 47.8%
of which: SME 0 0 0 0 0 0 0.0%
Retail 2,431 5 1,823 2 36 3 55.0%
of which: SME 0 0 0 0 0 0 0.0%
Secured by mortgages on immovable property 6,046 66 2,188 18 51 48 72.5%
of which: SME 0 0 0 0 0 0 0.0%
Items associated with particularly high risk 0 0 0 0 0 0 0.0%
Covered bonds 0 0 0 0 0 0 0.0%
Claims on institutions and corporates with a ST credit assessment 0 0 0 0 0 0 0.0%
Collective investments undertakings (CIU) 0 0 0 0 0 0 0.0%
Equity 26 0 26 0 0 0 0.0%
Securitisation
Other exposures 313 0 114 0 2 0 0.0%
Standardised Total 13,395 356 5,954 210 110 187 52.4%1 Computed as: Stock of provisions for defaulted stock / default stock (as defined in paragraphs 59 and 61 of the Methodological note)
Germany
Exposure values Risk exposure amounts Stock of provisionsCoverage Ratio -
Default Stock1
Portugal
31/12/2015
Exposure values Risk exposure amounts Stock of provisionsCoverage Ratio -
Default Stock1
Chile
31/12/2015
Exposure values Risk exposure amounts Stock of provisionsCoverage Ratio -
Default Stock1
31/12/2015
2016 EU-wide Stress Test:
Credit risk STABanco Santander S.A.
Non-defaulted Defaulted Non-defaulted Defaulted Non-defaulted Defaulted
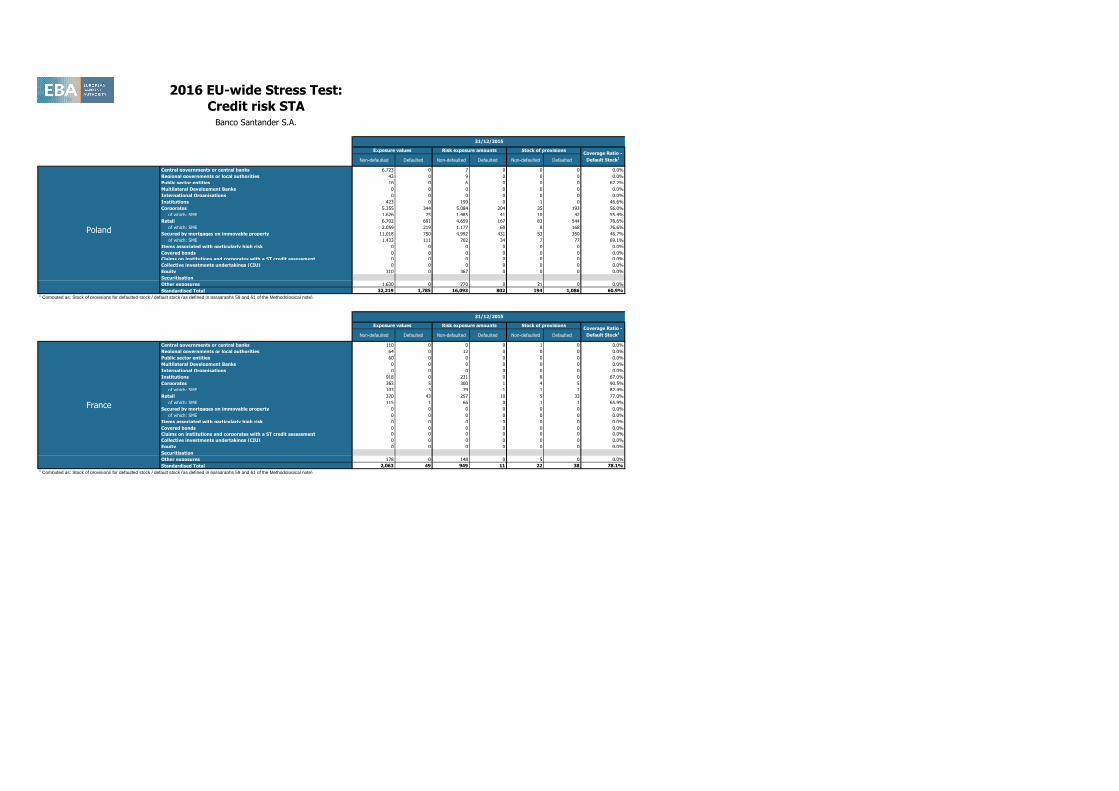
Central governments or central banks 6,723 0 7 0 0 0 0.0%
Regional governments or local authorities 43 0 9 0 0 0 0.0%
Public sector entities 16 0 6 0 0 0 67.2%
Multilateral Development Banks 0 0 0 0 0 0 0.0%
International Organisations 0 0 0 0 0 0 0.0%
Institutions 423 0 199 0 1 0 46.6%
Corporates 5,355 344 5,084 204 35 193 56.0%
of which: SME 1,626 75 1,485 41 10 42 55.4%
Retail 6,702 691 4,659 167 83 544 78.6%
of which: SME 2,059 219 1,177 60 8 168 76.6%
Secured by mortgages on immovable property 11,018 750 4,992 431 53 350 46.7%
of which: SME 1,433 111 702 34 7 77 69.1%
Items associated with particularly high risk 0 0 0 0 0 0 0.0%
Covered bonds 0 0 0 0 0 0 0.0%
Claims on institutions and corporates with a ST credit assessment 0 0 0 0 0 0 0.0%
Collective investments undertakings (CIU) 0 0 0 0 0 0 0.0%
Equity 310 0 367 0 0 0 0.0%
Securitisation
Other exposures 1,630 0 770 0 21 0 0.0%
Standardised Total 32,219 1,785 16,093 802 194 1,086 60.9%1 Computed as: Stock of provisions for defaulted stock / default stock (as defined in paragraphs 59 and 61 of the Methodological note)
Non-defaulted Defaulted Non-defaulted Defaulted Non-defaulted Defaulted
Central governments or central banks 110 0 0 0 1 0 0.0%
Regional governments or local authorities 64 0 12 0 0 0 0.0%
Public sector entities 60 0 0 0 0 0 0.0%
Multilateral Development Banks 0 0 0 0 0 0 0.0%
International Organisations 0 0 0 0 0 0 0.0%
Institutions 918 0 231 0 8 0 67.0%
Corporates 363 5 300 1 4 5 90.5%
of which: SME 103 3 79 1 1 2 82.4%
Retail 370 43 257 10 5 33 77.0%
of which: SME 115 1 66 0 1 1 65.9%
Secured by mortgages on immovable property 0 0 0 0 0 0 0.0%
of which: SME 0 0 0 0 0 0 0.0%
Items associated with particularly high risk 0 0 0 0 0 0 0.0%
Covered bonds 0 0 0 0 0 0 0.0%
Claims on institutions and corporates with a ST credit assessment 0 0 0 0 0 0 0.0%
Collective investments undertakings (CIU) 0 0 0 0 0 0 0.0%
Equity 0 0 0 0 0 0 0.0%
Securitisation
Other exposures 178 0 148 0 5 0 0.0%
Standardised Total 2,063 49 949 11 22 38 78.1%1 Computed as: Stock of provisions for defaulted stock / default stock (as defined in paragraphs 59 and 61 of the Methodological note)
France
Exposure values Risk exposure amounts Stock of provisionsCoverage Ratio -
Default Stock1
Poland
31/12/2015
Exposure values Risk exposure amounts Stock of provisionsCoverage Ratio -
Default Stock1
31/12/2015

2016 EU-wide Stress Test:
Credit risk STABanco Santander S.A.
Central governments or central banks
Regional governments or local authorities
Public sector entities
Multilateral Development Banks
International Organisations
Institutions
Corporates
of which: SME
Retail
of which: SME
Secured by mortgages on immovable property
of which: SME
Items associated with particularly high risk
Covered bonds
Claims on institutions and corporates with a ST credit assessment
Collective investments undertakings (CIU)
Equity
Securitisation
Other exposures
Standardised Total1 Computed as: Stock of provisions for defaulted stock / default stock (as defined in paragraphs 59 and 61 of the Methodological note)
Spain
United Kingdom
Banco Santander S.A.
Impairment
rate
Stock of
Provisions
Coverage Ratio -
Default Stock1
Impairment
rate
Stock of
Provisions
Coverage Ratio -
Default Stock1
Impairment
rate
Stock of
Provisions
Coverage Ratio -
Default Stock1
Impairment
rate
Stock of
Provisions
Coverage Ratio -
Default Stock1
Impairment
rate
Stock of
Provisions
Coverage Ratio -
Default Stock1
Impairment
rate
Stock of
Provisions
Coverage Ratio -
Default Stock1
0.2% 44 40.0% 0.2% 85 40.0% 0.2% 130 40.0% 0.4% 85 40.0% 0.4% 165 40.0% 0.4% 245 40.0%
0.1% 11 40.0% 0.1% 14 40.0% 0.1% 16 40.0% 0.1% 13 40.0% 0.1% 18 40.0% 0.1% 22 40.0%
0.0% 1 43.6% 0.0% 2 29.8% 0.0% 3 22.6% 0.0% 1 43.4% 0.0% 2 30.6% 0.0% 4 23.8%
0.0% 0 60.9% 0.0% 0 60.9% 0.0% 0 61.9% 0.0% 0 60.9% 0.0% 0 61.2% 0.0% 0 61.0%
- 0 - - 0 - - 0 - - 0 - - 0 - - 0 -
0.2% 271 33.7% 0.1% 312 29.6% 0.1% 340 26.1% 0.2% 304 39.4% 0.2% 376 34.2% 0.1% 423 31.3%
0.6% 3,329 55.3% 0.6% 3,781 50.2% 0.6% 4,226 47.4% 1.0% 3,762 57.0% 1.1% 4,645 51.8% 1.1% 5,436 49.4%
1.3% 314 40.3% 1.2% 406 37.9% 1.2% 496 37.8% 1.9% 363 40.7% 2.0% 547 45.4% 2.1% 695 45.3%
4.9% 13,986 57.5% 4.7% 19,227 55.4% 4.6% 23,697 54.4% 6.4% 15,930 59.7% 6.7% 23,169 58.8% 5.8% 28,477 57.8%
4.0% 1,772 58.5% 3.8% 2,504 59.2% 3.6% 3,125 59.1% 5.0% 2,016 63.4% 4.5% 2,826 62.5% 3.7% 3,427 61.6%
0.7% 2,406 30.6% 0.6% 2,989 29.2% 0.5% 3,465 28.0% 1.1% 2,822 31.7% 1.4% 4,186 31.3% 1.2% 5,221 30.6%
1.1% 355 38.6% 1.0% 508 38.8% 0.9% 633 38.3% 1.7% 445 33.9% 2.2% 746 31.0% 1.9% 967 30.1%
0.0% 14 48.0% 0.0% 14 52.4% 0.0% 14 53.7% 0.0% 14 52.1% 0.0% 14 55.2% 0.0% 14 55.1%
0.0% 0 38.7% 0.0% 1 39.3% 0.0% 1 40.5% 0.0% 0 38.6% 0.0% 1 39.8% 0.0% 2 41.8%
0.0% 0 45.0% 0.0% 0 45.0% 0.0% 0 45.0% 0.0% 0 45.0% 0.0% 0 45.6% 0.0% 0 45.5%
0.0% 0 45.0% 0.0% 0 45.0% 0.0% 0 45.4% 0.0% 0 45.0% 0.0% 0 45.4% 0.0% 1 45.3%
0.0% 0 45.0% 0.0% 0 45.0% 0.0% 1 45.2% 0.0% 0 51.8% 0.0% 1 51.8% 0.0% 1 51.8%
0.4% 8,491 48.0% 0.4% 8,791 46.5% 0.3% 9,058 44.6% 0.6% 8,666 51.7% 0.5% 9,080 48.7% 0.4% 9,440 45.5%
1.6% 28,552 51.2% 1.5% 35,215 49.3% 1.3% 40,951 48.1% 2.2% 31,598 53.0% 2.2% 41,657 51.4% 1.8% 49,286 50.1%
Impairment
rate
Stock of
Provisions
Coverage Ratio -
Default Stock1
Impairment
rate
Stock of
Provisions
Coverage Ratio -
Default Stock1
Impairment
rate
Stock of
Provisions
Coverage Ratio -
Default Stock1
Impairment
rate
Stock of
Provisions
Coverage Ratio -
Default Stock1
Impairment
rate
Stock of
Provisions
Coverage Ratio -
Default Stock1
Impairment
rate
Stock of
Provisions
Coverage Ratio -
Default Stock1
0.0% 0 40.0% 0.0% 0 40.0% 0.0% 0 40.0% 0.0% 0 40.0% 0.0% 0 40.0% 0.0% 0 40.0%
0.0% 0 40.0% 0.0% 0 40.0% 0.0% 0 40.0% 0.0% 0 40.0% 0.0% 0 40.0% 0.0% 0 40.0%
- 0 - - 0 - - 0 - - 0 - - 0 - - 0 -
0.0% 0 60.9% 0.0% 0 60.9% 0.0% 0 60.9% 0.0% 0 60.9% 0.0% 0 60.9% 0.0% 0 60.9%
- 0 - - 0 - - 0 - - 0 - - 0 - - 0 -
0.0% 11 42.8% 0.0% 11 36.3% 0.0% 11 32.9% 0.0% 11 38.3% 0.0% 11 33.6% 0.0% 11 32.0%
0.1% 247 20.0% 0.1% 266 19.6% 0.1% 290 19.9% 0.1% 258 21.8% 0.2% 303 23.3% 0.2% 343 23.7%
1.8% 8 46.6% 2.0% 13 46.7% 2.0% 18 46.6% 2.8% 11 56.2% 3.9% 21 62.8% 4.3% 33 70.2%
1.2% 391 91.5% 1.2% 547 92.4% 1.3% 708 92.7% 1.7% 456 91.5% 2.2% 731 92.3% 2.6% 1,055 92.7%
0.0% 5 61.4% 0.0% 5 60.6% 0.0% 5 59.9% 0.0% 5 61.7% 0.0% 5 62.8% 0.0% 5 70.2%
1.8% 51 68.8% 2.0% 88 68.3% 2.0% 126 68.0% 2.4% 62 71.8% 3.0% 121 72.7% 3.0% 177 73.2%
2.0% 45 67.6% 2.1% 79 67.2% 2.1% 113 66.9% 2.6% 55 70.6% 3.3% 109 71.5% 3.3% 159 72.0%
0.0% 0 49.2% 0.0% 0 48.9% 0.0% 0 48.6% 0.0% 0 51.4% 0.0% 0 52.0% 0.0% 0 52.4%
0.0% 0 38.7% 0.0% 0 39.2% 0.0% 1 40.5% 0.0% 0 38.6% 0.0% 1 39.7% 0.0% 1 42.0%
- 0 - - 0 - - 0 - - 0 - - 0 - - 0 -
- 0 - - 0 - - 0 - - 0 - - 0 - - 0 -
0.0% 0 45.0% 0.0% 0 45.0% 0.0% 0 45.0% 0.0% 0 51.8% 0.0% 0 51.8% 0.0% 0 51.8%
0.1% 296 53.0% 0.1% 311 47.8% 0.1% 328 43.5% 0.1% 299 52.2% 0.2% 329 44.6% 0.4% 384 37.0%0.4% 997 59.7% 0.4% 1,224 58.5% 0.4% 1,463 57.4% 0.5% 1,087 60.4% 0.7% 1,495 59.2% 0.8% 1,972 57.7%
Impairment
rate
Stock of
Provisions
Coverage Ratio -
Default Stock1
Impairment
rate
Stock of
Provisions
Coverage Ratio -
Default Stock1
Impairment
rate
Stock of
Provisions
Coverage Ratio -
Default Stock1
Impairment
rate
Stock of
Provisions
Coverage Ratio -
Default Stock1
Impairment
rate
Stock of
Provisions
Coverage Ratio -
Default Stock1
Impairment
rate
Stock of
Provisions
Coverage Ratio -
Default Stock1
0.1% 10 40.0% 0.1% 19 40.0% 0.1% 29 40.0% 0.3% 33 40.0% 0.3% 65 40.0% 0.3% 97 40.0%
0.1% 2 40.0% 0.1% 3 40.0% 0.1% 3 40.0% 0.3% 3 40.0% 0.3% 4 40.0% 0.3% 4 40.0%
0.0% 0 45.0% 0.0% 0 45.0% 0.0% 0 45.0% 0.0% 0 45.0% 0.0% 0 45.0% 0.0% 0 45.0%
0.0% 0 45.0% 0.0% 0 45.0% 0.0% 0 45.0% 0.0% 0 45.0% 0.0% 0 45.0% 0.0% 0 45.0%
- 0 - - 0 - - 0 - - 0 - - 0 - - 0 -
0.0% 4 45.0% 0.0% 5 45.0% 0.0% 6 45.0% 0.0% 6 45.0% 0.0% 7 45.0% 0.0% 9 45.0%
0.9% 154 33.8% 0.7% 177 29.8% 0.5% 193 28.2% 2.0% 195 30.0% 2.1% 264 26.9% 1.3% 301 25.8%
0.6% 2 34.5% 0.4% 2 34.3% 0.3% 3 34.1% 1.4% 3 37.0% 1.3% 4 37.1% 0.8% 4 36.7%
1.0% 189 60.4% 1.0% 253 66.6% 1.0% 307 66.3% 1.3% 202 64.7% 1.7% 306 75.2% 1.4% 372 72.4%
1.1% 23 62.7% 1.1% 28 62.3% 1.1% 32 61.2% 1.3% 24 65.0% 3.0% 38 80.1% 2.1% 46 76.4%
1.3% 247 30.8% 1.0% 312 25.2% 0.8% 359 22.6% 2.4% 320 39.9% 1.5% 417 34.0% 1.3% 497 31.8%
0.3% 0 12.8% 0.3% 0 11.7% 0.2% 0 10.7% 0.5% 0 14.5% 0.5% 0 16.1% 0.6% 1 17.8%
0.0% 8 45.4% 0.0% 8 45.2% 0.0% 8 45.1% 0.0% 8 54.9% 0.0% 8 55.4% 0.0% 8 55.3%
- 0 - - 0 - - 0 - - 0 - - 0 - - 0 -
0.0% 0 45.0% 0.0% 0 45.0% 0.0% 0 45.0% 0.0% 0 45.0% 0.0% 0 45.0% 0.0% 0 45.0%
- 0 - - 0 - - 0 - - 0 - - 0 - - 0 -
0.0% 0 45.0% 0.0% 0 45.0% 0.0% 0 45.0% 0.0% 0 51.8% 0.0% 1 51.8% 0.0% 1 51.8%
0.0% 6,644 27.4% 0.0% 6,646 27.1% 0.0% 6,648 26.8% 0.0% 6,696 33.2% 0.0% 6,706 33.0% 0.0% 6,714 32.7%
0.3% 7,258 31.8% 0.2% 7,423 30.1% 0.2% 7,552 29.0% 0.5% 7,462 36.8% 0.4% 7,778 35.5% 0.3% 8,003 34.6%
31/12/2018 31/12/2016 31/12/2017 31/12/201831/12/2016 31/12/2017
Baseline Scenario Adverse Scenario
Baseline Scenario Adverse Scenario
31/12/2016 31/12/2017 31/12/2018
31/12/2018
31/12/2016 31/12/2017 31/12/2018
Baseline Scenario Adverse Scenario
31/12/2016 31/12/2017 31/12/2018 31/12/2016 31/12/2017
2016 EU-wide Stress Test:
Credit risk STABanco Santander S.A.
Central governments or central banks
Regional governments or local authorities
Public sector entities
Multilateral Development Banks
International Organisations
Institutions
Corporates
of which: SME
Retail
of which: SME
Secured by mortgages on immovable property
of which: SME
Items associated with particularly high risk
Covered bonds
Claims on institutions and corporates with a ST credit assessment
Collective investments undertakings (CIU)
Equity
Securitisation
Other exposures
Standardised Total1 Computed as: Stock of provisions for defaulted stock / default stock (as defined in paragraphs 59 and 61 of the Methodological note)
Central governments or central banks
Regional governments or local authorities
Public sector entities
Multilateral Development Banks
International Organisations
Institutions
Corporates
of which: SME
Retail
of which: SME
Secured by mortgages on immovable property
of which: SME
Items associated with particularly high risk
Covered bonds
Claims on institutions and corporates with a ST credit assessment
Collective investments undertakings (CIU)
Equity
Securitisation
Other exposures
Standardised Total1 Computed as: Stock of provisions for defaulted stock / default stock (as defined in paragraphs 59 and 61 of the Methodological note)
Central governments or central banks
Regional governments or local authorities
Public sector entities
Multilateral Development Banks
International Organisations
Institutions
Corporates
of which: SME
Retail
of which: SME
Secured by mortgages on immovable property
of which: SME
Items associated with particularly high risk
Covered bonds
Claims on institutions and corporates with a ST credit assessment
Collective investments undertakings (CIU)
Equity
Securitisation
Other exposures
Standardised Total1 Computed as: Stock of provisions for defaulted stock / default stock (as defined in paragraphs 59 and 61 of the Methodological note)
Mexico
United States
Brazil
Impairment
rate
Stock of
Provisions
Coverage Ratio -
Default Stock1
Impairment
rate
Stock of
Provisions
Coverage Ratio -
Default Stock1
Impairment
rate
Stock of
Provisions
Coverage Ratio -
Default Stock1
Impairment
rate
Stock of
Provisions
Coverage Ratio -
Default Stock1
Impairment
rate
Stock of
Provisions
Coverage Ratio -
Default Stock1
Impairment
rate
Stock of
Provisions
Coverage Ratio -
Default Stock1
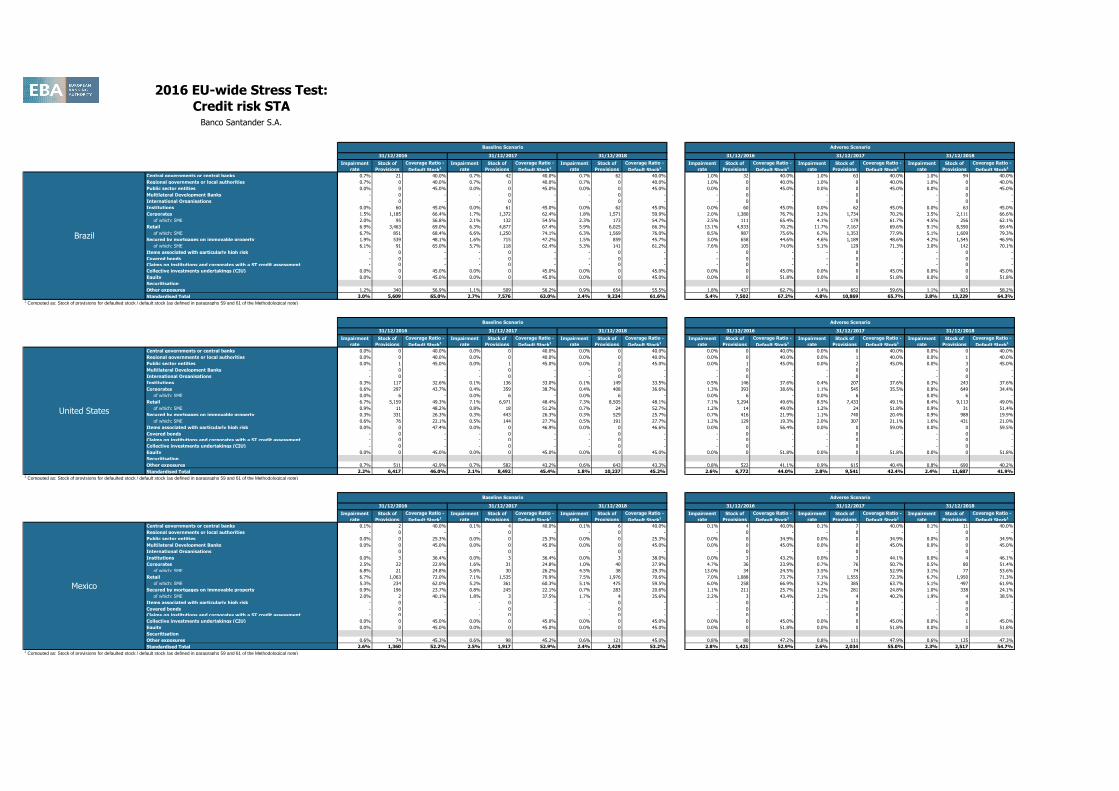
0.7% 21 40.0% 0.7% 42 40.0% 0.7% 62 40.0% 1.0% 32 40.0% 1.0% 63 40.0% 1.0% 94 40.0%
0.7% 0 40.0% 0.7% 0 40.0% 0.7% 0 40.0% 1.0% 0 40.0% 1.0% 0 40.0% 1.0% 0 40.0%
0.0% 0 45.0% 0.0% 0 45.0% 0.0% 0 45.0% 0.0% 0 45.0% 0.0% 0 45.0% 0.0% 0 45.0%
- 0 - - 0 - - 0 - - 0 - - 0 - - 0 -
- 0 - - 0 - - 0 - - 0 - - 0 - - 0 -
0.0% 60 45.0% 0.0% 61 45.0% 0.0% 62 45.0% 0.0% 60 45.0% 0.0% 62 45.0% 0.0% 63 45.0%
1.5% 1,185 66.4% 1.7% 1,372 62.4% 1.8% 1,571 59.9% 2.0% 1,380 76.7% 3.2% 1,734 70.2% 3.5% 2,111 66.6%
2.0% 95 56.8% 2.1% 132 54.5% 2.3% 173 54.7% 2.5% 111 65.4% 4.1% 179 61.7% 4.5% 256 62.1%
6.9% 3,463 69.0% 6.3% 4,877 67.4% 5.9% 6,025 66.3% 13.1% 4,933 70.2% 11.7% 7,167 69.6% 9.1% 8,590 69.4%
6.7% 851 68.4% 6.6% 1,250 74.1% 6.3% 1,569 76.0% 8.5% 987 75.6% 6.7% 1,353 77.9% 5.1% 1,609 79.3%
1.9% 539 48.1% 1.6% 715 47.2% 1.5% 859 45.7% 3.0% 658 44.6% 4.6% 1,189 48.6% 4.2% 1,545 46.9%
6.1% 91 65.0% 5.7% 118 62.4% 5.3% 141 61.2% 7.6% 105 74.0% 5.1% 129 71.3% 3.0% 142 70.1%
- 0 - - 0 - - 0 - - 0 - - 0 - - 0 -
- 0 - - 0 - - 0 - - 0 - - 0 - - 0 -
- 0 - - 0 - - 0 - - 0 - - 0 - - 0 -
0.0% 0 45.0% 0.0% 0 45.0% 0.0% 0 45.0% 0.0% 0 45.0% 0.0% 0 45.0% 0.0% 0 45.0%
0.0% 0 45.0% 0.0% 0 45.0% 0.0% 0 45.0% 0.0% 0 51.8% 0.0% 0 51.8% 0.0% 0 51.8%
1.2% 340 56.9% 1.1% 509 56.2% 0.9% 654 55.5% 1.8% 437 62.7% 1.4% 652 59.6% 1.1% 825 58.2%
3.0% 5,609 65.0% 2.7% 7,576 63.0% 2.4% 9,234 61.6% 5.4% 7,502 67.2% 4.8% 10,869 65.7% 3.8% 13,229 64.3%
Impairment
rate
Stock of
Provisions
Coverage Ratio -
Default Stock1
Impairment
rate
Stock of
Provisions
Coverage Ratio -
Default Stock1
Impairment
rate
Stock of
Provisions
Coverage Ratio -
Default Stock1
Impairment
rate
Stock of
Provisions
Coverage Ratio -
Default Stock1
Impairment
rate
Stock of
Provisions
Coverage Ratio -
Default Stock1
Impairment
rate
Stock of
Provisions
Coverage Ratio -
Default Stock1
0.0% 0 40.0% 0.0% 0 40.0% 0.0% 0 40.0% 0.0% 0 40.0% 0.0% 0 40.0% 0.0% 0 40.0%
0.0% 0 40.0% 0.0% 0 40.0% 0.0% 0 40.0% 0.0% 0 40.0% 0.0% 1 40.0% 0.0% 1 40.0%
0.0% 1 45.0% 0.0% 1 45.0% 0.0% 2 45.0% 0.0% 1 45.0% 0.0% 2 45.0% 0.0% 3 45.0%
- 0 - - 0 - - 0 - - 0 - - 0 - - 0 -
- 0 - - 0 - - 0 - - 0 - - 0 - - 0 -
0.3% 117 32.6% 0.1% 136 33.0% 0.1% 149 33.5% 0.5% 146 37.6% 0.4% 207 37.6% 0.3% 243 37.6%
0.6% 297 43.7% 0.4% 359 38.7% 0.4% 408 36.6% 1.3% 393 38.6% 1.1% 545 35.5% 0.8% 649 34.4%
0.0% 6 - 0.0% 6 - 0.0% 6 - 0.0% 6 - 0.0% 6 - 0.0% 6 -
6.7% 5,159 49.3% 7.1% 6,971 48.4% 7.3% 8,505 48.1% 7.1% 5,294 49.6% 8.5% 7,433 49.1% 8.4% 9,113 49.0%
0.9% 11 48.2% 0.8% 18 51.2% 0.7% 24 52.7% 1.2% 14 49.0% 1.2% 24 51.8% 0.9% 31 51.4%
0.3% 331 26.3% 0.3% 443 26.3% 0.3% 529 25.7% 0.7% 416 21.9% 1.1% 740 20.4% 0.9% 988 19.9%
0.6% 76 22.1% 0.5% 144 27.7% 0.5% 191 27.7% 1.2% 129 19.3% 2.0% 307 21.1% 1.6% 431 21.0%
0.0% 0 47.4% 0.0% 0 46.9% 0.0% 0 46.6% 0.0% 0 56.4% 0.0% 0 59.0% 0.0% 0 59.5%
- 0 - - 0 - - 0 - - 0 - - 0 - - 0 -
- 0 - - 0 - - 0 - - 0 - - 0 - - 0 -
- 0 - - 0 - - 0 - - 0 - - 0 - - 0 -
0.0% 0 45.0% 0.0% 0 45.0% 0.0% 0 45.0% 0.0% 0 51.8% 0.0% 0 51.8% 0.0% 0 51.8%
0.7% 511 42.9% 0.7% 582 43.2% 0.6% 643 43.3% 0.8% 522 41.1% 0.9% 615 40.4% 0.8% 690 40.2%
2.2% 6,417 46.0% 2.1% 8,492 45.4% 1.8% 10,237 45.2% 2.6% 6,772 44.0% 2.8% 9,541 42.4% 2.4% 11,687 41.9%
Impairment
rate
Stock of
Provisions
Coverage Ratio -
Default Stock1
Impairment
rate
Stock of
Provisions
Coverage Ratio -
Default Stock1
Impairment
rate
Stock of
Provisions
Coverage Ratio -
Default Stock1
Impairment
rate
Stock of
Provisions
Coverage Ratio -
Default Stock1
Impairment
rate
Stock of
Provisions
Coverage Ratio -
Default Stock1
Impairment
rate
Stock of
Provisions
Coverage Ratio -
Default Stock1
0.1% 2 40.0% 0.1% 4 40.0% 0.1% 6 40.0% 0.1% 4 40.0% 0.1% 7 40.0% 0.1% 11 40.0%
- 0 - - 0 - - 0 - - 0 - - 0 - - 0 -
0.0% 0 25.3% 0.0% 0 25.3% 0.0% 0 25.3% 0.0% 0 34.9% 0.0% 0 34.9% 0.0% 0 34.9%
0.0% 0 45.0% 0.0% 0 45.0% 0.0% 0 45.0% 0.0% 0 45.0% 0.0% 0 45.0% 0.0% 0 45.0%
- 0 - - 0 - - 0 - - 0 - - 0 - - 0 -
0.0% 3 36.4% 0.0% 3 36.4% 0.0% 3 38.0% 0.0% 3 43.2% 0.0% 3 44.1% 0.0% 4 46.1%
2.5% 22 22.9% 1.6% 31 24.8% 1.0% 40 27.9% 4.7% 36 23.9% 0.7% 76 50.7% 0.5% 80 51.4%
6.8% 21 24.8% 5.6% 30 26.2% 4.5% 38 29.3% 13.0% 34 24.5% 3.5% 74 52.9% 3.1% 77 53.6%
6.7% 1,063 72.0% 7.1% 1,535 70.9% 7.5% 1,976 70.6% 7.0% 1,088 73.7% 7.1% 1,555 72.3% 6.7% 1,950 71.3%
5.3% 234 62.0% 5.2% 361 60.3% 5.1% 475 59.5% 6.0% 258 66.9% 5.2% 385 63.7% 5.1% 497 61.9%
0.9% 196 23.7% 0.8% 245 22.1% 0.7% 283 20.6% 1.1% 211 25.7% 1.2% 281 24.8% 1.0% 338 24.1%
2.0% 2 40.1% 1.8% 3 37.5% 1.7% 4 35.6% 2.2% 3 43.4% 2.1% 4 40.2% 1.9% 4 38.5%
- 0 - - 0 - - 0 - - 0 - - 0 - - 0 -
- 0 - - 0 - - 0 - - 0 - - 0 - - 0 -
- 0 - - 0 - - 0 - - 0 - - 0 - - 0 -
0.0% 0 45.0% 0.0% 0 45.0% 0.0% 0 45.0% 0.0% 0 45.0% 0.0% 0 45.0% 0.0% 1 45.0%
0.0% 0 45.0% 0.0% 0 45.0% 0.0% 0 45.0% 0.0% 0 51.8% 0.0% 0 51.8% 0.0% 0 51.8%
0.6% 74 45.3% 0.6% 98 45.2% 0.6% 121 45.0% 0.8% 80 47.2% 0.8% 111 47.9% 0.6% 135 47.3%
2.6% 1,360 52.2% 2.5% 1,917 52.9% 2.4% 2,429 53.2% 2.8% 1,421 52.9% 2.6% 2,034 55.0% 2.3% 2,517 54.7%
31/12/2018 31/12/2016 31/12/2017 31/12/201831/12/2016 31/12/2017
31/12/2018 31/12/2016 31/12/2017 31/12/2018
Baseline Scenario Adverse Scenario
31/12/2016 31/12/2017
31/12/2018 31/12/2016 31/12/2017 31/12/2018
Baseline Scenario Adverse Scenario
31/12/2016 31/12/2017
Baseline Scenario Adverse Scenario
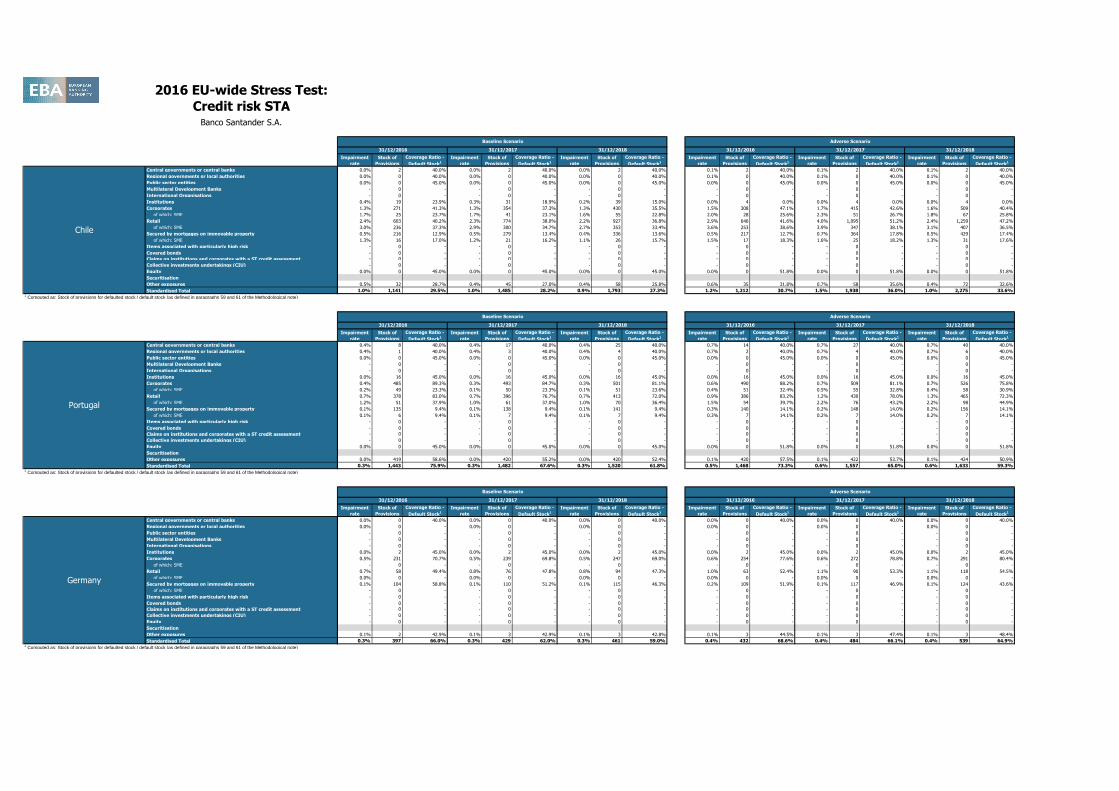
2016 EU-wide Stress Test:
Credit risk STABanco Santander S.A.
Central governments or central banks
Regional governments or local authorities
Public sector entities
Multilateral Development Banks
International Organisations
Institutions
Corporates
of which: SME
Retail
of which: SME
Secured by mortgages on immovable property
of which: SME
Items associated with particularly high risk
Covered bonds
Claims on institutions and corporates with a ST credit assessment
Collective investments undertakings (CIU)
Equity
Securitisation
Other exposures
Standardised Total1 Computed as: Stock of provisions for defaulted stock / default stock (as defined in paragraphs 59 and 61 of the Methodological note)
Central governments or central banks
Regional governments or local authorities
Public sector entities
Multilateral Development Banks
International Organisations
Institutions
Corporates
of which: SME
Retail
of which: SME
Secured by mortgages on immovable property
of which: SME
Items associated with particularly high risk
Covered bonds
Claims on institutions and corporates with a ST credit assessment
Collective investments undertakings (CIU)
Equity
Securitisation
Other exposures
Standardised Total1 Computed as: Stock of provisions for defaulted stock / default stock (as defined in paragraphs 59 and 61 of the Methodological note)
Central governments or central banks
Regional governments or local authorities
Public sector entities
Multilateral Development Banks
International Organisations
Institutions
Corporates
of which: SME
Retail
of which: SME
Secured by mortgages on immovable property
of which: SME
Items associated with particularly high risk
Covered bonds
Claims on institutions and corporates with a ST credit assessment
Collective investments undertakings (CIU)
Equity
Securitisation
Other exposures
Standardised Total1 Computed as: Stock of provisions for defaulted stock / default stock (as defined in paragraphs 59 and 61 of the Methodological note)
Germany
Portugal
Chile
Impairment
rate
Stock of
Provisions
Coverage Ratio -
Default Stock1
Impairment
rate
Stock of
Provisions
Coverage Ratio -
Default Stock1
Impairment
rate
Stock of
Provisions
Coverage Ratio -
Default Stock1
Impairment
rate
Stock of
Provisions
Coverage Ratio -
Default Stock1
Impairment
rate
Stock of
Provisions
Coverage Ratio -
Default Stock1
Impairment
rate
Stock of
Provisions
Coverage Ratio -
Default Stock1
0.0% 2 40.0% 0.0% 2 40.0% 0.0% 2 40.0% 0.1% 2 40.0% 0.1% 2 40.0% 0.1% 2 40.0%
0.0% 0 40.0% 0.0% 0 40.0% 0.0% 0 40.0% 0.1% 0 40.0% 0.1% 0 40.0% 0.1% 0 40.0%
0.0% 0 45.0% 0.0% 0 45.0% 0.0% 0 45.0% 0.0% 0 45.0% 0.0% 0 45.0% 0.0% 0 45.0%
- 0 - - 0 - - 0 - - 0 - - 0 - - 0 -
- 0 - - 0 - - 0 - - 0 - - 0 - - 0 -
0.4% 19 23.9% 0.3% 31 18.9% 0.2% 39 15.0% 0.0% 4 0.0% 0.0% 4 0.0% 0.0% 4 0.0%
1.3% 271 41.3% 1.3% 354 37.3% 1.3% 430 35.5% 1.5% 308 47.1% 1.7% 415 42.6% 1.6% 509 40.4%
1.7% 25 23.7% 1.7% 41 23.1% 1.6% 55 22.8% 2.0% 28 25.6% 2.3% 51 26.7% 1.8% 67 25.8%
2.4% 603 40.2% 2.3% 774 38.0% 2.2% 927 36.8% 2.9% 646 41.6% 4.0% 1,095 51.2% 2.4% 1,259 47.2%
3.0% 236 37.3% 2.9% 300 34.7% 2.7% 353 33.4% 3.6% 253 38.6% 3.9% 347 38.1% 3.1% 407 36.5%
0.5% 216 12.9% 0.5% 279 13.4% 0.4% 336 13.6% 0.5% 217 12.7% 0.7% 364 17.8% 0.5% 429 17.4%
1.3% 16 17.0% 1.2% 21 16.2% 1.1% 26 15.7% 1.5% 17 18.3% 1.6% 25 18.2% 1.3% 31 17.6%
- 0 - - 0 - - 0 - - 0 - - 0 - - 0 -
- 0 - - 0 - - 0 - - 0 - - 0 - - 0 -
- 0 - - 0 - - 0 - - 0 - - 0 - - 0 -
- 0 - - 0 - - 0 - - 0 - - 0 - - 0 -
0.0% 0 45.0% 0.0% 0 45.0% 0.0% 0 45.0% 0.0% 0 51.8% 0.0% 0 51.8% 0.0% 0 51.8%
0.5% 32 28.7% 0.4% 45 27.0% 0.4% 58 25.8% 0.6% 35 31.8% 0.7% 58 35.6% 0.4% 72 32.6%
1.0% 1,141 29.5% 1.0% 1,485 28.2% 0.9% 1,793 27.3% 1.2% 1,212 30.7% 1.5% 1,938 36.0% 1.0% 2,275 33.6%
Impairment
rate
Stock of
Provisions
Coverage Ratio -
Default Stock1
Impairment
rate
Stock of
Provisions
Coverage Ratio -
Default Stock1
Impairment
rate
Stock of
Provisions
Coverage Ratio -
Default Stock1
Impairment
rate
Stock of
Provisions
Coverage Ratio -
Default Stock1
Impairment
rate
Stock of
Provisions
Coverage Ratio -
Default Stock1
Impairment
rate
Stock of
Provisions
Coverage Ratio -
Default Stock1
0.4% 8 40.0% 0.4% 17 40.0% 0.4% 25 40.0% 0.7% 14 40.0% 0.7% 27 40.0% 0.7% 40 40.0%
0.4% 1 40.0% 0.4% 3 40.0% 0.4% 4 40.0% 0.7% 2 40.0% 0.7% 4 40.0% 0.7% 6 40.0%
0.0% 0 45.0% 0.0% 0 45.0% 0.0% 0 45.0% 0.0% 0 45.0% 0.0% 0 45.0% 0.0% 0 45.0%
- 0 - - 0 - - 0 - - 0 - - 0 - - 0 -
- 0 - - 0 - - 0 - - 0 - - 0 - - 0 -
0.0% 16 45.0% 0.0% 16 45.0% 0.0% 16 45.0% 0.0% 16 45.0% 0.0% 16 45.0% 0.0% 16 45.0%
0.4% 485 89.3% 0.3% 493 84.7% 0.3% 501 81.1% 0.6% 490 88.2% 0.7% 509 81.1% 0.7% 526 75.8%
0.2% 49 23.3% 0.1% 50 23.3% 0.1% 51 23.6% 0.4% 51 32.4% 0.5% 55 32.8% 0.4% 58 30.9%
0.7% 378 83.0% 0.7% 396 76.7% 0.7% 413 72.0% 0.9% 386 83.2% 1.2% 430 78.0% 1.3% 465 72.3%
1.2% 51 37.9% 1.0% 61 37.0% 1.0% 70 36.4% 1.5% 54 39.7% 2.2% 76 43.2% 2.2% 98 44.9%
0.1% 135 9.4% 0.1% 138 9.4% 0.1% 141 9.4% 0.3% 140 14.1% 0.2% 148 14.0% 0.2% 156 14.1%
0.1% 6 9.4% 0.1% 7 9.4% 0.1% 7 9.4% 0.3% 7 14.1% 0.2% 7 14.0% 0.2% 7 14.1%
- 0 - - 0 - - 0 - - 0 - - 0 - - 0 -
- 0 - - 0 - - 0 - - 0 - - 0 - - 0 -
- 0 - - 0 - - 0 - - 0 - - 0 - - 0 -
- 0 - - 0 - - 0 - - 0 - - 0 - - 0 -
0.0% 0 45.0% 0.0% 0 45.0% 0.0% 0 45.0% 0.0% 0 51.8% 0.0% 0 51.8% 0.0% 0 51.8%
0.0% 419 58.6% 0.0% 420 55.2% 0.0% 420 52.4% 0.1% 420 57.5% 0.1% 422 53.7% 0.1% 424 50.9%
0.3% 1,443 75.9% 0.3% 1,482 67.6% 0.3% 1,520 61.8% 0.5% 1,468 73.3% 0.6% 1,557 65.0% 0.6% 1,633 59.3%
Impairment
rate
Stock of
Provisions
Coverage Ratio -
Default Stock1
Impairment
rate
Stock of
Provisions
Coverage Ratio -
Default Stock1
Impairment
rate
Stock of
Provisions
Coverage Ratio -
Default Stock1
Impairment
rate
Stock of
Provisions
Coverage Ratio -
Default Stock1
Impairment
rate
Stock of
Provisions
Coverage Ratio -
Default Stock1
Impairment
rate
Stock of
Provisions
Coverage Ratio -
Default Stock1
0.0% 0 40.0% 0.0% 0 40.0% 0.0% 0 40.0% 0.0% 0 40.0% 0.0% 0 40.0% 0.0% 0 40.0%
0.0% 0 - 0.0% 0 - 0.0% 0 - 0.0% 0 - 0.0% 0 - 0.0% 0 -
- 0 - - 0 - - 0 - - 0 - - 0 - - 0 -
- 0 - - 0 - - 0 - - 0 - - 0 - - 0 -
- 0 - - 0 - - 0 - - 0 - - 0 - - 0 -
0.0% 2 45.0% 0.0% 2 45.0% 0.0% 2 45.0% 0.0% 2 45.0% 0.0% 2 45.0% 0.0% 2 45.0%
0.5% 231 70.7% 0.5% 239 69.8% 0.5% 247 69.0% 0.6% 254 77.6% 0.6% 272 78.8% 0.7% 291 80.4%
- 0 - - 0 - - 0 - - 0 - - 0 - - 0 -
0.7% 58 49.4% 0.8% 76 47.8% 0.8% 94 47.3% 1.0% 63 52.4% 1.1% 90 53.3% 1.1% 118 54.5%
0.0% 0 - 0.0% 0 - 0.0% 0 - 0.0% 0 - 0.0% 0 - 0.0% 0 -
0.1% 104 58.8% 0.1% 110 51.2% 0.1% 115 46.3% 0.2% 109 51.9% 0.1% 117 46.9% 0.1% 124 43.6%
- 0 - - 0 - - 0 - - 0 - - 0 - - 0 -
- 0 - - 0 - - 0 - - 0 - - 0 - - 0 -
- 0 - - 0 - - 0 - - 0 - - 0 - - 0 -
- 0 - - 0 - - 0 - - 0 - - 0 - - 0 -
- 0 - - 0 - - 0 - - 0 - - 0 - - 0 -
- 0 - - 0 - - 0 - - 0 - - 0 - - 0 -
0.1% 2 42.9% 0.1% 3 42.9% 0.1% 3 42.8% 0.1% 3 44.5% 0.1% 3 47.4% 0.1% 3 48.4%
0.3% 397 66.0% 0.3% 429 62.0% 0.3% 461 59.0% 0.4% 432 68.6% 0.4% 484 66.1% 0.4% 539 64.9%
31/12/2018 31/12/2016 31/12/2017 31/12/201831/12/2016 31/12/2017
31/12/2018 31/12/2016 31/12/2017 31/12/2018
Baseline Scenario Adverse Scenario
31/12/2016 31/12/2017
31/12/2018 31/12/2016 31/12/2017 31/12/2018
Baseline Scenario Adverse Scenario
31/12/2016 31/12/2017
Baseline Scenario Adverse Scenario
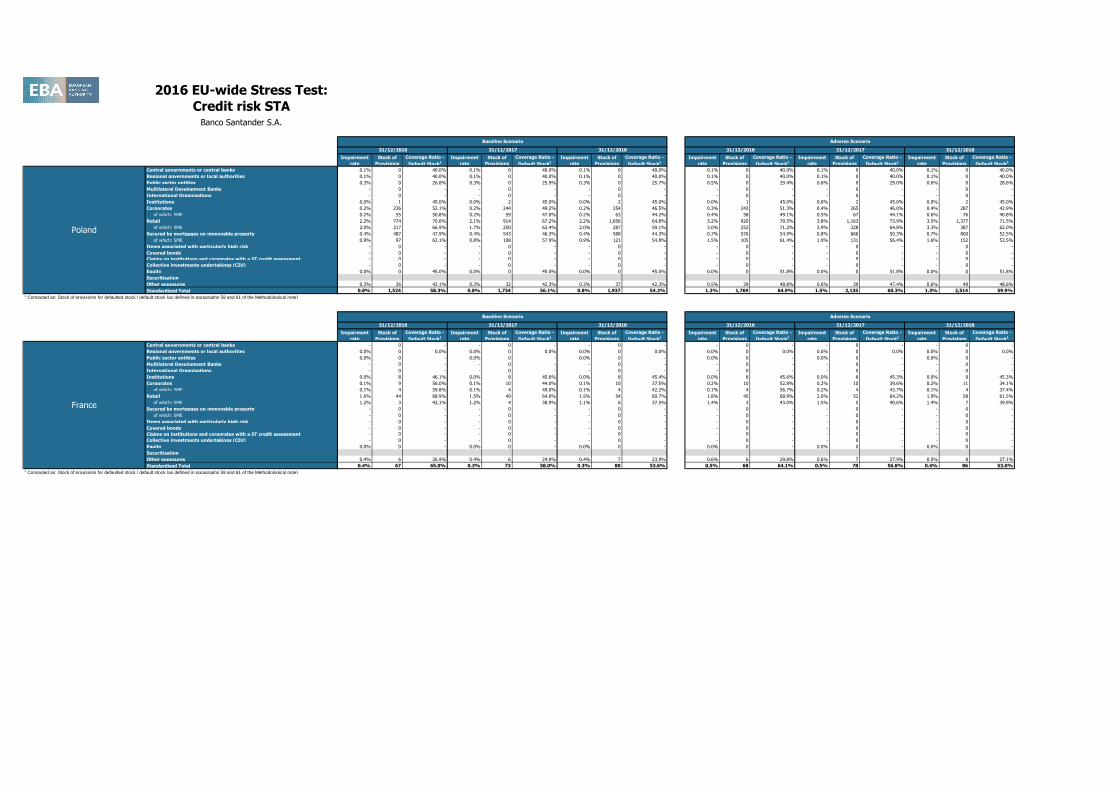
2016 EU-wide Stress Test:
Credit risk STABanco Santander S.A.
Central governments or central banks
Regional governments or local authorities
Public sector entities
Multilateral Development Banks
International Organisations
Institutions
Corporates
of which: SME
Retail
of which: SME
Secured by mortgages on immovable property
of which: SME
Items associated with particularly high risk
Covered bonds
Claims on institutions and corporates with a ST credit assessment
Collective investments undertakings (CIU)
Equity
Securitisation
Other exposures
Standardised Total1 Computed as: Stock of provisions for defaulted stock / default stock (as defined in paragraphs 59 and 61 of the Methodological note)
Central governments or central banks
Regional governments or local authorities
Public sector entities
Multilateral Development Banks
International Organisations
Institutions
Corporates
of which: SME
Retail
of which: SME
Secured by mortgages on immovable property
of which: SME
Items associated with particularly high risk
Covered bonds
Claims on institutions and corporates with a ST credit assessment
Collective investments undertakings (CIU)
Equity
Securitisation
Other exposures
Standardised Total1 Computed as: Stock of provisions for defaulted stock / default stock (as defined in paragraphs 59 and 61 of the Methodological note)
France
Poland
Impairment
rate
Stock of
Provisions
Coverage Ratio -
Default Stock1
Impairment
rate
Stock of
Provisions
Coverage Ratio -
Default Stock1
Impairment
rate
Stock of
Provisions
Coverage Ratio -
Default Stock1
Impairment
rate
Stock of
Provisions
Coverage Ratio -
Default Stock1
Impairment
rate
Stock of
Provisions
Coverage Ratio -
Default Stock1
Impairment
rate
Stock of
Provisions
Coverage Ratio -
Default Stock1
0.1% 0 40.0% 0.1% 0 40.0% 0.1% 0 40.0% 0.1% 0 40.0% 0.1% 0 40.0% 0.1% 0 40.0%
0.1% 0 40.0% 0.1% 0 40.0% 0.1% 0 40.0% 0.1% 0 40.0% 0.1% 0 40.0% 0.1% 0 40.0%
0.3% 0 26.8% 0.3% 0 25.9% 0.3% 0 25.7% 0.5% 0 29.4% 0.6% 0 29.0% 0.6% 0 28.6%
- 0 - - 0 - - 0 - - 0 - - 0 - - 0 -
- 0 - - 0 - - 0 - - 0 - - 0 - - 0 -
0.0% 1 45.0% 0.0% 2 45.0% 0.0% 2 45.0% 0.0% 1 45.0% 0.0% 2 45.0% 0.0% 2 45.0%
0.2% 236 52.1% 0.2% 244 49.2% 0.2% 254 46.5% 0.3% 243 51.3% 0.4% 265 46.0% 0.4% 287 42.9%
0.2% 55 50.8% 0.2% 59 47.0% 0.2% 63 44.2% 0.4% 58 49.1% 0.5% 67 44.1% 0.6% 76 40.8%
2.2% 774 70.6% 2.1% 914 67.2% 2.2% 1,056 64.8% 3.2% 920 79.5% 3.8% 1,163 73.9% 3.5% 1,377 71.5%
2.0% 217 66.9% 1.7% 250 62.4% 2.0% 287 59.1% 3.0% 252 71.2% 3.9% 328 64.8% 3.3% 387 62.0%
0.4% 487 47.9% 0.4% 543 46.3% 0.4% 588 44.3% 0.7% 576 54.9% 0.8% 666 50.3% 0.7% 800 52.5%
0.9% 97 62.1% 0.8% 108 57.9% 0.9% 121 54.8% 1.5% 105 61.4% 1.9% 131 56.4% 1.6% 152 53.5%
- 0 - - 0 - - 0 - - 0 - - 0 - - 0 -
- 0 - - 0 - - 0 - - 0 - - 0 - - 0 -
- 0 - - 0 - - 0 - - 0 - - 0 - - 0 -
- 0 - - 0 - - 0 - - 0 - - 0 - - 0 -
0.0% 0 45.0% 0.0% 0 45.0% 0.0% 0 45.0% 0.0% 0 51.8% 0.0% 0 51.8% 0.0% 0 51.8%
0.3% 26 42.1% 0.3% 32 42.3% 0.3% 37 42.3% 0.5% 29 48.8% 0.6% 39 47.4% 0.6% 49 48.6%
0.8% 1,524 58.3% 0.8% 1,734 56.1% 0.8% 1,937 54.2% 1.2% 1,769 64.9% 1.5% 2,135 60.3% 1.3% 2,514 59.9%
Impairment
rate
Stock of
Provisions
Coverage Ratio -
Default Stock1
Impairment
rate
Stock of
Provisions
Coverage Ratio -
Default Stock1
Impairment
rate
Stock of
Provisions
Coverage Ratio -
Default Stock1
Impairment
rate
Stock of
Provisions
Coverage Ratio -
Default Stock1
Impairment
rate
Stock of
Provisions
Coverage Ratio -
Default Stock1
Impairment
rate
Stock of
Provisions
Coverage Ratio -
Default Stock1
- 0 - - 0 - - 0 - - 0 - - 0 - - 0 -
0.0% 0 0.0% 0.0% 0 0.0% 0.0% 0 0.0% 0.0% 0 0.0% 0.0% 0 0.0% 0.0% 0 0.0%
0.0% 0 - 0.0% 0 - 0.0% 0 - 0.0% 0 - 0.0% 0 - 0.0% 0 -
- 0 - - 0 - - 0 - - 0 - - 0 - - 0 -
- 0 - - 0 - - 0 - - 0 - - 0 - - 0 -
0.0% 8 46.1% 0.0% 8 45.6% 0.0% 8 45.4% 0.0% 8 45.6% 0.0% 8 45.3% 0.0% 9 45.3%
0.1% 9 56.0% 0.1% 10 44.0% 0.1% 10 37.5% 0.2% 10 52.8% 0.2% 10 39.6% 0.2% 11 34.1%
0.1% 4 59.8% 0.1% 4 49.0% 0.1% 4 42.2% 0.1% 4 56.7% 0.2% 4 43.7% 0.1% 4 37.4%
1.6% 44 68.9% 1.5% 49 64.0% 1.5% 54 60.7% 1.8% 45 68.9% 2.0% 52 64.2% 1.9% 58 61.5%
1.2% 3 42.1% 1.2% 4 38.9% 1.1% 6 37.5% 1.4% 3 43.0% 1.5% 5 40.6% 1.4% 7 39.9%
- 0 - - 0 - - 0 - - 0 - - 0 - - 0 -
- 0 - - 0 - - 0 - - 0 - - 0 - - 0 -
- 0 - - 0 - - 0 - - 0 - - 0 - - 0 -
- 0 - - 0 - - 0 - - 0 - - 0 - - 0 -
- 0 - - 0 - - 0 - - 0 - - 0 - - 0 -
- 0 - - 0 - - 0 - - 0 - - 0 - - 0 -
0.0% 0 - 0.0% 0 - 0.0% 0 - 0.0% 0 - 0.0% 0 - 0.0% 0 -
0.4% 6 26.9% 0.4% 6 24.9% 0.4% 7 23.9% 0.6% 6 29.8% 0.6% 7 27.9% 0.5% 8 27.1%
0.4% 67 65.0% 0.3% 73 58.0% 0.3% 80 53.6% 0.5% 68 64.1% 0.5% 78 56.8% 0.4% 86 53.0%
31/12/2018 31/12/2016 31/12/2017 31/12/201831/12/2016 31/12/2017
31/12/2018 31/12/2016 31/12/2017 31/12/2018
Baseline Scenario Adverse Scenario
31/12/2016 31/12/2017
Baseline Scenario Adverse Scenario
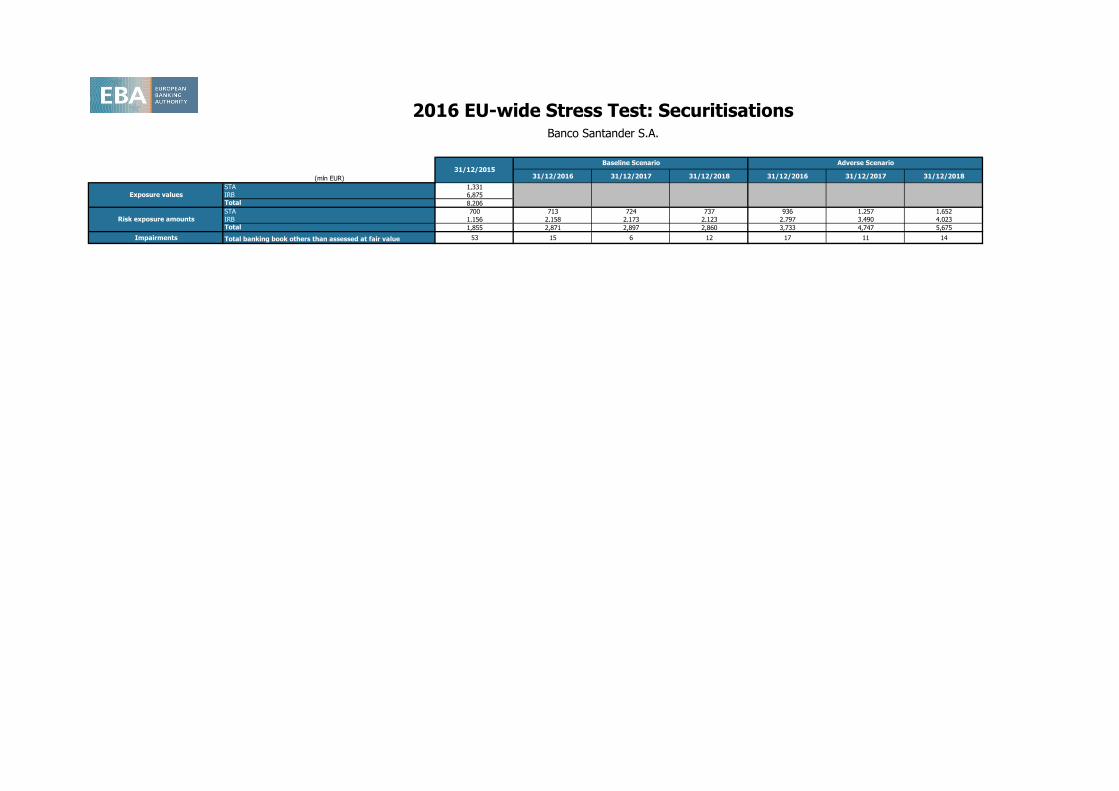
(mln EUR) 31/12/2016 31/12/2017 31/12/2018 31/12/2016 31/12/2017 31/12/2018
STA 1,331IRB 6,875Total 8,206
STA 700 713 724 737 936 1,257 1,652IRB 1,156 2,158 2,173 2,123 2,797 3,490 4,023Total 1,855 2,871 2,897 2,860 3,733 4,747 5,675
Impairments Total banking book others than assessed at fair value 53 15 6 12 17 11 14
2016 EU-wide Stress Test: SecuritisationsBanco Santander S.A.
Risk exposure amounts
31/12/2015Baseline Scenario Adverse Scenario
Exposure values

2016 EU-wide Stress Test: Sovereign
(mln EUR)
[ 0 - 3M [ 0 0 0 0 0 0 0 0 0 0 0 0 0 0 0
[ 3M - 1Y [ 12 12 0 0 12 0 0 0 0 0 0 0 0 0 0
[ 1Y - 2Y [ 0 -5 0 0 -5 0 0 0 0 0 0 0 0 0 0
[ 2Y - 3Y [ 2 1 0 0 1 0 0 0 0 0 0 0 0 0 0
[3Y - 5Y [ 26 26 0 0 26 0 0 0 0 0 0 0 0 0 0
[5Y - 10Y [ 9 -38 0 0 -38 0 0 0 0 0 0 0 0 0 0
[10Y - more 15 -3 1 0 -4 0 0 0 0 0 0 0 0 0 0Tot 64 -7 1 0 -8 0 0 0 0 0 0 0 0 0 0
[ 0 - 3M [ 16 16 0 0 16 0 0 0 0 0 0 0 0 1 0
[ 3M - 1Y [ 0 -153 0 0 -153 0 0 0 0 0 0 150 1 0 0
[ 1Y - 2Y [ 4 -7 0 0 -7 0 0 0 0 0 0 0 0 0 0
[ 2Y - 3Y [ 81 81 0 0 81 0 0 0 0 0 0 0 0 0 0
[3Y - 5Y [ 24 -4 0 0 -4 0 0 0 0 0 0 0 0 0 0
[5Y - 10Y [ 64 57 0 0 57 0 0 0 0 0 0 0 0 0 0
[10Y - more 14 -10 0 0 -10 0 0 0 0 0 0 0 0 0 0Tot 202 -20 0 0 -20 0 0 0 0 0 0 150 1 1 0
[ 0 - 3M [ 0 0 0 0 0 0 0 0 0 0 0 0 0 0 0
[ 3M - 1Y [ 0 0 0 0 0 0 0 0 0 0 0 0 0 0 0
[ 1Y - 2Y [ 0 0 0 0 0 0 0 0 0 0 0 0 0 0 0
[ 2Y - 3Y [ 0 0 0 0 0 0 0 0 0 0 0 0 0 0 0
[3Y - 5Y [ 0 0 0 0 0 0 0 0 0 0 0 0 0 0 0
[5Y - 10Y [ 0 0 0 0 0 0 0 0 0 0 0 0 0 0 0
[10Y - more 0 0 0 0 0 0 0 0 0 0 0 0 0 0 0Tot 0 0 0 0 0 0 0 0 0 0 0 0 0 0 0
Banco Santander S.A.
31/12/2015
Residual Maturity Country / Region
GROSS DIRECT LONG
EXPOSURES
(accounting value gross
of provisions)
(1)
NET DIRECT EXPOSURES
(accounting value gross of provisions)
(1)
Notional value Fair-value (+) Fair-value (-) Notional value Fair-value (+)
DIRECT SOVEREIGN EXPOSURES IN DERIVATIVES (1) INDIRECT SOVEREIGN EXPOSURES (3) (on and off balance sheet)
Derivatives with positive fair value Derivatives with negative fair value Derivatives with positive fair value Derivatives with negative fair value
Notional value Fair-value (-)Notional value
Cyprus
Czech Republic
of which: Loans and
receivablesof which: AFS
of which: FVO
(designated at fair
value through
profit&loss)
of which: HFT
(2)of which: HTM
Austria
Belgium
Bulgaria
Denmark
Estonia

2016 EU-wide Stress Test: Sovereign
(mln EUR)
Banco Santander S.A.
31/12/2015
Residual Maturity Country / Region
GROSS DIRECT LONG
EXPOSURES
(accounting value gross
of provisions)
(1)
NET DIRECT EXPOSURES
(accounting value gross of provisions)
(1)
Notional value Fair-value (+) Fair-value (-) Notional value Fair-value (+)
DIRECT SOVEREIGN EXPOSURES IN DERIVATIVES (1) INDIRECT SOVEREIGN EXPOSURES (3) (on and off balance sheet)
Derivatives with positive fair value Derivatives with negative fair value Derivatives with positive fair value Derivatives with negative fair value
Notional value Fair-value (-)Notional valueof which: Loans and
receivablesof which: AFS
of which: FVO
(designated at fair
value through
profit&loss)
of which: HFT
(2)of which: HTM
Austria
[ 0 - 3M [ 0 0 0 0 0 0 0 0 0 361 -98 0 0 0 0
[ 3M - 1Y [ 42 42 40 0 2 0 0 0 0 0 0 0 0 0 0
[ 1Y - 2Y [ 6 6 0 0 6 0 0 0 0 0 0 0 0 0 0
[ 2Y - 3Y [ 2 2 0 0 2 0 0 0 0 0 0 0 0 0 0
[3Y - 5Y [ 60 60 0 0 60 0 0 0 0 0 0 0 0 0 0
[5Y - 10Y [ 43 39 0 0 39 0 0 150 31 0 0 0 0 0 0
[10Y - more 19 19 0 0 19 0 0 0 0 0 0 0 0 0 0Tot 172 168 40 0 127 0 0 150 31 361 -98 0 0 0 0
[ 0 - 3M [ 23 3 0 0 -8 0 11 0 0 0 0 0 0 9 0
[ 3M - 1Y [ 105 -121 0 0 -127 0 6 1 0 0 0 345 1 0 0
[ 1Y - 2Y [ 17 -148 0 0 -151 0 3 0 0 0 0 75 0 0 0
[ 2Y - 3Y [ 27 -13 0 0 -16 0 3 1 0 0 0 0 0 0 0
[3Y - 5Y [ 227 83 0 0 72 0 11 8 0 0 0 50 0 0 0
[5Y - 10Y [ 195 -103 101 0 -237 0 33 436 1 0 0 0 0 15 0
[10Y - more 102 37 0 0 36 0 1 175 0 0 0 0 0 0 0Tot 696 -261 101 0 -430 0 68 621 1 0 0 469 1 24 0
[ 0 - 3M [ 15 15 0 0 15 0 0 0 0 0 0 0 0 23 0
[ 3M - 1Y [ 88 83 0 0 83 0 0 150 5 0 0 0 0 0 0
[ 1Y - 2Y [ 62 -359 0 0 -359 0 0 0 0 0 0 0 0 0 0
[ 2Y - 3Y [ 31 -6 0 0 -6 0 0 0 0 0 0 0 0 0 0
[3Y - 5Y [ 595 -56 0 0 -56 0 0 0 0 771 -100 0 0 0 0
[5Y - 10Y [ 869 98 0 0 98 0 0 300 127 0 0 0 0 0 0
[10Y - more 106 10 0 0 10 0 0 50 12 50 -18 0 0 0 0Tot 1,766 -214 0 0 -214 0 0 500 143 821 -118 0 0 23 0
[ 0 - 3M [ 0 0 0 0 0 0 0 0 0 0 0 0 0 0 0
[ 3M - 1Y [ 0 0 0 0 0 0 0 0 0 0 0 0 0 0 0
[ 1Y - 2Y [ 0 0 0 0 0 0 0 0 0 0 0 0 0 0 0
[ 2Y - 3Y [ 0 0 0 0 0 0 0 0 0 0 0 0 0 0 0
[3Y - 5Y [ 0 0 0 0 0 0 0 0 0 0 0 0 0 0 0
[5Y - 10Y [ 0 0 0 0 0 0 0 0 0 0 0 0 0 0 0
[10Y - more 0 0 0 0 0 0 0 0 0 0 0 0 0 0 0Tot 0 0 0 0 0 0 0 0 0 0 0 0 0 0 0
[ 0 - 3M [ 0 0 0 0 0 0 0 145 5 142 -3 0 0 0 0
[ 3M - 1Y [ 0 0 0 0 0 0 0 0 0 0 0 0 0 0 0
[ 1Y - 2Y [ 0 0 0 0 0 0 0 0 0 0 0 0 0 0 0
[ 2Y - 3Y [ 0 0 0 0 0 0 0 0 0 0 0 0 0 0 0
[3Y - 5Y [ 0 0 0 0 0 0 0 0 0 0 0 0 0 0 0
[5Y - 10Y [ 0 0 0 0 0 0 0 0 0 0 0 0 0 0 0
[10Y - more 0 0 0 0 0 0 0 0 0 0 0 0 0 0 0Tot 0 0 0 0 0 0 0 145 5 142 -3 0 0 0 0
[ 0 - 3M [ 0 0 0 0 0 0 0 0 0 0 0 0 0 0 0
[ 3M - 1Y [ 0 0 0 0 0 0 0 750 16 0 0 0 0 0 0
[ 1Y - 2Y [ 0 0 0 0 0 0 0 0 0 0 0 0 0 0 0
[ 2Y - 3Y [ 0 0 0 0 0 0 0 0 0 0 0 0 0 0 0
[3Y - 5Y [ 0 0 0 0 0 0 0 0 0 0 0 0 0 0 0
[5Y - 10Y [ 0 0 0 0 0 0 0 0 0 0 0 0 0 0 0
[10Y - more 0 0 0 0 0 0 0 0 0 0 0 0 0 0 0Tot 0 0 0 0 0 0 0 750 16 0 0 0 0 0 0
Greece
Ireland
Finland
France
Germany
Croatia
Hungary
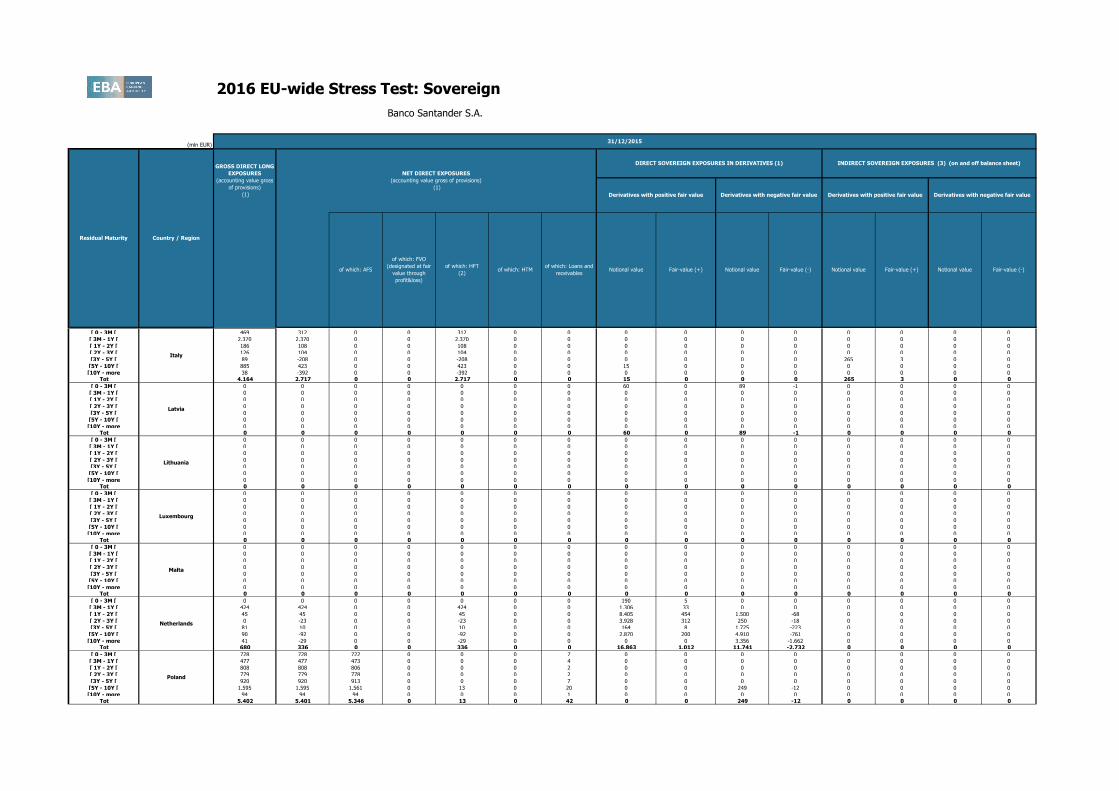
2016 EU-wide Stress Test: Sovereign
(mln EUR)
Banco Santander S.A.
31/12/2015
Residual Maturity Country / Region
GROSS DIRECT LONG
EXPOSURES
(accounting value gross
of provisions)
(1)
NET DIRECT EXPOSURES
(accounting value gross of provisions)
(1)
Notional value Fair-value (+) Fair-value (-) Notional value Fair-value (+)
DIRECT SOVEREIGN EXPOSURES IN DERIVATIVES (1) INDIRECT SOVEREIGN EXPOSURES (3) (on and off balance sheet)
Derivatives with positive fair value Derivatives with negative fair value Derivatives with positive fair value Derivatives with negative fair value
Notional value Fair-value (-)Notional valueof which: Loans and
receivablesof which: AFS
of which: FVO
(designated at fair
value through
profit&loss)
of which: HFT
(2)of which: HTM
Austria
[ 0 - 3M [ 469 312 0 0 312 0 0 0 0 0 0 0 0 0 0
[ 3M - 1Y [ 2,370 2,370 0 0 2,370 0 0 0 0 0 0 0 0 0 0
[ 1Y - 2Y [ 186 108 0 0 108 0 0 0 0 0 0 0 0 0 0
[ 2Y - 3Y [ 126 104 0 0 104 0 0 0 0 0 0 0 0 0 0
[3Y - 5Y [ 89 -208 0 0 -208 0 0 0 0 0 0 265 3 0 0
[5Y - 10Y [ 885 423 0 0 423 0 0 15 0 0 0 0 0 0 0
[10Y - more 38 -392 0 0 -392 0 0 0 0 0 0 0 0 0 0Tot 4,164 2,717 0 0 2,717 0 0 15 0 0 0 265 3 0 0
[ 0 - 3M [ 0 0 0 0 0 0 0 60 0 89 -1 0 0 0 0
[ 3M - 1Y [ 0 0 0 0 0 0 0 0 0 0 0 0 0 0 0
[ 1Y - 2Y [ 0 0 0 0 0 0 0 0 0 0 0 0 0 0 0
[ 2Y - 3Y [ 0 0 0 0 0 0 0 0 0 0 0 0 0 0 0
[3Y - 5Y [ 0 0 0 0 0 0 0 0 0 0 0 0 0 0 0
[5Y - 10Y [ 0 0 0 0 0 0 0 0 0 0 0 0 0 0 0
[10Y - more 0 0 0 0 0 0 0 0 0 0 0 0 0 0 0Tot 0 0 0 0 0 0 0 60 0 89 -1 0 0 0 0
[ 0 - 3M [ 0 0 0 0 0 0 0 0 0 0 0 0 0 0 0
[ 3M - 1Y [ 0 0 0 0 0 0 0 0 0 0 0 0 0 0 0
[ 1Y - 2Y [ 0 0 0 0 0 0 0 0 0 0 0 0 0 0 0
[ 2Y - 3Y [ 0 0 0 0 0 0 0 0 0 0 0 0 0 0 0
[3Y - 5Y [ 0 0 0 0 0 0 0 0 0 0 0 0 0 0 0
[5Y - 10Y [ 0 0 0 0 0 0 0 0 0 0 0 0 0 0 0
[10Y - more 0 0 0 0 0 0 0 0 0 0 0 0 0 0 0Tot 0 0 0 0 0 0 0 0 0 0 0 0 0 0 0
[ 0 - 3M [ 0 0 0 0 0 0 0 190 5 0 0 0 0 0 0
[ 3M - 1Y [ 424 424 0 0 424 0 0 1,306 33 0 0 0 0 0 0
[ 1Y - 2Y [ 45 45 0 0 45 0 0 8,405 454 1,500 -68 0 0 0 0
[ 2Y - 3Y [ 0 -23 0 0 -23 0 0 3,928 312 250 -18 0 0 0 0
[3Y - 5Y [ 81 10 0 0 10 0 0 164 8 1,725 -223 0 0 0 0
[5Y - 10Y [ 90 -92 0 0 -92 0 0 2,870 200 4,910 -761 0 0 0 0
[10Y - more 41 -29 0 0 -29 0 0 0 0 3,356 -1,662 0 0 0 0Tot 680 336 0 0 336 0 0 16,863 1,012 11,741 -2,732 0 0 0 0
[ 0 - 3M [ 728 728 722 0 0 0 7 0 0 0 0 0 0 0 0
[ 3M - 1Y [ 477 477 473 0 0 0 4 0 0 0 0 0 0 0 0
[ 1Y - 2Y [ 808 808 806 0 0 0 2 0 0 0 0 0 0 0 0
[ 2Y - 3Y [ 779 779 778 0 0 0 2 0 0 0 0 0 0 0 0
[3Y - 5Y [ 920 920 913 0 0 0 7 0 0 0 0 0 0 0 0
[5Y - 10Y [ 1,595 1,595 1,561 0 13 0 20 0 0 249 -12 0 0 0 0
[10Y - more 94 94 94 0 0 0 1 0 0 0 0 0 0 0 0Tot 5,402 5,401 5,346 0 13 0 42 0 0 249 -12 0 0 0 0
Italy
Latvia
Lithuania
Malta
Netherlands
Poland
Luxembourg

2016 EU-wide Stress Test: Sovereign
(mln EUR)
Banco Santander S.A.
31/12/2015
Residual Maturity Country / Region
GROSS DIRECT LONG
EXPOSURES
(accounting value gross
of provisions)
(1)
NET DIRECT EXPOSURES
(accounting value gross of provisions)
(1)
Notional value Fair-value (+) Fair-value (-) Notional value Fair-value (+)
DIRECT SOVEREIGN EXPOSURES IN DERIVATIVES (1) INDIRECT SOVEREIGN EXPOSURES (3) (on and off balance sheet)
Derivatives with positive fair value Derivatives with negative fair value Derivatives with positive fair value Derivatives with negative fair value
Notional value Fair-value (-)Notional valueof which: Loans and
receivablesof which: AFS
of which: FVO
(designated at fair
value through
profit&loss)
of which: HFT
(2)of which: HTM
Austria
[ 0 - 3M [ 178 178 0 0 7 0 170 0 0 0 0 0 0 0 0
[ 3M - 1Y [ 283 283 0 0 190 0 93 0 0 0 0 0 0 0 0
[ 1Y - 2Y [ 337 207 287 0 -130 0 50 0 0 0 0 159 1 0 0
[ 2Y - 3Y [ 147 147 85 0 12 0 50 0 0 0 0 0 0 0 0
[3Y - 5Y [ 4,992 4,992 4,812 0 1 0 179 0 0 0 0 0 0 0 0
[5Y - 10Y [ 3,306 3,261 2,732 0 14 0 516 0 0 0 0 0 0 0 0
[10Y - more 940 940 0 0 10 0 929 0 0 0 0 0 0 0 0Tot 10,182 10,007 7,916 0 104 0 1,987 0 0 0 0 159 1 0 0
[ 0 - 3M [ 0 0 0 0 0 0 0 0 0 0 0 0 0 0 0
[ 3M - 1Y [ 0 0 0 0 0 0 0 0 0 0 0 0 0 0 0
[ 1Y - 2Y [ 0 0 0 0 0 0 0 0 0 0 0 0 0 0 0
[ 2Y - 3Y [ 0 0 0 0 0 0 0 0 0 0 0 0 0 0 0
[3Y - 5Y [ 0 0 0 0 0 0 0 0 0 0 0 0 0 0 0
[5Y - 10Y [ 0 0 0 0 0 0 0 0 0 0 0 0 0 0 0
[10Y - more 0 0 0 0 0 0 0 0 0 0 0 0 0 0 0Tot 0 0 0 0 0 0 0 0 0 0 0 0 0 0 0
[ 0 - 3M [ 2,673 2,376 411 596 -257 0 1,627 12 1 78 -2 0 0 0 0
[ 3M - 1Y [ 9,624 9,548 2,928 326 5,353 0 941 493 10 455 -1 0 0 0 0
[ 1Y - 2Y [ 783 353 0 175 -379 0 557 338 33 140 -13 0 0 0 0
[ 2Y - 3Y [ 3,264 3,084 224 175 184 2,025 477 302 11 2,014 -400 0 0 0 0
[3Y - 5Y [ 8,878 8,501 5,767 628 320 0 1,786 2,913 107 1,671 -107 0 0 0 0
[5Y - 10Y [ 24,622 23,748 16,304 1,806 -8 0 5,647 2,936 188 1,087 -460 0 0 0 0
[10Y - more 1,379 1,085 810 47 -11 0 239 589 193 440 -36 0 0 0 0Tot 51,223 48,695 26,443 3,753 5,201 2,025 11,273 7,582 543 5,884 -1,020 0 0 0 0
[ 0 - 3M [ 65 65 65 0 0 0 0 0 0 0 0 0 0 0 0
[ 3M - 1Y [ 44 44 44 0 0 0 0 0 0 0 0 0 0 0 0
[ 1Y - 2Y [ 0 0 0 0 0 0 0 0 0 0 0 0 0 0 0
[ 2Y - 3Y [ 27 27 0 0 27 0 0 0 0 0 0 0 0 0 0
[3Y - 5Y [ 0 0 0 0 0 0 0 0 0 0 0 0 0 0 0
[5Y - 10Y [ 0 0 0 0 0 0 0 0 0 0 0 0 0 0 0
[10Y - more 0 0 0 0 0 0 0 0 0 0 0 0 0 0 0Tot 136 136 109 0 27 0 0 0 0 0 0 0 0 0 0
[ 0 - 3M [ 26 26 0 0 3 0 22 12 0 0 0 0 0 0 0
[ 3M - 1Y [ 2,691 2,242 2,679 0 -449 0 12 0 0 0 0 0 0 0 0
[ 1Y - 2Y [ 344 -352 333 0 -691 0 7 0 0 0 0 0 0 0 0
[ 2Y - 3Y [ 9 -27 0 0 -34 0 7 0 0 0 0 0 0 0 0
[3Y - 5Y [ 1,051 935 741 0 171 0 24 0 0 0 0 0 0 0 0
[5Y - 10Y [ 2,466 2,346 2,056 0 222 0 68 14 0 75 -1 0 0 0 0
[10Y - more 378 -7 0 0 -9 0 2 34 12 0 0 0 0 0 0Tot 6,965 5,163 5,808 0 -786 0 141 59 12 75 -1 0 0 0 0
Portugal
Romania
Slovakia
Slovenia
Spain
Sweden
United Kingdom

2016 EU-wide Stress Test: Sovereign
(mln EUR)
Banco Santander S.A.
31/12/2015
Residual Maturity Country / Region
GROSS DIRECT LONG
EXPOSURES
(accounting value gross
of provisions)
(1)
NET DIRECT EXPOSURES
(accounting value gross of provisions)
(1)
Notional value Fair-value (+) Fair-value (-) Notional value Fair-value (+)
DIRECT SOVEREIGN EXPOSURES IN DERIVATIVES (1) INDIRECT SOVEREIGN EXPOSURES (3) (on and off balance sheet)
Derivatives with positive fair value Derivatives with negative fair value Derivatives with positive fair value Derivatives with negative fair value
Notional value Fair-value (-)Notional valueof which: Loans and
receivablesof which: AFS
of which: FVO
(designated at fair
value through
profit&loss)
of which: HFT
(2)of which: HTM
Austria
[ 0 - 3M [ 0 0 0 0 0 0 0 0 0 0 0 0 0 0 0
[ 3M - 1Y [ 0 0 0 0 0 0 0 0 0 0 0 0 0 0 0
[ 1Y - 2Y [ 0 0 0 0 0 0 0 0 0 0 0 0 0 0 0
[ 2Y - 3Y [ 0 0 0 0 0 0 0 0 0 0 0 0 0 0 0
[3Y - 5Y [ 0 0 0 0 0 0 0 0 0 0 0 0 0 0 0
[5Y - 10Y [ 0 0 0 0 0 0 0 0 0 0 0 0 0 0 0
[10Y - more 0 0 0 0 0 0 0 0 0 0 0 0 0 0 0Tot 0 0 0 0 0 0 0 0 0 0 0 0 0 0 0
[ 0 - 3M [ 116 116 109 0 0 0 6 14 0 0 0 0 0 0 0
[ 3M - 1Y [ 97 97 93 0 0 0 4 0 0 0 0 0 0 0 0
[ 1Y - 2Y [ 2 2 0 0 0 0 2 0 0 0 0 0 0 0 0
[ 2Y - 3Y [ 2 2 0 0 0 0 2 0 0 0 0 0 0 0 0
[3Y - 5Y [ 7 7 0 0 0 0 7 0 0 0 0 0 0 0 0
[5Y - 10Y [ 20 20 0 0 0 0 20 0 0 0 0 0 0 0 0
[10Y - more 1 1 0 0 0 0 1 0 0 0 0 0 0 0 0Tot 243 243 203 0 0 0 41 14 0 0 0 0 0 0 0
[ 0 - 3M [ 0 0 0 0 0 0 0 0 0 0 0 0 0 0 0
[ 3M - 1Y [ 0 0 0 0 0 0 0 0 0 0 0 0 0 0 0
[ 1Y - 2Y [ 0 0 0 0 0 0 0 0 0 0 0 0 0 0 0
[ 2Y - 3Y [ 0 0 0 0 0 0 0 0 0 0 0 0 0 0 0
[3Y - 5Y [ 0 0 0 0 0 0 0 0 0 0 0 0 0 0 0
[5Y - 10Y [ 0 0 0 0 0 0 0 0 0 0 0 0 0 0 0
[10Y - more 0 0 0 0 0 0 0 0 0 0 0 0 0 0 0Tot 0 0 0 0 0 0 0 0 0 0 0 0 0 0 0
[ 0 - 3M [ 1,666 1,666 1,666 0 0 0 0 0 0 0 0 0 0 0 0
[ 3M - 1Y [ 0 0 0 0 0 0 0 0 0 0 0 0 0 0 0
[ 1Y - 2Y [ 0 0 0 0 0 0 0 0 0 0 0 0 0 0 0
[ 2Y - 3Y [ 0 0 0 0 0 0 0 0 0 0 0 0 0 0 0
[3Y - 5Y [ 0 0 0 0 0 0 0 0 0 0 0 0 0 0 0
[5Y - 10Y [ 0 0 0 0 0 0 0 0 0 0 0 0 0 0 0
[10Y - more 0 0 0 0 0 0 0 0 0 0 0 0 0 0 0Tot 1,666 1,666 1,666 0 0 0 0 0 0 0 0 0 0 0 0
[ 0 - 3M [ 826 826 0 0 826 0 0 0 0 0 0 0 0 0 0
[ 3M - 1Y [ 2,831 2,831 0 0 2,831 0 0 0 0 0 0 0 0 0 0
[ 1Y - 2Y [ 0 0 0 0 0 0 0 0 0 0 0 0 0 0 0
[ 2Y - 3Y [ 0 0 0 0 0 0 0 0 0 0 0 0 0 0 0
[3Y - 5Y [ 0 0 0 0 0 0 0 0 0 0 0 0 0 0 0
[5Y - 10Y [ 0 0 0 0 0 0 0 0 0 0 0 0 0 0 0
[10Y - more 0 0 0 0 0 0 0 0 0 0 0 0 0 0 0Tot 3,657 3,657 0 0 3,657 0 0 0 0 0 0 0 0 0 0
Liechtenstein
Iceland
Norway
Australia
Canada
Hong Kong
Japan
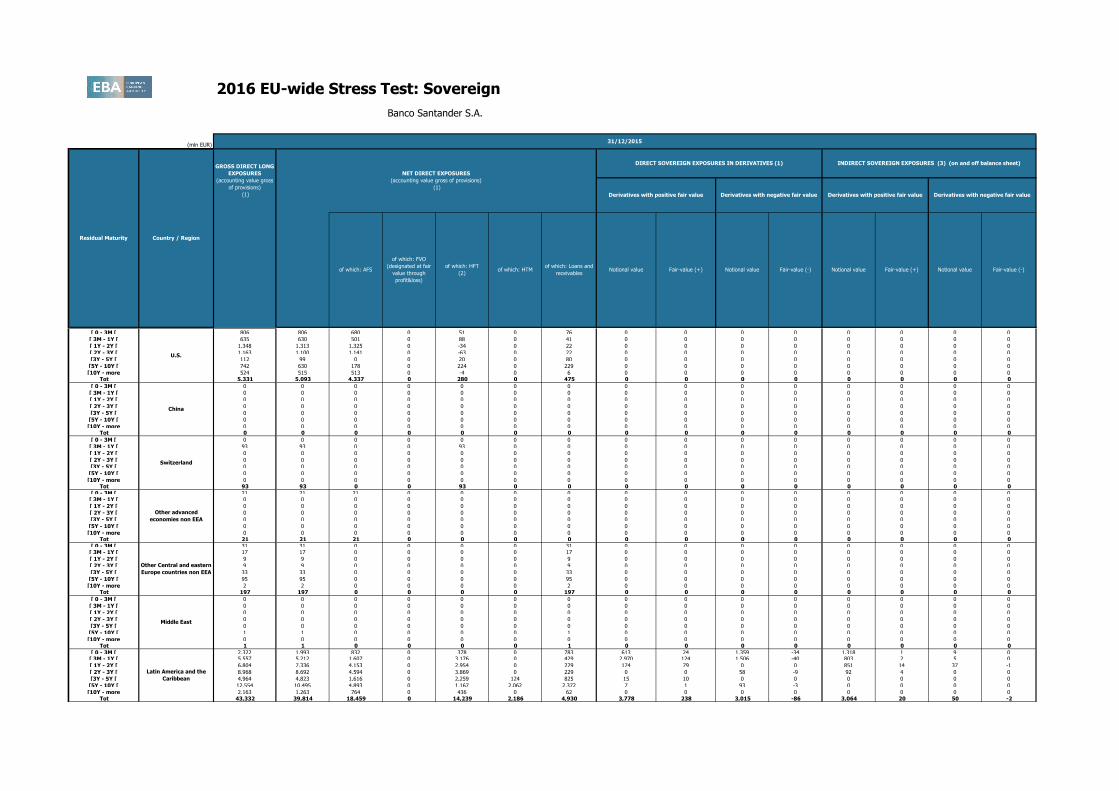
2016 EU-wide Stress Test: Sovereign
(mln EUR)
Banco Santander S.A.
31/12/2015
Residual Maturity Country / Region
GROSS DIRECT LONG
EXPOSURES
(accounting value gross
of provisions)
(1)
NET DIRECT EXPOSURES
(accounting value gross of provisions)
(1)
Notional value Fair-value (+) Fair-value (-) Notional value Fair-value (+)
DIRECT SOVEREIGN EXPOSURES IN DERIVATIVES (1) INDIRECT SOVEREIGN EXPOSURES (3) (on and off balance sheet)
Derivatives with positive fair value Derivatives with negative fair value Derivatives with positive fair value Derivatives with negative fair value
Notional value Fair-value (-)Notional valueof which: Loans and
receivablesof which: AFS
of which: FVO
(designated at fair
value through
profit&loss)
of which: HFT
(2)of which: HTM
Austria
[ 0 - 3M [ 806 806 680 0 51 0 76 0 0 0 0 0 0 0 0
[ 3M - 1Y [ 635 630 501 0 88 0 41 0 0 0 0 0 0 0 0
[ 1Y - 2Y [ 1,348 1,313 1,325 0 -34 0 22 0 0 0 0 0 0 0 0
[ 2Y - 3Y [ 1,163 1,100 1,141 0 -63 0 22 0 0 0 0 0 0 0 0
[3Y - 5Y [ 112 99 0 0 20 0 80 0 0 0 0 0 0 0 0
[5Y - 10Y [ 742 630 178 0 224 0 229 0 0 0 0 0 0 0 0
[10Y - more 524 515 513 0 -4 0 6 0 0 0 0 0 0 0 0Tot 5,331 5,093 4,337 0 280 0 475 0 0 0 0 0 0 0 0
[ 0 - 3M [ 0 0 0 0 0 0 0 0 0 0 0 0 0 0 0
[ 3M - 1Y [ 0 0 0 0 0 0 0 0 0 0 0 0 0 0 0
[ 1Y - 2Y [ 0 0 0 0 0 0 0 0 0 0 0 0 0 0 0
[ 2Y - 3Y [ 0 0 0 0 0 0 0 0 0 0 0 0 0 0 0
[3Y - 5Y [ 0 0 0 0 0 0 0 0 0 0 0 0 0 0 0
[5Y - 10Y [ 0 0 0 0 0 0 0 0 0 0 0 0 0 0 0
[10Y - more 0 0 0 0 0 0 0 0 0 0 0 0 0 0 0Tot 0 0 0 0 0 0 0 0 0 0 0 0 0 0 0
[ 0 - 3M [ 0 0 0 0 0 0 0 0 0 0 0 0 0 0 0
[ 3M - 1Y [ 93 93 0 0 93 0 0 0 0 0 0 0 0 0 0
[ 1Y - 2Y [ 0 0 0 0 0 0 0 0 0 0 0 0 0 0 0
[ 2Y - 3Y [ 0 0 0 0 0 0 0 0 0 0 0 0 0 0 0
[3Y - 5Y [ 0 0 0 0 0 0 0 0 0 0 0 0 0 0 0
[5Y - 10Y [ 0 0 0 0 0 0 0 0 0 0 0 0 0 0 0
[10Y - more 0 0 0 0 0 0 0 0 0 0 0 0 0 0 0Tot 93 93 0 0 93 0 0 0 0 0 0 0 0 0 0
[ 0 - 3M [ 21 21 21 0 0 0 0 0 0 0 0 0 0 0 0[ 3M - 1Y [ 0 0 0 0 0 0 0 0 0 0 0 0 0 0 0
[ 1Y - 2Y [ 0 0 0 0 0 0 0 0 0 0 0 0 0 0 0
[ 2Y - 3Y [ 0 0 0 0 0 0 0 0 0 0 0 0 0 0 0
[3Y - 5Y [ 0 0 0 0 0 0 0 0 0 0 0 0 0 0 0
[5Y - 10Y [ 0 0 0 0 0 0 0 0 0 0 0 0 0 0 0
[10Y - more 0 0 0 0 0 0 0 0 0 0 0 0 0 0 0Tot 21 21 21 0 0 0 0 0 0 0 0 0 0 0 0
[ 0 - 3M [ 31 31 0 0 0 0 31 0 0 0 0 0 0 0 0[ 3M - 1Y [ 17 17 0 0 0 0 17 0 0 0 0 0 0 0 0
[ 1Y - 2Y [ 9 9 0 0 0 0 9 0 0 0 0 0 0 0 0
[ 2Y - 3Y [ 9 9 0 0 0 0 9 0 0 0 0 0 0 0 0
[3Y - 5Y [ 33 33 0 0 0 0 33 0 0 0 0 0 0 0 0
[5Y - 10Y [ 95 95 0 0 0 0 95 0 0 0 0 0 0 0 0
[10Y - more 2 2 0 0 0 0 2 0 0 0 0 0 0 0 0Tot 197 197 0 0 0 0 197 0 0 0 0 0 0 0 0
[ 0 - 3M [ 0 0 0 0 0 0 0 0 0 0 0 0 0 0 0
[ 3M - 1Y [ 0 0 0 0 0 0 0 0 0 0 0 0 0 0 0
[ 1Y - 2Y [ 0 0 0 0 0 0 0 0 0 0 0 0 0 0 0
[ 2Y - 3Y [ 0 0 0 0 0 0 0 0 0 0 0 0 0 0 0
[3Y - 5Y [ 0 0 0 0 0 0 0 0 0 0 0 0 0 0 0
[5Y - 10Y [ 1 1 0 0 0 0 1 0 0 0 0 0 0 0 0
[10Y - more 0 0 0 0 0 0 0 0 0 0 0 0 0 0 0Tot 1 1 0 0 0 0 1 0 0 0 0 0 0 0 0
[ 0 - 3M [ 2,322 1,993 832 0 378 0 783 613 24 1,359 -34 1,318 1 9 0[ 3M - 1Y [ 5,557 5,212 1,607 0 3,176 0 429 2,970 124 1,506 -40 803 2 5 0
[ 1Y - 2Y [ 6,804 7,336 4,153 0 2,954 0 229 174 79 0 0 851 14 37 -1
[ 2Y - 3Y [ 8,968 8,692 4,594 0 3,869 0 229 0 0 58 -9 92 4 0 0
[3Y - 5Y [ 4,964 4,823 1,616 0 2,259 124 825 15 10 0 0 0 0 0 0
[5Y - 10Y [ 12,554 10,495 4,893 0 1,167 2,062 2,372 7 1 93 -3 0 0 0 0
[10Y - more 2,163 1,263 764 0 436 0 62 0 0 0 0 0 0 0 0Tot 43,332 39,814 18,459 0 14,239 2,186 4,930 3,778 238 3,015 -86 3,064 20 50 -2
Latin America and the
Caribbean
Middle East
U.S.
China
Switzerland
Other advanced
economies non EEA
Other Central and eastern
Europe countries non EEA
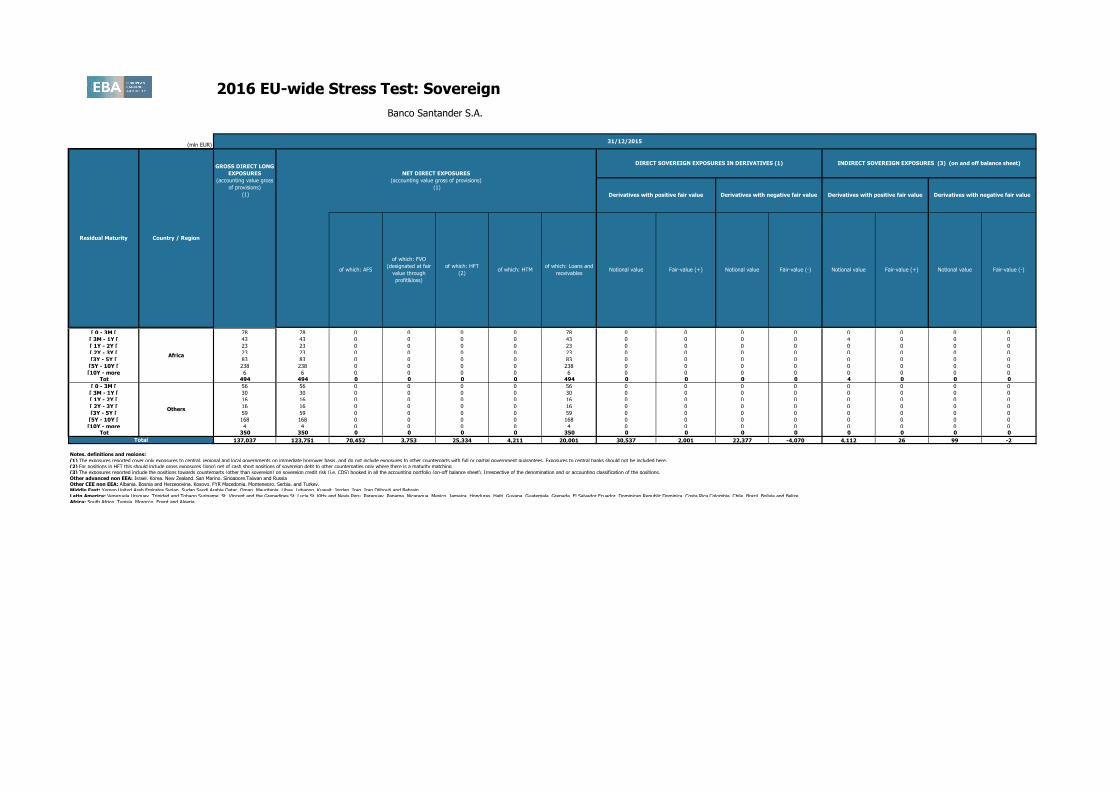
2016 EU-wide Stress Test: Sovereign
(mln EUR)
Banco Santander S.A.
31/12/2015
Residual Maturity Country / Region
GROSS DIRECT LONG
EXPOSURES
(accounting value gross
of provisions)
(1)
NET DIRECT EXPOSURES
(accounting value gross of provisions)
(1)
Notional value Fair-value (+) Fair-value (-) Notional value Fair-value (+)
DIRECT SOVEREIGN EXPOSURES IN DERIVATIVES (1) INDIRECT SOVEREIGN EXPOSURES (3) (on and off balance sheet)
Derivatives with positive fair value Derivatives with negative fair value Derivatives with positive fair value Derivatives with negative fair value
Notional value Fair-value (-)Notional valueof which: Loans and
receivablesof which: AFS
of which: FVO
(designated at fair
value through
profit&loss)
of which: HFT
(2)of which: HTM
Austria
[ 0 - 3M [ 78 78 0 0 0 0 78 0 0 0 0 0 0 0 0
[ 3M - 1Y [ 43 43 0 0 0 0 43 0 0 0 0 4 0 0 0
[ 1Y - 2Y [ 23 23 0 0 0 0 23 0 0 0 0 0 0 0 0
[ 2Y - 3Y [ 23 23 0 0 0 0 23 0 0 0 0 0 0 0 0
[3Y - 5Y [ 83 83 0 0 0 0 83 0 0 0 0 0 0 0 0
[5Y - 10Y [ 238 238 0 0 0 0 238 0 0 0 0 0 0 0 0
[10Y - more 6 6 0 0 0 0 6 0 0 0 0 0 0 0 0Tot 494 494 0 0 0 0 494 0 0 0 0 4 0 0 0
[ 0 - 3M [ 56 56 0 0 0 0 56 0 0 0 0 0 0 0 0
[ 3M - 1Y [ 30 30 0 0 0 0 30 0 0 0 0 0 0 0 0
[ 1Y - 2Y [ 16 16 0 0 0 0 16 0 0 0 0 0 0 0 0
[ 2Y - 3Y [ 16 16 0 0 0 0 16 0 0 0 0 0 0 0 0
[3Y - 5Y [ 59 59 0 0 0 0 59 0 0 0 0 0 0 0 0
[5Y - 10Y [ 168 168 0 0 0 0 168 0 0 0 0 0 0 0 0
[10Y - more 4 4 0 0 0 0 4 0 0 0 0 0 0 0 0Tot 350 350 0 0 0 0 350 0 0 0 0 0 0 0 0
137,037 123,751 70,452 3,753 25,334 4,211 20,001 30,537 2,001 22,377 -4,070 4,112 26 99 -2
Notes, definitions and regions:
(1) The exposures reported cover only exposures to central, regional and local governments on immediate borrower basis, and do not include exposures to other counterparts with full or partial government guarantees. Exposures to central banks should not be included here.(2) For positions in HFT this should include gross exposures (long) net of cash short positions of sovereign debt to other counterpaties only where there is a maturity matching(3) The exposures reported include the positions towards counterparts (other than sovereign) on sovereign credit risk (i.e. CDS) booked in all the accounting portfolio (on-off balance sheet). Irrespective of the denomination and or accounting classification of the positions.Other advanced non EEA: Israel, Korea, New Zealand, San Marino, Singapore,Taiwan and RussiaOther CEE non EEA: Albania, Bosnia and Herzegovina, Kosovo, FYR Macedonia, Montenegro, Serbia, and Turkey.Middle East: Yemen,United Arab Emirates,Syrian ,Sudan,Saudi Arabia,Qatar ,Oman ,Mauritania ,Libya ,Lebanon ,Kuwait ,Jordan ,Iraq ,Iran,Djibouti and Bahrain.Latin America: Venezuela,Uruguay ,Trinidad and Tobago,Suriname ,St. Vincent and the Grenadines,St. Lucia,St. Kitts and Nevis,Peru ,Paraguay ,Panama ,Nicaragua ,Mexico ,Jamaica ,Honduras ,Haiti ,Guyana ,Guatemala ,Grenada ,El Salvador,Ecuador ,Dominican Republic,Dominica ,Costa Rica,Colombia ,Chile ,Brazil ,Bolivia and Belize.Africa: South Africa, Tunisia ,Morocco ,Egypt and Algeria.
Africa
Others
Total
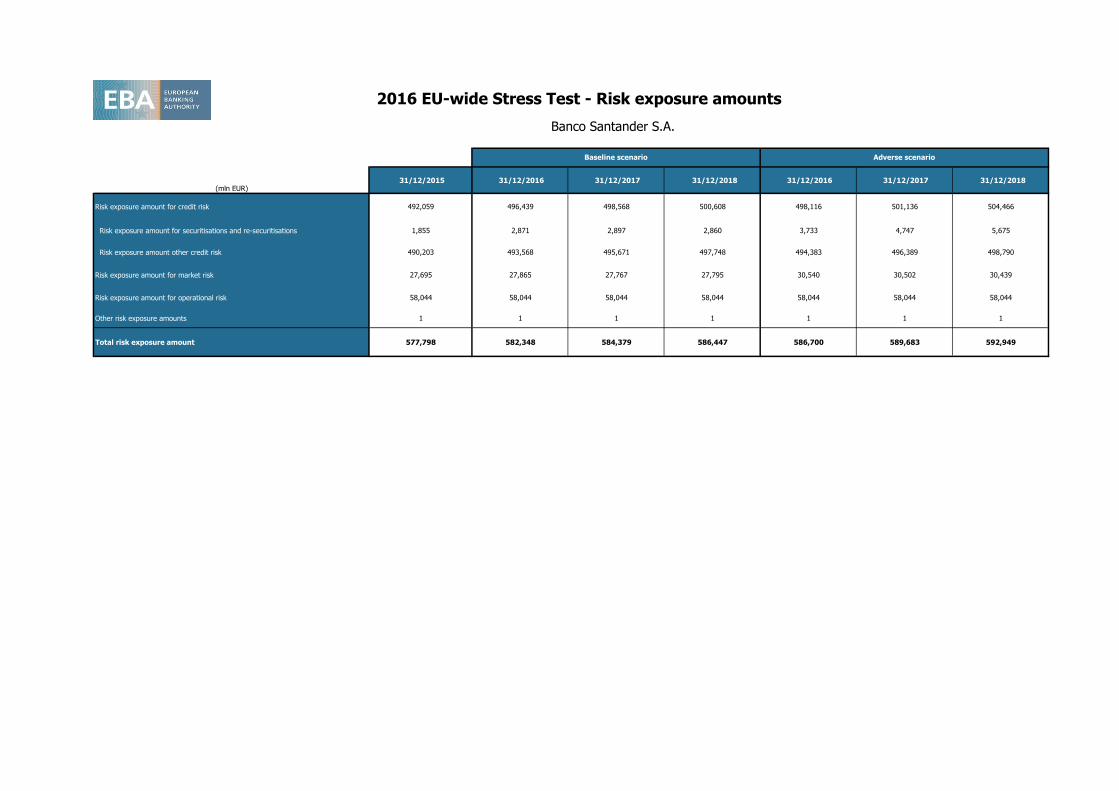
2016 EU-wide Stress Test - Risk exposure amounts
(mln EUR) 31/12/2015 31/12/2016 31/12/2017 31/12/2018 31/12/2016 31/12/2017 31/12/2018
Risk exposure amount for credit risk 492,059 496,439 498,568 500,608 498,116 501,136 504,466
Risk exposure amount for securitisations and re-securitisations 1,855 2,871 2,897 2,860 3,733 4,747 5,675
Risk exposure amount other credit risk 490,203 493,568 495,671 497,748 494,383 496,389 498,790
Risk exposure amount for market risk 27,695 27,865 27,767 27,795 30,540 30,502 30,439
Risk exposure amount for operational risk 58,044 58,044 58,044 58,044 58,044 58,044 58,044
Other risk exposure amounts 1 1 1 1 1 1 1
Total risk exposure amount 577,798 582,348 584,379 586,447 586,700 589,683 592,949
Baseline scenario Adverse scenario
Banco Santander S.A.
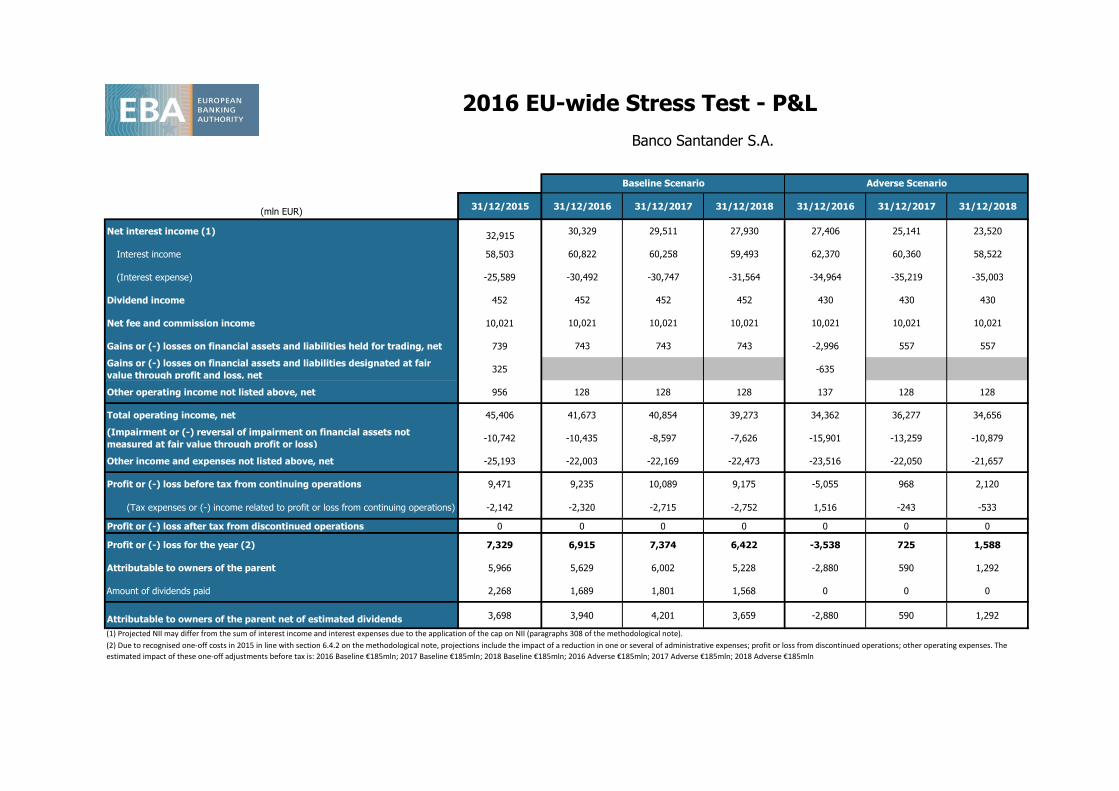
2016 EU-wide Stress Test - P&L
31/12/2015 31/12/2016 31/12/2017 31/12/2018 31/12/2016 31/12/2017 31/12/2018
Net interest income (1) 32,91530,329 29,511 27,930 27,406 25,141 23,520
Interest income 58,503 60,822 60,258 59,493 62,370 60,360 58,522
(Interest expense) -25,589 -30,492 -30,747 -31,564 -34,964 -35,219 -35,003
Dividend income 452 452 452 452 430 430 430
Net fee and commission income 10,021 10,021 10,021 10,021 10,021 10,021 10,021
Gains or (-) losses on financial assets and liabilities held for trading, net 739 743 743 743 -2,996 557 557
Gains or (-) losses on financial assets and liabilities designated at fair
value through profit and loss, net325 -635
Other operating income not listed above, net 956 128 128 128 137 128 128
Total operating income, net 45,406 41,673 40,854 39,273 34,362 36,277 34,656
(Impairment or (-) reversal of impairment on financial assets not
measured at fair value through profit or loss)-10,742 -10,435 -8,597 -7,626 -15,901 -13,259 -10,879
Other income and expenses not listed above, net -25,193 -22,003 -22,169 -22,473 -23,516 -22,050 -21,657
Profit or (-) loss before tax from continuing operations 9,471 9,235 10,089 9,175 -5,055 968 2,120
(Tax expenses or (-) income related to profit or loss from continuing operations) -2,142 -2,320 -2,715 -2,752 1,516 -243 -533
Profit or (-) loss after tax from discontinued operations 0 0 0 0 0 0 0
Profit or (-) loss for the year (2) 7,329 6,915 7,374 6,422 -3,538 725 1,588
Attributable to owners of the parent 5,966 5,629 6,002 5,228 -2,880 590 1,292
Amount of dividends paid 2,268 1,689 1,801 1,568 0 0 0
Attributable to owners of the parent net of estimated dividends 3,698 3,940 4,201 3,659 -2,880 590 1,292
(2) Due to recognised one-off costs in 2015 in line with section 6.4.2 on the methodological note, projections include the impact of a reduction in one or several of administrative expenses; profit or loss from discontinued operations; other operating expenses. The
estimated impact of these one-off adjustments before tax is: 2016 Baseline €185mln; 2017 Baseline €185mln; 2018 Baseline €185mln; 2016 Adverse €185mln; 2017 Adverse €185mln; 2018 Adverse €185mln
(mln EUR)
Baseline Scenario Adverse Scenario
Banco Santander S.A.
(1) Projected NII may differ from the sum of interest income and interest expenses due to the application of the cap on NII (paragraphs 308 of the methodological note).

2016 EU-wide Stress Test: Capital
(mln EUR,%) 31/12/2015 31/12/2016 31/12/2017 31/12/2018 31/12/2016 31/12/2017 31/12/2018
A OWN FUNDS 84,326 88,266 92,382 95,547 73,654 71,052 69,413
A.1 COMMON EQUITY TIER 1 CAPITAL (net of deductions and after applying transitional adjustments) 73,454 77,279 80,236 77,655 62,662 58,902 51,515
A.1.1 Capital instruments eligible as CET1 Capital (including share premium and net own capital instruments) 52,005 52,005 52,005 52,005 52,005 52,005 52,005
A.1.1.1 Of which: CET1 instruments subscribed by Government 0 0 0 0 0 0 0
A.1.2 Retained earnings 49,673 53,613 57,814 61,474 46,792 47,383 48,675
A.1.3 Accumulated other comprehensive income -15,302 -15,302 -15,302 -15,302 -23,023 -23,023 -23,023
A.1.3.1 Of which: arising from unrealised gains/losses from Sovereign exposure in AFS portfolio 96 96 96 96 -3,643 -3,643 -3,643
A.1.3.2 Of which: arising from unrealised gains/losses from the rest of AFS portfolio 740 740 740 740 -1,970 -1,970 -1,970
A.1.4 Other Reserves 0 0 0 0 0 0 0
A.1.5 Funds for general banking risk 0 0 0 0 0 0 0
A.1.6 Minority interest given recognition in CET1 capital 6,148 6,792 7,477 8,075 5,490 5,558 5,705
A.1.7 Adjustments to CET1 due to prudential filters -145 -145 -145 -145 -145 -145 -145
A.1.8 (-) Intangible assets (including Goodwill) -28,254 -28,254 -28,254 -28,254 -28,254 -28,254 -28,254
A.1.9 (-) DTAs that rely on future profitability and do not arise from temporary differences net of associated DTLs -3,922 -1,603 0 0 -5,439 -5,196 -4,663
A.1.10 (-) IRB shortfall of credit risk adjustments to expected losses -24 -24 -24 -24 -24 -24 -24
A.1.11 (-) Defined benefit pension fund assets -786 -786 -786 -786 -153 -153 -153
A.1.12 (-) Reciprocal cross holdings in CET1 Capital 0 0 0 0 0 0 0
A.1.13 (-) Excess deduction from AT1 items over AT1 Capital -10,286 -4,587 0 0 -4,587 0 0
A.1.14 (-) Deductions related to assets which can alternatively be subject to a 1.250% risk weight -24 -24 -24 -24 -24 -24 -24
A.1.14.1 Of which: from securitisation positions (-) 0 0 0 0 0 0 0
A.1.15(-) Holdings of CET1 capital instruments of financial sector entities where the institiution does not have a significant
investment0 0 0 0 0 0 0
A.1.16 (-) Deductible DTAs that rely on future profitability and arise from temporary differences -686 0 0 0 -1,901 -1,811 -1,613
A.1.17 (-) CET1 instruments of financial sector entities where the institiution has a significant investment 0 0 0 0 0 0 0
A.1.18 (-) Amount exceding the 17.65% threshold 0 0 0 0 0 0 0
A.1.19 (-) Additional deductions of CET1 Capital due to Article 3 CRR 0 0 0 0 0 0 0
A.1.20 CET1 capital elements or deductions - other 0 0 0 0 0 0 0
A.1.21 Transitional adjustments 25,059 15,596 7,476 638 21,925 12,587 3,030
A.1.21.1 Transitional adjustments due to grandfathered CET1 Capital instruments (+/-) 0 0 0 0 0 0 0
A.1.21.2 Transitional adjustments due to additional minority interests (+/-) 1,677 1,118 559 0 1,118 559 0
A.1.21.3Transitional adjustments to CET1 Capital from unrealised gains/losses from Sovereign exposure in AFS portfolio (+/-
)-96 -39 -19 0 1,457 729 0
A.1.21.4 Transitional adjustments to CET1 Capital from unrealised gains/losses from the rest of AFS portfolio (+/-) -444 -296 -148 0 788 394 0
A.1.21.5 Other transitional adjustments to CET1 Capital 23,923 14,813 7,084 638 18,562 10,905 3,030
A.1.21.5.1 Of which: due to DTAs that rely on future profitability and do not arise from temporary differences 3,260 1,282 0 0 3,384 2,549 1,812
A.1.21.5.2Of which: due to DTAs that rely on future profitability and arise from temporary differences and CET1
instruments of financial sector entities where the institution has a significant investment686 0 0 0 1,901 1,398 580
A.2 ADDITIONAL TIER 1 CAPITAL (net of deductions and after transitional adjustments) 0 0 1,112 6,811 0 1,112 6,811
A.2.1 Additional Tier 1 Capital instruments 5,504 5,504 5,504 5,504 5,504 5,504 5,504
A.2.2 (-) Excess deduction from T2 items over T2 capital 0 0 0 0 0 0 0
A.2.3 Other Additional Tier 1 Capital components and deductions 10,286 4,587 0 0 4,587 0 0
A.2.4 Additional Tier 1 transitional adjustments -15,790 -10,091 -4,392 1,307 -10,091 -4,392 1,307
A.3 TIER 1 CAPITAL (net of deductions and after transitional adjustments) 73,454 77,279 81,348 84,466 62,662 60,014 58,326
A.4 TIER 2 CAPITAL (net of deductions and after transitional adjustments) 10,872 10,987 11,034 11,081 10,992 11,038 11,087
A.4.1 Tier 2 Capital instruments 8,133 8,133 8,133 8,133 8,133 8,133 8,133
A.4.2 Other Tier 2 Capital components and deductions 3,866 3,947 3,960 3,972 3,952 3,964 3,979
A.4.3 Tier 2 transitional adjustments -1,128 -1,094 -1,059 -1,025 -1,094 -1,059 -1,025
B TOTAL RISK EXPOSURE AMOUNT 577,798 582,348 584,379 586,447 586,700 589,683 592,949
B.1 Of which: Transitional adjustments included 1,716 1,716 1,716 1,716 4,752 2,797 1,716
C.1 Common Equity Tier 1 Capital ratio 12.71% 13.27% 13.73% 13.24% 10.68% 9.99% 8.69%
C.2 Tier 1 Capital ratio 12.71% 13.27% 13.92% 14.40% 10.68% 10.18% 9.84%
C.3 Total Capital ratio 14.59% 15.16% 15.81% 16.29% 12.55% 12.05% 11.71%
D.1 Common Equity Tier 1 Capital ratio (1) 10.19% 11.41% 12.49% 13.17% 7.79% 7.89% 8.20%
D.2 Tier 1 Capital ratio (2) 11.14% 12.36% 13.43% 14.11% 8.73% 8.83% 9.13%
D.3 Total Capital ratio (3) 13.22% 14.44% 15.51% 16.18% 10.81% 10.89% 11.18%
ETotal amount of instruments with mandatory conversion into ordinary shares upon a fixed date in the 2016 -2018 period
(cumulative conversions) (4)0 0 0 0 0 0 0
FTotal Additional Tier 1 and Tier 2 instruments eligible as regulatory capital under the CRR provisions that convert into
Common Equity Tier 1 or are written down upon a trigger event (5)5504 5504 5504
F.1 Of which: eligible instruments whose trigger is above CET1 capital ratio in the adverse scenario (5) 0 0 0
G.1 Total leverage ratio exposures (transitional) 1,364,684 1,364,684 1,364,684 1,364,684 1,364,684 1,364,684 1,364,684
G.2 Total leverage ratio exposures (fully loaded) 1,358,254 1,358,254 1,358,254 1,358,254 1,358,254 1,358,254 1,358,254
G.3 Leverage ratio (transitional) 5.38% 5.66% 5.96% 6.19% 4.59% 4.40% 4.27%
G.4 Leverage ratio (fully loaded) 4.73% 5.28% 5.76% 6.08% 3.74% 3.82% 3.97%
(1) Fully loaded CET1 capital ratio estimation: [A.1-A.1.13-A.1.21+MIN(A.2+A.1.13-A.2.2-A.2.4+MIN(A.4+A.2.2-A.4.3,0),0)]/[B-B.1]
(2) Fully loaded T1 capital ratio estimation: [A.1-A.1.21+A.2-A.2.2-A.2.4+MIN(A.4+A.2.2-A.4.3,0)]/[B-B.1]
(3) Fully loaded Total capital ratio estimation: [A.1-A.1.21+A.2-A.2.4+A.4-A.4.3)/[B-B.1]. This ratio does not include grandfathered AT1 capital instruments meeting the conditions laid down in Article 63 of CRR and, hence, eligible as fully loaded T2 capital. Therefore, the ratio could be underestimated for banks with material instruments of such kind.
(4) Conversions not considered for CET1 computation
(5) Excluding instruments included in row E
Memorandum items
Baseline Scenario Adverse Scenario
CAPITAL RATIOS (%)
Transitional period
Banco Santander S.A.
OWN FUNDS
CAPITAL RATIOS (%)
Fully loaded
TOTAL RISK EXPOSURE
AMOUNT
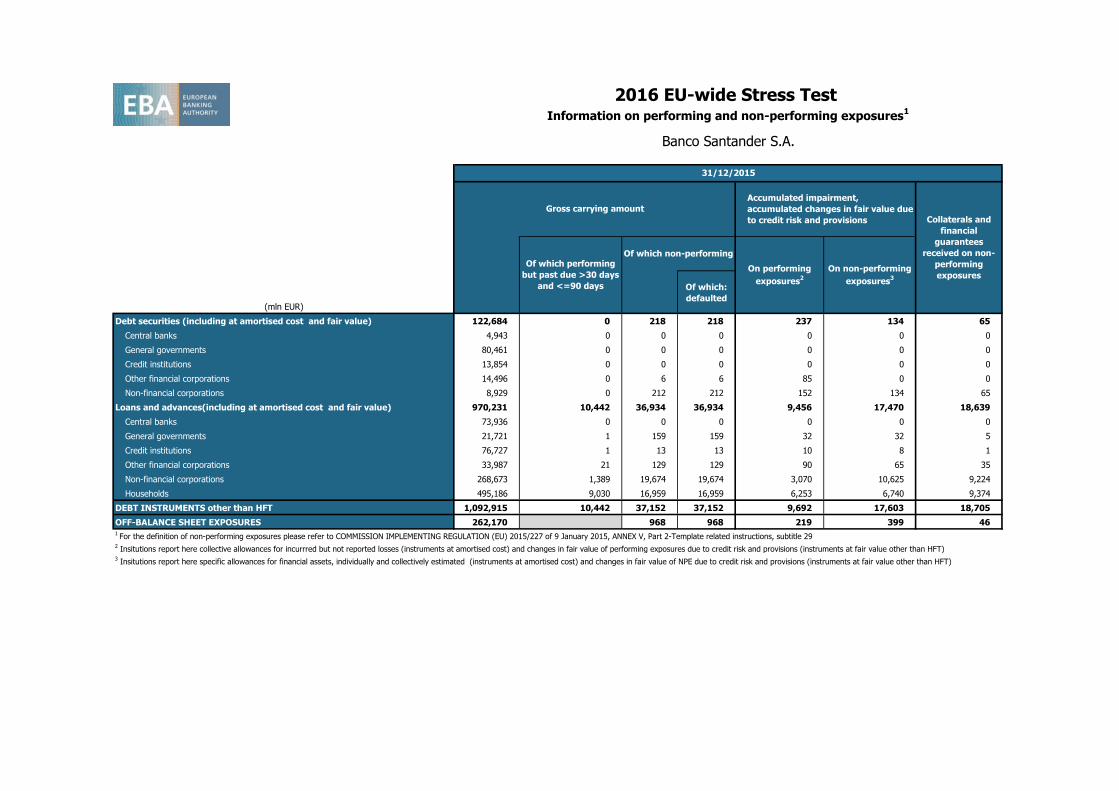
(mln EUR)
Of which:
defaulted
Debt securities (including at amortised cost and fair value) 122,684 0 218 218 237 134 65
Central banks 4,943 0 0 0 0 0 0
General governments 80,461 0 0 0 0 0 0
Credit institutions 13,854 0 0 0 0 0 0
Other financial corporations 14,496 0 6 6 85 0 0
Non-financial corporations 8,929 0 212 212 152 134 65
Loans and advances(including at amortised cost and fair value) 970,231 10,442 36,934 36,934 9,456 17,470 18,639
Central banks 73,936 0 0 0 0 0 0
General governments 21,721 1 159 159 32 32 5
Credit institutions 76,727 1 13 13 10 8 1
Other financial corporations 33,987 21 129 129 90 65 35
Non-financial corporations 268,673 1,389 19,674 19,674 3,070 10,625 9,224
Households 495,186 9,030 16,959 16,959 6,253 6,740 9,374
DEBT INSTRUMENTS other than HFT 1,092,915 10,442 37,152 37,152 9,692 17,603 18,705
OFF-BALANCE SHEET EXPOSURES 262,170 968 968 219 399 461 For the definition of non-performing exposures please refer to COMMISSION IMPLEMENTING REGULATION (EU) 2015/227 of 9 January 2015, ANNEX V, Part 2-Template related instructions, subtitle 29
2 Insitutions report here collective allowances for incurrred but not reported losses (instruments at amortised cost) and changes in fair value of performing exposures due to credit risk and provisions (instruments at fair value other than HFT)
3 Insitutions report here specific allowances for financial assets, individually and collectively estimated (instruments at amortised cost) and changes in fair value of NPE due to credit risk and provisions (instruments at fair value other than HFT)
On non-performing
exposures3
2016 EU-wide Stress Test Information on performing and non-performing exposures
1
31/12/2015
Gross carrying amount
Accumulated impairment,
accumulated changes in fair value due
to credit risk and provisions Collaterals and
financial
guarantees
received on non-
performing
exposures
Of which performing
but past due >30 days
and <=90 days
Of which non-performing
On performing
exposures2
Banco Santander S.A.
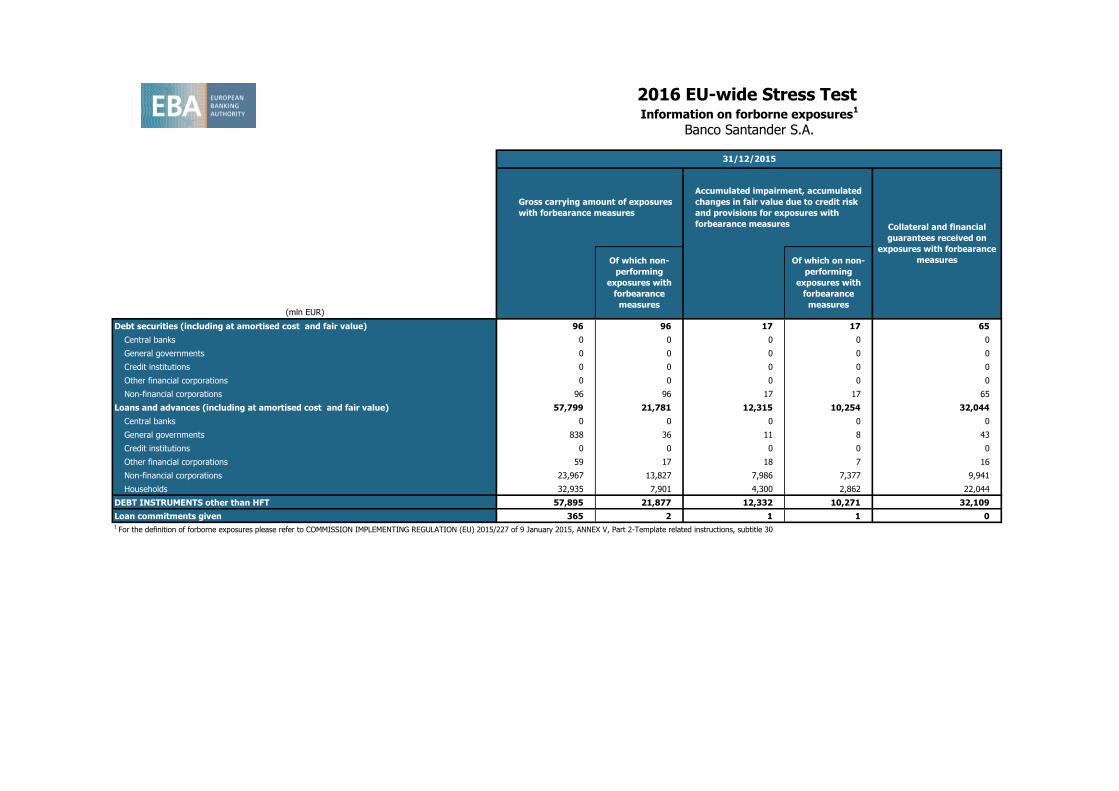
(mln EUR)
Debt securities (including at amortised cost and fair value) 96 96 17 17 65
Central banks 0 0 0 0 0
General governments 0 0 0 0 0
Credit institutions 0 0 0 0 0
Other financial corporations 0 0 0 0 0
Non-financial corporations 96 96 17 17 65
Loans and advances (including at amortised cost and fair value) 57,799 21,781 12,315 10,254 32,044
Central banks 0 0 0 0 0
General governments 838 36 11 8 43
Credit institutions 0 0 0 0 0
Other financial corporations 59 17 18 7 16
Non-financial corporations 23,967 13,827 7,986 7,377 9,941
Households 32,935 7,901 4,300 2,862 22,044
DEBT INSTRUMENTS other than HFT 57,895 21,877 12,332 10,271 32,109
Loan commitments given 365 2 1 1 01 For the definition of forborne exposures please refer to COMMISSION IMPLEMENTING REGULATION (EU) 2015/227 of 9 January 2015, ANNEX V, Part 2-Template related instructions, subtitle 30
2016 EU-wide Stress Test Information on forborne exposures
1
31/12/2015
Of which non-
performing
exposures with
forbearance
measures
Of which on non-
performing
exposures with
forbearance
measures
Gross carrying amount of exposures
with forbearance measures
Accumulated impairment, accumulated
changes in fair value due to credit risk
and provisions for exposures with
forbearance measures Collateral and financial
guarantees received on
exposures with forbearance
measures
Banco Santander S.A.