©2016 christopher steven satch all rights reserved
TRANSCRIPT

©2016
Christopher Steven Satch
ALL RIGHTS RESERVED

Exploration of Chufa (Cyperus esculentus L. var. sativus Boeck) as a novel specialty crop
for the Northeastern United States
By
Christopher Steven Satch
A thesis submitted to the Graduate School-New Brunswick
Rutgers, the State University of New Jersey
In partial fulfillment of the requirements
For the degree of
Master of Science in Plant Biology
Graduate Program in Plant Biology and Pathology
Written under the direction of Dr. Mark G. Robson
And approved by
________________________________
________________________________
________________________________
New Brunswick, New Jersey
January, 2016

ii
ABSTRACT OF THE THESIS
Exploration of Chufa (Cyperus esculentus L. var. sativus Boeck) as a novel specialty crop
for the Northeastern United States
By Christopher Steven Satch
Thesis Director:
Dr. Mark G. Robson
Cyperus esculentus L. var. sativus (Boeck) is a globally-distributed sedge that produces
edible tubers, commonly called nuts. The tubers are prized as a delicacy in parts of
Nigeria and North Africa. This plant is known by many names, but is most commonly
referred to as Chufa or Tiger Nuts. Chufa has been foraged as a part of the human diet
during the Paleolithic Era, and has been cultivated in Egypt and North Africa for over
6000 years. We wanted to explore the potential of this specialty crop that is high in all
20 amino acids, in vitamins C and E, and in minerals, to evaluate the potential for
growing it in the Northeastern United States. We also wanted to explore the optimal
conditions for production for anyone who wishes to utilize this crop. We have
evaluated the effects of potassium, iron, water, and growth media on the productivity of
Chufa. We have chosen potassium to increase tuber size, iron for overall plant
productivity, water for drought tolerance, and growth media for overall plant
productivity. We have found that increasing potassium with nitrogen and phosphorus

iii
increases overall plant productivity, but increased potassium alone does not significantly
increase tuber size. We have found that iron has no effect on plant productivity. We
have found that the productivity of Chufa increases significantly with increasing water.
We have found that professional growing medium is best for overall plant production,
followed by organically fertilized organic soil. We hope that our findings help to make
Chufa more accessible and enticing to the Western World as a health food crop.

iv
Acknowledgement and Dedication
To everyone who believes in me.
I would also like to thank the guidance of my committee, Dr. Lena Struwe, Dr. Mark
Robson, Dr. Albert Ayeni, and the support of the Department of Plant Biology and
Pathology. With their patience, virtue, and leadership, this thesis is possible.

v
Table of Contents
Chapter 1 – Chufa- the plant, properties, and history (1)
Chapter 2 – Characterization of Chufa: Potassium Enrichment of Soils (15)
Chapter 3 – Characterization of Chufa: Iron Enrichment of Soils and Foliar Spray (26)
Chapter 4 – Characterization of Chufa: Effect of Irrigation on Chufa Productivity (39)
Chapter 5 – Characterization of Chufa: Soil-Type Effects on Chufa Productivity (45)
Chapter 6 – Current Status and Future Applications (53)

vi
List of Figures – (Page Number)
Fig. 1 . . . . . . . . . . . . . . . . . . . . . . . . . . . . . . . . . . . . . . . . . . . . . . . . . . . . . . . . . (14)
Fig. 2, 3 . . . . . . . . . . . . . . . . . . . . . . . . . . . . . . . . . . . . . . . . . . . . . . . . . . . . . . . (17)
Fig. 4, 5 . . . . . . . . . . . . . . . . . . . . . . . . . . . . . . . . . . . . . . . . . . . . . . . . . . . . . . . (18)
Fig. 6, 7 . . . . . . . . . . . . . . . . . . . . . . . . . . . . . . . . . . . . . . . . . . . . . . . . . . . . . . . (19)
Fig. 8, 9, 10, 11 . . . . . . . . . . . . . . . . . . . . . . . . . . . . . . . . . . . . . . . . . . . . . . . . . (20)
Fig. 12, 13, 14, 15 . . . . . . . . . . . . . . . . . . . . . . . . . . . . . . . . . . . . . . . . . . . . . . . (21)
Fig. 16, 17, 18, 19 . . . . . . . . . . . . . . . . . . . . . . . . . . . . . . . . . . . . . . . . . . . . . . . (30)
Fig. 20, 21 . . . . . . . . . . . . . . . . . . . . . . . . . . . . . . . . . . . . . . . . . . . . . . . . . . . . . (31)
Fig. 22, 23 . . . . . . . . . . . . . . . . . . . . . . . . . . . . . . . . . . . . . . . . . . . . . . . . . . . . . (32)
Fig. 24, 25, 26, 27 . . . . . . . . . . . . . . . . . . . . . . . . . . . . . . . . . . . . . . . . . . . . . . . (33)
Fig. 28, 29 . . . . . . . . . . . . . . . . . . . . . . . . . . . . . . . . . . . . . . . . . . . . . . . . . . . . . (34)
Fig. 30, 31 . . . . . . . . . . . . . . . . . . . . . . . . . . . . . . . . . . . . . . . . . . . . . . . . . . . . . (35)
Fig. 32, 33, 34 . . . . . . . . . . . . . . . . . . . . . . . . . . . . . . . . . . . . . . . . . . . . . . . . . . (36)
Fig. 35, 36 . . . . . . . . . . . . . . . . . . . . . . . . . . . . . . . . . . . . . . . . . . . . . . . . . . . . . (40)
Fig. 37, 38, 39, 40 . . . . . . . . . . . . . . . . . . . . . . . . . . . . . . . . . . . . . . . . . . . . . . . (41)
Fig. 41, 42 . . . . . . . . . . . . . . . . . . . . . . . . . . . . . . . . . . . . . . . . . . . . . . . . . . . . . (42)

vii
Fig. 43 . . . . . . . . . . . . . . . . . . . . . . . . . . . . . . . . . . . . . . . . . . . . . . . . . . . . . . . . (43)
Fig. 44, 45 . . . . . . . . . . . . . . . . . . . . . . . . . . . . . . . . . . . . . . . . . . . . . . . . . . . . . (47)
Fig. 46, 47 . . . . . . . . . . . . . . . . . . . . . . . . . . . . . . . . . . . . . . . . . . . . . . . . . . . . . (48)
Fig. 48, 49 . . . . . . . . . . . . . . . . . . . . . . . . . . . . . . . . . . . . . . . . . . . . . . . . . . . . . (49)
Fig. 50 . . . . . . . . . . . . . . . . . . . . . . . . . . . . . . . . . . . . . . . . . . . . . . . . . . . . . . . . (50)

1
Chapter 1 - Chufa, the plant, properties, and history
Cyperus esculentus var. sativus (Boeck) is a globally-distributed sedge that produces
edible tubers, commonly called “nuts” (see Figure 1). The tubers have a nutty flavor,
and both the plant and the tubers have been called by a wide variety of names
including: Tiger Nuts, Tiger Nutsedge, Yellow Nutsedge, Chufa, Earth Almond, Earth Nut,
and so on (Sánchez‐Zapata, Fernández‐López, & Pérez‐Alvarez, 2012). It is a perennial
that reproduces mainly asexually through tuberous growth. It rarely flowers, and when
it does, most of the flowers are sterile (Sánchez‐Zapata, Fernández‐López, & Pérez‐
Alvarez, 2012). It grows up to about 0.3-0.8m in height, and prefers moist, loamy soil.
The tubers taste similar to almonds and coconuts, and are prized as a delicacy in parts of
Nigeria and North Africa (Bamishaiye, 2011).
Chufa has been cultivated for thousands of years, and since ancient times, has been
grown in North Africa, especially Egypt (Negbi, 1992) and the surrounding area. The
tubers have been found in the tombs of pharaohs of pre-dynastic times, about 6,000
years ago (Zohary, 1986), and are even thought to be a part of the diet of our Paleo-
ancestors (Peters & Vogel, 2005). In fact, a recent Oxford University publication finds
that indeed Chufa/Tiger Nuts were indeed a part of the diet of early man around the
Pleistocene Epoch, and consisted of a large part of the diet (Macho, 2014).
The tubers are typically cultivated in soils rich in organic matter, and are light, like in the
Nile Delta, or in the Valencia region in Spain. They are planted in raised beds, flooded
for irrigation, and then, the aboveground shoots are burned when it’s time to harvest.
2
The tubers do not get burnt because they are still underground. Tubers are harvested
by either hand or a machine similar to a peanut harvester (Sánchez‐Zapata, Fernández‐
López, & Pérez‐Alvarez, 2012).
The tubers have an excellent dry weight nutritional profile, being high in protein (7% -
8.5%) (Codina-Torrella, Guamis, & Trujillo, 2014; Adejuyitan, 2011), high in lipids (28% -
35%) (Codina-Torrella, Guamis, & Trujillo, 2014; Adejuyitan, 2011), and high in energy
(400 kcal/100g) (Codina-Torrella, Guamis, & Trujillo, 2014) compared to sweet potatoes,
(100kcal/100g) another tuber. The tubers can be ground into flour to be used in baking
products, and make an excellent wheat flour substitute for those with celiac disease, or
looking for a gluten-free diet (Aguilar, Albanell, Miñarro, & Capellas, 2015; Ahmed &
Hussein, 2014). The chufa oil shares a similar fatty acid profile to olive oil with high
monounsaturated fatty acids (Arafat, Gaafar, Basuny, & Nassef, 2009; Ezeh, Gordon, &
Niranjan, 2014). Oleic acid is the highest abundant fatty acid, and has been implicated
in the reduction of heart disease, diabetes, and cancer (Amine, et al., 2002; Lunn &
Theobald, 2006; Jones, et al., 2014). Vanillin has been found in roasted chufa oil, and is
a favorable and marketable quality for the chufa oil (Ezeh, Gordon, & Niranjan, 2014).
Chufa oil could serve as a natural alternate source of vanillin or aromatic food flavoring
(Lasekan, 2013). Chufa tubers are also high in vitamins C and E (Belewu & Belewu,
2007). In addition to all these benefits, Chufa tubers also contain more than the adult
FAO/WHO requirements for daily protein intake (Bosch, Alegria, & Farre, 2005), and
more than the requirements for 17 out of 20 amino acids. Chufa tubers have low or
zero amounts of asparagine, glutamine, and tryptophan (Bosch, Alegria, & Farre, 2005).

3
In North Africa, and in Spain, the tubers are also fermented and squeezed to produce
horchata de leche, a popular beverage, which may be alcoholic or not. In other parts of
the world, it is considered to be a persistent weed; although those weedy characteristics
make it productive, and desirable to be used as a biofuel and other applications. Chufa
has few pests and disease problems, making it hardy and desirable to be grown.
Iron Fortification
Iron is an essential nutrient in the human diet, and has many uses in the body. Iron is
used as the center of the hemoglobin molecule, which is vital for oxygen transport from
the lungs throughout the body. Iron is a component in myoglobin in the muscles, and is
essential in enzymatic reactions and mitochondrial electron transport. Being so vital,
deficiencies of iron are devastating, and if left untreated, will lead to gross malfunctions
within the body, or death. According to the NIH, the Recommended Dietary Allowance
(RDA) for Iron is 8-11mg (NIH, 2015). However, there are many areas in the world,
including the United States, where it is hard to acquire the recommended amount
through diet alone. According to the CDC, since the 1970’s, iron deficiency as anemia
has declined among children due to increased intake as infants, but anemic deficiency
has still remained high for low-income women (MMWR, 1998).
Regulation of iron balance occurs in the gastrointestinal tract via absorption. Although
the body generally holds onto the roughly 3g of iron, some does leave the body and
must be replaced. This replacement is limited by the iron bioavailability and absorption
in the gastrointestinal (GI) tract (MMWR, 1998). Iron uptake is influenced by many

4
factors, such as the rate of red blood cell production, the rate of muscle development,
respiration, the amount of iron stored in the body, the amount and type of iron in the
diet, as well as inhibitors and enhancers in the GI tract and diet. The main controller of
iron absorption is the GI tract, influenced by the total amount of iron in the body. If
total iron is low, then the GI tract will increase absorption. Iron bioavailability can range
as low as 1% when the body has enough, to 50% (Hallberg, 1981) when the body needs
more. However, these percentages fluctuate depending on the aforementioned factors.
The bioavailability of iron is also greatly dependent on the food source. Plant-based
iron, such as Chufa/Tiger nut iron, and iron-fortified foods, have iron available as non-
heme iron. Animal-based (including meat, poultry, and fish) iron is available as heme
iron, and is 2 to 3 times as readily absorbed as non-heme iron in the GI tract (Hallberg,
1981; Skikne, 1994). Enhancers of iron absorption include various acids, such as citric
acid and ascorbic acid (Vitamin C). Inhibitors of iron absorption include tannins (from
tea), phytates (from bran), and calcium (from dairy) (Bothwell, Overview and
mechanisms of iron regulation, 1995) (Siegenberg, Baynes, & Bothwell, 1994).
In adults, about 1mg of iron is lost daily through sloughed-off skin and feces (Green,
Charlton, & Seftel, 1968). Women of childbearing years require 0.3-0.5mg extra per day
to compensate for menstrual loss (Bothwell & Charlton, Iron deficiency in women,
1981), and an extra 3mg per day while pregnant, and post-partum until iron levels have
normalized (Hallberg, Iron balance in pregnancy, 1988). Excess iron is stored as either
the soluble protein complex ferritin, or the insoluble protein complex hemosiderin. In

5
healthy persons, about 70-80% of excess iron is stored as ferritin (Bothwell, Overview
and mechanisms of iron regulation, 1995) (Bothwell, Charlton, Cook, & Finch, 1979).
However, iron deficiency is one of the most common maladies worldwide, with an
estimated 1.5-2 billion people, which is roughly a third of the entire world’s population
(Miller, 2013) (Lynch, 2011) (MMWR, 1998). In the developing world, laborers with
anemia have impaired work capacity, which may be reversible with treatment (Li, et al.,
1994) (Cook, Skikne, & Baynes, 1994). Impaired labor capacity has economic
implications, and if anemia is reversible with treatment, then treatment with foods
fortified in iron would increase work capacity (Detzel & Wieser, 2015), which moves the
economy.
Chufa makes underground tubers, and like any plant with underground storage tissues,
it has an affinity for acquiring metals (Farrag & Fawzy, 2012) (Yadav & Chandra, 2011).
Iron has been found to be one of the metals in the tubers, and has been measured in
raw Tiger Nuts, and Tiger Nut flour. However, different groups have come up with
different values, ranging from .65mg/100g to 4.1mg/100g of Tiger Nut flour (Chinma,
Abu, & Abubakar, 2010) (Temple, Ojobe, & Kapu, 1990) (Oladele & Aina, 2007). We
have found that the iron content ranges between 2.5 and 4.5mg/100g in both field and
greenhouse conditions. This is about 30-50% of the RDA of iron in a completely
reasonable snack (raw or roasted tubers) or meal size (baked goods from Tiger Nut
flour).

6
However, to treat anemia, the lost iron must be replaced. Therefore, it is necessary to
increase iron intake. Iron supplements are expensive in the developing world, and are
not as available to the poor as fortified foods are. However, foods with added iron run
the risk of going rancid sooner, having a strange taste, and costing a bit more (Pasricha,
Drakesmith, Black, Hipgrave, & Biggs, 2013). It is more applicable to naturally increase
the inherent iron in foods such as Chufa/Tiger Nuts, so as to not disrupt the food quality.
In Africa, China, and Southeast Asia, food fortification has reached the broadest amount
of people, and has had the greatest benefit at the least cost (Detzel & Wieser, 2015).
The CDC recommends treating persons with anemia with daily 60-120mg of iron
supplements. The equivalent in Chufa tubers (at 3mg/100g) would be 2000g, which is
2Kg or 4.4pounds of tubers. This is indeed a lot to consume to forego the iron pill.
People around the world like variety in what they eat, and no matter how tasty a food
is, it is unlikely that they will eat bowls and bowls (or 4 pounds!) of that food every day
for a long period of time. Persons with anemia will likely follow that pattern, and will
not eat bowls and bowls of tubers for the extended amount of time that their bodies
need to accumulate iron to normal levels. Therefore, it is necessary to increase the iron
contained within the tuber, ideally in the ferritin form.
Accumulation within the plant
Chufa is a sedge, within Cyperaceae, and in the order Poales. Chufa and various grasses
reproduce by rhizomes and have similar pathways for dealing with nutrients (Nozoye, et
al., 2011). As one of the most widespread plants in the entire world, the members of
Poales have adapted to many environments. As such, they have many mechanisms for

7
dealing with different environments. Chufa has been used as a bioaccumulator of heavy
metals including iron in bioremediation projects (Yadav & Chandra, 2011). Like most
graminaceous plants (sensu lato), Chufa does not absorb iron with the help of acids.
Rather, Chufa makes proteins like phytosiderophores and release them into the soil
(Morrissey & Guerinot, 2009), which scavenge iron as ferric. Chufa then absorbs the
chelated proteins, and then convert the iron into ferrous iron via iron chelate reductase.
Both the graminaceous plants and other types of plants release acids to prevent the
oxidation of ferrous iron, and just absorb ferrous iron directly (Morrissey & Guerinot,
2009).
Perhaps a transgenic approach to the increase of iron would be to up-regulate the genes
involved in the formation of the phytosiderophores (PS). AtIRT1 is a divalent metal
transporter in Arabidopsis that transports ferrous iron from root to shoot. Loss of
function mutants have seen iron accumulation in the roots (Vert, et al., 2002) (Connolly,
Fett, & Guerinot, 2002). Perhaps this could be another approach to increasing tuber
iron. In non-graminaceous plants, phenolic compounds are secreted into the
rhizosphere, and Fe is taken and pooled in the apoplast. The apoplast, acting as an Fe
reservoir, stores about 75% of Fe in the roots, in plaques on the negatively-charged cell
walls, which are cation sinks (Roschzttardtz, et al., 2013) (Morrissey & Guerinot, 2009).
The mechanism for this is relatively unclear, however, the Fe-nicotianamine (NA)
transporter AtYSL3 would be a good candidate (Morrissey & Guerinot, 2009).
In graminaceous plants, iron take-up is dependent on siderophores with an affinity for
ferric iron. Mugineic acid (MA) family PSs are synthesized from L-methionine and

8
released from the root epidermis. In barley, the genes for sulfur uptake, methionine
synthesis, and PS synthesis are dramatically up-regulated in the first 24h of iron
deficiency (Roschzttardtz, et al., 2013) (Morrissey & Guerinot, 2009) (Nozoye, et al.,
2011). In rice, TOM1, the efflux transporter of deoxymugineic acid (the primary
phytosiderophore from rice and barley) is overexpressed upon iron deficiency. Coupled
with the expression of the nicotianamine transporters, ENA1 and ENA2, this explains the
main molecular mechanism in rice for iron acquisition from the soil (Nozoye, et al.,
2011). Also, in rice, the expression of the transcription factor, OsIRO2 is upregulated,
and is implicated in the up-regulation of the sulfur pathway and PSs (Itai, 2013). The
FeIII-PS chelate complexes are taken up by the plant via a high-affinity uptake system,
are not as influenced by pH than the reduction strategy, except that their secretion is
positively linearly correlated with increasing pH.
Once inside the epidermis of the root, the Fe-PS complexes are reduced so that they
release ferrous iron, which is taken up by unknown chaperones and proteins. The iron is
then transported symplastically to the pericycle, where it enters the xylem and
transported up to the leaves.
In the xylem, Fe is bound to citrate at lower pHs (~5.5), and to NA at higher pHs (~7.5)
(Rellán‐Álvarez, 2008). Fe complexes are important in the leaves for electron transport,
enzyme cofactors, and photosynthesis. Citrate is important in the xylem, and another
group (Guo et al., 2014) found that in another graminaceous plant, Phragmites spp.,
exogenously applied citric acid has been found to significantly increase Fe concentration
in the roots and rhizomes (Guo & Cutright, 2014). They have also found that the

9
rhizosphere has little effect on Fe absorption. However, it could be surmised that
bacteria which produce citric acid living in the soil could potentially increase iron in
graminaceous plants, including Cyperaceae. Although not many bacteria and fungi in
the soil may not interact directly with Cyperus, their role in “soil preparation” is
relatively unknown. Bacteria and fungi may change soil conditions to be conducive to
the absorption of Fe, or they may change soil conditions to be non-conducive to Fe. In
another study, bacteria (Bacillus spp., Streptomyces luteogriseus, and Pseudomonas
fluorescens), not fungi, were responsible for Fe and P accumulation within Carex
kobomugi, another sedge by increasing availability in the soil (Matsuoka, Akiyama,
Kobayashi, & Yamaji, 2013). Increasing beneficial bacteria in the soil related to iron-
uptake may increase iron, and will appeal to the organic farming community.
Since Chufa number of shoots correlate positively with number of tubers (Figs 1-3), one
could argue that increasing the number of shoots also increases number of tubers. One
could also argue that increasing photosynthetic efficiency would increase production of
the plant, although our data does not support the latter. Perhaps it would be through
N-fertilization that higher tuber production and size would be recorded. Another study
has found that N with K in a certain ratio increases tuber yield (Pascual, Maroto, LóPez-
Galarza, Sanbautista, & Alagarda, 2000). This might be another way to increase biomass
and yield.

10
Oil Applications
As our finite resource of crude oil runs lower and lower, the need for renewable sources
of fuel increases. One of the more promising ways towards creating a sustainable
renewable energy economy is through biofuels. Biofuels
Chufa has been little-explored for use in biofuels. The leafy aboveground structure
grows quickly, is easily harvestable, and is hardy. When we did an analysis on the ash
content of the leaves, we have found that the ash content is around 7%, which is too
high for the recommended 3% or less to be suitable for biofuels. However, this was
coming from fully-fertilized plants, and perhaps reduction of soil fertility might decrease
the ash content in the leaves, but this has not been explored.
Decrease in fertility too much hurts the plant, so a golden-medium would have to be
found. If so, then perhaps Chufa will be able to compete with other biofuels. Chufa has
the advantage of not being picky about the ground in which it grows in. Most biofuel
crops compete with actual crops for farmland space. It can be planted on hilly, fallow
land that is unsuitable for conventional crops, where it would grow as wild anyway. This
gives it a key advantage over other biofuel crops such as corn, which have specific field
needs.
The tubers can be pressed for oil, and the oil is not only applicable to food, but also to
use towards the production of biodiesel. In one study (Ofoefule, Ibeto, Okoro, &
Onukwuli, 2013), the high and moderate flash points of the Chufa biodiesel and blends
ranged between 90-178oC, their cloud points ranged between 6.5-13oC while their pour

11
points ranged between -3-(-10) oC. General results of the blends have performance
results closer to petro-diesel and ASTM standards. Thus, blends of Chufa-derived oil
have been shown to be good for both biodiesel and engines and non-biodiesel engines.
In another study (Wang, Zhou, Liu, Li, & Zhang, 2013), to reduce the cost of algal-based
biodiesel, Cyperus esculentus waste was used as the carbon source of the oleaginous
microalgae Chlorella vulgaris. It demonstrated that C. vulgaris grew better
in Chufa waste hydrolysate than in glucose medium under the same reducing sugar
concentration. Chufa waste hydrolysate concentration influenced the cell growth and
lipid production significantly. The produced biodiesel was analyzed by GC–MS and
those results suggested that lipids produced from the Chufa waste hydrolysate has
decent potential to be feedstock for biodiesel production.
Still, even if the oil were used for food alone, it has similar properties to olive oil- in that
it is high in monounsaturated fatty acids, oleic acid, and other key components of olive
oil (Ezeh, Gordon, & Niranjan, 2014) (Lasekan, 2013) (Sánchez‐Zapata, Fernández‐López,
& Pérez‐Alvarez, 2012).
Cultivars
Cultivars of Chufa have not been formally named or identified, most likely because
Chufa is almost an exclusively asexually-reproducing plant. Dr. Albert Ayeni has
acquired several lines of Chufa from markets on Ghana and Nigeria, as well as from
Organic Gemini LLC., in Brooklyn, NYC. Perhaps from genetic mutation accumulation, or
perhaps from epigenetic changes, we have identified several selections with discernable

12
traits. GH, from Ghana, yields larger tubers that are scattered through the soil. MV,
from Nigeria, yields oblong, sometimes branching tubers. SK, from Nigeria, grows in
dense clusters, and yields smaller tubers lined along the surface. OG from Brooklyn
behaves like GH, but was originally acquired from Spain. Genetic tests will need to be
done to parse out cultivars.
Discussion
Overall, Chufa is a hardy plant with many applications. It has few pests, which make it
desirable to grow, especially under organic conditions. Its tubers can be eaten raw,
roasted, crushed into flour to make gluten-free products, pressed for oil similar to olive
oil, and fermented into horchata beverages. However, as a root crop, the tubers ought
to have a high affinity for minerals, which they do. But, to help make iron more
available to poor communities, nutrition must be through diet, and that requires the
bolstering of iron content within the tuber. This can be done by adjusting the microbes
in the soil to facilitate iron acquisition, applying exogenous chelates in order to facilitate
iron acquisition, or possibly genetically engineer the Tiger Nutsedge to increase
acquisition of iron.
Another application would be to encourage community gardeners to plant this plant for
its health benefits, as well as increase market awareness of Chufa/Tiger Nuts as a health
food. Community gardens often donate their produce to food shelters, and Chufa
tubers are a highly nutritious food that will benefit those at food shelters. Its impact on
urban communities and urban gardening has not been studied. In fact, with little space

13
requirements, it would be an ideal crop to grow in the cities, on the ground, in planters
and balconies, and in windowsills. Its contributions to city greenspace would be
noticed, as it is a hardy plant tolerant of pollution, and, like any plant, reduces CO2 by
providing a CO2 sink. It can even be used to prevent erosion, as the thick mat of root
fibers creates a net that traps soil and holds it in place. Chufa has a lot that it can do for
cities such as NYC, and the surrounding areas.
Biofuels are a hot issue, and Chufa is a contender in the biofuels arena. However, work
will need to be done to reduce the ash content of the leaves, though this is not
impossible. Chufa seems to be most effective at providing a medium for biofuel-
producing bacteria to use as a carbon source. Fermenting the leaves produces quality
biofuel that can be used in many different types of engines. Coupled with the fact that
this plant can produce quite a bit of biomass within a few months makes it competitive
with other biofuel-producing plants.
Given all that this plant can do, we need to take advantage of this resource and use it. It
is worthy of being studied and applied to solve our problems.

14
Figure 1 – Chufa and a view of the tubers beneath the
soil- a photo from our study. Note the fibrous roots, as
well as rhizomes that terminate in the edible tubers.

15
Chapter 2 – Characterization of Chufa: Potassium Enrichment of Soils
We had surmised that if potatoes responded to potassium application by making larger
tubers (Chapman, Sparrow, Hardman, Wright, & Thorp, 1992) (Panique, et al., 1997), the
Chufa ought to respond to excess potassium by making larger tubers as well. Thus, we
designed an experiment to test if this is true. We wanted to determine the effects of
potassium treatments on three selections of Chufa in two different environments- a
climate-controlled greenhouse, and an open hoop-house.
Objective – To determine the effects of potassium applications on plant productivity in
two different environments.
Methods –
Two experiments were planted during the week of April 27, 2014, and harvested 14
weeks later, during the week of July 21, 2014. One was planted in a hoop-house style
greenhouse at 67 Ryders Lane, East Brunswick, NJ, known as Horticulture Farm 3 (HF3),
the other was planted at 18 College Farm Road (CFR), New Brunswick, NJ in a
permanent, climate-controlled greenhouse. Three different selections of Chufa were
used- MV, SK, and GH. Selection germplasm was obtained from markets in Ghana and
Nigeria. Chufa was propagated by taking the stalk a semi-mature plant with some of its
roots intact, trimming it down to about 4 inches, and planting it into a standard
greenhouse flat filled with Pro-Mix® brand BX general-purpose professional growing
medium soil. We refer to it as GreenHouse Mixture (GHM) soil. Three plants were
planted per flat, and each of the controls received only 10g of NPK fertilizer. Appended

16
potassium fertilizer was added to experimentals in the form of muriate of potash (MOP).
Trial 1 received 20g NPK/m2. Trial 2 received 10g of NPK plus 10g MOP/m2. Trial 3
received 10g of NPK plus 20g MOP/m2. Trials were watered every day until soil was
saturated. At CFR, temperature was kept constant at about 24-27°C. HF3 temperature
remained the same as outdoor temperature. Plants were given their fertilizer once,
about 4 weeks after planting, right before tuber-formation. Plants were grown until 14
weeks had passed, then harvested, and data for shoot weight, shoot number, tuber
weight, and tuber number was collected. Tubers were washed, then dried for two days,
then weighed. Rooty fibers were detached and discarded. Tuber weight is the weight
of all tubers produced in a flat (tuber yield weight). Results were statistically analyzed
using the “proc glm” command in the SAS software suite. Fisher’s Least Significant
Difference (LSD) model was applied to the data (p<0.05), and significance groups were
generated and applied to the results. The highest significance level was marked as “A”,
with lower significance levels marked as “B”, “C”, and so on.

17
Results –
I, H
BB, C
A, B
F, G, H
A
C, D
D, E
I
E, F, G
G, H
E, F
0
20
40
60
80
100
120
140
160
cou
nt
HF3 Potassium Number of Shoots
SK MV GH
E, F
A, B
B, C
A
F
C, DD, E D
F
D, E, F D, E, F
F
0
20
40
60
80
100
120
140
160
cou
nt
CFR Potassium Number of Shoots
SK MV GH
Figure 2 – The number of shoots
produced by each flat at HF3. SK, MV,
and GH are compared by treatments.
All treatments yielded significantly
more shoots than the control.
Figure 3 – The number of shoots
produced by each flat at CFR. SK, MV,
and GH are compared by treatments.
All treatments yielded significantly
more shoots than the control with
the exception of GH.

18
G
A, B
B, C B, C
F, G
A
B, C
C, D
G
D, E
E, F, GD, E, F
0
100
200
300
400
500
600
700
cou
nt
HF3 Potassium Number of Tubers
SK MV GH
D, E
AA, B
A
D, EA, B, C
A, B, C, D A, B, C, D
E B, C, D, E D, D, E C, D, E
0
100
200
300
400
500
600
700
cou
nt
CFR Potassium Number of Tubers
SK MV GH
Figure 4 – The number of tubers
produced by each flat at HF3. SK, MV,
and GH are compared by treatments.
HFE more than doubled the amount
of tubers compared to CFR.
Figure 5 – The number of tubers
produced by each flat at CFR. SK, MV,
and GH are compared by treatments.
SK fared on average the best with
regards to production for all
treatments.

19
F
A, BB, C
C, D, E
F
A
B, C, D D, E
F
C, D, E
E
D, E
-50
0
50
100
150
200
250
300
350
400
450
gram
s
HF3 Potassium Tuber Yield Weight
SK MV GH
C
A, B
A
A
C
A
AA
C A, B, CA, B
B, C
0
50
100
150
200
250
300
350
400
450
gram
s
CFR Potassium Tuber Yield Weight
SK MV GH
Figure 6 – The total weight of all
tubers produced by each flat at HF3.
SK, MV, and GH are compared by
treatments. HF3 tubers weighed
almost twice as much as CFR tubers.
Figure 7 – The total weight of all
tubers produced by each flat at CFR.
SK, MV, and GH are compared by
treatments. Treatments did not seem
to effect tuber yield weight.

20
E
A
B
B, C, D
E
A
B B, C, D
E
B, C
DC, D
0
50
100
150
200
250gr
ams
HF3 Potassium Shoot Weight
SK MV GH
E
A, BB, C
B, C
E
A
B
B, C
E
C, DD, E D, E
0
50
100
150
200
250
gram
s
CFR Potassium Shoot Weight
SK MV GH
D
A, B, CA, B, C
A, B, C
D
A
A, B, C
A, B
D
A, B, C B, CC
0
10
20
30
40
50
60
Control Treatment1
Treatment2
Treatment3
inch
es
HF3 Potassium Height
SK MV GH
E, F
A, B, C B, C, D
D, EF
AA, B
C, D, E
F
A, B, C B, C, D C, D, E
0
10
20
30
40
50
60
Control Treatment1
Treatment2
Treatment3
inch
es
CFR Potassium Height
SK MV GH
Figure 8 – The total weight of all
shoots produced by each flat at HF3.
SK, MV, and GH are compared by
treatments.
Figure 9 – The total weight of all
shoots produced by each flat at CFR.
SK, MV, and GH are compared by
treatments.

21
0
0.2
0.4
0.6
0.8
1
1.2
1.4
gram
s
HF3 Potassium Average Tuber Weight
SK
MV
GH
0
0.2
0.4
0.6
0.8
1
1.2
1.4
gram
s
CFR Potassium Average Tuber Weight
SK
MV
GH
0
1
2
3
4
5
6
tub
ers
per
sh
oo
t
HF3 Potassium Average Number of Tubers per Shoot
SK
MV
GH
0
0.5
1
1.5
2
2.5
3
3.5
4
4.5
tub
ers
per
sh
oo
t
CFR Potassium Average Number of Tubers per Shoot
SK
MV
GH
Figure 10 – The height of all shoots
produced by each flat at HF3. SK, MV,
and GH are compared by treatments.
Figure 11 – The height of all shoots
produced by each flat at HF3. SK, MV,
and GH are compared by treatments.
Figure 12 – The average weight of each
individual tuber produced by each flat at
HF3. SK, MV, and GH are compared by
treatments. Tubers range in weight from
about 0.5 grams to 0.9 grams.
Figure 13 – The average weight of each
individual tuber produced by each flat at
CFR. SK, MV, and GH are compared by
treatments. . Tubers range in weight from
about 0.5 grams to 1.1 grams.
A A
A A
A A
A A A A
A A
A A A
A
A
A
A A
A
A A A
B B
B
A A A A A A
A, B
A
A, B
C
B
A
C B, C
A, B
C B, C
A, B B
B, C C

22
At HF3 and CFR, all treatments significantly increased the number of shoots, except at
CFR, only GH did not produce significantly more shoots for all treatments. For number
of tubers produced at HF3, Treatment 1 for all selections yielded the most tubers.
Treatments 2 and 3 only yielded more tubers for SK and MV. At CFR, all treatments
yielded more tubers for SK and MV only. GH was unaffected. At HF3, all treatments for
all selections yielded more tuber weight than the control. For CFR, only SK and MV for
all treatments yielded more tuber weight than the control. Treatments at HF3 yield
more than double the weight of tubers, when compared with CFR. Shoot weight at HF3
was significantly higher for all treatments and selections, and was nearly double the
weight of the shoots produced at CFR. Shoot weight at CFR was significantly more than
the control for all selections of Treatment 1. Shoot weight was only higher for MV and
SK at CFR for Treatments 2 and 3. Plant height was significantly higher than the control
for all selections and treatments at HF3, and all treatments and selections at CFR, except
for Treatment 3 of SK. Average tuber weight at HF3 was slightly higher in GH for all
treatments than MV and SK. Average tuber weight at CFR was greater than HF3 for all
treatments and selections. Average number of tubers per shoot were not affected by
treatments.
Conclusion –
Figure 14 – The average number of
tubers per shoot produced by each
flat at HF3. SK, MV, and GH are
compared by treatments.
Figure 15 – The average number of
tubers per shoot produced by each
flat at CFR. SK, MV, and GH are
compared by treatments.

23
9, & 11). However, potassium increase had no effect on tuber yield weight (Figures 6 &
7). It was application of 20g of NPK (Treatment 1) that had the most dramatic effect on
those two selections, especially to MV with regards to tuber weight, and shoot weight-
MV was in the top tier. GH did not seem to do much better than the control except for
treatment 2 on tuber weight, and all GH did better than the control with respect to
height. It would seem that if a greenhouse farmer were going to grow for greatest plant
production, in terms of tuber size and yield weight, it would be best to choose selections
MV and SK. However, according to (Figure 13), GH and MV seem to produce on average
the highest amount of large tubers. Depending on the market demand, GH and MV may
be better to plant if larger tubers are desired. It would be better to plant SK for tuber
processing, such as extraction of oils, or pulverization into flour, or squeezed for
horchata juices. Figure 15 shows differences among selections with respect to number
of tubers produced per shoot. There are no statistical differences either among
treatments, or among selections with regards to number of tubers produced per shoot.
At HF3 –
All treatments performed greater than the control (Figures 2, 4, 6, 8, & 10). It should be
taken into great consideration that selection MV with treatment 1 was in the statistical
top-tier for every trait- tuber yield weight and number, shoot weight and number, and
plant height. Other treatments did not do as well as Treatment 1 did. Since the hoop-
house is closer to what is representative of in the field, farmers should take note that
this is the selection and combination of fertilizer (20g NPK/m2) that makes the plant
perform in the best way. Other treatments were not consistently significant enough to

24
have made any reasonable difference. Figure 14 shows that on average, fertilizer
treatments stimulate more tubers per shoot. Figure 12 shows that on average, GH has a
higher tuber weight- although this is not significant.
CFR and HF3 –
Treatments 2 and 3 generally did significantly better than the control, meaning that
adding fertilizer of any type beyond the 10g of NPK/m2 is beneficial to the plant, but not
in any consistent manner, as treatments tended to have different results for each
variable tested. However, for both places, MV with Treatment 1 was consistently in the
top statistical tier for almost all variables. It is even more important to note that MV is
the top for all variables at HF3, which has the closest conditions to what field conditions
would be like. Although potassium did not have the tuber-enlarging effect that we were
hoping for, we did discover that a balanced and high rate application of NPK significantly
increases the production of selection MV. The other two selections GH and SK may be
too closely-related, or respond to fertilizer in the same way to see too much of a
difference between them. The ideal fertilizer condition for production is high, balanced
fertilizer of NPK. The ideal environmental conditions for production indicate that a
hoop-house is best for tuber production. Looking at Figures 6&7, the conditions of HF3
have double the amount of tubers compared to CFR. Looking at Figures 4&5, the
number of tubers has doubled as well. Overall plant biomass has increased at HF3,
which is directly correlated with tuber production (Figures 8&9). Perhaps this is because
tuber production may be increased upon plant stress. Hoop house conditions are

25
constantly changing with the outside weather, and this may be enough to stimulate the
production of more tubers.
26
Chapter 3 – Characterization of Chufa: Iron Enrichment of Soils and Foliar Spray
Knowing that iron is an important plant and human nutrient, we wanted to see if we
could increase the nutrition of the tubers, as well as gauge the effects of iron on plant
productivity. Since iron is semi-soluble in soils, we wanted to test different soils for
absorption and effects. For Iron Experiment 1, we chose to apply the iron at different
times, to see the phenotypic effects. For another Iron Experiment 2, we chose
professional growing medium (potting soil), clay-loam, and one commercial organic soil.
For Iron Experiment 3, we delivered the iron as a foliar spray, to measure the effects on
phenotype. For all iron experiments, we chose the selection, GH because it gave the
most consistent results out of all the selections. (For literature on this matter, please
refer to Chapter 1).
Objective – To determine the effects of timing iron applications on plant productivity.
To determine the media which enhances iron effects on plant productivity. To
determine if foliar application affects plant productivity.
Methods –
The iron over time experiment and iron growth media experiment (Iron experiment 1
and Iron Experiment 2) were planted during the week of July 6, 2014, and harvested 14
weeks later, on the week of October 12, 2014. The foliar application experiment (Iron
Experiment 3) was planted during the week of July 5, 2015, and harvested 14 weeks
later, on the week of October 11, 2015. All experiments were planted in a hoop-house
style greenhouse at 67 Ryders Lane, East Brunswick, NJ, known as Horticulture Farm 3

27
(HF3). Only the GH selection was used. Selection germplasm was obtained from
markets in Ghana. The pH was kept in the 6.4-7 range for all trials. Results were
statistically analyzed using the “proc glm” command in the SAS software suite. Fisher’s
Least Significant Difference (LSD) model was applied to the data (p<0.05), and
significance groups were generated and applied to the results. The highest significance
level was marked as “A”, with lower significance levels marked as “B”, “C”, and so on.
Iron Experiment 1 (Iron Over Time) –
Chufa was propagated by taking the stalk a semi-mature plant with some of its roots
intact, trimming it down to about 4 inches, and planting it into a standard greenhouse
flat filled with Pro-Mix® brand BX general-purpose professional growing medium soil.
We refer to it as GreenHouse Mixture (GHM) soil. Three sprigs were planted per flat,
and each of the controls received only 10g of NPK fertilizer. Iron was added to the
experiments in the form of GroTech® Ironite soluble iron fertilizer in increasing
concentrations- Treatment 1 = 10 days after 4 weeks after planting apply 10g of iron
plus 10g of NPK/m2. Treatment 2 = 20 days after 4 weeks after planting apply 10g of iron
plus 10g of NPK/m2, Treatment 3 = 30 days after 4 weeks after planting apply 10g of iron
plus 10g of NPK/m2. Treatment 4 = 40 days after 4 weeks after planting apply 10g of iron
plus 10g of NPK/m2. Treatment 5 = 50 days after 4 weeks after planting apply 10g of
iron plus 10g of NPK/m2. Plants were given their fertilizer once, about 4 weeks after
planting, right before tuber-formation. Plants were grown until 14 weeks had passed,
then harvested, and data for shoot weight, shoot number, tuber weight, and tuber
number was collected. Tubers were washed, then dried for two days, then weighed.
28
Rooty fibers were detached and discarded. Tuber weight is the weight of all tubers
produced in a flat (tuber yield weight).
Iron Experiment 2 (Iron Growth Media) –
Chufa was propagated by taking the stalk a semi-mature plant with some of its roots
intact, trimming it down to about 4 inches, and planting it into a standard greenhouse
flat filled with either: Pro-Mix® brand BX general-purpose professional growing medium
soil; we refer to it as GreenHouse Mixture (GHM) soil, Field soil (FS) collected from HF3
which is a clay-loam, or unammended MiracleGro® brand organic soil (OS). Three plants
were planted per flat, and each of the controls received only 10g of NPK fertilizer. Only
OS did not receive any fertilizer, as organic proponents claim that the soil is inherently
as fertile as other soils, if not more-so. Iron was added to the experiments in the form
of two different levels: 10g/m2 or 20g/m2 of GroTech® Ironite soluble iron fertilizer.
Plants were given their fertilizer once, about 4 weeks after planting, right before tuber
formation. Plants were grown until 14 weeks had passed, then harvested, and data for
shoot weight, shoot number, tuber weight, and tuber number was collected. Tubers
were washed, then dried for two days, then weighed. Rooty fibers were detached and
discarded. Tuber weight is the weight of all tubers produced in a flat (tuber yield
weight).
Iron Experiment 3 (Iron Foliar) –
Chufa was propagated by taking the stalk a semi-mature plant with some of its roots
intact, trimming it down to about 4 inches, and planting it into a standard greenhouse

29
flat filled with Pro-Mix® brand BX general-purpose professional growing medium soil.
We refer to it as GreenHouse Mixture (GHM) soil. Three plants were planted per flat,
and each of the controls received 17.5g of NPK and 15g of muriate of potash (MOP)
fertilizer. Appended Iron was added to the experiments in the form of AquaIron™ DTPA
chelated 10% soluble iron fertilizer. A concentration of 2ppm, 4ppm, and 8ppm was
sprayed for treatments 1, 2, and 3, respectively. These treatments were done at 5
weeks, 7 weeks, and 9 weeks after planting. Plants were given their fertilizer once,
about 4 weeks after planting, right before tuber-formation. Plants were grown until 14
weeks had passed, then harvested, and data for shoot weight, shoot number, tuber
weight, and tuber number was collected. Tubers were washed, then dried for two days,
then weighed. Rooty fibers were detached and discarded. Tuber weight is the weight
of all tubers produced in a flat (tuber yield weight).

30
Results –
Iron Experiment 1 (Iron Over Time Experiment) –
AA A
A A
0
50
100
150
Control 20 Days 30 Days 40 Days 50 Days
cou
nt
HF3 Iron Over Time Number of Shoots
AA A A A
0
100
200
300
400
Control 20 Days 30 Days 40 Days 50 Days
cou
nt
HF3 Iron Over Time Number of Tubers
AA
A
AA
0
50
100
150
200
Control 20 Days 30 Days 40 Days 50 Days
gram
s
HF3 Iron Over Time Tuber Weight
AA
A A A
0
50
100
150
200
Control 20 Days 30 Days 40 Days 50 Days
gram
s
HF3 Iron Over Time Shoot Weight
Figure 16 – Effect of iron application on the
number of shoots produced by each flat over
time. Iron was applied at 4 weeks old
(control), or 20 days after that, or 30, 40, or
50 days after that. 10g of iron was used. No
significant difference observed.
Figure 17 – Effect of iron application on
the number of tubers produced by each
flat over time. Iron was applied at 4 weeks
old (control), or 20 days after that, or 30,
40, or 50 days after that. 10g of iron was
used. No significant difference observed.

31
No application of iron to the soil at any time had any effect on the physiology of the
plant. No significant difference was observed.
2.7
2.8
2.9
3
3.1
3.2
3.3
3.4
3.5
3.6
Control 20 Days 30 Days 40 Days 50 Days
tub
ers
pe
r sh
oo
t
Iron Over Time Number of Tubers per Shoot
0
0.1
0.2
0.3
0.4
0.5
0.6
0.7
0.8
Control 20 Days 30 Days 40 Days 50 Days
gram
s
Iron Over Time Tuber Weight
Figure 18 – Effect of iron application on the
tuber yield weight of each flat over time.
Iron was applied at 4 weeks old (control), or
20 days after that, or 30, 40, or 50 days after
that. 10g of iron was used. No significant
difference observed.
Figure 19 – Effect of iron application on
the total shoot weight of each flat over
time. Iron was applied at 4 weeks old
(control), or 20 days after that, or 30, 40,
or 50 days after that. 10g of iron was
used. No significant difference observed.
Figure 20 – Effect of iron application
on the average number of tubers per
shoot produced by each flat over
time. Iron was applied at 4 weeks old
(control), or 20 days after that, or 30,
40, or 50 days after that. 10g of iron
was used. No significant difference
observed.
Figure 21 – Effect of iron application
on the average weight of individual
tubers produced by each flat over
time. Iron was applied at 4 weeks old
(control), or 20 days after that, or 30,
40, or 50 days after that. 10g of iron
was used. No significant difference
observed.
A
A
A A
A
A A
A
A
A

32
Iron Experiment 2 (Iron Growth Media Experiment) –
B, C
C
B, CB, C
A
A, B
DD
D
0
20
40
60
80
100
120
140
Control 10g 20g
cou
nt
HF3 Iron Soil Experiment Number of Shoots
GHM
FS
OS
A, B
B, C
A
CB, C
C
D DD
0
50
100
150
200
250
300
350
Control 10g 20g
cou
nt
HF3 Iron Soil Experiment Number of Tubers
Figure 22 – Effect on number of
shoots produced by applying different
amounts of iron in different soils.
Fertilized GHM and FS out-performed
unamended OS.
Figure 23 – Effect on number of
tubers produced by applying different
amounts of iron in different soils.
Fertilized GHM and FS out-performed
unamended OS.

33
AA, B
A
B, C C, DB, C
E E D, E
0
50
100
150
200
Control 10g 20g
gram
s
HF3 Iron Soil Experiment Tuber Yield Weight
GHM FS OS
A AA
BB B
CC
C
0
100
200
300
400
500
600
Control 10g 20g
gram
s
HF3 Iron Soil Experiment Shoot Weight
GHM FS OS
0
1
2
3
4
5
Control 10g 20g
tub
ers
per
sh
oo
t
Soil and Iron Effects on Tubers per Shoot
GHM FS OS
0
0.1
0.2
0.3
0.4
0.5
0.6
0.7
0.8
Control 10g 20g
gram
s
Soil and Iron Effects on Tuber Weight
GHM FS OS
Figure 24 – Effect on tuber yield weight of
applying different amounts of iron in
different soils. Fertilized GHM and FS out-
performed unamended OS.
Figure 25 – Effect on shoot weight by
applying different amounts of iron in
different soils. Fertilized GHM and FS out-
performed unamended OS.
A
A
A, B A
B
A A
B
A
A
A
B
A
A, B
B
A A
A, B
34
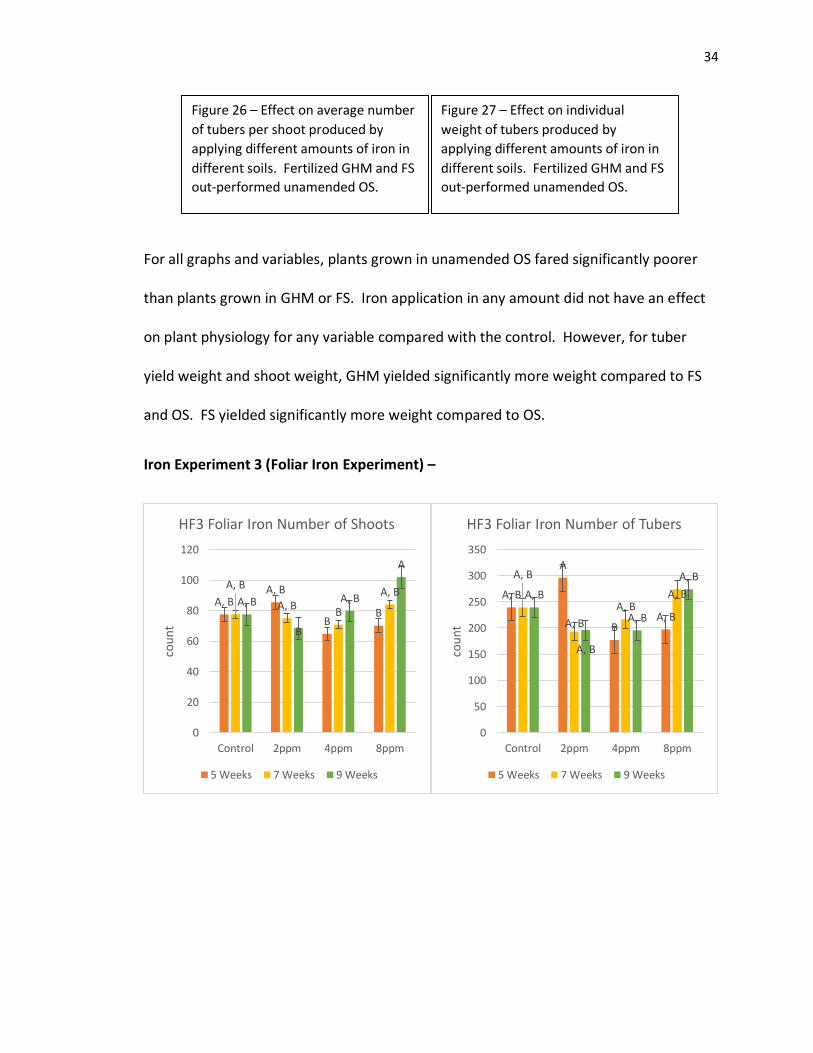
For all graphs and variables, plants grown in unamended OS fared significantly poorer
than plants grown in GHM or FS. Iron application in any amount did not have an effect
on plant physiology for any variable compared with the control. However, for tuber
yield weight and shoot weight, GHM yielded significantly more weight compared to FS
and OS. FS yielded significantly more weight compared to OS.
Iron Experiment 3 (Foliar Iron Experiment) –
A, BA, B
BB
A, B
A, BB
A, BA, B
B
A, B
A
0
20
40
60
80
100
120
Control 2ppm 4ppm 8ppm
cou
nt
HF3 Foliar Iron Number of Shoots
5 Weeks 7 Weeks 9 Weeks
A, B
A
BA, B
A, B
A, B
A, BA, BA, B
A, B
A, B
A, B
0
50
100
150
200
250
300
350
Control 2ppm 4ppm 8ppm
cou
nt
HF3 Foliar Iron Number of Tubers
5 Weeks 7 Weeks 9 Weeks
Figure 26 – Effect on average number
of tubers per shoot produced by
applying different amounts of iron in
different soils. Fertilized GHM and FS
out-performed unamended OS.
Figure 27 – Effect on individual
weight of tubers produced by
applying different amounts of iron in
different soils. Fertilized GHM and FS
out-performed unamended OS.

35
A
A, B
B, CB, C
A
C
A, B, CB, C
A
B, CB, C
B, C
0
20
40
60
80
100
120
140
160
180
200
Control 2ppm 4ppm 8ppm
gram
s
HF3 Foliar Iron Tuber Yield Weight
5 Weeks 7 Weeks 9 Weeks
A
B
BB
A
BB B
A
BB
B
0
20
40
60
80
100
120
140
160
180
200
Control 2ppm 4ppm 8ppm
gram
s
HF3 Foliar Iron Shoot Weight
5 Weeks 7 Weeks 9 Weeks
Figure 30 – Effect on tuber yield
weight of applying different ppm of
iron as a foliar spray on the leaves.
Figure 31 – Effect on shoot weight by
applying different ppm of iron as a
foliar spray on the leaves.

36
A
A
A AA
A
A
AA
A
A A
0
5
10
15
20
25
30
35
40
45
Control 2ppm 4ppm 8ppm
inch
es
HF3 Foliar Iron Plant Height
5 Weeks 7 Weeks 9 Weeks
0
0.1
0.2
0.3
0.4
0.5
0.6
0.7
0.8
Control 2ppm 4ppm 8ppm
gram
s
HF3 Foliar Iron Average Tuber Weight
5 Weeks 7 Weeks 9 Weeks
0
0.5
1
1.5
2
2.5
3
3.5
4
Control 2ppm 4ppm 8ppm
tub
ers
per
sh
oo
t
HF3 Foliar Iron Average Number of Tubers per Shoot
5 Weeks 7 Weeks 9 Weeks
Figure 32 – Effect on plant height by
applying different ppm of iron as a foliar
spray on the leaves.
Figure 33 – Effect on average individual
tuber weight by applying different ppm
of iron as a foliar spray on the leaves.
A A A
B
B B
B B B
B B B
A A A A
A
A
A
A A A
A
A

37
Foliar spraying of chelated iron at any concentration had no effect on number of shoots
or number of tubers produced. Tuber weight and shoot weight was depressed
significantly at any application strength. Average tuber weight was also significantly
decreased with foliar application.
Conclusion –
Iron Experiment 1 (Iron Over Time Experiment) –
Timing of soil iron application had no effect on any variable, as seen in Figures 16-21.
Neither shoot height, shoot weight, tuber yield weight, nor tuber yield number was
affected by iron application timing. No variable was significantly different from the
control. This indicates that the timing of soil iron application has no effect on
physiology.
Iron Experiment 2 (Iron Growth Media Experiment) –
As seen in Figures 22-27, all OS treatments and control performed significantly worse
than other soils. This may be due to the fact that we did not add 10g of NPK to the soil.
FS with 10g of iron added had significantly more shoots than its control, and more than
any non-FS group (Figure 22). Overall, FS with 20g of iron added seemed to not have
done as well as FS with 10g of iron added. With regards to number of tubers (Figure
Figure 34 – Effect on average number
of tubers per shoot produced by
applying different ppm of iron as a
foliar spray on the leaves.

38
producing increased tuber weight. This particular set of results may be a quirk. With
regards to tuber yield weight, GHM of all applications are all statistically in the highest
set. In Figure 24, GHM yielded almost twice as many tubers as FS did. GHM control
yielded significantly more than FS, which yielded significantly more than OS. This
implies that for tuber yield weight, GHM is the way to go. For shoot weight (Figure 25),
GHM significantly out-performed FS, which significantly out-performed OS. No
differences were found based on the amount of the treatments. It would seem that
iron application does not affect the productivity of the chufa. However, it may affect
the amount of iron in the tubers.
Iron Experiment 3 (Iron Foliar Experiment) –
As seen in Figures 28-34, no level of any foliar spray had any effect on any variable, with
the exception of tuber yield weight (Figure 30) and shoot weight (Figure 31). Foliar
application of iron seems to be detrimental to tuber weight and shoot weight. If iron
happened to be an effector, or some sort of growth suppressor, 2-8ppm is noticed by
the plant. Compared to the effects of iron fortification of the soil, iron foliar spray
seems to have a detrimental effect towards biomass and tuber yield. More studies need
to be done to evaluate the effects of the foliar spray of other nutrients.

39
Chapter 4 – Characterization of Chufa: Effect of Irrigation on Chufa Productivity
Chufa has been cultivated in North Africa as a food source for thousands of years, and
has been cultivated often in moist, flooded soils. The wild relatives, “Yellow Nutsedge”
and “Purple Nutsedge” (Cyperus esculentus L., and Cyperus rotundus L. respectively) are
dispersed ubiquitously around the world in a variety of climates. These climates, range
from arid to tropical. As such, we wanted to look at how water-frequency application
affects plant productivity of our two best selections, OG and GH.
Objective – To determine the effects of restricted water applications on plant drought
tolerance, productivity, and root density.
Methods –
Two experiments were planted during the week of July 6, 2015, and harvested 14 weeks
later, on the week of October 12, 2015. The experiment was planted in a hoop-house
style greenhouse at 67 Ryders Lane, East Brunswick, NJ, known as Horticulture Farm 3
(HF3). Two different selections of Chufa were used- OG and GH. Selection germplasm
was obtained from markets in Ghana and Nigeria. Chufa was propagated by taking the
stalk a semi-mature plant with some of its roots intact, trimming it down to about 4
inches, and planting it into a standard greenhouse flat filled with Pro-Mix® brand BX
general-purpose professional growing medium soil. We refer to it as GreenHouse
Mixture (GHM) soil. Three plants were planted per flat, and each of the flats received
15g of NPK fertilizer and 15g of muriate of potash (MOP). The control received 2 liters
of water every day. Trial 1 received 2 Liters of water 2 times a week per flat. Trial 2
40
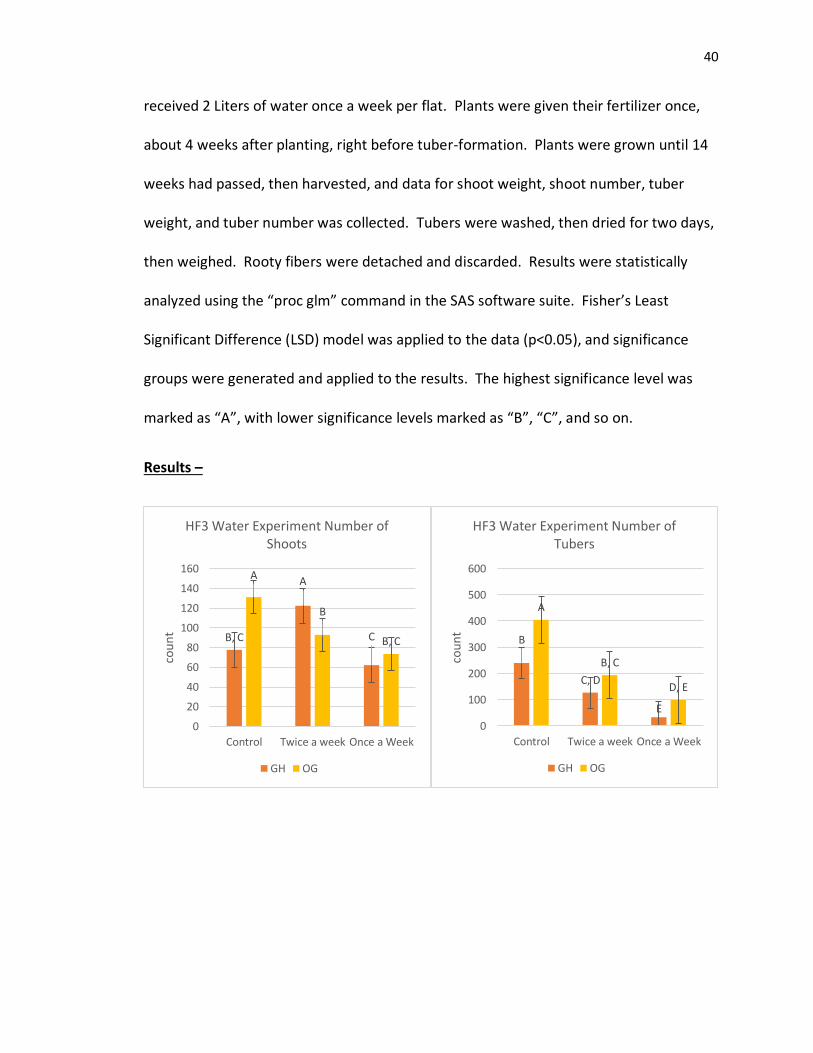
received 2 Liters of water once a week per flat. Plants were given their fertilizer once,
about 4 weeks after planting, right before tuber-formation. Plants were grown until 14
weeks had passed, then harvested, and data for shoot weight, shoot number, tuber
weight, and tuber number was collected. Tubers were washed, then dried for two days,
then weighed. Rooty fibers were detached and discarded. Results were statistically
analyzed using the “proc glm” command in the SAS software suite. Fisher’s Least
Significant Difference (LSD) model was applied to the data (p<0.05), and significance
groups were generated and applied to the results. The highest significance level was
marked as “A”, with lower significance levels marked as “B”, “C”, and so on.
Results –
B, C
A
C
A
B
B, C
0
20
40
60
80
100
120
140
160
Control Twice a week Once a Week
cou
nt
HF3 Water Experiment Number of Shoots
GH OG
B
C, D
E
A
B, C
D, E
0
100
200
300
400
500
600
Control Twice a week Once a Week
cou
nt
HF3 Water Experiment Number of Tubers
GH OG

41
B
C, DD
A
C
D
0
50
100
150
200
250
300
350
Control Twice a week Once a Week
gram
s
HF3 Water Experiment Tuber Yield Weight
GH OG
A
B
C
A
CC
0
50
100
150
200
250
Control Twice a week Once a Weekgr
ams
HF3 Water Experiment Shoot Weight
GH OG
A
B
C
A
B, C B, C
0
10
20
30
40
50
Control Twice a week Once a Week
inch
es
HF3 Water Experiment Plant Height
GH OG
0
0.1
0.2
0.3
0.4
0.5
0.6
0.7
0.8
0.9
Control Twice a Week Once a Week
gram
s
HF3 Water Experiment Average Tuber Weight
GH OG
Figure 35 – Effect of irrigation on
number of shoots produced. More
water significantly improves plant
productivity.
Figure 36 – Effect of irrigation on
number of tubers produced. More
water significantly improves plant
productivity.
Figure 37 – Effect of irrigation on tuber
yield weight. More water significantly
improves plant productivity.
Figure 38 – Effect of irrigation on shoot
weight. More water significantly improves
plant productivity.
A
A A, B
A, B
B B

42
0
1
2
3
4
5
Control Twice a Week Once a Week
tub
ers
per
sh
oo
t
HF3 Water Experiment Average Number of Tubers Per Shoot
GH OG
Figure 39 – Effect of irrigation on plant
height. More water significantly
improves plant productivity.
Figure 40 – Effect of irrigation on
average individual tuber weight. More
water significantly improves plant
productivity.
Figure 41 – Effect of irrigation on average number of
tubers per shoot produced. More water significantly
improves plant productivity.
OG Control OG Once a
week
OG Twice a
week
A A
A, B
A, B
B B

43
Irrigating every day significantly increases all variables compared to restricted irrigation.
Tuber and shoot weight of Chufa irrigated every day is double that of Chufa irrigated
less than that. Plant height, tuber weight, and average number of tubers per shoot is
also increased with increased irrigation. As seen in Figures 42 & 43, increased irrigation
also increases root density around the harvested tubers.
Conclusion –
As seen in (Figure 35), for number of shoots, OG that was irrigated every day and GH
that was watered every 2 days performed significantly better than any other treatment.
With regard to the number of tubers produced (Figure 36), OG watered every day did
significantly better than any other selection or treatment. GH irrigated every day came
in second with regards to tuber production. Both selections irrigated once a week fared
Figure 43 – Irrigation has a visible effect on root
density in GH. More frequent irrigation produce more
visible roots when harvested.
OG Control GH Once a
week
GH Twice a
week

44
the poorest. Tuber yield weight, shoot weight, and height (Figures 37, 38, & 39) were
highly affected by water application amount. OG fared the best with irrigating every
day, followed by GH watered every day. Average tuber weight, and average number of
tubers per shoot decreased with decreasing water (Figures 40 & 41). As seen in Figures
42 & 43, root density around the tubers increases with increased irrigation for both
selections of Chufa. As the water application decreases, so too does productivity. This
shows that Chufa productivity (and root density) is directly related to water application
frequency. With Chufa being such a water-thirsty crop, this may have implications on
where it can be planted. For example, in areas with water shortages, it would not be
wise to plant this crop. However, in frequently-flooded areas, this crop would be ideal.
Chufa has been historically planted along the Nile River in Egypt. The Nile is famous for
its predictable, yearly floods, which have brought fertile sediments from the highlands
of Ethiopia. Given the results of the Potassium Experiment (See Chapter 2), Chufa does
indeed perform better with higher levels of balanced nutrients. Recreating these ideal
conditions may be the key to success with this crop.

45
Chapter 5 – Characterization of Chufa: Soil-Type Effects on Chufa Productivity
Ecological and Bioremedial Roles
The genus Cyperus is already ubiquitous across the globe, and well-suited to the NYC
environment, as well as the coastal environment in which it would be planted. Of
course, in this case, Chufa would be used for its bioaccumulative and organic-
compound-detoxifying abilities (Bamishaiye, 2011). The strong rhizomatous roots are
also ideal in preventing soil erosion (Ghosh, 2003). They are often the first colonizers of
barren and disturbed land, and keep the soil stable enough for ecological succession of
larger plants to occur.
There have been some efforts to use Chufa as a bioremediator, and as a biostabilizer
(McPhearson, Hamstead, & Kremer, 2014). A case study shows that New York City
(NYC) has some of the most polluted waterways and runoff in the country, and that
projects that involve remediation via greenspace save the city up to $1.5 billion
annually (McPhearson, Hamstead, & Kremer, 2014). Using Chufa along with other
bioremedial plants would be an excellent way to expand upon an already beneficial
program. The increase of greenery would contribute to erosion control, beautification,
civic pride, reduction of CO2, absorption of runoff and rain water, and create jobs.
Cyperus is also a known food source of many wildlife native to NY and NJ. Hunters have
been known to plant Chufa in order to attract wild turkey (Bamishaiye, 2011). In fact,
Chufa has been used to save the declining turkey population all across the eastern
United States (Hammond, 2014). Chufa is a preferred food for wild turkeys, being so

46
nutritious, and state governments have planted acres of Chufa to successfully rescue the
turkey population. The tubers are important for other waterfowl as well. They are an
essential part of the greater Northeastern US ecosystem.
We thought it important to test in which soil Chufa does the best. We had predicted
that lighter, sandy soils would increase tuber production and size, while reducing the
root density of the tubers. As such, we chose 4 different soil conditions to test-
professional growing medium, loamy sand, and two commercial organic soils made by
different companies. We also chose two of our best selections to perform in this trial,
to measure differences between selections, to find the best conditions for productivity
for each selection. (For literature on this matter, please refer to Chapter 1).
Objective – To determine the effects of different soil types on plant productivity.
Methods –
Chufa was propagated by taking the stalk a semi-mature plant with some of its roots
intact, trimming it down to about 4 inches, and planting it into a standard greenhouse
flat filled with either: Pro-Mix® brand BX general-purpose professional growing medium
soil; we refer to it as GreenHouse Mixture (GHM) soil, field soil collected from Rutgers
Agricultural Extension at Adelphia, NJ (a loamy-sand, LS), Vigoro brand Organic Soil (VG)
or organically-fertilized MiracleGro® brand organic soil (MG). Three plants were planted
per flat, and each of the non-organic soils received 15g of NPK fertilizer and 15g of
muriate of potash (MOP). MG and VG received the recommended amount of 2oz. per
flat of MiracleGro® dry organic fertilizer. Plants were given their fertilizer once, about 4

47
weeks after planting, right before tuber-formation. Plants were grown until 14 weeks
had passed, then harvested, and data for shoot weight, shoot number, tuber weight,
and tuber number was collected. Tubers were washed, then dried for two days, then
weighed. Rooty fibers were detached and discarded. Tuber weight is the weight of all
tubers produced in a flat (tuber yield weight). Results were statistically analyzed using
the “proc glm” command in the SAS software suite. Fisher’s Least Significant Difference
(LSD) model was applied to the data (p<0.05), and significance groups were generated
and applied to the results. The highest significance level was marked as “A”, with lower
significance levels marked as “B”, “C”, and so on.
Results –
B
D
C
D
A
D
B
D
020406080
100120140160
Control LoamySand
MGOrganic
VGOrganic
cou
nt
HF3 Soil Experiment Number of Shoots
GH OG
B
D
C
D
A
D
B
D
0
100
200
300
400
500
Control LoamySand
MGOrganic
VGOrganic
cou
nt
HF3 Soil Experiment Number of Tubers
GH OG
Figure 44 – Effect of soil type on number of
shoots produced. Loamy-sand produced
less-root-dense tubers, whereas GHM
control and MG Organic produced root-
dense tubers. The control and MG organic
soil performed the best overall.
Figure 45 – Effect of soil type on number of
tubers produced. Loamy-sand produced
less-root-dense tubers, whereas GHM
control and MG Organic produced root-
dense tubers. The control and MG organic
soil performed the best overall.

48
B
D
C
D
A
D
B, C
D
0
50
100
150
200
250
300
Control LoamySand
MGOrganic
VGOrganic
gram
s
HF3 Soil Experiment Tuber Yield Weight
GH OG
A
C, D
B
C
A
D
B
C, D
0
50
100
150
200
250
Control LoamySand
MGOrganic
VGOrganic
gram
s
HF3 Soil Experiment Shoot Weight
GH OG
Figure 46 – Effect of soil type on tuber yield
weight. Besides the control, MG Organic
soil yielded the most tubers. Loamy-sand
produced less-root-dense tubers, whereas
GHM control and MG Organic produced
root-dense tubers. The control and MG
organic soil performed the best overall.
Figure 47 – Effect of soil type on shoot
weight. Loamy-sand produced less-root-
dense tubers, whereas GHM control and
MG Organic produced root-dense tubers.
The control and MG organic soil performed
the best overall.

49
A
B, C
BB, C
A
D
B
C, D
0
5
10
15
20
25
30
35
40
45
Control LoamySand
MGOrganic
VGOrganic
inch
es
HF3 Soil Experiment Height
GH OG
0
0.1
0.2
0.3
0.4
0.5
0.6
0.7
0.8
Control LoamySand
MGOrganic
VGOrganic
gram
s
HF3 Soil Experiment Average Tuber Weight
GH OG
Figure 48 – Effect of soil type on plant
height. Loamy-sand produced less-root-
dense tubers, whereas GHM control and MG
Organic produced root-dense tubers. The
control and MG organic soil performed the
best overall.
Figure 49 – Effect of soil type on average
individual tuber weight. Loamy-sand
produced less-root-dense tubers, whereas
GHM control and MG Organic produced
root-dense tubers. The control and MG
organic soil performed the best overall.
A
A
A, B
B
A A
A
A, B

50
For number of shoots, number of tubers, tuber yield weight, and shoot weight, Chufa
grown in the professional growth medium (GHM) produced significantly the most,
followed closely by Chufa grown in MG. Chufa grown in LS or VG fared the poorest,
producing less than half the number of shoots, number of tubers, tuber yield weight,
and shoot weight. However, Chufa grown in LS produced clean tubers with almost no
roots attached. Chufa grown in LS also happened to be the easiest to harvest, requiring
a fraction of the time compared to harvesting from other soils.
Conclusion –
As seen in Figures 44, 45, & 46, OG in GHM did the best at making many shoots and
tubers, as well as tuber yield weight. This was followed by OG in MG, and GH in GHM
0
0.5
1
1.5
2
2.5
3
3.5
4
Control Loamy Sand MG Organic VG Organic
tub
ers
per
sh
oo
t
HF3 Soil Experiment Average Tubers per Shoot
GH OG
Figure 50 – Effect of soil type on average number of tubers per
shoot produced. Loamy-sand produced less-root-dense tubers,
whereas GHM control and MG Organic produced root-dense
tubers. The control and MG organic soil performed the best
overall.
A A A
B
A A
A, B
A

51
and MG. Both selections in LS and VG made the fewest number of shoots. For shoot
weight (Figure 47), Both GH and OG did the best in GHM, followed by both selections in
MG. VG and LS did significantly poorer. Average number of tubers per shoot was
unaffected by soil (figure 50). With respect to plant height (Figure 48), both selections
grown in GHM did significantly better than the others. It would seem that the ideal soils
for Chufa productivity are high in organic matter, but highly digested organic matter.
The VG soil seemed to have been almost a wood-chip mulch, rather than a finer soil, like
the other soils. MG seemed highly-digested as an organic soil, and was finer in
particulates, and comparable to GHM in consistency. The VG soil dried out quite
quickly, and perhaps the poorness of performance in VG may be due to the fact that the
low-water was hampering the productivity of the plant (See Chapter 4).
Although Chufa in LS was not very productive, it should be noted that the tubers were
almost bare and root-free, compared to tubers produced in other soils. Tuber individual
size was also, on average, significantly smaller than in other soils (Figure 49). LS was
also the easiest soil in which to harvest the tubers. This may be advantageous, as chufa
is almost impossible to harvest in heavier soils, such as clay. We had noticed that last
year, planting the Iron-Soil experiment (See Chapter 3), the field soil was a clay-loam,
and was extremely difficult to harvest tubers from. We also had thought that the tuber
size was inversely proportional to soil-heaviness. This has proven to be not true. In-
fact, these results suggest that Chufa is a plant that prefers organically-rich, but
moderate-to-light soils. A future experiment should involve adjusting the
concentrations of sand and loam to find the ideal soil that makes harvesting easy, and

52
Chufa create the least amount of roots. Because Chufa performs so well with high
amounts of fertilizer (See Chapter 2), we highly recommend that farmers amend their
soils with as much organic matter and fertilizer as possible.
53
Chapter 6 – Current Status and Future Applications
Although Chufa is not popular in the Western world yet, it certainly is growing as a
commercial food product. In Wholefoods stores, Tigernut Horchata is sold on the same
shelf as cold-pressed juices. Tiger Nuts are sold in small bags and with trail mix to the
Paleo-diet market. However, two major limitations to this crop achieving national
attention are that Chufa is incredibly difficult to harvest, and the machinery in Spain that
does harvest Chufa is not for sale, and that Chufa is considered to be a noxious weed in
most farms.
We believe that the consumer markets will dictate demand of this crop, and if the price
is right, farmers’ opinions will be swayed about the status of this plant. Also, if the
harvesting equipment is developed, then Chufa can finally be advertised to the national
markets, and break through as a health food. With such benefits as all 20 amino acids,
high mineral and caloric content, versatile use, its usage history in Egypt, and a flavor
like coconuts and almonds, it is likely that Chufa will be a hit with the American public.
Because Chufa is considered a “weed”, and weeds seem to fare better than actual crops
themselves, it is highly productive to begin with. It has virtually no pests, save for
Billbugs. This makes it attractive as a crop. However, with the water demands of the
crop, it is likely to be planted along riversides, or in easily-flooded fields where other
crops do not like to grow. This will help with land requirements, and potentially opens
up floodplains and riverbanks as potential cultivatable land.

54
Ecological and Urban Farming Applications
Urban growth and dynamics have called for a need to address the growing issue of food
sustainability- in growing, processing, transport, and consumption. In addition, the
recent concerns in global climate change, economic stability, and food health concerns
have made Urban Agriculture (UA) an issue of great importance (Specht, et al., 2014).
UA has been an activity of leisure, but has resurged as an important factor in urban
sustainability and economic resilience (McClintock, 2010). With unavoidable increasing
urbanization (Nations, 2004), the need for new ways of bringing local, fresh, affordable
produce becomes priority to the economic sustainability and food supply of cities
(Elijah's Promise, 2015; Brock, 2008). With the ever-growing “Go Green” movement,
public demand for fresh produce, and the recent economic downturn, UA has been
implemented as a means of food security, job creation, creates leisure, and a sink for
urban waste (McClintock, 2010; Specht, et al., 2014; Mougeot, 2005; UNDP, 1996). UA
has also been used as city beautification and as community gardens, creating green
spaces and leisure spaces in cities, where there were none before. Community gardens
have been used in urban restoration projects and community strengthening projects in
the Bronx, with many health benefits to the volunteers besides having access to healthy
local food (Ottmann, 2012). Food shelters such as Elijah’s Promise in New Brunswick, NJ
have benefitted from food donations from local community gardens and home-growers
in the City of New Brunswick. Elijah’s Promise has trained many volunteers in how to
grow their own food, where food comes from, giving education and job-training for

55
those interested, as well as encouraging community engagement and helping the city’s
hungry (Matacera, 2015).
Community gardens can help needy families save money on food every year, as well as
be profitable for others. Community gardens’ productivity can be measured as
economic value per square foot. Average NYC community gardens can raise $1-10 per
square foot, but have seen as high as $40 per square foot (Saldivar-Tanaka & Krasny,
2004; Vitiello & Nairn, 2009; Gittleman, Jordan, & Brelsford, 2012). A small garden can
raise about $50,000 in fruit and vegetable sales, while larger gardens can generate even
more revenue.
We have found that chufa planted in about 2 square feet flats have yielded on average
500 tubers in outdoor conditions with average tuber size about 0.8g, which is about
400g of tubers. Market retail value of Chufa tubers ranges from about $0.68-1.10 or
more per ounce (TNUSA, 2015), or $0.0239 per gram. That makes 400g of tubers worth
about $9.59-15.52. This is about $4.79-7.76 per square foot, which is competitive with
high-value crops such as tomatoes and beans (Saldivar-Tanaka & Krasny, 2004). The
advantage of Chufa over beans and tomatoes, is that it requires little to no
maintenance. Beans need to be culled into trellises, and tomatoes need to be steaked
individually, costing time and money. Chufa is a “set it and forget it” type of crop, with
the obvious exception of irrigation, weeding, fertilizer applications, and other general
crop maintenance. Chufa is also advantageous to plant because it is relatively
pathogen-free. No insect damage except for Billbug has been observed during

56
experimental trials at field experiments at Rutgers Horticultural Farm 3, where it is
planted and maintained.
Organizing with “Organic Gemini Tigernuts” company in Brooklyn, NY and the
community gardens in Brooklyn, we can outreach to the local community and
encourage the growth of the Chufa and promote its benefits. The harvest from the
community gardens can be sold to Organic Gemini Tigernuts, benefitting the community
with revenue, greenspace, fresh produce, and helping the local chufa/tigernut business.
With a possible future Rutgers-patented harvesting machine, Rutgers could stand to
benefit from the revenue generated from sales, rental, and use of these machines that
we have developed. The ecological and economic potential of Chufa to be used in this
way is great, and increasing as demand for fresh, local produce and local greenspace
increases.
Given that the Chufa market in the Americas is just opening up, that leaves few
competitors and an unsaturated, open market. Because Chufa/Tiger nuts are healthy,
tasty, and versatile in use, they can be incorporated into a wide variety of products and
industries including the baking industry, the gluten-free market, and most importantly,
the health food industry. We fully believe that more exploration can be done with
different fertilizers and different soils and their effects on tuber production and plant
productivity.

57
Literature Cited
Adejuyitan, J. A. (2011). Tigernut processing: its food uses and health benefits. American Journal
of Food Technology, 6(3), 197-201.
Aguilar, N., Albanell, E., Miñarro, B., & Capellas, M. (2015). Chickpea and tiger nut flours as
alternatives to emulsifier and shortening in gluten-free bread. LWT-Food Science and
Technology, 62(1), 225-232.
Ahmed, Z. S., & Hussein, A. (2014). Exploring the suitability of incorporating tiger nut flour as
novel ingredient in gluten-free biscuit. Polish Journal of Food and Nutrition Sciences,
64(1), 27-33.
Amine, E., Baba, N., Belhadj, M., Deurenbery-Yap, M., Djazayery, A., Forrester, T., & Yoshiike, N.
(2002). Diet, nutrition and the prevention of chronic diseases: report of a Joint
WHO/FAO Expert Consultation. World Health Organization.
Arafat, S. M., Gaafar, A. M., Basuny, A. M., & Nassef, S. L. (2009). Chufa tubers (Cyperus
esculentus L.): As a new source of food. World Appl. Sci. J., 7:151–156.
Bamishaiye, E. I. (2011). Tiger nut: as a plant, its derivatives and benefits. African Journal of
Food, Agriculture, Nutrition and Development, 11(5): 5157-5170.
Belewu, M. A., & Belewu, K. Y. (2007). Comparative physicochemical evaluation of tigernut,
soybean and coconut milk sources. Intl. J. Agric. Biol., 5:785–7.
Bosch, L., Alegria, A., & Farre, R. (2005). RP-HPLC determination of tiger nut and orgeat amino
acid contents. Food science and technology international, 11(1), 33-40.
Bothwell, T. H. (1995). Overview and mechanisms of iron regulation. Nutr Rev, 53(9): 237-45.
Bothwell, T. H., & Charlton, R. W. (1981). Iron deficiency in women. Washington, DC: The
Nutrition Foundation.
Bothwell, T. H., Charlton, R. W., Cook, J. D., & Finch, C. A. (1979). Iron metabolism in man.
Oxford, UK: Blackwell Scientific Publications.
Brock, A. (2008). Room to grow: Participatory landscapes and urban agriculture at NYU. New
York University Press.
Chapman, K., Sparrow, L., Hardman, P., Wright, D., & Thorp, J. (1992). Potassium nutrition of
Kennebec and Russet Burbank potatoes in Tasmania: effect of soil and fertiliser
potassium on yield, petiole and tuber potassium concentrations, and tuber quality.
Australian Journal of Experimental Agriculture, 32(4): 521-527.

58
Chinma, C. E., Abu, J. O., & Abubakar, Y. A. (2010). Effect of tigernut (Cyperus esculentus) flour
addition on the quality of wheat‐based cake. International journal of food science &
technology, 45(8): 1746-1752.
Codina-Torrella, I., Guamis, B., & Trujillo, A. J. (2014). Characterization and comparison of tiger
nuts (Cyperus esculentus L.) from different geographical origin: Physico-chemical
characteristics and protein fractionation. Industrial Crops and Products, 65:406-414.
Connolly, E. L., Fett, J. P., & Guerinot, M. L. (2002). Expression of the IRT1 metal transporter is
controlled by metals at the levels of transcript and protein accumulation. Plant Cell,
14(6):1347-57.
Cook, J. D., Skikne, B. S., & Baynes, R. D. (1994). Iron deficiency: the global perspective. In C.
Hershko, A. N. Konijn, & P. Aisen, Progress in iron research (pp. 219-28). New York, NY:
Plenum Press.
Detzel, P., & Wieser, S. (2015). Food Fortification for Addressing Iron Deficiency in Filipino
Children: Benefits and Cost-Effectiveness. Annals of Nutrition and Metabolism, 66(Suppl.
2): 35-42.
Ezeh, O., Gordon, M. H., & Niranjan, K. (2014). Tiger nut oil (Cyperus esculentus L.): A review of
its composition and physico‐chemical properties. European Journal of Lipid Science and
Technology, 116(7), 783-794.
Farrag, H. F., & Fawzy, M. (2012). Phytoremediation Potentiality of Cyperus articulatus L. Life
Science Journal, 9(4).
Ghosh, T. B. (2003). Application of a ‘bio-engineering’technique to protect Ghoramara Island
(Bay of Bengal) from severe erosion. Journal of Coastal Conservation, 9(2): 171-178.
Gittleman, M., Jordan, K., & Brelsford, E. (2012). Using citizen science to quantify community
garden crop yields. Cities and the Environment (CATE), 5(1): 4.
Green, R., Charlton, R., & Seftel, H. (1968). Body iron excretion in man: a collaborative study. Am
J Med, 45: 336-53.
Guo, L., & Cutright, T. J. (2014). Effect of citric acid and rhizosphere bacteria on metal plaque
formation and metal accumulation in reeds in synthetic acid mine drainage solution.
Ecotoxicology and environmental safety, 104: 72-78.
Hallberg, L. (1981). Bioavailability of dietary iron in man. Annu Rev Nutr, 1:123-47.
Hallberg, L. (1988). Iron balance in pregnancy. In H. Berger, Vitamins and minerals in pregnancy
and lactation (pp. 115-27). New York, NY: Raven Press.
Hammond, J. D. (2014). Incremental Investment Value of Wild Turkey Management on the
South Carolina Piedmont. Natural Resources, 5: 719-31.
Home Depot Fertilizers. (2014, September 20). Retrieved from
http://www.homedepot.com/b/Outdoors-Garden-Center-Lawn-Care-Lawn-
Fertilizers/N-5yc1vZbx6b

59
Itai, R. N. (2013). Rice genes involved in phytosiderophore biosynthesis are synchronously
regulated during the early stages of iron deficiency in roots. Rice, 6(1): 1-13.
Jones, P. J., Senanayake, V. K., Pu, S., Jenkins, D. J., Connelly, P. W., Lamarche, B., & Kris-
Etherton, P. M. (2014). DHA-enriched high–oleic acid canola oil improves lipid profile
and lowers predicted cardiovascular disease risk in the canola oil multicenter
randomized controlled trial. The American journal of clinical nutrition, 100(1), 88-97.
La Tienda Importers. (2014, September 20). Retrieved from
http://www.tienda.com/food/products/nt-
15.html?gclid=CL_zyMmS7sACFaVZ7AodHloA8w
Lasekan, O. (2013). Volatile constituents of roasted tigernut oil (Cyperus esculentus L.). J. Sci.
Food Agric., 93(5), 1055-1061.
Li, R., Chen, X., Yan, H., Deurenberg, P., Garby, L., & Hautvast, J. G. (1994). Functional
consequences of iron supplementation in iron deficient female cotton mill workers in
Beijing, China. Am J Clin Nutr, 59(4): 908-13.
Lunn, J., & Theobald, H. E. (2006). The health effects of dietary unsaturated fatty acids. Nutrition
Bulletin, 31(3), 178-224.
Lynch, S. R. (2011). Why nutritional iron deficiency persists as a worldwide problem. The Journal
of nutrition, 141(4): 763S-768S.
Macho, G. A. (2014). Baboon Feeding Ecology Informs the Dietary Niche of Paranthropus boisei.
PLoS ONE, 9(1): e84942. doi:10.1371/journal.pone.0084942.
Matacera, M. (2015, August 20). Retrieved from Elijah's Promise:
http://www.elijahspromise.org/what-we-do/
Matsuoka, H., Akiyama, M., Kobayashi, K., & Yamaji, K. (2013). Fe and P solubilization under
limiting conditions by bacteria isolated from Carex kobomugi roots at the Hasaki coast.
Current microbiology, 66(3): 314-321.
McClintock, N. (2010). Why farm the city? Theorizing urban agriculture through a lens of
metabolic rift. Cambridge J Regions Econ Soc doi: 10.1093/cjres/rsq005. doi: doi:
10.1093/cjres/rsq005
McPhearson, T., Hamstead, Z. A., & Kremer, P. (2014). Urban ecosystem services for resilience
planning and management in New York City. Ambio, 43(4): 502-515.
Miller, J. L. (2013). Iron deficiency anemia: a common and curable disease. Cold Spring Harbor
perspectives in medicine, 3(7): a011866.
MMWR. (1998). Recommendations to Prevent and Control Iron Deficiency in the United States.
CDC. Retrieved August 7, 2015, from
http://www.cdc.gov/mmwr/preview/mmwrhtml/00051880.htm

60
Mok, H. F., Williamson, V. G., Grove, J. R., Burry, K., Barker, S. F., & Hamilton, A. J. (2014).
Strawberry fields forever? Urban agriculture in developed countries: a review.
Agronomy for sustainable development, 34(1): 21-43.
Morrissey, J., & Guerinot, M. L. (2009). Iron uptake and transport in plants: the good, the bad,
and the ionome. Chemical reviews, 109(10): 4553-4567.
Mougeot, L. J. (2005). Agropolis: The Social, Political and Environmental Dimensions of Urban
Agriculture. Ottawa: IDRC.
Nations, U. (2004). World population to 2300. New York: Department of Economic and Social
Affairs: United Nations.
Negbi, M. (1992). A sweetmeat plant, a perfume plant, and their weedy relatives: a chapter in
the history of Cyperus esculentus L. and C. rotundus L. Econ Bot, 46:64-71.
NIH. (2015, August 10). Iron Dietary Supplement Fact Sheet for Health Professionals. Retrieved
from https://ods.od.nih.gov/factsheets/Iron-HealthProfessional/
Nozoye, T., Nagasaka, S., Kobayashi, T., Takahashi, M., Sato, Y., Sato, Y., & Nishizawa, N. K.
(2011). Phytosiderophore efflux transporters are crucial for iron acquisition in
graminaceous plants. Journal of Biological Chemistry, 286(7): 5446-5454.
Ofoefule, A. U., Ibeto, C. N., Okoro, U. C., & Onukwuli, O. D. (2013). Biodiesel production from
Tigernut (Cyperus esculentus) oil and characterization of its blend with petro-diesel.
Phy. Rev. Res. Int. l , 3: 145-153.
Oladele, A. K., & Aina, J. O. (2007). Chemical composition and functional properties of flour
produced from two varieties of tigernut (Cyperus esculentus). African Journal of
Biotechnology, 6(21).
Ottmann, M. M. (2012). Characterization of urban agricultural practices and gardeners’
perceptions in Bronx community gardens, New York City. Cities and the environment
(CATE), 5(1): 13. Retrieved from http://digitalcommons.lmu.edu/cate/vol5/iss1/13/
Panique, E., Kelling, K., Schulte, E., Hero, D., Stevenson, W., & James, R. (1997). Potassium rate
and source effects on potato yield, quality, and disease interaction. American Potato
Journal, 74(6): 379-398.
Pascual, B., Maroto, J. V., LóPez-Galarza, S., Sanbautista, A., & Alagarda, J. (2000). Chufa
(Cyperus esculentus L. var. sativus Boeck.): An unconventional crop. Studies related to
applications and cultivation. Economic botany, 54(4): 439-448.
Pasricha, S. R., Drakesmith, H., Black, J., Hipgrave, D., & Biggs, B. A. (2013). Control of iron
deficiency anemia in low-and middle-income countries. Blood, 121(14): 2607-2617.
Peters, C. R., & Vogel, J. C. (2005). Africa's wild C 4 plant foods and possible early hominid diets.
Journal of Human Evolution, 48(3), 219-236.
Real Foods. (2014, September 20). Retrieved from
http://www.realfoods.co.uk/product/586/tiger-nuts

61
Rellán‐Álvarez, R. A.‐F. (2008). Formation of metal‐nicotianamine complexes as affected by pH,
ligand exchange with citrate and metal exchange. A study by electrospray ionization
time‐of‐flight mass spectrometry. Rapid Communications in Mass Spectrometry, 22(10):
1553-1562.
Resource Overseas. (2014, September 20). Retrieved from http://resource-
overseas.com/home/tiger-nuts/
Roschzttardtz, H., Conéjéro, G., Divol, F., Alcon, C., Verdeil, J. L., Curie, C., & Mari, S. (2013). New
insights into Fe localization in plant tissues. Front Plant Sci, 4: 350.
Saldivar-Tanaka, L., & Krasny, M. E. (2004). Culturing community development, neighborhood
open space, and civic agriculture: The case of Latino community gardens in New York
City. Agriculture and human values, 21(4): 399-412.
Sánchez‐Zapata, E., Fernández‐López, J., & Pérez‐Alvarez, J. A. (2012). Tiger nut (Cyperus
esculentus) commercialization: health aspects, composition, properties, and food
applications. Comprehensive Reviews in Food Science and Food Safety, 11.4 (2012): 366-
377.
Satch, C. S., & Ayeni, A. O. (2014). Unpublished Data. Rutgers University.
Siegenberg, D., Baynes, R. D., & Bothwell, T. H. (1994). Ascorbic acid prevents the dose-
dependent inhibitory effects of polyphenols and phytates on nonheme-iron absorption.
Am J Clin Nutr, 53: 537-41.
Skikne, B. B. (1994). Iron absorption. In J. H. Brock, J. W. Halliday, M. J. Pippard, & L. W. Powell,
Iron metabolism in health and disease (pp. 151-87). London, UK: W.B. Saunders.
Specht, K., Siebert, R., Hartmann, I., Freisinger, U. B., Sawicka, M., Werner, A., & Dierich, A.
(2014). Urban agriculture of the future: an overview of sustainability aspects of food
production in and on buildings. Specht, K., Siebert, R., Hartmann, I., Freisinger, U. B.,
Sawicka, M., Werner, A., ... & Dierich, A. (2014). Urban agriculture of the future: an
overview of sustainability aspects of food production in and on buildings. Agriculture and
Human Values, 31(1): 33-51.
Temple, V. J., Ojobe, T. O., & Kapu, M. M. (1990). Chemical analysis of tiger nut (Cyperus
esculentis). Journal of the Science of Food and Agriculture, 50(2): 261-263.
TNUSA. (2015, August 10). Retrieved from Tiger Nuts USA: http://tigernutsusa.com/tiger-nuts
UNDP. (1996). Urban Agriculture: Food, Jobs and Sustainable Cities. New York: United Nations
Development Programme.
Vert, G., Grotz, N., Dedaldechamp, F., Gaymard, F., Guerinot, M. L., Briat, J.-F., & Curie, C.
(2002). IRT1, an Arabidopsis transporter essential for iron uptake from the soil and for
plant growth. Plant Cell, 14(6):1223-33.

62
Vitiello, D., & Nairn, M. (2009). Community Gardening in Philadelphia: 2008 Harvest Report.
Penn Planning and Urban Studies, University of Pennsylvania. Retrieved August 7, 2015,
from https://sites.google.com/site/harvestreportsite/philadelphia-report
Wang, W., Zhou, W., Liu, J., Li, Y., & Zhang, Y. (2013). Biodiesel production from hydrolysate of
Cyperus esculentus waste by Chlorella vulgaris. Bioresource technology, 136: 24-29.
Yadav, S., & Chandra, R. (2011). Heavy metals accumulation and ecophysiological effect on L.
and L. growing in distillery and tannery effluent polluted natural wetland site, Unnao,
India. Environmental Earth Sciences, 6(62): 1235-1243.
Zohary, D. (1986). The origin and early spread of agriculture in the Old World. In: Barigozzi C,
editor. The origin and domestication of cultivated plants. Amsterdam: Elsevier, p. 3–20.