2016 car buyer journey - oem solutions · pdf filesource: 2016 car buyer journey provided by...
TRANSCRIPT

2016 Car Buyer Journey

Source: 2016 Car Buyer Journey provided by Autotrader and Kelley Blue Book
2
Market Environment

Source: IHS Automotive
3
Light NEW vehicle sales growth slows as the 2017 peak approaches.
17.0
16
.6
16
.2
13
.2 1
0.4
11
.6
12
.8
14
.5
15
.6
16
.5
17.3
17.8
18
.2
18
.1
17.7
17.2
0
4
8
12
16
20
2005 2010 2015 2020
Millio
ns
IHS Automotive
U.S. NEW Light Vehicle Sales and Forecast – Oct. 2015
Source: Automotive News
4
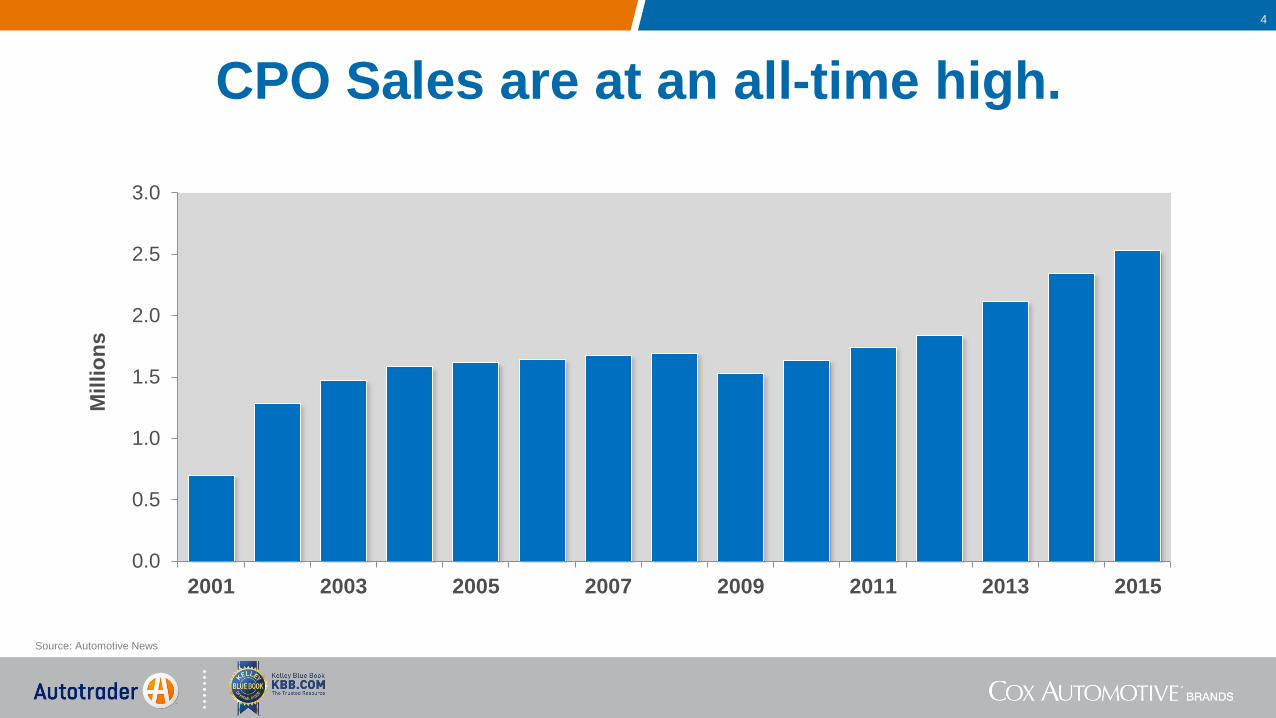
CPO Sales are at an all-time high.
0.0
0.5
1.0
1.5
2.0
2.5
3.0
2001 2003 2005 2007 2009 2011 2013 2015
Millio
ns

Source: IHS and TransUnion Consumer Credit Database
5
Auto originations have grown with increasing credit availability and auto sales growth.
Total Auto Loan and Lease Originations
(New and Used)
0
1
2
3
4
5
6
7
8
20
09
Q3
2009 Q
4
20
10
Q1
20
10
Q2
2010 Q
3
20
10
Q4
20
11
Q1
20
11
Q2
20
11
Q3
20
11
Q4
20
12
Q1
20
12
Q2
20
12
Q3
20
12
Q4
20
13
Q1
20
13
Q2
20
13
Q3
20
13
Q4
20
14
Q1
20
14
Q2
20
14
Q3
20
14
Q4
20
15
Q1
20
15
Q2
Millio
n

Auto sales will remain high, but growth will require conquesting
from others.
Source: 2016 Car Buyer Journey provided by Autotrader and Kelley Blue Book
6

7
6-in-10 buyers are open to vehicles
across Makes when they begin to shop.
30%
11%
24%
15%
13%
7%
34%
14%
22%
14%
10%
6%
29%
9%
26%
15%
14%
7%
You knew the exact vehicle that you wanted
You knew the vehicle make that you wanted
You knew the body style of the vehicle that
you wanted, but not the make or model
You didn’t know the specific vehicle you
wanted, but you had a certain class of
vehicle in mind
You didn’t know what you wanted, but the
vehicle had to have certain features
You didn’t know what vehicle you wanted
when you started looking
Initial Make/Model Purchase Intent (TOTAL VS. NEW VS. USED)
B
B
A
Total New (A) Used (B) Letters indicate significant differences between groups at the 95% confidence interval
Base: Total (n=2,117, MOE +/- 2.1%), New (n=1,277, MOE +/- 2.7%), Used (n=840, MOE +/- 3.4%)
QS10. Thinking back to when you first considered purchasing a vehicle, which of the following best describes your purchase intention?
Source: 2016 Car Buyer Journey provided by Autotrader and Kelley Blue Book

Source: 2016 Car Buyer Journey provided by Autotrader and Kelley Blue Book
8
Vehicle Consideration Mindset (TOTAL VS. NEW VS. USED)
NEW (A)
USED (B)
TOTAL
20% 64% B 1%
40% A 11% 31%
45% A 1% 31%
Letters indicate significant differences between groups at the 95% confidence interval
Base: Total (n=2,101, MOE +/- 2.1%), New (n=1,268, MOE +/- 2.8%), Used (n=833, MOE +/- 3.4%)
QS9. Which of the following best describes your mindset when you were shopping for your last vehicle?
New Vehicles only
Used vehicles but
considered New
Used only
New vehicles but
considered Used 18% 24% B 14%
More than half of used buyers considered new vehicles.
Source: 2016 Car Buyer Journey provided by Autotrader and Kelley Blue Book
9
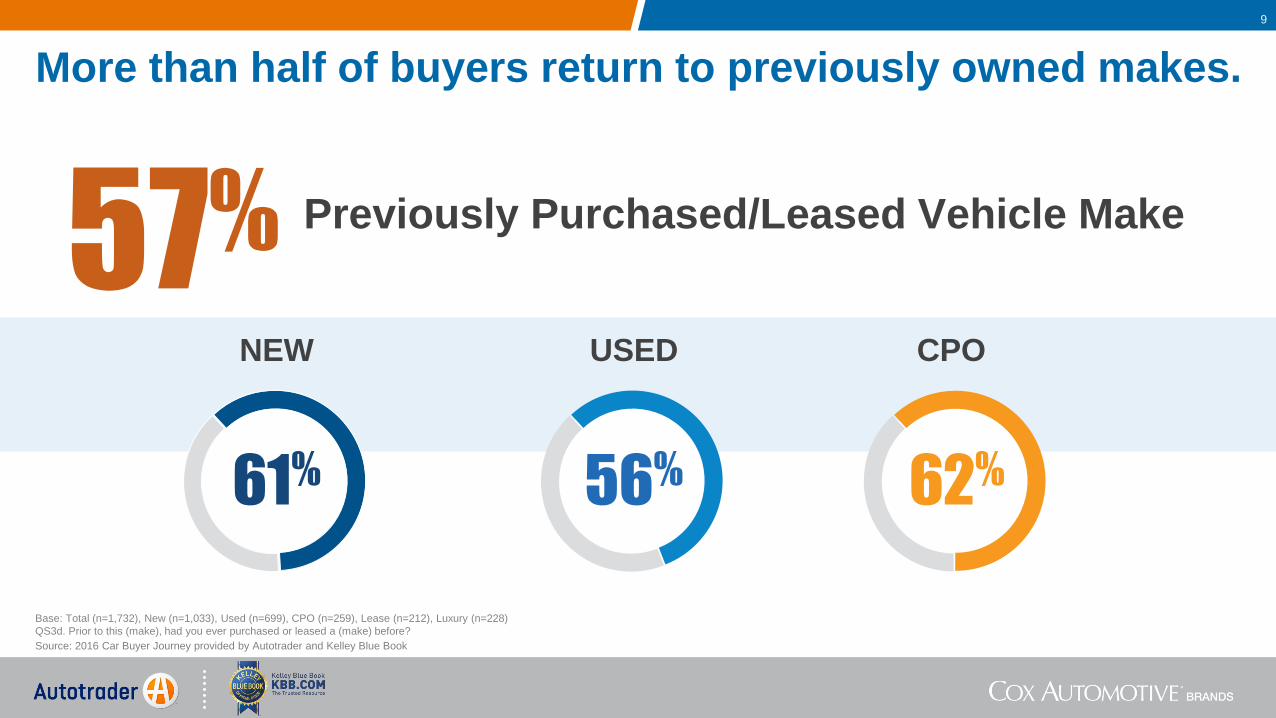
More than half of buyers return to previously owned makes.
57% Previously Purchased/Leased Vehicle Make
61% 56% 62%
NEW USED CPO
Base: Total (n=1,732), New (n=1,033), Used (n=699), CPO (n=259), Lease (n=212), Luxury (n=228)
QS3d. Prior to this (make), had you ever purchased or leased a (make) before?

Source: 2016 Car Buyer Journey provided by Autotrader and Kelley Blue Book
10
The conquest battle will largely take place ONLINE as brand preferences are developed ONLINE.

Source: 2016 Car Buyer Journey provided by Autotrader and Kelley Blue Book
11
Almost everyone shops online prior
to purchasing their vehicle and
nearly half are using their
smartphone to research and shop.
Letters indicate significant differences between groups at the 95% confidence interval
Base: Q99 - Total (n=1,869), New (n=1,098), Used (n=771)
Q99. Prior to purchasing your vehicle, which of the following devices did you use to access automotive information, either through the Internet or by using a mobile device?
83%
46%
31% Tablet
Desktop/ Laptop
Smartphone 88%
Use the Internet to
Research and Shop
(85% New, 90% Used)

Source: 2016 Car Buyer Journey provided by Autotrader and Kelley Blue Book
12
Buyers spend more time researching and shopping online.
Researching and
Shopping – Online
Researching and Shopping – Print
Talking with Others
Visiting Other Dealerships/Sellers
With the Dealership/ Seller where Purchased
21%
3%
2%
59%
8 : 4 2
0 : 1 5
0 : 2 9
2 : 1 2
3 : 0 6
15%
Base: Total (n=1,816), New (n=1,112), Used (n=704)
Q1520. Approximately how much time did you spend…

Source: 2016 Car Buyer Journey provided by Autotrader and Kelley Blue Book
13
The Top 5 Activities Done Online During The Shopping Process
Base: Total (n=1,856, MOE +/- 2.3%),
Q9a. Which of the following did you do online?
71%
68%
64%
63%
46%
1
2
3
4
5
Research car pricing
Find actual vehicles listed for sale
Compare different models
Find out what current car is worth
Locate a dealer or get dealer info
14
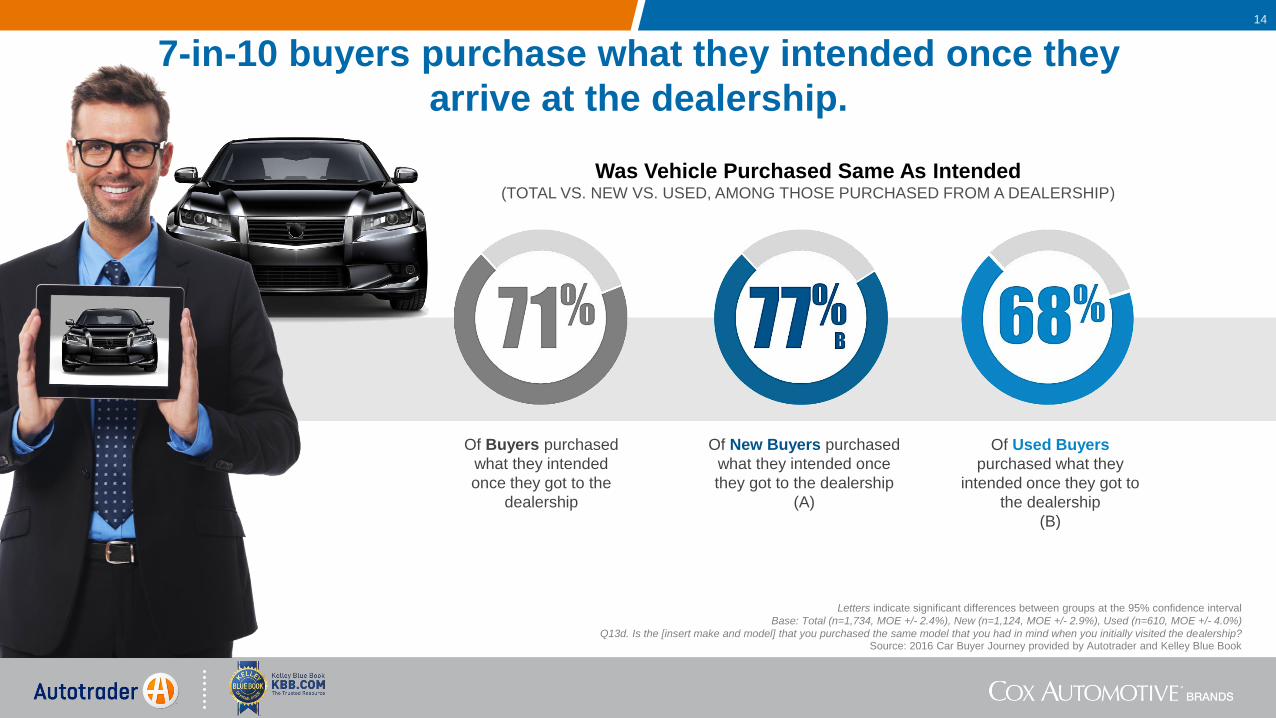
7-in-10 buyers purchase what they intended once they
arrive at the dealership.
Was Vehicle Purchased Same As Intended (TOTAL VS. NEW VS. USED, AMONG THOSE PURCHASED FROM A DEALERSHIP)
Of Used Buyers
purchased what they
intended once they got to
the dealership
(B)
Of New Buyers purchased
what they intended once
they got to the dealership
(A)
Of Buyers purchased
what they intended
once they got to the
dealership
77% 68% 71% B
Source: 2016 Car Buyer Journey provided by Autotrader and Kelley Blue Book
Letters indicate significant differences between groups at the 95% confidence interval
Base: Total (n=1,734, MOE +/- 2.4%), New (n=1,124, MOE +/- 2.9%), Used (n=610, MOE +/- 4.0%)
Q13d. Is the [insert make and model] that you purchased the same model that you had in mind when you initially visited the dealership?
Source: 2016 Car Buyer Journey provided by Autotrader and Kelley Blue Book
15
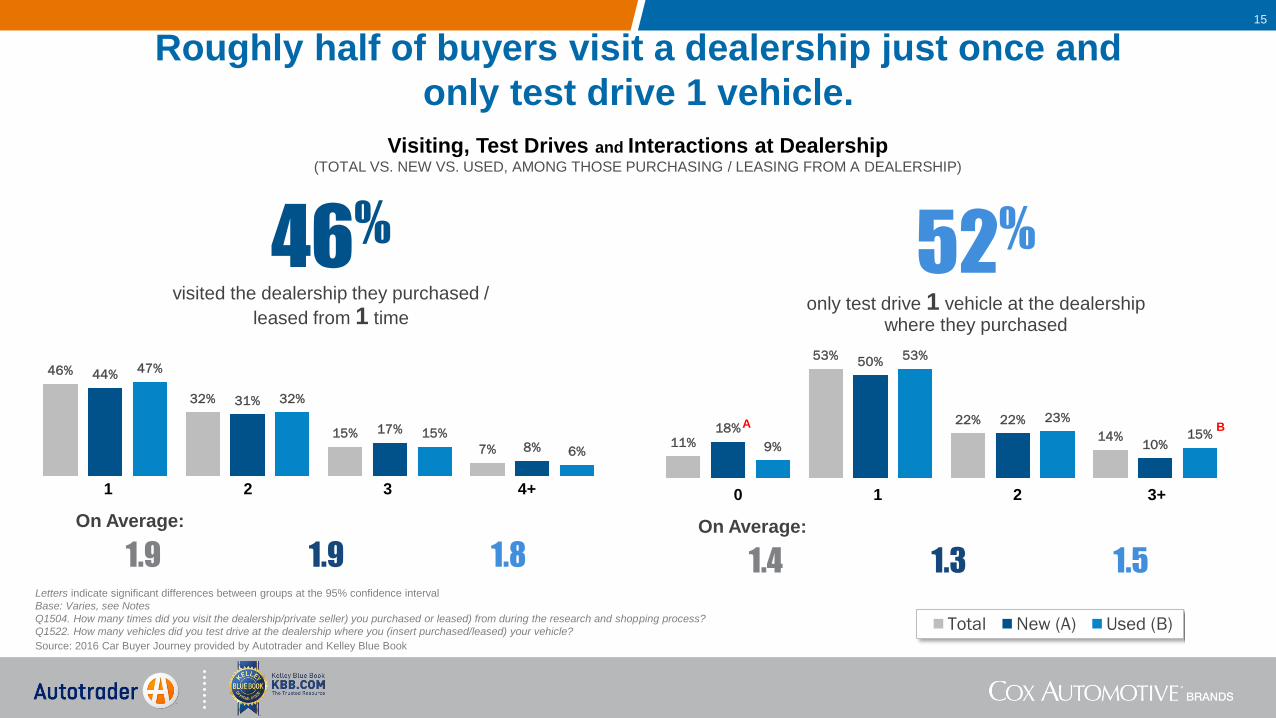
Roughly half of buyers visit a dealership just once and
only test drive 1 vehicle. Visiting, Test Drives and Interactions at Dealership
(TOTAL VS. NEW VS. USED, AMONG THOSE PURCHASING / LEASING FROM A DEALERSHIP)
Letters indicate significant differences between groups at the 95% confidence interval
Base: Varies, see Notes
Q1504. How many times did you visit the dealership/private seller) you purchased or leased) from during the research and shopping process?
Q1522. How many vehicles did you test drive at the dealership where you (insert purchased/leased) your vehicle?
46% visited the dealership they purchased /
leased from 1 time
46%
32%
15%
7%
44%
31%
17%
8%
47%
32%
15%
6%
Total New (A) Used (B)
1.9 1.9 1.8
On Average:
52%
only test drive 1 vehicle at the dealership where they purchased
11%
53%
22%
14% 18%
50%
22%
10% 9%
53%
23%
15% A B
1.4 1.3 1.5
On Average:
0 1 2 3+ 1 2 3 4+

Source: 2016 Car Buyer Journey provided by Autotrader and Kelley Blue Book
16
Third-Party Sites are central to the online
shopping experience.

Source: 2016 Car Buyer Journey provided by Autotrader and Kelley Blue Book
17
Buyers spend most of their time on third-party sites.
Letters indicate significant differences between groups at the 95% confidence interval
Base: Total (n=1,599, MOE +/- 2.5%), New (n=957, MOE +/- 3.2%), Used (n=642, MOE +/- 3.9%)
Q1520. Approximately how much time did you spend…
Q6a. Please select the names of the specific website(s)/apps that you used
Q7. Earlier you said that you spent (insert hours from Q1520 a-b) researching vehicles on the Internet or mobile apps. Approximately how much time did you spend on each?
Time Spent Researching and Shopping Online – Website Category (TOTAL VS. NEW VS. USED, AMONG INTERNET USERS)
Time %
Total Time Time %
Total Time Time %
Total Time
TOTAL NEW (A)
USED (B)
Researching &
Shopping Online 59%
% Total Time Time
% Total Time Time
% Total Time Time
8:42 60% A 55% 7:06 9:18 A
Third-Party
Sites 65% A 45% 3:12 6:06 A 60% 5:12
Dealership Sites 16% 1:24 15% 17% 1:12 1:24
OEM Sites 9% 0:47 6% 20% B 1:24 B 0:31

Source: 2016 Car Buyer Journey provided by Autotrader and Kelley Blue Book
18
Buyers use third-party sites more than other sites.
Letters indicate significant differences between groups at the 95% confidence interval
Base: Total (n=1,856, MOE +/- 2.3%), New (n=1,090, MOE +/- 3.0%), Used (n=766, MOE +/- 3.5%)
Q6a. Please select the names of the specific website(s)/apps that you used
Online Sources Used to Research & Shop (TOTAL VS. NEW VS. USED, AMONG INTERNET USERS)
78%
57%
36%
74%
57%
54%
80%
57%
29%
Third-Party Sites
Dealership
OEM Sites
A
B
Total New (A) Used (B)

Source: 2016 Car Buyer Journey provided by Autotrader and Kelley Blue Book
19
Buyers find third-party sites to be the most useful.
Letters indicate significant differences between groups at the 95% confidence interval
Base: Total (n=1,690, MOE +/- 2.4%), New (n=986, MOE +/- 3.1%), Used (n=704, MOE +/- 3.7%)
Q6d. Of all the websites/apps you visited, while shopping, which one did you find to be most useful?
Most Useful Category of Sites (TOTAL VS. NEW VS. USED, AMONG INTERNET USERS)
56%
25%
12%
1%
3%
3%
43%
24%
25%
1%
3%
4%
60%
26%
6%
1%
4%
3%
Third-Party Sites
Dealership
OEM Sites
Social Media
Other
None of theseTotal New (A) Used (B)
A
B

Source: 2016 Car Buyer Journey provided by Autotrader and Kelley Blue Book
20
Cox Automotive owns the dominant
properties in the market, but there are competitors that can take additional share.
Source: 2016 Car Buyer Journey provided by Autotrader and Kelley Blue Book
21
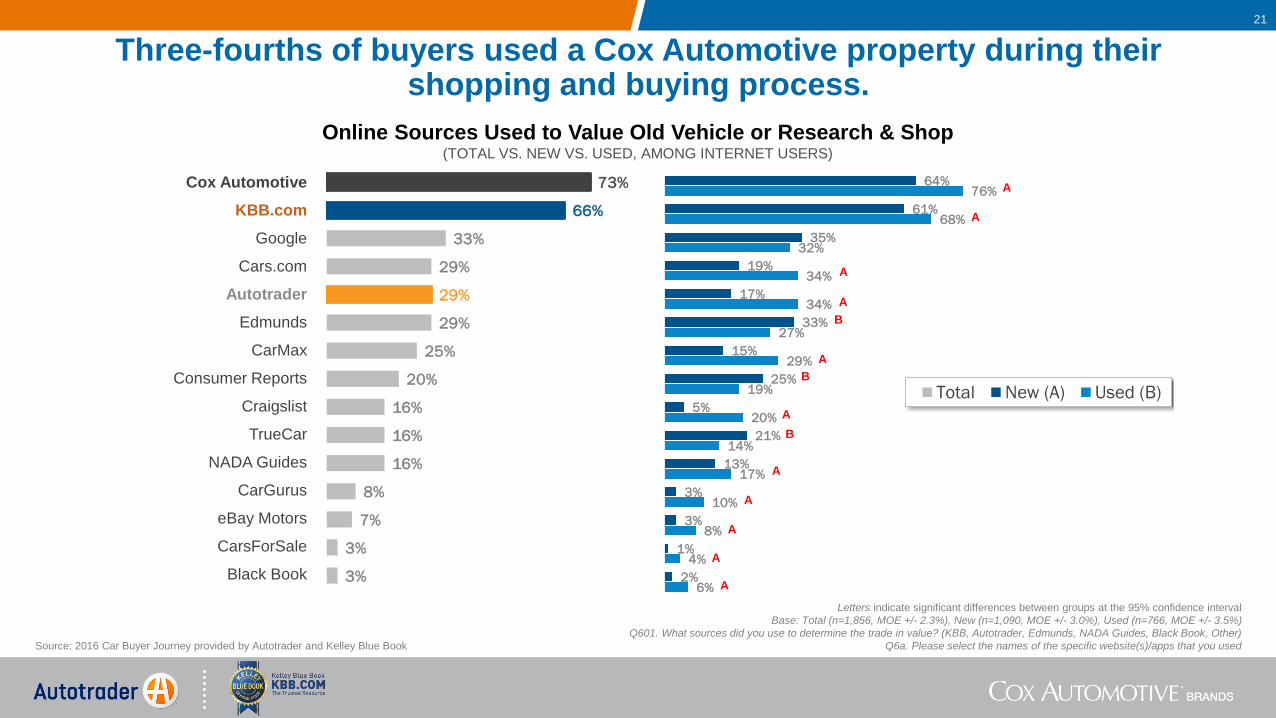
Three-fourths of buyers used a Cox Automotive property during their shopping and buying process.
Online Sources Used to Value Old Vehicle or Research & Shop (TOTAL VS. NEW VS. USED, AMONG INTERNET USERS)
Letters indicate significant differences between groups at the 95% confidence interval
Base: Total (n=1,856, MOE +/- 2.3%), New (n=1,090, MOE +/- 3.0%), Used (n=766, MOE +/- 3.5%)
Q601. What sources did you use to determine the trade in value? (KBB, Autotrader, Edmunds, NADA Guides, Black Book, Other)
Q6a. Please select the names of the specific website(s)/apps that you used
73%
66%
33%
29%
29%
29%
25%
20%
16%
16%
16%
8%
7%
3%
3%
Cox Automotive
KBB.com
Cars.com
Autotrader
Edmunds
CarMax
Consumer Reports
Craigslist
TrueCar
NADA Guides
CarGurus
eBay Motors
CarsForSale
Black Book
64%
61%
35%
19%
17%
33%
15%
25%
5%
21%
13%
3%
3%
1%
2%
76%
68%
32%
34%
34%
27%
29%
19%
20%
14%
17%
10%
8%
4%
6%
A
A
A
A
A
B
B
A
A
A
B
A
A
A
Total New (A) Used (B)
Source: 2016 Car Buyer Journey provided by Autotrader and Kelley Blue Book
22
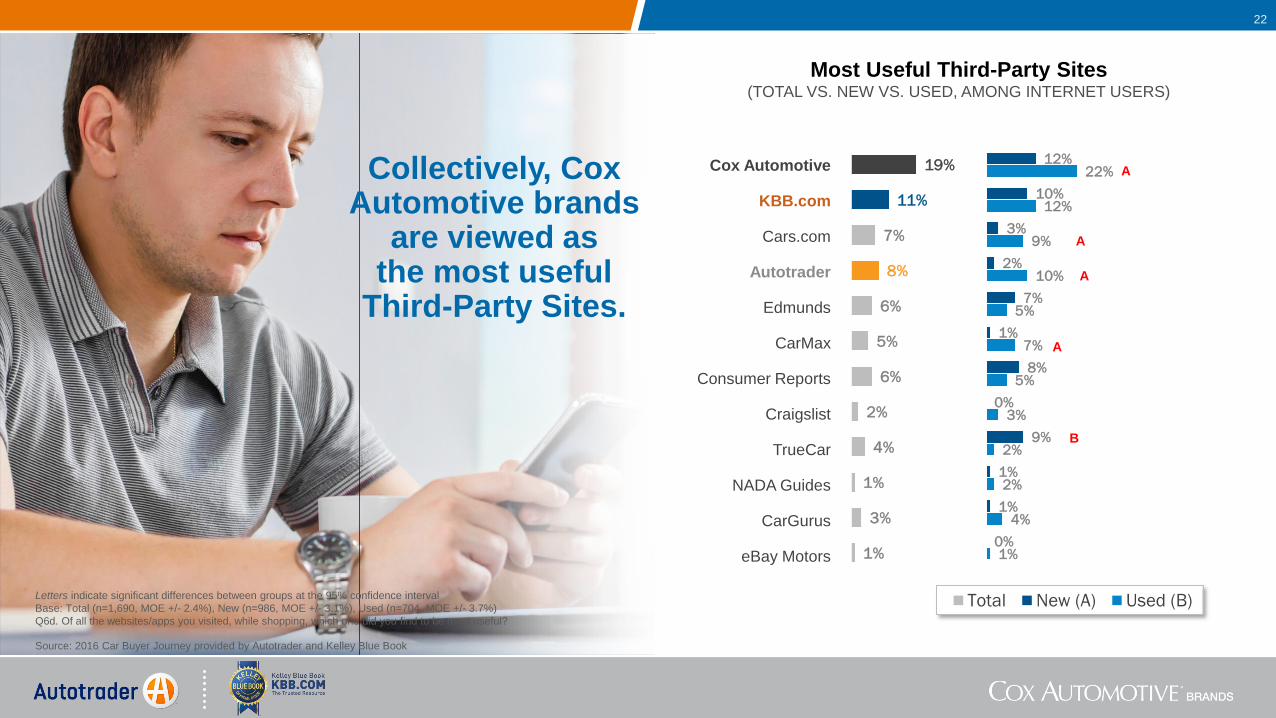
Collectively, Cox Automotive brands
are viewed as the most useful
Third-Party Sites.
Most Useful Third-Party Sites (TOTAL VS. NEW VS. USED, AMONG INTERNET USERS)
Letters indicate significant differences between groups at the 95% confidence interval
Base: Total (n=1,690, MOE +/- 2.4%), New (n=986, MOE +/- 3.1%), Used (n=704, MOE +/- 3.7%)
Q6d. Of all the websites/apps you visited, while shopping, which one did you find to be most useful?
19%
11%
7%
8%
6%
5%
6%
2%
4%
1%
3%
1%
Cox Automotive
KBB.com
Cars.com
Autotrader
Edmunds
CarMax
Consumer Reports
Craigslist
TrueCar
NADA Guides
CarGurus
eBay Motors
12%
10%
3%
2%
7%
1%
8%
0%
9%
1%
1%
0%
22%
12%
9%
10%
5%
7%
5%
3%
2%
2%
4%
1%
A
A
A
A
B
Total New (A) Used (B)

Source: 2016 Car Buyer Journey provided by Autotrader and Kelley Blue Book
23
Buyers find the Cox Automotive brand’s mobile sites to be the most useful while shopping.
Most Useful Third-Party Sites (MOBILE GROUPS, AMONG INTERNET USERS)
Letters indicate significant differences between groups at the 95% confidence interval
Base: Mobile Only (n=200, MOE +/- 6.9%), Heavy Mobile (n=335, MOE +/- 5.4%), Light Mobile (n=379, MOE +/- 5.0%), Desktop Only (n=657, MOE +/- 3.8%)
Q6d. Of all the websites/apps you visited, while shopping, which one did you find to be most useful?
Cox Automotive 28% CD 21% D 18% 16%
KBB.com 14% 10% 12% 12%
Cars.com 8% 8% 8% 7%
Autotrader 14% CD 11% D 7% D 4%
Edmunds 4% 4% 7% 7%
CarMax 8% C 8% C 3% 6% C
Consumer Reports 2% 6% A 8% A 6%
Craigslist 5% BD 1% 3% B 2%
TrueCar 4% 3% 7% BD 4%
NADA Guides 2% 3% D 1% 1%
CarGurus 5% D 4% D 3% 2%
eBay Motors -- -- 1% 1%
Mobile Only (A)
Heavy Mobile (B)
Light Mobile (C)
Desktop Only (D)

Source: 2016 Car Buyer Journey provided by Autotrader and Kelley Blue Book
24
While most are satisfied with their overall vehicle purchase experience, the
dealership experience can be further improved.

25
76% 68% 70% B
Source: 2016 Car Buyer Journey provided by Autotrader and Kelley Blue Book
Letters indicate significant differences between groups at the 95% confidence interval
Base: Total (n=1,734, MOE +/- 2.4%), New (n=1,124, MOE +/- 2.9%), Used (n=610, MOE +/- 4.0%)
Q602. Thinking back to your overall shopping experience, how satisfied were you with your shopping experience?
Satisfaction With Overall Shopping Experience (TOTAL VS. NEW VS. USED, % 8-10 RATING)
NEW (A)
USED (B)
TOTAL
New vehicle buyers are more satisfied with their shopping experience.

Source: 2016 Car Buyer Journey provided by Autotrader and Kelley Blue Book
26
Buyers are most satisfied with the test driving process and least satisfied with the process time and finance interactions.
Satisfaction with Different Steps in the Purchase Process (TOTAL VS. NEW VS. USED, AMONG THOSE WHO PURCHASED / LEASED FROM A DEALERSHIP, %8-10 RATING)
Letters indicate significant differences between groups at the 95% confidence interval
Base: Total (n=1,734, MOE +/- 2.4%), New (n=1,124, MOE +/- 2.9%), Used (n=610, MOE +/- 4.0%)
Q102. How satisfied were you with each of the following? Please you a scale from 1 to 10 where 10 means ‘Extremely
satisfied” and 1 means “Not at all satisfied”
Your overall experience
with the DEALERSHIP 76% 79% B 74%
The test driving process 81% 82% 80%
Interactions with the
dealership sales people 77% 81% B 75%
Interactions with the
financing department 67% 69% 65%
How long the process took 56% 56% 57%
TOTAL NEW (A)
USED (B)

Source: 2016 Car Buyer Journey provided by Autotrader and Kelley Blue Book
27
Over ½ of the time at the dealership is spent on Negotiation and Paperwork.
Letters indicate significant differences between groups at the 95% confidence interval
Base: Total (n=1,599, MOE +/- 2.5%), New (n=957, MOE +/- 3.2%), Used (n=642, MOE +/- 3.9%)
Q1520. Approximately how much time did you spend…
Q1521. Now please think about the (insert time from Q1520_g) that you spent with the dealership or private seller where you purchased or leased your vehicle. Approximately how much time did you spend…
Time Spent Researching & Shopping Online – Website Category (TOTAL VS. NEW VS. USED, AMONG INTERNET USERS)
Time % Time
@ Dealer Time % Time
@ Dealer Time % Time
@ Dealer
TOTAL NEW (A)
USED (B)
With the Dealership/ Seller
where Purchased 21%
% Total Time Time
% Total Time Time
% Total Time Time
3:06 20% 24% B 3:06 3:00 A
Looking at vehicles & talking
with sales people 30% 30% 0:55 0:53 29% 0:54
Test driving vehicles 16% 0:30 17% 13% 0:25 0:31
Negotiating a price and trade-in offer 22% 0:41 19% 24% 0:45 0:35
Discussing and signing paperwork 33% 1:01 34% 33% 1:01 1:01

Source: 2016 [Study Name] provided by [Business Unit]
28
Satisfaction decreases as time spent at the dealership increases … and as they interact with more personnel.
85% 83% 76%
70%
66%
0%
10%
20%
30%
40%
50%
60%
70%
80%
90%
100%
1 Hour or less
More than
1 hour to 2
More than
2 hours to 3
More than
3 Hours to 4
More than 4 Hours
SA
TIS
FA
CT
ION
50%
55%
60%
65%
70%
75%
80%
85%
90%
95%
100%
1 2 3 4+
Number of people interacted with at dealership
79% 79%
67%
61%
Q1520. Approximately how much time did you spend…
q102_5. Overall dealership experience (How satisfied were you with each of the following? Please use a scale from 1 to 10
where 10 means 'Extremely satisfied' and 1 means 'Not at all satisfied')

It is vitally important to continue to improve the
mobile experience, particularly for Millennials
and GenX.
Source: 2016 Car Buyer Journey provided by Autotrader and Kelley Blue Book
29

Source: 2016 Car Buyer Journey provided by Autotrader and Kelley Blue Book
30
Just under half of Buyers used multiple devices while shopping for their vehicle.
Letters indicate significant differences between groups at the 95% confidence interval
Base: Q99 - Total (n=1,869, MOE +/- 2.3%), New (n=1,098, MOE +/- 3.0%), Used (n=771, MOE +/- 3.5%)
Q99. Prior to purchasing your vehicle, which of the following devices did you use to access automotive
information, either through the Internet or by using a mobile device?
83%
46%
31% Tablet
Desktop/ Laptop
Smartphone
46% Use Multiple Devices
While Shopping (46% New, 46% Used)
14% ONLY Used a Mobile Device
While Shopping (14% New, 14% Used)

Source: 2016 Car Buyer Journey provided by Autotrader and Kelley Blue Book
31
1-in-5 Millennials and 1-in-4 GenX Buyers ONLY used a mobile device to shop.
Millennial
(18-34)
(A)
Gen X
(35-44)
(B)
Boomer
(45-64)
(C)
Pre-Boomer
(65+)
(D)
Multiple Devices 52% D 58% CD 45% D 31%
Mobile Only 20% CD* 24% CD 11% 8%
Base: Younger Millennial (n=57, MOE +/- 13.0%), Older Millennial (n=292, MOE +/- 5.7%), Millennial
(n=349, MOE +/- 5.2%), Gen X (n=347, MOE +/- 5.3%), Boomer (n=852, MOE +/- 3.4%), Pre-Boomer
(n=321, MOE +/- 5.5%)
Q99. Which of the following devices did you use to help you during the researching and shopping process?
Used Only Mobile or Multiple Devices (MILLENNIAL GROUPS AND GENERATIONS, AMONG INTERNET USERS)

Source: 2016 Car Buyer Journey provided by Autotrader and Kelley Blue Book
32
Millennials and GenX buyers spend nearly half of their time online on a mobile device.
Millennial
(18-34)
(A)
Gen X
(35-44)
(B)
Boomer
(45-64)
(C)
Pre-Boomer
(65+)
(D)
Desktop/Laptop
Users 54% 50% 67% AB 77% ABC
Smartphone
Users 31% CD 32% CD 15% D 7%
Tablet Users 15% 17% 17% 15%
Percentage of Time Researching Online Allocated to Each Device (MILLENNIAL GROUPS AND GENERATIONS, AMONG INTERNET USERS)
Base: Younger Millennial (n=186, MOE +/- 7.2%), Older Millennial (n=292, MOE +/- 5.9%), Millennial (n=281, MOE +/- 5.9%), Gen X (n=295, MOE +/- 5.7%), Boomer (n=741, MOE +/- 3.6%), Pre-Boomer (n=282, MOE +/- 5.9%)
Q1406. What percentage of time researching did you allocate to each source?

Source: 2016 Car Buyer Journey provided by Autotrader and Kelley Blue Book
33
Did They Use A Mobile Device At The Dealership? (TOTAL VS. NEW VS. USED)
Across all buyers, 1-in-4 used a mobile device at the dealership.
Letters indicate significant differences between groups at the 95% confidence interval
Base: Total (n=835, MOE +/- 3.4%), New (n=459, MOE +/- 4.6%), Used (n=376, MOE +/- 5.1%)
Q1407. Did you use your smartphone to do research or shop while you were at any dealership?
of ALL buyers used a smartphone
at a dealership.
(19% New, 24% Used)
of those used a smartphone to
shop used it at a dealership.
(55% New, 57% Used)
23%
56%
Source: 2016 Car Buyer Journey provided by Autotrader and Kelley Blue Book
34
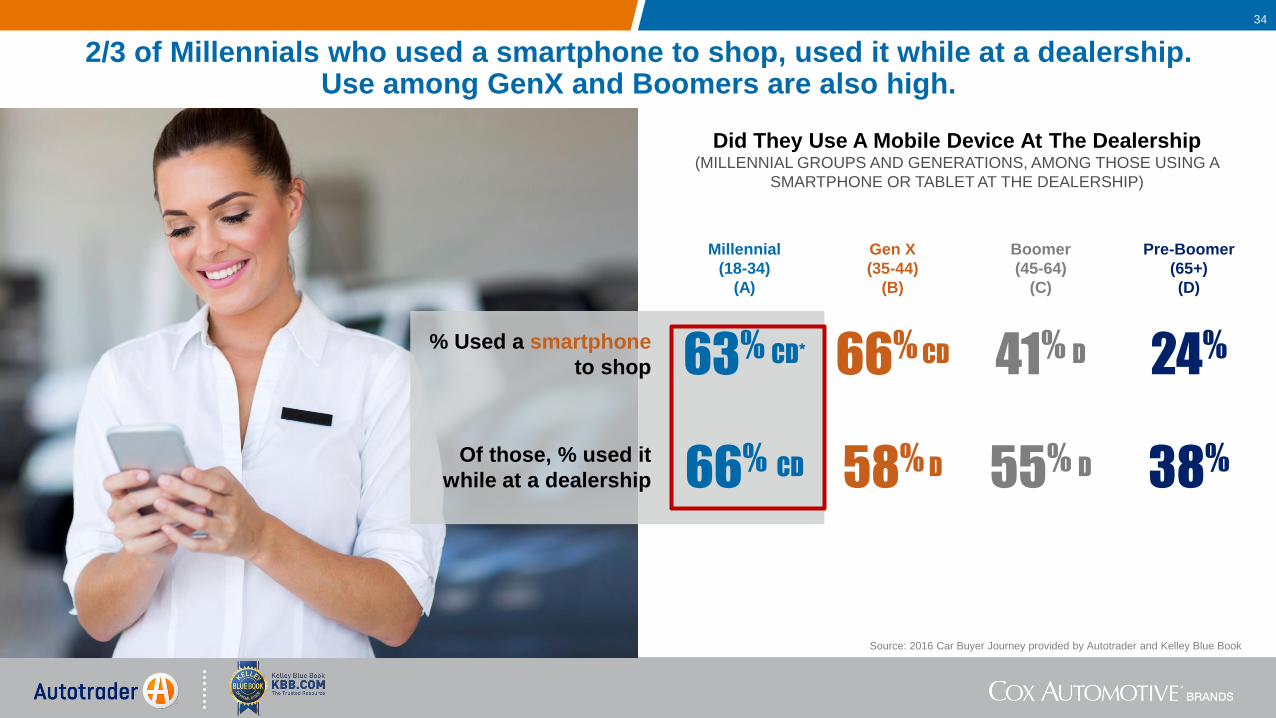
2/3 of Millennials who used a smartphone to shop, used it while at a dealership. Use among GenX and Boomers are also high.
Millennial
(18-34)
(A)
Gen X
(35-44)
(B)
Boomer
(45-64)
(C)
Pre-Boomer
(65+)
(D)
% Used a smartphone
to shop 63% CD* 66% CD 41% D 24%
Of those, % used it
while at a dealership 66% CD 58% D 55% D 38%
Did They Use A Mobile Device At The Dealership (MILLENNIAL GROUPS AND GENERATIONS, AMONG THOSE USING A
SMARTPHONE OR TABLET AT THE DEALERSHIP)

Source: 2016 Car Buyer Journey provided by Autotrader and Kelley Blue Book
35
What Did They Use Their Mobile Devices For At The Dealership (TOTAL VS. NEW VS. USED, AMONG THOSE USING A SMARTPHONE OR TABLET AT THE DEALERSHIP)
Those using mobile devices at the dealership are comparing prices at other dealerships.
Letters indicate significant differences between groups at the 95% confidence interval
Base: Total (n=516, MOE +/- 4.3%), New (n=282, MOE +/- 5.8%), Used (n=234, MOE +/- 6.4%)
Q1507. Which of the following, if any, did you use your tablet/smartphone to access while you were at the dealership?
61%
43%
37%
38%
33%
32%
15%
21%
18%
16%
8%
53%
37%
41%
31%
32%
33%
41%
22%
20%
14%
8%
59%
41%
38%
36%
33%
32%
22%
21%
18%
15%
8%
Compare prices for vehicles at other dealerships
Find prices for vehicles at the dealership where I was
Compare inventory at other dealerships
Check inventory at the dealership where I was
Research trade-in pricing
Completed activities unrelated to car shopping
Research incentives and special offers
Check out dealership ratings and review
Checked finances and/or loan information
Research financing
Complete dealership paperwork
B
TOTAL NEW (A)
USED (B)