2016 bc international education intelligence report release · 2016 bc international education...
TRANSCRIPT
ICG © 2016 1 BCCIE 2016: BC Intelligence Report Release – 20 June 2016
The Illuminate Consulting Group 20 June 2016
2016 BC INTERNATIONAL EDUCATION INTELLIGENCE REPORT RELEASE
BCCIE Summer Seminar
ICG © 2016 2 BCCIE 2016: BC Intelligence Report Release – 20 June 2016
• This presentation was presented by ICG at the BCCIE Summer Seminar in Victoria on 20 June 2016.
• The presentation shall be considered incomplete without oral clarification.
• The opinions expressed in this presentation are those of the authors alone.
• ICG makes no warranty regarding any claim or data presented in this presentation, and does not take any responsibility for any third party acting upon information contained in this presentation.
• This presentation or parts of it may not be amended, copied, or distributed without express written permission by ICG. This presentation is protected under U.S. and WIPRO copyright laws and regulations.
LEGAL DISCLAIMER
ICG © 2016 3 BCCIE 2016: BC Intelligence Report Release – 20 June 2016
Housekeeping Global Student Mobility Trends International Students in British Columbia Perspectives on British Columbia’s Recruiting Markets Student Decision Drivers: Cost, Ranking, Social Media Presence Competitiveness Driver: Pathways Outlook: British Columbia in 2018 Discussion
CONTENTS
ICG © 2016 4 BCCIE 2016: BC Intelligence Report Release – 20 June 2016
HOUSEKEEPING
• This presentation is geared for about 40 minutes. • About 20 minutes are allocated for discussion.
• The presentation will be made available through BCCIE
and ICG.
• The 2016 Canada International Education Intelligence is available from BCCIE (print) and ICG (PDF).
• Please see www.icg.ac for the presentation and report.
ICG © 2016 5 BCCIE 2016: BC Intelligence Report Release – 20 June 2016
Housekeeping Global Student Mobility Trends International Students in British Columbia Perspectives on British Columbia’s Recruiting Markets Student Decision Drivers: Cost, Ranking, Social Media Presence Competitiveness Driver: Pathways Outlook: British Columbia in 2018 Discussion
CONTENTS
ICG © 2016 6 BCCIE 2016: BC Intelligence Report Release – 20 June 2016
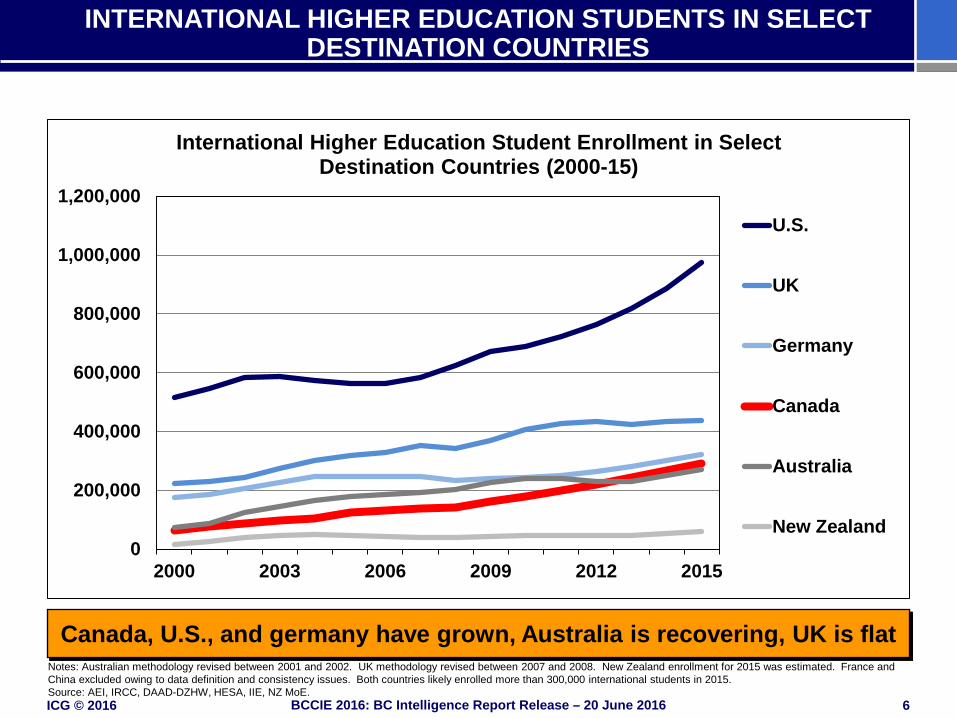
Notes: Australian methodology revised between 2001 and 2002. UK methodology revised between 2007 and 2008. New Zealand enrollment for 2015 was estimated. France and China excluded owing to data definition and consistency issues. Both countries likely enrolled more than 300,000 international students in 2015. Source: AEI, IRCC, DAAD-DZHW, HESA, IIE, NZ MoE.
Canada, U.S., and germany have grown, Australia is recovering, UK is flat
0
200,000
400,000
600,000
800,000
1,000,000
1,200,000
2000 2003 2006 2009 2012 2015
International Higher Education Student Enrollment in Select Destination Countries (2000-15)
U.S.
UK
Germany
Canada
Australia
New Zealand
INTERNATIONAL HIGHER EDUCATION STUDENTS IN SELECT DESTINATION COUNTRIES
ICG © 2016 7 BCCIE 2016: BC Intelligence Report Release – 20 June 2016
INTERNATIONAL HIGHER EDUCATION STUDENTS IN SELECT DESTINATION COUNTRIES
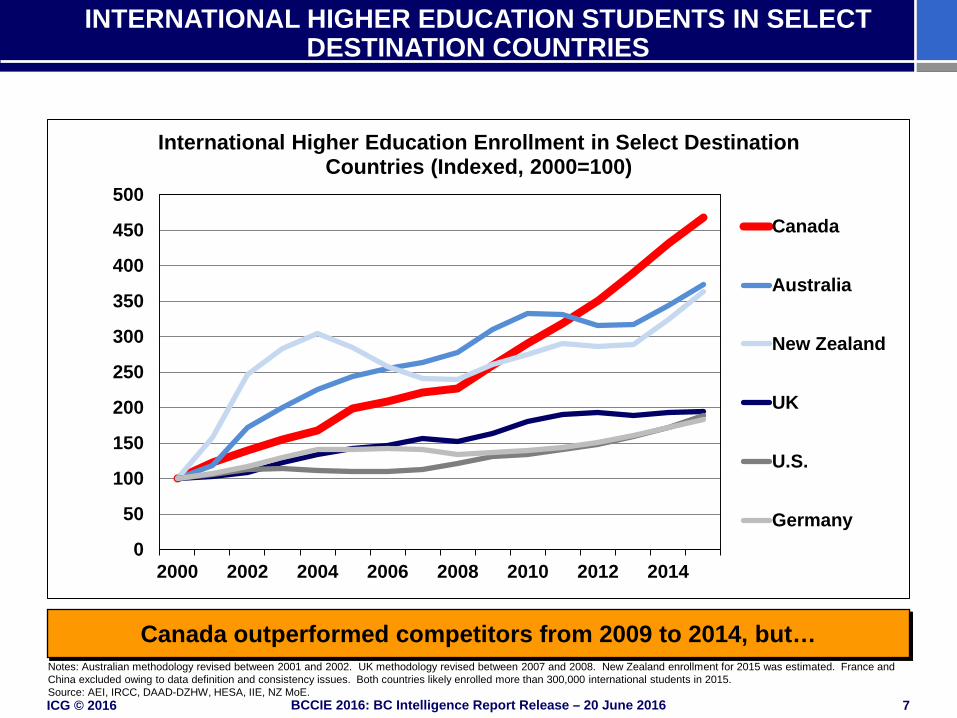
Canada outperformed competitors from 2009 to 2014, but…
0
50
100
150
200
250
300
350
400
450
500
2000 2002 2004 2006 2008 2010 2012 2014
International Higher Education Enrollment in Select Destination Countries (Indexed, 2000=100)
Canada
Australia
New Zealand
UK
U.S.
Germany
Notes: Australian methodology revised between 2001 and 2002. UK methodology revised between 2007 and 2008. New Zealand enrollment for 2015 was estimated. France and China excluded owing to data definition and consistency issues. Both countries likely enrolled more than 300,000 international students in 2015. Source: AEI, IRCC, DAAD-DZHW, HESA, IIE, NZ MoE.
ICG © 2016 8 BCCIE 2016: BC Intelligence Report Release – 20 June 2016
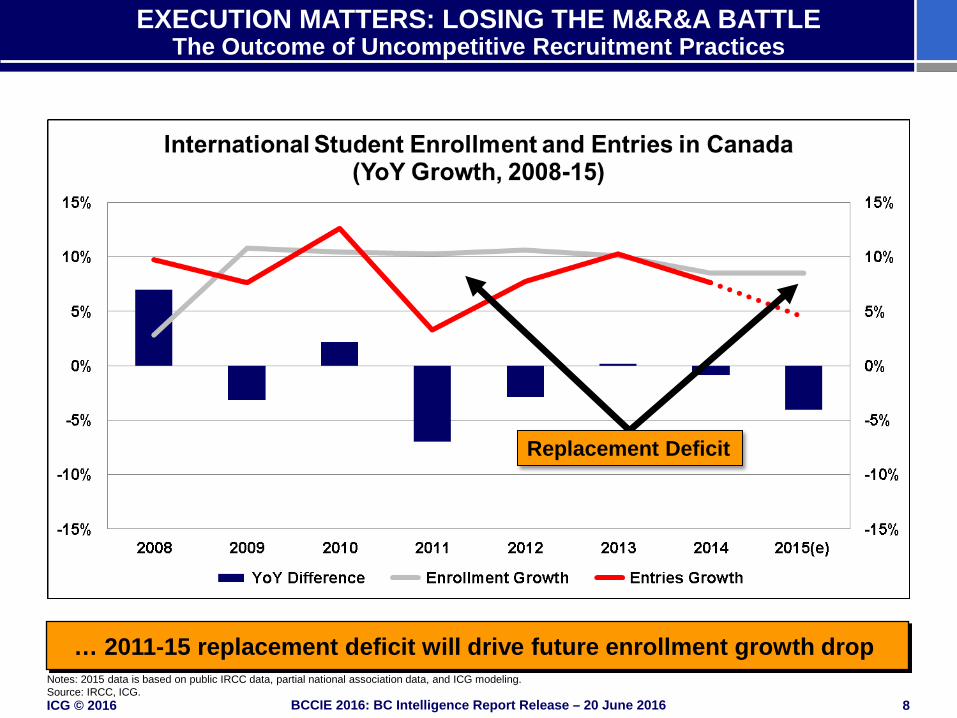
EXECUTION MATTERS: LOSING THE M&R&A BATTLE The Outcome of Uncompetitive Recruitment Practices
… 2011-15 replacement deficit will drive future enrollment growth drop Notes: 2015 data is based on public IRCC data, partial national association data, and ICG modeling. Source: IRCC, ICG.
Replacement Deficit
ICG © 2016 9 BCCIE 2016: BC Intelligence Report Release – 20 June 2016
COMMENTARY ON GLOBAL STUDENT MOBILITY TRENDS IN THE CANADIAN CONTEXT
• Canada become a key destination country over the last decade.
• Growth between 2008 and 2014 was high and sustained.
• The intake pipeline started to weaken in 2011.
• By 2015, Canada entered a new market position phase.
ICG © 2016 10 BCCIE 2016: BC Intelligence Report Release – 20 June 2016
Housekeeping Global Student Mobility Trends International Students in British Columbia Perspectives on British Columbia’s Recruiting Markets Student Decision Drivers: Cost, Ranking, Social Media Presence Competitiveness Driver: Pathways Outlook: British Columbia in 2018 Discussion
CONTENTS

ICG © 2016 11 BCCIE 2016: BC Intelligence Report Release – 20 June 2016
INTERNATIONAL STUDENTS IN BRITISH COLUMBIA International Student Enrollment by Province
BC hosts the second-largest international student population in Canada
0
50,000
100,000
150,000
200,000
250,000
300,000
350,000
2004 2005 2006 2007 2008 2009 2010 2011 2012 2013 2014
International Student Enrollment in Canada by Province, All Sectors (2004-14)
P.E.I.
Newfoundland
New Brunswick
Saskatchewan
Manitoba
Nova Scotia
Alberta
Quebec
British Columbia
Ontario
Notes: Includes all levels of study. Northwest Territories, Nunavut, and Yukon not displayed. Source: IRCC.
ICG © 2016 12 BCCIE 2016: BC Intelligence Report Release – 20 June 2016
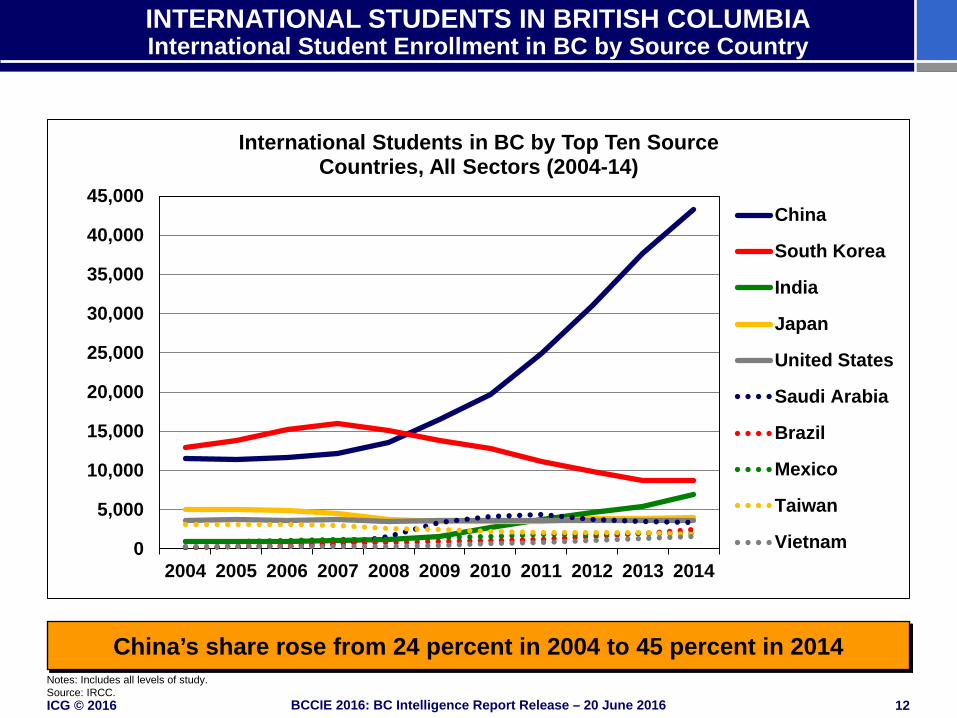
INTERNATIONAL STUDENTS IN BRITISH COLUMBIA International Student Enrollment in BC by Source Country
China’s share rose from 24 percent in 2004 to 45 percent in 2014
0
5,000
10,000
15,000
20,000
25,000
30,000
35,000
40,000
45,000
2004 2005 2006 2007 2008 2009 2010 2011 2012 2013 2014
International Students in BC by Top Ten Source Countries, All Sectors (2004-14)
China
South Korea
India
Japan
United States
Saudi Arabia
Brazil
Mexico
Taiwan
Vietnam
Notes: Includes all levels of study. Source: IRCC.
ICG © 2016 13 BCCIE 2016: BC Intelligence Report Release – 20 June 2016
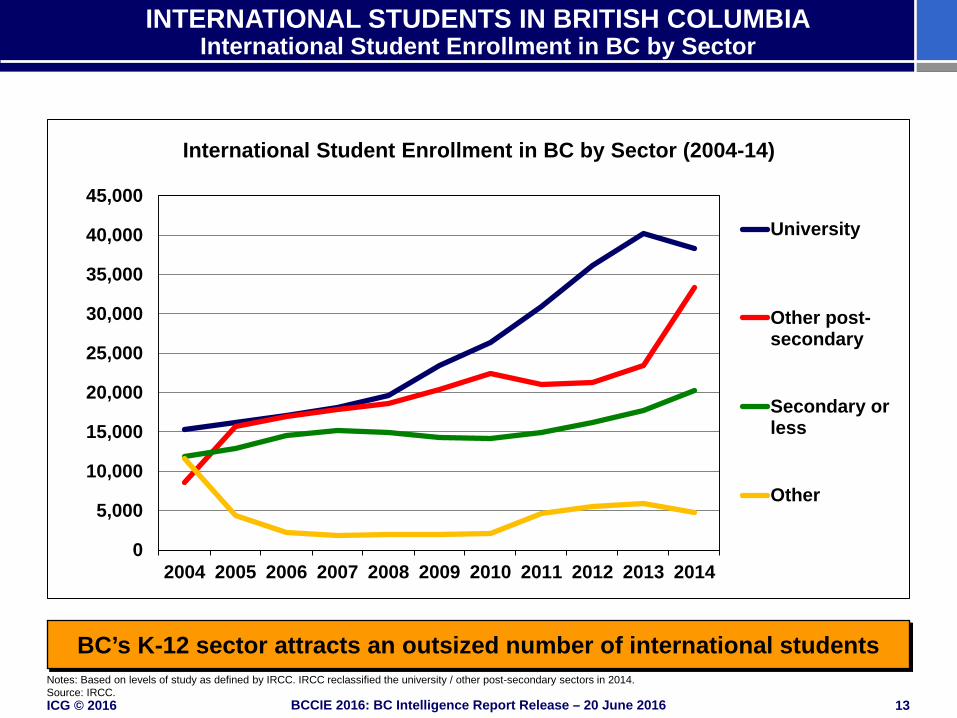
INTERNATIONAL STUDENTS IN BRITISH COLUMBIA International Student Enrollment in BC by Sector
BC’s K-12 sector attracts an outsized number of international students
0
5,000
10,000
15,000
20,000
25,000
30,000
35,000
40,000
45,000
2004 2005 2006 2007 2008 2009 2010 2011 2012 2013 2014
International Student Enrollment in BC by Sector (2004-14)
University
Other post-secondary
Secondary orless
Other
Notes: Based on levels of study as defined by IRCC. IRCC reclassified the university / other post-secondary sectors in 2014. Source: IRCC.
ICG © 2016 14 BCCIE 2016: BC Intelligence Report Release – 20 June 2016
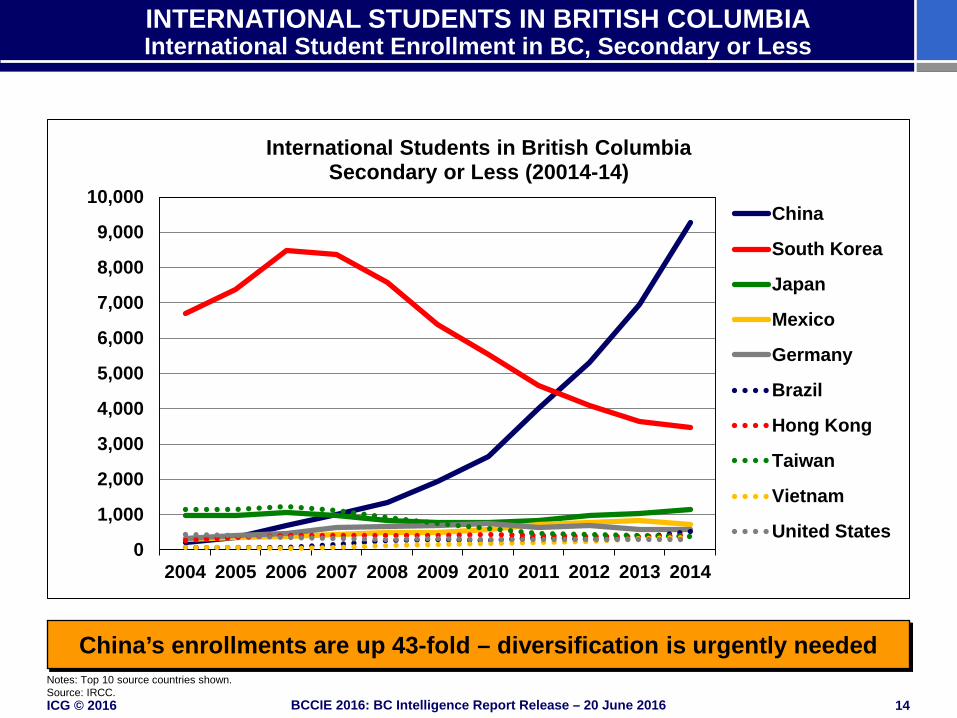
INTERNATIONAL STUDENTS IN BRITISH COLUMBIA International Student Enrollment in BC, Secondary or Less
China’s enrollments are up 43-fold – diversification is urgently needed
0
1,000
2,000
3,000
4,000
5,000
6,000
7,000
8,000
9,000
10,000
2004 2005 2006 2007 2008 2009 2010 2011 2012 2013 2014
International Students in British Columbia Secondary or Less (20014-14)
China
South Korea
Japan
Mexico
Germany
Brazil
Hong Kong
Taiwan
Vietnam
United States
Notes: Top 10 source countries shown. Source: IRCC.
ICG © 2016 15 BCCIE 2016: BC Intelligence Report Release – 20 June 2016
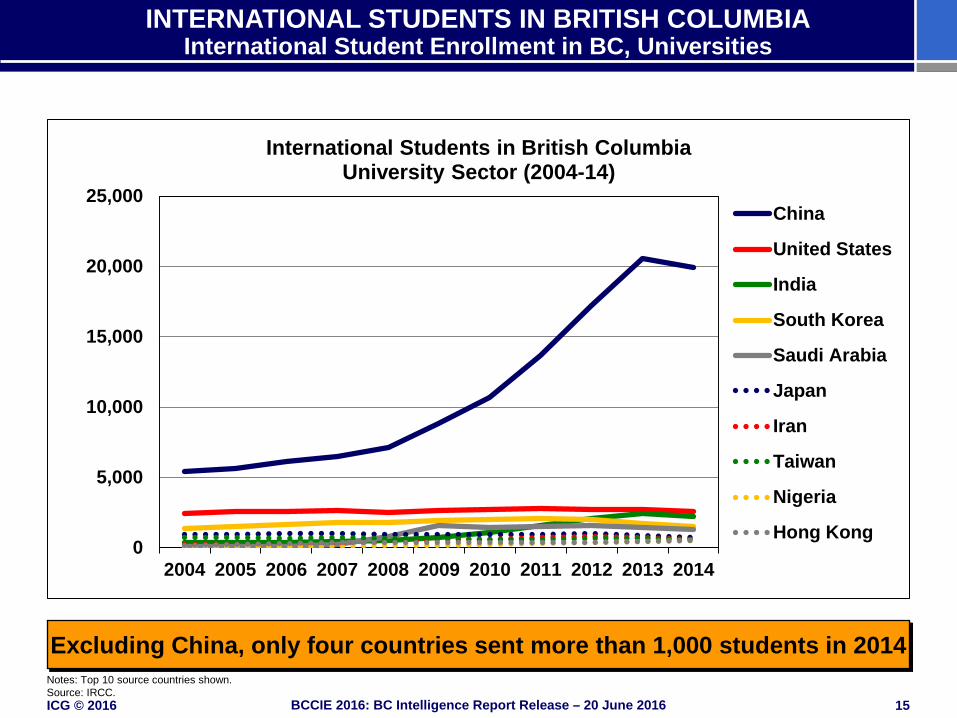
INTERNATIONAL STUDENTS IN BRITISH COLUMBIA International Student Enrollment in BC, Universities
Excluding China, only four countries sent more than 1,000 students in 2014 Notes: Top 10 source countries shown. Source: IRCC.
0
5,000
10,000
15,000
20,000
25,000
2004 2005 2006 2007 2008 2009 2010 2011 2012 2013 2014
International Students in British Columbia University Sector (2004-14)
China
United States
India
South Korea
Saudi Arabia
Japan
Iran
Taiwan
Nigeria
Hong Kong
ICG © 2016 16 BCCIE 2016: BC Intelligence Report Release – 20 June 2016
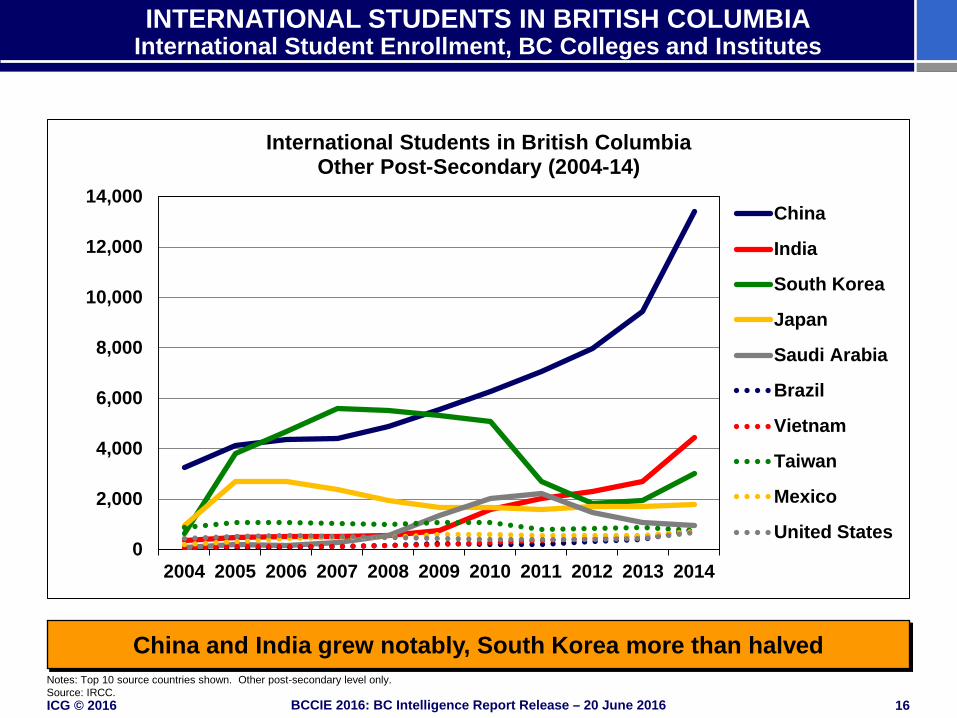
INTERNATIONAL STUDENTS IN BRITISH COLUMBIA International Student Enrollment, BC Colleges and Institutes
China and India grew notably, South Korea more than halved Notes: Top 10 source countries shown. Other post-secondary level only. Source: IRCC.
0
2,000
4,000
6,000
8,000
10,000
12,000
14,000
2004 2005 2006 2007 2008 2009 2010 2011 2012 2013 2014
International Students in British Columbia Other Post-Secondary (2004-14)
China
India
South Korea
Japan
Saudi Arabia
Brazil
Vietnam
Taiwan
Mexico
United States
ICG © 2016 17 BCCIE 2016: BC Intelligence Report Release – 20 June 2016
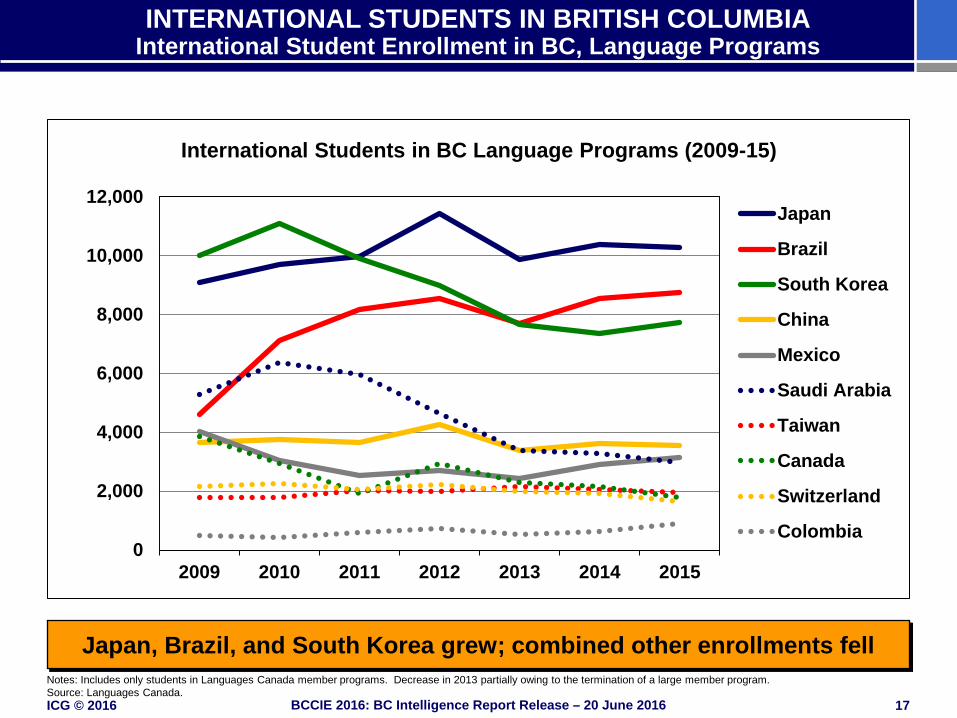
INTERNATIONAL STUDENTS IN BRITISH COLUMBIA International Student Enrollment in BC, Language Programs
Japan, Brazil, and South Korea grew; combined other enrollments fell Notes: Includes only students in Languages Canada member programs. Decrease in 2013 partially owing to the termination of a large member program. Source: Languages Canada.
0
2,000
4,000
6,000
8,000
10,000
12,000
2009 2010 2011 2012 2013 2014 2015
International Students in BC Language Programs (2009-15)
Japan
Brazil
South Korea
China
Mexico
Saudi Arabia
Taiwan
Canada
Switzerland
Colombia
ICG © 2016 18 BCCIE 2016: BC Intelligence Report Release – 20 June 2016
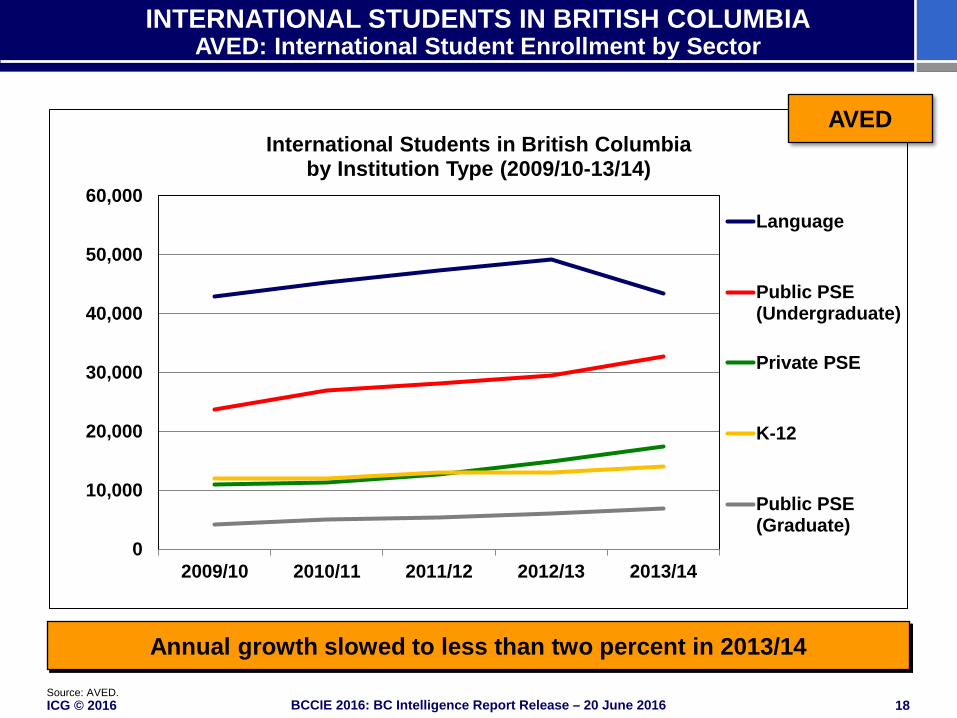
INTERNATIONAL STUDENTS IN BRITISH COLUMBIA AVED: International Student Enrollment by Sector
Annual growth slowed to less than two percent in 2013/14 Source: AVED.
0
10,000
20,000
30,000
40,000
50,000
60,000
2009/10 2010/11 2011/12 2012/13 2013/14
International Students in British Columbia by Institution Type (2009/10-13/14)
Language
Public PSE(Undergraduate)
Private PSE
K-12
Public PSE(Graduate)
AVED
ICG © 2016 19 BCCIE 2016: BC Intelligence Report Release – 20 June 2016
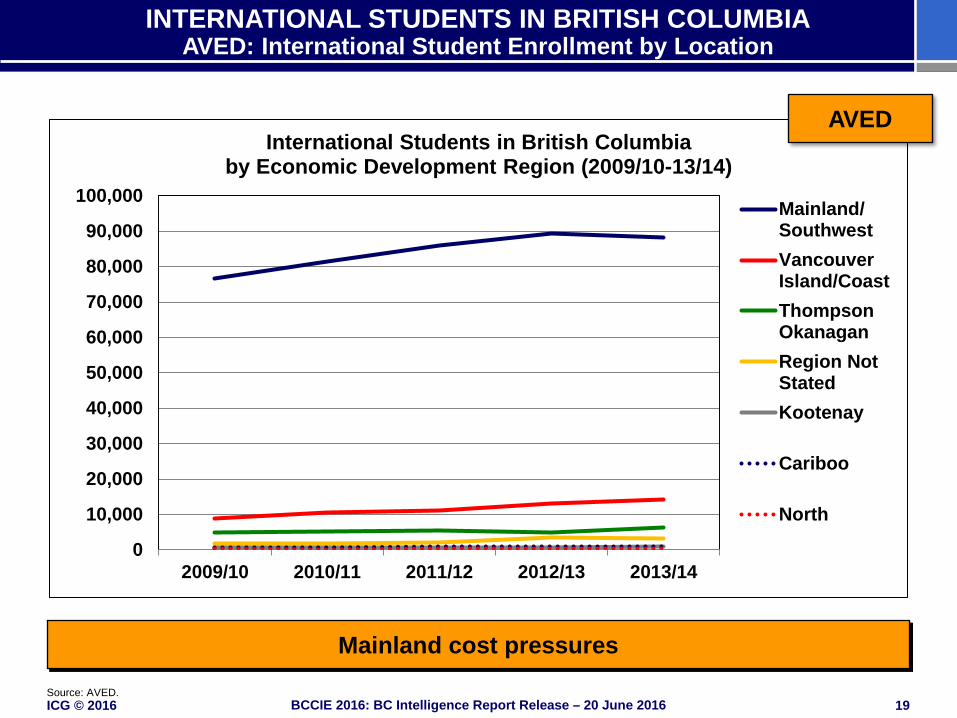
INTERNATIONAL STUDENTS IN BRITISH COLUMBIA AVED: International Student Enrollment by Location
Mainland cost pressures Source: AVED.
0
10,000
20,000
30,000
40,000
50,000
60,000
70,000
80,000
90,000
100,000
2009/10 2010/11 2011/12 2012/13 2013/14
International Students in British Columbia by Economic Development Region (2009/10-13/14)
Mainland/SouthwestVancouverIsland/CoastThompsonOkanaganRegion NotStatedKootenay
Cariboo
North
AVED
ICG © 2016 20 BCCIE 2016: BC Intelligence Report Release – 20 June 2016
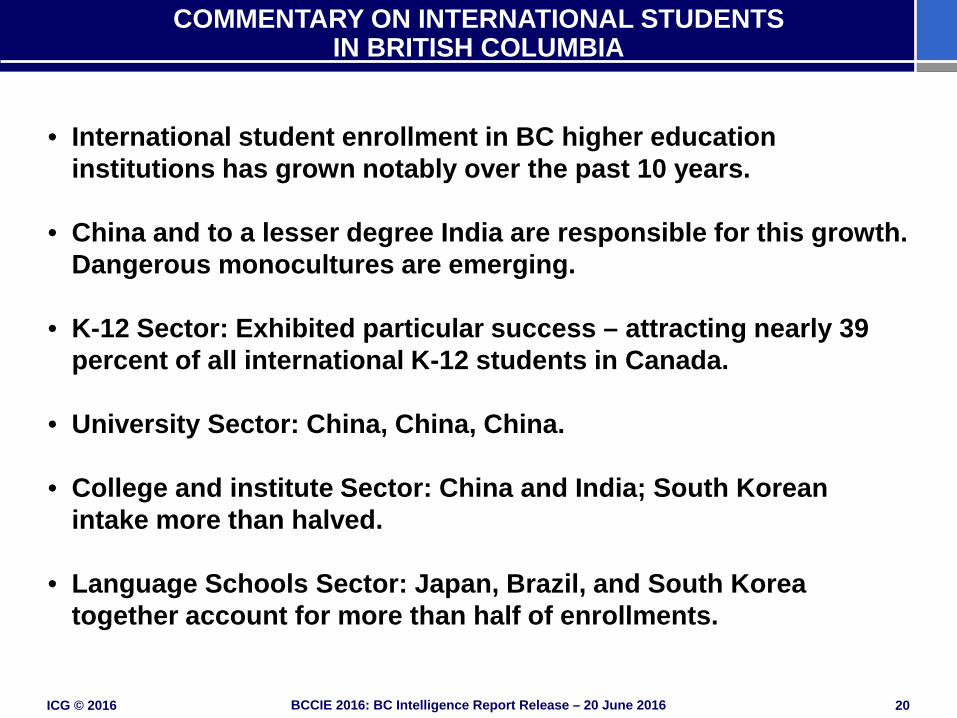
COMMENTARY ON INTERNATIONAL STUDENTS IN BRITISH COLUMBIA
• International student enrollment in BC higher education institutions has grown notably over the past 10 years.
• China and to a lesser degree India are responsible for this growth. Dangerous monocultures are emerging.
• K-12 Sector: Exhibited particular success – attracting nearly 39 percent of all international K-12 students in Canada.
• University Sector: China, China, China.
• College and institute Sector: China and India; South Korean intake more than halved.
• Language Schools Sector: Japan, Brazil, and South Korea together account for more than half of enrollments.
ICG © 2016 21 BCCIE 2016: BC Intelligence Report Release – 20 June 2016
Housekeeping Global Student Mobility Trends International Students in British Columbia Perspectives on British Columbia’s Recruiting Markets Student Decision Drivers: Cost, Ranking, Social Media Presence Competitiveness Driver: Pathways Outlook: British Columbia in 2018 Discussion
CONTENTS
ICG © 2016 22 BCCIE 2016: BC Intelligence Report Release – 20 June 2016
COMPETITION DYNAMICS IN KEY RECRUITING MARKETS Overview
• This section compares higher education enrollments in select destinations of international higher education students from the following recruitment markets:
• China • India • United States • South Korea • Japan
• These comparisons are provided to highlight BC’s competitive
position in some of its key recruitment markets.
• Additionally, they serve to offer a broader view of trends in student flows from these source countries.
ICG © 2016 23 BCCIE 2016: BC Intelligence Report Release – 20 June 2016
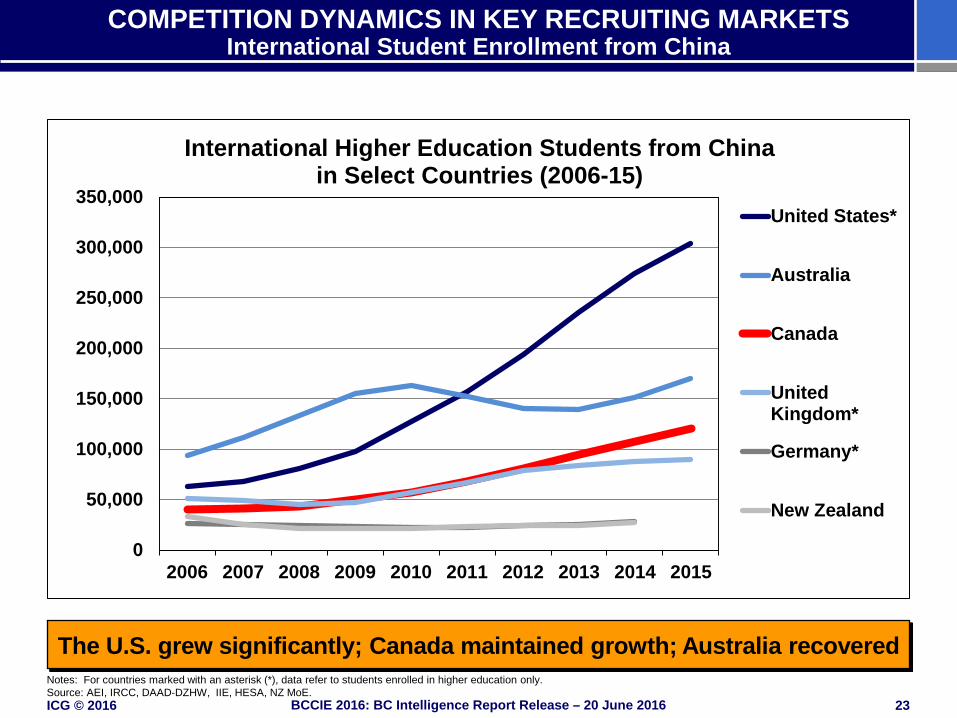
COMPETITION DYNAMICS IN KEY RECRUITING MARKETS International Student Enrollment from China
The U.S. grew significantly; Canada maintained growth; Australia recovered Notes: For countries marked with an asterisk (*), data refer to students enrolled in higher education only. Source: AEI, IRCC, DAAD-DZHW, IIE, HESA, NZ MoE.
0
50,000
100,000
150,000
200,000
250,000
300,000
350,000
2006 2007 2008 2009 2010 2011 2012 2013 2014 2015
International Higher Education Students from China in Select Countries (2006-15)
United States*
Australia
Canada
UnitedKingdom*
Germany*
New Zealand
ICG © 2016 24 BCCIE 2016: BC Intelligence Report Release – 20 June 2016
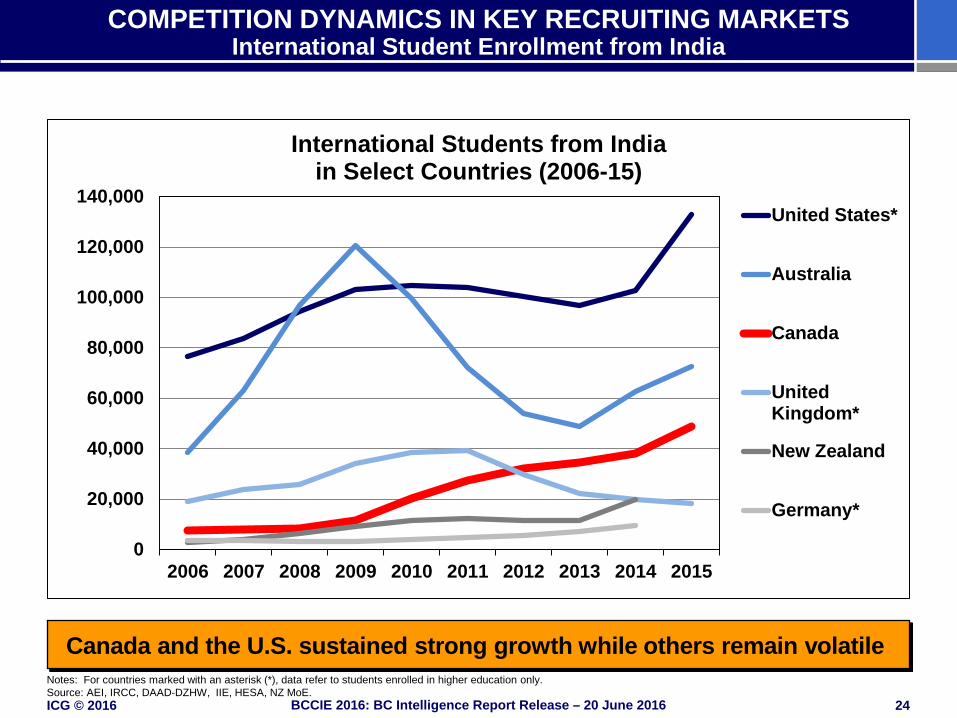
COMPETITION DYNAMICS IN KEY RECRUITING MARKETS International Student Enrollment from India
Canada and the U.S. sustained strong growth while others remain volatile
0
20,000
40,000
60,000
80,000
100,000
120,000
140,000
2006 2007 2008 2009 2010 2011 2012 2013 2014 2015
International Students from India in Select Countries (2006-15)
United States*
Australia
Canada
UnitedKingdom*
New Zealand
Germany*
Notes: For countries marked with an asterisk (*), data refer to students enrolled in higher education only. Source: AEI, IRCC, DAAD-DZHW, IIE, HESA, NZ MoE.

ICG © 2016 25 BCCIE 2016: BC Intelligence Report Release – 20 June 2016
COMPETITION DYNAMICS IN KEY RECRUITING MARKETS International Student Enrollment from the United States
The U.S. remains an underexploited market for Canadian and BC institutions
0
2,000
4,000
6,000
8,000
10,000
12,000
14,000
16,000
18,000
2006 2007 2008 2009 2010 2011 2012 2013 2014 2015
International Students from the U.S. in Select Countries (2006-15)
UnitedKingdom*
Canada
Australia
Germany*
New Zealand
Notes: For countries marked with an asterisk (*), data refer to students enrolled in higher education only. Source: AEI, IRCC, DAAD-DZHW, IIE, HESA, NZ MoE.
ICG © 2016 26 BCCIE 2016: BC Intelligence Report Release – 20 June 2016
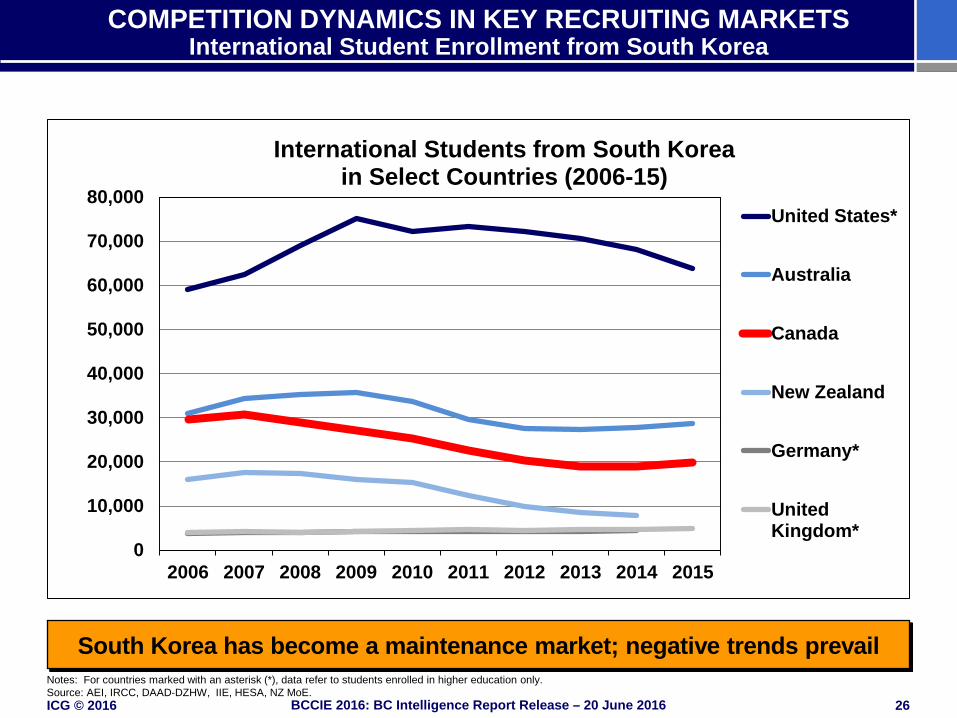
COMPETITION DYNAMICS IN KEY RECRUITING MARKETS International Student Enrollment from South Korea
South Korea has become a maintenance market; negative trends prevail
0
10,000
20,000
30,000
40,000
50,000
60,000
70,000
80,000
2006 2007 2008 2009 2010 2011 2012 2013 2014 2015
International Students from South Korea in Select Countries (2006-15)
United States*
Australia
Canada
New Zealand
Germany*
UnitedKingdom*
Notes: For countries marked with an asterisk (*), data refer to students enrolled in higher education only. Source: AEI, IRCC, DAAD-DZHW, IIE, HESA, NZ MoE.
ICG © 2016 27 BCCIE 2016: BC Intelligence Report Release – 20 June 2016
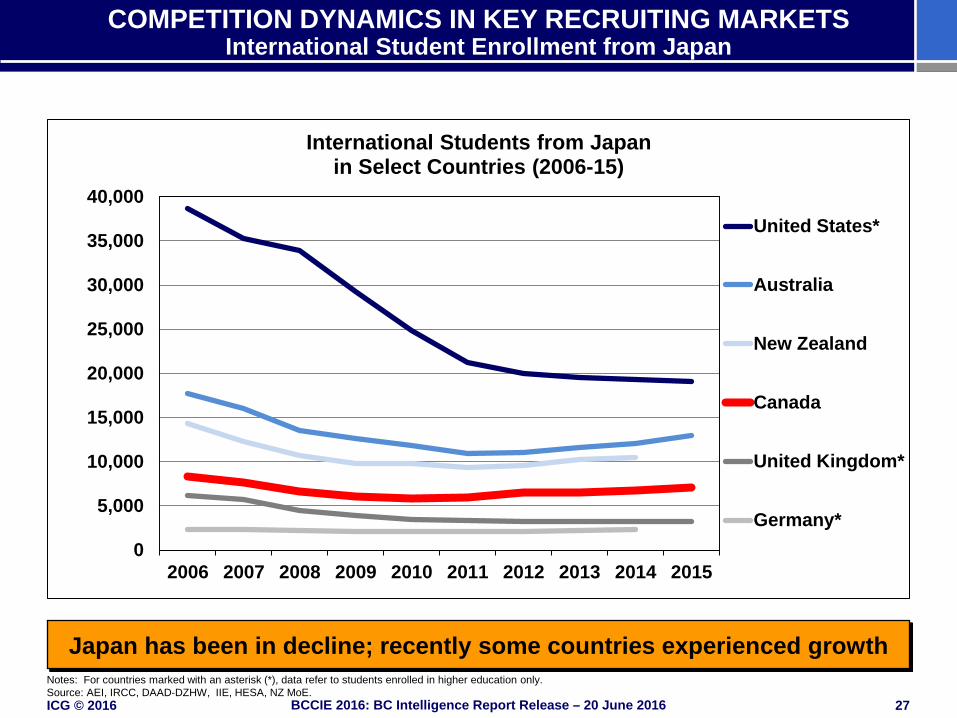
COMPETITION DYNAMICS IN KEY RECRUITING MARKETS International Student Enrollment from Japan
Japan has been in decline; recently some countries experienced growth
0
5,000
10,000
15,000
20,000
25,000
30,000
35,000
40,000
2006 2007 2008 2009 2010 2011 2012 2013 2014 2015
International Students from Japan in Select Countries (2006-15)
United States*
Australia
New Zealand
Canada
United Kingdom*
Germany*
Notes: For countries marked with an asterisk (*), data refer to students enrolled in higher education only. Source: AEI, IRCC, DAAD-DZHW, IIE, HESA, NZ MoE.
ICG © 2016 28 BCCIE 2016: BC Intelligence Report Release – 20 June 2016
COMMENTARY ON COMPETITION DYNAMICS IN KEY RECRUITING MARKETS
• China: Strong growth – but also significant in-market change dynamics. What about student quality?
• India: ROI-driven mobility creates bellwether function.
• U.S.: With rare exceptions, Canadian institutions do not lead with a brand pitch; discounting does not work.
• South Korea: Demographic pressures continue to depress enrollments.
• Japan: A balance between declining demographics and a renewed out-bound push.
ICG © 2016 29 BCCIE 2016: BC Intelligence Report Release – 20 June 2016
Housekeeping Global Student Mobility Trends International Students in British Columbia Perspectives on British Columbia’s Recruiting Markets Student Decision Drivers: Cost, Ranking, Social Media Presence Competitiveness Driver: Pathways Outlook: British Columbia in 2018 Discussion
CONTENTS
ICG © 2016 30 BCCIE 2016: BC Intelligence Report Release – 20 June 2016
• The following discussion centers on three key drivers for attracting international students to British Columbia institutions:
• Value – Fees and cost of living
• Brand perception – International university rankings
• Engagement – Social media presence
STUDENT DECISION DRIVERS Overview
ICG © 2016 31 BCCIE 2016: BC Intelligence Report Release – 20 June 2016
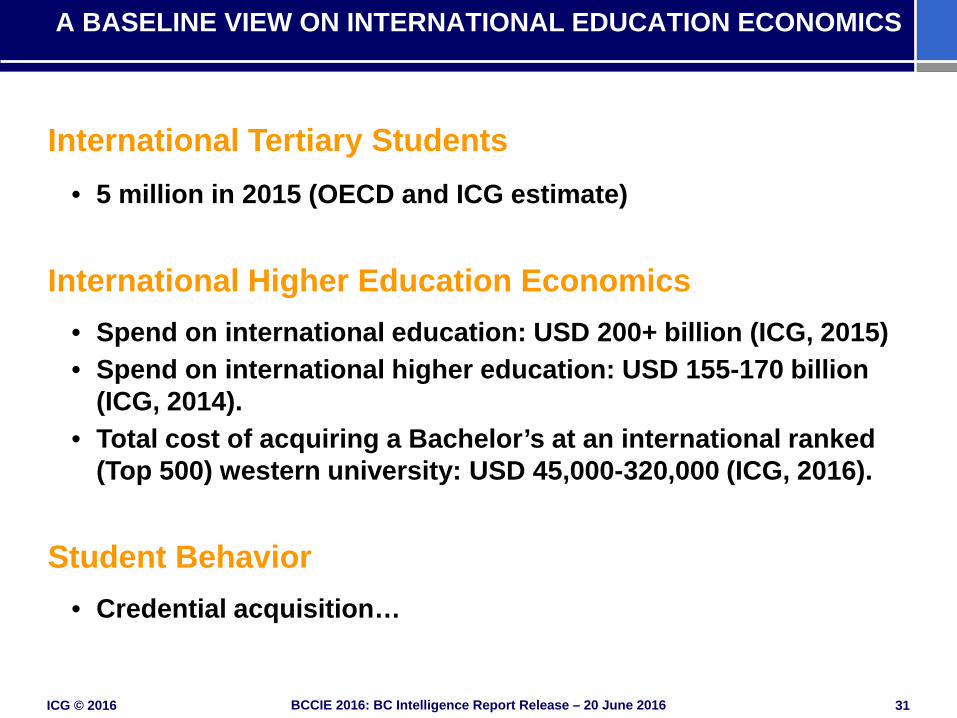
A BASELINE VIEW ON INTERNATIONAL EDUCATION ECONOMICS
International Tertiary Students
• 5 million in 2015 (OECD and ICG estimate)
International Higher Education Economics
• Spend on international education: USD 200+ billion (ICG, 2015) • Spend on international higher education: USD 155-170 billion
(ICG, 2014). • Total cost of acquiring a Bachelor’s at an international ranked
(Top 500) western university: USD 45,000-320,000 (ICG, 2016).
Student Behavior
• Credential acquisition…
ICG © 2016 32 BCCIE 2016: BC Intelligence Report Release – 20 June 2016
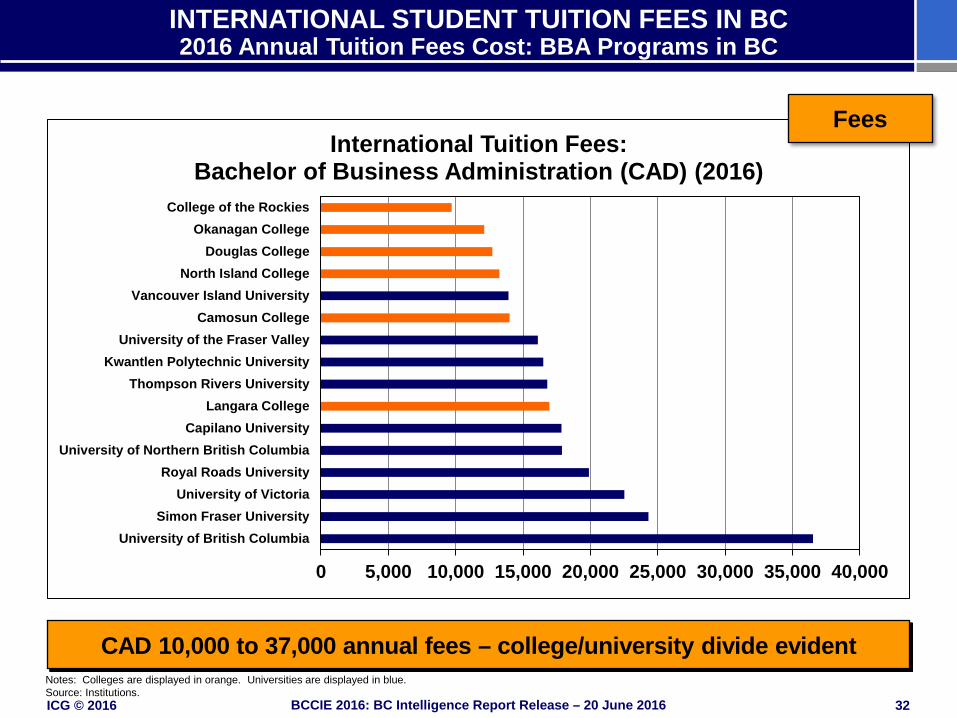
INTERNATIONAL STUDENT TUITION FEES IN BC 2016 Annual Tuition Fees Cost: BBA Programs in BC
CAD 10,000 to 37,000 annual fees – college/university divide evident
0 5,000 10,000 15,000 20,000 25,000 30,000 35,000 40,000
University of British ColumbiaSimon Fraser University
University of VictoriaRoyal Roads University
University of Northern British ColumbiaCapilano University
Langara CollegeThompson Rivers University
Kwantlen Polytechnic UniversityUniversity of the Fraser Valley
Camosun CollegeVancouver Island University
North Island CollegeDouglas College
Okanagan CollegeCollege of the Rockies
International Tuition Fees: Bachelor of Business Administration (CAD) (2016)
Notes: Colleges are displayed in orange. Universities are displayed in blue. Source: Institutions.
Fees
ICG © 2016 33 BCCIE 2016: BC Intelligence Report Release – 20 June 2016
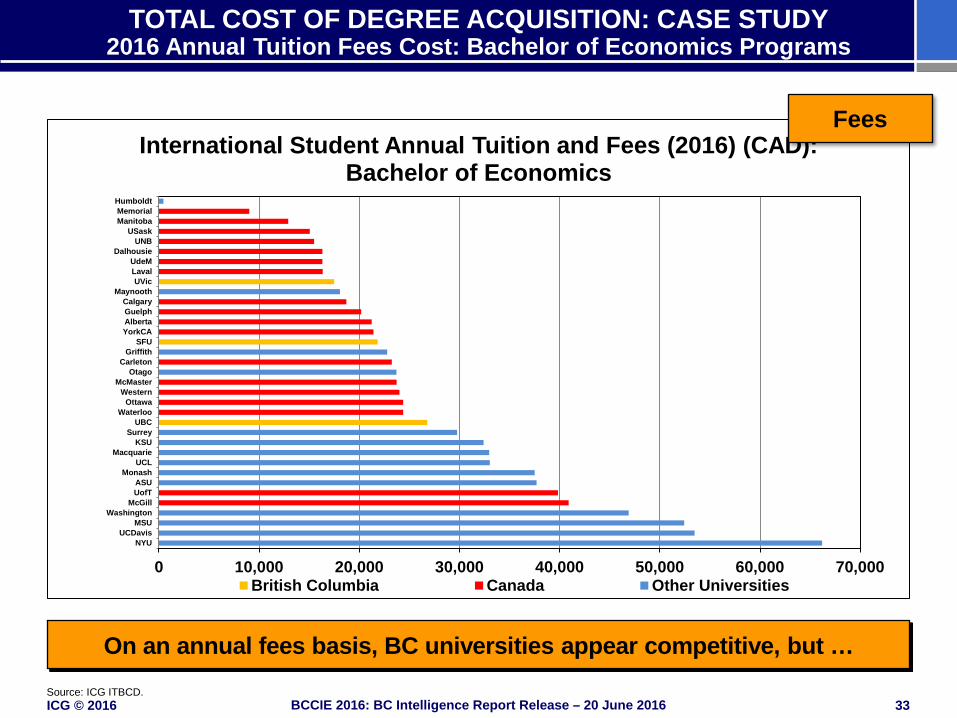
TOTAL COST OF DEGREE ACQUISITION: CASE STUDY 2016 Annual Tuition Fees Cost: Bachelor of Economics Programs
On an annual fees basis, BC universities appear competitive, but … Source: ICG ITBCD.
HumboldtMemorialManitoba
USaskUNB
DalhousieUdeMLavalUVic
MaynoothCalgaryGuelphAlbertaYorkCA
SFUGriffith
CarletonOtago
McMasterWestern
OttawaWaterloo
UBCSurrey
KSUMacquarie
UCLMonash
ASUUofT
McGillWashington
MSUUCDavis
NYU
0 10,000 20,000 30,000 40,000 50,000 60,000 70,000
International Student Annual Tuition and Fees (2016) (CAD): Bachelor of Economics
British Columbia Canada Other Universities
Fees
ICG © 2016 34 BCCIE 2016: BC Intelligence Report Release – 20 June 2016
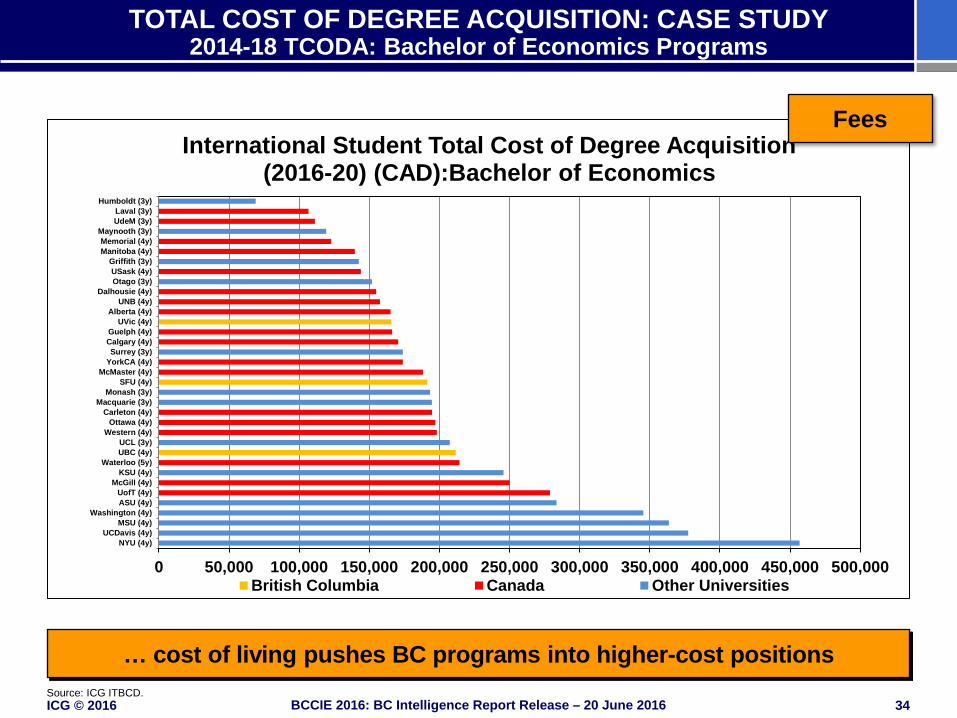
TOTAL COST OF DEGREE ACQUISITION: CASE STUDY 2014-18 TCODA: Bachelor of Economics Programs
… cost of living pushes BC programs into higher-cost positions
Humboldt (3y)Laval (3y)UdeM (3y)
Maynooth (3y)Memorial (4y)Manitoba (4y)
Griffith (3y)USask (4y)Otago (3y)
Dalhousie (4y)UNB (4y)
Alberta (4y)UVic (4y)
Guelph (4y)Calgary (4y)Surrey (3y)
YorkCA (4y)McMaster (4y)
SFU (4y)Monash (3y)
Macquarie (3y)Carleton (4y)
Ottawa (4y)Western (4y)
UCL (3y)UBC (4y)
Waterloo (5y)KSU (4y)
McGill (4y)UofT (4y)ASU (4y)
Washington (4y)MSU (4y)
UCDavis (4y)NYU (4y)
0 50,000 100,000 150,000 200,000 250,000 300,000 350,000 400,000 450,000 500,000
International Student Total Cost of Degree Acquisition (2016-20) (CAD):Bachelor of Economics
British Columbia Canada Other Universities
Source: ICG ITBCD.
Fees
ICG © 2016 35 BCCIE 2016: BC Intelligence Report Release – 20 June 2016
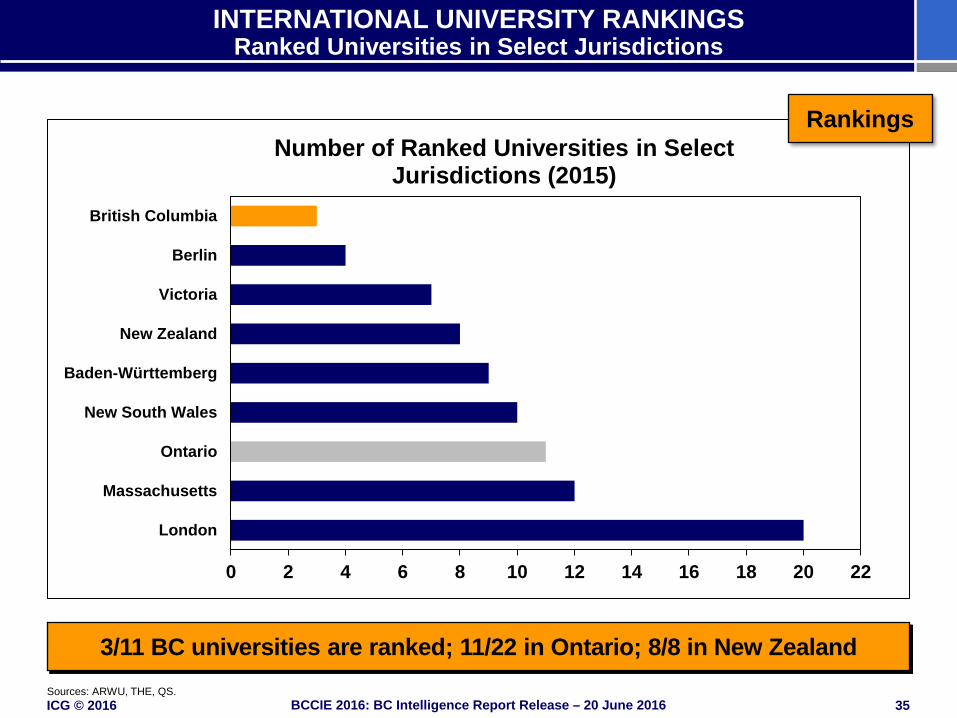
INTERNATIONAL UNIVERSITY RANKINGS Ranked Universities in Select Jurisdictions
3/11 BC universities are ranked; 11/22 in Ontario; 8/8 in New Zealand Sources: ARWU, THE, QS.
0 2 4 6 8 10 12 14 16 18 20 22
London
Massachusetts
Ontario
New South Wales
Baden-Württemberg
New Zealand
Victoria
Berlin
British Columbia
Number of Ranked Universities in Select Jurisdictions (2015)
Rankings
ICG © 2016 36 BCCIE 2016: BC Intelligence Report Release – 20 June 2016
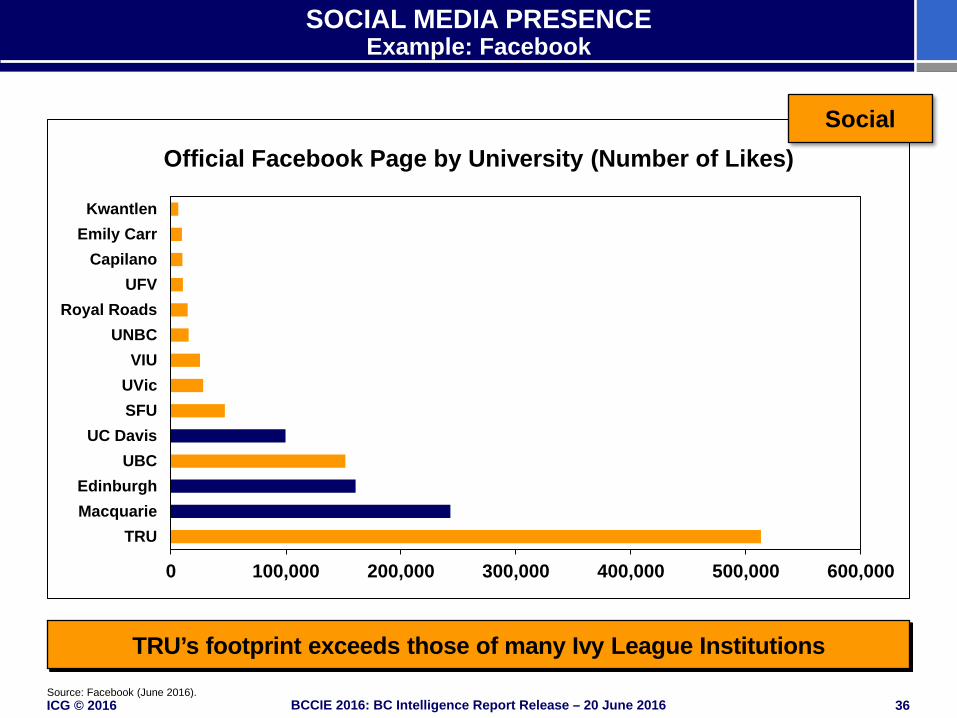
SOCIAL MEDIA PRESENCE Example: Facebook
Source: Facebook (June 2016).
0 100,000 200,000 300,000 400,000 500,000 600,000
TRUMacquarieEdinburgh
UBCUC Davis
SFUUVicVIU
UNBCRoyal Roads
UFVCapilano
Emily CarrKwantlen
Official Facebook Page by University (Number of Likes)
TRU’s footprint exceeds those of many Ivy League Institutions
Social
ICG © 2016 37 BCCIE 2016: BC Intelligence Report Release – 20 June 2016
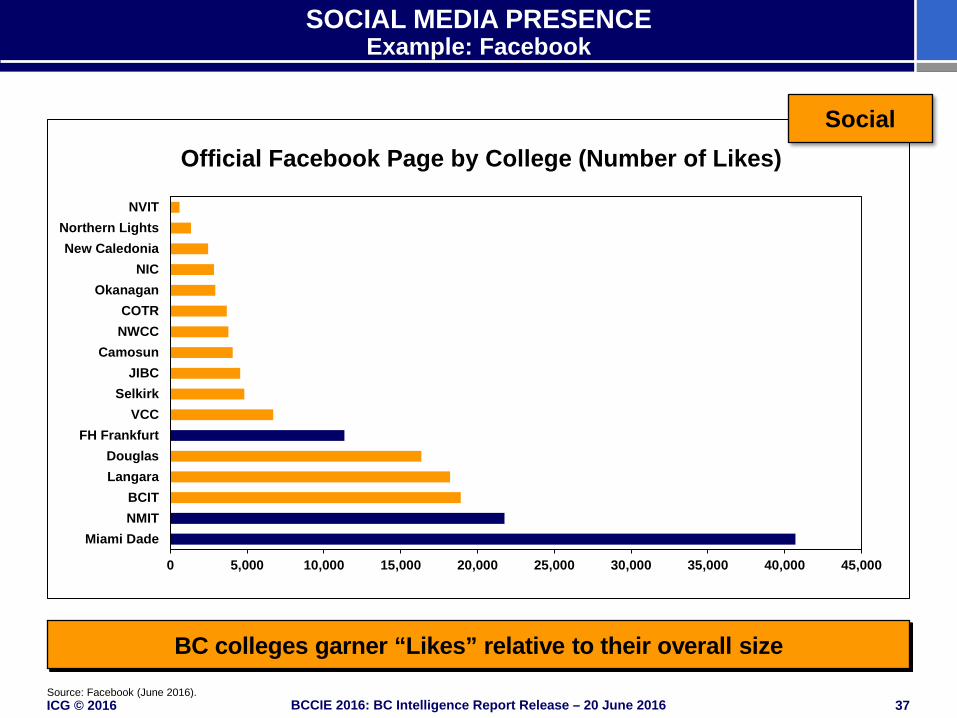
SOCIAL MEDIA PRESENCE Example: Facebook
0 5,000 10,000 15,000 20,000 25,000 30,000 35,000 40,000 45,000
Miami DadeNMITBCIT
LangaraDouglas
FH FrankfurtVCC
SelkirkJIBC
CamosunNWCCCOTR
OkanaganNIC
New CaledoniaNorthern Lights
NVIT
Official Facebook Page by College (Number of Likes)
Source: Facebook (June 2016).
BC colleges garner “Likes” relative to their overall size
Social
ICG © 2016 38 BCCIE 2016: BC Intelligence Report Release – 20 June 2016
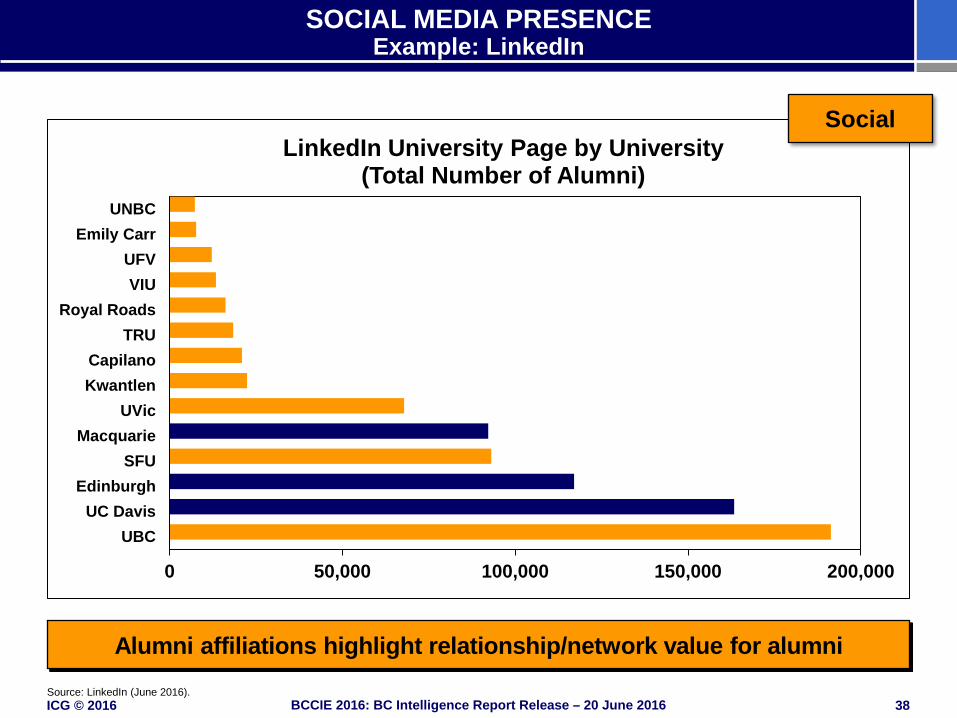
SOCIAL MEDIA PRESENCE Example: LinkedIn
0 50,000 100,000 150,000 200,000
UBCUC Davis
EdinburghSFU
MacquarieUVic
KwantlenCapilano
TRURoyal Roads
VIUUFV
Emily CarrUNBC
LinkedIn University Page by University (Total Number of Alumni)
Source: LinkedIn (June 2016).
Alumni affiliations highlight relationship/network value for alumni
Social
ICG © 2016 39 BCCIE 2016: BC Intelligence Report Release – 20 June 2016
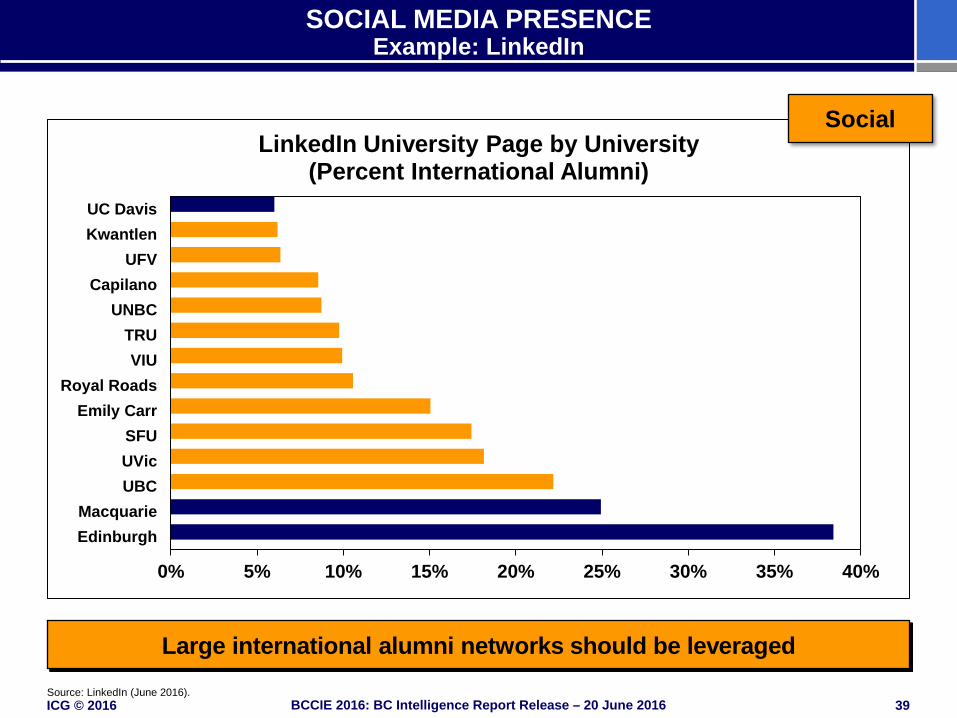
SOCIAL MEDIA PRESENCE Example: LinkedIn
0% 5% 10% 15% 20% 25% 30% 35% 40%
EdinburghMacquarie
UBCUVicSFU
Emily CarrRoyal Roads
VIUTRU
UNBCCapilano
UFVKwantlenUC Davis
LinkedIn University Page by University (Percent International Alumni)
Source: LinkedIn (June 2016).
Large international alumni networks should be leveraged
Social
ICG © 2016 40 BCCIE 2016: BC Intelligence Report Release – 20 June 2016
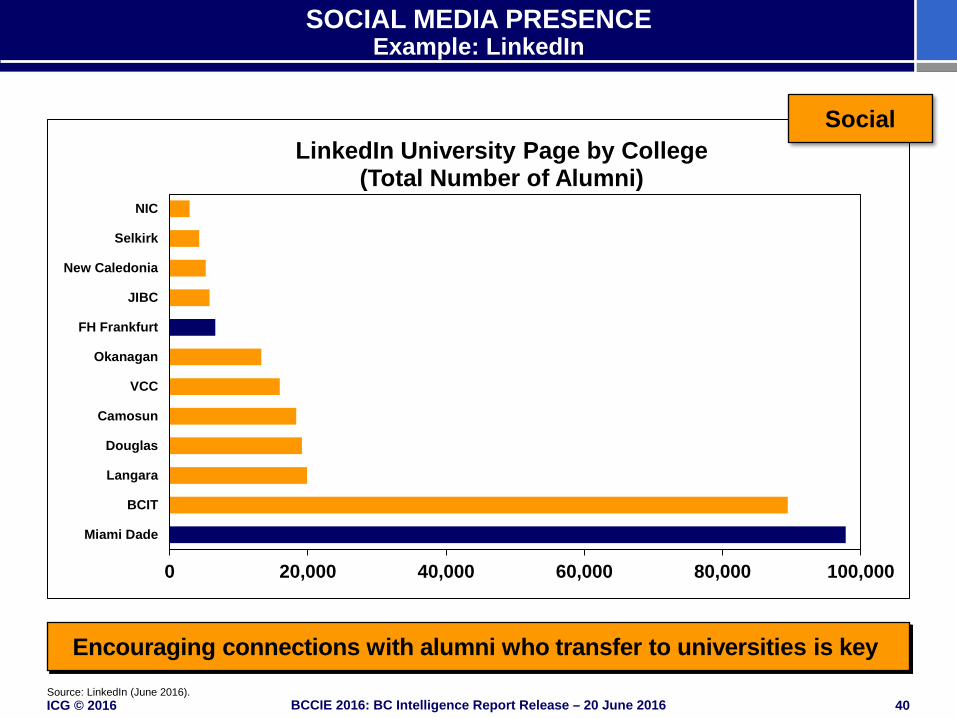
SOCIAL MEDIA PRESENCE Example: LinkedIn
0 20,000 40,000 60,000 80,000 100,000
Miami Dade
BCIT
Langara
Douglas
Camosun
VCC
Okanagan
FH Frankfurt
JIBC
New Caledonia
Selkirk
NIC
LinkedIn University Page by College (Total Number of Alumni)
Source: LinkedIn (June 2016).
Encouraging connections with alumni who transfer to universities is key
Social
ICG © 2016 41 BCCIE 2016: BC Intelligence Report Release – 20 June 2016
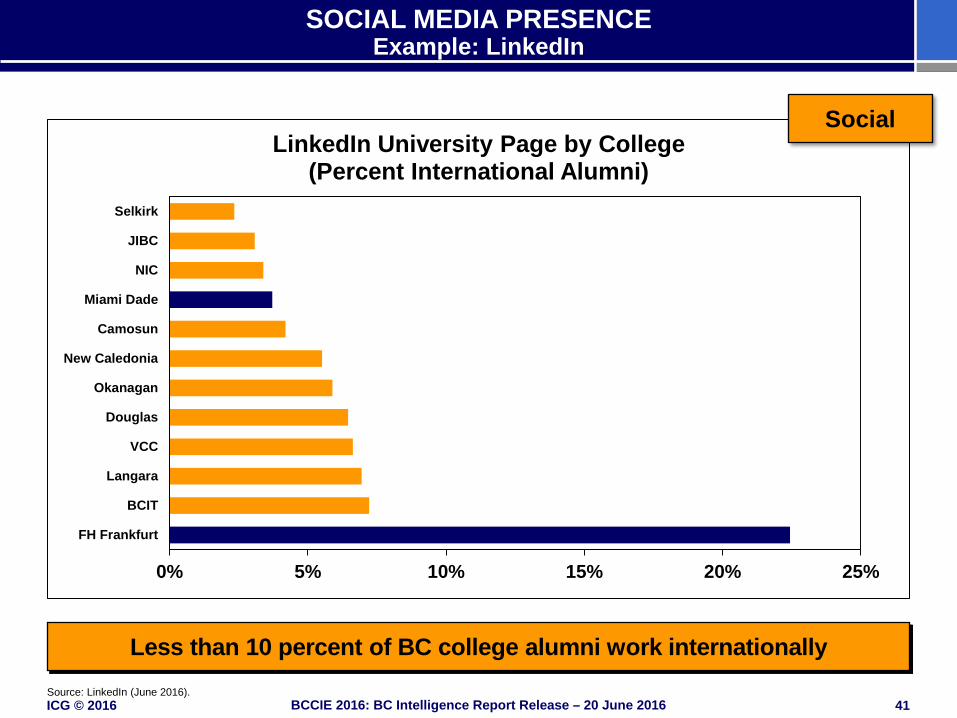
SOCIAL MEDIA PRESENCE Example: LinkedIn
0% 5% 10% 15% 20% 25%
FH Frankfurt
BCIT
Langara
VCC
Douglas
Okanagan
New Caledonia
Camosun
Miami Dade
NIC
JIBC
Selkirk
LinkedIn University Page by College (Percent International Alumni)
Source: LinkedIn (June 2016).
Less than 10 percent of BC college alumni work internationally
Social
ICG © 2016 42 BCCIE 2016: BC Intelligence Report Release – 20 June 2016
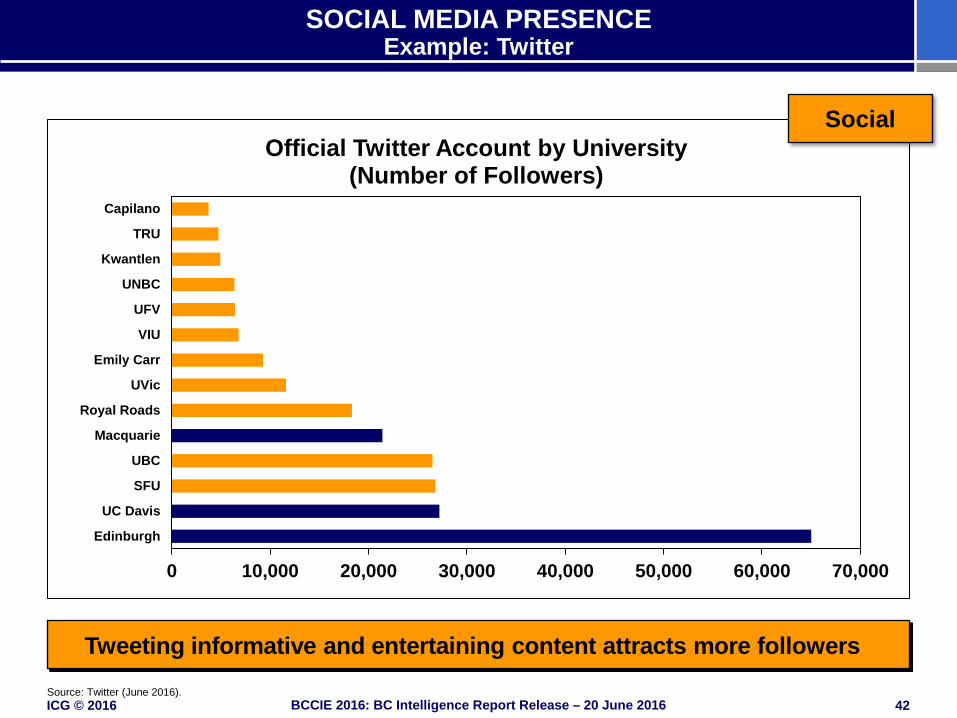
SOCIAL MEDIA PRESENCE Example: Twitter
0 10,000 20,000 30,000 40,000 50,000 60,000 70,000
Edinburgh
UC Davis
SFU
UBC
Macquarie
Royal Roads
UVic
Emily Carr
VIU
UFV
UNBC
Kwantlen
TRU
Capilano
Official Twitter Account by University (Number of Followers)
Source: Twitter (June 2016).
Tweeting informative and entertaining content attracts more followers
Social
ICG © 2016 43 BCCIE 2016: BC Intelligence Report Release – 20 June 2016
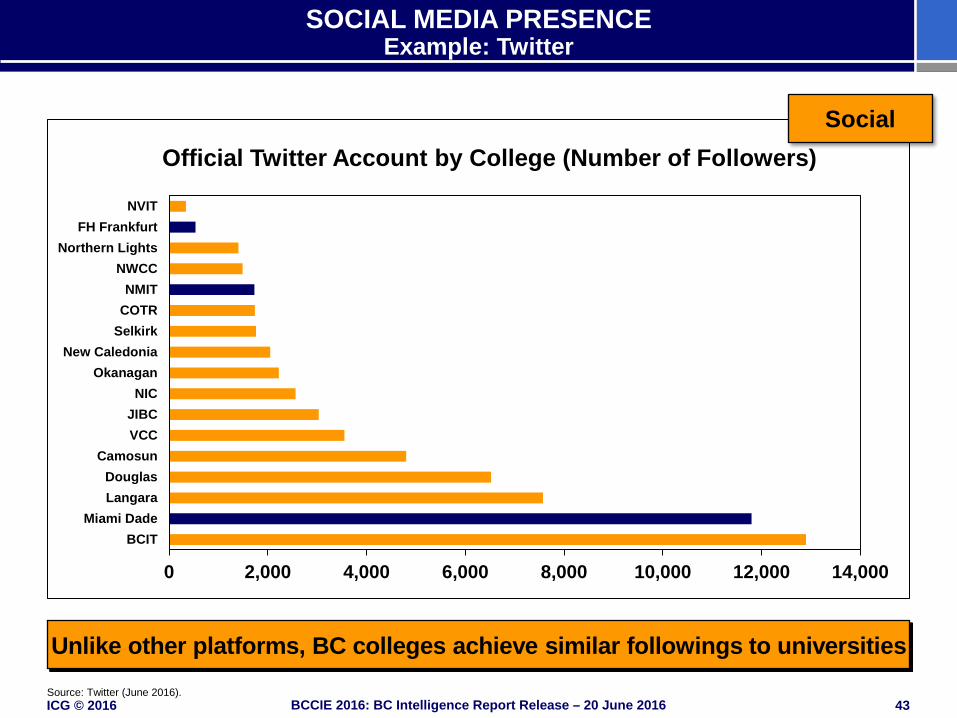
SOCIAL MEDIA PRESENCE Example: Twitter
0 2,000 4,000 6,000 8,000 10,000 12,000 14,000
BCITMiami Dade
LangaraDouglas
CamosunVCCJIBC
NICOkanagan
New CaledoniaSelkirkCOTRNMIT
NWCCNorthern Lights
FH FrankfurtNVIT
Official Twitter Account by College (Number of Followers)
Source: Twitter (June 2016).
Unlike other platforms, BC colleges achieve similar followings to universities
Social
ICG © 2016 44 BCCIE 2016: BC Intelligence Report Release – 20 June 2016
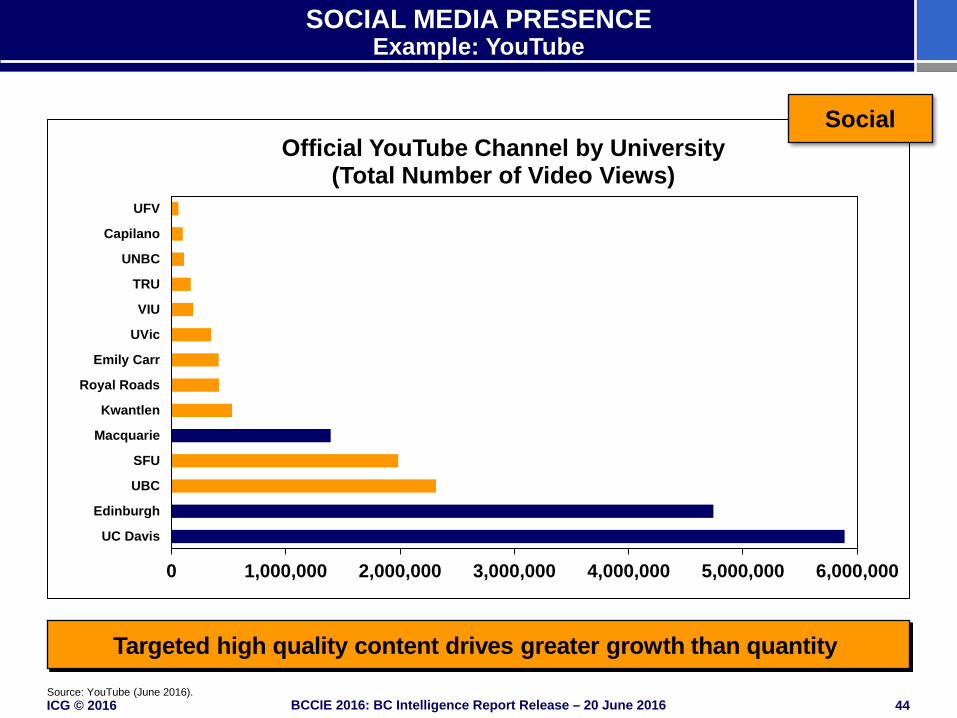
SOCIAL MEDIA PRESENCE Example: YouTube
0 1,000,000 2,000,000 3,000,000 4,000,000 5,000,000 6,000,000
UC Davis
Edinburgh
UBC
SFU
Macquarie
Kwantlen
Royal Roads
Emily Carr
UVic
VIU
TRU
UNBC
Capilano
UFV
Official YouTube Channel by University (Total Number of Video Views)
Source: YouTube (June 2016).
Targeted high quality content drives greater growth than quantity
Social
ICG © 2016 45 BCCIE 2016: BC Intelligence Report Release – 20 June 2016
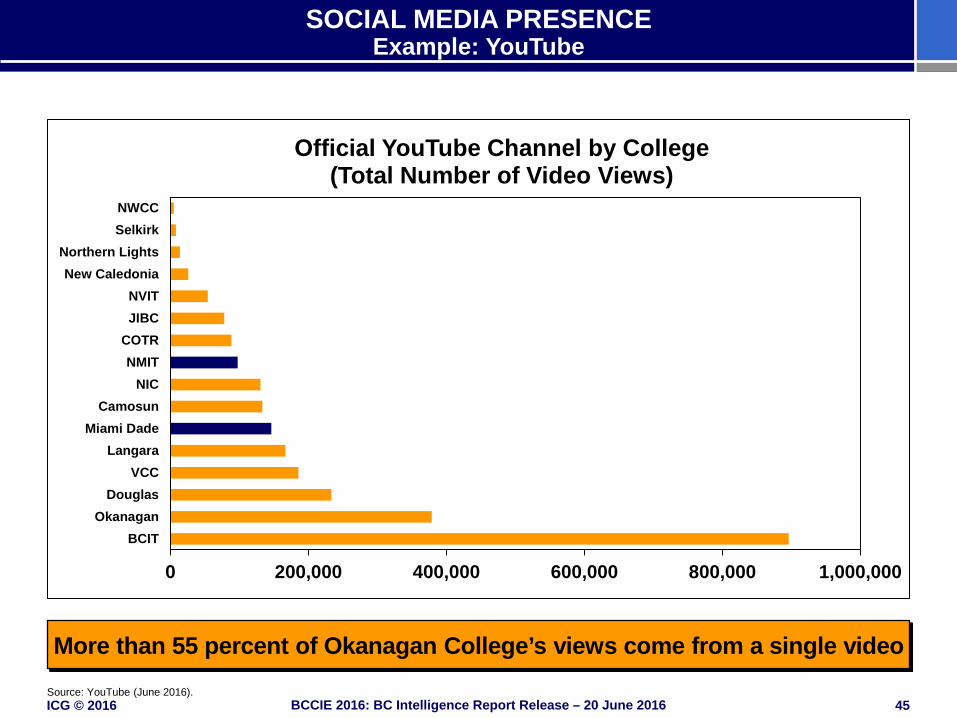
SOCIAL MEDIA PRESENCE Example: YouTube
0 200,000 400,000 600,000 800,000 1,000,000
BCITOkanagan
DouglasVCC
LangaraMiami Dade
CamosunNIC
NMITCOTR
JIBCNVIT
New CaledoniaNorthern Lights
SelkirkNWCC
Official YouTube Channel by College (Total Number of Video Views)
Source: YouTube (June 2016).
More than 55 percent of Okanagan College’s views come from a single video
ICG © 2016 46 BCCIE 2016: BC Intelligence Report Release – 20 June 2016
COMMENTARY ON STUDENT DECISION DRIVERS
Cost
• Competitive fees dissipate in the light of cost of living and study duration.
• The discounting of Australian and U.S. universities will create sizable competition issues.
Rankings
• BC lacks a deep landscape of ranked universities – this is a competitive malus.
Social Media
• TRU is a global social media success story. • Most BC institution do not operate at the same level than U.S.
peers, but comparable to Australian and UK institutions.
ICG © 2016 47 BCCIE 2016: BC Intelligence Report Release – 20 June 2016
Housekeeping Global Student Mobility Trends International Students in British Columbia Perspectives on British Columbia’s Recruiting Markets Student Decision Drivers: Cost, Ranking, Social Media Presence Competitiveness Driver: Pathways Outlook: British Columbia in 2018 Discussion
CONTENTS
ICG © 2016 48 BCCIE 2016: BC Intelligence Report Release – 20 June 2016
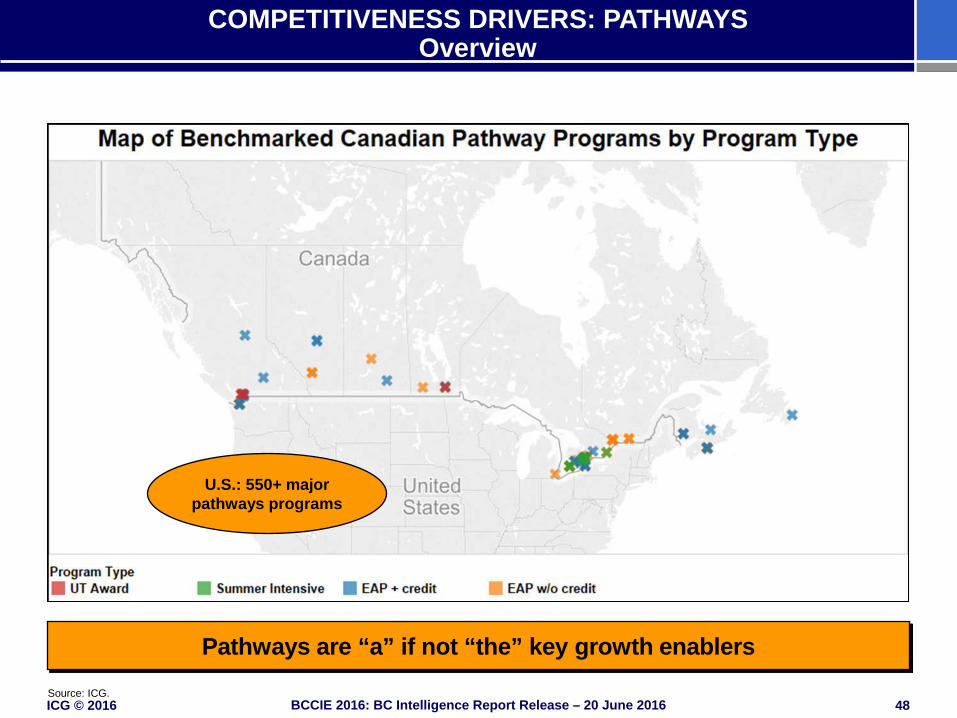
COMPETITIVENESS DRIVERS: PATHWAYS Overview
Pathways are “a” if not “the” key growth enablers
Source: ICG.
U.S.: 550+ major pathways programs
ICG © 2016 49 BCCIE 2016: BC Intelligence Report Release – 20 June 2016
COMPETITIVENESS DRIVERS: PATHWAYS
• As of 2014, 25-30 percent of international students entering under-graduate degrees in Canada come from pathways programs (ICG, 2015).
• Yet, the Canadian pathways landscape remains fragmented – many universities maintain unclear relationships with pathways programs.
• Australia and the UK recruit a majority of international undergraduates through pathway programs. Canada will have to follow suit in order to compete
• Within Canada, BC leads for offering tightly integrated pathway programs (e.g., FIC, Vantage).
ICG © 2016 50 BCCIE 2016: BC Intelligence Report Release – 20 June 2016
Housekeeping Global Student Mobility Trends International Students in British Columbia Perspectives on British Columbia’s Recruiting Markets Student Decision Drivers: Cost, Ranking, Social Media Presence Competitiveness Driver: Pathways Outlook: British Columbia in 2018 Discussion
CONTENTS
ICG © 2016 51 BCCIE 2016: BC Intelligence Report Release – 20 June 2016
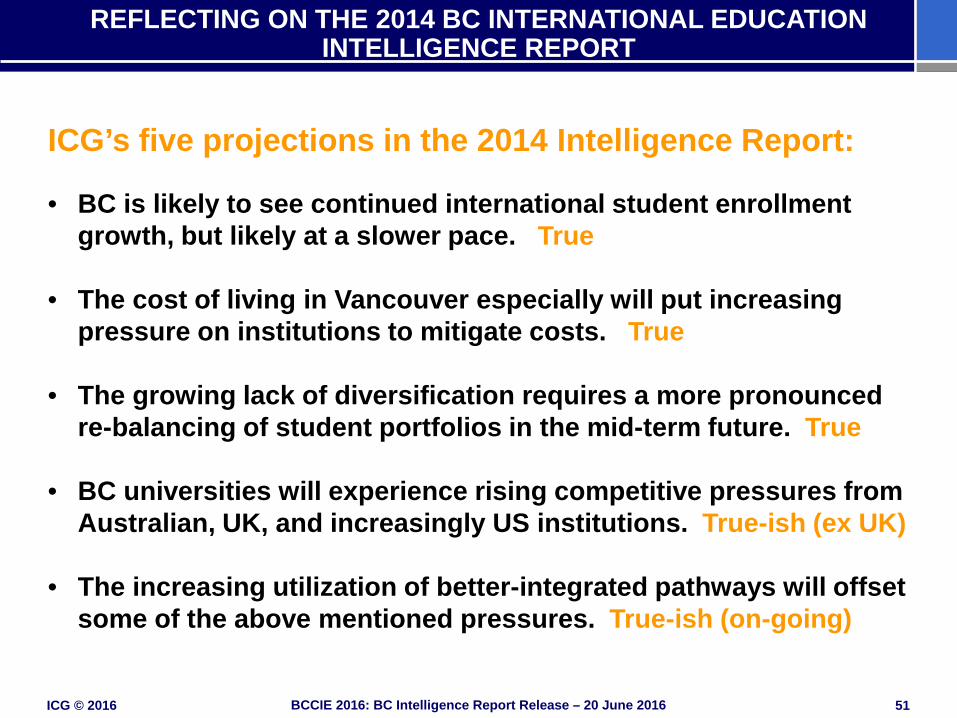
ICG’s five projections in the 2014 Intelligence Report: • BC is likely to see continued international student enrollment
growth, but likely at a slower pace. True
• The cost of living in Vancouver especially will put increasing pressure on institutions to mitigate costs. True
• The growing lack of diversification requires a more pronounced re-balancing of student portfolios in the mid-term future. True
• BC universities will experience rising competitive pressures from Australian, UK, and increasingly US institutions. True-ish (ex UK)
• The increasing utilization of better-integrated pathways will offset some of the above mentioned pressures. True-ish (on-going)
REFLECTING ON THE 2014 BC INTERNATIONAL EDUCATION INTELLIGENCE REPORT
ICG © 2016 52 BCCIE 2016: BC Intelligence Report Release – 20 June 2016
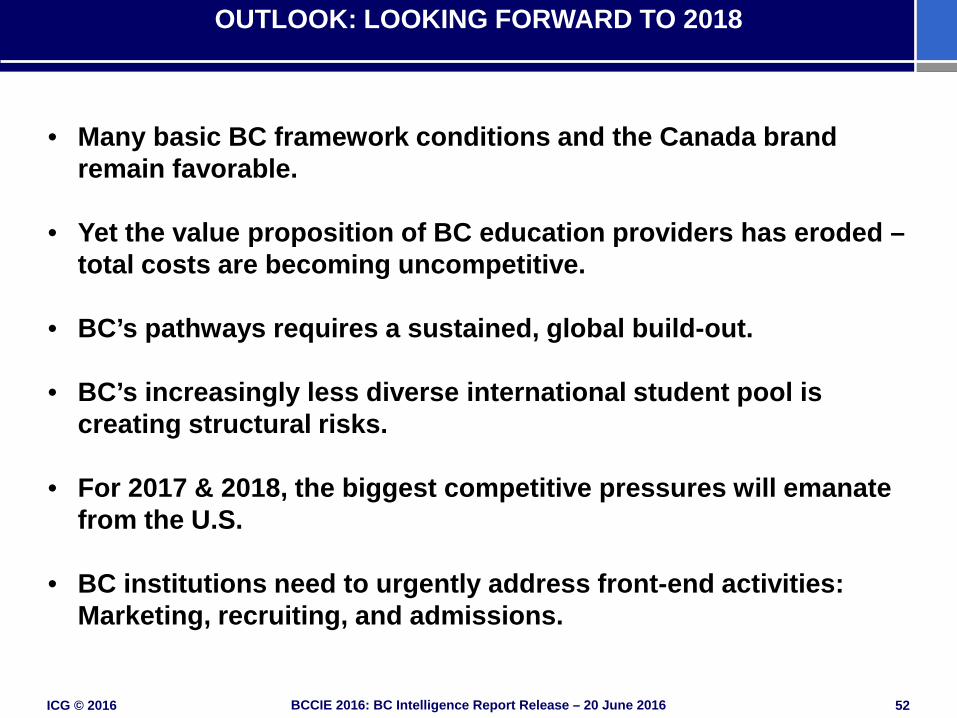
• Many basic BC framework conditions and the Canada brand remain favorable.
• Yet the value proposition of BC education providers has eroded – total costs are becoming uncompetitive.
• BC’s pathways requires a sustained, global build-out.
• BC’s increasingly less diverse international student pool is creating structural risks.
• For 2017 & 2018, the biggest competitive pressures will emanate from the U.S.
• BC institutions need to urgently address front-end activities: Marketing, recruiting, and admissions.
OUTLOOK: LOOKING FORWARD TO 2018

ICG © 2016 53 BCCIE 2016: BC Intelligence Report Release – 20 June 2016
Housekeeping Global Student Mobility Trends International Students in British Columbia Perspectives on British Columbia’s Recruiting Markets Student Decision Drivers: Cost, Ranking, Social Media Presence Competitiveness Driver: Pathways Outlook: British Columbia in 2018 Discussion
CONTENTS
ICG © 2016 54 BCCIE 2016: BC Intelligence Report Release – 20 June 2016
CONTACT INFORMATION
Dr. Daniel J. Guhr Managing Director Phone +1 650 860 6102 Fax +1 650 860 6109 [email protected] Illuminate Consulting Group P.O. Box 262 San Carlos, CA 94070 USA