2016-17 state assessment results briefing scores... · 2016-17 state assessment results briefing...
TRANSCRIPT

2016-17 State AssessmentResults Briefing
Rhonda Sims, Associate CommissionerOffice of Assessment and Accountability
Rebecca BlessingDirector of Communications
Nancy RodriguezMedia Liaison
September 21, 2017
KDE:OLLCS:DC:9/21/17
Agenda 2016-17 overview and changesWhat is in the release?Where can you find the data? Timeline for reporting Getting the data/Embargo Questions and answers Contact information
2
3
2016-17 Overviewand Changes
Overview Based on state assessments in 2016-17
school year Transition year between old accountability system
under NCLB/waivers and new system under ESSA and Senate Bill 1 (2017)
2017-18 transition period continues● Modeling the new system is expected
2018-19 school year ● The new accountability system is expected to be
in place 4
Overview SB1 (2017) -- The accountability system shall
include :● An annual overall summative performance evaluation of
each school and district compared to the goals established by the Kentucky Board of Education.
● The evaluation for each school and district shall:Not consist of a single summative numerical score that ranks
schools against each other; and
Be based on a combination of academic and school quality indicators and measures, with greater weight assigned to the academic measures.
5
2016-17 Changes Schools, District and State WILL NOT receive:
● An overall score ● No scores for Next-Generation Learners or Next-
Generation Instructional Programs (Program Reviews)
● Classifications or labels (no rankings) Schools, Districts and State WILL receive:
● Data for Achievement, Gap, Growth (EL/MS), CCR, and Graduation Rate (HS)
● 2016-17 Program Review scores, if submitted and districts approved school results
6

2016-17 Changes Schools and districts will NOT receive labels
for priority or focus. KDE will continue to support schools and
districts that are low performing (current and new).
7
2016-17 Changes No science scores for ES or MS. Students took part in
field test of new science assessments. Alternate assess.science scores will be reported for all levels.
On-demand writing eliminated at grades 6 and 10. Now tested only once in ES (grade 5), MS (grade 8) and once inHS (grade 11) per SB1 (2017). Scores not comparable with previous years.
No language mechanics scores at HS due to ACT eliminating reporting of English subscores.
Growth not reported at HS, due to ACT Plan being discontinued by the vendor.
Limited use of ACT Compass in CCR reporting, due to ACT discontinuing the test. 8

What is in the 2016-17 release?
9

Student Data
10
Assessed Students● All students who were
enrolled at time of testing
● Under Assessment Tab in SRC
100-day Students● Students tested who
have been in the school at least 100 days
● Students on which accountability has been based in past
● Scores included in components of Achievement, Gap, Growth (ES/MS), College and Career Readiness and Graduation rate
● Included in data sets

11
Reporting Components 2016-17
Achievement• Reading• Mathematics• Social Studies• Writing• Science – EOC
and Alternate Assessment Only
Gap• Consists of two
components• Novice
Reduction• Non-
Duplicated Gap Group
Growth• Only at
elementary & middle school
• High school has no growth due to the absence of ACT Plan scores
CCR• College
Readiness• ACT• KYOTE• Compass
• Career Readiness• Academic• Technical
Grad Rate (Cohort)• 4-year rate
used for graduation rate goal
• 5-year rate used at high school reported

Achievement Data
12
K-PREP (Kentucky Performance Rating for Educational Progress) ● Scores and performance levels
(NAPD) Reading (Grades 3-8) Mathematics (Grades 3-8) Science (EOC and Alt. only)
Social Studies (Grades 5, 8) Language Mechanics
(Grades 4, 6) On-demand Writing
(Grades 5, 8, 11)
The ACT (Grade 11)● Scores and
benchmarks End-of-Course
● English II● Biology● Algebra II● U.S. History
Alternate Assessment

Achievement Achievement – Student performance [Novice, Apprentice,
Proficient and Distinguished (NAPD)] in content area tests –reading, mathematics, science (HS) , social studies, and writing.
For each content area, one point is awarded for each percent of students scoring proficient or distinguished. One-half point is awarded for each percent of students scoring apprentice. No points are awarded for novice students.
Distinguished students can earn a bonus. To calculate the bonus, each percent distinguished earns an additional one-half point, and the percent novice earns a negative one-half point, so that when the distinguished and novice values are combined, the novice points may offset the distinguished bonus. If the novice performance completely offsets the distinguished bonus, no points are added to or subtracted from the achievement calculation.
13
Graduation Rate The Four-year Adjusted Cohort Graduation Rate
provides an accurate graduation model that follows students from their first year in high school through their expected cohort graduation school year in four years.
The Five-year Adjusted Cohort Graduation Rate is defined as the number of students who graduate in five years with a regular high school diploma divided by the number of students who entered high school five years earlier adjusting for transfers in and out, émigrés and deceased students. 14
Gap – Non-duplicated Group The percentage scoring Proficient and Distinguished in
all content area tests. Non-duplicated gap group is aggregate of students in
demographic categories (African American, Hispanic, American Indian, limited English proficiency, students in poverty (free/reduced-price meal) and students with disabilities.
The N-count (number of students reported) is based on school population by level (elementary, middle, high), not grade-by-grade enrollment, causing almost every school in Kentucky to have a reported gap group.
15

Gap – Non-duplicated Group
16
African American
Hispanic
American Indian
Limited English proficiency
Students in Poverty (free/reduced-price meal)
Students with Disabilities (IEP)
Student counts once, even if a part of several groups.
Gap – Novice Reduction Annual novice reduction targets in reading
and mathematics for individual student groups (African American, Hispanic, American Indian, limited English proficiency, students in poverty [free/reduced-price meal], students with disabilities and non-duplicated gap group); A decrease of novice by 10% each year to set annual targets;
Scores are based on percent of target met.17

Gap – Novice Reduction Target Groups
18
African American
Hispanic
American Indian
Limited English proficiency
Students in Poverty (free/reduced-price meal)
Students with Disabilities (IEP)
Non-Duplicated Gap GroupCalculated for each content area that has a minimum of
10 Novice students in a group.
Growth – Reading & Mathematics Includes the percentage of students at typical or
high growth.
The student growth percentile places students into academic peer groups and then calculates their improvement over a one-year period compared to the academic peer group.
Typical growth for accountability is a student growth percentile at or above 40.
Growth not reported at high school.19
College and/or Career Readiness (CCR)High School Only A readiness percentage is calculated by dividing the
number of high school graduates who have successfully met an indicator of readiness for college/career with the total number of graduates.● College Readiness includes ACT, KYOTE and/or Compass● Career Readiness includes: academic (ASVAB or
WorkKeys) and technical (KOSSA or Industry Certificates) benchmarks.
● A bonus (.5 point) is earned by students that are College Ready Academic and have meet the Career Ready Technical. 20

Reminders Data presented by school level (elementary,
middle, high) and aggregated for the district and state. For example, a K-8 school will have both elementary and middle school reports
Only data from A1 schools are aggregated for districts and the state.
To protect student privacy, some data may be suppressed. This is indicated with an * in the SRC.
21
22
Where can you find the data?

23
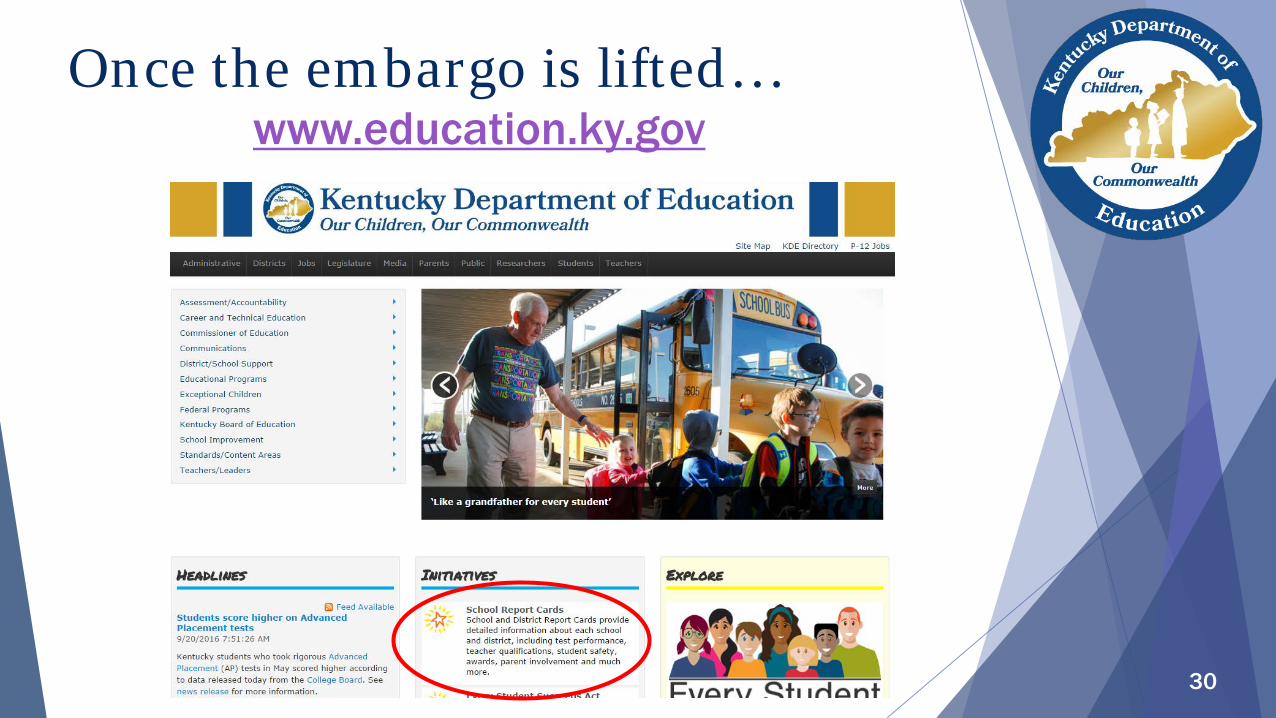
Where can you find the public data?
http://applications.education.ky.gov/SRC/

24
Where can you find the data?
*No Accountability Tab or determinations
Timeline For 2016-17 Reporting
25

26
•Morning: Release of embargoed data to districts via SRC
•Afternoon: Release of embargoed data to working media
Sept. 25
•12:01 a.m. ET –Embargo lifted
•School Report Card publicly available
Sept. 28 •Data Review for new individual student change requests
Sept. 28-Oct. 9
• Resolution of change requests
Oct. 9-11
Timeline for 2016-17 Reporting
Embargo
27

Getting the data What you will get: (all data embargoed)
● Briefing Packet● News Release● Access to embargoed School Report Card● Downloadable Data Sets● Tool on what data can and cannot be compared
Directions for access to the secure School Report Card will be sent to:● Districts in the morning of September 25● Working members of the media in the afternoon
of September 2528
Embargo Status Data and reports are embargoed until
12:01 a.m. ET, Sept. 28. During an embargo, district and school staff
may discuss the data in private; however data cannot be shared publicly or distributed by any means by the media.
If you break the embargo, your media outlet will not be granted rights to receive the data in advance next year.
29
Contact InformationNancy Rodriguez
[email protected](502)564-2000, ext. 4610
Rebecca [email protected]
(502)564-2000, ext. 4604
31