2015 wildlife science report - in.gov · 4 2015 wildlife science report—wildlife science unit...
TRANSCRIPT

Indiana Department of Natural Resources2015 WILDLIFE SCIENCE REPORT

2 2015 Wildlife Science Report
ON THE COVER: Celebrate Birds in 2016
The American bittern (Botaurus lentiginosus) that graces the cover of this year’s Wildlife Science report was photographed at Tern Bar Slough Wildlife Diversi-ty Area in spring 2015. American bitterns are secretive inhabitants of shallow freshwater marshes with dense stands of cattails, reeds and other emergent vegeta-tion. These solitary herons have a well-camouflaged body that features a heavily streaked brown and white underside. If threatened, the bird remains motion-less with its bill pointed skyward, allowing it to blend with the surrounding foliage. American bitterns are endangered in Indiana, where they reach the southern boundary of their breeding range in the Midwest.
Migratory birds, such as the American bittern, will be the focus of a year-long celebration in 2016 to recognize the 100-year anniversary of the Migratory Bird Treaty Act (MBTA). This landmark agreement, signed between the United States and Great Britain (for Canada) on August 16, 1916, was the foundation for establishing farsighted programs to manage and conserve birds that cross international borders. This year, the U.S. Fish and Wildlife Service (USFWS), in cooperation with its federal, state, private, non-governmental, tribal and international partners, is organizing numerous events to celebrate 100 years of bird conservation and protection.
The Wildlife Science Unit (WSU) will serve as the Indiana contact for the USFWS centennial celebrations. Activities such as festivals, bird hikes and presenta-
tions have been organized throughout the Hoosier state to increase participation in citizen science ef-forts; foster life-long support for bird conservation and habitat restoration at state, local and residential levels; and expand opportunities for public engagement in the conservation of migratory birds. To learn more, subscribe to the online monthly MyDNR and Wild Bulletin newsletters on our website. You will receive updates on upcoming MBT centennial events and bird-of-the-month articles. For more information about the centennial nationwide, visit http://www.fws.gov/birds/MBTreaty100/.
At its simplest, migration is the process of organisms moving from one area to another. Most Indiana birds undergo seasonal, north-south movements between their breeding and wintering grounds. This remarkable phenomenon is driven by availability of food and nest-ing opportunities, yet it is energetically demanding with real risks and rewards consequences. Similarly, it takes a grand and multi-continental commitment of many to safeguard the planet’s wildlife of the skies. Please join us, not only in celebrating 100 years of conservation, but also declaring a lifelong commitment to migratory bird protection. We look forward to seeing you in 2016.
Photograph NoteDNR photographers Frank Oliver and John Maxwell,
along with WSU staff, took many of the copyrighted photos in this publication. Others are in the public domain, unless otherwise noted.
During fall migration, thousands of sandhill cranes visit the shallow marshes on Jasper-Pulaski FWA, offering one of the greatest wildlife viewing spectacles in Indiana.

32015 Wildlife Science Report
TABLE OF CONTENTS
On the Cover ...................................................................................................................................................................................... 2
WILDLIFE SCIENCE UNIT ADMINISTRATION Introduction .................................................................................................................................................................................. 4
Personnel Changes ...................................................................................................................................................................... 4 Wildlife Science Staff ................................................................................................................................................................... 5 Funding ........................................................................................................................................................................................... 6 Rule Changes ................................................................................................................................................................................ 7 Opportunities to Volunteer ....................................................................................................................................................... 8
WILDLIFE DIVERSITY Amphibians & Reptiles ................................................................................................................................................................ 9
Birds ............................................................................................................................................................................................. 12 Fish & Freshwater Mussels ..................................................................................................................................................... 23 Mammals ..................................................................................................................................................................................... 29 WILDLIFE RESEARCH Deer ............................................................................................................................................................................................. 38 Furbearers .................................................................................................................................................................................. 41 Upland Gamebirds .................................................................................................................................................................... 44 Wild Turkey ................................................................................................................................................................................ 49 Waterfowl .................................................................................................................................................................................. 51 Black Bears ................................................................................................................................................................................. 55 Wild Pigs ..................................................................................................................................................................................... 57
Tern Bar Slough Wildlife Diversity Area in Gibson County. Part of this 840-acre property is being managed to provide habitat for the federally endangered least tern.

4 2015 Wildlife Science Report—Wildlife Science Unit Administration
WILDLIFE SCIENCE UNIT ADMINISTRATION
INTRODUCTIONState law (IC 14-22-2) charges the Division of Fish
and Wildlife (DFW) with the protection, reproduction, care, management, survival and regulation of wild animal populations in Indiana in such a manner that will best serve the interests of the resource and people of the state. To better achieve this legislative mandate, professional staff in the Wildlife Diversity and Wildlife Research programs merged in 2014 to form the WSU. Although their responsibilities, funding sources, focal species and user groups may differ, both share the fun-damental mission to conserve and manage wild animal populations throughout Indiana.
The WSU is a comprehensive, science-based, re-source management program that carries out an array of activities to fulfill its statutory obligations. Popula-tion management (i.e., species restoration, regulation of take, periodic or total protection of a species), re-search, surveys, habitat acquisition and improvement, and education are some of the tools staff members use to meet these responsibilities.
In today’s complex environment, state wildlife agencies must be flexible and adopt holistic manage-ment strategies to address unforeseen challenges and embrace new opportunities. In Indiana, longstanding programs for popular game species, such as white-tailed deer (Odocoileus virginianus) and wild turkey (Meleagris gallopavo), must evolve to maintain a healthy balance among diverse ecological, recreational and economic interests. Additional plans must be car-ried out to manage fully restored wildlife (river otter, Lontra canadensis; peregrine falcon, Falco peregrinus) or focus on extirpated species recolonizing the state (black bear, Ursus americanus). Biologists continue to track the impacts of established diseases (white-nose syndrome in cave-dwelling bats), while carrying out surveillance plans to detect the arrival of others (chronic wasting disease in deer and highly patho-genic avian influenza in wild birds). Guiding all efforts is Indiana’s newly revised State Wildlife Action Plan (SWAP), which provides the blueprint for the future stewardship of all fish and wildlife and their habitats in the state.
This annual report offers a brief look at some of the notable highlights and accomplishments of the WSU in 2015. We share this information to enlighten Hoosiers to the intrinsic value of Indiana’s rich wildlife resourc-es and the conservation efforts underway to ensure they persist for present and future generations to use and enjoy.
PERSONNEL CHANGESSeveral personnel changes occurred in the WSU in
2015. After 36 years of service, Gary Langell retired in June. One of his responsibilities, that of the unit’s supervisor, was filled by Dawn Slack in March. Also new to the Department of Natural Resources (DNR), Allisyn-Marie Gillet filled the nongame ornithologist position in August.
After Gary graduated from Purdue University with a B.S. degree in wildlife science, he started his DNR career as a biologist aide with the Highway Roadside Habitat Development Program. In 1979, he became a district wildlife biologist and began fostering relation-ships with private citizens and natural resource organi-zations around the state. Such connections are critical to natural resource management in Indiana, given that more than 90% of the state’s land is privately owned. Gary was a district biologist for 19 years before he
Although Gary Langell spent most of his career working with private land programs, his true passion is birding. He is banding a Swainson’s thrush at the Ford Hoosier Outdoor Experience.

52015 Wildlife Science Report—Wildlife Science Unit Administration
Indianapolis Office: 317-234-9586Scott Johnson, Program [email protected]
Bloomington Office: 812-334-1137Dawn Slack, [email protected]
Shawn Rossler, Furbearer Biologist
Adam Phelps, Waterfowl [email protected]
Budd Veverka, Farmland Game Biologist
Sarabeth Klueh-Mundy, Nongame Herpetologist [email protected]
Jason Mirtl, Assistant Nongame [email protected]
Cassie Hudson, Assistant Nongame [email protected]
Tim Shier, Assistant Nongame Mammalogist [email protected]
Allisyn-Marie Gillet, Nongame [email protected]
Vacant, Deer Biologist
Vacant, Assistant Deer Biologist
Vacant, Nongame Mammalogist
Edinburgh Office: 812-526-5816Brant Fisher, Nongame Aquatic [email protected]
JoAnne Davis, Assistant Nongame Aquatic [email protected]
Mitchell Office: 812-849-4586Steve Backs, Ruffed Grouse and Wild Turkey [email protected]
Amy Kearns, Assistant Nongame [email protected]
Naturalist Aides: Hillary Bulcher, Sadie Dainko, Megan Dillon, Andrew Dubois, Christy Hubbard, Emily Johnstone, Olivia Leonard, Kelsey Philippi, Carolyn Straiker
2015 WILDLIFE SCIENCE UNIT STAFF
advanced into administrative positions and became the Private Lands Program Manager. In 2014, he became supervisor of the then newly formed WSU.
Gary’s enthusiasm and passion for natural resource preservation was evident on a daily basis. He helped establish Indiana’s first Conservation Reserve Enhance-ment Program (CREP), providing incentives for agri-cultural producers to leave streamside, highly erodible land idle for 15 years. Gary also worked extensively with statewide Natural Resources Conservation Service (NRCS) offices to incorporate wildlife-friendly tech-niques into its conservation practices. He gave his time outside of the office as well, as a member of the State Soil Conservation Board.
The DNR recognized Gary’s talents with two Pro-gram Manager of the Year awards and three DNR Di-rector’s Award nominations. Gary also earned respect and admiration from his colleagues, peers and em-ployees over the years, which was perhaps his highest career honor.
Dawn Slack joined the DFW as the Wildlife Science Supervisor in March and is based in the Bloomington Field Office. She earned a M.S. degree in biology from Austin Peay State University in Tennessee, with a concentration in botany. She worked for about 18 years as a biologist for private consulting firms and several military bases, including Fort Campbell in Kentucky and Camp Atterbury in Indiana. Most recently, she had worked on the Hardwood Ecosystem Experiment (HEE).
Dawn has a wide range of talents including conducting stream and endangered species assessments, botanical surveys, species-specific habitat surveys and wetland delineations. She also has experience with avian, fish, amphibian and bat monitoring programs.
Outside of work, Dawn chairs the Mary Gray Bird Sanctuary, where she assists with habitat surveys, Monitoring Avian Productivity and Survivorship (MAPS)
Dawn Slack, husband Ryan and dog Marley visit the Mary Gray Bird Sanctuary in Connersville.

6 2015 Wildlife Science Report—Wildlife Science Unit Administration
bird banding, land management and restoration. She also volunteers at the Indiana Native Plant and Wildflower Society (INPAWS), Monroe County Identify and Reduce Invasive Species (MC-IRIS) program, and Brown County Native Woodland Project (BCNWP). Dawn lives in Brown County with her husband and their Labrador retriever. She is passionate about ecological restoration.
Allisyn-Marie Gillet joins the DFW as the Nongame Ornithologist stationed in the Bloomington Field Of-fice. Allisyn graduated from Rutgers University’s Cook College with a B.S. degree in general biology and natural resource management. She received master’s degrees from Columbia University (conservation biol-ogy) and the University of Missouri-St. Louis (ecology, evolution and systematics). Before coming to Indiana, she was a middle school science teacher who worked with bobolinks (Dolichonyx oryzivorus) during her summers. Her passion for birds has taken her to the Florida Everglades, the Mogollon Rim in Arizona, and the grasslands of Nebraska. Allisyn has worked with many bird species, from red-winged blackbirds (Age-laius phoeniceus) to Galapagos hawks (Buteo galapa-goensis) studying diverse topics ranging from envi-ronmental contamination to disease transmission. Her current interests lie in habitat restoration, management and using technology to monitor bird populations.
FUNDINGThe breadth of activities conducted or supported by
the WSU are shaped by many elements, including its statutory responsibilities, program priorities, funding, staffing levels, and opportunities for partner involve-ment. In 2015, resources from multiple federal, state, university, and private sources helped pay for wildlife conservation in Indiana.
Wildlife DiversityThe DFW appreciates the continued assistance of
Hoosiers who value the state’s rich wildlife heritage. Indiana citizens graciously donated $321,827 to the Nongame Wildlife Fund when filing their State income taxes in 2015. The Nongame Wildlife Fund, established by the Indiana General Assembly in 1982, supports all wildlife diversity activities and is the sole source of matching funds needed for the DFW to receive federal grants. The amount contributed in 2015 ($321,827) was 2% less than the previous year but well below the 14-year average of $371,000. Fluctuations in contributions are unsettling but expected when funding depends on voluntary donations rather than a dedicated source.
In 2015, the DFW received federal monies through the USFWS State and Tribal Wildlife Grants (SWG) program. The SWG program was authorized by Con-gress in 2001 to support programs that conserve declining fish and wildlife species before they become threatened or endangered. Funds are made available as grants to eligible states, based on the size of the state and its population. The 2015 apportionment ($798,001) was comparable to that received in the previous four years but below the 15-year average of approximately $1 million. We are grateful to our many university partners who continue to provide the 35% non-federal match that allows us to use our SWG funds to their full potential.
Additional USFWS funds were received from a com-petitive white-nose syndrome (WNS) grant ($26,910)
Annual donations to the Indiana Nongame Wildlife Fund from 2002 to 2015.
Allisyn-Marie Gillet in Galapagos tracks the movement of Galapagos hawks from a main perching site.

72015 Wildlife Science Report—Wildlife Science Unit Administration
and a Section 6 endangered species grant ($59,527). The WNS grant will provide bat houses to Indiana citizens to encourage participation in the summer bat roost monitoring project, purchase equipment for acoustic bat surveys, and pay expenses for staff to attend national and regional WNS meetings. The northern long-eared bat (Myotis septentrionalis), a forest-dwelling bat found statewide, will be the focus of the endangered species grant. Funds will be used to determine this species’ summer roosting ecology in northern Indiana, where forested cover is less abun-dant and often spatially isolated.
Wildlife ResearchSurvey and monitoring activities conducted by Wild-
life Research personnel are financed by state hunting/trapping license fees and federal Pittman-Robertson (PR) Act funds. PR monies are derived from an 11% federal excise tax on sporting arms, ammunition and archery equipment, and a 10% federal excise tax on handguns. When hunters and shooters purchase these items, the manufacturers pay the excise tax.
The excise taxes are deposited into the Wildlife Res-toration Trust Fund and administered by the USFWS. Funds are made available as grants through the USFWS to each eligible state, based on the size of the state and its number of licensed hunters. The grants fund up to 75% of the eligible costs with the other 25% sup-plied by the State, usually from license revenue but other partners, such as universities, sometimes provide the match.
State wildlife agencies use PR funds to support nu-merous programs such as habitat and species restora-tion, research, management, land acquisition, hunter access, facilities construction and maintenance, archery and shooting ranges, and hunter education. Projects that target the restoration and conservation of wild mammals and birds are eligible for Wildlife Restoration funds. During 2015, Wildlife Restoration grant funds
Indiana’s annual apportionment of USFWS State Wildlife Grant program funds from 2001 to 2015.
HOW TO DONATE
DFW invites you to play an active role in conserving Indiana’s nongame and endangered wildlife. Wildlife Diversity activities are supported by public
donations to the Indiana Nongame Wildlife Fund. The money donated goes directly to the protection and management of more than 750 species in Indiana—from shorebirds and salamanders to endangered swamp rabbits and lake sturgeon. You can help Indiana's wildlife by looking for the eagle logo on your Indiana state tax form (Schedule 5/Schedule IN-DONATE) to donate all or part of your refund. You may also donate online at endangeredwildlife.IN.gov or by sending a check to:
Indiana Nongame Wildlife Fund402 West Washington Street, Room W273
Indianapolis, IN 46204
totaling approximately $662,977 were used to conduct wildlife research projects in Indiana.
RULE CHANGESIndiana fish and wildlife resources are governed by
state laws and administrative rules that set forth the requirements that regulate wild animals. The DFW has statutory authority for wild mammals, birds, reptiles, amphibians, fish, crayfish and freshwater mussels. Ad-ministrative rules are typically reviewed biennially, and any necessary changes are made through the approval of the Natural Resources Commission. The rule revi-sion process takes almost a year to complete, includes a public comment period and hearing, and requires adoption and approval from multiple state governmen-tal bodies and offices.
Rule changes that took effect in 2015 included those that affect game turtles (snapping, smooth and spiny softshell). Changes were made to establish a season (July–March), change the daily bag limit for these three turtles to four per species and restrict the size that can be taken to individuals that have a straight-line carapace of 12 inch-es or greater. These changes were enacted because grow-ing evidence indicates that long-lived organisms, such as turtles, cannot sustain continuous harvest of reproductive females without negatively affecting abundance. Habitat destruction and capture for the pet and food trades re-main primary threats to many turtle species in Indiana.
Two categories are used to designate the status of rare species in Indiana: endangered and special concern. Species designated as special concern are defined as any animal species requiring monitoring because of known or suspected limited abundance or

8 2015 Wildlife Science Report—Wildlife Science Unit Administration
distribution, or because of a recent change in federal status or required habitat. Species designated as endangered are defined as any animal species whose prospect for survival or recruitment within Indiana are in jeopardy and are in danger of disappearing from the state. The endangered designation also includes all animal species listed as threatened or endangered by the USFWS that occur in Indiana. Whereas endangered species receive legal protection through the Indiana Nongame and Endangered Species Conservation Act (IC 14-22-34), species of special concern do not have equivalent levels of protection, and some can still be taken from the wild. In 2015, the rufa red knot (Calidris canutus rufa) and ruffed grouse (Bonasa umbellus) were added to the state’s list of special concern species, which can be found at endangeredwildlife.IN.gov.
OPPORTUNITIES TO VOLUNTEERA common question heard around the DFW is “how
can I help?” Specific questions involve helping with scientific research, species that are in need, and clean-ing up the environment. A new DFW program is mak-ing answering those questions easier.
In 2014, the DFW began using a volunteer manage-
ment program called CERVIS. The program allows biologists to easily advertise projects for which they need assistance. CERVIS also provides a convenient way for the general public to sign up for activities that peak their interest.
Perhaps you would like to participate in a woodcock singing survey, assist with the banding of mourning doves, help monitor wildlife populations by deploying a trail camera on your property, clean up public access sites by adopting a ramp, or teach kids to fish at the DNR’s fishing pond at the State Fair. All of these op-tions and more are available.
To get started, visit the DNR Volunteer Program page online at wildlife.in.gov/8301.htm and select "Apply to volunteer." You can set up your profile to receive emails about projects that pertain to your interests and skills. Regardless of whether you choose to receive those emails, you can peruse the lists of events and service projects currently open for registration at any time.
The DNR thanks all who volunteered to help make its programs successful in 2015. The time and effort contributed by each individual, young and old, was greatly appreciated. Although the program is relatively new, more than 350 volunteers logged over 3,300 hours in 2015.
Roush Lake FWA lies along the floodplain of the Wabash River in Huntington and Wells counties in northeast Indiana. The property’s 7,350 acres of land, 900-acre lake, and 350 acres of impoundments provide quality hunting and fishing opportunities and outstanding wildlife watching throughout the year.

2015 Wildlife Science Report—Wildlife Diversity 9
AMPHIBIANS & REPTILESCrawfish Frog and Spadefoot Toad
Frogs and toads can be some of the easiest species to survey. Much like birds, each species has a distinct call. Adults migrate to breeding areas, which can be ponds, wetlands, road-side ditches, or small flooded pools. Males do all of the calling. Most species call after dark during spring and summer.
Indiana is home to 17 species of frogs and toads. Some species only occur in specific parts of the state. For instance, the green treefrog only occurs in extreme southwest Indiana. In addition, each species has a particular timeframe during which it calls. A person would need to listen several different times throughout the active season if that individual wanted to try to hear each species. Wood frogs, Lithobates sylvaticus, are winter breeders. Surveys for them need to be con-ducted from February to March. The two gray treefrog species, Hyla versicolor and Hyla chrysocelis, are some of the longest and latest breeders. They can be heard from mid-April through the end of July.
In addition to the species with known timeframes for calling, there are the two “explosive” breeders. These two, northern crawfish frog, Lithobates areolatus, and eastern spadefoot toad, Scaphiopus holbrookii, will call for a very short time, during ideal conditions. This makes timing key when surveying for those species.
Crawfish frog breeding occurs in March and April on rainy nights when temperatures are above 55 de-grees. If temperatures turn cold, or there is a shortage of rainfall, the breeding season can be exceptionally short. Wildlife Science biologists began surveying for
WILDLIFE DIVERSITY
this species in 2004 and have continued these surveys in some capacity ever since. The crawfish frog is a state-endangered species that has disappeared from much of its historical range. As such, it is important to conduct surveys at historical locations to find out if the species continues to persist there. Surveys in 2015 confirmed the presence of crawfish frogs at historical sites in Sullivan and Greene counties.
The spadefoot toad will call anytime during spring or summer, after heavy rainfall (at least 1.5–2 inches). In 2001, this species was known to occur in only seven counties. The scarcity of records prompted it to be listed as a species of special concern. In 2006, Wildlife Science biologists began surveying the spadefoot toad. From 2006–2011, a total of 10 county records were added. After the large rain event of 2015, the spadefoot toad was observed in Washington, Orange and Jack-son counties for the first time. This species was taken off the special concern list in 2009, but opportunistic surveys will still occur as time allows. It is important to survey all species to ensure that even the common species remain common.
Green SalamanderThe green salamander, Aneides aeneus, is one of In-
diana’s most distinct salamanders. It has green lichen-like markings, a slender body, and a rounded head. These salamanders have long toes that are squared off on the tip. This trait allows them to climb freely up or down vertical cliff faces or trees.
Indiana’s population is disjunct from the species’ primary range, which is more Appalachian. Green salamanders were first discovered in Indiana in 1993,
The northern crawfish frog is a state-endangered species.
A young spadefoot toad from Washington County.

2015 Wildlife Science Report—Wildlife Diversity10
when researchers were looking for Allegheny woodrat (Neotoma magister) habitat. Green salamanders prefer wooded sandstone outcrops with deep crevices that are moist but not wet. These crevices serve as protec-tive hiding places as well as areas where females will suspend their eggs from the overhead rock surface.
Currently, the green salamander is a state-endangered species due to its specific habitat requirements and limited distribution. It is only known from Crawford and Perry counties. After the initial discovery in 1993, no additional green salamander populations were located until 2007. In fall 2010, 2012 and 2014, surveys found green salamanders at seven previously unknown sites. One location from 2012 had hatchling green salamanders in 2012 and 2013. A different site from 2012 had an egg clutch being guarded by a female in late summer 2015. Visits were made to all of the historic locations in 2015. At least one individual was observed at all but one site. Tissue samples were collected at most locations for use in a range-wide genetics study.
North American Amphibian Monitoring Program
Every year, early spring through late summer, Indiana erupts with the sounds of chorusing frogs and toads. From the large bullfrog, Lithobates catesbeianus, to the tiny cricket frog, Acris blanchardi, there are a variety of sizes, and each species has its own unique mating call. You may have heard the melodious call of the gray treefrog, Hyla versicolor, and the spaceship-type call of the American toad, Anaxyrus americanus, and thought they were some other animal or insect.
Volunteers for the North American Amphibian Monitoring Program (NAAMP) must learn the calls of all 17 Indiana frog and toad species. You might think that a small frog, like the spring peeper, Pseudacris crucifer, would be hard to hear over larger species like the southern leopard frog, Lithobates
The green salamander blends in well with the surrounding lichen.
sphenocephalus. But any seasoned volunteer can tell you that even a handful of spring peepers can sound almost deafening.
The NAAMP program was initiated because of increasing concerns about global amphibian declines. NAAMP, which is administered in cooperation with the United States Geological Survey (USGS), incorporates public volunteers to collect data on Indiana’s frog and toad species.
We had our best year yet for recruiting NAAMP volunteers. The launch of the DFW’s Volunteer Program made NAAMP more visible to a wider audience. We had 29 volunteers, including nine first-time participants. This past year, volunteers collected data from 27 pre-determined routes. Most of these volunteers (24) were able to run their routes during all three time periods, referred to as "windows". Because certain species only call during certain time frames, using windows allows us to collect data on more
A Cope’s gray treefrog on a window of the DNR Fish & Wildlife field office in Bloomington during a light rain. Males of this species can be heard calling from mid-April through the end of July.
A Cope’s gray treefrog as seen from inside the Bloomington field office. The yellow wash on the legs of this frog is a key characteristic.

2015 Wildlife Science Report—Wildlife Diversity 11
species over the duration of the breeding season. All 17 species were detected in 2015.
If you like listening to frog calls or if you have an interest in conservation, NAAMP might be for you.
Volunteers must follow strict protocols for data collection and pass a frog- and toad-call identification test. Each driving survey route stops 10 times near suitable amphibian habitat. Observers listen for five minutes and record what species are present at each stop. Volunteers need to collect data a minimum of three times between February and June each year.
If you would like to learn more about the frogs and toads of Indiana, check out the nongame website: http://www.IN.gov/dnr/fishwild/3325.htm.
The WSU thanks the dedicated volunteers who participated in NAAMP in 2015 for their invaluable assistance in monitoring this important group of animals statewide. We could not do it without them.
Volunteers Who Surveyed Three Windows:Charles BoswellMerilee BrittJim BrownBill DeanKathleen Galina ^^Barbara Harcourt **Julie Henricks **Jim HortonLara IbeyJustin Kuhns ^^Olivia Leonard ^^Keith MichalskiJason Mirtl **James NealJackie Powers ^^Noah ShieldsTim ShierNancy StarkRobin Stark **Jack StillSteve TrippelJohn TrittCyndi Wagner ^^Maryann Watson
Volunteers Who Surveyed Two Windows:Riley Carswell ^^Jordan Holmes ^^Darrel JoyKim Miser ^^Randy Peak ^^
^^ New volunteers** Volunteers who ran two routes
Eastern Box TurtlesBox turtles are readily identified by the hinge on the
underside (plastron) of their shell. This hinge allows them to fold in their head and limbs for protection. In Indiana, there are two species of box turtles, the ornate (Terrapene ornata) which is state-endangered and the eastern (Terrapene carolina) which is a species of special concern. They are closely related species that both live most of their lives on land, but prefer different habitats.
The ornate box turtle is a sand-loving species that currently only exists in the northwestern part of the state. They are smaller than their eastern counterparts and the domed part of their shell, the carapace, features a pattern of radiating lines. The eastern box turtle is a woodland species that occurs more prominently in the southern half of the state. It also has a spotty distribution in central and northern Indiana. While eastern box turtles can have radiating lines on their carapace, they are more known for their varied and vibrant color patterns. Males often have brightly colored yellow or orange heads.
Naturalist aides Hillary Bulcher and Andrew Dubois take a break from tracking eastern box turtles.

2015 Wildlife Science Report—Wildlife Diversity12
A hatchling eastern box turtle that was found within the turtle enclosure at Patoka River National Wildlife Refuge.
Wildlife Science assistant biologist Jason Mirtl gets ready to release one of the I-69 eastern box turtles after the transmitter was attached.
The eastern box turtle is most active during the first few weeks of warm spring weather and after heavy rain. Unfortunately, many of them end up on the road and get hit by cars. If you encounter a turtle in the road, the best thing to do to protect it is to remove it and place it on the side of the road, pointing in the direction in which you found it facing. Box turtles have a “home range”, the term for an area in which they make all of their movements for finding food, shelter and mating. They instinctively will attempt to return to their home range if moved from it. This trait makes them more likely to get hit on the road if they are placed far away from their original location.
In 2004, Indiana declared the eastern box turtle a special protected species. This means that it is illegal to possess an eastern box turtle, or any of its parts, without a permit. In response to the growing concerns about box turtle declines across the country and how the construction of a new interstate might affect local populations, Wildlife Science biologists rescued more than 200 eastern box turtles from the proposed Interstate 69 alignment during 2010, 2011 and 2012. Each turtle was weighed, measured and given a unique identification number before being placed in a secure, semi-natural environment.
Scientific research determined it would be unsafe to return these turtles back where they came from after the interstate was completed, given the high mortality rates of turtles near large, busy roads. Due to the homing instinct of the turtles, a solution isn’t as easy as merely releasing the turtles in the new area. To reset the turtles’ site-fidelity instinct, they were moved to an enclosure in their new habitat in 2013. Current information indicates that a minimum of two years in the enclosure is required to help them adopt a new home area.
In spring 2015, the turtles collected from the I-69 right-of-way were released into their new home. A subset of these turtles was outfitted with radio transmitters and is being tracked two-to-three times per week. Location, temperature and habitat use are being recorded. These turtles will be radio-tracked during the 2015 and 2016 active seasons. Box turtles that resided on this parcel of land before the I-69 turtle introduction were radio-tracked during 2013 and 2014. Data from the I-69 turtles will be compared to those of the resident turtles to assess the success of the translocation.
BIRDSBald Eagle
Each year, biologists catalog new bald eagle (Hali-aeetus leucocephalus) nest sites in the state. Surveys by helicopter once helped monitor bald eagle nesting in Indiana, but were discontinued after 2010. Now most newly discovered bald eagle nests are brought to our attention by property managers and the public.
During the last comprehensive survey in 2010, 120 An eastern box turtle with a transmitter attached to its carapace (top part of the shell).

2015 Wildlife Science Report—Wildlife Diversity 13
eagle pairs were known in Indiana. Approximately 20 new nests were reported in 2011, and another 35 in 2012. Thirty-five additional nests were discovered in 2013, and 28 in 2014. This year, 24 new bald eagle nests were reported, although a few were new nests in territories that already had other nests. Three of these nests represent new Indiana county records for Marshall and Scott counties. Bald eagle nesting is now documented in 80 of Indiana’s 92 counties. The current population is likely around 250-300 breeding pairs.
Winter surveys were also conducted as another way to monitor long-term eagle population trends in the region. The National Midwinter Bald Eagle Survey, coordinated by the U.S. Army Corps of Engineers, has been conduct-ed in Indiana since 1979. This year, eagles were surveyed from the ground at 11 locations, mainly DFW properties or public lakes. Surveys were also taken by helicopter at four survey routes along rivers that are typically inac-cessible by foot. The number of bald eagles tallied at these sites was 243 individuals, which is 40% above the
previous 10-year average of 174 eagles for the state. At the 10 sites surveyed from the ground in both of the past two years, 167 bald eagles were counted compared to 147 in 2014. Among the individuals counts, greatest concentrations of eagles were observed at a night roost along Sugar Creek (37 eagles), the Wabash River in Knox County (34), night roosts on the Mississinewa (32) and Salamonie (31) rivers, and Monroe Lake (29).
Winter bald eagle counts can vary dramatically depending on the severity of winter, the availability of prey (fish and waterfowl), and open water. Indiana attracts more eagles during cold winters when more northern birds are forced to venture south for food; however, there is evidence of a stable upward trend of bald eagles wintering in Indiana. A 2015 article in the Journal of Raptor Research analyzed data collected from the National Midwinter Bald Eagle Survey and re-ported a significant yearly increase of 3.6% in Indiana’s wintering adult bald eagle population and 3.9% for its immature eagles from 1986–2010. Our current data support this 25-year trend. We are seeing more bald eagles winter in Indiana each year. Nationwide, bald eagle populations are increasing by 0.6% each year.
Judging from our post-delisting monitoring efforts, our country’s bald eagle population is stable and healthy. This is a huge accomplishment for conserva-tion. After World War II, the effects of DDT and other pesticides caused dramatic population declines in numerous raptors, including the bald eagle.
Our national symbol was declared recovered in 2007 and removed from the federal endangered species list. Indiana followed suit in 2008 after reaching a goal of 50 nesting pairs. This was a significant achievement—no eagles were known to have nested in the state from about 1900–1988. Restoration efforts from 1985–1989, when 73 eaglets from Wisconsin and Alaska were raised and released at Monroe Lake, contributed greatly to the statewide recovery.
Remarkably, one of these 73 eaglets was observed returning to Monroe Lake this past summer. Bald
C43 in flight. (Photo by Teresa Bass)
Previously known nests (red) and new nests discovered in 2015 (blue) for bald eagles in Indiana.

2015 Wildlife Science Report—Wildlife Diversity14
eagle #C43 was spotted by Cassie Hudson, assistant nongame mammal biologist, and friends as they were on a boat ride in late May. Photos were taken by Teresa Bass and shared with Amy Kearns, the as-sistant nongame bird biologist, and retired nongame bird biologist John Castrale, who identified the bird as C43. Records state that C43 was removed from a nest in Whitestone Harbor, Alaska on July 22, 1988, mak-ing her 27 years old, arguably one of the oldest bald eagles in Indiana. Photos also revealed that she had a brood patch. This indicates she is still raising young. C43 is a powerful reminder of the tireless and deter-mined effort to recover this species, and a symbol of hope for our state’s endangered species.
OspreyFrom 2003–2006, 96 young ospreys (Pandion haliae-
tus) were taken from nests in coastal areas of Virginia and raised and released at four locations in Indiana in an attempt to restore this state-endangered bird. As a result of this effort and the erection of nesting plat-forms in a partnership between the Indiana DNR and private groups and individuals, the state’s osprey pop-ulation has grown steadily. The population has exceed-ed the state’s delisting goal of sustaining 50 breeding pairs, and as a result, osprey are being considered for removal from the Indiana list of endangered species.
Ospreys are large, eagle-like birds that are fascinat-ing to watch. A reversible toe allows them to easily grasp and carry fish in flight. They are most commonly found during spring and fall migrations while hover-ing, diving and catching fish in the open waters of Indiana’s lakes, ponds and rivers. Historically, a few remained to nest, building large stick nests in dead trees near the shoreline or on islands in lakes, rivers or wetlands. Now, osprey nests are most often found on man-made structures, including cell towers, utility poles and nesting platforms built specifically for them.
Monitoring efforts continued for osprey in Indiana
during 2015, with 91 sites checked. The sites included previous nests, nesting platforms, and locations with reports of new nests. Eleven new nests were found. Overall, 69 sites had osprey or osprey nests present (compared to 68 in 2014), with 62 (59 in 2014) pairs believed to have laid eggs. Of those, 59 (53 in 2014) were thought to be successful. At least 102 (96 in 2014) chicks were produced, but this is a significant underestimate because it is difficult to observe all young in the nest from the ground.
Osprey pairs are present in 22 of Indiana’s 92 coun-ties and tend to cluster with the largest number of nests in Kosciusko (14 nests or pairs), St. Joseph (10), Orange (seven), Steuben (six), and LaGrange (five) counties. Public areas with the largest concentrations of osprey nests are Patoka Lake, Pigeon River Fish & Wildlife Area (FWA), Potato Creek State Park, and Brookville Lake. Nests in 2015 were built on com-munication towers (26), nesting platforms (20), utility towers or poles (13), dead trees (four), a grain silo, an abandoned crane, and stadium lights (one each).
As communication towers have become increasingly used by ospreys, companies that service the equip-ment are encountering and recognizing osprey nests. Many companies contact the DFW for guidance, and most are willing and able to delay maintenance on the towers until after the nesting season. Although vacant nests can be removed from towers without a permit, companies are encouraged to maintain at least part of the nest structure at a location on the tower where it is less likely to interfere with the tower’s operation.
A notable sighting this year included a banded os-prey at one of the nests on Patoka Lake. A 12-year-old osprey, identified as H27, was photographed by Jason Massey. Historical records show that H27 was released at Patoka Lake in 2003 during the osprey reintroduc-tion project.
This bird acts a gentle reminder of the success of our reintroduction programs, and that our ospreys are healthy and thriving. As long as unpolluted water-ways, healthy fish populations, and suitable nest sites exist, the outlook for ospreys in Indiana is promising. For the fourth consecutive year, the number of osprey
Osprey H27, age 12. Notice the aluminum bands on each leg. (Photo by Jason Massey)
Annual number of osprey territories in Indiana from 2000 to 2015.

2015 Wildlife Science Report—Wildlife Diversity 15
Locations of osprey pairs or nests in Indiana in 2015.
pairs exceeded the recovery goal of 50. This develop-ment has prompted the species’ proposed delisting by DFW staff.
Interior Least TernThe least tern (Sternula antillarum) is the smallest
species of tern in America. Its black cap, white forehead, and bright yellow bill distinguish it from other terns. Least terns feed on small fish and aquatic invertebrates and nest on the ground on sand bars or gravel islands, often in open areas. Its current population is found along the coasts and within the interior, following major rivers like the Mississippi, Ohio and Wabash. Significant declines caused by human use and modification of breeding habitat in rivers have rendered the interior population of least terns federally endangered.
As a ground-nesting bird found along major rivers, the interior least tern is greatly influenced by water. They often benefit from water around islands or river
bars because surrounding water protects their nests by making them less accessible to ground preda-tors. However, when rivers become high, they reduce the size of river bars, which lessens suitable habitat available for nesting. Heavy rains also flood nests and cause abandonment or major losses of eggs and chicks.
Continuous, heavy rains occurred this year through-out the Midwest, which caused rivers to swell and flood frequently. In the past, high water in key nesting areas along the Mississippi River has resulted in least terns venturing north to Indiana in search of nesting sites. However, water levels in southwestern Indiana along the Wabash and Ohio rivers were high and offered few sandbars or islands suitable for nesting. Adult least terns were later observed nesting in Indi-ana at human-constructed sites close to these rivers.
The first least terns reported in Indiana in 2015 were noted at a property owned by the Peabody Coal Com-pany called the Wheeling Bottoms on May 20. Birds were last seen on September 1, on the Wabash River north of the Interstate-64 bridges. At Gibson Lake near the Wabash River, 230 adults were present, the second-highest count since this site has been monitored. Six-teen miles east, at Wheeling Bottoms, 30 adults were observed, and the colony produced about 15 young. At the American Electric Power (AEP) Rockport Plant in Spencer County, 60 adults were noted. Eight adults returned to Goose Pond FWA in Greene County, where three nests were attempted on an island designed for them. These nests successfully fledged four young, a record high for this colony.
Working closely with Duke Energy, the USFWS, and AEP, we closely monitored least tern colonies at two main nesting locations and took steps to help ensure successful nesting. In Gibson County, least terns nested on properties owned and managed by Duke Energy and the U.S. Fish and Wildlife Service (Cane Ridge WMA).
An estimated 185 nests produced a conservative esti-mate of 99 fledglings in 2015. Eighty-seven nests were found during the early part of the breeding season, while another 98 were tallied later. The increase was
Annual number of least tern fledglings at Gibson Lake and surrounding areas over the past 10 years.

2015 Wildlife Science Report—Wildlife Diversity16
the result of pairs re-nesting after failed attempts, and birds showing up from other parts of their range.
The elevated number of late nests suggests high lev-els of predation and other sources of nest failure this year. More than half of all nests and young produced were on the center dike of Gibson Lake (101 nests). The remainder were at Cane Ridge (59) and a coal ash disposal area (25). No nesting occurred at Tern Bar Slough, although least terns were seen there, foraging and loafing. Pump problems again limited water levels at Cane Ridge. Nesting islands at Tern Bar Slough were left without a protective moat for most of the season.
At the AEP Rockport plant in Spencer County, an electric fence was placed around the main nesting site to reduce predation by mammals and prevent Canada Geese (Branta canadensis) from loafing on the dike. At least 40 young were produced from 34 nests, record highs for this site, which is located along the Ohio River about 50 miles southeast of the Gibson Lake colony. Least terns have been present there since 2003. The nesting site is a short, narrow dike separating some retention ponds. A nearby dredge island in the Ohio River sometimes has nesting terns, but few birds were seen this year due to high water levels.
Management of least terns is challenging. It consists of maintaining nesting sites to keep them free of dense vegetation, using fencing and manipulating water lev-els to deter ground predators, and employing least tern decoys to attract birds to suitable sites. These efforts have resulted in more than adequate production in eight out of the last nine years, and a steadily increas-ing population of least terns in Indiana since their discovery in the state in 1986.
Barn OwlBarn owls (Tyto alba) are ghostly pale, with whit-
ish underparts and buffy light-brown upperparts. They have black eyes and a heart-shaped face, prompting
One interior least tern chick and egg in its nest at Goose Pond FWA in early July.
some to call them the monkey-faced owl. Barn owls feed at night, most often on voles and mice. They never hoot. Instead, they give eerie, raspy calls.
Habitat loss has caused barn owls to become rare in Indiana. They are found primarily in southern counties. Barn owl numbers depend on the availability of grassland-type habitat, suitable nest sites, winter severity, and predation by great horned owls (Bubo virginianus) and raccoons (Procyon lotor). To find food, they need open areas of permanent grassland such as pastures, hayfields, prairies and the margins of wetlands. Their nesting sites include cavities in large trees and human structures like haylofts, steeples, silos, and other buildings.
In an effort to provide barn owls with secure nesting sites that are protected from raccoons and other preda-tors, the DNR has built more than 300 nest boxes and erected them in barns and other structures in suitable habitat statewide over the past three decades. Al-though many of these structures have been destroyed, existing boxes are checked periodically and new ones erected for this secretive and rare owl. Ten barn owl nests were reported in 2015.
Wildlife Science biologists are seeking reports of barn owls, especially if they are nesting. Placing nest boxes in a barn or other building protects owls from predators so they can raise more young.
Peregrine FalconMore than 300 breeding pairs of peregrine falcons
(Falco peregrinus) are present in the Midwest. That number is several times greater than the 60–80 pairs estimated to have been present historically. Indiana’s population has similarly expanded, and in 2013, the peregrine falcon was removed from the state list of
Barn owlets protected in a nest box. Notice the difference in size among these owlets to indicate difference in age. Barn owl eggs hatch at different times, causing the first chick to hatch to be older than its siblings.

2015 Wildlife Science Report—Wildlife Diversity 17
endangered species. It is now considered a species of special concern.
Falconers are also now permitted to trap an un-banded juvenile peregrine in the fall to be used for falconry. Only one bird can be taken in Indiana, and only 12 falcons can be captured in the entire Missis-sippi Flyway this year. In 2014, one passage (i.e., non-locally produced) peregrine was captured for falconry. In 2015, permits were issued to trap but no peregrines were captured. Peregrine falcons taken by falconers are most likely migrants from populations breeding in Arctic regions.
Breeding by peregrine falcons in Indiana has re-mained stable and relatively unchanged for the past four years. In 2015, 20 locations had peregrines pres-ent during part of the nesting season, compared to 21 locations in 2014. Fifteen nesting attempts were docu-mented (16 in 2014), 14 were successful (13 in 2014), 41 chicks were banded (43 in 2014), and 44 young fledged (40 in 2014). Three chicks were not banded because one site was inaccessible for banding, another bird flew from the nest box, and the other was not captured due to safety concerns.
Signs of trichomoniasis, sometimes called “frounce”
in falcons, were found in a chick from a Fort Wayne nest. Trichomoniasis is an upper digestive tract disease that is often fatal in young birds. A local veterinarian treated the bird, and it was returned to its nest box. Its siblings were also treated, and all fledged without inci-dent. Another chick from a nest in Gary was retrieved from the ground and euthanized because it had an advanced case of trichomoniasis. This year, only one nest failed to produce chicks and eight unhatched eggs were collected.
Because many young falcons are banded in the nest each year, much is known about them. Of the adults in the 15 territories where eggs were laid in 2015, 12 were unbanded, 17 were identified by their leg bands, and one individual was not observed well enough to identify. Identified adults had origins in seven differ-ent states: Indiana (seven), Illinois (three), Wisconsin (two), Kentucky (two), and Michigan, Ohio and Mis-souri (one each). All breeding adults were produced in the wild except one that was hacked in Missouri. At least three falcons were nesting for the first time in In-diana. Ages of females ranged from 2–16 years of age. Males were 2–10 years old.
Reports of recovered bands have also provided updates on peregrines banded in Indiana. A female banded in New Albany in 2013 was found dead near Stratton, Ohio. Another young female that was banded in Fort Wayne in 2013 was found near a high school in Chicago with a gunshot wound to its wing. She died several days later. She had been reported wintering near that site.
On a lighter note, a female hatched in 2007 from South Bend is back nesting at a county courthouse in Wisconsin for her sixth year. A female produced at the coke plant in Gary is nesting in Milwaukee for the fifth year.
Of the 15 peregrine nest attempts in Indiana this year, most are close to a large body of water. Indiana’s
Annual number of peregrine falcon chicks fledged in Indiana from 1989 to 2015.
Four banded peregrine falcon chicks at Carmeuse Lime Plant, Gary, in May of 2015.
A peregrine in flight over Michigan City Harbor in May of 2015.

2015 Wildlife Science Report—Wildlife Diversity18
nesting pairs were found near Lake Michigan (eight nests), the Ohio River (two), White River (two), Kanka-kee River (one), and the three rivers of Fort Wayne (St. Mary’s, Maumee, St. Joseph—one each). Two nests are in downtown urban areas on office buildings. The remainder are in industrial areas: power plants (seven), steel mills (four), an oil refinery, and a lime plant. Data from the past four years of surveys have provided evidence that Indiana’s breeding population remains productive. Despite that, we will likely continue our post-delisting monitoring efforts, with the help of volunteers, to help ensure that the population remains healthy and stable.
Loggerhead ShrikeThe loggerhead shrike (Lanius ludovicianus) is
a songbird slightly smaller than a robin. Its striking appearance includes a broad black mask through the eyes, gray back and breast, a white spot on black wings, and white edges on a black tail.
Despite their small, robin-like stature, shrikes have habits similar to those of a sizeable raptor. Their strong, hooked bill allows them to take prey that is comparatively large. They compensate for their lack of talons by hanging their prey from thorns or barbed wire. Doing so provides an anchor while they tear their prey into bite-sized pieces. Prey hung in this way can also be stored for later. This behavior has earned them the nickname of “butcher bird,” which is unique to North American shrikes.
Shrikes have a diverse diet of prey, including bee-tles, grasshoppers, wasps, spiders, mice, voles, house sparrows, snakes and frogs. They hunt from perches, scanning the ground from a utility wire, post, fence or plant stalk, and pouncing on prey spied below.
Habitats for shrikes consist of grasslands, deserts, shrub lands and agricultural areas. Shrikes prefer
smaller fields planted to a variety of crops bordered by shrubby hedgerows and fence lines, and livestock pasture with short vegetation. Nests are substantial structures made of small twigs and grass, lined with horse hair or wool, and placed in a shrub or small tree. Eastern red cedars and multiflora rose bushes are favorite nesting sites in Indiana, especially when the bush is isolated within a fencerow. Shrikes sometimes nest twice in one season, especially if the first nesting attempt fails.
Loggerhead shrikes have been undergoing alarming population declines in the eastern United States. They are a state endangered bird in Indiana and many other states. Reasons for this decline are puzzling and likely include a combination of factors. The loss of quality breeding habitat, the use of pesticides, and increasing human development on its wintering grounds in the southern United States are among the many threats this species faces. Loggerhead shrikes were included on Indiana’s state endangered list when it was first developed in 1981, and they remain there today.
In 1999–2000, DFW biologists did extensive survey-ing for shrikes and found 58 territories in 1999 and 45 territories in 2000. In the years since, shrikes have declined dramatically. Fewer than 10 nesting territories have been reported annually in the entire state since surveys resumed in 2010.
Each spring and summer since 2010, DFW biologists have conducted surveys in areas with historical shrike nesting territories. Nearly all nests found in recent years have been located on or adjacent to traditional Amish farms. Due to a shortage of DFW staff, survey efforts were limited this year. In 2015, two nesting territories were located in Daviess County, and one was found in Orange County. One nest was found, two nests successfully fledged young, and one nesting
Clues like this fly impaled on barbed wire indicate the presence of a loggerhead shrike.
The unique combination of color bands on the legs of this loggerhead shrike in Orange County identifies him for tracking.

2015 Wildlife Science Report—Wildlife Diversity 19
attempt failed when the fencerow containing the nest bush was cleared.
Landowners can help shrikes and other wildlife by preserving their fencerows and the shrubs that grow along them. Because shrikes typically build their nests in isolated bushes and trees along a fencerow, eliminating these linear features effectively destroys the nesting habitat for this unique species. If fencerows need to be cleared, in order to help shrikes, it is best to wait until after the nesting season (late April to late August) to give baby birds a better chance to survive. Fencerows provide nesting habitat for other native birds besides shrikes and food and cover for game species like deer, rabbits, and bobwhite quail. Farms with healthy, shrubby fencerows have a greater diversity of native wildlife than those without, and many of these native species are beneficial for insect and pest control.
Sandhill CraneThe sandhill crane (Grus canadensis) is a long-
legged, long-necked waterbird that can be confused with the somewhat similar-appearing but unrelated great blue heron (Ardea herodias), which is sometimes inappropriately referred to as the blue crane.
Sandhills fly with their necks outstretched. An in-dividual is almost always seen with its mate, family group, or flocks numbering from a couple of dozen to the hundreds. During fall and spring migrations, groups of 50–100 are most commonly encountered ei-ther flying in a loose V-formation, circling as they catch updrafts, or descending to a field to feed or roost for the night. Their bugling calls are usually heard before the flock is seen.
Sandhill cranes can be observed in agricultural fields near roosting sites during the day. They eat waste grain, as well as a variety of aquatic plants, invertebrates, and small vertebrates to refuel for their daily migra-tions. At night, they normally roost in the shallow water of marshes or in fields. During breeding season, the expanding eastern population nests in marshes in the upper Great Lakes states and southern Canada. Nesting has been noted in Indiana since the early 1980s and now occurs in the northern quarter of the state.
Each year, the USFWS coordinates a fall survey of the eastern population of sandhill cranes to monitor changes in abundance. Much of the population stops at Jasper-Pulaski FWA in northwestern Indiana before venturing south to wintering areas in Tennessee, Georgia and Florida.
Public properties and other areas with a history of stopovers by sandhill cranes were surveyed, and DFW staff and volunteers were asked to report sightings of cranes on the target survey dates of Oct. 29 and Nov. 10. During the survey on Oct. 29, Jasper-Pulaski FWA had 5,950 sandhill cranes present. Lesser numbers were present at a private property adjacent to Kingsbury FWA (648), and at Pigeon River FWA
(526), Muscatatuck National Wildlife Refuge (NWR) (96, surveyed Nov. 3), Kingsbury FWA (eight), Boot Lake (five), and Willow Slough FWA (one). No cranes were observed at more southerly areas: Atterbury FWA, Goose Pond FWA, Brookville Lake, Ewing Bottoms in Jackson County, Lieber Preserve, Knightstown Reservoir, or Monroe Lake.
During the survey on Nov. 10, Jasper-Pulaski FWA had the most sandhill cranes present, reaching 7,968 on Nov 12. Fewer cranes were observed at the private property adjacent to Kingsbury FWA (1,256), Pigeon River FWA (559), Boot Lake (105), Muscatatuck NWR (89), and Monroe Lake (five). No cranes were found at Kingsbury FWA, Atterbury FWA, Goose Pond FWA, Brookville Lake, Ewing Bottoms, Willow Slough FWA, Lieber Preserve, or Knightstown Reservoir. Many sand-hill cranes had not yet moved south into Indiana from Wisconsin, Michigan, and other northern locales.
In addition to the USFWS fall count, weekly crane surveys were conducted at Jasper-Pulaski FWA. Counts exceeded 7,000 birds from mid-November to mid-December with more than 10,000 cranes from Nov. 19 to Dec. 10, with a peak of 24,233 on Nov. 19. This number is comparable to the previous aver-age 10-year peak count of 22,057 sandhill cranes at Jasper-Pulaski FWA.
Whooping CranesOne of the rarest bird species in the world, whoop-
ing cranes (Grus americana) migrate through Indiana in spring and fall, and sometimes spend much of the winter in our state's wetlands.
Standing five feet tall, they can be easily identified by their size, as well as by their deep red crowns and black mustaches against an almost entirely blank can-vas of snowy, white feathers. Their beautiful plumage and size often grab viewers’ attention, especially when they are mixed in with a flock of their smaller, drabber cousin species, the sandhill crane.
It is vitally important that humans view these endangered birds from a distance, and do not attempt
Annual peak numbers of sandhill cranes counted during fall surveys at Jasper-Pulaski FWA since 1978.

2015 Wildlife Science Report—Wildlife Diversity20
to approach or feed them. The reason is birds that learn to approach vehicles for food often die after being hit by cars. Illegal shooting is also a concern—several cranes were shot by poachers in the state in recent years.
In the fall of 2015, there were only 92 whooping cranes in the eastern migratory flock, the population that migrates through Indiana. These birds nest in Wisconsin, where reproduction attempts have been plagued by predators, parasitic black flies, infertility, and nest abandonment issues. Currently, the whoop-ing crane population is not self-sustaining, but it is augmented each year by a handful of young birds that are introduced to the wild in a variety of ways. The most famous technique is when the birds are raised by humans in white crane costumes and taught to migrate by following an ultralight aircraft.
This spring, a pair of whooping cranes stayed in Indiana well past the time when they should have migrated. This, and their secretive behavior, led biolo-gists to suspect they were nesting. By late April, the male of the pair was seen alone, calling frequently and exhibiting signs of distress. A search found the female dead near her nest. The cause of death could not be determined, but predation by a coyote (Canis latrans) or bobcat (Lynx rufus) is likely. This event marks the first time a whooping crane nest was documented in our state, as well as the first time a nest has been built outside of Wisconsin by a bird from the eastern migra-tory population.
Male whooping crane #12-09 spent the winter, summer, and fall in southern Indiana. (Photo by Steve Gifford)
Colonial Waterbirds“Colonial waterbirds” refers to several types of
aquatic birds that nest close to each other. These include herons, egrets, cormorants, terns, and gulls. In Indiana, colonies of black-crowned night-herons (Nycticorax nycticorax), great egrets (Ardea alba), and double-crested cormorants (Phalacrocorax auritus) are counted annually along the lakeshore.
Both heron and egret species are state-listed and are monitored yearly for early detection of possible population declines. Double-crested cormorants are not endangered, but are viewed with concern in the Midwest because increasing populations pose a potential threat to local fisheries and compete for nest
Annual number of double-crested cormorant nests at the ArcelorMittal Steel plant in Lake County from 2004–2015.
2015 Wildlife Science Report—Wildlife Diversity 21
sites with these less common heron and egret species.Indiana is also involved in the Great Lakes Colonial
Waterbird Survey, which requires periodic assessment of two large gull colonies along Lake Michigan. Nests were last counted in 2011. Tallies of 9,517 ring-billed gull (Larus delawarensis) and 205 herring gull (Larus argentatus) nests were taken at ArcelorMittal Steel West, and 23,899 ring-billed and 28 herring gull nests at ArcelorMittal Steel East. These sites represent our main waterbird survey locations.
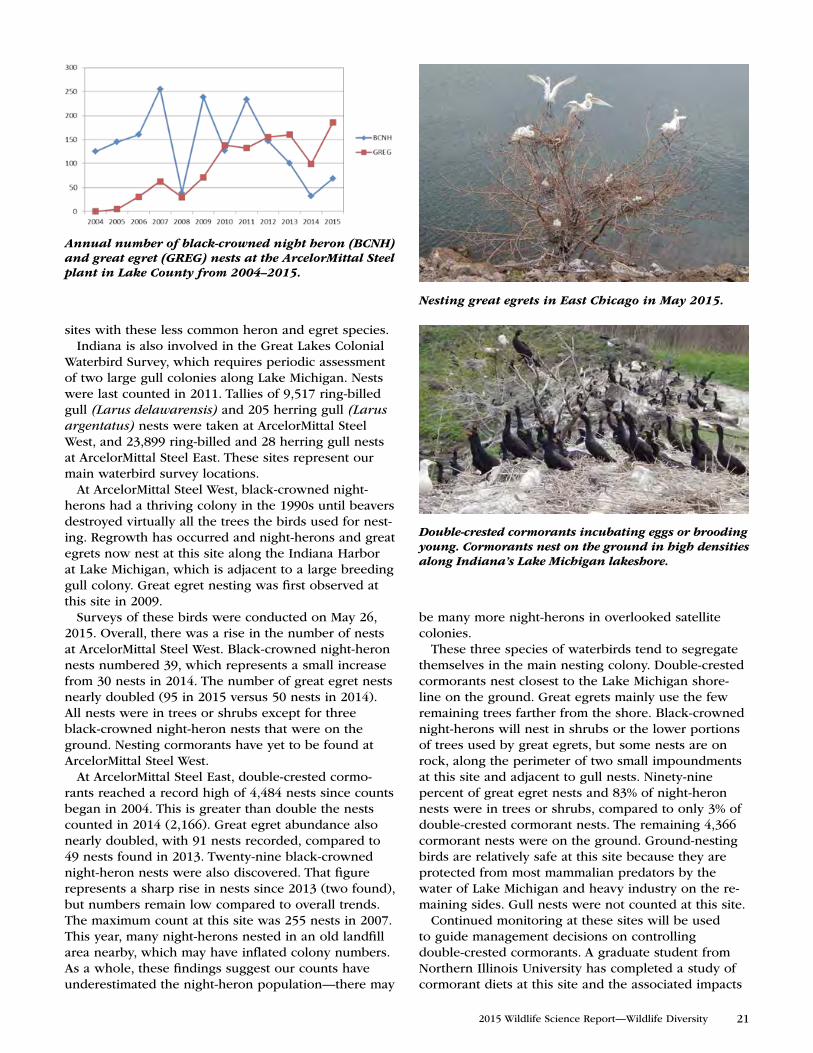
At ArcelorMittal Steel West, black-crowned night-herons had a thriving colony in the 1990s until beavers destroyed virtually all the trees the birds used for nest-ing. Regrowth has occurred and night-herons and great egrets now nest at this site along the Indiana Harbor at Lake Michigan, which is adjacent to a large breeding gull colony. Great egret nesting was first observed at this site in 2009.
Surveys of these birds were conducted on May 26, 2015. Overall, there was a rise in the number of nests at ArcelorMittal Steel West. Black-crowned night-heron nests numbered 39, which represents a small increase from 30 nests in 2014. The number of great egret nests nearly doubled (95 in 2015 versus 50 nests in 2014). All nests were in trees or shrubs except for three black-crowned night-heron nests that were on the ground. Nesting cormorants have yet to be found at ArcelorMittal Steel West.
At ArcelorMittal Steel East, double-crested cormo-rants reached a record high of 4,484 nests since counts began in 2004. This is greater than double the nests counted in 2014 (2,166). Great egret abundance also nearly doubled, with 91 nests recorded, compared to 49 nests found in 2013. Twenty-nine black-crowned night-heron nests were also discovered. That figure represents a sharp rise in nests since 2013 (two found), but numbers remain low compared to overall trends. The maximum count at this site was 255 nests in 2007. This year, many night-herons nested in an old landfill area nearby, which may have inflated colony numbers. As a whole, these findings suggest our counts have underestimated the night-heron population—there may
be many more night-herons in overlooked satellite colonies.
These three species of waterbirds tend to segregate themselves in the main nesting colony. Double-crested cormorants nest closest to the Lake Michigan shore-line on the ground. Great egrets mainly use the few remaining trees farther from the shore. Black-crowned night-herons will nest in shrubs or the lower portions of trees used by great egrets, but some nests are on rock, along the perimeter of two small impoundments at this site and adjacent to gull nests. Ninety-nine percent of great egret nests and 83% of night-heron nests were in trees or shrubs, compared to only 3% of double-crested cormorant nests. The remaining 4,366 cormorant nests were on the ground. Ground-nesting birds are relatively safe at this site because they are protected from most mammalian predators by the water of Lake Michigan and heavy industry on the re-maining sides. Gull nests were not counted at this site.
Continued monitoring at these sites will be used to guide management decisions on controlling double-crested cormorants. A graduate student from Northern Illinois University has completed a study of cormorant diets at this site and the associated impacts
Annual number of black-crowned night heron (BCNH) and great egret (GREG) nests at the ArcelorMittal Steel plant in Lake County from 2004–2015.
Nesting great egrets in East Chicago in May 2015.
Double-crested cormorants incubating eggs or brooding young. Cormorants nest on the ground in high densities along Indiana’s Lake Michigan lakeshore.

2015 Wildlife Science Report—Wildlife Diversity22
on Lake Michigan fisheries. A report is currently being prepared. We look forward to its findings to help guide us as cormorant populations in Indiana change.
Marshbird SurveysThe term “marshbirds” comprises a diverse array of
birds from different groups that include bitterns, rails, gallinules, and grebes. These birds are difficult to survey because they reside in dense emergent vegetation and are inconsistently vocal during the breeding season. Thus, little is known about their numbers, population trends, and responses to habitat changes and land management practices. A standardized protocol that uses playbacks of vocalizations is used to study them throughout North America.
In Indiana, short-term surveys employing playbacks have been used on occasion, primarily to learn about the distribution and relative abundance of marshbirds. In 2010, the Indiana office of the National Audubon Society set up survey points at the 8,000-acre Goose Pond FWA in Greene County. This expansive mix of shallow wetlands, ditches and upland grasslands provides extensive habitat for rails and bitterns. In 2012, the DFW became the responsible party for ad-ministering this survey at Goose Pond FWA and also established additional routes at the 840-acre Tern Bar Slough in Gibson County. The purpose of these sur-veys was to determine the relative density of rail and bittern species and study how species diversity and populations change over time.
This year, agency staff and volunteers again surveyed 26 points along eight routes at Goose Pond FWA, while the smaller Tern Bar Slough site had two routes and nine points. Surveys were conducted during three two-
week time periods from mid-April through May. Target species recorded were American bittern, least bittern (Ixobrychus exilis), king rail (Rallus elegans), Virginia rail (Rallus limicola) and sora (Porzana carolina). Non-target species noted included pied-billed grebe (Podilymbus podiceps), common gallinule (Gallinula galeata), American coot (Fulica americana), Wilson’s snipe (Gallinago delicata), sedge wren (Cistothorus platensis), marsh wren (C. palustris) and swamp sparrow (Melospiza georgiana).
A total of 121 unique detections were logged of target species in 2015. Sora and American bittern were the most common species detected at both locations. Soras and Virginia rails are mostly migrants in southern Indiana, while bittern species and king rails regularly breed there. All species except least bittern are detected most commonly on earlier surveys due to the timing of migration and higher calling frequencies before egg-laying.
All rail and bittern species except sora are on the Indiana list of endangered species. This is likely because marshes and other wetlands have been destroyed or
The state-endangered king rail is a secretive marshbird that regularly breeds in southern Indiana. The species is difficult to find, but can be best detected before the bird lays its eggs, because that’s when it calls the most to announce its territories. (photo by Steve Gifford)
Number of marshbirds detected at 26 survey points, Goose Pond FWA, 2012–2015.
Number of marshbirds detected at nine survey points, Tern Bar Slough, 2012–2015.

2015 Wildlife Science Report—Wildlife Diversity 23
degraded over the years, and quality wetlands are difficult to find. Marshbird surveys at restoration projects such as Goose Pond FWA and Tern Bar Slough demonstrate that wetland birds will readily discover and use these habitats.
ShorebirdsGoose Pond FWA is one of the largest wetland resto-
rations in the United States, with 8,933 acres managed and owned by the Indiana DFW. It not only boasts a diversity of habitats, wildlife, and rare migrants, but also is located near the migratory pathways of the Wa-bash and East Fork of the White River..
These characteristics make Goose Pond FWA a vitally important stopover point. For long-distance migrants, the presence of suitable foraging habitat could mean the difference between life and death. Shorebirds must build adequate fuel reserves during stopovers to survive their remaining journey. This may require individuals to increase their size by upwards of 10% of their current body size per day—some in spring may fly straight from Goose Pond FWA to their nesting territories in the Arctic, or south to the Gulf of Mexico during fall.
Thirty-five shorebird species, including the feder-ally endangered piping plover, have been recorded at Goose Pond FWA. Eight shorebird species that are of
greatest conservation need in Indiana are regular visi-tors or breeders on the property.
Shorebird surveyors observed and recorded 13,192 individual shorebirds of 30 different species at Goose Pond FWA during the 2015 spring and fall survey periods. With 2,186 individuals recorded, killdeer (Charadrius vociferous) were the most numerous species, representing 16.6% of individual shorebirds surveyed. Over one thousand individuals of five other species were recorded including pectoral sandpiper (Calidris melanotos; 1,794; 13.6%), lesser yellowlegs (Tringa flavipes; 1,706; 12.9%), least sandpiper (Calid-ris minutilla; 1,466; 11.1%), dunlin (Calidris alpine; 1,313; 10.0%), and black-necked stilt (Himantopus mexicanus; 1,082; 8.2%). Together, these six species represented 72.4% of all observed individuals. Twenty-four species represent the remaining 27.6% of indi-viduals recorded. The diversity of shorebird species observed during the 2015 survey at Goose Pond FWA was notable. Thirty of the 36 (83%) regularly occurring (annual or near annual) shorebird species in the state were recorded. Based on historical records maintained by Ken Brock, no other public property in Indiana has documented this many regularly occurring shorebird species in a single year. Surveys will be continued next year to further investigate shorebird population trends at Goose Pond FWA.
FISH & FRESHWATER MUSSELSFloodplain Fish Sampling
Flooding that started at the beginning of June and lasted until August provided some unique opportunities to sample fish in large river floodplain areas across the state that normally would not have water near the end of the summer. Fish sampling was conducted in floodplain ponds (which in some cases could more appropriately be called puddles), ditches, and oxbows in Tippecanoe, Fountain, Sullivan, Knox
Flooded riparian area along the Wabash River in Tippecanoe County.
Number of shorebirds detected during the 2015 shorebird survey at Goose Pond FWA. The term “peep species” refers to a group of five sandpiper species that are difficult to distinguish during any time of the year: white-rumped, Baird’s, western, semipalmated, and least sandpipers.

2015 Wildlife Science Report—Wildlife Diversity24
Wildlife Science assistant biologist JoAnne Davis stirs up some fish in a flooded field in Tippecanoe County.
Flooded field in Sullivan County.
Spotted gar collected from Kelley Bayou in Sullivan County.
Flooded field in Knox County, with very harsh conditions.
Abundant YOY common carp, silver carp and grass carp collected from a flooded field in Knox County.
YOY grass carp from floodplain pond along the East Fork White River in Jackson County.

2015 Wildlife Science Report—Wildlife Diversity 25
Redbelly tilapia collected from a flooded field in Tippecanoe County.
and Jackson counties. Fish were collected using seines, dip nets, and backpack electrofishing equipment.
Most of the locations sampled had abundant fish populations, including both adult and young of the year (YOY) fish. Habitats were generally shallow, with murky, hot, low-oxygenated water and mucky, hard-pan bottoms. Some of the locations were puddles that were literally drying up (most were on the verge of drying up completely) in the middle of washed-out corn or soybean fields. Even with these harsh conditions, as many as 40 species were collected at some sites.
Native species such as longnose gar (Lepisosteus osseus), shortnose gar (L. platostomus), spotted gar (L. oculatus), gizzard shad (Dorosoma cepedianum), bigmouth buffalo (Ictiobus cyprinellus), western mos-quitofish (Gambusia affinis), bluegill (Lepomis mac-rochirus), largemouth bass (Micropterus salmoides), white crappie (Pomoxis annularis), and black crappie (P. nigromaculatus) were common and present at most locations sampled. No endangered or special concern fish species were encountered.
Non-native species such as common carp (Cyprinus carpio), grass carp (Ctenopharyngodon idella), silver carp (Hypophthalmichthys molitrix), and bighead carp (H. nobilis) were also abundant and common across the locations sampled. YOY silver carp were found farther upstream on the Wabash River (Tippecanoe County) and the East Fork White River ( Jackson County) than previously known. YOY grass carp were also collected from Jackson County. This is the first time reproduction of this species has been documented above Williams Dam in the East Fork White River drainage. Several large redbelly tilapia (Tilapia zillii) were collected at one location (at the confluence of the Wabash and Tippecanoe rivers) and presumably escaped from an aquaculture pond somewhere nearby during the flooding.
Most of the sites that were sampled dried up com-pletely by September. These habitats provided ample feeding opportunities for birds and other animals, and likely resulted in the loss of millions of fish.
Northern Riffleshell Augmentation in the Tippecanoe River and Clubshell Reintroduction in the Eel River
Northern riffleshell (Epioblasma torulosa rangiana) and clubshell (Pleurobema clava) were once both widely distributed within the Ohio River and Lake Erie drainages of Indiana. Northern riffleshell has not been seen live for many years in Indiana but is still considered extant in the Tippecanoe River. Clubshell is still reproducing in the upper section of the Tippecanoe and is still found living in Fish Creek, although reproduction, if occurring there, is at low
The Tippecanoe River in Pulaski County, site of the 2015 northern riffleshell augmentation.
The Eel River in Miami County, location for the clubshell reintroduction in 2015.

2015 Wildlife Science Report—Wildlife Diversity26
levels. Augmenting and strengthening the northern riffleshell population in the Tippecanoe and re-establishing a clubshell population in another Indiana drainage (the Eel River in the upper Wabash River drainage) would provide a better opportunity for the continued persistence of both species in the state.
The salvage of adult northern riffleshell and clubshell (among other species) from the Hunter Station (U.S. 62) bridge replacement project on the Allegheny River in Pennsylvania has provided an unprecedented opportunity to augment and reintroduce populations of both species within their historical ranges. The states of Pennsylvania, Illinois, West Virginia, Kentucky and Ohio have already started augmentation/reintroduction projects. In 2015, Indiana, along with Manchester University and the USFWS (Carterville Fish and Wildlife Conservation Office
and Bloomington Ecological Services Field Office), received approval from the Pennsylvania Fish & Boat Commission to partner in this project.
Before receiving adult mussels from Pennsylvania, a lot of effort was spent finalizing locations for augmen-tation/reintroduction in the Tippecanoe and Eel rivers. Three sites in each river were chosen, permanent grid markers where installed, and quantitative mussel sam-pling was completed. At least 30 quadrats (0.25–m² in size) were dug at each site to determine mussel densi-ties before release of northern riffleshell and clubshell.
One hundred fifty northern riffleshell and 150 club-shell arrived in Indiana via overnight FedEx (packed in a cooler with moist burlap and ice) on September 15. Each mussel came with a pit tag epoxied to one valve and a small, numbered plastic tag attached to the other valve. Upon arrival, all mussels were taken directly
A male (top) and female (bottom) northern riffleshell, each with a numbered plastic identification tag affixed to its valve.
Clubshell for reintroduction in the Eel River.
Grids established in the Tippecanoe River where northern riffleshell will be placed.
Wildlife Science assistant biologist JoAnne Davis places a clubshell in the Eel River.

2015 Wildlife Science Report—Wildlife Diversity 27
to their river of destination. Northern riffleshell were placed in a cage (with sand/gravel substrate) in Lake Shafer. Clubshell were placed in two cages in the Eel River.
The next day, northern riffleshell were recovered from the cages, taken to the three sites on the Tippeca-noe and placed in the substrate (50 at each site). Indi-vidual mussels were placed in specific locations along the permanent grid at each site, and their initial loca-tions were recorded by an underwater pit tag reader. The following day, the same procedures were used to release clubshell in the Eel River. Both species in both rivers seemed to be in good health and actively started filtering after placement in the substrate.
Near the end of October, the previously released northern riffleshell and clubshell were monitored. All 300 released mussels were relocated, and none had
Female northern riffleshell filtering after its placement in the Tippecanoe River.
Clubshell filtering after its placement in the Eel River.
moved outside their original area of placement. Five individuals at each site were dug up and examined—all were still alive and closed tightly upon handling. Many were seen actively filtering at each site and many (especially the clubshell) had buried themselves deeply into the substrate. Both species will be monitored for survival into next summer. If survival is good in these pilot studies, more adults of both species will arrive in 2016 for additional augmentation and reintroduction.
Snuffbox Augmentation in the Tippecanoe River
Once present in multiple watersheds of Indiana, the state and federal endangered snuffbox (Epioblasma triquetra) has only been found live in three rivers in recent times: the Salamonie River (Huntington County), Tippecanoe River (White County), and Sugar Creek (Shelby County).
The snuffbox is likely only secure in a 10-mile stretch of the Salamonie, where multiple individuals and juveniles have been found. The other two popula-tions are precarious at best and, if still present, may no longer be reproducing. Augmenting one of these populations would provide a better chance for the continued persistence of snuffbox in Indiana. Fed-eral funding was obtained in 2012 to start a snuffbox augmentation project in the Tippecanoe River using female snuffbox from the Salamonie.
A second year of snuffbox propagation was success-fully completed near the end of April 2015. Procedures were similar to last year’s but with a few changes based on lessons learned in 2014. In anticipation of high water, five female snuffbox were collected from the Salamonie on April 18 and placed in a cage on the river’s bottom for later retrieval. On April 23 and 29, the bases of five cages were filled with substrate and placed in Lake Shafer. Modifications were made to
Submerged cage holding female snuffbox in Salamonie River.

2015 Wildlife Science Report—Wildlife Diversity28
the bases so the tops would fit more tightly, and they would better retain substrate material. Hardware cloth was also inserted beneath the cage tops so logperch (Percina caprodes), the host fish for snuffbox, could be more easily monitored after placement in the cages.
On April 30, 125 logperch were collected (with seines) from the Tippecanoe, downstream of the
Extracting glochidia from a female snuffbox.
Six female snuffbox used for propagation.
The condition of the logperch is inspected during a check in May 2015.
Modified cage for snuffbox culture.
Norway Dam. They were transported to the Salamonie, and the previously collected female snuffbox (along with one additional collected female) were secured. A streamside laboratory was established, and glochidia were extracted from the female snuffbox and used to infect the logperch. This was accomplished by gently prying open the shell of each female just far enough so that a small cork could be placed between the valves, allowing access to the gills. Each gill was then pricked several times along its length using a small needle attached to a syringe. After each prick, glochidia were flushed from the gill into a small container with a steady stream of water from the syringe. The glochidia collected from the six female snuffbox were then used to infect the 125 logperch brought from the Tippecanoe.
Once the culture procedures were completed, the female snuffbox were returned to the Salamonie, from

2015 Wildlife Science Report—Wildlife Diversity 29
A logperch with glochidia (which resembles grains of salt) attached to its gills.
A cage from 2014 is pulled from Lake Shafer to check for juvenile snuffbox.
Juvenile snuffbox recovered from 2014 cages.
alive. Unlike in June, however, their gills appeared to be devoid of glochidia, which would assume that at this point juvenile mussels had dropped. Snuffbox cages with their infected logperch were visited in Lake Shafer near the end of August and remaining logperch were released. The cages will remain in place until summer/fall 2016, then they will be pulled, and the juvenile snuffbox will be harvested and stocked at aug-mentation sites in the Tippecanoe River.
In August, cages placed in the Salamonie in 2014 were pulled and examined for juvenile snuffbox. Seven individuals, which looked very healthy, were recovered. Loss of substrate from the cages and difficulties in keeping logperch alive during the process may have led to the small number of snuffbox produced. Efforts were made in 2015 to correct these problems, so we hope more juvenile snuffbox will be found in these cages next year. Interestingly, of the seven live snuffbox, five were 1+ year old (from 2014) but two were smaller individuals, which means they must have migrated into the 2014 cages from the nearby 2015 cages. This may have been due to the flooded conditions of the Tippecanoe (and Lake Shafer) during much of 2015.
MAMMALSBatsAcoustic bat monitoring stations
Thirteen bat species have been reported from Indi-ana. Each varies in its social structure (solitary or colo-nial), roosting habits (tree foliage, tree cavities, caves and mines, or buildings), and time present in the state (year-round or seasonal). Understanding the status and distribution of such a diverse group requires a broad array of monitoring techniques.
Ten permanent acoustic bat monitoring stations have been operational since August 2014. These stations are active year-round and provide data on bat migration,
where they were collected while the logperch were taken to Lake Shafer and placed in the previously prepared cages. Over the next couple months, the logperch were periodically fed and the cage tops were cleaned.
In mid-May, a cage top was pulled to check the con-dition of the logperch. All logperch were still alive and their gills still had attached glochidia. Logperch were checked again in early June, and still seemed to be in good health, with some glochidia still attached. Heavy rains in the Tippecanoe watershed caused large-scale flooding by the end of the month. The cages stayed intact, however, despite Lake Shafer flowing like a river and lots of floating debris. A large tree had been deposited near but, luckily, not on the cages.
Snuffbox cages were again visited in early July when the Tippecanoe was still at or near flood stage. One cage top was pulled, and all of its logperch were still

2015 Wildlife Science Report—Wildlife Diversity30
species distribution and abundance, winter activity levels, and long-term colony stability. Station locations were selected based on geographic distribution and suitable foraging habitat, predominantly along forested edges near rivers or lakes. Participating properties include five State Parks, two Fish & Wildlife Areas, one State Reservoir, Indiana Dunes National Lakeshore, and Eagle Creek Park.
Data collection is still in its infancy, and a full analysis has yet to be performed. Initial results from autumn and winter 2014 indicate that virtually all bats had either migrated or hibernated by early November. Tri-colored bat (Perimyotis subflavus), one of Indiana’s smallest bat species, was the first to become absent from the landscape. Predictably, there was a general trend of bat activity diminishing from the landscape later in autumn at more southerly locations.
Species representation also varied by location. Tri-colored bats and bats in the Myotis group were most prominent in the karst region of O’Bannon Woods State Park, while eastern red bats (Lasiurus borealis) were more common across the south. Also of note
was the relative prominence of tri-colored bats and the Myotis group at Prophetstown State Park and J.E. Roush Lake Fish & Wildlife Area, suggesting that these species possibly use the Wabash River drainage as a major corridor for movement.
The acoustic bat monitoring stations provide an op-portunity for partners at the local, state, and federal levels to work together to monitor some of Indiana’s most vulnerable, valuable, and misunderstood animals. Monitoring is ongoing, and the first complete analysis of the data collected will be performed in 2016.
Mobile acoustic bat survey programThe fifth consecutive year of mobile acoustic bat
surveying was completed in 2015. This statewide ef-fort monitors the distribution and relative abundance of resident bats during their reproductive season. The program uses car-mounted microphones connected to bat detectors to record the echolocation calls of bats in the surrounding environment. The same routes are driven each summer. This allows biologists to monitor multiple species at different locations throughout the state and across years.
The core set of data features 28 counties that were surveyed a minimum of three times each year from 2012 through 2015. The total number of bat calls
The statewide network of 10 monitoring stations collects acoustic information from bats throughout the year.
The Whitewater monitoring station is at Brookville Lake. Each station consists of an ultrasonic microphone at the top of a 10-foot pole, a solar panel, and a utility box that houses the battery and bat detector.

2015 Wildlife Science Report—Wildlife Diversity 31
detected per survey decreased from 64.6 in 2012 to 37.4 in 2015 (-42%). Much of this decline may be attributable to deaths associated with WNS, a disease affecting cave-hibernating bats that was first detected in Indiana in January 2011. Encouragingly, the rate of decline has steadily diminished each year. The rate from 2012 to 2013 was -31%; the rate from 2014 to
The equipment for mobile acoustic bat surveys includes an ultra-sonic microphone (left) to detect high-frequency sounds, a bat detector (center) to process and save acoustic data, and a GPS unit (right) to append time and location information to each file.
The number of bat calls detected per survey by species and year, showing relative abundance and population trends.
The frequency and structure of an echolocation call can be used to identify the species of a bat. The tri-colored bat typically has a uniform sequence of L-shaped pulses between 40 and 45 kHz.
2015 was -4%. We hope this indicates that Indiana’s bat populations are beginning to stabilize.
Predictably, those species most dependent upon caves for hibernation suffered the highest drops in detection rates. The tri-colored bat had a drop in calls/survey from 10.9 in 2012 to 2.4 in 2015 (-78%). The Myotis group dropped from 3.9 to 1.8 (-53%). The eastern red bat does not hibernate in caves but also dropped substantially in detection rate. Carcass surveys from wind farms indicate that this species is especially susceptible to deaths associated with wind turbines, which may explain a portion of the species’ decline. The detection rates for Indiana’s two larg-est bat species, big brown bat (Eptesicus fuscus) and hoary bat (Lasiurus cinereus), have fluctuated from year to year and appear relatively stable.
In 2015, 27 surveyors conducted surveys in 76 coun-ties, generating tens-of-thousands of acoustic files. To process such a large quantity of data, task-specific software was used to automatically identify acoustic files that contained bat calls, and to further identify the most likely species for each call. Surveys are scheduled to continue in summer 2016. We hope this work will provide additional evidence that Indiana’s bat popula-tions are stabilizing after years of decline.
Summer Bat Roost MonitoringIn 2015, the DFW started a new project that will
expand its methods to monitor bats while they are in their summer range. The Summer Bat Roost Monitor-ing Project uses volunteers to collect information on the distribution, occupancy and abundance of bat colo-nies throughout Indiana.
Participants must have bats roosting on their proper-ty or have permission to enter property where a roost occurs. Possible roost sites include trees, bat houses, barns, attics, outbuildings and other structures. On each night of surveying, volunteers count the number of bats that exit the roost and record general weather information at the time of exit. Each survey takes less than an hour and is conducted on eight to 12 nights from mid-May to mid-July.
Data were collected from 10 participants, scattered throughout the state, in 2015. Seven additional volun-teers signed up but were unable to participate for vari-ous reasons. Six of the successful roosts were in barns, three were in bat houses, and one was in an occupied home. The number of bats counted in barns ranged from one to 90. Five to 40 bats were counted exiting bat houses. Fewer than four bats were counted exiting the occupied home.
The DFW hopes to continue gathering data from these, and additional, roost sites in order to study long-term trends. Wildlife Diversity biologists have moni-tored winter populations of bats in caves and mines since the mid-1980s, but less is known about the status of bats the remainder of the year. Because certain spe-cies roost colonially in structures, we are able to study

2015 Wildlife Science Report—Wildlife Diversity32
them in their summer range while allowing the public to contribute to scientific investigations.
Information from the Summer Bat Roost Monitoring Project will help biologists evaluate roost selection, population trends, species distribution and potential impacts from disease. To learn more about this project or to participate, please email [email protected].
Winter bat countsCounts of bats in winter hibernation sites have been
done in Indiana for more than 30 years. The work has yielded one of the longest-running datasets known for populations of cave-dwelling bats.
Winter surveys are completed every other year to minimize bat disturbance. Biologists alternate between large and small hibernacula sites. Historically, caves used by the endangered Indiana bat (Myotis sodalis) have been targeted. Those surveys provide insight into the species’ progress toward recovery. They also shed light on the status of other hibernating bat species, including the little brown (Myotis lucifugus), northern
long-eared (Myotis septentrionalis), tri-colored, and big brown bats. The value of this information has risen as WNS continues to negatively affect winter bat popula-tions throughout eastern North America.
Five winters have passed since WNS was first detected in Indiana. Survey results from 21 caves, for which the DFW has pre- and post-WNS counts, show a 90% decline in little brown bat numbers during that span. Given the same parameters, tri-colored, big brown and Indiana bats decreased by 71%, 51% and 27%, respectively.
Eleven caves were visited in January 2015. Many harbor the largest known winter concentrations of Indiana bats in the state. These caves had collectively shown steady growth in Indiana bat populations since 2001, but one of the largest declines occurred this year.
Bat houses provide an opportunity to study the number of bats using that roost site throughout the summer. (Photo by Heather Kaarakka, Wisconsin DNR)
Whereas humans have to engage their muscles to grip an object, the weight of a bat essentially causes its claws to clench shut while relaxed. Therefore, a bat can hang in one location for an extended length of time during hibernation.
The results of little brown bat surveys from five Indiana caves (Batwing, Coon, Endless, Grotto and Wyandotte) from 2003 to 2015. WNS was first detected in Indiana caves in 2011 and has catastrophically impacted little brown bat populations.

2015 Wildlife Science Report—Wildlife Diversity 33
The number of Indiana bats counted in 2015 dropped 18% from 2013.
Biologists have observed the movement of bats between caves. For example, in Harrison County, Twin Domes used to be home to more than 70,000 hibernat-ing Indiana bats. In 2015, fewer than 2,500 remained. Alternatively, in the 1990s, fewer than 21,000 Indiana bats hibernated in Jughole Cave in Harrison County. In 2015, more than 63,000 were counted there.
Little brown bats used to be one of the most com-mon bats in Indiana; however, WNS has hit this species particularly hard. In the 11 caves surveyed in 2015, only 465 little brown bats were counted. This repre-sented a decline of 60% from 2013 and a 93% drop from 2011, when the greatest number of little brown
bats was reported (6,751). Catastrophic losses con-tinued at Grotto Cave (3,175 bats in 2011 to seven in 2015) and Endless Cave (1,253 bats in 2011 to 184).
Tri-colored bats, the smallest bats that winter in Indiana, are usually found in small numbers in many caves. Cumulatively, no more than 900 tri-colored bats have been counted from the 11 caves surveyed this year. However, in 2015, only 59 bats were observed, a decline of 92% from 2013. No tri-colored bats were found in Grotto, which housed 134 in 2011, or Coon, where 246 bats were counted in 2009. Only two were recorded in Batwing and Wyandotte. WNS was first detected in all four of these caves in 2011.
WNS has now been detected in 38 caves in 11 Indiana counties but still has not been confirmed in Jughole Cave. It seems likely that the fungus that causes WNS would be present there, given that many surrounding caves are also infected. However, due to Jughole’ s high ceilings, it is not possible to either swab bats for testing or closely inspect bats for visible signs of WNS. The number of Indiana bats counted in Jughole in 2015 increased by 8% compared to the 2013 survey, and by 78% (from 35,641 to 63,570) from the 2011 survey.
Although researchers are scrambling to find a solu-tion for this disease, we are likely years from practical applications of such a solution in the wild. Perhaps now more than ever, conservation efforts that benefit bats are imperative.
Swamp RabbitSwamp rabbits (Sylvilagus aquaticus) are the largest
of the 14 cottontail species. They can be distinguished from their common relative, the eastern cottontail (Sylvilagus floridanus), by their larger size, darker coloration, small ears relative to their large body, and
The largest Indiana bat hibernation sites are surveyed every other winter to minimize bat disturbance. Populations had been steadily increasing since the mid-1980s. However, an 18% decline was noted from 2013 to 2015.
The results of tri-colored bat surveys from five Indiana caves (Batwing, Coon, Endless, Grotto and Wyandotte) from 2003 to 2015.
Federally endangered Indiana bats hibernating on the ceiling in Wyandotte Cave. They form dense clusters of 300 to 500 individuals per square foot.

2015 Wildlife Science Report—Wildlife Diversity34
cinnamon rings around their eyes. The maximum weight of a swamp rabbit can reach 6 pounds, compared to 3.5 pounds for an eastern cottontail.
Swamp rabbits are also referred to as swampers or cane cutters. The latter name comes from their ten-dency to each giant cane. As their name implies, they are typically found near water and prefer bottomland hardwood forests that are adjacent to rivers, sloughs, marshes and swamps. In Indiana, they are only found in the extreme southwest corner where the Ohio and Wabash rivers create a landscape seen nowhere else in the state. Features include flat topography, lowland swamps and backwater sloughs.
Swamp rabbits were probably never common in In-diana, which sits at the extreme northern edge of their range (they are more abundant in Alabama, Mississippi and Louisiana). Today, they are considered by many to be one of the rarest mammals in the state. The drain-ing of large portions of floodplain forests has left only isolated patches of suitable habitat. Widespread loss of wetlands and other factors prompted the swamp rabbit to be listed as state-endangered in 1986.
One of the species’ most peculiar traits is depositing
fecal pellets on top of stumps and downed logs. The reason for this behavior is unclear. It’s possible that swamp rabbits use the elevated posts to watch for predators. Biologists determine the species’ presence, in part, by searching for pellets during winter, when vegetation is down.
The first comprehensive study of swamp rabbits in Indiana, conducted more than 40 years ago, suggested the species occupied 25 sites in six southwestern counties—Gibson, Knox, Posey, Spencer, Vanderburgh and Warrick. All later field work, however, has found a marked reduction in the occupied range. In 2006, pellets were found at nine sites in Gibson and Posey counties. Wildlife Diversity biologists plan to resurvey
Locations of nine occupied swamp rabbit sites from a 2006 survey (blue squares) and those sites surveyed in 2015 (red triangles) are shown. Swamp rabbits have only been found in Indiana in six southwestern counties—Gibson, Knox, Posey, Spencer, Vanderburgh and Warrick.
The swamp rabbit is distinguished from the more common eastern cottontail by its larger body size, relatively smaller ears, darker coloration and cinnamon rings around its eyes.
Swamp rabbit pellets mixed in with leaf litter on an artificial log (a wood frame covered with carpet). Artificial logs mimic moss-covered logs often used by swamp rabbits. Researchers use artificial logs to help determine the presence of swamp rabbits, whose pellets are usually round, about 3/8 inch in diameter, and range in color from almost black to a more golden hue.

2015 Wildlife Science Report—Wildlife Diversity 35
previously occupied sites in 2015–2017. In 2015, one site each in Knox, Gibson and Posey counties was surveyed. No conclusive sign of swamp rabbits was found.
Continued protection and restoration of large tracts of bottomland hardwood forests, marshes and other wetland habitat would help swamp rabbits persevere. Efforts to connect fragmented habitats with forested corridors would greatly benefit swampers and other species.
Franklin’s ground squirrelsFranklin's ground squirrels (Spermophilus franklinii)
are relatively large ground squirrels found in isolated grasslands in northwest Indiana. In 2015, Wildlife Science biologists conducted surveys for this state-endangered species at locations in Benton and Lake counties. This was the first surveying done for Franklin’s ground squirrels by the DFW in nearly 10 years. Once distributed across at least 16 counties in the northwestern quarter of the state, the species is now believed restricted to six or fewer counties, in the extreme northwest.
A total of 21 Franklin’s ground squirrels were captured at 19 sites in spring and summer of 2015. Sixteen of the 21 squirrels were captured at a single site in Lake County, five more than were captured at this site in 2006. In contrast, squirrel abundance decreased in Benton County. Of the 12 Benton County sites surveyed
A Franklin’s ground squirrel peeks from a live trap during a survey in Benton County. Squirrels are weighed, marked and checked for reproductive status before being released back into the habitat.
Locations of Franklin’s ground squirrel surveys in 1985–1987, 2005–2007, and 2015. Sites not surveyed in both 2005–2007 and 2015 were omitted.
The number of Franklin’s ground squirrels captured during each survey period show population declines at Benton County sites and a stable population at the Lake County site.

2015 Wildlife Science Report—Wildlife Diversity36
A Franklin’s ground squirrel sits atop the leg of a Wildlife Science biologist after being released from a live trap in Lake County (Photo by Emily Stork, Indiana Division of Nature Preserves).
in both 2005–2007 and 2015, eight yielded fewer squirrels, one had the same number captured, and no squirrels were taken at the remaining three sites. Nine of these 12 Benton County sites were also surveyed in 1985–1987. Capture numbers dropped from 39 in 1985–1987, to 21 in 2005–2007, to just four in 2015.
In 2015, DFW biologists partnered with other state and private entities to draft a habitat management plan for Franklin’s ground squirrels in Lake County. In the future, it is possible that similar habitat management plans will be used in other counties where Franklin’s ground squirrel populations still exist. By maintaining these isolated patches of ideal Franklin’s ground squir-rel habitat, we hope this species can once again thrive in northwest Indiana.
Allegheny WoodratThe Allegheny woodrat was listed as a state-
endangered species in 1988. It is one of the rarest and least-observed mammals in Indiana for several reasons.
Woodrats live in the labyrinths of cracks and crevices among the limestone cliffs, outcrops and caves in the forested hills along the Ohio River. Such areas are not easy for humans to reach. Woodrats are nocturnal, so they are rarely active during the day. They stay close to the deep crevices and ledges that provide protection from predators. Females also raise their young and store food there.
Woodrats are also referred to as trade rats or pack
rats because of their tendency to gather items from their surroundings. Generally this phenomenon is practical because woodrats need to cache food—like leaves and acorns—for the winter. However, they also collect items dropped by other animals, like feathers, and objects left by humans, such as shotgun shells, plastic cups and pens.
The current distribution of woodrats in Indiana includes about 15 cliff sites scattered along nearly 40 miles of the Ohio River from Rosewood in Harrison County downstream to Alton in Crawford County. Since 1991, Wildlife Science personnel have periodically conducted live-trapping surveys at these
Wildlife Science assistant biologist Tim Shier walks along a towering cliff face in Harrison County. This is the type of habitat in which Allegheny woodrats are found.
Allegheny woodrats cache sticks, leaves and other items in protected rock crevices. This particular cache is near a shelterhouse at O’Bannon Woods State Park. Remnants of red and yellow plastic cups were picked up and cached by a woodrat.

2015 Wildlife Science Report—Wildlife Diversity 37
appears to be increasing, decreasing or stable. The cap-ture rate is the number of woodrats captured per 100 trap-nights. The highest capture rate, which equaled 18.2, was recorded in 2011. Since then, that number has steadily declined. In 2015 the capture rate was 12.3 woodrats, a drop of 11% from 2013. Although there was an overall decline, it is encouraging to note that the capture rate at six of 11 sites increased from 2013.
The Laconia/Rabbit Hash Ridge complex continues to be the most populated of the three general areas surveyed. Nearly half of all woodrats captured in 2015 were found at these sites. Roughly 30% were found on Harrison-Crawford State Forest sites. Although the Alton area in Crawford County consists of just one site, it still produced 22% of all woodrats captured in 2015.
One encouraging find this year was the capture of a female woodrat that originated from the captive breed-ing program at Purdue University. This individual was born in July 2011 and was released at Harrison-Crawford State Forest in June 2012. Wildlife Diversity biologists captured her during surveys conducted in 2012, 2013 and 2015. She was always captured along the same 30 meters of cliff line. At 4 years old, she is the oldest individual captured in 2015. Two of the 110 woodrats captured in 2015 were 3 years old. The oldest individual ever caught in Indiana was estimated to be just over 5 years old.
Allegheny woodrat capture rates from 2005 to 2015 (excluding 2014, when monitoring was not conducted). The capture rate is the number of woodrats caught per 100 trap-nights.
Allegheny woodrats are captured in live traps baited with apple slices. Once processed, they are released at their capture site.
sites to monitor the species’ distribution and relative abundance in the state.
Wildlife Science biologists surveyed Indiana’s wood-rat population from late August to early November 2015. Results were compared to 2013, the last year woodrats were monitored in the state. Biologists look at capture rates to measure whether the population

2015 Wildlife Science Report—Wildlife Research38
WILDLIFE RESEARCH
DEERDeer Damage Control Program
The DNR deer damage control program addresses the immediate damage deer cause to private proper-ties, primarily those of farmers. The program is not a tool to control deer populations.
The program allows removal of deer outside the deer hunting season only when damage exceeds $500 and when non-lethal measures would be inadequate. The DNR responds to landowner complaints by conducting on-site inspections and providing appropriate technical advice. If non-lethal methods such as fencing and repellants are deemed inappropriate, the DNR may issue a deer damage control permit. The permit requires any antlers to be removed and be provided to DNR Law Enforcement or other approved DNR personnel.
In 2014, the DNR issued 365 deer damage control permits that resulted in the take of 1,448 deer. Further analysis of the 2014 dataset was not possible. During 2015, the DNR issued 310 permits, which represents a 15% reduction from 2014. Soybeans and corn were the most frequently damaged crops. More than 90% of the permits were issued to landowners who previously re-ported deer damage. The total permits issued in 2015 allowed for a maximum take of 4,823 deer; however, only 1,557 deer were harvested, a success rate of 32%. Of the harvested deer, 145 (10%) were adult bucks, 161 (10%) were male fawns, and 1,251 (80%) were does. The program provided 67 harvested deer that were donated to feed families in need.
Chronic Wasting DiseaseChronic wasting disease (CWD) is a neurodegenera-
tive disease that affects members of the cervid fam-ily. Members of the family include white-tailed deer, mule deer (O. hemionus), elk (Cervis elaphus) and moose (Alces alces). CWD is in a class of prion-caused diseases known as transmissible spongiform encepha-lopathies (TSE).
There is no cure or vaccine for CWD, and it is fa-tal. It attacks the animal’s brain and causes behavioral changes, excessive salivation and loss of appetite. These symptoms lead to progressive loss of body condition and death. CWD has a long incubation period that aver-ages from 18 to 24 months between infection and actual symptoms. Infected animals often appear healthy in the early stages of the disease. In advanced stages, however, they become emaciated, may lose fear of humans, stand with legs wide apart, and hold the head and ears low.
CWD spreads through the saliva and feces of in-fected deer. Researchers at the National Wildlife Health Center (NWHC) found that the prions that cause the disease can be taken up by plants. It is uncertain yet if eating prion-contaminated plant material passes the disease on to the consumer, but prion-tainted plants were found to be infectious when injected into small mammals. The NWHC is conducting additional re-search to determine how the disease is transmitted among deer and elk, what role infected deer carcasses play in CWD transmission, how artificial feeding af-fects transmission, and whether small mammals play a role in transmission.
According to the Centers for Disease Control, CWD has spread to at least 20 states and 133 counties. It was first detected as a clinical syndrome in 1967 in Colorado in captive mule deer at a research facility. In 1978, CWD was diagnosed as a spongiform encephalopathy and was found in captive deer and elk in Wyoming. Three years later, the disease was observed in free-ranging elk in Colorado. By 2002, it had been detected in nine states (Colorado, Illinois, Kansas, Minnesota, Montana, Oklahoma, South Dakota, Wisconsin and Wyoming) and two Canada provinces. Fourteen states and two Cana-dian provinces documented CWD in 2014, and by 2015 the NWHC verified it in at least 22 states. This year, new cases of CWD were reported from seven previously documented states (Illinois, Michigan, Missouri, Ohio, Texas, Wisconsin and Wyoming).
The DFW collects the retropharyngeal lymph nodes of hunter-harvested deer in its statewide CWD surveillance program.

2015 Wildlife Science Report—Wildlife Research 39
In 2013, eastern Wyoming reported 40 percent of its deer had CWD, and in one mule deer herd, approxi-mately 50 percent of the males had been infected. The Iowa DNR reported in 2014 that one in four deer in western Dane County had CWD.
The DFW has been testing samples from hunter-harvested and road-killed deer throughout Indiana as part of the statewide CWD surveillance program. Because diseased prions accumulate in lymphoid and neural tissues, CWD is diagnosed by examination of brain or lymphoid tissue from a dead animal. There is currently no reliable way to test for the disease in living animals. Sick deer reported by citizens are also tested through the targeted surveillance program. In 2014, DFW collected and tested 927 samples through its active and targeted surveillance program. In 2015, DFW tested 363 samples for CWD. Since surveillance began in 2002, more than 18,000 samples have been tested by the DFW. All samples have tested negative for CWD.
Bovine TuberculosisBovine tuberculosis (bTB) is a contagious,
Distribution of CWD in North America, October 2015. (courtesy USGS National Wildlife Health Center)
chronic bacterial disease caused by the bacterium Mycobacterium bovis. Typically, the bacterium infects the lungs but it may spread to other organs.
Mycobacterium bovis collects in the saliva of infected animals and spreads primarily through airborne particles from the respiratory tract; however, the bacteria also spreads through contaminated feed and watering sites from saliva and other bodily discharges or by drinking raw, unpasteurized milk from infected animals. Bovine tuberculosis is most commonly found in cattle, but the bacterium can exist in other species and can infect many mammals, including humans. White-tailed deer are considered reservoir hosts, and the existence of multiple reservoir hosts can make eradication difficult.
In 2009, captive deer in a cervid farm in Franklin County tested positive for bTB. Two additional cervid farms, one in Harrison and one in Wayne counties, received deer from the infected cervid farm in Franklin County. Testing results from the Harrison and Wayne farms were negative for bTB. In addition, samples tested from wild deer populations surrounding the

2015 Wildlife Science Report—Wildlife Research40
positive facility in Franklin County also tested negative for bTB. Due to the infectious nature of bTB, a surveillance program (identified as the Franklin West/Fayette zone) was established in those counties to sample and test hunter-harvested deer to determine if wild populations were host reservoirs for the disease.
Two years later, in 2011, livestock from a cattle farm in northern Dearborn County tested positive for the same strain of bTB found at the Franklin County farm. Therefore, in 2012, surveillance efforts expanded to include Dearborn County. This surveillance zone was identified as the Franklin East/Dearborn zone. As part of the surveillance program during the first weekend of firearms season from 2009 to 2015, DNR staff collected deer heads from willing hunters at check stations in Franklin, Fayette, Ripley and Dearborn counties. Lymph nodes were collected from the heads by the Board of Animal Health (BOAH) and U.S. Department of Agriculture (USDA) personnel, and submitted to Purdue’s Animal Disease and Diagnostic Lab (ADDL) and the National Veterinary Services Laboratory (NVSL) in Ames, Iowa for bTB testing.
As of 2015, none of the more than 1,329 wild deer sampled have tested positive for bTB. Samples
Distribution of bTB samples collected from 2009 to 2015 in Dearborn and Franklin counties.
collected for the Franklin West/Fayette zone exceeded the required number of samples by 2014, and the five-year sampling window was met for the Franklin East/Dearborn zone by 2015. Therefore, because surveillance goals (sample size and/or sampling duration required to achieve 95% confidence at a 1% prevalence rate) were met, the bTB surveillance program for both zones is considered complete. Based on detection probabilities for both positive sites, it is unlikely that bTB was endemic to the wild deer herd, and it is unlikely that bTB moved from the captive cervid herds to the wild cervid populations.
Epizootic Hemorrhagic DiseaseEpizootic hemorrhagic disease (EHD) is a disease
caused by the epizootic hemorrhagic disease viruses (EHDV) that belong to the genus Orbivirus. It is an acute and often fatal disease of some wild ruminants.
There are 10 serotypes of EHDV worldwide. The Center for Food Security and Public Heath (CFSPH) lists two serotypes currently endemic in North Amer-ica, EHDV-1 and EHDV-2. Both are widespread in white-tailed deer and periodically cause significant epizootics in deer throughout the United States and Canada. The EHDVs are transmitted by biting midges in the genus Culicoides and are better known as no-see-ums. According to the CFSPH, the virus is not directly spread from deer to deer, deer do not always die from the disease, viruses can be present in blood
Distribution of confirmed and suspected cases of EHD in captive and wild deer in Indiana in 2015.

2015 Wildlife Science Report—Wildlife Research 41
for up to two months, and incubation in deer is five to 10 days.
There are three forms of EHD—chronic, peracute and acute. Deer with the chronic form of EHD may be ill for several weeks and then recover. Deer with the peracute form may experience high fever, anorexia, weakness, respiratory distress, edema of the head and neck and swelling of the tongue and eye. Deer with the acute form often experience symptoms associated with the peracute form plus extensive hemorrhages in many tissues. Deer with the acute form also often have bloody nasal discharges and develop ulcers in the mouth and on other digestive organs such as the rumen and omasum. Mortality rates published by the CFSPH are high with the peracute and acute forms. Deer with peracute and acute symptoms often die within eight to 36 hours.
In North America, epizootic outbreaks of EHD occur in the late summer or early autumn and appear to be associated with wet weather. Outbreaks normally stop with the onset of freezing temperatures. According to the CFSPH, mortality rate in white-tailed deer is high (approximately 90%), but the severity of the disease varies from year to year and with geographic location. The disease may not be observed one year and may be widespread the next. The variability of the disease is caused by many environmental factors, including the number of insect vectors, the EDHV serotype, previous host immunity, overall host genetics and deer popula-tion density. Deer that survive develop antibodies.
Indiana has had its share of EHD outbreaks in wild deer. In 2014 no cases of EHD were confirmed in wild deer; however, it was confirmed in wild deer in 2015. The DNR tested and confirmed EHD in four counties in the wild herd and obtained reports of suspect cases in 27 counties scattered across the state in 2015. The BOAH also confirmed EHD in captive herds in 2015.
The white-tailed deer is Indiana’s most popular game animal, providing recreational opportunities to nearly 200,000 Hoosier sportsmen and women annually.
Reports varied across the state from as few as two to five suspect cases in some counties, to as many as 30 reported suspect cases in Putman County alone.
FURBEARERSArcher Index Survey
Archery hunters play an important role in monitor-ing the abundance of furbearer and other wildlife spe-cies in Indiana. Since the early 1990s, Indiana archery hunters have voluntarily shared their wildlife observa-tions with the DNR as a method for monitoring trends in statewide wildlife populations. This partnership has provided a consistent and inexpensive method for monitoring many wildlife species.
Before archery hunting season, hunters who have volunteered to participate in the survey are sent a packet that includes a standardized form and direc-tions for recording wildlife observations. Hunters are asked to record the number of hours they spend hunt-ing each day, noting either morning or evening hunts, and the number of each wildlife species observed.
After the survey, participants return their completed form to the DFW. Population indices are tabulated by dividing the number of each wildlife species sighted by each hunter by the number of hours hunted. The index is represented as the number of sightings per 1,000 hours of hunting, summarized for statewide and regional totals.
Indiana archery hunters recorded sightings of fur-bearer and other selected wildlife species from Oc-tober 1 through November 14, 2014. A total of 3,573 archery-hunts were conducted during the survey pe-riod, resulting in 10,675 hours of hunting observations.
White-tailed deer were the most frequently sighted species, and the observation rate for deer has trended upward over the last 20 years. Raccoons were the most frequently sighted furbearer, only slightly higher than coyote. Sightings of gray fox (Urocyon cinereoargen-teus) and red fox (Vulpes vulpes) have decreased over the last 20 years. Fox squirrels (Sciurus niger) were the most frequently sighted small game species. The wild turkey was the most frequently sighted game bird, while northern bobwhite (Colinus virginianus) sightings continued a downward trend.
Citizen Science Trail Camera SurveyThe DFW furbearer program developed a new citi-
zen science survey called Snapshot IN that uses trail cameras to gather information on Indiana wildlife. In October 2015, the DNR’s CERVIS database was used to select 100 volunteers who had interest in the survey as well as at least 10 acres of private land in one of Indi-ana’s 92 counties in which to place the camera.
Volunteers were contacted by phone and provided details of the survey. Volunteers who met requirements and were willing to participate were mailed a loaned trail camera, security equipment, and a volunteer packet describing project details.

2015 Wildlife Science Report—Wildlife Research42
A trail camera captures the image of a white-tailed deer buck in Jackson County in late October.
Bobcats are primarily active at night, as documented by this image taken by a trail camera in Greene County.

2015 Wildlife Science Report—Wildlife Research 43
evaluate their attitudes toward medium-sized carni-vores (raccoons, coyote, fox, skunks, bobcat, river otter and badger). The survey will be dispersed evenly and randomly among Indiana residents living in urban, suburban and rural areas to capture the variation in residents. Data analysis will evaluate the relationships among preferred management actions and demograph-ic factors. The goal of this survey is to gather informa-tion to best direct future management of these species. The project began in October 2015 and is expected to be finished by August 2016.
Bobcat MonitoringSince the late 1980s, the DFW has recorded the an-
nual number of bobcat (Lynx rufus) mortalities re-ported to and confirmed by DNR personnel. Mortality reports are used to collect biological and distribution data for bobcat in Indiana.
Correspondence is sent annually to DNR Law En-forcement and wildlife personnel requesting reports of bobcat mortalities, including animals struck by vehicles, incidentally trapped or killed by other causes. Decisions on what carcasses to salvage are made annually.
During the 2015 pilot year, volunteers were asked to place the camera on a well-used game trail and moni-tor it for any 30-day period during October and No-vember. Volunteers were asked not to use attractants or baits, but to place the camera near a game trail or water source in order to photograph animals in a place in which they would naturally congregate.
The goal of the new survey is to gather accurate data on the distribution and relative abundance of wildlife species across the state. The DFW plans to run this survey annually and looks forward to working with citizen scientists to better understand how animals are using various Indiana landscapes. The results from this year’s pilot study will be available in 2016 and used to improve study design. The DFW is also exploring areas for collaboration and expanding the trail camera work across the Midwest.
Public Attitudes toward MesocarnivoresThe DFW is collaborating with Purdue University
on a human dimensions study of Indiana residents to
The DFW launched a new project in 2015 using images shot by citizen scientists with State-owned trail cameras to collect information on the distribution and relative abundance of wildlife in Indiana.
Analysis of public attitudes toward medium-sized carnivores such as red fox is the target of collaborative study between the DFW and Purdue University.
Distribution of bobcat mortalities reported in Indiana from 1990 to 2014.

2015 Wildlife Science Report—Wildlife Research44
A datasheet is used to collect temporal and spatial information for each animal. Salvaged bobcats are tagged and biological samples are collected, including physical measurements, a canine tooth for aging, and reproductive tracts from females.
Sixty-three bobcat mortalities were reported and confirmed from 25 counties in 2014. This is the fifth consecutive year bobcat mortalities exceeded 60 ani-mals. A total of 46 bobcats were road-killed, 14 were accidentally trapped or snared, and three bobcats were killed by other causes. Bobcat mortalities are reported more frequently in fall and winter, primarily from Indi-ana’s southern counties.
River Otter MonitoringDNR personnel collect incidentally killed river otters
reported to the DFW and DNR Law Enforcement as part of the state’s monitoring program.
Indicative of a healthy and expanding population, the number of incidentally killed otters has increased considerably during the last 10 years and has exceeded 100 animals in each of the last four years. In 2014, 141 river otter mortalities were reported and confirmed from 47 counties. In more specific terms, 21 river ot-
ters were killed by collisions with vehicles, 115 were accidentally trapped or snared, and five otters were killed by other causes.
Thanks to the continued support of trappers who turn over incidentally trapped otters, the DFW has been able to maintain records and collect biological samples from these animals. The animals provided vital information regarding the distribution.
River Otter Trapping SeasonThe first regulated trapping season for river otters in
Indiana began in November 2015. This success story was made possible by restoration efforts in Indiana and other states in the lower Midwest. Federal laws require each otter pelt to be tagged before it is sold, a process that will be new to most Indiana trappers.
River otter trapping season will run from 8 a.m., November 15, 2015 until noon, March 15, 2016. The bag limit is two otters per trapper, per season. There is a maximum of 600 otters for this initial season. If the quota is reached prior to March 15, the season will close. A valid Indiana trapping license is required to set traps for river otters. Additional details can be found at www.in.gov/dnr/fishwild/8499.htm.
UPLAND GAMEBIRDSRing-Necked Pheasant Crowing Count
The colorful ring-necked pheasant (Phasianus colchicus) is a naturalized species, introduced from China in 1881. Indiana stocked ring-necked pheasants from the early to mid-1900s. The spring pheasant crowing count is used to determine the change in pheasant abundance and has been conducted annually across the pheasant’s range since 1976. The current crowing count consists of 20 routes comprised of 400 stops, across the pheasant range and three additional historic routes in Benton County.
Distribution of river otter mortalities reported in Indiana from 1995 to 2014.
Average number of ring-necked pheasant crows heard per stop in Benton County (1977–2013; 3 routes), northern Indiana (1981–2006; 15 routes), and rangewide in Indiana (2009–2015; 20 routes).

2015 Wildlife Science Report—Wildlife Research 45
Between April 29 and May 8, 2015, DFW staff and volunteers recorded 251 calls of cock pheasant, commonly known as crows. Routes (n=16) with calls recorded in both 2015 and 2016 were analyzed. Considering these 16 routes, the statewide average number of pheasant calls heard per route in 2015 (14.19 ± 0.64 calls) was not greater (24.0%) than the number heard in 2014 (11.44 ± 0.49 calls). The three historic routes in Benton County had a non-significant increase of 54.7% in the number of pheasant calls heard per route in 2015 (27.33 ± 0.76 calls) compared to the previous year (17.67 ± 1.43 calls). The 2015 estimate nearly equaled the 10-year average (27.35 ± 0.51 calls).
The near-record low pheasant populations of the past 10 years can be attributed to severe weather events and the loss of suitable habitat for wintering, nesting and brooding young. Indiana landowners who want to participate in federal and state habitat conservation programs for pheasant can contact their local USDA service center (www.in.nrcs.usda.gov) or local district wildlife biologist (www.IN.gov/dnr/fishwild/2716.htm).
Ruffed Grouse Population StatusNo drumming male ruffed grouse (Bonasa umbellus
monticola) were heard on the 14 roadside survey routes (15 stops per route) during the 2015 survey for the third consecutive year—only one grouse has been heard in the last six years. The 5-year (2010–2014) average drumming index for control routes is 0.002 drummers per stop (~1 drummer heard every 500 stops), compared to 1.16 drummers per stop during the peak years of 1979–1981, or nearly a 600-fold decrease.
The distribution of ruffed grouse in Indiana has historically fluctuated with changing land use. Ruffed grouse require young hardwood forests composed of dense seedling- to sapling-size trees and shrubs. In 1931, ruffed grouse occurred in only 12 Indiana
Spring breeding indices for ruffed grouse populations based on counts of drumming males on 10 roadside routes and the Maumee Grouse Study Area in Indiana from 1969 to 2015.
counties. After reforestation, natural range expansion and successful restoration efforts, grouse had expanded to 41 counties by 1983, the species’ greatest distribution in Indiana since 1856. Survey results indicate the breeding population of ruffed grouse has declined steadily in the last 30 years and are now less than 1% of levels recorded during the peak years of 1979–1981.
A reassessment of the ruffed grouse distribution and conservation status was conducted in 2008. Preliminary data from the Indiana Breeding Bird Atlas (2005–2010) indicate ruffed grouse occurred in less than 1% of the priority blocks surveyed compared to 10% for the same blocks during the 1985–1990 assessment. Currently, remnant ruffed grouse populations persist in 10–13 of the 43-county distribution reported in 1983.
Prospects for population recovery are dismal given the continual advancement of forest succession. In ad-dition, ruffed grouse populations have likely dropped below “minimal viable levels” within most of the cur-rent Indiana range. The species appears destined for extirpation unless some intervention (e.g., extensive timber harvests of sufficient intensity) or sizable natu-ral disturbances occur across the forested landscape to create a significant increase of early successional for-ested habitats in the more wooded regions of the state.
The Appalachian subspecies of ruffed grouse that oc-curs in Indiana is morphologically unique from other subspecies and is physiologically best adapted to the southern latitudes of the species’ continental distribu-tion, tolerating warmer and drier climates and a diet with higher tannin levels. Populations of this subspe-cies have already disappeared from Illinois, southern Missouri, western Kentucky and Tennessee, and Arkan-sas, with significant declines occurring in Ohio, eastern Kentucky and Tennessee, North Carolina, northern Georgia, southern Michigan, western Pennsylvania and
During spring, a male ring-necked pheasant puffs up his feathers as he calls to attract females (photo by D. Rehder).

2015 Wildlife Science Report—Wildlife Research46
New York, and the Virginias. The implications for bio-diversity, if this subspecies disappears from much of its range, will likely become critical as environmental temperature and precipitation gradients move latitudi-nally northward due to climate change.
Ruffed Grouse Hunting Season SuspendedThe hunting season for ruffed grouse in Indiana was
suspended beginning in 2015 because of the species’ declining population. The decline came about as the species preferred habitat, early-age hardwood forests, continues to diminish across the state. In the last de-cade, grouse hunting became more of an excuse for a few dedicated hunters (less than 100) to be outdoors with bird dogs than an actual hunt, as evidenced by the few birds taken (less than 1 grouse per 2–3 hunt-ers per season).
A fall hunting season for ruffed grouse began in 1965 with a daily bag limit of two birds. Grouse hunt-ing used to be one of the premier gamebird hunting experiences in Indiana. This was especially true after the “blizzard” years of 1977–1978 decimated bobwhite quail and ring-necked pheasant populations across the state. During the peak years of the early 1980s, esti-mated annual harvests were 15,000 to 20,000 grouse, with about 15,000 hunters participating.
A volunteer “cooperative hunter-bag” survey was conducted from 1965 through 1990. Grouse hunters submitted a season log of hunting activity and wing and tails from harvested birds. The average grouse hunting party consisted of two or three hunters who spent 4.2 hours per hunting trip and expended an effort of 1.9 man-hours per flushed bird and 14.2 man-hours for each grouse bagged.
Annual variations in the harvest variables during this time were small, with only ± 8% and ±12% changes in the flush and success rates, respectively. Such con-sistent results were likely due to the “self-regulation”
This map depicts point locations, total home range (yellow, light blue), and core-use areas (red, purple) of two northern bobwhite coveys during the non-breeding period (November–March) near Area C, along the northeast boundary of Glendale FWA.
behavior of hunters, by which less avid hunters would participate during lows in grouse population levels. During 1966–1982 when wing and tail feather collec-tions were made, there was a 57% probability the bird bagged would be a juvenile, and a 53% chance the bird would be a male. The average juvenile per adult hen ratio in the harvest was 2.97 (range 1.72 to 4.48 juveniles to adult hen).
Effects of Disturbance and Macro-habitat Composition on Northern Bobwhite Movement, Dispersal and Survival
The northern bobwhite (Colinus virginianus) is widely distributed throughout eastern North America and Mexico, and is one of the most researched birds in North America. Unfortunately, its population has been declining across its entire range, hence northern bob-whites are one of the most researched birds in North America.
DFW staff captured and tracked 150 northern bobwhites twice weekly during the non-breeding season and daily during the breeding season. In addition, they triangulated a total of 7,492 point locations. In 2015, staff began mapping, using ArcMap, these locations to determine home range, survival, and habitat use. Covey home range size and winter use
After nearly 50 years in existence, the hunting season for ruffed grouse in Indiana was suspended in 2015 because of the species’ declining population.

2015 Wildlife Science Report—Wildlife Research 47
A male northern bobwhite stands within a grassy opening at Summit Lake State Park.
areas were calculated. In addition, vegetation of nearly half of the study was identified and mapped. Results and publications are forthcoming.
Northern Bobwhite Whistle Count Spring bobwhite whistle counts to monitor changes
in annual abundance are conducted by DFW staff. This count has been conducted since 1948.
Between June 6 and July 6, 2015, staff and volun-teers counted 483 whistling bobwhites along 72 routes. Analysis was limited to only the 2014 and 2015 routes that recorded at least one male bobwhite. Considering only these routes (n=62), the statewide average num-ber of bobwhites heard per route in 2015 (7.7 ± 0.3 birds) was not greater than the number heard in 2014 (7.2 ± 0.3 birds).
The northern bobwhite population in Indiana has been declining for more than 20 years. Habitat loss, particular-ly the loss of winter cover, will continue to suppress the
population and will worsen the negative effects of preda-tion and weather. Indiana landowners interested in creat-ing bobwhite habitat can take advantage of federal and state habitat conservation programs. Interested individu-als should contact their local USDA service center (www.in.nrcs.usda.gov), or their local district wildlife biologist (wildlife.IN.gov/2716.htm).
Mourning Dove BandingWith a nationwide range, the mourning dove
(Zenaida macroura) is one of the most widely distributed and abundant birds in North America and is the most abundant upland gamebird in Indiana. The USFWS, with the assistance of state agencies, manages mourning doves by collecting population data in three distinct management units (Eastern, Central and Western) across the United States. Indiana, along with 27 additional states, is included in the Eastern Management Unit (EMU).
Average number of northern bobwhites heard whistling per stop by Bird Conservation Region (BCR) in Indiana from 1976 to 2015. Unpaired zero routes included in these data sets.
Indiana is divided into three BCRs that are defined by ecoregions. Multiple species, including mourning doves and northern bobwhites, are monitored within Indiana based on BCRs.

2015 Wildlife Science Report—Wildlife Research48
Since 2004, the DFW has cooperated with the USFWS and has conducted an operational banding program to estimate annual populations, survival and recruitment rates, and harvest rates. Based on popula-tion modeling, the USFWS has established an optimum number of banding samples per Bird Conservation Re-gion (BCRs) per state. There are three BCRs in Indiana, Eastern Tallgrass Prairie (BCR 22), Prairie Hardwood Transition (BCR 23), and Central Hardwood (BCR 24). The ideal number of birds banded in Indiana are 0.48 (BCR 22), 0.11 (BCR 23) and 0.41 (BCR 24).
Between July 1 and August 15, 2015 DFW and vol-unteers banded 1,011 mourning doves and aged 96.8% of the birds captured. Overall, statewide age propor-tion quotas were exceeded. However, several banding goals were not met in individual BCRs. Regional age proportions were not met for both BCR 23 due to poor trapping conditions and minimal site use by the birds,
and BCR 22 due to insufficient adult bird captures. Based on band recoveries between 2003 and 2014, the USFWS calculated the estimated annual survival rates and harvest rates in Indiana. Survival rates were 28% for hatch-year (HY) birds and 40% for after-hatch-year (AHY) birds. Both estimates are 1% lower than the EMU survival rates. The harvest rates are 7.4% for HY (1.4% lower than EMU rates) and 7.7% for AHY (1.6% higher than the EMU). Prior to the 2015 hunting sea-son, banding data showed an estimated population of 68.3 million birds in the EMU and 273.6 million birds nationally.
American Woodcock Singing Ground Survey
The American woodcock (Scolopax minor) is a popular game bird throughout much of the eastern United States. The DFW counts vocalizing male wood-cock during the bird's peak display period. Indiana is one of six states and two Canadian provinces in the Central Management Region that participate in this annual survey. Also participating are Minnesota, Wis-consin, Michigan, Illinois, and Ohio, and Ontario and Manitoba.
Between April 10 and May 5, 2015, six woodcock were recorded on three of 18 routes, compared to six birds on four of 15 routes in 2014. The number of woodcock vocalizing during the 2015 singing-ground survey did not differ from the number for the previous year for both Indiana (-6.8%), and the Central Manage-ment Region (6.3%; 408 routes). The number of wood-cock recorded in Indiana has declined by an average of 4.7% per year over the last 10 years (2005–2015), and by 4.2% per year from 1968 to 2015. These de-clines are statistically significant and are considerably
Annual goals and 2015 results for the Mourning Dove Banding Program within three BCRs in Indiana. [note: AHY = after hatch year bird; HY = hatch year bird].
Number of singing male woodcock heard per route in Indiana and the Central Management Region (CMR) from 1968 to 2015. The CMR includes the states of Illinois, Indiana, Michigan, Minnesota, Ohio, and Wisconsin, and the Canadian provinces of Ontario and Manitoba
The DFW participates with 26 other states in an annual banding program to determine the population size, survival, and harvest rates of the mourning dove, one of the most widely distributed and abundant gamebirds in North America.

2015 Wildlife Science Report—Wildlife Research 49
A male American woodcock displays on the ground hoping to attract a female.
greater than the 1.5% and 1.0% annual decline estimat-ed for the entire Central Management Region during the respective time periods.
Like other upland gamebirds in Indiana, the number of American woodcock has declined over the last three decades. American woodcock habitat is characterized as young, densely growing hardwoods within areas of moist soil. These moist soil areas must support ample populations of earthworms, the woodcock’s primary food. Without habitat conservation and habitat man-agement, early successional habitats will continue to be lost and populations of American woodcock will continue to decline.
WILD TURKEYWild Turkey Population Status
Declining trends in brood production of wild turkeys in the post-restoration era continue to be observed in Indiana and across the eastern United States. District wildlife biologists and conservation officers record ob-servations of wild turkey hens and poults in July and August. The average statewide production index (PI) of 2.9 total poults to total adult hens was a 45% improve-ment over the 2.0 PI reported in 2013 and significantly greater than the previous 5-year (2009–2013) average of 2.1. Since 1993, the average PI has progressively declined, leveling off at values indicative of a stable post-restoration population. Annual fluctuations in pro-ductivity around the long-term average are expected and characteristic of a stable population as it settles to the availability of suitable habitat.
The spring and early summers of 2014 and 2015 were characterized by above normal precipitation and below normal temperatures, marking 10 consecu-tive years of flooding events in various regions of the state concurrent with turkey nesting season in April and May or early brood rearing periods of June and July. Unprecedented flooding in July 2015 occurred in many rivers and associated drainages throughout large
portions of the state with standing water remaining for more than a week in many bottomland fields. The impacts on late turkey renesting and brood survival associated with these flood events likely influenced production because the primary turkey habitat in many of the forested regions of the state is associated with riparian systems. Brood production data for summer 2015 are currently being compiled and will be ana-lyzed at a later date.
Roadside gobbler trend routes (10 routes in 14 counties; 15 stops per route) are conducted annually from late March into April in conjunction with road-side trend routes for ruffed grouse. Roadside gobbling counts are not accurate indicators of annual trends in turkey populations, but they do provide insight into long-term (five years or more) trends and a relative comparison to other areas.
Annual variations can reflect weather conditions during surveys and may also reflect the proportion
Number of poults per adult hen (solid red line) and logarithmic trend line (dashed blue line) for wild turkeys in Indiana from 1993 to 2015.
Number of gobbling wild turkeys heard per stop (solid red line) and moving average for previous five years (blue dashed line) on 10 roadside routes in Indiana from 1992 to 2015.

2015 Wildlife Science Report—Wildlife Research50
of the more vocal 2-year-old gobblers in the popula-tion, rather than actual long-term population trends. A good example of the influence of vocal 2-year-olds is evident in the 2006 gobbling index when record high summer brood production in 2004, likely attributed to the abundance of 17-year cicadas. The number of male wild turkeys heard along the traditional 10 control roadside routes from March 30 to April 21, 2015 was 0.59 gobblers per stop (GI), which was 14% less than the 0.69 heard in 2014. Four new routes established in 2012 showed a 13% decrease in 2015. The 5-year moving average shows a general increase from 1987 to 2006, followed by a general decrease. The 2015 statewide gobbling index of 0.59 was not statistically different than the 5-year average of 0.74 but was the lowest GI since 1998.
Fall 2014 Wild Turkey HarvestHunters harvested 548 wild turkeys during the 10th
fall turkey hunting season, 67 less (-11%) than the 615 harvested in 2013–2014. The combined shotgun and archery portion of the season accounted for 53% of the harvest. Archery hunters took 58% of the total harvest, generally incidental to deer hunting. Adult birds made up 72% of the harvest, with a juvenile-to-adult ratio of 1 to 2.6. The proportion of adults in the fall harvest was relatively high and likely reflects a combination of low summer brood success, hunter selection for larger adult birds, and age-determination errors.
Counties harvesting at least 15 birds were Steu-ben (21), Harrison (20), Jefferson (19), Warrick (19), Dearborn (18), Switzerland (18) and Greene (15). The Web-based “Check-In-Game” harvest reporting system accounted for 69% of the 2014 harvest reports.
During the first 10 years of fall hunting in Indiana, the mean annual harvest was 640 birds with an aver-age of 8,771 hunters annually participating, with an estimated average success rate of 7.4%. The interest in fall turkey hunting in Indiana remains relatively low compared to interest in spring hunting but does pro-vide an additional hunting opportunity.
Beginning with the fall 2015 season, the number of days for the combined archery and firearms (shotgun) portion of the fall season in the northern part of the state will be lengthened from five days to 12 days in mid-October, similar to the season length in the south-ern part of the fall turkey firearms hunting range. Fall archery for wild turkeys occurs statewide beginning on October 1 with two separate portions with 60–65 days of total archery hunting opportunity into the first week of January.
Spring 2015 Wild Turkey HarvestHunters harvested 11,583 wild turkeys in 89 of 92
counties during the 46th spring wild turkey hunt, based on reports from 335 check stations (48% of the harvest records) with the remainder coming from the Web-based “Check-IN-Game” (50%) and tele-check (2%) systems that started in 2012. The 2015 harvest was a 9% increase from the 2014 harvest of 10,582, with 26 counties exceeding 200 harvested birds. Overall, 65 counties showed increased harvests, eight counties showed no change, and harvests decreased in 19 counties. The top 10 counties were Harrison (380), Switzerland (360), Jefferson (346), Steuben (337), Dearborn (331), Perry (308), Warrick (297), Franklin (269), Clark (268) and Crawford (250).
A total of 10,406 birds were harvested during the 19-day regular season that ran from April 22 to May 10, 2015. About 58% of the regular season harvest occurred during the first five days of the season, with 43% occurring on the three weekends. Another 1,177 birds (10% of total harvest) were taken during the youth-only weekend (April 18–19). Approximately 68% of the harvest occurred by 10 a.m., 78% by noon, 10% from noon to 3 p.m. and 18% occurring from 3 p.m. to sunset.
Landowners/active military personnel (license exempt) accounted for 7% of the 2015 harvest. Juvenile gobblers (1-year-old birds or "jakes") made up 21% of the harvest, compared to 17% in 2014, whereas 2-year-old and 3-year-old birds comprised 46% and 33% of the harvest, respectively. Mean weight of jakes increased slightly (16.6 lbs. compared to the 10-year average of 15.5 lbs.), while figures for older birds were similar to those in previous years (22–24 lbs). Bearded hens made up less than 2% of the harvest. All regions, except for the southeast portion of the state, experienced an increase in harvests, reflecting the overall 9% increase in the total harvest. The northern region, the largest region, supported 28% of the harvest, with 44% of the harvest occurring in the south-central and southeast regions.
Reasons for the 9% statewide increase in 2015 were likely related to the continued growth of the relatively “younger” northern region populations (i.e., in terms of years after restoration) and the slight increase in 2014 summer brood production. Annual harvests have stabilized in the last five years, ranging from 11,000 to 12,000 birds, while the number of hunters during
Fall harvests of wild turkeys (orange bars) and estimated number of participating hunters (black line) in Indiana from 2005 to 2014.

2015 Wildlife Science Report—Wildlife Research 51
Indiana hunters harvested nearly 11,600 wild turkeys during the spring 2015 hunt, which included more than 1,100 birds taken during the youth-only weekend.
the same period has ranged from 55,000 to 60,000. Hunter numbers have declined slightly the last few years following similar declines in estimated hunter success rates. The 2015 harvest was the sixth highest spring harvest. The estimated number of spring turkey hunters afield was 55,531, and the estimated hunter success was 21%.
WATERFOWLWaterfowl Banding
Canada geese and wood ducks (Aix sponsa) are mi-gratory waterfowl that breed statewide in Indiana. Both are abundant and widely sought by waterfowl hunters.
Each year, DFW staff capture members of each species for banding. Geese are captured during their flightless period in the last two weeks of June using funnel traps on dry land. Wood ducks are captured us-ing baited live traps.
Flightless Canada geese being coaxed into a funnel trap.
Spring harvests of wild turkeys (maroon bars) and estimated number of participating hunters (black line) in Indiana from 1990 to 2015.
Banding a Canada goose at Monroe Lake.

2015 Wildlife Science Report—Wildlife Research52
Harvest locations for wood ducks banded in Indiana.
The birds are removed from the traps, age and sex are determined, and a uniquely numbered aluminum band is attached to one leg of each bird. Data from the banded birds are submitted to the USGS Bird Banding Laboratory in Maryland, which maintains the data from all banded migratory birds nationwide. Anyone who harvests, sees, or finds a banded migra-tory bird is encouraged to report the band number by calling 1-800-327-BAND or by visiting reportband.gov. Information from bird band recovery reports is used to calculate survival and harvest rates, and to deter-mine movement patterns.
In 2015, a total of 1,442 Canada geese were banded on private and public lands in Indiana. An additional 68 geese were banded as they were relocated from nuisance situations to FWA properties. For the first time in at least 10 years, the goal of banding 2,000 geese was not reached. Only 243 wood ducks were banded, well short of the annual goal of 1,285. This shortfall is the result of widespread flooding in sum-mer 2015, which made concentrations of wood ducks difficult to locate and trap because ducks spread out when more water is available. In addition, personnel shortages within the DFW limited the level of assis-tance available for waterfowl banding in 2015, further reducing banding effort and success.
Waterfowl Hunter SurveysHunter surveys assess hunting effort and success,
as well as hunter satisfaction, habits and approaches
Preferred hunt dates for North Zone duck hunters. The horizontal axis is week (denoted by the first letter of the month), and the vertical axis is the proportion of hunters who chose that week.
to hunting. The data assist DFW biologists in setting seasons that address the biological parameters of the species hunted and the desires of the hunters who make conservation possible. The DFW sends a survey to waterfowl hunters every three to four years.
The most recent survey was sent after the 2013–14 season. Surveyed hunters were randomly selected from the federal Hunter Information Program (HIP)

2015 Wildlife Science Report—Wildlife Research 53
database. Five-thousand resident hunters older than age 16 were selected from the federal Hunter Information Program (HIP) database. Of these, 1,461 (29%) returned their survey.
Satisfaction among Indiana waterfowl hunters is rela-tively high. Overall satisfaction with the duck hunting experience, goose hunting experience, and waterfowling experience exceed 50% for all hunters, North Zone hunt-ers, and South Zone hunters. Only hunters in the Central Zone reported satisfaction levels below 50% (though only the goose hunting experience was below 50%, at 45%).
Finally, data from the survey regarding preferences for season timing were used to inform decisions regarding the 2015–16 hunting seasons. These data will continue to be used in this way in later years. Many other ques-
tions are asked on this survey, some of which are used to partition respondents (e.g., by where they hunt). A full report will be available separately at www.in.gov/dnr/fishwild/3352.htm. The next survey will likely be sent to hunters after the 2016–17 waterfowl season.
Waterfowl Population SurveysThe DFW performs many waterfowl population sur-
veys. During the April breeding season, statewide heli-copter surveys estimate the breeding population of Cana-da geese, mallard (Anas platyrhynchos), blue-winged teal (Anas discors) and mute swan (Cygnus olor). Wood duck breeding populations are not estimated because they are difficult to survey from the air and they nest in tree cavi-ties therefore, are not visible from a helicopter.
Indiana breeding population estimates for 2015 were 90,379 Canada geese and 26,565 mallards. Breeding Preferred hunt dates for Central Zone duck hunters.
The horizontal axis is week (denoted by the first letter of the month), and the vertical axis is the proportion of hunters who chose that week.
Preferred hunt dates for South Zone duck hunters. The horizontal axis is week (denoted by the first letter of the month), and the vertical axis is the proportion of hunters who chose that week.
Canada goose breeding population estimates in Indiana from 1993 to 2015. Population was not estimated in 2002 or 2010, and the estimate for 2006 was removed due to small sample size.
Five-year (2010–2014) duck migration averages (in thousands) for the north waterfowl hunting zone. The x-axis represents the approximate week of the month, not the date. The solid black line is 2014 only.

2015 Wildlife Science Report—Wildlife Research54
Five-year (2010–2014) duck migration averages (in thousands) for the south waterfowl hunting zone. The x-axis is the approximate week of the month, not the date. The solid black line is 2014 only.
blue-winged teal numbers were not estimated because most occur in large flocks, indicating migrating rather than breeding birds.
Since 1986, weekly waterfowl surveys have been conducted from the last week in August through the end of January on selected state and federal properties throughout Indiana. These data allow DFW to track yearly and long-range migration timing and distribu-tion as birds move through the state. This information is used to set annual waterfowl season parameters in each waterfowl hunting zone to maximize local hunt-ing opportunities while peak migration is occurring while peak migration is occurring.
In 2012, the DFW began conducting weekly helicopter surveys of the lower Wabash, White and Ohio rivers from
Migration rank by week during the 2014–15 waterfowl survey (dashed line) and the three-year average (green solid line) for the Wabash River. The survey occurs for 14 weeks. The week with the highest count has a rank of 14; the week with the lowest count has a rank of 1.
Migration rank by week during the 2014–15 waterfowl survey (dashed line) and the two-year average (green solid line) for the West Fork White River. The survey occurs for 14 weeks. The week with the highest count has a rank of 14; the week with the lowest count has a rank of 1.
November through January. These flights provide infor-mation about winter waterfowl usage on Indiana’s major river systems. The 2014–15 season was the third for the Wabash surveys and the second for the East Fork of the White River. Due to low waterfowl densities, surveys of the Ohio River were discontinued after the first year.
Helicopters fly the Wabash River from its conflu-ence with the Ohio River up to the U.S. Hwy. 40 bridge in Terre Haute. The West Fork White River is flown from the State Road 39 bridge in Martinsville down to the State Route 58 bridge, west of Elnora.
Five-year (2010–2014) duck migration averages (in thousands) for the central waterfowl hunting zone. The x-axis is the approximate week of the month, not the date. The solid black line is 2014 only.

2015 Wildlife Science Report—Wildlife Research 55
The ditches and marshes around Gibson Generating Station, including Gibson Lake, and Cane Ridge are also flown. This is an important area for wintering waterfowl, especially mallard, snow goose (Chen caerulescens), and Ross’s goose (C. rossii).
Avian Influenza MonitoringAfter an outbreak of H5N8 highly-pathogenic avian
influenza (HPAI) in a backyard poultry flock in Whitley County in May 2015, DFW biologists, working with vet-erinarians from BOAH, monitored wild waterfowl around the Whitley County outbreak area through environmen-tal sampling. In addition, other wild birds were tested statewide when found dead. Samples consisted of mostly hawks and owls, though some songbirds and waterbirds were tested as well. All samples were negative for HPAI.
Throughout routine Canada goose banding in June 2015, BOAH personnel accompanied DFW banding crews and sampled 755 birds for HPAI (mostly Canada geese, along with a few mallards and feral domestic ducks). All were negative for HPAI.
Indiana counties where wild birds were tested for HPAI in 2015. All tests were negative for HPAI.
Locations where hunter-harvested birds will be tested for HPAI in fall and winter 2015–16.
As fall 2015 progresses, the DFW will continue to test appropriate species when these birds are found sick or dead. In addition, hunter harvested dabbling ducks will be tested at eight state properties during duck season, in accordance with the national HPAI surveillance plan.
BLACK BEARSBlack Bear Visits Indiana
In spring 2015, a black bear made its first verified visit to Indiana in 144 years. Black bears were historically abundant across the state, excluding portions of north-west Indiana dominated by prairie. Unregulated hunting and habitat loss caused black bears to be extirpated from Indiana, and much of the Midwest, by 1850. The last con-firmed report of a black bear in Indiana was in 1871.
In the last 20 years, bear populations have expanded across the Appalachian range and upper Midwest and have recolonized several states that had previously lost their resident populations. These states include Con-necticut, Georgia, Kentucky, Maryland, Missouri, Rhode Island, New Jersey, Ohio, Oklahoma, South Carolina, and Texas. More recently, sightings of bears—typically

2015 Wildlife Science Report—Wildlife Research56
young males—have occurred in Iowa, Illinois, Kansas and Nebraska. As of 2015, Delaware and Indiana were the only states in the continental United States that had not had a confirmed bear sighting in modern times.
On June 3, 2015, the Michigan DNR informed the DFW that a black bear was in Berrien County, which borders LaPorte and St. Joseph counties in northwest Indiana, and three days later, bear scat was confirmed near a South Bend residence. This bear, believed to be a young male, spent most of the next three months in Indiana, during which time IDNR personnel verified, or deemed probable, 35 reports, primarily in the Michigan City-LaPorte area. No Indiana sightings were reported in September, but the bear returned to the Michigan City area in October, providing the DFW with another nine verified or probable reports. It was last reported in Indi-ana on October 13 and last reported in 2015 on Novem-ber 6 from Bridgman, Michigan, nearly 13 miles north of the state line. In total, there were 44 verified or prob-able reports in Indiana (41 from LaPorte County and three from St. Joseph County), and another 14 probable reports in Michigan within 3 miles of the state line.
The DFW used Michigan’s “Problem Bear Guidelines” to manage the situation, and considered the bear a Category IV bear when it entered the state because of adverse encounters with residents as it traveled and located food. The DFW released media information and updated webpages with information on bear safety and minimizing contact with humans through bear-proofing practices. Additionally, DFW and Division of Law Enforcement staff was made available to the media and conducted public educational programs later in
A black bear eats birdseed from a feeder in the backyard of a residence in Michigan City in mid-June.
LaPorte County map of verified and probable bear reports received by the DNR between June 13 and October 13, 2015.

2015 Wildlife Science Report—Wildlife Research 57
the fall. Plans changed in late June, when the bear was upgraded to Category III after it continued to find food attractants, revisited numerous locations and attempted to enter a residence. DFW staff determined that capture and relocation would be the most appropriate remedy, but subsequent attempts to do so were unsuccessful.
Indiana, like nearly every other state in the eastern U.S., will learn to live with bears in time, but as seen elsewhere, problems and negative human-bear interac-tions are likely to occur. It is essential for State agencies, local governments, and the public to be prepared and exhaust every effort possible to minimize these negative interactions. Though occurrences may be rare for many years, bears will likely continue to periodically visit Indiana. To report a bear sighting or sign of a bear visit, please visit: www.in.gov/dnr/fishwild/8497.htm.
WILD PIGSWild Pig Status And Elimination Project
Wild pigs (Sus scrofa), an exotic, non-native and in-vasive species, were intentionally and illegally released in two different regions of southern Indiana in the early 1990s. The released pigs are primarily linked to sources in Louisiana and, possibly, Mississippi. DNA analyses of tissues collected from euthanized wild pigs confirmed their origin but also suggest that other sources probably released pigs several years later.
The wild pigs exhibited morphological characteristics of the Eurasian or Russian Boar hybrids rather than feral swine of domestic origin. Ongoing DNA profiling of existing wild pig populations shows promise as a forensic tool for law enforcement, to determine the origin of potential new populations, and a means to evaluate eradication success. Population control was previously conducted through unrestricted shooting; however, neither this approach nor recreational sport hunting are effective in controlling wild pig
populations—and will generally encourage illegal releases of more pigs to expand hunting opportunities.
In 2014, Congress approved $20 million over five years to control and eliminate wild pig populations, with focus directed at what were termed “emerging wild pig populations” in the Midwest farm belt. USDA-Wildlife Services hired professionally-trained technicians in each state to work cooperatively with various State and federal agencies and cooperating landowners to carry out wild pig population control techniques, including trapping, snaring, aerial shooting, and selective night shooting of pigs not effectively eliminated by other methods. Pig removal involves adapting traditional techniques and equipment to conditions in the Midwest, where the combination of relatively low density pig populations, abundant food resources, and winter conditions have presented challenges not likely faced in many southern states. Another ongoing challenge is educating landowners to integrate multiple control methods and develop the patience to capture complete pig sounder groups (adult sows and their progeny) for removal.
The proliferation of pot-bellied pig reports around the state has become more of an administrative nuisance and unnecessary waste of limited personnel investigation time. Most pot-bellied pigs and their hybrids appear to be abandoned, escaped, or poorly-confined pets. Free-ranging swine of any origin can damage native fauna and flora, their habitats, water resources, and personal property. By state law, free-ranging swine of all types can generally be shot on sight in Indiana, with landowner permission. Several pot-bellied hybrids have been killed on Indiana DNR properties.
Indiana recently modified its exotic animal statute to recognize the legal possession and breeding of “Heritage” swine, to make pursuit or take of wild/feral swine with dogs illegal, and to improve language pertaining to “aiding and abetting” the illegal release of wild/feral swine.
Wildlife Science biologist Steve Backs takes tissue samples from wild pigs that were part of an elimination project.
A sow and 3 young wild piglets grazing near a fresh mud wallow.