2015 water and wastewater finance - unc school of … · 2015 water and wastewater finance february...
TRANSCRIPT
Environmental Finance Center, School of Government 1
Agenda UNC School of Government Environmental Finance Center
2015 Water and Wastewater Finance February 10-11, 2015 Friday Center 100 Friday Center Drive, Chapel Hill, NC
Tuesday, February 10
9:00 Continental Breakfast/Registration
9:30 Introduction/Capital Finance Overview
Jeff Hughes, Director, School of Government Environmental Finance Center
10:30 Break
10:45 Water Finance Legal Issues and Trends
Update on evolving legal issues (e.g. availability charges, impact fees, inter local
agreement Pre-audit requirements, Pending Cases)
Kara Millonzi, School of Government
12:00 Lunch
1:00 Water and Sewer Rates!
Jeff Hughes
Shadi Eskaf, Senior Project Director Environmental Finance Center
David Tucker, Project Director Environmental Finance Center
3:00 Break
3:15 Wholesale Rates and Inter-local Agreements
Jeff Hughes
Joseph Martin, Woodfin Water and Sanitary District
4:30 Adjourn

Environmental Finance Center, School of Government 2
Wednesday, February 11
8:00 Continental Breakfast
8:30 One Time Capital Charges and Fees (System Development Charges,
Assessments, Impact Fees ETC.) Jeff Hughes
9:30 Break
9:45 How’s Your Utility’s Financial Health?
Discussion of different approaches and systems for measuring financial capability
Ted Damutz, Moody’s Investor Service
Ted Cole, Davenport & Company LLC
10:45 Break
11:00 Creative Water and Wastewater Finance
What’s New and Emerging in the world of water finance (Distributed Infrastructure,
Green Bonds, Micro-Bonds, Assessment Bonds, P3)
Jeff Hughes
Mary Tiger
Adam Parker, Sanford Holshouser LLP
12:00 Lunch
1:00 Finding the Money! Capital Finance Programs and Options Louis Lloyd, Retired BB&T
Dennis Delong, USDA Rural Development Water and Sewer Programs
Kim Colson, Director, State Water Infrastructure Finance Authority(SWIA), NCDENR
Seth Robertson, SWIA-CWSRF
Amy Simes, SWIA-DWSRF
Stephanie Morris, SWIA-CDBG
3:00 Wrap up and adjourn
10.5 Continuing Education Hours
Individuals seeking PDH credit should submit
this agenda and license # to NC BELS
Water Treatment Operators and Water Pollution Control
Operators should sign a course attendance roster at the
conclusion of the course at the registration desk.

2/10/2015
1
Water and Wastewater Finance:Legal Issues & Trends
Kara Millonzi
February 2015
Common Legal Issues
• Availability fees
• Impact/Capacity/System fees
• Transfers
• Preaudit requirements
Availability Fees
• Charge on developed property that is not connected to unit’s water/sewer line
– Not applicable to “dry taps”
• Charge cannot exceed periodic administrative/overhead fee that unit assesses on properties that are connected
2/10/2015
2
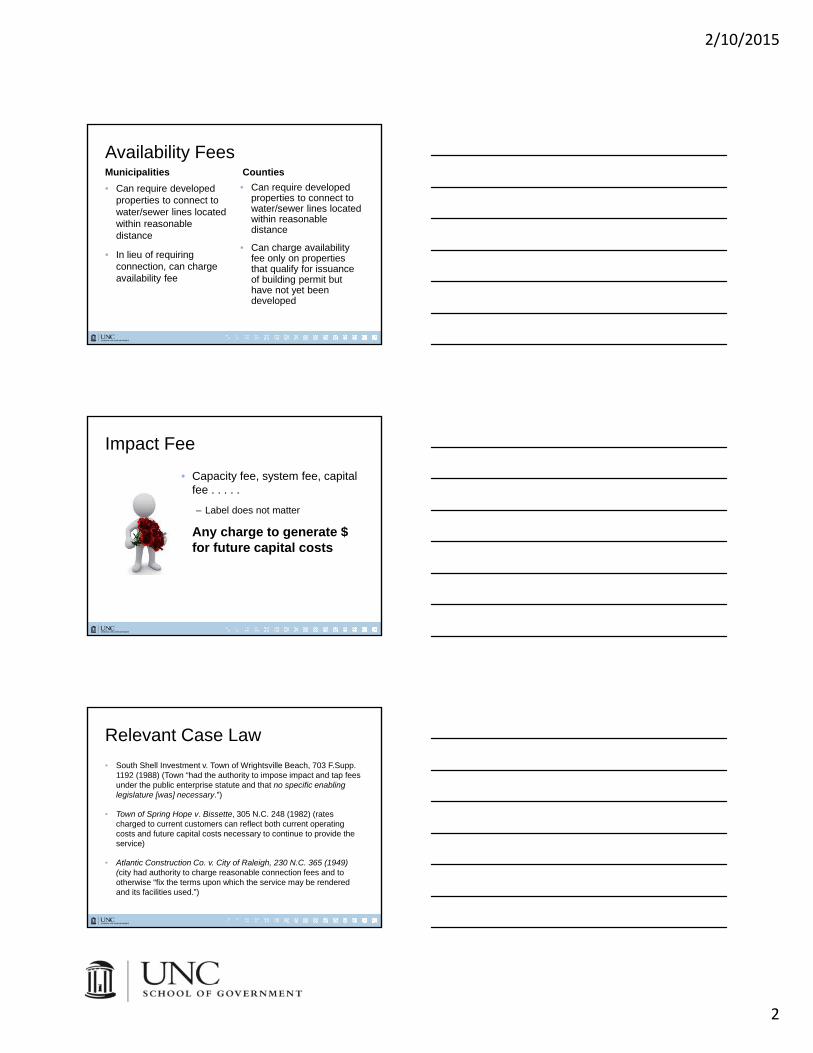
Availability FeesMunicipalities
• Can require developed properties to connect to water/sewer lines located within reasonable distance
• In lieu of requiring connection, can charge availability fee
Counties
• Can require developed properties to connect to water/sewer lines located within reasonable distance
• Can charge availability fee only on properties that qualify for issuance of building permit but have not yet been developed
Impact Fee
• Capacity fee, system fee, capital fee . . . . .
– Label does not matter
• Any charge to generate $ for future capital costs
Relevant Case Law
• South Shell Investment v. Town of Wrightsville Beach, 703 F.Supp. 1192 (1988) (Town “had the authority to impose impact and tap fees under the public enterprise statute and that no specific enabling legislature [was] necessary.”)
• Town of Spring Hope v. Bissette, 305 N.C. 248 (1982) (rates charged to current customers can reflect both current operating costs and future capital costs necessary to continue to provide the service)
• Atlantic Construction Co. v. City of Raleigh, 230 N.C. 365 (1949) (city had authority to charge reasonable connection fees and to otherwise “fix the terms upon which the service may be rendered and its facilities used.”)

2/10/2015
3
Relevant Case Law
• Union Land Owners Ass’n v. County of Union, 201 N.C. App. 374 (2009), disc. rev. den’d, 364 N.C. 442 (2010) (no implied impact fee authority)
• Amward Homes, Inc. v. Town of Cary, 206 N.C. App. 38 (2010), aff’dby an equally divided court, 365 N.C. 305 (2011) (no implied impact fee authority)
• Lanvale Properties, LLC v. County of Cabarrus, 366 N.C. 142 (2012) (no implied impact fee authority)
Counties and Municipalities May….
• “[e]stablish and revise from time to time schedules of rents, rates, fees, charges, and penalties for the use of or the services furnished by any public enterprise.”
Water and Sewer Authorities May…
• set “rates, fees, and other charges for the use of and for the services furnished or to be furnished by any water system or sewer system or parts thereof owned or operated by the authority.”

2/10/2015
4
Is there authority?
• Monthly charge to current water customers, $12.50 fixed + $15.00 per 1000 gallons
• $400 tap fee to install meter and establish new account
• $750 capacity fee assessed on new development
• $1200 connect fee on all properties that connect
Why Care?
• G.S. 160-363; G.S. 153A-324– if unit found to have illegally exacted a fee for development
approval that is not specifically authorized by law, city shall return fee plus 6% interest per annum
• G.S. 6-21.7– if court finds unit outside the scope of its legal authority,
the court may award reasonable attorneys' fees and costs to the party who successfully challenged the city's or county's action, provided that if the court also finds that the city's or county's action was an abuse of its discretion, the court shall award attorneys' fees and costs.
Transfers
General FundGeneral Fund Enterprise FundEnterprise Fund

2/10/2015
5
Transfers
• From General Fund to an Enterprise Fund
– Authorized by G.S. 153A-276; G.S. 160A-313
• From Enterprise Fund to General Fund (or any other fund)
– Authorized by G.S. 159-13(b)(14)
– But, G.S. 159G-37
NCDENR SRF Certification
Applicant’s Certification:
I certify that no funds received from water or wastewater utility operations have been transferred in the last fiscal year from the water and/or sewer enterprise fund to the general fund for the purpose of supplementing the (Local Government Unit) resources of the general fund in accordance with § 159G-37.(b) except as allowable and are listed below.
Preaudit
2/10/2015
6
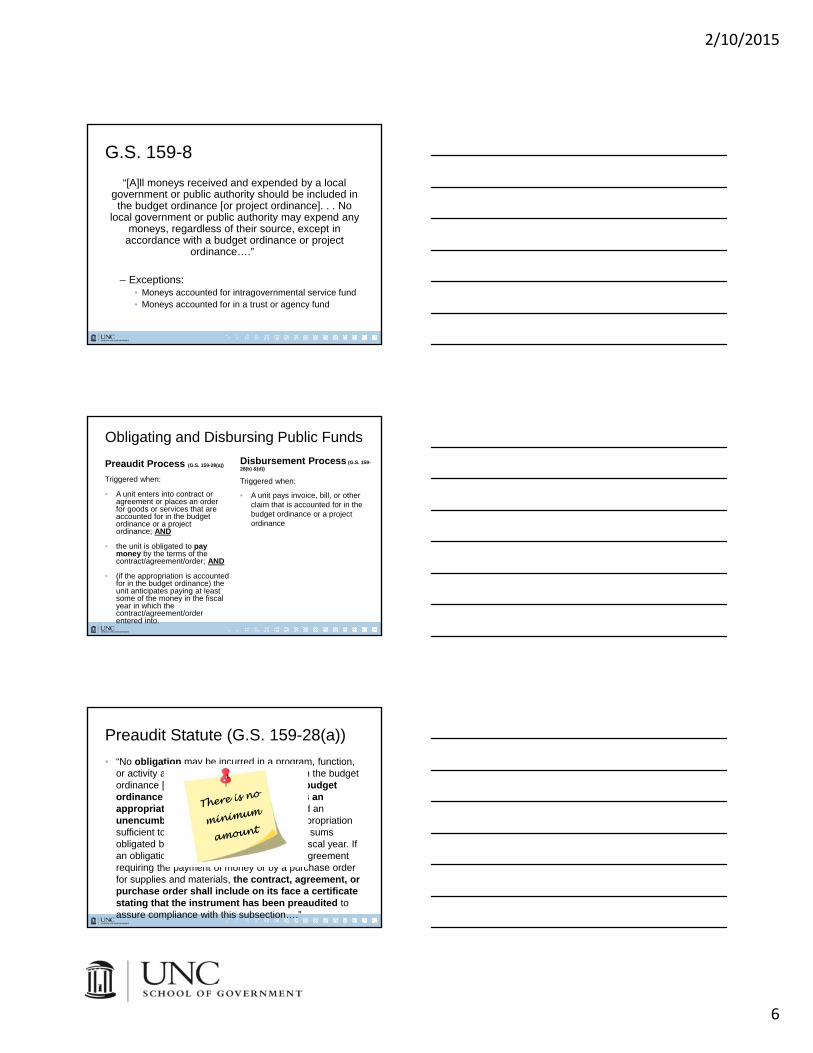
G.S. 159-8
“[A]ll moneys received and expended by a local government or public authority should be included in
the budget ordinance [or project ordinance]. . . No local government or public authority may expend any
moneys, regardless of their source, except in accordance with a budget ordinance or project
ordinance….”
– Exceptions:• Moneys accounted for intragovernmental service fund• Moneys accounted for in a trust or agency fund
Obligating and Disbursing Public Funds
Preaudit Process (G.S. 159-28(a))
Triggered when:
• A unit enters into contract or agreement or places an order for goods or services that are accounted for in the budget ordinance or a project ordinance; AND
• the unit is obligated to pay money by the terms of the contract/agreement/order; AND
• (if the appropriation is accounted for in the budget ordinance) the unit anticipates paying at least some of the money in the fiscal year in which the contract/agreement/order entered into.
Disbursement Process (G.S. 159-28(b) &(d))
Triggered when:
• A unit pays invoice, bill, or other claim that is accounted for in the budget ordinance or a project ordinance
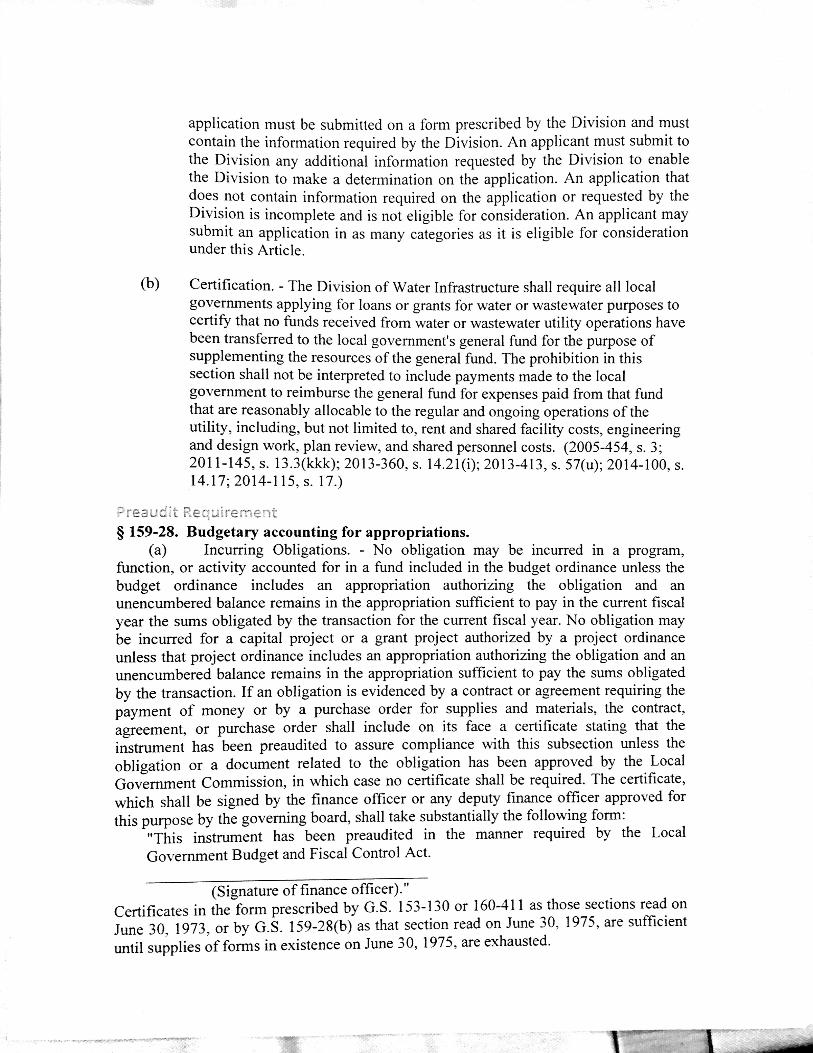
Preaudit Statute (G.S. 159-28(a))
• “No obligation may be incurred in a program, function, or activity accounted for in a fund included in the budget ordinance [or project ordinance] unless the budget ordinance [or project ordinance] includes an appropriation authorizing the obligation and an unencumbered balance remains in the appropriation sufficient to pay in the current fiscal year the sums obligated by the transaction for the current fiscal year. If an obligation is evidenced by a contract or agreement requiring the payment of money or by a purchase order for supplies and materials, the contract, agreement, or purchase order shall include on its face a certificate stating that the instrument has been preaudited to assure compliance with this subsection….”

2/10/2015
7
Preaudit applies to:
• Purchase orders (POs)
• Purchases below PO threshold
• Service contracts
• Phone / Internet orders
• Credit / Procurement / Fuel Card payments
• Employment agreements (even at-will)
• Interlocal agreements
• Etc.
Is a Preaudit Required?
• City and county enter into a five year bulk water sale agreement whereby county agrees to purchase water from the city. The county will pay based on city’s rate schedule.
– Must the city preaudit the contract?
– Must the county preaudit the contract?
G.S. 159-28(a): What is Process?
Finance Officer (or deputy finance officer) must:1. Check to see if there is an appropriation in budget ordinance
or project ordinance for amount due this fiscal year
2. Check to see if sufficient funds remain in the appropriation to cover amount that will come due this fiscal year
3. Memorialize contract/agreement/order in writing*
4. Affix signed preaudit certificate to “writing” that evidences contract/agreement/order
* New requirement as per 2012 & 2013 NC Court of Appeals decisions

2/10/2015
8
G.S. 159-28(a): Certificate
“This instrument has been preaudited in the manner required by the Local Government Budget and Fiscal Control Act.”
___________________(Signature of finance officer or deputy finance officer)
• Not required on any contracts approved by LGC.
Penalties for not following Process
• Contract/agreement/order is VOID and cannot be enforced
• Any individual or officer who enters into contract/agreement /order or causes funds to be disbursed without following statutory processes may be held personally liable for amounts committed or disbursed


2/10/2015
1
Member NYSE|FINRA|SIPC
February 10-11, 2015
How’s Your Utility’s Financial Health?UNC School of Government Environmental Finance Center 2015 Water and Wastewater Finance
Introduction.
– Identify the Characteristics of a Financially Strong Utility System.
Multi-Step Approach to Establishing a Financially Strong Utility System.
– Perform an Internal Assessment of Historical Financial Performance.
– Develop Peer Comparative and Benchmarking Analyses to Identify Relative Strengths and Weaknesses.
– Project Future Financial Performance to Achieve Identified Goals.
– Establish a Series of Policies and Procedures to Memorialize and Institutionalize Best Practices.
– Implement a Multi-Year Plan.
February 10-11, 2015
Topics for Discussion
UNC School of Government Environmental Finance Center 1
Since the financial downturn, the credit quality of a utility system has become more important than in previous market environments.
Credit rating agencies, banks and investors have increased the level of due diligence performed on transactions.
On December 15, 2014 Moody’s Investors Service issued a Rating Methodology for US Municipal Utility Revenue Debt and on December 10, 2014 Standard and Poor’s released their proposed criteria for US Municipal Utility Systems. Fitch continues to operate under their established criteria.
A Utility should not manage itself exclusively for rating agencies; however, often times good planning and rating agency strategies are aligned.
– Multi-year Financial Planning.
– Formalized Management Practices / Policies.
– Comprehensive Approach to System Management (Regulatory Compliance, Capacity Issues, Competitive Rate Structure).
February 10-11, 2015
Credit Quality
2
3
4
5
6
7
8
Per
cent
(%)
Credit Spreads: 30-Year MMD
AAA BBB
UNC School of Government Environmental Finance Center 2
Credit Spreads (%) vs the 30-yr AAA M MD
Nov 2004 - Dec 2008Rating Min Max Average
AA 0.04 0.19 0.10 A 0.15 1.26 0.33
BBB 0.30 2.52 0.60
Dec 2008 - Jan 2015Rating Min Max Average
AA 0.09 0.56 0.22 A 0.27 1.11 0.75
BBB 0.69 2.58 1.49
Note: credit spreads compared to the 'AAA' equivalent

2/10/2015
2
System size and assessment base.
– Larger systems can achieve economies of scale.
– Smaller systems may have trouble raising revenues to meet large fixed costs.
Economy and customer base.
– Diverse customer base protects against loss of large customers.
– Growing economy / population increase can stress a system’s ability to meet capital and operating needs.
– Wealth and income levels provide insight into the economic resources of the service area.
Governance / Legal Provisions.
– An independent Board often counters politicization of a utility.
– Trust Agreements set minimum operating / financial standards for issuers in a contract with bond holders.
– Rate Covenant.
– Additional Bonds Test.
– Debt Service Reserve Fund.
February 10-11, 2015 UNC School of Government Environmental Finance Center 3
Characteristics of a Financially Strong Utility System
Management.
– Adaptability to regulatory changes and financial constraints.
– Sound staffing practices.
– Established track record of financial management and regulatory compliance.
– Financial Policy Guidelines.
Strategic Focus.
– Multi-year Capital Improvement Plan (“CIP”) which includes current and projected capital needs for asset maintenance and expansion of user base.
– Identified funding sources for CIP with a balanced mix of debt and pay-go financing.
– Long-term financial forecasting minimizes financial uncertainty.
– Proactive regulatory compliance planning process.
Rates, rate structure, and rate-making flexibility.
– Ability and willingness to set/raise rates to a sufficient level to meet all obligations and maintain reserves for emergencies.
– Debt Service Coverage.
– Liquidity.
February 10-11, 2015 UNC School of Government Environmental Finance Center 4
Characteristics of a Financially Strong Utility System
Liquidity.
– Systems with large, completed, and compliant capital improvement programs can afford narrower margins.
– Adequate excess revenues (i.e. strong debt service coverage ratio) enable systems to cash-fund more capital needs.
System Capacity.
– Ability of current system capacity to support existing customers and future growth.
– Additional needs in near-term and long-term to meet customer demand affect size and scope of capital programs.
System Condition.
– Age and repair of existing system facilities.
February 10-11, 2015 UNC School of Government Environmental Finance Center 5
Characteristics of a Financially Strong Utility System

2/10/2015
3
Multi-Step Approach to Establishing a Financially Strong Utility System
February 10-11, 2015 UNC School of Government Environmental Finance Center 6
Evaluate Operating Revenues and Expenditures.
– Diversity of operating revenue sources.
– Source of revenue growth (e.g. customers, flows, rates).
– Operating revenues derived from contractual agreements.
– Nature of expenditure drivers (i.e. fixed contractual obligations vs. variable flow-driven expenses).
– Structural Operating Balance.
Indentify Non-Operating Revenue / Expenditure Cash Flows.
– Capacity / development / connection fees.
– Transfers to / from the other funds (e.g. General Fund, Rate Stabilization Fund, etc.).
– Indirect cost allocations.
– Debt service costs.
February 10-11, 2015 UNC School of Government Environmental Finance Center 7
Perform an Internal Assessment of Historical Financial Performance
0.0
10.0
20.0
30.0
40.0
50.0
60.0
70.0
80.0
2011 2012 2013 2014 2015 Budget
Mil
lions
Utility Revenues vs. Expenditures
Operating Expense Debt Service Revenue
-2.0 4.0 6.0 8.0
10.0 12.0 14.0 16.0
2011 2012 2013 2014 2015 Budget
Mill
ions
Historical System Flows
Wastewater Flows Water Flows
Capital Funding Activities.
– Historical debt issuance.
– Pay-as-you-go Capital Outlay.
Liquidity Position.
– Identify both restricted and unrestricted resources.
– Measure liquidity relative to System Budget.
– Cash as a percentage of O&M Expenditures.
– Days Cash on Hand.
Debt Service Coverage.
– Parity.
– Subordinate.
– Total.
February 10-11, 2015 UNC School of Government Environmental Finance Center 8
Perform an Internal Assessment of Historical Financial Performance
0
200
400
600
800
1000
1200
1400
1600
1800
2011 2012 2013 2014 2015 Budget
0%
50%
100%
150%
200%
250%
300%
350%
400%
450%
500%
Cash as a % of O&M and Days Cash on Hand
Operating Days Cash on Hand Cash as % of Operating Expense
.0x
.5x
1.0x
1.5x
2.0x
2.5x
3.0x
3.5x
4.0x
2011 2012 2013 2014 2015 Budget
Total and Parity Debt Service Coverage
Total Debt Service Coverage Parity Coverage

2/10/2015
4
Develop a meaningful peer group to identify relative strengths and weaknesses.
– Debt Ratios.
– Fund Balance / Liquidity Ratios.
– Customer Concentration.
– Service Area Characteristics.
Peer Groups may include:
– Credit Rating Categories.
– Customer Base Size.
– Neighboring Utility Systems.
Resources for benchmarking include:
– School of Government Dashboard.
– Credit Rating Agency Publications.
– Local Government Commission Reports.
February 10-11, 2015
Peer Comparative and Benchmarking Analyses
UNC School of Government Environmental Finance Center 9
0.00x 0.50x 1.00x 1.50x 2.00x 2.50x 3.00x 3.50x
NC 'A' W&S Median
NC 'Aa' W&S Median
NC 'Aaa'' W&S Median
Nat'l 'A' W&S Median
Nat'l 'Aa' W&S Median
Nat'l 'Aaa' W&S Median
Total Debt Service Coverage
0 100 200 300 400
NC 'A' W&S Median
NC 'Aa' W&S Median
NC 'Aaa'' W&S Median
Nat'l 'A' W&S Median
Nat'l 'Aa' W&S Median
Nat'l 'Aaa' W&S Median
Percent
Water and Sewer Unrestricted Cash as a % of O&M
Project Future Operating and Non-Operating Revenues.
– System flows, customer growth and required Rate Increases.
Project Future Operating Expenditures.
– Overhead costs and contractual obligations.
– Variable costs driven by system demand and cost of materials.
February 10-11, 2015 UNC School of Government Environmental Finance Center 10
Forecast Future Financial Performance to Achieve Identified Goals
-
5
10
15
20
25
Mil
lions
Historical and Projected Revenues
Historical Revenues Projected Revenues
-
5
10
15
20
25
Mil
lions
Historical and Projected Expenditures
Historical Expenditures Projected Expenditures
Develop a multi-year Capital Improvement Program (“CIP”) including:
– Identifying realistic capital and maintenance needs (not a wish list).
– Asset Management.
– System Enhancement.
– Regulatory.
– Capacity/Expansion.
– Assigning funding sources for all projects with a balanced approach of pay-as-you-go cash, grants, reserves and debt.
– Analyzing potential operating budget impacts associated with planned capital projects.
February 10-11, 2015
Forecast Future Financial Performance to Achieve Identified Goals
UNC School of Government Environmental Finance Center 11
Asset Management
40%
System Enhancement
15%
Regulatory25%
Capacity / Expansion
20%
5-Year CIP: Uses of Funds
Pay-As-You-Go Capital
10%
Revenue Bonds45%Grants
30%
Capital Reserve Fund
10%
Installment Purchase Contracts
5%
5-Year CIP: Sources of Funds

2/10/2015
5
Analyze the forecasted revenues, expenditures and capital needs relative to financial ratios.
Isolate the effect of key variables to stress test the system’s financial performance.
– Model various demand scenarios and the related impacts on revenues.
– Expenditure inflation.
– Parity vs. subordinate indebtedness.
Calculate System capital funding capacity under a series of parameters including debt service coverage levels, liquidity measures and revenue growth.
Measure potential Customer Rate Implications.
– One-time increases vs. multi-year strategy.
February 10-11, 2015
Forecast Future Financial Performance to Achieve Identified Goals
UNC School of Government Environmental Finance Center 12
.0x
.5x
1.0x
1.5x
2.0x
2.5x
3.0x
3.5x
4.0x
2011 2012 2013 2014 2015 Budget
Total and Parity Debt Service Coverage
Total Debt Service Coverage Parity Coverage
System Funding Capacity - 5% Revenue Growth
Debt Service Coverage RatioCash 1.00x 1.25x 1.50x 1.75x25% 25,500,000 20,500,000 17,500,000 15,000,000 50% 24,500,000 19,500,000 16,500,000 13,500,000 75% 23,500,000 18,000,000 15,000,000 12,500,000 100% 22,500,000 17,000,000 14,000,000 11,500,000
Financial policies can provide benefits to a number of parties by:
– Establishing a policy / decision making framework for staff and the governing body.
– Providing comfort to Rating Agencies, Banks and Investors that a utility system will mange itself in a responsible fashion.
– Offer transparency to customers.
A Financial Policy and Procedures Document may include:
– Cash Management and Investment Policies.
– Budgeting Policies.
– Capital Improvement Planning Policies.
– Debt Policies.
– Liquidity Policies.
February 10-11, 2015
Establish a Series of Policies and Procedures
UNC School of Government Environmental Finance Center 13
0
200
400
600
800
1000
1200
1400
1600
1800
2011 2012 2013 2014 2015 Budget
0%
50%
100%
150%
200%
250%
300%
350%
400%
450%
500%
Cash as a % of O&M and Days Cash on Hand
Operating Days Cash on Hand Cash as % of Operating Expense Policy
.0x
1.0x
2.0x
3.0x
4.0x
2011 2012 2013 2014 2015 Budget
Total and Parity Debt Service Coverage
Total Debt Service Coverage Parity Coverage
Rate Covenant - Total Rate Covenant - Parity
Policy - Total
Memorialize the Plan through a series of Policy / Planning Documents.
– Adopted Financial Policies and Guidelines.
– Formalized Capital Improvement Plan.
– Approved by the Governing Body.
– Updated on a regular basis (e.g. annually or bi-annually).
– Multi-Year Rate Strategy that is implemented by the Governing Body and is assessed annually as part of the budget process.
February 10-11, 2015 UNC School of Government Environmental Finance Center 14
Implement a Multi-Year Plan
2/10/2015
6
Municipal Advisor Disclosure
The U.S. Securities and Exchange Commission (the “SEC”) has clarified that a broker, dealer or municipal securities dealer engaging in municipal advisory activities outside the scope of underwriting a particular issuance ofmunicipal securities should be subject to municipal advisor registration. Davenport & Company LLC (“Davenport”) has registered as a municipal advisor with the SEC. As a registered municipal advisor Davenport mayprovide advice to a municipal entity or obligated person. An obligated person is an entity other than a municipal entity, such as a not for profit corporation, that has commenced an application or negotiation with an entity toissue municipal securities on its behalf and for which it will provide support. If and when an issuer engages Davenport to provide financial advisory or consultant services with respect to the issuance of municipal securities,Davenport is obligated to evidence such a financial advisory relationship with a written agreement.
When acting as a registered municipal advisor Davenport is a fiduciary required by federal law to act in the best interest of a municipal entity without regard to its own financial or other interests. Davenport is not a fiduciarywhen it acts as a registered investment advisor, when advising an obligated person, or when acting as an underwriter, though it is required to deal fairly with such persons.
This material was prepared by public finance, or other non-research personnel of Davenport. This material was not produced by a research analyst, although it may refer to a Davenport research analyst or research report.Unless otherwise indicated, these views (if any) are the author’s and may differ from those of the Davenport fixed income or research department or others in the firm. Davenport may perform or seek to perform financialadvisory services for the issuers of the securities and instruments mentioned herein.
This material has been prepared for information purposes only and is not a solicitation of any offer to buy or sell any security/instrument or to participate in any trading strategy. Any such offer would be made only after aprospective participant had completed its own independent investigation of the securities, instruments or transactions and received all information it required to make its own investment decision, including, whereapplicable, a review of any offering circular or memorandum describing such security or instrument. That information would contain material information not contained herein and to which prospective participants arereferred. This material is based on public information as of the specified date, and may be stale thereafter. We have no obligation to tell you when information herein may change. We make no representation or warrantywith respect to the completeness of this material. Davenport has no obligation to continue to publish information on the securities/instruments mentioned herein. Recipients are required to comply with any legal orcontractual restrictions on their purchase, holding, sale, exercise of rights or performance of obligations under any securities/instruments transaction.
The securities/instruments discussed in this material may not be suitable for all investors or issuers. Recipients should seek independent financial advice prior to making any investment decision based on this material.This material does not provide individually tailored investment advice or offer tax, regulatory, accounting or legal advice. Prior to entering into any proposed transaction, recipients should determine, in consultation withtheir own investment, legal, tax, regulatory and accounting advisors, the economic risks and merits, as well as the legal, tax, regulatory and accounting characteristics and consequences, of the transaction. You shouldconsider this material as only a single factor in making an investment decision.
The value of and income from investments and the cost of borrowing may vary because of changes in interest rates, foreign exchange rates, default rates, prepayment rates, securities/instruments prices, market indexes,operational or financial conditions or companies or other factors. There may be time limitations on the exercise of options or other rights in securities/instruments transactions. Past performance is not necessarily a guideto future performance and estimates of future performance are based on assumptions that may not be realized. Actual events may differ from those assumed and changes to any assumptions may have a material impacton any projections or estimates. Other events not taken into account may occur and may significantly affect the projections or estimates. Certain assumptions may have been made for modeling purposes or to simplify thepresentation and/or calculation of any projections or estimates, and Davenport does not represent that any such assumptions will reflect actual future events. Accordingly, there can be no assurance that estimatedreturns or projections will be realized or that actual returns or performance results will not materially differ from those estimated herein. This material may not be sold or redistributed without the prior written consent ofDavenport.
Version 1.13.14 MB | TC
February 10-11, 2015 UNC School of Government Environmental Finance Center 15

1
Analysis of Water & Sewer Revenue Debt
Ted Damutz, Senior Credit Officer
UNC School of Government Environmental Finance Center Chapel Hill February 11, 2015
Water & Sewer Sector is Relatively Stable…..
Water & Sewer Sector is Relatively Stable…..…..
2
» Monopolistic service
» Highly essential service
» Operations (not finances) highly regulated
» Relatively affordable
» Paid from user fees generated from system operations
…..But There are Risks for Some Systems
3
» Public resistance to rate increases
» Limitations to support from general government
» Source constraints
» Environmental consent decrees with state and federal regulators can result in significant additional debt
» Risk from general government distress, even if separately secured or governed

2
4
Distribution of Water & Sewer Ratings Mirrors GO Ratings» Average rating for both sectors is Aa3
0.0%
5.0%
10.0%
15.0%
20.0%
25.0%
30.0%
Aaa Aa1 Aa2 Aa3 A1 A2 A3 Baa1 Baa2 Baa3 Ba1 Ba2 Ba3 B1 B2 B3 Caa1 Caa2 Caa3 Ca
Moody's General Obligation Bond Ratings
0.0%
5.0%
10.0%
15.0%
20.0%
25.0%
30.0%
35.0%
Aaa Aa1 Aa2 Aa3 A1 A2 A3 Baa1 Baa2 Baa3 Ba1 Ba2 Ba3 B1 B2 B3 Caa1 Caa2 Caa3 Ca
Moody's Water/Sewer Revenue Bond Ratings
Water Enterprises Sewer Enterprises Combined Enterprises
Type of System
5
» Water, sewer or combined water / sewer
» Local retailer – water distribution, sewerage collection
» Regional wholesaler – water supply, sewerage treatment
» Integrated systems – supply / distribution or collection / treatment
» Independent authority or part of a general purpose government
Areas of Analysis
6
» Economy / Service Area
» Management / Governance
» Rate setting authority
» Debt / Capital Needs / Regulatory
Compliance
» Covenants and Other Security Provisions
» Financial Performance (Including Key Ratios)

3
Economy / Service Area
7
» Signs of Strength
– Growing or Stable, Diversified Economy
– Predominance of Residential Ratepayers
» Signs of Weakness
– Economic or Population Decline
– Other Economic Vulnerabilities
– Rapid Population Growth
– Ratepayer Concentration – Dominant Payers or Dominant Industry
Management / Governance
8
» Signs of Strength
– Regular, moderate rate increases
– Independent rate setting authority
– Conservative financial policies, consistently adhered to
» Signs of Weakness
– Infrequent, large rate increases
– Rates not competitive
– Politicized rate setting process
– Problems with revenue collection
– Absence of long-term planning
– Violation of permits / regulations
Debt / Capital Needs / Regulatory Compliance
9
» Signs of Strength
Capital needs identified and quantified; funding identified
Consistent record of completing capital projects on time and within budget
Manageable debt levels
Level or front-loaded debt structure » Signs of Weaknesses
Large, unaddressed capital needs
Construction risk or uncertainties about costs of capital program
Exposure to unhedged variable rate debt
Exposure to swap termination or bank bond acceleration
Backloaded debt structure

4
System Characteristics
» How do we assess technical and operational characteristics of utility systems for their credit implications?
– Prospective debt and rate structure heavily influenced by:
» Condition of system in terms of age, leakage/outage
» Capacity of system to meet current, future user demands
– Is there other inherent value or risk?
» Saleable water rights, excess treatment capacity, landfill capacity are valuable
» Expiring permits, short term contracts for supply/treatment, dwindling owned resources add risk
Financial Performance – Summary
11
» Signs of Strength
Ratios compare favorably to similar systems and medians
Current net revenues provide good coverage of peak debt service on outstanding bonds including new issue
» Signs of Challenges
Ratios compare unfavorably to similar systems and medians
Operating ratio or debt ratio is rising; debt service coverage is declining
Net revenues need to grow (through future rate increases or increased system use) to cover future debt service on currently outstanding bonds
Dependence on connection fees and other volatile or non-recurring revenues
Assumptions underlying forecast appear optimistic given past trends
Financial Performance – Operating Ratio
12
Median Values – Operating Ratios
2013
Water Systems 64.6%
Sewer Systems 55.7%
Water / Sewer Systems 63.0%
Source: Moody’s MFRA. Based on a population of 322 water systems, 222 sewer systems, and 360 water/sewer systems.
» Operating Ratio – O&M expenses divided by total operating revenues

5
Financial Performance – Debt Service Coverage
13
Median Values – Debt Service Coverage
2013
Water Systems 2.09x
Sewer Systems 1.89x
Water / Sewer Systems 1.95x
Source: Moody’s MFRA. Based on a population of 322 water systems, 222 sewer systems, and 360 water/sewer systems.
» Net revenues divided by annual principal and interest requirements
Financial Performance – Debt Ratio
14
» Net funded debt divided by the sum of net fixed assets and net working
capital
Median Values – Debt Ratio
2013
Water Systems 32.8%
Sewer Systems 38.4%
Water / Sewer Systems 32.7%
Source: Moody’s MFRA. Based on a population of 322 water systems, 222 sewer systems, and 360 water/sewer systems.
Update to US Municipal Utility Methodology
» Update to methodology
• Applies to all municipal utilities, including water, sewer, water and sewer, stormwater, gas, electric (non-generation), solid waste, and other combined utilities
• Quasi-monopolistic systems that provide essential services and are financed by user charges
• Vast majority are municipally owned
» Introduction of a scorecard
• Provides transparency and insight into the credit factors we consider important
• Includes a set of common rating factors and metrics that apply to all utilities, followed by “notching factors” that accommodate more individualized credit considerations
• Does not include every rating consideration – final ratings are determined only by a Rating Committee

6
Current Municipal Utility Ratings» Moody’s maintains approximately 1,100 municipal utility ratings
» Ratings range from Aaa to Caa3, with a median rating of Aa3
0
100
200
300
400
Water & Sewer Water Sewer Electric Stormwater Solid Waste Gas
0
100
200
300
Aaa Aa1 Aa2 Aa3 A1 A2 A3 Baa1 Baa2 Baa3 Ba1 Ba2 Ba3 B1 B2 B3
Rating
Rating Distribution
Rated Municipal Utility Systems by Type
Municipal Utilities Scorecard Weighted Factors
Broad Scorecard Factors Factor Weighting Rating Sub‐Factor Sub‐factor Weighting
System Characteristics 35%
Asset Condition (Remaining Useful Life) 10.0%
Service Area Wealth (Median Family Income) 12.5%
System Size (O&M) 7.5%
Financial Strength 35%
Annual Debt Service Coverage 15.0%
Days Cash on Hand 15.0%
Debt to Operating Revenues 10.0%
Management 20%Rate Management 10.0%
Regulatory Compliance and Capital Planning 10.0%
Legal Provisions 10%
Rate Covenant 5.0%
Debt Service Reserve Requirement 5.0%
Total 100% Total 100%
1. System Characteristics (30%)
» Asset Condition (10%) - Net fixed assets/depreciation
• Proxy for the age and health of the system and where it stands in its useable lifecycle
• An indicator of the ability to comply with environmental regulations and continue delivering adequate service with existing resources
» Service Area Wealth (12.5%) - MFI as % of US
• Income of residents within service area conveys capacity of ratepayers to afford rates necessary to fund operations and capital upgrades
» System Size (7.5%) – O&M expenditures
• Larger systems tend to be more diverse and enjoy economies of scale
• Different types of systems have varying cost structures

7
2. Financial Strength (40%)
» Annual Debt Service Coverage (15%) – Net revenues/debt service
• Measures capacity to pay annual debt service from net revenues of the system and demonstrates financial performance and margin of protection for debt repayment
» Days Cash on Hand (15%) - Cash and investments x 365/operating expenses
• Measures liquidity to meet expenses, cope with emergencies, and manage variances from forecasts
» Debt to Operating Revenues (10%) – Net debt/operating revenues
• Measures debt level relative to gross revenues and normalizes for difference in debt structure that may not be reflected in the annual debt service coverage metric
3. Management (20%)
» Rate Management (10%)
• Assessment of track record of setting rates appropriately to cover operating expenses and capital costs
• Ability and willingness to make timely changes when necessary
» Regulatory Compliance and Capital Planning (10%)
• Measure of utility’s history of addressing state and federal regulatory requirements and meeting future capital needs
4. Legal Provisions (10%)
» Rate Covenant (5%)
• Measures strength of legal commitment to set rates to cover operating costs and debt service, and usually an additional margin
» Debt Service Reserve Requirement (5%)
• Measures strength of debt service reserve requirements relative to scheduled debt service

8
Below‐the‐Line Adjustments
Examples of notching factors addressing individualized credit considerations
• System Characteristics
• Additional service area economic strength or diversity
• Significant customer concentration
• Financial Strength
• Extraordinarily high debt service coverage
• Debt service coverage below key thresholds
• Legal Provisions
• Structural enhancement and/or complexities
• Management
• Unusually strong or weak capital planning
Below‐the‐Line Adjustments: Factors not included in the grid
» Credit attributes that may result in ratings different from scorecard resultsAdjustments/Notching Factors
Factor 1: System CharacteristicsAdditional service area economic strength or diversitySignificant customer concentrationRevenue‐per‐Customer greatly over/under regional average
Exposure to weather volatility or extreme conditions Resource vulnerability (1/3 or greater)Sizable or insufficient capacity margin
Weak depreciation/reinvestment practices relative to industry normsOther analyst adjustment to System Characteristics (Specify)
Factor 2: Financial StrengthDebt Service Coverage (Annual or MADS) below key thresholds: Additional Bonds Test and 1.00x coverageConstrained liquidity position due to oversized transfers
Outsized capital needsOversized ANPL relative to debt or significant ARC under‐paymentSignificant exposure to puttable debt and/or swaps or other unusual debt structure
Other analyst adjustment to Financial Strength factor (Specify)
Factor 3: Legal ProvisionsStructural Enhancements/Complexities
Other analyst adjustment to Legal Provisions factor (Specify)
Factor 4: ManagementUnusually strong or weak operational or capital planning
Other analyst adjustment to Management factor (Specify)OtherCredit Event/Trend not yet reflected in existing data set
Relationship with General Obligation Rating
» A municipal utility’s credit quality is related to the strength of its associated local government entity. Examples of credit linkages include:
• Economy: Coterminous or overlapping economic base and service area
• Finances: Cash can often flow between the two entities
• Debt: Revenues to support GO and utility paid by the same group of constituents
• Management and Governance: Management teams may be the same or have close ties
• Capital Markets: GO and utility need to access the same capital markets for funding
» Rating levels are usually similar (within 2 notches) due to these linkages

9
Larger Rating Differential Can Occur
» Rare cases demonstrate independence from the associated GO rating and may warrant a greater notching difference. Typical features include:
• Non-coterminous service area with revenues coming from a substantially larger base
• Strict separation of accounts and assets
• Independent management and governance
Ted DamutzVice President/Senior Credit [email protected]
26
Questions?
© 2015 Moody’s Investors Service, Inc. and/or its licensors and affiliates (collectively, “MOODY’S”). All rights reserved.
CREDIT RATINGS ARE MOODY'S INVESTORS SERVICE, INC.'S (“MIS”) CURRENT OPINIONS OF THE RELATIVE FUTURE CREDIT RISK OF ENTITIES, CREDIT COMMITMENTS, OR DEBT OR DEBT-LIKE SECURITIES. MIS DEFINES CREDIT RISK AS THE RISK THAT AN ENTITY MAY NOT MEET ITS CONTRACTUAL, FINANCIAL OBLIGATIONS AS THEY COME DUE AND ANY ESTIMATED FINANCIAL LOSS IN THE EVENT OF DEFAULT. CREDIT RATINGS DO NOT ADDRESS ANY OTHER RISK, INCLUDING BUT NOT LIMITED TO: LIQUIDITY RISK, MARKET VALUE RISK, OR PRICE VOLATILITY. CREDIT RATINGS ARE NOT STATEMENTS OF CURRENT OR HISTORICAL FACT. CREDIT RATINGS DO NOT CONSTITUTE INVESTMENT OR FINANCIAL ADVICE, AND CREDIT RATINGS ARE NOT RECOMMENDATIONS TO PURCHASE, SELL, OR HOLD PARTICULAR SECURITIES. CREDIT RATINGS DO NOT COMMENT ON THE SUITABILITY OF AN INVESTMENT FOR ANY PARTICULAR INVESTOR. MIS ISSUES ITS CREDIT RATINGS WITH THE EXPECTATION AND UNDERSTANDING THAT EACH INVESTOR WILL MAKE ITS OWN STUDY AND EVALUATION OF EACH SECURITY THAT IS UNDER CONSIDERATION FOR PURCHASE, HOLDING, OR SALE.
ALL INFORMATION CONTAINED HEREIN IS PROTECTED BY LAW, INCLUDING BUT NOT LIMITED TO, COPYRIGHT LAW, AND NONE OF SUCH INFORMATION MAY BE COPIED OR OTHERWISE REPRODUCED, REPACKAGED, FURTHER TRANSMITTED, TRANSFERRED, DISSEMINATED, REDISTRIBUTED OR RESOLD, OR STORED FOR SUBSEQUENT USE FOR ANY SUCH PURPOSE, IN WHOLE OR IN PART, IN ANY FORM OR MANNER OR BY ANY MEANS WHATSOEVER, BY ANYPERSON WITHOUT MOODY’S PRIOR WRITTEN CONSENT. All information contained herein is obtained by MOODY’S from sources believed by it to be accurate and reliable. Because of the possibility of human or mechanical error as well as other factors, however, all information contained herein is provided “AS IS” without warranty of any kind. Except as expressly stated otherwise, MOODY’S has not verified, audited or validated independently any information received in the rating process, nor will it do so. Under no circumstances shall MOODY’S have any liability to any person or entity for (a) any loss or damage in whole or in part caused by, resulting from, or relating to, any error (negligent or otherwise) or other circumstance or contingency within or outside the control of MOODY’S or any of its directors, officers, employees or agents in connection with the procurement, collection, compilation, analysis, interpretation, communication, publication or delivery of any such information, or (b) any direct, indirect, special, consequential, compensatory or incidental damages whatsoever (including without limitation, lost profits), even if MOODY’S is advised in advance of the possibility of such damages, resulting from the use of or inability to use, any such information. The ratings, financial reporting analysis, projections, and other observations, if any, constituting part of the information contained herein are, and must be construed solely as, statements of opinion and not statements of fact or recommendations to purchase, sell or hold any securities. Each user of the information contained herein must make its own study and evaluation of each security it may consider purchasing, holding or selling. NO WARRANTY, EXPRESS OR IMPLIED, AS TO THE ACCURACY, TIMELINESS, COMPLETENESS, MERCHANTABILITY OR FITNESS FOR ANY PARTICULAR PURPOSE OF ANY SUCH RATING OR OTHER OPINION OR INFORMATION IS GIVEN OR MADE BY MOODY’S IN ANY FORM OR MANNER WHATSOEVER.
MIS, a wholly-owned credit rating agency subsidiary of Moody’s Corporation (“MCO”), hereby discloses that most issuers of debt securities (including corporate and municipal bonds, debentures, notes and commercial paper) and preferred stock rated by MIS have, prior to assignment of any rating, agreed to pay to MIS for appraisal and rating services rendered by it fees ranging from $1,500 to approximately $2,500,000. MCO and MIS also maintain policies and procedures to address the independence of MIS’s ratings and rating processes. Information regarding certain affiliations that may exist between directors of MCO and rated entities, and between entities who hold ratings from MIS and have also publicly reported to the SEC an ownership interest in MCO of more than 5%, is posted annually at www.moodys.com under the heading “Shareholder Relations — Corporate Governance — Director and Shareholder Affiliation Policy.”
Any publication into Australia of this document is by MOODY’S affiliate, Moody’s Investors Service Pty Limited ABN 61 003 399 657, which holds Australian Financial Services License no. 336969. This document is intended to be provided only to “wholesale clients” within the meaning of section 761G of the Corporations Act 2001. By continuing to access this document from within Australia, you represent to MOODY’S that you are, or are accessing the document as a representative of, a “wholesale client” and that neither you nor the entity you represent will directly or indirectly disseminate this document or its contents to “retail clients” within the meaning of section 761G of the Corporations Act 2001.