2015 top 40 money managers report - … · november 2015 • benefitscanada investments 2015 top 40...
TRANSCRIPT

14 / November 2015 • BenefitsCanada
2015 TOP 40 MONEY MANAGERS REPORTI N V E S T M E N T SS
HU
TT
ER
STO
CK

BenefitsCanada • November 2015 / 15
BREAKDOWN | DB FUND ASSETS
UNDER MANAGEMENT ASSETS AS OF JUNE 30, 2015
Source: Firms participating in the Canadian Institutional Investment Network Spring 2015 Top 40 Money Managers Survey
Canadian EquityCanadian Bonds
U.S. EquityGlobal Equity
International (non-N.A. Equity)U.S. Bonds
88.5% 11.5%73.7% 26.3%46.9% 53.1%96.4% 3.6%41.9% 58.1%64.5% 35.5%
Active Passive
Mutual Fund (Individual/ Retail Investors) $811,380.6
Pension Segregated Fund $487,284.0 Pension Pooled Fund $396,910.3 High Net Worth $259,144.9 Sub-advised $243,279.9 Insurance Company $157,065.7 Corporate $96,063.6 Other $82,384.4 ETFs $74,252.3 Insurance Segregated Fund $65,954.9 Wrap/Third Party $32,922.1 Foundation $32,487.7 Endowment $26,632.5 Trust Fund $11,575.9 First Nations $1,777.8 Government $1,358.7 Total: $2,780,475.2
BREAKDOWN | CANADIAN ASSETS UNDER MANAGEMENT
ASSETS (MILLIONS) AS OF JUNE 30, 2015
Note: Canadian-domiciled clients only
By Yaldaz Sadakova
he past two years—rather than the 1990s or early 2000s—will go down in history as the time when the Internet finally started disrupting the asset management industry.
No, really. The industry is 20 years late.When it comes to tracking portfolio performance
and making investment decisions, at least some

16 / November 2015 • BenefitsCanada
Source: Firms participating in the Canadian Institutional Investment Network Spring 2015 Top 40 Money Managers Survey
TOP 10 | POOLED FUND MANAGERS CPA = CANADIAN PENSION ASSETS; ASSETS (MILLIONS) AS OF JUNE 30, 2015
Company 2015 CPA 1| BlackRock Asset Management Canada Ltd. $63,353.2 2| TD Asset Management $41,609.6 3| Phillips, Hager & North Investment Management (RBC Global Asset Management) $21,509.4
4| Brookfield Asset Management $17,433.0 5| MFS Investment Management Canada Ltd. $14,518.2 6| Connor, Clark & Lunn Financial Group $13,796.6 7| GLC Asset Management Group Ltd. $12,941.5 8| Beutel, Goodman & Company Ltd. $12,539.0 9| State Street Global Advisors, Ltd. $11,409.8 10| Pyramis Global Advisors (a Fidelity Investments Company) $11,157.2
Top 10 Total: $220,267.5
TOP 10 | CAP INVESTMENT MANAGERS CPA = CANADIAN PENSION ASSETS; ASSETS (MILLIONS) AS OF JUNE 30, 2015
Company 2015 CAP CPA 1| BlackRock Asset Management Canada Ltd. $25,399.0 2| TD Asset Management $11,730.3 3| GLC Asset Management Group Ltd. $11,065.0 4| Beutel, Goodman & Company Ltd.* $10,608.0 5| MFS Investment Management Canada Ltd. $9,481.0 6| Sun Life Global Investments $8,458.9 7| Pyramis Global Advisors (a Fidelity Investments Company) $7,177.9 8| Connor, Clark & Lunn Financial Group $6,512.4 9| Phillips, Hager & North Investment Management (RBC Global Asset Management) $4,735.4 10| Franklin Templeton Institutional $4,671.0
Top 10 Total: $99,838.9
players in finance—including institutional investors and asset management firms—still party like it’s 1995. They use siloed data that lives in Excel spreadsheets and on shared drives. Aggregating and standardizing data remains a tedious, unglamorous, back-office task.
But now, techies are building financial technology startups offering easily searchable, cloud-based data platforms aimed at improving portfolio management.
“Disruptive companies compete along an angle that the established companies dismiss as a toy,” says David Teten, a partner at New York City-based ff Venture Capital. “When [Vanguard] was first launched, people said, ‘This is totally ridiculous: who’s going to pay money to someone to just match the market?’ ” And we all know what happened next.
Powered by ExcelBut the Internet still hasn’t transformed all aspects of asset management.
“Portfolios are becoming more complex, and technology has not kept up. It’s quite discouraging if you’re a technologist coming in and seeing the state of the infrastructure powering all this complexity,” says Joel Beal, a vice-president at Addepar, a Silicon Valley startup.
Addepar, in which ff Venture Capital is an investor, sells cloud-based software, allowing portfolio managers to see all their holdings data—including transactions, exposures and net-of-fee returns—across all asset classes in one place. It even displays alternatives data, something some systems can’t handle.
A lot of Addepar’s customers—including endowments, foundations, funds of funds, advisors and family offices—were dependent on Excel.
“A lot of people have built their own custom solutions, and usually there’s tons of work in Excel,” Beal explains. “We did
2015 TOP 40 MONEY MANAGERS REPORTI N V E S T M E N T S
Note: * Did not report CAP assets last year
All over the world, people between the ages of 25 and 35 are the most active early-stage entrepreneurs— Global Entrepreneurship Monitor
SH
UT
TE
RST
OC
K

20 / November 2015 • BenefitsCanada
MONEY MANAGERS1TD ASSET MANAGEMENT
Rank 2014: 1 2.9%
2015 CPA: $81,978.9 2014 CPA: $79,650.4
Total Assets 2015: $251,046.1
6STATE STREET GLOBAL ADVISORS, LTD.*
Rank 2014: 5 4.5%
2015 CPA: $32,507.4 2014 CPA: $31,101.9
Total Assets 2015: $49,927.6
16FRANKLIN TEMPLETON INSTITUTIONAL
Rank 2014: 15 2.7%
2015 CPA: $15,675.0 2014 CPA: $15,263.7
Total Assets 2015: $49,775.0
11 GREYSTONE MANAGED INVESTMENTS INC.
Rank 2014: 9 ä-3.6%
2015 CPA: $20,836.5 2014 CPA: $21,617.7
Total Assets 2015: $32,554.2
3PHILLIPS, HAGER & NORTH INVESTMENT MANAGEMENT (RBC Global Asset Management)
Rank 2014: 3 14.2%
2015 CPA: $57,496.1 2014 CPA: $50,333.6
Total Assets 2015: $261,087.0
8CONNOR, CLARK & LUNN FINANCIAL GROUP
Rank 2014: 7 15.9%
2015 CPA: $27,277.6 2014 CPA: $23,541.6
Total Assets 2015: $57,401.0
18BENTALL KENNEDY(CANADA) LP
Rank 2014: 21 2.0%
2015 CPA: $13,942.0 2014 CPA: $13,665.0
Total Assets 2015: $23,535.0
13MFS INVESTMENT MANAGEMENT CANADA LTD.
Rank 2014: 11 ä-2.7%
2015 CPA: $17,909.0 2014 CPA: $18,406.1
Total Assets 2015: $26,579.0
2BLACKROCK ASSET MANAGEMENT CANADA LTD.
Rank 2014: 2 9.7%
2015 CPA: $80,440.5 2014 CPA: $73,345.9
Total Assets 2015: $148,637.9
7FIERA CAPITAL CORP.
Rank 2014: 6 6.6%
2015 CPA: $27,962.1 2014 CPA: $26,223.6
Total Assets 2015: $75,473.4
17WELLINGTON MANAGEMENT GROUP LLP
Rank 2014: 22 7.1%
2015 CPA: $14,525.0 2014 CPA: $13,562.0
Total Assets 2015: $19,595.0
12PYRAMIS GLOBAL ADVISORS (a Fidelity Investments Company)
Rank 2014: 13 6.2%
2015 CPA: $18,285.8 2014 CPA: $17,223.9
Total Assets 2015: $107,012.7
4MANULIFE ASSET MANAGEMENT****
Rank 2014: 18 130.1%
2015 CPA: $33,661.9 2014 CPA: $14,628.0
Total Assets 2015: $94,919.7
9J.P. MORGAN ASSET MANAGEMENT (CANADA) INC.
Rank 2014: 8 ä-0.4%
2015 CPA: $21,819.8 2014 CPA: $21,898.6
Total Assets 2015: $24,837.3
19PIMCO CANADA CORP.
Rank 2014: 24 14.2%
2015 CPA: $13,555.0 2014 CPA: $11,867.0
Total Assets 2015: $25,776.0
14LETKO, BROSSEAU & ASSOCIATES INC.
Rank 2014: 12 1.0%
2015 CPA: $17,814.3 2014 CPA: $17,631.7
Total Assets 2015: $28,968.1
5BEUTEL, GOODMAN & COMPANY LTD.
Rank 2014: 4 ä-7.9%
2015 CPA: $32,533.8 2014 CPA: $35,330.0
Total Assets 2015: $39,697.0
10CIBC ASSET MANAGEMENT INC.***
Rank 2014: 14 4.7%
2015 CPA: $21,124.3 2014 CPA: $20,168.7
Total Assets 2015: $129,013.0
20JARISLOWSKY, FRASER LTD.
Rank 2014: 17 ä-9.1%
2015 CPA: $13,480.0 2014 CPA: $14,833.0
Total Assets 2015: $32,754.0
15BROOKFIELD ASSET MANAGEMENT
Rank 2014: 20 26.8%
2015 CPA: $17,433.0 2014 CPA: $13,752.0
Total Assets 2015: $49,777.0
TOP 40TOP 40
“Portfolios are becoming more complex, and technology has not kept up” — Joel Beal, vice-president, Addepar

BenefitsCanada • November 2015 / 21
MONEY MANAGERS 21BNY/MELLON ASSET
MANAGEMENT LTD.
Rank 2014: 19 ä-4.7%
2015 CPA: $13,195.1 2014 CPA: $13,849.7
Total Assets 2015: $18,986.7
2015 Top 40 Total: $751,281.6
2014 Top 40 Total: $696,490.0
% Variance: 7.9%
26ADDENDA CAPITAL INC.
Rank 2014: 26 ä-0.6%
2015 CPA: $10,450.7 2014 CPA: $10,514.5
Total Assets 2015: $25,367.7
36ALLIANCEBERNSTEIN CANADA INSTITUTIONAL INVESTMENTS*
Rank 2014: n/a 29.7%
2015 CPA: $5,993.0 2014 CPA: $4,622.3
Total Assets 2015: $11,903.0
31BURGUNDY ASSET MANAGEMENT LTD.
Rank 2014: 35 27.9%
2015 CPA: $8,014.9 2014 CPA: $6,265.3
Total Assets 2015: $19,495.7
23LEITH WHEELER INVESTMENT COUNSEL LTD.
Rank 2014: 23 ä0.0%
2015 CPA: $12,858.9 2014 CPA: $12,863.6
Total Assets 2015: $17,348.4
28SPRUCEGROVE INVESTMENT MANAGEMENT LTD.
Rank 2014: 28 ä-5.4%
2015 CPA: $9,106.3 2014 CPA: $9,623.8
Total Assets 2015: $13,417.8
38INVESCO
Rank 2014: 38 6.1%
2015 CPA: $5,678.3 2014 CPA: $5,352.3
Total Assets 2015: $35,221.7
33INDUSTRIAL ALLIANCE GROUP**
Rank 2014: 32 9.5%
2015 CPA: $7,240.1 2014 CPA: $6,610.8
Total Assets 2015: $78,192.9
22GLC ASSET MANAGEMENT GROUP LTD.
Rank 2014: 16 ä-14.1%
2015 CPA: $12,941.5 2014 CPA: $15,069.9
Total Assets 2015: $35,957.5
27MERCER GLOBAL INVESTMENTS CANADA LTD.**
Rank 2014: 37 55.6%
2015 CPA: $9,504.3 2014 CPA: $6,107.3
Total Assets 2015: $9,629.0
37FOYSTON, GORDON & PAYNE INC.
Rank 2014: 36 ä-7.3%
2015 CPA: $5,761.0 2014 CPA: $6,214.0
Total Assets 2015: $13,464.0
32MAWER INVESTMENT MANAGEMENT LTD.
Rank 2014: 34 16.5%
2015 CPA: $7,320.6 2014 CPA: $6,286.4
Total Assets 2015: $30,810.8
24ABERDEEN ASSET MANAGEMENT PLC
Rank 2014: 27 13.4%
2015 CPA: $11,000.5 2014 CPA: $9,703.2
Total Assets 2015: $15,896.1
29BAILLIE GIFFORD OVERSEAS LTD.
Rank 2014: 29 4.7%
2015 CPA: $8,550.0 2014 CPA: $8,168.0
Total Assets 2015: $12,563.0
39BMO GLOBAL ASSET MANAGEMENT
Rank 2014: 39 4.7%
2015 CPA: $5,394.3 2014 CPA: $5,153.6
Total Assets 2015: $93,351.3
34GUARDIAN CAPITAL LP
Rank 2014: 31 ä-1.6%
2015 CPA: $6,946.1 2014 CPA: $7,060.4
Total Assets 2015: $22,132.6
25MORGUARD INVESTMENTS LTD.
Rank 2014: 25 0.8%
2015 CPA: $10,890.5 2014 CPA: $10,807.8
Total Assets 2015: $14,316.4
30SUN LIFE GLOBAL INVESTMENTS
Rank 2014: 30 16.4%
2015 CPA: $8,458.9 2014 CPA: $7,270.0
Total Assets 2015: $10,857.6
40CANSO INVESTMENT COUNSEL, LTD.
Rank 2014: n/a 13.6%
2015 CPA: $4,964.7 2014 CPA: $4,372.0
Total Assets 2015: $16,900.9
35HEXAVEST INC.
Rank 2014: 33 3.4%
2015 CPA: $6,754.3 2014 CPA: $6,530.7
Total Assets 2015: $7,929.7
CANADIAN ASSETS (MILLIONS) UNDER MANAGEMENT AS OF JUNE 30, 2015CPA = CANADIAN PENSION ASSETSä Indicates an increase or decrease in variance from 2014 to 2015
Source: Firms participating in the Canadian Institutional Investment Network Spring 2015 Top 40 Money Managers Survey
Notes: * 2014 number restated ** Offers delegated services/implemented consulting *** 2014 number restated to include currency overlays **** Manulife acquired Standard Life in January 2015
Figures in this report are based on responses provided by the survey participants. Benefits Canada assumes no responsibility for the accuracy of the data provided. All totals are subject to a +/- variance due to rounding.

24 / November 2015 • BenefitsCanada
TOP 5 | FASTEST GROWING (%) - LESS THAN $1.0 BILLION CPA = CANADIAN PENSION ASSETS; ASSETS (MILLIONS) AS OF JUNE 30, 2015
Company 2015 CPA 2014 CPA % Variance 1| Acorn Global Investments Inc. $5.0 $3.5 43.5% 2| American Century Investment Management, Inc. $931.0 $705.9 31.9% 3| Unigestion SA $801.7 $608.5 31.7% 4| Morneau Shepell Asset & Risk Management Ltd.* $922.0 $739.5 24.7% 5| Monegy** $344.4 $300.1 14.8%
TOP 5 | FASTEST GROWING (%) - $1.0 BILLION TO $10.0 BILLION CPA = CANADIAN PENSION ASSETS; ASSETS (MILLIONS) AS OF JUNE 30, 2015
Company 2015 CPA 2014 CPA Variance % 1| NISA Investment Advisors, LLC $1,005.0 $398.5 152.2% 2| Janus Capital Group $1,001.8 $402.5 148.9% 3| Neuberger Berman LLC $2,762.8 $1,435.0 92.5% 4| Innocap Investment Management Inc. $2,059.0 $1,276.5 61.3% 5| Mercer Global Investments Canada Ltd.* $9,504.3 $6,107.3 55.6%
Note: * Offers delegated services/implemented consulting ** Restated 2014 number Source: Firms participating in the Canadian Institutional Investment Network Spring 2015 Top 40 Money Managers Survey
TOP 5 | FASTEST GROWING (%) - GREATER THAN $10.0 BILLION CPA = CANADIAN PENSION ASSETS; ASSETS (MILLIONS) AS OF JUNE 30, 2015
Company 2015 CPA 2014 CPA Variance % 1| Brookfield Asset Management $17,433.0 $13,752.0 26.8% 2| Connor, Clark & Lunn Financial Group $27,277.6 $23,541.6 15.9% 3| Phillips, Hager & North Investment Management (RBC Global Asset Management) $57,496.1 $50,333.6 14.2% 4| PIMCO Canada Corp. $13,555.0 $11,867.0 14.2% 5| Aberdeen Asset Management PLC $11,000.5 $9,703.2 13.4%
2015 TOP 40 MONEY MANAGERS REPORTI N V E S T M E N T S
Worldwide, more men perform early-stage
entrepreneurial activity. Starting business
ventures out of necessity is more common
among women. — Global Entrepreneurship Monitor
SH
UT
TE
RST
OC
K

BenefitsCanada • November 2015 / 27
TOP 10 | TOTAL CANADIAN ASSETS UNDER MANAGEMENT ASSETS (MILLIONS) AS OF JUNE 30, 2015 Company 2015 CDN AUM 1| Phillips, Hager & North Investment Management (RBC Global Asset Management) $261,087.0 2| TD Asset Management $251,046.1 3| BlackRock Asset Management Canada Ltd. $148,637.9 4| CIBC Asset Management Inc. $129,013.0 5| CI Investments Inc. (including CI Institutional Asset Management) $108,839.0 6| Pyramis Global Advisors (a Fidelity Investments Company) $107,012.7 7| BMO Global Asset Management $93,351.3 8| Industrial Alliance Group** $78,192.9 9| Fiera Capital Corp. $75,473.4 10| Mackenzie Investments $62,560.3
Top 10 Total: $1,315,213.5
Note: ** Offers delegated services/implemented consulting Source: Firms participating in the Canadian Institutional Investment Network Spring 2015 Top 40 Money Managers Survey
Source: Firms participating in the Canadian Institutional Investment Network Spring 2015 Top 40 Money Managers Survey
TOP 10 | DB INVESTMENT MANAGERS CPA = CANADIAN PENSION ASSETS; ASSETS (MILLIONS) AS OF JUNE 30, 2015
Company 2015 DB CPA 1| TD Asset Management $70,248.6 2| BlackRock Asset Management Canada Ltd. $54,034.3 3| Phillips, Hager & North Investment Management (RBC Global Asset Management) $52,760.7
4| State Street Global Advisors, Ltd. $30,453.3 5| Fiera Capital Corp. $23,561.9 6| J.P. Morgan Asset Management (Canada) Inc. $22,057.3 7| Beutel, Goodman & Company Ltd. $21,926.0 8| Connor, Clark & Lunn Financial Group $21,225.6 9| CIBC Asset Management Inc. $21,047.4 10| Greystone Managed Investments Inc. $18,361.0
Top 10 Total: $335,676
a survey of our client base, and the most frequent product they were moving off of was Excel.”
Justin Zhen discovered a similar reliance on spreadsheets when he started working on Wall Street a few years ago. As a hedge fund analyst, he found valuing companies involved updating data manually and emailing spreadsheets back and forth. A friend who worked at Goldman Sachs at the time noticed the same flurry of Excel update emails during earnings seasons.
So, in 2013, the two started Thinknum, a data platform for valuing companies. Today, Thinknum’s customers include asset management firms, pension funds and other institutional and retail investors.
The platform lets portfolio managers test how different scenarios, such as extreme weather or volatile oil prices, could affect company stocks, Zhen
2015 TOP 40 MONEY MANAGERS REPORT I N V E S T M E N T S
Youth around the world are 1.6 times
more likely to want to start a business
than the rest of the population — Global Entrepreneurship Monitor
SH
UT
TE
RST
OC
K

28 / November 2015 • BenefitsCanada
BREAKDOWN | PENSION ASSET BY CLASS Assets as of June 30, 2015 Canadian Bonds Active 22.7% Canadian Equity Active 15.3% Global Equity Active 10.7% Balance 10.4% Canadian Bonds Index 8.9% Real Estate Equity 5.4% EAFE Equity 4.5% U.S. Equity Index 3.7% U.S. Equity Active 2.7% Other 2.6% Canadian Equity Index 2.2% Emerging Markets Equity 2.2% International Equity Index 2.1% Hedge Funds 1.3% International Equity Active 1.0% Real Return Bond 0.9% Money Markets 0.8% Canadian Equity Small Cap 0.7% Global Bonds 0.7% Asian Equity 0.3% Global Equity Index 0.3% Cash 0.3% Target Date Risk 0.3% Commodities 0.2% U.S. Bonds Active 0.1% Mortgages 0.1%
Source: Firms participating in the Canadian Institutional Investment Network Spring 2015 Top 40 Money Managers Survey
explains. And it does it without the use of spreadsheets. Plus, since the platform’s in the cloud, multiple users can work on the same financial model without having to email one another updates.
Thinknum also pulls non-financial information, such as the number of social media followers and Facebook check-ins a company gets within a certain period. Zhen says this data can be important for assessing companies because there’s a big correlation between social media presence and revenue, especially for consumer companies.
“Right now, investors try to look at financial data to see whether a company is cheap,” he says. “On the Internet, there’s data that lets you think about companies on a different level.”
Digital DinosaursZhen and his partner aren’t alone in what they discovered while working in finance.
The international State Street 2014 Data and Analytics Survey—which polled 400 senior executives at pension funds, endowments, foundations, sovereign wealth funds, funds of funds, insurance companies, central banks and supranational institutions—classified almost a third (27%) of respondents as data starters, organizations that didn’t take sufficient advantage of emerging data management technologies.
These organizations had siloed portfolio information and used separate platforms to track different asset classes. This process gave them a fragmented view of their portfolio holdings and limited their ability to analyze performance and risk. All of this meant they had a difficult time changing investment strategies.
2015 TOP 40 MONEY MANAGERS REPORTI N V E S T M E N T S
In Canada, the ratio of opportunity-driven
entrepreneurship (where people pursue
opportunities) to necessity-driven entrepreneurship
(where people lack other work options) is 7:1— Global Entrepreneurship Monitor
SH
UT
TE
RST
OC
K
30 / November 2015 • BenefitsCanada
Another 36% of respondents were categorized as data movers. While they still had data gaps and errors, they’d made some upgrades, such as data visualization and improved data integration across different asset classes. The upgrades allowed them to perform partially integrated performance and risk analysis in individual asset classes.
The third group (37%) were data innovators. Their data was integrated, high-quality and traceable-back-to-source. This gave them a complete view of risk and performance across different asset classes, as well as the ability to stress-test their portfolios and more easily change investment strategies.
The survey showed asset managers were more likely to be data innovators than asset owners such as pension funds. In fact, almost half (41%) of the participating pension funds were classified as data starters, whereas 38% were classed as data movers and only 22% were deemed data innovators.
$379 Tip for a $70 MealSo why is the industry disruption happening now?
First, thanks to tech solutions that lower administrative and overhead costs, it’s cheaper and easier to start a company. And, in some sectors, venture capital dollars are flowing—U.S. financial technology startups attracted $12 billion in investments last year, compared with just $4 billion the year before.
Further, says Teten, the asset management industry is ripe for disruption. He points to unhappy investment customers who complain about paying high fees for which they don’t believe they get enough value.
Of course, it’s hard for money managers to consistently beat the markets, which means they underperform quite often. When those managers
2015 TOP 40 MONEY MANAGERS REPORTI N V E S T M E N T S
Canada’s women are starting
businesses at a rate amounting
to two-thirds that of men — Global Entrepreneurship Monitor
SH
UT
TE
RST
OC
K
© Copyright 2015 Toron AMI
Expert investors: Here and around the world • Proven investment processes based on
proprietary research
• Embedded risk management discipline
• Dedicated service for our clients since 1959
Contact James Porter or Jamie Brubacher
1.800.463.7475 or 416.977.6767
toron-ami.com
CANADIAN FIRM GLOBAL REACH
133-03-002_ToronAMI Ad Sept 2015 BPM_HALF_FINAL_pub.indd 1 2015-04-15 10:48 AM

BenefitsCanada • November 2015 / 31
outperform, they collect a base fee plus a performance fee; but when they underperform, they still collect the base fee. In a 2013 article he wrote for Forbes, Teten likened this reward structure to receiving a “$379 tip for a $70 meal.”
New CompetitionAsset managers, of course, know their customers are unhappy with paying high fees. They also know their privileged position isn’t as strong as it used to be. A different State Street poll—the 2015 Asset Manager Survey of 400 senior executives in asset management firms worldwide—finds 79% of money managers expect new competition from non-traditional market entrants such as technology firms.
Still, money managers remain focused mostly on their traditional rivals, explains Rob Baillie, CEO of State Street Trust Company Canada. “It’s more of an emerging risk,” he says, adding it’s early to talk about disruption.
That might explain why, when discussing how they’ll respond to the changing competitive landscape, none of the Asset Manager Survey participants voiced plans to invest in technology upgrades.
Instead, they said they’d mainly expand distribution networks and launch new products, such as liquid alternatives and multi-asset solutions.
And 46% said they were evaluating acquisition targets. For example, BlackRock recently bought robo advice firm Future Advisor for an undisclosed sum. (BlackRock didn’t respond to an interview request.)
“The trick is what happens post-acquisition,” Teten says of the deal, explaining established companies can find it hard to incorporate disruption. “It’s difficult for a large company to acquire a disruptive company and let it
13% of American adults
start and run new
businesses every year — Global Entrepreneurship Monitor
SH
UT
TE
RST
OC
K
Derisking With Stable Returns
“During our 33 years of servicing institutional clients, buying excellent companies at a discount has protected client capital and provided strong results.”
FOUR SIMPLE RULES = PROVEN SUCCESS
CAPITAL PRESERVATION Invest with a priority to protect clients’ capital
VALUATION
Value a company from the perspective of an owner-operator
INDEPENDENT RESEARCH Find great companies with sound management at discounted valuations and attractive yields
LONG TERM PERSPECTIVE
Allow the market to recognize the value in your investments
This information is not an offering of, nor advertisement for, any securities. Past performance is not a reliable indicator of future
performance and should not be relied on to make investment decisions. Lincluden’s Stable Income Equity returns ref ect the Canadian
equity component of the Lincluden Income Plus Pooled Fund and do not include cash. Comparative performance and risk characteristics
data is sourced from Mercer Manager Performance Analytics (Mercer MPA). The Lincluden series is not part of the Mercer MPA Universe
and has been included for presentation purposes only. Returns are in Canadian dollars and are gross of fees.
CONTACT: Wayne Wilson, Vice President Tel: 905.825.3543 email: [email protected]
www.lincluden.com
LINCLUDEN ◆ SPTSX ● Median
Rate of Return for 8 Years (%) Substantially Lower Risk
Lincluden Stable Return Equity Strategy Comparison with the Pooled – Canadian Equities (PFS) universe (Percentile Ranking)
Performance characteristics vs. S&P/TSX Composite in C$ (before fees) over 8 yrs ending March 2015 (monthly calculations)
Return (%pa)
9.7 (0)
4.65.5
(75)
Standard Deviation (%pa)
10.314.5 14.6
(100)
(56)
Downside Capture %
68.4100.0098.0
(100)
(32)
9.0
10.0
8.0
6.0
5.0
4.0
7.0
3.0
2.0
◆
●
17.0
14.0
15.0
16.0
13.0
11.0
12.0
10.0 ◆
●
100.0
110.0
90.0
70.0
80.0
60.0
◆
●
9120_Lincluden_RE_June2015.indd 1 2015-06-01 8:43 PM
good health
is good business
Canada’s Research-Based Pharmaceutical Companies
Making Canada Better
Help your clients ofer a benefts plan that promotes
employee health, disease prevention and provides
comprehensive access to innovative medicines & vaccines.
Because a healthier workforce works better.
For more information on
how to build a better plan
email: [email protected]
RxD_6291_BenefitsCanadaCampaign_BLUE_PRESS.pdf 1 2015-03-18 9:51 AM
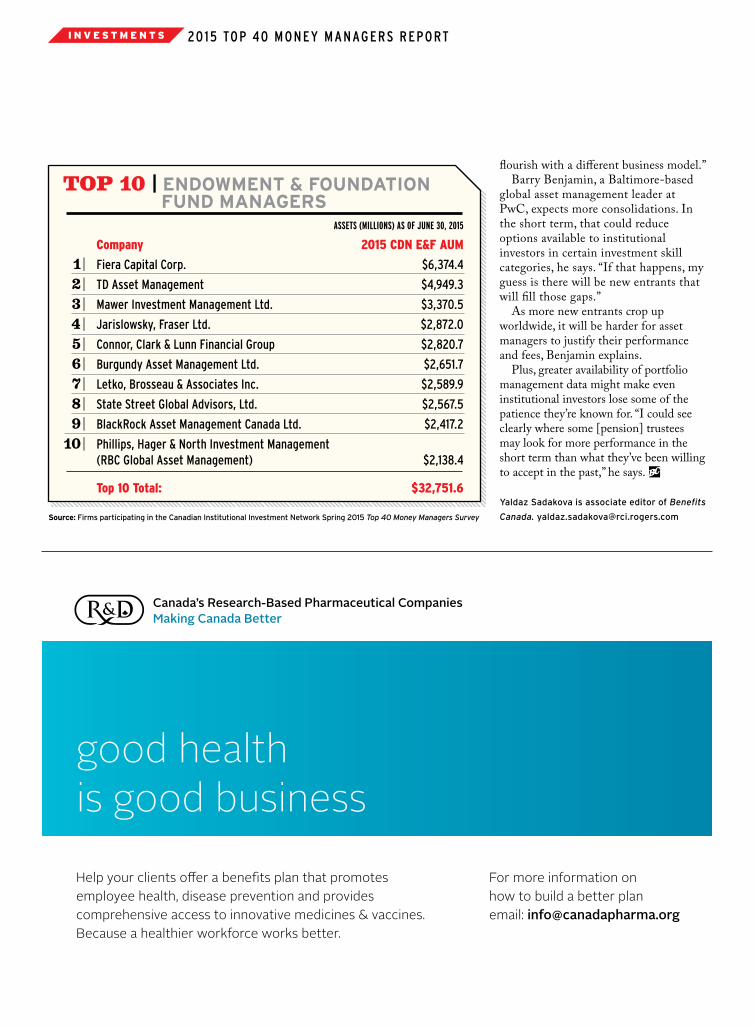
TOP 10 | ENDOWMENT & FOUNDATION FUND MANAGERS ASSETS (MILLIONS) AS OF JUNE 30, 2015
Company 2015 CDN E&F AUM 1| Fiera Capital Corp. $6,374.4 2| TD Asset Management $4,949.3 3| Mawer Investment Management Ltd. $3,370.5 4| Jarislowsky, Fraser Ltd. $2,872.0 5| Connor, Clark & Lunn Financial Group $2,820.7 6| Burgundy Asset Management Ltd. $2,651.7 7| Letko, Brosseau & Associates Inc. $2,589.9 8| State Street Global Advisors, Ltd. $2,567.5 9| BlackRock Asset Management Canada Ltd. $2,417.2 10| Phillips, Hager & North Investment Management (RBC Global Asset Management) $2,138.4
Top 10 Total: $32,751.6
Source: Firms participating in the Canadian Institutional Investment Network Spring 2015 Top 40 Money Managers Survey
flourish with a different business model.”Barry Benjamin, a Baltimore-based
global asset management leader at PwC, expects more consolidations. In the short term, that could reduce options available to institutional investors in certain investment skill categories, he says. “If that happens, my guess is there will be new entrants that will fill those gaps.”
As more new entrants crop up worldwide, it will be harder for asset managers to justify their performance and fees, Benjamin explains.
Plus, greater availability of portfolio management data might make even institutional investors lose some of the patience they’re known for. “I could see clearly where some [pension] trustees may look for more performance in the short term than what they’ve been willing to accept in the past,” he says.
Yaldaz Sadakova is associate editor of Benefits
Canada. [email protected]
2015 TOP 40 MONEY MANAGERS REPORTI N V E S T M E N T S

BenefitsCanada • November 2015 / 33
THE NUMBERS
❱ At the end of June 30, 2015, Canadian pension assets for the Top 40 money managers totalled $751,281.6 million, compared with $696,490 million the year prior. That’s an increase of 7.9%.
❱ Manulife Asset Management had the biggest jump from No. 18 to No. 4 as a result of its acquisition of Standard Life in January 2015.
❱ Twenty-eight of the Top 40 money managers reported an increase in pension assets, while 12 reported a decrease.
❱ Twelve of the Top 40 money managers reported double-digit increases in assets under management, down from 32 managers in last year’s report.
❱ Two managers are new to this year’s list: AllianceBernstein Canada Institutional Investments (No. 36) and Canso Investment Counsel, Ltd. (No. 40).
Source: Firms participating in the Canadian Institutional Investment Network Spring 2015 Top 40 Money Managers Survey
SH
UT
TE
RST
OC
K
Great-West Life’s Drug Coverage
Search Tool
provides benefts information, including
confrmation that a drug is covered and at what percentage.
Plan members can use GroupNet Mobile to search
coverage details, then submit their claim.
e.
www.greatwestlife.com
We’re so
mobile
PHRA third layout.indd 1 2015-10-19 3:25 PM