2015 taulbee survey - cra · 2017-08-02 · the data. departments that responded to the survey were...
TRANSCRIPT

COMPUTING RESEARCH NEWS, MAY 2016Vol. 28 / No. 5
cra.org/crn 2
2015 Taulbee SurveyContinued Booming Undergraduate CS Enrollment; Doctoral Degree Production Dips Slightly
This article and the accompanying figures and tables present
the results from the 45th annual CRA Taulbee Survey1. The
survey, conducted annually by the Computing Research
Association, documents trends in student enrollment,
degree production, employment of graduates, and faculty
salaries in academic units in the United States and Canada
that grant the Ph.D. in computer science (CS), computer
engineering (CE) or information (I)2. Most of these academic
units are departments, but some are colleges or schools of
information or computing. In this report, we will use the term
“department” to refer to the unit offering the program. This
year’s survey also includes the so-called “department profiles”
data about space, research funding sources, and teaching
loads; these data are only requested every three years.
CRA gathers survey data during the fall. Responses received
by February 5, 2016 are included in the analysis. The period
covered by the data varies from table to table. Degree
production and enrollment (Ph.D., Master’s, and Bachelor’s)
refer to the previous academic year (2014-15). Data for new
students in all categories refer to the current academic year
(2015-16). Projected student production and information on
faculty salaries are also for the current academic year; salaries
are those effective January 1, 2016.
We surveyed a total of 266 Ph.D.-granting departments;
we received responses from 178 for a response rate of
67 percent. This is similar to last year’s 68 percent. The
response rates from CE and Canadian departments continue
to be rather low, and this year the CE response rate was
even lower than usual. U.S. CS, U.S. I, and Canadian response
rates were similar to last year. Figure 1 shows the history
of response rates to the survey. Response rates are inexact
because some departments provide only partial data,
and some institutions provide a single joint response for
multiple departments. Thus, in some tables the number of
departments shown as reporting will not equal the overall
total number of respondents shown in Figure 1 for that
category of department.
To account for the changes in response rate, we will comment
not only on aggregate totals but also on averages per
department reporting or data from those departments that
responded to both this year’s and last year’s surveys. This is
a more accurate indication of the one-year changes affecting
the data.
Departments that responded to the survey were sent
preliminary results about faculty salaries in December 2015;
these results included additional distributional information not
contained in this report. The CRA Board views this as a benefit
of participating in the survey.
Degree, enrollment and faculty salary data for the U.S CS
departments are stratified according to a) whether the
institution is public or private, and b) the tenure-track faculty
size of the reporting department. The faculty size strata
deliberately overlap, so that data from most departments
affect multiple strata. This may be especially useful to
departments near the boundary of one stratum. Salary data
also is stratified according to the population of the locale in
which the institution is located.3 These stratifications allow
our readers to see multiple views of important data, and
hopefully gain new insights from them. In addition to tabular
presentations of data, we will use “box and whisker” diagrams
to show medians, quartiles, and the range between the 10th
and 90th percentile data points.
We thank all respondents to this year’s questionnaire.
Departments that participated are listed at the end of this
article. CRA member respondents again will be given the
opportunity to obtain certain survey information for a self-
selected peer group. Instructions for doing this will be emailed
to all such departments.
By Stuart Zweben and Betsy Bizot

COMPUTING RESEARCH NEWS, MAY 2016Vol. 28 / No. 5
cra.org/crn 3
Doctoral Degree Production, Enrollments and Employment
(Tables D1-D10; Figures D1-D6)
Last year’s respondents reported production of 1,940
doctoral degrees. This year’s respondents produced 1,780
doctoral degrees, a decline of 8.2 percent. However, on a
per-department basis, the decline is only 4.9 percent. An
examination of the data by area of computing shows that
the aggregate decline in degrees produced does not come
from U.S. CS departments, and that overall, U.S. private
CS departments actually increased their productivity on
a per-department basis. Each of the other groups (CE, I
and Canadian) show declines, but these numbers are more
strongly influenced by the specific departments responding in
a given year, since we receive data from only a small number
of these departments.
Among all departments reporting both this year and last year,
the number of total doctoral degrees declined by 3.5 percent,
but among U.S. CS departments reporting both years, there
was essentially no change (actually an increase of 0.3 percent).
Women comprised 18.3 percent of CS doctoral graduates and
20.2 percent of all doctoral computing graduates, both values
being slightly higher than those reported last year. The
percentage of CS doctoral degrees that went to Non-resident
Aliens also was slightly higher than last year, at 60.7 percent
compared with 60.1 percent, while the percentage that went
to resident Asians dropped to 6.4 percent from 8.1 percent. CE
had an even higher percentage of Non-resident Aliens than did
CS, and was less gender diverse. Among I doctoral degrees,
45.8 percent went to Non-resident Aliens and 33.8 percent to
Whites; for Non-resident Aliens this is an increase compared
with last year’s report; for Whites it is a slight decrease.
The percentage of doctoral graduates who were American
Indian or Alaska Native, Black or African American, Native
Hawaiian/Pacific Islander, Hispanic, or Multiracial Non-Hispanic
rose from 2.6 percent to 4.0 percent in CS, and was 4.5 percent
in aggregate across CS, CE and I (vs 3.4 percent in 2013-14). As
Figure 1. Number of Respondents to the Taulbee Survey
Year US CS Depts. US CE Depts. Canadian US Information Total
1995 110/133 (83%) 9/13 (69%) 11/16 (69%) 130/162 (80%)
1996 98/131 (75%) 8/13 (62%) 9/16 (56%) 115/160 (72%)
1997 111/133 (83%) 6/13 (46%) 13/17 (76%) 130/163 (80%)
1998 122/145 (84%) 7/19 (37%) 12/18 (67%) 141/182 (77%)
1999 132/156 (85%) 5/24 (21%) 19/23 (83%) 156/203 (77%)
2000 148/163 (91%) 6/28 (21%) 19/23 (83%) 173/214 (81%)
2001 142/164 (87%) 8/28 (29%) 23/23 (100%) 173/215 (80%)
2002 150/170 (88%) 10/28 (36%) 22/27 (82%) 182/225 (80%)
2003 148/170 (87%) 6/28 (21%) 19/27 (70%) 173/225 (77%)
2004 158/172 (92%) 10/30 (33%) 21/27 (78%) 189/229 (83%)
2005 156/174 (90%) 10/31 (32%) 22/27 (81%) 188/232 (81%)
2006 156/175 (89%) 12/33 (36%) 20/28 (71%) 188/235 (80%)
2007 155/176 (88%) 10/30 (33%) 21/28 (75%) 186/234 (79%)
2008 151/181 (83%) 12/32 (38%) 20/30 (67%) 9/19 (47%) 192/264 (73%)
2009 147/184 (80%) 13/31 (42%) 16/30 (53.3%) 12/20 (60%) 188/265 (71%)
2010 150/184 (82%) 12/30 (40%) 18/29 (62%) 15/22 (68%) 195/265 (74%)
2011 142/185 (77%) 13/31 (42%) 13/30 (43%) 16/21 (76%) 184/267 (69%)
2012 152/189 (80%) 11/32 (34%) 14/30 (47%) 16/26 (62%) 193/277 (70%)
2013 144/188 (77%) 10/30 (33%) 14/26 (54%) 11/22 (50%) 179/266 (67%)
2014 143/188 (76%) 13/31 (42%) 12/26 (46%) 13/19 (68%) 181/268 (68%)
2015 146/190 (77%) 8/32 (25%) 12/26 (46%) 12/18 (67%) 178/266 (67%)

COMPUTING RESEARCH NEWS, MAY 2016Vol. 28 / No. 5
cra.org/crn 4
they did last year, Non-resident Aliens and Resident Asians
comprised a higher percentage of the CS female doctoral
graduates than they did CS male graduates, while Whites
comprised a lower percentage of the female graduates as
compared with male graduates (Table D9).
Among currently enrolled CS doctoral students whose ethnicity
is known, we see the same direction of difference among
Non-resident Aliens and Whites; Non-resident Aliens comprise a
higher percent of the enrolled women than they do the enrolled
men, and Whites comprise a lower percentage of enrolled
women. This is similar to the observations last year. Resident
Asians comprise a similar percentage of enrolled Asian men
and Asian women (Table D10).
Table D1. PhD Production and Pipeline by Department Type
Department Type # Depts
PhDs Awarded PhDs Next Year Passed Qualifier Passed Thesis(if dept has)
# Avg/ Dept # Avg/
Dept # Avg/ Dept # # Dept Avg/
Dept
US CS Public 97 1,179 12.2 1,296 13.4 1,326 15.1 949 78 12.2
US CS Private 33 391 11.5 502 15.2 403 12.2 227 24 9.5
US CS Total 130 1,570 12.0 1,798 13.8 1,729 14.3 1,176 102 11.5
US CE 4 33 6.6 40 10.0 65 16.3 63 3 21.0
US Info 12 82 6.8 107 8.9 101 9.2 82 9 9.1
Canadian 12 95 9.5 176 14.7 128 11.6 113 8 14.1
Grand Total 158 1,780 11.3 2,121 13.4 2,023 13.8 1,434 122 11.8
Table D2. PhDs Awarded by Gender
CS CE I Total
Male 1,263 81.7% 75 85.2% 82 56.6% 1,420 79.8%
Female 283 18.3% 13 14.8% 63 43.4% 359 20.2%
Total Known Gender 1,546 88 145 1,779
Gender Unknown 1 0 0 1
Grand Total 1,547 88 145 1,780
Table D3. PhDs Awarded by Ethnicity
CS CE I Total
Nonresident Alien 875 60.7% 58 67.4% 65 45.8% 998 59.8%
Amer Indian or Alaska Native 2 0.1% 0 0.0% 0 0.0% 2 0.1%
Asian 92 6.4% 4 4.7% 14 9.9% 110 6.6%
Black or African-American 15 1.0% 0 0.0% 10 7.0% 25 1.5%
Native Hawaiian/Pac Islander 6 0.4% 0 0.0% 0 0.0% 6 0.4%
White 416 28.8% 23 26.7% 48 33.8% 487 29.2%
Multiracial, not Hispanic 11 0.8% 0 0.0% 1 0.7% 12 0.7%
Hispanic, any race 25 1.7% 1 1.2% 4 2.8% 30 1.8%
Total Residency & Ethnicity Known 1,442 86 142 1,670
Resident, ethnicity unknown 50 0 1 51
Residency unknown 55 2 2 59
Grand Total 1,547 88 145 1,780

COMPUTING RESEARCH NEWS, MAY 2016Vol. 28 / No. 5
cra.org/crn 5
Table D4. Employment of New PhD Recipients By Specialty
Artifi
cial
Inte
llige
nce
Com
pute
r-Su
ppor
ted
Co
oper
ativ
e W
ork
Data
base
s/In
form
atio
n Re
triev
al
Grap
hics
/Vis
ualiz
atio
n
Hard
war
e/Ar
chite
ctur
e
Hum
an-C
ompu
ter I
nter
actio
n
High
-Per
form
ance
Com
putin
g
Info
rmat
ics:
Bio
med
ica/
Ot
her S
cien
ce
Info
rmat
ion
Assu
ranc
e/Se
curit
y
Info
rmat
ion
Scie
nce
Info
rmat
ion
Syst
ems
Netw
orks
Oper
atin
g Sy
stem
s
Prog
ram
min
g La
ngua
ges/
Co
mpi
lers
Robo
tics/
Visi
on
Scie
ntifi
c/Nu
mer
ical
Com
putin
g
Soci
al C
ompu
ting/
So
cial
Info
rmat
ics
Softw
are
Engi
neer
ing
Theo
ry a
nd A
lgor
ithm
s
Othe
r
Tota
l
North American PhD Granting Depts.
Tenure-track 10 0 7 6 6 4 12 5 8 12 2 8 4 9 3 0 5 14 8 17 140 10.0%
Researcher 2 0 1 2 0 1 5 2 1 2 0 2 1 2 2 1 0 0 1 1 26 1.8%
Postdoc 22 0 10 13 7 3 6 12 5 4 2 4 1 11 9 3 1 2 9 13 137 9.7%
Teaching Faculty 6 0 5 2 1 2 2 0 5 1 3 8 2 3 2 2 4 3 2 11 64 4.6%
North American, Other Academic
Other CS/CE/I Dept. 2 0 2 1 0 0 2 0 2 4 0 3 2 3 0 1 1 2 3 5 33 2.3%
Non-CS/CE/I Dept 0 0 0 0 0 0 1 1 0 2 0 0 0 0 1 1 0 0 1 1 8 0.6%
North American, Non-Academic
Industry 77 2 67 47 46 21 23 35 34 11 6 57 31 31 48 9 29 111 35 86 806 57.3%
Government 4 0 1 1 3 6 1 3 6 0 3 0 0 3 3 3 1 3 2 4 47 3.3%
Self-Employed 1 0 0 2 1 0 0 2 1 0 1 0 1 1 1 0 2 5 0 4 22 1.6%
Unemployed 1 0 2 0 0 0 1 0 0 0 0 1 0 0 1 0 0 0 1 0 7 0.5%
Other 0 0 0 1 0 0 0 1 0 1 0 1 0 0 1 0 0 0 0 2 7 0.5%
Total Inside North America
125 2 95 75 64 37 53 61 62 37 17 84 42 63 71 20 43 140 62 144 1,297 92.2%
Outside North America
Ten-Track in PhD 2 0 2 0 0 0 0 2 2 3 0 1 0 0 1 0 1 1 1 3 19 1.4%
Researcher in PhD 1 0 0 0 0 0 0 0 0 0 0 1 0 3 1 0 0 0 2 1 9 0.6%
Postdoc in PhD 1 0 1 0 0 0 0 4 0 1 0 1 0 1 4 1 1 0 5 2 22 1.6%
Teaching in PhD 0 0 0 0 1 0 0 1 0 1 1 2 0 0 1 0 0 0 0 0 7 0.5%
Other Academic 1 0 0 0 0 1 0 1 0 0 1 0 0 1 0 0 0 2 1 0 8 0.6%
Industry 3 0 2 3 1 0 1 0 0 1 0 2 0 2 3 0 1 3 3 1 26 1.8%
Government 0 0 4 0 0 0 0 0 0 1 0 0 0 0 3 0 0 1 1 0 10 0.7%
Self-Employed 1 0 1 0 0 0 1 0 0 0 0 0 0 0 0 0 0 1 0 0 4 0.3%
Unemployed 0 0 0 0 0 0 0 0 0 0 0 0 0 1 0 0 0 0 0 0 1 0.1%
Other 0 0 1 0 0 0 1 0 0 0 0 0 0 0 0 0 0 0 0 1 3 0.2%
Total Outside NA 9 0 11 3 2 1 3 8 2 7 2 7 0 8 13 1 3 8 13 8 109 7.8%
Total with Employment Data, Inside North America plus Outside North America
134 2 106 78 66 38 56 69 64 44 19 91 42 71 84 21 46 148 75 152 1,406
Employment Type & Location Unknown
19 5 13 20 9 7 12 13 12 3 11 11 3 3 8 4 2 19 5 195 374
Grand Total 153 7 119 98 75 45 68 82 76 47 30 102 45 74 92 25 48 167 80 347 1,780

COMPUTING RESEARCH NEWS, MAY 2016Vol. 28 / No. 5
cra.org/crn 6
Among those pursuing I degrees, 62 percent of the men and
55 percent of the women are Non-resident Aliens or Resident
Asians. This is a higher percentage for both men and women
than last year, but is a similar-sized difference between men
and women. Also similar to last year, there is no appreciable
difference in the percentage of men vs the percentage of
women among Whites pursuing I degrees.
At U.S. CS departments, the average number of students per
department who passed qualifier exams rose to 14.3 in 2014-15,
from 13.9 in 2013-14. The increase was due to departments
in public institutions; there was a decrease in U.S. private
institutions. The average number per department who
passed thesis candidacy exams in 2014-15 (most, but not all,
departments have such exams) increased slightly from 2013-14
at both public and private U.S. CS departments (Table D1).
Once again, the number of new Ph.D. students per department
reporting increased slightly this year compared with the total
from last year’s reporting departments (Tables 1 and D5). This
reflects increases in CS departments and decreases in CE,
I, and Canadian departments. Among all departments that
Table D4a. Detail of Industry Employment
Artifi
cial
Inte
llige
nce
Com
pute
r-Su
ppor
ted
Co
oper
ativ
e W
ork
Data
base
s/
Info
rmat
ion
Retri
eval
Grap
hics
/Vis
ualiz
atio
n
Hard
war
e/Ar
chite
ctur
e
Hum
an-C
ompu
ter I
nter
actio
n
High
-Per
form
ance
Com
putin
g
Info
rmat
ics:
Bio
med
ica/
Ot
her S
cien
ce
Info
rmat
ion
Assu
ranc
e/Se
curit
y
Info
rmat
ion
Scie
nce
Info
rmat
ion
Syst
ems
Netw
orks
Oper
atin
g Sy
stem
s
Prog
ram
min
g La
ngua
ges/
Co
mpi
lers
Robo
tics/
Visi
on
Scie
ntifi
c/
Num
eric
al C
ompu
ting
Soci
al C
ompu
ting/
Soc
ial
Info
rmat
ics
Softw
are
Engi
neer
ing
Theo
ry a
nd A
lgor
ithm
s
Unkn
own
Othe
r
Tota
l
Inside North America
Research 47 0 46 25 27 12 14 18 13 4 2 33 19 15 27 4 20 40 15 12 24 417 51.7%
Non-Research 16 1 14 15 18 6 9 12 16 7 4 19 11 13 15 4 7 58 14 7 26 292 36.2%
Postdoctorate 3 0 1 1 0 1 0 0 1 0 0 1 0 0 1 0 2 2 2 2 0 17 2.1%
Type Not Specified 11 1 6 6 1 2 0 5 4 0 0 4 1 3 5 1 0 11 4 8 7 80 9.9%
Total Inside NA 77 2 67 47 46 21 23 35 34 11 6 57 31 31 48 9 29 111 35 29 57 806
Outside North America
Research 3 0 1 2 1 0 0 0 0 1 0 1 0 1 1 0 1 1 1 0 1 15 57.7%
Non-Research 0 0 1 1 0 0 1 0 0 0 0 1 0 1 0 0 0 2 1 0 0 8 30.8%
Postdoctorate 0 0 0 0 0 0 0 0 0 0 0 0 0 0 2 0 0 0 0 0 0 2 7.7%
Type Not Specified 0 0 0 0 0 0 0 0 0 0 0 0 0 0 0 0 0 0 1 0 0 1 3.8%
Total Outside NA 3 0 2 3 1 0 1 0 0 1 0 2 0 2 3 0 1 3 3 0 1 26
Table D5. New PhD Students by Department Type
CS CE I Total
Department Type
New Admit
MS to PhD Total Avg. per
Dept.New
AdmitMS to PhD Total Avg. per
Dept.New
AdmitMS to PhD Total Avg. per
Dept. Total Avg. per Dept
US CS Public 1,563 140 1,703 18.1 78 13 91 5.7 68 4 72 10.3 1,866 19.6
US CS Private 564 13 577 16.0 18 0 18 4.5 14 0 14 7.0 609 16.9
US CS Total 2,127 153 2,280 17.5 96 13 109 5.5 82 4 86 9.6 2,475 18.9
US CE 0 0 0 0.0 37 7 44 8.8 0 0 0 0.0 44 8.8
US Information 7 0 7 7.0 0 0 0 0.0 90 7 97 8.1 104 8.7
Canadian 116 13 129 10.8 0 0 0 0.0 0 0 0 0.0 129 10.8
Grand Total 2,250 166 2,416 16.9 133 20 153 6.1 172 11 183 8.7 2,752 17.2

COMPUTING RESEARCH NEWS, MAY 2016Vol. 28 / No. 5
cra.org/crn 7
reported both years, the number of new Ph.D. students was
unchanged. If only U.S. CS departments that reported both
years are considered, there was an increase of 2.0 percent.
The proportion of new doctoral students from outside North
America continues to increase. This year’s proportion is
65.7 percent while last year’s was 62.6 percent. There were
increases in all categories of departments with the exception
of U.S. CS private (Table D5a).
Among programs that reported both years, total doctoral
enrollment increased 1.1 percent. If only U.S. computer science
departments are considered, the increase was only 0.2
percent (Table 1). Total doctoral enrollment by gender is in
about the same overall proportion reported last year (Table
D7), with a slight increase in diversity in CS and a decrease
in I departments. The fraction
of doctoral students who are
not either Non-resident Aliens,
Asian or White remains below 5
percent (Table D8).
Figure D5 shows a graphical
view of the Ph.D. pipeline for
computer science programs.
The data in this graph are
normalized by the number of
departments reporting. The
graph offsets the qualifier data
by two years from the data
for new students, and offsets
the graduation data by five
years from the data for new
students. These data have
been useful in estimating the
timing of changes in production
rates. The graph suggests
that doctoral production will
remain fairly steady during the
next few years, though the
departments are forecasting an
increase in production during
2015-16 (Table D1).
Figure D6 shows the
employment trend of
new Ph.D.s in academia
and industry, those taking employment outside of North
America, and those going to academia who took positions in
departments other than Ph.D.-granting CS/CE departments.
Table D4 shows a more detailed breakdown of the
employment data for new Ph.D.s. The percentage of new
Ph.D.s who took positions in North American industry was
57.3 percent, just below last year’s historic record of 57.5
percent. Among those doctoral graduates who went to North
American industry as other than a postdoc and for whom the
type of industry position was known, about 59 percent took
research positions (Table D4a). This is up from the 56 percent
reported last year. This year, definitive data was provided
for 90 percent of the graduates who went to industry, an
improvement over last year’s 87 percent.
Table D5a. New PhD Students from Outside North America
Department Type CS CE I Total New
OutsideTotal New
% outside North America
US CS Public 1,173 75 35 1,283 1,866 68.8%
US CS Private 317 16 9 342 609 56.2%
Total US CS 1,490 91 44 1,625 2,475 65.7%
US CE 0 36 0 36 44 81.8%
US Info 6 0 54 60 104 57.7%
Canadian 87 0 0 87 129 67.4%
Grand Total 1,583 127 98 1,808 2,752 65.7%
Table D6. PhD Enrollment by Department Type
Department Type
# Depts CS CE I Total
US CS Public 100 8,880 66.2% 566 66.2% 487 66.2% 9,933 64.5%
US CS Private 37 2,903 24.2% 71 24.2% 156 24.2% 3,130 20.3%
Total US CS 137 11,783 90.3% 637 90.3% 643 90.3% 13,063 84.8%
US CE 6 45 0.1% 480 0.1% 0 0.1% 525 3.4%
US Info 12 29 0.2% 0 0.2% 605 0.2% 634 4.1%
Canadian 11 862 9.3% 0 9.3% 313 9.3% 1,175 7.6%
Grand Total 166 12,719 1,117 1,561 15,397
Table D7. PhD Enrollment by Gender
CS CE I Total
Male 10,062 81.0% 943 84.4% 1,044 66.9% 12,049 79.8%
Female 2,361 19.0% 174 15.6% 517 33.1% 3,052 20.2%
Total Known Gender 12,423 1,117 1,561 15,101
Gender Unknown 296 0 0 296
Grand Total 12,719 1,117 1,561 15,397

COMPUTING RESEARCH NEWS, MAY 2016Vol. 28 / No. 5
cra.org/crn 8
Table D8. PhD Enrollment by Ethnicity
CS CE I Total
Nonresident Alien 7,067 61.0% 715 65.6% 649 51.7% 8,431 60.5%
Amer Indian or Alaska Native
39 0.3% 6 0.6% 2 0.2% 47 0.3%
Asian 916 7.9% 76 7.0% 96 7.6% 1,088 7.8%
Black or African-American
150 1.3% 18 1.7% 48 3.8% 216 1.5%
Native Hawaiian/ Pac Islander
7 0.1% 1 0.1% 7 0.6% 15 0.1%
White 3,142 27.1% 237 21.7% 413 32.9% 3,792 27.2%
Multiracial, not Hispanic 69 0.6% 11 1.0% 13 1.0% 93 0.7%
Hispanic, any race 204 1.8% 26 2.4% 28 2.2% 258 1.9%
Total Known 11,594 1,090 1,256 13,940
Resident, ethnicity unknown
588 10 251 849
Residency unknown 537 17 54 608
Grand Total 12,719 1,117 1,561 15,397
Table D9. PhDs Awarded by Gender and Ethnicity, From 175 Departments
CS CE I Ethnicity Totals
Male Fem N/R % of M*
% of F*
Male Fem N/R % of M*
% of F*
Male Fem N/R % of M*
% of F*
Total %
Nonresident Alien 707 168 0 60 64 51 7 0 69 58 33 32 0 41 53 998 59.8
Amer Indian or Alaska Native
2 0 0 0 0 0 0 0 0 0 0 0 0 0 0 2 0.1
Asian 66 26 0 6 10 3 1 0 4 8 8 6 0 10 10 110 6.6
Black or African-American
10 5 0 1 2 0 0 0 0 0 6 4 0 7 7 25 1.5
Native Hawaiian/ Pac Islander
4 2 0 0 1 0 0 0 0 0 0 0 0 0 0 6 0.4
White 356 60 0 30 23 19 4 0 26 33 31 17 0 38 28 487 29.2
Multiracial, not Hispanic
9 2 0 1 1 0 0 0 0 0 1 0 0 1 0 12 0.7
Hispanic, any race 25 0 0 2 0 1 0 0 1 0 2 2 0 3 3 30 1.8
Total Res & Ethnicity Known
1,179 263 0 0 0 74 12 0 81 61 0 1,670
Resident, ethnicity unknown
36 14 0 0 0 0 0 1 0 51
Not Reported (N/R) 48 6 1 1 1 0 1 1 0 59
Gender Totals 1,263 283 1 75 13 0 82 63 0 1,780
% 81.7% 18.3% 85.2% 14.8% 56.6% 43.4%
* % of M and % of F columns are the percent of that gender who are of the specified ethnicity, of those whose ethnicity is known

COMPUTING RESEARCH NEWS, MAY 2016Vol. 28 / No. 5
cra.org/crn 9
The percentage of 2014-15 graduates who took North American
academic jobs rose this year to 29.0 from last year’s all-time
low of 27.3. The percentage of graduates taking tenure-track
positions in North American doctoral granting computing
departments rose to 10.0 in 2014-15, from 7.6 for 2013-14
graduates. The percentage taking positions in North American
non-Ph.D.-granting computing departments rose from 1.9
percent to 2.3 percent, while the percentage taking North
American academic postdoctoral positions dropped from 11.6
percent to 9.7 percent.
Among those whose employment is known, the proportion of
Ph.D. graduates who were reported taking positions outside
of North America fell from 9.4 percent to 7.8 percent. Only 24
percent of those employed outside of North America went to
industry compared to 37 percent reported last year. About
17 percent went to tenure-track academic positions, down
from 26 percent last year, while approximately 20 percent
went to academic postdoctoral positions, similar to last year.
Teaching and research positions in academic departments, and
employment in government positions, were higher this year
among those who went outside North America. Of the doctoral
graduates who went to non-North American industry positions,
the positions were in research by almost a two-to-one margin
over those that were not research; that ratio was three-to-one
each of the past two years. Definitive data was provided for
96 percent of these graduates.
Employment in industry postdoctoral positions is included in
the overall industry numbers. When academic and industry
postdocs are combined, the result is that 12.6 percent of 2014-
15 doctoral graduates took some type of postdoctoral position,
down from 15.6 percent last year and 18.1 percent the year
before last. Approximately 11 percent of these were industry
postdocs; last year 14 percent of postdocs were industry
postdocs.
The unemployment rate for new Ph.D.s again this year was
below one percent. In 2014-15, 21.0 percent of new Ph.D.s’
employment status was unknown; in 2013-14 it was 19.7
percent. It is possible that the lack of information about the
employment of more than one in five graduates skews the real
overall percentages for certain employment categories.
Table D10. PhD Enrollment by Gender and Ethnicity, From 153 Departments Providing Breakdown Data
CS CE I Ethnicity Totals
Male Fem N/R % of M*
% of F*
Male Fem N/R % of M*
% of F*
Male Fem N/R % of M*
% of F*
Total %
Nonresident Alien 5,583 1,405 79 61 64 604 111 0 66 64 435 214 0 55 46 8,431 60.5%
Amer Indian or Alaska Native
29 10 0 0 1 4 2 0 0 1 0 2 0 0 0 47 0.3%
Asian 706 194 16 8 9 64 12 0 7 7 56 40 0 7 9 1,088 7.8%
Black or African-American
95 50 5 1 2 9 9 0 1 5 22 26 0 3 6 216 1.5%
Native Hawaiian/ Pac Islander
5 2 0 0 0 1 0 0 0 0 6 1 0 1 0 15 0.1%
White 2,585 482 75 28 22 203 34 0 22 20 258 155 0 33 34 3,792 27.2%
Multiracial, not Hispanic
55 11 3 1 1 10 1 0 1 1 5 8 0 1 2 93 0.7%
Hispanic, any race 162 32 10 2 2 22 4 0 2 2 13 15 0 2 3 258 1.9%
Total Res & Ethnicity Known
9,220 2,186 188 917 173 795 461 0 13,940
Resident, ethnicity unknown
469 103 16 9 1 208 43 0 849
Not Reported (N/R) 373 72 165 17 0 41 13 0 608
Gender Totals 10,062 2,361 296 943 174 1,044 517 0 15,397
% 81.0% 19.0% 84.4% 15.6% 66.9% 33.1%
* % of M and % of F columns are the percent of that gender who are of the specified ethnicity, of those whose ethnicity is known

COMPUTING RESEARCH NEWS, MAY 2016Vol. 28 / No. 5
cra.org/crn 10
Table D4 also indicates the areas of specialty of new Ph.D.s.
Artificial intelligence, networks, software engineering
and databases continue to be the most popular areas of
specialization for doctoral graduates. But this year the order
is different. Software engineering moved from third to first,
followed by artificial intelligence, databases and networks.
Figure D1. PhD Production
CRA Taulbee Survey 2015
Figure D2. Nonresident Aliens as Fraction of PhD Enrollments
CRA Taulbee Survey 2015
Year
Per
cent

COMPUTING RESEARCH NEWS, MAY 2016Vol. 28 / No. 5
cra.org/crn 11
Figure D3. PhD Degrees Granted by Tenure-Track Size
CRA Taulbee Survey 2015
Figure D4. PhD Enrollment Normalized by Tenure-Track Size
CRA Taulbee Survey 2015

COMPUTING RESEARCH NEWS, MAY 2016Vol. 28 / No. 5
cra.org/crn 12
Figure D5. CS Pipeline corrected for year of entry
CRA Taulbee Survey 2015
Figure D6. Employment Trends for New Ph.D.s
CRA Taulbee Survey 2015
Year of entry
Passed qualifier per dept
Ph.D. production per dept
New Ph.D students per dept
Academia (North America)
Industry (North America)
Non-PhD Dept. among those going to Academia (North America)
Abroad

COMPUTING RESEARCH NEWS, MAY 2016Vol. 28 / No. 5
cra.org/crn 13
Master’s and Bachelor’s Degree Production and Enrollments
This section reports data about enrollment and degree
production for Master’s and Bachelor’s programs in the
doctoral-granting departments. Although the absolute number
of degrees and enrolled students reported herein only reflect
departments that offer the doctoral degree, the trends
observed in the master’s and bachelor’s data from these
departments tend to strongly reflect trends in the larger
population of programs that offer such degrees.
Master’s (Tables M1-M8; Figures M1-M2)
On a per-department basis, CS master’s degree production in
U.S. CS departments rose nearly 25% in 2014-15; this follows
Table M1. Master’s Degrees Awarded by Department Type
Department Type
# Depts CS CE I Total
US CS Public 100 5,410 54.5% 350 57.0% 785 31.6% 6,545 50.2%
US CS Private 38 3,855 38.8% 84 13.7% 347 13.9% 4,286 32.9%
Total US CS 138 9,265 93.3% 434 70.7% 1,132 45.5% 10,831 83.1%
US CE 6 0 0.0% 178 29.0% 0 0.0% 178 1.4%
US Info 11 286 2.9% 0 0.0% 1,208 48.6% 1,494 11.5%
Canadian 11 382 3.8% 2 0.3% 148 5.9% 532 4.1%
Grand Total 166 9,933 614 2,488 13,035
Table M2. Master’s Degrees Awarded by Gender
CS CE I Total
Male 7,268 75.1% 467 76.1% 1,294 52.0% 9,029 70.7%
Female 2,404 24.9% 147 23.9% 1,194 48.0% 3,745 29.3%
Total Known Gender 9,672 614 2,488 12,774
Gender Unknown 261 0 0 261
Grand Total 9,933 614 2,488 13,035
Table M3. Master’s Degrees Awarded by Ethnicity
CS CE I Total
Nonresident Alien 6,076 68.1% 404 67.4% 757 33.3% 7,237 61.4%
Amer Indian or Alaska Native 48 0.5% 1 0.2% 13 0.6% 62 0.5%
Asian 958 10.7% 72 12.0% 176 7.7% 1,206 10.2%
Black or African-American 110 1.2% 6 1.0% 154 6.8% 270 2.3%
Native Hawaiian/Pac Island 3 0.0% 0 0.0% 3 0.1% 6 0.1%
White 1,534 17.2% 102 17.0% 1,039 45.7% 2,675 22.7%
Multiracial, not Hispanic 53 0.6% 0 0.0% 19 0.8% 72 0.6%
Hispanic, any race 141 1.6% 14 2.3% 111 4.9% 266 2.3%
Total Residency & Ethnicity Known 8,923 599 2,272 11,794
Resident, ethnicity unknown 255 12 192 459
Residency unknown 755 3 24 782
Grand Total 9,933 614 2,488 13,035

COMPUTING RESEARCH NEWS, MAY 2016Vol. 28 / No. 5
cra.org/crn 14
Table M4. Master’s Degrees Expected Next Year by Department Type
Department Type # Depts CS CE I Total
US CS Public 98 5,301 57.8% 297 58.9% 521 20.3% 6,119 50.0%
US CS Private 34 3,477 37.9% 63 12.5% 356 13.9% 3,896 31.8%
Total US CS 132 8,778 95.7% 360 71.4% 877 34.2% 10,015 81.8%
US CE 4 0 0.0% 127 25.2% 0 0.0% 127 1.0%
US Info 11 40 0.4% 0 0.0% 1,691 65.8% 1,731 14.1%
Canadian 12 352 3.8% 17 3.4% 0 0.0% 369 3.0%
Grand Total 159 9,170 504 2,568 12,242
Table M5. New Master’s Students by Department Type
Department Type
CS CE I Total Outside North America
Total # Depts
Avg / Dept
Total # Depts
Avg / Dept
Total # Dept
Avg / Dept
Total # Dept
Avg / Dept
Total %
US CS Public 6,329 100 63.3 277 19 14.6 691 13 53.2 7,297 100 73.0 4,693 64.3%
US CS Private 3,241 35 92.6 68 5 13.6 284 3 94.7 3,593 35 102.7 2,201 61.3%
Total US CS 9,570 135 70.9 345 24 14.4 975 16 60.9 10,890 135 80.7 6,894 63.3%
US CE 0 0 0.0 273 5 54.6 0 0 0.0 273 5 54.6 220 80.6%
US Info 16 1 16.0 0 0 0.0 1,440 11 130.9 1,456 11 132.4 472 32.4%
Canadian 354 12 29.5 6 2 3.0 0 0 0.0 360 12 30.0 228 63.3%
Grand Total 9,940 148 67.2 624 31 20.1 2,415 27 89.4 12,979 163 79.6 7,814 60.2%
Table M6. Total Master’s Enrollment by Department Type
Department Type
CS CE I Total
Total # Depts
Avg / Dept Total #
DeptsAvg / Dept Total #
DeptAvg / Dept Total #
DeptAvg / Dept
US CS Public 14,696 102 144.1 834 24 34.8 1,880 15 125.3 17,410 102 170.7
US CS Private 8,954 37 242.0 146 5 29.2 1,253 4 313.3 10,353 37 279.8
Total US CS 23,650 139 170.1 980 29 33.8 3,133 19 164.9 27,763 139 199.7
US CE 0 0 0.0 958 5 191.6 0 0 0.0 958 5 191.6
US Info 97 1 97.0 0 0 0.0 3,799 11 345.4 3,896 11 354.2
Canadian 985 11 89.5 22 1 22.0 282 2 141.0 1,289 11 117.2
Grand Total 24,732 151 163.8 1,960 35 56.0 7,214 32 225.4 33,906 166 204.3
COMPUTING RESEARCH NEWS, MAY 2016Vol. 28 / No. 5
cra.org/crn 15
two consecutive years of relatively flat production. Both public
and private departments reported large increases.
Overall production of master’s degrees in the information
area declined in 2014-15, following two consecutive years of
growth. U.S. public CS departments showed an increased
production of information Master’s degrees, while U.S. private
CS departments reported decreases. U.S. I departments
also reported decreased production of information master’s
degrees, the opposite of what took place last year (Table M1).
The proportion of female graduates among master’s degree
recipients rose in CS from 22.0 percent to 24.9 percent, and
this resulted in a slight rise in the overall percentage of
master’s degrees to women, from 28.7 to 29.3 (Table M2).
In the information area, the percentage of the master’s
recipients that were Non-resident Aliens increased in 2014-15
to 33.3 percent as compared with 28.1 percent 2013-14. In CS,
68.1 percent of the master’s degrees went to Non-resident
Aliens, similar to the 67.8 percent in 2013-14. In both CS and
I, the fraction of master’s degrees going to Whites declined
(Table M3).
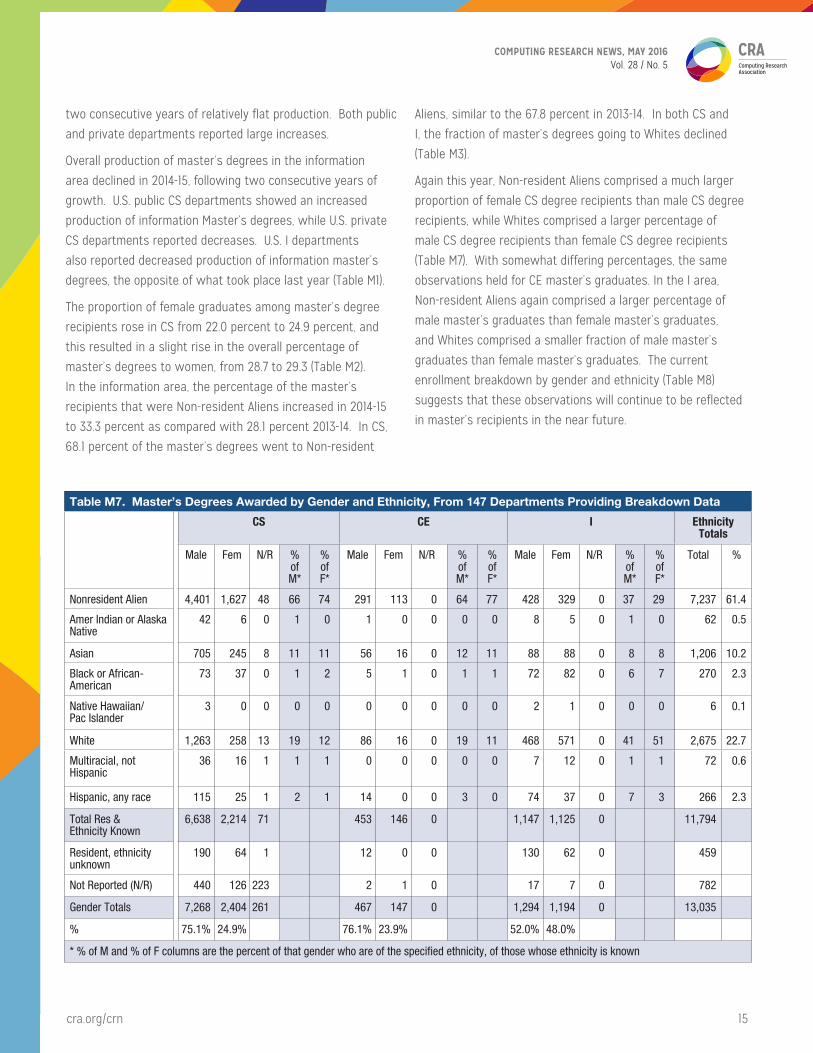
Again this year, Non-resident Aliens comprised a much larger
proportion of female CS degree recipients than male CS degree
recipients, while Whites comprised a larger percentage of
male CS degree recipients than female CS degree recipients
(Table M7). With somewhat differing percentages, the same
observations held for CE master’s graduates. In the I area,
Non-resident Aliens again comprised a larger percentage of
male master’s graduates than female master’s graduates,
and Whites comprised a smaller fraction of male master’s
graduates than female master’s graduates. The current
enrollment breakdown by gender and ethnicity (Table M8)
suggests that these observations will continue to be reflected
in master’s recipients in the near future.
Table M7. Master’s Degrees Awarded by Gender and Ethnicity, From 147 Departments Providing Breakdown Data
CS CE I Ethnicity Totals
Male Fem N/R % of M*
% of F*
Male Fem N/R % of M*
% of F*
Male Fem N/R % of M*
% of F*
Total %
Nonresident Alien 4,401 1,627 48 66 74 291 113 0 64 77 428 329 0 37 29 7,237 61.4
Amer Indian or Alaska Native
42 6 0 1 0 1 0 0 0 0 8 5 0 1 0 62 0.5
Asian 705 245 8 11 11 56 16 0 12 11 88 88 0 8 8 1,206 10.2
Black or African-American
73 37 0 1 2 5 1 0 1 1 72 82 0 6 7 270 2.3
Native Hawaiian/ Pac Islander
3 0 0 0 0 0 0 0 0 0 2 1 0 0 0 6 0.1
White 1,263 258 13 19 12 86 16 0 19 11 468 571 0 41 51 2,675 22.7
Multiracial, not Hispanic
36 16 1 1 1 0 0 0 0 0 7 12 0 1 1 72 0.6
Hispanic, any race 115 25 1 2 1 14 0 0 3 0 74 37 0 7 3 266 2.3
Total Res & Ethnicity Known
6,638 2,214 71 453 146 0 1,147 1,125 0 11,794
Resident, ethnicity unknown
190 64 1 12 0 0 130 62 0 459
Not Reported (N/R) 440 126 223 2 1 0 17 7 0 782
Gender Totals 7,268 2,404 261 467 147 0 1,294 1,194 0 13,035
% 75.1% 24.9% 76.1% 23.9% 52.0% 48.0%
* % of M and % of F columns are the percent of that gender who are of the specified ethnicity, of those whose ethnicity is known

COMPUTING RESEARCH NEWS, MAY 2016Vol. 28 / No. 5
cra.org/crn 16
There were increases in the average number of new master’s
students enrolled in U.S. CS departments. U.S. CS departments
at both public and private institutions experienced these
increases (Table M5). For departments at public institutions,
this represents the fourth straight year of increases. This
suggests further increased production of master’s degrees in
the next couple of years.
The fraction of new master’s students in U.S. CS departments
that is reported to be from outside North America declined
slightly, from 64.5 percent in 2014-15 to 63.3 percent in 2015-16
(Table M5). At U.S. information departments, the fraction of
new master’s students from outside North America decreased
from 43.5 percent to 32.4 percent, following two consecutive
years of increase.
Table M8. Master’s Enrollment by Gender and Ethnicity, From 139 Departments Providing Breakdown Data
CS CE I Ethnicity Totals
Male Fem N/R % of M*
% of F*
Male Fem N/R % of M*
% of F*
Male Fem N/R % of M*
% of F*
Total %
Nonresident Alien 9,977 4,283 195 63 76 836 242 0 53 74 1,470 1,050 0 40 35 18,053 59.5
Amer Indian or Alaska Native
19 7 1 0 0 3 1 0 0 0 4 2 0 0 0 37 0.1
Asian 1,261 472 23 8 8 120 19 0 8 6 305 188 1 8 6 2,389 7.9
Black or African-American
299 91 11 2 2 49 5 0 3 2 227 189 0 6 6 871 2.9
Native Hawaiian/ Pac Islander
7 0 0 0 0 0 1 0 0 0 2 2 0 0 0 12 0.0
White 3,679 600 74 23 11 397 41 0 25 13 1,439 1,370 0 39 46 7,600 25.0
Multiracial, not Hispanic
111 30 0 1 1 21 4 0 1 1 35 46 0 1 2 247 0.8
Hispanic, any race 506 126 19 3 2 140 14 0 9 4 205 137 0 6 5 1,147 3.8
Total Res & Ethnicity Known
15,859 5,609 323 1,566 327 0 3,687 2,984 1 30,356
Resident, ethnicity unknown
541 134 51 30 14 0 295 171 0 1,236
Not Reported (N/R) 1,435 382 592 15 8 0 55 21 0 2,314
Gender Totals 17,835 6,125 772 1,611 349 0 4,037 3,176 1 33,906
% 74.4% 25.6% 82.2% 17.8% 56.0% 44.0%
* % of M and % of F columns are the percent of that gender who are of the specified ethnicity, of those whose ethnicity is known

COMPUTING RESEARCH NEWS, MAY 2016Vol. 28 / No. 5
cra.org/crn 17
Figure M1. Master’s Degrees Granted by Tenure-Track Size
CRA Taulbee Survey 2015
Figure M2. Master’s Enrollment Normalized by Tenure-Track Size
CRA Taulbee Survey 2015

COMPUTING RESEARCH NEWS, MAY 2016Vol. 28 / No. 5
cra.org/crn 18
Bachelor’s (Tables 1, B1-B8; Figures B1-B4)
When comparing all departments reporting this year to all
departments reporting last year, there was an increase in
bachelor’s degree production of 26.9 percent overall, and
21.6 percent per department. When considering only those
departments that reported both years, the increase was
22.2 percent. Among U.S. computer science departments,
the increases were 21.8 percent overall and 14.7 percent
per department when comparing totals for all reporting
departments. The increase was 17.7 percent for those U.S. CS
departments that reported both years (Table 1).
Table 1. Degree Production and Enrollment Change From Previous Year
Total Only Departments Responding Both Years
US CS Only All Departments US CS Only All Departments
PhDs 2014 2015 % chg 2014 2015 % chg 2014 2015 % chg 2014 2015 % chg
# Departments 137 140 2.2% 173 170 -1.7% 122 122 151 151
PhD Awarded 1,606 1,570 -2.2% 1,940 1,780 -8.2% 1,486 1,490 0.3% 1,746 1,685 -3.5%
# Departments 135 136 170 164 119 119 145 145
PhD Enroll 12,633 13,063 3.4% 15,066 15,397 2.2% 11,783 11,804 0.2% 13,838 13,986 1.1%
# Departments 135 137 169 166 121 121 148 148
New PhD Enroll 2,445 2,475 1.2% 2,820 2,752 -2.4% 2,207 2,251 2.0% 2,528 2,528 0.0%
# Departments 134 133 170 162 116 116 145 145
Bachelor’s 2014 2015 % chg 2014 2015 % chg 2014 2015 % chg 2014 2015 % chg
# Departments 130 138 6.2% 162 166 2.5% 118 118 144 144
BS Awarded 14,283 17,401 21.8% 17,237 21,880 26.9% 13,561 15,966 17.7% 16,333 19,964 22.2%
# Departments 129 137 158 165 116 116 140 140
BS Enrollment 80,324 98,377 22.5% 96,660 119,919 24.1% 75,801 85,318 12.6% 91,199 105,282 15.4%
# Departments 128 138 167 165 116 116 140 140
New BS Majors 20,351 25,256 24.1% 25,595 30,147 17.8% 18,798 22,015 17.1% 23,472 26,839 14.3%
# Departments 115 123 145 147 100 100 123 123
BS Enroll/Dept 627.5 712.9 13.6% 578.8 726.8 25.6% 653.5 735.5 12.6% 651.4 752.0 15.4%
Table B1. Bachelor’s Degrees Awarded by Department Type
Department Type # Depts CS CE I Total
US CS Public 100 10,468 68.6% 1,686 64.9% 1,620 40.2% 13,774 63.0%
US CS Private 36 3,046 20.0% 245 9.4% 336 8.3% 3,627 16.6%
Total US CS 136 13,514 88.6% 1,931 74.3% 1,956 48.6% 17,401 79.5%
US CE 7 0 0.0% 601 23.1% 143 3.6% 744 3.4%
US Info 10 90 0.6% 0 0.0% 1,485 36.9% 1,575 7.2%
Canadian 11 1,652 10.8% 66 2.5% 442 11.0% 2,160 9.9%
Grand Total 164 15,256 2,598 4,026 21,880

COMPUTING RESEARCH NEWS, MAY 2016Vol. 28 / No. 5
cra.org/crn 19
Table B2. Bachelor’s Degrees Awarded by Gender
CS CE I Total
Male 12,509 84.3% 2,235 88.4% 3,129 78.3% 17,873 83.7%
Female 2,325 15.7% 293 11.6% 869 21.7% 3,487 16.3%
Total Known Gender 14,834 2,528 3,998 21,360
Gender Unknown 422 70 28 520
Grand Total 15,256 2,598 4,026 21,880
Table B3. Bachelor’s Degrees Awarded by Ethnicity
CS CE I Total
Nonresident Alien 1,053 8.8% 188 8.6% 253 7.4% 1,494 8.5%
Amer Indian or Alaska Native 48 0.4% 6 0.3% 5 0.1% 59 0.3%
Asian 2,734 22.8% 553 25.3% 534 15.7% 3,821 21.8%
Black or African-American 425 3.5% 81 3.7% 297 8.7% 803 4.6%
Native Hawaiian/Pac Islander 42 0.4% 11 0.5% 21 0.6% 74 0.4%
White 6,589 55.0% 1,103 50.5% 1,821 53.6% 9,513 54.2%
Multiracial, not Hispanic 248 2.1% 36 1.6% 95 2.8% 379 2.2%
Hispanic, any race 835 7.0% 206 9.4% 373 11.0% 1,414 8.1%
Total Residency & Ethnicity Known 11,974 2,184 3,399 17,557
Resident, ethnicity unknown 718 53 150 921
Residency unknown 2,564 361 477 3,402
Grand Total 15,256 2,598 4,026 21,880
Table B4. Bachelor’s Degrees Expected Next Year by Department Type
Department Type # Depts CS CE I Total
US CS Public 95 11,885 65.5% 1,809 73.0% 1,365 43.5% 15,059 63.4%
US CS Private 30 3,735 20.6% 244 9.8% 268 8.5% 4,247 17.9%
Total US CS 125 15,620 86.1% 2,053 82.8% 1,633 52.0% 19,306 81.3%
US CE 4 0 0.0% 358 14.4% 0 0.0% 358 1.5%
US Info 9 82 0.5% 0 0.0% 1,497 47.7% 1,579 6.6%
Canadian 11 2,432 13.4% 68 2.7% 8 0.3% 2,508 10.6%
Grand Total 149 18,134 2,479 3,138 23,751

COMPUTING RESEARCH NEWS, MAY 2016Vol. 28 / No. 5
cra.org/crn 20
This marks the second consecutive year of double-digit
percentage increases in bachelor’s degree production. It is
a natural outgrowth of the booming bachelor’s enrollments
reported for the past several years.
For the eighth straight year, there was an increase in
the number of new undergraduate computing majors.
This year’s respondents reported 17.8 percent more new
majors (16.2 percent per department) than did last year’s
respondents. The increase is 14.3 percent when considering
only those departments reporting both this year and
last year. Among U.S. computer science departments,
the increase was 24.1 percent overall (16.0 percent per
department), and 17.1 percent among departments reporting
both this year and last year. Figure B2 illustrates the trend
in the total number of newly declared CS/CE undergraduate
majors as reported in the Taulbee Survey. Over the past four
years, this number has almost doubled, and now exceeds
the levels reported during the dot-com boom period.
Total undergraduate enrollment in computing majors among
U.S. CS departments (i.e., the sum of the number of majors
in CS, CE and I at these departments) increased 22.5 percent
(13.6 percent per department) when all respondents are
compared, and increased 12.6 percent among departments
reporting both this year and last year. Aggregate
total enrollment (which combines CS departments, CE
departments, I departments and Canadian departments) once
Table B5. New Bachelor’s Students by Department Type
CS CE I Total
Department Type Major Pre-
major#
Dept
Avg. Major /Dept
Total Pre-major
# Dept
Avg. Major /Dept
Total Pre-major
# Dept
Avg. Major /Dept
Total Major
Avg. Major /
Dept
US CS Public 15,515 8,842 90 172.4 2,332 1,003 28 83.3 929 146 23 40.4 18,776 208.6
US CS Private 5,516 1,449 30 183.9 569 10 6 94.8 395 10 4 98.8 6,480 216.0
US CS Total 21,031 10,291 120 175.3 2,901 1,013 34 85.3 1,324 156 27 49.0 25,256 210.5
US CE 0 0 0 0.0 484 313 6 80.7 0 0 0 0.0 484 80.7
US Information 288 0 1 288.0 0 0 0 0.0 716 112 8 89.5 1,004 125.5
Canadian 3,138 901 10 313.8 250 0 2 125.0 15 0 1 15.0 3,403 340.3
Grand Total 24,457 11,192 131 186.7 3,635 1,326 42 86.5 2,055 268 36 57.1 30,147 209.4
Table B6. Total Bachelor’s Enrollment by Department Type
CS CE I Total
Department Type Major Pre-
major#
Dept
Avg. Major
per Dept.
Total Pre-major
# Dept
Avg. Major
per Dept.
Total Pre-major
# Dept
Avg. Major
per Dept.
Total Major
Avg. Major
per Dept
US CS Public 61,039 16,320 101 604.3 8,874 1,816 34 261.0 7,353 647 26 282.8 77,266 765.0
US CS Private 18,698 1,603 37 505.4 938 17 9 104.2 1,475 4 4 368.8 21,111 570.6
US CS Total 79,737 17,923 138 577.8 9,812 1,833 43 228.2 8,828 651 30 294.3 98,377 712.9
US CE 0 0 0 0.0 3,133 471 7 447.6 729 0 1 729.0 3,862 551.7
US Information 705 0 1 705.0 0 0 0 0.0 4,064 674 10 406.4 4,769 476.9
Canadian 9,678 1,080 10 967.8 191 0 1 191.0 3,042 0 3 1,014. 12,911 1291.1
Grand Total 90,120 19,003 149 604.8 13,136 2,304 51 257.6 16,663 1,325 44 378.7 119,919 726.8

COMPUTING RESEARCH NEWS, MAY 2016Vol. 28 / No. 5
cra.org/crn 21
again increased in all three computing areas (CS, CE, and
I), although the increase in CE was only just over 2 percent
(Table B6). New student enrollment also increased once again
in all three areas (Table B5).
The proportion of women among bachelor’s graduates in CS
rose from 14.1 percent in 2013-14 to 15.7 percent in 2014-15. In
CE, the percentage of female bachelor’s graduates was 11.6,
the same as it was two years ago (it was 11.2 percent last
year). There also was an increase in the percentage of I
degrees going to women from 20.3 percent to 21.7 percent
(Table B2). The fraction of CS bachelor’s degrees awarded to
Whites declined from 57.7 percent in 2013-14 to 55.0 percent in
2014-15, and the percentage awarded to Asians rose from 21.1
percent to 22.8 percent. Changes in other ethnicity categories
were less than one percent in CS. In aggregate across the
three degree areas, 54.2 percent of the graduates were White,
21.8 percent Asian, 8.5 percent Non-resident Aliens, and 15.5
percent all other ethnicity categories combined. However, in I
programs, the other ethnicity categories accounted for over 23
percent of the graduates (Table B3).
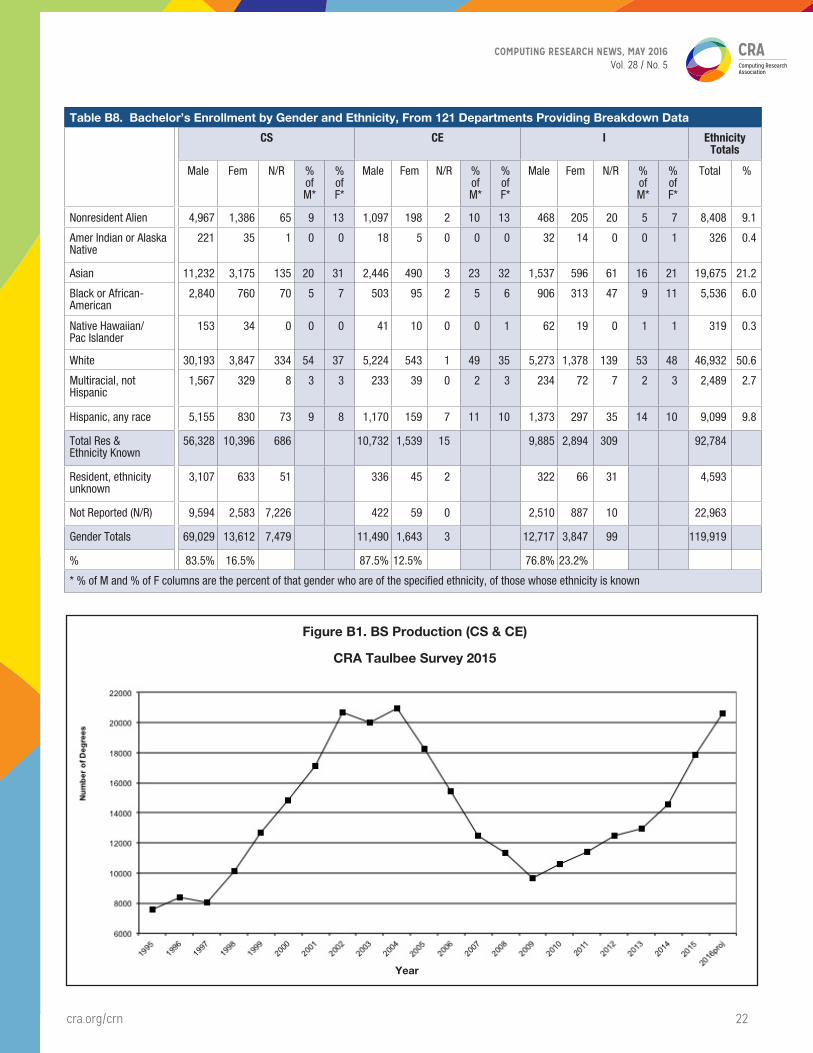
In all three computing areas (CS, CE and I), Resident Asians and
Non-resident Aliens comprise a larger fraction of female degree
recipients than male recipients, while Whites comprise a larger
fraction of male degree recipients than female recipients
(Table B7). Table B8 indicates that the same comparisons hold
true for total bachelor’s enrollment. We observed these same
results in last year’s report.
Table B7. Bachelor’s Degrees Awarded by Gender and Ethnicity, From 125 Departments Providing Breakdown Data
CS CE I Ethnicity Totals
Male Fem N/R% of M*
% of F*
Male Fem N/R% of M*
% of F*
Male Fem N/R% of M*
% of F*
Total %
Nonresident Alien 800 245 8 8 13 159 29 0 8 11 165 87 1 6 12 1,494 8.5
Amer Indian or Alaska Native
40 8 0 0 0 4 2 0 0 1 5 0 0 0 0 59 0.3
Asian 2,126 600 8 21 32 472 81 0 25 31 379 139 16 15 19 3,821 21.8
Black or African-American
312 108 5 3 6 75 6 0 4 2 226 66 5 9 9 803 4.6
Native Hawaiian/ Pac Islander
30 12 0 0 1 7 4 0 0 2 14 7 0 1 1 74 0.4
White 5,818 738 33 58 40 991 112 0 52 43 1,454 350 17 56 48 9,513 54.2
Multiracial, not Hispanic
203 42 3 2 2 29 7 0 2 3 69 24 2 3 3 379 2.2
Hispanic, any race 720 109 6 7 6 186 20 0 10 8 303 64 6 12 9 1,414 8.1
Total Res & Ethnicity Known
10,049 1,862 63 1,923 261 0 2,615 737 47 17,557
Resident, ethnicity unknown
572 111 35 47 6 0 124 18 8 921
Not Reported (N/R) 1,888 352 362 265 26 70 390 114 27 3,402
Gender Totals 12,509 2,325 422 2,235 293 70 3,129 869 28 21,880
% 84.3% 15.7% 88.4% 11.6% 78.3% 21.7%
* % of M and % of F columns are the percent of that gender who are of the specified ethnicity, of those whose ethnicity is known
COMPUTING RESEARCH NEWS, MAY 2016Vol. 28 / No. 5
cra.org/crn 22
Table B8. Bachelor’s Enrollment by Gender and Ethnicity, From 121 Departments Providing Breakdown Data
CS CE I Ethnicity Totals
Male Fem N/R % of M*
% of F*
Male Fem N/R % of M*
% of F*
Male Fem N/R % of M*
% of F*
Total %
Nonresident Alien 4,967 1,386 65 9 13 1,097 198 2 10 13 468 205 20 5 7 8,408 9.1
Amer Indian or Alaska Native
221 35 1 0 0 18 5 0 0 0 32 14 0 0 1 326 0.4
Asian 11,232 3,175 135 20 31 2,446 490 3 23 32 1,537 596 61 16 21 19,675 21.2
Black or African-American
2,840 760 70 5 7 503 95 2 5 6 906 313 47 9 11 5,536 6.0
Native Hawaiian/ Pac Islander
153 34 0 0 0 41 10 0 0 1 62 19 0 1 1 319 0.3
White 30,193 3,847 334 54 37 5,224 543 1 49 35 5,273 1,378 139 53 48 46,932 50.6
Multiracial, not Hispanic
1,567 329 8 3 3 233 39 0 2 3 234 72 7 2 3 2,489 2.7
Hispanic, any race 5,155 830 73 9 8 1,170 159 7 11 10 1,373 297 35 14 10 9,099 9.8
Total Res & Ethnicity Known
56,328 10,396 686 10,732 1,539 15 9,885 2,894 309 92,784
Resident, ethnicity unknown
3,107 633 51 336 45 2 322 66 31 4,593
Not Reported (N/R) 9,594 2,583 7,226 422 59 0 2,510 887 10 22,963
Gender Totals 69,029 13,612 7,479 11,490 1,643 3 12,717 3,847 99 119,919
% 83.5% 16.5% 87.5% 12.5% 76.8% 23.2%
* % of M and % of F columns are the percent of that gender who are of the specified ethnicity, of those whose ethnicity is known
Figure B1. BS Production (CS & CE)
CRA Taulbee Survey 2015
Year

COMPUTING RESEARCH NEWS, MAY 2016Vol. 28 / No. 5
cra.org/crn 23
Figure B3. Bachelor’s Degrees Granted by Tenure-Track Size
CRA Taulbee Survey 2015
Figure B2. Newly Declared CS/CE Undergraduate Majors
CRA Taulbee Survey 2015
Year

COMPUTING RESEARCH NEWS, MAY 2016Vol. 28 / No. 5
cra.org/crn 24
Faculty Demographics (Tables F1-F9)4
Table F1 shows the current and anticipated sizes, in FTE, for
tenure-track, teaching and research faculty, and postdocs.
The total tenure-track faculty count in U.S. CS departments
(3,880) represents about a 9 percent increase over last
year. The average tenure-track faculty size per U.S. CS
department went from 27.4 to 28.1 during this period. In
these departments, the average number of teaching faculty
increased from 5.7 to 6.9 and the average number of postdocs
increased from 6.0 to 6.5, while the average number of
research faculty decreased from 6.1 to 5.4. Canadian, CE and
I departments have much more volatile data due to the small
number of departments reporting in each of those categories.
As we have mentioned in previous Taulbee reports, Canadian
universities, on average, have several more tenure-track
faculty members per department than do U.S. universities,
while on average U.S. I departments and U.S. CE departments
are somewhat smaller than U.S. CS departments. The
observations about U.S. CE and I departments may reflect the
fact that we ask departments to report only computing-related
faculty, so departments with Library Science or EE programs
may report only part of their faculty.
Among U.S. CS departments, those at private universities
tend to have more teaching faculty, research faculty and
postdocs than do those at public universities on average. This
observation also was made last year. However, this year the
average tenure-track faculty size at public universities was
slightly larger than that at private universities; this is a change
from previous years.
Table F2 summarizes faculty hiring this past year. The success
rate for hiring tenure-track faculty at U.S. CS departments fell
from 80.2 percent in 2013-14 to 70.8 percent in 2014-15. Even
with this decline the 2014-15 rate still was higher than that
of two years ago. The success rate was almost identical at
public and private departments. Again this year, Canadian
departments had lower success rates on average than did U.S.
Figure B4. Bachelor’s Enrollment Normalized by Tenure-Track Size
CRA Taulbee Survey 2015

COMPUTING RESEARCH NEWS, MAY 2016Vol. 28 / No. 5
cra.org/crn 25
Table F1. Actual and Anticipated Faculty Size by Position and Department Type
Actual Projected Expected 2-Yr Growth
2015-2016 2016-2017 2017-2018
US CS Public Total Average Total Average Total Average # %
TenureTrack 2,859 28.3 3,083 30.5 3,227 31.9 368 12.9%
Teaching 569 6.6 635 7.3 667 7.8 98 17.2%
Research 263 4.8 287 5.3 310 5.8 47 17.9%
Postdoc 311 5.5 355 5.9 384 6.5 73 23.5%
Total 3,991 39.5 4,351 43.1 4,580 45.3 589 14.8%
US CS Private
TenureTrack 1,021 27.6 1,092 29.5 1,153 31.2 132 12.9%
Teaching 257 7.6 288 8.7 306 9.3 49 19.1%
Research 134 7.0 142 7.5 151 7.9 17 12.7%
Postdoc 224 9.0 244 9.8 256 10.2 32 14.3%
Total 1,632 44.1 1,764 47.7 1,864 50.4 232 14.2%
All US CS
TenureTrack 3,880 28.1 4,175 30.3 4,380 31.7 500 12.9%
Teaching 826 6.9 923 7.7 973 8.2 147 17.8%
Research 396 5.4 429 5.9 460 6.4 64 16.2%
Postdoc 535 6.5 599 7.0 640 7.6 105 19.6%
Total 5,623 40.7 6,115 44.3 6,444 46.7 821 14.6%
US CE
TenureTrack 105 15.1 117 16.8 126 18.0 21 20.0%
Teaching 15 2.4 17 2.8 18 2.9 3 20.0%
Research 10 2.4 10 2.5 11 2.6 1 10.0%
Postdoc 12 2.9 14 2.8 16 3.1 4 33.3%
Total 140 20.0 157 22.4 169 24.1 29 20.7%
US I
TenureTrack 301 25.1 316 26.3 326 27.2 25 8.3%
Teaching 112 11.2 117 11.7 121 12.1 9 8.0%
Research 16 2.0 13 1.9 14 1.7 -2 -12.5%
Postdoc 27 3.0 27 3.4 26 2.9 -1 -3.7%
Total 454 37.8 473 39.4 485 40.4 31 6.8%
Canadian
TenureTrack 425 35.4 437 36.4 441 36.8 16 3.8%
Teaching 62 5.6 62 6.2 62 6.2 0 0.0%
Research 10 2.5 9 2.3 8 2.7 -2 -20.0%
Postdoc 75 8.3 72 8.0 69 7.7 -6 -8.0%
Total 571 47.6 579 48.3 579 48.3 8 1.4%
Grand Total
TenureTrack 4,711 27.9 5,045 29.9 5,273 31.2 562 11.9%
Teaching 1,014 6.9 1,118 7.7 1,173 8.1 159 15.7%
Research 432 4.8 461 5.2 492 5.7 60 13.9%
Postdoc 649 6.2 712 6.7 751 7.0 102 15.7%
Total 6,788 40.2 7,324 43.3 7,677 45.4 889 13.1%

COMPUTING RESEARCH NEWS, MAY 2016Vol. 28 / No. 5
cra.org/crn 26
CS, U.S. CE and U.S. I departments. In aggregate, the tenure-
track hiring success rate fell from 78.8 percent to 70.6 percent.
Among those hired into all categories of academic positions
(tenure-track, teaching faculty, research faculty and postdoc)
in 2014-15, 21.6 percent were women, a slight decrease from
the 22.1 percent in 2013-14 (Table F3). Considering only tenure-
track positions, the proportion of women hired declined
from 21.8 percent in 2013-14 to 20.3 percent in 2014-15. Only
among research faculty positions was there an increase in
the percentage of positions going to women as compared
with those reported last year. The percentage of new
female tenure-track and overall faculty hires is similar to the
percentage of new female Ph.D.s produced this past year.
Among new tenure-track faculty, the fraction who are white
declined from 49.5 percent to 44.8 percent, while the fraction
who are Non-resident Alien or Asian new hires rose from 41.8
percent to 43.5 percent. Once again, whites dominated the
newly hired teaching faculty, with Asians and Non-resident
Aliens accounting for most of the remainder. Among research
faculty, whites comprised 42.3 percent of new hires, while
Non-resident Aliens or resident Asians in aggregate comprised
53.8 percent of new hires. Among postdoc new hires, whites
comprised 19.8 percent, about half of what it was last year,
with Non-resident Aliens and resident Asians collectively
comprising 75.4 percent compared with just over 50 percent
last year (Table F4).
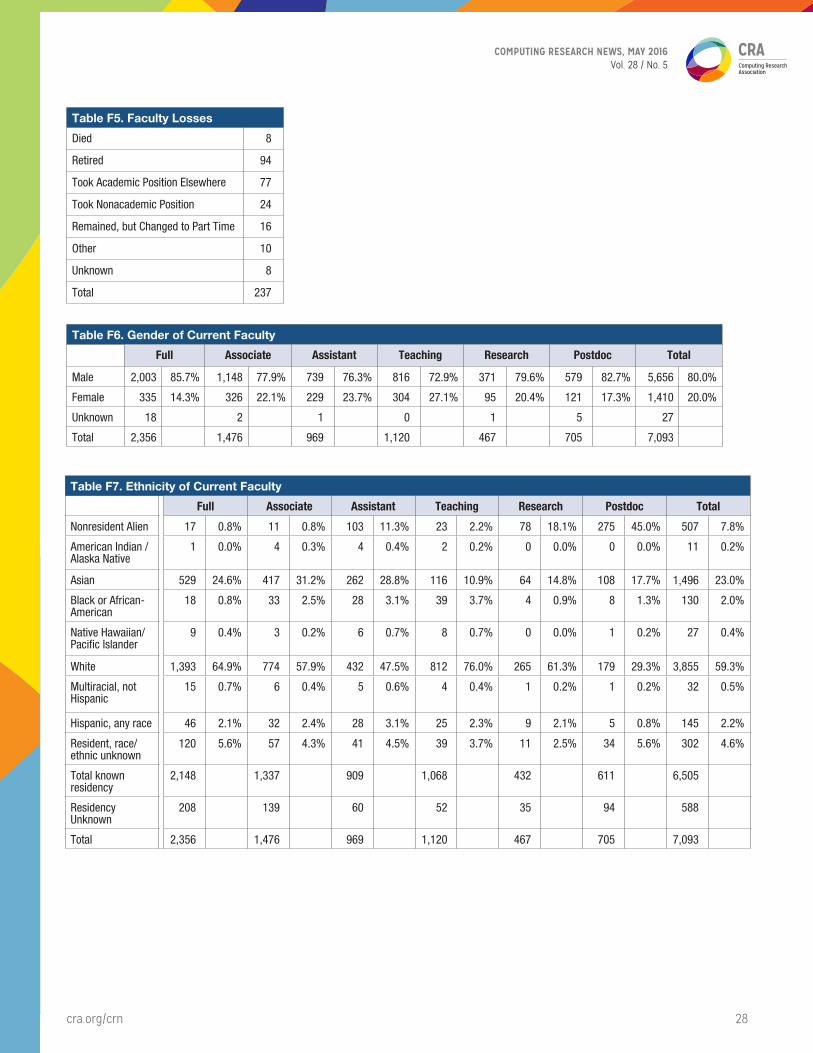
There were slightly fewer faculty losses reported this year
as compared with last year (Table F5). Retirements were the
biggest reason for faculty loss, and were up substantially
this year as compared with last year. Movement from one
academic position to another was the next largest cause of
faculty attrition.
The proportion of women at the full professor rank rose from
13.3 percent last year to 14.3 percent this year, while the
proportion at the associate professor level rose from 20.5 to
22.1 percent. The proportion at the assistant professor level,
however, fell from 24.6 to 23.7 percent (Table F6). There also
were decreases in the proportion of women among teaching
faculty and postdocs, while there was an increase in the
proportion of women among research faculty. Whites, Asians
and Non-resident Aliens account for more than 85 percent of
each category of faculty members (Table F7).
Table F2. Vacant Positions 2014-2015 by Position and Department Type
Tried to fill Filled
US CS Public
TenureTrack 261 185
Teaching 114 96
Research 73 70
Postdoc 81 75
Total 529 425
US CS Private
TenureTrack 85 60
Teaching 46 37
Research 11 10
Postdoc 52 52
Total 194 159
All US CS
TenureTrack 346 245
Teaching 160 133
Research 84 80
Postdoc 133 127
Total 723 584
US CE
TenureTrack 8 7
Teaching 23 23
Research 16 16
Postdoc 11 11
Total 58 57
US I
TenureTrack 25 18
Teaching 10 13
Research 1 2
Postdoc 13 18
Total 49 51
Canadian
TenureTrack 32 20
Teaching 6 5
Research 0 0
Postdoc 24 24
Total 62 49
Grand Total
TenureTrack 411 290
Teaching 199 174
Research 101 98
Postdoc 181 180
Total 892 741

COMPUTING RESEARCH NEWS, MAY 2016Vol. 28 / No. 5
cra.org/crn 27
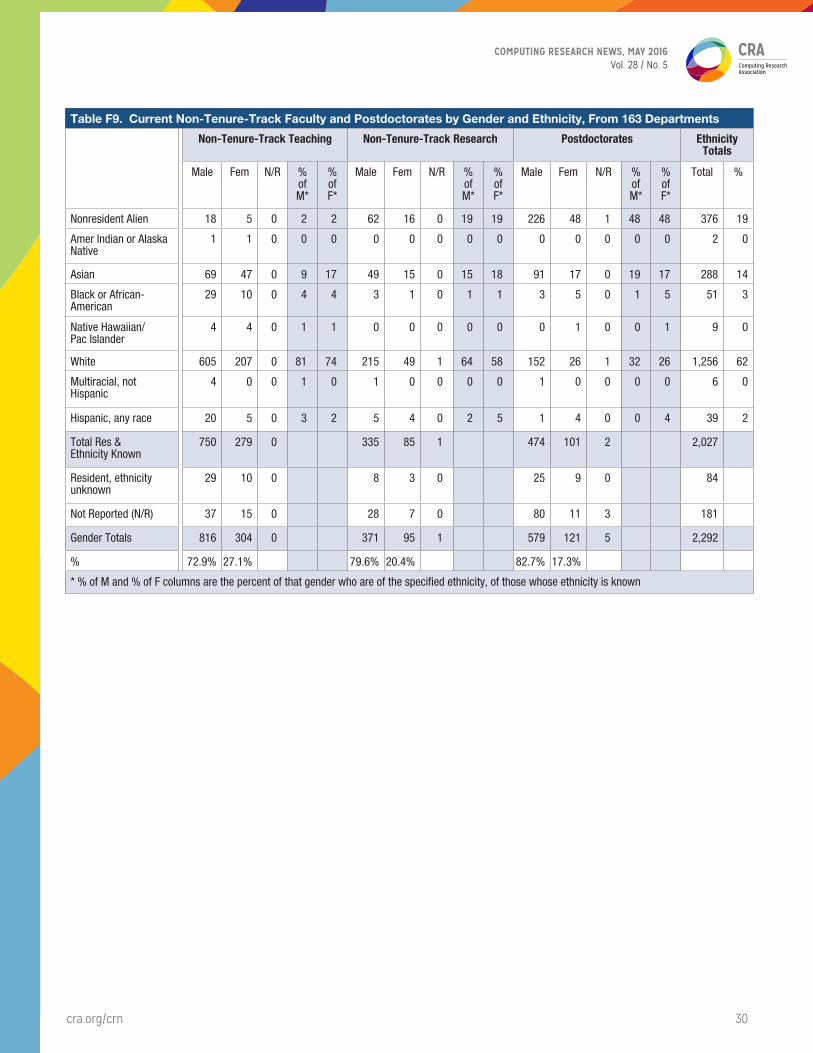
Ninety-five percent of departments provided gender by
ethnicity breakdowns for their current faculty members.
(Tables F8 and F9). Whites again comprised a greater
percentage of female full professors than they do male full
professors, while the reverse is true at the associate professor
level. Asians comprise a greater percentage of male full
professors than they do female full professors.
For next year, U.S. CS departments forecast a 7.6 percent
growth in tenure-track faculty, and an 11.7 percent growth in
teaching faculty. They also forecast a 12.0 percent growth in
postdocs.
Table F2a. Reasons Positions Left Unfilled
Reason # Reported % of Reasons
Didn’t find a good fit 35 26.3%
Offers turned down 53 39.8%
Technically vacant, not filled for admin reasons 7 5.3%
Hiring in progress 35 26.3%
Other 3 2.3%
Total Reasons Provided 133
Table F3. Gender of Newly Hired Faculty
Tenure-Track Teaching Research Postdoc Total
Male 255 79.7% 127 75.1% 39 75.0% 108 80.6% 529 78.4%
Female 65 20.3% 42 24.9% 13 25.0% 26 19.4% 146 21.6%
Unknown 0 1 1 14 16
Total 320 170 53 148 691
Table F4. Ethnicity of Newly Hired Faculty
Tenure-Track Teaching Research Postdoc Total
Nonresident Alien 46 15.9% 12 7.8% 14 26.9% 67 53.2% 139 22.3%
American Indian / Alaska Native
1 0.3% 0 0.0% 0 0.0% 0 0.0% 1 0.2%
Asian 80 27.6% 23 14.9% 14 26.9% 28 22.2% 145 23.3%
Black or African-American
9 3.1% 2 1.3% 0 0.0% 2 1.6% 13 2.1%
Native Hawaiian/ Pacific Islander
0 0.0% 0 0.0% 0 0.0% 0 0.0% 0 0.0%
White 130 44.8% 112 72.7% 22 42.3% 25 19.8% 289 46.5%
Multiracial, not Hispanic
2 0.7% 0 0.0% 0 0.0% 1 0.8% 3 0.5%
Hispanic, any race 9 3.1% 2 1.3% 0 0.0% 1 0.8% 12 1.9%
Resident, race/ethnic unknown
13 4.5% 3 1.9% 2 3.8% 2 1.6% 20 3.2%
Total known residency
290 154 52 126 622
Residency Unknown 30 16 1 22 69
Total 320 170 53 148 691
COMPUTING RESEARCH NEWS, MAY 2016Vol. 28 / No. 5
cra.org/crn 28
Table F5. Faculty Losses
Died 8
Retired 94
Took Academic Position Elsewhere 77
Took Nonacademic Position 24
Remained, but Changed to Part Time 16
Other 10
Unknown 8
Total 237
Table F6. Gender of Current Faculty
Full Associate Assistant Teaching Research Postdoc Total
Male 2,003 85.7% 1,148 77.9% 739 76.3% 816 72.9% 371 79.6% 579 82.7% 5,656 80.0%
Female 335 14.3% 326 22.1% 229 23.7% 304 27.1% 95 20.4% 121 17.3% 1,410 20.0%
Unknown 18 2 1 0 1 5 27
Total 2,356 1,476 969 1,120 467 705 7,093
Table F7. Ethnicity of Current Faculty
Full Associate Assistant Teaching Research Postdoc Total
Nonresident Alien 17 0.8% 11 0.8% 103 11.3% 23 2.2% 78 18.1% 275 45.0% 507 7.8%
American Indian / Alaska Native
1 0.0% 4 0.3% 4 0.4% 2 0.2% 0 0.0% 0 0.0% 11 0.2%
Asian 529 24.6% 417 31.2% 262 28.8% 116 10.9% 64 14.8% 108 17.7% 1,496 23.0%
Black or African-American
18 0.8% 33 2.5% 28 3.1% 39 3.7% 4 0.9% 8 1.3% 130 2.0%
Native Hawaiian/ Pacific Islander
9 0.4% 3 0.2% 6 0.7% 8 0.7% 0 0.0% 1 0.2% 27 0.4%
White 1,393 64.9% 774 57.9% 432 47.5% 812 76.0% 265 61.3% 179 29.3% 3,855 59.3%
Multiracial, not Hispanic
15 0.7% 6 0.4% 5 0.6% 4 0.4% 1 0.2% 1 0.2% 32 0.5%
Hispanic, any race 46 2.1% 32 2.4% 28 3.1% 25 2.3% 9 2.1% 5 0.8% 145 2.2%
Resident, race/ethnic unknown
120 5.6% 57 4.3% 41 4.5% 39 3.7% 11 2.5% 34 5.6% 302 4.6%
Total known residency
2,148 1,337 909 1,068 432 611 6,505
Residency Unknown
208 139 60 52 35 94 588
Total 2,356 1,476 969 1,120 467 705 7,093

COMPUTING RESEARCH NEWS, MAY 2016Vol. 28 / No. 5
cra.org/crn 29
Table F8. Current Tenured and Tenure-Track Faculty by Gender and Ethnicity, From 170 Departments
Full Professor Associate Professor Assistant Professor Ethnicity Totals
Male Fem N/R % of M*
% of F*
Male Fem N/R % of M*
% of F*
Male Fem N/R % of M*
% of F*
Total %
Nonresident Alien 14 3 0 1 1 8 3 0 1 1 81 22 0 12 10 131 3.1
Amer Indian or Alaska Native
1 0 0 0 0 2 2 0 0 1 2 2 0 0 1 9 0.2
Asian 463 60 6 27 21 322 94 1 33 33 198 63 1 30 30 1,208 28.9
Black or African-American
16 2 0 1 1 19 14 0 2 5 14 14 0 2 7 79 1.9
Native Hawaiian/ Pac Islander
8 1 0 1 0 3 0 0 0 0 4 2 0 1 1 18 0.4
White 1,175 206 12 68 73 609 164 1 62 57 330 102 0 50 48 2,599 62.2
Multiracial, not Hispanic
14 1 0 1 0 6 0 0 1 0 2 3 0 0 1 26 0.6
Hispanic, any race 37 9 0 2 3 22 10 0 2 4 24 4 0 4 2 106 2.5
Total Res & Ethnicity Known
1,728 282 18 991 287 2 655 212 1 4,176
Resident, ethnicity unknown
101 19 0 46 11 0 32 9 0 218
Not Reported (N/R) 174 34 0 111 28 0 52 8 0 407
Gender Totals 2,003 335 18 1,148 326 2 739 229 1 4,801
% 85.7% 14.3% 77.9% 22.1% 76.3% 23.7%
* % of M and % of F columns are the percent of that gender who are of the specified ethnicity, of those whose ethnicity is known
COMPUTING RESEARCH NEWS, MAY 2016Vol. 28 / No. 5
cra.org/crn 30
Table F9. Current Non-Tenure-Track Faculty and Postdoctorates by Gender and Ethnicity, From 163 Departments
Non-Tenure-Track Teaching Non-Tenure-Track Research Postdoctorates Ethnicity Totals
Male Fem N/R % of M*
% of F*
Male Fem N/R % of M*
% of F*
Male Fem N/R % of M*
% of F*
Total %
Nonresident Alien 18 5 0 2 2 62 16 0 19 19 226 48 1 48 48 376 19
Amer Indian or Alaska Native
1 1 0 0 0 0 0 0 0 0 0 0 0 0 0 2 0
Asian 69 47 0 9 17 49 15 0 15 18 91 17 0 19 17 288 14
Black or African-American
29 10 0 4 4 3 1 0 1 1 3 5 0 1 5 51 3
Native Hawaiian/ Pac Islander
4 4 0 1 1 0 0 0 0 0 0 1 0 0 1 9 0
White 605 207 0 81 74 215 49 1 64 58 152 26 1 32 26 1,256 62
Multiracial, not Hispanic
4 0 0 1 0 1 0 0 0 0 1 0 0 0 0 6 0
Hispanic, any race 20 5 0 3 2 5 4 0 2 5 1 4 0 0 4 39 2
Total Res & Ethnicity Known
750 279 0 335 85 1 474 101 2 2,027
Resident, ethnicity unknown
29 10 0 8 3 0 25 9 0 84
Not Reported (N/R) 37 15 0 28 7 0 80 11 3 181
Gender Totals 816 304 0 371 95 1 579 121 5 2,292
% 72.9% 27.1% 79.6% 20.4% 82.7% 17.3%
* % of M and % of F columns are the percent of that gender who are of the specified ethnicity, of those whose ethnicity is known

COMPUTING RESEARCH NEWS, MAY 2016Vol. 28 / No. 5
cra.org/crn 31
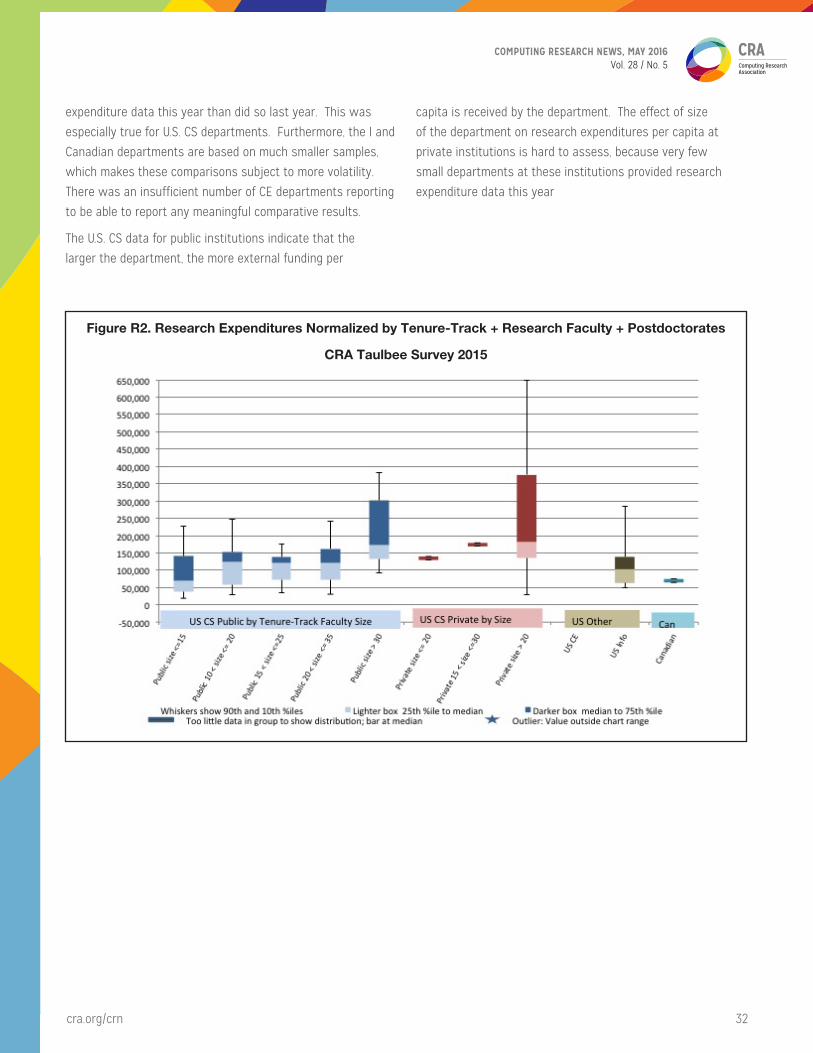
Research Expenditures (Table R1; Figures R1-R2)
Table R1 shows the department’s total expenditure (including
indirect costs or “overhead” as stated on project budgets)
from external sources of support. Figures R1 and R2 show
the per capita expenditure, where capitation is computed two
ways. The first (Figure R1) is relative to the number of tenure-
track faculty members. The second (Figure R2) is relative to
researchers and postdocs as well as tenure-track faculty.
Canadian levels are shown in Canadian dollars.
Overall median research expenditures for 2014-15 at U.S.
CS public departments fell 10.7 percent in comparison with
2013-14. At U.S. CS departments in private institutions,
median expenditures rose 37.6 percent. The median research
expenditure at U.S. CS departments in private institutions is
nearly twice that of public institutions. Median expenditures
also fell at U.S. I departments and Canadian departments in
comparison with 2013-14. It should be noted that for each
department type, fewer departments provided research
Table R1. Total Expenditure from External Sources for Computing Research
Department Type
# Depts
Percentile of Department Averages
10th 25th 50th 75th 90th
US CS Public 72 $608,907 $1,758,770 $3,528,438 $8,278,021 $15,596,967
US CS Private 21 $1,506,373 $2,936,144 $6,883,862 $13,380,854 $20,150,000
US CE 3 $2,330,244
US Information 12 $1,320,092 $2,076,549 $2,982,247 $4,621,781 $4,796,780
Canadian 8 $1,898,335 $3,289,450 $5,621,809
Figure R1. Research Expenditures Normalized by Tenure-Track Size
CRA Taulbee Survey 2015
COMPUTING RESEARCH NEWS, MAY 2016Vol. 28 / No. 5
cra.org/crn 32
Figure R2. Research Expenditures Normalized by Tenure-Track + Research Faculty + Postdoctorates
CRA Taulbee Survey 2015
expenditure data this year than did so last year. This was
especially true for U.S. CS departments. Furthermore, the I and
Canadian departments are based on much smaller samples,
which makes these comparisons subject to more volatility.
There was an insufficient number of CE departments reporting
to be able to report any meaningful comparative results.
The U.S. CS data for public institutions indicate that the
larger the department, the more external funding per
capita is received by the department. The effect of size
of the department on research expenditures per capita at
private institutions is hard to assess, because very few
small departments at these institutions provided research
expenditure data this year

COMPUTING RESEARCH NEWS, MAY 2016Vol. 28 / No. 5
cra.org/crn 33
Graduate Student Support (Tables G1-G2; Figures G1-G3)
Table G1 shows the number of graduate students supported
as full-time students as of fall 2015, further categorized as
teaching assistants (TAs), research assistants (RAs), and full-
support fellows. The table also shows the split between those
on institutional vs. external funds. The average number of TAs
on institutional funds in U.S. CS departments increased 31.8
percent this year. Public universities reported a 17.9 percent
Table G1. Graduate Students Supported as Full-Time Students by Department Type
On Institutional Funds On External Funds Total
Department Type
# Dept
Teaching Assistants
Research Assistants
Full-Support Fellows
Teaching Assistants
Research Assistants
Full-Support Fellows
US CS Public 89 3,179.3 40.2% 1,117.5 14.1% 329.5 4.2% 3.3 0.0% 3,075.2 38.9% 206.0 2.6% 7,910.7
US CS Private 31 1,094.3 24.8% 1,140.1 25.8% 236.3 5.4% 15.0 0.3% 1,767.0 40.0% 161.3 3.7% 4,413.9
US CS Total 120 4,273.5 34.7% 2,257.6 18.3% 565.8 4.6% 18.3 0.1% 4,842.2 39.3% 367.3 3.0% 12,324.6
US CE 4 150.0 38.2% 38.0 9.7% 12.0 3.1% 0.0 0.0% 193.0 49.1% 0.0 0.0% 393.0
US I 10 196.5 42.0% 68.0 14.5% 28.5 6.1% 5.0 1.1% 163.0 34.9% 6.5 1.4% 467.5
Canadian 9 323.5 37.7% 92.5 10.8% 51.0 6.0% 40.0 4.7% 326.0 38.0% 24.0 2.8% 857.0
Grand Total 143 4,943.5 35.2% 2,456.1 17.5% 657.3 4.7% 63.3 0.5% 5,524.2 39.3% 397.8 2.8% 14,042.1
Table G2. Fall 2015 Academic-Year Graduate Stipends by Department Type and Support Type
Teaching Assistantships
Percentiles of Department Averages
Department Type # Depts 10th 25th 50th 75th 90th
US CS Public 91 $13,500 $15,321 $17,680 $19,279 $23,000
US CS Private 21 $17,100 $20,500 $22,950 $24,700 $27,600
US CE 6 $15,984 $18,450 $19,185
US Info 10 $17,178 $19,316 $20,636 $22,597 $24,762
Canadian 9 $5,600 $12,639 $17,267
Research Assistantships
Percentiles of Department Averages
Department Type # Depts 10th 25th 50th 75th 90th
US CS Public 90 $14,501 $16,650 $18,122 $20,000 $23,449
US CS Private 29 $19,180 $22,000 $24,300 $26,450 $29,866
US CE 6 $17,317 $18,084 $18,800
US Information 10 $19,224 $19,755 $21,286 $23,861 $25,000
Canadian 8 $9,569 $12,320 $15,750
Full-Support Fellows
Percentiles of Department Averages
Department Type # Depts 10th 25th 50th 75th 90th
US CS Public 58 $16,840 $18,498 $22,000 $25,000 $33,200
US CS Private 27 $20,600 $22,423 $24,700 $28,955 $31,700
US CE 5 $18,000
US Information 4 $25,125
Canadian 4 $18,000

COMPUTING RESEARCH NEWS, MAY 2016Vol. 28 / No. 5
cra.org/crn 34
increase, while the average at private universities more than
doubled. In last year’s report, private universities reported over
a 14.2 percent decrease. It is possible that there were some
inconsistencies between years in departmental reporting. The
average number of TAs at I departments rose 15.2 percent
and the average at Canadian departments rose 64.9 percent.
The small number of I and Canadian departments make these
comparative averages subject to volatility. However, it seems
safe to say that all types of departments increased their
average number of TAs this year. This is consistent with the
undergraduate enrollment increases reported earlier.
Following a year of significant decline at both public and private
universities in the average number of RAs on institutional
funding, this average more than doubled this year at U.S. public
universities, and nearly tripled at U.S. private universities. The
number of RAs on external funding decreased by 14.6 percent in
U.S. CS departments at public universities, but increased by 39.7
percent in departments at private universities. For the second
year in a row, we see both public and private institutions
experiencing just the reverse of what was experienced in the
previous year’s report. The average number of full-support
fellows on both internal and external funds declined in U.S. CS
departments at both public and private universities.
Table G2 shows the distribution of stipends for TAs, RAs, and
full-support fellows. U.S. CS data are further broken down
in this table by public and private institution. Figures G1-G3
further break down the U.S. CS data by size of department and
by geographic location of the university.
The median TA salaries at U.S. CS departments increased 1.2
percent at public universities and increased 2.6 percent at private
universities. Median salaries of RAs were essentially unchanged
at public universities but rose 5.9 percent at private universities.
For full support fellows, median salaries rose 4.1 percent at
U.S. public universities but declined 13.9 percent at U.S. private
universities. Last year, we reported a large increase in the median
salary of full support fellows at private universities, so there may
be an error in the data provided to us in one of the years. Through
further analysis, we also observed that those departments
from private institutions that reported in this year’s survey
but not last year’s typically had lower than average stipends.
Larger departments at U.S. public universities tend to offer higher
stipends to both TAs and RAs than do smaller departments, and
private universities tend to offer higher stipends to all categories
of grad students than do public universities. As was the case
last year, departments located in larger population centers also
tend to pay higher stipends to TAs; the effect of locale on RA
stipends was less clear this year for both publics and privates,
and the data for full-support fellows exhibits no clear trend
relative to locale at public universities.
Figure G1. Teaching Assistantship Stipends
CRA Taulbee Survey 2015

COMPUTING RESEARCH NEWS, MAY 2016Vol. 28 / No. 5
cra.org/crn 35
Figure G3. Full Support Fellows Stipends
CRA Taulbee Survey 2015
Figure G2. Research Assistantship Stipends
CRA Taulbee Survey 2015

COMPUTING RESEARCH NEWS, MAY 2016Vol. 28 / No. 5
cra.org/crn 36
Faculty Salaries (Tables S1-S21; Figures S1-S9)
Each department was asked to report individual (but
anonymous) faculty salaries if possible; otherwise, the
department was requested to provide the mean salary for
each rank (full, associate, and assistant professors and
non-tenure-track teaching faculty, research faculty, and
post-doctorates) and the number of persons at each rank.
The salaries are those in effect on January 1, 2016. For U.S.
departments, nine-month salaries are reported in U.S. dollars.
For Canadian departments, twelve-month salaries are reported
in Canadian dollars. Respondents were asked to include salary
supplements such as salary monies from endowed positions.
U.S. CS data are reported in Tables S1-S16 and in the box and
whiskers diagrams. Data for CE, I, Canadian and new Ph.D.s
are reported in Tables S17-S20. The tables and diagrams
contain distributional data (first decile, quartiles, and ninth
decile) computed from the department averages only. Thus,
for example, a table row labeled “50” or the median line in a
Table S1. Nine-month Salaries, 132 Responses of 190 US CS Departments, Percentiles from Department Averages
Full Professor Associate Assistant Non-Tenure Track
In rank 16+ yrs
In rank 8-15 yrs
In rank 0-7 years
All years in rank
In rank 8+ years
In rank 0-7 years
All years in rank
Teach Research Postdoc
Depts 101 108 111 128 98 113 125 128 88 47 44
Indiv 552 547 633 1,812 401 603 1,064 792 627 262 353
10 $127,800 $123,346 $115,893 $127,969 $97,666 $98,365 $99,173 $88,788 $63,823 $58,466 $40,887
25 $139,693 $139,661 $127,784 $137,653 $102,059 $105,432 $105,682 $93,277 $68,482 $73,694 $47,563
50 $165,667 $158,109 $141,273 $156,016 $110,180 $113,873 $111,670 $99,115 $75,712 $85,900 $54,155
75 $182,708 $174,541 $157,496 $168,839 $120,141 $120,933 $121,010 $104,754 $88,976 $117,996 $60,764
90 $200,281 $195,062 $184,685 $186,073 $128,277 $130,188 $130,058 $111,231 $103,485 $145,329 $67,908
Table S2. Nine-month Salaries, 97 Responses of 137 US CS Public (All Public), Percentiles from Department Averages
Full Professor Associate Assistant Non-Tenure Track
In rank 16+ yrs
In rank 8-15 yrs
In rank 0-7 years
All years in rank
In rank 8+ years
In rank 0-7 years
All years in rank
Teach Research Postdoc
Depts 78 84 86 95 78 89 93 94 62 34 32
Indiv 401 418 465 1,319 308 478 810 559 394 179 208
10 $127,613 $120,324 $114,731 $123,307 $97,610 $97,372 $98,327 $87,745 $60,400 $57,891 $40,299
25 $137,670 $138,816 $124,300 $134,450 $101,876 $103,687 $104,132 $91,954 $66,553 $70,892 $48,195
50 $156,408 $151,552 $140,072 $152,687 $109,037 $112,446 $110,450 $97,599 $72,949 $79,852 $53,619
75 $176,766 $171,136 $153,002 $163,135 $117,731 $119,834 $117,898 $102,351 $79,653 $102,788 $57,828
90 $189,531 $183,944 $171,781 $170,844 $126,448 $125,831 $128,270 $105,981 $90,444 $119,000 $62,520
Table S3. Nine-month Salaries, 34 Responses of 53 US CS Private (All Private), Percentiles from Department Averages
Full Professor Associate Assistant Non-Tenure Track
In rank 16+ yrs
In rank 8-15 yrs
In rank 0-7 years
All years in rank
In rank 8+ years
In rank 0-7 years
All years in rank
Teach Research Postdoc
Depts 23 24 25 33 20 24 32 34 26 13 12
Indiv 151 129 168 493 93 125 254 233 233 83 145
10 $134,248 $132,601 $127,788 $130,980 $101,060 $106,347 $103,922 $95,740 $73,356 $63,857 $42,977
25 $170,595 $148,611 $138,375 $144,992 $106,068 $112,244 $110,979 $98,504 $78,930 $84,027 $45,746
50 $183,615 $176,810 $160,098 $176,399 $115,907 $119,881 $119,338 $106,250 $89,816 $127,260 $59,095
75 $204,272 $197,763 $187,065 $196,001 $126,712 $130,880 $129,841 $111,785 $100,809 $144,008 $67,769
90 $225,246 $220,428 $197,740 $212,554 $132,831 $142,207 $140,785 $120,443 $111,360 $153,189 $68,289

COMPUTING RESEARCH NEWS, MAY 2016Vol. 28 / No. 5
cra.org/crn 37
diagram is the median of the averages for the departments
that reported within the stratum (the number of such
departments reporting is shown in the “depts” row). It
therefore is not a true median of all of the salaries.
We also report salary data for senior faculty based on time
in rank, for more meaningful comparison of individual or
departmental faculty salaries with national averages. We report
associate professor salaries for time in rank of 7 years or less,
and of more than 7 years. For full professors, we report time in
rank of 7 years or less, 8 to 15 years, and more than 15 years.
Those departments reporting salary data were provided a
summary report in December 2015. Those departments that
provided individual salaries were additionally provided more
comprehensive distributional information based on these
Table S4. Nine-month Salaries, 26 Responses of US CS Public With <=15 Tenure-Track Faculty, Percentiles from Department Averages
Full Professor Associate Assistant Non-Tenure Track
In rank 16+ yrs
In rank 8-15 yrs
In rank 0-7 years
All years in rank
In rank 8+ years
In rank 0-7 years
All years in rank
Teach Research Postdoc
Depts 13 15 19 24 16 20 23 23 9 2 1
Indiv 34 28 46 117 48 65 127 68 32
10 $108,250 $108,843 $111,958 $109,239 $98,432 $94,551 $97,580 $84,614
25 $127,800 $119,026 $117,356 $124,349 $101,462 $99,661 $101,061 $87,429 $59,250
50 $135,605 $142,258 $125,000 $133,036 $106,447 $103,883 $104,132 $92,000 $68,111
75 $153,351 $150,076 $133,277 $146,318 $120,090 $114,540 $110,989 $96,000 $72,897
90 $156,892 $166,403 $144,174 $155,169 $130,299 $120,857 $122,635 $102,067
Table S5. Nine-month Salaries, 29 Responses of US CS Public With 10 < Tenure-Track Faculty <=20, Percentiles from Department Averages
Full Professor Associate Assistant Non-Tenure Track
In rank 16+ yrs
In rank 8-15 yrs
In rank 0-7 years
All years in rank
In rank 8+ years
In rank 0-7 years
All years in rank
Teach Research Postdoc
Depts 18 20 22 28 22 25 28 28 14 2 3
Indiv 52 64 61 197 64 91 170 84 41
10 $113,805 $117,749 $114,437 $118,603 $96,531 $95,094 $97,031 $84,983 $58,271
25 $130,030 $120,809 $116,990 $129,233 $98,721 $98,645 $99,636 $89,865 $64,067
50 $138,695 $137,726 $126,787 $136,255 $102,479 $103,687 $104,015 $92,103 $66,766
75 $152,642 $150,218 $141,247 $149,002 $109,209 $114,343 $108,871 $96,370 $71,441
90 $168,639 $160,163 $155,475 $156,364 $118,881 $119,052 $121,630 $102,646 $74,242
Table S6. Nine-month Salaries, 26 Responses of US CS Public With 15 < Tenure-Track Faculty <=25, Percentiles from Department Averages
Full Professor Associate Assistant Non-Tenure Track
In rank 16+ yrs
In rank 8-15 yrs
In rank 0-7 years
All years in rank
In rank 8+ years
In rank 0-7 years
All years in rank
Teach Research Postdoc
Depts 21 24 24 26 22 24 25 26 18 8 7
Indiv 72 94 103 280 59 95 162 95 65 21 18
10 $113,879 $121,511 $113,579 $123,116 $92,758 $95,773 $96,815 $87,723 $63,055
25 $134,062 $130,580 $117,585 $131,492 $98,181 $100,357 $103,630 $90,325 $64,910 $65,520 $40,000
50 $139,693 $147,626 $131,414 $144,290 $102,994 $109,654 $108,198 $94,968 $68,263 $78,358 $44,592
75 $166,663 $162,208 $151,308 $156,578 $111,157 $114,328 $111,368 $101,050 $74,134 $86,848 $50,991
90 $187,038 $173,539 $160,131 $166,602 $113,498 $117,740 $115,449 $105,129 $77,673

COMPUTING RESEARCH NEWS, MAY 2016Vol. 28 / No. 5
cra.org/crn 38
individual salaries. This year, 75 percent of those reporting
salary data provided salaries at the individual level.
The remainder of this section updates the basic report
provided in December to all departments that provided salary
data. It reflects salary data received since the deadline for
that report.
Salaries at private institutions tend to be higher than those at
public institutions for all faculty types (Tables S2 and S3). This
pattern is consistent with observations in previous years.
Viewed relative to faculty size, salaries at each rank tend to be
higher for larger departments at both public (Tables S4-S8) and
private (Tables S9-S11) institutions. At public institutions, this
Table S7. Nine-month Salaries, 29 Responses of US CS Public With 20 < Tenure-Track Faculty <=35, Percentiles from Department Averages
Full Professor Associate Assistant Non-Tenure Track
In rank 16+ yrs
In rank 8-15 yrs
In rank 0-7 years
All years in rank
In rank 8+ years
In rank 0-7 years
All years in rank
Teach Research Postdoc
Depts 28 29 27 29 26 28 28 29 20 14 10
Indiv 122 130 123 380 97 123 220 154 105 41 54
10 $128,526 $125,310 $117,335 $131,066 $98,694 $99,059 $102,295 $88,754 $63,192 $49,656 $39,499
25 $136,063 $138,963 $131,414 $143,686 $103,235 $106,733 $106,492 $92,916 $66,127 $69,800 $45,414
50 $151,436 $154,458 $146,973 $155,313 $110,778 $112,468 $110,459 $98,901 $71,504 $78,358 $49,979
75 $175,692 $172,257 $159,210 $163,278 $115,342 $116,782 $112,863 $101,275 $78,491 $90,344 $56,517
90 $180,818 $185,587 $179,389 $174,172 $121,077 $122,594 $121,250 $105,249 $86,872 $113,546 $58,046
Table S8. Nine-month Salaries, 33 Responses of US CS Public With Tenure-Track Faculty >30, Percentiles from Department Averages
Full Professor Associate Assistant Non-Tenure Track
In rank 16+ yrs
In rank 8-15 yrs
In rank 0-7 years
All years in rank
In rank 8+ years
In rank 0-7 years
All years in rank
Teach Research Postdoc
Depts 32 33 32 33 28 33 33 33 28 20 21
Indiv 235 245 279 774 144 259 405 308 260 139 174
10 $142,059 $142,346 $128,176 $145,501 $101,598 $107,311 $107,455 $95,789 $62,722 $66,617 $46,299
25 $153,427 $150,878 $134,231 $155,232 $106,838 $112,270 $111,548 $98,749 $70,165 $74,290 $50,750
50 $169,128 $168,686 $147,445 $159,459 $111,501 $119,070 $115,427 $101,275 $77,691 $90,082 $53,871
75 $180,641 $174,983 $155,873 $167,028 $121,737 $123,002 $125,969 $104,102 $87,538 $106,930 $58,510
90 $199,053 $188,554 $164,478 $179,040 $131,046 $130,188 $130,182 $107,451 $105,923 $128,138 $66,333
Table S9. Nine-month Salaries, 15 Responses of US CS Private With <=20 Tenure-Track Faculty, Percentiles from Department Averages
Full Professor Associate Assistant Non-Tenure Track
In rank 16+ yrs
In rank 8-15 yrs
In rank 0-7 years
All years in rank
In rank 8+ years
In rank 0-7 years
All years in rank
Teach Research Postdoc
Depts 7 8 9 14 8 9 14 15 11 5 4
Indiv 30 28 32 103 17 26 59 59 40 9 20
10 $128,860 $102,083 $95,491 $70,792
25 $145,034 $133,070 $128,203 $136,246 $104,441 $112,149 $111,305 $99,849 $74,935
50 $171,918 $170,798 $153,733 $169,218 $112,124 $118,828 $117,265 $104,099 $79,977 $127,260 $54,844
75 $178,142 $201,411 $186,000 $195,006 $126,000 $129,274 $128,410 $110,909 $94,960
90 $214,671 $137,202 $116,595 $102,315

COMPUTING RESEARCH NEWS, MAY 2016Vol. 28 / No. 5
cra.org/crn 39
Table S10. Nine-month Salaries, 15 Responses of US CS Private With 15 < Tenure-Track Faculty <=30, Percentiles from Department Averages
Full Professor Associate Assistant Non-Tenure Track
In rank 16+ yrs
In rank 8-15 yrs
In rank 0-7 years
All years in rank
In rank 8+ years
In rank 0-7 years
All years in rank
Teach Research Postdoc
Depts 10 12 12 15 8 10 14 15 10 5 6
Indiv 41 57 53 175 22 34 65 80 53 15 43
10 $170,725 $136,154 $129,992 $144,694 $110,111 $107,575 $97,885 $74,614
25 $176,896 $148,611 $138,449 $160,780 $102,914 $112,826 $110,825 $98,804 $82,766
50 $185,258 $174,443 $169,165 $173,062 $112,124 $119,101 $116,245 $104,156 $92,547 $84,027 $50,523
75 $197,301 $194,918 $190,024 $185,675 $119,424 $128,993 $126,345 $109,165 $101,820
90 $226,239 $212,690 $211,587 $207,006 $134,050 $129,283 $116,595 $118,988
Table S11. Nine-month Salaries, 19 Responses of US CS Private With Tenure-Track Faculty >20, Percentiles from Department Averages
Full Professor Associate Assistant Non-Tenure Track
In rank 16+ yrs
In rank 8-15 yrs
In rank 0-7 years
All years in rank
In rank 8+ years
In rank 0-7 years
All years in rank
Teach Research Postdoc
Depts 16 16 16 19 12 15 18 19 15 8 8
Indiv 121 101 136 390 76 99 195 174 193 74 125
10 $160,103 $141,437 $132,928 $138,017 $103,431 $106,222 $108,624 $96,324 $77,114
25 $183,336 $158,902 $144,971 $163,550 $110,798 $113,376 $111,493 $98,182 $85,646 $99,048 $45,746
50 $198,718 $176,810 $165,655 $177,857 $119,130 $120,933 $122,657 $108,270 $93,486 $124,970 $65,316
75 $218,484 $193,921 $187,496 $194,751 $128,083 $134,907 $133,728 $114,676 $102,066 $144,834 $68,080
90 $227,064 $213,709 $193,554 $205,965 $132,981 $142,009 $140,875 $122,223 $112,131
Table S12. Nine-month Salaries, 37 Responses of US CS Public In Large City or Suburbs, Percentiles from Department Averages
Full Professor Associate Assistant Non-Tenure Track
In rank 16+ yrs
In rank 8-15 yrs
In rank 0-7 years
All years in rank
In rank 8+ years
In rank 0-7 years
All years in rank
Teach Research Postdoc
Depts 31 32 35 36 29 36 36 36 24 16 12
Indiv 159 160 206 535 129 211 342 248 187 110 99
10 $134,062 $137,652 $115,749 $130,626 $95,949 $101,456 $102,034 $91,690 $64,042 $63,863 $40,299
25 $142,055 $142,877 $126,061 $138,984 $102,209 $107,302 $107,083 $95,521 $68,106 $73,868 $48,118
50 $163,506 $152,668 $134,118 $155,272 $111,404 $113,677 $111,924 $100,349 $72,337 $99,612 $52,381
75 $176,641 $170,057 $150,108 $161,221 $120,321 $119,335 $118,191 $102,810 $81,040 $117,539 $56,333
90 $198,863 $184,096 $156,387 $169,206 $129,906 $127,069 $128,534 $106,287 $90,361 $141,344 $58,361

COMPUTING RESEARCH NEWS, MAY 2016Vol. 28 / No. 5
cra.org/crn 40
Table S13. Nine-month Salaries, 23 Responses of US CS Public In Midsize City or Suburbs, Percentiles from Department Averages
Full Professor Associate Assistant Non-Tenure Track
In rank 16+ yrs
In rank 8-15 yrs
In rank 0-7 years
All years in rank
In rank 8+ years
In rank 0-7 years
All years in rank
Teach Research Postdoc
Depts 18 20 18 21 19 20 21 21 12 5 6
Indiv 107 114 130 362 57 99 166 122 79 12 25
10 $121,411 $120,148 $118,852 $130,087 $95,736 $97,078 $97,482 $88,196 $65,430
25 $137,661 $144,544 $129,063 $145,133 $99,975 $108,448 $108,198 $92,203 $67,360
50 $153,868 $158,368 $146,233 $153,878 $106,524 $114,737 $112,241 $98,906 $70,801 $77,400 $52,862
75 $181,186 $172,303 $152,459 $166,353 $115,251 $121,045 $120,016 $104,712 $78,906
90 $192,830 $176,415 $158,338 $168,700 $121,653 $130,593 $130,350 $113,970 $104,311
Table S14. Nine-month Salaries, 36 Responses of US CS Public in Small City, Town, or Rural, Percentiles from Department Averages
Full Professor Associate Assistant Non-Tenure Track
In rank 16+ yrs
In rank 8-15 yrs
In rank 0-7 years
All years in rank
In rank 8+ years
In rank 0-7 years
All years in rank
Teach Research Postdoc
Depts 26 29 31 35 27 30 33 34 24 12 14
Indiv 117 135 126 392 109 161 282 176 120 55 84
10 $120,840 $119,382 $115,098 $118,397 $98,269 $97,168 $98,327 $87,380 $57,688 $50,122 $46,774
25 $132,372 $130,450 $120,745 $130,626 $101,734 $100,820 $102,327 $90,284 $64,537 $69,412 $49,139
50 $155,799 $149,000 $140,392 $145,458 $105,597 $105,515 $105,682 $94,081 $73,477 $78,358 $54,345
75 $173,939 $170,871 $157,528 $162,012 $117,468 $116,745 $110,468 $99,544 $78,556 $87,381 $58,298
90 $180,426 $186,292 $174,592 $175,541 $124,680 $121,852 $121,024 $104,131 $86,632 $94,878 $62,418
Table S15. Nine-month Salaries, 23 Responses of US CS Private in Large City or Suburbs, Percentiles from Department Averages
Full Professor Associate Assistant Non-Tenure Track
In rank 16+ yrs
In rank 8-15 yrs
In rank 0-7 years
All years in rank
In rank 8+ years
In rank 0-7 years
All years in rank
Teach Research Postdoc
Depts 16 16 17 23 14 16 21 23 18 10 8
Indiv 97 84 128 341 82 95 203 176 188 69 98
10 $127,740 $131,859 $128,441 $130,980 $103,510 $104,876 $103,634 $95,624 $71,517 $77,100
25 $157,728 $133,725 $138,375 $144,744 $107,846 $109,420 $111,007 $98,553 $78,930 $91,155 $43,112
50 $186,531 $158,479 $156,680 $169,815 $118,249 $119,542 $119,847 $104,156 $86,138 $129,426 $59,095
75 $200,105 $194,918 $188,788 $193,309 $126,269 $129,956 $129,620 $114,676 $99,097 $142,356 $65,673
90 $214,539 $213,709 $197,160 $212,651 $127,822 $140,065 $140,451 $121,783 $104,465 $149,269

COMPUTING RESEARCH NEWS, MAY 2016Vol. 28 / No. 5
cra.org/crn 41
Table S16. Nine-month Salaries, 11 Responses of US CS Private in Other than Large City, Percentiles from Department Averages
Full Professor Associate Assistant Non-Tenure Track
In rank 16+ yrs
In rank 8-15 yrs
In rank 0-7 years
All years in rank
In rank 8+ years
In rank 0-7 years
All years in rank
Teach Research Postdoc
Depts 7 8 8 10 6 8 11 11 8 3 4
Indiv 54 45 40 152 11 30 51 57 45 0 47
10 $137,109 $110,763 $98,160
25 $182,089 $172,562 $154,957 $176,763 $117,904 $113,252 $100,860 $87,307
50 $183,615 $188,938 $167,997 $184,168 $115,070 $119,881 $118,828 $106,300 $95,192 $61,380
75 $221,656 $203,481 $186,266 $197,025 $135,130 $127,444 $109,035 $104,583
90 $205,464 $141,000 $115,339
Table S17. Nine-month Salaries, 7 Responses of 32 US Computer Engineering Departments, Percentiles from Department Averages
Full Professor Associate Assistant Non-Tenure Track
In rank 16+ yrs
In rank 8-15 yrs
In rank 0-7 years
All years in rank
In rank 8+ years
In rank 0-7 years
All years in rank
Teach Research Postdoc
Depts 4 5 5 7 4 5 7 6 4 2 1
Indiv 11 13 19 65 7 24 44 19 11
10
25 $126,102 $99,212
50 $154,343 $128,200 $124,550 $138,820 $100,334 $109,836 $106,119 $97,139 $78,085
75 $180,557 $116,869
90
Table S18. Nine-month Salaries, 12 Responses of 20 US Information Departments, Percentiles from Department Averages
Full Professor Associate Assistant Non-Tenure Track
In rank 16+ yrs
In rank 8-15 yrs
In rank 0-7 years
All years in rank
In rank 8+ years
In rank 0-7 years
All years in rank
Teach Research Postdoc
Depts 9 11 12 13 11 13 13 13 9 5 3
Indiv 33 43 73 149 63 83 147 109 108 22
10 $130,924 $119,152 $123,471 $102,066 $93,343 $98,499 $83,529
25 $136,961 $134,407 $130,409 $137,063 $108,988 $109,006 $108,333 $88,883 $67,568
50 $159,849 $145,229 $148,620 $155,804 $115,226 $115,157 $116,619 $97,146 $88,746 $93,708
75 $169,272 $178,095 $158,765 $166,046 $121,109 $119,975 $121,548 $101,815 $95,479
90 $182,795 $194,153 $181,710 $146,550 $129,716 $132,923 $105,429

COMPUTING RESEARCH NEWS, MAY 2016Vol. 28 / No. 5
cra.org/crn 42
Table S19. Twelve-month Salaries, 10 Responses of 30 Canadian Departments, Percentiles from Department Averages
Full Professor Associate Assistant Non-Tenure Track
In rank 16+ yrs
In rank 8-15 yrs
In rank 0-7 years
All years in rank
In rank 8+ years
In rank 0-7 years
All years in rank
Teach Research Postdoc
Depts 10 9 9 10 10 9 10 10 8 4 6
Indiv 51 58 68 177 70 42 112 46 65 13 58
10 $158,083 $146,713 $125,676 $123,851 $93,381
25 $164,468 $158,978 $135,954 $151,230 $133,740 $116,066 $125,697 $98,736 $98,125
50 $188,500 $174,726 $158,521 $176,500 $141,218 $125,060 $137,983 $110,608 $110,268 $79,525 $48,350
75 $208,988 $188,692 $182,037 $190,438 $152,522 $144,913 $148,666 $120,402 $118,480
90 $224,519 $192,707 $166,386 $163,029 $124,987
Table S20. Nine-month Salaries for New PhDs (Twelve-month for Canadians)
US (CS, CE, and Info Combined) Canadian
Tenure-Track
Non-ten Teaching
Non-ten Research
Postdoc Tenure-Track
Non-ten Teaching
Non-ten Research
Postdoc
Depts 63 21 7 24 5 1 0 1
Indiv 117 27 14 80 11
10 $89,750 $63,184 $42,450
25 $94,750 $67,500 $64,579 $46,818
50 $98,500 $80,000 $64,579 $54,410 $95,250
75 $104,875 $87,250 $68,750 $67,692
90 $111,667 $94,340 $68,000
Table S21. Change in Salary Median for Departments that Reported in Both 2014 and 2015
U.S. CS U.S. CE U.S. I Canadian
Departments 117 6 10 8
Full Profs 4.2% 9.4% 9.8% 0.2%
Assoc. Profs. 1.7% 6.2% 6.4% 1.7%
Asst. Profs. 3.8% 1.7% 1.7% -1.2%
Non-ten-track teaching faculty 4.3% -21.3% 11.1% 5.5%
Research faculty -3.6% -21.7% 38.6% -2.9%
Post doctorates 2.4% -5.7% -5.8%

COMPUTING RESEARCH NEWS, MAY 2016Vol. 28 / No. 5
cra.org/crn 43
also is consistent with the pattern in previous years.
At private institutions last year, senior faculty salaries at
larger departments did not tend to be higher than those at
smaller departments.
Viewed relative to type of locale, public institution salaries
appear to be generally lower in smaller locales for assistant
professors and early stage associate professors (Tables
S12-S14), while private institution salaries exhibit no consistent
pattern relative to type of locale (Tables S15-S16). These
observations coincide with those in previous years.
When analyzing the magnitude of faculty salary changes from
one year to the next, we use only those departments that
reported both years; otherwise, the departments that reported
during only one year can skew the comparison. Because some
departments that reported both years provided only aggregate
salaries for their full and associate professors during one
year and in the other year reported them by years in rank, we
only report salary changes for all full professors and for all
associate professors in the year-to-year comparison. Table S21
shows, by type of faculty and type of department, the change
in the median of the average salaries from departments
that reported both years (the number of departments being
compared is indicated in the first row of each column). Using
the cell showing full professors at U.S. CS departments as an
example, the table indicates that the median of the 117 average
salaries for full professors was 4.2 percent higher in 2015 than
was the median of the average full professor salaries in 2014
from these same 117 departments.
When interpreting these changes, it is important to remember
the effect that promotions have on the departmental data
from one year to the next, since individual faculty members
move from one rank to another. Thus, a department with a
small number of faculty members in a particular rank can
have its average salary in that rank change appreciably (in
either direction) by a single promotion to or from that rank.
Departures via resignation or retirement also impact these
figures, particularly in the non-tenure-track categories.
Because of the small number of Canadian and Computer
Engineering departments reporting, the values in those
columns are considerably more volatile.
For new Ph.D.s in tenure-track positions at U.S. computer
science, computer engineering, and I-school departments
(Table S20) the median of the averages was $98,500, an
increase of 3.5 percent vs. last year. This year there is a
sufficient number of Canadian institutions to report the median
of the averages, but in 2014 none were reported, so year-to-
year comparisons cannot be made.
Figure S1. US CS Department Average Salary, Full Professor in Rank 16+ Years
CRA Taulbee Survey 2015

COMPUTING RESEARCH NEWS, MAY 2016Vol. 28 / No. 5
cra.org/crn 44
Figure S2. US CS Department Average Salary, Full Professor in Rank 8-15 Years
CRA Taulbee Survey 2015
Figure S3. US CS Department Average Salary, Full Professor in Rank 0-7 Years
CRA Taulbee Survey 2015

COMPUTING RESEARCH NEWS, MAY 2016Vol. 28 / No. 5
cra.org/crn 45
Figure S4. US CS Department Average Salary, Associate Professor in Rank 8+ Years
CRA Taulbee Survey 2015
Figure S5. US CS Department Average Salary, Associate Professor in Rank 0-7 Years
CRA Taulbee Survey 2015

COMPUTING RESEARCH NEWS, MAY 2016Vol. 28 / No. 5
cra.org/crn 46
Figure S6. US CS Department Average Salary, Assistant Professor
CRA Taulbee Survey 2015
Figure S7. US CS Department Average Salary, Non-Tenure Track Teaching Faculty
CRA Taulbee Survey 2015
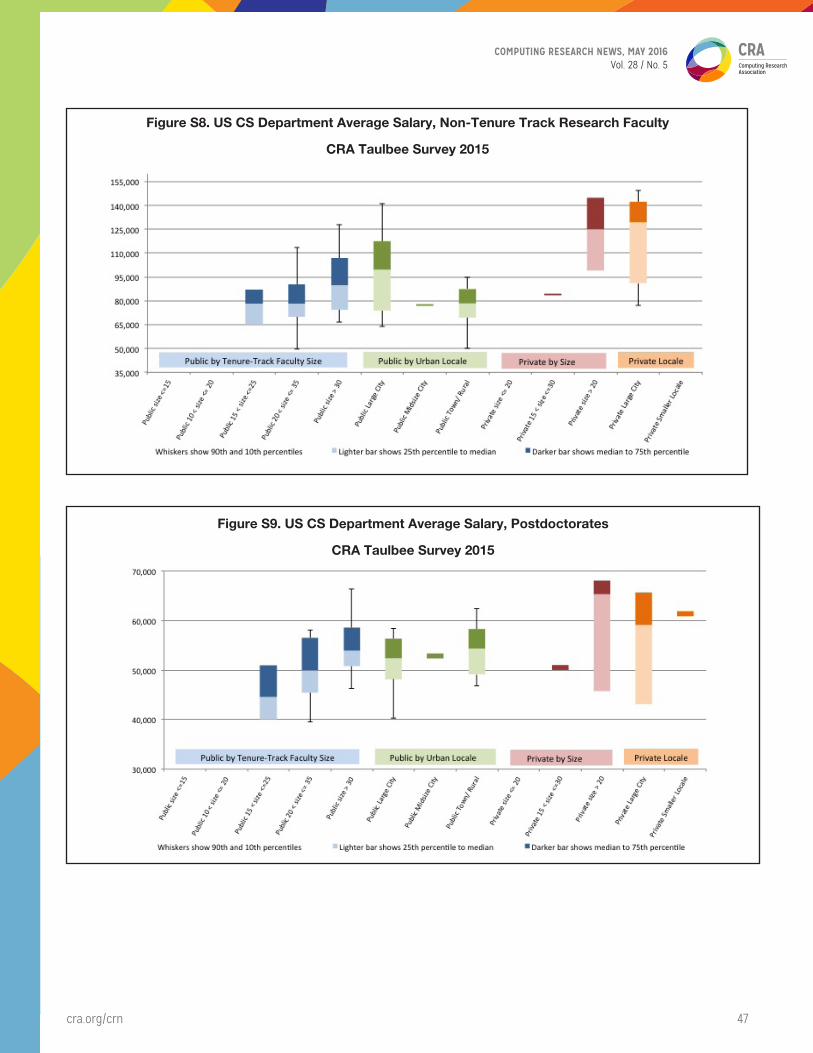
COMPUTING RESEARCH NEWS, MAY 2016Vol. 28 / No. 5
cra.org/crn 47
Figure S8. US CS Department Average Salary, Non-Tenure Track Research Faculty
CRA Taulbee Survey 2015
Figure S9. US CS Department Average Salary, Postdoctorates
CRA Taulbee Survey 2015

COMPUTING RESEARCH NEWS, MAY 2016Vol. 28 / No. 5
cra.org/crn 48
Department Profiles
Every three years, the Taulbee Survey collects data about
elements of departmental activities that are not expected
to change much from year to year. Included are data about
teaching loads, sources of external funding, methods of
recruiting graduate students, department support staff, and
space. The most recent data about these activities were
reported in the 2012 Taulbee Survey. The results of that survey
are available on the CRA web site at http://cra.org/wp-content/
uploads/2015/01/2012_taulbee_survey.pdf.
Teaching loads (Tables Prof1-Prof4)
Across all departments, the median teaching load in semester
courses per year is 3.0, which has not changed over a long
period of time. This median holds true in all departments
except for U.S. CS private institutions where the median
teaching load is 2.0, unchanged from last reporting. Three
years ago, the medians at U.S. CE and U.S. I departments were
4.0 and 3.5, respectively. Note that the CE and I groups are
small and thus more sensitive to the individual institutions reporting in a given year. (Table Prof1).
Table Prof2 shows whether or not it is possible to increase
or decrease individual teaching loads from the standards,
and Tables Prof 3 and Prof 4 indicate why such adjustments
might be allowed. As has been the case in previous years,
nearly every department allows reductions from the standard
load, with little difference across department types. However,
the reasons for reductions do vary across department
types, with U.S. CS publics generally allowing more possible
factors to reduce teaching load than do U.S. CS privates.
Also as in previous years, about 2/3 of all departments allow
increases, with a greater percentage of publics and Canadian
departments allowing increases as compared with privates
and U.S. I departments. A smaller percentage of departments
(71 percent) allow increases for shifting primary responsibilities
to teaching than did previously (76 percent three years ago and
81 percent six years ago), while a larger percent (29 percent)
allow increases for other reasons than did previously (24
percent three years ago and 19 percent six years ago).
Table Prof1. Official Teaching Load of Tenured and Tenure-Track Faculty
Official Teaching Load* Academic Calendar
Department Type # Dept Minimum Mean Median Maximum # Dept Semester Quarter Other
US CS Public 97 2 3.2 3 9 100 90 10 0
US CS Private 32 1 2.7 2 6 34 27 7 0
US CE 7 2 3.3 3 4 7 6 1 0
US I 10 2 3.2 3 4 11 9 2 0
Canadian 8 3 3.4 3 4 10 8 0 2
Grand Total 154 1 3.1 3 9 162 140 20 2
* Teaching load is given for a semester calendar. Loads for a quarter system were multiplied by 2/3. To convert back to quarter-system equivalent, multiplythese values by 1.5.
Table Prof2. Faculty Load Reductions and Increases
Faculty Load Reduction Possible Faculty Load Increase Possible
Department Type # Dept Yes No # Dept Yes No
US CS Public 101 96.0% 4.0% 97 73.2% 26.8%
US CS Private 33 93.9% 6.1% 30 56.7% 43.3%
US CE 7 100.0% 0.0% 6 50.0% 50.0%
US I 11 90.9% 9.1% 11 54.5% 45.5%
Canadian 9 100.0% 0.0% 8 75.0% 25.0%
Grand Total 161 95.7% 4.3% 152 67.8% 32.2%

COMPUTING RESEARCH NEWS, MAY 2016Vol. 28 / No. 5
cra.org/crn 49
Table Prof3. Types of Load Reductions Possible in Departments Offering Reductions
Department Type # Dept
Special Package for New Faculty
Administrative Duties
Type of Size of Class Taught
Buy-out % of salary
Buy-out fixed amt
Strong Research
InvolvementOther
US CS Public 103 79.6% 84.5% 34.0% 68.9% 12.6% 56.3% 10.7%
US CS Private 38 73.7% 65.8% 18.4% 39.5% 0.0% 28.9% 21.1%
US CE 7 85.7% 85.7% 57.1% 85.7% 0.0% 71.4% 14.3%
US I 12 83.3% 75.0% 16.7% 50.0% 16.7% 33.3% 8.3%
Canadian 12 75.0% 75.0% 8.3% 0.0% 25.0% 58.3% 16.7%
Grand Total 172 78.5% 79.1% 28.5% 57.0% 10.5% 49.4% 13.4%
Table Prof4. Reasons for Increase in Teaching Load in Departments Where Increase is Possible
Department Type # DeptShifting Primary
Responsibilities to Teaching
Other
US CS Public 71 74.6% 25.4%
US CS Private 17 64.7% 35.3%
US CE 3 100.0% 0.0%
US I 6 50.0% 50.0%
Canadian 6 50.0% 50.0%
Grand Total 103 70.9% 29.1%

COMPUTING RESEARCH NEWS, MAY 2016Vol. 28 / No. 5
cra.org/crn 50
Sources of External Funding (Tables R2, R3)
Table R2 shows the distribution of sources of external research
funding, and its historical values over the five three-year
intervals during which we have collected such data. There is
little difference in the distribution in 2015 compared with 2012.
The average research support per department increased four
percent from 2012 to 2015, though this can be highly dependent
on the particular departments responding; there are fewer
departments that provided distributional information this year
than did so in 2012. NSF continues to be the dominant funder
of external research, followed by non-DARPA defense funding
and industry funding.
Table R2. Comparison of US CS External Funding 2003-2015
2003 (126 departments)
2006 (123 departments)
2009 (117 departments)
Total % Fund Total % Fund Total % Fund
NSF $354,451,309 40.7 $255,089,816 43.0 $281,076,341 43.1
DARPA $85,401,891 9.8 $64,191,150 10.8 $38,393,018 5.9
NIH $15,864,767 1.8 $24,880,112 4.2 $33,128,578 5.1
DOE $20,471,676 2.4 $24,391,329 4.1 $17,225,839 2.6
State agencies $24,438,483 2.8 $16,875,578 2.8 $17,861,292 2.7
Industrial sources $70,813,388 8.1 $50,333,039 8.5 $76,464,763 11.7
Other defense $177,357,598 20.4 $97,512,961 16.4 $109,510,806 16.8
Other federal $50,555,980 5.8 $32,388,664 5.5 $27,695,790 4.2
Private foundation $32,977,093 3.8 $10,826,656 1.8 $18,297,020 2.8
IMLS
Other $37,995,002 4.4 $16,996,108 2.9 $32,763,366 5.0
Total $870,327,187 $593,485,413 $652,416,813
Average/Dept $6,907,359 $4,825,085 $5,576,212
2012 (123 departments)
2015 (108 departments)
Total % Fund Total % Fund
NSF $368,922,448 42.2 $342,335,280 42.93
DARPA $52,526,824 6.0 $62,512,155 7.8
NIH $46,533,387 5.3 $35,716,475 4.5
DOE $30,149,692 3.4 $24,482,764 3.1
State agencies $17,725,647 2.0 $17,648,938 2.2
Industrial sources $89,149,734 10.2 $80,716,010 10.1
Other defense $173,606,289 19.8 $148,555,418 18.6
Other federal $37,088,925 4.2 $27,492,424 3.4
Private foundation $23,600,989 2.7 $33,488,855 4.2
IMLS $288,059 0.0 $79,692 0.0
Other $35,190,510 4.0 $24,440,153 3.1
Total $874,782,504 $797,468,164
Average/Dept $7,112,053 $7,383,964

COMPUTING RESEARCH NEWS, MAY 2016Vol. 28 / No. 5
cra.org/crn 51
Table R3b. External Funding Breakdown of 26 US CS Private Departments
Funding Source Sum % of Fund
Percentile of Department Funding From Source
10th 25th 50th 75th 90th
NSF $99,368,786 34.3% $574,896 $936,966 $2,481,040 $4,514,537 $7,058,936
DARPA $34,570,641 11.9% $2,203 $73,637 $704,193 $1,647,762 $10,643,290
NIH $17,031,220 5.9% $2,693 $101,774 $365,100 $819,699 $4,493,789
DOE $9,351,735 3.2% $0 $10,169 $103,343 $1,793,622 $2,286,313
State agencies $1,108,128 0.4% $33,628
Industry $37,848,688 13.1% $24,577 $142,934 $413,457 $1,399,150 $6,832,107
Other defense $58,979,946 20.4% $2,889 $321,205 $537,472 $1,908,595 $6,293,922
Other federal $10,633,812 3.7% $0 $7,227 $144,700 $456,389 $6,177,809
Pvt foundation $15,339,546 5.3% $0 $22,033 $204,153 $733,146 $4,861,686
IMLS 0.0% $0
Other $5,217,082 1.8% $0 $45,844 $146,267 $264,218 $1,304,558
Total $289,449,584
Table R3a. External Funding Breakdown of 82 US CS Public Departments
Funding Source Sum % of Fund
Percentile of Department Funding From Source
10th 25th 50th 75th 90th
NSF $242,966,494 47.8% $236,598 $807,371 $1,873,563 $4,139,278 $7,528,033
DARPA $27,941,514 5.5% $0 $0 $106,518 $508,130 $1,372,342
NIH $18,685,255 3.7% $0 $44,699 $153,330 $492,836 $935,804
DOE $15,131,029 3.0% $0 $18,381 $111,377 $342,787 $965,275
State agencies $16,540,810 3.3% $0 $20,349 $75,143 $287,269 $773,507
Industry $42,867,322 8.4% $1,027 $31,477 $235,546 $700,971 $1,850,347
Other defense $89,575,472 17.6% $14,926 $152,992 $490,387 $1,495,659 $4,164,485
Other federal $16,858,612 3.3% $0 $36,214 $179,238 $485,921 $788,443
Pvt foundation $18,149,309 3.6% $0 $12,073 $55,058 $290,561 $956,803
IMLS $79,692 0.0% $0 $0 $0 $0 $13,129
Other $19,223,071 3.8% $0 $10,217 $98,087 $428,830 $991,198
Total $508,018,580

COMPUTING RESEARCH NEWS, MAY 2016Vol. 28 / No. 5
cra.org/crn 52
Table R3d. External Funding Breakdown of 12 US Information Departments
Funding Source Sum % of Fund
Percentile of Department Funding From Source
10th 25th 50th 75th 90th
NSF $15,041,369 39.8% $184,066 $592,400 $1,105,755 $1,894,628 $2,880,258
DARPA $68,521 0.2%
NIH $913,121 2.4% $2,868 $101,604 $287,340
DOE $393,525 1.0% $0 $14,371 $189,577
State agencies $435,770 1.2% $36,801 $76,508 $106,341
Industry $1,847,473 4.9% $26,755 $81,000 $451,829
Other defense $3,895,626 10.3% $9,471 $130,720 $1,076,657
Other federal $2,673,460 7.1% $48,219 $426,797 $1,075,113
Pvt foundation $6,921,585 18.3% $22,272 $83,591 $476,909 $1,066,981 $1,893,206
IMLS $3,632,378 9.6% $153,767 $605,982 $634,559
Other $1,985,199 5.3% $77,603 $195,914 $263,428
Total $37,808,027
Table R3c. External Funding Breakdown of 4 US CE Departments
Funding Source Sum % of Fund
Percentile of Department Funding From Source
10th 25th 50th 75th 90th
NSF $5,058,107 46.9% $1,145,059
DARPA $672,331 6.2% $58,887
NIH $762,610 7.1% $155,391
DOE $2,021,777 18.7%
State agencies $56,866 0.5%
Industry $1,278,417 11.8% $415,004
Other defense $693,296 6.4% $169,981
Other federal $175,710 1.6%
Pvt foundation $17,051 0.2%
IMLS $12,603 0.1%
Other $39,833 0.4%
Total $10,788,601

COMPUTING RESEARCH NEWS, MAY 2016Vol. 28 / No. 5
cra.org/crn 53
Table R3e. External Funding Breakdown of 10 Canadian Departments (in Canadian dollars)
Funding Source Sum % of Fund
Percentile of Department Funding From Source
10th 25th 50th 75th 90th
NSERC $28,200,702 57.9% $117,373 $944,842 $2,560,706 $3,339,499 $8,815,915
DARPA $237,872 0.5%
NIH $179,973 0.4%
DOE 0.0%
State agencies $2,989,517 6.1% $238,332 $381,750 $630,883
Industry $4,275,183 8.8% $376,304
Other defense 0.0%
Other federal $2,791,894 5.7% $28,706 $544,901 $1,094,791
Pvt foundation 0.0%
IMLS 0.0%
Other $10,060,867 20.6% $137,627 $822,517 $1,582,220
Total $48,736,008

COMPUTING RESEARCH NEWS, MAY 2016Vol. 28 / No. 5
cra.org/crn 54
Table Prof7. Median Amounts and Years of Selected Graduate Student Recruitment Incentives
Department Type # Dept Upfront One-Time
Signing BonusStipend
EnhancementsGuaranteed Years
of SupportGuaranteed
Summer SupportPaid Visits to
Campus
US CS Public 103 $5,000 $3,800 4.0 $5,343 $600
US CS Private 38 $3,000 5.0 $7,500 $800
US CE 7
US I 12 4.0 $500
Canadian 12 5.0 $9,000
Grand Total 172 $5,000 $3,800 4.0 $6,000 $600
Table Prof5. Factors Affecting the Amount of a Graduate Student’s Stipend
Department Type # Dept Advance to Next
Stage of Program Years of Service GPA Recruitment Enhancements
Different Stipend Sources Other
US CS Public 103 57.3% 16.5% 7.8% 29.1% 36.9% 10.7%
US CS Private 38 34.2% 21.1% 15.8% 13.2% 26.3% 13.2%
US CE 7 28.6% 14.3% 0.0% 14.3% 28.6% 0.0%
US I 12 50.0% 8.3% 8.3% 8.3% 50.0% 16.7%
Canadian 12 25.0% 16.7% 25.0% 16.7% 66.7% 16.7%
Grand Total 172 48.3% 16.9% 10.5% 22.7% 37.2% 11.6%
Table Prof6. Departments Using Selected Graduate Student Recruitment Incentives
Department Type # Dept Upfront One-Time
Signing BonusStipend
EnhancementsGuaranteed Multi-
Year SupportGuaranteed
Summer SupportPaid Visits to
Campus Other
US CS Public 103 11.7% 20.4% 47.6% 23.3% 34.0% 2.9%
US CS Private 38 7.9% 13.2% 52.6% 23.7% 50.0% 5.3%
US CE 7 0.0% 0.0% 28.6% 14.3% 28.6% 14.3%
US I 12 8.3% 16.7% 58.3% 8.3% 41.7% 8.3%
Canadian 12 33.3% 8.3% 75.0% 25.0% 16.7% 8.3%
Grand Total 172 11.6% 16.9% 50.6% 22.1% 36.6% 4.7%
Other Graduate Student Data (Tables Prof5-Prof7)
Table Prof5 illustrates the factors that are most likely to affect
graduate student stipends. Advancement to the next stage
of study and the source of funding are the most likely factors.
Stipends are considerably less likely than three years ago to
be affected by years of service (17 percent vs 25 percent). Less
drastic drop-offs in likelihood were present in advancement to
the next stage of the program (48 percent vs 52 percent) and
GPA (11 percent vs 13 percent).
Tables Prof6 and Prof7 focus on incentives for recruiting
graduate students. Compared with three years ago, a greater
percentage of departments have one-time signing bonuses
(12 percent vs 6 percent) while a smaller percentage employ
stipend enhancements (17 percent vs 25 percent), guaranteed
multi-year support (51 percent vs 58 percent), and paid visits to
campus (37 percent vs 42 percent).

COMPUTING RESEARCH NEWS, MAY 2016Vol. 28 / No. 5
cra.org/crn 55
Space (Tables Prof8-Prof16)
With the enormous increases in undergraduate enrollments
since the last survey of department profiles, it is of particular
interest to see if space has grown during this time.
Compared with three years ago, median overall department
space has grown by about 6 percent, the same percentage
amount that it grew in the previous three years. Conference
and seminar space grew the most, by 31 percent, while office
and laboratory space grew by 11-16 percent (Table Prof8).
Office space and research lab space grew more at U.S. CS
public departments than at U.S. CS private departments, while
conference and research lab space grew more at privates.
Instructional lab space grew between 22 (privates) and 26
percent (publics) at U.S. CS departments (Tables Prof9
and Prof10).
One-quarter of U.S. CS public departments reported definite
plans to increase space, and one-third of U.S. CS private
departments did likewise (Table Prof14). Both of these fractions
are higher than three years ago, and particularly so for public
departments, where only 9 percent had definite plans to
increase space three years ago.
Table Prof8. Department Space, net square feet, 133 US institutions
Percentiles Total Space Faculty, Staff, and Student Offices
Conference and Seminar Rooms Research Labs Instructional Labs
10 12,240 4,660 542 1,270 891
25 18,744 7,332 1,035 3,048 2,051
50 29,300 12,248 2,108 7,257 3,877
75 49,156 22,115 4,468 12,077 6,978
90 78,157 39,713 7,230 17,997 12,289
Table Prof9. Department Space, net square feet, 89 US CS Public
Percentiles Total Space Faculty, Staff, and Student Offices
Conference and Seminar Rooms Research Labs Instructional Labs
10 11,901 4,864 502 1,717 1,311
25 18,210 6,778 895 3,818 2,351
50 30,000 11,105 1,696 8,735 4,403
75 56,528 23,963 4,010 13,493 7,652
90 79,288 42,377 6,629 18,020 12,895
Table Prof10. Department Space, net square feet, 28 US CS Private
Percentiles Total Space Faculty, Staff, and Student Offices
Conference and Seminar Rooms Research Labs Instructional Labs
10 15,465 5,261 594 1,160 361
25 20,896 10,894 1,246 2,695 1,547
50 27,706 15,363 2,801 6,224 2,512
75 49,219 20,414 4,640 8,849 5,220
90 61,864 33,759 6,419 17,400 9,818

COMPUTING RESEARCH NEWS, MAY 2016Vol. 28 / No. 5
cra.org/crn 56
Table Prof12. Department Space, net square feet, 11 US Information Departments
Percentiles Total Space Faculty, Staff, and Student Offices
Conference and Seminar Rooms Research Labs Instructional Labs
10 15,473 8,037 1,630 287 756
25 24,610 10,353 1,991 1,117 1,013
50 33,548 12,937 2,571 2,312 2,800
75 41,498 22,806 6,315 3,706 5,160
90 46,755 24,100 7,522 4,871 5,969
Table Prof13. Department Space, net square meters, 12 Canadian Departments
Percentiles Total Space Faculty, Staff, and Student Offices
Conference and Seminar Rooms Research Labs Instructional Labs
10 2,136 609 77 424 0
25 3,185 1,333 132 806 433
50 5,819 1,475 306 1,176 939
75 6,732 2,236 431 1,940 1,187
90 7,932 3,418 607 2,118 1,205
Table Prof14. Definite Plans to Gain or Lose Space
Department Type # Dept Gain Space No Change Lose Space
US CS Public 96 25.0 % 72.9.0% 2.1%
US CS Private 30 33.3% 66.7% 0.0%
US CE 6 16.7% 83.3% 0.0%
US I 11 9.1% 90.9% 0.0%
Canadian 10 10.0% 90.0% 0.0%
Grand Total 153 24.2% 74.5% 1.2%
Table Prof11. Department Space, net square feet, 5 US CE Departments
Percentiles Total Space Faculty, Staff, and Student Offices
Conference and Seminar Rooms Research Labs Instructional Labs
10
25 18,625 3,118 1,066 7,021 3,517
50 20,729 8,908 1,437 11,264 3,734
75 50,000 17,500 2,395 15,500 6,000
90

COMPUTING RESEARCH NEWS, MAY 2016Vol. 28 / No. 5
cra.org/crn 57
Table Prof15. Sources of Funding for Additional Space for Departments with Plans to Add
Department Type # Dept
Percent of Departments Using Funds from Source
Institutional Federal State / Provincial Industry Private
US CS Public 24 70.8% 16.7% 37.5% 12.5% 33.3%
US CS Private 10 100.0% 0.0% 0.0% 0.0% 18.2%
US CE 1
US I 1
Canadian 1
Grand Total 37 75.7% 10.8% 27.0% 10.8% 35.1%
Table Prof16. Full Time Staff by Type of Support – All Institutions
Secretarial / Administrative Computer Support Research
Institu-tional
External Support Total Institu-
tionalExternal Support Total Institu-
tionalExternal Support Total
10 2.0 0.0 2.0 1.0 0.0 1.0 0.0 0.0 0.0
25 3.3 0.0 4.0 1.0 0.0 1.0 0.0 0.0 0.0
50 6.0 0.0 6.0 3.0 0.0 3.0 0.0 1.0 1.0
75 11.0 1.0 11.8 5.0 0.3 5.0 1.0 4.0 4.0
90 28.2 3.0 29.6 9.0 2.3 10.2 2.1 11.3 11.6
# Depts 155 73 155 139 59 140 90 77 105
Table Prof17. Full Time Staff by Type of Support – US CS Public
Secretarial / Administrative Computer Support Research
Institu-tional
External Support Total Institu-
tionalExternal Support Total Institu-
tionalExternal Support Total
10 2.0 0.0 2.0 1.0 0.0 1.0 0.0 0.0 0.0
25 3.0 0.0 3.0 1.0 0.0 1.0 0.0 0.0 0.0
50 5.0 0.0 5.2 3.0 0.0 3.0 0.0 0.6 1.0
75 10.1 1.0 11.0 4.9 0.1 5.0 1.0 3.5 3.0
90 21.0 4.4 22.8 7.4 2.8 8.4 2.0 8.6 9.0
# Depts 96 45 96 87 36 87 52 47 61
Departmental Support Staff (Tables Prof17-Prof21)
Tables Prof17-Prof22 show the distribution of staffing levels
based on department type. Compared with three years ago, the
median number of administrative and computer support staff
rose from 5 to 6, and from 2 to 3, respectively. As was the case
three years ago, median levels of administrative staff in U.S. CS
departments are higher at private institutions than at public
institutions, while median levels of computer support staff
are similar at public and private institutions. Higher median
levels are notable in U.S. I programs for both administrative and
computer support staff. This likely is because these units tend
to be schools rather than departments.

COMPUTING RESEARCH NEWS, MAY 2016Vol. 28 / No. 5
cra.org/crn 58
Table Prof18. Full Time Staff by Type of Support – US CS Private
Secretarial / Administrative Computer Support Research
Institu-tional
External Support Total Institu-
tionalExternal Support Total Institu-
tionalExternal Support Total
10 2.0 0.0 2.1 0.2 0.0 0.2 0.0 0.0 0.0
25 4.0 0.0 4.0 1.0 0.0 1.3 0.0 0.4 0.0
50 7.0 0.8 8.0 3.0 0.0 3.0 0.0 2.0 2.0
75 12.0 1.0 13.0 8.0 1.0 7.3 1.1 8.8 5.8
90 29.8 2.5 32.2 13.4 1.9 13.2 4.1 14.5 14.7
# Depts 33 16 33 29 12 30 20 16 24
Table Prof19. Full Time Staff by Type of Support – US CE Departments
Secretarial / Administrative Computer Support Research
Institu-tional
External Support Total Institu-
tionalExternal Support Total Institu-
tionalExternal Support Total
10
25 5.0 5.0
50 7.0 7.0 1.3 1.3 0.0 0.0 0.3
75 8.5 8.5
90
# Depts 5 2 5 4 2 4 3 3 4
Table Prof20. Full Time Staff by Type of Support – US Information Departments
Secretarial / Administrative Computer Support Research
Institu-tional
External Support Total Institu-
tionalExternal Support Total Institu-
tionalExternal Support Total
10 4.7 4.7
25 11.5 0.0 11.5 3.0 3.0 0.0 0.6 0.0
50 19.0 0.0 19.0 4.0 0.0 4.0 0.4 1.5 1.0
75 33.0 0.5 33.0 5.0 5.0 1.0 5.0 4.0
90 44.6 45.1
# Depts 10 5 10 9 4 9 8 6 9
Table Prof21. Full Time Staff by Type of Support – 14 Canadian Departments
Secretarial / Administrative Computer Support Research
Institu-tional
External Support Total Institu-
tionalExternal Support Total Institu-
tionalExternal Support Total
10 3.8 3.8 3.0 3.0
25 4.5 0.0 4.5 4.0 0.0 4.3 0.0 0.0 0.0
50 7.0 0.0 7.0 5.5 0.0 5.5 0.0 0.0 0.0
75 8.0 0.0 10.5 7.8 1.0 7.8 0.0 1.6 2.8
90 20.0 20.0 14.1 16.1
# Depts 11 5 11 10 5 10 7 5 7

COMPUTING RESEARCH NEWS, MAY 2016Vol. 28 / No. 5
cra.org/crn 59
Concluding Observations
The Taulbee Survey clearly documents the continued
undergraduate enrollment boom being seen in U.S. doctoral-
granting computer science programs. It also shows that
departments are adding teaching faculty, TAs and, to a lesser
extent, tenure-track faculty to their rolls. CRA is studying
this enrollment phenomenon in more depth. A special
task force led by Tracy Camp will report later this year on
the results of a more targeted study of the CS enrollment
boom in both doctoral-granting and non-doctoral-granting
departments. Those results should be of interest to all in the
computing community.
Participating Departments
US CS Public (107): Arizona State, Auburn, Clemson, College
of William & Mary, Colorado School of Mines, Colorado State,
Florida International, George Mason, Georgia Tech, Georgia
State, Indiana, Iowa State, Kansas State, Kent State, Michigan
State, Michigan Technological University, Mississippi State,
Missouri Science & Technology, Montana State, Naval
Postgraduate School, New Jersey Institute of Technology,
New Mexico State, North Carolina A&T, North Carolina State,
North Dakota State, Ohio State, Ohio, Oklahoma State, Old
Dominion, Oregon State, Pennsylvania State, Portland State,
Purdue, Rutgers, Southern Illinois, Stony Brook (SUNY), Texas
A&M, Texas Tech, University at Albany, University at Buffalo,
Universities of: Alabama (Birmingham and Tuscaloosa), Arizona,
Arkansas, Arkansas at Little Rock, California (Berkeley, Davis,
Irvine, Riverside, San Diego, Santa Barbara, and Santa Cruz),
Central Florida, Colorado (Boulder), Connecticut , Delaware,
Florida, Georgia , Hawaii, Houston, Illinois (Chicago and Urbana
Champaign), Iowa, Kansas, Kentucky, Louisiana at Lafayette,
Maryland (College Park and Baltimore County), Massachusetts
(Amherst and Boston), Michigan, Minnesota, Mississippi,
Missouri (Columbia), Nebraska (Omaha and Lincoln), Nevada
(Las Vegas and Reno), New Hampshire, New Mexico, North
Carolina (Chapel Hill and Charlotte), North Dakota, North Texas,
Oklahoma, Oregon, Pittsburgh, Rhode Island, South Carolina,
South Florida, Tennessee (Knoxville), Texas (Arlington, Austin,
Dallas, and El Paso), Utah, Vermont, Virginia, Washington,
Wisconsin (Madison and Milwaukee), and Wyoming, Virginia
Tech, Washington State, Wayne State, Western Michigan, and
Wright State.
US CS Private (40): Boston University, Brown, Carnegie
Mellon, Case Western Reserve, Clarkson, Columbia, Cornell,
Dartmouth, DePaul, Drexel, Duke, Emory, Georgetown, Harvard,
Howard, Illinois Institute of Technology, Johns Hopkins,
Lehigh, MIT, New York University, Northeastern, Northwestern,
Nova Southeastern, Polytechnic, Princeton, Rensselaer, Rice,
Rochester Institute of Technology, Stanford, Stevens Institute
of Technology, Toyota Technological Institute at Chicago, Tufts,
Universities of: Chicago, Pennsylvania, Rochester, Southern
California, and Tulsa, Washington in St. Louis, Worcester
Polytechnic Institute, and Yale.
US CE (8): Northeastern, North Carolina State, Universities
of: California (Santa Cruz), Central Florida, Illinois (Urbana
Champaign), New Mexico , and Southern California, and
Virginia Tech.

COMPUTING RESEARCH NEWS, MAY 2016Vol. 28 / No. 5
cra.org/crn 60
US Information (14): Cornell, Drexel, Florida State, Indiana,
Penn State, Syracuse, University at Albany (SUNY), Universities
of: California (Berkeley), Illinois (Urbana Champaign), Maryland
(Baltimore County), Michigan, North Carolina (Chapel Hill),
Pittsburgh, and Washington.
Canadian (12): Concordia, McGill, Simon Fraser, Universities of:
British Columbia, Calgary, Manitoba, New Brunswick, Toronto,
Victoria, Waterloo, and Western Ontario, and York.
1The title of the survey honors the late Orrin E. Taulbee of the University of Pittsburgh, who conducted these surveys for the
Computer Science Board until 1984, with retrospective annual data going back to 1970.
2Information (I) programs included here are Information Science, Information Systems, Information Technology, Informatics, and
related disciplines with a strong computing component. Surveys were sent to CRA members, the CRA Deans group members,
and participants in the iSchools Caucus (www.ischools.org) who met the criteria of granting Ph.D.s and being located in North
America. Other I-programs who meet these criteria and would like to participate in the survey in future years are invited to
contact [email protected] for inclusion.
3Classification of the population of an institution’s locale is in accordance with the Carnegie Classification database. Large cities
are those with population >= 250,000. Mid-size cities have population between 100,000 and 250,000. Town/rural populations are
less than 100,000.
4All faculty tables: The survey makes no distinction between faculty specializing in CS vs. CE programs. Every effort is made to
minimize the inclusion of faculty in electrical engineering who are not computer engineers.