2019 taulbee survey total undergrad cs enrollment rises
TRANSCRIPT

cra.org/crn3 May 2020
This article and the accompanying figures and tables present the results from the 49th annual CRA Taulbee Survey.1 The survey, conducted annually by the Computing Research Association, documents trends in student enrollment, degree production, employment of graduates, and faculty salaries in academic units in the United States and Canada that grant the Ph.D. in computer science (CS), computer engineering (CE), or information (I).2 Most of these academic units are departments, but some are colleges or schools of information or computing. In this report, we will use the term “department” to refer to the unit offering the program.
2019 Taulbee SurveyTotal Undergrad CS Enrollment Rises Again, but with Fewer New Majors; Doctoral Degree Production Recovers From Last Year’s Dip
By Stuart Zweben and Betsy Bizot
CRA gathers survey data during the fall. Responses received by
February 7, 2020 are included in the analysis. The period covered
by the data varies from table to table. Degree production and
enrollment (Ph.D., Master’s, and Bachelor’s) refer to the previous
academic year (2018-19). Data for new students in all categories
refer to the current academic year (2019-20). Projected student
production and information on faculty salaries are also for the
current academic year; salaries are those effective January 1, 2020.
We surveyed a total of 278 Ph.D.-granting departments and
received responses from 181, for an overall response rate of 65
percent. Last year we had the same number of respondents,
but included more departments in our survey and had a 61
percent response rate. The response rates from CE and Canadian
departments in particular continue to be low. The U.S. CS response
rate of 77 percent is, as usual, the highest of all of the categories,
and is higher than last year’s 73 percent and equal to the U.S. CS
response rate of two years ago. Figure 1 shows the history of
the survey’s response rates. Response rates are inexact because
some departments provide only partial data, and some institutions
provide a single joint response for multiple departments. Thus, in
some tables the number of departments shown as reporting will
not equal the overall total number of respondents shown in Figure
1 for that category of department.
To account for the changes in response rate, we will comment
not only on aggregate totals but also on averages per department
reporting or data from those departments that responded to both
2018 and 2019 surveys. This is a more meaningful indication of the
one-year changes affecting the data.
Degree, enrollment, and faculty salary data for the U.S CS
departments are stratified according to: a) whether the institution
is public or private; and b) the tenure-track faculty size of the
reporting department. The faculty size strata deliberately overlap,
so that data from most departments affect multiple strata. This
may be especially useful to departments near the boundary
of one stratum. Salary data is also stratified according to the
population of the locale in which the institution is located.3
These stratifications allow our readers to see multiple views of
important data, and hopefully gain new insights from them. In
addition to tabular presentations of data, we will use “box and
whisker” diagrams to show medians, quartiles, and the range
between the 10th and 90th percentile data points.
We thank all of the respondents to this year’s questionnaire. The
participating departments are listed at the end of this article.
CRA member respondents will again be given the opportunity to
obtain certain survey information for a self-selected peer group.
Instructions for doing this will be emailed to all such departments.

cra.org/crn4 May 2020
2019 Taulbee Survey (continued)
Doctoral Degree Production, Enrollment, and Employment(Tables 1, D1-D10; Figures D1-D6)
Degree ProductionDoctoral degree production increased in 2018-19, recovering to
levels more comparable to those of two years ago. This year’s
respondents produced 13.2 degrees per U.S. CS department, and
12.2 degrees per department overall. This compares with 12.6 and
12.1, respectively, reported last year, and 13.1 and 12.4, respectively,
reported two years ago. More departments (160) reported their
Ph.D. production this year than did so last year (156). Total Ph.D.
production in 2018-19 was 1,860 compared with 1,787 degrees
produced in 2017-18 and 1,834 in 2016-17 (Table D1).
Among all departments reporting both this year and last year, the
number of total doctoral degrees rose by 2.7 percent. However,
among U.S. CS departments reporting both years, the increase was
6.9 percent (Table 1).
In 2018-19, women received 20.3 percent of CS doctoral degrees
and 20.8 percent of all doctoral computing degrees (Table D2). Last
year, the respective percentages were 19.3 and 21.3. Non-resident
Aliens comprised a smaller percentage of 2018-19 Ph.D. recipients
in all three areas (CS, CE and I) compared with 2017-18 recipients.
This is the reverse of what was experienced last year. In contrast,
resident Asians comprised a larger percentage compared with last
year among recipients in all three areas
(Table D3). The combined percentage of CS doctoral graduates who
were American Indian or Alaska Native, Black or African American,
Figure 1. Number of Respondents to the Taulbee Survey
Year US CS Depts. US CE Depts. Canadian US Information Total
1995 110/133 (83%) 9/13 (69%) 11/16 (69%) 130/162 (80%)
1996 98/131 (75%) 8/13 (62%) 9/16 (56%) 115/160 (72%)
1997 111/133 (83%) 6/13 (46%) 13/17 (76%) 130/163 (80%)
1998 122/145 (84%) 7/19 (37%) 12/18 (67%) 141/182 (77%)
1999 132/156 (85%) 5/24 (21%) 19/23 (83%) 156/203 (77%)
2000 148/163 (91%) 6/28 (21%) 19/23 (83%) 173/214 (81%)
2001 142/164 (87%) 8/28 (29%) 23/23 (100%) 173/215 (80%)
2002 150/170 (88%) 10/28 (36%) 22/27 (82%) 182/225 (80%)
2003 148/170 (87%) 6/28 (21%) 19/27 (70%) 173/225 (77%)
2004 158/172 (92%) 10/30 (33%) 21/27 (78%) 189/229 (83%)
2005 156/174 (90%) 10/31 (32%) 22/27 (81%) 188/232 (81%)
2006 156/175 (89%) 12/33 (36%) 20/28 (71%) 188/235 (80%)
2007 155/176 (88%) 10/30 (33%) 21/28 (75%) 186/234 (79%)
2008 151/181 (83%) 12/32 (38%) 20/30 (67%) 9/19 (47%) 192/264 (73%)
2009 147/184(80%) 13/31 (42%) 16/30 (53.3%) 12/20 (60%) 188/265 (71%)
2010 150/184 (82%) 12/30 (40%) 18/29 (62%) 15/22 (68%) 195/265 (74%)
2011 142/185 (77%) 13/31 (42%) 13/30 (43%) 16/21 (76%) 184/267 (69%)
2012 152/189 (80%) 11/32 (34%) 14/30 (47%) 16/26 (62%) 193/277 (70%)
2013 144/188 (77%) 10/30 (33%) 14/26 (54%) 11/22 (50%) 179/266 (67%)
2014 143/188 (76%) 13/31 (42%) 12/26 (46%) 13/19 (68%) 181/268 (68%)
2015 146/190(77%) 8/32 (25%) 12/26 (46%) 12/18 (67%) 178/266 (67%)
2016 150/188 (80%) 8/33 (24%) 11/26 (42%) 14/21 (67%) 183/268 (68%)
2017 148/192 (77%) 8/35 (23%) 11/30 (37%) 14/24 (58%) 181/281 (64%)
2018 143/195 (73%) 5/34 (15%) 12/30 (40%) 14/24 (58%) 174/283 (61%)
2019 148/192 (77%) 7/35 (20%) 11/29 (38%) 15/22 (68%) 181/278 (65%)

cra.org/crn5 May 2020
Native Hawaiian/Pacific Islander, Hispanic, or Multiracial Non-
Hispanic was only 3.1 percent; it was 3.8 percent in 2017-18.
Unlike in previous years, Non-resident Aliens comprised a
somewhat smaller percentage of the CS female doctoral graduates
than they did CS male graduates, and Whites comprised an equal
percentage of the female and male graduates. In past years,
Non-resident Aliens had a higher percentage of female than male
CS graduates, while Whites had a higher percentage of male than
female CS graduates (Table D9).
Doctoral Program EnrollmentTotal doctoral enrollment increased by 1.4 percent, and increased
8.6 percent among programs that reported both years. If only U.S.
computer science departments are considered, the respective
increases were 4.2 and 8.5 percent (Table 1). For the fourth straight
year, total doctoral enrollment by gender is more diverse. Across
the three areas of CS, CE and I combined, the fraction of 2018-
19 doctoral students who were women is 24.5 percent, versus
23.4 percent in 2017-18. In CS, women comprised 23.2 percent of
the 2018-19 students currently enrolled, versus 22.3 percent the
previous year (Table D7).
By contrast, doctoral enrollment by ethnicity was less diverse in
2018-19. The overall fraction of doctoral students who were neither
Non-resident Aliens, Asian, nor White declined from 6.9 percent to
4.9 percent. In CS programs, the fraction declined from 7.0 to 4.5
percent (Table D8).
As has been true in previous years, Non-resident Aliens comprise
a higher percentage of the enrolled CS women than they do the
enrolled CS men, while a lower percentage of enrolled CS women
than enrolled CS men are White. The same relationships hold for
CE. In I, the same pattern holds for White students (they comprise
a lower percentage of women than of men), but Non-resident
Aliens also comprise a smaller percentage of enrolled women than
of enrolled men (Table D10).
At U.S. CS departments, the average number of students per
department who passed qualifier exams in 2018-19 was 17.0,
similar to the 17.2 reported the previous year. Both public and
private institutions reported slight declines this year, following
two consecutive years of increases. The average number per U.S.
CS department who passed thesis candidacy exams in 2018-19
(most, but not all, departments have such exams) also declined
from 2017-18 at both public and private institutions (Table D1).
2019 Taulbee Survey (continued)
Table 1. Degree Production and Enrollment Change From Previous Year
Total Only Departments Responding Both Years
US CS Only All Departments US CS Only All Departments
PhDs 2018 2019 % chg 2018 2019 % chg 2018 2019 % chg 2018 2019 % chg
PhD Awarded 1,521 1,701 11.8% 1,787 1,860 4.1% 1,379 1,474 6.9% 1,584 1,626 2.7%
#Units PhD Awd 121 129 6.6% 148 153 3.4% 107 107 129 129
PhD Enrollment 14,992 15,621 4.2% 17,110 17,355 1.4% 13,959 15,145 8.5% 15,502 16,832 8.6%
#Units PhD Enr 139 138 -0.7% 169 164 -3.0% 127 127 151 151
New PhD Enroll 3,395 3,365 -0.9% 3,769 3,732 -1.0% 2,900 3,095 6.7% 3,321 3,574 7.6%
#Units New PhD 133 134 0.8% 162 161 -0.6% 117 117 145 145
Bachelor’s 2018 2019 % chg 2018 2019 % chg 2018 2019 % chg 2018 2019 % chg
BS Awarded 28,698 29,377 2.4% 33,853 35,298 4.3% 25,799 27,790 7.7% 30,474 33,551 10.1%
#Units BS Awd 130 134 3.1% 155 159 2.6% 117 117 139 139
BS Enrollment 141,259 143,457 1.6% 163,735 172,264 5.2% 121,863 130,942 7.5% 142,667 158,879 11.4%
#Units BS Enr 131 135 3.1% 156 160 2.6% 118 118 140 140
New BS Majors 35,245 33,184 -5.8% 40,774 39,226 -3.8% 27,786 25,338 -8.8% 33,052 30,839 -6.7%
#Units New BS 112 121 8.0% 133 142 6.8% 98 98 115 115
BS Enroll/Dept 1,078.3 1,062.6 -1.5% 1,050 1,077 2.6% 1,033 1109.7 7.5% 1019.1 1134.9 11.4%
cra.org/crn6 May 2020
Table D1. PhD Production and Pipeline by Department Type
Department Type # Depts
PhDs Awarded PhDs Next Year Passed Qualifier Passed Thesis (if dept has)
# Avg/ Dept # Avg/ Dept # Avg/ Dept # # Dept Avg/ Dept
US CS Public 100 1,222 12.9 1,430 14.3 1,587 17.3 1168 76 15.4
US CS Private 34 479 14.1 603 17.7 576 16.5 246 24 10.3
US CS Total 134 1,701 13.2 2,033 15.2 2,163 17.0 1,414 100 14.1
US CE 5 23 4.6 48 9.6 14 4.7 12 3 4.0
US Info 12 55 5.5 105 8.8 113 9.4 92 11 8.4
Canadian 9 81 9.0 85 9.4 99 11.0 78 5 15.6
Grand Total 160 1,860 12.2 2,271 14.2 2,389 15.8 1,596 119 13.4
Table D2. PhDs Awarded by Gender
CS CE I Total
Male 1,313 79.7% 99 83.9% 58 63.0% 1,470 79.2%
Female 334 20.3% 19 16.1% 34 37.0% 387 20.8%
Total Known Gender 1,647 118 92 1,857
Gender Unknown 2 0 1 3
Grand Total 1,649 118 93 1,860
Table D3. PhDs Awarded by Ethnicity
CS CE I Total
Nonresident Alien 906 61.7% 59 66.3% 26 31.0% 991 60.4%
Amer Indian or Alaska Native 2 0.1% 0 0.0% 0 0.0% 2 0.1%
Asian 151 10.3% 10 11.2% 12 14.3% 173 10.5%
Black or African-American 13 0.9% 3 3.4% 2 2.4% 18 1.1%
Native Hawaiian/Pac Islander 1 0.1% 0 0.0% 3 3.6% 4 0.2%
White 365 24.9% 13 14.6% 40 47.6% 418 25.5%
Multiracial, not Hispanic 9 0.6% 3 3.4% 0 0.0% 12 0.7%
Hispanic, any race 21 1.4% 1 1.1% 1 1.2% 23 1.4%
Total Residency & Ethnicity Known 1,468 89 84 1,641
Resident, ethnicity unknown 52 4 4 60
Residency unknown 129 25 5 159
Grand Total 1,649 118 93 1,860
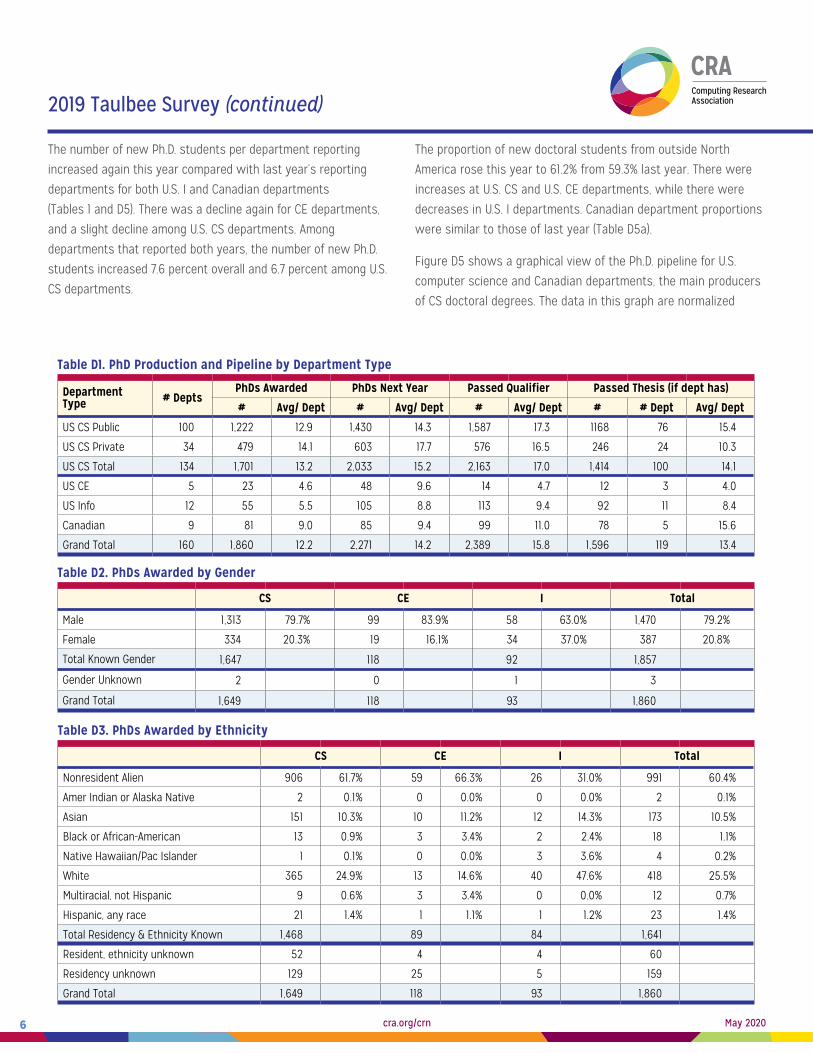
The number of new Ph.D. students per department reporting
increased again this year compared with last year’s reporting
departments for both U.S. I and Canadian departments
(Tables 1 and D5). There was a decline again for CE departments,
and a slight decline among U.S. CS departments. Among
departments that reported both years, the number of new Ph.D.
students increased 7.6 percent overall and 6.7 percent among U.S.
CS departments.
The proportion of new doctoral students from outside North
America rose this year to 61.2% from 59.3% last year. There were
increases at U.S. CS and U.S. CE departments, while there were
decreases in U.S. I departments. Canadian department proportions
were similar to those of last year (Table D5a).
Figure D5 shows a graphical view of the Ph.D. pipeline for U.S.
computer science and Canadian departments, the main producers
of CS doctoral degrees. The data in this graph are normalized
2019 Taulbee Survey (continued)
cra.org/crn7 May 2020
Table D4. Employment of New PhD Recipients By Specialty
Artif
icia
l Int
ellig
ence
/ M
achi
ne L
earn
ing
Com
puti
ng E
duca
tion
Data
base
s / I
nfor
mat
ion
Retr
ieva
l
Grap
hics
/ Vi
sual
izat
ion
Hard
war
e / A
rchi
tect
ure
High
-Per
form
ance
Com
puti
ng
Hum
an-C
ompu
ter I
nter
acti
on
Info
rmat
ics:
Bio
med
ical
/ Ot
her S
cien
ce
Info
rmat
ion
Scie
nce
Info
rmat
ion
Syst
ems
Netw
orks
Oper
atin
g Sy
stem
s
Prog
ram
min
g La
ngua
ges
/ Com
pile
rs
Robo
tics
/ Vi
sion
Scie
ntifi
c / N
umer
ical
Com
puti
ng
Secu
rity
/ In
form
atio
n As
sura
nce
Soci
al C
ompu
ting
/ So
cial
Info
rmat
ics
Soft
war
e En
gine
erin
g
Theo
ry a
nd A
lgor
ithm
s
Othe
r
Unkn
own
Tota
l
North American PhD Granting Depts.
Tenure-track 25 2 6 6 1 1 13 0 6 1 9 4 3 9 1 18 4 0 6 7 9 131 9.6%
Researcher 7 0 0 0 0 4 3 3 0 2 0 3 0 0 1 1 0 2 3 1 4 34 2.5%
Postdoc 29 1 8 5 4 2 5 15 4 2 7 6 7 11 2 11 8 4 25 5 11 172 12.6%
Teaching Faculty 4 5 4 2 2 2 7 1 2 1 1 3 0 3 2 1 1 5 3 1 4 54 4.0%
North American, Other Academic
Other CS/CE/I Dept. 0 4 4 2 1 0 4 1 0 0 1 2 0 3 1 0 0 4 3 0 2 32 2.3%
Non-CS/CE/I Dept 0 1 0 0 0 1 0 1 1 0 0 0 0 0 0 0 1 0 0 1 0 6 0.4%
North American, Non-Academic
Industry 180 4 55 33 32 19 28 18 9 6 35 28 16 58 4 40 16 52 38 46 59 776 57.0%
Government 4 0 2 0 0 3 0 4 0 0 0 0 0 5 3 5 0 1 0 3 2 32 2.3%
Self-Employed 6 0 0 1 0 1 1 0 0 0 1 0 0 0 0 1 0 1 0 0 1 13 1.0%
Unemployed 0 0 0 0 0 0 1 0 0 0 0 0 0 0 0 0 0 0 0 0 0 1 0.1%
Other 0 1 0 1 0 0 0 1 0 1 0 0 0 2 0 0 1 0 0 0 2 9 0.7%
Total Inside North America
255 18 79 50 40 33 62 44 22 13 54 46 26 91 14 77 31 69 78 64 94 1,260 92.5%
Outside North America
Ten-Track in PhD 4 0 4 2 0 1 0 2 3 2 2 1 0 0 0 6 0 1 3 0 2 33 2.4%
Researcher in PhD 0 0 0 0 0 0 0 0 0 0 0 0 0 0 1 0 0 0 0 0 0 1 0.1%
Postdoc in PhD 3 0 1 0 0 0 0 0 0 1 0 0 2 1 0 1 0 1 4 1 1 16 1.2%
Teaching in PhD 1 0 0 0 0 0 2 2 0 0 2 0 0 1 0 1 0 0 2 0 1 12 0.9%
Other Academic 1 0 0 0 0 0 0 0 0 1 1 0 0 0 0 1 0 1 0 0 0 5 0.4%
Industry 10 1 1 1 0 1 0 1 0 0 0 4 0 1 0 2 1 1 5 0 1 30 2.2%
Government 0 0 0 0 0 0 0 0 0 0 0 0 0 0 0 1 0 0 0 0 1 2 0.1%
Self-Employed 0 0 0 0 0 0 0 0 0 0 0 0 0 0 0 0 0 0 0 0 0 0 0.0%
Unemployed 0 0 0 0 0 0 0 0 0 0 0 0 0 0 0 0 0 0 0 0 0 0 0.0%
Other 0 0 0 0 0 0 0 0 0 0 0 1 0 0 0 0 0 0 1 0 1 3 0.2%
Total Outside NA 19 1 6 3 0 2 2 5 3 4 5 6 2 3 1 12 1 4 15 1 7 102 7.5%
Total with Employment Data, Inside North America plus Outside North America
274 19 85 53 40 35 64 49 25 17 59 52 28 94 15 89 32 73 93 65 101 1,362
Employment Type & Location Unknown
38 0 14 21 13 1 5 15 13 2 20 4 4 9 3 9 1 8 14 21 283 498
Grand Total 312 19 99 74 53 36 69 64 38 19 79 56 32 103 18 98 33 81 107 86 384 1,860
2019 Taulbee Survey (continued)

cra.org/crn8 May 2020
by the number of reporting departments. The graph offsets the
qualifier data by two years from the data for new students, and
offsets the graduation data by five years from the data for new
students. These data have been useful in estimating the timing
of changes in production rates. The graph predicts larger growth
beginning next year, and departments are indeed forecasting a
double-digit percent increase in production during 2019-20
(Table D1). Last year’s departmental forecast double-digit
percentage increase in production did not materialize; much more
modest growth was obtained.
Table D4a. Detail of Industry Employment
Artif
icia
l Int
ellig
ence
/ M
achi
ne L
earn
ing
Com
puti
ng E
duca
tion
Data
base
s / I
nfor
mat
ion
Retr
ieva
l
Grap
hics
/ Vi
sual
izat
ion
Hard
war
e / A
rchi
tect
ure
High
Per
form
ance
Com
puti
ng
Hum
an-C
ompu
ter I
nter
acti
on
Info
rmat
ics:
Bio
med
ical
/ Ot
her S
cien
ce
Info
rmat
ion
Scie
nce
Info
rmat
ion
Syst
ems
Netw
orks
Oper
atin
g Sy
stem
s
Prog
ram
min
g La
ngua
ges
/ Com
pile
rs
Robo
tics
/ Vi
sion
Scie
ntifi
c /N
um
eric
al C
ompu
ting
Secu
rity
/ In
form
atio
n As
sura
nce
Soci
al C
ompu
ting
/ So
cial
Info
rmat
ics
Soft
war
e En
gine
erin
g
Theo
ry a
nd A
lgor
ithm
s
Othe
r
Unkn
own
Tota
l
Inside North America
Research 122 3 28 21 22 12 19 11 8 4 21 9 8 41 3 18 11 18 19 28 17 443 57.1%
Non-Research 46 1 21 11 6 6 9 3 1 1 12 16 6 14 0 15 3 31 11 14 16 243 31.3%
Postdoctorate 2 0 0 0 0 0 0 3 0 0 0 0 1 2 0 1 1 0 1 0 4 15 1.9%
Type Not Specified 10 0 6 1 4 1 0 1 0 1 2 3 1 1 1 6 1 3 7 4 22 75 9.7%
Total Inside NA 180 4 55 33 32 19 28 18 9 6 35 28 16 58 4 40 16 52 38 46 59 776
Outside North America
Research 8 1 0 1 0 1 0 1 0 0 0 2 0 1 0 2 1 0 3 0 1 22 73.3%
Non-Research 2 0 1 0 0 0 0 0 0 0 0 1 0 0 0 0 0 1 0 0 0 5 16.7%
Postdoctorate 0 0 0 0 0 0 0 0 0 0 0 0 0 0 0 0 0 0 1 0 0 1 3.3%
Type Not Specified 0 0 0 0 0 0 0 0 0 0 0 1 0 0 0 0 0 0 1 0 0 2 6.7%
Total Outside NA 10 1 1 1 0 1 0 1 0 0 0 4 0 1 0 2 1 1 5 0 1 30
Table D5. New PhD Students by Department Type
CS CE I Total
Department Type
New Admit
MS to
PhDTotal
Avg. per
Dept.New
AdmitMS to PhD Total
Avg. per
Dept.New
AdmitMS to PhD Total
Avg. per
Dept.Total
Avg. per
Dept
US CS Public 2,026 178 2,204 22.7 114 15 129 7.6 86 8 94 13.4 2,427 24.8
US CS Private 853 59 912 25.3 8 2 10 2.5 16 0 16 8.0 938 26.1
US CS Total 2,879 237 3,116 23.4 122 17 139 6.6 102 8 110 12.2 3,365 25.1
US CE 0 0 0 0.0 39 8 47 9.4 0 0 0 0.0 47 9.4
US Information 12 0 12 6.0 0 0 0 0.0 132 14 146 11.2 158 12.2
Canadian 136 26 162 18.0 0 0 0 0.0 0 0 0 0.0 162 18.0
Grand Total 3,027 263 3,290 22.8 161 25 186 7.2 234 22 256 11.6 3,732 23.2
2019 Taulbee Survey (continued)

cra.org/crn9 May 2020
Table D5a. New PhD Students from Outside North America
Department Type CS CE I Total New
Outside Total New% outside
North America
US CS Public 1,410 86 39 1,535 2,427 63.2%
US CS Private 523 7 12 542 938 57.8%
Total US CS 1,933 93 51 2,077 3,365 61.7%
US CE 0 37 0 37 47 78.7%
US Info 5 0 84 89 158 56.3%
Canadian 80 0 0 80 162 49.4%
Grand Total 2,018 130 135 2,283 3,732 61.2%
Table D6. PhD Enrollment by Department Type
Department Type # Depts CS CE I Total
US CS Public 100 10,149 66.2% 747 76.8% 364 35.0% 11,260 64.9%
US CS Private 38 4,263 27.8% 58 6.0% 40 3.8% 4,361 25.1%
Total US CS 138 14,412 93.9% 805 82.7% 404 38.8% 15,621 90.0%
US CE 5 0 0.0% 168 17.3% 0 0.0% 168 1.0%
US Info 12 102 0.7% 0 0.0% 636 61.2% 738 4.3%
Canadian 9 828 5.4% 0 0.0% 0 0.0% 828 4.8%
Grand Total 164 15,342 973 1,040 17,355
Table D7. PhD Enrollment by Gender
CS CE I Total
Male 11,527 76.8% 726 76.1% 579 55.8% 12,832 75.5%
Female 3,477 23.2% 228 23.9% 459 44.2% 4,164 24.5%
Total Known Gender 15,004 954 1,038 16,996
Gender Unknown 338 19 2 359
Grand Total 15,342 973 1,040 17,355
Table D8. PhD Enrollment by Ethnicity
CS CE I Total
Nonresident Alien 9,205 66.1% 685 72.1% 534 54.4% 10,424 65.8%
Amer Indian or Alaska Native 18 0.1% 0 0.0% 0 0.0% 18 0.1%
Asian 1088 7.8% 53 5.6% 60 6.1% 1201 7.6%
Black or African-American 222 1.6% 18 1.9% 45 4.6% 285 1.8%
Native Hawaiian / Pac Islander 9 0.1% 2 0.2% 9 0.9% 20 0.1%
White 2,995 21.5% 160 16.8% 294 29.9% 3,449 21.8%
Multiracial, not Hispanic 115 0.8% 10 1.1% 16 1.6% 141 0.9%
Hispanic, any race 269 1.9% 22 2.3% 24 2.4% 315 2.0%
Total Known 13,921 950 982 15,853
Resident, ethnicity unknown 405 23 58 486
Residency unknown 1016 0 0 1016
Grand Total 15,342 973 1,040 17,355
2019 Taulbee Survey (continued)

cra.org/crn10 May 2020
Table D9. PhDs Awarded by Gender and Ethnicity, From 153 Departments
CS CE I Ethnicity Totals
Male Fem N/R % of M*
% of F* Male Fem N/R % of
M*% of F* Male Fem N/R % of
M*% of F* Total %
Nonresident Alien 723 183 0 62 59 51 8 0 68 57 19 7 0 36 23 991 60.4
Amer Indian or Alaska Native 2 0 0 0 0 0 0 0 0 0 0 0 0 0 0 2 0.1
Asian 112 39 0 10 13 8 2 0 11 14 8 4 0 15 13 173 10.5
Black or African-American 10 3 0 1 1 2 1 0 3 7 1 1 0 2 3 18 1.1
Native Hawaiian/Pac Islander 1 0 0 0 0 0 0 0 0 0 3 0 0 6 0 4 0.2
White 289 76 0 25 25 10 3 0 13 21 21 19 0 40 61 418 25.5
Multiracial, not Hispanic 6 3 0 1 1 3 0 0 4 0 0 0 0 0 0 12 0.7
Hispanic, any race 17 4 0 2 1 1 0 0 1 0 1 0 0 2 0 23 1.4Total Res & Ethnicity Known 1,160 308 0 0 0 75 14 0 53 31 0 1,641
Resident, ethnicity unknown 42 8 2 4 0 0 3 1 0 60
Not Reported (N/R) 111 18 0 20 5 0 2 2 1 159
Gender Totals 1,313 334 2 99 19 0 58 34 1 1,860
% 79.7% 20.3% 83.9% 16.1% 63.0% 37.0%
* % of M and % of F columns are the percent of that gender who are of the specified ethnicity, of those whose ethnicity is known
Table D10. PhD Enrollment by Gender and Ethnicity, From 164 Departments Providing Breakdown Data
CS CE I Ethnicity Totals
Male Fem N/R % of M*
% of F* Male Fem N/R % of
M*% of F* Male Fem N/R % of
M*% of F* Total %
Nonresident Alien 6,939 2,154 112 66 68 493 183 9 70 82 306 228 0 56 52 10,424 65.8%
Amer Indian or Alaska Native 15 3 0 0 0 0 0 0 0 0 0 0 0 0 0 18 0.1%
Asian 788 296 4 7 9 44 8 1 6 4 31 29 0 6 7 1201 7.6%
Black or African-American 147 75 0 1 2 13 4 1 2 2 16 28 1 3 6 285 1.8%
Native Hawaiian/Pac Islander 3 5 1 0 0 0 2 0 0 1 5 4 0 1 1 20 0.1%
White 2,408 554 33 23 18 130 24 6 18 11 168 125 1 31 29 3,449 21.8%
Multiracial, not Hispanic 94 20 1 1 1 8 0 2 1 0 7 9 0 1 2 141 0.9%
Hispanic, any race 204 61 4 2 2 19 3 0 3 1 10 14 0 2 3 315 2.0%Total Res & Ethnicity Known 10,598 3,168 155 707 224 543 437 2 15,853
Resident, ethnicity unknown 292 113 0 19 4 36 22 0 486
Not Reported (N/R) 637 196 183 0 0 0 0 0 1016
Gender Totals 11,527 3,477 338 726 228 579 459 2 17,355
% 76.8% 23.2% 76.1% 23.9% 55.8% 44.2% 0.0%
* % of M and % of F columns are the percent of that gender who are of the specified ethnicity, of those whose ethnicity is known
2019 Taulbee Survey (continued)

cra.org/crn11 May 2020
2019 Taulbee Survey (continued)
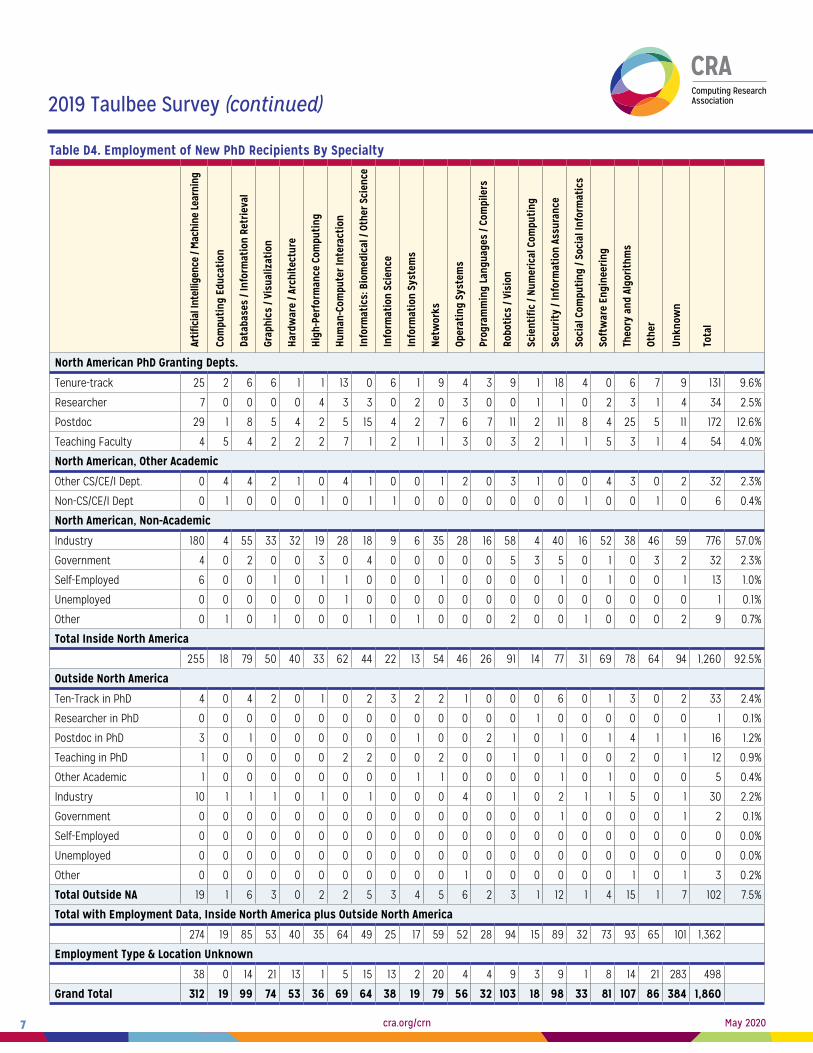
Ph.D. EmploymentFigure D6 shows the employment trend of new Ph.D.s in academia
and industry within North America, those taking employment
outside of North America, and those going to academia in
North America who took positions in departments other than
Ph.D.-granting CS and CE departments. Table D4 shows a more
detailed breakdown of the employment data for new Ph.D.s. The
percentage of new Ph.D.s who took positions in North American
industry was 57.0 percent, the same as the percentage reported
last year. Among those doctoral graduates who went to North
American industry and for whom the type of industry position was
known, about 63 percent took research positions (Table D4a). This
also is the percentage reported last year. This year, definitive data
was provided for over 90 percent of the graduates who went to
North American industry, slightly lower than last year’s 92 percent.
The percentage of Ph.D. graduates who took North American
academic jobs in 2018-19 (31.5) also was similar in that reported for
2017-18 (31.2). Among those graduates taking academic positions
in North America, the percentage who did not go to a doctoral-
granting computing department was 8.9, compared to 5.7 in 2017-
18. This number has oscillated for the last several years, so this
rise should not be interpreted as any indication of a trend.
Among those whose employment is known, 7.5 percent of Ph.D.
graduates reported taking positions outside of North America,
similar to the reported values in each of the past two years.
Slightly higher percentages of these persons went to an industry,
tenure-track academic, and academic postdoctoral positions than
did so last year. A slightly lower percentage went to academic
researcher and government positions. However, most of the
doctoral graduates who went to non-North American industry
positions took research positions. Definitive data was provided
for 93 percent of the graduates who went to non-North American
industry positions.
When academic and industry postdocs are combined, the result is
that 15.0 percent of 2018-19 doctoral graduates whose employment
was known took some type of postdoctoral position. Last year,
the reported percentage was 14.8. Approximately eight percent of
these were industry postdocs.
Of those doctoral graduates for whom employment information
was known, only one person was reported as unemployed.
However, 26.8 percent of new Ph.D.s’ employment status was
unknown. The lack of information about the employment of more
than one in four graduates may skew the real overall percentages
for certain employment categories.
Table D4 also indicates the areas of specialty of new Ph.D.s.
Artificial intelligence/machine learning continues to be by far the
most popular area, comprising nearly 17 percent of all doctoral
degrees awarded. However, this year, theory/algorithms and
robotics/vision were next highest, replacing software engineering
and networks. The fourth most popular specialty area both
last year and this year is security/information assurance.
Approximately one in five of the Ph.D.s are categorized into the
area “unknown.”

cra.org/crn12 May 2020
2019 Taulbee Survey (continued)
Figure D1. PhD Production
CRA Taulbee Survey 2019
Figure D2. Nonresident Aliens as Fraction of PhD Enrollments
CRA Taulbee Survey 2019
cra.org/crn13 May 2020
2019 Taulbee Survey (continued)
Figure D3. PhD Degrees Granted by Tenure-Track Size
CRA Taulbee Survey 2019
Figure D4. PhD Enrollment Normalized by Tenure-Track Size
CRA Taulbee Survey 2019

cra.org/crn14 May 2020
2019 Taulbee Survey (continued)
Figure D5. CS Pipeline corrected for year of entry
Figure D6. Employment Trends for New Ph.D.s

cra.org/crn15 May 2020
Master’s and Bachelor’s Degree Production and EnrollmentsThis section reports data about enrollment and degree production
for master’s and bachelor’s programs in the doctoral-granting
departments. Although the absolute number of degrees and
enrolled students reported herein only reflect departments that
offer the doctoral degree, the trends observed in the master’s and
bachelor’s data from these departments tend to strongly reflect
trends in the larger population of programs that offer such degrees.
Master’s(Tables M1-M8; Figures M1-M2)
On a per department basis, 2018-19 CS master’s degree production
in U.S. CS departments rose by 8.1 percent compared with 2017-
18. The production at public institutions rose 16.7 percent, while
that at private institutions declined by 6.4 percent. Each of these
comparisons with 2017-18 is in the reverse direction of the year-to-
year comparison reported in last year’s survey.
Overall master’s degree production per department in 2018-19
rose 7.1 percent aggregated over all departments, 6.1 percent at
U.S. CS departments and 9.1 percent at Information departments.
Canadian production per department showed a 46 percent
increase, but with only nine departments reporting versus 11 last
year, this comparison may well be skewed by the difference in
departments reporting in the two respective years. No comparison
is made for the CE area due to the even smaller number of
departments reporting (Table M1).
The proportion of female graduates among CS master’s degree
recipients rose from 26.5 percent to 27.2 percent. Women
comprised 24.6 percent of the CE graduates, down from 27.5
percent, and the I area graduated more women than men among
those whose gender was reported (53.9 percent, versus 48.8
percent in last year’s report). Aggregating all areas, the percentage
of master’s degrees to women increased from 30.6 to 31.2 percent
(Table M2).
In CS, 68.8 percent of master’s degrees went to Non-resident
Aliens, slightly lower than the 70.0 percent in 2017-18. The
percentage of Non-resident Aliens also dropped slightly in the I
area, from 44.4 percent to 43.3 percent. The CE area statistics are
more volatile due to the smaller number of units reporting; the
percentage of CE degrees going to Non-resident Aliens increased
from 70.8 to 79,8 percent. The aggregate percentage over all three
areas dipped slightly, from 65.4 to 64.7 percent. The percentage
of CS master’s recipients among American Indian/Alaska Native,
Black/African-American, Native Hawaiian/Pacific Islander, Hispanic,
and Multiracial was approximately 4.0 percent in 2018-19 versus 3.6
percent in 2017-18 (Table M3).
Table M1. Master’s Degrees Awarded by Department Type
Department Type # Depts CS CE I Total
US CS Public 100 8,621 58.5% 383 54.3% 487 15.7% 9,491 51.2%
US CS Private 36 5,235 35.5% 89 12.6% 615 19.9% 5,939 32.0%
Total US CS 136 13,856 94.0% 472 67.0% 1,102 35.6% 15,430 83.3%
US CE 5 0 0.0% 223 31.6% 0 0.0% 223 1.2%
US Info 12 47 0.3% 0 0.0% 1,992 64.4% 2,039 11.0%
Canadian 9 832 5.6% 10 1.4% 0 0.0% 842 4.5%
Grand Total 162 14,735 705 3,094 18,534
Table M2. Master’s Degrees Awarded by Gender
CS CE I Total
Male 10,404 72.8% 483 75.4% 1,261 46.1% 12,148 68.8%
Female 3,888 27.2% 158 24.6% 1,473 53.9% 5,519 31.2%
Total Known Gender 14,292 641 2,734 17,667
Gender Unknown 443 64 360 867
Grand Total 14,735 705 3,094 18,534
2019 Taulbee Survey (continued)

cra.org/crn16 May 2020
Table M3. Master’s Degrees Awarded by Ethnicity
CS CE I Total
Nonresident Alien 9,042 68.8% 497 79.8% 1,261 43.3% 10,800 64.7%
Amer Indian or Alaska Native 6 0.0% 0 0.0% 1 0.0% 7 0.0%
Asian 1,547 11.8% 28 4.5% 412 14.1% 1,987 11.9%
Black or African-American 155 1.2% 5 0.8% 133 4.6% 293 1.8%
Native Hawaiian/Pac Island 6 0.0% 0 0.0% 8 0.3% 14 0.1%
White 2,032 15.5% 72 11.6% 931 32.0% 3,035 18.2%
Multiracial, not Hispanic 86 0.7% 8 1.3% 62 2.1% 156 0.9%
Hispanic, any race 276 2.1% 13 2.1% 105 3.6% 394 2.4%
Total Residency & Ethnicity Known 13,150 623 2,913 16,686
Resident, ethnicity unknown 477 9 168 654
Residency unknown 1,108 73 13 1,194
Grand Total 14,735 705 3,094 18,534
Table M4. Master’s Degrees Expected Next Year by Department Type
Department Type
# Depts CS CE I Total
US CS Public 99 8,494 59.5% 296 51.4% 367 11.7% 9,157 50.9%
US CS Private 34 5,224 36.6% 96 16.7% 521 16.7% 5,841 32.5%
Total US CS 133 13,718 96.1% 392 68.1% 888 28.4% 14,998 83.4%
US CE 5 0 0.0% 179 31.1% 0 0.0% 179 1.0%
US Info 12 43 0.3% 0 0.0% 2,236 71.6% 2,279 12.7%
Canadian 9 517 3.6% 5 0.9% 0 0.0% 522 2.9%
Grand Total 159 14,278 618 3,124 17,978
2019 Taulbee Survey (continued)
Table M5. New Master’s Students by Department Type
Department Type
CS CE I Total Outside North America
Total # Depts
Avg. per
Dept.Total #
DeptsAvg. per
Dept.Total #
DeptsAvg. per
Dept.Total #
DeptsAvg. per
Dept.#
Depts %
US CS Public 9,733 102 95.4 313 22 14.2 374 15 24.9 10,420 102 102.2 6,401 61.4%
US CS Private 5,292 35 151.2 21 4 5.3 447 6 74.5 5,760 35 164.6 3,810 66.1%
Total US CS 15,025 137 109.7 334 26 12.8 821 21 39.1 16,180 137 118.1 10,211 63.1%
US CE 0 0 0.0 194 5 38.8 0 0 0.0 194 5 38.8 157 80.9%
US Information 88 2 44.0 0 0 0.0 2,081 13 160.1 2,169 13 166.8 941 43.4%
Canadian 479 9 53.2 52 2 26.0 0 0 0.0 531 9 59.0 353 66.5%
Grand Total 15,592 148 105.4 580 33 17.6 2,902 34 85.4 19,074 164 116.3 11,662 61.1%

cra.org/crn17 May 2020
Table M7. Masters Degrees Awarded by Gender and Ethnicity, From 164 Departments Providing Breakdown Data
CS CE I Ethnicity Totals
Male Fem N/R % of M*
% of F*
Male Fem N/R % of M*
% of F*
Male Fem N/R % of M*
% of F*
Total %
Nonresident Alien 6,213 2,607 222 66 75 362 135 0 77 88 600 525 136 51 38 10,800 64.7
Amer Indian or Alaska Native 4 1 1 0 0 0 0 0 0 0 0 1 0 0 0 7 0.0
Asian 1102 440 5 12 13 19 9 0 4 6 125 194 93 11 14 1987 11.9
Black or African-American 112 39 4 1 1 5 0 0 1 0 47 61 25 4 4 293 1.8
Native Hawaiian/Pac Islander 5 1 0 0 0 0 0 0 0 0 5 0 3 0 0 14 0.1
White 1,705 310 17 18 9 64 8 0 14 5 319 540 72 27 39 3,035 18.2
Multiracial, not Hispanic 72 11 3 1 0 7 1 0 2 1 21 33 8 2 2 156 0.9
Hispanic, any race 206 68 2 2 2 12 1 0 3 1 55 42 8 5 3 394 2.4
Total Res & Ethnicity Known 9,419 3,477 254 469 154 0 1,172 1,396 345 16,686
Resident, ethnicity unknown 323 151 3 5 2 2 86 75 7 654
Not Reported (N/R) 662 260 186 9 2 62 3 2 8 1194
Gender Totals 10,404 3,888 443 483 158 64 1,261 1,473 360 18,534
% 72.8% 27.2% 75.4% 24.6% 46.1% 53.9%
* % of M and % of F columns are the percent of that gender who are of the specified ethnicity, of those whose ethnicity is known
Table M6. Total Master’s Students by Department Type
Department Type
CS CE I Total
Total # Depts
Avg. per
Dept.Total #
DeptsAvg. per
Dept.Total #
DeptsAvg. per
Dept.Total #
DeptsAvg. per
Dept.
US CS Public 25,977 101 257.2 908 20 45.4 1,205 13 92.7 28,090 102 275.4
US CS Private 12293 37 332.2 181 5 36.2 1391 5 278.2 13865 37 374.7
Total US CS 38,270 138 277.3 1,089 25 43.6 2,596 18 144.2 41,955 139 301.8
US CE 0 0 0.0 373 5 74.6 0 0 0.0 373 5 74.6
US Information 121 2 60.5 0 0 0.0 4675 13 359.6 4796 13 368.9
Canadian 2850 9 316.7 39 1 39.0 0 0 0.0 2889 9 321.0
Grand Total 41,241 149 276.8 1,501 31 48.4 7,271 31 234.5 50,013 166 301.3
2019 Taulbee Survey (continued)

cra.org/crn18 May 2020
As has been the case in recent years, Non-resident Aliens again
comprised a much larger proportion of female CS and CE degree
recipients than male CS and CE degree recipients, while larger
percentage of male CS and CE degree recipients than female
CS and CE degree recipients were White (Table M7). In the I
area, Non-resident Aliens again comprised a larger percentage
of male master’s graduates than female master’s graduates,
while a smaller percentage of male master’s graduates than
female master’s graduates were White. These trends are likely
to continue into the near future based on the current enrollment
breakdown by gender and ethnicity (Table M8).
The average number of new master’s students enrolled in U.S. CS
departments dipped from 123.5 to 118.1. The decline is due to public
departments; private departments actually experienced slight
increases (Table M5).
The fraction of new master’s students in U.S. CS departments that
is reported to be from outside North America in 2019-20 was 63.1
percent, compared with 60.0 percent in 2018-19 (Table M5). The
2019-20 level is close to the level reported two years ago. Both
public and private institutions saw an increase in this statistic.
At U.S. Information departments, the fraction of new master’s
students from outside North America also rose, from 40.2 percent
to 43.4 percent, ending a two-year decline.
Table M8. Masters Enrollment by Gender and Ethnicity, From 166 Departments Providing Breakdown Data
CS CE I Ethnicity Totals
Male Fem N/R % of M*
% of F* Male Fem N/R % of
M*% of F* Male Fem N/R % of
M*% of F* Total %
Nonresident Alien 15,752 6,682 155 59 73 704 288 0 70 84 1,427 1,281 3 44 37 26,292 59.2
Amer Indian or Alaska Native 19 4 0 0 0 0 0 0 0 0 5 6 0 0 0 34 0.1
Asian 2,880 983 61 11 11 55 13 0 6 4 295 319 0 9 9 4,606 10.4
Black or African-American 507 174 34 2 2 24 1 0 2 0 175 205 0 5 6 1,120 2.5
Native Hawaiian/ Pac Islander 15 1 0 0 0 1 0 0 0 0 5 0 0 0 0 22 0.0
White 6,314 1,007 131 24 11 160 23 0 16 7 1,075 1,408 3 33 41 10,121 22.8
Multiracial, not Hispanic 311 87 6 1 1 9 3 0 1 1 59 74 0 2 2 549 1.2
Hispanic, any race 1,028 203 9 4 2 51 14 0 5 4 186 156 0 6 5 1,647 3.7
Total Res & Ethnicity Known 26,826 9,141 396 1,004 342 0 3,227 3,449 6 44,391
Resident, ethnicity unknown 1,000 287 21 11 4 1 154 159 0 1,637
Not Reported (N/R) 1,866 833 871 27 12 100 1 0 275 3,985
Gender Totals 29,692 10,261 1,288 1,042 358 101 3,382 3,608 281 50,013
% 74.3% 25.7% 74.4% 25.6% 48.4% 51.6%
* % of M and % of F columns are the percent of that gender who are of the specified ethnicity, of those whose ethnicity is known
2019 Taulbee Survey (continued)

cra.org/crn19 May 2020
2019 Taulbee Survey (continued)
Figure M1 . Master’s Degrees Granted by Tenure-Track Size
CRA Taulbee Survey 2019
Figure M2. Master’s Enrollment Normalized by Tenure-Track Size
CRA Taulbee Survey 2019

cra.org/crn20 May 2020
Bachelor’s(Tables 1, B1-B8; Figures B1-B4)
Growth in bachelor’s degree production abated this year, ending
a five-year run of double-digit percent increases. Total degrees
produced across all three areas of computing was 4.3 percent
higher among this year’s reporting departments compared with
last year’s reporting departments. The increase in CS degrees
produced was 6.8 percent. However, it is important to calibrate
these changes based on the set of departments reporting each
year. On a per-department basis, total degree production rose
overall by 1.6 percent across all department types and declined
by 0.7 percent in U.S. CS departments. Computer science degree
production rose 2.4 percent in U.S. CS departments, but only
2.0 percent per department. When considering only those
departments that reported both years, the increase in total degree
production across the CS, CE and I areas was 10.1 percent among
all departments and 7.7 percent among U.S. CS departments
(Tables 1 and B1).
2019 Taulbee Survey (continued)
Table B1. Bachelor’s Degrees Awarded by Department Type
Department Type # Depts CS CE I Total
US CS Public 97 18,987 66.6% 1,718 74.2% 1,863 41.8% 22,568 63.9%
US CS Private 37 6,231 21.8% 247 10.7% 331 7.4% 6,809 19.3%
Total US CS 134 25,218 88.4% 1,965 84.9% 2,194 49.2% 29,377 83.2%
US CE 5 0 0.0% 317 13.7% 0 0.0% 317 0.9%
US Info 11 355 1.2% 0 0.0% 2,263 50.8% 2,618 7.4%
Canadian 9 2,954 10.4% 32 1.4% 0 0.0% 2,986 8.5%
Grand Total 159 28,527 2,314 4,457 35,298
Table B2. Bachelor’s Degrees Awarded by Gender
CS CE I Total
Male 20,991 79.0% 1,879 85.4% 3,216 72.2% 26,086 78.5%
Female 5,572 21.0% 320 14.6% 1,236 27.8% 7,128 21.5%
Total Known Gender 26,563 2,199 4,452 33,214
Gender Unknown 1,964 115 5 2,084
Grand Total 28,527 2,314 4,457 35,298
Table B3. Bachelor’s Degrees Awarded by Ethnicity
CS CE I Total
Nonresident Alien 3,307 14.5% 194 9.9% 316 7.5% 3,817 13.2%
Amer Indian or Alaska Native 51 0.2% 5 0.3% 10 0.2% 66 0.2%
Asian 6,128 27.0% 352 17.9% 895 21.2% 7,375 25.5%
Black or African-American 755 3.3% 87 4.4% 346 8.2% 1,188 4.1%
Native Hawaiian/Pac Islander 36 0.2% 12 0.6% 10 0.2% 58 0.2%
White 9,939 43.7% 1,015 51.5% 1,958 46.3% 12,912 44.6%
Multiracial, not Hispanic 715 3.1% 88 4.5% 202 4.8% 1,005 3.5%
Hispanic, any race 1,800 7.9% 216 11.0% 490 11.6% 2,506 8.7%
Total Residency & Ethnicity Known 22,731 1,969 4,227 28,927
Resident, ethnicity unknown 1,297 64 130 1,491
Residency unknown 4,499 281 100 4,880
Grand Total 28,527 2,314 4,457 35,298

cra.org/crn21 May 2020
Figure B1 shows the trend in total computing bachelor’s degree
production since 1995 for all departments reporting to the Taulbee
Survey. Based on current and recent enrollments, additional growth
in CS bachelor’s degree production seems likely for a little while.
The smaller increase in the number of bachelor’s degrees last year
is coupled with a decrease in the number of new undergraduate
computing majors, ending an eleven year string of increases. While
there were more new CS majors reported this year than last year,
when the increased number of departments reporting this year is
accounted for, there actually was a decrease in the average new
CS majors per department. Across all departments, there was a 5.4
percent decrease, from 275.4 to 260.6. Among U.S. CS departments,
the decrease was 7.1 percent, from 266.7 to 247.8 (Table B5). When
CS, CE, and I majors are aggregated, the decrease in new majors
per department is 3.8 percent among all departments and 5.8
percent among U.S. CS departments. The decrease in new majors
2019 Taulbee Survey (continued)
Table B5. New Bachelor’s Students by Department Type
CS CE I Total
Department Type Major Pre-
Major#
DeptsAvg.
Major /Dept
Total Pre-Major
# Depts
Avg. Major /Dept
Total Pre-Major
# Depts
Avg. Major /Dept
Total Major
Avg. Major /Dept
US CS Public 23,731 10,062 92 257.9 1,800 1,373 31 58.1 764 377 19 40.2 26,295 285.8
US CS Private 6,258 1,989 29 215.8 233 160 8 29.1 398 27 7 56.9 6,889 237.6
Total US CS 29,989 12,051 121 247.8 2,033 1,533 39 52.1 1,162 404 26 44.7 33,184 274.2
US CE 0 0 0 0.0 200 291 3 66.7 0 0 0 0.0 200 66.7
US Information 429 191 2 214.5 0 0 0 0.0 1,289 347 9 143.2 1,718 190.9
Canadian 3,987 1,388 9 443.0 137 0 3 45.7 0 0 0 0.0 4,124 458.2
Grand Total 34,405 13,630 132 260.6 2,370 1,824 45 52.7 2,451 751 35 70.0 39,226 276.2
Table B6. Total Bachelor’s Enrollment by Department Type
CS CE I Total
Department Type Major Pre-
Major#
DeptsAvg.
Major /Dept
Total Pre-Major
# Depts
Avg. Major /Dept
Total Pre-Major
# Dept
Avg. Major /Dept
Total Major
Avg. Major /Dept
US CS Public 97,260 19,722 97 1,002.7 8,948 2,572 33 271.2 7,033 990 20 351.7 113,241 1,155.5
US CS Private 27,590 3,949 37 745.7 893 438 7 127.6 1,733 51 6 288.8 30,216 816.6
Total US CS 124,850 23,671 134 931.7 9,841 3,010 40 246.0 8,766 1,041 26 337.2 143,457 1,062.6
US CE 0 0 0 0.0 1,699 609 5 339.8 0 0 0 0.0 1,699 339.8
US Information 1,382 447 2 691.0 0 0 0 0.0 8,366 794 11 760.5 9,748 886.2
Canadian 17,055 1,355 9 1,895.0 305 213 1 305.0 0 0 0 0.0 17,360 1,928.9
Grand Total 143,287 25,473 145 988.2 11,845 3,832 46 257.5 17,132 1,835 37 463.0 172,264 1,076.7
Table B4. Bachelor’s Degrees Expected Next Year by Department Type
Department Type # Depts CS CE I Total
US CS Public 91 19,504 64.4% 1,572 64.6% 1,282 36.3% 22,358 61.7%
US CS Private 33 6,273 20.7% 315 12.9% 322 9.1% 6,910 19.1%
Total US CS 124 25,777 85.1% 1,887 77.6% 1,604 45.4% 29,268 80.8%
US CE 5 0 0.0% 357 14.7% 0 0.0% 357 1.0%
US Info 11 330 1.1% 0 0.0% 1,926 54.6% 2,256 6.2%
Canadian 9 4,170 13.8% 189 7.8% 0 0.0% 4,359 12.0%
Grand Total 149 30,277 2,433 3,530 36,240

cra.org/crn22 May 2020
is 6.7 percent when considering only those departments reporting
both this year and last year, and 8.8 percent when considering U.S.
CS departments reporting both years (Table 1). Figure B2 illustrates
the trend in the total number of newly declared computing
undergraduate majors as reported in the Taulbee Survey.
Despite the decrease in new majors, more total majors were
reported this year than last year. At U.S. CS departments, the total
number of majors in CS, CE, and I combined increased 1.6 percent,
while among all departments it increased 5.2 percent. However,
when normalized for the number of departments reporting,
enrollment decreased 1.5 percent at U.S. CS departments and
increased only 2.6 percent among all departments. When only
departments reporting both years are considered, the respective
increases are 7.5 and 11.4 percent (Table 1). Looking only at CS
enrollment, the increase in majors per department reporting is 7.9
percent for all departments combined, and 4.8 percent for U.S. CS
departments (Table B6).
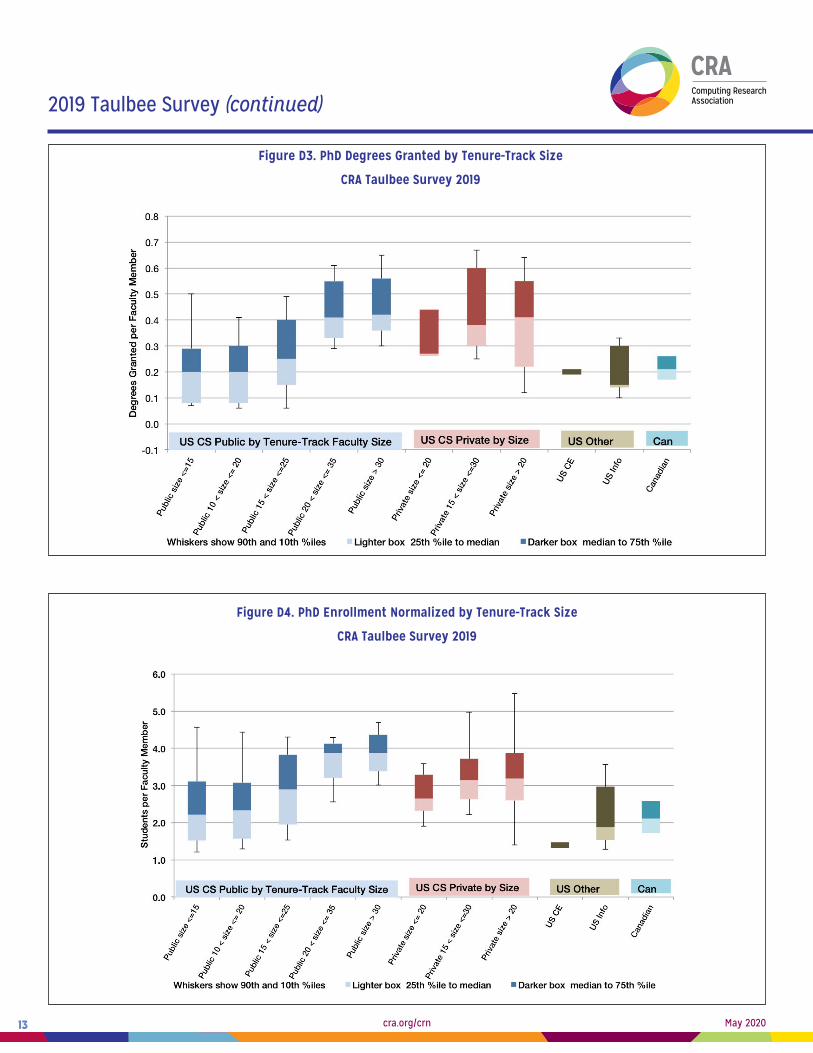
Per-department averages smooth out comparisons from year
to year when there are differences in the number of reporting
departments, but the averages include both very large and very
small departments. Figures B3 and B4 show the distribution of
number of degrees awarded (Figure B3) and total enrollment
(Figure B4) per tenured or tenure-track faculty member, in
department size groupings for the U.S. CS departments. Larger
departments tend to produce more bachelor’s degrees per
tenure-track faculty member than do smaller departments at both
public and private institutions. However, neither public nor private
institutions show a clear relationship between faculty size and
enrollment per tenure-track faculty member.
Figure B5 shows the enrollment trend from Taulbee Survey data
since this surge began. It illustrates both the decline in average
new majors per department in the current (2019-20) academic
year and the twelve consecutive years of growth in average
total majors per department through academic year 2018-19.
The average enrollment per U.S. CS department increased over
380 percent during that period; that is nearly a quintupling from
its level in fall 2006. For the past six years, it has exceeded the
previous peak reached during the dot-com enrollment surge.
Another view of bachelor’s enrollments can be gleaned from
CS course-level data. Such data was first reported in CRA’s
Generation-CS report for the fall terms in 2005, 2010 and 2015. The
Taulbee Survey began collecting follow-up data in the 2016 survey,
and now does so annually. Table B9 shows four-year enrollment
trends for the four types of courses for which data is collected
(representative introductory course for non-majors, introductory
course for majors, mid-level course, and upper-level course). For
each type of course, only those departments are included that
reported data for each of the four years and reported on the
same course in each of the four years. The data indicate that
median enrollment in the introductory course for non-majors,
the introductory course for CS majors, and the mid-level course
each is at its highest level in 2018 among the four years 2016-19.
None of the courses show a steadily increasing median over the
four-year period. The introductory course for non-majors had it
lowest median enrollment in 2019, while the upper level course
had its highest median level in 2019. The table further shows
that, in the course for majors at each of the introductory, mid
and upper levels, the median percent of majors in the course
was lower in 2019 than in 2018. Finally, the table shows a steady
increase over the four-year period in the representation of women
in the introductory courses for both majors and non-majors, and
a steady increase in the representation of underrepresented
minority students in the upper-level.
Gender diversity among bachelor’s graduates, both overall and in
CS, rose very slightly in 2018-19. Women comprised 21.5 percent
of all graduates and 21.0 percent of CS graduates in 2018-2019,
compared with respective percentages of 21.2 and 20.9 in 2017-18.
The percentage of women among I graduates also increased, from
26.8 percent to 27.8 percent, but the percentage of women among
CE bachelor’s graduates was 14.6 percent compared with the 15.6
percent reported last year (Table B2).
The percentage of CS bachelor’s graduates who are White again
declined, from 45.4 percent in 2017-18 to 43.7 percent in 2018-19,
while the percentage awarded to Asians rose from 26.5 percent
to 27.0 percent and the percentage awarded to Non-resident
Aliens rose from 13.9 percent to 14.5 percent. All other ethnicities
combined comprise 14.7 percent of those for whom ethnicity
is known, up from 14.2 percent last year. Hispanics make up
the largest share of these other ethnicities at 8.0 percent. In
aggregate across the three areas of computing, 44.6 percent
of the graduates were White, 25.5 percent Asian, 13.2 percent
Non-resident Aliens, and 16.7 percent all other ethnicity categories
combined. However, in I programs, the other ethnicity categories
2019 Taulbee Survey (continued)

cra.org/crn23 May 2020
Table B7. Bachelors Degrees Awarded by Gender and Ethnicity, From 159 Departments Providing Breakdown Data
CS CE I Ethnicity Totals
Male Fem N/R % of M*
% of F* Male Fem N/R % of
M*% of F* Male Fem N/R % of
M*% of F* Total %
Nonresident Alien 2,335 877 95 14 19 168 26 0 10 9 208 106 2 7 9 3,817 13.2
Amer Indian or Alaska Native 41 9 1 0 0 4 1 0 0 0 7 3 0 0 0 66 0.2
Asian 4,266 1,594 268 25 35 278 74 0 17 25 558 337 0 18 29 7,375 25.5
Black or African-American 566 160 29 3 4 71 16 0 4 5 239 107 0 8 9 1,188 4.1
Native Hawaiian/Pac Islander 30 5 1 0 0 9 3 0 1 1 2 8 0 0 1 58 0.2
White 8,124 1,465 350 47 32 889 124 2 53 42 1,504 454 0 49 39 12,912 44.6
Multiracial, not Hispanic 543 140 32 3 3 76 12 0 5 4 136 66 0 5 6 1,005 3.5
Hispanic, any race 1,440 322 38 8 7 177 39 0 11 13 395 95 0 13 8 2,506 8.7
Total Res & Ethnicity Known 17,345 4,572 814 1,672 295 2 3,049 1,176 2 28,927
Resident, ethnicity unknown 1,002 268 27 55 8 1 93 35 2 1,491
Not Reported (N/R) 2,644 732 1,123 152 17 112 74 25 1 4,880
Gender Totals 20,991 5,572 1,964 1,879 320 115 3,216 1,236 5 35,298
% 79.0% 21.0% 85.4% 14.6% 72.2% 27.8%
* % of M and % of F columns are the percent of that gender who are of the specified ethnicity, of those whose ethnicity is known
Table B8. Bachelors Enrollment by Gender and Ethnicity, From 160 Departments Providing Breakdown Data
CS CE I Ethnicity Totals
Male Fem N/R % of M*
% of F* Male Fem N/R % of
M*% of F* Male Fem N/R % of
M*% of F* Total %
Nonresident Alien 10,842 3,411 91 13 16 804 153 20 9 10 764 411 0 7 10 16,496 12.4
Amer Indian or Alaska Native 212 56 3 0 0 15 2 0 0 0 26 9 0 0 0 323 0.2
Asian 19,508 7,005 57 23 32 1,645 448 12 19 28 1,729 951 0 15 23 31,355 23.5
Black or African-American 3,767 1,276 20 4 6 528 114 7 6 7 999 444 0 9 11 7,155 5.4
Native Hawaiian/Pac Islander 105 27 0 0 0 22 9 0 0 1 16 10 0 0 0 189 0.1
White 38,454 7,005 276 45 32 4,238 600 72 48 37 6,140 1,660 2 53 40 58,447 43.9
Multiracial, not Hispanic 3,206 950 24 4 4 376 63 5 4 4 471 221 0 4 5 5,316 4.0
Hispanic, any race 8,610 1,926 106 10 9 1,177 220 18 13 14 1,483 459 0 13 11 13,999 10.5
Total Res & Ethnicity Known 84,704 21,656 577 8,805 1,609 134 11,628 4,165 2 133,280
Resident, ethnicity unknown 4,110 1,048 389 235 43 1 249 101 3 6,179
Not Reported (N/R) 15,249 4,693 10,861 581 104 333 141 34 809 32,805
Gender Totals 104,063 27,397 11,827 9,621 1,756 468 12,018 4,300 814 172,264
% 79.2% 20.8% 84.6% 15.4% 73.6% 26.4%
* % of M and % of F columns are the percent of that gender who are of the specified ethnicity, of those whose ethnicity is known
2019 Taulbee Survey (continued)

cra.org/crn24 May 2020
accounted for approximately 25 percent of the graduates, up from
23 percent last year (Table B3).
Gender and ethnicity distributions of enrolled students (Table
B8) suggest that women comprise a larger fraction of the total
CS enrollment in 2019-20 than they did in 2018-19 (20.8 percent
vs 19.5 percent). The 20.8 percent of enrolled CS students who
are women is almost identical to the 21.0 percent of 2018-19 CS
graduates who were women. With respect to ethnic diversity, the
fraction of total enrollment aggregated across all three computing
areas, among ethnicities other than Non-resident Alien, Asian and
White, is 20.2 percent. Last year it was 20.6 percent. In CS, these
other ethnicities comprised 19.0 percent of total enrollment. These
statistics suggest that the diversity of computing graduates is not
likely to change much any time soon.
In all three computing areas (CS, CE, and I), Resident Asians and
Non-resident Aliens continue comprise a larger fraction of female
enrollment than male enrollment, while a larger fraction of male
enrollment than female enrollment is White (Table B8). Table B7
indicates that the same comparisons continue to hold true for
degree awardees in CS and I, although Non-resident Aliens are
a slightly higher fraction of male than of female awardees in CE
this year.
Table B9. Undergrad Representative Course Enroll 2016-2019, Department-Level Percentiles
Number of Students Reported % Who Are Majors % Who Are Women % URM at Non-MSI
Intro-Level for Non Majors
(N=51) 2016 2017 2018 2019 (N=31) 2016 2017 2018 2019 (N=29) 2016 2017 2018 2019 (N=23) 2016 2017 2018 2019
25 68.0 64.0 77.0 78.0 25 0.2 0.5 0.4 0.2 25 23.1 22.8 22.8 24.9 25 7.7 13.2 3.3 9.9
50 191.0 197.0 200.0 158.0 50 4.6 2.9 2.5 3.8 50 35.3 37.9 38.1 39.3 50 19.1 21.3 17.1 17.6
75 299.0 367.0 356.0 346.0 75 12.9 12.6 14.3 15.0 75 47.8 47.2 50.3 46.5 75 32.0 34.9 29.4 37.1
Intro for Majors
(N=61) 2016 2017 2018 2019 (N=41) 2016 2017 2018 2019 (N=36) 2016 2017 2018 2019 (N=29) 2016 2017 2018 2019
25 184.5 181.0 171.0 220.5 25 18.4 18.5 16.9 10.7 25 16.3 17.5 17.9 18.4 25 4.9 9.7 8.9 10.2
50 276.0 303.0 346.0 337.0 50 46.4 43.3 47.0 34.2 50 19.5 21.3 21.6 25.4 50 16.2 18.9 14.6 16.4
75 449.5 495.0 603.5 588.5 75 78.7 74.4 71.0 60.7 75 29.8 32.2 35.4 33.9 75 23.3 27.2 25.5 28.0
Mid-Level
(N=61) 2016 2017 2018 2019 (N=43) 2016 2017 2018 2019 (N=36) 2016 2017 2018 2019 (N=26) 2016 2017 2018 2019
25 88.0 103.5 109.0 117.5 25 41.5 37.9 50.0 43.5 25 14.0 13.5 16.9 16.6 25 7.9 9.6 8.6 10.1
50 147.0 158.0 189.0 181.0 50 69.4 60.6 74.8 64.6 50 19.6 19.5 21.8 19.7 50 13.0 16.2 12.9 14.6
75 267.5 336.0 326.0 355.0 75 86.1 87.0 88.9 87.9 75 28.8 30.8 29.5 31.0 75 29.9 28.6 29.0 20.2
Upper-Level
(N=61) 2016 2017 2018 2019 (N=42) 2016 2017 2018 2019 (N=36) 2016 2017 2018 2019 (N=27) 2016 2017 2018 2019
25 51.0 64.5 74.0 76.0 25 69.6 67.1 67.7 71.7 25 11.0 11.6 12.6 12.3 25 4.8 7.1 5.1 6.7
50 101.0 120.0 118.0 121.0 50 89.0 83.6 89.7 87.7 50 16.4 18.2 16.1 17.8 50 9.2 11.3 12.0 12.5
75 170.0 185.5 210.5 264.0 75 98.5 96.3 97.4 97.4 75 22.9 27.1 27.1 25.7 75 22.5 28.8 26.3 28.1
2019 Taulbee Survey (continued)

cra.org/crn25 May 2020
Figure B1. BS Production (CS & CE)
CRA Taulbee Survey 2019
Figure B2. Newly Declared Undergraduate Majors: CS, CE, and I (beginning in 2008)
CRA Taulbee Survey 2019
2019 Taulbee Survey (continued)

cra.org/crn26 May 2020
Figure B4. Bachelor’s Enrollment Normalized by Tenure-Track Size
CRA Taulbee Survey 2019
Figure B3. Bachelor’s Degrees Granted by Tenure-Track Size
CRA Taulbee Survey 2019
2019 Taulbee Survey (continued)

cra.org/crn27 May 2020
Faculty Demographics(Tables F1-F9; Figure F1)4
Table F1 shows the current and anticipated sizes, in FTE, for
tenure-track, teaching, and research faculty, and postdocs. The
total tenure-track faculty count in U.S. CS departments increased
by less than one percent over last year, and the average tenure-
track faculty size decreased slightly. In U.S. CS departments,
the total teaching faculty count increased from 1107 to 1249 (12.8
percent), following a 16.9 percent increase last year.
Once again, we report teaching faculty in two categories,
called “Teaching Professors” and “Other Instructors”. “Teaching
Professors” on average have more varied responsibilities in
teaching, scholarship, service/governance, etc., and higher
expectations for visibility outside the unit or the institution. “Other
Instructors” are more focused on teaching introductory or mid-
level courses and tend to have shorter contract lengths, though
they are still full time faculty (Taulbee does not collect data on
course-by-course adjuncts). In U.S. CS departments, the number of
persons in these two categories again was split fairly evenly at
public institutions, but decidedly in favor of Teaching Professors at
private institutions. However, at private institutions, many more
persons were classified as “Other Instructors” this year, while the
number of “Teaching Professors” was similar to that reported last
year. U.S. I departments and Canadian departments also again
reported a decided preference for the Teaching Professor category
of teaching faculty.
The total number of research faculty reported at U.S. CS
departments dropped from 426 to 382, while the total number
of postdocs dropped from 531 to 518. About 62% of the U.S. CS
departments providing faculty data to this year’s survey reported
having any research faculty, including slightly more public (63%)
than private (58%) universities. About two-thirds of public and 71%
of private U.S. CS departments reported having any postdocs.
Figure F1 illustrates the comparative changes at U.S. CS departments
in undergraduate enrollment, tenure-track faculty and teaching
Figure B5. Average New and Continuing CS Majors per Academic Unit (U.S. CS Programs Only)
CRA Taulbee Survey 2019
2019 Taulbee Survey (continued)

cra.org/crn28 May 2020
Table F1. Actual and Anticipated Faculty Size by Position and Department Type
Actual ProjectedExpected 2-Yr Growth # Depts
2019-2020 2020-2021 2021-2022
US CS Public Total Average Total Average Total Average # %
TenureTrack 3077 30.5 3244 32.1 3417 33.8 340 11.1% 101
Teaching Prof 491 4.9 538 5.3 595 5.9 103 21.0% 77
Other Instruc 421 4.2 451 4.5 468 4.6 46 11.0% 73
Research 237 2.4 250 2.5 266 2.6 28 11.9% 64
Postdoc 253 2.5 274 2.7 298 3.0 45 17.8% 68
Total 4,480 44.4 4,757 47.1 5,043 49.9 563 12.6%
US CS Private
TenureTrack 1307 34.4 1376 36.2 1418 37.3 110 8.5% 38
Teaching Prof 224 5.9 246 6.5 258 6.8 34 15.0% 31
Other Instruc 113 3.0 120 3.2 125 3.3 12 10.6% 25
Research 145 3.8 159 4.2 169 4.4 24 16.6% 22
Postdoc 265 7.0 282 7.4 294 7.7 29 10.9% 27
Total 2,054 54.1 2,183 57.4 2,263 59.6 209 10.2%
All US CS
TenureTrack 4,384 31.5 4,619 33.2 4,835 34.8 451 10.3% 139
Teaching Prof 715 5.1 784 5.6 852 8.8 137 19.1% 108
Other Instruc 534 3.8 571 4.1 593 8.2 58 11.0% 98
Research 382 2.8 409 2.9 435 7.5 52 13.7% 86
Postdoc 518 3.7 556 4.0 592 8.3 74 14.3% 95
Total 6,534 47.0 6,940 49.9 7,306 52.6 772 11.8%
US CE
TenureTrack 112 22.4 114 22.8 116 23.2 4 3.6% 5
Teaching Prof 7 1.4 7 1.4 7 2.3 0 0.0% 3
Other Instruc 8 1.6 8 1.6 8 4.0 0 0.0% 2
Research 24 4.8 24 4.8 24 12.0 0 0.0% 3
Postdoc 26 5.2 28 5.6 29 7.3 3 11.5% 4
Total 177 35.4 181 36.2 184 36.8 7 4.0%
US I
TenureTrack 394 28.2 432 30.9 464 33.2 70 17.8% 14
Teaching Prof 126 9.0 152 10.9 172 15.6 46 36.6% 12
Other Instruc 60 4.3 65 4.6 70 11.6 10 16.7% 12
Research 14 1.0 15 1.1 17 2.8 3 20.7% 9
Postdoc 32 2.3 42 3.0 47 4.2 15 47.6% 12
Total 625 44.7 706 50.4 769 55.0 144 23.0%
Canadian
TenureTrack 361 40.1 380 42.2 384 42.7 23 6.4% 9
Teaching Prof 47 5.2 46 5.1 45 7.5 -2 -4.3% 7
Other Instruc 15 1.7 15 1.7 15 3.0 0 0.0% 7
Research 5 0.6 5 0.6 5 5.0 0 0.0% 2
Postdoc 92 10.2 93 10.3 94 15.7 2 2.2% 6
Total 520 57.8 539 59.9 543 60.3 23 4.4% 9
Grand Total
TenureTrack 5,252 31.4 5,546 33.2 5,799 34.7 547 10.4% 167
Teaching Prof 895 5.4 990 5.9 1,076 9.2 181 20.2% 130
Other Instruc 617 3.7 659 3.9 685 8.1 68 11.0% 119
Research 426 2.5 454 2.7 481 7.2 55 13.0% 100
Postdoc 668 4.0 718 4.3 762 8.3 95 14.2% 117
Total 7,857 47.0 8,366 50.1 8,803 52.7 946 12.0%
2019 Taulbee Survey (continued)

cra.org/crn29 May 2020
faculty since 2006, when the current enrollment surge began. This
figure updates with recent years’ data a figure from the Generation-
CS report. Although the graph shows that teaching faculty increases
for the past two years are at a similar rate to growth in number of
majors, that followed six consecutive years of increases that each
fell far short of the growth in majors. This illustrates the continuing
challenge to obtain sufficient instructional resources to deal
effectively with the increased enrollments.
Canadian departments, on average, are larger than U.S. CS
departments, in terms of both tenure-track and total faculty,
although the gap is smaller this year for total faculty. U.S. I and
CE departments, on average, continue to be smaller than U.S. CS
departments on both counts, though the gap between U.S. CS
and U.S. I also has narrowed. The observations about U.S. CE and
I departments may reflect the fact that we ask departments to
report only computing-related faculty, so departments with Library
Science or EE programs may report only part of their faculty.
Among U.S. CS departments, those at private universities are on
average larger than those at public universities in both tenure-
track and total faculty size. This has been observed consistently
for many years.
Table F2 summarizes faculty hiring this past year. The success
rate for hiring tenure-track faculty at this year’s reporting U.S. CS
departments was 70.7 percent, a noticeable drop from last year’s
reported 77.5 percent. The success rate among departments
at public universities was again higher than that at private
universities (74.0 percent vs 62.4 percent), and the gap was larger
this year. Canadian departments once again collectively had a
lower success rate than U.S.CS departments. U.S. I departments’
success rate was higher than U.S. CS departments, a change
from last year’s observation. In aggregate across all types of
departments, the tenure-track hiring success rate during the three
most recent recruiting cycles has decreased from 82.7 percent to
77.3 percent to 70.4 percent. The distribution of the reasons for
lack of hiring success is similar to that last year, though there
was a slightly larger percentage this year due to offers being
turned down (55.9 percent compared with 51.1 percent reported
last year (Table F2a).
2019 Taulbee Survey (continued)
Table F2. Vacant Positions 2018-2019 by Position and Department Type
Tried to fill Filled
US CS Public
TenureTrack 312 231
Teaching Prof 85 70
Other Instruc 80 80
Research 29 33
Postdoc 102 107
Total 608 521
US CS Private
TenureTrack 125 78
Teaching Prof 44 38
Other Instruc 24 25
Research 18 18
Postdoc 49 58
Total 260 217
All US CS
TenureTrack 437 309
Teaching Prof 129 108
Other Instruc 104 105
Research 47 51
Postdoc 151 165
Total 868 738
US CE
TenureTrack 6 2
Teaching Prof 0 0
Other Instruc 0 0
Research 1 1
Postdoc 8 6
Total 15 9
US I
TenureTrack 54 44
Teaching Prof 21 20
Other Instruc 4 6
Research 5 2
Postdoc 11 11
Total 95 83
Canadian
TenureTrack 41 24
Teaching Prof 5 5
Other Instruc 4 4
Research 0 2
Postdoc 11 38
Total 61 73
Grand Total
TenureTrack 538 379
Teaching Prof 155 133
Other Instruc 112 115
Research 53 56
Postdoc 181 220
Total 1,039 903

cra.org/crn30 May 2020
Gender diversity among newly hired faculty improved in 2019-20
when all categories of academic positions (tenure-track, teaching
faculty, research faculty, and postdoc) are considered collectively.
This year the fraction of newly hired faculty who are women is
25.9 percent vs 22.9 percent last year (Table F3). Among those
newly hired into tenure-track positions, the proportion of women
was similar (23.5 percent this year to 22.9 percent last year). The
percentage of women among new tenure-track faculty hires and
the percentage of women among newly hired faculty overall both
are once again higher than the percentage of new female Ph.D.s
produced during the past year (20.8 percent).
Among new tenure-track faculty whose residency was known,
White, Non-resident Alien or Asian hires collectively comprise 94.1
Table F2a. Reasons Positions Left Unfilled
Reason # Reported % of Reasons
Didn’t find a person who met our hiring goals* 19 13.1%
Offers turned down 81 55.9%
Technically vacant, not filled for admin reasons 7 4.8%
Hiring in progress 34 23.4%
Other 4 2.8%
Total Reasons Provided 145
*What hiring goals could not be met? # Given
Specific specialty area not found (cybersecurity and others) 6
Didn’t meet criteria, weak candidates, too few candidates 6
Table F3. Gender of Newly Hired Faculty
Tenure-Track Teaching Professors Other Instructors Research Postdoc Total
Male 322 76.5% 93 63.3% 68 70.8% 37 86.0% 111 77.1% 631 74.1%
Female 99 23.5% 54 36.7% 28 29.2% 6 14.0% 33 22.9% 220 25.9%
Unknown 1 0 1 0 7 9
Total 422 147 97 0 43 151 860
Table F4. Ethnicity of Newly Hired Faculty
Tenure-Track Teaching Professors
Other Instructors Research Postdoc Total
Nonresident Alien 59 15.6% 9 6.7% 10 11.6% 4 10.3% 21 15.7% 103 13.3%
American Indian/Alaska Native 0 0.0% 2 1.5% 2 2.3% 0 0.0% 0 0.0% 4 0.5%
Asian 143 37.8% 26 19.3% 13 15.1% 12 30.8% 52 38.8% 246 31.9%
Black or African-American 4 1.1% 5 3.7% 2 2.3% 0 0.0% 4 3.0% 15 1.9%
Native Hawaiian/Pacific Islander 0 0.0% 0 0.0% 0 0.0% 3 7.7% 0 0.0% 3 0.4%
White 154 40.7% 79 58.5% 51 59.3% 17 43.6% 49 36.6% 350 45.3%
Multiracial, not Hispanic 1 0.3% 0 0.0% 0 0.0% 0 0.0% 1 0.7% 2 0.3%
Hispanic, any race 5 1.3% 9 6.7% 4 4.7% 2 5.1% 3 2.2% 23 3.0%
Resident, race/ethnic unknown 12 3.2% 5 3.7% 4 4.7% 1 2.6% 4 3.0% 26 3.4%
Total known residency 378 135 86 39 134 772
Residency Unknown 44 12 11 4 17 88
Total 422 147 97 43 151 860
2019 Taulbee Survey (continued)

cra.org/crn31 May 2020
percent. Among newly hired teaching and research faculty, these
three categories comprise approximately 85 percent, while among
postdocs it is slightly over 90 percent (Table F4).
Table F10 shows the sources of new faculty of each type. For
newly hired assistant professors, the fraction who had been
postdocs in the previous year was 97/342 (28 percent). Since we
began collecting such information in 2015, this percentage has
ranged from 21 to 31 percent. The percentage of these new
assistant professors who were postdocs is about the same as the
percentage who were new Ph.Ds, while 36 percent of new assistant
professors were in other academic positions the previous year. Last
year, 39 percent of new assistant professors were new Ph.D.s while
29 percent came from other academic positions. We don’t know
the previous academic rank of the new assistant professors who
came from other academic positions; they might have been teaching
faculty or research faculty as a transitional position, or they might
have come from other tenure-track positions.
Of the 90 new full and associate professors whose source was
reported, 82 percent came from other academic institutions and
12 percent from industry. This is similar to last year’s respective
78 and 13 percent. Among teaching faculty, 35 percent were hired
without a Ph.D, while this fraction was 42 percent for Other
Instructors. Last year’s respective percentages were 25 and 74
percent. This year, 55 percent of new research faculty did not have
a Ph.D., compared with only 34 percent reported last year.
Table F5. Faculty Losses
Died 5
Retired 103
Took Academic Position Elsewhere 139
Took Nonacademic Position 43
Remained, but Changed to Part Time 11
Other 20
Unknown 6
Total 327
Table F6. Gender of Current Faculty
Full Associate Assistant Teaching Professors
Other Instructors Research Postdoc Total
Male 2,064 84.3% 1,010 77.4% 1,082 76.1% 679 70.7% 489 70.2% 317 77.7% 493 72.6% 6,134 77.4%
Female 385 15.7% 295 22.6% 340 23.9% 282 29.3% 208 29.8% 91 22.3% 186 27.4% 1,787 22.6%
Unknown 41 6 22 5 12 0 35 121
Total 2,490 1,311 1,444 966 709 408 714 8,042
Table F7. Ethnicity of Current Faculty
Full Associate Assistant Teaching Professors
Other Instructors Research Postdoc Total
Nonresident Alien 10 0.4% 17 1.5% 195 14.8% 51 6.0% 36 5.4% 22 5.6% 151 24.9% 482 6.6%
American Indian/ Alaska Native 5 0.2% 1 0.1% 4 0.3% 2 0.2% 4 0.6% 0 0.0% 5 0.8% 21 0.3%
Asian 677 29.9% 361 31.3% 460 34.8% 111 13.0% 66 9.9% 93 23.8% 168 27.7% 1,936 26.7%
Black or African-American 23 1.0% 24 2.1% 38 2.9% 15 1.8% 23 3.5% 10 2.6% 15 2.5% 148 2.0%
Native Hawaiian/ Pacific Islander 1 0.0% 6 0.5% 0 0.0% 0 0.0% 10 1.5% 0 0.0% 0 0.0% 17 0.2%
White 1,403 61.9% 664 57.6% 544 41.1% 610 71.2% 444 66.9% 240 61.5% 222 36.6% 4,127 56.9%
Multiracial, not Hispanic 16 0.7% 6 0.5% 5 0.4% 4 0.5% 7 1.1% 1 0.3% 4 0.7% 43 0.6%
Hispanic, any race 47 2.1% 34 3.0% 26 2.0% 29 3.4% 28 4.2% 14 3.6% 14 2.3% 192 2.6%
Resident, race/ ethnic unknown 83 3.7% 39 3.4% 50 3.8% 35 4.1% 46 6.9% 10 2.6% 28 4.6% 291 4.0%
Total known residency 2,265 1,152 1,322 857 664 390 607 7,257
Residency Unknown 225 159 122 109 45 18 107 785
Total 2,490 1,311 1,444 966 709 408 714 8,042
2019 Taulbee Survey (continued)

cra.org/crn32 May 2020
Table F8. Current Tenured and Tenure-Track Faculty by Gender and Ethnicity, From 162 Departments
Full Professor Associate Professor Assistant Professor Ethnicity Totals
Male Fem N/R % of M*
% of F* Male Fem N/R % of
M*% of F* Male Fem N/R % of
M* % of F* Total %
Nonresident Alien 9 1 0 1 0 15 2 0 2 1 155 39 1 16 13 222 5
Amer Indian or Alaska Native 2 3 0 0 1 0 1 0 0 0 0 4 0 0 1 10 0
Asian 582 95 0 32 28 271 90 0 32 35 361 99 0 37 33 1,498 33
Black or African-American 18 5 0 1 2 16 8 0 2 3 20 18 0 2 6 85 2
Native Hawaiian/Pac Islander 1 0 0 0 0 6 0 0 1 0 0 0 0 0 0 7 0
White 1,183 220 0 64 66 520 144 0 61 57 409 134 1 42 45 2,611 57
Multiracial, not Hispanic 16 0 0 1 0 4 2 0 1 1 2 3 0 0 1 27 1
Hispanic, any race 35 12 0 2 4 26 8 0 3 3 22 4 0 2 1 107 2
Total Res & Ethnicity Known 1,846 336 0 858 255 0 969 301 2 4,567
Resident, ethnicity unknown 55 11 17 27 9 3 28 19 3 172
Not Reported (N/R) 163 38 24 125 31 3 85 20 17 506
Gender Totals 2,064 385 41 1,010 295 6 1,082 340 22 5,245
% 84.3% 15.7% 77.4% 22.6% 76.1% 23.9%
* %M and %F columns are the percent of that gender who are of the specified ethnicity, of those whose ethnicity is known
Table F9a. Current Non-Tenure-Track Teaching Faculty by Gender and Ethnicity, From 157 Departments
Teaching Professors Other Instructors Ethnicity Totals
Male Fem N/R % of M* % of F* Male Fem N/R % of M* % of F* Total %
Nonresident Alien 38 13 0 7 5 23 12 1 5 7 87 6
Amer Indian or Alaska Native 1 1 0 0 0 4 0 0 1 0 6 0
Asian 70 41 0 12 17 39 27 0 9 15 177 12
Black or African-American 12 3 0 2 1 12 11 0 3 6 38 3
Native Hawaiian/Pac Islander 0 0 0 0 0 6 4 0 1 2 10 1
White 437 173 0 75 72 321 123 0 74 68 1,054 73
Multiracial, not Hispanic 3 1 0 1 0 7 0 0 2 0 11 1
Hispanic, any race 22 7 0 4 3 23 5 0 5 3 57 4
Total Res & Ethnicity Known 583 239 0 435 182 1 1,440
Resident, ethnicity unknown 22 12 1 31 15 0 81
Not Reported (N/R) 74 31 4 23 11 11 154
Gender Totals 679 282 5 489 208 12 1,675
% 70.7% 29.3% 70.2% 29.8%
* %M and %F columns are the percent of that gender who are of the specified ethnicity, of those whose ethnicity is known
2019 Taulbee Survey (continued)

cra.org/crn33 May 2020
There were 7.9 percent more faculty losses reported this year as
compared with last year (Table F5). Increases were present in
retirements, persons taking academic positions elsewhere, and
persons taking nonacademic positions. Fewer people moved to
part-time status than did so in last year’s report.
The proportion of women currently at the full professor and
assistant professor ranks is higher this year than last year, while
the proportion at the associate professor rank is slightly lower.
This is the reverse of what was reported last year at all three
ranks. There again is an increase in the proportion of women
among teaching faculty, with only a one-half of a percentage point
difference in the proportion of women between the two teaching
faculty categories. The proportion of women among research faculty
and postdocs also are higher than their respective values reported
last year, with the biggest jump being among postdocs, where the
proportion of women went from 19.0 to 27.4 percent (Table F6).
Table F7 shows the breakdown of ethnicity among current faculty
in each category. The proportion of current faculty who are
American Indian, Black, Native Hawaiian, Multiracial or Hispanic
collectively totals between 4.0 and 6.5 percent except for “other
instructors”, where these ethnicities total 10.9 percent.
Again this year, the vast majority of departments reported gender
by ethnicity breakdowns of their faculty, Table F8 shows, for each
ethnicity at each tenure-track rank, the percentage of total men
at that rank represented by that ethnicity and the percentage of
total women at that rank represented by that ethnicity. Tables
F9a and F9b do likewise, respectively, for teaching faculty and
for research faculty and postdocs. While there are fluctuations
in these percentages from year to year, the basic picture did not
change much from last year.
U.S. CS departments anticipate an average 5.4 percent growth
in tenure-track faculty next year but an 8.5 percent growth in
teaching faculty (Table F1). The tenure-track forecast is lower
than that made last year, while the teaching faculty forecast is
higher than last year’s forecast. Departments also forecast an
average 7.3 percent growth in postdocs, lower than the forecast
last year. Actual hiring was fairly close in aggregate to last year’s
expectations for teaching faculty hiring, falling short for teaching
professors and exceeding expectations for other instructors.
Actual hiring fell short of expectations for postdocs and far short
of expectations for tenure-track faculty.
Table F9b. Current Non-Tenure-Track Research Faculty and Postdocs by Gender and Ethnicity, From 132 Depts
Non-Tenure-Track Research Postdocs Ethnicity Totals
Male Fem N/R % of M* % of F* Male Fem N/R % of M* % of F* Total %
Nonresident Alien 18 4 0 6 5 118 30 3 28 20 173 18
Amer Indian or Alaska Native 0 0 0 0 0 5 0 0 1 0 5 1
Asian 73 20 0 25 23 122 42 4 29 29 261 27
Black or African-American 6 4 0 2 5 11 4 0 3 3 25 3
Native Hawaiian/ Pac Islander 0 0 0 0 0 0 0 0 0 0 0 0
White 184 56 0 63 64 151 65 6 36 44 462 48
Multiracial, not Hispanic 0 1 0 0 1 3 1 0 1 1 5 1
Hispanic, any race 12 2 0 4 2 8 5 1 2 3 28 3
Total Res & Ethnicity Known 293 87 0 418 147 14 959
Resident, ethnicity unknown 9 1 0 17 7 4 38
Not Reported (N/R) 15 3 0 58 32 17 125
Gender Totals 317 91 0 493 186 35 1,122
% 77.7% 22.3% 72.6% 27.4%
* %M and %F columns are the percent of that gender who are of the specified ethnicity, of those whose ethnicity is known
2019 Taulbee Survey (continued)

cra.org/crn34 May 2020
Table F10. Source of New Faculty
Source Full Associate Assistant Teaching Prof
Other Instruc Research Postdoc Total
% Total from
Source
New PhD 2 3 95 20 11 5 70 206 29%
From Postdoc 0 0 97 6 4 5 10 122 17%
From Other Academic 36 38 123 30 25 12 32 296 41%
From Industry 5 6 27 25 19 7 1 90 13%
Total With Hire Source 43 47 342 81 59 29 113 714
Hired Without PhD 1 0 7 28 25 16 0 77
% Hired Without PhD 35% 42% 55%
Figure Fl. Comparative Change in Majors and instructional Resources per Unit
CRA Taulbee Survey 2019
I.D
450
400
350
� 300 E E 250 .... GI "' 81 200 t; -= 150 ... C
� 100 GI
CL 50
0
-50CD 0 0 C\I
,-.. co 8 8 C\I C\I
0) 0 0 C\I
0 ,-0 C\I
,,-0 C\I
C\I ,-0 C\I
(") ,-0 C\I
.,,. ,-0 C\I
It) ,-0 C\I
CD ,-0 C\I
r-,. ,-0 C\I
00 ,-0 C\I
a, ,-0 C\I
-Average UG per unit cum chngfrom '06
-Avg TT fac per unit cum chgfrom '06
-Avg teach tac per unit cumchg since '06
Source: CRA Taulbee Survey
Note: Collection of Teaching faculty per unit changed in 2018 which may contribute to large increase.
2019 Taulbee Survey (continued)

cra.org/crn35 May 2020
Research Expenditures(Table R1; Figures R1-R2)
Table R1 shows the distribution of departments’ total research
expenditure (including indirect costs or “overhead” as stated on
project budgets) from external sources of support. Figures R1 and
R2 show the per capita expenditure, where capitation is computed
two ways. The first (Figure R1) is relative only to the number of
tenure-track faculty members. The second (Figure R2) is relative
to research faculty and postdocs as well as tenure-track faculty.
Canadian levels are shown in Canadian dollars.
Reported research expenditures in U.S. departments were
substantially lower this year compared with those reported last
year. Overall median research expenditures for 2018-19 at U.S.
CS public departments decreased 11 percent, while they declined
nearly 35 percent at U.S. CS private departments and 28 percent
at U.S. I departments. However, this follows substantial increases
reported last year. Canadian departments showed a 75 percent
increase in median expenditure over last year, but the small
Canadian sample size makes these comparisons a less reliable
indicator of the country-wide situation.
The U.S. CS data show a tendency for larger departments to
have more external funding per capita than smaller departments
among both public and private institutions. This has been the
trend consistently at public institutions, but not as consistently at
private institutions.
2019 Taulbee Survey (continued)
Table R1. Total Expenditure from External Sources for Computing Research
Department Type # Depts 10th 25th 50th 75th 90th
US CS Public 82 $758,700 $2,054,122 $4,715,479 $9,620,511 $15,940,989
US CS Private 30 $1,693,735 $3,307,449 $6,165,610 $14,235,123 $18,240,686
US CE 3 * * * * *
US Information 14 $1,232,838 $2,418,270 $3,026,459 $5,107,540 $6,074,615
Canadian 4 * * $3,592,278 * *

cra.org/crn36 May 2020
Figure R2. Research Expenditures Normalized by Tenure-Track + Research Faculty + Postdoctorates
CRA Taulbee Survey 2019
Figure R1. Research Expenditures Normalized by Tenure-Track Size
CRA Taulbee Survey 2019
2019 Taulbee Survey (continued)

cra.org/crn37 May 2020
Graduate Student Support(Tables G1-G2; Figures G1-G3)
Table G1 shows the number of doctoral students supported
as full-time students as of fall 2019, further categorized as
teaching assistants (TAs), research assistants (RAs), and full-
support fellows. The table also shows the split between those on
institutional vs. external funds. Table G1a shows similar data for
supported master’s students.
The average number of TAs on institutional funds among doctoral
students in U.S. CS departments is similar to last year’s value (35.0
vs 33.8 last year). Public universities reported an increase, private
universities reported a decline for the second straight year. The
small number of CE, I, and Canadian departments also make these
comparative averages subject to considerable volatility.
Among research associates, the average number per department
on external funding was lower this year in U.S. CS departments
at both public and private universities, while the average number
of RAs supported on institutional funds increased at both public
and private universities. The average number of full-support
fellows on internal funds declined in U.S. CS departments, mainly
due to decreases at private universities. The average number
of full-support fellows on external funds increased at U.S. CS
departments, again mainly due to private universities.
Among master’s students, 67.9 percent of support is for TAs, an
increase over the 66.8 percent reported last year. Conversely,
29.2 percent of support is for RAs, compared with last year’s
29.8 percent. The 108 U.S. CS departments that provided master’s
support data had an average number of TAs per department on
institutional funds of 23.2, compared to the 19.4 average reported
in last year’s survey and 16.7 reported two years ago (Table
G1a). This suggests that the use of master’s students continues
to increase to help departments cope with the CS enrollment
surge. Note, however, that master’s students are not eligible for
assistantships in several departments (Table G1b).
Table G1a. Master's Students Supported as Full-Time Students by Department Type
On Institutional Funds On External Funds Total
Department Type
# Dept
Teaching Assistants
Research Assistants
Full-Support Fellows
Teaching Assistants
Research Assistants
Full-Support Fellows
US CS Public 85 1,971.2 71.6% 146.5 5.3% 42.0 1.5% 36.0 1.3% 527.8 19.2% 31.0 1.1% 2,754.5
US CS Private 23 533.2 85.6% 20.3 3.3% 7.0 1.1% 2.5 0.4% 45.0 7.2% 15.0 2.4% 623.0
US CS Total 108 2,504.4 74.1% 166.8 4.9% 49.0 1.5% 38.5 1.1% 572.8 17.0% 46.0 1.4% 3,377.5
US CE 3 5.0 71.4% 1.0 14.3% 0.0 0.0% 0.0 0.0% 1.0 14.3% 0.0 0.0% 7.0
US I 13 128.9 56.8% 18.4 8.1% 32.0 14.1% 0.2 0.1% 45.3 20.0% 2.0 0.9% 226.8
Canadian 4 294.5 37.8% 269.0 34.5% 0.0 0.0% 8.0 1.0% 208.5 26.7% 0.0 0.0% 780.0
Grand Total 128 2,933 66.8% 455 10.4% 81 1.8% 47 1.1% 828 18.8% 48 1.1% 4,391
Table G1. Doctoral Students Supported as Full-Time Students by Department Type
On Institutional Funds On External Funds Total
Department Type
# Dept
Teaching Assistants
Research Assistants
Full-Support Fellows
Teaching Assistants
Research Assistants
Full-Support Fellows
US CS Public 91 3,625.3 39.6% 1,267.9 13.9% 383.9 4.2% 64.0 0.7% 3,547.6 38.8% 258.5 2.8% 9,147.2
US CS Private 32 675.7 17.1% 1,285.8 32.5% 285.5 7.2% 0.0 0.0% 1,542.9 39.0% 169.0 4.3% 3,958.9
US CS Total 123 4,301.0 32.8% 2,553.7 19.5% 669.4 5.1% 64.0 0.5% 5,090.5 38.8% 427.5 3.3% 13,106.1
US CE 4 85.0 30.9% 10.0 3.6% 14.0 5.1% 0.0 0.0% 164.0 59.6% 2.0 0.7% 275.0
US I 14 251.6 41.0% 117.2 19.1% 27.5 4.5% 1.6 0.3% 197.2 32.1% 19.0 3.1% 614.1
Canadian 6 224.0 42.9% 201.0 38.5% 4.0 0.8% 3.0 0.6% 90.0 17.2% 0.0 0.0% 522.0
Grand Total 147 4,861.6 33.5% 2,881.9 19.9% 714.9 4.9% 68.7 0.5% 5,541.7 38.2% 448.5 3.1% 14,517.2
2019 Taulbee Survey (continued)

cra.org/crn38 May 2020
Table G2 shows the distribution of stipends for TAs, RAs, and full-
support fellows. U.S. CS data are further broken down in this table
by public and private institution. Figures G1-G3 further break down
the U.S. CS data by size of department and by geographic location
of the university.
The median TA salaries at U.S. CS departments increased 2.5
percent at public universities and increased 4.1 percent at private
universities. Median salaries of RAs rose 1.5 percent at public
universities and 4.8 percent at private universities. For full-support
fellows, median salaries rose 2.9 percent at U.S. public universities
and 2.1 percent at U.S. private universities.
Compared with public U.S. CS departments, median stipends are
higher at private U.S. CS departments in each of the three stipend
categories, and based on the changes observed in the previous
paragraph, the gap grew this year for TAs and RAs. Median
stipends for TAs and RAs at U.S. I schools fall in between those
at public and private U.S. CS departments. These relationships
are unchanged from previous years. Median stipends for full-
support fellows at I schools are the same as that for public U.S. CS
departments. They also were nearly the same last year.
Median salaries of RAs are 3.7 percent higher than those of TAs at
U.S. CS public departments, less than one percent higher at U.S.
CS private departments, and 2.4 percent higher U.S. I departments.
Full support fellow median salaries are considerably higher than
RA salaries at U.S. CS public departments, but only modestly higher
at U.S. CS private and U.S. I departments.
At U.S. CS departments, larger departments have higher salaries
than do smaller departments for both TAs and RAs, except that
the smallest public departments (those of size 15 or less) have
higher TA (but not RA) stipends than those of size 16-25. Stipends
of full support fellows exhibit no clear relationship among public
departments, while private departments continue to show a
positive correlation between size and stipend.
2019 Taulbee Survey (continued)
Table G1b. Master's Students Eligibility for Assistantship Support
# Depts % of Depts
All master’s students are eligible for assistantships 88 62.0%
No master’s students are eligible for assistantships 12 8.5%
Students in some master’s programs but not others are eligible for assistantships 28 19.7%
Other* 14 9.9%
* Other responses divided between individual student qualifications (e.g. GPA or training) and department needs or resources (research needs, funds availability)

cra.org/crn39 May 2020
2019 Taulbee Survey (continued)
Figure G1. Teaching Assistantship Stipends
CRA Taulbee Survey 2019
Table G2. Fall 2019 Academic-Year Graduate Stipends by Department Type and Support Type
Teaching AssistantshipsPercentiles of Department Averages
Department Type # Depts 10th 25th 50th 75th 90th
US CS Public 100 $12,000 $16,568 $19,484 $21,911 $24,168US CS Private 28 $19,995 $23,776 $26,760 $30,858 $32,651US CE 5 $16,857US Information 12 $17,809 $20,834 $23,486 $26,044 $27,114Canadian 8 $7,790 $14,073 $16,438
Research AssistantshipsPercentiles of Department Averages
Department Type # Depts 10th 25th 50th 75th 90thUS CS Public 99 $14,815 $17,934 $20,212 $22,850 $25,534US CS Private 35 $22,056 $23,675 $27,000 $31,600 $33,497US CE 5 $24,633US Information 12 $20,118 $21,780 $24,045 $25,765 $26,158Canadian 7 $8,989 $11,000 $16,377
Full-Support FellowsPercentiles of Department Averages
Department Type # Depts 10th 25th 50th 75th 90thUS CS Public 64 $17,650 $20,188 $25,000 $30,000 $34,031US CS Private 33 $23,129 $25,292 $27,670 $32,520 $34,000US CE 4 $25,334US Information 9 $21,779 $25,000 $26,000Canadian 3

cra.org/crn40 May 2020
Figure G2. Research Assistantship Stipends
CRA Taulbee Survey 2019
Figure G3. Full Support Fellows Stipends
CRA Taulbee Survey 2019
2019 Taulbee Survey (continued)

cra.org/crn41 May 2020
Faculty Salaries(Tables S1-S21; Figures S1-S9)
Each department was asked to report individual (but anonymous)
faculty salaries if possible; otherwise, the department was
requested to provide the mean salary for each rank (full, associate,
and assistant professors and non-tenure-track teaching faculty,
research faculty, and post-doctorates) and the number of persons
at each rank. The salaries are those in effect on January 1, 2020 for
U.S. departments; nine-month salaries are reported in U.S. dollars.
For Canadian departments, twelve-month salaries are reported
in Canadian dollars. Respondents were asked to include salary
supplements such as salary monies from endowed positions.
U.S. CS data is reported in Tables S1-S16 and in the box and
whiskers diagrams. Data for CE, I, Canadian, and new Ph.D.s are
reported in Tables S17-S20. The tables and diagrams contain
distributional data (first decile, quartiles, and ninth decile) computed
from the department averages only. Thus, for example, a table row
labeled “50” or the median line in a diagram is the median of the
averages for the departments that reported within the stratum
(the number of such departments reporting is shown in the “depts”
row). Therefore, it is not a true median of all of the salaries.
We also report salary data for senior faculty based on time in rank,
for more meaningful comparison of individual or departmental
faculty salaries with national averages. We report associate
professor salaries for time in rank of 7 years or less, and of
more than 7 years. For full professors, we report time in rank of
7 years or less, 8 to 15 years, and more than 15 years. We also
disaggregate teaching faculty salaries into the two subclasses, for
teaching professors and other instructors. Within each subclass,
there is further breakdown into persons with time in rank of
less than 3 years, 3-5 years, 6-8 years, and 9 or more years. The
teaching faculty salary disaggregations are in Tables S1a to S19a.
Those departments reporting salary data are normally provided
a summary report in December; this year, the salary report was
distributed in April when the early version of this report was made
available to participating departments and CRA members. Next
Table S1. Nine-month Salaries, 142 Responses of 192 US CS Departments, Percentiles from Department Averages
Full Professor Associate Assistant Non-Tenure Track
In rank 16+ yrs
In rank 8-15 yrs
In rank 0-7 years
All years in rank
In rank 8+ years
In rank 0-7 years
All years in rank
Teach Research Postdoc
Depts 120 117 124 141 110 125 141 139 117 45 47
Indiv 713 556 718 2,068 403 604 1,072 1,228 1,105 311 327
10 $130,980 $135,374 $121,646 $127,443 $102,984 $109,657 $106,206 $92,663 $63,556 $60,973 $44,701
25 $153,698 $151,481 $139,637 $149,007 $110,633 $116,866 $113,722 $100,252 $73,691 $73,860 $53,893
50 $178,611 $170,794 $161,285 $168,867 $116,719 $124,786 $121,547 $107,553 $85,717 $100,000 $57,217
75 $208,495 $199,546 $178,392 $190,332 $129,199 $141,000 $135,536 $119,819 $100,241 $122,209 $67,055
90 $236,524 $221,550 $198,757 $208,257 $142,139 $152,122 $153,051 $129,157 $118,372 $146,281 $70,315
Table S1a. Nine-month Salaries, 142 Responses of 192 US CS Departments, Percentiles from Department Averages
Teaching Professor Other Instructor
Teaching 9+ years
Teaching 6-8 years
Teaching 3-5 years
Teaching <3 years
All years Teaching 9+ years
Teaching 6-8 years
Teaching 3-5 years
Teaching <3 years
All years
Depts 43 40 56 63 91 29 14 30 41 72
Indiv 111 64 148 192 644 79 41 90 124 461
10 $74,538 $73,389 $69,606 $68,486 $72,437 $60,535 $61,165 $59,625 $52,734 $52,826
25 $88,773 $82,097 $79,802 $80,000 $82,200 $70,382 $72,359 $67,981 $66,083 $65,672
50 $103,371 $93,234 $90,838 $88,020 $89,500 $81,396 $75,193 $75,703 $72,513 $72,877
75 $124,000 $108,413 $110,287 $101,088 $107,677 $96,697 $87,351 $86,830 $87,267 $85,690
90 $140,817 $133,848 $132,563 $116,213 $123,325 $123,822 $103,332 $104,383 $97,218 $108,928
2019 Taulbee Survey (continued)

cra.org/crn42 May 2020
Table S2. Nine-month Salaries, 105 Responses of 139 US CS Public (All Public), Percentiles from Department Averages
Full Professor Associate Assistant Non-Tenure Track
In rank 16+ yrs
In rank 8-15 yrs
In rank 0-7 years
All years in rank
In rank 8+ years
In rank 0-7 years
All years in rank
Teach Research Postdoc
Depts 87 86 94 104 83 89 104 103 85 30 30
Indiv 485 392 513 1462 302 404 761 911 764 183 158
10 $127,609 $128,701 $119,650 $126,791 $100,764 $105,715 $104,612 $91,628 $62,276 $53,385 $43,800
25 $146,244 $147,994 $132,495 $143,998 $107,937 $115,639 $111,185 $97,690 $72,270 $69,242 $53,870
50 $172,696 $165,267 $151,569 $163,142 $115,973 $123,583 $119,560 $104,026 $82,400 $82,404 $55,852
75 $193,340 $190,046 $171,892 $179,190 $126,530 $133,452 $130,990 $114,900 $90,162 $111,275 $62,898
90 $212,502 $204,833 $185,195 $196,732 $138,688 $143,514 $143,228 $124,130 $109,882 $130,929 $68,650
Table S2a. Nine-month Salaries, 105 Responses of 139 US CS Public (All Public), Percentiles from Department Averages
Teaching Professor Other Instructor
Non-Tenure Track
Teaching 9+ years
Teaching 6-8 years
Teaching 3-5 years
Teaching <3 years
All years Teaching 9+ years
Teaching 6-8 years
Teaching 3-5 years
Teaching <3 years
All years
Depts 28 28 40 44 63 25 11 23 28 54
Indiv 65 40 102 129 429 67 29 73 87 335
10 $72,079 $72,577 $67,708 $63,742 $69,109 $59,826 $58,129 $60,627 $36,175 $51,240
25 $84,123 $80,714 $78,444 $78,703 $78,619 $66,972 $70,162 $67,526 $60,770 $63,276
50 $94,636 $89,674 $85,166 $86,125 $87,500 $76,128 $73,452 $71,287 $70,000 $69,890
75 $108,435 $104,173 $95,071 $91,191 $100,180 $89,159 $78,982 $82,749 $80,786 $79,586
90 $135,920 $118,243 $115,693 $105,108 $117,181 $100,881 $85,714 $88,184 $87,416 $86,669
2019 Taulbee Survey (continued)
year will return to the earlier distribution of the salary report to
participants. In the salary report, those departments that provided
individual salaries were additionally provided more comprehensive
distributional information based on these individual salaries.
The response rates from U.S. CS, U.S. CE, U.S. Information, and
Canadian departments increased over last year’s rates. This year’s
respective response rates for those departments were 73, 20, 68 and
31 percent; last year’s respective rates were 70, 15, 60 and 27 percent.
The total number of respondents this year was 172, while last year
we had 164 respondents. The number of respondents this year was
exactly the same as two years ago. As always, we urge caution in
drawing conclusions from those categories with low response rates.
This year, 63 percent of those reporting salary data provided salaries
at the individual level. This is down from last year’s 68 percent.
Salaries at private institutions tend to be higher than those at
public institutions for all faculty types (Tables S2 and S3). This
pattern is consistent with data from previous years.
When viewed relative to faculty size, salaries tend to be higher for
larger departments at both public and private institutions (perhaps
best seen in Figures S1-S9). This pattern holds for all tenure-track
ranks. It also holds for teaching faculty, research faculty and postdoc
salaries, with the exception of research faculty at public institutions.
When viewed relative to type of locale, public institution salaries
appear to be generally lower in smaller locales than in mid-size
or large cities for all tenure-track faculty ranks. Private institution
salaries exhibit the opposite pattern, except for associate
professors with 0-7 years in rank. Teaching faculty salaries at both
public and private institutions tend to be higher in large cities
than in smaller locales (Figures S1-S7).
Our analysis of faculty salary changes from one year to the next
uses only those departments that reported both years; otherwise,
the departments that reported during only one year can skew
the comparison. Because some departments that reported both
years provided only aggregate salaries for their full and associate

cra.org/crn43 May 2020
Table S3. Nine-month Salaries, 37 Responses of 53 US CS Private (All Private), Percentiles from Department Averages
Full Professor Associate Assistant Non-Tenure Track
In rank 16+ yrs
In rank 8-15 yrs
In rank 0-7 years
All years in rank
In rank 8+ years
In rank 0-7 years
All years in rank
Teach Research Postdoc
Depts 33 31 30 37 27 36 37 36 32 15 17
Indiv 228 164 205 606 101 200 311 317 341 128 169
10 $157,813 $156,404 $146,136 $139,493 $110,395 $118,203 $114,788 $102,882 $79,451 $95,364 $46,867
25 $180,060 $175,097 $162,540 $169,667 $112,875 $122,768 $120,998 $110,292 $84,459 $102,500 $54,996
50 $217,020 $199,525 $177,531 $194,991 $118,728 $142,100 $138,667 $119,150 $101,209 $115,000 $61,980
75 $238,950 $220,725 $197,940 $211,541 $133,262 $151,889 $148,760 $128,443 $110,717 $145,828 $68,763
90 $255,329 $234,338 $207,052 $232,976 $153,342 $167,268 $161,404 $132,715 $126,052 $162,626 $70,875
Table S3a. Nine-month Salaries, 37 Responses of 53 US CS Private (All Private), Percentiles from Department Averages
Teaching Professor Other Instructor
Teaching 9+ years
Teaching 6-8 years
Teaching 3-5 years
Teaching <3 years
All years Teaching 9+ years
Teaching 6-8 years
Teaching 3-5 years
Teaching <3 years
All years
Depts 15 12 16 19 28 4 3 7 13 18
Indiv 46 24 46 63 215 12 17 37 126
10 $95,956 $81,181 $82,081 $79,190 $84,377 $69,550 $67,930
25 $104,616 $90,997 $92,512 $87,026 $89,004 $77,214 $83,500 $77,331
50 $121,090 $106,686 $111,612 $94,389 $103,992 $126,098 $91,503 $88,000 $89,687
75 $131,875 $121,143 $119,635 $112,850 $121,485 $102,717 $99,000 $105,174
90 $140,443 $142,791 $136,619 $139,668 $129,081 $105,262 $110,215
2019 Taulbee Survey (continued)
professors during one year and in the other year reported them by
years in rank, we only report salary changes for all full professors
and for all associate professors in the year-to-year comparison.
Similarly, we do not disaggregate teaching faculty by years in
rank in the year to year comparison, though we do distinguish
teaching professors from other instructors. Table S21 shows, by
type of faculty and type of department, the change in the median
of the average salaries from departments that reported both
years (the number of departments being compared is indicated
in parentheses in each column heading). Using the cell showing
full professors at U.S. CS departments as an example, the table
indicates that the median of the 129 average salaries for full
professors was 3.7 percent higher in 2019-20 than was the median
of the average full professor salaries in 2018-19 from these same
129 departments.
When interpreting these changes, it is important to remember the
effect that promotions have on the departmental data from one
year to the next, since a promotion causes an individual faculty
member to move from one rank to another. Thus, a department
with a small number of faculty members in a particular rank can
have its average salary in that rank change appreciably (in either
direction) by a single promotion to or from that rank. Departures
via resignation or retirement also impact these figures, particularly
in the non-tenure-track categories. Because of the small
number of Canadian schools, Information schools, and Computer
Engineering departments reporting, the values in those columns
are considerably more volatile; this is evident in several of the
entries in Table S21.
For new Ph.D.s in tenure-track positions at U.S. computer science,
computer engineering and I-school departments, the median of the
averages was $112,555, an increase of 5.5 percent over last year
(Table S20). Again this year, there was an insufficient response
from Canadian institutions to report any results regarding
Canadian salaries for new Ph.Ds.

cra.org/crn44 May 2020
2019 Taulbee Survey (continued)
Table S4a. Nine-month Salaries, 20 Responses of US CS Public With <=15 Tenure-Track Faculty, Percentiles from Department Averages
Teaching Professor Other Instructor
Teaching 9+ years
Teaching 6-8 years
Teaching 3-5 years
Teaching <3 years
All years Teaching 9+ years
Teaching 6-8 years
Teaching 3-5 years
Teaching <3 years
All years
Depts 4 3 4 8 10 2 0 3 4 7
Indiv 5 10 13 32 6 20
10 $59,770
25 $64,709 $68,524 $59,161
50 $77,956 $89,074 $78,135 $82,010 $59,412 $63,823
75 $85,438 $87,861 $68,939
90 $89,951
Table S4. Nine-month Salaries, 20 Responses of US CS Public With <=15 Tenure-Track Faculty, Percentiles from Department Averages
Full Professor Associate Assistant Non-Tenure Track
In rank 16+ yrs
In rank 8-15 yrs
In rank 0-7 years
All years in rank
In rank 8+ years
In rank 0-7 years
All years in rank
Teach Research Postdoc
Depts 12 9 16 19 15 12 19 18 13 0 1
Indiv 19 17 40 86 39 30 80 67 52
10 $113,283 $112,384 $114,466 $93,871 $101,126 $94,784 $87,162 $58,782
25 $117,229 $114,358 $116,630 $122,476 $96,516 $102,590 $100,915 $89,693 $62,697
50 $133,253 $129,223 $122,372 $127,305 $101,345 $111,466 $107,535 $95,548 $74,461
75 $148,265 $150,008 $127,991 $140,164 $112,516 $116,462 $115,869 $98,275 $79,518
90 $193,732 $163,021 $153,209 $133,789 $119,690 $122,435 $101,018 $87,895
Table S5. Nine-month Salaries, 36 Responses of US CS Public With 10 < Tenure-Track Faculty <=20, Percentiles from Department Averages
Full Professor Associate Assistant Non-Tenure Track
In rank 16+ yrs
In rank 8-15 yrs
In rank 0-7 years
All years in rank
In rank 8+ years
In rank 0-7 years
All years in rank
Teach Research Postdoc
Depts 24 26 31 36 27 29 36 35 26 4 4
Indiv 54 66 90 232 80 86 185 159 125 19 6
10 $113,653 $112,349 $112,065 $114,874 $94,741 $102,687 $101,280 $89,702 $59,046
25 $123,131 $128,439 $116,260 $125,846 $102,256 $105,706 $105,565 $92,414 $62,350
50 $140,535 $150,229 $126,083 $141,770 $107,700 $112,072 $110,850 $97,291 $72,062 $95,925 $56,000
75 $160,837 $170,924 $141,455 $154,452 $112,885 $116,899 $117,337 $102,779 $79,189
90 $188,751 $204,667 $149,985 $173,059 $118,350 $125,079 $123,830 $108,611 $87,056

cra.org/crn45 May 2020
Table S5a. Nine-month Salaries, 36 Responses of US CS Public With 10 < Tenure-Track Faculty <=20, Percentiles from Department Averages
Teaching Professor Other Instructor
Teaching 9+ years
Teaching 6-8 years
Teaching 3-5 years
Teaching <3 years
All years Teaching 9+ years
Teaching 6-8 years
Teaching 3-5 years
Teaching <3 years
All years
Depts 6 7 8 9 16 7 2 8 10 19
Indiv 8 9 9 17 47 12 20 22 78
10 $63,281 $26,056 $41,149
25 $68,043 $69,690 $74,542 $69,601 $60,004 $61,413 $53,301 $54,641
50 $80,557 $81,600 $75,909 $80,000 $75,408 $71,067 $69,929 $59,540 $63,823
75 $85,245 $85,141 $84,750 $85,075 $85,343 $77,758 $68,456 $72,231
90 $87,741 $80,333 $82,635
2019 Taulbee Survey (continued)
Table S6. Nine-month Salaries, 34 Responses of US CS Public With 15 < Tenure-Track Faculty <=25, Percentiles from Department Averages
Full Professor Associate Assistant Non-Tenure Track
In rank 16+ yrs
In rank 8-15 yrs
In rank 0-7 years
All years in rank
In rank 8+ years
In rank 0-7 years
All years in rank
Teach Research Postdoc
Depts 26 29 29 34 24 29 34 34 26 6 4
Indiv 71 78 109 288 71 79 178 211 154 24 7
10 $125,744 $119,309 $112,486 $133,608 $104,441 $105,052 $105,694 $91,728 $61,709
25 $138,469 $140,719 $127,408 $142,673 $109,786 $110,000 $110,142 $96,289 $64,940
50 $159,049 $158,149 $142,672 $152,717 $114,758 $116,866 $115,484 $101,567 $73,502 $91,859 $55,770
75 $178,374 $190,000 $151,770 $171,139 $120,506 $124,600 $123,608 $107,295 $81,611
90 $200,367 $207,016 $168,494 $178,421 $127,033 $129,446 $131,355 $113,989 $87,956
Table S6a. Nine-month Salaries, 34 Responses of US CS Public With 15 < Tenure-Track Faculty <=25, Percentiles from Department Averages
Teaching Professor Other Instructor
Non-Tenure Track
Teaching 9+ years
Teaching 6-8 years
Teaching 3-5 years
Teaching <3 years
All years Teaching 9+ years
Teaching 6-8 years
Teaching 3-5 years
Teaching <3 years
All years
Depts 6 7 10 9 15 8 4 10 9 20
Indiv 8 9 16 23 62 13 6 25 23 92
10 $62,754 $63,141 $60,125 $42,682
25 $71,961 $66,069 $74,542 $71,250 $65,450 $65,793 $57,080 $62,933
50 $88,753 $81,600 $75,909 $80,000 $75,818 $72,104 $70,850 $75,703 $67,825 $68,292
75 $85,245 $81,827 $84,063 $86,603 $77,648 $79,508 $80,000 $78,523
90 $94,461 $90,076 $85,991 $85,035

cra.org/crn46 May 2020
2019 Taulbee Survey (continued)
Table S7. Nine-month Salaries, 24 Responses of US CS Public With 20 < Tenure-Track Faculty <=35, Percentiles from Department Averages
Full Professor Associate Assistant Non-Tenure Track
In rank 16+ yrs
In rank 8-15 yrs
In rank 0-7 years
All years in rank
In rank 8+ years
In rank 0-7 years
All years in rank
Teach Research Postdoc
Depts 22 21 21 24 20 21 24 24 20 7 6
Indiv 92 60 86 271 67 62 155 206 179 15 18
10 $138,649 $136,459 $131,910 $143,426 $107,941 $113,109 $110,915 $97,738 $67,405
25 $150,279 $143,305 $149,663 $153,752 $110,723 $116,677 $115,665 $101,571 $72,075 $51,881
50 $169,597 $156,408 $153,015 $164,740 $117,828 $124,057 $119,462 $104,935 $74,460 $69,144 $55,560
75 $187,576 $174,523 $167,667 $181,213 $126,148 $131,630 $125,364 $108,781 $84,197 $88,439
90 $199,309 $203,501 $177,976 $187,520 $132,953 $142,500 $132,866 $116,602 $89,435
Table S7a. Nine-month Salaries, 24 Responses of US CS Public With 20 < Tenure-Track Faculty <=35, Percentiles from Department Averages
Teaching Professor Other Instructor
Teaching 9+ years
Teaching 6-8 years
Teaching 3-5 years
Teaching <3 years
All years Teaching 9+ years
Teaching 6-8 years
Teaching 3-5 years
Teaching <3 years
All years
Depts 6 6 9 9 13 7 5 8 8 17
Indiv 11 8 27 26 100 15 7 16 23 79
10 $72,471 $53,195
25 $77,351 $68,107 $75,496 $66,971 $68,328 $58,143 $63,382
50 $88,773 $83,031 $78,948 $83,276 $80,790 $73,140 $73,452 $71,869 $67,027 $68,752
75 $92,708 $88,000 $89,154 $80,290 $81,800 $74,411 $80,000
90 $95,617 $85,206
Table S8. Nine-month Salaries, 41 Responses of US CS Public With Tenure-Track Faculty >30, Percentiles from Department Averages
Full Professor Associate Assistant Non-Tenure Track
In rank 16+ yrs
In rank 8-15 yrs
In rank 0-7 years
All years in rank
In rank 8+ years
In rank 0-7 years
All years in rank
Teach Research Postdoc
Depts 40 40 41 41 35 40 41 41 38 21 22
Indiv 352 275 335 973 159 260 423 549 491 153 142
10 $161,515 $148,001 $144,365 $159,699 $107,936 $120,668 $116,660 $102,634 $75,650 $66,873 $42,200
25 $169,619 $158,095 $153,055 $166,581 $112,814 $123,589 $119,360 $104,824 $85,102 $70,000 $47,810
50 $179,841 $176,306 $170,983 $177,294 $123,775 $133,426 $127,608 $115,204 $91,241 $81,930 $55,394
75 $202,937 $193,489 $181,310 $194,367 $135,269 $141,646 $141,831 $123,632 $106,964 $106,128 $64,044
90 $223,458 $211,575 $207,427 $202,335 $143,146 $151,929 $153,051 $129,720 $120,381 $119,300 $69,848

cra.org/crn47 May 2020
2019 Taulbee Survey (continued)
Table S8a. Nine-month Salaries, 41 Responses of US CS Public With Tenure-Track Faculty >30, Percentiles from Department Averages
Teaching Professor Other Instructor
Teaching 9+ years
Teaching 6-8 years
Teaching 3-5 years
Teaching <3 years
All years Teaching 9+ years
Teaching 6-8 years
Teaching 3-5 years
Teaching <3 years
All years
Depts 15 16 23 24 33 12 4 7 11 20
Indiv 45 25 66 89 304 41 18 37 46 187
10 $92,070 $87,287 $79,779 $81,040 $85,254 $70,446 $66,083 $57,035
25 $94,636 $90,113 $84,291 $86,653 $88,122 $74,851 $69,519 $70,313 $68,338
50 $107,619 $99,520 $91,055 $90,500 $99,290 $86,538 $81,050 $80,545 $72,513 $71,589
75 $131,313 $112,165 $103,604 $102,301 $113,119 $91,044 $94,977 $85,494 $83,947
90 $146,018 $131,094 $145,870 $114,123 $125,380 $120,950 $91,125 $94,607
Table S9. Nine-month Salaries, 11 Responses of US CS Private With <=20 Tenure-Track Faculty, Percentiles from Department Averages
Full Professor Associate Assistant Non-Tenure Track
In rank 16+ yrs
In rank 8-15 yrs
In rank 0-7 years
All years in rank
In rank 8+ years
In rank 0-7 years
All years in rank
Teach Research Postdoc
Depts 8 6 7 11 10 10 11 11 8 2 4
Indiv 25 15 19 64 24 25 50 40 42 6
10 $125,912 $108,400 $114,397 $112,113 $95,880
25 $174,449 $144,740 $142,817 $111,043 $118,363 $114,484 $103,309 $78,357
50 $191,892 $186,093 $170,000 $179,809 $116,521 $120,134 $120,484 $107,835 $84,405 $53,098
75 $238,538 $180,631 $198,202 $124,071 $134,983 $124,577 $122,050 $93,224
90 $207,500 $132,162 $141,835 $138,667 $127,500
Table S9a. Nine-month Salaries, 11 Responses of US CS Private With <=20 Tenure-Track Faculty, Percentiles from Department Averages
Teaching Professor Other Instructor
Non-Tenure Track
Teaching 9+ years
Teaching 6-8 years
Teaching 3-5 years
Teaching <3 years
All years Teaching 9+ years
Teaching 6-8 years
Teaching 3-5 years
Teaching <3 years
All years
Depts 4 2 5 5 8 0 0 0 1 2
Indiv 4 9 18 38
10
25 $82,235
50 $106,284 $86,600 $82,250 $87,752
75 $93,224
90

cra.org/crn48 May 2020
2019 Taulbee Survey (continued)
Table S10. Nine-month Salaries, 16 Responses of US CS Private With 15 < Tenure-Track Faculty <=30, Percentiles from Department Averages
Full Professor Associate Assistant Non-Tenure Track
In rank 16+ yrs
In rank 8-15 yrs
In rank 0-7 years
All years in rank
In rank 8+ years
In rank 0-7 years
All years in rank
Teach Research Postdoc
Depts 14 14 12 16 11 16 16 16 15 8 8
Indiv 68 57 57 188 24 65 90 99 100 36 58
10 $181,865 $172,742 $162,516 $172,768 $111,750 $118,656 $119,760 $109,068 $79,328
25 $192,896 $185,621 $163,341 $182,712 $114,625 $130,292 $128,145 $115,577 $86,759 $96,704 $55,713
50 $211,088 $201,251 $174,181 $195,330 $118,728 $140,600 $139,071 $119,150 $102,200 $105,063 $60,990
75 $240,658 $217,679 $183,816 $202,175 $132,938 $149,040 $144,005 $126,988 $109,409 $132,486 $68,471
90 $253,483 $224,307 $194,806 $220,155 $138,900 $167,030 $161,613 $136,132 $117,882
Table S10a. Nine-month Salaries, 16 Responses of US CS Private With 15 < Tenure-Track Faculty <=30, Percentiles from Department Averages
Teaching Professor Other Instructor
Teaching 9+ years
Teaching 6-8 years
Teaching 3-5 years
Teaching <3 years
All years Teaching 9+ years
Teaching 6-8 years
Teaching 3-5 years
Teaching <3 years
All years
Depts 8 6 7 11 15 1 0 2 6 8
Indiv 14 8 14 32 75 17 25
10 $75,948 $85,598
25 $102,427 $110,190 $84,588 $88,971 $75,168
50 $107,931 $96,835 $112,800 $87,401 $102,200 $93,000 $86,601
75 $115,049 $120,590 $101,570 $113,675 $94,689
90 $116,433 $121,954
Table S11. Nine-month Salaries, 26 Responses of US CS Private With Tenure-Track Faculty >20, Percentiles from Department Averages
Full Professor Associate Assistant Non-Tenure Track
In rank 16+ yrs
In rank 8-15 yrs
In rank 0-7 years
All years in rank
In rank 8+ years
In rank 0-7 years
All years in rank
Teach Research Postdoc
Depts 25 25 23 26 17 26 26 25 24 13 13
Indiv 203 149 186 542 77 175 261 277 299 122 163
10 $160,335 $157,078 $150,310 $155,124 $111,221 $120,784 $120,757 $110,105 $83,722 $94,599 $47,578
25 $191,292 $182,267 $162,580 $177,823 $114,395 $134,850 $131,268 $116,312 $93,122 $105,000 $60,000
50 $218,574 $199,525 $183,733 $196,624 $123,714 $147,904 $144,092 $121,377 $104,015 $115,000 $68,616
75 $238,950 $220,356 $201,236 $222,110 $138,900 $158,791 $155,820 $129,079 $112,106 $148,092 $69,278
90 $267,363 $231,900 $211,440 $237,434 $157,974 $171,297 $164,201 $135,828 $127,908 $166,138 $70,958

cra.org/crn49 May 2020
2019 Taulbee Survey (continued)
Table S11a. Nine-month Salaries, 26 Responses of US CS Private With Tenure-Track Faculty >20, Percentiles from Department Averages
Teaching Professor Other Instructor
Teaching 9+ years
Teaching 6-8 years
Teaching 3-5 years
Teaching <3 years
All years Teaching 9+ years
Teaching 6-8 years
Teaching 3-5 years
Teaching <3 years
All years
Depts 11 10 11 14 20 4 3 7 12 16
Indiv 42 22 37 45 177 12 17 35 122
10 $103,371 $79,819 $94,482 $87,208 $93,690 $76,525 $71,758
25 $107,931 $90,321 $107,017 $93,091 $98,325 $77,214 $84,625 $83,093
50 $121,275 $106,686 $112,800 $101,713 $111,966 $126,098 $91,503 $89,000 $91,065
75 $131,875 $116,617 $118,050 $124,157 $122,416 $102,717 $99,618 $107,154
90 $141,191 $144,764 $127,576 $143,665 $136,077 $105,736 $110,309
Table S12. Nine-month Salaries, 41 Responses of US CS Public In Large City or Suburbs, Percentiles from Department Averages
Full Professor Associate Assistant Non-Tenure Track
In rank 16+ yrs
In rank 8-15 yrs
In rank 0-7 years
All years in rank
In rank 8+ years
In rank 0-7 years
All years in rank
Teach Research Postdoc
Depts 35 35 38 41 34 36 41 40 33 11 15
Indiv 199 154 216 602 130 188 345 347 336 114 97
10 $135,258 $140,112 $125,248 $139,444 $105,187 $105,712 $108,017 $94,878 $62,255 $60,616 $44,918
25 $159,049 $149,220 $135,579 $150,903 $111,667 $115,650 $111,389 $101,403 $73,691 $68,952 $53,893
50 $177,875 $170,641 $153,585 $165,519 $119,779 $124,693 $121,920 $107,239 $83,843 $104,712 $55,204
75 $193,173 $190,829 $171,591 $182,767 $128,414 $133,390 $130,814 $116,447 $90,162 $129,211 $58,662
90 $211,580 $203,532 $184,664 $194,851 $138,569 $143,119 $141,831 $120,223 $107,363 $141,300 $63,707
Table S12a Nine-month Salaries, 41 Responses of US CS Public In Large City or Suburbs, Percentiles from Department Averages
Teaching Professor Other Instructor
Non-Tenure Track
Teaching 9+ years
Teaching 6-8 years
Teaching 3-5 years
Teaching <3 years
All years Teaching 9+ years
Teaching 6-8 years
Teaching 3-5 years
Teaching <3 years
All years
Depts 12 15 16 19 25 9 5 11 11 22
Indiv 29 23 41 69 205 21 11 29 28 131
10 $91,398 $73,476 $77,683 $72,117 $72,198 $60,000 $52,734 $53,236
25 $93,768 $84,914 $81,419 $78,273 $79,240 $71,019 $65,218 $63,720 $63,897
50 $96,048 $93,805 $87,506 $88,335 $88,122 $86,262 $74,000 $77,667 $71,500 $71,676
75 $110,788 $105,873 $93,281 $90,739 $96,848 $89,290 $83,133 $80,000 $79,586
90 $132,322 $119,762 $106,641 $107,998 $114,971 $105,000 $83,327 $86,239

cra.org/crn50 May 2020
2019 Taulbee Survey (continued)
Table S13. Nine-month Salaries, 25 Responses of US CS Public In Midsize City or Suburbs, Percentiles from Department Averages
Full Professor Associate Assistant Non-Tenure Track
In rank 16+ yrs
In rank 8-15 yrs
In rank 0-7 years
All years in rank
In rank 8+ years
In rank 0-7 years
All years in rank
Teach Research Postdoc
Depts 21 21 21 25 19 24 25 25 19 7 4
Indiv 131 108 148 395 69 91 169 238 168 34 27
10 $140,629 $126,480 $127,408 $146,590 $105,787 $110,000 $108,961 $93,526 $62,789
25 $157,978 $155,484 $146,402 $156,323 $109,300 $116,605 $115,707 $97,291 $72,522 $80,256
50 $176,833 $165,000 $164,800 $171,200 $116,363 $126,162 $121,179 $103,647 $85,681 $94,000 $60,234
75 $199,591 $185,917 $174,000 $184,790 $124,299 $139,394 $135,052 $117,500 $95,134 $112,419
90 $224,380 $199,546 $185,544 $200,416 $141,915 $150,316 $156,810 $139,277 $147,905
Table S13a. Nine-month Salaries, 25 Responses of US CS Public In Midsize City or Suburbs, Percentiles from Department Averages
Teaching Professor Other Instructor
Teaching 9+ years
Teaching 6-8 years
Teaching 3-5 years
Teaching <3 years
All years Teaching 9+ years
Teaching 6-8 years
Teaching 3-5 years
Teaching <3 years
All years
Depts 7 6 9 8 11 5 3 3 4 9
Indiv 21 9 22 21 77 18 18 91
10 $72,437
25 $85,714 $74,000 $76,479 $75,939 $67,833
50 $108,494 $89,279 $79,250 $81,276 $89,500 $71,067 $85,246 $75,228
75 $139,100 $113,264 $92,907 $110,939 $85,681
90 $144,560
Table S14. Nine-month Salaries, 39 Responses of US CS Public in Small City, Town, or Rural, Percentiles from Department Averages
Full Professor Associate Assistant Non-Tenure Track
In rank 16+ yrs
In rank 8-15 yrs
In rank 0-7 years
All years in rank
In rank 8+ years
In rank 0-7 years
All years in rank
Teach Research Postdoc
Depts 31 30 35 38 30 29 38 38 33 12 11
Indiv 155 130 149 465 103 125 247 326 260 35 34
10 $121,300 $127,426 $112,587 $123,570 $100,245 $106,488 $102,535 $89,130 $63,733 $54,536 $42,000
25 $132,568 $143,994 $124,404 $130,542 $105,079 $114,210 $106,930 $95,520 $71,078 $67,235 $50,972
50 $154,380 $158,197 $144,365 $150,076 $111,350 $119,163 $115,541 $102,958 $78,200 $71,930 $55,584
75 $183,634 $188,742 $172,233 $172,618 $124,518 $131,630 $124,639 $108,281 $89,250 $83,909 $64,560
90 $201,368 $211,575 $181,132 $188,777 $132,419 $136,839 $135,358 $123,819 $101,373 $110,391 $69,998

cra.org/crn51 May 2020
2019 Taulbee Survey (continued)
Table S14a. Nine-month Salaries, 39 Responses of US CS Public in Small City, Town, or Rural, Percentiles from Department Averages
Teaching Professor Other Instructor
Teaching 9+ years
Teaching 6-8 years
Teaching 3-5 years
Teaching <3 years
All years Teaching 9+ years
Teaching 6-8 years
Teaching 3-5 years
Teaching <3 years
All years
Depts 9 7 15 17 27 11 3 9 13 23
Indiv 15 8 39 39 147 28 25 41 113
10 $69,206 $64,484 $68,693 $59,117 $40,000 $51,211
25 $73,497 $73,510 $77,104 $80,000 $76,599 $65,099 $67,751 $57,080 $62,969
50 $82,414 $82,262 $86,928 $84,750 $86,664 $76,128 $69,858 $67,825 $68,666
75 $86,345 $95,630 $96,594 $91,000 $96,044 $84,105 $71,287 $70,625 $73,310
90 $103,629 $102,369 $108,041 $89,423 $80,741 $84,574
Table S15. Nine-month Salaries, 24 Responses of US CS Private in Large City or Suburbs, Percentiles from Department Averages
Full Professor Associate Assistant Non-Tenure Track
In rank 16+ yrs
In rank 8-15 yrs
In rank 0-7 years
All years in rank
In rank 8+ years
In rank 0-7 years
All years in rank
Teach Research Postdoc
Depts 21 19 20 24 19 24 24 23 22 12 11
Indiv 148 99 155 409 85 152 238 230 293 119 112
10 $147,845 $152,110 $147,022 $136,992 $110,508 $115,524 $114,043 $101,812 $79,451 $97,895 $45,168
25 $178,221 $163,578 $161,837 $167,586 $111,560 $123,885 $122,379 $110,820 $85,778 $107,594 $56,107
50 $214,187 $186,056 $180,799 $190,266 $118,728 $139,834 $137,856 $118,500 $101,209 $121,897 $61,980
75 $235,231 $219,786 $196,647 $205,598 $135,314 $149,743 $146,549 $128,446 $110,968 $145,696 $70,035
90 $243,996 $229,462 $205,940 $229,834 $156,406 $167,813 $159,291 $133,004 $123,233 $167,894 $71,000
Table S15a. Nine-month Salaries, 24 Responses of US CS Private in Large City or Suburbs, Percentiles from Department Averages
Teaching Professor Other Instructor
Non-Tenure Track
Teaching 9+ years
Teaching 6-8 years
Teaching 3-5 years
Teaching <3 v
All years Teaching 9+ years
Teaching 6-8 years
Teaching 3-5 years
Teaching <3 years
All years
Depts 12 11 13 14 19 4 3 6 11 14
Indiv 40 23 40 48 176 12 16 32 117
10 $94,515 $80,645 $82,253 $87,208 $86,159 $68,000 $67,836
25 $105,239 $94,642 $94,482 $93,143 $91,647 $80,375 $74,003
50 $123,907 $107,669 $110,423 $105,814 $102,200 $126,098 $96,312 $88,000 $89,687
75 $136,834 $125,135 $118,680 $125,948 $122,260 $95,670 $105,174
90 $141,004 $143,866 $126,561 $143,665 $128,602 $106,210 $110,049

cra.org/crn52 May 2020
2019 Taulbee Survey (continued)
Table S16. Nine-month Salaries, 13 Responses of US CS Private in Other than Large City, Percentiles from Department Averages
Full Professor Associate Assistant Non-Tenure Track
In rank 16+ yrs
In rank 8-15 yrs
In rank 0-7 years
All years in rank
In rank 8+ years
In rank 0-7 years
All years in rank
Teach Research Postdoc
Depts 12 12 10 13 8 12 13 13 10 3 6
Indiv 80 65 50 197 16 48 73 87 48 57
10 $164,652 $163,642 $143,400 $156,668 $118,417 $116,900 $105,925 $82,685
25 $188,484 $182,312 $162,887 $175,870 $117,354 $120,819 $120,998 $107,835 $85,507
50 $229,979 $209,130 $173,967 $208,257 $122,234 $143,623 $141,096 $119,800 $100,524 $64,520
75 $246,840 $221,767 $196,870 $214,326 $132,009 $157,208 $154,883 $126,500 $107,958
90 $272,089 $234,829 $210,676 $238,489 $163,273 $161,198 $131,489 $164,608
Table S16a. Nine-month Salaries, 13 Responses of US CS Private in Other than Large City, Percentiles from Department Averages
Teaching Professor Other Instructor
Teaching 9+ years
Teaching 6-8 years
Teaching 3-5 years
Teaching <3 years
All years Teaching 9+ years
Teaching 6-8 years
Teaching 3-5 years
Teaching <3 years
All years
Depts 3 1 3 5 9 0 0 1 2 4
Indiv 15 39 9
10
25 $89,037
50 $82,250 $105,784 $92,486
75 $110,931
90
Table S17. Nine-month Salaries, 7 Responses of 35 US Computer Engineering Departments, Percentiles from Department Averages
Full Professor Associate Assistant Non-Tenure Track
In rank 16+ yrs
In rank 8-15 yrs
In rank 0-7 years
All years in rank
In rank 8+ years
In rank 0-7 years
All years in rank
Teach Research Postdoc
Depts 7 7 7 7 7 7 7 7 4 2 2
Indiv 41 19 37 103 17 32 49 47 15
10
25 $167,235 $132,705 $133,008 $142,821 $104,414 $108,909 $106,057 $95,728
50 $173,254 $147,187 $154,494 $163,759 $107,835 $129,084 $111,327 $101,756 $94,237
75 $188,898 $169,336 $158,623 $184,582 $115,573 $131,632 $129,201 $114,075
90

cra.org/crn53 May 2020
2019 Taulbee Survey (continued)
Table S17a. Nine-month Salaries, 7 Responses of 35 US Computer Engineering Departments, Percentiles from Department Averages
Teaching Professor Other Instructor
Teaching 9+ years
Teaching 6-8 years
Teaching 3-5 years
Teaching <3 years
All years Teaching 9+ years
Teaching 6-8 years
Teaching 3-5 years
Teaching <3 years
All years
Depts 1 1 0 2 3 2 1 1 1 2
Indiv
10
25
50
75
90
Table S18. Nine-month Salaries, 16 Responses of 23 US Information Departments, Percentiles from Department Averages
Full Professor Associate Assistant Non-Tenure Track
In rank 16+ yrs
In rank 8-15 yrs
In rank 0-7 years
All years in rank
In rank 8+ years
In rank 0-7 years
All years in rank
Teach Research Postdoc
Depts 10 13 16 16 13 16 16 16 14 5 5
Indiv 44 55 79 178 55 106 161 176 186 31 19
10 $168,531 $149,049 $120,127 $129,120 $102,006 $104,469 $101,952 $87,315 $69,930
25 $179,380 $159,300 $132,658 $144,597 $107,431 $118,406 $116,622 $98,463 $76,929
50 $190,659 $166,253 $153,863 $167,411 $116,891 $125,272 $125,015 $106,151 $89,870 $69,149 $54,318
75 $205,510 $190,557 $163,966 $174,940 $134,417 $134,813 $139,205 $109,971 $98,335
90 $218,362 $194,446 $178,414 $185,193 $142,663 $149,101 $147,287 $125,151 $107,117
Table S18a. Nine-month Salaries, 16 Responses of 29 US Information Departments, Percentiles from Department Averages
Teaching Professor Other Instructor
Non-Tenure Track
Teaching 9+ years
Teaching 6-8 years
Teaching 3-5 years
Teaching <3 years
All years Teaching 9+ years
Teaching 6-8 years
Teaching 3-5 years
Teaching <3 years
All years
Depts 6 3 5 7 12 6 4 5 7 8
Indiv 17 8 23 93 20 9 24 40 93
10 $65,207
25 $68,470 $84,248 $73,482 $74,914
50 $92,694 $99,640 $82,072 $94,279 $89,977 $78,919 $80,330 $77,800 $85,379
75 $87,045 $113,388 $88,589 $92,852
90 $130,366

cra.org/crn54 May 2020
2019 Taulbee Survey (continued)
Table S19. Twelve-month Salaries, 9 Responses of 29 Canadian Departments, Percentiles from Department Averages
Full Professor Associate Assistant Non-Tenure Track
In rank 16+ yrs
In rank 8-15 yrs
In rank 0-7 years
All years in rank
In rank 8+ years
In rank 0-7 years
All years in rank
Teach Research Postdoc
Depts 7 9 8 9 8 8 9 9 7 4 5
Indiv 52 58 62 172 58 41 99 78 69 13 57
10
25 $195,448 $181,895 $150,586 $178,470 $144,944 $116,107 $132,706 $105,944 $88,287
50 $216,856 $188,935 $180,807 $183,498 $156,517 $146,943 $161,370 $126,905 $102,970 $77,695 $55,667
75 $220,489 $210,084 $198,255 $202,212 $169,341 $170,008 $169,307 $135,623 $112,737
90
Table S19a. Twelve-month Salaries, 9 Responses of 30 Canadian Departments, Percentiles from Department Averages
Teaching Professor Other Instructor
Non-Tenure Track
Teaching 9+ years
Teaching 6-8 years
Teaching 3-5 years
Teaching <3 years
All years Teaching 9+ years
Teaching 6-8 years
Teaching 3-5 years
Teaching <3 years
All years
Depts 4 2 3 4 6 1 1 1 1 3
Indiv 19 6 44
10
25
50 $129,626 $80,484 $106,355
75
90
Table S20. Nine-month Salaries for New PhDs (Twelve-month for Canadian)
US (CS, CE, and Info Combined) Canadian
Tenure-Track
Teaching Prof
Other Instructor
Non-ten Teach All
Non-ten Research
Postdoc Tenure-Track
Teaching Prof
Other Instructor
Non-ten Teach All
Non-ten Research
Postdoc
Depts 83 34 17 45 9 29 3 2 0 2 1 2
Indiv 180 45 41 86 48 143 13 3 3 2 14
10 $94,500 $70,000 $36,250 $51,759 $45,737
25 $100,600 $78,666 $45,000 $66,250 $29,000 $45,737
50 $112,555 $85,008 $68,383 $79,333 $59,158 $61,439
75 $120,690 $93,333 $78,000 $85,006 $74,000 $68,300
90 $135,139 $104,770 $91,260 $99,000 $74,568

cra.org/crn55 May 2020
2019 Taulbee Survey (continued)
Table S21. Change in Salary Median for Departments that Reported in Both 2018 and 2019
U.S. CS U.S. CE U.S. I Canadian
Departments 129 4 13 8
Full Profs 3.70% 22.70% -0.50% 2.40%
Assoc. Profs. 2.70% 5.40% 1.80% 13.20%
Asst. Profs. 2.80% 3.30% 4.10% 3.70%
Teaching Prof 7.00% 1.70% 8.70% 1.80%
Other Instructors 4.00% -5.30% -6.30% 1.90%
Research faculty 11.10% -1.90% -25.90% 17.30%
Post doctorates 3.00% -12.70% 8.10% -3.10%
Adjunct Per-Course Payments(Tables S22-S23)
This year, for the first time, we asked for the rate typically paid
adjuncts for a single course, divided by whether the course
was taught to undergraduate or graduate students, and whether
the adjunct had a Ph.D. or a Masters degree. Table S22 shows the
median course rate for different types of institutions. In general,
among U.S. CS departments, adjunct rates are higher per course a)
when the adjunct has a Ph.D. rather than an MS degree, b) at private
than at public institutions, and c) in smaller than in larger locales.
Table S23 summarizes the primary reasons for which adjunct rates
might be adjusted.
Table S22. Median value for an adjunct teaching a single course.
Group Median PhD
teaching undergrad
N PhD teaching
undergrad
Median PhD
teaching grad
N PhD teaching
grad
Median MS teaching
undergrad
N MS teaching
undergrad
Median MS
teaching grad
N MS teaching
grad
US CS $7,750 92 $7,750 84 $6,750 84 $6,000 63
US CE $8,500 5 $9,297 4 $8,500 5 $9,297 4
US IN $6,000 10 $6,000 10 $5,100 11 $6,250 10
Canadian $7,500 5 $8,222 4 $8,250 4 $6,445 3
US CS Public $6,500 70 $6,000 63 $6,250 68 $6,000 49
US CS Private $8,847 22 $8,694 21 $9,299 16 $8,200 14
Pub large city $6,000 37 $5,818 32 $6,000 36 $5,550 25
Pub mid city $6,500 13 $6,500 11 $6,000 10 $6,000 7
Pub small/rurl $8,250 20 $8,750 20 $7,500 22 $7,500 17
Priv large city $8,847 14 $9,146 14 $8,382 12 $7,763 11
Private other $10,000 8 $8,000 7 $12,678 4 $11,000 3
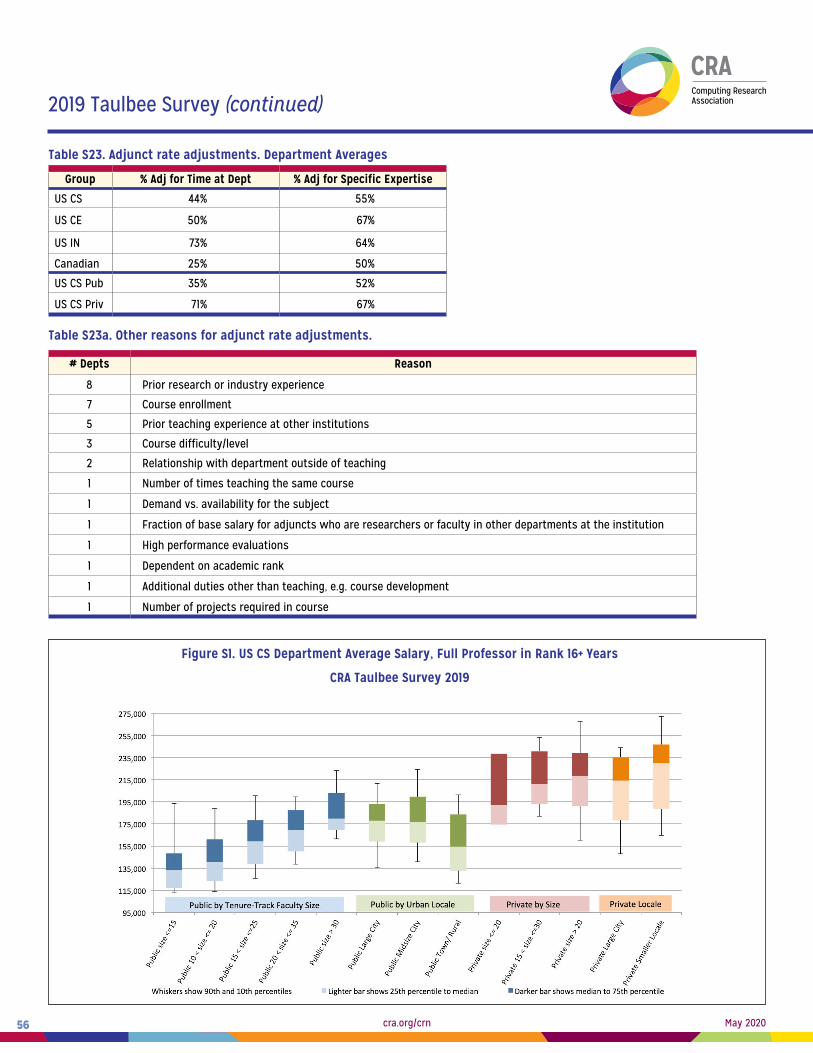
cra.org/crn56 May 2020
2019 Taulbee Survey (continued)
Table S23. Adjunct rate adjustments. Department Averages
Group % Adj for Time at Dept % Adj for Specific Expertise
US CS 44% 55%
US CE 50% 67%
US IN 73% 64%
Canadian 25% 50%
US CS Pub 35% 52%
US CS Priv 71% 67%
Table S23a. Other reasons for adjunct rate adjustments.
# Depts Reason
8 Prior research or industry experience
7 Course enrollment
5 Prior teaching experience at other institutions
3 Course difficulty/level
2 Relationship with department outside of teaching
1 Number of times teaching the same course
1 Demand vs. availability for the subject
1 Fraction of base salary for adjuncts who are researchers or faculty in other departments at the institution
1 High performance evaluations
1 Dependent on academic rank
1 Additional duties other than teaching, e.g. course development
1 Number of projects required in course
Figure S1. US CS Department Average Salary, Full Professor in Rank 16+ Years
CRA Taulbee Survey 2019

cra.org/crn57 May 2020
2019 Taulbee Survey (continued)
Figure S2. US CS Department Average Salary, Full Professor in Rank 8-15 Years
CRA Taulbee Survey 2019
Figure S3. US CS Department Average Salary, Full Professor in Rank 0-7 Years
CRA Taulbee Survey 2019

cra.org/crn58 May 2020
2019 Taulbee Survey (continued)
Figure S4. US CS Department Average Salary, Associate Professor in Rank 8+ Years
CRA Taulbee Survey 2019
Figure S5. US CS Department Average Salary, Associate Professor in Rank 0-7 Years
CRA Taulbee Survey 2019

cra.org/crn59 May 2020
2019 Taulbee Survey (continued)
Figure S6. US CS Department Average Salary, Assistant Professor
CRA Taulbee Survey 2019
Figure S7. US CS Department Average Salary, Non-Tenure Track Teaching Faculty
CRA Taulbee Survey 2019

cra.org/crn60 May 2020
2019 Taulbee Survey (continued)
Figure S7a. US CS Department Average Salary, Teaching Professors
CRA Taulbee Survey 2019
Figure S7b. US CS Department Average Salary, Other Instructors
CRA Taulbee Survey 2019

cra.org/crn61 May 2020
2019 Taulbee Survey (continued)
Figure S8. US CS Department Average Salary, Non-Tenure Track Research Faculty
CRA Taulbee Survey 2019
Figure S9. US CS Department Average Salary, Postdoctorates
CRA Taulbee Survey 2019

cra.org/crn62 May 2020
Concluding Observations
After twelve years of sustained growth in undergraduate
enrollment, there may be signs of a slowdown in that there are,
on average, fewer new undergraduate majors in 2019-20 than
there were in 2018-19. Nevertheless, the average number of CS
majors continued its rise in 2018-19, both in U.S. CS departments
and overall.
Growth in tenure-track faculty size was small in the academic
departments in 2018-19, but there again was double-digit
percentage increase in full-time teaching faculty and an increased
number of supported TAs. We don’t track part-time faculty; it is
possible that departments also were continuing to increase this
category of instructional assistance.
Doctoral program activity, both enrollment and completions, saw
healthy increases. Master’s degree production also was up in U.S.
CS departments in 2018-19, but as was the case for bachelor’s
programs, the number of new master’s students was down in
2019-20.
The COVID-19 restrictions in place in spring 2020 will, no doubt,
have significant effects on what gets reported in next year’s
survey. CRA already is monitoring the impact on departments in
a supplementary survey, and those who have responded to the
supplementary survey were provided with a report summarizing
the early findings.
Next year will mark 50 years of the Taulbee Survey. To
commemorate this milestone, we expect to provide some
retrospective on the historical Taulbee Survey data, probably as a
separate report from the annual report.
Participating CS, CE, I and Canadian Departments (Departments marked with * have participated in all 5 of the most
recent Taulbee surveys)
U.S. CS Public (109): Arizona State*, Auburn*, Clemson*,
College of William & Mary*, Colorado School of Mines*, Colorado
State*, Florida International*, George Mason*, Georgia Tech*,
Georgia State*, Indiana*, Indiana University Purdue University
Indianapolis, Iowa State*, Kansas State*, Kent State*, Michigan
State*, Michigan Technological University, Missouri University
of Science and Technology, Montana State*, Naval Postgraduate
School*, New Jersey Institute of Technology*, New Mexico State,
North Carolina A&T, North Carolina State*, North Dakota State*,
Ohio State*, Ohio*, Oklahoma State*, Old Dominion, Oregon
State*, Pennsylvania State*, Portland State*, Purdue*, Rutgers,
Southern Illinois (Carbondale), Stony Brook (SUNY)*, Temple,
Tennessee Tech, Texas A&M*, Texas Tech*, University at Buffalo*,
41Universities of: Alabama (Birmingham)*, Arizona, Arkansas*,
Arkansas at Little Rock*, California (Berkeley*, Davis*, Irvine*,
Los Angeles, Riverside*, San Diego, Santa Barbara*, and Santa
Cruz*), Central Florida*, Colorado (Boulder)*, Connecticut*,
Delaware*, Florida*, Georgia*, Houston*, Idaho, Illinois (Chicago*
and Urbana-Champaign*), Iowa*, Kansas*, Kentucky, Louisiana at
Lafayette*, Maine, Maryland (College Park* and Baltimore County*),
Massachusetts (Amherst*), Memphis, Minnesota*, Missouri
(Columbia), Nebraska (Lincoln*), Nevada (Las Vegas and Reno*),
New Hampshire*, New Mexico, North Carolina (Chapel Hill* and
Charlotte*), 80North Texas*, Oklahoma*, Oregon*, Pittsburgh*,
Rhode Island*, South Carolina*, South Florida*, Tennessee
(Knoxville)*, Texas (Arlington*, Austin*, Dallas*, El Paso*, and San
Antonio), Utah*, Vermont, Virginia*, Washington*, Washington
Human Centered Design & Engineering, Wisconsin (Madison*
and Milwaukee*), Wyoming, Utah State, Virginia Commonwealth,
Virginia Tech*, Washington State*, Wayne State*, Western
Michigan, and Wright State*.
U.S. CS Private (41): Boston University*, Brandeis, Brown*,
Carnegie Mellon*, Case Western Reserve*, Clarkson, Columbia,
Cornell*, DePaul*, Drexel*, Duke*, Emory*, Florida Institute of
Technology, George Washington, Harvard*, Illinois Institute of
Technology, Johns Hopkins*, Lehigh*, MIT*, New York University*,
Northeastern*, Northwestern*, NYU Tandon School of Engineering,
Pace, Princeton*, Rensselaer*, Rice*, Rochester Institute of
Technology*, Stanford*, Stevens Institute of Technology*, Toyota
Technological Institute at Chicago*, Tufts*, Universities of:
Chicago*, Notre Dame, Pennsylvania*, Rochester*, Southern
California*, and Tulsa*, Washington in St. Louis*, Worcester
Polytechnic Institute*, and Yale.
U.S. CE (7): Boston University, Case Western Reserve, North
Carolina State*, Northwestern, Universities of: Central Florida*,
Illinois (Urbana-Champaign), and New Mexico*.
2019 Taulbee Survey (continued)

cra.org/crn63 May 2020
U.S. Information (16): Cornell*, Drexel*, Indiana*, Penn State*,
Syracuse, Universities of: Arizona, California (Berkeley), Cincinnati,
Colorado (Boulder), Illinois (Urbana-Champaign), Maryland (College
Park ISchool and Baltimore County*), Michigan*, North Carolina
(Chapel Hill)*, Pittsburgh*, and Washington*.
Canadian (11): Concordia*, McGill, Simon Fraser*, Universities of:
British Columbia*, Calgary*, Manitoba*, New Brunswick, Toronto*,
Waterloo, Western Ontario, and York*.
1The title of the survey honors Orrin E. Taulbee of the University of Pittsburgh, who conducted these surveys for the Computer Science Board until 1984, with retrospective annual data going back to 1970.
2Information (I) programs included here are Information Science, Information Systems, Information Technology, Informatics, and
related disciplines with a strong computing component. Surveys were sent to CRA members, the CRA Deans group members, and
participants in the iSchools Caucus (www.ischools.org) who met the criteria of granting Ph.D.s and being located in North America.
Other I programs who meet these criteria and would like to participate in the survey in future years are invited to contact
[email protected] for inclusion.
3Classification of the population of an institution’s locale is in accordance with the Carnegie Classification database. Large cities are
those with population >= 250,000. Mid-size cities have population between 100,000 and 250,000. Town/rural populations are less than
100,000.
4All faculty tables: The survey makes no distinction between faculty specializing in CS vs. CE programs. Every effort is made to
minimize the inclusion of faculty in electrical engineering who are not computer engineers.
2019 Taulbee Survey (continued)