2015 phytochemical and biological studies on selected
TRANSCRIPT
University of WollongongResearch Online
University of Wollongong Thesis Collection University of Wollongong Thesis Collections
2015
Phytochemical and biological studies on selectedStemona and Stichoneuron species (Stemonaceae)Rosdayati Alino RamliUniversity of Wollongong
Research Online is the open access institutional repository for theUniversity of Wollongong. For further information contact the UOWLibrary: [email protected]
Recommended CitationRamli, Rosdayati Alino, Phytochemical and biological studies on selected Stemona and Stichoneuron species (Stemonaceae), Doctorof Philosophy thesis, School of Chemistry, University of Wollongong, 2015. http://ro.uow.edu.au/theses/4441

Phytochemical and Biological studies on selected Stemona and
Stichoneuron species (Stemonaceae)
A thesis submitted in fulfilment of the requirements
for the award of the degree of
Doctor of Philosophy
From
University of Wollongong
Rosdayati Alino Ramli
M.Sc. Chemistry
Supervisor: Professor Stephen G. Pyne
School of Chemistry
Febuary 2015
i
DECLARATION
I, Rosdayati Alino Ramli, declare all the materials in this thesis, submitted in partial
fulfillment of requirement for the award of Doctor of Philosophy, conducted in the
Department of Chemistry at the University of Wollongong, is my own work except
when mentioned in this thesis. This document has not been submitted for qualification
at any academic institution.
Rosdayati Alino Ramli
May, 2015

ii
ACKNOWLEDGEMENTS
Firstly, I would like to sincerely thank my supervisor, Prof. Stephen Pyne, for his
wisdom, kindness and patience throughout the whole period of my PhD project. I am so
thankful for the opportunity he offered me to learn natural products chemistry and to
attend some conferences and have a fun life in Wollongong. Secondly, I would like to
record my thanks to all the technical support in the School of Chemistry particularly Dr.
Wildford Lie for helping with my NMR experiments. Special thanks to Dr. Roonglawan
Rattanajak from Medical Molecular Biology Research Unit, National Center for
Genetic Engineering and Biotechnology, National Science and Technology
Development Agency, Thailand for helping me with the antiplasmodial assays. I also
thank to Ministry of Education Malaysia and University Sains Islam Malaysia (USIM)
for the PhD scholarship. I would like to thank the Pyne group, especially Phurpa, Kung,
Dr. Arife and Duc for their kind help, instructions in the lab and teaching me
experimental skills, and for their friendship. I would like to give my special thanks to
my husband, Md. Zubaidillah for his care and company, and also his never ending
support. Special thanks to my family, my parents and my sibling, for their love, care
and support. Without them, I can’t image how I could complete my PhD. Finally, I
would like to thank all my friends especially Prof. Emr. Dato’ Noramly Muslim, Prof.
Dr. Musa Ahmad, Azean Tajuddin, Najatulmuna Hamdan, Lili Hannah, Lydia Yusrina,
Nur Indah and Madihah for their support, help and love.

iii
ABSTRACT
Chapter 1 of this thesis is a review of the literature on the structure, biological
activities and isolation of Stemona alkaloids from the Stemonaceae family of plants.
This chapter also outlines the aims of this project, which were to isolated and determine
the structures of the Stemona alkaloids and other chemical constituents in four species
of Stemonaceae; three of them collected in peninsular Malaysia and another one in
Indonesia. Another aim of this project was to determine the biological activities of these
alkaloids.
Chapter 2 reviews and describes the genus of Stemona and Stichoneuron
including their distribution and morphologies, and also the field work undertaken to
collect the plants for this study. Stemona curtisii Hook F., Stichoneuron halabalensis
Hook F. and Stichoneuron caudatum Ridley were collected from different sites in
Malaysia by Ramli, R. A., while Stemona javanica (Kunth) Engl. was collected in
Indonesia by our collaborator, Pudjiastuti, P.
Chapter 3 reviews the earlier studies on S. curtisii from Thailand. This chapter
also describes the results of the isolation of the chemical constituents from the roots
extract of S. curtisii from Malaysia using chromatographic techniques, including
column chromatography and preparative thin layer chromatography. Six known
alkaloids were successfully isolated and their structures were confirmed by NMR and
ESI-MS analysis and from camparisons made with the spectroscopic data from the
literature. The isolated compounds were (2'S)-hydroxystemofoline, stemocochinine, 1-
hydroxyprotostemonine, oxystemokerrin-N-oxide, isostemofoline and stemofoline.
Eleven Stemona alkaloids were reported from S. curtisii in Thailand; five of them, were
iv
pyrrolo[1,2-a]azepine alkaloids while the others were pyrido[1,2-a]azepine alkaloids. In
contrast, in this study only one pyrido[1,2-a]azepine alkaloid, oxystemokerrin-N-oxide,
was isolated from S. curtisii from Malaysia. Stemofoline was the major alkaloid found
in the roots of S. curtisii from Thailand while (2'S)-hydroxystemofoline was the major
alkaloid from the roots of the plant material collected in Malaysia.
Chapter 4 describes the isolation of Stemona alkaloids from the root extracts of
Stemona javanica using chromatograpic techniques. Two new protostemonine-type
alkaloids, javastemonine A and B were isolated together with four known Stemona
alkaloids, 13-demethoxy-11(S*),12(R
*)-dihydroprotostemonine, isoprotostemonine,
protostemonine and isomaistemonine. The structures and relative configurations of the
new alkaloids were determined by spectroscopic analysis and molecular modeling
studies.
Chapter 5 describes the isolation of the chemical components from the roots and
leaf extracts of the hitherto unreported Stichoneuron halabalensis. This study led to the
characterization of the known compounds (+)--tocopherol, (R)-(+)-goniothalamin,
four known Stemona alkaloids, bisdehydrostemoninine A, stemoninine,
sessilistemoamine C, sessilistemoamine A; and three new Stemona alkaloids,
stichoneurines C, D and E. The structures and relative configurations of the new
alkaloids were determined by spectroscopic analysis, and from comparisons made with
published spectroscopic data and molecular modeling studies.
Chapter 6 provides a discussion of the isolation of four novel stichoneurine-type
alkaloids, stichoneurines F and G and sessilistemonamines E and F, Stemona alkaloids,
from the root extracts of Stichoneuron caudatum. The isolation and purification of these
chemical constituents were achieved using various chromatographic techniques. The
v
structures and relative configurations of the new alkaloids have been determined by
spectroscopic methods and molecular modeling experiments. A possible biosynthesis of
these new alkaloids from stichoneurine B involving an intramolecular Mannich reaction
to form the cyclopentane ring of these alkaloids was proposed.
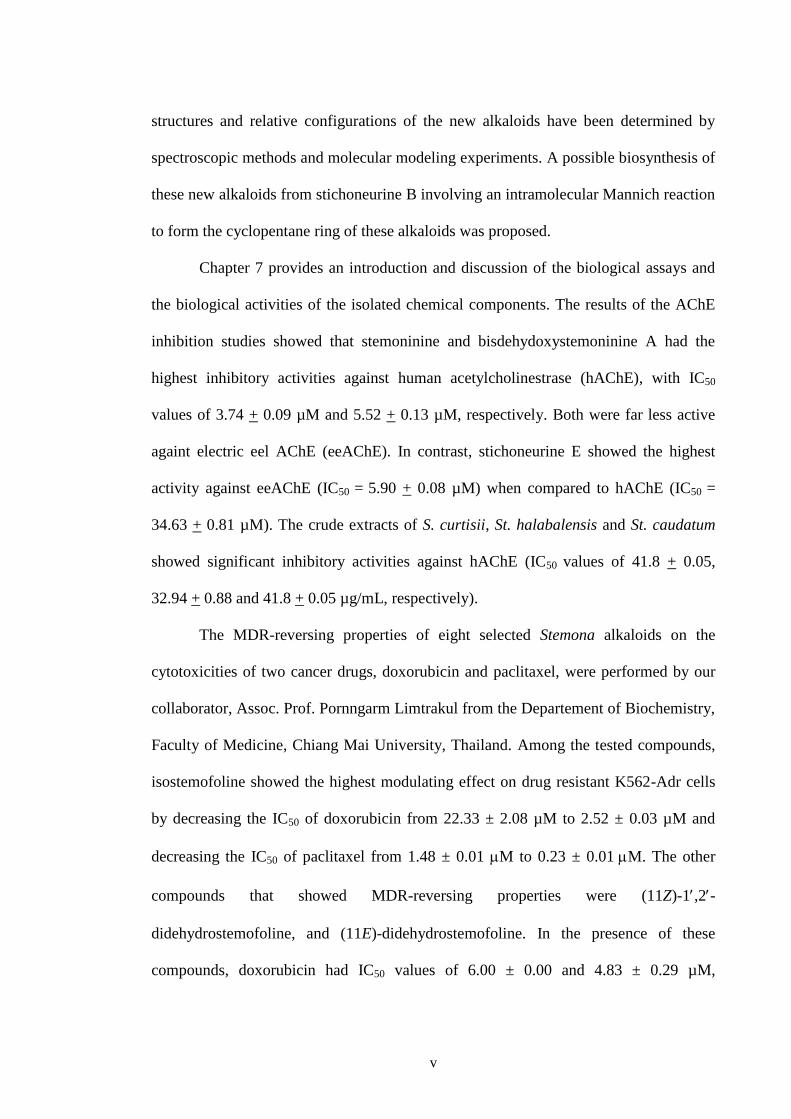
Chapter 7 provides an introduction and discussion of the biological assays and
the biological activities of the isolated chemical components. The results of the AChE
inhibition studies showed that stemoninine and bisdehydoxystemoninine A had the
highest inhibitory activities against human acetylcholinestrase (hAChE), with IC50
values of 3.74 + 0.09 µM and 5.52 + 0.13 µM, respectively. Both were far less active
againt electric eel AChE (eeAChE). In contrast, stichoneurine E showed the highest
activity against eeAChE (IC50 = 5.90 + 0.08 µM) when compared to hAChE (IC50 =
34.63 + 0.81 µM). The crude extracts of S. curtisii, St. halabalensis and St. caudatum
showed significant inhibitory activities against hAChE (IC50 values of 41.8 + 0.05,
32.94 + 0.88 and 41.8 + 0.05 µg/mL, respectively).
The MDR-reversing properties of eight selected Stemona alkaloids on the
cytotoxicities of two cancer drugs, doxorubicin and paclitaxel, were performed by our
collaborator, Assoc. Prof. Pornngarm Limtrakul from the Departement of Biochemistry,
Faculty of Medicine, Chiang Mai University, Thailand. Among the tested compounds,
isostemofoline showed the highest modulating effect on drug resistant K562-Adr cells
by decreasing the IC50 of doxorubicin from 22.33 ± 2.08 µM to 2.52 ± 0.03 µM and
decreasing the IC50 of paclitaxel from 1.48 ± 0.01 M to 0.23 ± 0.01M. The other
compounds that showed MDR-reversing properties were (11Z)-1,2-
didehydrostemofoline, and (11E)-didehydrostemofoline. In the presence of these
compounds, doxorubicin had IC50 values of 6.00 ± 0.00 and 4.83 ± 0.29 µM,
vi
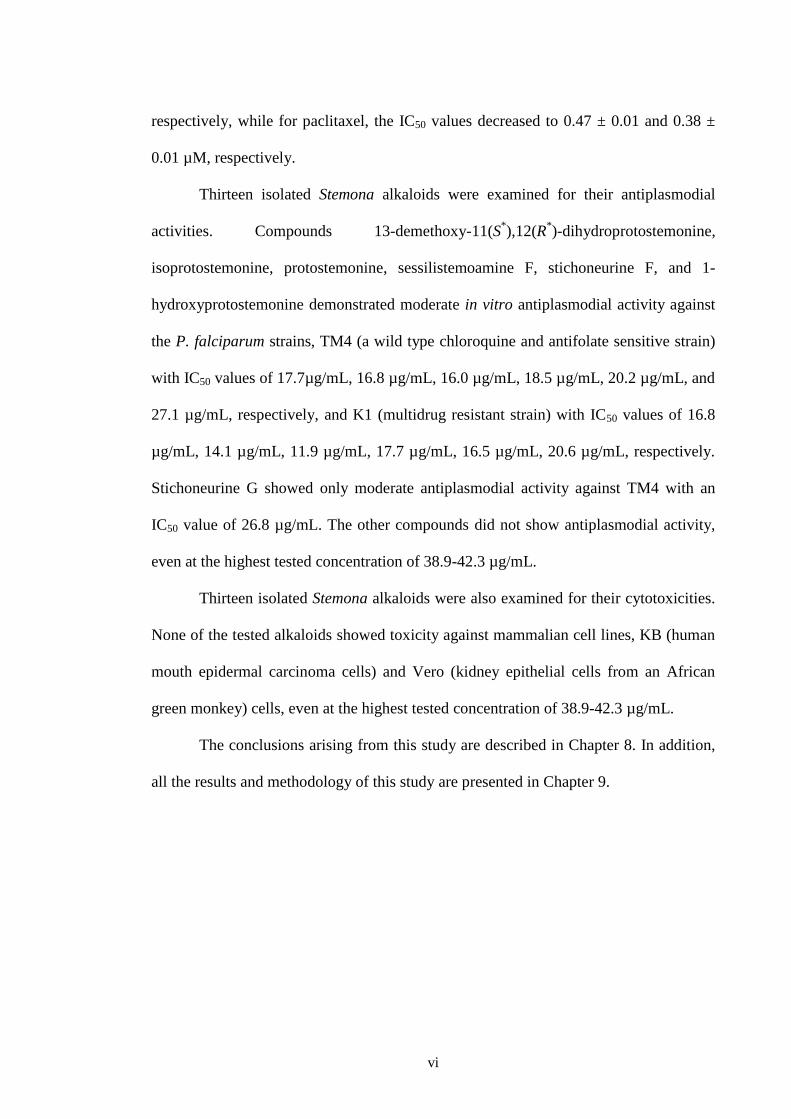
respectively, while for paclitaxel, the IC50 values decreased to 0.47 ± 0.01 and 0.38 ±
0.01 µM, respectively.
Thirteen isolated Stemona alkaloids were examined for their antiplasmodial
activities. Compounds 13-demethoxy-11(S*),12(R
*)-dihydroprotostemonine,
isoprotostemonine, protostemonine, sessilistemoamine F, stichoneurine F, and 1-
hydroxyprotostemonine demonstrated moderate in vitro antiplasmodial activity against
the P. falciparum strains, TM4 (a wild type chloroquine and antifolate sensitive strain)
with IC50 values of 17.7µg/mL, 16.8 µg/mL, 16.0 µg/mL, 18.5 µg/mL, 20.2 µg/mL, and
27.1 µg/mL, respectively, and K1 (multidrug resistant strain) with IC50 values of 16.8
µg/mL, 14.1 µg/mL, 11.9 µg/mL, 17.7 µg/mL, 16.5 µg/mL, 20.6 µg/mL, respectively.
Stichoneurine G showed only moderate antiplasmodial activity against TM4 with an
IC50 value of 26.8 µg/mL. The other compounds did not show antiplasmodial activity,
even at the highest tested concentration of 38.9-42.3 µg/mL.
Thirteen isolated Stemona alkaloids were also examined for their cytotoxicities.
None of the tested alkaloids showed toxicity against mammalian cell lines, KB (human
mouth epidermal carcinoma cells) and Vero (kidney epithelial cells from an African
green monkey) cells, even at the highest tested concentration of 38.9-42.3 µg/mL.
The conclusions arising from this study are described in Chapter 8. In addition,
all the results and methodology of this study are presented in Chapter 9.
vii
PUBLICATIONS ARISING FROM THIS THESIS
1. Ramli, A. R; Pudjiastuti, P.; Tjahjandaric, T.; Lie, W.; Rattanajak, R.;
Kamchonwongapaisan, S.; Pyne, S. G. Alkaloids from the roots of Stemona
javanica (Kunth) Engl. (Stemonaceae) and their anti-malarial,
acetylcholinesterase inhibitory and cytotoxic activities. Phytochem. Lett. 2015,
11, 157–162.
2. Ramli, R. A.; Lie, W.; Pyne, S. G. Alkaloids from the roots of Stichoneuron
caudatum and their acetylcholinesterase inhibitory activities. J. Nat. Prod. 2014,
77, 894–901.
3. Ramli, R. A.; Lie, W.; Pyne, S. G. Alkaloids from the roots and leaves of
Stichoneuron halabalensis and their acetylcholinesterase inhibitory activities.
Nat. Prod. Commun. 2013, 8, 695−698.
viii
TABLE OF CONTENTS
Page
DECLARATION i
ACKNOWLEDGEMENTS ii
ABSTRACT iii
PUBLICATIONS ARISING FROM THIS THESIS vii
LIST OF FIGURES xiv
LIST OF TABLES xxii
LIST OF SCHEMES xxvi
LIST OF ABBREVIATIONS xxvii
CHAPTER 1 INTRODUCTION 1
1.1 The Stemonaceae family 1
1.2 Biological activities of the Stemona alkaloids 2
1.3 The Stemona alkaloids 6
1.4 Structural classification of the Stemona alkaloids 6
1.4.1 Stenine group 8
1.4.2 Stemoamide group 9
1.4.3 Tuberostemospironine group 11
1.4.4 Stemoamine group 12
1.4.5 Parvistemoline group 13
1.4.6 Stemofoline group 13
1.4.7 Stemocurtisine group 15
1.4.8 Miscellaneous group 16
ix
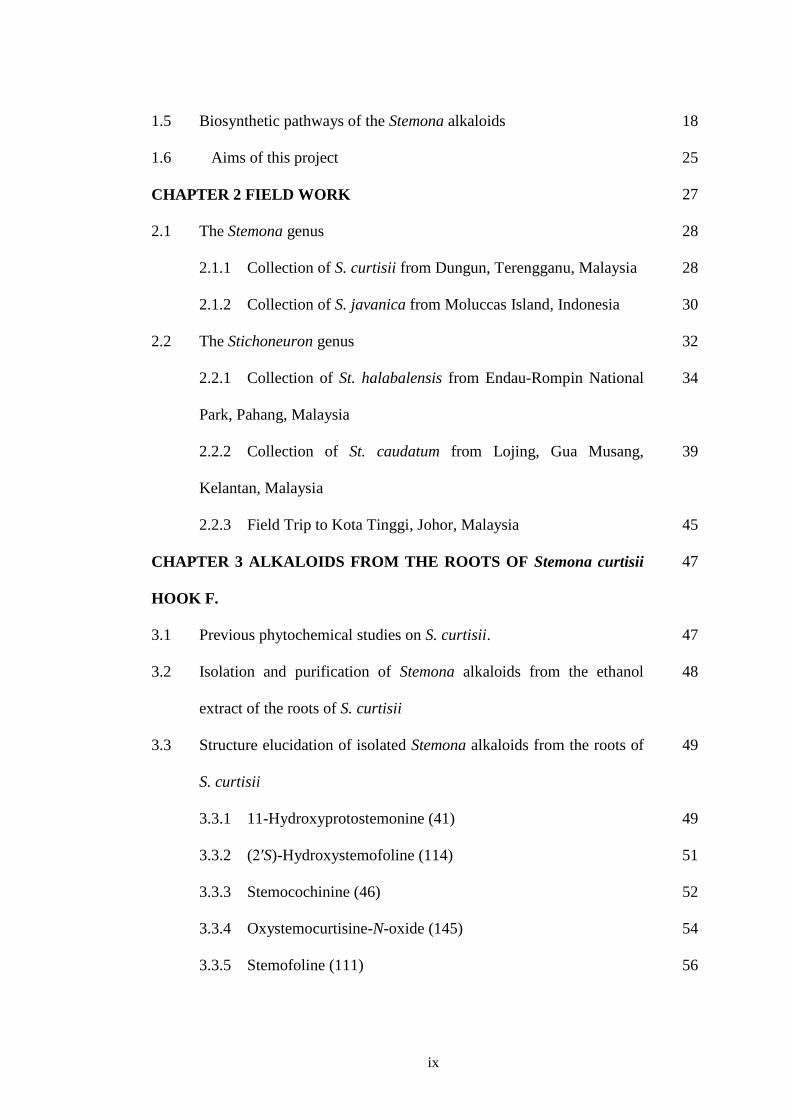
1.5 Biosynthetic pathways of the Stemona alkaloids 18
1.6 Aims of this project 25
CHAPTER 2 FIELD WORK 27
2.1 The Stemona genus 28
2.1.1 Collection of S. curtisii from Dungun, Terengganu, Malaysia 28
2.1.2 Collection of S. javanica from Moluccas Island, Indonesia 30
2.2 The Stichoneuron genus 32
2.2.1 Collection of St. halabalensis from Endau-Rompin National
Park, Pahang, Malaysia
34
2.2.2 Collection of St. caudatum from Lojing, Gua Musang,
Kelantan, Malaysia
39
2.2.3 Field Trip to Kota Tinggi, Johor, Malaysia 45
CHAPTER 3 ALKALOIDS FROM THE ROOTS OF Stemona curtisii
HOOK F.
47
3.1 Previous phytochemical studies on S. curtisii. 47
3.2 Isolation and purification of Stemona alkaloids from the ethanol
extract of the roots of S. curtisii
48
3.3 Structure elucidation of isolated Stemona alkaloids from the roots of
S. curtisii
49
3.3.1 11-Hydroxyprotostemonine (41) 49
3.3.2 (2′S)-Hydroxystemofoline (114) 51
3.3.3 Stemocochinine (46) 52
3.3.4 Oxystemocurtisine-N-oxide (145) 54
3.3.5 Stemofoline (111) 56
x
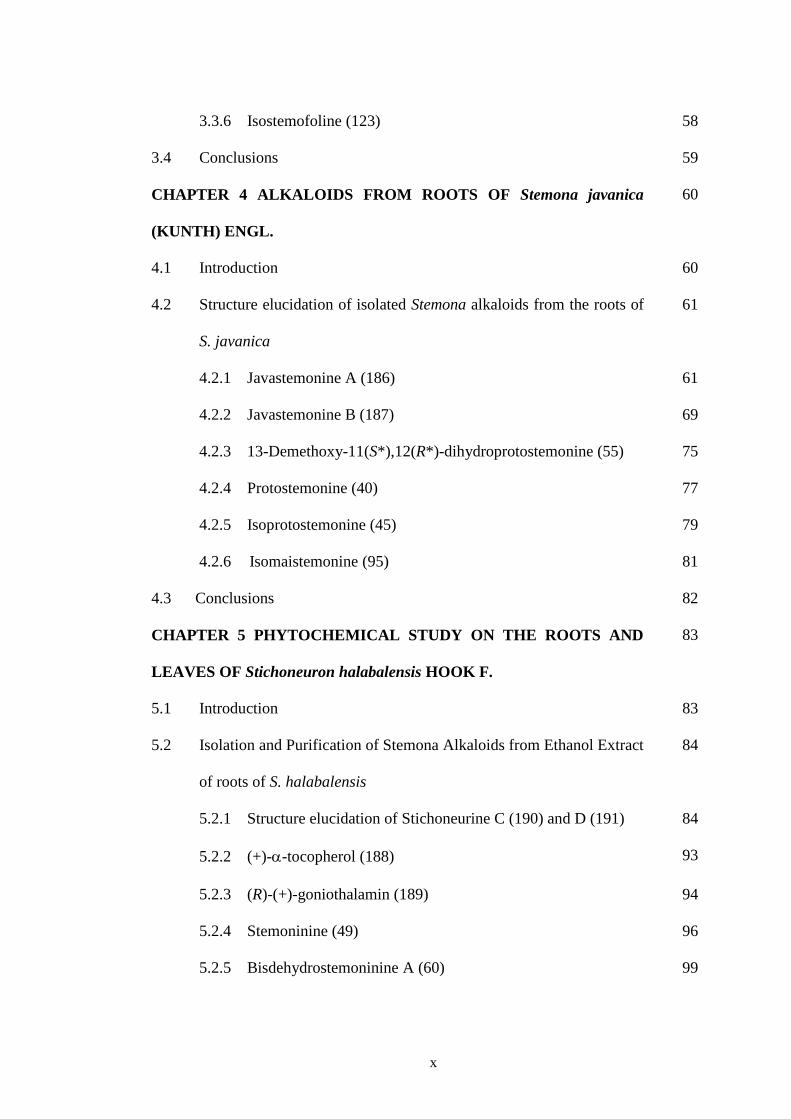
3.3.6 Isostemofoline (123) 58
3.4 Conclusions 59
CHAPTER 4 ALKALOIDS FROM ROOTS OF Stemona javanica
(KUNTH) ENGL.
60
4.1 Introduction 60
4.2 Structure elucidation of isolated Stemona alkaloids from the roots of
S. javanica
61
4.2.1 Javastemonine A (186) 61
4.2.2 Javastemonine B (187) 69
4.2.3 13-Demethoxy-11(S*),12(R*)-dihydroprotostemonine (55) 75
4.2.4 Protostemonine (40) 77
4.2.5 Isoprotostemonine (45) 79
4.2.6 Isomaistemonine (95) 81
4.3 Conclusions 82
CHAPTER 5 PHYTOCHEMICAL STUDY ON THE ROOTS AND
LEAVES OF Stichoneuron halabalensis HOOK F.
83
5.1 Introduction 83
5.2 Isolation and Purification of Stemona Alkaloids from Ethanol Extract
of roots of S. halabalensis
84
5.2.1 Structure elucidation of Stichoneurine C (190) and D (191) 84
5.2.2 (+)--tocopherol (188) 93
5.2.3 (R)-(+)-goniothalamin (189) 94
5.2.4 Stemoninine (49) 96
5.2.5 Bisdehydrostemoninine A (60) 99
xi
5.2.6 Sessilistemoamine A (96) 101
5.2.7 Sessilistemoamine C (98) 103
5.3 Isolation and purification of Stemona alkaloids from the ethanol
extract of the leaves of S. halabalensis
104
5.3.1 Structure elucidation of Stichoneurine E (192) 105
5.4 Conclusions 110
CHAPTER 6 ALKALOIDS FROM THE ROOTS Stichoneuron
caudatum RIDLEY
111
6.1 Introduction 111
6.2 Isolation and purification of Stemona alkaloids from ethanol extract
of the roots of St. caudatum
111
6.3 Structure elucidation of isolated Stemona alkaloids from Ethanol
Extract Of the roots of S. caudatum
112
6.3.1 Stichoneurine F (193) 112
6.3.2 Stichoneurine G (194) 121
6.3.3 Sessilistemonamine E (195) 125
6.3.4 Sessilistemonamine F (196) 131
6.4 Conclusions 136
CHAPTER 7 THE BIOLOGICAL ACTIVITIES OF THE ISOLATED
CHEMICAL COMPONENTS
136
7.1 Acetylcholinestrase (AChE) inhibitory activities 137
7.2 Modulation of drug resistance by Stemona alkaloids on multi drug
resistence (MDR) cancer cell lines
140
7.2.1 Mechanisms contributing to drug resistant cancer cells 140
xii
7.2.2 Modulation of P-glycoprotein in drug resistance in cancer cell
lines
142
7. 3 Modulation of resistance to anticancer drug by isolated Stemona
alkaloids
144
7.4 Antimalarial activity of isolated Stemona alkaloids againt P.
falpacirum
149
7.5 Cytotoxicity activity of isolated Stemona alkaloids againt
mammalian cells
150
7.6 Conclusions 151
CHAPTER 8 CONCLUSIONS 153
CHAPTER 9 EXPERIMENTAL 158
9.1 General Experimental 158
9.1.1 Chromatography 158
9.1.2 Polarimeter 159
9.1.3 Mass spectrometer 159
9.1.4 Infrared spectroscopy 159
9.1.5 Nuclear magnetic resonance spectroscopy 159
9.1.6 Molecular modelling 160
9.2 Experimental for Chapter 3 160
9.3 Experimental for Chapter 4 164
9.4 Experimental for Chapter 5 168
9.5 Experimental for Chapter 6 174
9.6 Experimental for Chapter 7 178
9.6.1 AChE inhibitory activity 178
xiii
9.6.2 Antiplasmodial assay 179
9.6.3 Cytotixicity assay and chemosensitivity testing 180
9.6.4 Cytotoxicity assay against Vero and KB cells 182
REFERENCES 183

xiv
LIST OF FIGURES
Figure Page
1.1 Representative plants from the Stemonaceae family (Pictures taken
from Majumdar & Datta).3
1
1.2 Common medicinal drugs for treatment of Alzheimer’s disease.24
5
1.3 Anti-influenza drugs.30
6
1.4 The heterocyclic base structures of the Stemona alkaloids group.13-
14,32
7
1.5 Stemona alkaloids of the stenine group.13-14,32-38
8-9
1.6 Stemona alkaloids of the stemoamide group.2,14,35,39
10-11
1.7 Stemona alkaloids of the tuberostemospironine group.2,5,14,31,35,40-41
11-12
1.8 Stemona alkaloids of the stemonamine group.2,14,25
12
1.9 Stemona alkaloids of the parvistemoline group.2,4,14
13
1.10 Stemona alkaloids of the stemofoline group.2,14,42-43
14
1.11 Stemona alkaloids of the stemocurtisine group.2,13-14,39,44
15
1.12 Stemona alkaloids of the miscellaneous group.2,14,32,34,35,36,38,45
17
1.13 Structure comparisons of different Stemona alkaloids. The
spermidine part of the pyrrolo[1,2-a] core is depicted with grey
bold bonds and the terpenoids units with black bold bonds.46
20
2.1 Shows the flowers of some Stemona species.53-57
27
2.2 Map indicating the collection location of S. curtisii.58
28
2.3 Stemona curtisii Hook. f (A) habit, (B) roots, (D) leaf, (D) flower
and (E) fruit (Photos taken by R. A. Ramli, 2 May 2011).
29
xv
2.4 Stemona curtisii Hook.f.: (a) twig; (b) leaf; (c) flower; (d) tepals;
(e). androecium; (f) stamens; (g) ovary with pedicel; (h) Capsule
with persistent tepals [Taken from Murugan].59
30
2.5 Roots of S. javanica (Photo taken by P. Pudjiastuti, June 2012) 31
2.6 (A) Herbarium specimen of S. javanica61
and (B) Drawing of
picture of S. javanica by Telford.62
32
2.7 Distribution of four Stichoneuron species in Peninsular Thailand
and Peninsular Malaysia: St. bognerianum ( ); St. calcicola ( );
St. caudatum ( ); St. halabalensis ( ).1
33
2.8 The flower of (A) St. bognerianum, (B) St. calcicola, (C) St.
caudatum, (D) St. halabalensis and (E) St. membranaceum.1,63
33
2.9 Location where St. halabalensis was collected in Peninsular of
Malaysia.64
35
2.10 The area of sample collection in Endau-Rompin State Park
(photographs taken by R. A. Ramli, 24 April 2010)
36
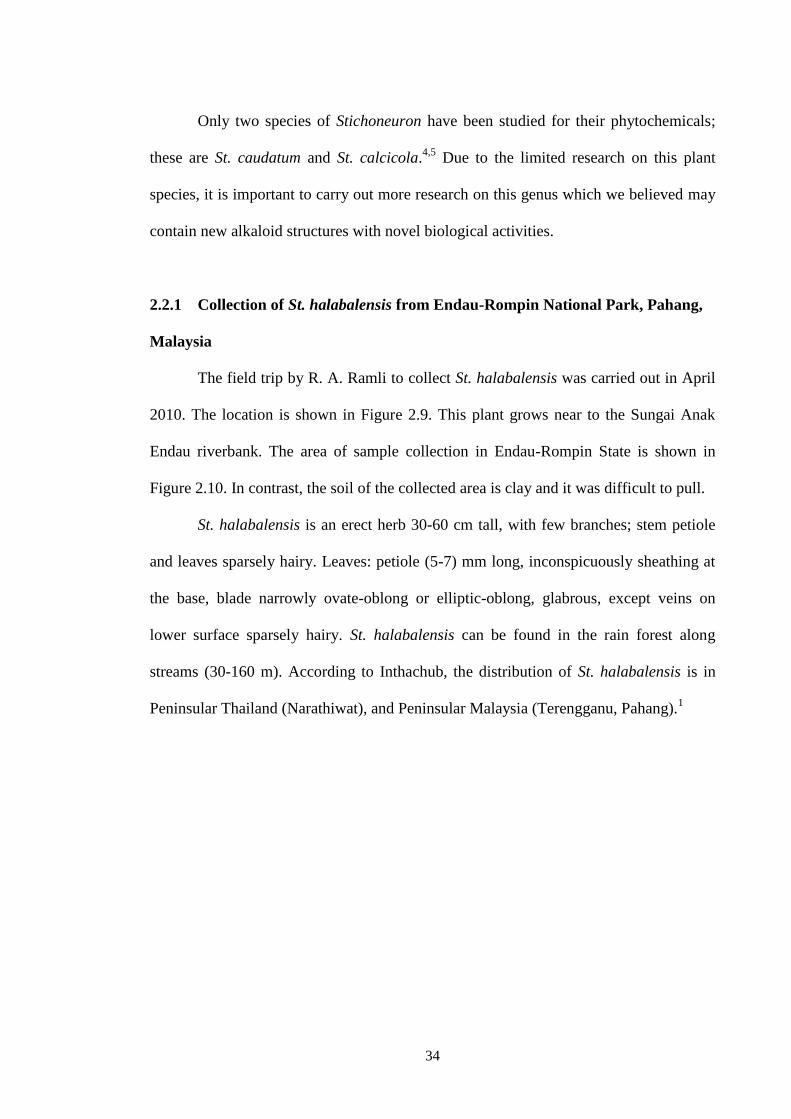
2.11 St. halabalensis (A) young plants, (B) roots, (C) fruits and (D)
flower (photographs taken by R. A. Ramli, 24 April 2010).
37
2.12 St. halabalensis Inthachub. (A) flowering and fruiting stem; (B)
flower; (C-D) tepal, seen from inside and outside respectively; (E-
F) stamens; (G) ovary; (H) fruit; (I) seed with finger-like aril lobes;
(J) bract.1
38
2.13 St. caudatum (A) flower, (B) leaves, (C) young plants and (D)
roots (photographs taken by R. A. Ramli, 24 April 2010)
39
2.14 Location where St. caudatum was collected in Peninsular of 41
xvi
Malaysia.70
2.15 The area of sample collection in Lojing, Gua Musang, Kelantan,
Malaysia (photographs taken by R. A. Ramli, 10 December 2011)
42
2.16 St. caudatum: (A) inflorescence; (B) fruit; (C) seed; (D)
androcium; (E) stamen; (F) Ovary [Photographed by Inthachub,
2008].69
43
2.17 St. caudatum Ridl. (A) flowering and fruiting stem; (B)
inflorescence with buds, (C) flower; (D) tepal, seen from inside;
(E) stamen; (F) (ovary; (G) fruit; (H) seed with finger like aril
lobes; (I) bract; (J) detail of lower leaf surface.1
44
2.18 Flower of St. bognerianum [Photographed by Bogner, 1789)].1 45
2.19 The area of Kaya River, Mawai, Kota Tinggi Johor, Malaysia
(photographs taken by R. A. Ramli, 10 December 2011).
46
3.1 Isolated Stemona alkaloids from the roots of Malaysian S. curtisii. 49
3.2 1H NMR spectrum (methanol-d4, 500 MHz) of 1-
hydroxyprotostemonine (41).
50
3.3 1H NMR spectrum (CDCl3, 500 MHz) of (2′S)-hydroxystemofoline
(114).
51
3.4 1H NMR spectrum (CDCl3, 500 MHz) of stemocochinine (46). 53
3.5 13
C NMR spectrum (CDCl3, 125 MHz) of stemocochinine (46). 53
3.6 1H NMR spectrum (methanol-d4, 500 MHz) of oxystemocurtisin-
N-oxide (145).
56
3.7 1H NMR spectrum (CDCl3, 500 MHz) of stemofoline (111). 57
3.8 1H NMR spectrum (CDCl3, 500 MHz) of isotemofoline (123). 59
xvii
4.1 Structures of the isolated Stemona alkaloids from roots of S.
javanica.
60
4.2 The coupling constants (J) of H-11 and H-12 in 51, 52 and 186
together with their ROESY correlations.11
64
4.3 Key COSY and HMBC correlations for compound 186. 64
4.4 Spartan ‘10 generated lowest energy conformation of 186 showing
key ROESY cross-peaks. The details on how this structure was
generated are included in the Experimental section (Chapter 9).
65
4.5 13
C NMR spectrum (CDCl3, 500 MHz) of javastemonine A (186). 65
4.6 1H NMR spectrum (CDCl3, 500 MHz) of javastemonine A (186). 66
4.7 ROESY spectrum (CDCl3, 500 MHz) of javastemonine A (186). 66
4.8 Key COSY and HMBC correlations for compound 187. 71
4.9 Spartan ‘10 generated lowest energy conformation of 187 showing
key ROESY cross-peaks.
71
4.10 13
C NMR spectrum (CDCl3, 500 MHz) of javastemonine B (187). 72
4.11 1H NMR spectrum (CDCl3, 500 MHz) of javastemonine B (187). 72
4.12 ROESY spectrum (CDCl3, 500 MHz) of javastemonine B (187). 73
4.13 1H NMR spectrum (CDCl3, 500 MHz) of 13-demethoxy-
11(S*),12(R*)-dihydroprotostemonine (55).
75
4.14 1H NMR spectrum (CDCl3, 500 MHz) of protostemonine (40). 78
4.15 13
C NMR spectrum (CDCl3, 125 MHz) of protostemonine (40). 78
4.16 1H NMR spectrum (CDCl3, 500 MHz) of isoprotostemonine (45). 80
4.17 13
C NMR spectrum (CDCl3, 125 MHz) of isoprotostemonine (45). 80
4.18 1H NMR spectrum (CDCl3, 500 MHz) of isomaistemonine (95). 82

xviii
5.1 Structures of the isolated compounds from the root of St.
halabalensis.
84
5.2 Key COSY and HMBC correlations for stichoneurine C and D
(190-191).
88
5.3 13
C NMR spectrum (CDCl3, 125 MHz) of stichoneurine C and D
(190-191).
88
5.4 1H NMR spectrum (CDCl3, 500 MHz) of stichoneurine C and D
(190-191).
89
5.5 Spartan ’10 generated AM1 structure of stichoneurine C (190)
showing key NOESY cross-peaks. The structures was generated
using Spartan ‘10 and conformational searching (MMFF) to find
the lowest energy conformers.
89
5.6 Spartan ’10 generated AM1 structure of stichoneurine D (191)
showing key NOESY cross-peaks. The structures was generated
using Spartan ‘10 and conformational searching (MMFF) to find
the lowest energy conformers.
90
5.7 NOESY NMR spectrum (CDCl3, 500 MHz) of stichoneurine C and
D (190-191).
90
5.8 1H NMR spectrum (CDCl3, 500 MHz) of (+)-α-tocopherol (188). 93
5.9 1H NMR spectrum (CDCl3, 500 MHz) of (R)-(+)-goniothalamin
(189).
95
5.10 13
C NMR spectrum (CDCl3, 125 MHz) of (R)-(+)-goniothalamin
(189).
96
5.11 1H NMR spectrum (CDCl3, 500 MHz) of stemoninine (49). 98

xix
5.12 13
C-APT NMR spectrum (CDCl3, 125 MHz) of stemoninine (49). 98
5.13 1H NMR spectrum (CDCl3, 500 MHz) of bisdehydrostemoninine A
(60).
100
5.14 13
C-APT NMR spectrum (CDCl3, 125 MHz) of
bisdehydrostemoninine A (60).
100
5.15 1H NMR spectrum (CDCl3, 500 MHz) of sessilistemoamine A
(96).
101
5.16 1H NMR spectrum (CDCl3, 500 MHz) of sessilistemoamine C
(98).
104
5.17 Structures of the isolated compounds from the leaf of St.
halabalensis.
105
5.18 13
C NMR spectrum (CDCl3, 125 MHz) of stichoneurine E (192). 106
5.19 1H NMR spectrum (CDCl3, 500 MHz) of stichoneurine E (192). 107
5.20 Key COSY and HMBC correlations for stichoneurine E (192). 107
5.21 ROESY NMR spectrum (CDCl3, 500 MHz) of stichoneurine E
(192).
108
5.22 Spartan ’10 generated AM1 structure of stichoneurine E (192)
showing key NOESY cross-peaks.
108
6.1 Isolated Stemona alkaloids from St. caudatum. 112
6.2 Key COSY and HMBC correlations for stichoneurine E (193). 114
6.3 Spartan ’10 generated lowest energy conformation of stichoneurine
F (193) showing key ROESY cross-peaks. The structure shown
were generated using Spartan ‘10 and conformational searching
(MMFF) to find the lowest energy conformers).
116
xx
6.4 13
C NMR spectrum (methanol-d4, 125 MHz) of stichoneurine F
(193).
117
6.5 1H NMR spectrum (CD3OH, 500 MHz) of stichoneurine F (193). 117
6.6 ROESY spectrum (methanol-d4, 500 MHz) of stichoneurine F
(193).
118
6.7 13
C NMR spectrum (methanol-d4, 125 MHz) of stichoneurine G
(194).
122
6.8 1H NMR spectrum (methanol-d4, 500 MHz) of stichoneurine G
(194).
123
6.9 ROESY spectrum (methanol-d4, 500 MHz) of stichoneurine G
(194).
123
6.10 Key COSY and HMBC correlations for sessilistemonamine E
(195).
127
6.11 Spartan ’10 generated lowest energy conformation of
sessilistemonamine E (195) showing key ROESY cross-peaks. The
structure shown were generated using Spartan ‘10 and
conformational searching (MMFF) to find the lowest energy
conformers).
128
6.12 13
C NMR spectrum (methanol-d4, 125 MHz) of sessilistemonamine
E (195).
128
6.13 1H NMR spectrum (methanol-d4, 500 MHz) of sessilistemonamine
E (195).
129
6.14 ROESY spectrum (methanol-d4, 500 MHz) of sessilistemonamine
E (195).
129
xxi
6.15 13
C NMR spectrum (methanol-d4, 125 MHz) of sessilistemonamine
F (196).
132
6.16 1H NMR spectrum (methanol-d4, 500 MHz) of sessilistemonamine
F (196).
133
6.17 ROESY spectrum (methanol-d4, 500 MHz) of sessilistemonamine
F (196).
133
7.1 Mechanisms of drug resistance in cancer cells. Cancer cells can
evade chemotherapeutic treatment by increasing active drug efflux,
decreasing drug influx, increasing DNA repair mechanisms,
altering apoptotic machinery, altering cell cycle checkpoints,
enhancing drug metabolism, increasing vesicular sequestration or
altering molecular drug targets.93
141
7.2 Function of the P-gp pump. The model illustrates a protein which
uses ATP energy to actively efflux drug substrate across the
plasma membrane. The MDR modulator (chemosensitiser) may act
as a competitive inhibitor by occupying drug binding sites or as a
non-competitive inhibitor at chemosensitiser binding sites.84
144
7.3 Stemona alkaloids which were to be tested for inhibitory activity
against P-gp.
145
8.1 New alkaloids isolated from this work. 157
xxii
LIST OF TABLES
Table Page
3.1 1H NMR (500 MHz) spectroscopic data of 1-
hydroxyprotostemonine (this work) and 1-hydroxyprotostemonine
(41)39
in methanol-d4 solution (δ in ppm).
50
3.2 13
C (125 MHz) and 1H (500 MHz) NMR spectroscopic data of
(2′S)-hydroxystemofoline (this work) and (2′S)-
hydroxystemofoline (114)46
in CDCl3 solution (δ in ppm).
52
3.3 13
C (125 MHz) and 1H (500 MHz) NMR spectroscopic data of
stemocochinine (this work) and stemocochinine (46)10
in CDCl3
solution (δ in ppm).
54
3.4 1H NMR (500 MHz) spectroscopic data of oxystemocurtisin-N-
oxide and oxystemocurtisin-N-oxide (145)10
in methanol-d4
solution (δ in ppm).
55
3.5 1H NMR (500 MHz) spectroscopic data of stemofoline (this work)
and stemofoline (111)15
in CDCl3 solution (δ in ppm).
57
3.6 1H NMR (500 MHz) spectroscopic data of isotemofoline (this
work) and isotemofoline (123)71
in CDCl3 solution (δ in ppm).
58
4.1 13
C NMR (125 Hz), 1H NMR (500 MHz) and 2D spectroscopic
data for javastemonine A (186) in CDCl3 solution (δ in ppm).
67
4.2 1H (500 MHz) and
13C NMR (125 MHz) spectroscopic data of 13-
demethoxy-(11S*,12R*)-dihydroprotostemonine (55),22
javastemonine A (186) and stemocochinine (46)10
in CDCl3
68
xxiii
solution (δ in ppm).
4.3 13
C NMR (125 Hz), 1H NMR (500 MHz) and 2D spectroscopic
data for compound 187 in CDCl3 solution (δ in ppm).
73
4.4 13
C NMR (125 MHz) and 1H NMR (500 MHz) spectroscopic data
of protostemonine (40),10
isoprotostemonine (45)7 and
javastemonine B (187) in CDCl3 solution (δ in ppm).
74
4.5 13
C (125 MHz) and 1H NMR (500 MHz) spectroscopic data of 13-
demethoxy-11(S*),12(R*)-dihydroprotostemonine (this work) and
13-demethoxy-11(S*),12(R*)-dihydroprotostemonine (55)22
in
CDCl3 solution (δ in ppm).
76
4.6 13
C (125 MHz) and 1H NMR (500 MHz) spectroscopic data of
protostemonine (this work) and protostemonine (40)10
in CDCl3
solution (δ in ppm).
77
4.7 13
C (125 MHz) and 1H (500 MHz) NMR spectroscopic data of
isoprotostemonine (this work) and isoprotostemonine (45)7
in
CDCl3 solution (δ in ppm).
79
4.8 1H NMR (500 MHz) spectroscopic data of isomaistemonine (this
work) and isomaistemonine (45)73
in CDCl3 solution (δ in ppm).
81
5.1 13
C (125 Hz), 1H (500 MHz) and HMBC NMR spectroscopic data
for stichoneurine C (190) and a comparison with stemoninine
(49),76
in CDCl3 solution (δ in ppm).
91
5.2 13
C (125 Hz), 1H (500 MHz) and HMBC NMR spectroscopic data
for stichoneurine D (191) in CDCl3 solution (δ in ppm).
92
5.3 13
C (125 Hz) and 1H NMR (500 MHz) spectroscopic data of (+)-α- 94
xxiv
tocopherol (this work) and (+)-α-tocopherol (188)80
in CDCl3
solution (δ in ppm).
5.4 13
C (125 Hz) and 1H NMR (500 MHz) spectroscopic data of (R)-
(+)-goniothalamin and (R)-(+)-goniothalamin (189)82
in CDCl3
solution (δ in ppm).
95
5.5 13
C (125 Hz) and 1H NMR (500 MHz) spectroscopic data of
stemoninine (this work) and stemoninine (49)76
in CDCl3 solution
(δ in ppm).
97
5.6 13
C (125 Hz) and 1H NMR (500 MHz) spectroscopic data of
bisdehydrostemoninines A (this work) and bisdehydrostemoninines
A (60)18
in CDCl3 solution (δ in ppm).
99
5.7 1H NMR (500 MHz) spectroscopic data of sessilistemonamine A
(this work) and sessilistemonamone A (96)25
in CDCl3 solution (δ
in ppm).
102
5.8 1H NMR (500 MHz) spectroscopic data of sessilistemonamonies C
(this work) and sessilistemonamonies C (98)25
in CDCl3 solution (δ
in ppm).
103
5.9 13
C (125 Hz), 1H (500 MHz) and HMBC NMR spectroscopic data
for stichoneurine E (192) in CDCl3 solution (δ in ppm).
109
6.1 13
C (125 Hz), 1H (500 MHz) and 2D NMR spectroscopic data for
stichoneurine F (193) in methanol-d4 solution (δ in ppm).
119
6.2 13
C (125 Hz), 1H (500 MHz) and 2D NMR spectroscopic data for
stichoneurine G (194) methanol-d4 solution (δ in ppm).
124
6.3 13
C (125 Hz), 1H (500 MHz) and 2D NMR spectroscopic data for 130
xxv
sessilistemonamine E (195) in methanol-d4 solution (δ in ppm).
6.4 13
C (125 Hz), 1H (500 MHz) and 2D NMR spectroscopic data for
sessilistemonamine F (196) methanol-d4 solution (δ in ppm).
134
7.1 AChE inhibitory activities of isolated compounds. 139
7.2 AChE inhibitory activities of crude extracts. 139
7.3 Modulation of resistance to doxorubicin K562-Adr cells by
Stemona alkaloids (5 µM) after 48 h treatment.
146
7.4 Modulation of resistance to paclitaxel in K562-Adr cells by
Stemona alkaloids (5µM) after 48 h treatment.
147
7.5 Antimalarial activity (IC50) of isolated Stemona alkaloids againt P.
falpacirum.
150
7.6 Cytotoxicity activity (IC50) of isolated Stemona alkaloids against
mammalian cells (VERO and KB cells).
151
9.1 The references used for 1H and
13C NMR spectroscopy. 160
xxvi
LIST OF SCHEMES
Scheme Page
1.1 Hydrolysis of acetylcholine (ACh).23
5
1.2 Proposed biosynthetic connections between pyrrolo- and pyrido-
azepines.10
18
1.3 Biosynthesis of spermidine and the iminium ion intermediate A.46
19
1.4 Proposed biosynthetic pathway of stemofoline.46
20
1.5 Proposed biosynthesis pathway of pyrido[1,2-a]-azepines
alkaloids.47
21
1.6 Proposed biosynthesis of cochinchistemoninone (138) and
cochinchistemonine (137).48
21
1.7 Classification of Stemona alkaloids into three skeleton types based
on different carbon chains attached to C-9 of the pyrroloazepine
core.12
23
1.8 Hypothetical biosynthetic pathway of pandanamide and its
possible cyclization products 74, 184 and 185.5
24
6.1 Proposed biosynthesis of stichoneurine F and G (193 and 194). 120
6.2 Proposed biosynthesis of sessilistemoamine E and F (195 and
196).
135
7.1 Principle of the Ellman method.81
138
xxvii
LIST OF ABBREVIATIONS
δ Chemical shift
λ Wavelength
[α]D Specific rotation
Ar Aromatic
ACh Acetylcholine
AChE Acetylcholinesterase
AD Alzheimer’s desease
ATCh Acetylthiocholine
ATChI Acetylthiocholine iodide
APT Attached proton test
App Apparent
calcd Calculated
CC Column chromatography
Methanol-d4 Deuterated methanol
COSY Correlation spectroscopy
DCM Dichloromethane
DEPT Distortionless enhancement by polarization transfer
DMSO Dimethyl sulfoxide
DTNB Dithiobisnitrobenzoate
d Doublet
dd Double of doublets (NMR)
ddd double of doublet of doublets (NMR)
xxviii
dddd Double of doublet of doublet of doublets (NMR)
dq Double of quartets (NMR)
dt Double of triplets (NMR)
eeAChE Electric eel acetylcholinestrase
EA Ethyl acetate
EI Electron impact
ESI Electrospray ionization
ESIMS Electrospray ionization mass spectrum
FR Fold-revesal resistance
g Gram
gCOSY Correlated spectroscopy
gHMBC Heteronuclear multiple bond correlation
gHSQC Heteronuclear single quantum correlation
hAChE Human acetylcholinestrase
Hz Hertz
HRESIMS High resolution electrospray ionization mass spectrum
IC50 The half maximal inhibitory concentration
IR Infrared
lit. Literature
m Multiplet
m/z Mass/charge ratio
MDR Multidrug resistance
mg Milligram
mL Mililitre
xxix
[M+H]+ Protonated molecular ion
Me Methyl
NMR Nuclear Magnetic Resonance
NOESY Nuclear Overhauser Effect Spectroscopy
P-gp Permeability glycoprotein
ppm Parts per million
PTLC Preparative thin-layer chromatography
q Quartet
Rf Relative mobility
RR Relative resistance
R2 Coefficient of determination
rt Room temperature
s Singlet
SD Standard deviation
S. Stemona
St. Stichoneuron
sp. Species
t Triplet
TLC Thin layer chromatography
TMS Tetramethylsilane
µL Microlitre
µM Micromolar
1
CHAPTER 1
INTRODUCTION
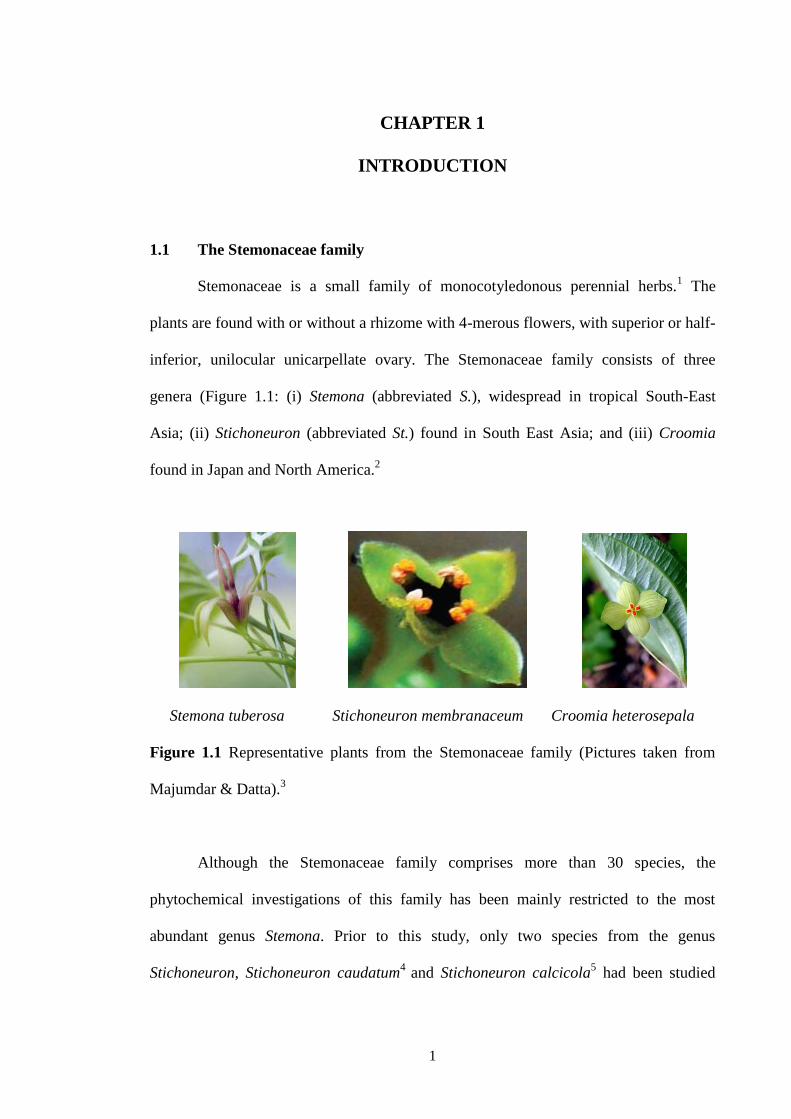
1.1 The Stemonaceae family
Stemonaceae is a small family of monocotyledonous perennial herbs.1 The
plants are found with or without a rhizome with 4-merous flowers, with superior or half-
inferior, unilocular unicarpellate ovary. The Stemonaceae family consists of three
genera (Figure 1.1: (i) Stemona (abbreviated S.), widespread in tropical South-East
Asia; (ii) Stichoneuron (abbreviated St.) found in South East Asia; and (iii) Croomia
found in Japan and North America.2
Stemona tuberosa Stichoneuron membranaceum Croomia heterosepala
Figure 1.1 Representative plants from the Stemonaceae family (Pictures taken from
Majumdar & Datta).3
Although the Stemonaceae family comprises more than 30 species, the
phytochemical investigations of this family has been mainly restricted to the most
abundant genus Stemona. Prior to this study, only two species from the genus
Stichoneuron, Stichoneuron caudatum4
and Stichoneuron calcicola5 had been studied
2
for their phytochemicals. Xu and coworkers6 initiated an extensive investigation of
some Stemona species in the early 1980s leading to the isolation and structural
elucidation of many of the currently known Stemona alkaloids.7 Most of the
phytochemical studies of this family were restricted to the roots of Stemona plants
although a few studies of the leaves and stems have been also reported.8 Several reviews
of the Stemona alkaloids, their structures, biological activities and the plant species and
parts from which they have been isolated from have been published.2,4 5
The chemical
interest in Stemonaceae extracts was stimulated by their popular use in South-East Asia
as insecticides and vermifuges, as well as their use against respiratory diseases.913
1.2 Biological activities of the Stemona alkaloids
Extracts of Stemonaceae have found popular use as insecticides, vermifuges,
antihelmitics and in the treatment of respiratory diseases in China and Japan.2,1416
The
water extracts obtained from the roots of some Stemonaceae species were widely used
in China against human and cattle parasites, agricultural pests and as domestic
insecticides.14
The methanolic extracts obtained from the fresh leaves of S. japonica
showed strong insecticidal activity against silk worm larvae.14
The crude extracts of
Stemonaceae species have also shown antitubercular and antitussive activities.16
Previous chemical and pharmacological investigations have revealed that alkaloids
might represent the main bioactive constituents in these plants. A further study on the
isolated individual alkaloids revealed that isostenine (3) (Figure 1.5),
neotuberostemonine (11) (Figure 1.5), bisdehydrostemoninine (62), stemoninine (49)
and stemoamide (36) (Figure 1.6) were potent antitussive agents.9,1718
3
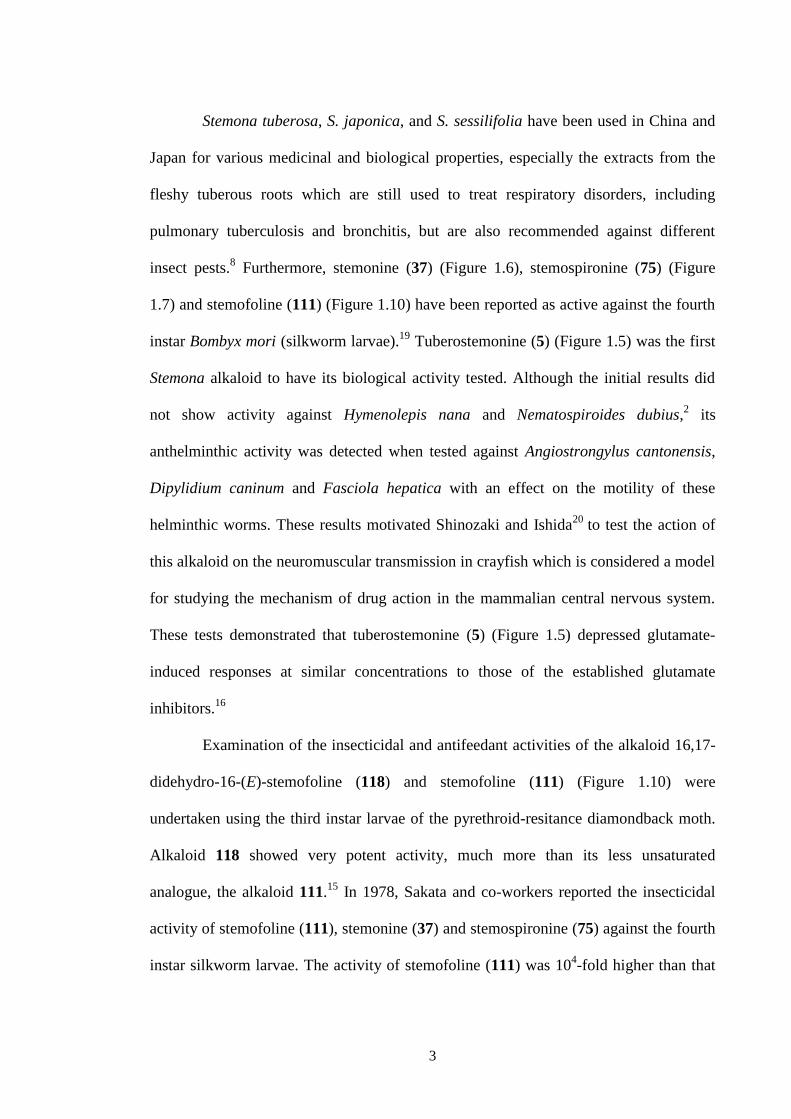
Stemona tuberosa, S. japonica, and S. sessilifolia have been used in China and
Japan for various medicinal and biological properties, especially the extracts from the
fleshy tuberous roots which are still used to treat respiratory disorders, including
pulmonary tuberculosis and bronchitis, but are also recommended against different
insect pests.8 Furthermore, stemonine (37) (Figure 1.6), stemospironine (75) (Figure
1.7) and stemofoline (111) (Figure 1.10) have been reported as active against the fourth
instar Bombyx mori (silkworm larvae).19
Tuberostemonine (5) (Figure 1.5) was the first
Stemona alkaloid to have its biological activity tested. Although the initial results did
not show activity against Hymenolepis nana and Nematospiroides dubius,2 its
anthelminthic activity was detected when tested against Angiostrongylus cantonensis,
Dipylidium caninum and Fasciola hepatica with an effect on the motility of these
helminthic worms. These results motivated Shinozaki and Ishida20
to test the action of
this alkaloid on the neuromuscular transmission in crayfish which is considered a model
for studying the mechanism of drug action in the mammalian central nervous system.
These tests demonstrated that tuberostemonine (5) (Figure 1.5) depressed glutamate-
induced responses at similar concentrations to those of the established glutamate
inhibitors.16
Examination of the insecticidal and antifeedant activities of the alkaloid 16,17-
didehydro-16-(E)-stemofoline (118) and stemofoline (111) (Figure 1.10) were
undertaken using the third instar larvae of the pyrethroid-resitance diamondback moth.
Alkaloid 118 showed very potent activity, much more than its less unsaturated
analogue, the alkaloid 111.15
In 1978, Sakata and co-workers reported the insecticidal
activity of stemofoline (111), stemonine (37) and stemospironine (75) against the fourth
instar silkworm larvae. The activity of stemofoline (111) was 104-fold higher than that
4
of the alkaloids 37 and 75.8 From these observations, the insecticidal activity of 16,17-
didehydro-16-(E)-stemofoline (118) was evaluated to be strongest among the
stemofoline-related alkaloids, so far isolated, from plants of the genus Stemona.15
The activities of these alkaloids were also studied on the nicotinic acetylcholine
receptors (nAChRs) of insects. These receptors are cholinergic receptors which are
triggered by the binding of the neurotransmitter acetylcholine (ACh).21
This study
indicated that 6β-hydroxystemofoline (127), 16-hydroxystemofoline (128) and
neostemofoline (58) showed agonist effects on insect nAChR while protostemodiol
(110) and 13-demethoxy-11(S*),12(R*)-dihydroprotostemonine (55) acted as an
antagonist.22
Acetylcholine (ACh) receptors in humans are located at the top end of dendrites
and are mainly present in the central nervous system. The acetylcholinestrase (AChE)
enzyme controls the level and duration of action of ACh. This enzyme catalyses the
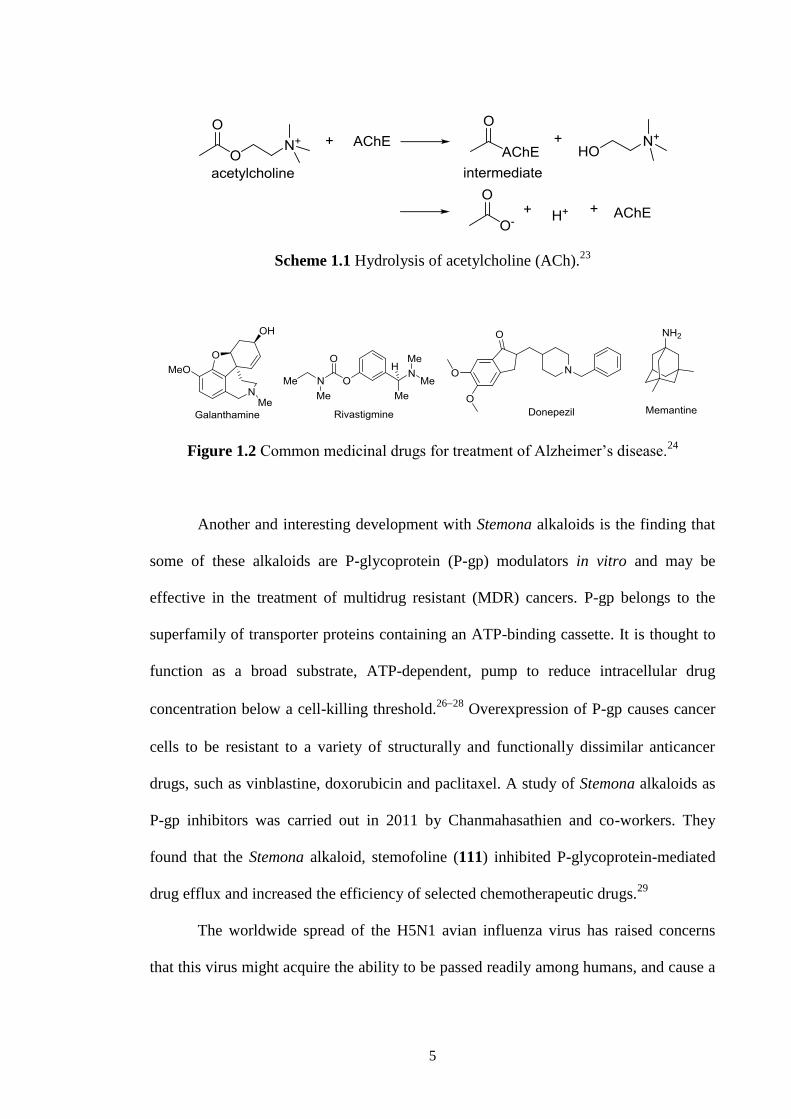
hydrolysis of ACh to inactive choline and acetate (Scheme 1.1).23
The inhibition of
AChE prolongs the duration of action of ACh which is useful for the treatment of the
symptoms of Alzheimer disease (AD). The cholinergic hypothesis states that AD
patients have an abnormal low level of ACh. Many alkaloids have been reported to be
AChE inhibitors. The well-known AD drugs are galanthamine, rivastigmine, donepezil
and memantine (Figure 1.2).24
However, a few Stemona alkaloids such as
sessilistemonamine A (96) and B (97) were reported to act as AChE inhibitors but with
less activity compared with the current clinical drug, galanthamine. These and other
Stemona alkaloids may also have therapeutic applications in the treatment of AD.25
5
Scheme 1.1 Hydrolysis of acetylcholine (ACh).23
Figure 1.2 Common medicinal drugs for treatment of Alzheimer’s disease.24
Another and interesting development with Stemona alkaloids is the finding that
some of these alkaloids are P-glycoprotein (P-gp) modulators in vitro and may be
effective in the treatment of multidrug resistant (MDR) cancers. P-gp belongs to the
superfamily of transporter proteins containing an ATP-binding cassette. It is thought to
function as a broad substrate, ATP-dependent, pump to reduce intracellular drug
concentration below a cell-killing threshold.2628
Overexpression of P-gp causes cancer
cells to be resistant to a variety of structurally and functionally dissimilar anticancer
drugs, such as vinblastine, doxorubicin and paclitaxel. A study of Stemona alkaloids as
P-gp inhibitors was carried out in 2011 by Chanmahasathien and co-workers. They
found that the Stemona alkaloid, stemofoline (111) inhibited P-glycoprotein-mediated
drug efflux and increased the efficiency of selected chemotherapeutic drugs.29
The worldwide spread of the H5N1 avian influenza virus has raised concerns
that this virus might acquire the ability to be passed readily among humans, and cause a
6
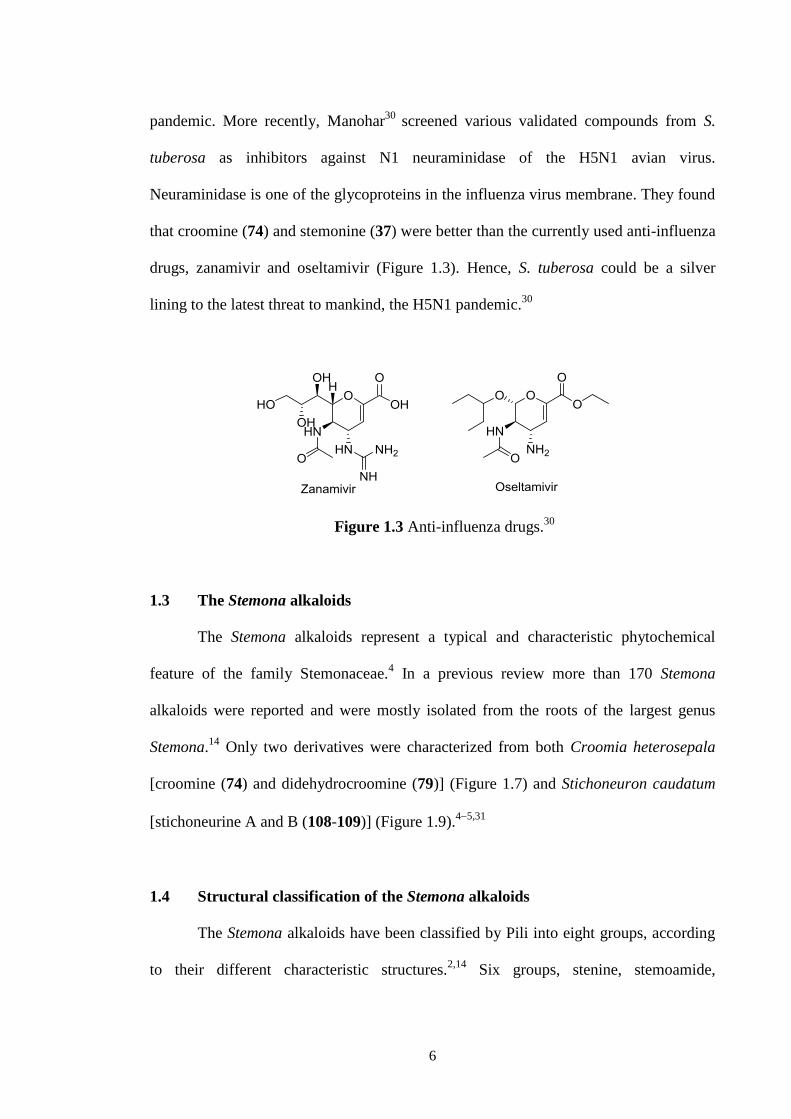
pandemic. More recently, Manohar30
screened various validated compounds from S.
tuberosa as inhibitors against N1 neuraminidase of the H5N1 avian virus.
Neuraminidase is one of the glycoproteins in the influenza virus membrane. They found
that croomine (74) and stemonine (37) were better than the currently used anti-influenza
drugs, zanamivir and oseltamivir (Figure 1.3). Hence, S. tuberosa could be a silver
lining to the latest threat to mankind, the H5N1 pandemic.30
Figure 1.3 Anti-influenza drugs.30
1.3 The Stemona alkaloids
The Stemona alkaloids represent a typical and characteristic phytochemical
feature of the family Stemonaceae.4 In a previous review more than 170 Stemona
alkaloids were reported and were mostly isolated from the roots of the largest genus
Stemona.14
Only two derivatives were characterized from both Croomia heterosepala
[croomine (74) and didehydrocroomine (79)] (Figure 1.7) and Stichoneuron caudatum
[stichoneurine A and B (108-109)] (Figure 1.9).45,31
1.4 Structural classification of the Stemona alkaloids
The Stemona alkaloids have been classified by Pili into eight groups, according
to their different characteristic structures.2,14
Six groups, stenine, stemoamide,
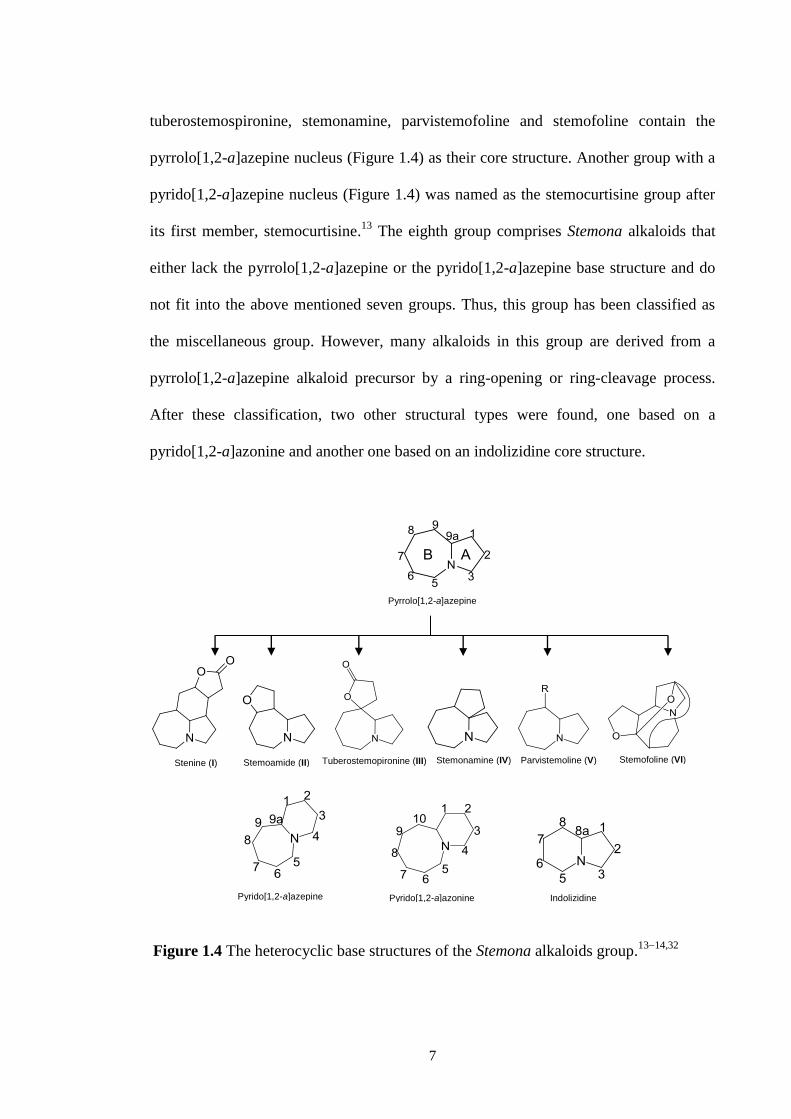
7
tuberostemospironine, stemonamine, parvistemofoline and stemofoline contain the
pyrrolo[1,2-a]azepine nucleus (Figure 1.4) as their core structure. Another group with a
pyrido[1,2-a]azepine nucleus (Figure 1.4) was named as the stemocurtisine group after
its first member, stemocurtisine.13
The eighth group comprises Stemona alkaloids that
either lack the pyrrolo[1,2-a]azepine or the pyrido[1,2-a]azepine base structure and do
not fit into the above mentioned seven groups. Thus, this group has been classified as
the miscellaneous group. However, many alkaloids in this group are derived from a
pyrrolo[1,2-a]azepine alkaloid precursor by a ring-opening or ring-cleavage process.
After these classification, two other structural types were found, one based on a
pyrido[1,2-a]azonine and another one based on an indolizidine core structure.
Figure 1.4 The heterocyclic base structures of the Stemona alkaloids group.1314,32
Pyrido[1,2-a]azepine Pyrido[1,2-a]azonine Indolizidine
Stemoamide (II) Tuberostemopironine (III) Stemonamine (IV) Parvistemoline (V) Stemofoline (VI) Stenine (I)
Pyrrolo[1,2-a]azepine
8
N
O
O
H
H
H1211
O O
H
9
18
5
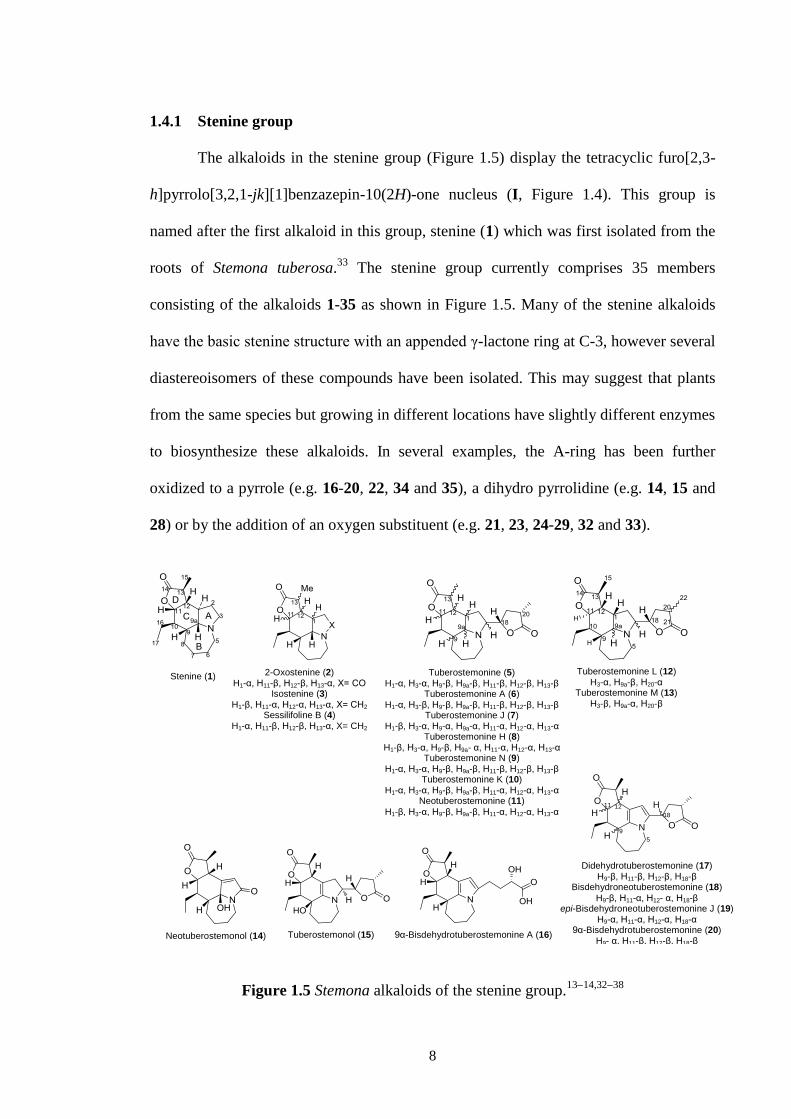
1.4.1 Stenine group
The alkaloids in the stenine group (Figure 1.5) display the tetracyclic furo[2,3-
h]pyrrolo[3,2,1-jk][1]benzazepin-10(2H)-one nucleus (I, Figure 1.4). This group is
named after the first alkaloid in this group, stenine (1) which was first isolated from the
roots of Stemona tuberosa.33
The stenine group currently comprises 35 members
consisting of the alkaloids 1-35 as shown in Figure 1.5. Many of the stenine alkaloids
have the basic stenine structure with an appended γ-lactone ring at C-3, however several
diastereoisomers of these compounds have been isolated. This may suggest that plants
from the same species but growing in different locations have slightly different enzymes
to biosynthesize these alkaloids. In several examples, the A-ring has been further
oxidized to a pyrrole (e.g. 16-20, 22, 34 and 35), a dihydro pyrrolidine (e.g. 14, 15 and
28) or by the addition of an oxygen substituent (e.g. 21, 23, 24-29, 32 and 33).
Figure 1.5 Stemona alkaloids of the stenine group.1314,3238
Stenine (1) 2-Oxostenine (2) H1-α, H11-β, H12-β, H13-α, X= CO
Isostenine (3) H1-β, H11-α, H12-α, H13-α, X= CH2
Sessilifoline B (4) H1-α, H11-β, H12-β, H13-α, X= CH2
Tuberostemonine (5) H1-α, H3-α, H9-β, H9a-β, H11-β, H12-β, H13-β
Tuberostemonine A (6) H1-α, H3-β, H9-β, H9a-β, H11-β, H12-β, H13-β
Tuberostemonine J (7) H1-β, H3-α, H9-α, H9a-α, H11-α, H12-α, H13-α
Tuberostemonine H (8) H1-β, H3-α, H9-β, H9a- α, H11-α, H12-α, H13-α
Tuberostemonine N (9) H1-α, H3-α, H9-β, H9a-β, H11-β, H12-β, H13-β
Tuberostemonine K (10) H1-α, H3-α, H9-β, H9a-β, H11-α, H12-α, H13-α
Neotuberostemonine (11)
H1-β, H3-α, H9-β, H9a-β, H11-α, H12-α, H13-α
Tuberostemonol (15)
Didehydrotuberostemonine (17) H9-β, H11-β, H12-β, H18-β
Bisdehydroneotuberostemonine (18)
H9-β, H11-α, H12- α, H18-β epi-Bisdehydroneotuberostemonine J (19)
H9-α, H11-α, H12-α, H18-α 9α-Bisdehydrotuberostemonine (20)
H9- α, H11-β, H12-β, H18-β
9α-Bisdehydrotuberostemonine A (16) Neotuberostemonol (14)
Tuberostemonine L (12) H3-α, H9a-β, H20-α
Tuberostemonine M (13) H3-β, H9a-α, H20-β
9
N O O
HOHO
H
O
H
NO
OH
O
H
H
H
O
Figure 1.5 Stemona alkaloids of the stenine group (continued).1314,3238
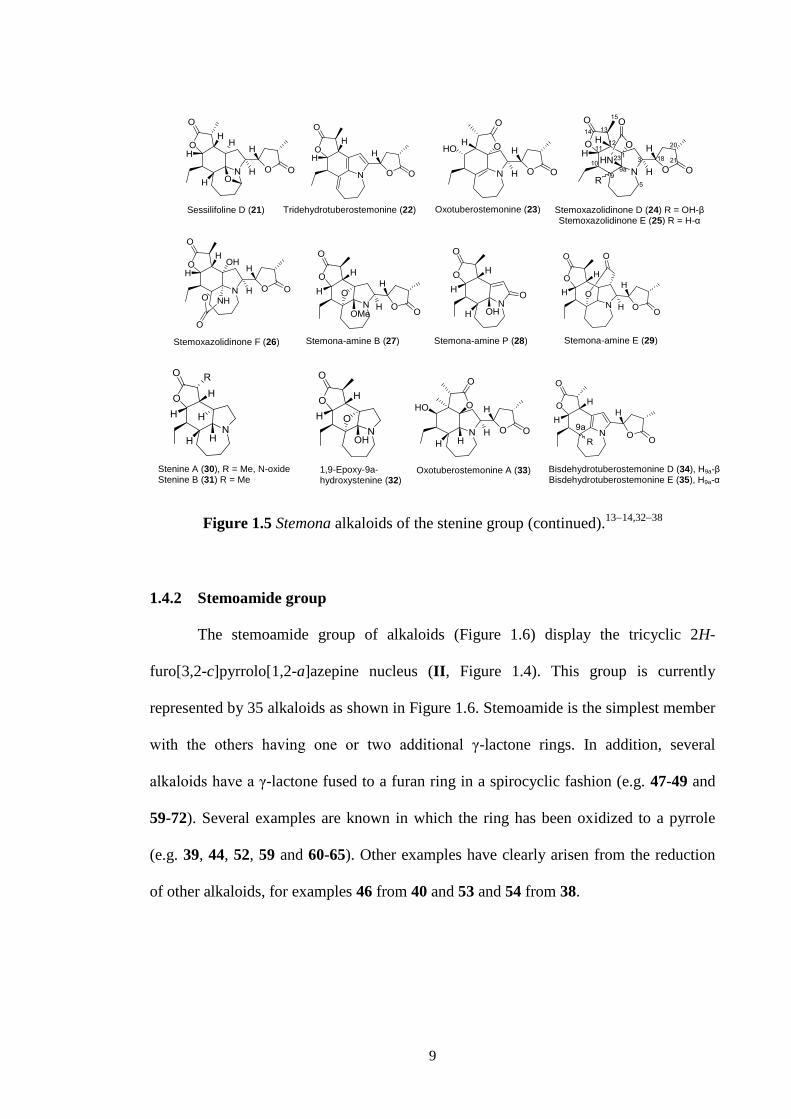
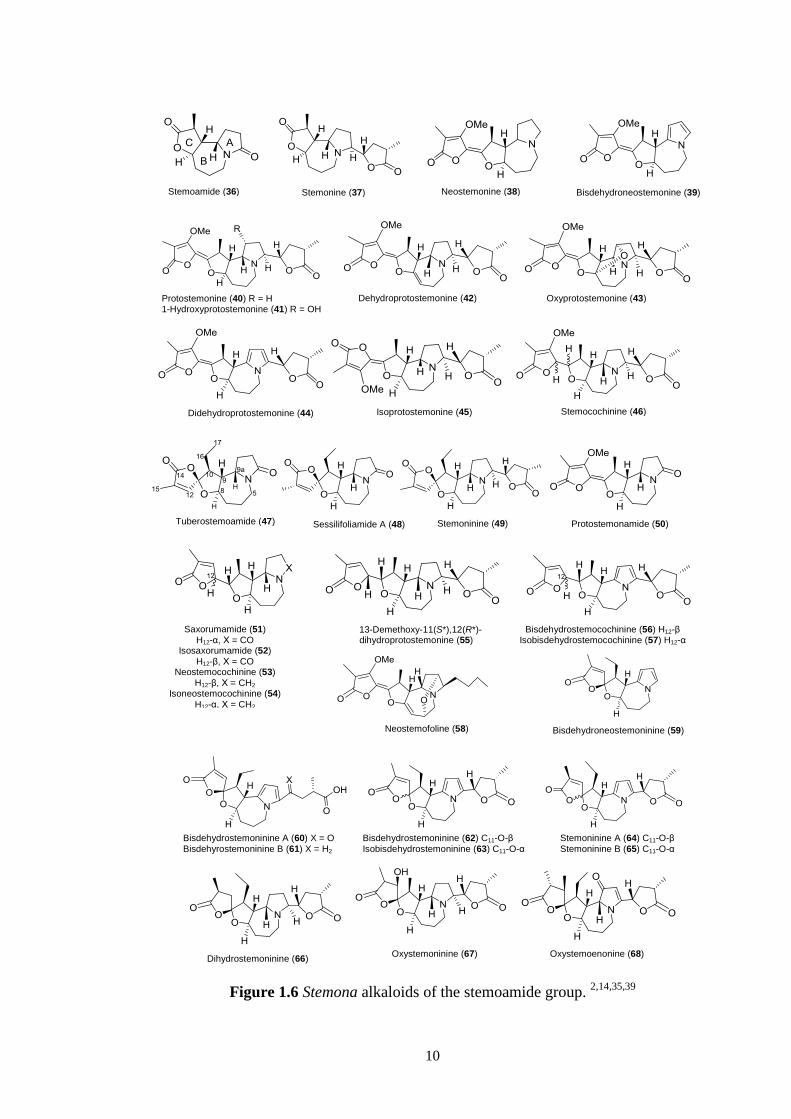
1.4.2 Stemoamide group
The stemoamide group of alkaloids (Figure 1.6) display the tricyclic 2H-
furo[3,2-c]pyrrolo[1,2-a]azepine nucleus (II, Figure 1.4). This group is currently
represented by 35 alkaloids as shown in Figure 1.6. Stemoamide is the simplest member
with the others having one or two additional γ-lactone rings. In addition, several
alkaloids have a γ-lactone fused to a furan ring in a spirocyclic fashion (e.g. 47-49 and
59-72). Several examples are known in which the ring has been oxidized to a pyrrole
(e.g. 39, 44, 52, 59 and 60-65). Other examples have clearly arisen from the reduction
of other alkaloids, for examples 46 from 40 and 53 and 54 from 38.
Oxotuberostemonine (23) Stemoxazolidinone D (24) R = OH-β Stemoxazolidinone E (25) R = H-α
Stemona-amine B (27) Stemona-amine P (28)
Sessilifoline D (21) Tridehydrotuberostemonine (22)
Stemoxazolidinone F (26) Stemona-amine E (29)
Stenine A (30), R = Me, N-oxide Stenine B (31) R = Me
1,9-Epoxy-9a- hydroxystenine (32)
Oxotuberostemonine A (33) Bisdehydrotuberostemonine D (34), H9a-β Bisdehydrotuberostemonine E (35), H9a-α
10
Figure 1.6 Stemona alkaloids of the stemoamide group. 2,14,35,39
Neostemofoline (58)
Stemoamide (36) Neostemonine (38) Stemonine (37) Bisdehydroneostemonine (39)
Protostemonine (40) R = H 1-Hydroxyprotostemonine (41) R = OH
Dehydroprotostemonine (42)
(29)
Oxyprotostemonine (43)
(29)
Didehydroprotostemonine (44) Isoprotostemonine (45) Stemocochinine (46)
Tuberostemoamide (47) Sessilifoliamide A (48) Stemoninine (49) Protostemonamide (50)
Saxorumamide (51) H12-α, X = CO
Isosaxorumamide (52) H12-β, X = CO
Neostemocochinine (53) H12-β, X = CH2
Isoneostemocochinine (54) H12-α, X = CH2
13-Demethoxy-11(S*),12(R*)- dihydroprotostemonine (55)
Bisdehydrostemocochinine (56) H12-β Isobisdehydrostemocochinine (57) H12-α
Bisdehydroneostemoninine (59)
Bisdehydrostemoninine A (60) X = O Bisdehyrostemoninine B (61) X = H2
Bisdehydrostemoninine (62) C11-O-β Isobisdehydrostemoninine (63) C11-O-α
Stemoninine A (64) C11-O-β Stemoninine B (65) C11-O-α
Dihydrostemoninine (66) Oxystemoninine (67) Oxystemoenonine (68)

11
Figure 1.6 Stemona alkaloids of the stemoamide group (continued).2,14,35,39
1.4.3 Tuberostemospironine group
Alkaloids in the tuberostemospironine group (Figure 1.7) are characterized by
the presence of a spiro[furan-2-(5H),9’[9H]pyrrolo[1,2-a]azepin]-5-one nucleus (III,
Figure 1.4). There are 15 alkaloids included in this group as shown in Figure 1.7. These
alkaloids are based around the simplest member, tuberostemospironine (73) and feature
a spiro γ-lactone at C-9. Interestingly, stemona-lactam R (86), the C-9 epimer of 73, has
also been isolated suggesting different enzymes are involved in their biosynthesis. The
most complex alkaloid in this group is sessilifoliamine A (84) which has a pentacyclic
structure.
NO
OO
H
OH
9
Figure 1.7 Stemona alkaloids of the tuberostemospironine group.2,5,14,31,35,4041
Stemoenonine (69) R = H Methylstemoenonine (70) R = CH3
Tuberostemospironine (73) Croomine (74) R = H
Stemospironine (75) R = OMe
Stemotinine (76)
Isostemotinine (77) Stemonidine (78) Didehydrocroomine (79)
1,9a-Seco-stemoninine (71) Stemona-lactam O (72)

12
Figure 1.7 Stemona alkaloids of the tuberostemospironine group
(continued).2,5,14,31,35,4041
1.4.4 Stemoamine group
This group (Figure 1.8) is characterized by the presence of the tetracyclic
spiro[1H-cyclopenta[b]pyrrolo[1,2-a]azepine-11(10H),2′(5′H)-furan]-5′,10-dione
skeleton (IV, Figure 1.4) and comprises 11 alkaloids.
Figure 1.8 Stemona alkaloids of the stemonamine group.2,14,25
10-Hydroxycroomine (80) R1 = OH, R2 = H
6-Hydroxycroomine (81)
R1 = H, R2 = OH
Dehydrocroomine (82) Tuberospironine (83)
Sessilifoliamine A (84)
Stemonamine (88) Isostemonamine (89) Stemonamide (90) Isostemonamide (91)
Sessilistemoamine A (96), H10-β, H11-α, H12- α, H9a-C1-β Sessilistemonamine B (97)
H10-α, H11- β, H12- β, H9a-C1-α Sessilistemonamine C (98)
H10-α, H11-α, H12- α, H9a-C1-β
Maistemonine (92) R = H
Oxymaistemonine (93) R = OH
Isooxymaistemonine (94) R = OH Isomaistemonine (95) R = H
Tuberospironine A (85)
Stemona-lactam R (86) Dehydoisostemotinine (87)
13
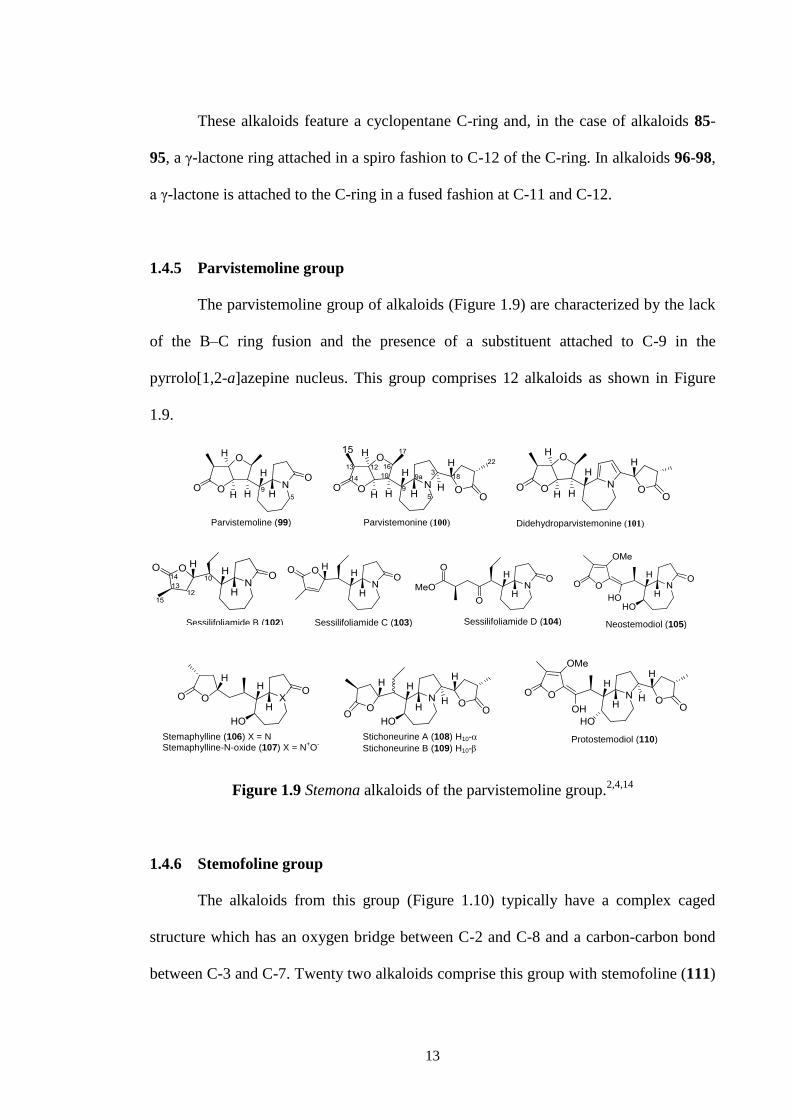
These alkaloids feature a cyclopentane C-ring and, in the case of alkaloids 85-
95, a γ-lactone ring attached in a spiro fashion to C-12 of the C-ring. In alkaloids 96-98,
a γ-lactone is attached to the C-ring in a fused fashion at C-11 and C-12.
1.4.5 Parvistemoline group
The parvistemoline group of alkaloids (Figure 1.9) are characterized by the lack
of the B–C ring fusion and the presence of a substituent attached to C-9 in the
pyrrolo[1,2-a]azepine nucleus. This group comprises 12 alkaloids as shown in Figure
1.9.
Figure 1.9 Stemona alkaloids of the parvistemoline group.2,4,14
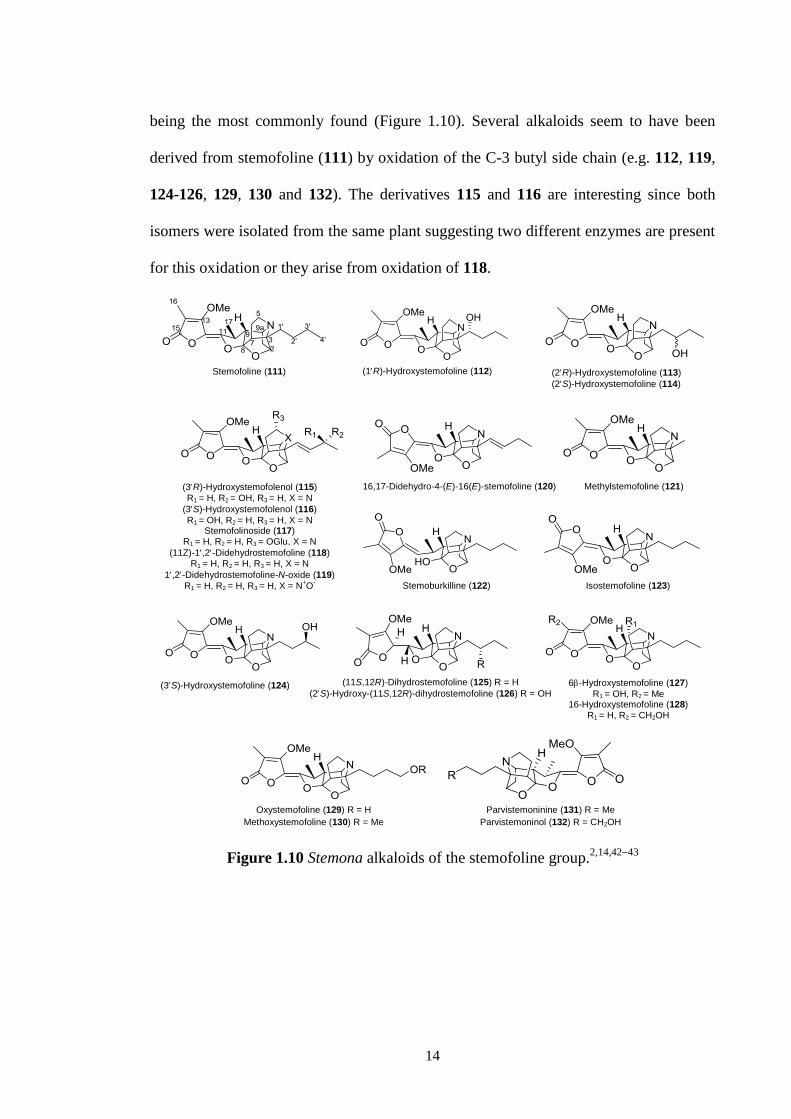
1.4.6 Stemofoline group
The alkaloids from this group (Figure 1.10) typically have a complex caged
structure which has an oxygen bridge between C-2 and C-8 and a carbon-carbon bond
between C-3 and C-7. Twenty two alkaloids comprise this group with stemofoline (111)
Parvistemoline (99) Parvistemonine (100) Didehydroparvistemonine (101)
Sessilifoliamide B (102) Sessilifoliamide C (103) Sessilifoliamide D (104) Neostemodiol (105)
Stemaphylline (106) X = N Stemaphylline-N-oxide (107) X = N
+O
-
Stichoneurine A (108) H10-
Stichoneurine B (109) H10- Protostemodiol (110)
14
being the most commonly found (Figure 1.10). Several alkaloids seem to have been
derived from stemofoline (111) by oxidation of the C-3 butyl side chain (e.g. 112, 119,
124-126, 129, 130 and 132). The derivatives 115 and 116 are interesting since both
isomers were isolated from the same plant suggesting two different enzymes are present
for this oxidation or they arise from oxidation of 118.
Figure 1.10 Stemona alkaloids of the stemofoline group.2,14,4243
Stemofoline (111) (1R)-Hydroxystemofoline (112) (2R)-Hydroxystemofoline (113)
(2S)-Hydroxystemofoline (114)
(3R)-Hydroxystemofolenol (115)
R1 = H, R2 = OH, R3 = H, X = N
(3S)-Hydroxystemofolenol (116)
R1 = OH, R2 = H, R3 = H, X = N Stemofolinoside (117)
R1 = H, R2 = H, R3 = OGlu, X = N
(11Z)-1,2-Didehydrostemofoline (118) R1 = H, R2 = H, R3 = H, X = N
1,2-Didehydrostemofoline-N-oxide (119)
R1 = H, R2 = H, R3 = H, X = N+O
-
16,17-Didehydro-4-(E)-16(E)-stemofoline (120) Methylstemofoline (121)
Stemoburkilline (122) Isostemofoline (123)
6-Hydroxystemofoline (127)
R1 = OH, R2 = Me 16-Hydroxystemofoline (128)
R1 = H, R2 = CH2OH
Oxystemofoline (129) R = H
Methoxystemofoline (130) R = Me
Parvistemoninine (131) R = Me
Parvistemoninol (132) R = CH2OH
(11S,12R)-Dihydrostemofoline (125) R = H
(2S)-Hydroxy-(11S,12R)-dihydrostemofoline (126) R = OH (3S)-Hydroxystemofoline (124)
15
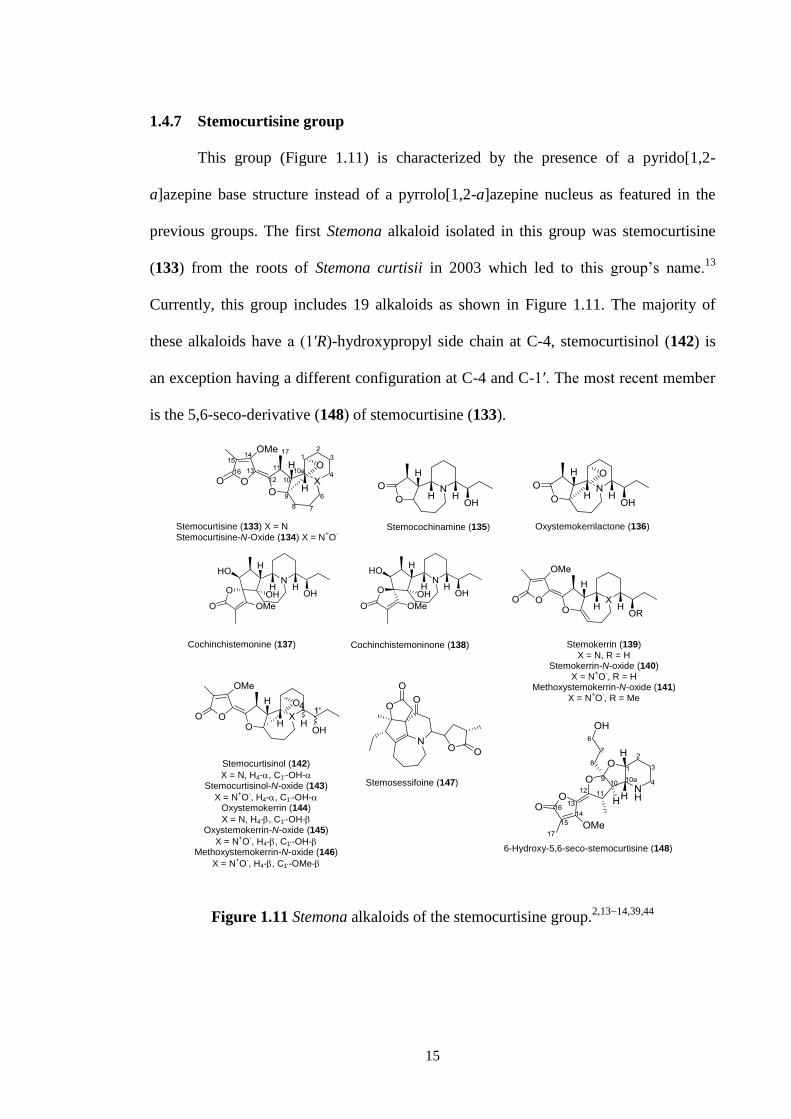
1.4.7 Stemocurtisine group
This group (Figure 1.11) is characterized by the presence of a pyrido[1,2-
a]azepine base structure instead of a pyrrolo[1,2-a]azepine nucleus as featured in the
previous groups. The first Stemona alkaloid isolated in this group was stemocurtisine
(133) from the roots of Stemona curtisii in 2003 which led to this group’s name.13
Currently, this group includes 19 alkaloids as shown in Figure 1.11. The majority of
these alkaloids have a (1′R)-hydroxypropyl side chain at C-4, stemocurtisinol (142) is
an exception having a different configuration at C-4 and C-1′. The most recent member
is the 5,6-seco-derivative (148) of stemocurtisine (133).
Figure 1.11 Stemona alkaloids of the stemocurtisine group.2,1314,39,44
Stemocurtisine (133) X = N Stemocurtisine-N-Oxide (134) X = N
+O
-
Stemocochinamine (135)
6-Hydroxy-5,6-seco-stemocurtisine (148)
Stemocurtisinol (142)
X = N, H4-, C1-OH- Stemocurtisinol-N-oxide (143)
X = N+O
-, H4-, C1-OH-
Oxystemokerrin (144)
X = N, H4-, C1-OH- Oxystemokerrin-N-oxide (145)
X = N+O
-, H4-, C1-OH-
Methoxystemokerrin-N-oxide (146)
X = N+O
-, H4-, C1-OMe-
Cochinchistemoninone (138) Cochinchistemonine (137)
Oxystemokerrilactone (136)
Stemokerrin (139) X = N, R = H
Stemokerrin-N-oxide (140) X = N
+O
-, R = H
Methoxystemokerrin-N-oxide (141) X = N
+O
-, R = Me
Stemosessifoine (147)

16
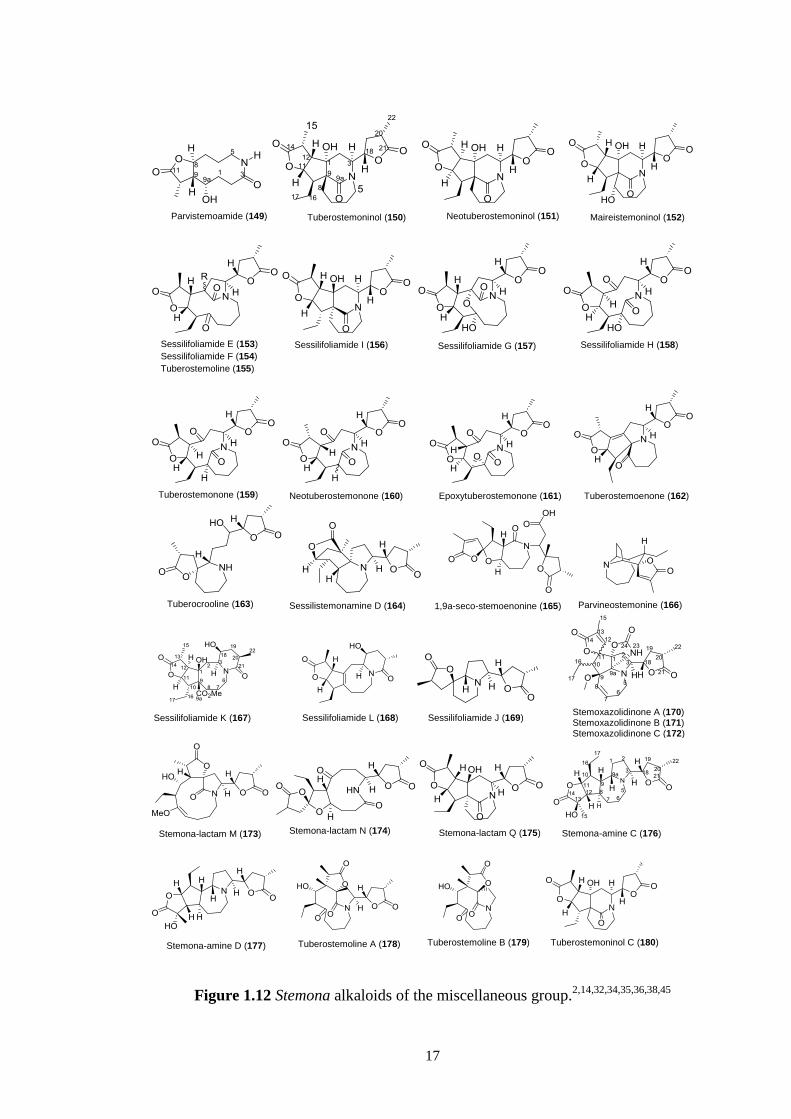
1.4.8 Miscellaneous group
The miscellaneous group (Figure 1.12) comprises alkaloids that do not fit in any of the
general classifications as shown in Figure 1.12. Members of this group exhibit a
polycyclic skeleton but neither a pyrrolo[1,2-a]azepine nor a pyrido[1,2-a]azepine
system, except for tuberostemoenone (162), sessilistemonamine D (164) and
stemoxazolidinone A-C (170-172). Many of these compounds arise from oxidative
cleavage of the pyrido[1,2-a]azepine skeleton and further rearrangement, including the
recently isolated alkaloids stemona-lactam M (173) and stemona-lactam N (174).
Members of this group are parvistemoamide (149), tuberostemoninol (150),
neotuberostemoninol (151), maireistemoninol (152), sessilifoliamide E (153),
sessilifoliamide F (154), tuberostemoline (155), sessilifoliamide I (156), sessilifoliamide
G (157), sessilifoliamide H (158), tuberostemonone (159), neotuberostemonone (160),
epoxytuberostemonone (161), tuberocrooline (163), 1,9a-seco-stemoenonine (165),
parvineostemonine (166) and stemona-lactam Q (175) (Figure 1.12). However, other
bicyclic systems were also found for example, the pyrido[1,2-a]azonine nucleus (Figure
1.12) is found in sessilifoliamide K (167) and sessilifoliamide L (168) and an
indolizidine nucleus (Figure 1.12) in sessilifoliamide J (169). More recently,
Hitotsuyanagi36
reported another two Stemona alkaloids from S. tuberosa with a new
skeleton. They are stemona-amines C and D (176-177) and in this thesis, we put them in
this group as the authors claimed that these alkaloids have a novel skeleton.36
Another
three new Stemona alkaloids have been reported, tuberostemoline A and B (178-179)
and tuberostemoninol C (180).38
The total members of this group are 32 (Figure 1.12).
17
NO
OH
H
H OHOOH
O
Figure 1.12 Stemona alkaloids of the miscellaneous group.2,14,32,34,35,36,38,45
Parvistemoamide (149) Tuberostemoninol (150) Neotuberostemoninol (151) Maireistemoninol (152)
Sessilifoliamide E (153)
Sessilifoliamide F (154)
Tuberostemoline (155)
Sessilifoliamide I (156) Sessilifoliamide G (157) Sessilifoliamide H (158)
Tuberostemonone (159) Neotuberostemonone (160) Epoxytuberostemonone (161) Tuberostemoenone (162)
Tuberocrooline (163) Sessilistemonamine D (164) 1,9a-seco-stemoenonine (165) Parvineostemonine (166)
Sessilifoliamide K (167) Sessilifoliamide L (168)
Sessilifoliamide J (169)
Stemoxazolidinone A (170) Stemoxazolidinone B (171) Stemoxazolidinone C (172)
Stemona-lactam M (173) Stemona-lactam N (174) Stemona-lactam Q (175)
Stemona-amine D (177)
Stemona-amine C (176)
Tuberostemoline A (178) Tuberostemoline B (179)
Tuberostemoninol C (180)
18
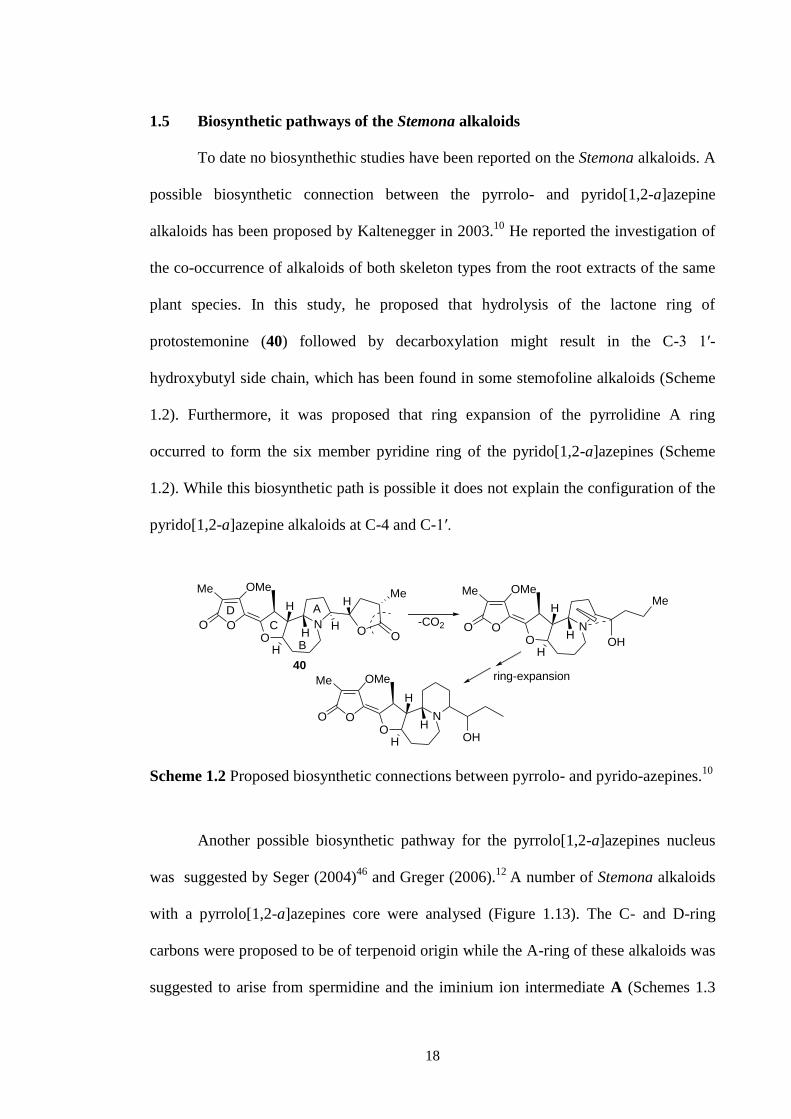
1.5 Biosynthetic pathways of the Stemona alkaloids
To date no biosynthethic studies have been reported on the Stemona alkaloids. A
possible biosynthetic connection between the pyrrolo- and pyrido[1,2-a]azepine
alkaloids has been proposed by Kaltenegger in 2003.10
He reported the investigation of
the co-occurrence of alkaloids of both skeleton types from the root extracts of the same
plant species. In this study, he proposed that hydrolysis of the lactone ring of
protostemonine (40) followed by decarboxylation might result in the C-3 1′-
hydroxybutyl side chain, which has been found in some stemofoline alkaloids (Scheme
1.2). Furthermore, it was proposed that ring expansion of the pyrrolidine A ring
occurred to form the six member pyridine ring of the pyrido[1,2-a]azepines (Scheme
1.2). While this biosynthetic path is possible it does not explain the configuration of the
pyrido[1,2-a]azepine alkaloids at C-4 and C-1′.
NO H
H
H
O
OMeMe
OO O
H
MeH
-CO2 NO H
H
H
O
OMeMe
O
OH
Me
NO H
H
H
O
OMeMe
O
OH
40
A
B
C
D
ring-expansion
Scheme 1.2 Proposed biosynthetic connections between pyrrolo- and pyrido-azepines.10
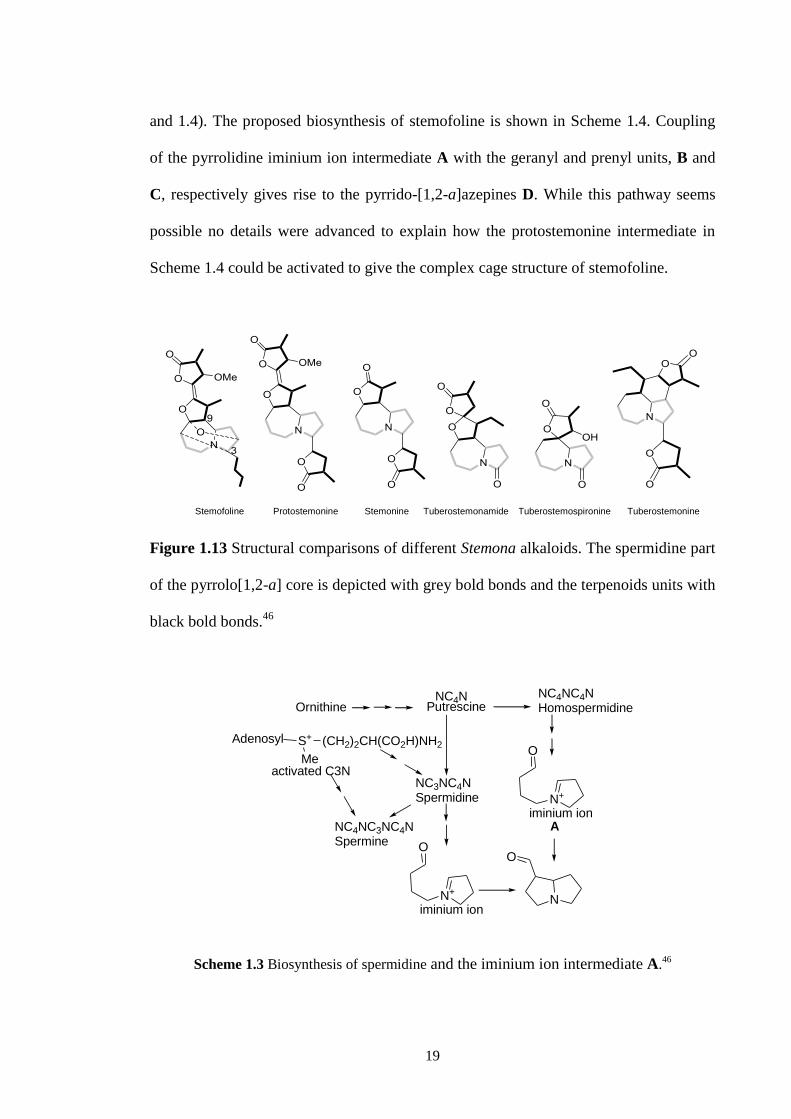
Another possible biosynthetic pathway for the pyrrolo[1,2-a]azepines nucleus
was suggested by Seger (2004)46
and Greger (2006).12
A number of Stemona alkaloids
with a pyrrolo[1,2-a]azepines core were analysed (Figure 1.13). The C- and D-ring
carbons were proposed to be of terpenoid origin while the A-ring of these alkaloids was
suggested to arise from spermidine and the iminium ion intermediate A (Schemes 1.3
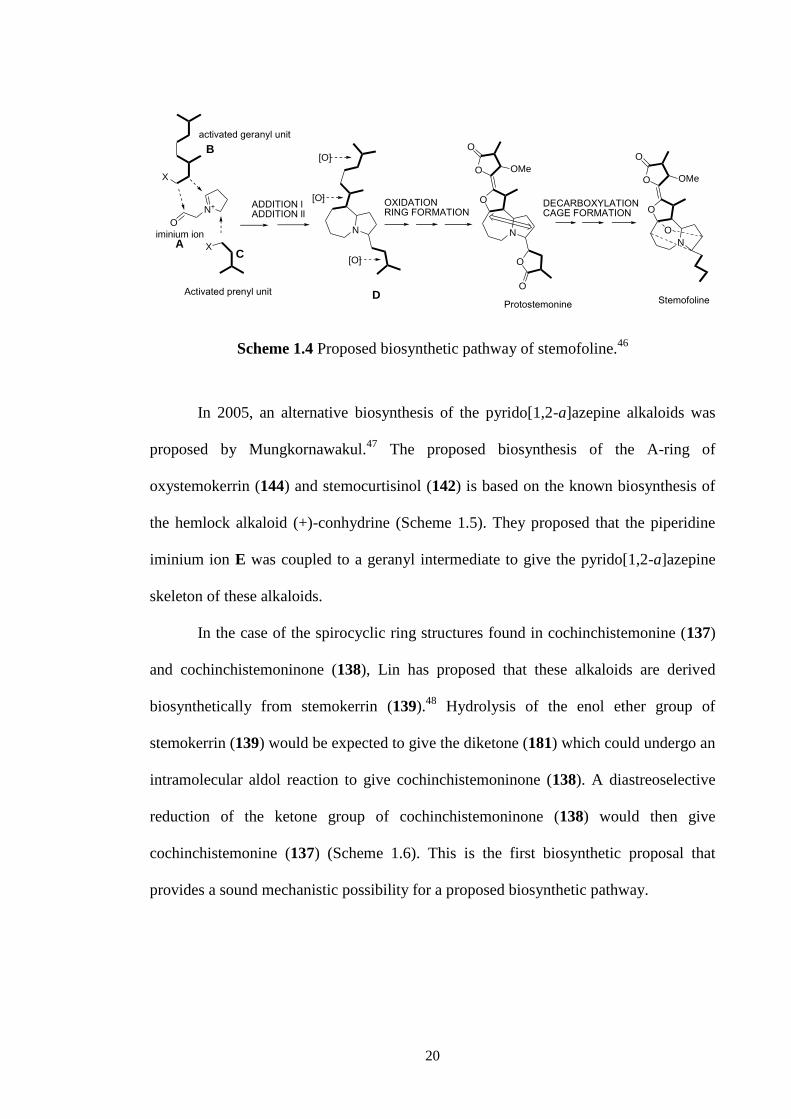
19
and 1.4). The proposed biosynthesis of stemofoline is shown in Scheme 1.4. Coupling
of the pyrrolidine iminium ion intermediate A with the geranyl and prenyl units, B and
C, respectively gives rise to the pyrrido-[1,2-a]azepines D. While this pathway seems
possible no details were advanced to explain how the protostemonine intermediate in
Scheme 1.4 could be activated to give the complex cage structure of stemofoline.
Figure 1.13 Structural comparisons of different Stemona alkaloids. The spermidine part
of the pyrrolo[1,2-a] core is depicted with grey bold bonds and the terpenoids units with
black bold bonds.46
Ornithine PutrescineNC4N NC4NC4N
Homospermidine
Adenosyl S+
Me
(CH2)2CH(CO2H)NH2
activated C3NNC3NC4NSpermidine
NC4NC3NC4N Spermine
N+
iminium ion
N+
iminium ion
N
O
A
O
O
Scheme 1.3 Biosynthesis of spermidine and the iminium ion intermediate A.46
Tuberostemospironine
Stemofoline
Protostemonine
Stemonine
Tuberostemonamide Tuberostemonine
20
X
N+
iminium ion
X
Activated prenyl unit
activated geranyl unit
ADDITION lADDITION ll
N
[O]
[O]
[O]
N
O
O
O
O
O
OMe
OXIDATIONRING FORMATION
N
O
O
O
OMe
O
StemofolineProtostemonine
DECARBOXYLATIONCAGE FORMATION
CA
B
D
O
Scheme 1.4 Proposed biosynthetic pathway of stemofoline.46
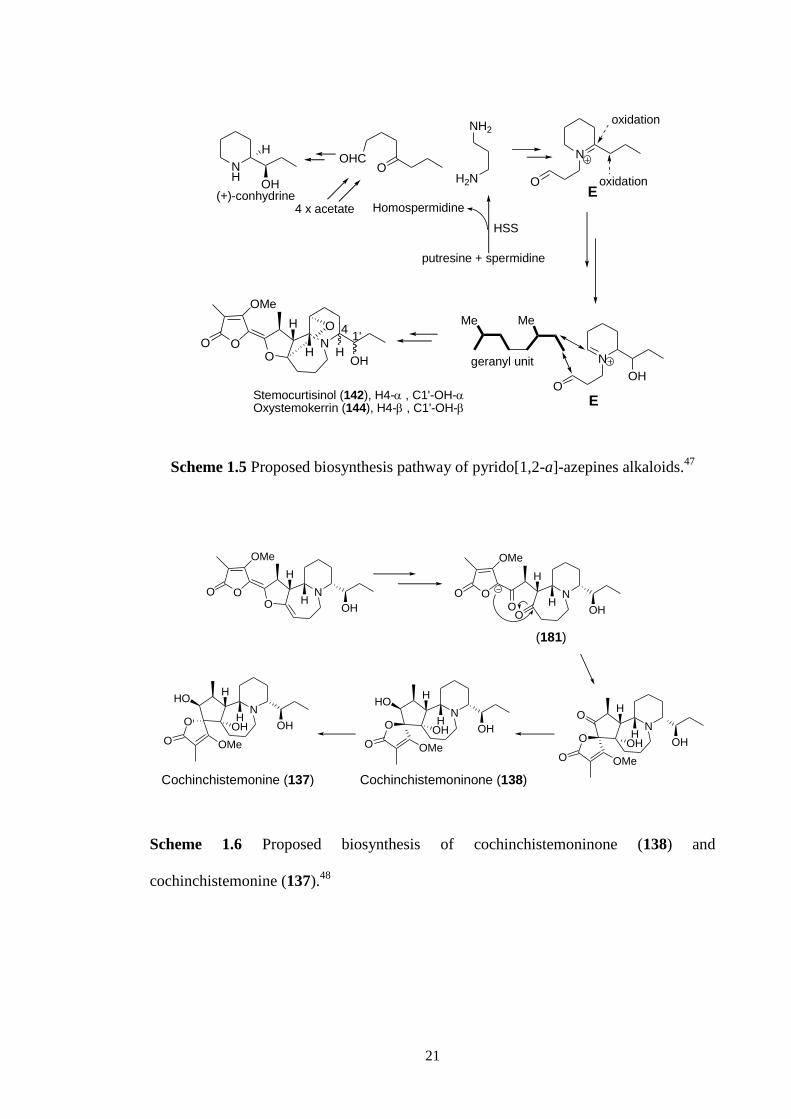
In 2005, an alternative biosynthesis of the pyrido[1,2-a]azepine alkaloids was
proposed by Mungkornawakul.47
The proposed biosynthesis of the A-ring of
oxystemokerrin (144) and stemocurtisinol (142) is based on the known biosynthesis of
the hemlock alkaloid (+)-conhydrine (Scheme 1.5). They proposed that the piperidine
iminium ion E was coupled to a geranyl intermediate to give the pyrido[1,2-a]azepine
skeleton of these alkaloids.
In the case of the spirocyclic ring structures found in cochinchistemonine (137)
and cochinchistemoninone (138), Lin has proposed that these alkaloids are derived
biosynthetically from stemokerrin (139).48
Hydrolysis of the enol ether group of
stemokerrin (139) would be expected to give the diketone (181) which could undergo an
intramolecular aldol reaction to give cochinchistemoninone (138). A diastreoselective
reduction of the ketone group of cochinchistemoninone (138) would then give
cochinchistemonine (137) (Scheme 1.6). This is the first biosynthetic proposal that
provides a sound mechanistic possibility for a proposed biosynthetic pathway.
21
NH
H
OH
OHCO
NH2
H2N
N
O
putresine + spermidine
N
O
oxidation
oxidation
MeMe
geranyl unit
OH
HSS
Homospermidine(+)-conhydrine
4 x acetate
NO
OO
OMe
H
HOH
O
H
41'
E
E
Stemocurtisinol (142), H4- , C1'-OH- Oxystemokerrin (144), H4- , C1'-OH-
Scheme 1.5 Proposed biosynthesis pathway of pyrido[1,2-a]-azepines alkaloids.47
NO
OO
OMe
H
HOH
N
H
HOHO
O OMe
HO
OH
N
H
HOHO
O OMe
HO
OH
Cochinchistemonine (137) Cochinchistemoninone (138)
(181)
N
O
OO
OMe
H
HOHO
N
H
HOHO
O OMe
O
OH
Scheme 1.6 Proposed biosynthesis of cochinchistemoninone (138) and
cochinchistemonine (137).48
22
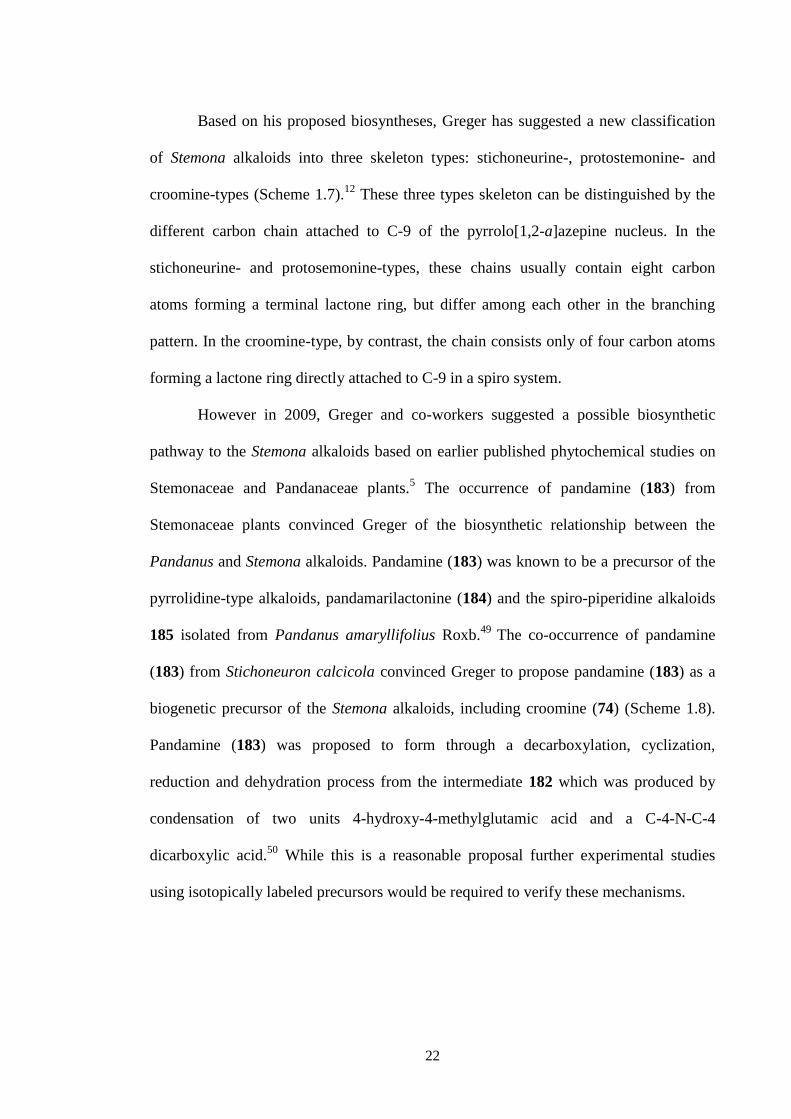
Based on his proposed biosyntheses, Greger has suggested a new classification
of Stemona alkaloids into three skeleton types: stichoneurine-, protostemonine- and
croomine-types (Scheme 1.7).12
These three types skeleton can be distinguished by the
different carbon chain attached to C-9 of the pyrrolo[1,2-a]azepine nucleus. In the
stichoneurine- and protosemonine-types, these chains usually contain eight carbon
atoms forming a terminal lactone ring, but differ among each other in the branching
pattern. In the croomine-type, by contrast, the chain consists only of four carbon atoms
forming a lactone ring directly attached to C-9 in a spiro system.
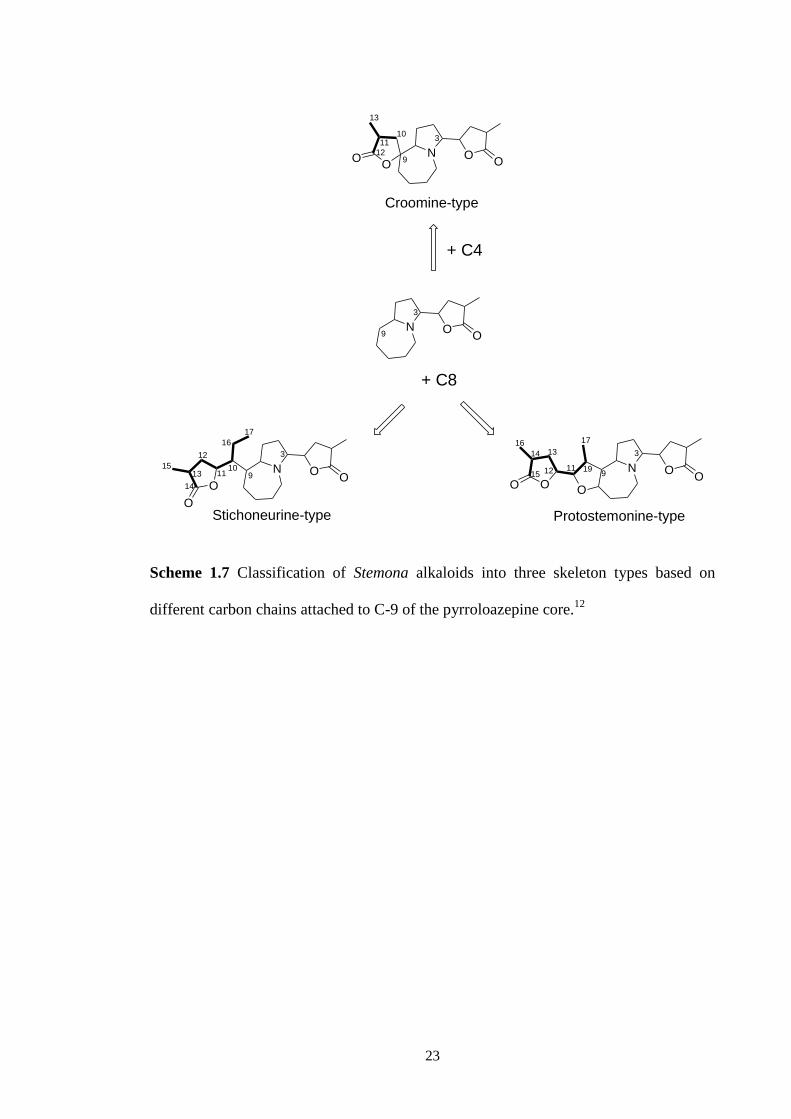
However in 2009, Greger and co-workers suggested a possible biosynthetic
pathway to the Stemona alkaloids based on earlier published phytochemical studies on
Stemonaceae and Pandanaceae plants.5 The occurrence of pandamine (183) from
Stemonaceae plants convinced Greger of the biosynthetic relationship between the
Pandanus and Stemona alkaloids. Pandamine (183) was known to be a precursor of the
pyrrolidine-type alkaloids, pandamarilactonine (184) and the spiro-piperidine alkaloids
185 isolated from Pandanus amaryllifolius Roxb.49
The co-occurrence of pandamine
(183) from Stichoneuron calcicola convinced Greger to propose pandamine (183) as a
biogenetic precursor of the Stemona alkaloids, including croomine (74) (Scheme 1.8).
Pandamine (183) was proposed to form through a decarboxylation, cyclization,
reduction and dehydration process from the intermediate 182 which was produced by
condensation of two units 4-hydroxy-4-methylglutamic acid and a C-4-N-C-4
dicarboxylic acid.50
While this is a reasonable proposal further experimental studies
using isotopically labeled precursors would be required to verify these mechanisms.
23
N OO
3
9
N OO
3
9O
O
Croomine-type
N OO
OOO
Protostemonine-type
N OO
3
9
O
O
+ C8
Stichoneurine-type
13
12
1110
14
13
12
11
17
16
1015
313
12 11
17
199
14
16
15
+ C4
Scheme 1.7 Classification of Stemona alkaloids into three skeleton types based on
different carbon chains attached to C-9 of the pyrroloazepine core.12
24
Scheme 1.8 Hypothetical biosynthetic pathway of pandanamide and its possible
cyclization products 74, 184 and 185.5
25
1.6 Aims of this project
Despite Stemona plants and their component alkaloids having a wide range of
biological activities that are useful, with potential applications in medicine and
agriculture, only a few investigations have been carried out to determine the structures
of the active compounds. Unfortunately, the limited supply of many of these alkaloids
has prevented further biological investigations and developments. It is important that
this family be studied further and their active principles be identified. The isolation of
compounds from Stichoneuron and Stemona sp. were the particular interest for this
study as well as the AChE inhibition activities of these alkaloids which may allow us to
discover new derivatives that can be used as a treatment for Alzheimer’s disease. The
study of Stichoneuron sp was particular importance to establish if Stemona-alkaloids
were also present in these plants. Such a study would also provide taxonomic support
for this species being classified under the Stemonaceae family. In collaboration with the
Department of Biochemistry, Faculty of Medicine, Chiang Mai University, we also
planned to test some of the isolated Stemona alkaloids as P-glycoprotein (P-gp)
inhibitors. With collaborators in Thailand (Dr. Sumalee Kamchonwongpaisan from the
National Center for Genetic Engineering and Biotechnology, Thailand), we also planned
to test the Stemona alkaloids for their antimalarial activities against wildtype and
multidrug resistant P. falciparum strains and for their cytotoxicity activities against
VERO cells (kidney epithelial cells from an African green monkey) and KB cells
(human mouth epidermal carcinoma cells).
26
The aims of this project are:
1. To collect S. curtisii and Stichoneuron plants from peninsular Malaysia,
document their locations and have them identified by a botanist.
2. Make ethanol or methanol extracts of the roots and leaves of these plants and
then to isolate the chemical components, especially the Stemona alkaloids, from
St. halabalensis, St. caudatum, S. curtisii and S. javanica. It should be noted in
previous studies the majority of the Stemona alkaloids are found in the roots
rather than the leaves.
3. To determine the structures of the isolated chemical components from these
plants.
4. To determine the AChE inhibitory activity of the isolated chemical components.
5. To determine the P-gp inhibitory activity in the modulation of drug resistance of
the isolated chemical components in cancer cell lines.
6. To determine the antimalarial activity of these alkaloids against wild type and
multidrug resistant P. falciparum strains and cytotoxicity activities against Vero
and KB cells.
27
CHAPTER 2
FIELD WORK
2.1 The Stemona genus
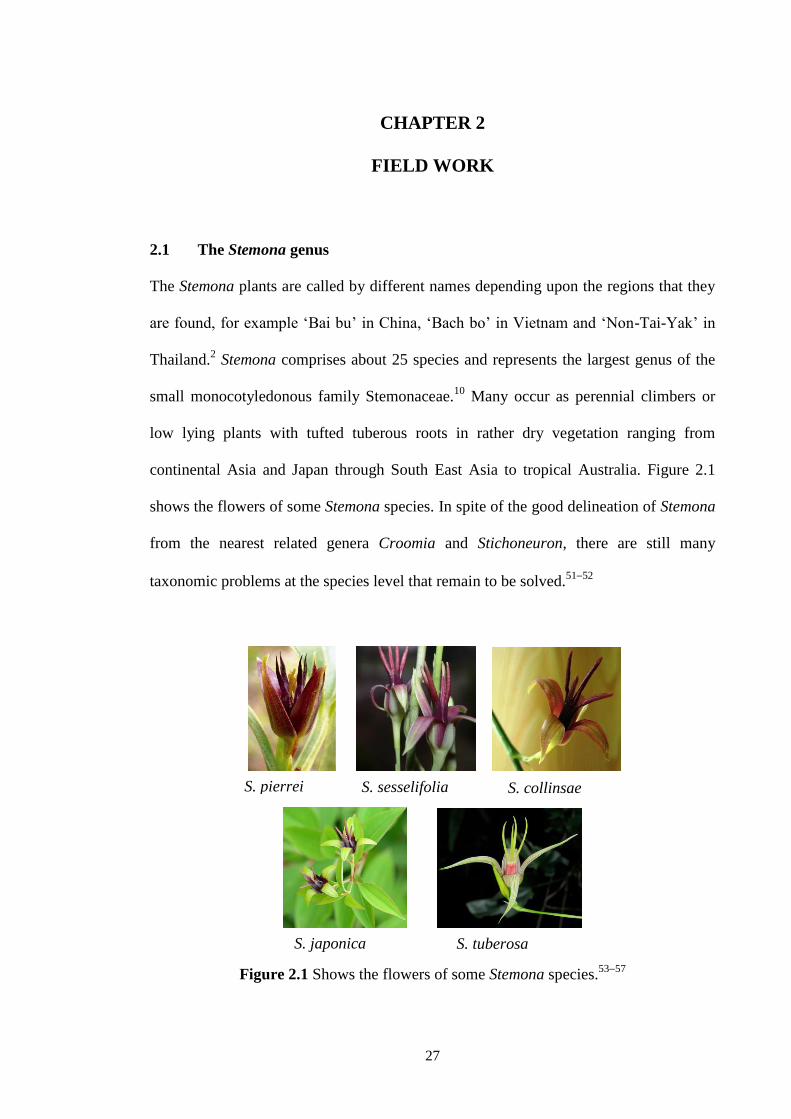
The Stemona plants are called by different names depending upon the regions that they
are found, for example ‘Bai bu’ in China, ‘Bach bo’ in Vietnam and ‘Non-Tai-Yak’ in
Thailand.2 Stemona comprises about 25 species and represents the largest genus of the
small monocotyledonous family Stemonaceae.10
Many occur as perennial climbers or
low lying plants with tufted tuberous roots in rather dry vegetation ranging from
continental Asia and Japan through South East Asia to tropical Australia. Figure 2.1
shows the flowers of some Stemona species. In spite of the good delineation of Stemona
from the nearest related genera Croomia and Stichoneuron, there are still many
taxonomic problems at the species level that remain to be solved.5152
Figure 2.1 Shows the flowers of some Stemona species.5357
S. japonica
S. sesselifolia
S. tuberosa
S. pierrei S. collinsae
28
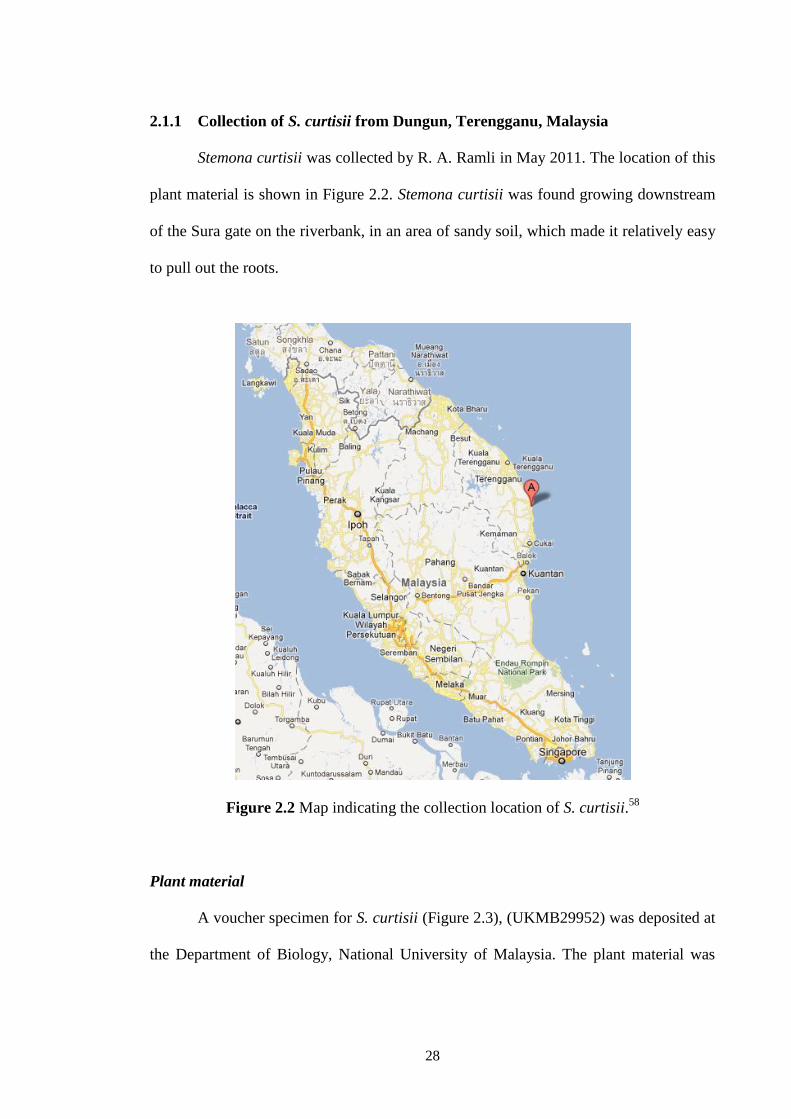
2.1.1 Collection of S. curtisii from Dungun, Terengganu, Malaysia
Stemona curtisii was collected by R. A. Ramli in May 2011. The location of this
plant material is shown in Figure 2.2. Stemona curtisii was found growing downstream
of the Sura gate on the riverbank, in an area of sandy soil, which made it relatively easy
to pull out the roots.
Figure 2.2 Map indicating the collection location of S. curtisii.58
Plant material
A voucher specimen for S. curtisii (Figure 2.3), (UKMB29952) was deposited at
the Department of Biology, National University of Malaysia. The plant material was
29
identified by Mr. Sani from the same department. Figure 2.4 shows the drawings of S.
curtisii by Murugan.59
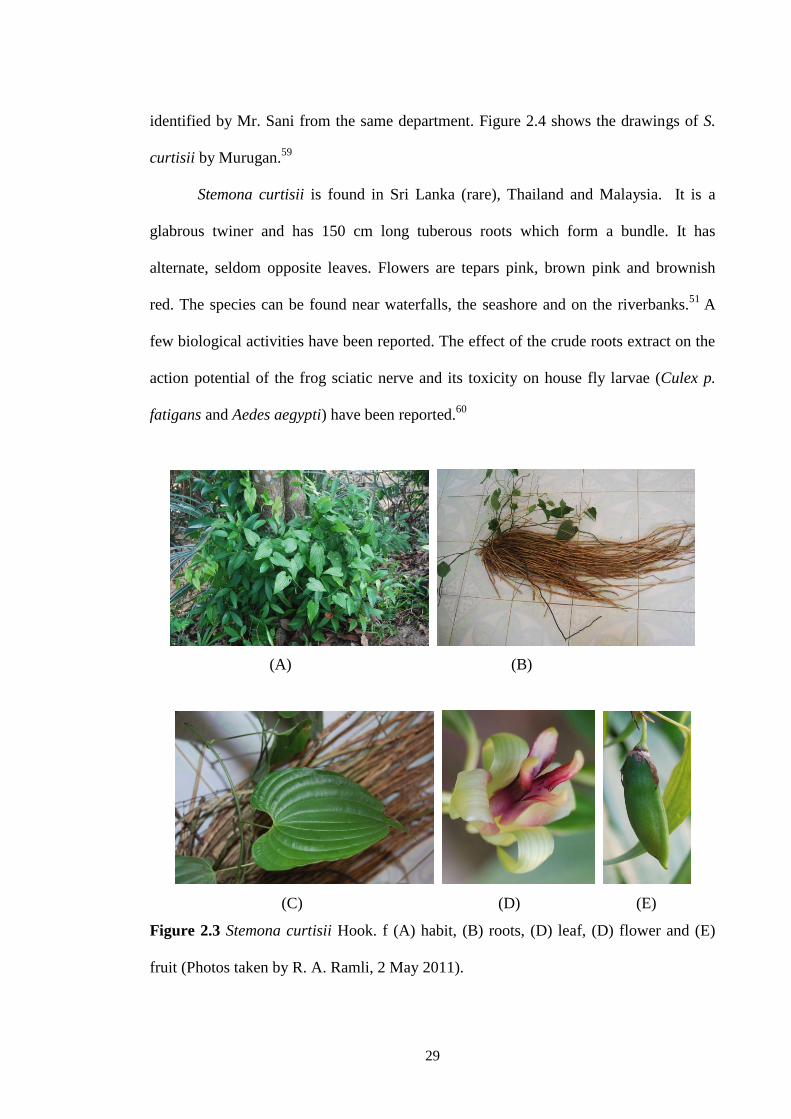
Stemona curtisii is found in Sri Lanka (rare), Thailand and Malaysia. It is a
glabrous twiner and has 150 cm long tuberous roots which form a bundle. It has
alternate, seldom opposite leaves. Flowers are tepars pink, brown pink and brownish
red. The species can be found near waterfalls, the seashore and on the riverbanks.51
A
few biological activities have been reported. The effect of the crude roots extract on the
action potential of the frog sciatic nerve and its toxicity on house fly larvae (Culex p.
fatigans and Aedes aegypti) have been reported.60
(A) (B)
(C) (D) (E)
Figure 2.3 Stemona curtisii Hook. f (A) habit, (B) roots, (D) leaf, (D) flower and (E)
fruit (Photos taken by R. A. Ramli, 2 May 2011).
30
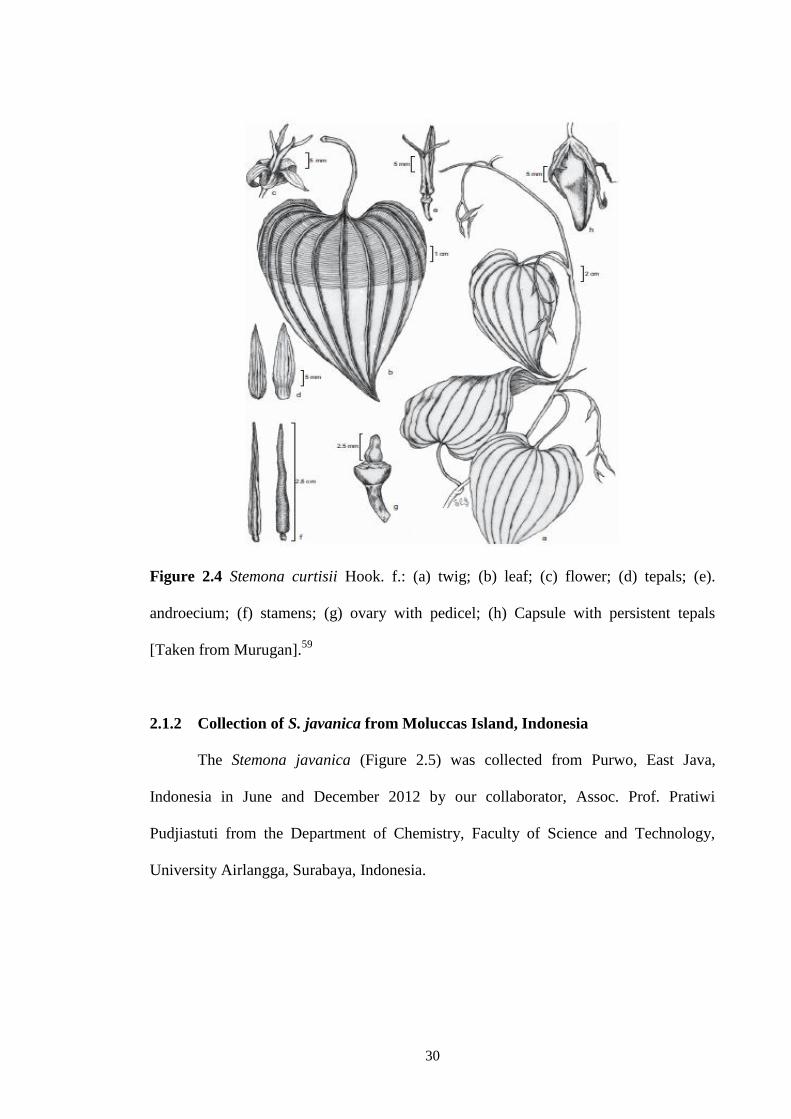
Figure 2.4 Stemona curtisii Hook. f.: (a) twig; (b) leaf; (c) flower; (d) tepals; (e).
androecium; (f) stamens; (g) ovary with pedicel; (h) Capsule with persistent tepals
[Taken from Murugan].59
2.1.2 Collection of S. javanica from Moluccas Island, Indonesia
The Stemona javanica (Figure 2.5) was collected from Purwo, East Java,
Indonesia in June and December 2012 by our collaborator, Assoc. Prof. Pratiwi
Pudjiastuti from the Department of Chemistry, Faculty of Science and Technology,
University Airlangga, Surabaya, Indonesia.
31
Plant material
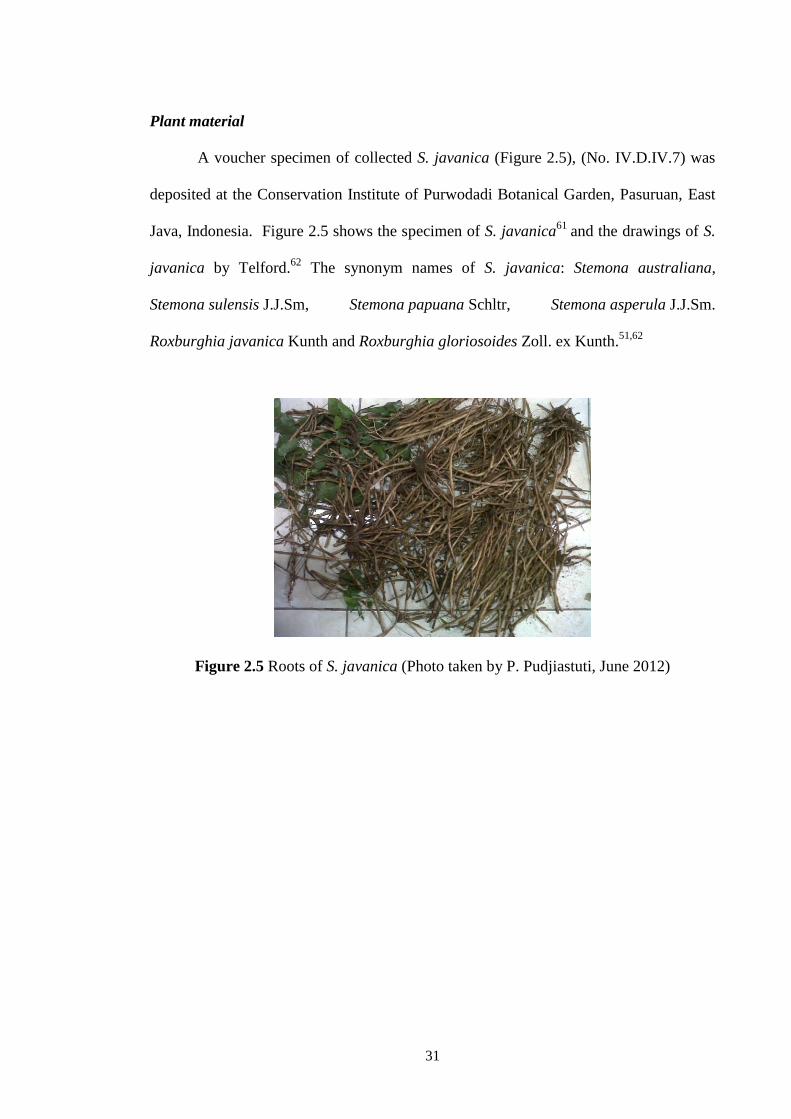
A voucher specimen of collected S. javanica (Figure 2.5), (No. IV.D.IV.7) was
deposited at the Conservation Institute of Purwodadi Botanical Garden, Pasuruan, East
Java, Indonesia. Figure 2.5 shows the specimen of S. javanica61
and the drawings of S.
javanica by Telford.62
The synonym names of S. javanica: Stemona australiana,
Stemona sulensis J.J.Sm, Stemona papuana Schltr, Stemona asperula J.J.Sm.
Roxburghia javanica Kunth and Roxburghia gloriosoides Zoll. ex Kunth.51,62
Figure 2.5 Roots of S. javanica (Photo taken by P. Pudjiastuti, June 2012)
32
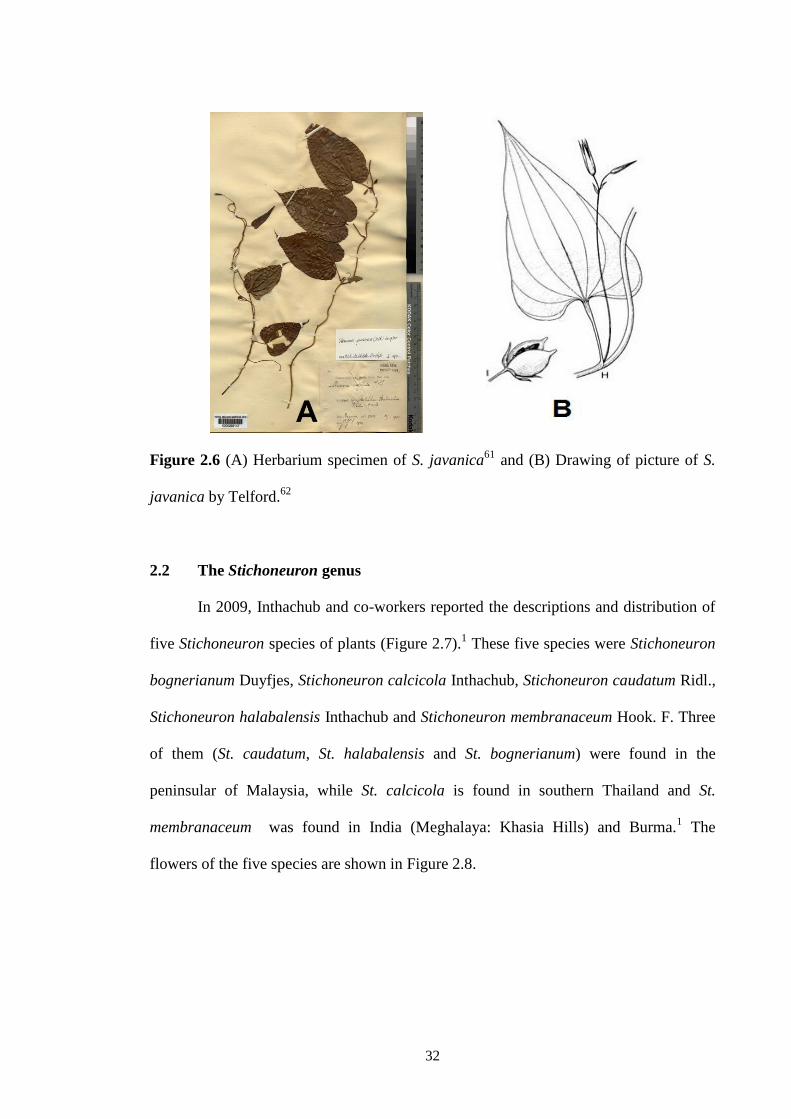
Figure 2.6 (A) Herbarium specimen of S. javanica61
and (B) Drawing of picture of S.
javanica by Telford.62
2.2 The Stichoneuron genus
In 2009, Inthachub and co-workers reported the descriptions and distribution of
five Stichoneuron species of plants (Figure 2.7).1 These five species were Stichoneuron
bognerianum Duyfjes, Stichoneuron calcicola Inthachub, Stichoneuron caudatum Ridl.,
Stichoneuron halabalensis Inthachub and Stichoneuron membranaceum Hook. F. Three
of them (St. caudatum, St. halabalensis and St. bognerianum) were found in the
peninsular of Malaysia, while St. calcicola is found in southern Thailand and St.
membranaceum was found in India (Meghalaya: Khasia Hills) and Burma.1 The
flowers of the five species are shown in Figure 2.8.
33
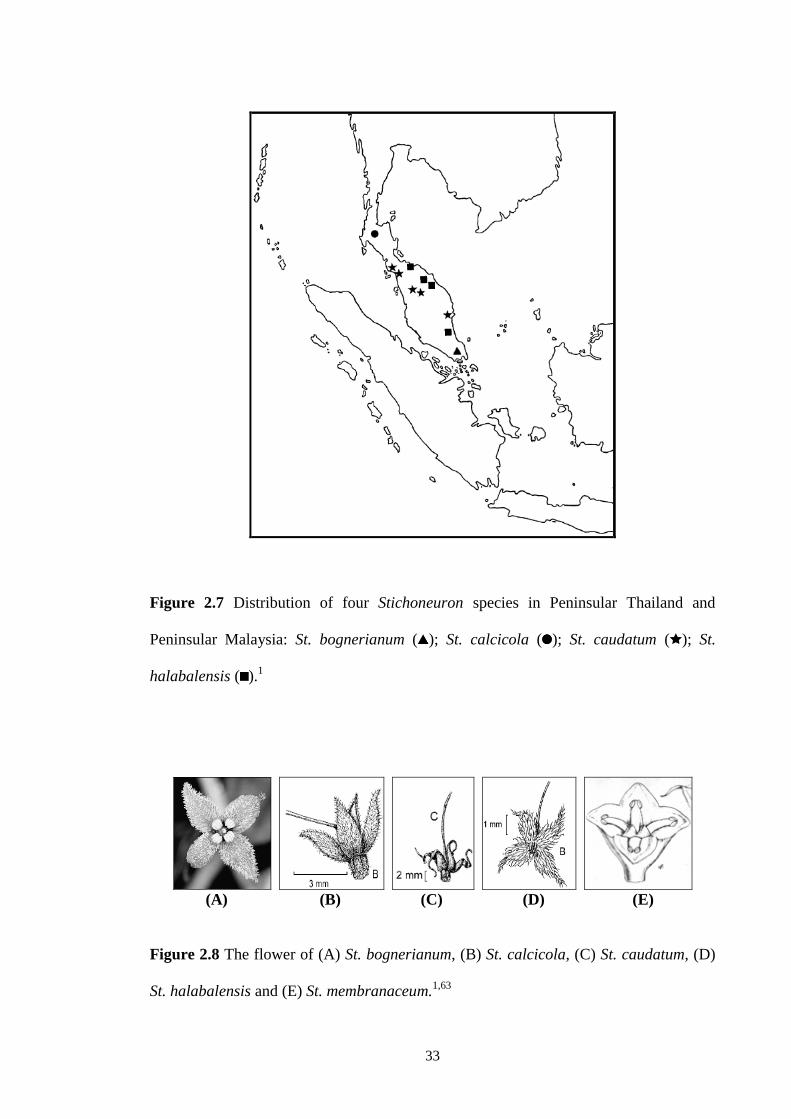
Figure 2.7 Distribution of four Stichoneuron species in Peninsular Thailand and
Peninsular Malaysia: St. bognerianum ( ); St. calcicola ( ); St. caudatum ( ); St.
halabalensis ( ).1
(A) (B) (C) (D) (E)
Figure 2.8 The flower of (A) St. bognerianum, (B) St. calcicola, (C) St. caudatum, (D)
St. halabalensis and (E) St. membranaceum.1,63
34
Only two species of Stichoneuron have been studied for their phytochemicals;
these are St. caudatum and St. calcicola.4,5
Due to the limited research on this plant
species, it is important to carry out more research on this genus which we believed may
contain new alkaloid structures with novel biological activities.
2.2.1 Collection of St. halabalensis from Endau-Rompin National Park, Pahang,
Malaysia
The field trip by R. A. Ramli to collect St. halabalensis was carried out in April
2010. The location is shown in Figure 2.9. This plant grows near to the Sungai Anak
Endau riverbank. The area of sample collection in Endau-Rompin State is shown in
Figure 2.10. In contrast, the soil of the collected area is clay and it was difficult to pull.
St. halabalensis is an erect herb 30-60 cm tall, with few branches; stem petiole
and leaves sparsely hairy. Leaves: petiole (5-7) mm long, inconspicuously sheathing at
the base, blade narrowly ovate-oblong or elliptic-oblong, glabrous, except veins on
lower surface sparsely hairy. St. halabalensis can be found in the rain forest along
streams (30-160 m). According to Inthachub, the distribution of St. halabalensis is in
Peninsular Thailand (Narathiwat), and Peninsular Malaysia (Terengganu, Pahang).1

35
Figure 2.9 Location where St. halabalensis was collected in Peninsular of Malaysia.64

36
Figure 2.10 The area of sample collection in Endau-Rompin State Park (photographs
taken by R. A. Ramli, 24 April 2010)
Plant material
A voucher specimen of St. halabalensis (Figure 2.11), UKM29953 was
deposited at the Department of Biology, National University of Malaysia. The plant
material was identified by Prof. Latiff Mohammad from the Department of Biology,
National University of Malaysia. Figure 2.12 shows the drawings of St. halabalensis by
Inthachub.1
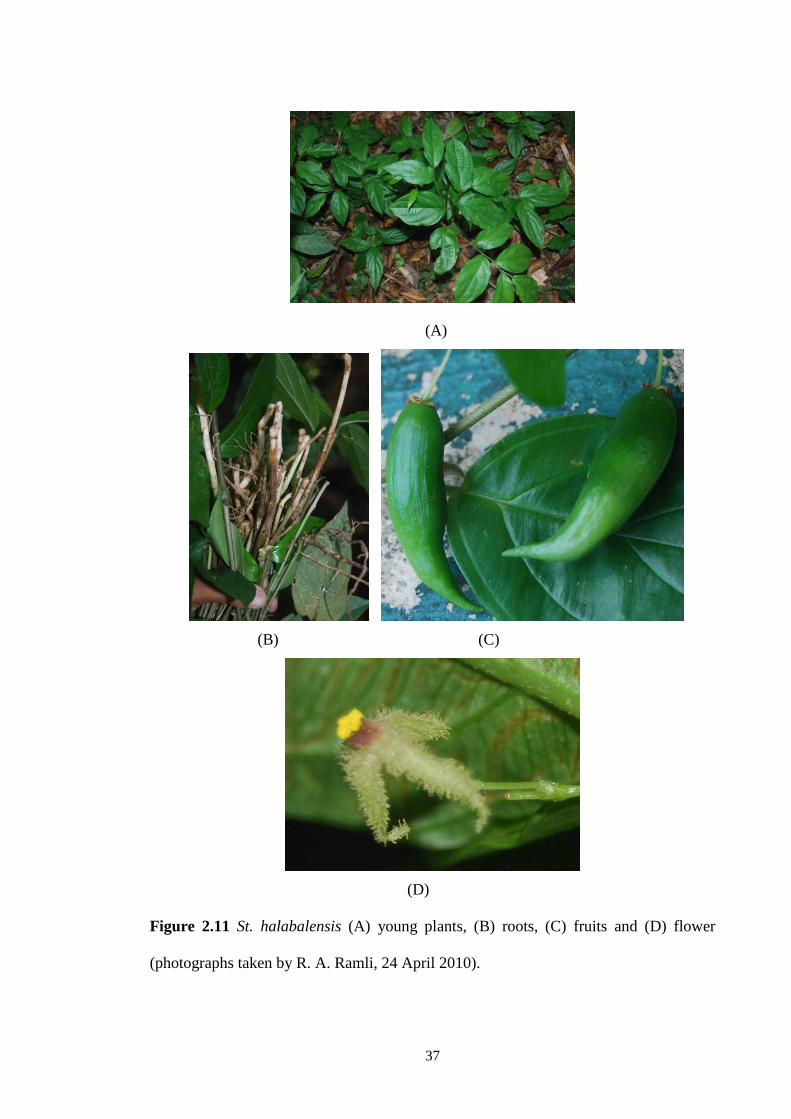
37
(A)
(B) (C)
(D)
Figure 2.11 St. halabalensis (A) young plants, (B) roots, (C) fruits and (D) flower
(photographs taken by R. A. Ramli, 24 April 2010).
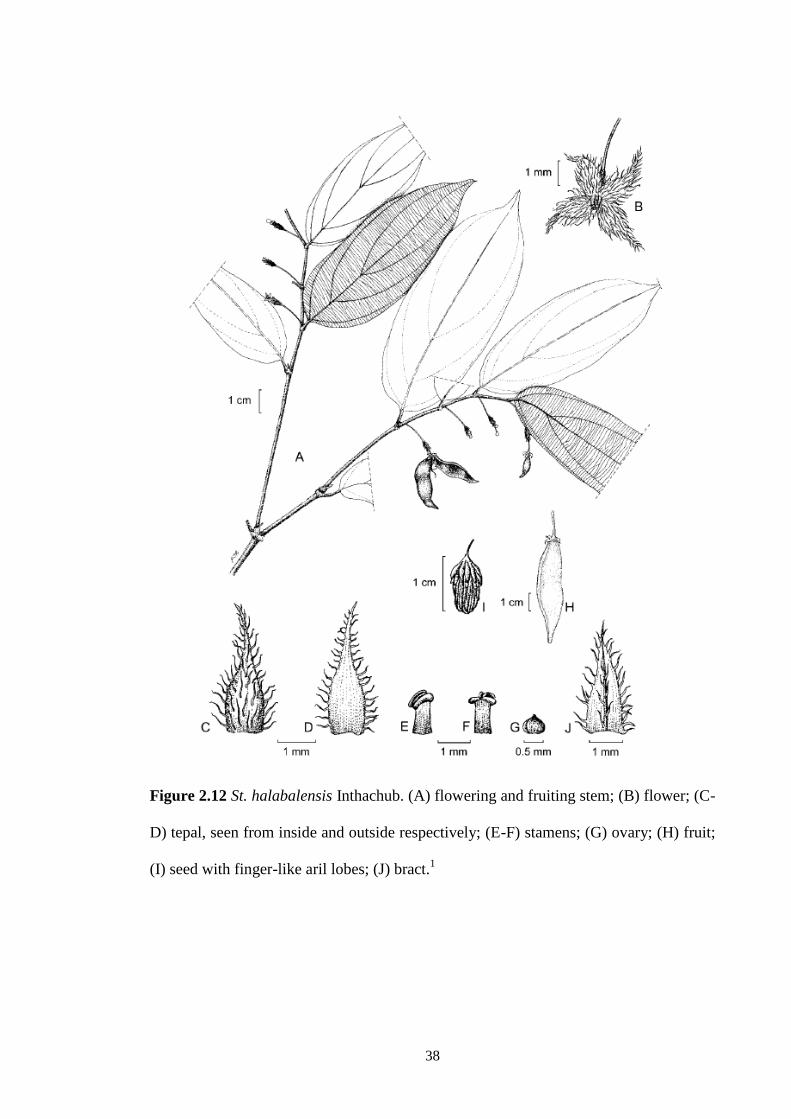
38
Figure 2.12 St. halabalensis Inthachub. (A) flowering and fruiting stem; (B) flower; (C-
D) tepal, seen from inside and outside respectively; (E-F) stamens; (G) ovary; (H) fruit;
(I) seed with finger-like aril lobes; (J) bract.1
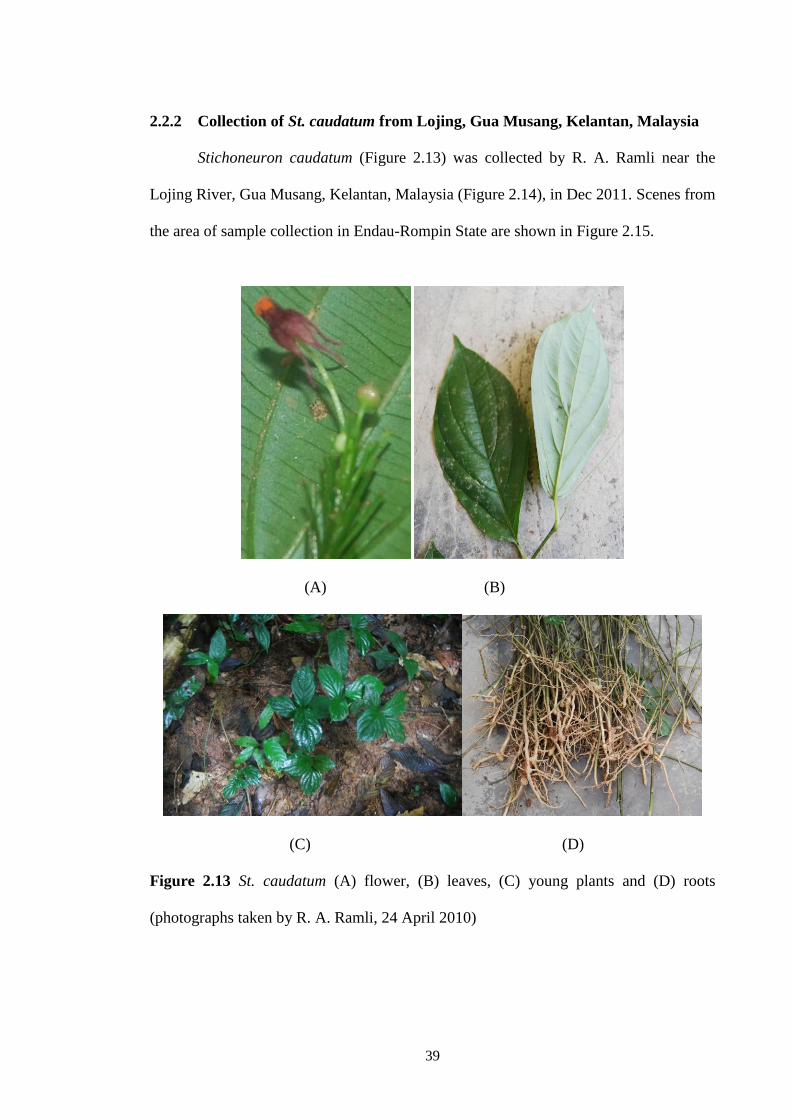
39
2.2.2 Collection of St. caudatum from Lojing, Gua Musang, Kelantan, Malaysia
Stichoneuron caudatum (Figure 2.13) was collected by R. A. Ramli near the
Lojing River, Gua Musang, Kelantan, Malaysia (Figure 2.14), in Dec 2011. Scenes from
the area of sample collection in Endau-Rompin State are shown in Figure 2.15.
(A) (B)
(C) (D)
Figure 2.13 St. caudatum (A) flower, (B) leaves, (C) young plants and (D) roots
(photographs taken by R. A. Ramli, 24 April 2010)
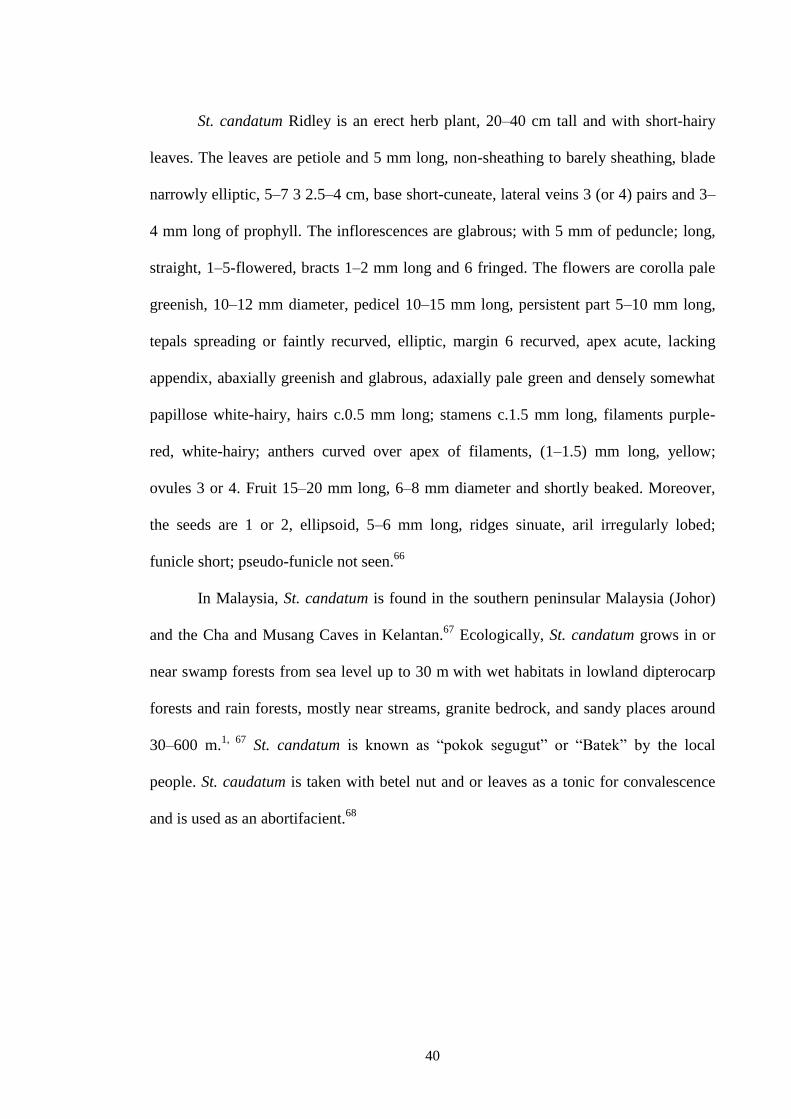
40
St. candatum Ridley is an erect herb plant, 20–40 cm tall and with short-hairy
leaves. The leaves are petiole and 5 mm long, non-sheathing to barely sheathing, blade
narrowly elliptic, 5–7 3 2.5–4 cm, base short-cuneate, lateral veins 3 (or 4) pairs and 3–
4 mm long of prophyll. The inflorescences are glabrous; with 5 mm of peduncle; long,
straight, 1–5-flowered, bracts 1–2 mm long and 6 fringed. The flowers are corolla pale
greenish, 10–12 mm diameter, pedicel 10–15 mm long, persistent part 5–10 mm long,
tepals spreading or faintly recurved, elliptic, margin 6 recurved, apex acute, lacking
appendix, abaxially greenish and glabrous, adaxially pale green and densely somewhat
papillose white-hairy, hairs c.0.5 mm long; stamens c.1.5 mm long, filaments purple-
red, white-hairy; anthers curved over apex of filaments, (1–1.5) mm long, yellow;
ovules 3 or 4. Fruit 15–20 mm long, 6–8 mm diameter and shortly beaked. Moreover,
the seeds are 1 or 2, ellipsoid, 5–6 mm long, ridges sinuate, aril irregularly lobed;
funicle short; pseudo-funicle not seen.66
In Malaysia, St. candatum is found in the southern peninsular Malaysia (Johor)
and the Cha and Musang Caves in Kelantan.67
Ecologically, St. candatum grows in or
near swamp forests from sea level up to 30 m with wet habitats in lowland dipterocarp
forests and rain forests, mostly near streams, granite bedrock, and sandy places around
30–600 m.1, 67
St. candatum is known as “pokok segugut” or “Batek” by the local
people. St. caudatum is taken with betel nut and or leaves as a tonic for convalescence
and is used as an abortifacient.68
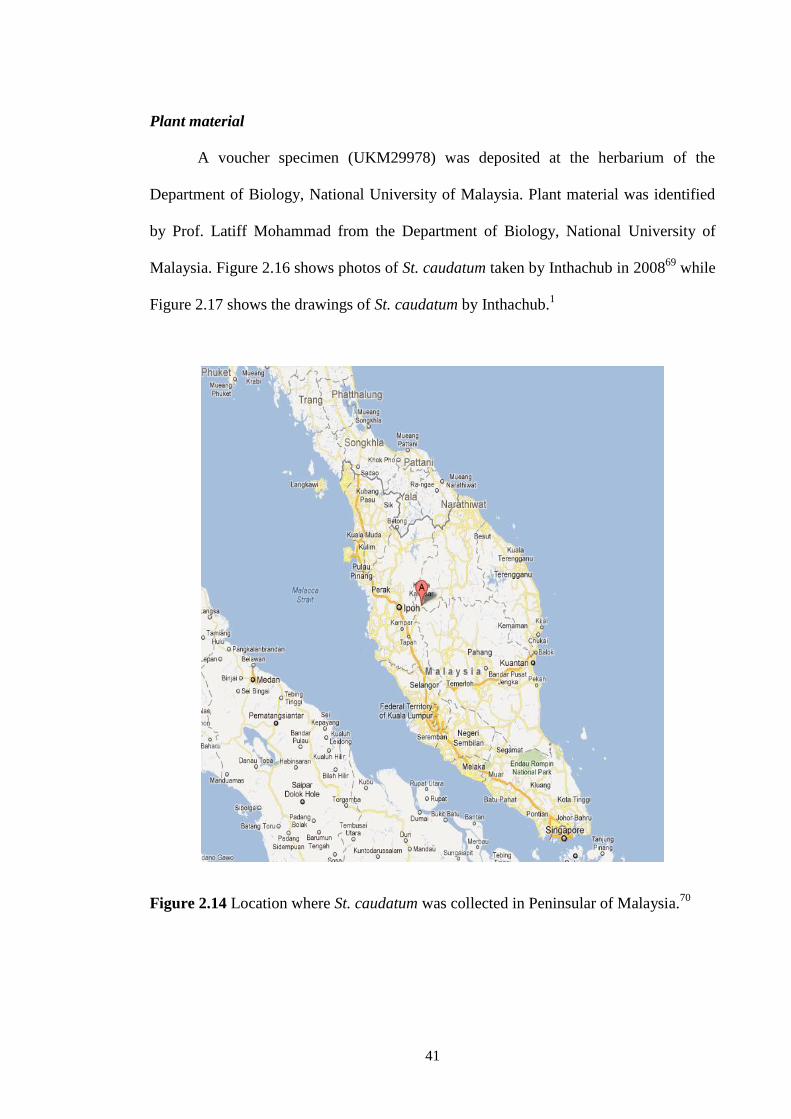
41
Plant material
A voucher specimen (UKM29978) was deposited at the herbarium of the
Department of Biology, National University of Malaysia. Plant material was identified
by Prof. Latiff Mohammad from the Department of Biology, National University of
Malaysia. Figure 2.16 shows photos of St. caudatum taken by Inthachub in 200869
while
Figure 2.17 shows the drawings of St. caudatum by Inthachub.1
Figure 2.14 Location where St. caudatum was collected in Peninsular of Malaysia.70
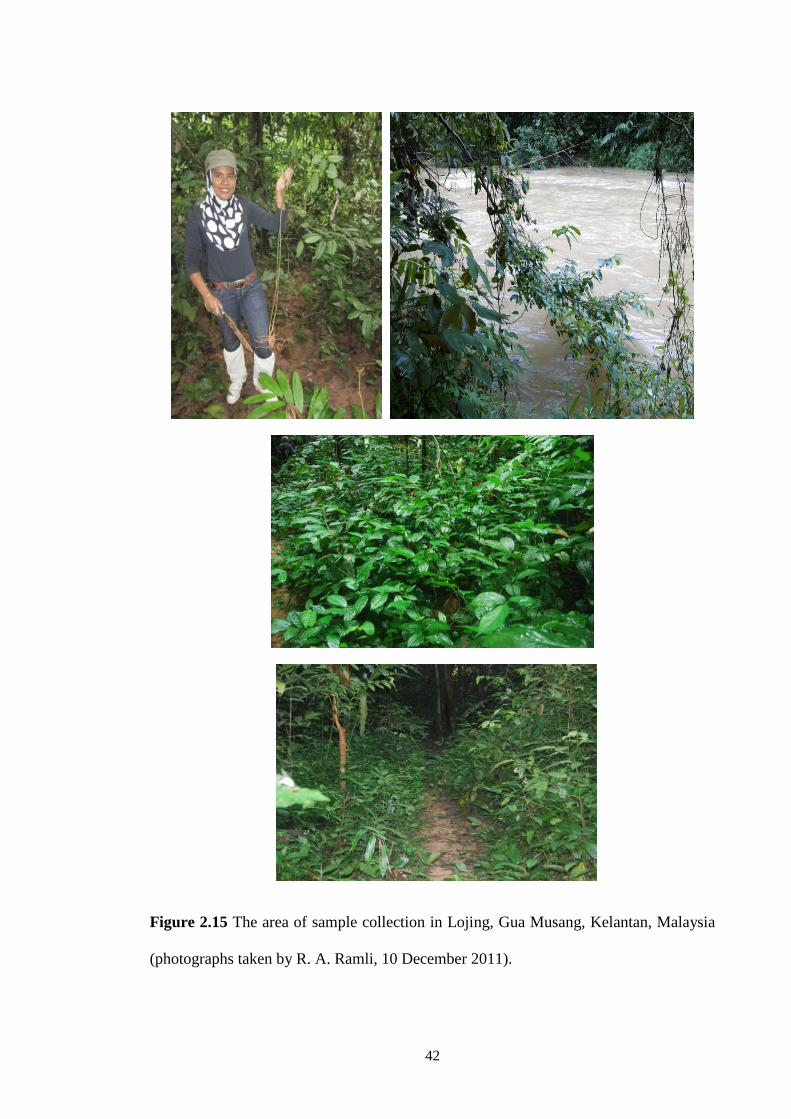
42
Figure 2.15 The area of sample collection in Lojing, Gua Musang, Kelantan, Malaysia
(photographs taken by R. A. Ramli, 10 December 2011).
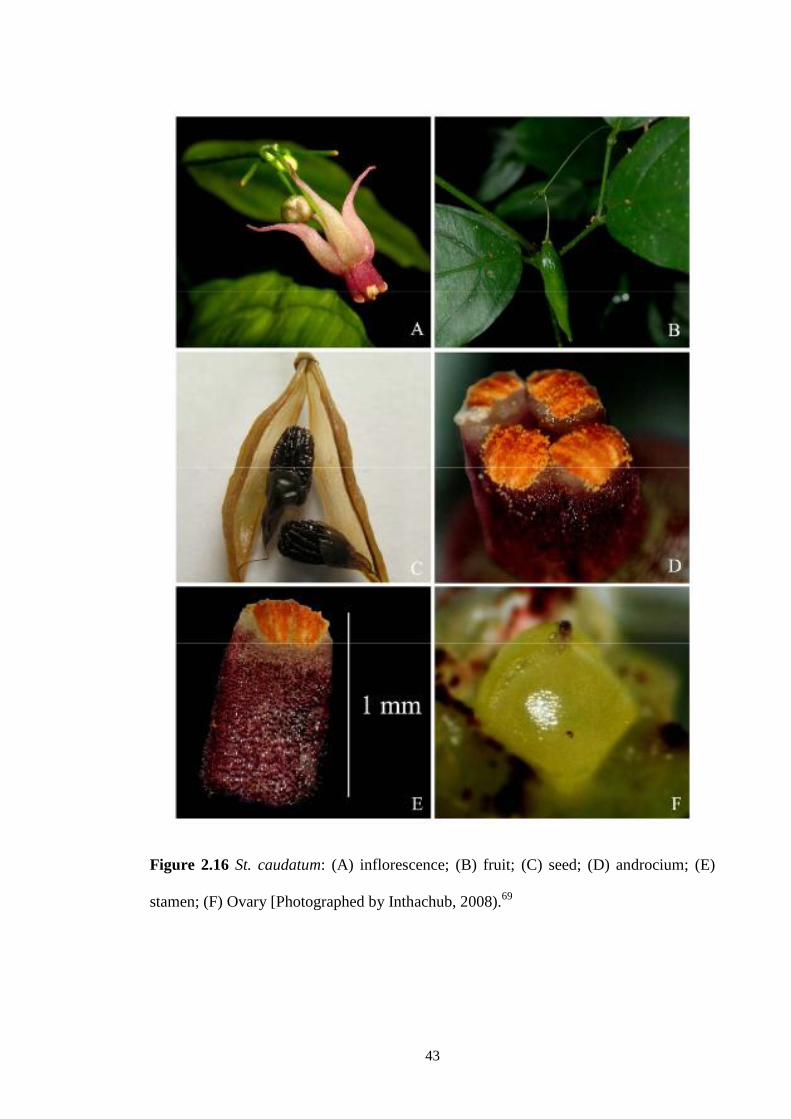
43
Figure 2.16 St. caudatum: (A) inflorescence; (B) fruit; (C) seed; (D) androcium; (E)
stamen; (F) Ovary [Photographed by Inthachub, 2008).69
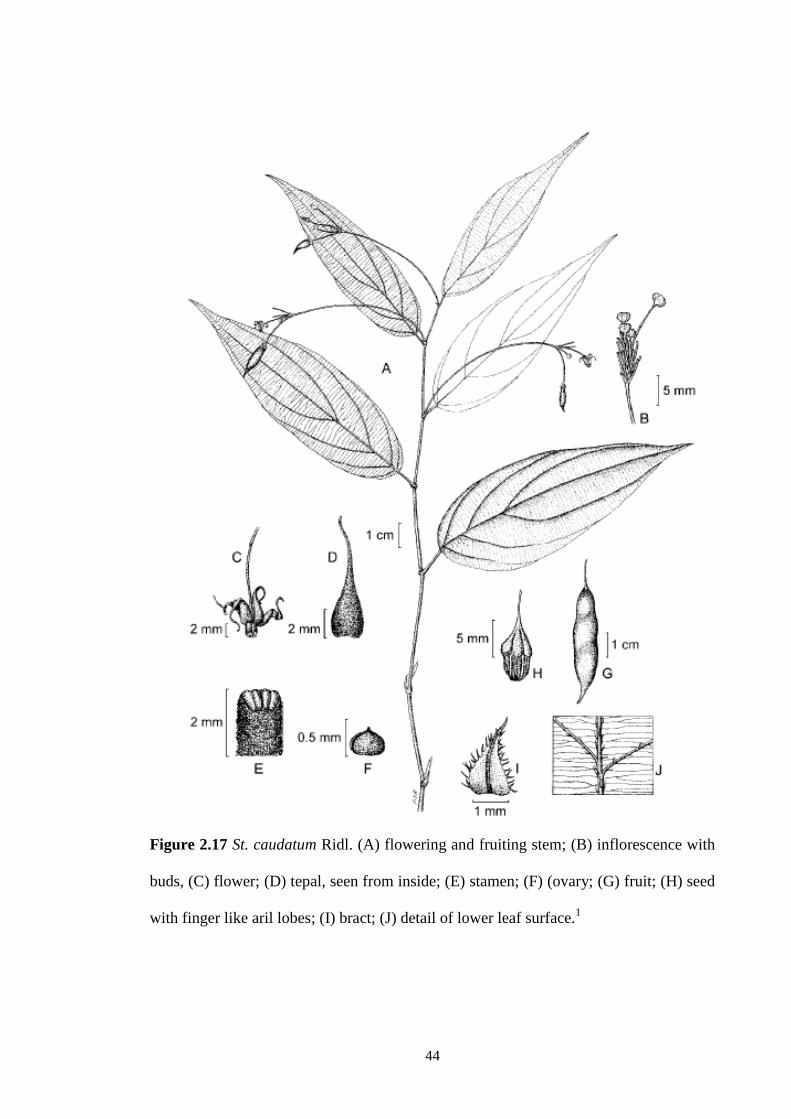
44
Figure 2.17 St. caudatum Ridl. (A) flowering and fruiting stem; (B) inflorescence with
buds, (C) flower; (D) tepal, seen from inside; (E) stamen; (F) (ovary; (G) fruit; (H) seed
with finger like aril lobes; (I) bract; (J) detail of lower leaf surface.1
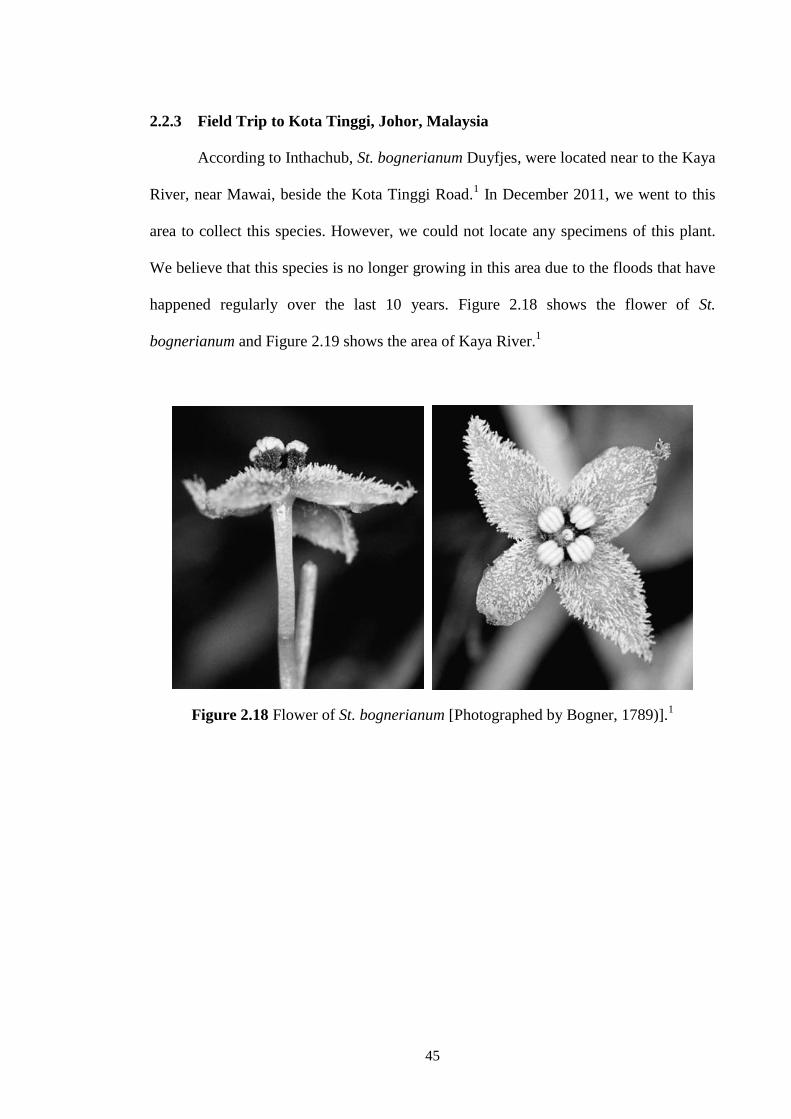
45
2.2.3 Field Trip to Kota Tinggi, Johor, Malaysia
According to Inthachub, St. bognerianum Duyfjes, were located near to the Kaya
River, near Mawai, beside the Kota Tinggi Road.1 In December 2011, we went to this
area to collect this species. However, we could not locate any specimens of this plant.
We believe that this species is no longer growing in this area due to the floods that have
happened regularly over the last 10 years. Figure 2.18 shows the flower of St.
bognerianum and Figure 2.19 shows the area of Kaya River.1
Figure 2.18 Flower of St. bognerianum [Photographed by Bogner, 1789)].1
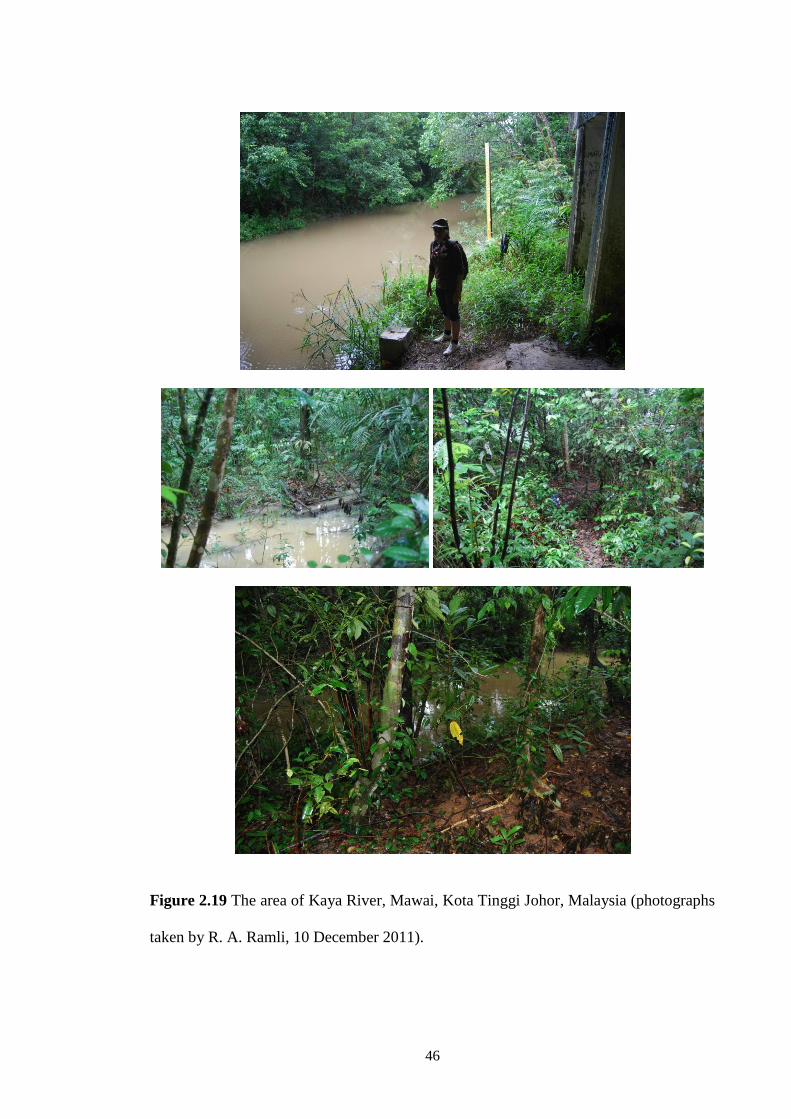
46
Figure 2.19 The area of Kaya River, Mawai, Kota Tinggi Johor, Malaysia (photographs
taken by R. A. Ramli, 10 December 2011).
47
CHAPTER 3
ALKALOIDS FROM THE ROOTS OF Stemona curtisii HOOK F.
This chapter reports on a phytochemical study of the roots extracts of Stemona
curtisii collected from Dungun, Terengganu in Malaysia.
3.1 Previous phytochemical studies on S. curtisii
A few phytochemical studies on S. curtisii have been reported. The earliest study
was made in 2003 by Kaltenegger and co-workers.10
S. curtisii was collected from
South Thailand, Ko Lipe near Ko Adang in 2003. Six Stemona alkaloids were isolated
from the roots, oxystemokerrin (144), dehydroprotostemonine (42), oxyprotostemonine
(43), stemocochinine (46), (2′S)-hydroxystemofoline (114) and stemofoline (111),
which was the major alkaloid.
In 2003, a phytochemical investigation on roots of S. curtisii, collected from
Tumbol Kaunmao, Amphor Rasda, in the North of Trang Province, Thailand by
Mungkornasawakul and co-workers.13
This study led to the isolation of a new
pentacyclic Stemona alkaloid, stemocurtisine (133), with a novel pyrido[1,2-a]azapine
A,B-ring system. A year later, they reported another new Stemona alkaloid,
stemocurtisinol (142), together with oxyprotostemonine (43) from the roots of S.
curtissi from the same location.11
Further investigations on the roots of S.curtisii collected from Trang Province,
Thailand were carried out in 2010. Two new Stemona alkaloids, 1-
hydroxyprotostemonine (41) and stemocurtisine-N-oxide (134) were reported.39
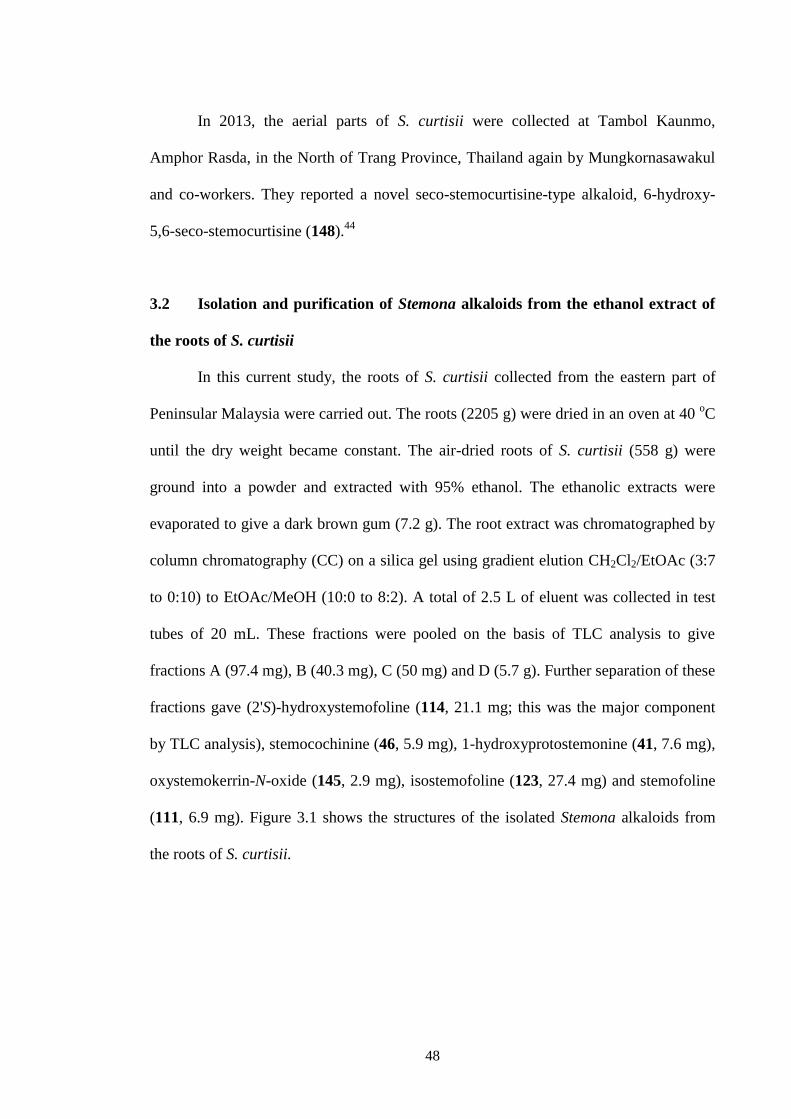
48
In 2013, the aerial parts of S. curtisii were collected at Tambol Kaunmo,
Amphor Rasda, in the North of Trang Province, Thailand again by Mungkornasawakul
and co-workers. They reported a novel seco-stemocurtisine-type alkaloid, 6-hydroxy-
5,6-seco-stemocurtisine (148).44
3.2 Isolation and purification of Stemona alkaloids from the ethanol extract of
the roots of S. curtisii
In this current study, the roots of S. curtisii collected from the eastern part of
Peninsular Malaysia were carried out. The roots (2205 g) were dried in an oven at 40 oC
until the dry weight became constant. The air-dried roots of S. curtisii (558 g) were
ground into a powder and extracted with 95% ethanol. The ethanolic extracts were
evaporated to give a dark brown gum (7.2 g). The root extract was chromatographed by
column chromatography (CC) on a silica gel using gradient elution CH2Cl2/EtOAc (3:7
to 0:10) to EtOAc/MeOH (10:0 to 8:2). A total of 2.5 L of eluent was collected in test
tubes of 20 mL. These fractions were pooled on the basis of TLC analysis to give
fractions A (97.4 mg), B (40.3 mg), C (50 mg) and D (5.7 g). Further separation of these
fractions gave (2'S)-hydroxystemofoline (114, 21.1 mg; this was the major component
by TLC analysis), stemocochinine (46, 5.9 mg), 1-hydroxyprotostemonine (41, 7.6 mg),
oxystemokerrin-N-oxide (145, 2.9 mg), isostemofoline (123, 27.4 mg) and stemofoline
(111, 6.9 mg). Figure 3.1 shows the structures of the isolated Stemona alkaloids from
the roots of S. curtisii.
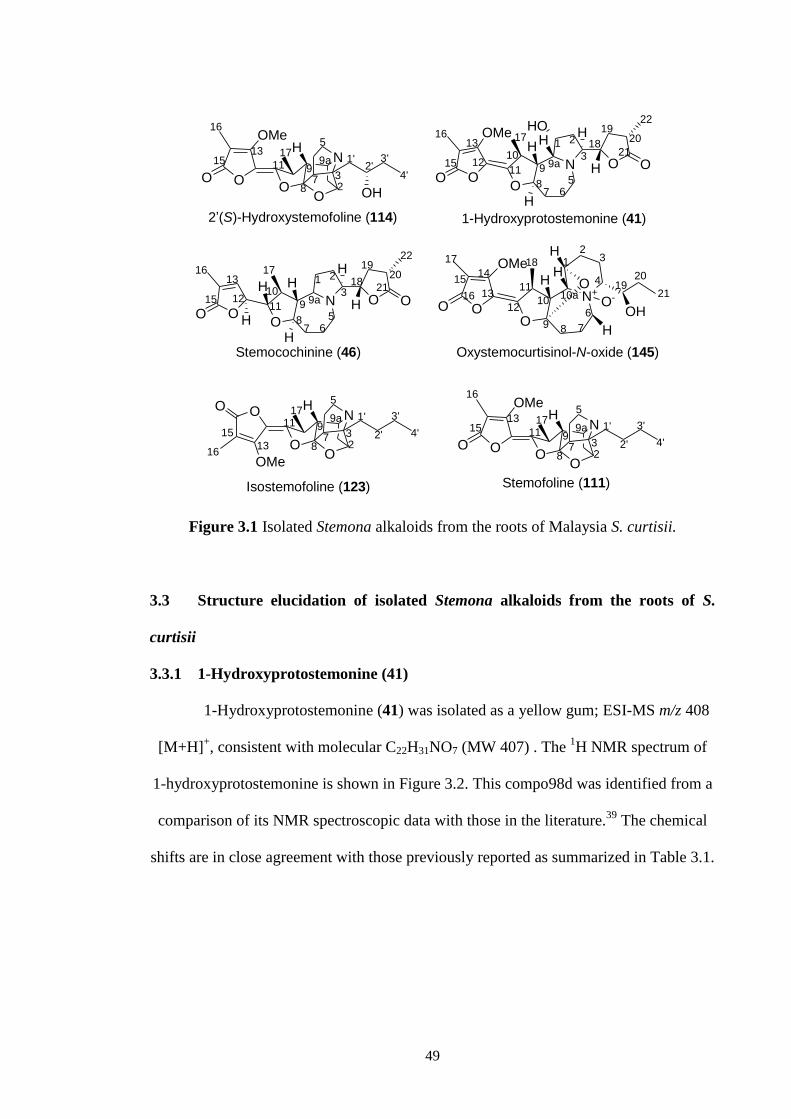
49
1-Hydroxyprotostemonine (41)
Oxystemocurtisinol-N-oxide (145)
2’(S)-Hydroxystemofoline (114)
Isostemofoline (123) Stemofoline (111)
Stemocochinine (46)
N
OOO
OMe
O O
HOH
H
H
1 2
3
567
9 9a10
1112
13
15
16 1718
1920
22
21
8
HH
OO
N
OO
H
3
16
13
1117
9
87 4'
3'2'
1'9a
5
2
OMe
15
OH
N
OOO
O O
H
H
H
1 2
3
567
9 9a10
1112
13
15
16 1718
1920
22
21
8
HH
H
N+
OOO OH
O
OMe
O-
HH
H
H
6
79
10a11
12
13
1519
20
21
8
12
3
4
10
14
16
17 18
OO
N
OO
H
3
16
13
1117
9
87 4'
3'
2'
1'9a
5
2
OMe
15
OO
NH
311
17
9
87 4'
3'
2'
1'9a
5
2
OO
OMe
15
1613
Figure 3.1 Isolated Stemona alkaloids from the roots of Malaysia S. curtisii.
3.3 Structure elucidation of isolated Stemona alkaloids from the roots of S.
curtisii
3.3.1 1-Hydroxyprotostemonine (41)
1-Hydroxyprotostemonine (41) was isolated as a yellow gum; ESI-MS m/z 408
[M+H]+, consistent with molecular C22H31NO7 (MW 407) . The
1H NMR spectrum of
1-hydroxyprotostemonine is shown in Figure 3.2. This compo98d was identified from a
comparison of its NMR spectroscopic data with those in the literature.39
The chemical
shifts are in close agreement with those previously reported as summarized in Table 3.1.

50
Figure 3.2 1H NMR spectrum (methanol-d4, 500 MHz) of 1-hydroxyprotostemonine
(41).
Table 3.1 1H NMR (500 MHz) spectroscopic data of 1-hydroxyprotostemonine (this
work) and 1-hydroxyprotostemonine (41)39
in methanol-d4 solution (δ in ppm).
Data Experimental Literature39
Position H (mult., J (Hz), assign.) H (mult., J (Hz), assign.)
1 4.32-4.25 (overlap) 4.32 (t, J 3.9)
2α 1.84 (dd, J 13.5, 6.0) 1.85 (dd, J 13.0, 6.0)
β 1.70-1.65 (m) 1.71-1.67 (m)
3 3.58-3.61 (overlap) 3.55-3.60 (m)
5α 3.43 (dd, J 9.0, 6.5) 3.41 (dd, J 9.0, 6.5)
β 3.65-3.58 (m) 3.65-3.58 (m)
6α 1.63-1.58 (m) 1.63-1.58 (m)
β 1.63-1.58 (m) 1.63-1.58 (m)
7α 2.40-2.35 (m) 2.39-2.34 (m)
β 1.44-138 (m) 1.42 (m)
8 4.74 (dt, J 10.5, 3.8) 4.75 (dt, J 10.5, 3.8)
9 2.36-2.30 (m) 2.35-2.30 (m)
9a 3.60-3.54 (overlap) 3.61-3.56 (m)
10 3.31 (m) 3.30 (m)
16 (Me) 2.06 (s) 2.05 (s)
17 (Me) 1.36 (d, J 6.5) 1.35 (d, J 7.0)
18 4.34-4.32 (overlap) 4.33-4.30 (m)
19α 1.61-1.51 (m) 1.61-1.51 (m)
β 2.62-258 (m) 2.61 (m)
20 2.82-279 (m) 2.82 (m)
22 (Me) 1.27 (d, J 7.5) 1.27 (d, J 7.0)
OMe 4.12 (br s) 4.12 (br s)
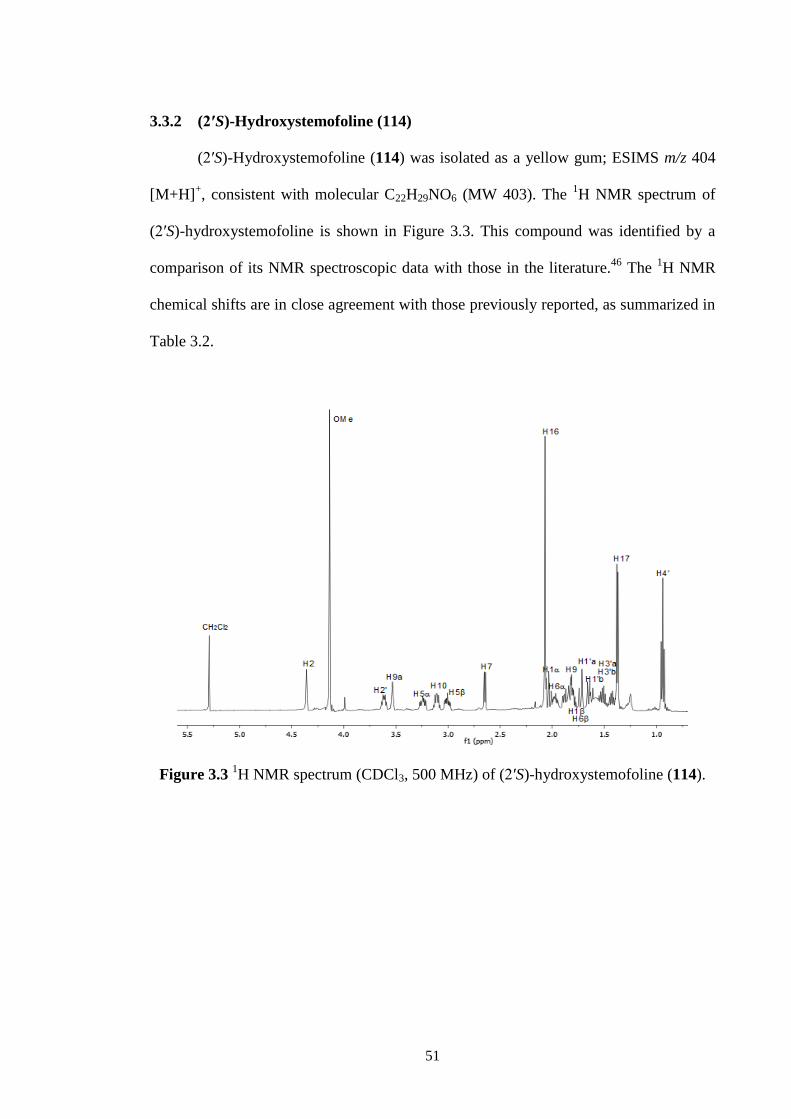
51
3.3.2 (2′S)-Hydroxystemofoline (114)
(2′S)-Hydroxystemofoline (114) was isolated as a yellow gum; ESIMS m/z 404
[M+H]+, consistent with molecular C22H29NO6 (MW 403). The
1H NMR spectrum of
(2′S)-hydroxystemofoline is shown in Figure 3.3. This compound was identified by a
comparison of its NMR spectroscopic data with those in the literature.46
The 1H NMR
chemical shifts are in close agreement with those previously reported, as summarized in
Table 3.2.
Figure 3.3 1H NMR spectrum (CDCl3, 500 MHz) of (2′S)-hydroxystemofoline (114).
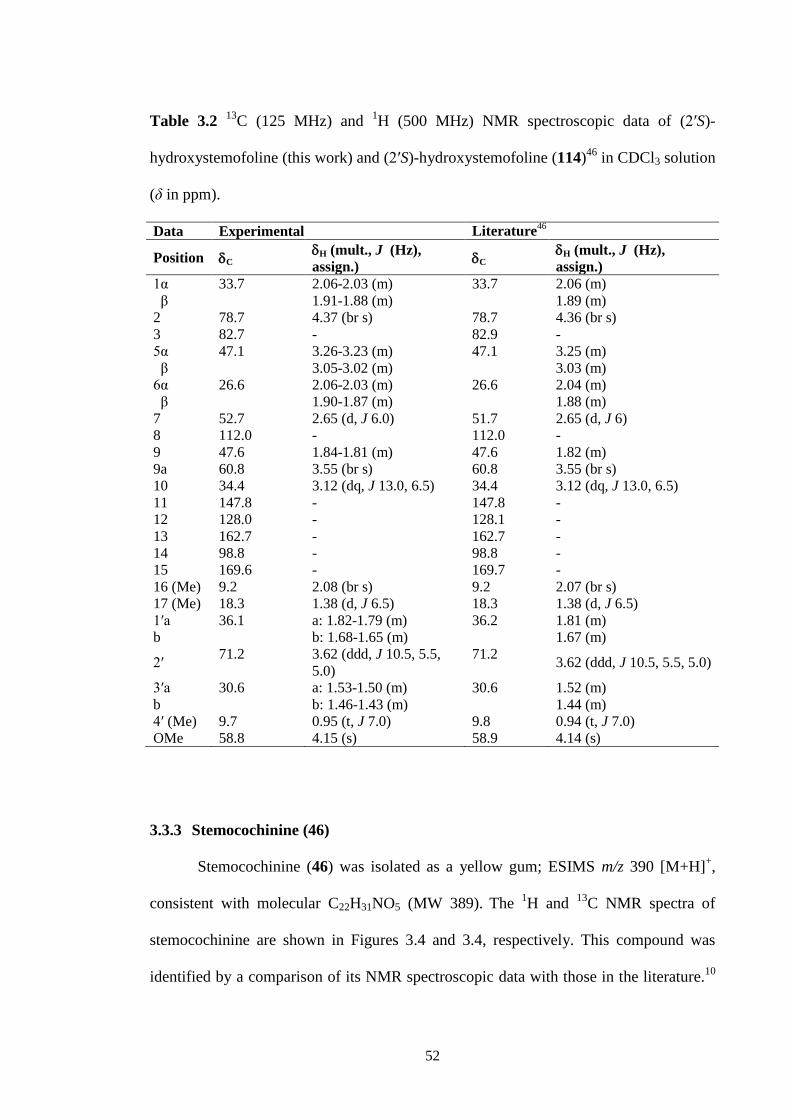
52
Table 3.2 13
C (125 MHz) and 1H (500 MHz) NMR spectroscopic data of (2′S)-
hydroxystemofoline (this work) and (2′S)-hydroxystemofoline (114)46
in CDCl3 solution
(δ in ppm).
Data Experimental Literature46
Position C H (mult., J (Hz),
assign.) C
H (mult., J (Hz),
assign.)
1α 33.7 2.06-2.03 (m) 33.7 2.06 (m)
β 1.91-1.88 (m) 1.89 (m)
2 78.7 4.37 (br s) 78.7 4.36 (br s)
3 82.7 - 82.9 -
5α 47.1 3.26-3.23 (m) 47.1 3.25 (m)
β 3.05-3.02 (m) 3.03 (m)
6α 26.6 2.06-2.03 (m) 26.6 2.04 (m)
β 1.90-1.87 (m) 1.88 (m)
7 52.7 2.65 (d, J 6.0) 51.7 2.65 (d, J 6)
8 112.0 - 112.0 -
9 47.6 1.84-1.81 (m) 47.6 1.82 (m)
9a 60.8 3.55 (br s) 60.8 3.55 (br s)
10 34.4 3.12 (dq, J 13.0, 6.5) 34.4 3.12 (dq, J 13.0, 6.5)
11 147.8 - 147.8 -
12 128.0 - 128.1 -
13 162.7 - 162.7 -
14 98.8 - 98.8 -
15 169.6 - 169.7 -
16 (Me) 9.2 2.08 (br s) 9.2 2.07 (br s)
17 (Me) 18.3 1.38 (d, J 6.5) 18.3 1.38 (d, J 6.5)
1′a 36.1 a: 1.82-1.79 (m) 36.2 1.81 (m)
b b: 1.68-1.65 (m) 1.67 (m)
2′ 71.2 3.62 (ddd, J 10.5, 5.5,
5.0)
71.2 3.62 (ddd, J 10.5, 5.5, 5.0)
3′a 30.6 a: 1.53-1.50 (m) 30.6 1.52 (m)
b b: 1.46-1.43 (m) 1.44 (m)
4′ (Me) 9.7 0.95 (t, J 7.0) 9.8 0.94 (t, J 7.0)
OMe 58.8 4.15 (s) 58.9 4.14 (s)
3.3.3 Stemocochinine (46)
Stemocochinine (46) was isolated as a yellow gum; ESIMS m/z 390 [M+H]+,
consistent with molecular C22H31NO5 (MW 389). The
1H and
13C NMR spectra of
stemocochinine are shown in Figures 3.4 and 3.4, respectively. This compound was
identified by a comparison of its NMR spectroscopic data with those in the literature.10
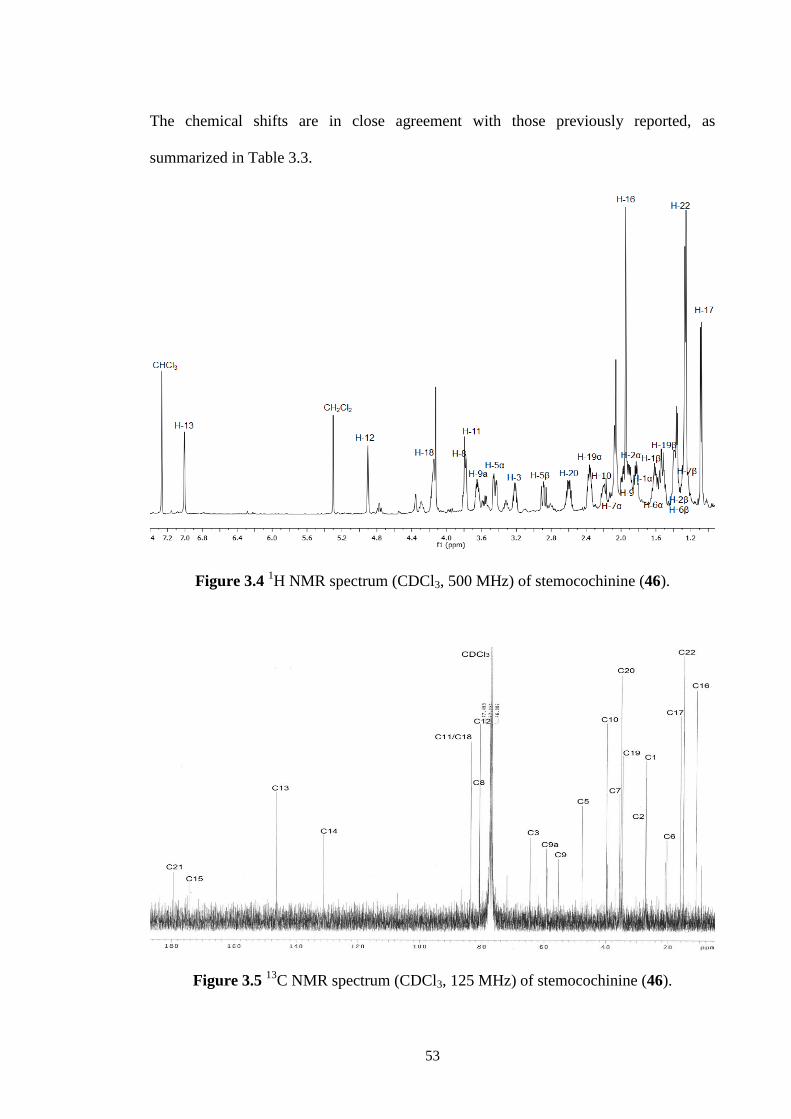
53
The chemical shifts are in close agreement with those previously reported, as
summarized in Table 3.3.
Figure 3.4 1H NMR spectrum (CDCl3, 500 MHz) of stemocochinine (46).
Figure 3.5 13
C NMR spectrum (CDCl3, 125 MHz) of stemocochinine (46).
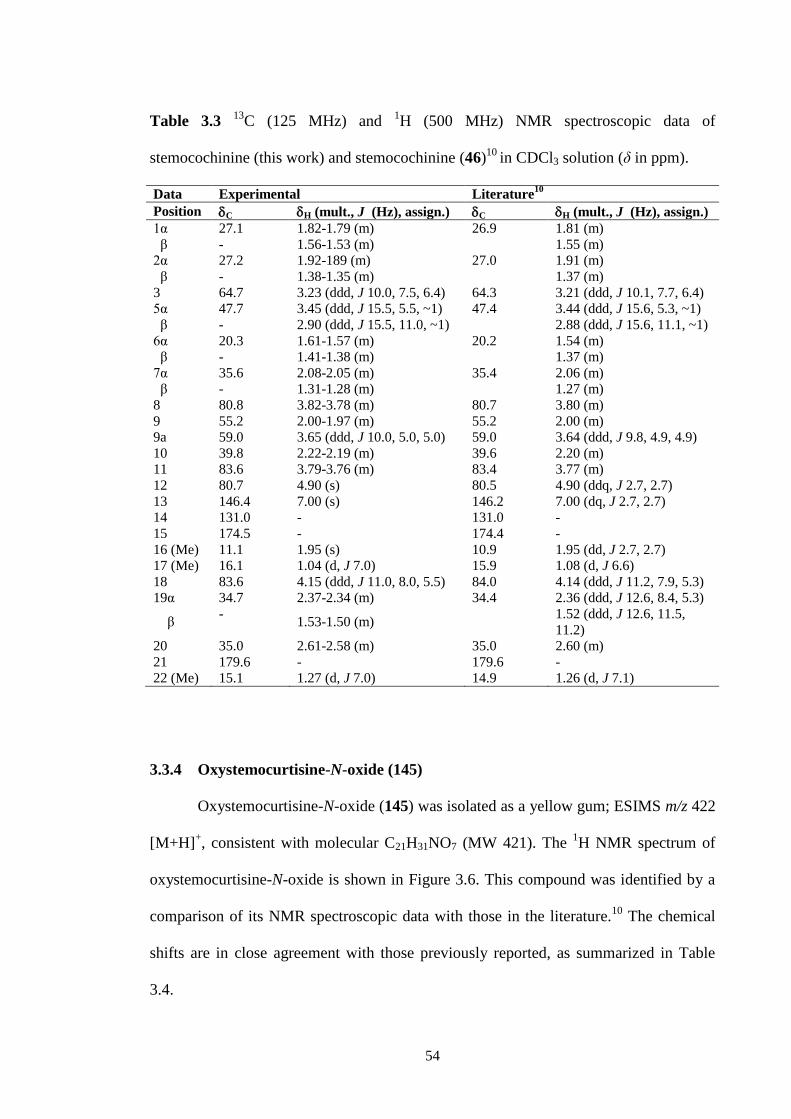
54
Table 3.3 13
C (125 MHz) and 1H (500 MHz) NMR spectroscopic data of
stemocochinine (this work) and stemocochinine (46)10
in CDCl3 solution (δ in ppm).
Data Experimental Literature10
Position C H (mult., J (Hz), assign.) C H (mult., J (Hz), assign.)
1α 27.1 1.82-1.79 (m) 26.9 1.81 (m)
β - 1.56-1.53 (m) 1.55 (m)
2α 27.2 1.92-189 (m) 27.0 1.91 (m)
β - 1.38-1.35 (m) 1.37 (m)
3 64.7 3.23 (ddd, J 10.0, 7.5, 6.4) 64.3 3.21 (ddd, J 10.1, 7.7, 6.4)
5α 47.7 3.45 (ddd, J 15.5, 5.5, ~1) 47.4 3.44 (ddd, J 15.6, 5.3, ~1)
β - 2.90 (ddd, J 15.5, 11.0, ~1) 2.88 (ddd, J 15.6, 11.1, ~1)
6α 20.3 1.61-1.57 (m) 20.2 1.54 (m)
β - 1.41-1.38 (m) 1.37 (m)
7α 35.6 2.08-2.05 (m) 35.4 2.06 (m)
β - 1.31-1.28 (m) 1.27 (m)
8 80.8 3.82-3.78 (m) 80.7 3.80 (m)
9 55.2 2.00-1.97 (m) 55.2 2.00 (m)
9a 59.0 3.65 (ddd, J 10.0, 5.0, 5.0) 59.0 3.64 (ddd, J 9.8, 4.9, 4.9)
10 39.8 2.22-2.19 (m) 39.6 2.20 (m)
11 83.6 3.79-3.76 (m) 83.4 3.77 (m)
12 80.7 4.90 (s) 80.5 4.90 (ddq, J 2.7, 2.7)
13 146.4 7.00 (s) 146.2 7.00 (dq, J 2.7, 2.7)
14 131.0 - 131.0 -
15 174.5 - 174.4 -
16 (Me) 11.1 1.95 (s) 10.9 1.95 (dd, J 2.7, 2.7)
17 (Me) 16.1 1.04 (d, J 7.0) 15.9 1.08 (d, J 6.6)
18 83.6 4.15 (ddd, J 11.0, 8.0, 5.5) 84.0 4.14 (ddd, J 11.2, 7.9, 5.3)
19α 34.7 2.37-2.34 (m) 34.4 2.36 (ddd, J 12.6, 8.4, 5.3)
β -
1.53-1.50 (m) 1.52 (ddd, J 12.6, 11.5,
11.2)
20 35.0 2.61-2.58 (m) 35.0 2.60 (m)
21 179.6 - 179.6 -
22 (Me) 15.1 1.27 (d, J 7.0) 14.9 1.26 (d, J 7.1)
3.3.4 Oxystemocurtisine-N-oxide (145)
Oxystemocurtisine-N-oxide (145) was isolated as a yellow gum; ESIMS m/z 422
[M+H]+, consistent with molecular C21H31NO7 (MW 421). The
1H NMR spectrum of
oxystemocurtisine-N-oxide is shown in Figure 3.6. This compound was identified by a
comparison of its NMR spectroscopic data with those in the literature.10
The chemical
shifts are in close agreement with those previously reported, as summarized in Table
3.4.
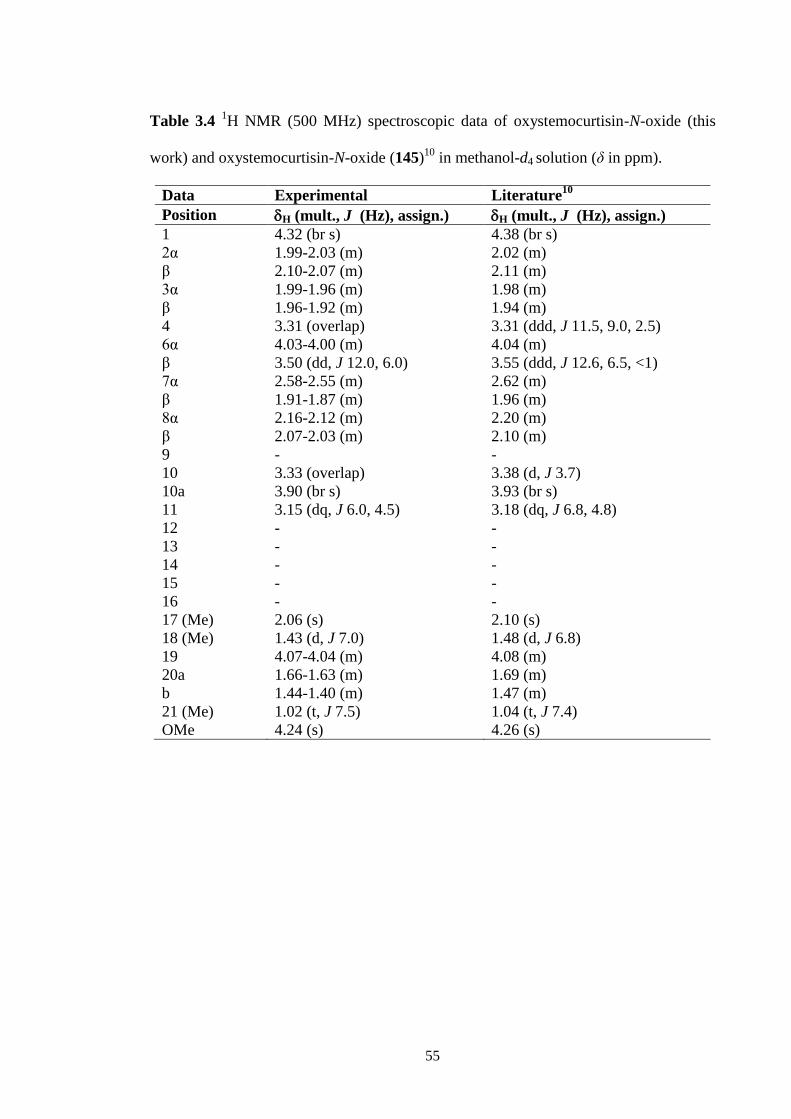
55
Table 3.4 1H NMR (500 MHz) spectroscopic data of oxystemocurtisin-N-oxide (this
work) and oxystemocurtisin-N-oxide (145)10
in methanol-d4 solution (δ in ppm).
Data Experimental Literature10
Position H (mult., J (Hz), assign.) H (mult., J (Hz), assign.)
1 4.32 (br s) 4.38 (br s)
2α 1.99-2.03 (m) 2.02 (m)
β 2.10-2.07 (m) 2.11 (m)
3α 1.99-1.96 (m) 1.98 (m)
β 1.96-1.92 (m) 1.94 (m)
4 3.31 (overlap) 3.31 (ddd, J 11.5, 9.0, 2.5)
6α 4.03-4.00 (m) 4.04 (m)
β 3.50 (dd, J 12.0, 6.0) 3.55 (ddd, J 12.6, 6.5, <1)
7α 2.58-2.55 (m) 2.62 (m)
β 1.91-1.87 (m) 1.96 (m)
8α 2.16-2.12 (m) 2.20 (m)
β 2.07-2.03 (m) 2.10 (m)
9 - -
10 3.33 (overlap) 3.38 (d, J 3.7)
10a 3.90 (br s) 3.93 (br s)
11 3.15 (dq, J 6.0, 4.5) 3.18 (dq, J 6.8, 4.8)
12 - -
13 - -
14 - -
15 - -
16 - -
17 (Me) 2.06 (s) 2.10 (s)
18 (Me) 1.43 (d, J 7.0) 1.48 (d, J 6.8)
19 4.07-4.04 (m) 4.08 (m)
20a 1.66-1.63 (m) 1.69 (m)
b 1.44-1.40 (m) 1.47 (m)
21 (Me) 1.02 (t, J 7.5) 1.04 (t, J 7.4)
OMe 4.24 (s) 4.26 (s)
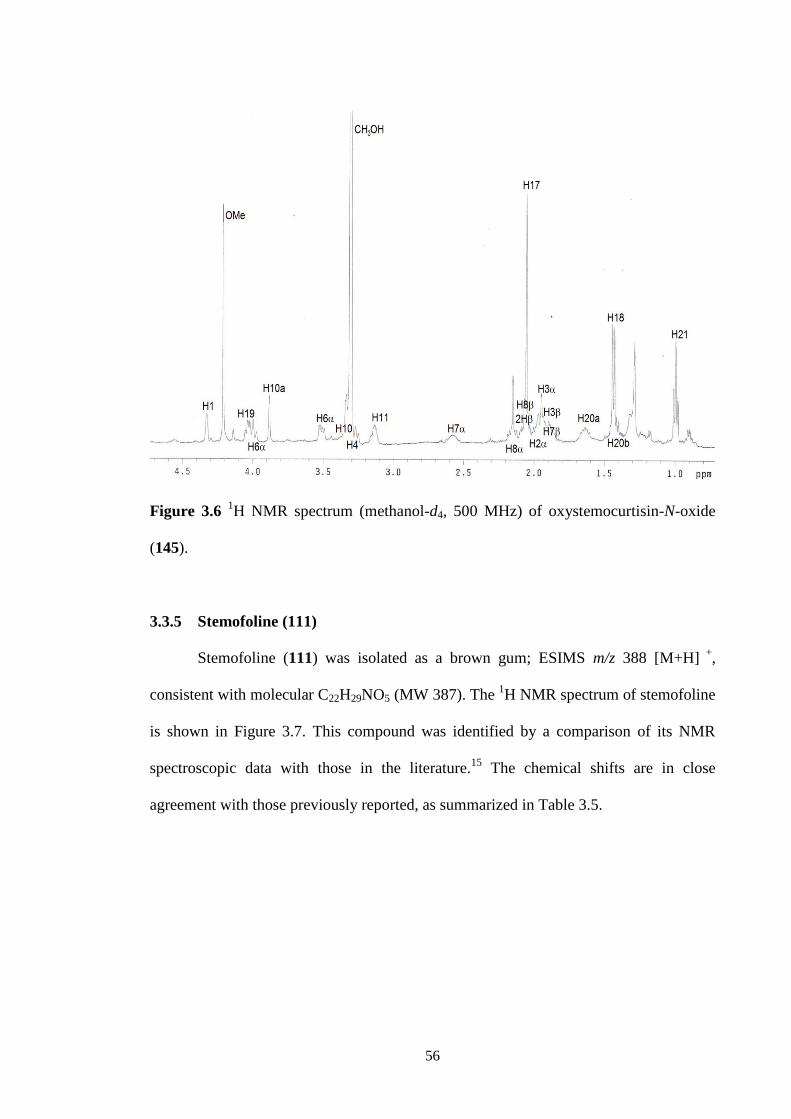
56
Figure 3.6 1H NMR spectrum (methanol-d4, 500 MHz) of oxystemocurtisin-N-oxide
(145).
3.3.5 Stemofoline (111)
Stemofoline (111) was isolated as a brown gum; ESIMS m/z 388 [M+H] +
,
consistent with molecular C22H29NO5 (MW 387). The 1H NMR spectrum of stemofoline
is shown in Figure 3.7. This compound was identified by a comparison of its NMR
spectroscopic data with those in the literature.15
The chemical shifts are in close
agreement with those previously reported, as summarized in Table 3.5.

57
Figure 3.7 1H NMR spectrum (CDCl3, 500 MHz) of stemofoline (111).
Table 3.5 1H NMR (500 MHz) spectroscopic data of stemofoline (this work) and
stemofoline (111)15
in CDCl3 solution (δ in ppm).
Data Experimental Literature15
Position H (mult., J (Hz), assign.) H (mult., J (Hz), assign.)
1 1.85-1.90 (m, 2H) 1.7-2.00 (m)
2 4.26 (br s) 4.25 (br s)
5 3.11-3.08 (m, 2H) 3.20-3.10 (m, 2H)
6 1.92-2.00 (m, 2H) 1.70-2.0 (m, 2H)
7 2.75 (d, J 6.4) 2.70 (d, J 6.4)
9 1.75-1.80 (m) 1.70-2.00 (m)
9a 3.54 (br s) 3.50 (br s)
10 3.06-3.03 (m) 3.10 (m)
16 (Me) 2.09 (s) 2.07 (s)
17 (Me) 1.40 (d, J 6.4) 1.36 (d, J 6.4)
1' 1.60-1.65 (m, 2H) 1.50-1.60 (m)
2' 1.35-1.45 (m, 2H) 1.50-1.60 (m)
3' 1.25-1.35 (m, 2H) 1.50-1.60 (m)
4' (Me) 0.94 (t, J 7.0) 0.92 (t, J 6.8)
OMe 4.17 (s) 4.13 (s)
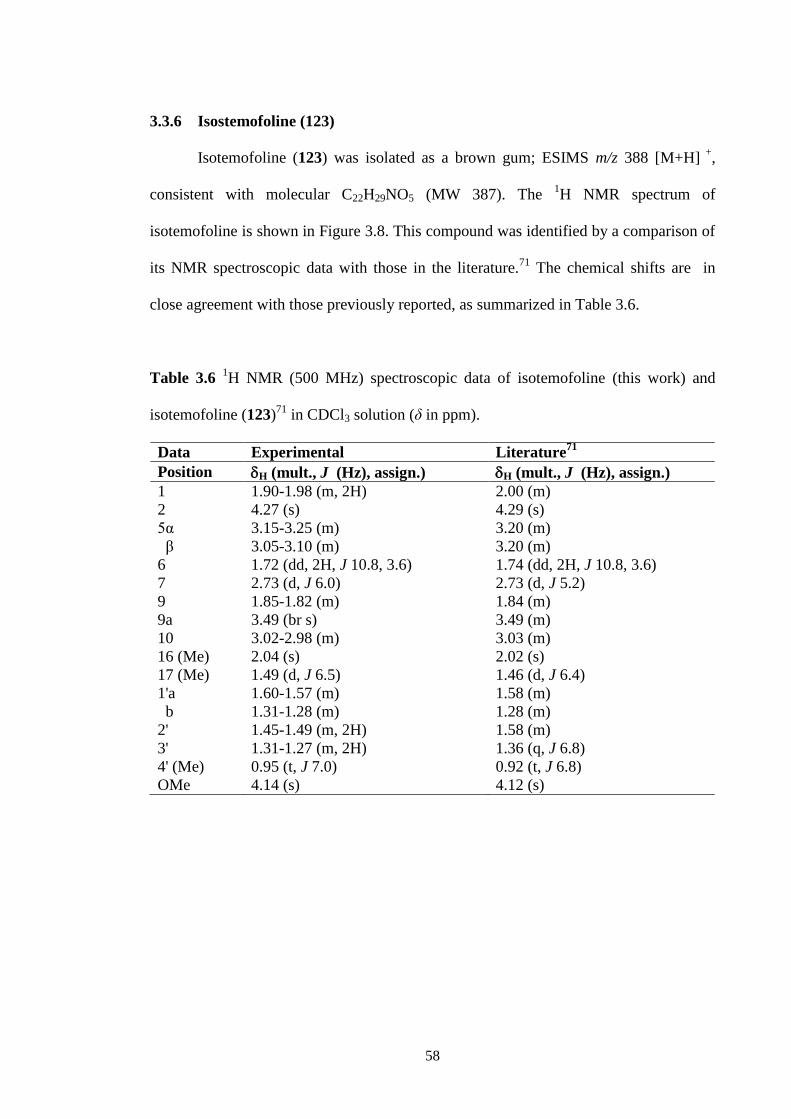
58
3.3.6 Isostemofoline (123)
Isotemofoline (123) was isolated as a brown gum; ESIMS m/z 388 [M+H] +
,
consistent with molecular C22H29NO5 (MW 387). The 1H NMR spectrum of
isotemofoline is shown in Figure 3.8. This compound was identified by a comparison of
its NMR spectroscopic data with those in the literature.71
The chemical shifts are in
close agreement with those previously reported, as summarized in Table 3.6.
Table 3.6 1H NMR (500 MHz) spectroscopic data of isotemofoline (this work) and
isotemofoline (123)71
in CDCl3 solution (δ in ppm).
Data Experimental Literature71
Position H (mult., J (Hz), assign.) H (mult., J (Hz), assign.)
1 1.90-1.98 (m, 2H) 2.00 (m)
2 4.27 (s) 4.29 (s)
5α 3.15-3.25 (m) 3.20 (m)
β 3.05-3.10 (m) 3.20 (m)
6 1.72 (dd, 2H, J 10.8, 3.6) 1.74 (dd, 2H, J 10.8, 3.6)
7 2.73 (d, J 6.0) 2.73 (d, J 5.2)
9 1.85-1.82 (m) 1.84 (m)
9a 3.49 (br s) 3.49 (m)
10 3.02-2.98 (m) 3.03 (m)
16 (Me) 2.04 (s) 2.02 (s)
17 (Me) 1.49 (d, J 6.5) 1.46 (d, J 6.4)
1'a 1.60-1.57 (m) 1.58 (m)
b 1.31-1.28 (m) 1.28 (m)
2' 1.45-1.49 (m, 2H) 1.58 (m)
3' 1.31-1.27 (m, 2H) 1.36 (q, J 6.8)
4' (Me) 0.95 (t, J 7.0) 0.92 (t, J 6.8)
OMe 4.14 (s) 4.12 (s)
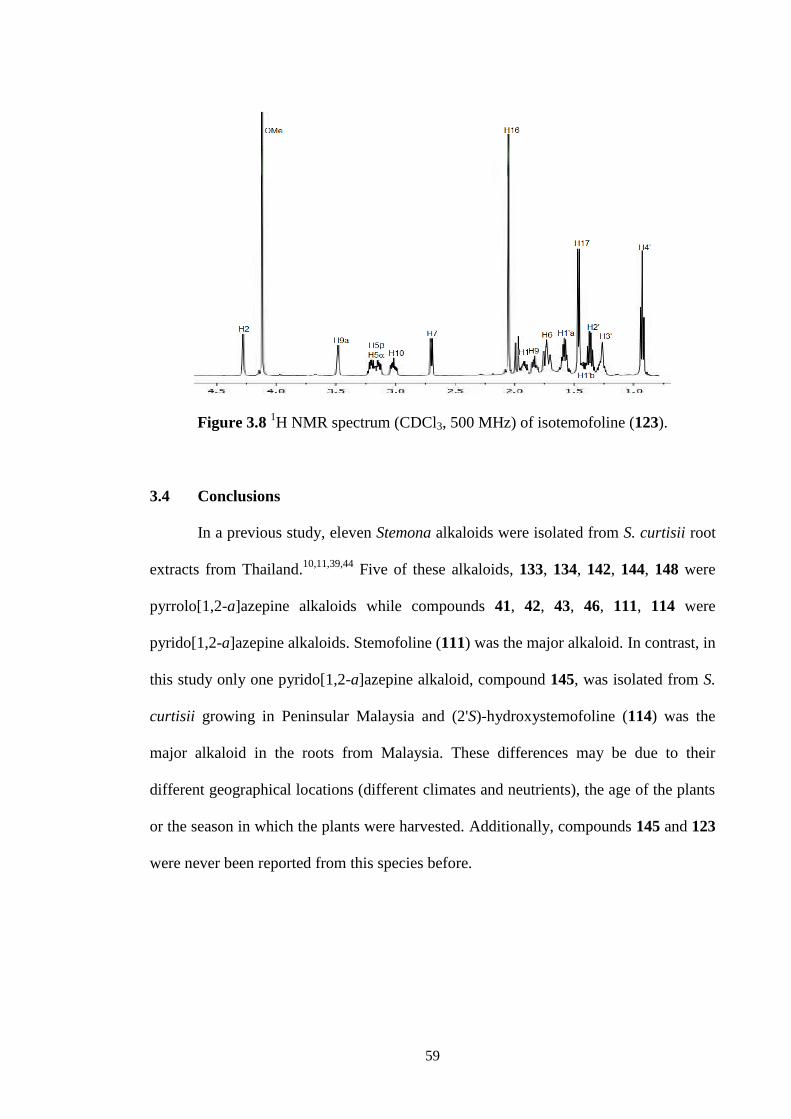
59
Figure 3.8 1H NMR spectrum (CDCl3, 500 MHz) of isotemofoline (123).
3.4 Conclusions
In a previous study, eleven Stemona alkaloids were isolated from S. curtisii root
extracts from Thailand.10,11,39,44
Five of these alkaloids, 133, 134, 142, 144, 148 were
pyrrolo[1,2-a]azepine alkaloids while compounds 41, 42, 43, 46, 111, 114 were
pyrido[1,2-a]azepine alkaloids. Stemofoline (111) was the major alkaloid. In contrast, in
this study only one pyrido[1,2-a]azepine alkaloid, compound 145, was isolated from S.
curtisii growing in Peninsular Malaysia and (2'S)-hydroxystemofoline (114) was the
major alkaloid in the roots from Malaysia. These differences may be due to their
different geographical locations (different climates and neutrients), the age of the plants
or the season in which the plants were harvested. Additionally, compounds 145 and 123
were never been reported from this species before.
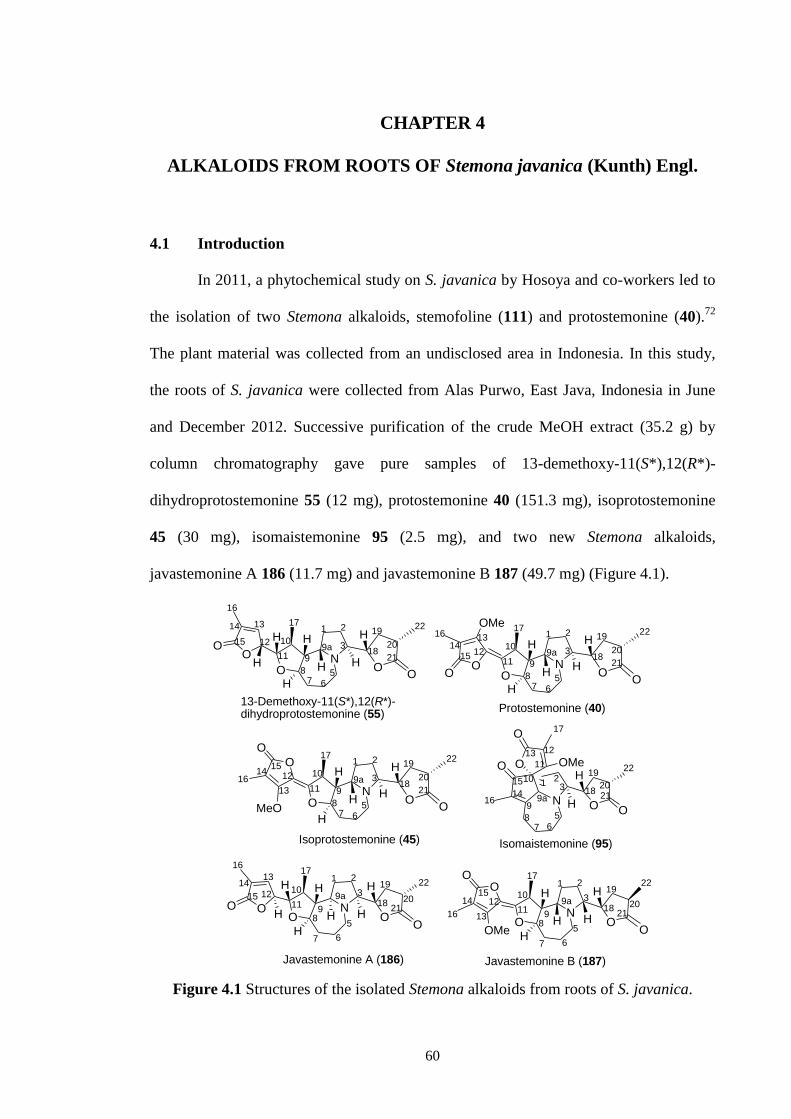
60
CHAPTER 4
ALKALOIDS FROM ROOTS OF Stemona javanica (Kunth) Engl.
4.1 Introduction
In 2011, a phytochemical study on S. javanica by Hosoya and co-workers led to
the isolation of two Stemona alkaloids, stemofoline (111) and protostemonine (40).72
The plant material was collected from an undisclosed area in Indonesia. In this study,
the roots of S. javanica were collected from Alas Purwo, East Java, Indonesia in June
and December 2012. Successive purification of the crude MeOH extract (35.2 g) by
column chromatography gave pure samples of 13-demethoxy-11(S*),12(R*)-
dihydroprotostemonine 55 (12 mg), protostemonine 40 (151.3 mg), isoprotostemonine
45 (30 mg), isomaistemonine 95 (2.5 mg), and two new Stemona alkaloids,
javastemonine A 186 (11.7 mg) and javastemonine B 187 (49.7 mg) (Figure 4.1).
13-Demethoxy-11(S*),12(R*)-dihydroprotostemonine (55)
Protostemonine (40)
Isoprotostemonine (45) Isomaistemonine (95)
Javastemonine B (187)Javastemonine A (186)
NO
H
OO
H
H
H H
H9a
1 2
3
5
67
89
10
11
17
18
19
2021
22
OO12
H
1314
15
16
NO
H
OO
H
H
H H
9a
1 2
3
5
67
89
10
11
17
18
19
2021
22
12
13
1415
16
OO
OMe
NO H
H
H
OO
H
1 2
3
567
8
9
9a10
11
17
18
19
20
22
21
H
OO
H
H
12
1314
15
16
NO H
H
H
O
OMe
O OO
H
1 2
3
567
8
9
9a10
1112
1314
15
1617
18
19
20
22
21
H
NO H
H
H
OO
H
1 2
3
567
8
9
9a10
11
17
18
19
20
22
21
HO
O
MeO
12
13
1415
16
N
O
O
O OMe
O O
H
H
12
3
5
678
99a
10
11
12
16
17
14
15
13
18
19
2021
22
Figure 4.1 Structures of the isolated Stemona alkaloids from roots of S. javanica.
61
4.2 Structure elucidation of isolated Stemona alkaloids from the roots of S.
javanica
4.2.1 Javastemonine A (186)
Compound 186 was obtained as a brown gum. Its molecular formula was
determined as C22H32NO5 from its HRESIMS (m/z 390.2280 [M+H]+, calc. for
390.2291). The IR spectrum of 186 showed characteristic bands at 1771 cm-1
and at
1761 and 1657 cm-1
for a saturated and an unsaturated γ-lactone, respectively. The
13C/DEPT NMR spectrum (Figure 4.5) displayed resonances for three methyl [δ 15.9
(C-17), 15.1 (C-22) and 11.0 (C-16)], six methylene [δ 48.0 (C-5), 35.3 (C-7), 34.9 (C-
19), 26.9 (C-1), 26.8 (C-2), and 19.8 (C-6)], five methine [δ 65.1 (C-3), 59.7 (C-9a),
54.6 (C-9), 39.8 (C-10), and 35.1 (C-20)], four oxymethine [δ 83.5 (C-11), 82.6 (C-18),
80.7 (C-12), and 80.6 (C-8)], two olefinic [δ 146.4 (C-13) and 131.2 (C-14); q C and
CH, respectively] and two downfield quaternary [δ 179.5 (C-21) and 174.5 (C-15)]
carbons (Table 4.1). The H/H COSY correlations of 186 indicated the partial spin
system H-1−H-2−H-3−H-18−H-19−H-20−H-22, typical of the pyrrolidine ring of the
Stemona alkaloids, with a γ-lactone substituent at C-3 (Figure 4.3). Also observed were
the COSY correlations between the vicinal pairs of contiguous protons along the C-
5−C-13 and C-9−C-1 backbones and between H-10 and H-17 (Figure 4.3). The 1H
NMR spectrum (Figure 4.6) indicated resonances for two different methyl groups,
which were attached to methine carbons, with 1H NMR resonances at δ 1.26 (d, J = 7.0
Hz, 3H, H-22) and δ 1.10 (d, J = 6.5 Hz, 3H, H-17), and a singlet methyl resonance at δ
1.95 (s, 3H, H-16). Key HMBC correlations for 186 are shown in Figure 4.3, while full
details are provided in Table 4.1. HSQC and HMBC experiments identified the protons
and carbons (C-18−C-22) of the γ-butyrolactone moiety (Figure 4.3), which was clearly
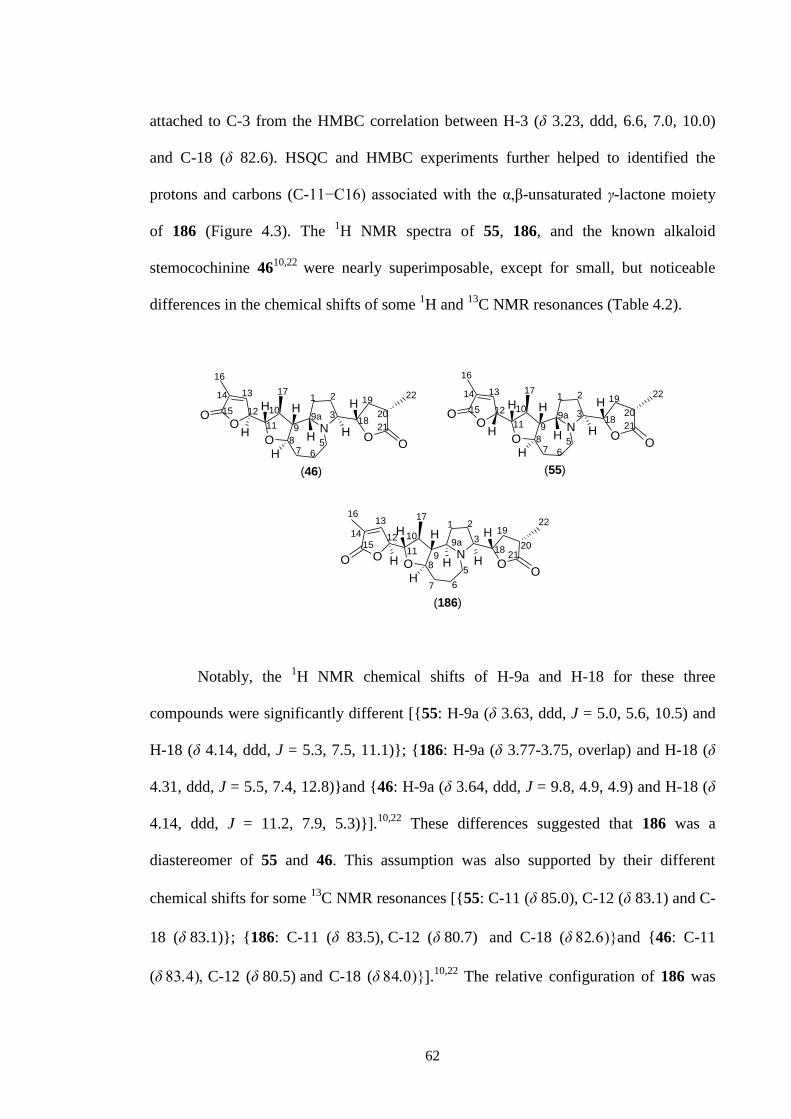
62
attached to C-3 from the HMBC correlation between H-3 (δ 3.23, ddd, 6.6, 7.0, 10.0)
and C-18 (δ 82.6). HSQC and HMBC experiments further helped to identified the
protons and carbons (C-11−C16) associated with the α,β-unsaturated γ-lactone moiety
of 186 (Figure 4.3). The 1H NMR spectra of 55, 186, and the known alkaloid
stemocochinine 4610,22
were nearly superimposable, except for small, but noticeable
differences in the chemical shifts of some 1H and
13C NMR resonances (Table 4.2).
NO
H
OO
H
H
H H
H9a
OO
1 2
3
5
67
89
10
11
12
13
1415
16 17
18
19
2021
22
H
(46) (55)
(186)
NO H
H
H
OO
H
1 2
3
567
8
9
9a10
11
17
18
19
20
22
21
H
OO
H
H
12
1314
15
16
NO H
H
H
OO
H
1 2
3
567
8
9
9a10
11
17
18
19
20
22
21
H
OO
H
H
12
1314
15
16
Notably, the 1H NMR chemical shifts of H-9a and H-18 for these three
compounds were significantly different [{55: H-9a (δ 3.63, ddd, J = 5.0, 5.6, 10.5) and
H-18 (δ 4.14, ddd, J = 5.3, 7.5, 11.1)}; {186: H-9a (δ 3.77-3.75, overlap) and H-18 (δ
4.31, ddd, J = 5.5, 7.4, 12.8)}and {46: H-9a (δ 3.64, ddd, J = 9.8, 4.9, 4.9) and H-18 (δ
4.14, ddd, J = 11.2, 7.9, 5.3)}].10,22
These differences suggested that 186 was a
diastereomer of 55 and 46. This assumption was also supported by their different
chemical shifts for some 13
C NMR resonances [{55: C-11 (δ85.0),C-12 (δ 83.1) and C-
18 (δ83.1)}; {186: C-11 (δ 83.5),C-12 (δ80.7) and C-18 (δand {46: C-11
(δC-12 (δ80.5)and C-18 (δ.10,22
The relative configuration of 186 was
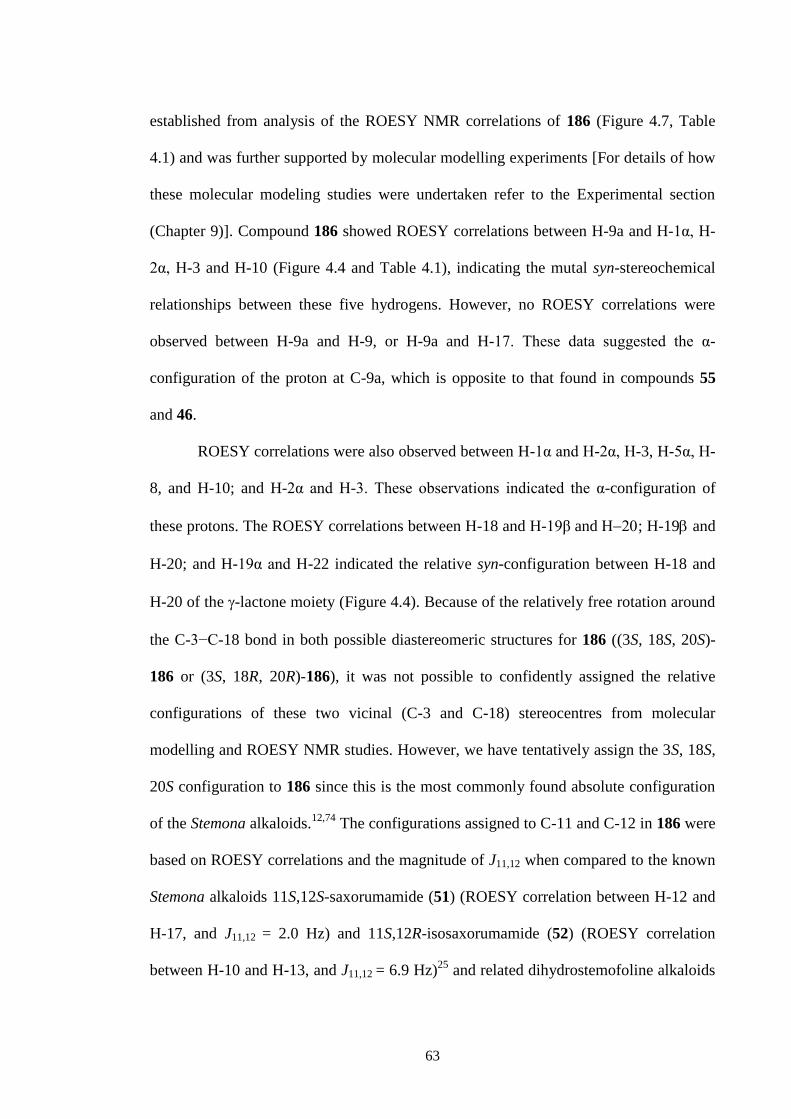
63
established from analysis of the ROESY NMR correlations of 186 (Figure 4.7, Table
4.1) and was further supported by molecular modelling experiments [For details of how
these molecular modeling studies were undertaken refer to the Experimental section
(Chapter 9)]. Compound 186 showed ROESY correlations between H-9a and H-1α, H-
2α, H-3 and H-10 (Figure 4.4 and Table 4.1), indicating the mutal syn-stereochemical
relationships between these five hydrogens. However, no ROESY correlations were
observed between H-9a and H-9, or H-9a and H-17. These data suggested the α-
configuration of the proton at C-9a, which is opposite to that found in compounds 55
and 46.
ROESY correlations were also observed between H-1α and H-2α, H-3, H-5α, H-
8, and H-10; and H-2α and H-3. These observations indicated the α-configuration of
these protons. The ROESY correlations between H-18 and H-19βand; H-19 and
H-20; and H-19α and H-22 indicated the relative syn-configuration between H-18 and
H-20 of the -lactone moiety (Figure 4.4). Because of the relatively free rotation around
the C-3−C-18 bond in both possible diastereomeric structures for 186 ((3S, 18S, 20S)-
186 or (3S, 18R, 20R)-186), it was not possible to confidently assigned the relative
configurations of these two vicinal (C-3 and C-18) stereocentres from molecular
modelling and ROESY NMR studies. However, we have tentatively assign the 3S, 18S,
20S configuration to 186 since this is the most commonly found absolute configuration
of the Stemona alkaloids.12,74
The configurations assigned to C-11 and C-12 in 186 were
based on ROESY correlations and the magnitude of J11,12 when compared to the known
Stemona alkaloids 11S,12S-saxorumamide (51) (ROESY correlation between H-12 and
H-17, and J11,12 = 2.0 Hz) and 11S,12R-isosaxorumamide (52) (ROESY correlation
between H-10 and H-13, and J11,12 = 6.9 Hz)25
and related dihydrostemofoline alkaloids
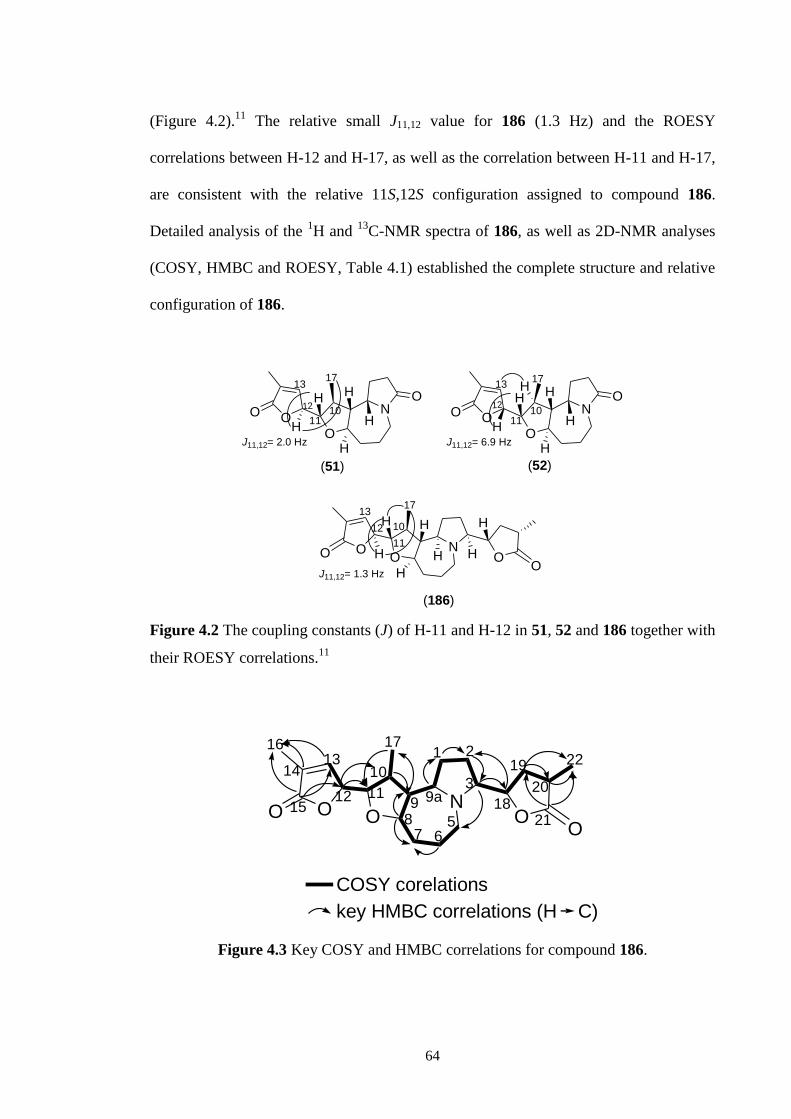
64
(Figure 4.2).11
The relative small J11,12 value for 186 (1.3 Hz) and the ROESY
correlations between H-12 and H-17, as well as the correlation between H-11 and H-17,
are consistent with the relative 11S,12S configuration assigned to compound 186.
Detailed analysis of the 1H and
13C-NMR spectra of 186, as well as 2D-NMR analyses
(COSY, HMBC and ROESY, Table 4.1) established the complete structure and relative
configuration of 186.
N
O
H
H
H
OOH
H
12
NO
H
OO
H
H
H H
H
OO
10
11
12
1317
H
O10
11N
O
H
H
H
OOH
H
12O
10
13
11
(51) (52)
(186)
J11,12= 2.0 Hz J11,12= 6.9 Hz
17 17H
J11,12= 1.3 Hz
13
Figure 4.2 The coupling constants (J) of H-11 and H-12 in 51, 52 and 186 together with
their ROESY correlations.11
COSY corelations
key HMBC correlations (H C)
NO O
OOO
3
18
1
11
10
9a98
7 65
2
1413
1622
21
20
19
17
1512
Figure 4.3 Key COSY and HMBC correlations for compound 186.
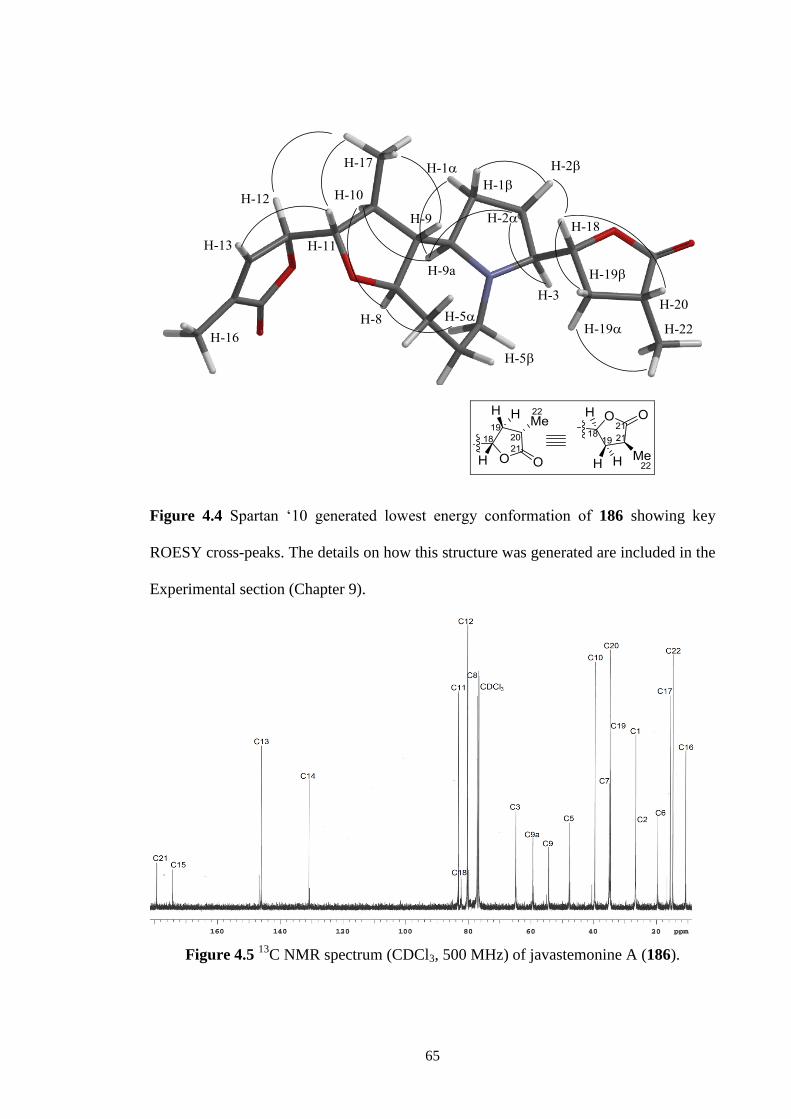
65
Figure 4.4 Spartan ‘10 generated lowest energy conformation of 186 showing key
ROESY cross-peaks. The details on how this structure was generated are included in the
Experimental section (Chapter 9).
Figure 4.5 13
C NMR spectrum (CDCl3, 500 MHz) of javastemonine A (186).
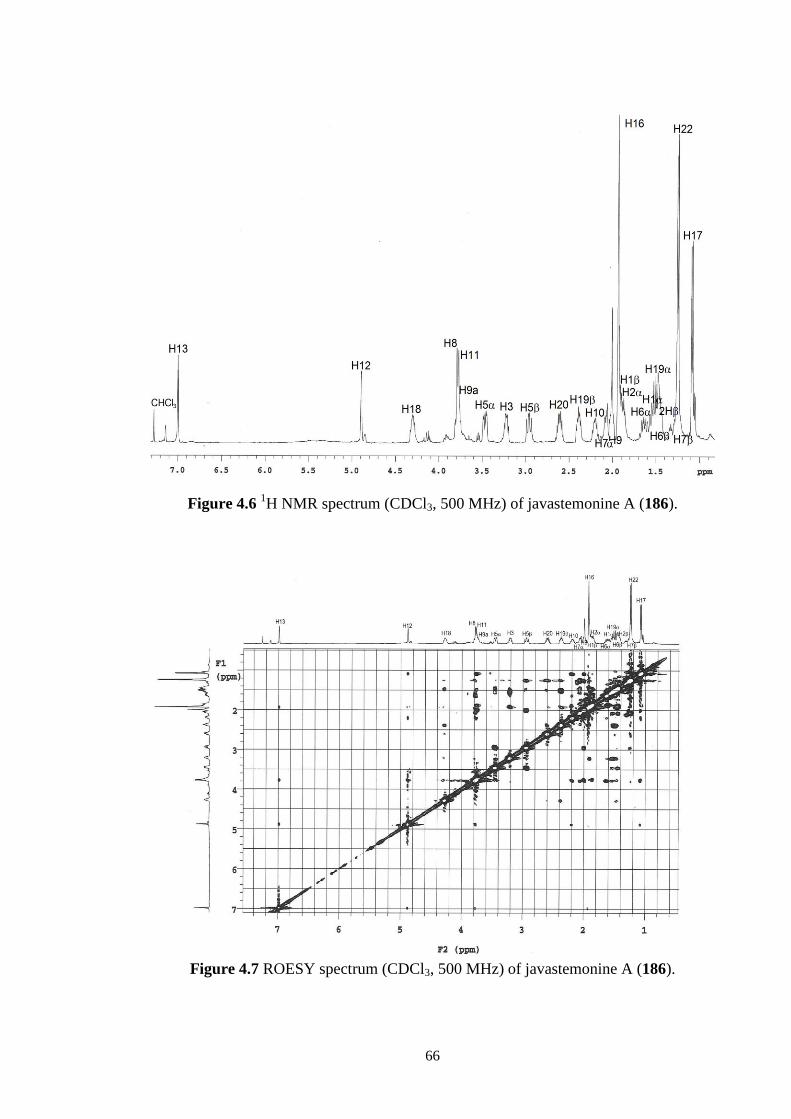
66
Figure 4.6 1H NMR spectrum (CDCl3, 500 MHz) of javastemonine A (186).
Figure 4.7 ROESY spectrum (CDCl3, 500 MHz) of javastemonine A (186).
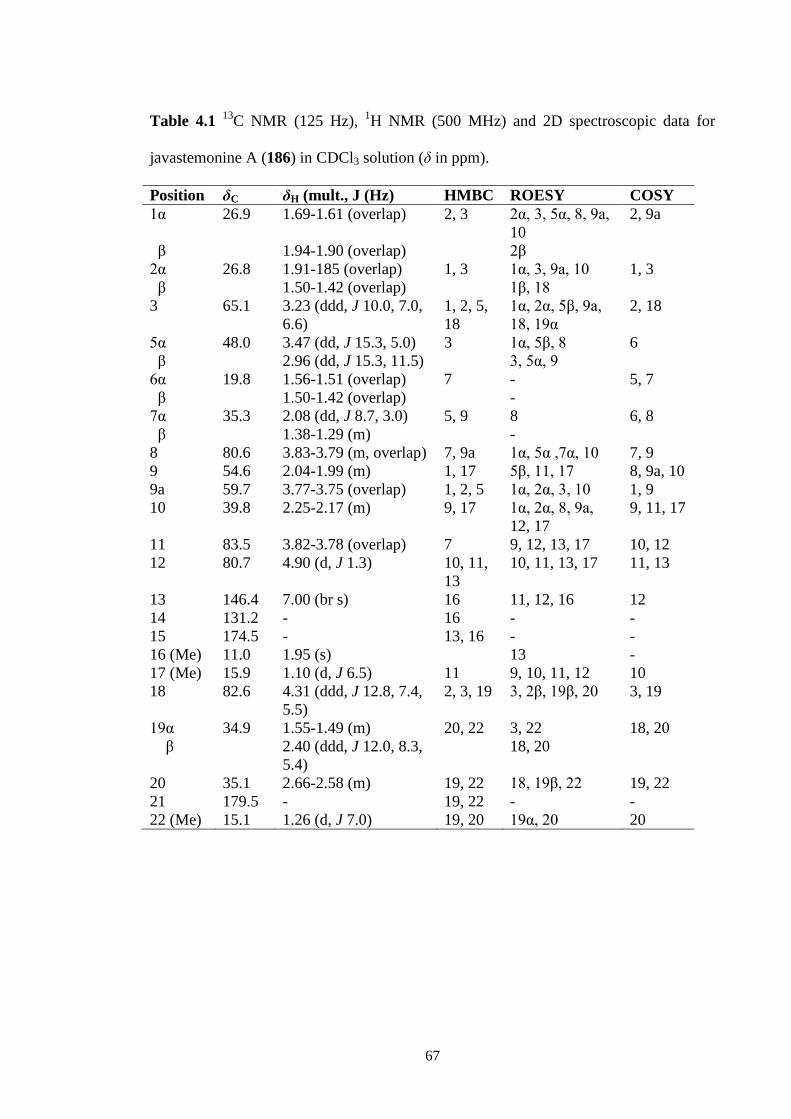
67
Table 4.1 13
C NMR (125 Hz), 1H NMR (500 MHz) and 2D spectroscopic data for
javastemonine A (186) in CDCl3 solution (δ in ppm).
Position δC δH (mult., J (Hz) HMBC ROESY COSY
1α 26.9 1.69-1.61 (overlap) 2, 3 2α, 3, 5α, 8, 9a,
10
2, 9a
β 1.94-1.90 (overlap) 2β
2α 26.8 1.91-185 (overlap) 1, 3 1α, 3, 9a, 10 1, 3
β 1.50-1.42 (overlap) 1β, 18
3 65.1 3.23 (ddd, J 10.0, 7.0,
6.6)
1, 2, 5,
18
1α, 2α, 5β, 9a,
18, 19α
2, 18
5α 48.0 3.47 (dd, J 15.3, 5.0) 3 1α, 5β, 8 6
β 2.96 (dd, J 15.3, 11.5) 3, 5α, 9
6α 19.8 1.56-1.51 (overlap) 7 - 5, 7
β 1.50-1.42 (overlap) -
7α 35.3 2.08 (dd, J 8.7, 3.0) 5, 9 8 6, 8
β 1.38-1.29 (m) -
8 80.6 3.83-3.79 (m, overlap) 7, 9a 1α, 5α ,7α, 10 7, 9
9 54.6 2.04-1.99 (m) 1, 17 5β, 11, 17 8, 9a, 10
9a 59.7 3.77-3.75 (overlap) 1, 2, 5 1α, 2α, 3, 10 1, 9
10 39.8 2.25-2.17 (m) 9, 17 1α, 2α, 8, 9a,
12, 17
9, 11, 17
11 83.5 3.82-3.78 (overlap) 7 9, 12, 13, 17 10, 12
12 80.7 4.90 (d, J 1.3) 10, 11,
13
10, 11, 13, 17 11, 13
13 146.4 7.00 (br s) 16 11, 12, 16 12
14 131.2 - 16 - -
15 174.5 - 13, 16 - -
16 (Me) 11.0 1.95 (s) 13 -
17 (Me) 15.9 1.10 (d, J 6.5) 11 9, 10, 11, 12 10
18 82.6 4.31 (ddd, J 12.8, 7.4,
5.5)
2, 3, 19 3, 2β, 19β, 20 3, 19
19α 34.9 1.55-1.49 (m) 20, 22 3, 22 18, 20
β 2.40 (ddd, J 12.0, 8.3,
5.4)
18, 20
20 35.1 2.66-2.58 (m) 19, 22 18, 19β, 22 19, 22
21 179.5 - 19, 22 - -
22 (Me) 15.1 1.26 (d, J 7.0) 19, 20 19α, 20 20
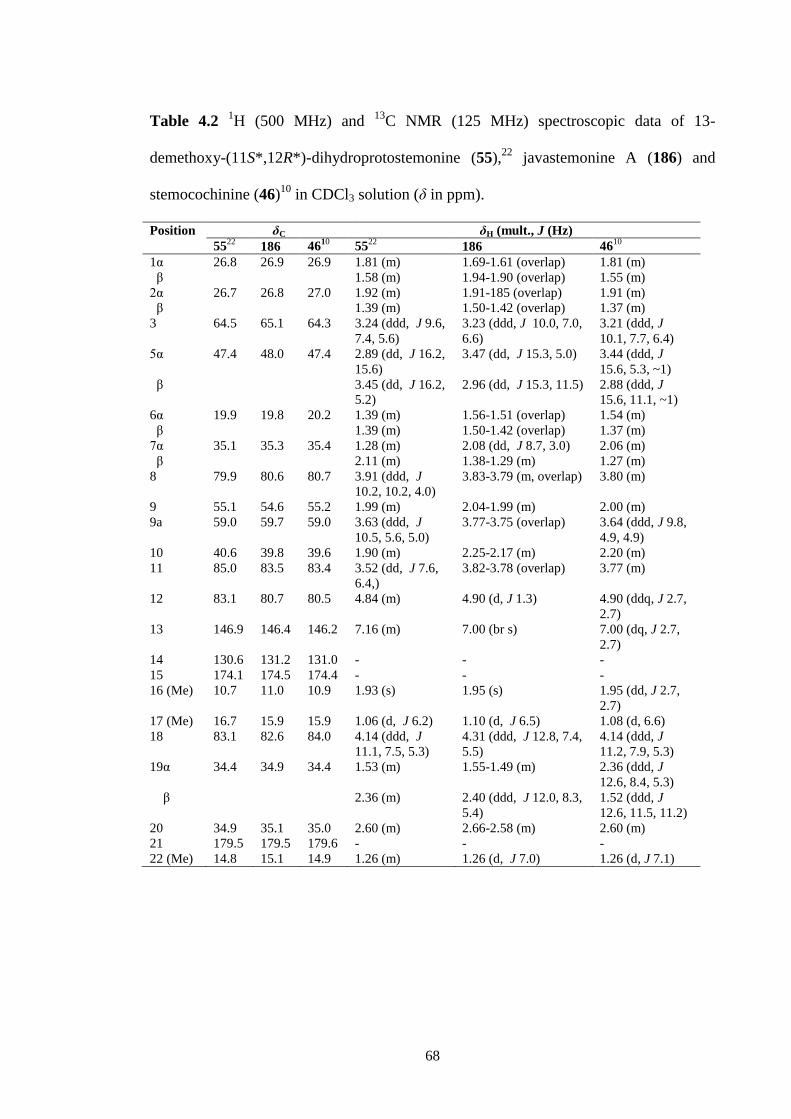
68
Table 4.2 1H (500 MHz) and
13C NMR (125 MHz) spectroscopic data of 13-
demethoxy-(11S*,12R*)-dihydroprotostemonine (55),22
javastemonine A (186) and
stemocochinine (46)10
in CDCl3 solution (δ in ppm).
Position δC δH (mult., J (Hz)
5522
186 4610
5522
186 46
10
1α 26.8 26.9 26.9 1.81 (m) 1.69-1.61 (overlap) 1.81 (m)
β 1.58 (m) 1.94-1.90 (overlap) 1.55 (m)
2α 26.7 26.8 27.0 1.92 (m) 1.91-185 (overlap) 1.91 (m)
β 1.39 (m) 1.50-1.42 (overlap) 1.37 (m)
3 64.5 65.1 64.3 3.24 (ddd, J 9.6,
7.4, 5.6)
3.23 (ddd, J 10.0, 7.0,
6.6)
3.21 (ddd, J
10.1, 7.7, 6.4)
5α 47.4 48.0 47.4 2.89 (dd, J 16.2,
15.6)
3.47 (dd, J 15.3, 5.0) 3.44 (ddd, J
15.6, 5.3, ~1)
β 3.45 (dd, J 16.2,
5.2)
2.96 (dd, J 15.3, 11.5) 2.88 (ddd, J
15.6, 11.1, ~1)
6α 19.9 19.8 20.2 1.39 (m) 1.56-1.51 (overlap) 1.54 (m)
β 1.39 (m) 1.50-1.42 (overlap) 1.37 (m)
7α 35.1 35.3 35.4 1.28 (m) 2.08 (dd, J 8.7, 3.0) 2.06 (m)
β 2.11 (m) 1.38-1.29 (m) 1.27 (m)
8 79.9 80.6 80.7 3.91 (ddd, J
10.2, 10.2, 4.0)
3.83-3.79 (m, overlap) 3.80 (m)
9 55.1 54.6 55.2 1.99 (m) 2.04-1.99 (m) 2.00 (m)
9a 59.0 59.7 59.0 3.63 (ddd, J
10.5, 5.6, 5.0)
3.77-3.75 (overlap) 3.64 (ddd, J 9.8,
4.9, 4.9)
10 40.6 39.8 39.6 1.90 (m) 2.25-2.17 (m) 2.20 (m)
11 85.0 83.5 83.4 3.52 (dd, J 7.6,
6.4,)
3.82-3.78 (overlap) 3.77 (m)
12 83.1 80.7 80.5 4.84 (m) 4.90 (d, J 1.3) 4.90 (ddq, J 2.7,
2.7)
13 146.9 146.4 146.2 7.16 (m) 7.00 (br s) 7.00 (dq, J 2.7,
2.7)
14 130.6 131.2 131.0 - - -
15 174.1 174.5 174.4 - - -
16 (Me) 10.7 11.0 10.9 1.93 (s) 1.95 (s) 1.95 (dd, J 2.7,
2.7)
17 (Me) 16.7 15.9 15.9 1.06 (d, J 6.2) 1.10 (d, J 6.5) 1.08 (d, 6.6)
18 83.1 82.6 84.0 4.14 (ddd, J
11.1, 7.5, 5.3)
4.31 (ddd, J 12.8, 7.4,
5.5)
4.14 (ddd, J
11.2, 7.9, 5.3)
19α 34.4 34.9 34.4 1.53 (m) 1.55-1.49 (m) 2.36 (ddd, J
12.6, 8.4, 5.3)
β 2.36 (m) 2.40 (ddd, J 12.0, 8.3,
5.4)
1.52 (ddd, J
12.6, 11.5, 11.2)
20 34.9 35.1 35.0 2.60 (m) 2.66-2.58 (m) 2.60 (m)
21 179.5 179.5 179.6 - - -
22 (Me) 14.8 15.1 14.9 1.26 (m) 1.26 (d, J 7.0) 1.26 (d, J 7.1)
69
4.2.2 Javastemonine B (187)
Compound 187 was obtained as a pale yellow gum. The molecular formula of
187 as C23H31NO6 was determined from its HRESIMS (m/z 418.2230 [M+H]+, calcd for
C23H32NO6 418.2226). The IR spectrum of 187 showed characteristic bands at 1780 cm-
1 and at 1745 and 1670 cm
-1 for a saturated and an unsaturated -lactone ring,
respectively. The 13
C/DEPT NMR spectra of 187 (Figure 4.10) displayed resonances for
three methyl [δ 8.7 (C-17), 14.6 (C-22), and 16.6 (C-16)], six methylene [δ 49.5 (C-5),
33.1 (C-7), 35.0 (C-19), 25.9 (C-2), 25.9 (C-1), and 17.8 (C-6)], five methine [δ 67.5
(C-3), 61.8 (C-9a), 50.9 (C-9), 41.7 (C-10), and 34.6 (C-20)], two oxymethine [δ 77.2
(C-18) and 82.7 (C-8)], four olefinic [δ 163.6 (C-13), 98.1 (C-14), 126.1 (C-12), and
149.2 (C-11)] and two quaternary [δ 178.3 (C-21) and 170.6 (C-15) carbons and a
methoxy group [δ 59.5 (C-23)] (Table 4.1). The chemical shifts of these 13
C NMR
signals were similar to these of the known Stemona alkaloids, protostemonine (40, the
11(Z) isomer of 45) and isoprotostemonine (45) (Figure 4.1) which were isolated here
and previously from S. japonica.7 The COSY and HMBC spectroscopic analysis of 187
showed analogous correlations to those observed for 186. The correlations in the COSY
spectrum of 187 indicated the spin system H-1−H-2−H-3−H-18−H-19−H-20−H-22,
typical of the pyrrolidine ring of the Stemona alkaloids with a -lactone substituent at C-
3 (Figure 4.8). COSY correlations were also observed between the vicinal pairs of
contiguous protons along the C-5−C-6−C-7−C-8−C-9−C-9a−C-1 backbone and
between H-10 and H-17 (Figure 4.8). The 1H NMR/COSY spectra indicated resonances
for the presence of two methyl groups (δ 1.27 (d, J = 7.0 Hz, 3H, H-22), and 1.48 (d, J =
7.0 Hz, 3H, H-17), which were attached to methine groups with 1H NMR resonances at
δ 2.70 (ddq, J = 11.5, 7.5, 7.0 Hz, 1H, H-20), and δ 3.04 (ddd, J = 13.4, 7.1, 7.1, 1H, H-
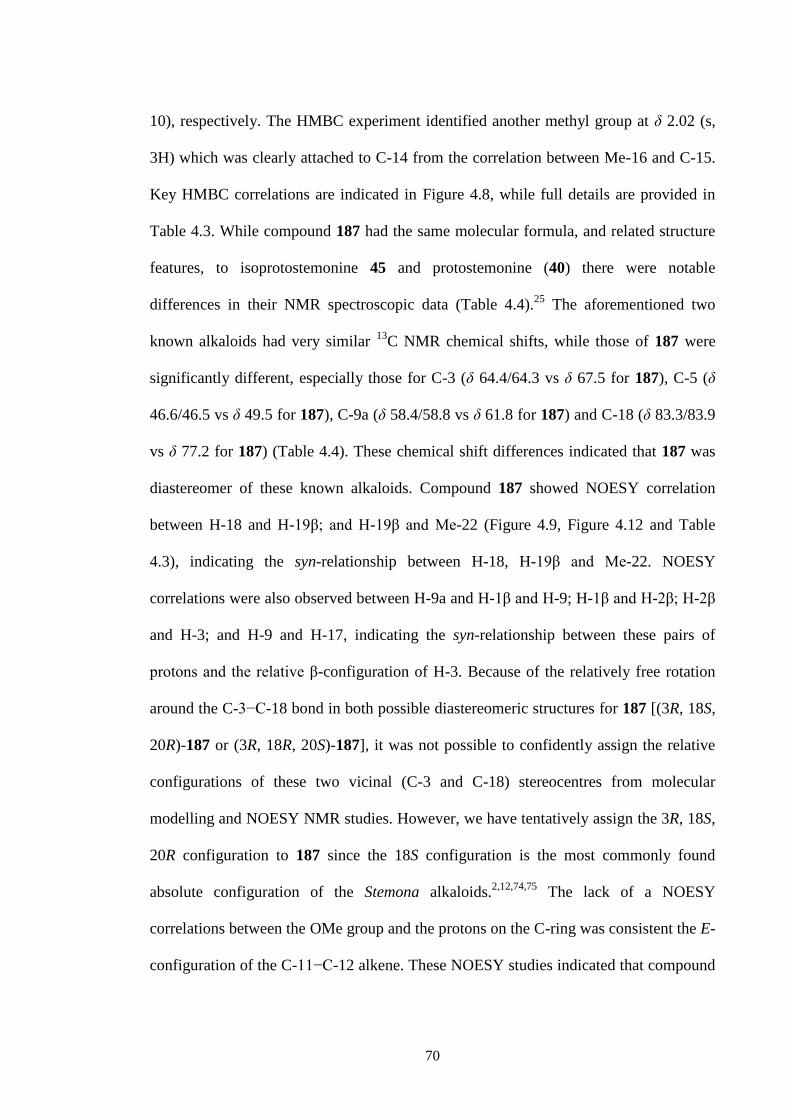
70
10), respectively. The HMBC experiment identified another methyl group at δ 2.02 (s,
3H) which was clearly attached to C-14 from the correlation between Me-16 and C-15.
Key HMBC correlations are indicated in Figure 4.8, while full details are provided in
Table 4.3. While compound 187 had the same molecular formula, and related structure
features, to isoprotostemonine 45 and protostemonine (40) there were notable
differences in their NMR spectroscopic data (Table 4.4).25
The aforementioned two
known alkaloids had very similar 13
C NMR chemical shifts, while those of 187 were
significantly different, especially those for C-3 (δ 64.4/64.3 vs δ 67.5 for 187), C-5 (δ
46.6/46.5 vs δ 49.5 for 187), C-9a (δ 58.4/58.8 vs δ 61.8 for 187) and C-18 (δ 83.3/83.9
vs δ 77.2 for 187) (Table 4.4). These chemical shift differences indicated that 187 was
diastereomer of these known alkaloids. Compound 187 showed NOESY correlation
between H-18 and H-19β; and H-19β and Me-22 (Figure 4.9, Figure 4.12 and Table
4.3), indicating the syn-relationship between H-18, H-19β and Me-22. NOESY
correlations were also observed between H-9a and H-1β and H-9; H-1β and H-2β; H-2β
and H-3; and H-9 and H-17, indicating the syn-relationship between these pairs of
protons and the relative β-configuration of H-3. Because of the relatively free rotation
around the C-3−C-18 bond in both possible diastereomeric structures for 187 [(3R, 18S,
20R)-187 or (3R, 18R, 20S)-187], it was not possible to confidently assign the relative
configurations of these two vicinal (C-3 and C-18) stereocentres from molecular
modelling and NOESY NMR studies. However, we have tentatively assign the 3R, 18S,
20R configuration to 187 since the 18S configuration is the most commonly found
absolute configuration of the Stemona alkaloids.2,12,74,75
The lack of a NOESY
correlations between the OMe group and the protons on the C-ring was consistent the E-
configuration of the C-11−C-12 alkene. These NOESY studies indicated that compound
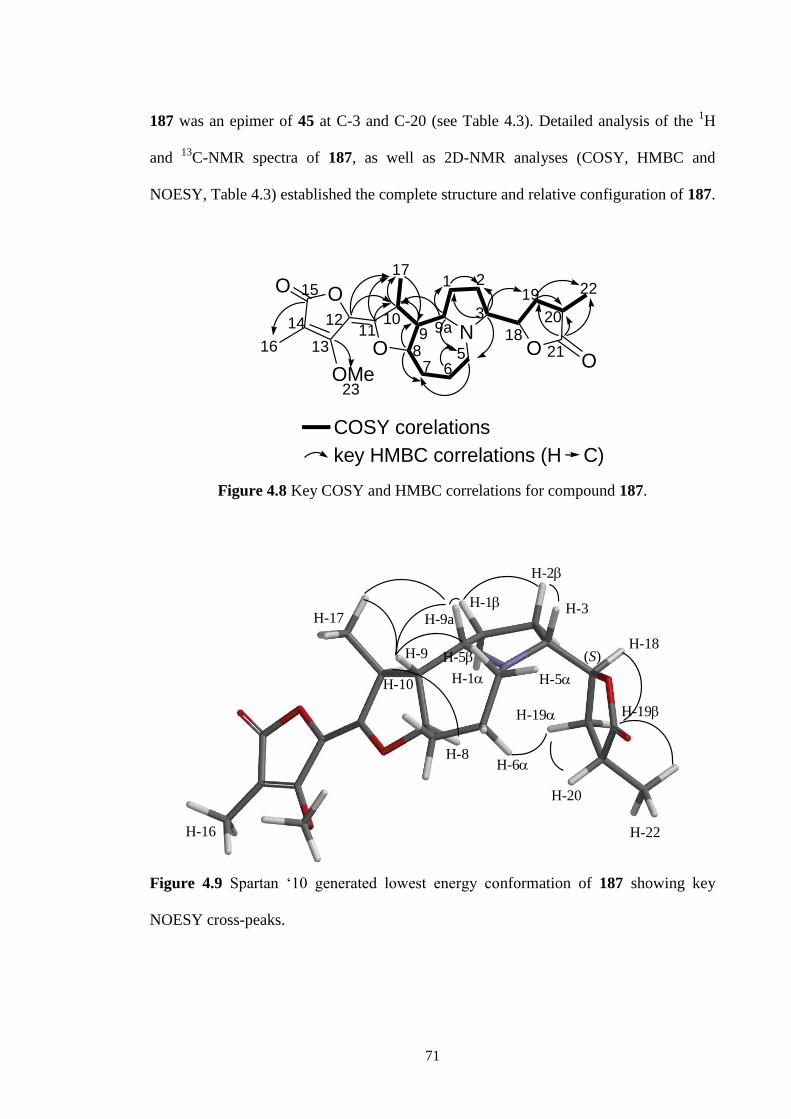
71
187 was an epimer of 45 at C-3 and C-20 (see Table 4.3). Detailed analysis of the 1H
and 13
C-NMR spectra of 187, as well as 2D-NMR analyses (COSY, HMBC and
NOESY, Table 4.3) established the complete structure and relative configuration of 187.
NO O
O
OO
OMe
3
18
1
1110
9a98
7 65
2
14
13
12
16
22
21
20
19
17
COSY corelations
key HMBC correlations (H C)
15
23
Figure 4.8 Key COSY and HMBC correlations for compound 187.
H-22
H-20
H-19
H-3
H-18
H-19
H-5
H-5
H-9
H-10
H-16
H-17
H-2
H-9a
H-1
H-1
H-8
(S)
H-6
Figure 4.9 Spartan ‘10 generated lowest energy conformation of 187 showing key
NOESY cross-peaks.
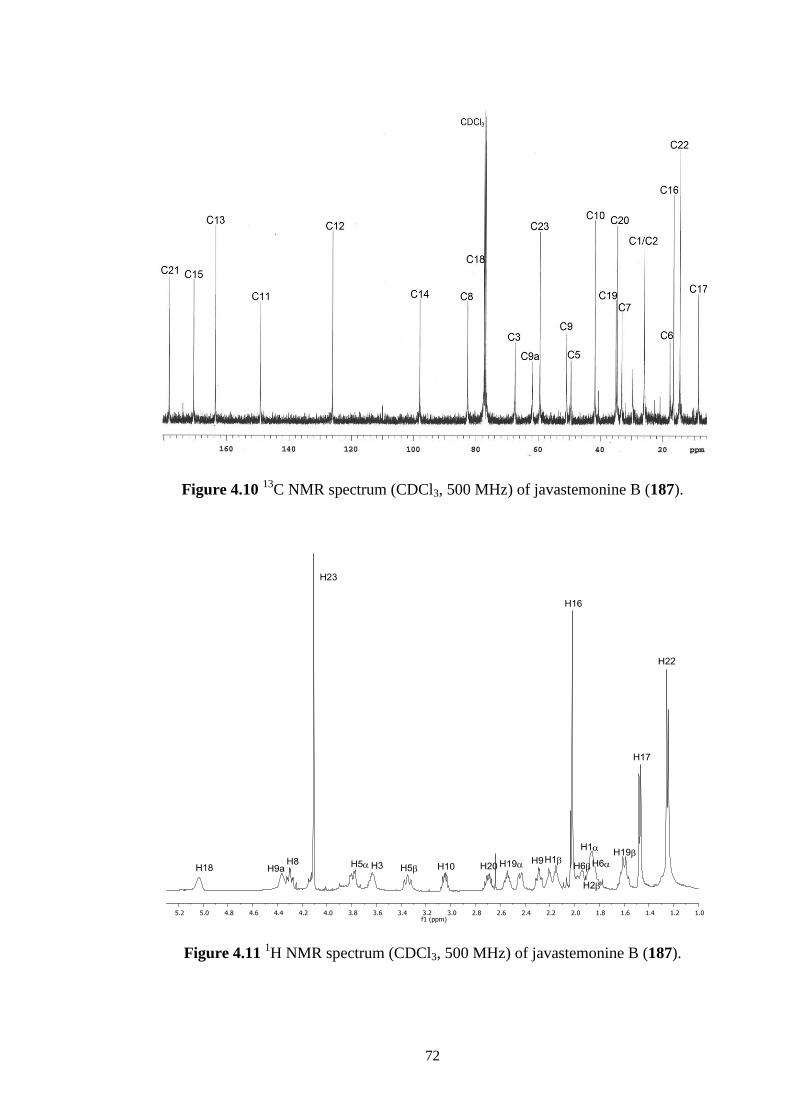
72
Figure 4.10 13
C NMR spectrum (CDCl3, 500 MHz) of javastemonine B (187).
Figure 4.11 1H NMR spectrum (CDCl3, 500 MHz) of javastemonine B (187).
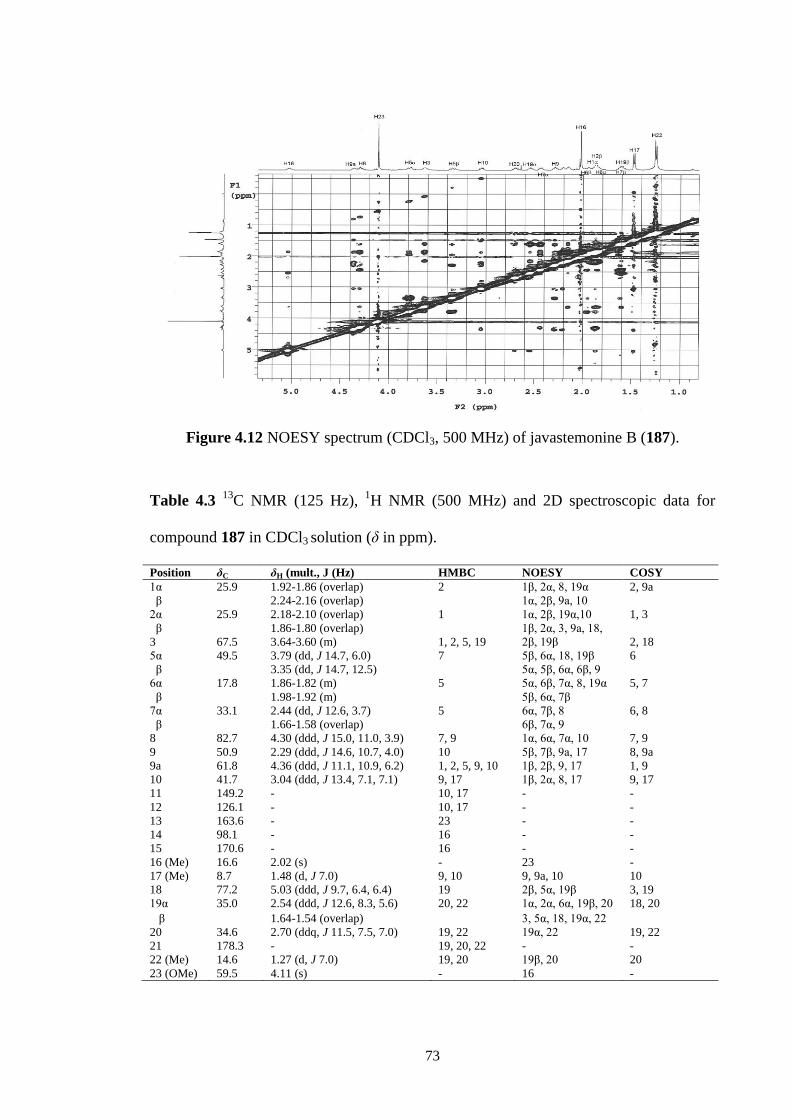
73
Figure 4.12 NOESY spectrum (CDCl3, 500 MHz) of javastemonine B (187).
Table 4.3 13
C NMR (125 Hz), 1H NMR (500 MHz) and 2D spectroscopic data for
compound 187 in CDCl3 solution (δ in ppm).
Position δC δH (mult., J (Hz) HMBC NOESY COSY
1α 25.9 1.92-1.86 (overlap) 2 1β, 2α, 8, 19α 2, 9a
β 2.24-2.16 (overlap) 1α, 2β, 9a, 10
2α 25.9 2.18-2.10 (overlap) 1 1α, 2β, 19α,10 1, 3
β 1.86-1.80 (overlap) 1β, 2α, 3, 9a, 18,
3 67.5 3.64-3.60 (m) 1, 2, 5, 19 2β, 19β 2, 18
5α 49.5 3.79 (dd, J 14.7, 6.0) 7 5β, 6α, 18, 19β 6
β 3.35 (dd, J 14.7, 12.5) 5α, 5β, 6α, 6β, 9
6α 17.8 1.86-1.82 (m) 5 5α, 6β, 7α, 8, 19α 5, 7
β 1.98-1.92 (m) 5β, 6α, 7β
7α 33.1 2.44 (dd, J 12.6, 3.7) 5 6α, 7β, 8 6, 8
β 1.66-1.58 (overlap) 6β, 7α, 9
8 82.7 4.30 (ddd, J 15.0, 11.0, 3.9) 7, 9 1α, 6α, 7α, 10 7, 9
9 50.9 2.29 (ddd, J 14.6, 10.7, 4.0) 10 5β, 7β, 9a, 17 8, 9a
9a 61.8 4.36 (ddd, J 11.1, 10.9, 6.2) 1, 2, 5, 9, 10 1β, 2β, 9, 17 1, 9
10 41.7 3.04 (ddd, J 13.4, 7.1, 7.1) 9, 17 1β, 2α, 8, 17 9, 17
11 149.2 - 10, 17 - -
12 126.1 - 10, 17 - -
13 163.6 - 23 - -
14 98.1 - 16 - -
15 170.6 - 16 - -
16 (Me) 16.6 2.02 (s) - 23 -
17 (Me) 8.7 1.48 (d, J 7.0) 9, 10 9, 9a, 10 10
18 77.2 5.03 (ddd, J 9.7, 6.4, 6.4) 19 2β, 5α, 19β 3, 19
19α 35.0 2.54 (ddd, J 12.6, 8.3, 5.6) 20, 22 1α, 2α, 6α, 19β, 20 18, 20
β 1.64-1.54 (overlap) 3, 5α, 18, 19α, 22
20 34.6 2.70 (ddq, J 11.5, 7.5, 7.0) 19, 22 19α, 22 19, 22
21 178.3 - 19, 20, 22 - -
22 (Me) 14.6 1.27 (d, J 7.0) 19, 20 19β, 20 20
23 (OMe) 59.5 4.11 (s) - 16 -
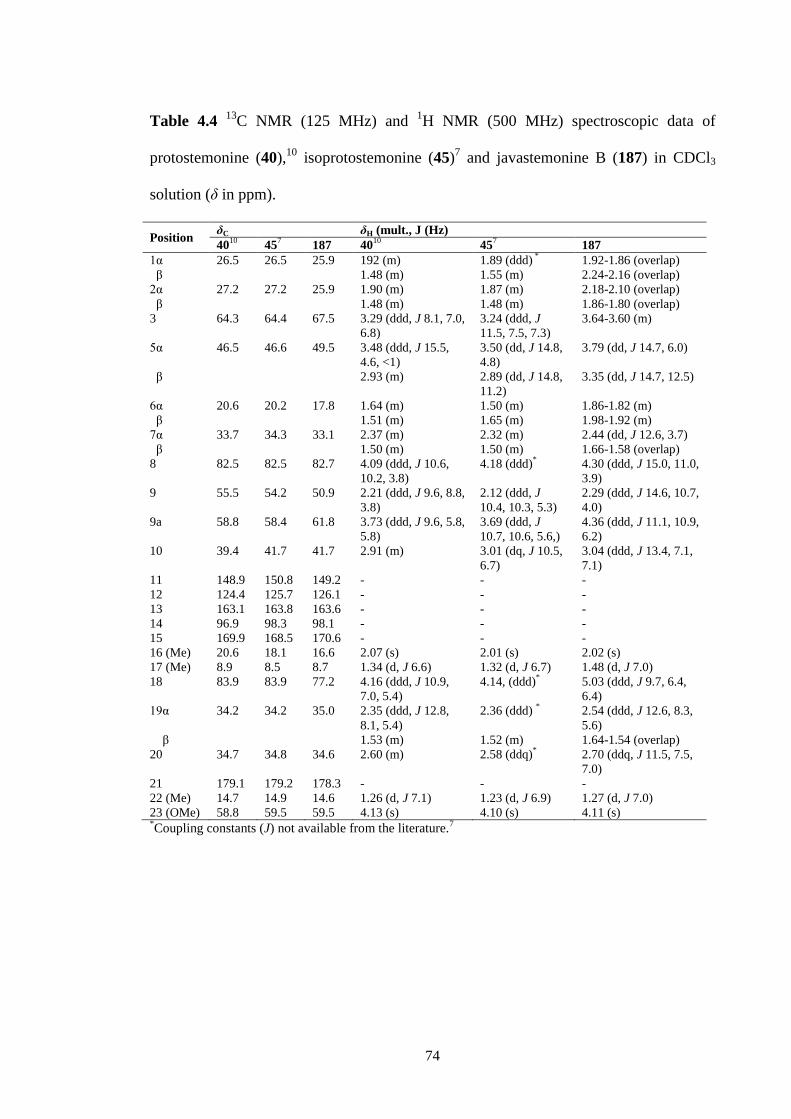
74
Table 4.4 13
C NMR (125 MHz) and 1H NMR (500 MHz) spectroscopic data of
protostemonine (40),10
isoprotostemonine (45)7 and javastemonine B (187) in CDCl3
solution (δ in ppm).
Position δC
δH (mult., J (Hz)
4010
457 187 40
10 45
7 187
1α 26.5 26.5 25.9 192 (m) 1.89 (ddd) * 1.92-1.86 (overlap)
β 1.48 (m) 1.55 (m) 2.24-2.16 (overlap)
2α 27.2 27.2 25.9 1.90 (m) 1.87 (m) 2.18-2.10 (overlap)
β 1.48 (m) 1.48 (m) 1.86-1.80 (overlap)
3 64.3 64.4 67.5 3.29 (ddd, J 8.1, 7.0,
6.8)
3.24 (ddd, J
11.5, 7.5, 7.3)
3.64-3.60 (m)
5α 46.5 46.6 49.5 3.48 (ddd, J 15.5,
4.6, <1)
3.50 (dd, J 14.8,
4.8)
3.79 (dd, J 14.7, 6.0)
β 2.93 (m) 2.89 (dd, J 14.8,
11.2)
3.35 (dd, J 14.7, 12.5)
6α 20.6 20.2 17.8 1.64 (m) 1.50 (m) 1.86-1.82 (m)
β 1.51 (m) 1.65 (m) 1.98-1.92 (m)
7α 33.7 34.3 33.1 2.37 (m) 2.32 (m) 2.44 (dd, J 12.6, 3.7)
β 1.50 (m) 1.50 (m) 1.66-1.58 (overlap)
8 82.5 82.5 82.7 4.09 (ddd, J 10.6,
10.2, 3.8)
4.18 (ddd)* 4.30 (ddd, J 15.0, 11.0,
3.9)
9 55.5 54.2 50.9 2.21 (ddd, J 9.6, 8.8,
3.8)
2.12 (ddd, J
10.4, 10.3, 5.3)
2.29 (ddd, J 14.6, 10.7,
4.0)
9a 58.8 58.4 61.8 3.73 (ddd, J 9.6, 5.8,
5.8)
3.69 (ddd, J
10.7, 10.6, 5.6,)
4.36 (ddd, J 11.1, 10.9,
6.2)
10 39.4 41.7 41.7 2.91 (m) 3.01 (dq, J 10.5,
6.7)
3.04 (ddd, J 13.4, 7.1,
7.1)
11 148.9 150.8 149.2 - - -
12 124.4 125.7 126.1 - - -
13 163.1 163.8 163.6 - - -
14 96.9 98.3 98.1 - - -
15 169.9 168.5 170.6 - - -
16 (Me) 20.6 18.1 16.6 2.07 (s) 2.01 (s) 2.02 (s)
17 (Me) 8.9 8.5 8.7 1.34 (d, J 6.6) 1.32 (d, J 6.7) 1.48 (d, J 7.0)
18 83.9 83.9 77.2 4.16 (ddd, J 10.9,
7.0, 5.4)
4.14, (ddd)* 5.03 (ddd, J 9.7, 6.4,
6.4)
19α 34.2 34.2 35.0 2.35 (ddd, J 12.8,
8.1, 5.4)
2.36 (ddd) * 2.54 (ddd, J 12.6, 8.3,
5.6)
β 1.53 (m) 1.52 (m) 1.64-1.54 (overlap)
20 34.7 34.8 34.6 2.60 (m) 2.58 (ddq)* 2.70 (ddq, J 11.5, 7.5,
7.0)
21 179.1 179.2 178.3 - - -
22 (Me) 14.7 14.9 14.6 1.26 (d, J 7.1) 1.23 (d, J 6.9) 1.27 (d, J 7.0)
23 (OMe) 58.8 59.5 59.5 4.13 (s) 4.10 (s) 4.11 (s) *Coupling constants (J) not available from the literature.
7

75
4.2.3 13-Demethoxy-11(S*),12(R*)-dihydroprotostemonine (55)
13-Demethoxy-11(S*),12(R*)-dihydroprotostemonine (55) was isolated as a
brown gum; ESIMS m/z 390 [M+H]+, consistent with molecular C22H31NO5 (MW 389).
The 1H NMR spectrum of 13-demethoxy-11(S*),12(R*)-dihydroprotostemonine is
shown in Figure 4.13. This compound was identified from a comparison of its NMR
spectroscopic data with those in the literature.22
The 1H NMR chemical shifts are in
agreement with those previously reported, as summarized in Table 4.5.
Figure 4.13 1H NMR spectrum (CDCl3, 500 MHz) of 13-demethoxy-11(S*),12(R*)-
dihydroprotostemonine (55).
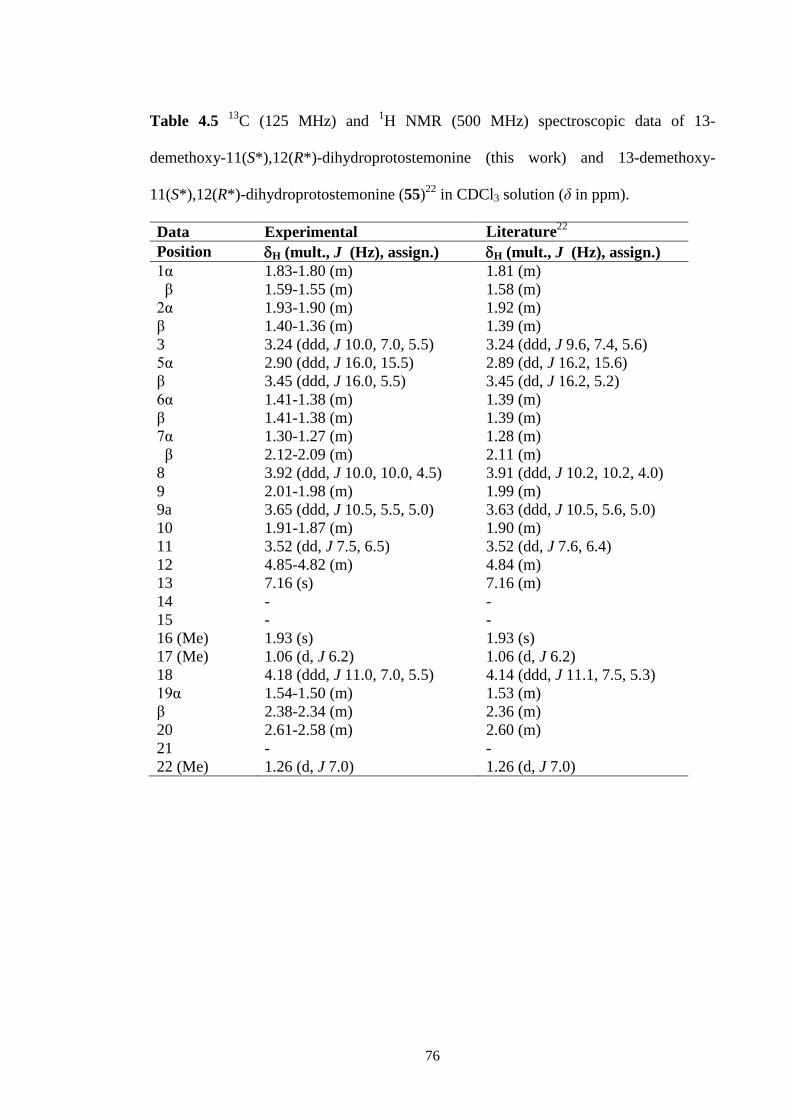
76
Table 4.5 13
C (125 MHz) and 1H NMR (500 MHz) spectroscopic data of 13-
demethoxy-11(S*),12(R*)-dihydroprotostemonine (this work) and 13-demethoxy-
11(S*),12(R*)-dihydroprotostemonine (55)22
in CDCl3 solution (δ in ppm).
Data Experimental Literature22
Position H (mult., J (Hz), assign.) H (mult., J (Hz), assign.)
1α 1.83-1.80 (m) 1.81 (m)
β 1.59-1.55 (m) 1.58 (m)
2α 1.93-1.90 (m) 1.92 (m)
β 1.40-1.36 (m) 1.39 (m)
3 3.24 (ddd, J 10.0, 7.0, 5.5) 3.24 (ddd, J 9.6, 7.4, 5.6)
5α 2.90 (ddd, J 16.0, 15.5) 2.89 (dd, J 16.2, 15.6)
β 3.45 (ddd, J 16.0, 5.5) 3.45 (dd, J 16.2, 5.2)
6α 1.41-1.38 (m) 1.39 (m)
β 1.41-1.38 (m) 1.39 (m)
7α 1.30-1.27 (m) 1.28 (m)
β 2.12-2.09 (m) 2.11 (m)
8 3.92 (ddd, J 10.0, 10.0, 4.5) 3.91 (ddd, J 10.2, 10.2, 4.0)
9 2.01-1.98 (m) 1.99 (m)
9a 3.65 (ddd, J 10.5, 5.5, 5.0) 3.63 (ddd, J 10.5, 5.6, 5.0)
10 1.91-1.87 (m) 1.90 (m)
11 3.52 (dd, J 7.5, 6.5) 3.52 (dd, J 7.6, 6.4)
12 4.85-4.82 (m) 4.84 (m)
13 7.16 (s) 7.16 (m)
14 - -
15 - -
16 (Me) 1.93 (s) 1.93 (s)
17 (Me) 1.06 (d, J 6.2) 1.06 (d, J 6.2)
18 4.18 (ddd, J 11.0, 7.0, 5.5) 4.14 (ddd, J 11.1, 7.5, 5.3)
19α 1.54-1.50 (m) 1.53 (m)
β 2.38-2.34 (m) 2.36 (m)
20 2.61-2.58 (m) 2.60 (m)
21 - -
22 (Me) 1.26 (d, J 7.0) 1.26 (d, J 7.0)
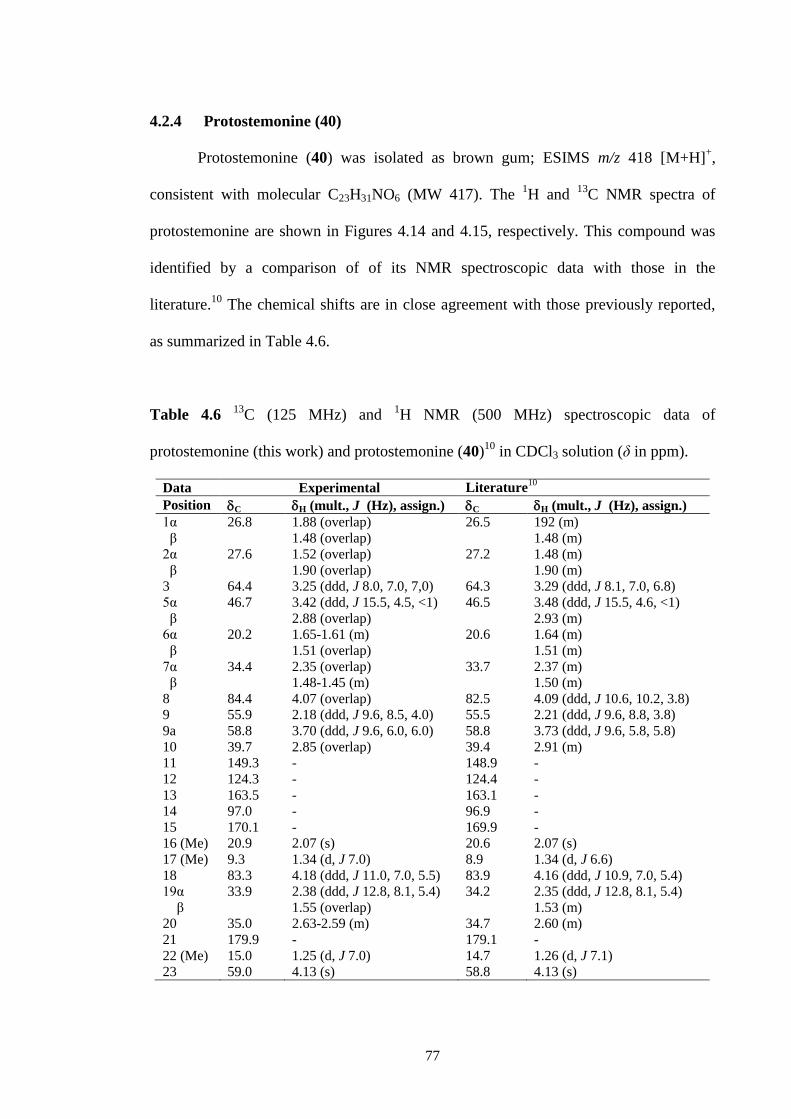
77
4.2.4 Protostemonine (40)
Protostemonine (40) was isolated as brown gum; ESIMS m/z 418 [M+H]+,
consistent with molecular C23H31NO6 (MW 417). The 1H and
13C NMR spectra of
protostemonine are shown in Figures 4.14 and 4.15, respectively. This compound was
identified by a comparison of of its NMR spectroscopic data with those in the
literature.10
The chemical shifts are in close agreement with those previously reported,
as summarized in Table 4.6.
Table 4.6 13
C (125 MHz) and 1H NMR (500 MHz) spectroscopic data of
protostemonine (this work) and protostemonine (40)10
in CDCl3 solution (δ in ppm).
Data Experimental Literature10
Position C H (mult., J (Hz), assign.) C H (mult., J (Hz), assign.)
1α 26.8 1.88 (overlap) 26.5 192 (m)
β 1.48 (overlap) 1.48 (m)
2α 27.6 1.52 (overlap) 27.2 1.48 (m)
β 1.90 (overlap) 1.90 (m)
3 64.4 3.25 (ddd, J 8.0, 7.0, 7,0) 64.3 3.29 (ddd, J 8.1, 7.0, 6.8)
5α 46.7 3.42 (ddd, J 15.5, 4.5, <1) 46.5 3.48 (ddd, J 15.5, 4.6, <1)
β 2.88 (overlap) 2.93 (m)
6α 20.2 1.65-1.61 (m) 20.6 1.64 (m)
β 1.51 (overlap) 1.51 (m)
7α 34.4 2.35 (overlap) 33.7 2.37 (m)
β 1.48-1.45 (m) 1.50 (m)
8 84.4 4.07 (overlap) 82.5 4.09 (ddd, J 10.6, 10.2, 3.8)
9 55.9 2.18 (ddd, J 9.6, 8.5, 4.0) 55.5 2.21 (ddd, J 9.6, 8.8, 3.8)
9a 58.8 3.70 (ddd, J 9.6, 6.0, 6.0) 58.8 3.73 (ddd, J 9.6, 5.8, 5.8)
10 39.7 2.85 (overlap) 39.4 2.91 (m)
11 149.3 - 148.9 -
12 124.3 - 124.4 -
13 163.5 - 163.1 -
14 97.0 - 96.9 -
15 170.1 - 169.9 -
16 (Me) 20.9 2.07 (s) 20.6 2.07 (s)
17 (Me) 9.3 1.34 (d, J 7.0) 8.9 1.34 (d, J 6.6)
18 83.3 4.18 (ddd, J 11.0, 7.0, 5.5) 83.9 4.16 (ddd, J 10.9, 7.0, 5.4)
19α 33.9 2.38 (ddd, J 12.8, 8.1, 5.4) 34.2 2.35 (ddd, J 12.8, 8.1, 5.4)
β 1.55 (overlap) 1.53 (m)
20 35.0 2.63-2.59 (m) 34.7 2.60 (m)
21 179.9 - 179.1 -
22 (Me) 15.0 1.25 (d, J 7.0) 14.7 1.26 (d, J 7.1)
23 59.0 4.13 (s) 58.8 4.13 (s)
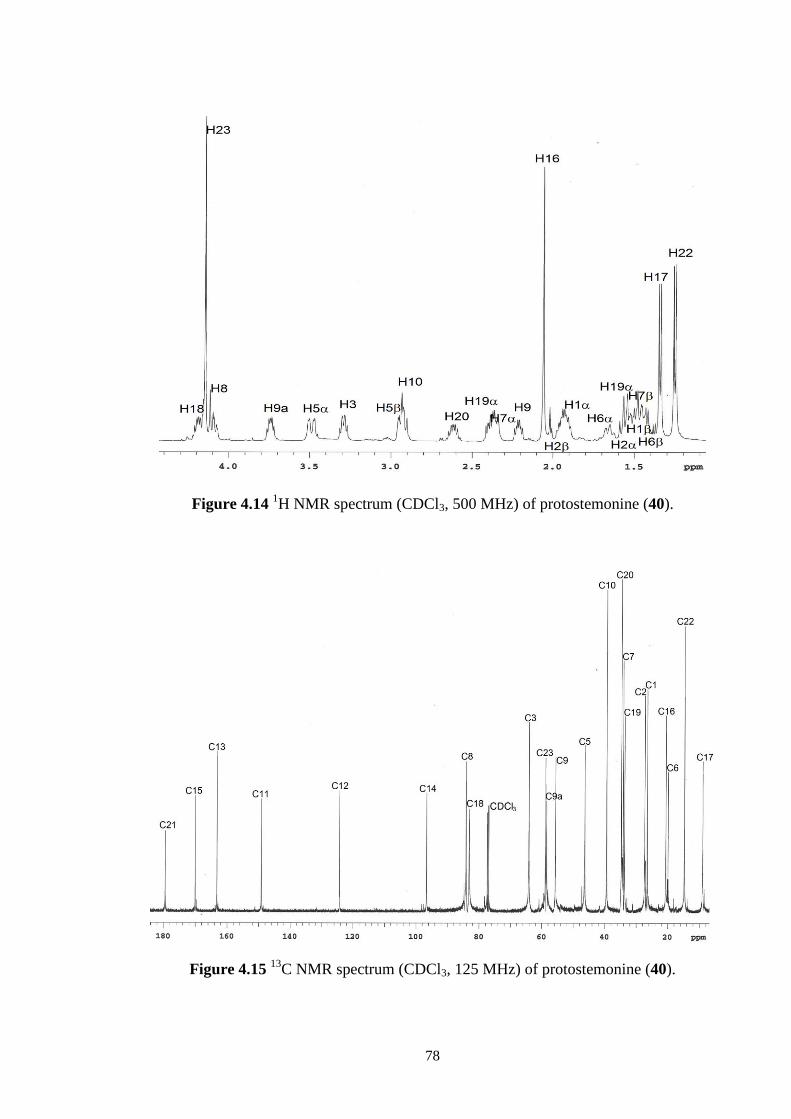
78
Figure 4.14 1H NMR spectrum (CDCl3, 500 MHz) of protostemonine (40).
Figure 4.15 13
C NMR spectrum (CDCl3, 125 MHz) of protostemonine (40).
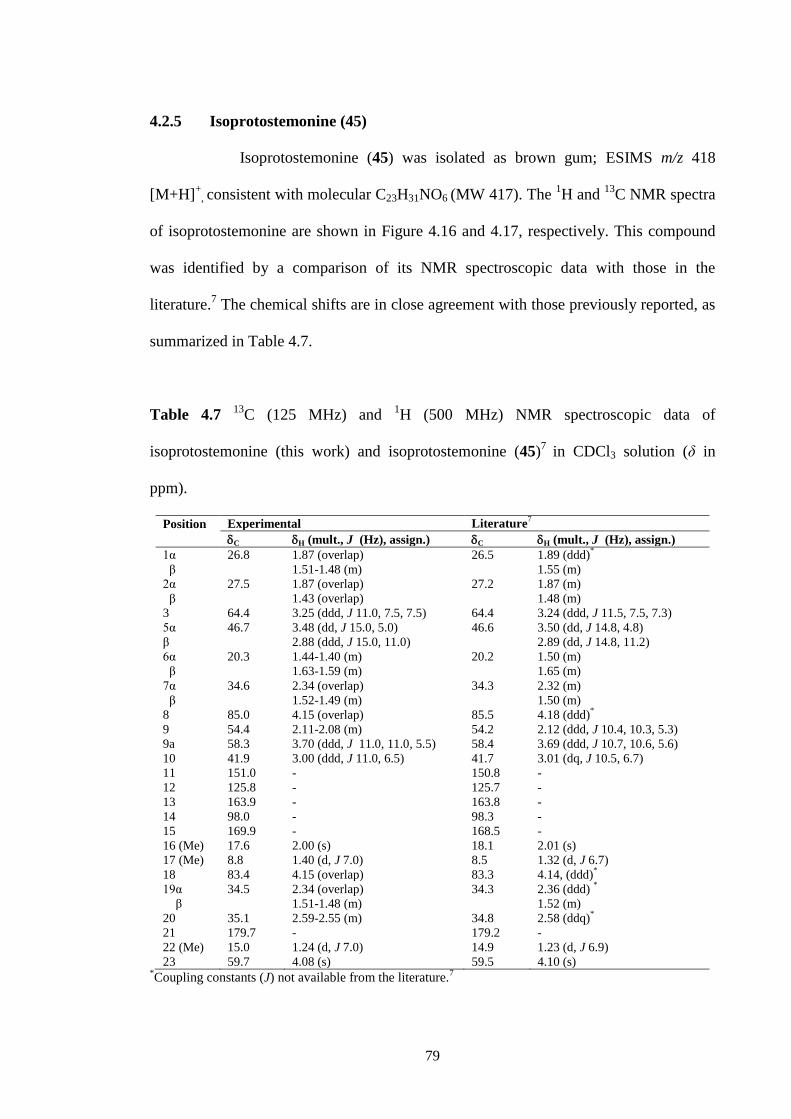
79
4.2.5 Isoprotostemonine (45)
Isoprotostemonine (45) was isolated as brown gum; ESIMS m/z 418
[M+H]+
, consistent with molecular C23H31NO6 (MW 417). The 1H and
13C NMR spectra
of isoprotostemonine are shown in Figure 4.16 and 4.17, respectively. This compound
was identified by a comparison of its NMR spectroscopic data with those in the
literature.7 The chemical shifts are in close agreement with those previously reported, as
summarized in Table 4.7.
Table 4.7 13
C (125 MHz) and 1H (500 MHz) NMR spectroscopic data of
isoprotostemonine (this work) and isoprotostemonine (45)7
in CDCl3 solution (δ in
ppm).
Position Experimental Literature7
C H (mult., J (Hz), assign.) C H (mult., J (Hz), assign.)
1α 26.8 1.87 (overlap) 26.5 1.89 (ddd)*
β 1.51-1.48 (m) 1.55 (m)
2α 27.5 1.87 (overlap) 27.2 1.87 (m)
β 1.43 (overlap) 1.48 (m)
3 64.4 3.25 (ddd, J 11.0, 7.5, 7.5) 64.4 3.24 (ddd, J 11.5, 7.5, 7.3)
5α 46.7 3.48 (dd, J 15.0, 5.0) 46.6 3.50 (dd, J 14.8, 4.8)
β 2.88 (ddd, J 15.0, 11.0) 2.89 (dd, J 14.8, 11.2)
6α 20.3 1.44-1.40 (m) 20.2 1.50 (m)
β 1.63-1.59 (m) 1.65 (m)
7α 34.6 2.34 (overlap) 34.3 2.32 (m)
β 1.52-1.49 (m) 1.50 (m)
8 85.0 4.15 (overlap) 85.5 4.18 (ddd)*
9 54.4 2.11-2.08 (m) 54.2 2.12 (ddd, J 10.4, 10.3, 5.3)
9a 58.3 3.70 (ddd, J 11.0, 11.0, 5.5) 58.4 3.69 (ddd, J 10.7, 10.6, 5.6)
10 41.9 3.00 (ddd, J 11.0, 6.5) 41.7 3.01 (dq, J 10.5, 6.7)
11 151.0 - 150.8 -
12 125.8 - 125.7 -
13 163.9 - 163.8 -
14 98.0 - 98.3 -
15 169.9 - 168.5 -
16 (Me) 17.6 2.00 (s) 18.1 2.01 (s)
17 (Me) 8.8 1.40 (d, J 7.0) 8.5 1.32 (d, J 6.7)
18 83.4 4.15 (overlap) 83.3 4.14, (ddd)*
19α 34.5 2.34 (overlap) 34.3 2.36 (ddd) *
β 1.51-1.48 (m) 1.52 (m)
20 35.1 2.59-2.55 (m) 34.8 2.58 (ddq)*
21 179.7 - 179.2 -
22 (Me) 15.0 1.24 (d, J 7.0) 14.9 1.23 (d, J 6.9)
23 59.7 4.08 (s) 59.5 4.10 (s) *Coupling constants (J) not available from the literature.
7
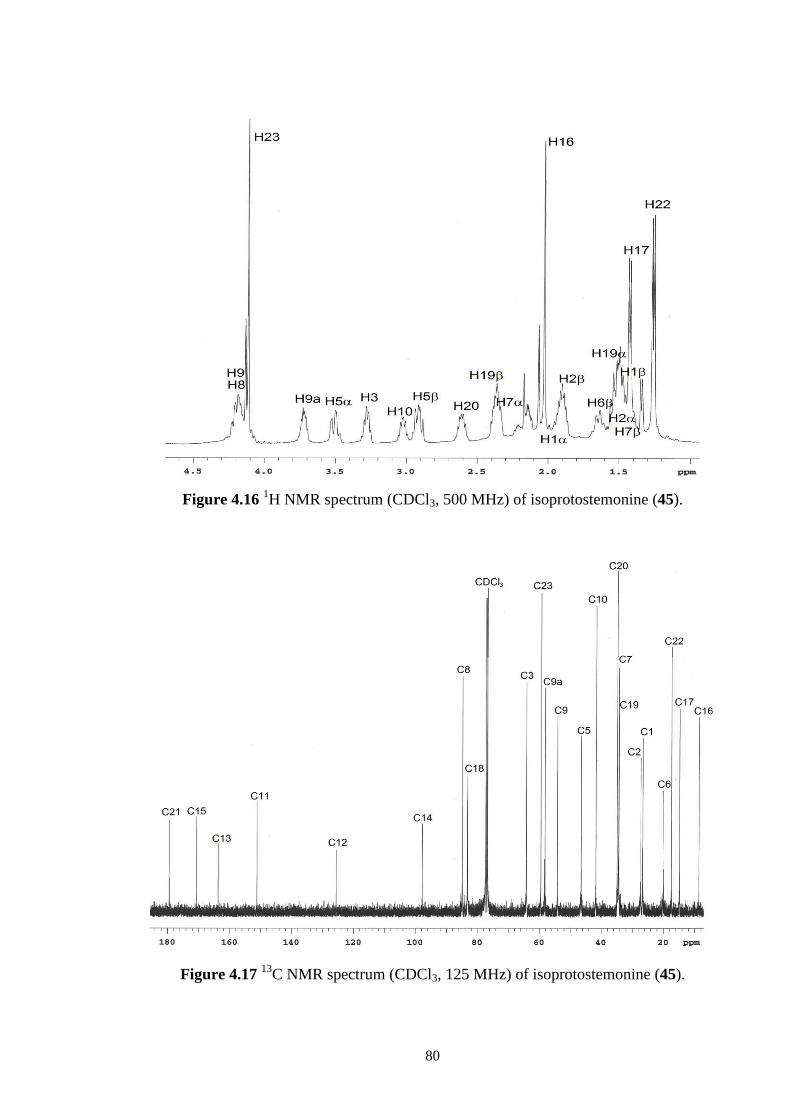
80
Figure 4.16 1H NMR spectrum (CDCl3, 500 MHz) of isoprotostemonine (45).
Figure 4.17 13
C NMR spectrum (CDCl3, 125 MHz) of isoprotostemonine (45).
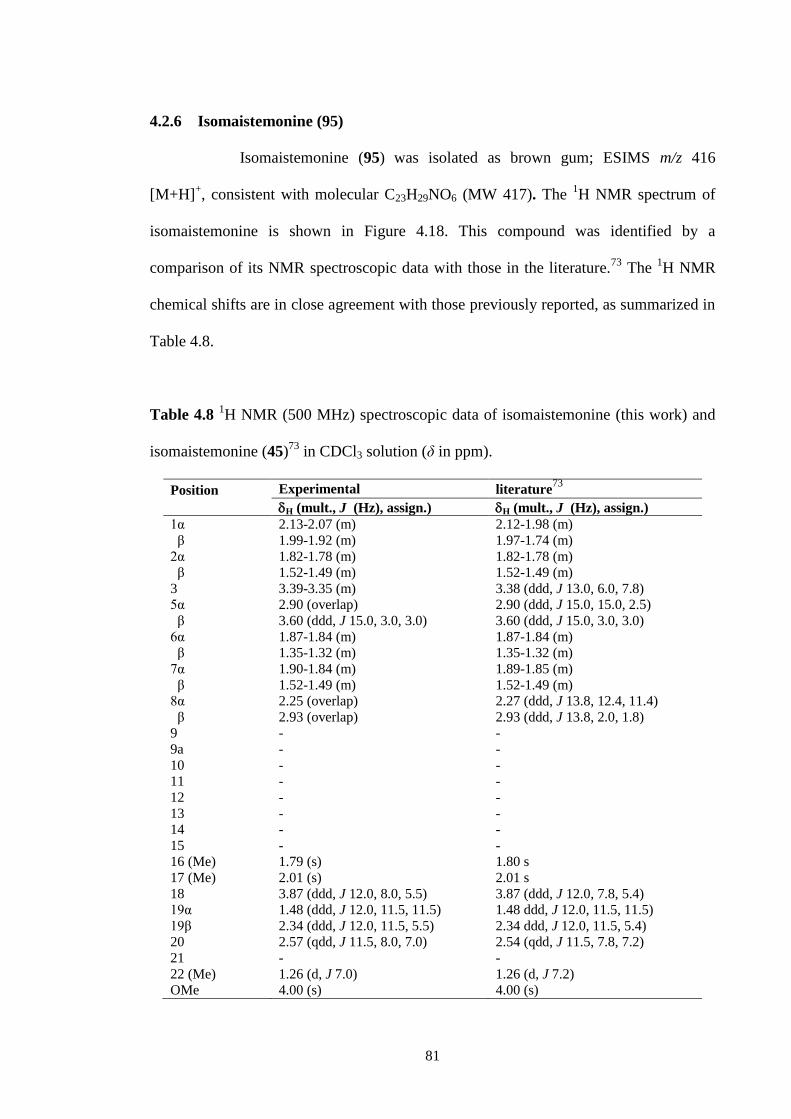
81
4.2.6 Isomaistemonine (95)
Isomaistemonine (95) was isolated as brown gum; ESIMS m/z 416
[M+H]+, consistent with molecular C23H29NO6 (MW 417). The
1H NMR spectrum of
isomaistemonine is shown in Figure 4.18. This compound was identified by a
comparison of its NMR spectroscopic data with those in the literature.73
The 1H NMR
chemical shifts are in close agreement with those previously reported, as summarized in
Table 4.8.
Table 4.8 1H NMR (500 MHz) spectroscopic data of isomaistemonine (this work) and
isomaistemonine (45)73
in CDCl3 solution (δ in ppm).
Position Experimental literature73
H (mult., J (Hz), assign.) H (mult., J (Hz), assign.)
1α 2.13-2.07 (m) 2.12-1.98 (m)
β 1.99-1.92 (m) 1.97-1.74 (m)
2α 1.82-1.78 (m) 1.82-1.78 (m)
β 1.52-1.49 (m) 1.52-1.49 (m)
3 3.39-3.35 (m) 3.38 (ddd, J 13.0, 6.0, 7.8)
5α 2.90 (overlap) 2.90 (ddd, J 15.0, 15.0, 2.5)
β 3.60 (ddd, J 15.0, 3.0, 3.0) 3.60 (ddd, J 15.0, 3.0, 3.0)
6α 1.87-1.84 (m) 1.87-1.84 (m)
β 1.35-1.32 (m) 1.35-1.32 (m)
7α 1.90-1.84 (m) 1.89-1.85 (m)
β 1.52-1.49 (m) 1.52-1.49 (m)
8α 2.25 (overlap) 2.27 (ddd, J 13.8, 12.4, 11.4)
β 2.93 (overlap) 2.93 (ddd, J 13.8, 2.0, 1.8)
9 - -
9a - -
10 - -
11 - -
12 - -
13 - -
14 - -
15 - -
16 (Me) 1.79 (s) 1.80 s
17 (Me) 2.01 (s) 2.01 s
18 3.87 (ddd, J 12.0, 8.0, 5.5) 3.87 (ddd, J 12.0, 7.8, 5.4)
19α 1.48 (ddd, J 12.0, 11.5, 11.5) 1.48 ddd, J 12.0, 11.5, 11.5)
19β 2.34 (ddd, J 12.0, 11.5, 5.5) 2.34 ddd, J 12.0, 11.5, 5.4)
20 2.57 (qdd, J 11.5, 8.0, 7.0) 2.54 (qdd, J 11.5, 7.8, 7.2)
21 - -
22 (Me) 1.26 (d, J 7.0) 1.26 (d, J 7.2) OMe 4.00 (s) 4.00 (s)
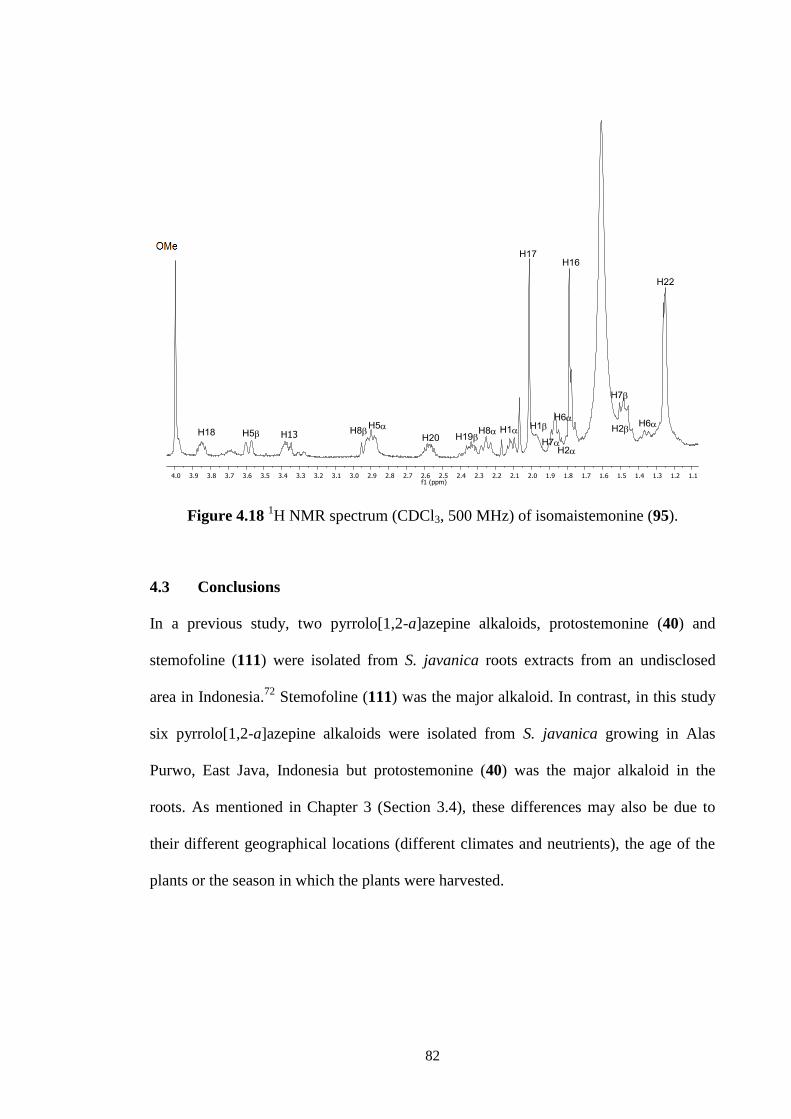
82
Figure 4.18 1H NMR spectrum (CDCl3, 500 MHz) of isomaistemonine (95).
4.3 Conclusions
In a previous study, two pyrrolo[1,2-a]azepine alkaloids, protostemonine (40) and
stemofoline (111) were isolated from S. javanica roots extracts from an undisclosed
area in Indonesia.72
Stemofoline (111) was the major alkaloid. In contrast, in this study
six pyrrolo[1,2-a]azepine alkaloids were isolated from S. javanica growing in Alas
Purwo, East Java, Indonesia but protostemonine (40) was the major alkaloid in the
roots. As mentioned in Chapter 3 (Section 3.4), these differences may also be due to
their different geographical locations (different climates and neutrients), the age of the
plants or the season in which the plants were harvested.
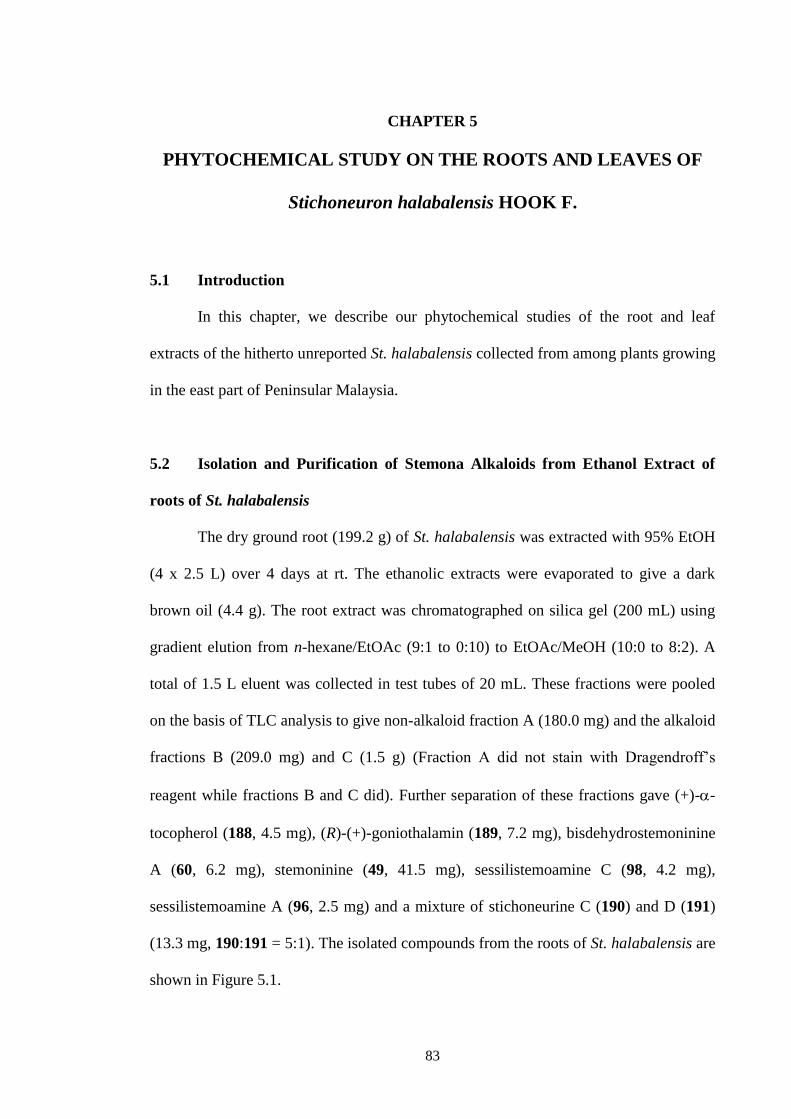
83
CHAPTER 5
PHYTOCHEMICAL STUDY ON THE ROOTS AND LEAVES OF
Stichoneuron halabalensis HOOK F.
5.1 Introduction
In this chapter, we describe our phytochemical studies of the root and leaf
extracts of the hitherto unreported St. halabalensis collected from among plants growing
in the east part of Peninsular Malaysia.
5.2 Isolation and Purification of Stemona Alkaloids from Ethanol Extract of
roots of St. halabalensis
The dry ground root (199.2 g) of St. halabalensis was extracted with 95% EtOH
(4 x 2.5 L) over 4 days at rt. The ethanolic extracts were evaporated to give a dark
brown oil (4.4 g). The root extract was chromatographed on silica gel (200 mL) using
gradient elution from n-hexane/EtOAc (9:1 to 0:10) to EtOAc/MeOH (10:0 to 8:2). A
total of 1.5 L eluent was collected in test tubes of 20 mL. These fractions were pooled
on the basis of TLC analysis to give non-alkaloid fraction A (180.0 mg) and the alkaloid
fractions B (209.0 mg) and C (1.5 g) (Fraction A did not stain with Dragendroff’s
reagent while fractions B and C did). Further separation of these fractions gave (+)--
tocopherol (188, 4.5 mg), (R)-(+)-goniothalamin (189, 7.2 mg), bisdehydrostemoninine
A (60, 6.2 mg), stemoninine (49, 41.5 mg), sessilistemoamine C (98, 4.2 mg),
sessilistemoamine A (96, 2.5 mg) and a mixture of stichoneurine C (190) and D (191)
(13.3 mg, 190:191 = 5:1). The isolated compounds from the roots of St. halabalensis are
shown in Figure 5.1.
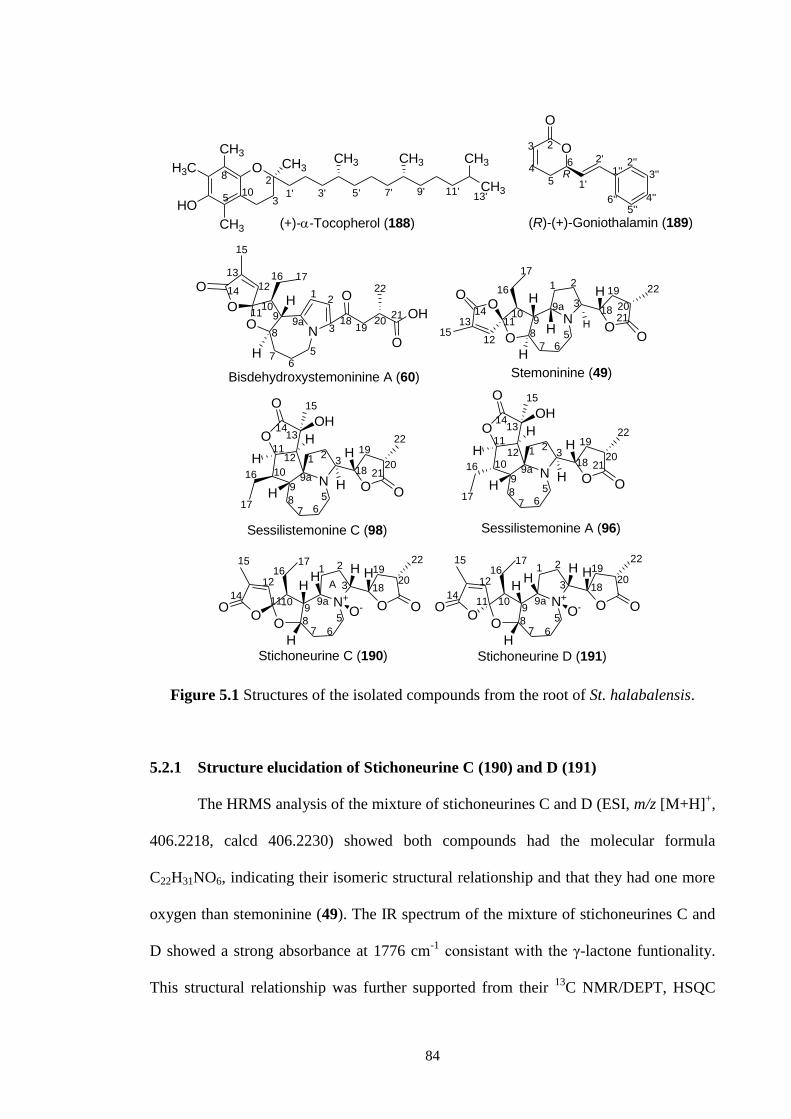
84
N+O O
HHH
OO-
H
H
10
1
1820
19
7 6
5
3
2
8
99a
1617 22
OO
12
14
15
A
Stichoneurine D (191)Stichoneurine C (190)
11
O
CH3
CH3CH3CH3
CH3
H3C
HO
CH3
CH3
2
35
8
10 1' 3' 5' 7' 9' 11'13'
O
O
23
4
5
6
1'
2'1''
2''
5''6''
3''
4''
R
(+)--Tocopherol (188) (R)-(+)-Goniothalamin (189)
Stemoninine (49)Bisdehydroxystemoninine A (60)
Sessilistemonine A (96)Sessilistemonine C (98)
N+O O
HHH
OO-
H
H
10
1
1820
19
7 6
5
3
2
8
99a
1617 22
OO
12
14
15
11
N
O
OO H
H
H
O
H
H
O
1 2
3
567
8
9a
910
11
12
1314
15
16
17
18
19
2021
22
NO
HO
O
H
OH
O
O
12
3
56
7
8
910
11
12
13
14
15
16 17
1819
2021
22
9a
N O O
H
HH
HO
O
OH
1
9a9
10
1112H 2
3
5
678
1314
15
16
17
18
19
2021
22
N O O
H
HH
HO
O
OH
1
9a9
10
1112H 2
3
5
678
1314
15
16
17
18
19
2021
22
Figure 5.1 Structures of the isolated compounds from the root of St. halabalensis.
5.2.1 Structure elucidation of Stichoneurine C (190) and D (191)
The HRMS analysis of the mixture of stichoneurines C and D (ESI, m/z [M+H]+,
406.2218, calcd 406.2230) showed both compounds had the molecular formula
C22H31NO6, indicating their isomeric structural relationship and that they had one more
oxygen than stemoninine (49). The IR spectrum of the mixture of stichoneurines C and
D showed a strong absorbance at 1776 cm-1
consistant with the γ-lactone funtionality.
This structural relationship was further supported from their 13
C NMR/DEPT, HSQC
85
and HMBC spectra, which indicated that stemoninine (49) and stichoneurine C and D
(190-191) had the same number of carbons and carbon types, with the same relative
connectivities and same ring features.
In the 13
C NMR spectrum (Figure 5.3) of the mixture of stichoneurine C (190)
and D (191), a complete twofold set of signals with an intensity ratio of approximately
5:1 was observed. In the 1H NMR spectrum (Figure 5.4), the majority of resonances for
stichoneurine D (191) could also be observed, with eight overlapping with those of
stichoneurine C (190). Due to the clear intensity differences of the 13
C NMR resonances
for stichoneurine C (190) and D (191) (Figure 5.4) and by the use of 2D methods
(COSY, HMQC, HMBC, and NOESY) it was possible to assign all 13
C NMR
resonances of both isomers. Both were characterized by the presence of three methyl
groups, seven methylenes, seven methines, two olefinic and three quaternary carbons.
The COSY correlations in the COSY spectrum of stichoneurine C (190) and D (191)
indicated the spin system H-1−H-2−H-3−H-18−H-19−H-20−H-22, typical of the
pyrrolidine ring of the Stemona alkaloids, with a -lactone substituent at C-3 (Figure
5.2). COSY correlations were also observed between the vicinal pairs of contiguous
protons along the C-5−C-10 backbone, with vicinal correlations also seen between H-10
and H-16; H-16 and H-17 (Figure 5.2). The full 1H and
13C NMR spectral assignments
for stichoneurine C and D (190-191), based on extensive NOESY/ROESY, HSQC and
HMBC experiments, are shown in Table 5.1 and Table 5.2.
For stichoneurine C (190), the 13
C NMR signals included three methyl [δ 10.7
(C-15), 13.0 (C-17) and 14.7 (C-22)], seven methylene [δ 67.7 (C-5), 34.9 (C-1), 24.1
(C-2), 21.3 (C-6), 34.9 (C-7), 35.4 (C-19) and 19.5 (C-16)], seven methine [δ 75.5 (C-
3), 85.8 (C-8), 48.7 (C-9), 78.8 (C-9a), 51.5 (C-10), 73.5 (C-18) and 35.3 (C-20)], two
86
olefinic [δ 143.7 (C-12) and 134.7 (C-13)] and three quaternary carbons [δ 112.4 (C-
11), 171.1 (C-14) and 178.3 (C-21)]. The 1H NMR resonances of stichoneurine C at δ
0.85 (t, J = 7.0 Hz), 1.27 (d, J = 7.0 Hz) and 1.95 (d, J = 1.3 Hz) were assigned to the
methyl groups C-17, C-22 and C-15, respectively. The olefinic proton resonance at δ
6.61 (apparent d, J = 1.3 Hz) was assigned to H-12. The 13
C NMR signals at δ 178.3 and
171.1 indicated two lactone carbonyls, while the signal at δ 112.4 (quartenary carbon)
indicated a ketal group such as that present in stemoninine (49).76
The analysis of the
1D and 2D NMR spectra of stichoneurine C (190) led to the full assignment of the
carbon and proton signals (Table 5.1). The signals resonating at δ 178.3 (C-21) and
171.1 (C-14) showed correlations with those of H-19 and H-22, and with H-12, and H-
15, respectively in the HMBC spectrum. The quaternary carbon signal at δ 112.4 (C-11)
showed correlations with H-8, H-10, H-12 and H-16, thus indicating the position of the
ketal moiety at C-11 and the ethyl group at C-10. Key HMBC correlations for
stichoneurine C (190) are shown in Figure 5.2, while full NMR spectroscopic details are
provided in Table 5.1.
While for stichoneurine D (191), the 13
C NMR spectrum (Figure 5.3) showed 22
carbon signals including three methyl [δ 10.8 (C-15), 12.2 (C-17) and 14.7 (C-22)], seven
methylene [δ 68.1 (C-5), 33.2 (C-1), 24.1 (C-2), 21.0 (C-6), 33.5 (C-7), 35.4 (C-19) and
19.5 (C-16)], seven methine [δ 75.5 (C-3), 86.8 (C-8), 50.7 (C-9), 78.7 (C-9a), 53.0 (C-
10), 73.3 (C-18) and 35.2 (C-20)], two olefinic [δ 142.5 (C-12) and 134.1 (C-13)] and
three quaternary carbons [δ 113.7 (C-11), 171.3 (C-14) and 178.3 (C-21)]. The 1H NMR
resonances of stichoneurine D at δ 0.95 (t, J = 7.5 Hz), 1.27 (overlap) and 1.95 (overlap)
were assigned to the methyl groups C-17, C-22 and C-15, respectively. The olefinic
proton resonance at δ 6.78 (apparent d, J = 1.3 Hz) was assigned to H-12. Similar to
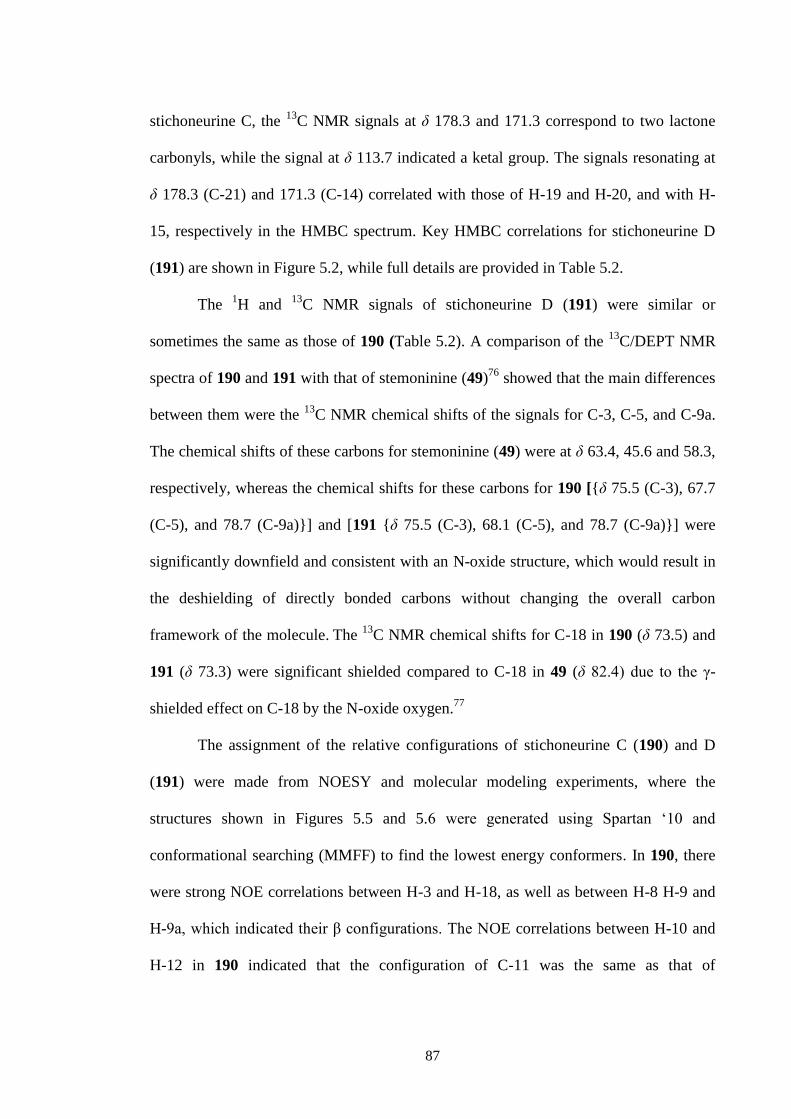
87
stichoneurine C, the 13
C NMR signals at δ 178.3 and 171.3 correspond to two lactone
carbonyls, while the signal at δ 113.7 indicated a ketal group. The signals resonating at
δ 178.3 (C-21) and 171.3 (C-14) correlated with those of H-19 and H-20, and with H-
15, respectively in the HMBC spectrum. Key HMBC correlations for stichoneurine D
(191) are shown in Figure 5.2, while full details are provided in Table 5.2.
The 1H and
13C NMR signals of stichoneurine D (191) were similar or
sometimes the same as those of 190 (Table 5.2). A comparison of the 13
C/DEPT NMR
spectra of 190 and 191 with that of stemoninine (49)76
showed that the main differences
between them were the 13
C NMR chemical shifts of the signals for C-3, C-5, and C-9a.
The chemical shifts of these carbons for stemoninine (49) were at δ 63.4, 45.6 and 58.3,
respectively, whereas the chemical shifts for these carbons for 190 [{δ 75.5 (C-3), 67.7
(C-5), and 78.7 (C-9a)}] and [191 {δ 75.5 (C-3), 68.1 (C-5), and 78.7 (C-9a)}] were
significantly downfield and consistent with an N-oxide structure, which would result in
the deshielding of directly bonded carbons without changing the overall carbon
framework of the molecule. The
13C NMR chemical shifts for C-18 in 190 (δ 73.5) and
191 (δ 73.3) were significant shielded compared to C-18 in 49 (δ 82.4) due to the γ-
shielded effect on C-18 by the N-oxide oxygen.77
The assignment of the relative configurations of stichoneurine C (190) and D
(191) were made from NOESY and molecular modeling experiments, where the
structures shown in Figures 5.5 and 5.6 were generated using Spartan ‘10 and
conformational searching (MMFF) to find the lowest energy conformers. In 190, there
were strong NOE correlations between H-3 and H-18, as well as between H-8 H-9 and
H-9a, which indicated their β configurations. The NOE correlations between H-10 and
H-12 in 190 indicated that the configuration of C-11 was the same as that of

88
stemoninine (49). These correlations indicated that stichoneurine C (190) was a
diastereomer of stemoninine (49) at C-3 and C-8. Most of these NOE correlations were
also observed in the NOESY spectrum of stichoneurine D (191). The difference was
that the NOESY correlation between H-10 and H-12 was now absent and a correlation
between H-12 and H-16 was now observed (Figure 5.7).
N+O O
OO-
OO
COSY corelations
key HMBC correlations (H C)
12
3
567
89
9a10
11
1213
14
16
17
18
1920
2215
Figure 5.2 Key COSY and HMBC correlations for stichoneurine C and D (190-191).
Figure 5.3 13
C NMR spectrum (CDCl3, 125 MHz) of stichoneurine C and D (190-191).
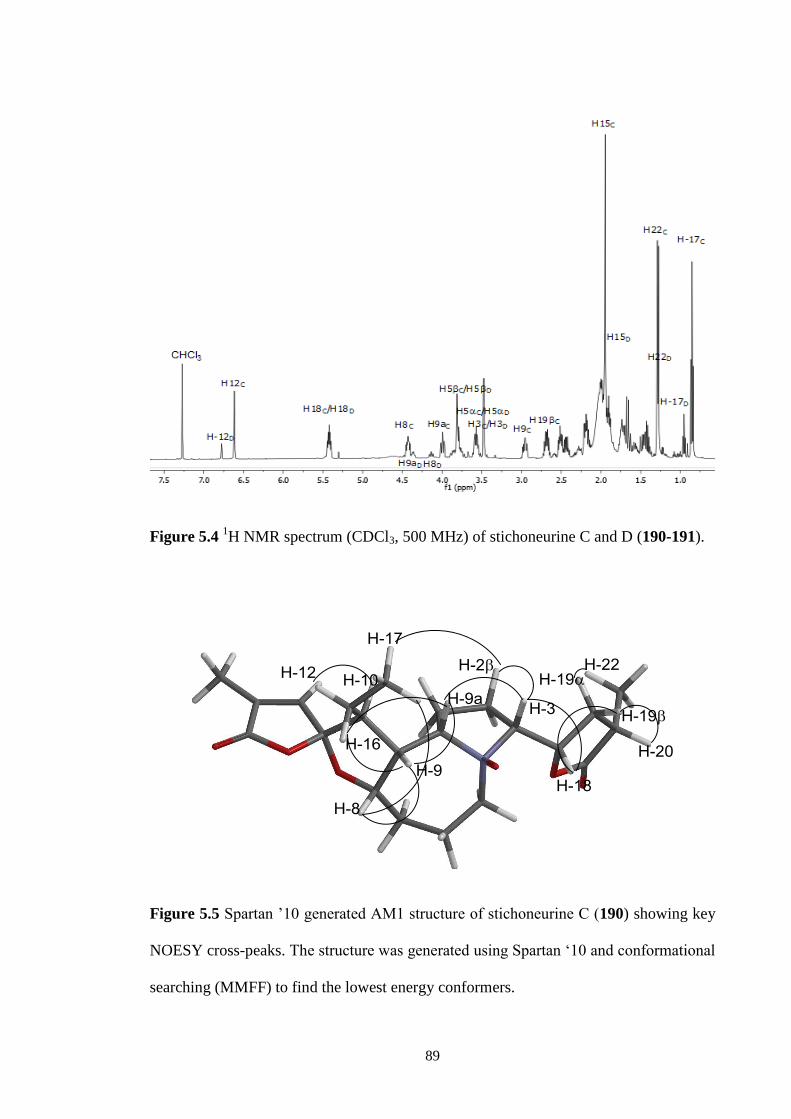
89
Figure 5.4 1H NMR spectrum (CDCl3, 500 MHz) of stichoneurine C and D (190-191).
Figure 5.5 Spartan ’10 generated AM1 structure of stichoneurine C (190) showing key
NOESY cross-peaks. The structure was generated using Spartan ‘10 and conformational
searching (MMFF) to find the lowest energy conformers.
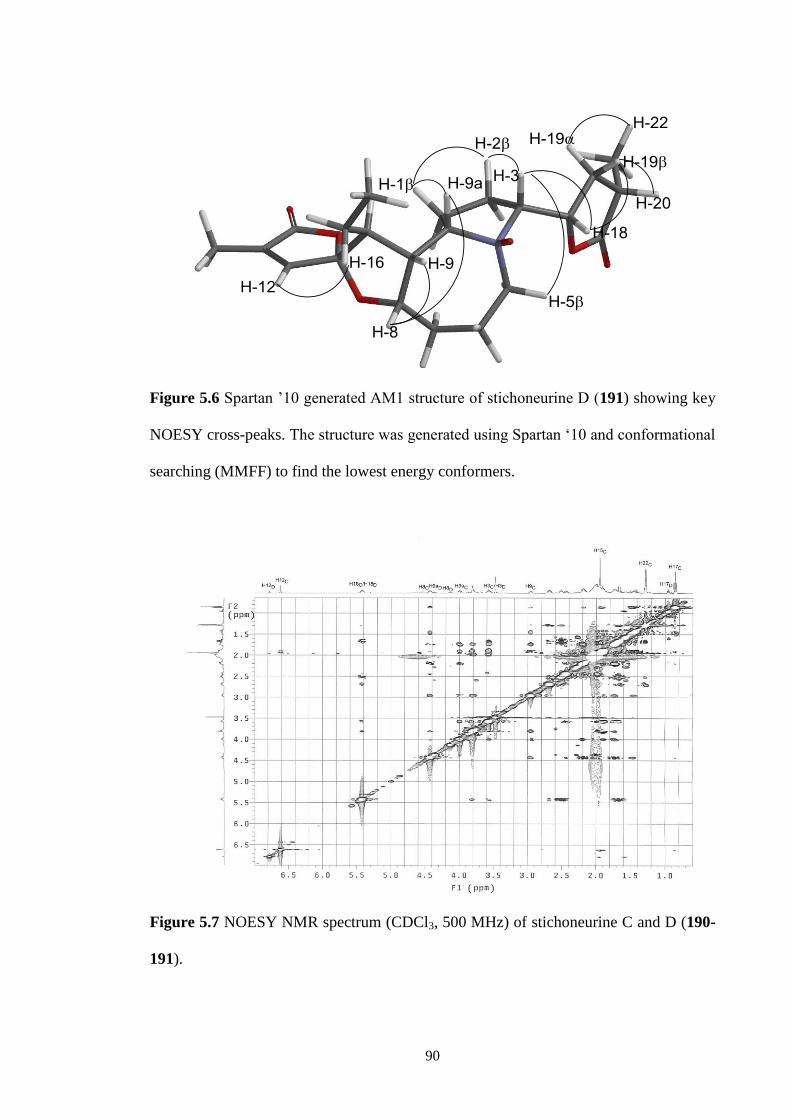
90
Figure 5.6 Spartan ’10 generated AM1 structure of stichoneurine D (191) showing key
NOESY cross-peaks. The structure was generated using Spartan ‘10 and conformational
searching (MMFF) to find the lowest energy conformers.
Figure 5.7 NOESY NMR spectrum (CDCl3, 500 MHz) of stichoneurine C and D (190-
191).
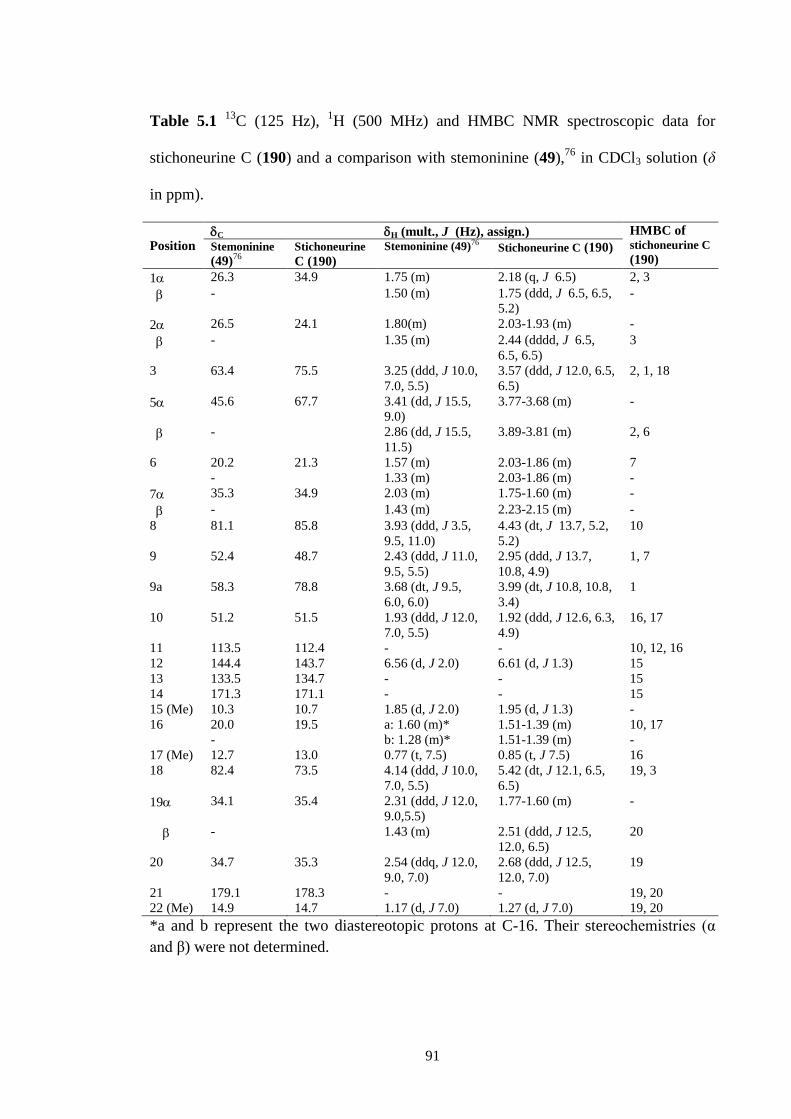
91
Table 5.1 13
C (125 Hz), 1H (500 MHz) and HMBC NMR spectroscopic data for
stichoneurine C (190) and a comparison with stemoninine (49),76
in CDCl3 solution (δ
in ppm).
Position C H (mult., J (Hz), assign.) HMBC of
stichoneurine C
(190) Stemoninine
(49)76
Stichoneurine
C (190)
Stemoninine (49)76 Stichoneurine C (190)
1 26.3 34.9 1.75 (m) 2.18 (q, J 6.5) 2, 3
- 1.50 (m) 1.75 (ddd, J 6.5, 6.5,
5.2)
-
2 26.5 24.1 1.80(m) 2.03-1.93 (m) -
- 1.35 (m) 2.44 (dddd, J 6.5,
6.5, 6.5)
3
3 63.4 75.5 3.25 (ddd, J 10.0,
7.0, 5.5)
3.57 (ddd, J 12.0, 6.5,
6.5)
2, 1, 18
5 45.6 67.7 3.41 (dd, J 15.5,
9.0)
3.77-3.68 (m) -
- 2.86 (dd, J 15.5,
11.5)
3.89-3.81 (m) 2, 6
6 20.2 21.3 1.57 (m) 2.03-1.86 (m) 7
- 1.33 (m) 2.03-1.86 (m) -
7 35.3 34.9 2.03 (m) 1.75-1.60 (m) -
- 1.43 (m) 2.23-2.15 (m) -
8 81.1 85.8 3.93 (ddd, J 3.5,
9.5, 11.0)
4.43 (dt, J 13.7, 5.2,
5.2)
10
9 52.4 48.7 2.43 (ddd, J 11.0,
9.5, 5.5)
2.95 (ddd, J 13.7,
10.8, 4.9)
1, 7
9a 58.3 78.8 3.68 (dt, J 9.5,
6.0, 6.0)
3.99 (dt, J 10.8, 10.8,
3.4)
1
10 51.2 51.5 1.93 (ddd, J 12.0,
7.0, 5.5)
1.92 (ddd, J 12.6, 6.3,
4.9)
16, 17
11 113.5 112.4 - - 10, 12, 16
12 144.4 143.7 6.56 (d, J 2.0) 6.61 (d, J 1.3) 15
13 133.5 134.7 - - 15
14 171.3 171.1 - - 15
15 (Me) 10.3 10.7 1.85 (d, J 2.0) 1.95 (d, J 1.3) -
16 20.0 19.5 a: 1.60 (m)* 1.51-1.39 (m) 10, 17
- b: 1.28 (m)* 1.51-1.39 (m) -
17 (Me) 12.7 13.0 0.77 (t, 7.5) 0.85 (t, J 7.5) 16
18 82.4 73.5 4.14 (ddd, J 10.0,
7.0, 5.5)
5.42 (dt, J 12.1, 6.5,
6.5)
19, 3
19 34.1 35.4 2.31 (ddd, J 12.0,
9.0,5.5)
1.77-1.60 (m) -
- 1.43 (m) 2.51 (ddd, J 12.5,
12.0, 6.5)
20
20 34.7 35.3 2.54 (ddq, J 12.0,
9.0, 7.0)
2.68 (ddd, J 12.5,
12.0, 7.0)
19
21 179.1 178.3 - - 19, 20
22 (Me) 14.9 14.7 1.17 (d, J 7.0) 1.27 (d, J 7.0) 19, 20
*a and b represent the two diastereotopic protons at C-16. Their stereochemistries (α
and β) were not determined.
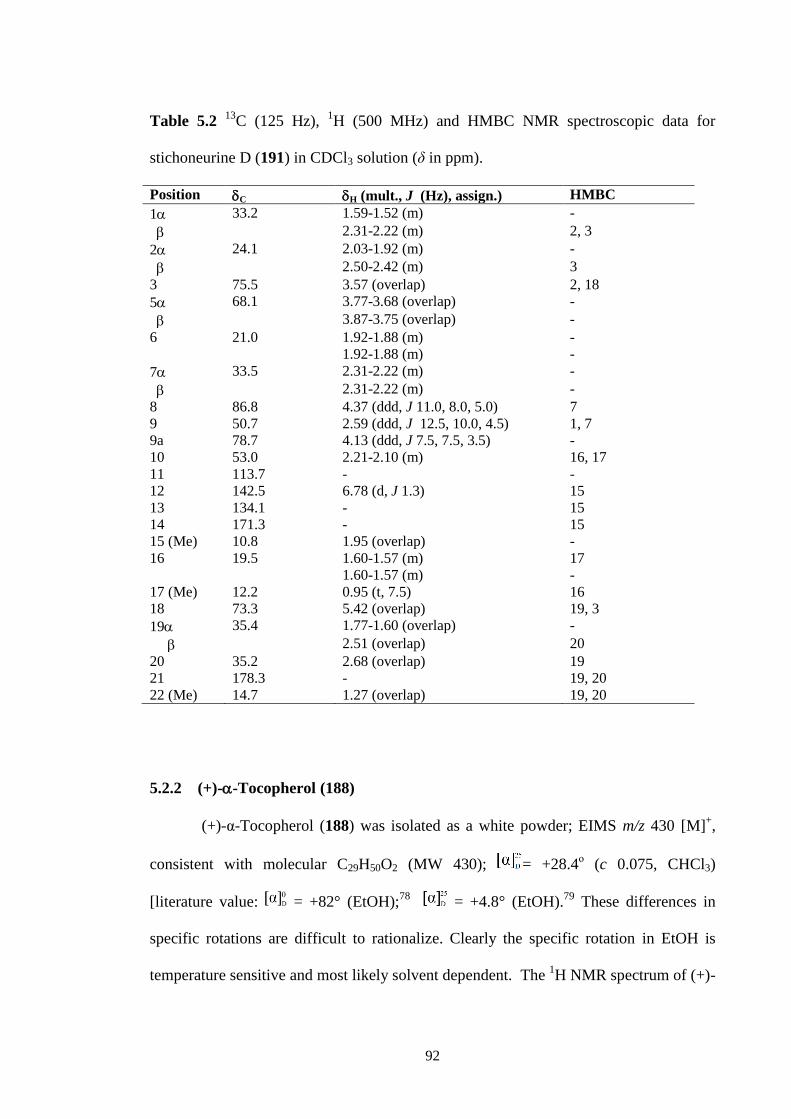
92
Table 5.2 13
C (125 Hz), 1H (500 MHz) and HMBC NMR spectroscopic data for
stichoneurine D (191) in CDCl3 solution (δ in ppm).
Position C H (mult., J (Hz), assign.) HMBC
1 33.2 1.59-1.52 (m) -
2.31-2.22 (m) 2, 3
2 24.1 2.03-1.92 (m) -
2.50-2.42 (m) 3
3 75.5 3.57 (overlap) 2, 18
5 68.1 3.77-3.68 (overlap) -
3.87-3.75 (overlap) -
6 21.0 1.92-1.88 (m) -
1.92-1.88 (m) -
7 33.5 2.31-2.22 (m) -
2.31-2.22 (m) -
8 86.8 4.37 (ddd, J 11.0, 8.0, 5.0) 7
9 50.7 2.59 (ddd, J 12.5, 10.0, 4.5) 1, 7
9a 78.7 4.13 (ddd, J 7.5, 7.5, 3.5) -
10 53.0 2.21-2.10 (m) 16, 17
11 113.7 - -
12 142.5 6.78 (d, J 1.3) 15
13 134.1 - 15
14 171.3 - 15
15 (Me) 10.8 1.95 (overlap) -
16 19.5 1.60-1.57 (m) 17
1.60-1.57 (m) -
17 (Me) 12.2 0.95 (t, 7.5) 16
18 73.3 5.42 (overlap) 19, 3
19 35.4 1.77-1.60 (overlap) -
2.51 (overlap) 20
20 35.2 2.68 (overlap) 19
21 178.3 - 19, 20
22 (Me) 14.7 1.27 (overlap) 19, 20
5.2.2 (+)--Tocopherol (188)
(+)-α-Tocopherol (188) was isolated as a white powder; EIMS m/z 430 [M]+,
consistent with molecular C29H50O2 (MW 430); = +28.4ο (c 0.075, CHCl3)
[literature value: = +82° (EtOH);78
= +4.8° (EtOH).79
These differences in
specific rotations are difficult to rationalize. Clearly the specific rotation in EtOH is
temperature sensitive and most likely solvent dependent. The 1H NMR spectrum of (+)-
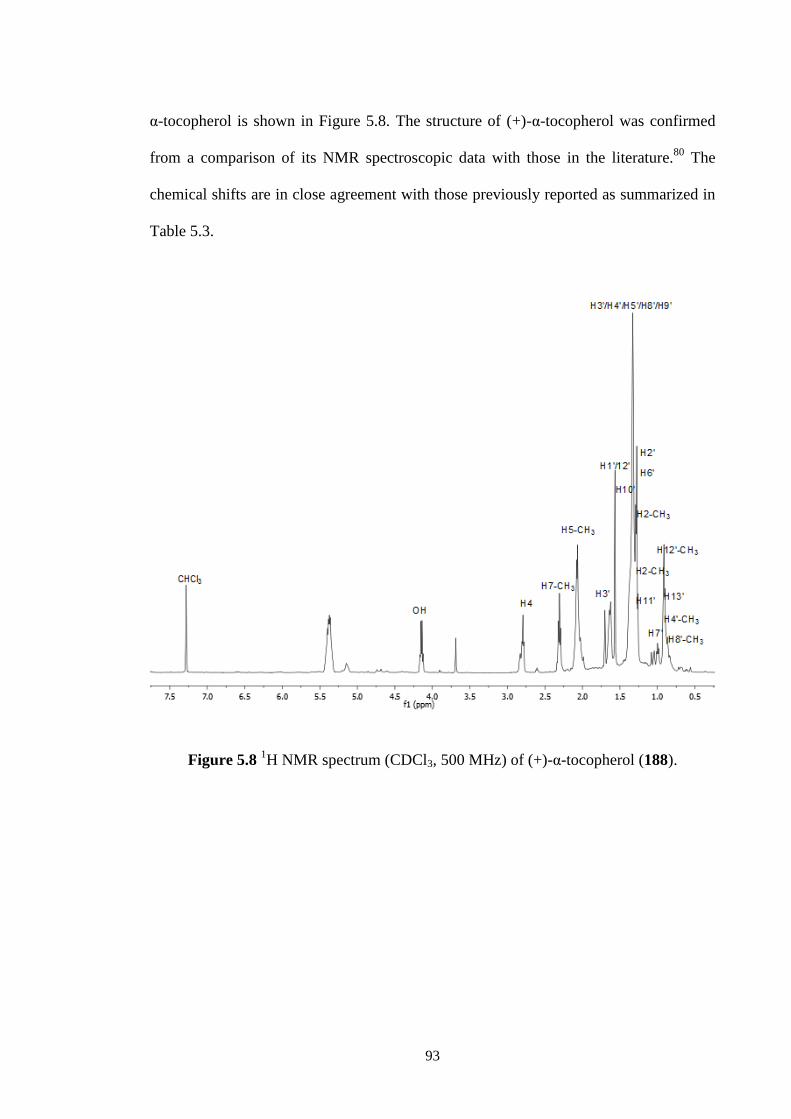
93
α-tocopherol is shown in Figure 5.8. The structure of (+)-α-tocopherol was confirmed
from a comparison of its NMR spectroscopic data with those in the literature.80
The
chemical shifts are in close agreement with those previously reported as summarized in
Table 5.3.
Figure 5.8 1H NMR spectrum (CDCl3, 500 MHz) of (+)-α-tocopherol (188).
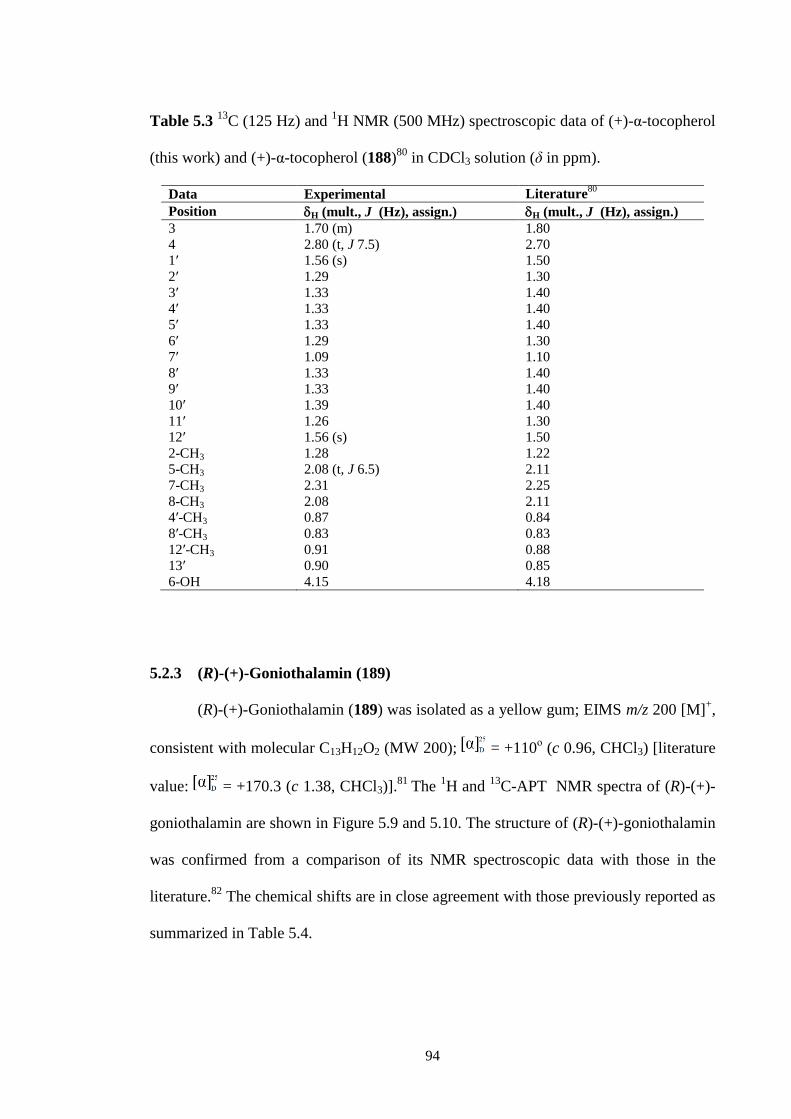
94
Table 5.3 13
C (125 Hz) and 1H NMR (500 MHz) spectroscopic data of (+)-α-tocopherol
(this work) and (+)-α-tocopherol (188)80
in CDCl3 solution (δ in ppm).
Data Experimental Literature80
Position H (mult., J (Hz), assign.) H (mult., J (Hz), assign.)
3 1.70 (m) 1.80
4 2.80 (t, J 7.5) 2.70
1′ 1.56 (s) 1.50
2′ 1.29 1.30
3′ 1.33 1.40
4′ 1.33 1.40
5′ 1.33 1.40
6′ 1.29 1.30
7′ 1.09 1.10
8′ 1.33 1.40
9′ 1.33 1.40
10′ 1.39 1.40
11′ 1.26 1.30
12′ 1.56 (s) 1.50
2-CH3 1.28 1.22
5-CH3 2.08 (t, J 6.5) 2.11
7-CH3 2.31 2.25
8-CH3 2.08 2.11
4′-CH3 0.87 0.84
8′-CH3 0.83 0.83
12′-CH3 0.91 0.88
13′ 0.90 0.85
6-OH 4.15 4.18
5.2.3 (R)-(+)-Goniothalamin (189)
(R)-(+)-Goniothalamin (189) was isolated as a yellow gum; EIMS m/z 200 [M]+,
consistent with molecular C13H12O2 (MW 200); = +110ο (c 0.96, CHCl3) [literature
value: = +170.3 (c 1.38, CHCl3)].81
The 1H and
13C-APT NMR spectra of (R)-(+)-
goniothalamin are shown in Figure 5.9 and 5.10. The structure of (R)-(+)-goniothalamin
was confirmed from a comparison of its NMR spectroscopic data with those in the
literature.82
The chemical shifts are in close agreement with those previously reported as
summarized in Table 5.4.
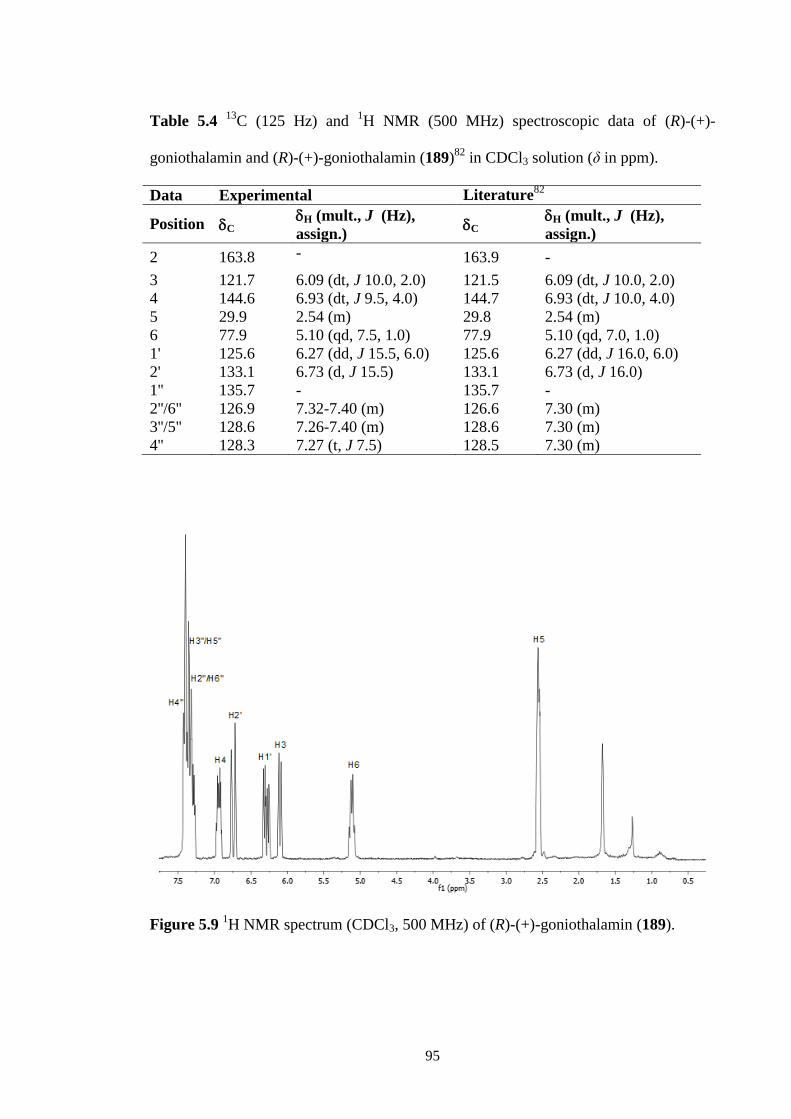
95
Table 5.4 13
C (125 Hz) and 1H NMR (500 MHz) spectroscopic data of (R)-(+)-
goniothalamin and (R)-(+)-goniothalamin (189)82
in CDCl3 solution (δ in ppm).
Data Experimental Literature82
Position C H (mult., J (Hz),
assign.) C
H (mult., J (Hz),
assign.)
2 163.8 - 163.9 -
3 121.7 6.09 (dt, J 10.0, 2.0) 121.5 6.09 (dt, J 10.0, 2.0)
4 144.6 6.93 (dt, J 9.5, 4.0) 144.7 6.93 (dt, J 10.0, 4.0)
5 29.9 2.54 (m) 29.8 2.54 (m)
6 77.9 5.10 (qd, 7.5, 1.0) 77.9 5.10 (qd, 7.0, 1.0)
1' 125.6 6.27 (dd, J 15.5, 6.0) 125.6 6.27 (dd, J 16.0, 6.0)
2' 133.1 6.73 (d, J 15.5) 133.1 6.73 (d, J 16.0)
1'' 135.7 - 135.7 -
2''/6'' 126.9 7.32-7.40 (m) 126.6 7.30 (m)
3''/5'' 128.6 7.26-7.40 (m) 128.6 7.30 (m)
4'' 128.3 7.27 (t, J 7.5) 128.5 7.30 (m)
Figure 5.9 1H NMR spectrum (CDCl3, 500 MHz) of (R)-(+)-goniothalamin (189).
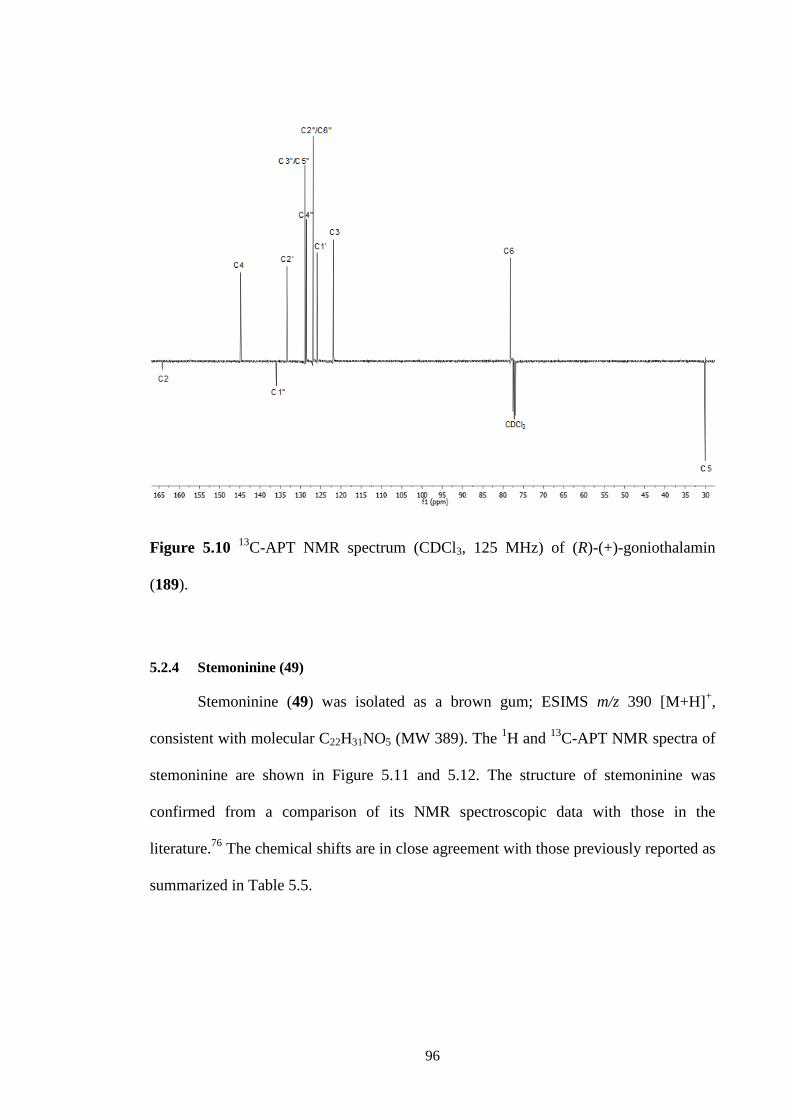
96
Figure 5.10 13
C-APT NMR spectrum (CDCl3, 125 MHz) of (R)-(+)-goniothalamin
(189).
5.2.4 Stemoninine (49)
Stemoninine (49) was isolated as a brown gum; ESIMS m/z 390 [M+H]+,
consistent with molecular C22H31NO5 (MW 389). The 1H and
13C-APT NMR spectra of
stemoninine are shown in Figure 5.11 and 5.12. The structure of stemoninine was
confirmed from a comparison of its NMR spectroscopic data with those in the
literature.76
The chemical shifts are in close agreement with those previously reported as
summarized in Table 5.5.
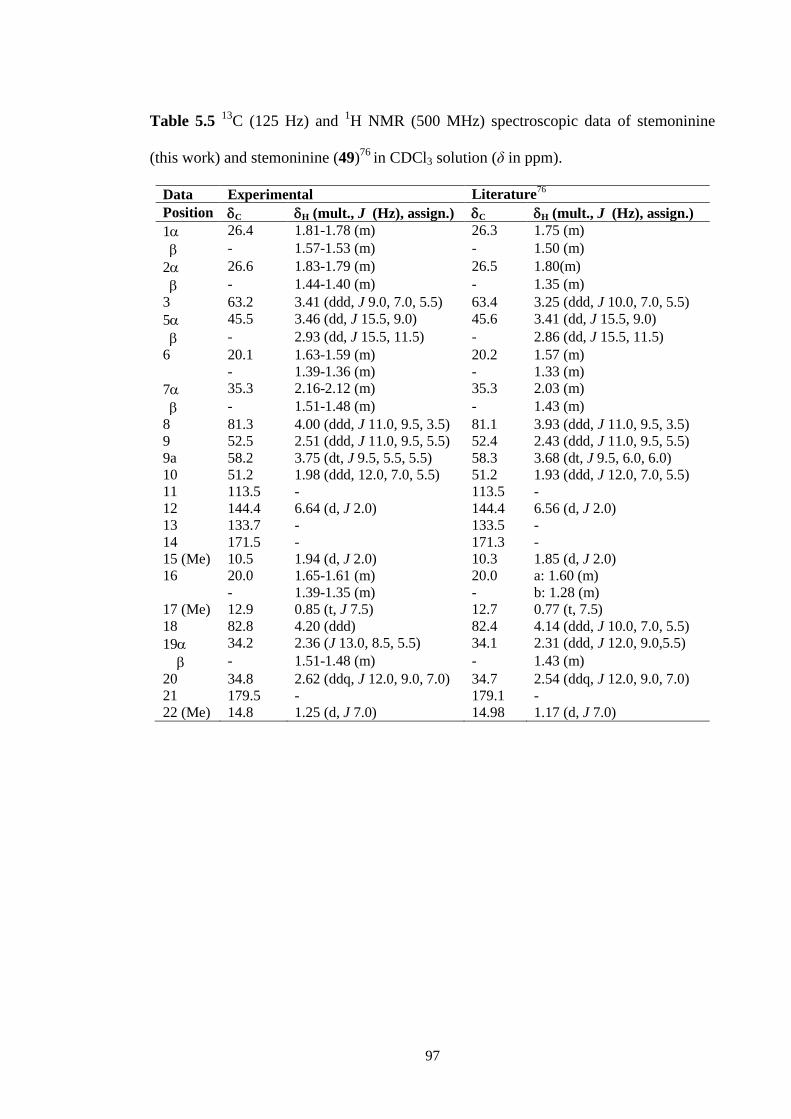
97
Table 5.5 13
C (125 Hz) and 1H NMR (500 MHz) spectroscopic data of stemoninine
(this work) and stemoninine (49)76
in CDCl3 solution (δ in ppm).
Data Experimental Literature76
Position C H (mult., J (Hz), assign.) C H (mult., J (Hz), assign.)
1 26.4 1.81-1.78 (m) 26.3 1.75 (m)
- 1.57-1.53 (m) - 1.50 (m)
2 26.6 1.83-1.79 (m) 26.5 1.80(m)
- 1.44-1.40 (m) - 1.35 (m)
3 63.2 3.41 (ddd, J 9.0, 7.0, 5.5) 63.4 3.25 (ddd, J 10.0, 7.0, 5.5)
5 45.5 3.46 (dd, J 15.5, 9.0) 45.6 3.41 (dd, J 15.5, 9.0)
- 2.93 (dd, J 15.5, 11.5) - 2.86 (dd, J 15.5, 11.5)
6 20.1 1.63-1.59 (m) 20.2 1.57 (m)
- 1.39-1.36 (m) - 1.33 (m)
7 35.3 2.16-2.12 (m) 35.3 2.03 (m)
- 1.51-1.48 (m) - 1.43 (m)
8 81.3 4.00 (ddd, J 11.0, 9.5, 3.5) 81.1 3.93 (ddd, J 11.0, 9.5, 3.5)
9 52.5 2.51 (ddd, J 11.0, 9.5, 5.5) 52.4 2.43 (ddd, J 11.0, 9.5, 5.5)
9a 58.2 3.75 (dt, J 9.5, 5.5, 5.5) 58.3 3.68 (dt, J 9.5, 6.0, 6.0)
10 51.2 1.98 (ddd, 12.0, 7.0, 5.5) 51.2 1.93 (ddd, J 12.0, 7.0, 5.5)
11 113.5 - 113.5 -
12 144.4 6.64 (d, J 2.0) 144.4 6.56 (d, J 2.0)
13 133.7 - 133.5 -
14 171.5 - 171.3 -
15 (Me) 10.5 1.94 (d, J 2.0) 10.3 1.85 (d, J 2.0)
16 20.0 1.65-1.61 (m) 20.0 a: 1.60 (m)
- 1.39-1.35 (m) - b: 1.28 (m)
17 (Me) 12.9 0.85 (t, J 7.5) 12.7 0.77 (t, 7.5)
18 82.8 4.20 (ddd) 82.4 4.14 (ddd, J 10.0, 7.0, 5.5)
19 34.2 2.36 (J 13.0, 8.5, 5.5) 34.1 2.31 (ddd, J 12.0, 9.0,5.5)
- 1.51-1.48 (m) - 1.43 (m)
20 34.8 2.62 (ddq, J 12.0, 9.0, 7.0) 34.7 2.54 (ddq, J 12.0, 9.0, 7.0)
21 179.5 - 179.1 -
22 (Me) 14.8 1.25 (d, J 7.0) 14.98 1.17 (d, J 7.0)
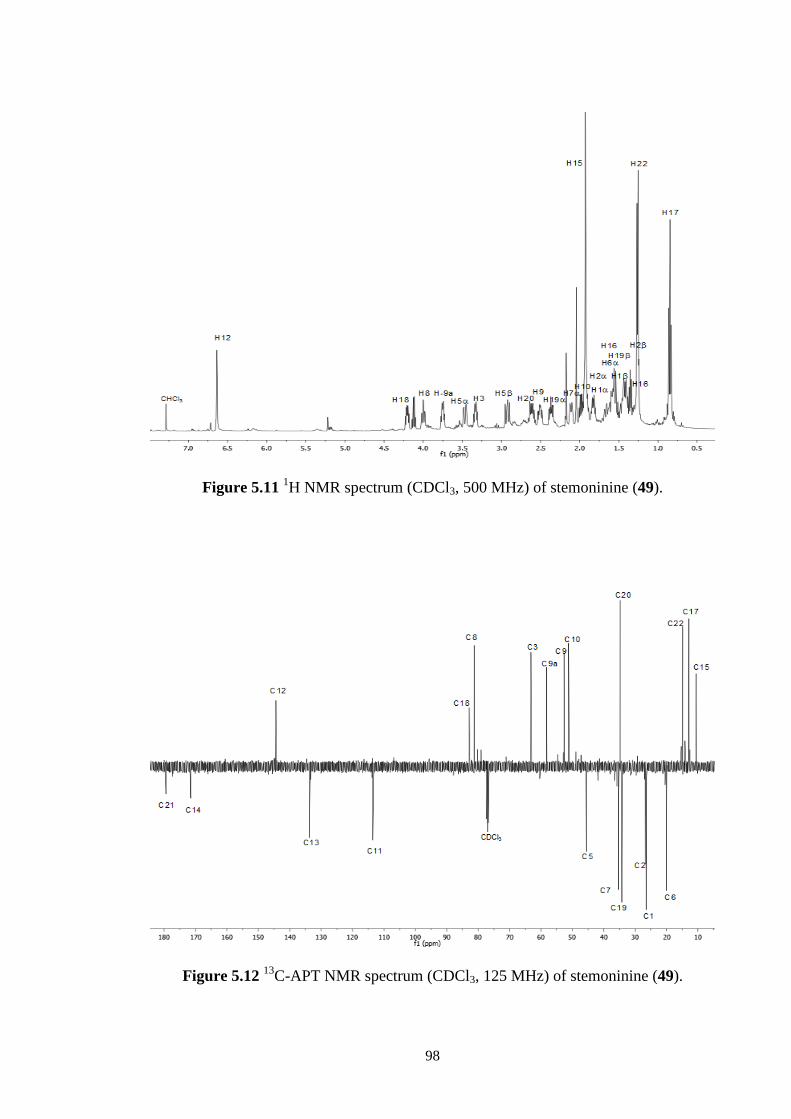
98
Figure 5.11 1H NMR spectrum (CDCl3, 500 MHz) of stemoninine (49).
Figure 5.12 13
C-APT NMR spectrum (CDCl3, 125 MHz) of stemoninine (49).
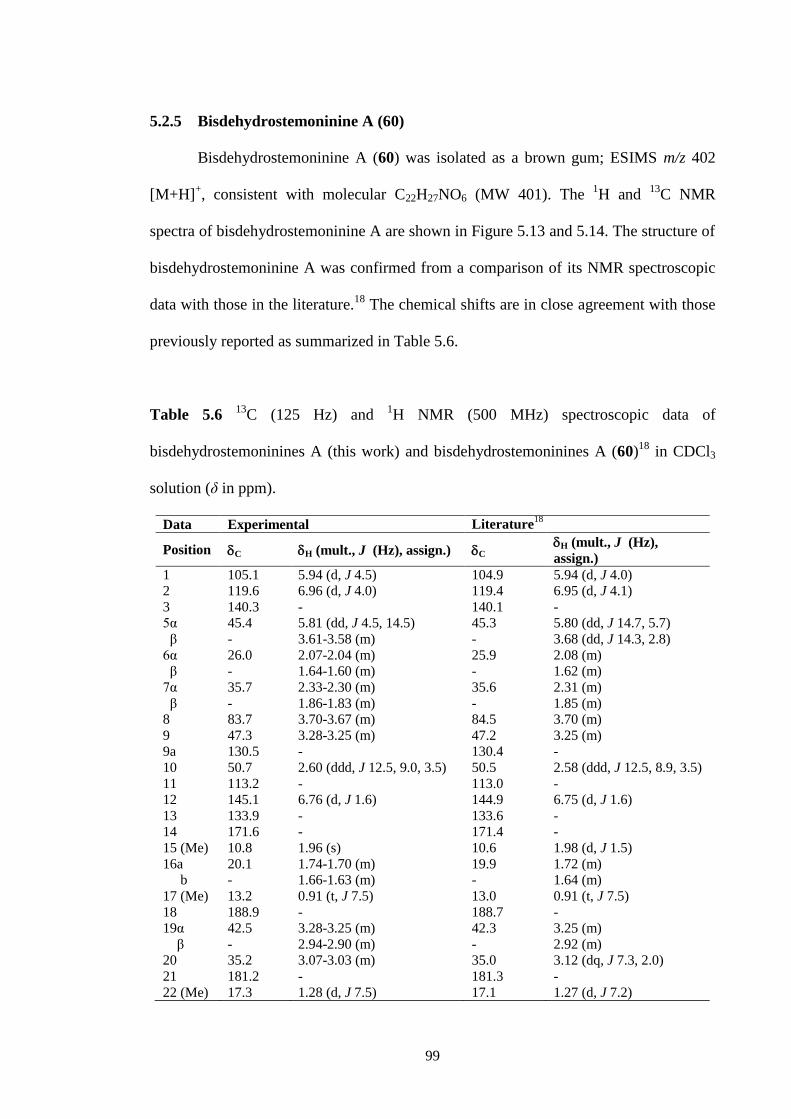
99
5.2.5 Bisdehydrostemoninine A (60)
Bisdehydrostemoninine A (60) was isolated as a brown gum; ESIMS m/z 402
[M+H]+, consistent with molecular C22H27NO6 (MW 401). The
1H and
13C NMR
spectra of bisdehydrostemoninine A are shown in Figure 5.13 and 5.14. The structure of
bisdehydrostemoninine A was confirmed from a comparison of its NMR spectroscopic
data with those in the literature.18
The chemical shifts are in close agreement with those
previously reported as summarized in Table 5.6.
Table 5.6 13
C (125 Hz) and 1H NMR (500 MHz) spectroscopic data of
bisdehydrostemoninines A (this work) and bisdehydrostemoninines A (60)18
in CDCl3
solution (δ in ppm).
Data Experimental Literature18
Position C H (mult., J (Hz), assign.) C H (mult., J (Hz),
assign.)
1 105.1 5.94 (d, J 4.5) 104.9 5.94 (d, J 4.0)
2 119.6 6.96 (d, J 4.0) 119.4 6.95 (d, J 4.1)
3 140.3 - 140.1 -
5α 45.4 5.81 (dd, J 4.5, 14.5) 45.3 5.80 (dd, J 14.7, 5.7)
β - 3.61-3.58 (m) - 3.68 (dd, J 14.3, 2.8)
6α 26.0 2.07-2.04 (m) 25.9 2.08 (m)
β - 1.64-1.60 (m) - 1.62 (m)
7α 35.7 2.33-2.30 (m) 35.6 2.31 (m)
β - 1.86-1.83 (m) - 1.85 (m)
8 83.7 3.70-3.67 (m) 84.5 3.70 (m)
9 47.3 3.28-3.25 (m) 47.2 3.25 (m)
9a 130.5 - 130.4 -
10 50.7 2.60 (ddd, J 12.5, 9.0, 3.5) 50.5 2.58 (ddd, J 12.5, 8.9, 3.5)
11 113.2 - 113.0 -
12 145.1 6.76 (d, J 1.6) 144.9 6.75 (d, J 1.6)
13 133.9 - 133.6 -
14 171.6 - 171.4 -
15 (Me) 10.8 1.96 (s) 10.6 1.98 (d, J 1.5)
16a 20.1 1.74-1.70 (m) 19.9 1.72 (m)
b - 1.66-1.63 (m) - 1.64 (m)
17 (Me) 13.2 0.91 (t, J 7.5) 13.0 0.91 (t, J 7.5)
18 188.9 - 188.7 -
19α 42.5 3.28-3.25 (m) 42.3 3.25 (m)
β - 2.94-2.90 (m) - 2.92 (m)
20 35.2 3.07-3.03 (m) 35.0 3.12 (dq, J 7.3, 2.0)
21 181.2 - 181.3 -
22 (Me) 17.3 1.28 (d, J 7.5) 17.1 1.27 (d, J 7.2)
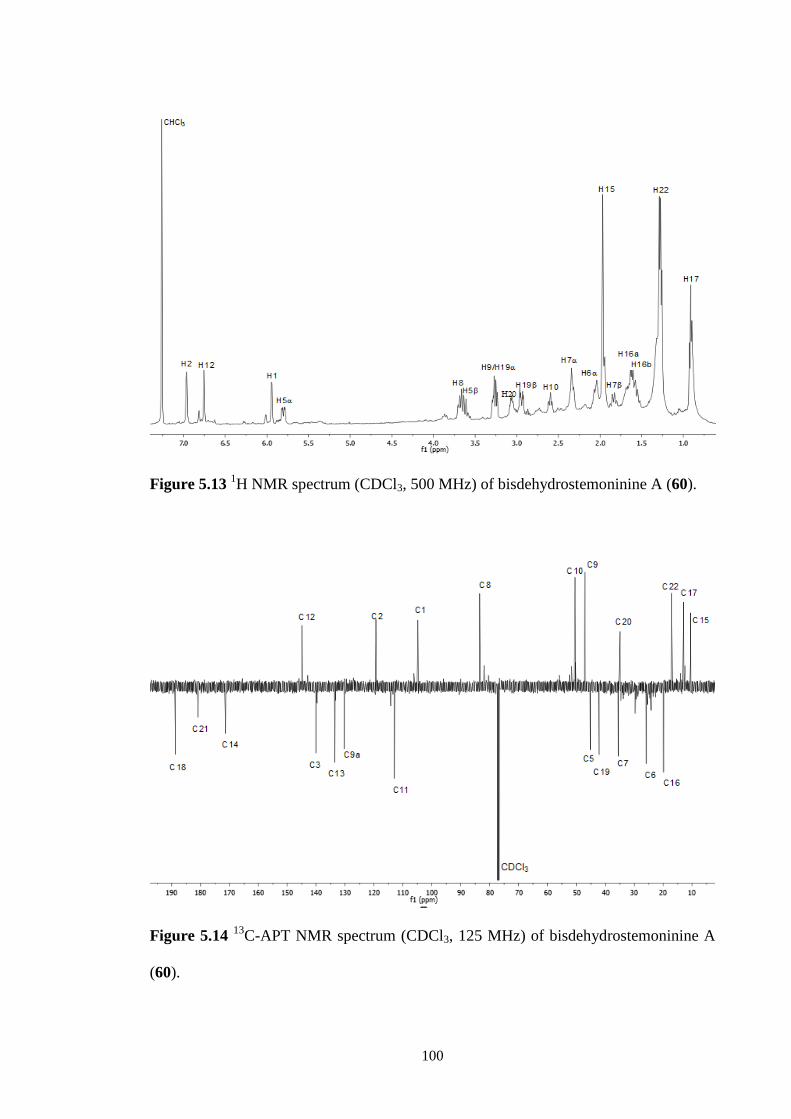
100
Figure 5.13 1H NMR spectrum (CDCl3, 500 MHz) of bisdehydrostemoninine A (60).
Figure 5.14 13
C-APT NMR spectrum (CDCl3, 125 MHz) of bisdehydrostemoninine A
(60).
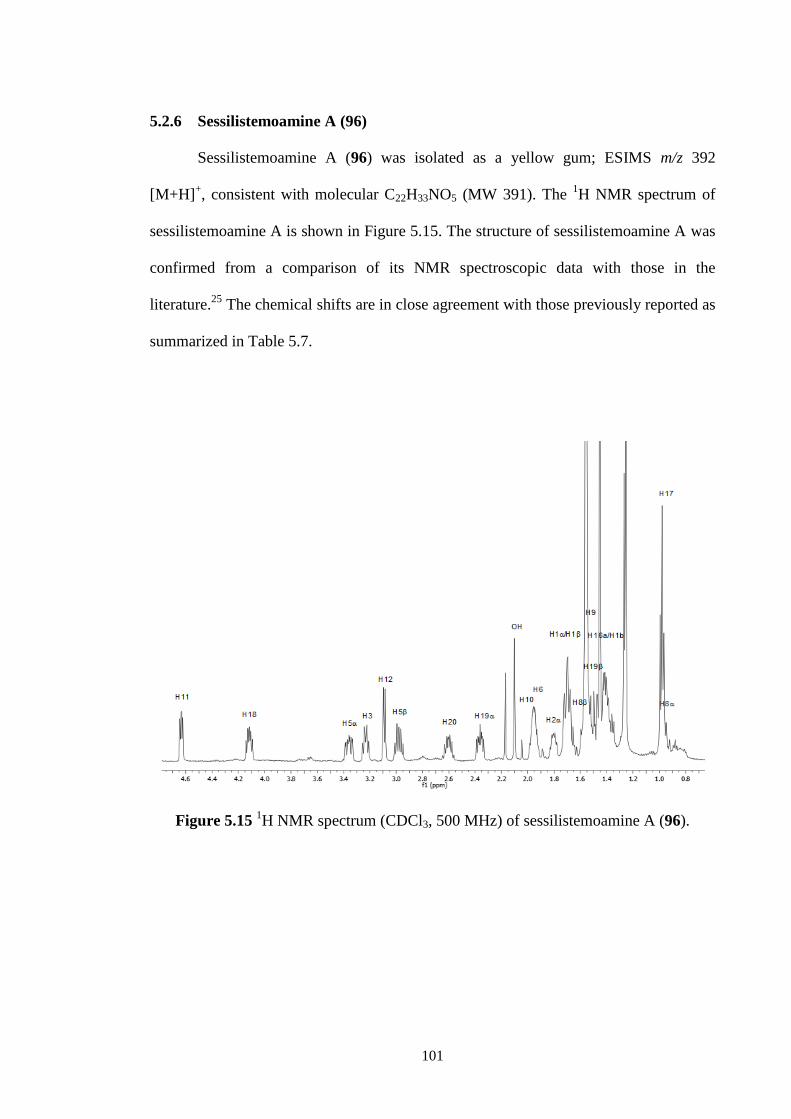
101
5.2.6 Sessilistemoamine A (96)
Sessilistemoamine A (96) was isolated as a yellow gum; ESIMS m/z 392
[M+H]+, consistent with molecular C22H33NO5 (MW 391). The
1H NMR spectrum of
sessilistemoamine A is shown in Figure 5.15. The structure of sessilistemoamine A was
confirmed from a comparison of its NMR spectroscopic data with those in the
literature.25
The chemical shifts are in close agreement with those previously reported as
summarized in Table 5.7.
Figure 5.15 1H NMR spectrum (CDCl3, 500 MHz) of sessilistemoamine A (96).
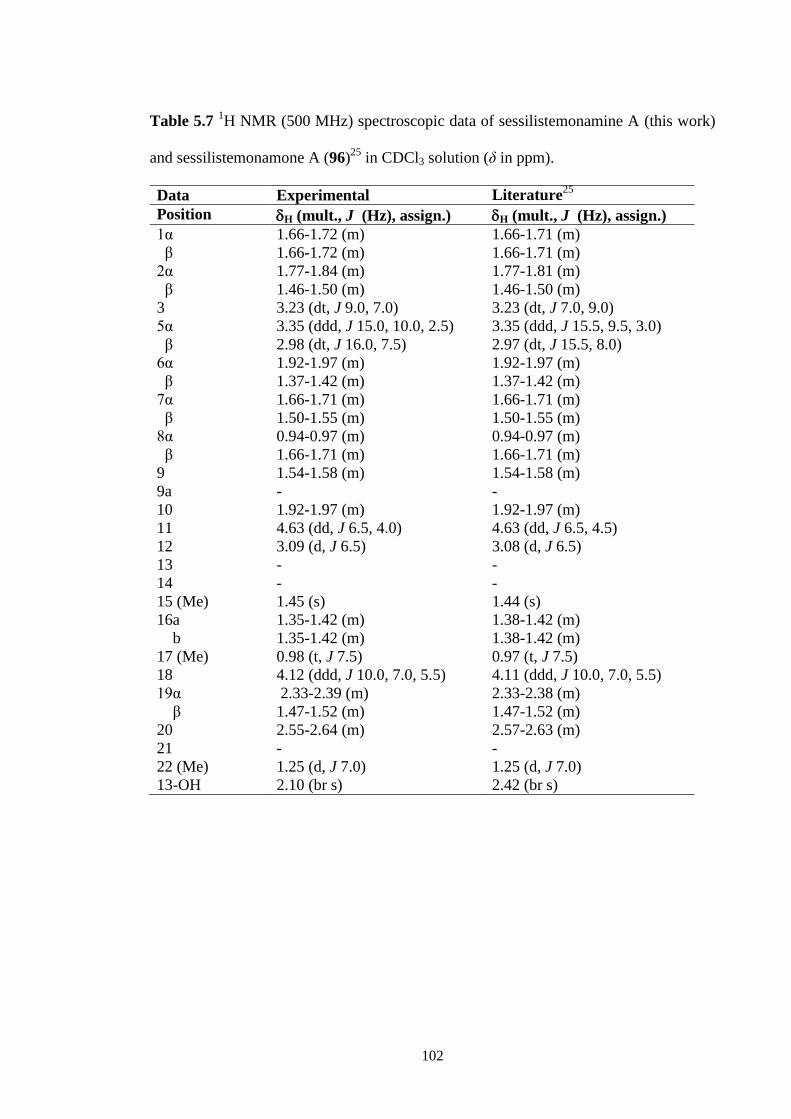
102
Table 5.7 1H NMR (500 MHz) spectroscopic data of sessilistemonamine A (this work)
and sessilistemonamone A (96)25
in CDCl3 solution (δ in ppm).
Data Experimental Literature25
Position H (mult., J (Hz), assign.) H (mult., J (Hz), assign.)
1α 1.66-1.72 (m) 1.66-1.71 (m)
β 1.66-1.72 (m) 1.66-1.71 (m)
2α 1.77-1.84 (m) 1.77-1.81 (m)
β 1.46-1.50 (m) 1.46-1.50 (m)
3 3.23 (dt, J 9.0, 7.0) 3.23 (dt, J 7.0, 9.0)
5α 3.35 (ddd, J 15.0, 10.0, 2.5) 3.35 (ddd, J 15.5, 9.5, 3.0)
β 2.98 (dt, J 16.0, 7.5) 2.97 (dt, J 15.5, 8.0)
6α 1.92-1.97 (m) 1.92-1.97 (m)
β 1.37-1.42 (m) 1.37-1.42 (m)
7α 1.66-1.71 (m) 1.66-1.71 (m)
β 1.50-1.55 (m) 1.50-1.55 (m)
8α 0.94-0.97 (m) 0.94-0.97 (m)
β 1.66-1.71 (m) 1.66-1.71 (m)
9 1.54-1.58 (m) 1.54-1.58 (m)
9a - -
10 1.92-1.97 (m) 1.92-1.97 (m)
11 4.63 (dd, J 6.5, 4.0) 4.63 (dd, J 6.5, 4.5)
12 3.09 (d, J 6.5) 3.08 (d, J 6.5)
13 - -
14 - -
15 (Me) 1.45 (s) 1.44 (s)
16a 1.35-1.42 (m) 1.38-1.42 (m)
b 1.35-1.42 (m) 1.38-1.42 (m)
17 (Me) 0.98 (t, J 7.5) 0.97 (t, J 7.5)
18 4.12 (ddd, J 10.0, 7.0, 5.5) 4.11 (ddd, J 10.0, 7.0, 5.5)
19α 2.33-2.39 (m) 2.33-2.38 (m)
β 1.47-1.52 (m) 1.47-1.52 (m)
20 2.55-2.64 (m) 2.57-2.63 (m)
21 - -
22 (Me) 1.25 (d, J 7.0) 1.25 (d, J 7.0)
13-OH 2.10 (br s) 2.42 (br s)
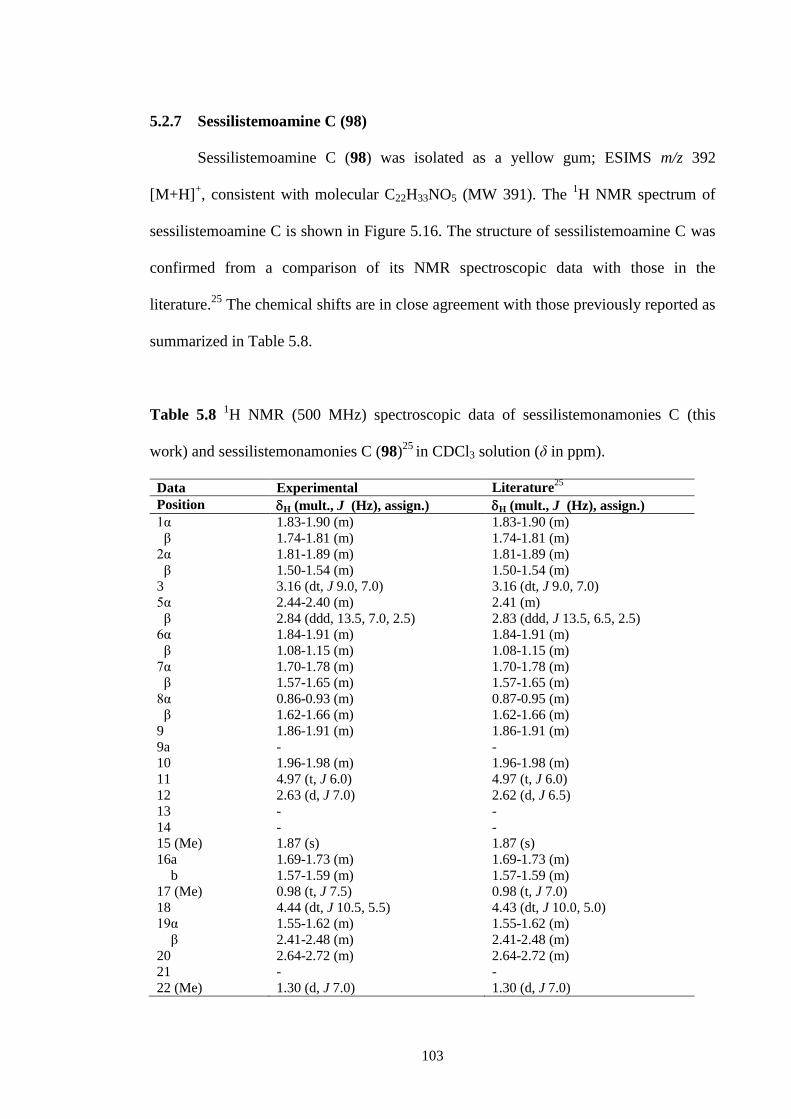
103
5.2.7 Sessilistemoamine C (98)
Sessilistemoamine C (98) was isolated as a yellow gum; ESIMS m/z 392
[M+H]+, consistent with molecular C22H33NO5 (MW 391). The
1H NMR spectrum of
sessilistemoamine C is shown in Figure 5.16. The structure of sessilistemoamine C was
confirmed from a comparison of its NMR spectroscopic data with those in the
literature.25
The chemical shifts are in close agreement with those previously reported as
summarized in Table 5.8.
Table 5.8 1H NMR (500 MHz) spectroscopic data of sessilistemonamonies C (this
work) and sessilistemonamonies C (98)25
in CDCl3 solution (δ in ppm).
Data Experimental Literature25
Position H (mult., J (Hz), assign.) H (mult., J (Hz), assign.)
1α 1.83-1.90 (m) 1.83-1.90 (m)
β 1.74-1.81 (m) 1.74-1.81 (m)
2α 1.81-1.89 (m) 1.81-1.89 (m)
β 1.50-1.54 (m) 1.50-1.54 (m)
3 3.16 (dt, J 9.0, 7.0) 3.16 (dt, J 9.0, 7.0)
5α 2.44-2.40 (m) 2.41 (m)
β 2.84 (ddd, 13.5, 7.0, 2.5) 2.83 (ddd, J 13.5, 6.5, 2.5)
6α 1.84-1.91 (m) 1.84-1.91 (m)
β 1.08-1.15 (m) 1.08-1.15 (m)
7α 1.70-1.78 (m) 1.70-1.78 (m)
β 1.57-1.65 (m) 1.57-1.65 (m)
8α 0.86-0.93 (m) 0.87-0.95 (m)
β 1.62-1.66 (m) 1.62-1.66 (m)
9 1.86-1.91 (m) 1.86-1.91 (m)
9a - -
10 1.96-1.98 (m) 1.96-1.98 (m)
11 4.97 (t, J 6.0) 4.97 (t, J 6.0)
12 2.63 (d, J 7.0) 2.62 (d, J 6.5)
13 - -
14 - -
15 (Me) 1.87 (s) 1.87 (s)
16a 1.69-1.73 (m) 1.69-1.73 (m)
b 1.57-1.59 (m) 1.57-1.59 (m)
17 (Me) 0.98 (t, J 7.5) 0.98 (t, J 7.0)
18 4.44 (dt, J 10.5, 5.5) 4.43 (dt, J 10.0, 5.0)
19α 1.55-1.62 (m) 1.55-1.62 (m)
β 2.41-2.48 (m) 2.41-2.48 (m)
20 2.64-2.72 (m) 2.64-2.72 (m)
21 - -
22 (Me) 1.30 (d, J 7.0) 1.30 (d, J 7.0)
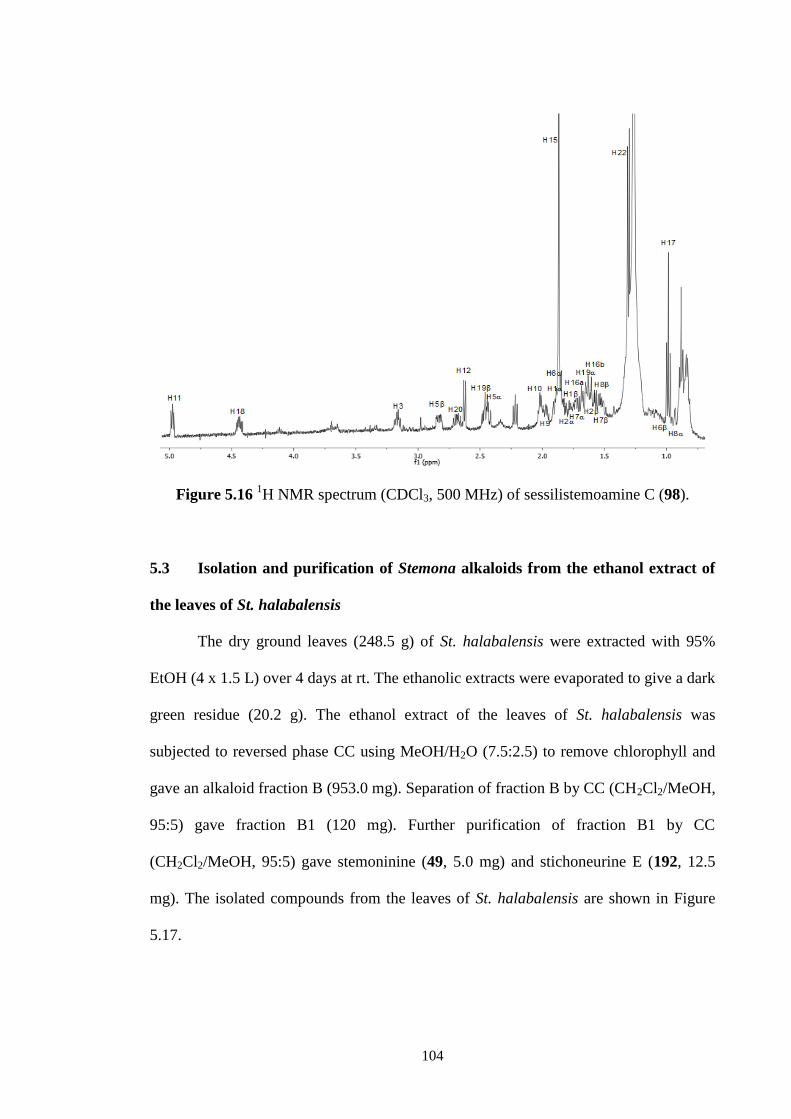
104
Figure 5.16 1H NMR spectrum (CDCl3, 500 MHz) of sessilistemoamine C (98).
5.3 Isolation and purification of Stemona alkaloids from the ethanol extract of
the leaves of St. halabalensis
The dry ground leaves (248.5 g) of St. halabalensis were extracted with 95%
EtOH (4 x 1.5 L) over 4 days at rt. The ethanolic extracts were evaporated to give a dark
green residue (20.2 g). The ethanol extract of the leaves of St. halabalensis was
subjected to reversed phase CC using MeOH/H2O (7.5:2.5) to remove chlorophyll and
gave an alkaloid fraction B (953.0 mg). Separation of fraction B by CC (CH2Cl2/MeOH,
95:5) gave fraction B1 (120 mg). Further purification of fraction B1 by CC
(CH2Cl2/MeOH, 95:5) gave stemoninine (49, 5.0 mg) and stichoneurine E (192, 12.5
mg). The isolated compounds from the leaves of St. halabalensis are shown in Figure
5.17.

105
Stemoninine (49)
N+O O
H
H
H
OO-
H
H
10
1
18
20
19
7 6
5
3
2
8
99a
1617 22
OO
12
14
15
11
Stichoneurine E (192)
N
O
OO H
H
H
O
H
H
O
1 2
3
567
8
9a
910
11
12
1314
15
16
17
18
19
2021
22
Figure 5.17 Structures of the isolated compounds from the leaf of St. halabalensis.
5.3.1 Structure elucidation of Stichoneurine E (192)
Stichoneurine E (192) was obtained as a brown gum. Its molecular formula was
determined as C22H31NO6 from its HRESIMS (m/z 406.2217 [M+H]+, calcd for
406.2230). The IR spectrum of stichoneurine E showed a characteristic -lactone
carbonyl absorption at 1778 cm-1
but not one for the unsaturated -lactone. The
13C/DEPT NMR spectrum (Figure 5.18) was similar to that stichoneurine C (190) and D
(191). The 13
C NMR signals for stichoneurine E (192) corresponded to those of three
methyl [δ 10.6 (C-15), 12.8 (C-17) and14.5 (C-22)], seven methylene [δ 19.2 (C-16),
20.8 (C-6), 24.0 (C-2), 24.2 (C-7), 34.4 (C-1), 35.2 (C-19), 66.5 (C-5)], seven methine
[δ 34.8 (C-19), 48.1 (C-9), 51.3 (C-10), 72.9 (C-18), 76.1 (C-3), 78.5 (C-9a) and 84.1
(C-8)], two olefinic [δ 143.5 (C-12) and 134.5 (C-13)] and three quaternary carbons [δ
112.2 (C-11), 170.9 (C-14) and 177.9 (C-21)] (Figure 5.18 Table 5.9). The 1H NMR
resonances at δ 0.85 (t, J = 7.5 Hz), 1.27 (d, J = 6.8.0 Hz) and 1.94 (d, J = 1.2 Hz) were
assigned to the methyl groups C-17, C-22 and C-15, respectively (Figure 5.19 and Table
5.9). The olefinic proton resonance at δ 6.62 (apparent d, J = 1.3 Hz) was assigned to H-
12. The 13
C NMR signals at δ 177.9 and 170.9 indicated two lactone carbonyls, while
the signal at δ 112.2 indicated a ketal group such as that present in stichoneurine C
(190) and D (191). The COSY and HMBC spectra of stichoneurine E (192) showed
analogous correlations to those observed in that of stichoneurine C (190) and D (191).
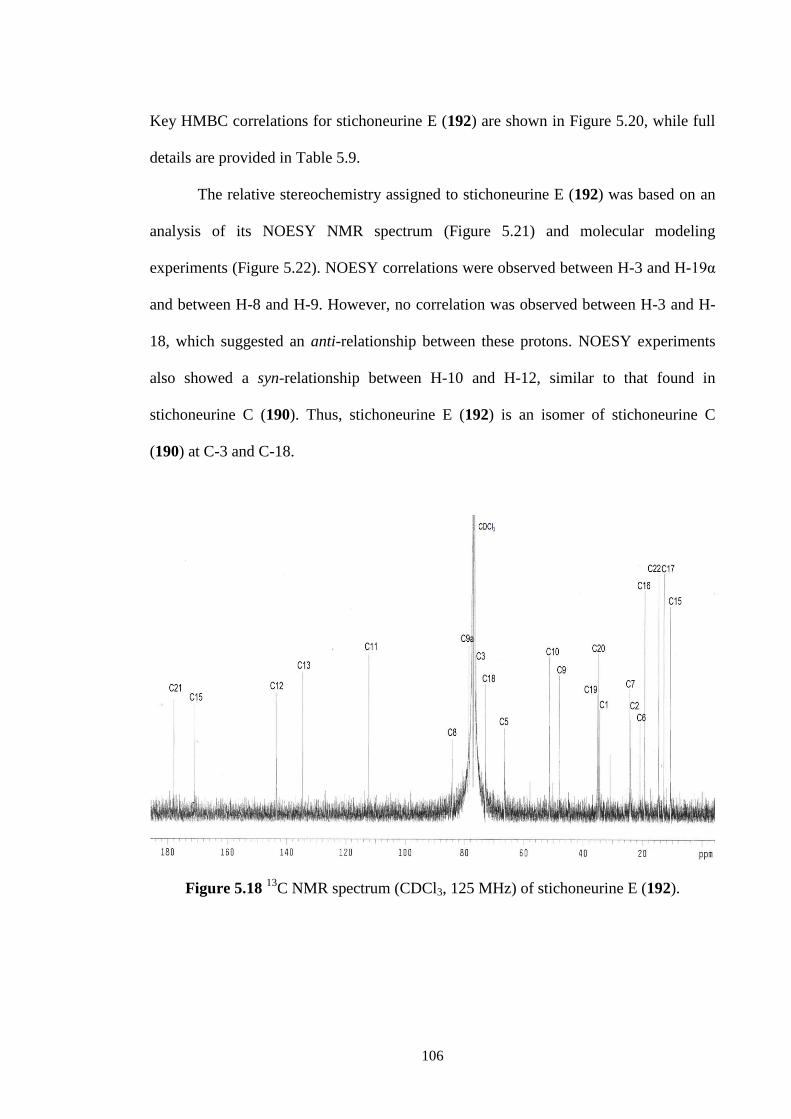
106
Key HMBC correlations for stichoneurine E (192) are shown in Figure 5.20, while full
details are provided in Table 5.9.
The relative stereochemistry assigned to stichoneurine E (192) was based on an
analysis of its NOESY NMR spectrum (Figure 5.21) and molecular modeling
experiments (Figure 5.22). NOESY correlations were observed between H-3 and H-19α
and between H-8 and H-9. However, no correlation was observed between H-3 and H-
18, which suggested an anti-relationship between these protons. NOESY experiments
also showed a syn-relationship between H-10 and H-12, similar to that found in
stichoneurine C (190). Thus, stichoneurine E (192) is an isomer of stichoneurine C
(190) at C-3 and C-18.
Figure 5.18 13
C NMR spectrum (CDCl3, 125 MHz) of stichoneurine E (192).
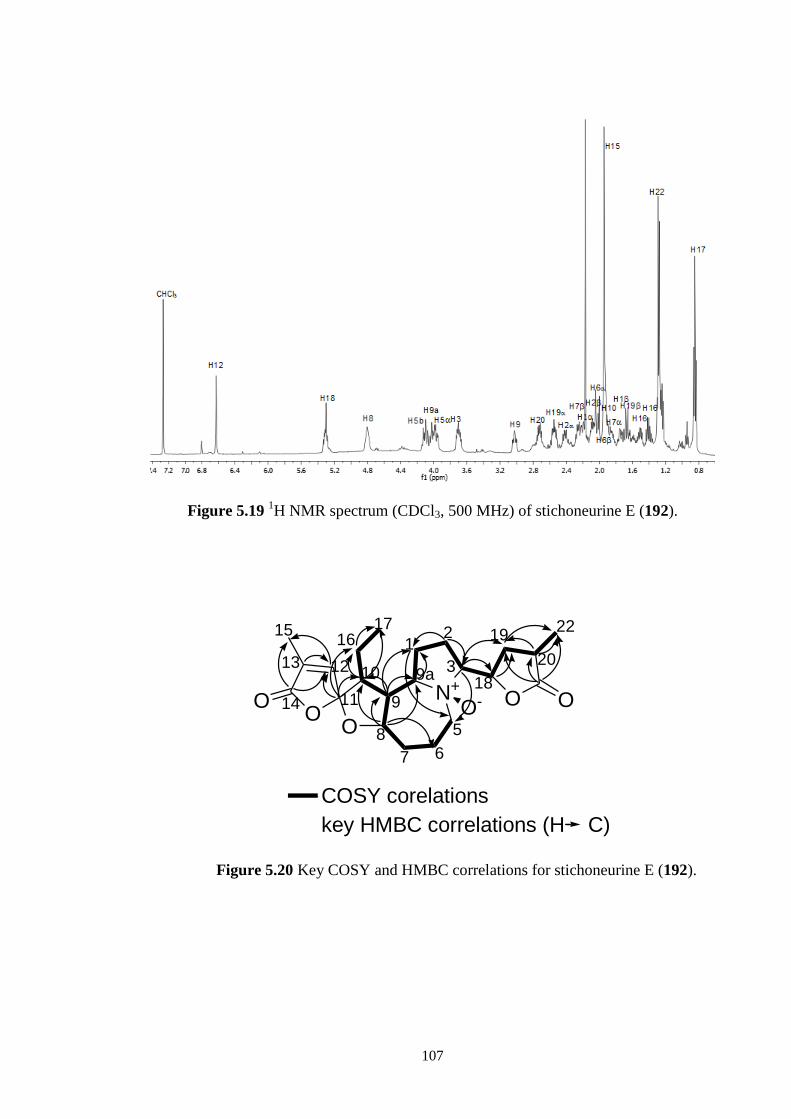
107
Figure 5.19 1H NMR spectrum (CDCl3, 500 MHz) of stichoneurine E (192).
N+O O
OO-
OO
COSY corelations
key HMBC correlations (H C)
12
3
5
67
8
9
9a10
11
1213
14
1516
17
18
19
20
22
Figure 5.20 Key COSY and HMBC correlations for stichoneurine E (192).
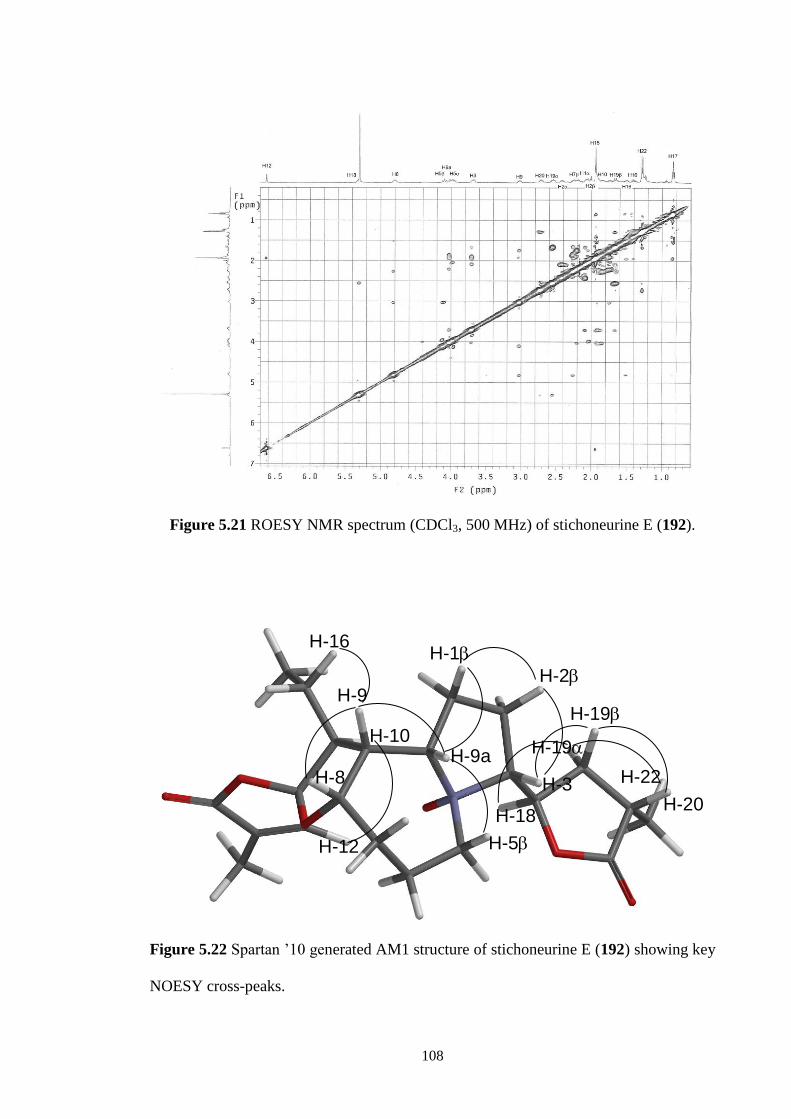
108
Figure 5.21 ROESY NMR spectrum (CDCl3, 500 MHz) of stichoneurine E (192).
H-22H-3
H-18
H-12
H-10H-9a
H-9
H-16
H-8
H-19
H-19
H-2
H-1
H-20
H-5
Figure 5.22 Spartan ’10 generated AM1 structure of stichoneurine E (192) showing key
NOESY cross-peaks.

109
Table 5.9 13
C (125 Hz), 1H (500 MHz) and HMBC NMR spectroscopic data for
stichoneurine E (192) in CDCl3 solution (δ in ppm).
Position C H (mult., J (Hz), assign.) HMBC
1 34.4 1.78-1.72 (m) -
2.23-2.19 (m) 5
2 24.0 2.47-2.39 (m) -
2.14-2.04 (m) 1, 3
3 76.1 3.70 (ddd, J 13.6, 7.5, 5.5) 2b, 5b, 18, 19
5 66.5 4.01-3.93 (m) -
4.15-4.06 (m) -
6 20.8 2.06-2.02 (m) 5
1.94-1.88 (m) -
7 24.2 1.89-1.79 (m) -
2.30-2.22 (m) -
8 84.1 4.85-4.77 (dt, J 18.5, 12.5, 6.0) 2, 6, 9, 9a, 10
9 48.1 3.03 (ddd, J 13.6, 9.8, 4.5) 1, 10
9a 78.5 4.06-3.98 (m) 1, 9
10 51.3 1.98-1.89 (m) 9, 16, 17
11 112.2 - 9a, 12, 10, 16
12 143.5 6.62 (d, J 1.3) 15
13 134.5 - 10, 12
14 170.9 - 12, 15
15 (Me) 10.6 1.94 (d, J 1.2) 12
16 19.2 1.54-1.47 (m) 15, 17
1.44-1.37 (m) -
17 (Me) 12.8 0.85 (d, J 7.5) 15, 16
18 72.9 5.36-5.26 (m) 3, 19b
19 35.2 1.72-1.61 (m) -
2.59-2.53 (m) 22
20 34.8 2.76-2.67 (m) 19, 20, 22
21 177.9 - 20, 19, 22
22 (Me) 14.5 1.27 (d, J 6.8) 19, 20
110
5.4 Conclusions
This study of the hitherto unreported St. halabalensis led to the characterization
of the known compounds (+)-α-tocopherol (188) and (R)-(+)-goniothalamin (189) and
seven pyrrolo[1,2-a]azepine type alkaloids including four known Stemona alkaloids,
bisdehydoxystemoninine A (60), stemoninine (49), sessilistemonamine C (98) and
sessilistemonamine A (96) and three new alkaloids, stichoneurines C (190), D (191) and
E (192). Compounds 188, 189, 60, 49, 98, 96, 190 and 191 were isolated from the roots,
while only two alkaloids 49 and 192 were isolated from the leaves. Interestingly, the
three new alkaloids, stichoneurines C-E (190-192) are diastereoisomers and have a N-
oxide structure. It is possible that 190-192 are artifacts are formed by oxidation during
the purification procedure, however this seems unlikely since no other alkaloids were
isolated as their N-oxides. It would be interesting if further studies can be carrying out
to investigate the enzymes or other factors that were involved in their occurrences.
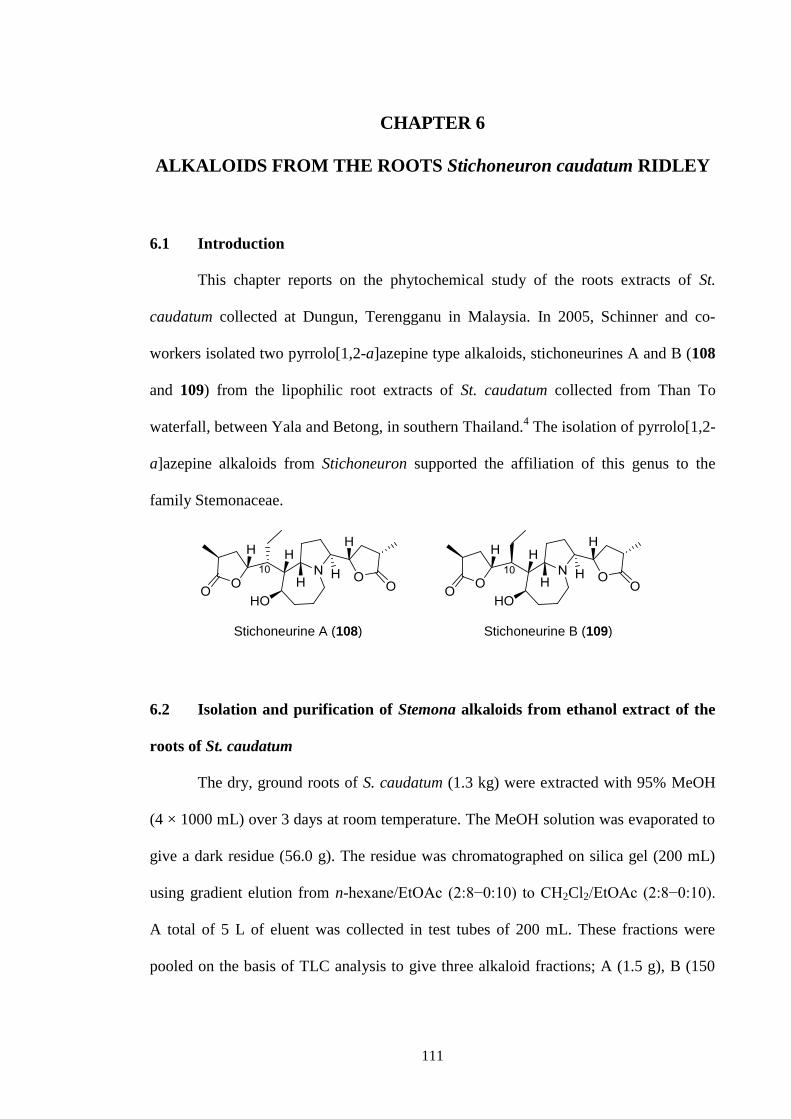
111
CHAPTER 6
ALKALOIDS FROM THE ROOTS Stichoneuron caudatum RIDLEY
6.1 Introduction
This chapter reports on the phytochemical study of the roots extracts of St.
caudatum collected at Dungun, Terengganu in Malaysia. In 2005, Schinner and co-
workers isolated two pyrrolo[1,2-a]azepine type alkaloids, stichoneurines A and B (108
and 109) from the lipophilic root extracts of St. caudatum collected from Than To
waterfall, between Yala and Betong, in southern Thailand.4 The isolation of pyrrolo[1,2-
a]azepine alkaloids from Stichoneuron supported the affiliation of this genus to the
family Stemonaceae.
6.2 Isolation and purification of Stemona alkaloids from ethanol extract of the
roots of St. caudatum
The dry, ground roots of S. caudatum (1.3 kg) were extracted with 95% MeOH
(4 × 1000 mL) over 3 days at room temperature. The MeOH solution was evaporated to
give a dark residue (56.0 g). The residue was chromatographed on silica gel (200 mL)
using gradient elution from n-hexane/EtOAc (2:8−0:10) to CH2Cl2/EtOAc (2:8−0:10).
A total of 5 L of eluent was collected in test tubes of 200 mL. These fractions were
pooled on the basis of TLC analysis to give three alkaloid fractions; A (1.5 g), B (150
Stichoneurine A (108) Stichoneurine B (109)
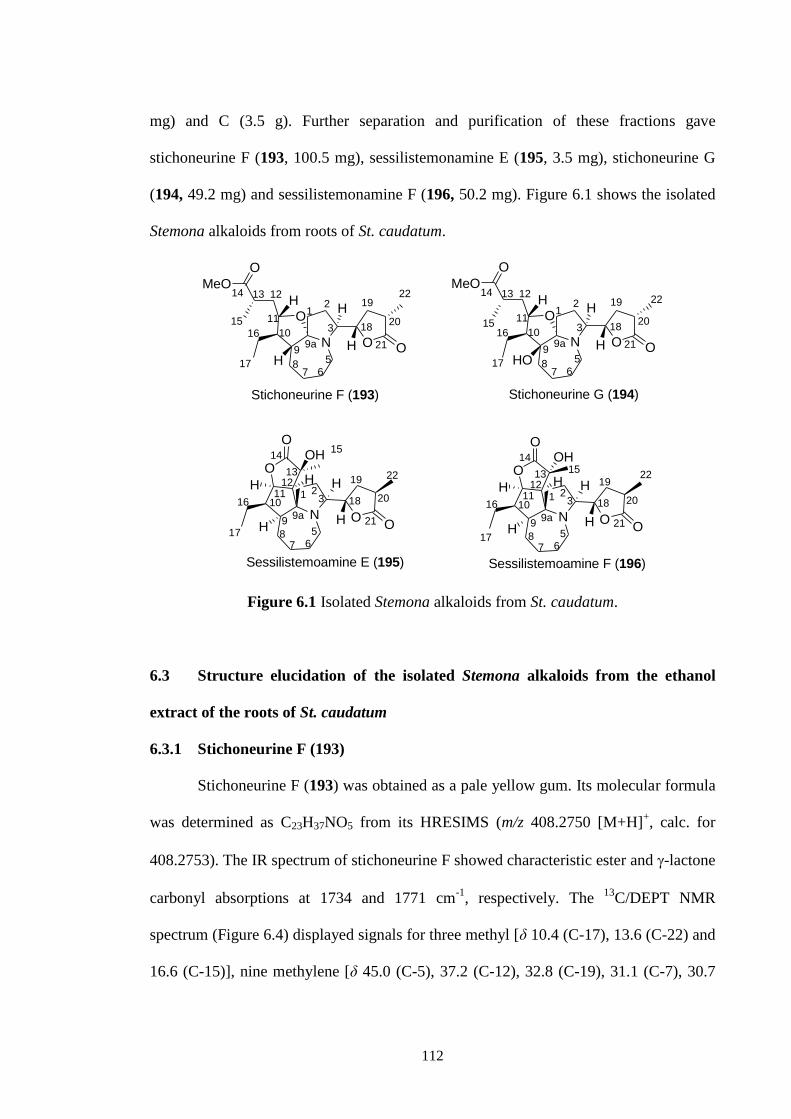
112
mg) and C (3.5 g). Further separation and purification of these fractions gave
stichoneurine F (193, 100.5 mg), sessilistemonamine E (195, 3.5 mg), stichoneurine G
(194, 49.2 mg) and sessilistemonamine F (196, 50.2 mg). Figure 6.1 shows the isolated
Stemona alkaloids from roots of St. caudatum.
N
O
O
MeO
O
OH
H
H
Stichoneurine F (193)
111
109a
9
87 6
5
3
2
1815
14 13 12
16
22
21
20
19
17
Sessilistemoamine E (195)
21
2110
9a9
87 6
5
22
20
19
18
1514
11
17
3
1312
16
H
N O
O
O
O
H H
H
H
H
OH
Sessilistemoamine F (196)
Stichoneurine G (194)
N
O
O
MeO
O
OH
H
HO
111
109a
9
87 6
5
3
2
1815
14 13 12
16
22
21
20
19
17
H
21
2110
9a9
87 6
5
22
20
19
18
1514
11
17
3
1312
16
N O
O
O
O
H H
H
H
H
OH
Figure 6.1 Isolated Stemona alkaloids from St. caudatum.
6.3 Structure elucidation of the isolated Stemona alkaloids from the ethanol
extract of the roots of St. caudatum
6.3.1 Stichoneurine F (193)
Stichoneurine F (193) was obtained as a pale yellow gum. Its molecular formula
was determined as C23H37NO5 from its HRESIMS (m/z 408.2750 [M+H]+, calc. for
408.2753). The IR spectrum of stichoneurine F showed characteristic ester and -lactone
carbonyl absorptions at 1734 and 1771 cm-1
, respectively. The 13
C/DEPT NMR
spectrum (Figure 6.4) displayed signals for three methyl [δ 10.4 (C-17), 13.6 (C-22) and
16.6 (C-15)], nine methylene [δ 45.0 (C-5), 37.2 (C-12), 32.8 (C-19), 31.1 (C-7), 30.7

113
(C-1), 26.3 (C-8), 23.3 (C-16), 23.3 (C-2) and 23.0 (C-6)], five methine [δ 66.4 (C-3),
49.4 (C-9), 46.3 (C-10), 36.7 (C-13) and 34.7 (C-20)], two oxymethines [δ 82.1 (C-18)
and 76.6 (C-11)] and three quaternary [δ 180.2 (C-21), 176.9 (C-14) and 104.5 (C-9a)]
carbons and a methoxy group [δ 50.3] (Table 1). The correlations in the COSY
spectrum indicated the spin system H-1−H-2−H-3−H-18−H-19−H-20−H-22, typical of
the pyrrolidine ring of the Stemona alkaloids, with a -lactone substituent at C-3 (Figure
6.2). However, unlike many of these alkaloids, C-9a in 193 was a quaternary carbon,
and not a methine, since H-1 showed only a COSY correlation to H-2.2,12,74,75
COSY
correlations were also observed between the vicinal pairs of contiguous protons along
the C-5−C-13 backbone, with vicinal correlations also seen between H-10 and H-16; H-
16 and H-17; and H-13 and H-15 (Figure 6.2). The 1H NMR/COSY spectra (Table 6.1)
indicated the presence of two different methyl groups from the signals at δ 1.16 (d, J =
6.5 Hz, 3H, H-22) and δ 1.12 (d, J = 7.0 Hz, 3H, H-15), that are attached to methines
with resonances at δ 2.73-2.63 (m, 1H, H-20) and δ 2.72-2.63 (m, 1H, H-13), and a
methyl group at δ 0.90 (t, J = 7.5 Hz, 3H, H-17) which is vicinally coupled to the
methylene resonance at δ 1.46−1.26 (m, 2H, H-16). Key HMBC correlations for
stichoneurine F (193) are shown in Figure 6.2, while full details are provided in Table
6.1.
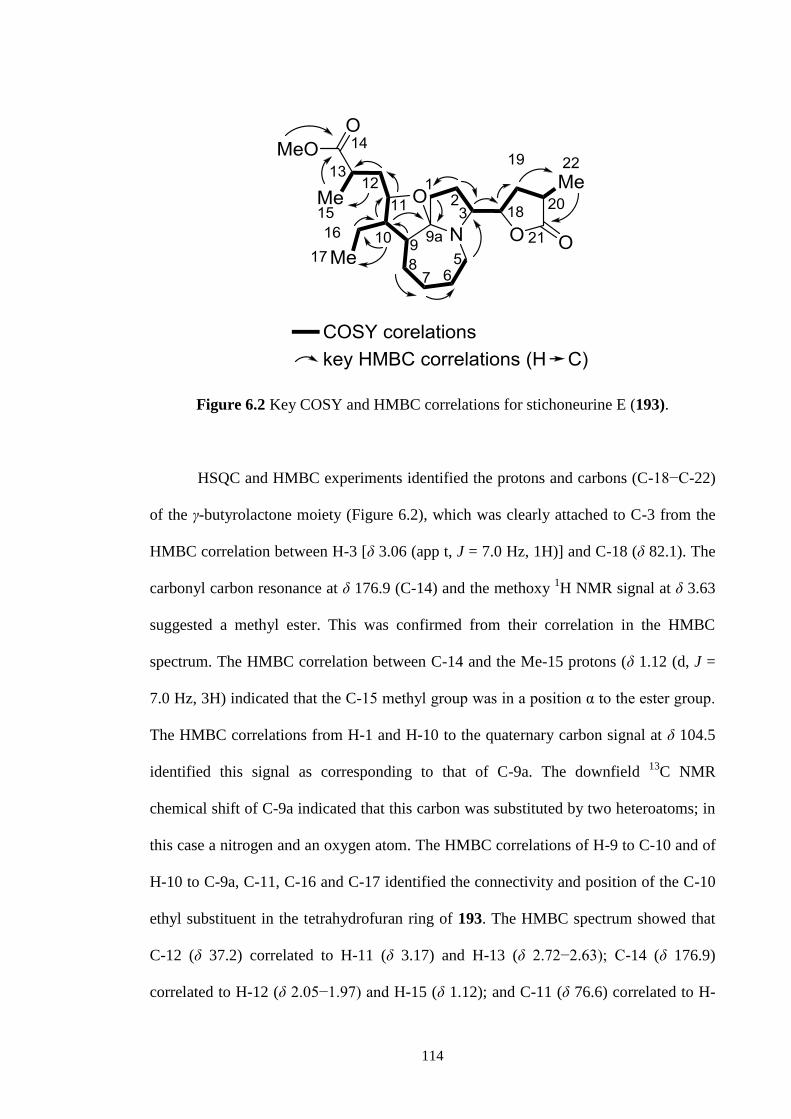
114
Figure 6.2 Key COSY and HMBC correlations for stichoneurine E (193).
HSQC and HMBC experiments identified the protons and carbons (C-18−C-22)
of the γ-butyrolactone moiety (Figure 6.2), which was clearly attached to C-3 from the
HMBC correlation between H-3 [δ 3.06 (app t, J = 7.0 Hz, 1H)] and C-18 (δ 82.1). The
carbonyl carbon resonance at δ 176.9 (C-14) and the methoxy 1H NMR signal at δ 3.63
suggested a methyl ester. This was confirmed from their correlation in the HMBC
spectrum. The HMBC correlation between C-14 and the Me-15 protons (δ 1.12 (d, J =
7.0 Hz, 3H) indicated that the C-15 methyl group was in a position α to the ester group.
The HMBC correlations from H-1 and H-10 to the quaternary carbon signal at δ 104.5
identified this signal as corresponding to that of C-9a. The downfield 13
C NMR
chemical shift of C-9a indicated that this carbon was substituted by two heteroatoms; in
this case a nitrogen and an oxygen atom. The HMBC correlations of H-9 to C-10 and of
H-10 to C-9a, C-11, C-16 and C-17 identified the connectivity and position of the C-10
ethyl substituent in the tetrahydrofuran ring of 193. The HMBC spectrum showed that
C-12 (δ 37.2) correlated to H-11 (δ 3.17) and H-13 (δ 2.72−2.63); C-14 (δ 176.9)
correlated to H-12 (δ 2.05−1.97) and H-15 (δ 1.12); and C-11 (δ 76.6) correlated to H-
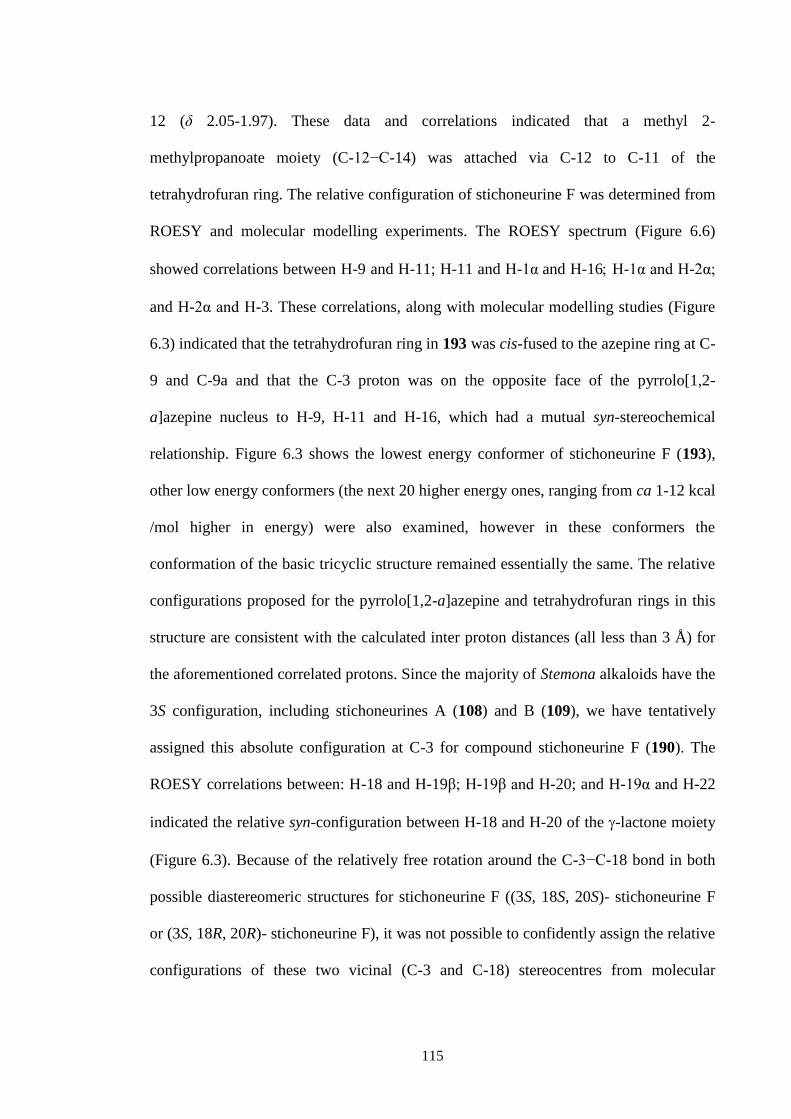
115
12 (δ 2.05-1.97). These data and correlations indicated that a methyl 2-
methylpropanoate moiety (C-12−C-14) was attached via C-12 to C-11 of the
tetrahydrofuran ring. The relative configuration of stichoneurine F was determined from
ROESY and molecular modelling experiments. The ROESY spectrum (Figure 6.6)
showed correlations between H-9 and H-11; H-11 and H-1αand H-16 H-1α and H-2α;
and H-2α and H-3. These correlations, along with molecular modelling studies (Figure
6.3) indicated that the tetrahydrofuran ring in 193 was cis-fused to the azepine ring at C-
9 and C-9a and that the C-3 proton was on the opposite face of the pyrrolo[1,2-
a]azepine nucleus to H-9, H-11 and H-16, which had a mutual syn-stereochemical
relationship. Figure 6.3 shows the lowest energy conformer of stichoneurine F (193),
other low energy conformers (the next 20 higher energy ones, ranging from ca 1-12 kcal
/mol higher in energy) were also examined, however in these conformers the
conformation of the basic tricyclic structure remained essentially the same. The relative
configurations proposed for the pyrrolo[1,2-a]azepine and tetrahydrofuran rings in this
structure are consistent with the calculated inter proton distances (all less than 3 Å) for
the aforementioned correlated protons. Since the majority of Stemona alkaloids have the
3S configuration, including stichoneurines A (108) and B (109), we have tentatively
assigned this absolute configuration at C-3 for compound stichoneurine F (190). The
ROESY correlations between: H-18 and H-19β; H-19β and H-20; and H-19α and H-22
indicated the relative syn-configuration between H-18 and H-20 of the -lactone moiety
(Figure 6.3). Because of the relatively free rotation around the C-3−C-18 bond in both
possible diastereomeric structures for stichoneurine F ((3S, 18S, 20S)- stichoneurine F
or (3S, 18R, 20R)- stichoneurine F), it was not possible to confidently assign the relative
configurations of these two vicinal (C-3 and C-18) stereocentres from molecular
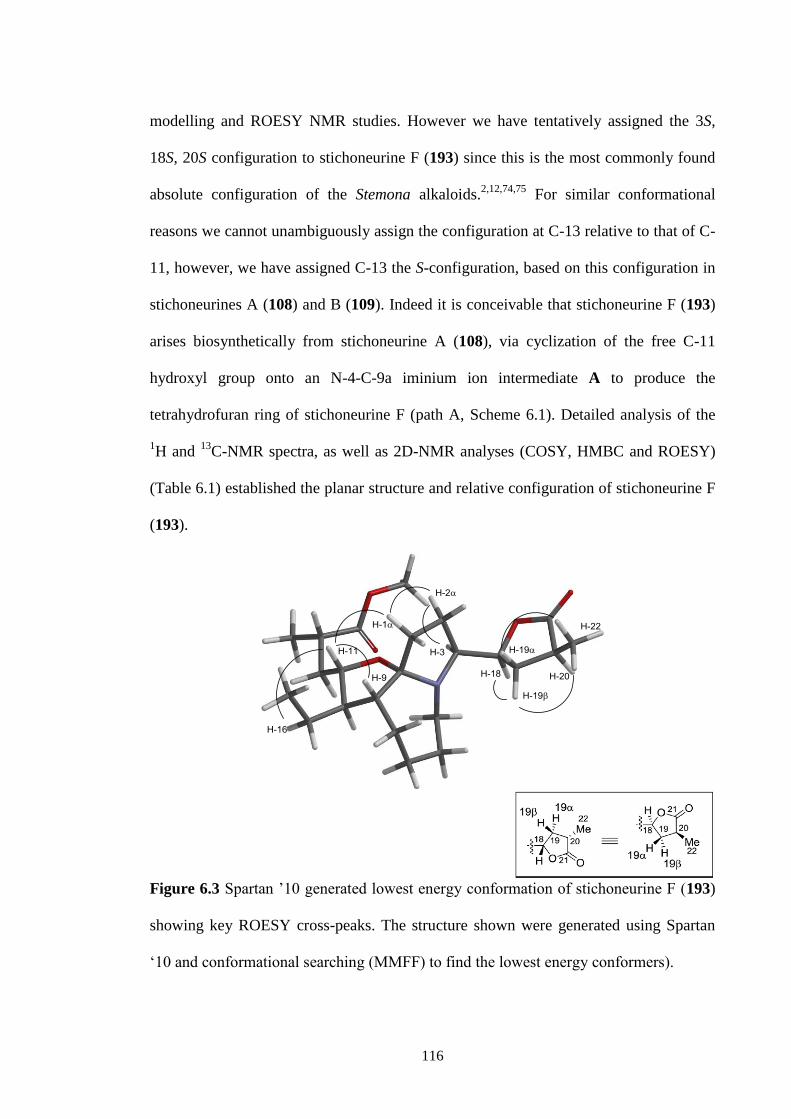
116
modelling and ROESY NMR studies. However we have tentatively assigned the 3S,
18S, 20S configuration to stichoneurine F (193) since this is the most commonly found
absolute configuration of the Stemona alkaloids.2,12,74,75
For similar conformational
reasons we cannot unambiguously assign the configuration at C-13 relative to that of C-
11, however, we have assigned C-13 the S-configuration, based on this configuration in
stichoneurines A (108) and B (109). Indeed it is conceivable that stichoneurine F (193)
arises biosynthetically from stichoneurine A (108), via cyclization of the free C-11
hydroxyl group onto an N-4-C-9a iminium ion intermediate A to produce the
tetrahydrofuran ring of stichoneurine F (path A, Scheme 6.1). Detailed analysis of the
1H and
13C-NMR spectra, as well as 2D-NMR analyses (COSY, HMBC and ROESY)
(Table 6.1) established the planar structure and relative configuration of stichoneurine F
(193).
Figure 6.3 Spartan ’10 generated lowest energy conformation of stichoneurine F (193)
showing key ROESY cross-peaks. The structure shown were generated using Spartan
‘10 and conformational searching (MMFF) to find the lowest energy conformers).
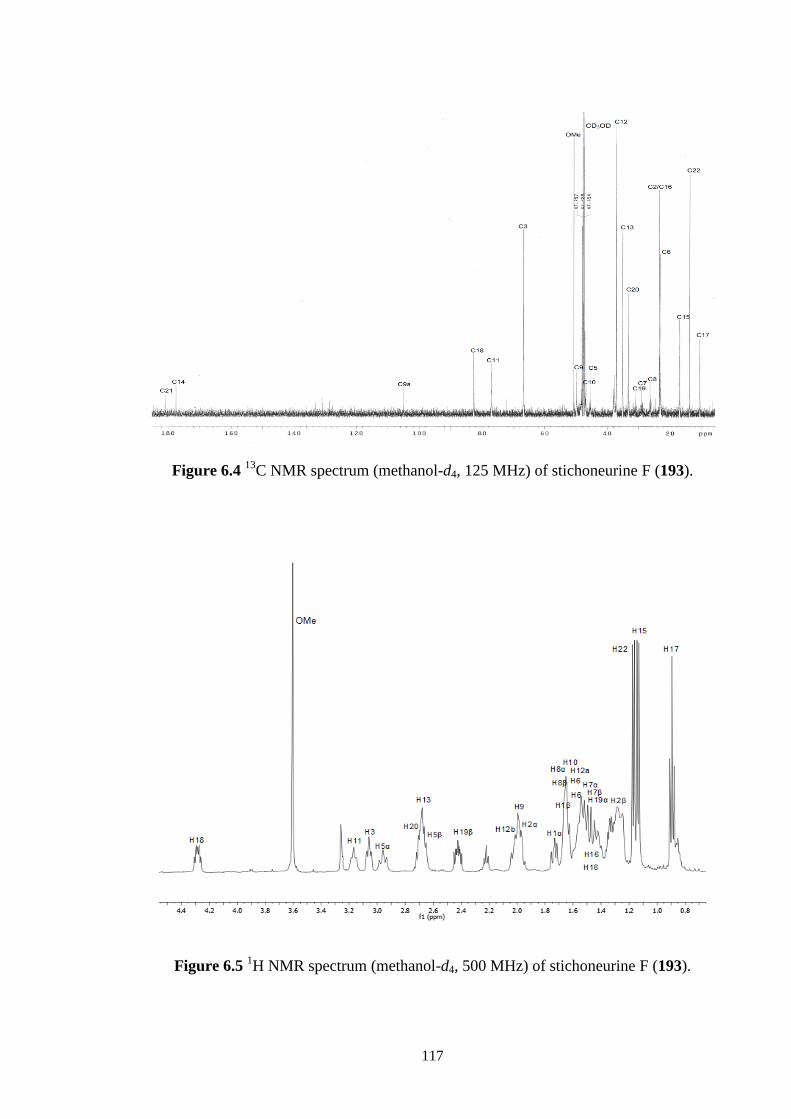
117
Figure 6.4 13
C NMR spectrum (methanol-d4, 125 MHz) of stichoneurine F (193).
Figure 6.5 1H NMR spectrum (methanol-d4, 500 MHz) of stichoneurine F (193).
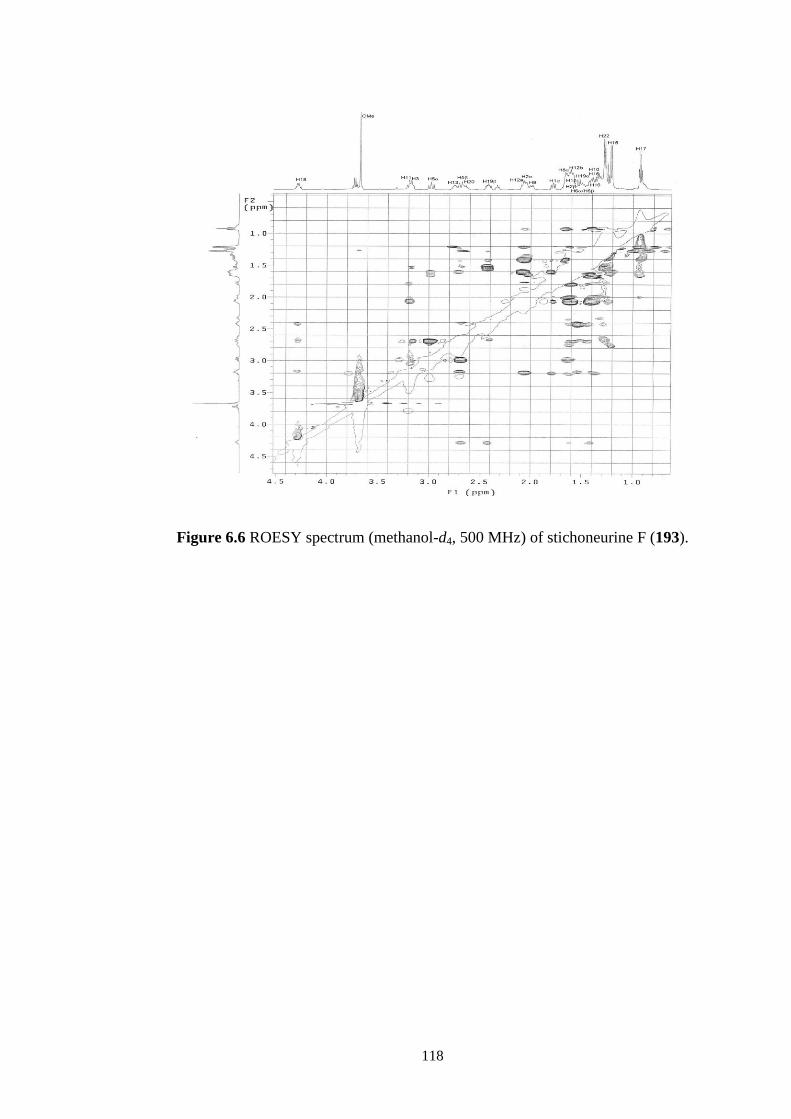
118
Figure 6.6 ROESY spectrum (methanol-d4, 500 MHz) of stichoneurine F (193).
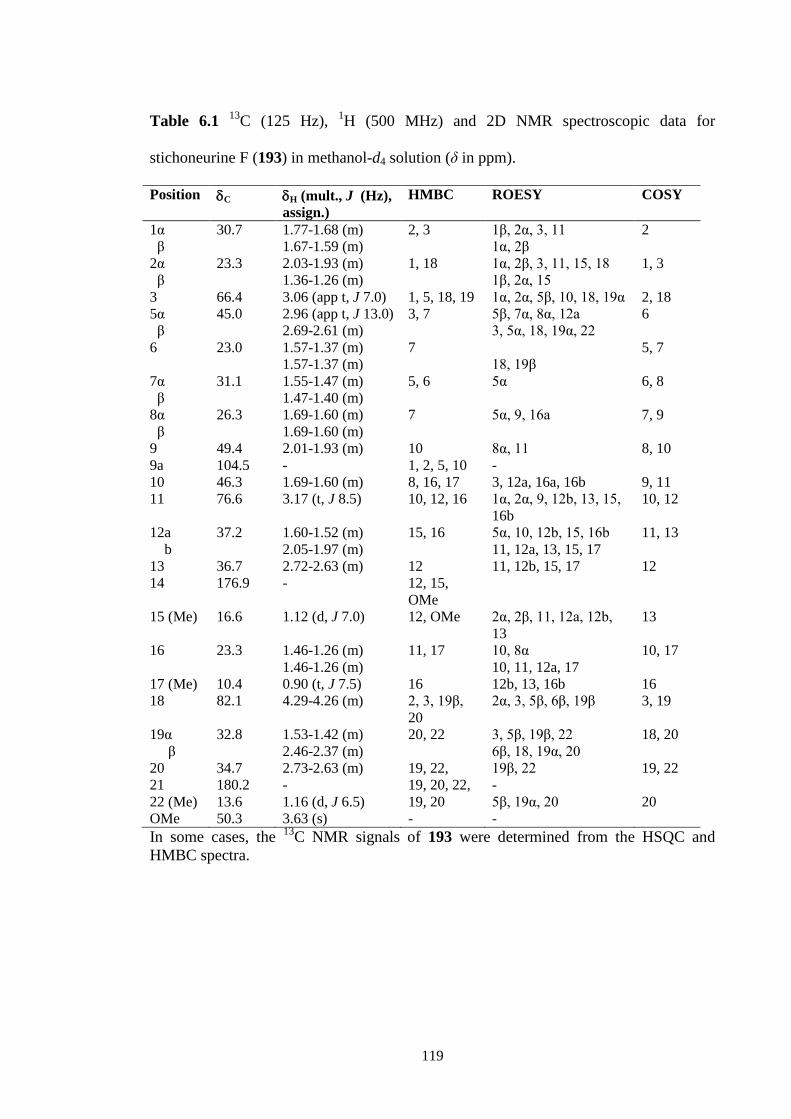
119
Table 6.1 13
C (125 Hz), 1H (500 MHz) and 2D NMR spectroscopic data for
stichoneurine F (193) in methanol-d4 solution (δ in ppm).
Position C H (mult., J (Hz),
assign.)
HMBC ROESY COSY
1α 30.7 1.77-1.68 (m) 2, 3 1β, 2α, 3, 11 2
β 1.67-1.59 (m) 1α, 2β
2α 23.3 2.03-1.93 (m) 1, 18 1α, 2β, 3, 11, 15, 18 1, 3
β 1.36-1.26 (m) 1β, 2α, 15
3 66.4 3.06 (app t, J 7.0) 1, 5, 18, 19 1α, 2α, 5β, 10, 18, 19α 2, 18
5α 45.0 2.96 (app t, J 13.0) 3, 7 5β, 7α, 8α, 12a 6
β 2.69-2.61 (m) 3, 5α, 18, 19α, 22
6 23.0 1.57-1.37 (m) 7 5, 7
1.57-1.37 (m) 18, 19β
7α 31.1 1.55-1.47 (m) 5, 6 5α 6, 8
β 1.47-1.40 (m)
8α 26.3 1.69-1.60 (m) 7 5α, 9, 16a 7, 9
β 1.69-1.60 (m)
9 49.4 2.01-1.93 (m) 10 8α, 11 8, 10
9a 104.5 - 1, 2, 5, 10 -
10 46.3 1.69-1.60 (m) 8, 16, 17 3, 12a, 16a, 16b 9, 11
11 76.6 3.17 (t, J 8.5) 10, 12, 16 1α, 2α, 9, 12b, 13, 15,
16b
10, 12
12a 37.2 1.60-1.52 (m) 15, 16 5α, 10, 12b, 15, 16b 11, 13
b 2.05-1.97 (m) 11, 12a, 13, 15, 17
13 36.7 2.72-2.63 (m) 12 11, 12b, 15, 17 12
14 176.9 - 12, 15,
OMe
15 (Me) 16.6 1.12 (d, J 7.0) 12, OMe 2α, 2β, 11, 12a, 12b,
13
13
16 23.3 1.46-1.26 (m) 11, 17 10, 8α 10, 17
1.46-1.26 (m) 10, 11, 12a, 17
17 (Me) 10.4 0.90 (t, J 7.5) 16 12b, 13, 16b 16
18 82.1 4.29-4.26 (m) 2, 3, 19β,
20
2α, 3, 5β, 6β, 19β 3, 19
19α 32.8 1.53-1.42 (m) 20, 22 3, 5β, 19β, 22 18, 20
β 2.46-2.37 (m) 6β, 18, 19α, 20
20 34.7 2.73-2.63 (m) 19, 22, 19β, 22 19, 22
21 180.2 - 19, 20, 22, -
22 (Me) 13.6 1.16 (d, J 6.5) 19, 20 5β, 19α, 20 20
OMe 50.3 3.63 (s) - -
In some cases, the 13
C NMR signals of 193 were determined from the HSQC and
HMBC spectra.
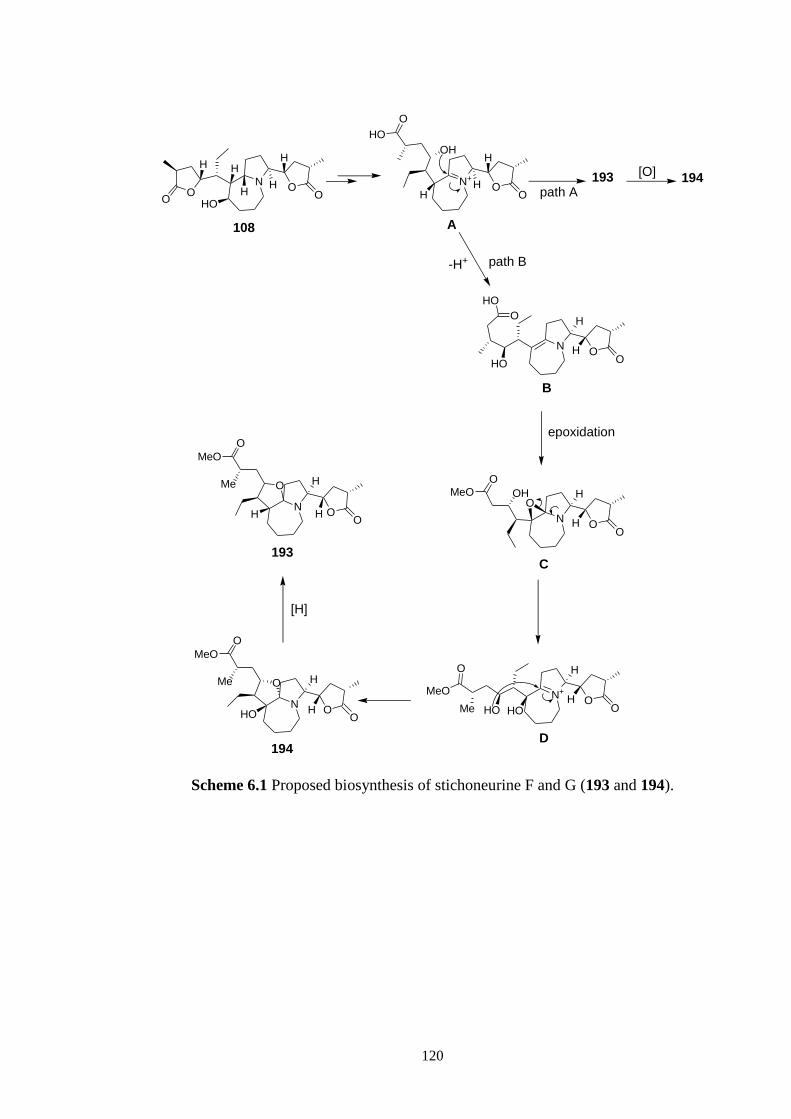
120
N
H
HOO
H
OO
H
H
108
N+
OOH
193 194path A
path B
NO
O
epoxidation
[O]
NO
O
OOH
B
A
C
N+
OO
D
NO
O
OMe
HO
194
[H]
193
O
MeO H
H
H
H
HO
-H+
H
HHOHO
MeO
Me
O
O
MeO
NO
O
OMe
O
MeO
HO
H
H
OH
HO
O
HO
O
H
H
H
H
H
Scheme 6.1 Proposed biosynthesis of stichoneurine F and G (193 and 194).
121
6.3.2 Stichoneurine G (194)
Stichoneurine G (194) was obtained as a pale yellow gum. The molecular
formula of stichoneurine G (194) as C23H37NO6 was determined from its HRESIMS
(m/z 424.2699 [M+H]+, calc. for 424.2682). This data indicated that stichoneurine G
(194) had one more oxygen atom than stichoneurine F (193). The IR spectrum of
stichoneurine G (194) showed characteristic alcohol, ester and -lactone carbonyl
absorptions at 3520, 1730 and 1761 cm-1
, respectively. The 13
C/DEPT NMR spectrum
of stichoneurine G (194) (Figure 6.7) was similar to that of stichoneurine F (193) except
for the number of methine and quaternary carbons, which were both four, indicating that
one methine carbon in stichoneurine F (193) had become a quaternary carbon in
stichoneurine G (194). The signal for the new quaternary carbon at δ 83.7 (C-9)
suggested that this carbon was substituted by the hydroxyl group that was observed in
the IR spectrum. There were 13
C/DEPT NMR signals for three methyl [δ 12.3 (C-17),
13.6 (C-22) and 17.1 (C-15)], nine methylene [δ 45.6 (C-5), 38.1 (C-12), 33.5 (C-19),
36.2 (C-7), 33.8 (C-1), 30.6 (C-8), 23.9 (C-6), 22.5 (C-2) and 17.9 (C-16)], four methine
[δ 67.9 (C-3), 51.1 (C-10), 37.2 (C-20) and 35.4 (C-13)], two oxymethine [δ 82.9 (C-18)
and 76.1 (C-11)] and four quaternary carbons [δ 181.2 (C-21), 177.8 (C-14), 109.1 (C-
9a) and 83.7 (C-9)] and a methoxy group [δ 50.9]. The COSY and HMBC spectra of
stichoneurine G (194) showed analogous correlations to those observed in that of
stichoneurine F (193), except that the correlations observed from H-9 in the spectrum of
stichoneurine F (193) were now absent. The ROESY spectrum of stichoneurine G (194)
(Figure 6.9) showed correlations between H-11 and H-1and H-16; H-1 and H-2;
and H-2 and H-3, which were also found in the ROESY spectrum of structure
stichoneurine F (193) (Figure 6.6), and correlations between H-18 and H-19; H-19

122
and H-20; and H-19 and H-22 which indicated the relative syn-configuration between
H-18 and H-20 of the -lactone moiety. This data was thus consistent with stichoneurine
G (194) being the C-9 hydroxy derivative of stichoneurine F (193). A possible
biosynthesis of 194 is outline in Scheme 6.1. Stichoneurine G (194) could arise from
oxidation of 193 at C-9 (Scheme 6.1, path A) or from conversion of the iminium ion
intermediate A to the enamine B (Scheme 6.1, path B), which upon epoxidation could
give the epoxide C. Ring opening of C could give the iminium ion D which could
cyclise to 194 (Scheme 6.1).
Figure 6.7 13
C NMR spectrum (methanol-d4, 125 MHz) of stichoneurine G (194).

123
Figure 6.8 1H NMR spectrum (methanol-d4, 500 MHz) of stichoneurine G (194).
Figure 6.9 ROESY spectrum (methanol-d4, 500 MHz) of stichoneurine G (194).
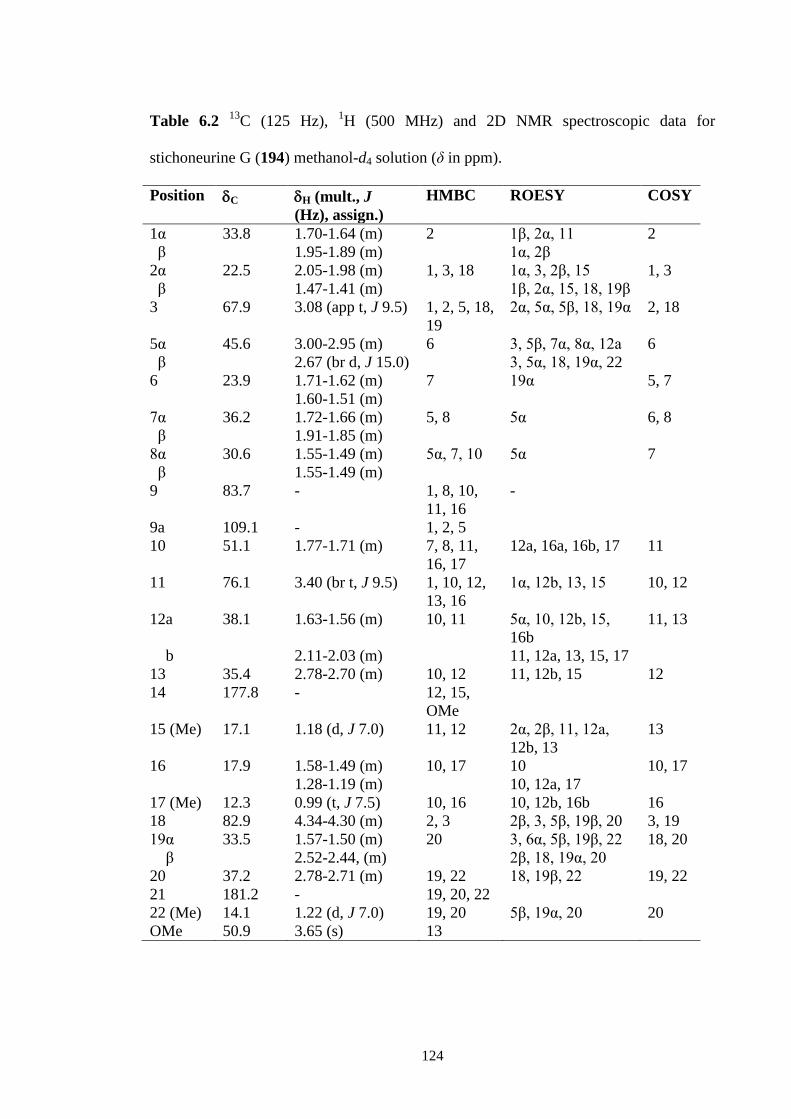
124
Table 6.2 13
C (125 Hz), 1H (500 MHz) and 2D NMR spectroscopic data for
stichoneurine G (194) methanol-d4 solution (δ in ppm).
Position C H (mult., J
(Hz), assign.)
HMBC ROESY COSY
1α 33.8 1.70-1.64 (m) 2 1β, 2α, 11 2
β 1.95-1.89 (m) 1α, 2β
2α 22.5 2.05-1.98 (m) 1, 3, 18 1α, 3, 2β, 15 1, 3
β 1.47-1.41 (m) 1β, 2α, 15, 18, 19β
3 67.9 3.08 (app t, J 9.5) 1, 2, 5, 18,
19
2α, 5α, 5β, 18, 19α 2, 18
5α 45.6 3.00-2.95 (m) 6 3, 5β, 7α, 8α, 12a 6
β 2.67 (br d, J 15.0) 3, 5α, 18, 19α, 22
6 23.9 1.71-1.62 (m) 7 19α 5, 7
1.60-1.51 (m)
7α 36.2 1.72-1.66 (m) 5, 8 5α 6, 8
β 1.91-1.85 (m)
8α 30.6 1.55-1.49 (m) 5α, 7, 10 5α 7
β 1.55-1.49 (m)
9 83.7 - 1, 8, 10,
11, 16
-
9a 109.1 - 1, 2, 5
10 51.1 1.77-1.71 (m) 7, 8, 11,
16, 17
12a, 16a, 16b, 17 11
11 76.1 3.40 (br t, J 9.5) 1, 10, 12,
13, 16
1α, 12b, 13, 15 10, 12
12a 38.1 1.63-1.56 (m) 10, 11 5α, 10, 12b, 15,
16b
11, 13
b 2.11-2.03 (m) 11, 12a, 13, 15, 17
13 35.4 2.78-2.70 (m) 10, 12 11, 12b, 15 12
14 177.8 - 12, 15,
OMe
15 (Me) 17.1 1.18 (d, J 7.0) 11, 12 2α, 2β, 11, 12a,
12b, 13
13
16 17.9 1.58-1.49 (m) 10, 17 10 10, 17
1.28-1.19 (m) 10, 12a, 17
17 (Me) 12.3 0.99 (t, J 7.5) 10, 16 10, 12b, 16b 16
18 82.9 4.34-4.30 (m) 2, 3 2β, 3, 5β, 19β, 20 3, 19
19α 33.5 1.57-1.50 (m) 20 3, 6α, 5β, 19β, 22 18, 20
β 2.52-2.44, (m) 2β, 18, 19α, 20
20 37.2 2.78-2.71 (m) 19, 22 18, 19β, 22 19, 22
21 181.2 - 19, 20, 22
22 (Me) 14.1 1.22 (d, J 7.0) 19, 20 5β, 19α, 20 20
OMe 50.9 3.65 (s) 13
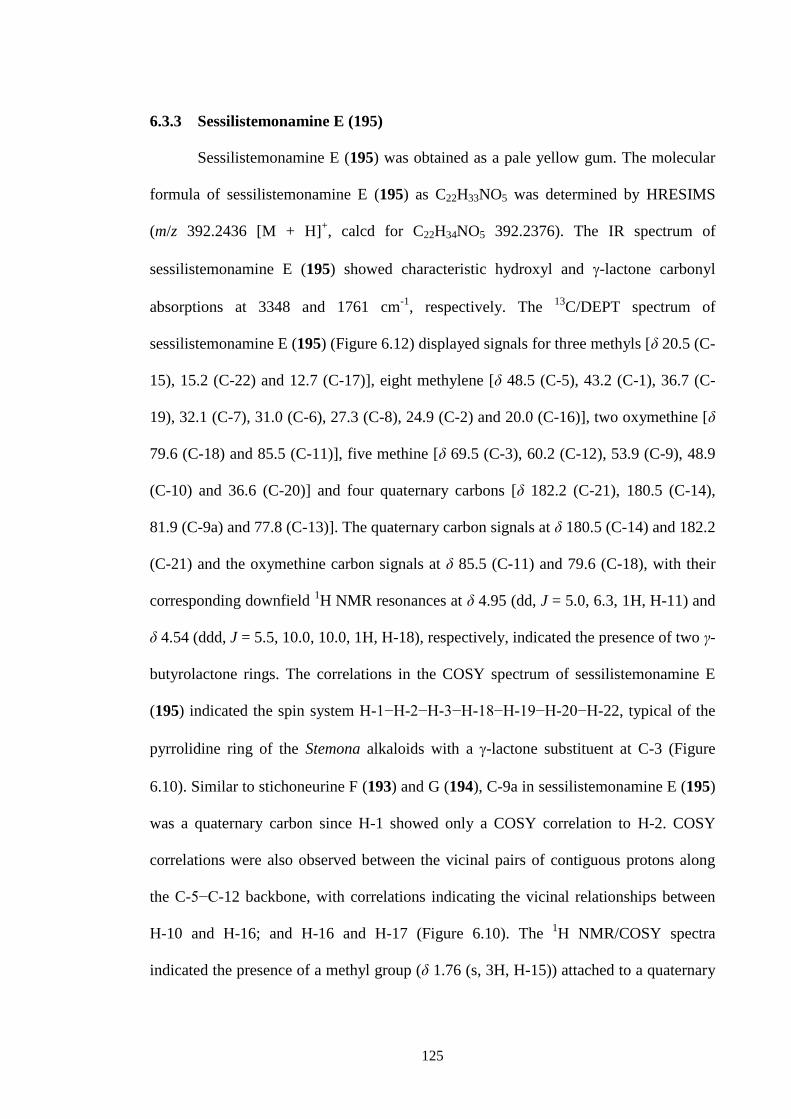
125
6.3.3 Sessilistemonamine E (195)
Sessilistemonamine E (195) was obtained as a pale yellow gum. The molecular
formula of sessilistemonamine E (195) as C22H33NO5 was determined by HRESIMS
(m/z 392.2436 [M + H]+, calcd for C22H34NO5 392.2376). The IR spectrum of
sessilistemonamine E (195) showed characteristic hydroxyl and -lactone carbonyl
absorptions at 3348 and 1761 cm-1
, respectively. The 13
C/DEPT spectrum of
sessilistemonamine E (195) (Figure 6.12) displayed signals for three methyls [δ 20.5 (C-
15), 15.2 (C-22) and 12.7 (C-17)], eight methylene [δ 48.5 (C-5), 43.2 (C-1), 36.7 (C-
19), 32.1 (C-7), 31.0 (C-6), 27.3 (C-8), 24.9 (C-2) and 20.0 (C-16)], two oxymethine [δ
79.6 (C-18) and 85.5 (C-11)], five methine [δ 69.5 (C-3), 60.2 (C-12), 53.9 (C-9), 48.9
(C-10) and 36.6 (C-20)] and four quaternary carbons [δ 182.2 (C-21), 180.5 (C-14),
81.9 (C-9a) and 77.8 (C-13)]. The quaternary carbon signals at δ 180.5 (C-14) and 182.2
(C-21) and the oxymethine carbon signals at δ 85.5 (C-11) and 79.6 (C-18), with their
corresponding downfield 1H NMR resonances at δ 4.95 (dd, J = 5.0, 6.3, 1H, H-11) and
δ 4.54 (ddd, J = 5.5, 10.0, 10.0, 1H, H-18), respectively, indicated the presence of two γ-
butyrolactone rings. The correlations in the COSY spectrum of sessilistemonamine E
(195) indicated the spin system H-1−H-2−H-3−H-18−H-19−H-20−H-22, typical of the
pyrrolidine ring of the Stemona alkaloids with a -lactone substituent at C-3 (Figure
6.10). Similar to stichoneurine F (193) and G (194), C-9a in sessilistemonamine E (195)
was a quaternary carbon since H-1 showed only a COSY correlation to H-2. COSY
correlations were also observed between the vicinal pairs of contiguous protons along
the C-5−C-12 backbone, with correlations indicating the vicinal relationships between
H-10 and H-16; and H-16 and H-17 (Figure 6.10). The 1H NMR/COSY spectra
indicated the presence of a methyl group (δ 1.76 (s, 3H, H-15)) attached to a quaternary
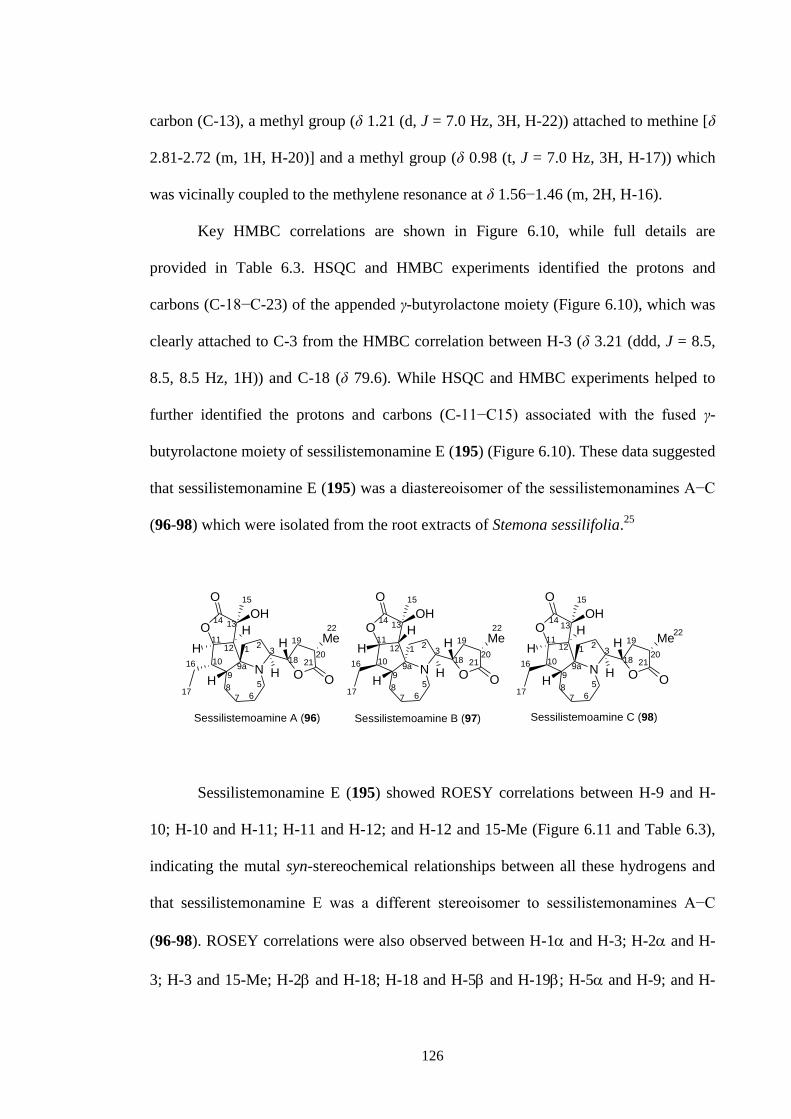
126
carbon (C-13), a methyl group (δ 1.21 (d, J = 7.0 Hz, 3H, H-22)) attached to methine [δ
2.81-2.72 (m, 1H, H-20)] and a methyl group (δ 0.98 (t, J = 7.0 Hz, 3H, H-17)) which
was vicinally coupled to the methylene resonance at δ 1.56−1.46 (m, 2H, H-16).
Key HMBC correlations are shown in Figure 6.10, while full details are
provided in Table 6.3. HSQC and HMBC experiments identified the protons and
carbons (C-18−C-23) of the appended γ-butyrolactone moiety (Figure 6.10), which was
clearly attached to C-3 from the HMBC correlation between H-3 (δ 3.21 (ddd, J = 8.5,
8.5, 8.5 Hz, 1H)) and C-18 (δ 79.6). While HSQC and HMBC experiments helped to
further identified the protons and carbons (C-11−C15) associated with the fused γ-
butyrolactone moiety of sessilistemonamine E (195) (Figure 6.10). These data suggested
that sessilistemonamine E (195) was a diastereoisomer of the sessilistemonamines A−C
(96-98) which were isolated from the root extracts of Stemona sessilifolia.25
N O O
MeH
HH
HO
O
OH
1
9a9
10
1112H 2
3
5
67
8
1314
15
16
17
18
19
2021
22
N O O
MeH
HH
HO
O
OH
1
9a9
10
1112H 2
3
5
67
8
1314
15
16
17
18
19
2021
22
N O O
MeH
HH
HO
O
OH
1
9a9
10
1112H 2
3
5
67
8
1314
15
16
17
18
19
2021
22
Sessilistemoamine A (96) Sessilistemoamine B (97) Sessilistemoamine C (98)
Sessilistemonamine E (195) showed ROESY correlations between H-9 and H-
10; H-10 and H-11; H-11 and H-12; and H-12 and 15-Me (Figure 6.11 and Table 6.3),
indicating the mutal syn-stereochemical relationships between all these hydrogens and
that sessilistemonamine E was a different stereoisomer to sessilistemonamines A−C
(96-98). ROSEY correlations were also observed between H-1 and H-3; H-2 and H-
3; H-3 and 15-Me; H-2 and H-18; H-18 and H-5 and H-19; H-5 and H-9; and H-
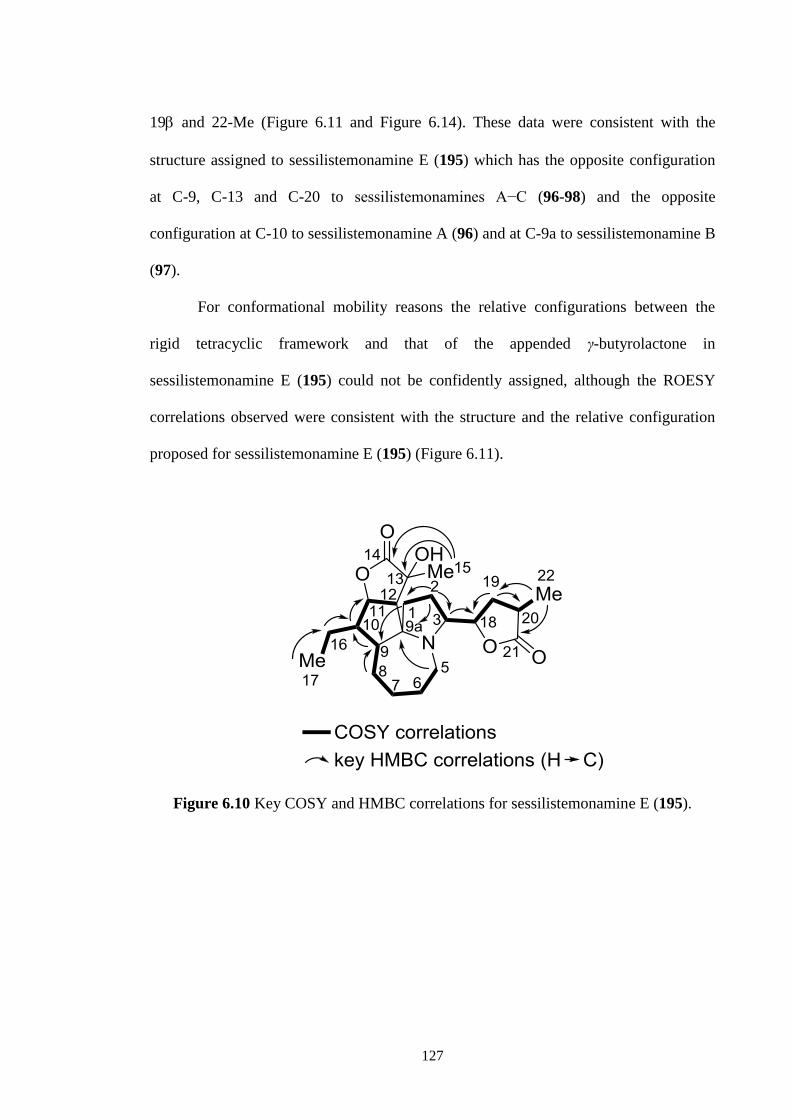
127
19 and 22-Me (Figure 6.11 and Figure 6.14). These data were consistent with the
structure assigned to sessilistemonamine E (195) which has the opposite configuration
at C-9, C-13 and C-20 to sessilistemonamines A−C (96-98) and the opposite
configuration at C-10 to sessilistemonamine A (96) and at C-9a to sessilistemonamine B
(97).
For conformational mobility reasons the relative configurations between the
rigid tetracyclic framework and that of the appended γ-butyrolactone in
sessilistemonamine E (195) could not be confidently assigned, although the ROESY
correlations observed were consistent with the structure and the relative configuration
proposed for sessilistemonamine E (195) (Figure 6.11).
Figure 6.10 Key COSY and HMBC correlations for sessilistemonamine E (195).
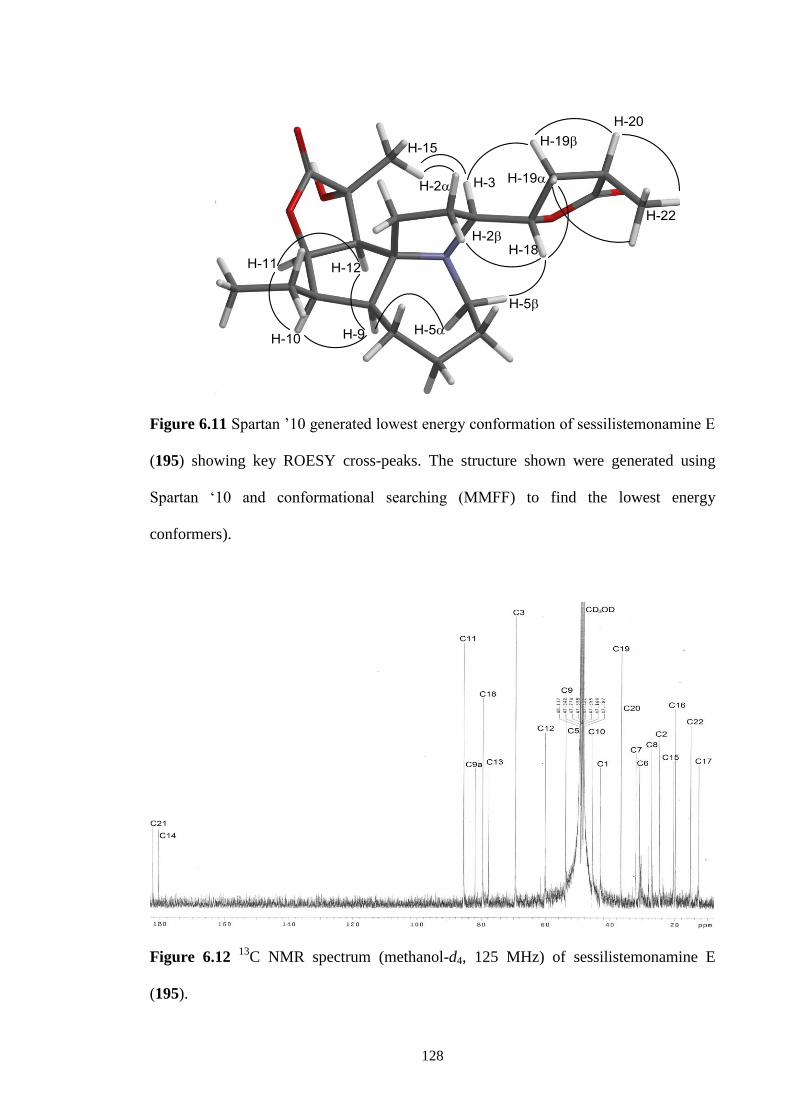
128
Figure 6.11 Spartan ’10 generated lowest energy conformation of sessilistemonamine E
(195) showing key ROESY cross-peaks. The structure shown were generated using
Spartan ‘10 and conformational searching (MMFF) to find the lowest energy
conformers).
Figure 6.12 13
C NMR spectrum (methanol-d4, 125 MHz) of sessilistemonamine E
(195).
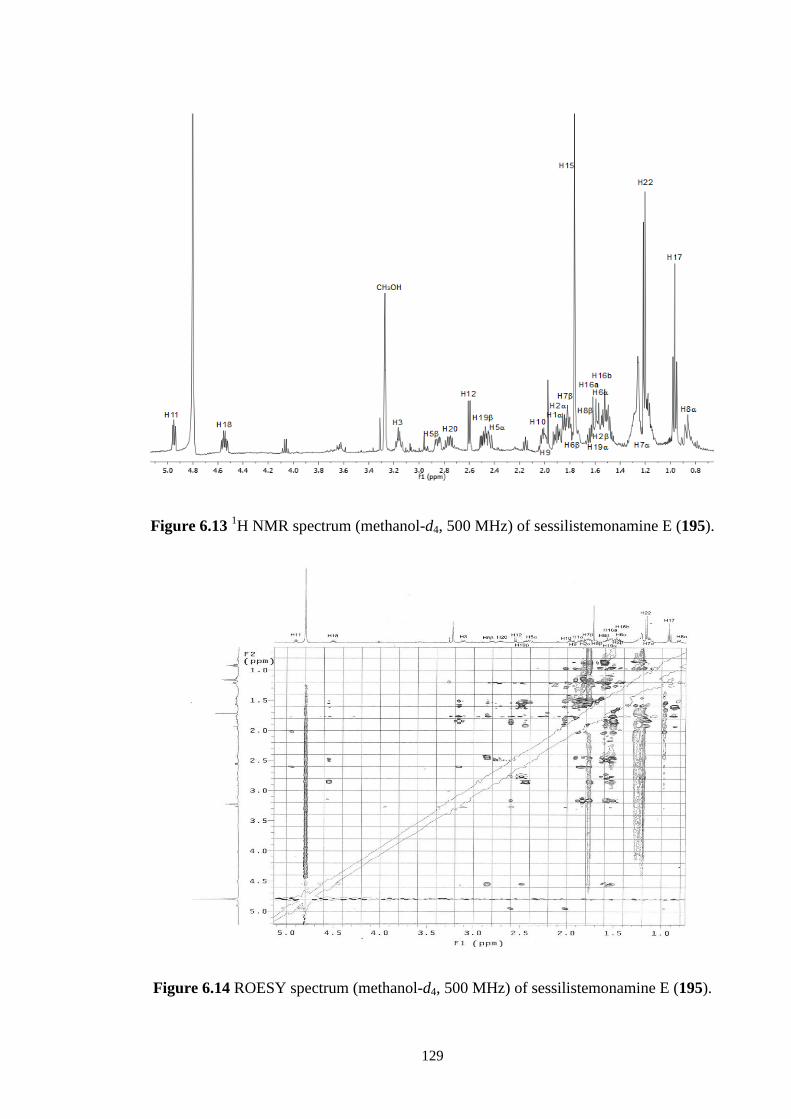
129
Figure 6.13 1H NMR spectrum (methanol-d4, 500 MHz) of sessilistemonamine E (195).
Figure 6.14 ROESY spectrum (methanol-d4, 500 MHz) of sessilistemonamine E (195).
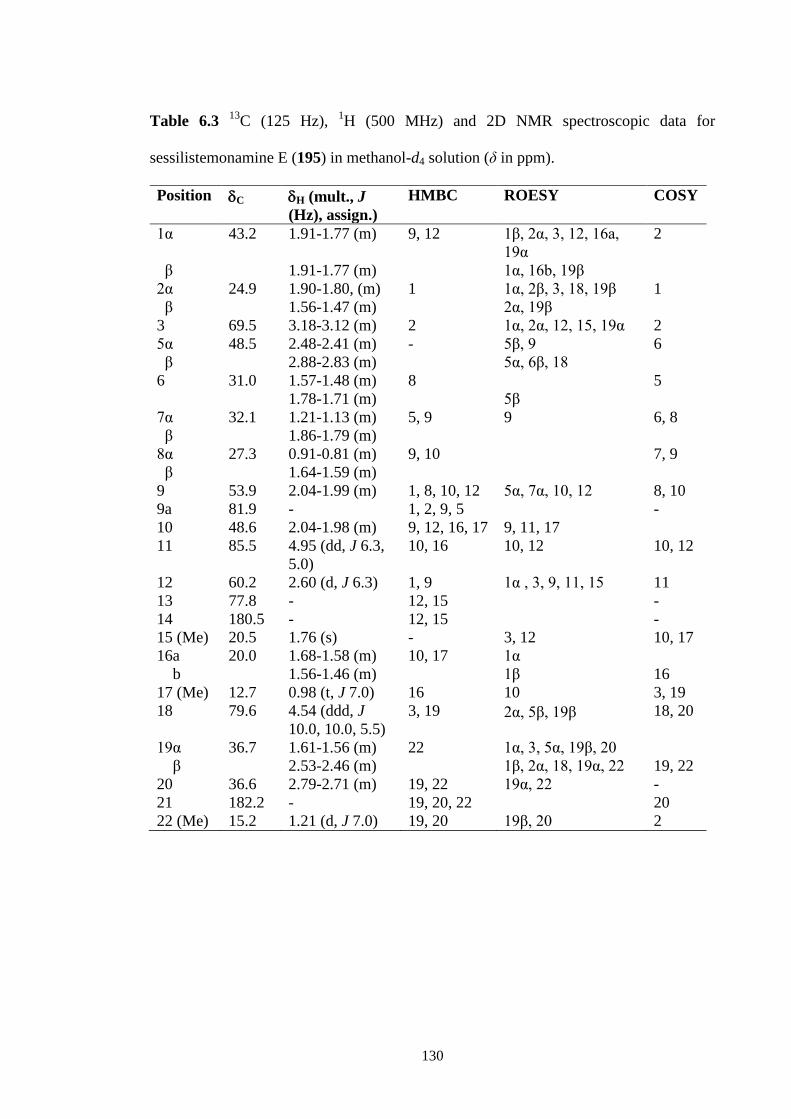
130
Table 6.3 13
C (125 Hz), 1H (500 MHz) and 2D NMR spectroscopic data for
sessilistemonamine E (195) in methanol-d4 solution (δ in ppm).
Position C H (mult., J
(Hz), assign.)
HMBC ROESY COSY
1α 43.2 1.91-1.77 (m) 9, 12 1β, 2α, 3, 12, 16a,
19α
2
β 1.91-1.77 (m) 1α, 16b, 19β
2α 24.9 1.90-1.80, (m) 1 1α, 2β, 3, 18, 19β 1
β 1.56-1.47 (m) 2α, 19β
3 69.5 3.18-3.12 (m) 2 1α, 2α, 12, 15, 19α 2
5α 48.5 2.48-2.41 (m) - 5β, 9 6
β 2.88-2.83 (m) 5α, 6β, 18
6 31.0 1.57-1.48 (m) 8 5
1.78-1.71 (m) 5β
7α 32.1 1.21-1.13 (m) 5, 9 9 6, 8
β 1.86-1.79 (m)
8α 27.3 0.91-0.81 (m) 9, 10 7, 9
β 1.64-1.59 (m)
9 53.9 2.04-1.99 (m) 1, 8, 10, 12 5α, 7α, 10, 12 8, 10
9a 81.9 - 1, 2, 9, 5 -
10 48.6 2.04-1.98 (m) 9, 12, 16, 17 9, 11, 17
11 85.5 4.95 (dd, J 6.3,
5.0)
10, 16 10, 12 10, 12
12 60.2 2.60 (d, J 6.3) 1, 9 1α , 3, 9, 11, 15 11
13 77.8 - 12, 15 -
14 180.5 - 12, 15 -
15 (Me) 20.5 1.76 (s) - 3, 12 10, 17
16a 20.0 1.68-1.58 (m) 10, 17 1α
b 1.56-1.46 (m) 1β 16
17 (Me) 12.7 0.98 (t, J 7.0) 16 10 3, 19
18 79.6 4.54 (ddd, J
10.0, 10.0, 5.5)
3, 19 2α, 5β, 19β 18, 20
19α 36.7 1.61-1.56 (m) 22 1α, 3, 5α, 19β, 20
β 2.53-2.46 (m) 1β, 2α, 18, 19α, 22 19, 22
20 36.6 2.79-2.71 (m) 19, 22 19α, 22 -
21 182.2 - 19, 20, 22 20
22 (Me) 15.2 1.21 (d, J 7.0) 19, 20 19β, 20 2
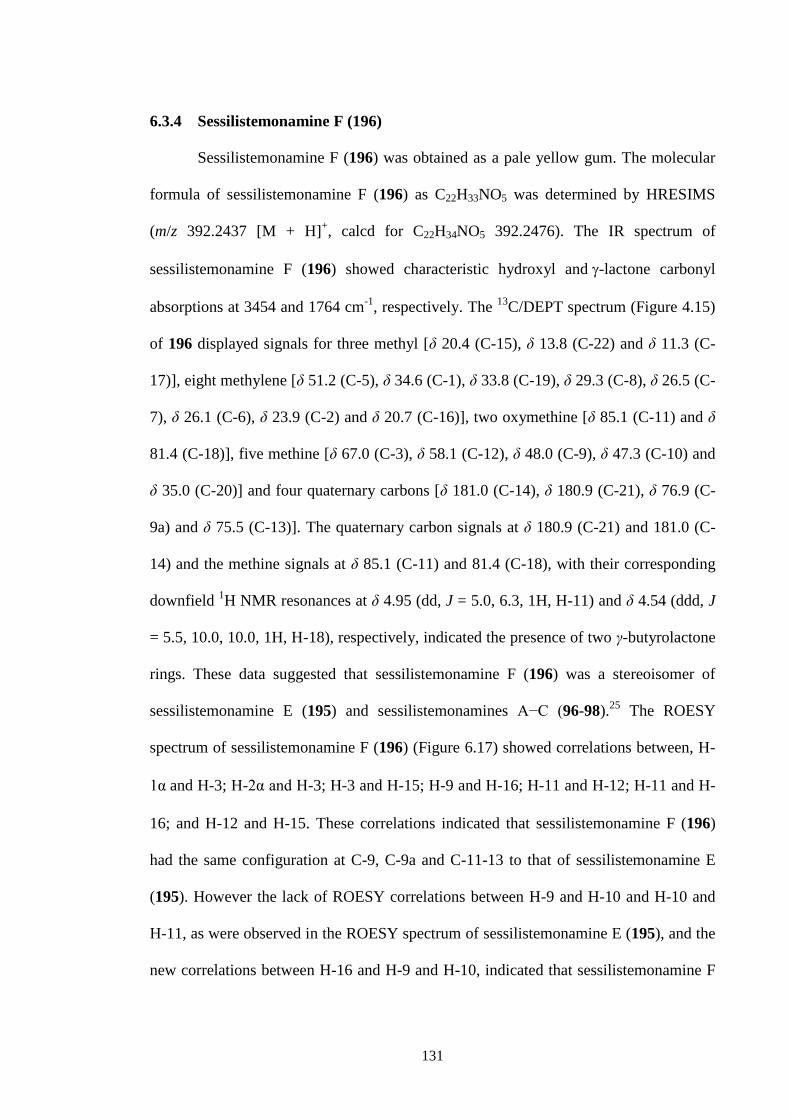
131
6.3.4 Sessilistemonamine F (196)
Sessilistemonamine F (196) was obtained as a pale yellow gum. The molecular
formula of sessilistemonamine F (196) as C22H33NO5 was determined by HRESIMS
(m/z 392.2437 [M + H]+, calcd for C22H34NO5 392.2476). The IR spectrum of
sessilistemonamine F (196) showed characteristic hydroxyl and-lactone carbonyl
absorptions at 3454 and 1764 cm-1
, respectively. The 13
C/DEPT spectrum (Figure 4.15)
of 196 displayed signals for three methyl [δ 20.4 (C-15), δ 13.8 (C-22) and δ 11.3 (C-
17)], eight methylene [δ 51.2 (C-5), δ 34.6 (C-1), δ 33.8 (C-19), δ 29.3 (C-8), δ 26.5 (C-
7), δ 26.1 (C-6), δ 23.9 (C-2) and δ 20.7 (C-16)], two oxymethine [δ 85.1 (C-11) and δ
81.4 (C-18)], five methine [δ 67.0 (C-3), δ 58.1 (C-12), δ 48.0 (C-9), δ 47.3 (C-10) and
δ 35.0 (C-20)] and four quaternary carbons [δ 181.0 (C-14), δ 180.9 (C-21), δ 76.9 (C-
9a) and δ 75.5 (C-13)]. The quaternary carbon signals at δ 180.9 (C-21) and 181.0 (C-
14) and the methine signals at δ 85.1 (C-11) and 81.4 (C-18), with their corresponding
downfield 1H NMR resonances at δ 4.95 (dd, J = 5.0, 6.3, 1H, H-11) and δ 4.54 (ddd, J
= 5.5, 10.0, 10.0, 1H, H-18), respectively, indicated the presence of two γ-butyrolactone
rings. These data suggested that sessilistemonamine F (196) was a stereoisomer of
sessilistemonamine E (195) and sessilistemonamines A−C (96-98).25
The ROESY
spectrum of sessilistemonamine F (196) (Figure 6.17) showed correlations between, H-
1αand H-3; H-2α and H-3; H-3 and H-15; H-9 and H-16; H-11 and H-12; H-11 and H-
16; and H-12 and H-15. These correlations indicated that sessilistemonamine F (196)
had the same configuration at C-9, C-9a and C-11-13 to that of sessilistemonamine E
(195). However the lack of ROESY correlations between H-9 and H-10 and H-10 and
H-11, as were observed in the ROESY spectrum of sessilistemonamine E (195), and the
new correlations between H-16 and H-9 and H-10, indicated that sessilistemonamine F
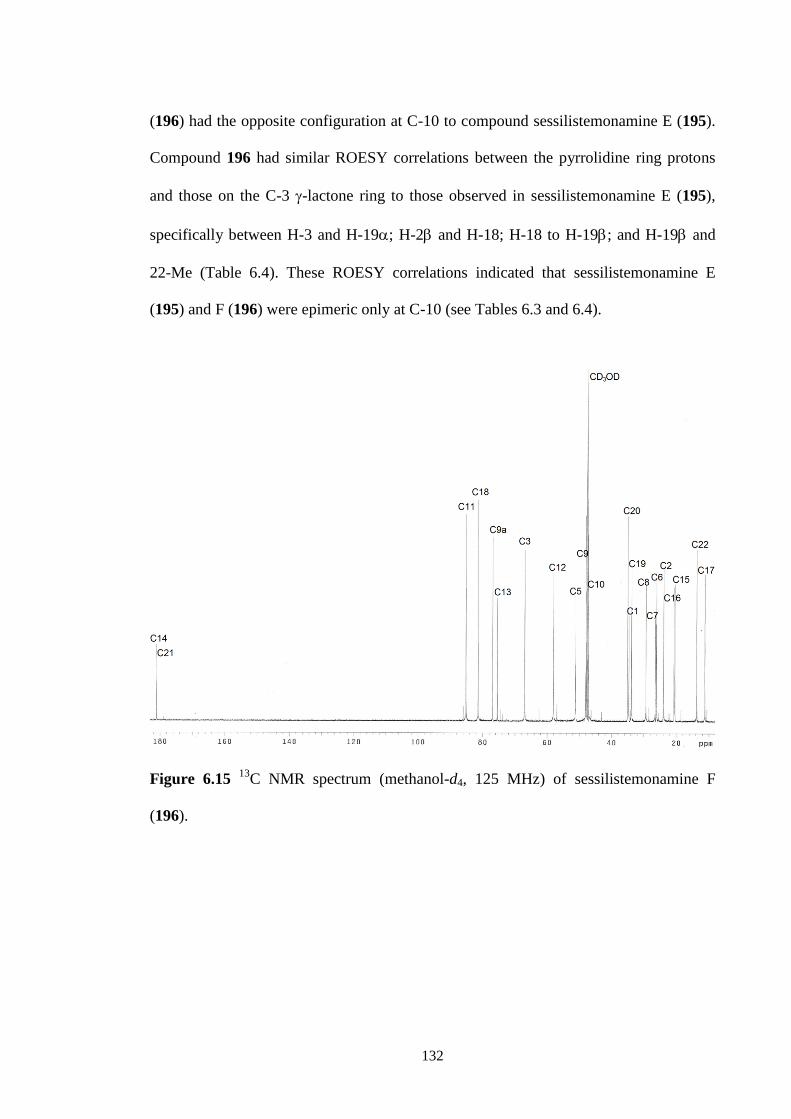
132
(196) had the opposite configuration at C-10 to compound sessilistemonamine E (195).
Compound 196 had similar ROESY correlations between the pyrrolidine ring protons
and those on the C-3 -lactone ring to those observed in sessilistemonamine E (195),
specifically between H-3 and H-19; H-2 and H-18; H-18 to H-19; and H-19 and
22-Me (Table 6.4). These ROESY correlations indicated that sessilistemonamine E
(195) and F (196) were epimeric only at C-10 (see Tables 6.3 and 6.4).
Figure 6.15 13
C NMR spectrum (methanol-d4, 125 MHz) of sessilistemonamine F
(196).
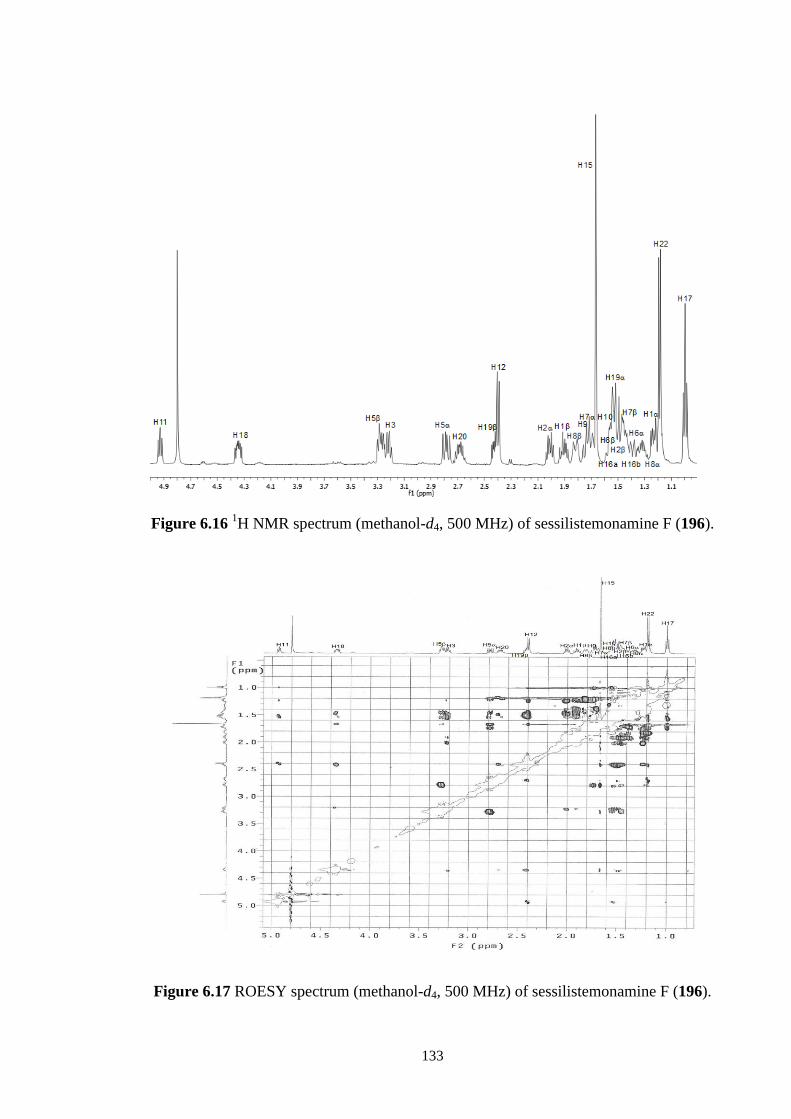
133
Figure 6.16 1H NMR spectrum (methanol-d4, 500 MHz) of sessilistemonamine F (196).
Figure 6.17 ROESY spectrum (methanol-d4, 500 MHz) of sessilistemonamine F (196).
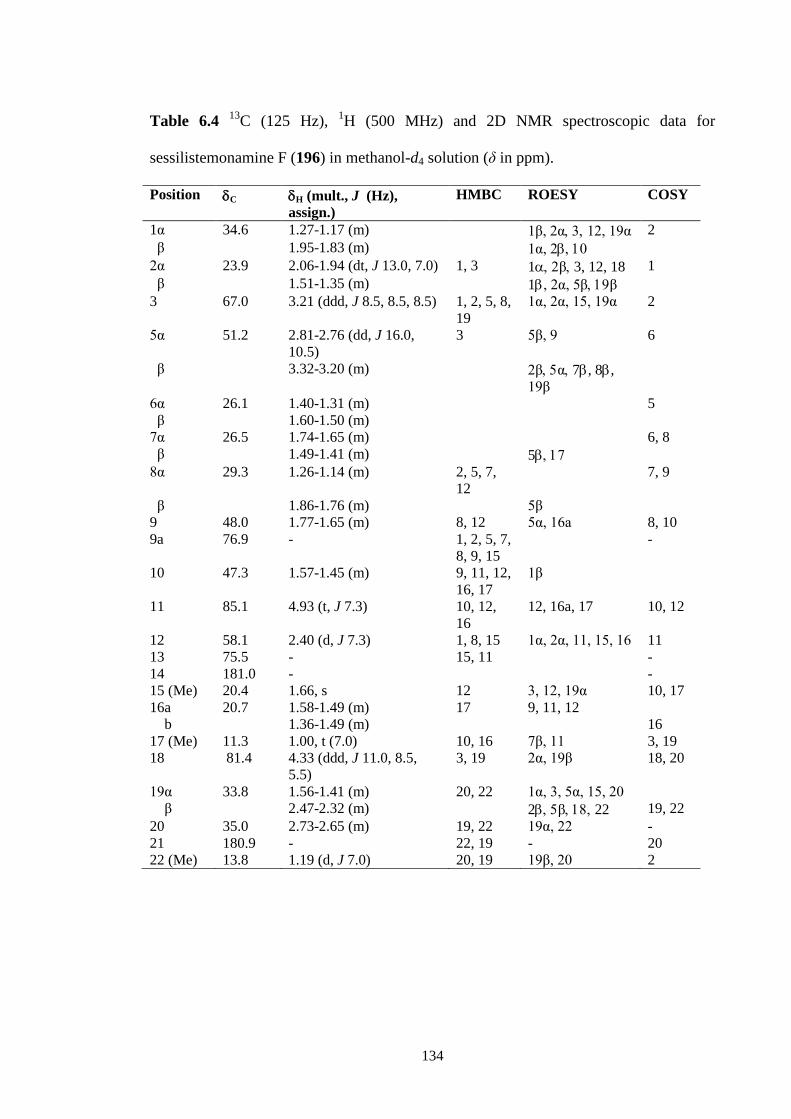
134
Table 6.4 13
C (125 Hz), 1H (500 MHz) and 2D NMR spectroscopic data for
sessilistemonamine F (196) in methanol-d4 solution (δ in ppm).
Position C H (mult., J (Hz),
assign.)
HMBC ROESY COSY
1α 34.6 1.27-1.17 (m) 1β, 2α12, 19α 2
β 1.95-1.83 (m) 1α, 2
2α 23.9 2.06-1.94 (dt, J 13.0, 7.0) 1, 3 1β3, 12, 18 1
β 1.51-1.35 (m) 1, 2α, 5ββ
3 67.0 3.21 (ddd, J 8.5, 8.5, 8.5) 1, 2, 5, 8,
19
1α, 2α, 15, 19α 2
5α 51.2 2.81-2.76 (dd, J 16.0,
10.5)
3 5β, 9 6
β 3.32-3.20 (m) 2βα7, 8,
19β
6α 26.1 1.40-1.31 (m) 5
β 1.60-1.50 (m)
7α 26.5 1.74-1.65 (m) 6, 8
β 1.49-1.41 (m) 5
8α 29.3 1.26-1.14 (m) 2, 5, 7,
12
7, 9
β 1.86-1.76 (m) 5β
9 48.0 1.77-1.65 (m) 8, 12 5α, 16a 8, 10
9a 76.9 - 1, 2, 5, 7,
8, 9, 15
-
10 47.3 1.57-1.45 (m) 9, 11, 12,
16, 17
1β
11 85.1 4.93 (t, J 7.3) 10, 12,
16
12, 16a, 17 10, 12
12 58.1 2.40 (d, J 7.3) 1, 8, 15 1α, 2α, 11, 15, 16 11
13 75.5 - 15, 11 -
14 181.0 - -
15 (Me) 20.4 1.66, s 12 3, 12, 19α 10, 17
16a 20.7 1.58-1.49 (m) 17 9, 11, 12
b 1.36-1.49 (m) 16
17 (Me) 11.3 1.00, t (7.0) 10, 16 7β, 11 3, 19
18 81.4 4.33 (ddd, J 11.0, 8.5,
5.5)
3, 19 2α, 19β 18, 20
19α 33.8 1.56-1.41 (m) 20, 22 1α, 3, 5α, 15, 20
β 2.47-2.32 (m) 2β22 19, 22
20 35.0 2.73-2.65 (m) 19, 22 19α, 22 -
21 180.9 - 22, 19 - 20
22 (Me) 13.8 1.19 (d, J 7.0) 20, 19 19β, 20 2
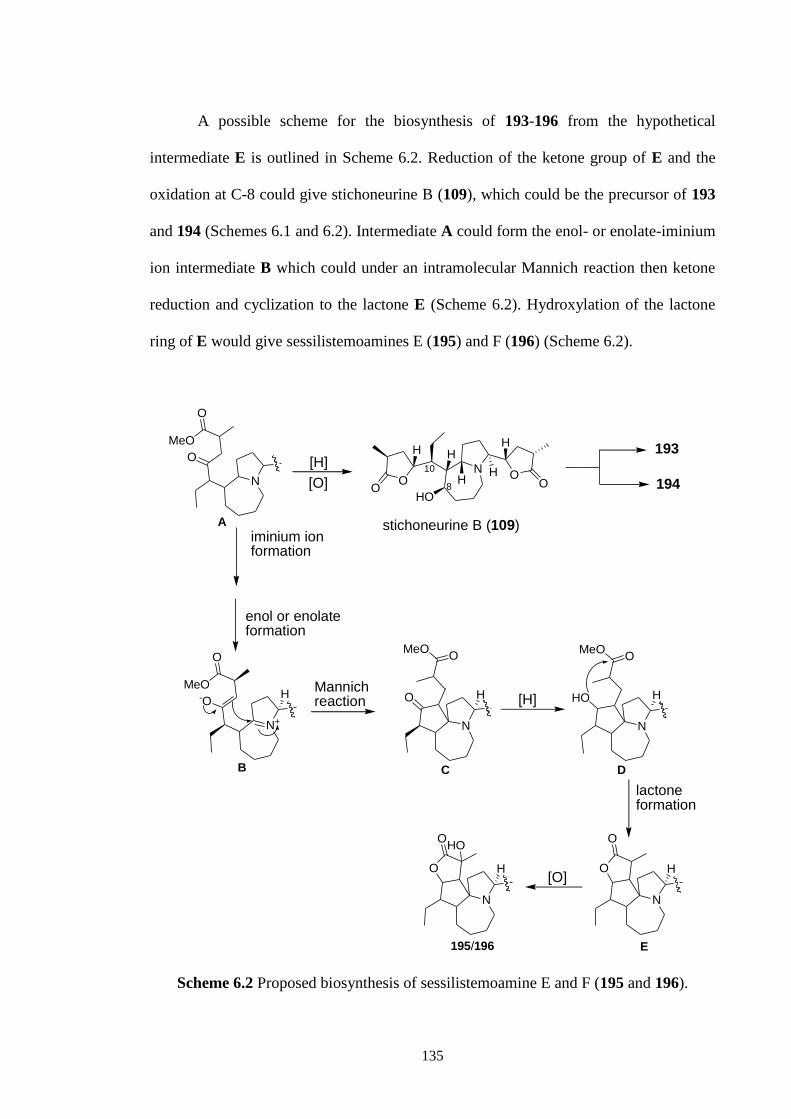
135
A possible scheme for the biosynthesis of 193-196 from the hypothetical
intermediate E is outlined in Scheme 6.2. Reduction of the ketone group of E and the
oxidation at C-8 could give stichoneurine B (109), which could be the precursor of 193
and 194 (Schemes 6.1 and 6.2). Intermediate A could form the enol- or enolate-iminium
ion intermediate B which could under an intramolecular Mannich reaction then ketone
reduction and cyclization to the lactone E (Scheme 6.2). Hydroxylation of the lactone
ring of E would give sessilistemoamines E (195) and F (196) (Scheme 6.2).
N
O
MeO
O
[H]
stichoneurine B (109)
193
194
iminium ion formation
enol or enolate formation
N+
-O
MeO
O
N
MeOO
Mannich reaction O [H]
N
MeOO
HO
lactone formation
N
O
O
N
O
O
[O]
N
H
HOO
HO
H
OO
H
H
10
H H H
H H
HO
8
B D
195/196 E
[O]
A
C
Scheme 6.2 Proposed biosynthesis of sessilistemoamine E and F (195 and 196).
136
6.4 Conclusions
In the previous study, two pyrrolo[1,2-a]azepine alkaloids stichoneurines A and B (108
and 109) were isolated from the roots of St. caudatum collected from Thailand.4 In
contrast, four new pyrrolo[1,2-a]azepine alkaloids were isolated from the roots of St.
caudatum collected from Malaysia, stichoneurines F and D (193 and 194) and
sessilistemoamine E and F (195 and 196). These differences may be due to their
different geographical locations (different climates and neutrients), the age of the plants
or the season in which the plants were harvested. A possible biosynthesis of these new
alkaloids has been proposed starting from stichoneurine B, involving an intramolecular
Mannich reaction to form the cyclopentane ring (Schemes 6.1 and 6.2). Further studies
should be carried out in order to understand the mechanisms of their formation. In
addition, I believe that the synthesis studies of these new alkaloids would be interesting
and new findings would be reported.
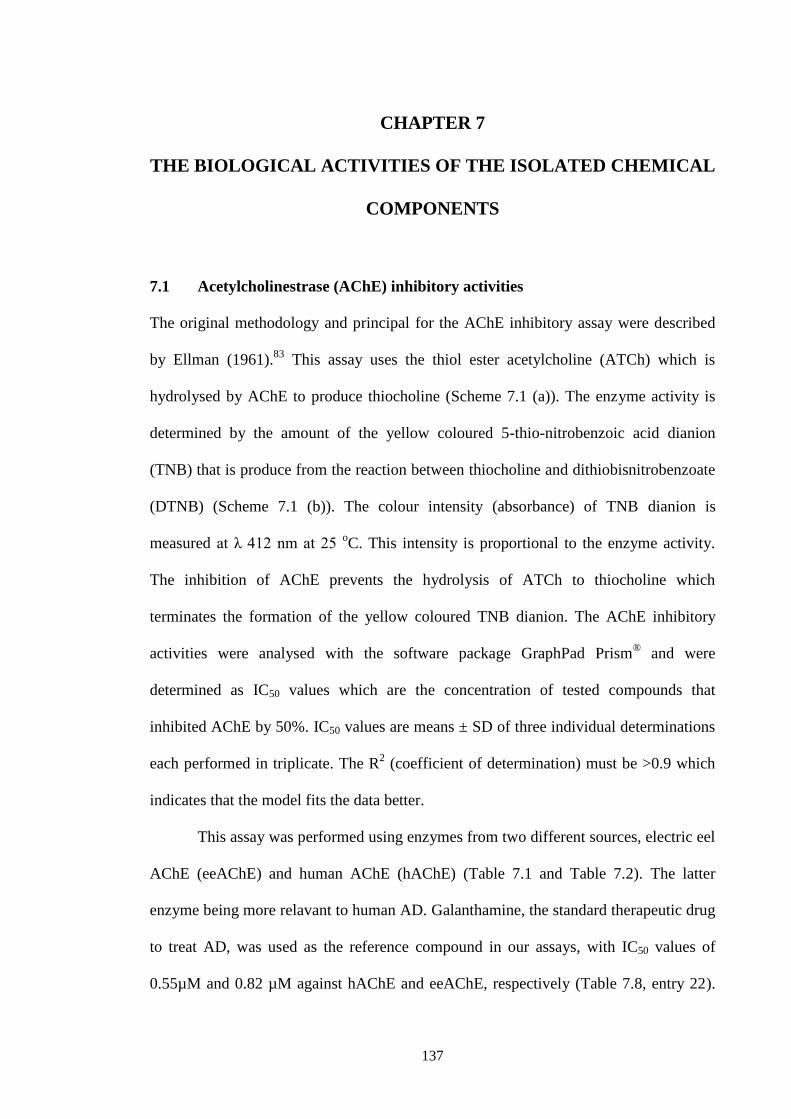
137
CHAPTER 7
THE BIOLOGICAL ACTIVITIES OF THE ISOLATED CHEMICAL
COMPONENTS
7.1 Acetylcholinestrase (AChE) inhibitory activities
The original methodology and principal for the AChE inhibitory assay were described
by Ellman (1961).83
This assay uses the thiol ester acetylcholine (ATCh) which is
hydrolysed by AChE to produce thiocholine (Scheme 7.1 (a)). The enzyme activity is
determined by the amount of the yellow coloured 5-thio-nitrobenzoic acid dianion
(TNB) that is produce from the reaction between thiocholine and dithiobisnitrobenzoate
(DTNB) (Scheme 7.1 (b)). The colour intensity (absorbance) of TNB dianion is
measured at λ 412 nm at 25 oC. This intensity is proportional to the enzyme activity.
The inhibition of AChE prevents the hydrolysis of ATCh to thiocholine which
terminates the formation of the yellow coloured TNB dianion. The AChE inhibitory
activities were analysed with the software package GraphPad Prism® and were
determined as IC50 values which are the concentration of tested compounds that
inhibited AChE by 50%. IC50 values are means ± SD of three individual determinations
each performed in triplicate. The R2 (coefficient of determination) must be >0.9 which
indicates that the model fits the data better.
This assay was performed using enzymes from two different sources, electric eel
AChE (eeAChE) and human AChE (hAChE) (Table 7.1 and Table 7.2). The latter
enzyme being more relavant to human AD. Galanthamine, the standard therapeutic drug
to treat AD, was used as the reference compound in our assays, with IC50 values of
0.55µM and 0.82 µM against hAChE and eeAChE, respectively (Table 7.8, entry 22).
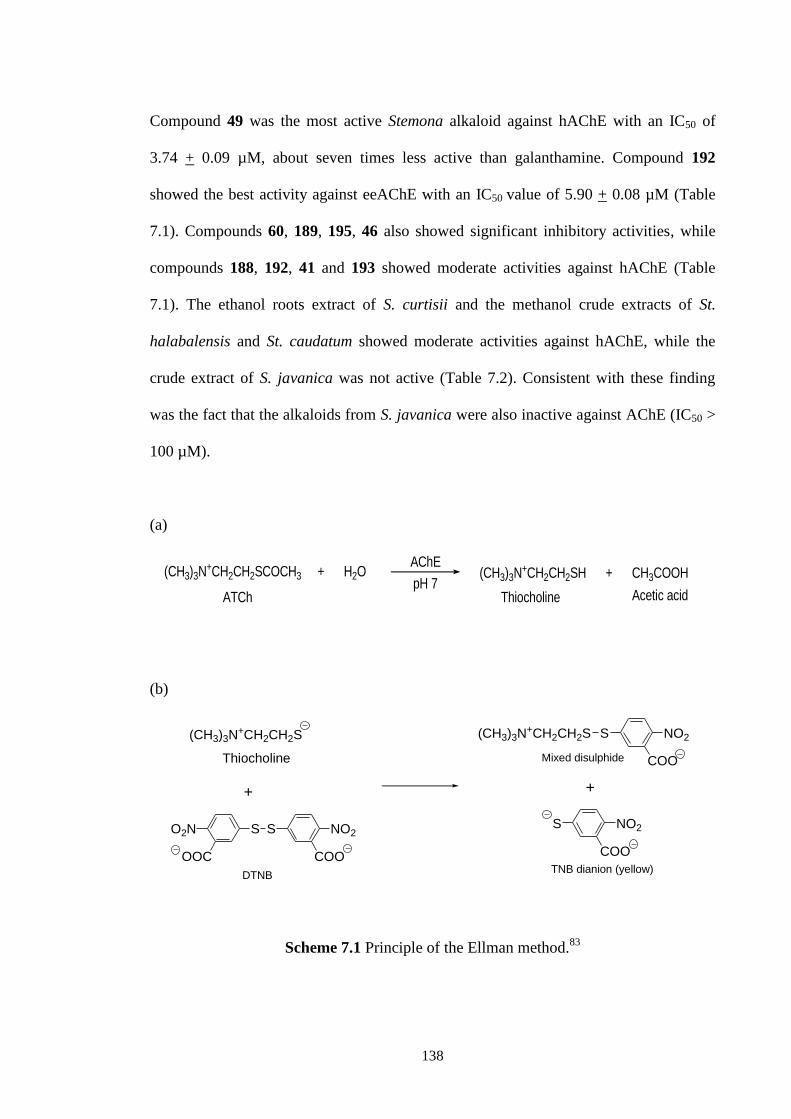
138
Compound 49 was the most active Stemona alkaloid against hAChE with an IC50 of
3.74 + 0.09 µM, about seven times less active than galanthamine. Compound 192
showed the best activity against eeAChE with an IC50 value of 5.90 + 0.08 µM (Table
7.1). Compounds 60, 189, 195, 46 also showed significant inhibitory activities, while
compounds 188, 192, 41 and 193 showed moderate activities against hAChE (Table
7.1). The ethanol roots extract of S. curtisii and the methanol crude extracts of St.
halabalensis and St. caudatum showed moderate activities against hAChE, while the
crude extract of S. javanica was not active (Table 7.2). Consistent with these finding
was the fact that the alkaloids from S. javanica were also inactive against AChE (IC50 >
100 µM).
(a)
(CH3)3N+CH2CH2SCOCH3 + H2OAChE
(CH3)3N+CH2CH2SH + CH3COOH
ATCh Thiocholine Acetic acidpH 7
(b)
(CH3)3N+CH2CH2S
Thiocholine
(CH3)3N+CH2CH2S S NO2
COOMixed disulphide
S NO2
COO
SO2N
OOC
S NO2
COO
++
DTNBTNB dianion (yellow)
Scheme 7.1 Principle of the Ellman method.83
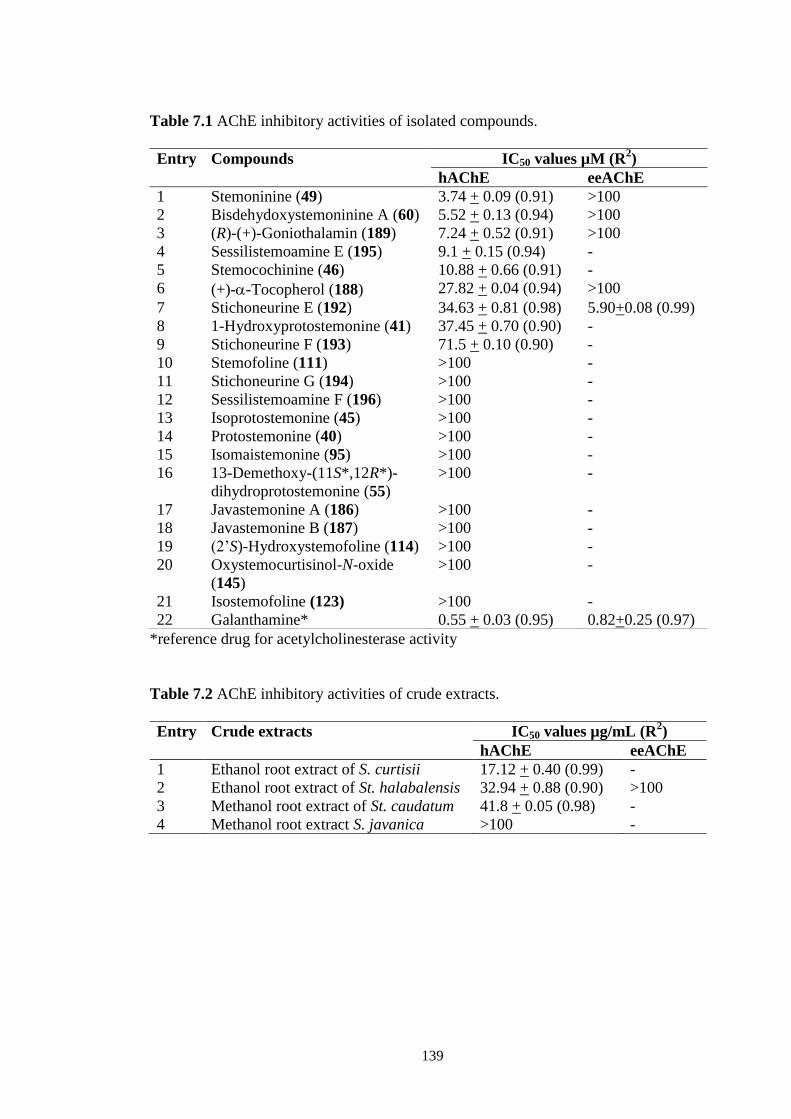
139
Table 7.1 AChE inhibitory activities of isolated compounds.
*reference drug for acetylcholinesterase activity
Table 7.2 AChE inhibitory activities of crude extracts.
Entry Crude extracts IC50 values µg/mL (R2)
hAChE eeAChE
1 Ethanol root extract of S. curtisii 17.12 + 0.40 (0.99) -
2 Ethanol root extract of St. halabalensis 32.94 + 0.88 (0.90) >100
3 Methanol root extract of St. caudatum 41.8 + 0.05 (0.98) -
4 Methanol root extract S. javanica >100 -
Entry Compounds IC50 values µM (R2)
hAChE eeAChE
1 Stemoninine (49) 3.74 + 0.09 (0.91) >100
2 Bisdehydoxystemoninine A (60) 5.52 + 0.13 (0.94) >100
3 (R)-(+)-Goniothalamin (189) 7.24 + 0.52 (0.91) >100
4 Sessilistemoamine E (195) 9.1 + 0.15 (0.94) -
5 Stemocochinine (46) 10.88 + 0.66 (0.91) -
6 (+)--Tocopherol (188) 27.82 + 0.04 (0.94) >100
7 Stichoneurine E (192) 34.63 + 0.81 (0.98) 5.90+0.08 (0.99)
8 1-Hydroxyprotostemonine (41) 37.45 + 0.70 (0.90) -
9 Stichoneurine F (193) 71.5 + 0.10 (0.90) -
10 Stemofoline (111) >100 -
11 Stichoneurine G (194) >100 -
12 Sessilistemoamine F (196) >100 -
13 Isoprotostemonine (45) >100 -
14 Protostemonine (40) >100 -
15 Isomaistemonine (95) >100 -
16 13-Demethoxy-(11S*,12R*)-
dihydroprotostemonine (55)
>100 -
17 Javastemonine A (186) >100 -
18 Javastemonine B (187) >100 -
19 (2’S)-Hydroxystemofoline (114) >100 -
20 Oxystemocurtisinol-N-oxide
(145)
>100 -
21 Isostemofoline (123) >100 -
22 Galanthamine* 0.55 + 0.03 (0.95) 0.82+0.25 (0.97)
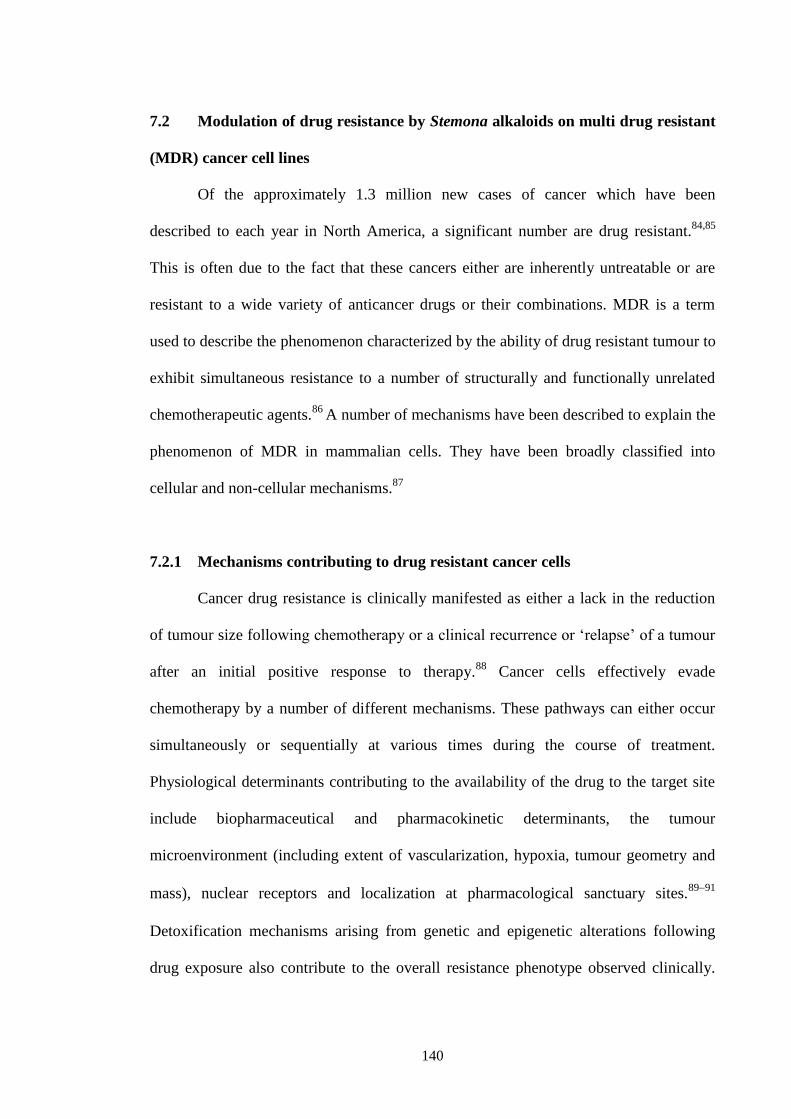
140
7.2 Modulation of drug resistance by Stemona alkaloids on multi drug resistant
(MDR) cancer cell lines
Of the approximately 1.3 million new cases of cancer which have been
described to each year in North America, a significant number are drug resistant.84,85
This is often due to the fact that these cancers either are inherently untreatable or are
resistant to a wide variety of anticancer drugs or their combinations. MDR is a term
used to describe the phenomenon characterized by the ability of drug resistant tumour to
exhibit simultaneous resistance to a number of structurally and functionally unrelated
chemotherapeutic agents.86
A number of mechanisms have been described to explain the
phenomenon of MDR in mammalian cells. They have been broadly classified into
cellular and non-cellular mechanisms.87
7.2.1 Mechanisms contributing to drug resistant cancer cells
Cancer drug resistance is clinically manifested as either a lack in the reduction
of tumour size following chemotherapy or a clinical recurrence or ‘relapse’ of a tumour
after an initial positive response to therapy.88
Cancer cells effectively evade
chemotherapy by a number of different mechanisms. These pathways can either occur
simultaneously or sequentially at various times during the course of treatment.
Physiological determinants contributing to the availability of the drug to the target site
include biopharmaceutical and pharmacokinetic determinants, the tumour
microenvironment (including extent of vascularization, hypoxia, tumour geometry and
mass), nuclear receptors and localization at pharmacological sanctuary sites.8991
Detoxification mechanisms arising from genetic and epigenetic alterations following
drug exposure also contribute to the overall resistance phenotype observed clinically.

141
These include (1) processes limiting anticancer drug concentrations at the molecular
target (i.e. increased active drug efflux, decreased drug influx, vesicular sequestration
and enhanced drug metabolism,9094
(2) mechanisms involving altered molecular
targets91
and (3) mechanisms preventing drug induced cell death (such as increased
DNA repair mechanisms91
and alteration of the cellular death apparatus) (Figure 7.1).95
Figure 7.1 Mechanisms of drug resistance in cancer cells. Cancer cells can evade
chemotherapeutic treatment by increasing active drug efflux, decreasing drug influx,
increasing DNA repair mechanisms, altering apoptotic machinery, altering cell cycle
checkpoints, enhancing drug metabolism, increasing vesicular sequestration or altering
molecular drug targets.95
Decreased drug influx
Increased DNA repair
Altered cellular
death apparatus
Altered cell cycle checkpoint Increased drug
metabolism
Vesicular sequestration
Altered molecular target
Increased drug efflux
142
7.2.2 Modulation of P-glycoprotein in drug resistance in cancer cell lines
Chemotherapy is the treatment of choice in many malignant tumours. Cancer
cells may develop a multidrug resistant (MDR) phenotype after prolonged treatment.
Multidrug resistance is a significant reason for failure in the treatment of cancer
patients. It is often related to the over expression of a 170 kDa plasma membrane
glycoprotein (P-gp). P-gp belongs to the superfamily of transporter proteins containing
an ATP-binding cassette. It is thought to function as a broad substrate, ATP-dependent
pump which can reduce intracellular drug concentrations below a cell-killing
threshold.2628
Overexpression of P-gp causes cancer cells to be resistant to a variety of
structurally and functionally dissimilar anticancer drugs, such as vinblastine,
doxorubicin and paclitaxel.
P-Glycoprotein (P-gp)
P-gp, a member of a superfamily of ATP-dependent membrane transport
proteins, is a plasma membrane protein that was first characterized in multidrug
resistant Chinese hamster ovary cells by Ling and co-workers.9699
It has been shown to
pump substrates out of tumour cells through an ATP dependent mechanism in a
unidirectional fashion. In tumour cells over expressing P-gp, this results in reduced
intracellular drug concentrations which decreases the cytotoxicity of a broad spectrum
of antitumour drugs including anthracyclines (e.g. doxorubicin), vinca alkaloids (e.g.
vincristine) podophyllotoxins (e.g. etoposide) and taxanes (e.g. taxol). Several
mechanisms have been put forward to explain this transport function of P-gp. The
model of Higgins postulates86
that P-gp encounters xenobiotics in the inner leaflet of the
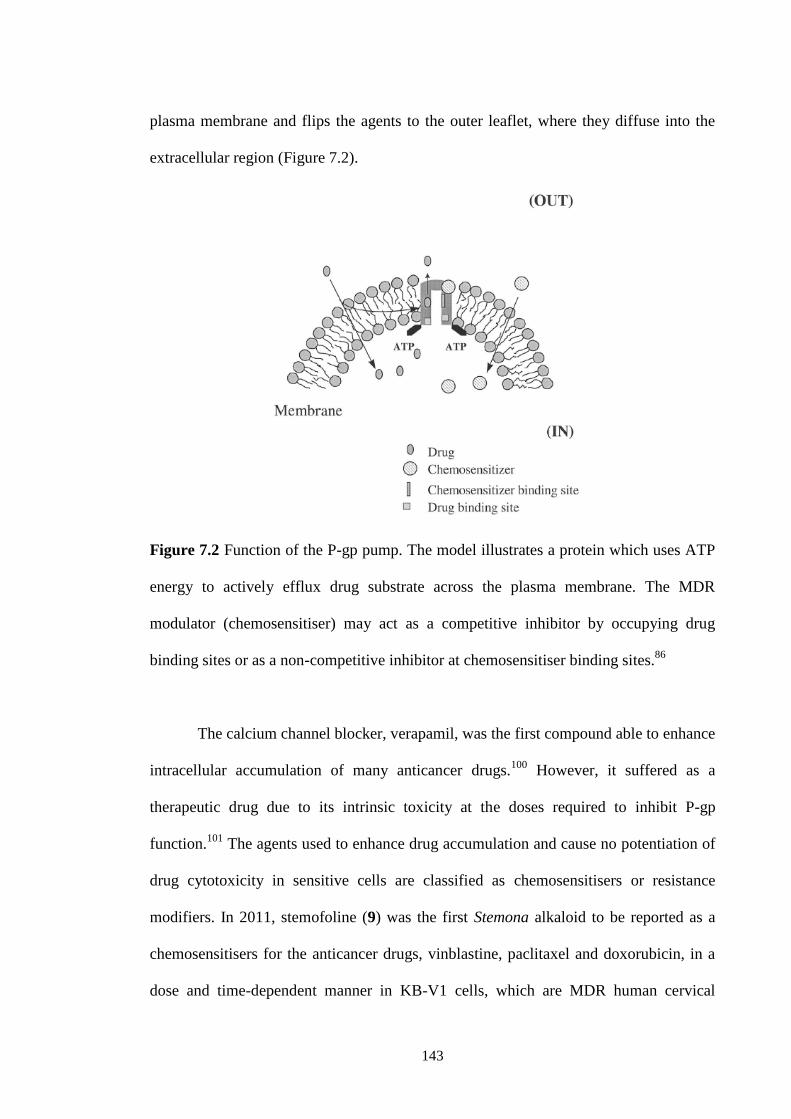
143
plasma membrane and flips the agents to the outer leaflet, where they diffuse into the
extracellular region (Figure 7.2).
Figure 7.2 Function of the P-gp pump. The model illustrates a protein which uses ATP
energy to actively efflux drug substrate across the plasma membrane. The MDR
modulator (chemosensitiser) may act as a competitive inhibitor by occupying drug
binding sites or as a non-competitive inhibitor at chemosensitiser binding sites.86
The calcium channel blocker, verapamil, was the first compound able to enhance
intracellular accumulation of many anticancer drugs.100
However, it suffered as a
therapeutic drug due to its intrinsic toxicity at the doses required to inhibit P-gp
function.101
The agents used to enhance drug accumulation and cause no potentiation of
drug cytotoxicity in sensitive cells are classified as chemosensitisers or resistance
modifiers. In 2011, stemofoline (9) was the first Stemona alkaloid to be reported as a
chemosensitisers for the anticancer drugs, vinblastine, paclitaxel and doxorubicin, in a
dose and time-dependent manner in KB-V1 cells, which are MDR human cervical

144
carcinoma cells with P-gp expression.29
In this study we focused on the MDR-reversing
properties of the Stemona alkaloids isolated from Stemona curtisii and Stichoneuron
halabalensis against K562 and K562/Adr.
7. 3 Modulation of resistance to anticancer drug by isolated Stemona alkaloids
These alkaloids were chosen because they were available in relatively larger
amounts and had not decomposed after isolation and characterization. In collaboration
with the Department of Biochemistry, Faculty of Medicine, Chiang Mai University,
Thailand, some of the isolated Stemona alkaloids were selected to be tested for
inhibitory activity against P-glycoprotein (P-gp). The cytotoxicity of eight selected
Stemona alkaloids (41, 46, 49, 60, 114, 118, 123 and (11E)-1,2-didehydrostemofoline)
(Figure 7.3) were for the first time investigated against a human leukemic (K562-Adr)
cell line, which overexpresses P-gp, and a drug-sensitive cell line (K562) using the
tetrazolium-based colorimeteric MTT assay (by treatment with the alkaloids at 0-50 μM
for 48 h). Cytotoxicity assays showed that the eight Stemona alkaloids were not
cytotoxic to K562-Adr or K562 cells at 5µM (>90% cell survival). Thus the alkaloid
compounds were applied in all subsequent experiments at a final concentration of 5 µM.
These cell lines were then treated with selected Stemona alkaloids at 5 µM and various
concentrations of doxorubicin (DOX) or paclitaxel (PTX) (0-40 µM DOX for K562-Adr
and 0-500 nM for K562) or (0-1.5 µM PTX for K562-Adr and 0-20 nM for K562). The
cells were incubated for 48 h at 37 oC, and then cell growth was assessed by means of
an MTT colorimeteric assay. Verapamil (20 µM) was used as a positive control. The
relative resistance (RR) was calculated as the ratio of the IC50 value of the K562-Adr
cells (resistant cells) to the IC50 value of the K562 cells (drug sensitive cells). The fold-
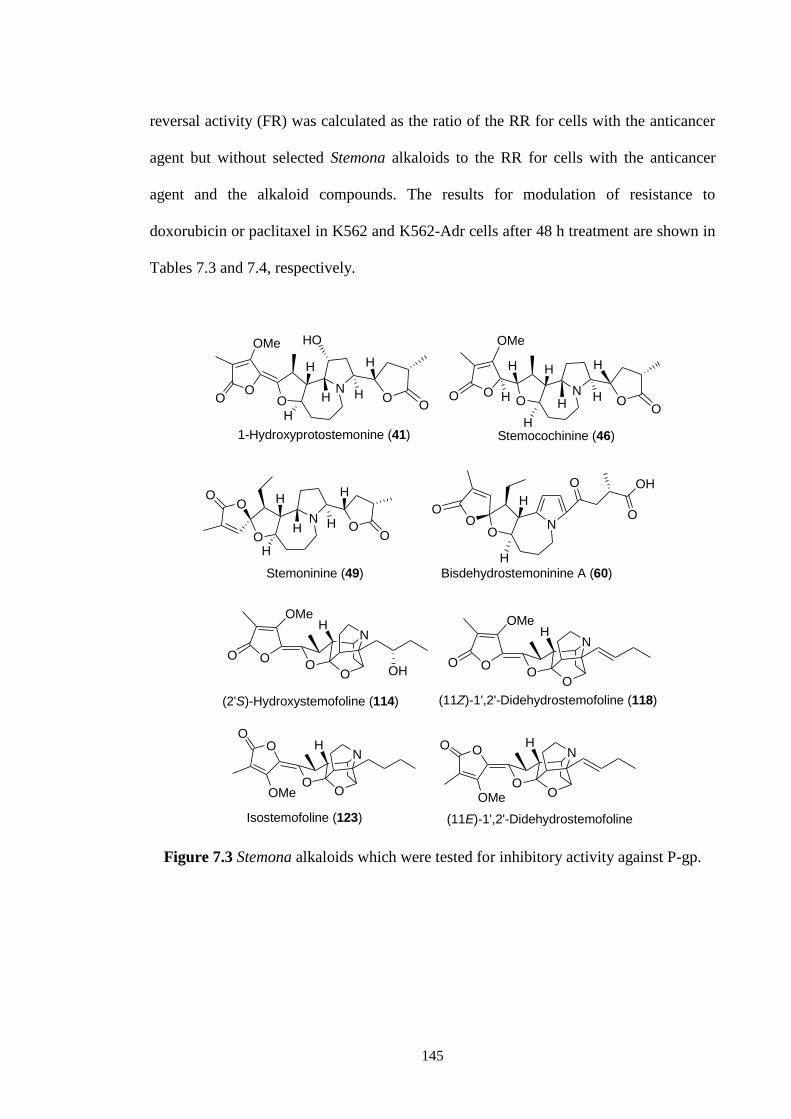
145
reversal activity (FR) was calculated as the ratio of the RR for cells with the anticancer
agent but without selected Stemona alkaloids to the RR for cells with the anticancer
agent and the alkaloid compounds. The results for modulation of resistance to
doxorubicin or paclitaxel in K562 and K562-Adr cells after 48 h treatment are shown in
Tables 7.3 and 7.4, respectively.
NO
H
OO
H
OO
OMe
H
H
HH
H
Stemocochinine (46)
NO H
H
H
O
OMe
O OO
H
HO
H
1-Hydroxyprotostemonine (41)
N
O
OO H
H
H
O
H
HO
Stemoninine (49)
NO
H
OO
H
OHO
O
Bisdehydrostemoninine A (60)
OO
N
OO
OMeH
OH
(2'S)-Hydroxystemofoline (114)
OO
N
OO
OMeH
(11Z)-1',2'-Didehydrostemofoline (118)
OO
NHO
OMe
O
Isostemofoline (123)
OO
NH
(11E)-1',2'-Didehydrostemofoline
O
OMe
O
Figure 7.3 Stemona alkaloids which were tested for inhibitory activity against P-gp.
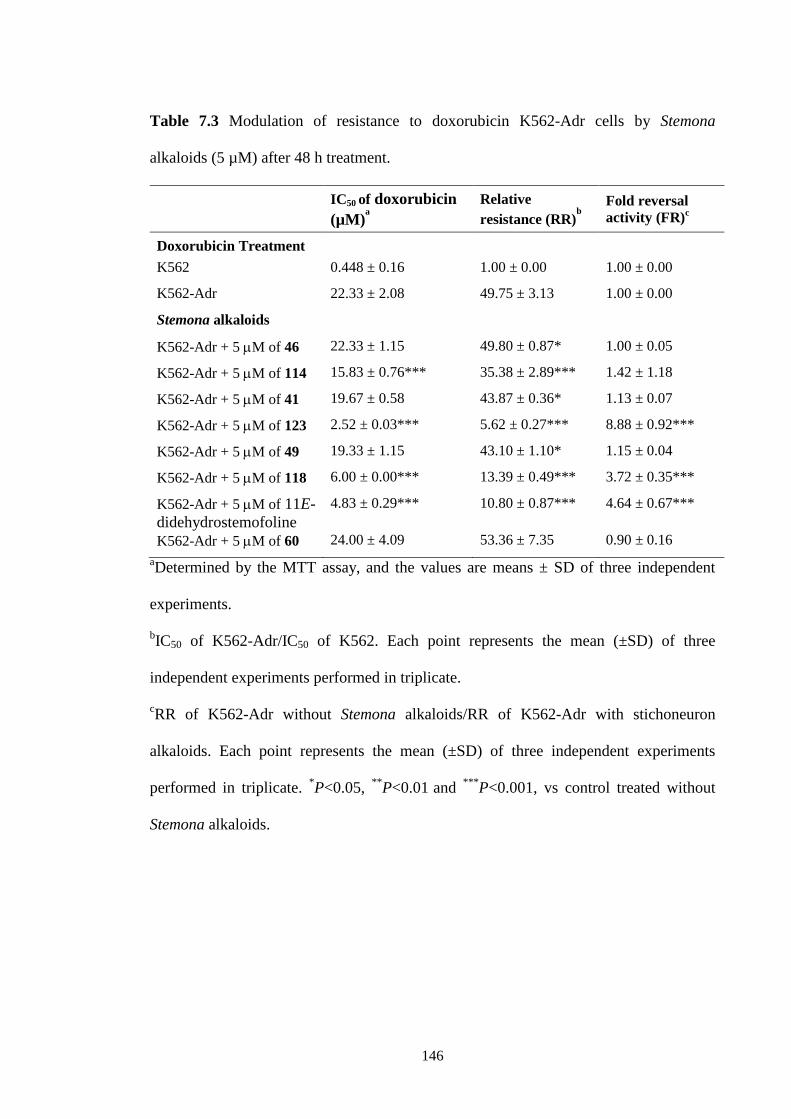
146
Table 7.3 Modulation of resistance to doxorubicin K562-Adr cells by Stemona
alkaloids (5 µM) after 48 h treatment.
IC50 of doxorubicin
(µM)a
Relative
resistance (RR)b
Fold reversal
activity (FR)c
Doxorubicin Treatment
K562 0.448 ± 0.16 1.00 ± 0.00 1.00 ± 0.00
K562-Adr 22.33 ± 2.08 49.75 ± 3.13 1.00 ± 0.00
Stemona alkaloids
K562-Adr + 5 M of 46 22.33 ± 1.15 49.80 ± 0.87* 1.00 ± 0.05
K562-Adr + 5 M of 114 15.83 ± 0.76*** 35.38 ± 2.89*** 1.42 ± 1.18
K562-Adr + 5 M of 41 19.67 ± 0.58 43.87 ± 0.36* 1.13 ± 0.07
K562-Adr + 5 M of 123 2.52 ± 0.03*** 5.62 ± 0.27*** 8.88 ± 0.92***
K562-Adr + 5 M of 49 19.33 ± 1.15 43.10 ± 1.10* 1.15 ± 0.04
K562-Adr + 5 M of 118 6.00 ± 0.00*** 13.39 ± 0.49*** 3.72 ± 0.35***
K562-Adr + 5 M of 11E-
didehydrostemofoline
4.83 ± 0.29*** 10.80 ± 0.87*** 4.64 ± 0.67***
K562-Adr + 5 M of 60 24.00 ± 4.09 53.36 ± 7.35 0.90 ± 0.16
aDetermined by the MTT assay, and the values are means ± SD of three independent
experiments.
bIC50 of K562-Adr/IC50 of K562. Each point represents the mean (±SD) of three
independent experiments performed in triplicate.
cRR of K562-Adr without Stemona alkaloids/RR of K562-Adr with stichoneuron
alkaloids. Each point represents the mean (±SD) of three independent experiments
performed in triplicate. *P<0.05,
**P<0.01
and
***P<0.001, vs control treated without
Stemona alkaloids.
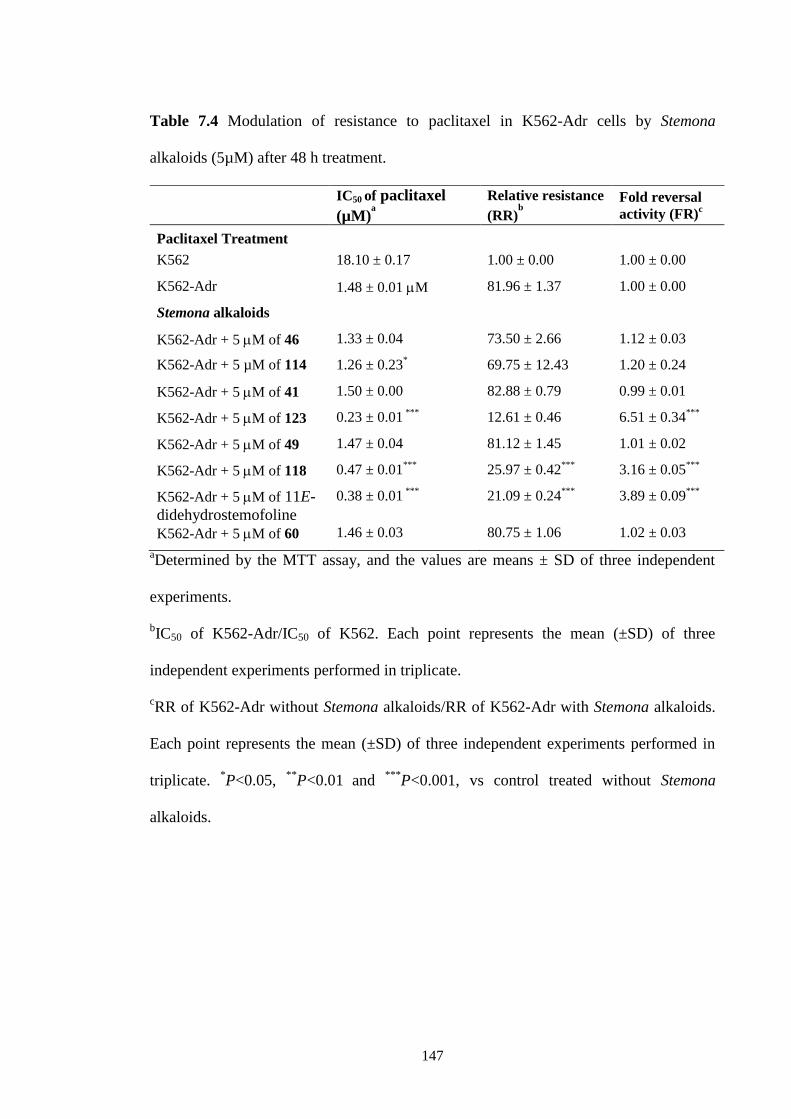
147
Table 7.4 Modulation of resistance to paclitaxel in K562-Adr cells by Stemona
alkaloids (5µM) after 48 h treatment.
IC50 of paclitaxel
(µM)a
Relative resistance
(RR)b
Fold reversal
activity (FR)c
Paclitaxel Treatment
K562 18.10 ± 0.17 1.00 ± 0.00 1.00 ± 0.00
K562-Adr 1.48 ± 0.01 M 81.96 ± 1.37 1.00 ± 0.00
Stemona alkaloids
K562-Adr + 5 M of 46 1.33 ± 0.04 73.50 ± 2.66 1.12 ± 0.03
K562-Adr + 5 µM of 114 1.26 ± 0.23* 69.75 ± 12.43 1.20 ± 0.24
K562-Adr + 5 M of 41 1.50 ± 0.00 82.88 ± 0.79 0.99 ± 0.01
K562-Adr + 5 M of 123 0.23 ± 0.01 ***
12.61 ± 0.46 6.51 ± 0.34***
K562-Adr + 5 M of 49 1.47 ± 0.04 81.12 ± 1.45 1.01 ± 0.02
K562-Adr + 5 M of 118 0.47 ± 0.01***
25.97 ± 0.42***
3.16 ± 0.05***
K562-Adr + 5 M of 11E-
didehydrostemofoline
0.38 ± 0.01 ***
21.09 ± 0.24***
3.89 ± 0.09***
K562-Adr + 5 M of 60 1.46 ± 0.03 80.75 ± 1.06 1.02 ± 0.03
aDetermined by the MTT assay, and the values are means ± SD of three independent
experiments.
bIC50 of K562-Adr/IC50 of K562. Each point represents the mean (±SD) of three
independent experiments performed in triplicate.
cRR of K562-Adr without Stemona alkaloids/RR of K562-Adr with Stemona alkaloids.
Each point represents the mean (±SD) of three independent experiments performed in
triplicate. *P<0.05,
**P<0.01
and
***P<0.001, vs control treated without Stemona
alkaloids.
148
The MDR-reversing properties of the selected the Stemona alkaloids on
doxorubicin cytotoxicity are shown in Table 7.3. The efficiency of this modulating
effect is indicated by a lowering of the RR value from 81.96 and an increase in the FR
value from 1.00. Among the tested compounds, isostemofoline (123) showed the
highest modulating effect on the resistance K562-Adr cells by decreasing the IC50 of
doxorubicin from 22.33 ± 2.08 µM (Table 7.3) to 2.52 ± 0.03 µM (Table 7.3). It showed
the lowest RR of 5.62 ± 0.27 and the highest FR of 8.88 ± 0.92 (Table 7.3). The other
compounds that showed MDR-reversing properties were 118, and 11E-
didehydrostemofoline. In the present of these compounds, doxorubicin had IC50 values
6.00 ± 0.00 and 4.83 ± 0.29 µM respectively (Table 7.3). Compounds 118 and 11E-
didehydrostemofoline increased sensitivity of K562-Adr cells to doxorubicin, as
measured by their FR values by 3.72 ± 0.35 and 4.64 ± 0.67 fold, respectively, while the
other compounds showed no modulating effect.
The MDR-reversing properties of the selected the Stemona alkaloids on
paclitaxel cytotoxicity are shown in Table 7.4. Among the tested compounds,
isostemofoline (123) showed the highest modulating effect on the resistant K562-Adr
cells by decreasing the IC50 of paclitaxel from 1.48 ± 0.01 M to 0.23 ± 0.01M (Table
7.4). It showed the lowest RR of 12.61 ± 0.46 and the highest FR of 6.51 ± 0.34 (Table
7.4). The other compounds that showed MDR-reversing properties were 118 and 11E-
didehydrostemofoline. In the present of these compounds, paclitaxel had IC50 values of
0.47 ± 0.01 and 0.38 ± 0.01 µM, respectively (Table 7.4). 11E- didehydrostemofoline
and compound 118 increased sensitivity of K562-Adr cells to paclitaxel as measured by
their FR values of 3.89 ± 0.09 and 3.16 ± 0.05 fold, respectively, while the other
compounds showed no modulating effects.
149
In comparison, stemofoline-type alkaloids 123, 118 and 11E-
didehydrostemofoline, which had a non-polar side chain, were observed to be good
modulators for both doxorubicin and paclitaxel on K562-Adr cells. Stemofoline-type
alkaloids with an alcohol side chain and stemoamide-type alkaloids showed no
modulating effects.
7.4 Antimalarial activity of isolated Stemona alkaloids againt P. falpacirum
Thirteen isolated Stemona alkaloids were examined for their antiplasmodial
(Table 7.5). Compounds 55, 45, 40, 196, 193, and 41 demonstrated moderate in vitro
antiplasmodial activity against the P. falciparum strains, TM4 (a wild type chloroquine
and antifolate sensitive strain) with IC50 values of 17.7 µg/mL, 16.8 µg/mL, 16.0
µg/mL, 18.5 µg/mL, 20.2 µg/mL, and 27.1 µg/mL, respectively, and K1 (multidrug
resistant strain) with IC50 values of 16.8 µg/mL, 14.1 µg/mL, 11.9 µg/mL, 17.7 µg/mL,
16.5 µg/mL, 20.6 µg/mL, respectively. Stichoneurine G (194) only showed moderate
antiplasmodial activity against TM4 with an IC50 value of 26.8 µg/mL. The other
compounds did not show antiplasmodial activity, even at the highest tested
concentration of 38.9-42.3 µg/mL.
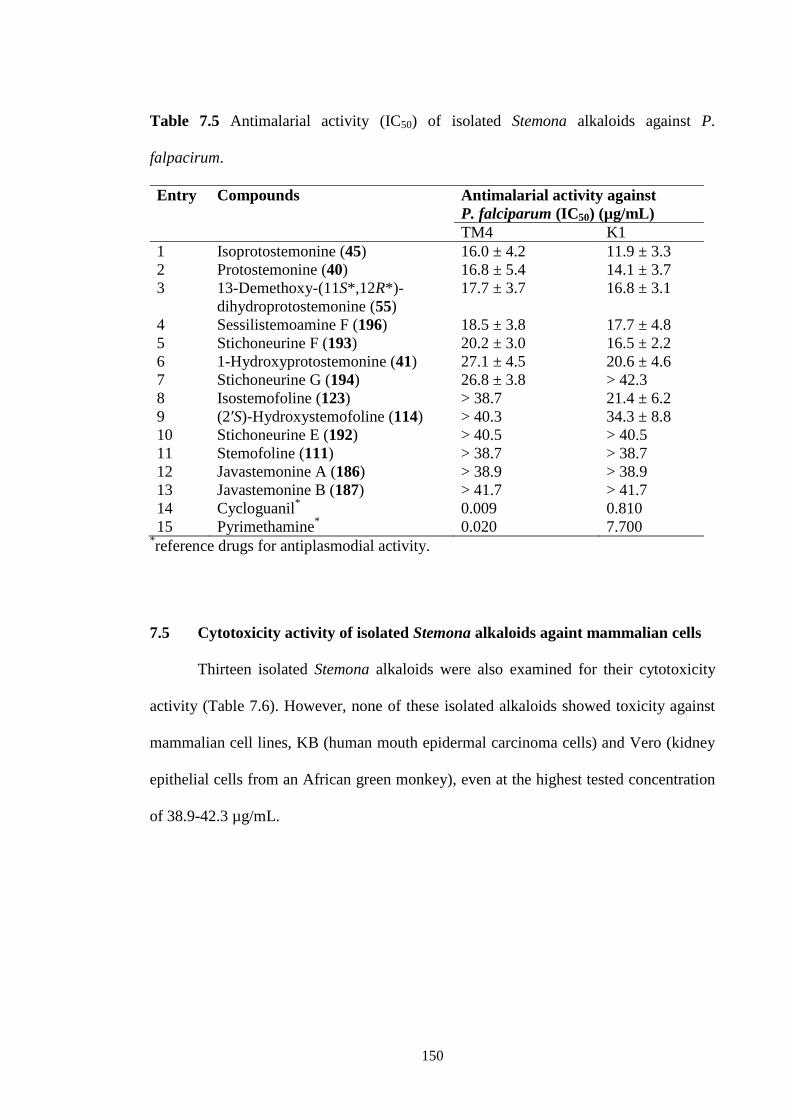
150
Table 7.5 Antimalarial activity (IC50) of isolated Stemona alkaloids against P.
falpacirum.
Entry Compounds Antimalarial activity against
P. falciparum (IC50) (µg/mL)
TM4 K1
1 Isoprotostemonine (45) 16.0 ± 4.2 11.9 ± 3.3
2 Protostemonine (40) 16.8 ± 5.4 14.1 ± 3.7
3 13-Demethoxy-(11S*,12R*)-
dihydroprotostemonine (55)
17.7 ± 3.7 16.8 ± 3.1
4 Sessilistemoamine F (196) 18.5 ± 3.8 17.7 ± 4.8
5 Stichoneurine F (193) 20.2 ± 3.0 16.5 ± 2.2
6 1-Hydroxyprotostemonine (41) 27.1 ± 4.5 20.6 ± 4.6
7 Stichoneurine G (194) 26.8 ± 3.8 > 42.3
8 Isostemofoline (123) > 38.7 21.4 ± 6.2
9 (2′S)-Hydroxystemofoline (114) > 40.3 34.3 ± 8.8
10 Stichoneurine E (192) > 40.5 > 40.5
11 Stemofoline (111) > 38.7 > 38.7
12 Javastemonine A (186) > 38.9 > 38.9
13 Javastemonine B (187) > 41.7 > 41.7
14 Cycloguanil* 0.009 0.810
15 Pyrimethamine* 0.020 7.700
*reference drugs for antiplasmodial activity.
7.5 Cytotoxicity activity of isolated Stemona alkaloids againt mammalian cells
Thirteen isolated Stemona alkaloids were also examined for their cytotoxicity
activity (Table 7.6). However, none of these isolated alkaloids showed toxicity against
mammalian cell lines, KB (human mouth epidermal carcinoma cells) and Vero (kidney
epithelial cells from an African green monkey), even at the highest tested concentration
of 38.9-42.3 µg/mL.
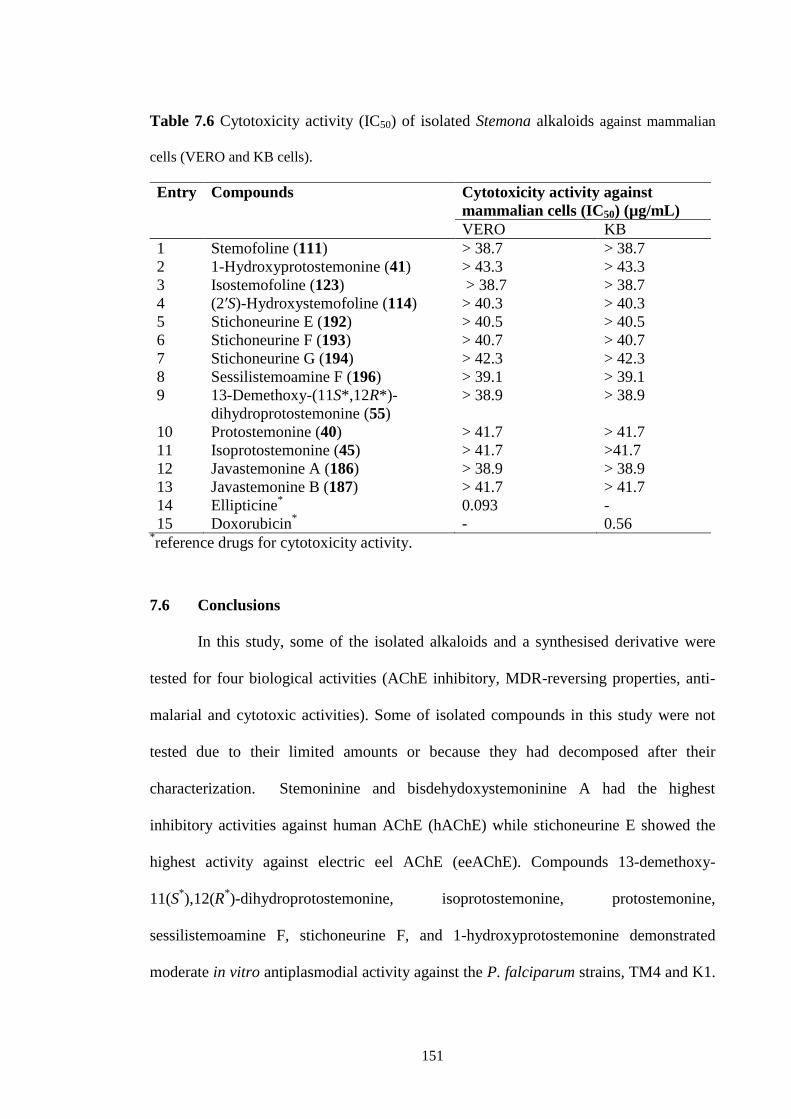
151
Table 7.6 Cytotoxicity activity (IC50) of isolated Stemona alkaloids against mammalian
cells (VERO and KB cells).
Entry Compounds Cytotoxicity activity against
mammalian cells (IC50) (µg/mL)
VERO KB
1 Stemofoline (111) > 38.7 > 38.7
2 1-Hydroxyprotostemonine (41) > 43.3 > 43.3
3 Isostemofoline (123) > 38.7 > 38.7
4 (2′S)-Hydroxystemofoline (114) > 40.3 > 40.3
5 Stichoneurine E (192) > 40.5 > 40.5
6 Stichoneurine F (193) > 40.7 > 40.7
7 Stichoneurine G (194) > 42.3 > 42.3
8 Sessilistemoamine F (196) > 39.1 > 39.1
9 13-Demethoxy-(11S*,12R*)-
dihydroprotostemonine (55)
> 38.9 > 38.9
10 Protostemonine (40) > 41.7 > 41.7
11 Isoprotostemonine (45) > 41.7 >41.7
12 Javastemonine A (186) > 38.9 > 38.9
13 Javastemonine B (187) > 41.7 > 41.7
14 Ellipticine* 0.093 -
15 Doxorubicin* - 0.56
*reference drugs for cytotoxicity activity.
7.6 Conclusions
In this study, some of the isolated alkaloids and a synthesised derivative were
tested for four biological activities (AChE inhibitory, MDR-reversing properties, anti-
malarial and cytotoxic activities). Some of isolated compounds in this study were not
tested due to their limited amounts or because they had decomposed after their
characterization. Stemoninine and bisdehydoxystemoninine A had the highest
inhibitory activities against human AChE (hAChE) while stichoneurine E showed the
highest activity against electric eel AChE (eeAChE). Compounds 13-demethoxy-
11(S*),12(R
*)-dihydroprotostemonine, isoprotostemonine, protostemonine,
sessilistemoamine F, stichoneurine F, and 1-hydroxyprotostemonine demonstrated
moderate in vitro antiplasmodial activity against the P. falciparum strains, TM4 and K1.
152
Stichoneurine G showed only moderate antiplasmodial activity against TM4 while the
other compounds did not show antiplasmodial activity. Clearly, in stichoneurines F and
G, the occurance of the hydroxyl group in stichoneurine G resulted in higher
antiplasmodial activity against TM4. The pyrrolo[1,2-a]azepine type alkaloids showed
better activities in AChE inhibitory and anti-malarial activities compared to the
pyrido[1,2-a]azepine type alkaloids. In contrast, the pyrido[1,2-a]azepine type alkaloids
isostemofoline, (11Z)-1,2-didehydrostemofoline, and (11E)-didehydrostemofoline
showed the highest modulating effect on drug resistant K562/Adr cells by decreasing
the IC50 values of doxorubicin and paclitaxel. None of the tested alkaloids showed
toxicity against mammalian cell lines, KB and Vero cells. Further studies should be
carried out to synthetic derivatives of these compounds to better understand the
structural factors that affect the biological activites of these alkaloids.
153
CHAPTER 8
CONCLUSIONS
In this project, one Stemona spp., Stemona curtisii Hook F., and two
Stichoneuron spp. i.e Stichoneuron halabalensis Hook F. and Stichoneuron caudatum
Ridley were collected from different sites in Malaysia while Stemona javanica (Kunth)
Engl. was collected in Indonesia. These plants were studied in order to discover new
chemical constituents especially Stemona alkaloids and to explore the biological
activities of these compounds including their i) acetylcholinesterase (AChE) inhibitory
activities against human AChE and electric eel acetylcholinesterase (eeAChE), ii) P-
glycoprotein (P-gp) modulator activities for the potential treatment of multidrug
resistant (MDR) cancers, iii) antiplasmodial activities against the Plasmodium
falciparum strains, TM4 (a wild type chloroquine and antifolate sensitive strain) and K1
(multidrug resistant strain) and iv) cytotoxicity activity against mammalian cell lines,
KB (human mouth epidermal carcinoma cells) and Vero (kidney epithelial cells from an
African green monkey) cells.
The phytochemical study on the roots extract of S. curtisii led to the isolation six
of known alkaloids, (2'S)-hydroxystemofoline (114), stemocochinine (46), 1-
hydroxyprotostemonine (41), oxystemokerrin-N-oxide (145), isostemofoline (123) and
stemofoline (111). Phytochemical investigations on S. curtisii from Thailand have been
carried out since 2003 with the latest finding of new alkaloid 148 reported in 2013. The
differences of alkaloids distribution from Malaysia (as found in this study) and Thailand
may be due to their different geographical locations (different climates and neutrients),
the age of the plants or the season in which the plants were harvested.
154
Two new protostemonine-type alkaloids, javastemonine A and B (186 and 187)
(Figure 8.1) were isolated from the root extracts of Stemona javanica together with four
known Stemona alkaloids, 13-demethoxy-11(S*),12(R*)-dihydroprotostemonine (55)
protostemonine (40), isoprotostemonine (45) and isomaistemonine (95). Protostemonine
(40) was the major alkaloid. Javastemonine A (186) was a diastereomer of 55 and 46
while javastemonine B (187) was an epimer of 45. Importantly, noticeable differences
in the chemical shifts of some 1H and
13C NMR resonances of these diastereomers were
observed.
A study of the hitherto unreported Stichoneuron halabalensis led to the
characterization of the known compounds (+)--tocopherol (188), (R)-(+)-
goniothalamin (189), seven pyrrolo[1,2-a]azepine type alkaloids including four known
alkaloids bisdehydrostemoninine A (60), stemoninine (49), sessilistemoamine C (98),
sessilistemoamine A (96); and three new alkaloids, stichoneurines C (190), D (191) and
E (192) (Figure 8.1). Stichoneurines C-E (190-192) are diastereoisomers and have a N-
xide structure. The occurances of (+)--tocopherol (188) and (R)-(+)-goniothalamin
(189) from the family Stemonaceae have never before been reported.
Four novel stichoneurine-type alkaloids, stichoneurines F and G (193 and 194)
and sessilistemonamines E and F (195 and 196) (Figure 8.1) were isolated from the root
extracts of Stichoneuron caudatum Ridley. Stichoneurines F (193) was the major
alkaloids. The biosynthesis of stichoneurines F and D (193 and 194) and
sessilistemoamine E and F (195 and 196) were proposed in Schemes 6.1 and 6.2
respectively. This proposed biosynthesis starts from stichoneurine B and involved an
intramolecular Mannich reaction to form the cyclopentane.
155
The isolation and purification of these chemical constituents were performed
using various chromatography techniques. The structures of the known compounds
were determined on the basis of their spectroscopic data and from comparisons made
with literature data. The structures and relative configurations of the new alkaloids have
been determined by 1D and 2D NMR spectroscopic, MS and IR methods and molecular
modeling experiments. Molecular modeling was an important method to help interpret
the NOESY and ROESY NMR experiments and assign the relative configurations of the
new alkaloids.
The AChE inhibitory activities of the isolated compounds and crude extracts
were performed using a spectrophotometric-based method known as Ellman’s method.
Stemoninine (49) and bisdehydoxystemoninine A (60) showed the highest inhibitory
activities against hAChE but were far less active againts eeAChE. In contrast,
stichoneurine E (192) showed highest activity against eeAChE when compared to
hAChE. While the crude extracts of St. caudatum, St. halabalensis and S. curtisii
showed significant inhibitory activities against hAChE. The highest modulating activity
was observed with isostemofoline (123) which had a simple non-polar side chain. Other
stemofoline-type alkaloids, 118 and (11E)-didehydrostemofoline, also exhibited better
activities than the stemoamide alkaloids as modulators of resistance to anticancer drugs.
Thirteen isolated Stemona alkaloids were examined for their antiplasmodial activities.
The pyrrolo[1,2-a]azapine alkloids 41, 40, 45, 55, 193 and 196 demonstrated moderate
in vitro antiplasmodial activity against the P. falciparum strains, TM4 and K1, while
alkaloid 194 only showed moderate antiplasmodial activity against TM4. The other
compounds, are pyrido[1,2-a]azapine alkaloids, except alkaloids 186 and 187, which
156
did not show antiplasmodial activity. None of these alkaloids showed toxicity against
KB and Vero cell lines.
Some isolated alkaloids that were isolated in relatively large amount would
make useful starting materials for the synthesis other minor alkaloids or analogues for
further biological testing. Instead of using commercial chemicals, using stable isolated
alkaloids might save money and time and provide a ‘short cut’ for the synthesis of other
alkaloids with potentially useful biological activities. Further study using isotopically
labeled molecules should be carried out in order to understand their biosynthesis and to
test the biosynthetic pathways proposed in this thesis. Phytocemical studies on
Stemonaceae plants should be developed further to include studies of plants in other
locations, including well studies species which may have produced new chemical
components due to their different geographical locations and levels of nutrients and
climate.
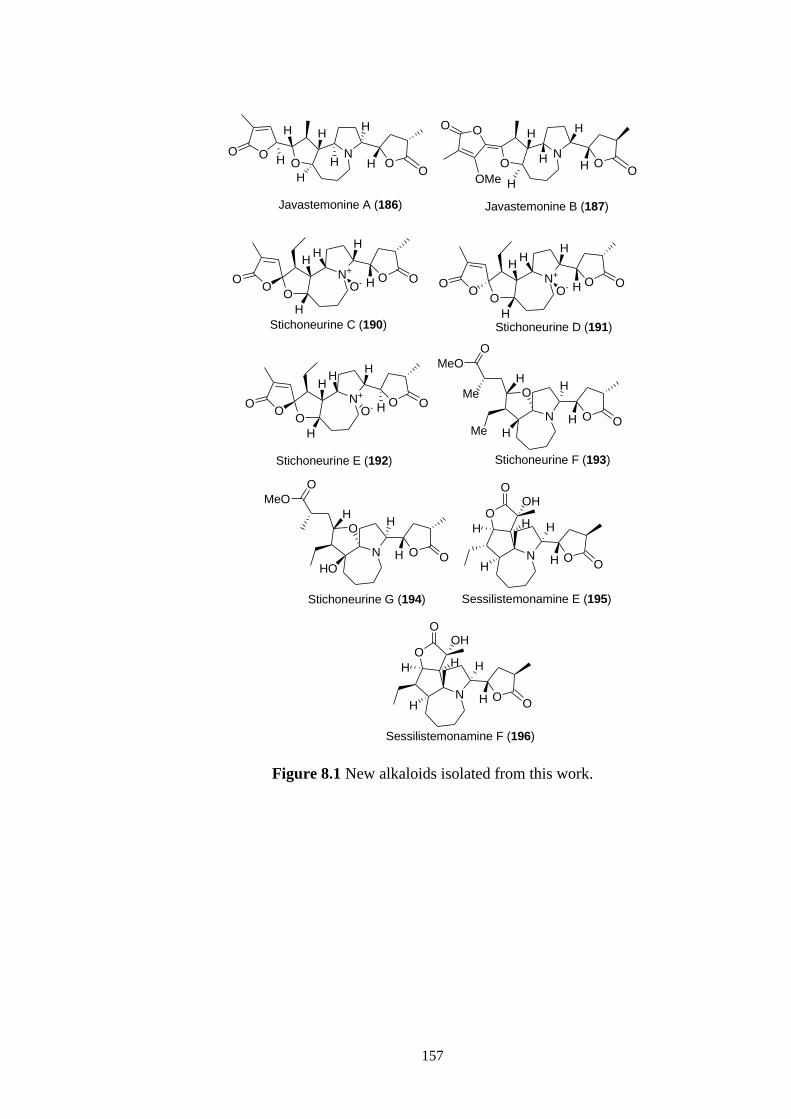
157
Javastemonine B (187)
NO
H
OOH
H
OO
OMe
H
H
Javastemonine A (186)
Stichoneurine C (190)
N+O O
H
H
H
OO-
H
H
OO N+
O O
H
H
H
OO-
H
H
OO
Stichoneurine D (191)
N+O O
H
H
H
OO-
H
H
OO
Stichoneurine E (192)
N
O
OMe
MeO
O
Me
OH
H
H
H
Stichoneurine F (193)
N
O
O
MeO
O
OH
H
HO
H
Stichoneurine G (194)
N O
O
O
O
H H
H
H
H
OH
Sessilistemonamine E (195)
N O
O
O
O
H H
H
H
H
OH
Sessilistemonamine F (196)
NO
H
OO
HH
H
HH
OOH
Figure 8.1 New alkaloids isolated from this work.
158
CHAPTER 9
EXPERIMENTAL
9.1 General Experimental
9.1.1 Chromatography
Thin Layer Chromatography (TLC) was performed using aluminium-backed
Merck sorbent silica gel (0.1 mm thickness). Compounds were detected by staining with
Dregendroff reagent. Preparative TLC (PTLC) was performed using commercial glass-
backed plates (20 x 20 cm) with Merck 60 PF 254 silica gel (1 mm thickness).
Compounds were detected under a 254 nm ultraviolet lamp.
The Dragendroff’s reagent was prepared from a mixture of two stock solutions.
Stock solution A contained H2O (10 mL), concentrated HCl (2 mL) and bismuth
subnitrate (0.6 g). Stock solution B contained H2O (10 mL) and KI (6.0 g). These two
stock solutions were combined and diluted with H2O (15 mL) and concentrated HCl (7
mL). The mixture was then made up to 400 mL with H2O. The TLC spots were dipped
in the Dragendroff’s reagent in order to see the alkaloid spots.
Purification of compounds by column chromatography was performed using
Merck GF 254 flash silica gel (40-63 µm). Small-scale separations (< 2.0 g) were
performed using either a 10 or 20 mm diameter column, and large scale separations (>
2.0 g) were performed using either 30 or 50 mm diameter column, each with the stated
solvent system. Most columns were developed using gradient elution using the solvent
mixtures defined in the experimental section.
159
9.1.2 Polarimeter
Optical rotations were measured using a 1 cm cell, in a Jasco DIP-370 digital
polarimeter or a 10 cm cell, in a Jasco P-2000 polarimeter. Ten measurements were
taken and the average was used to calculate the specific rotation.
9.1.3 Mass spectrometer
Low resolution mass spectra were obtained either on a Shimadzu GC mass
spectrometer (EI and Cl) or a Waters LCZ single quadropole (ESI). High-resolution
mass spectra were obtained either on a VG Autospec mass spectrometer (EI and Cl) or a
Waters QTOF (ESI). HRMS (exact masses) were used in lieu of elemental analysis and
TLC analysis and 1H and
13C NMR spectroscopy were used as criteria for purity. In
most case compounds were purified to 90-95% purityas judged by 1H NMR analysis.
9.1.4 Infrared spectroscopy
Infrared spectra were obtained as neat samples on a Smart Omni-Sampler
Avator ESP Nicolet spectrometer.
9.1.5 Nuclear magnetic resonance spectroscopy
1H and
13C NMR spectra were recorded on a Varian Inova-500 spectrometer
(500 MHz, 1H and 125 MHz,
13C) in deuterochloroform (CDCl3), unless otherwise
specified. NMR assignments were based on gCOSY, gHSQC, gHMBC, ROESY,
NOESY, TOCSY and DEPT or APT experiments. These experiments were performed
using the standard Varian pulse sequences and mixing times. NMR solvents used in the
experiments and their associated referencing data are displayed in Table 9.1. Unless
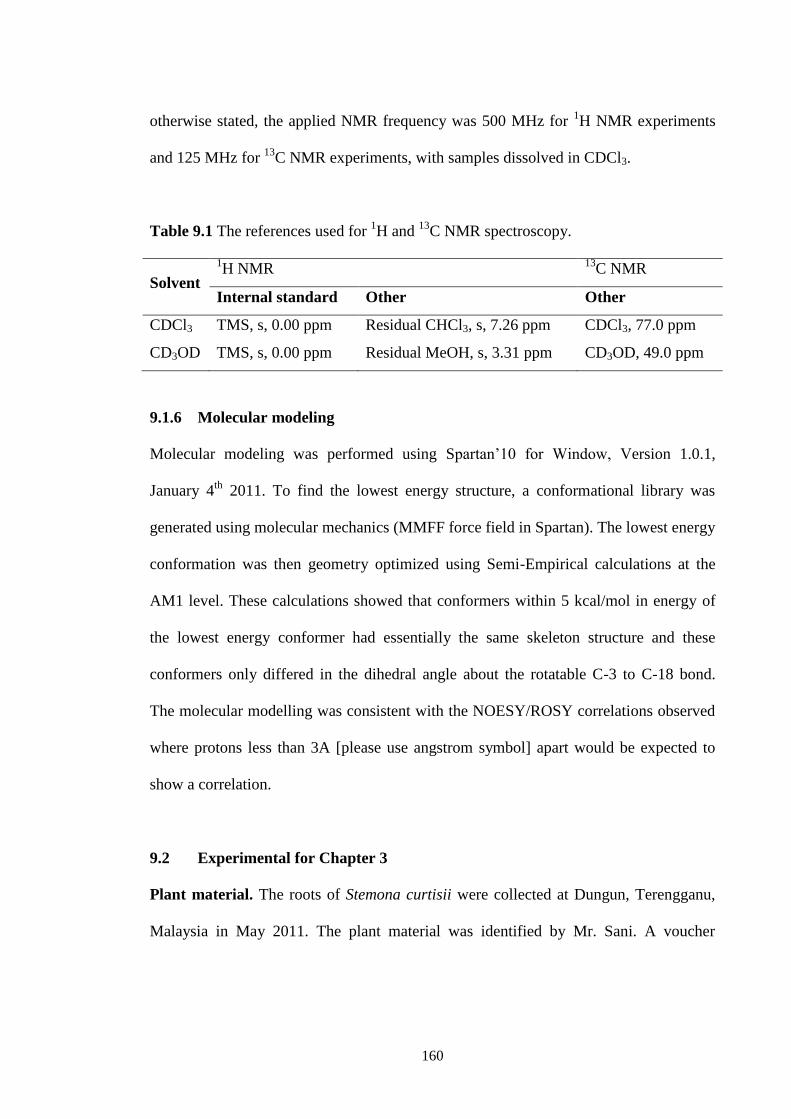
160
otherwise stated, the applied NMR frequency was 500 MHz for 1H NMR experiments
and 125 MHz for 13
C NMR experiments, with samples dissolved in CDCl3.
Table 9.1 The references used for 1H and
13C NMR spectroscopy.
Solvent
1H NMR
13C NMR
Internal standard Other Other
CDCl3 TMS, s, 0.00 ppm Residual CHCl3, s, 7.26 ppm CDCl3, 77.0 ppm
CD3OD TMS, s, 0.00 ppm Residual MeOH, s, 3.31 ppm CD3OD, 49.0 ppm
9.1.6 Molecular modeling
Molecular modeling was performed using Spartan’10 for Window, Version 1.0.1,
January 4th
2011. To find the lowest energy structure, a conformational library was
generated using molecular mechanics (MMFF force field in Spartan). The lowest energy
conformation was then geometry optimized using Semi-Empirical calculations at the
AM1 level. These calculations showed that conformers within 5 kcal/mol in energy of
the lowest energy conformer had essentially the same skeleton structure and these
conformers only differed in the dihedral angle about the rotatable C-3 to C-18 bond.
The molecular modelling was consistent with the NOESY/ROSY correlations observed
where protons less than 3A [please use angstrom symbol] apart would be expected to
show a correlation.
9.2 Experimental for Chapter 3
Plant material. The roots of Stemona curtisii were collected at Dungun, Terengganu,
Malaysia in May 2011. The plant material was identified by Mr. Sani. A voucher
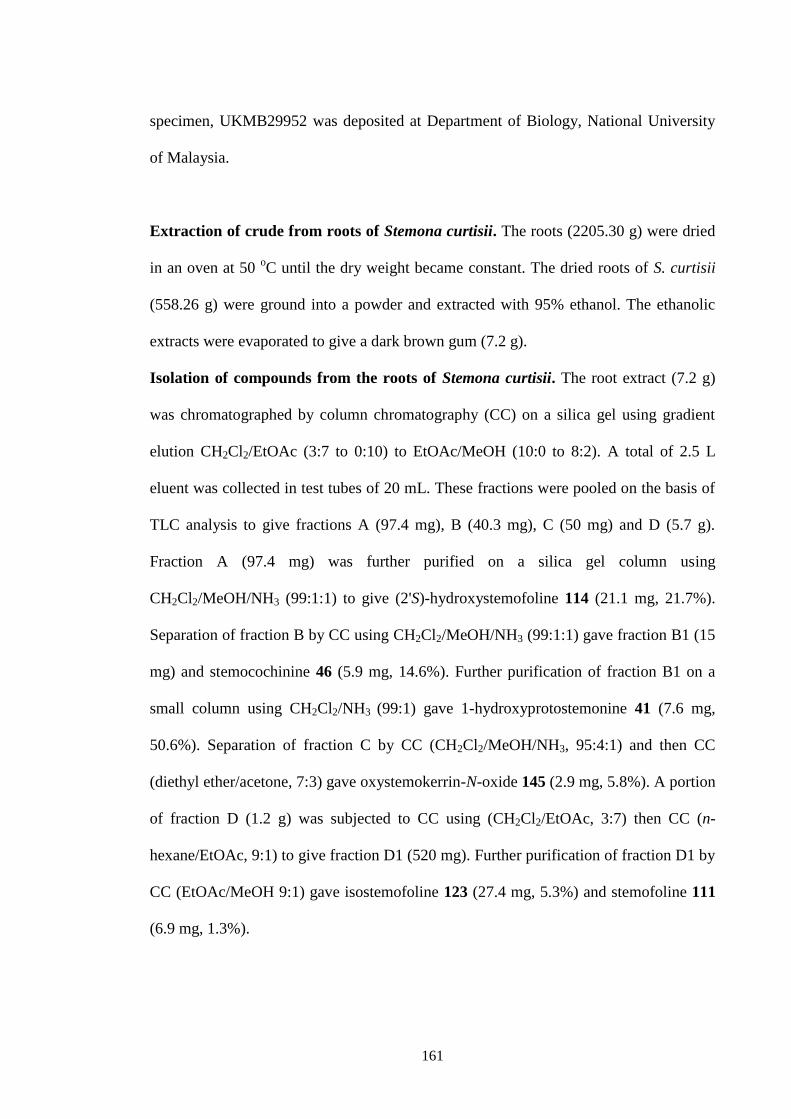
161
specimen, UKMB29952 was deposited at Department of Biology, National University
of Malaysia.
Extraction of crude from roots of Stemona curtisii. The roots (2205.30 g) were dried
in an oven at 50 oC until the dry weight became constant. The dried roots of S. curtisii
(558.26 g) were ground into a powder and extracted with 95% ethanol. The ethanolic
extracts were evaporated to give a dark brown gum (7.2 g).
Isolation of compounds from the roots of Stemona curtisii. The root extract (7.2 g)
was chromatographed by column chromatography (CC) on a silica gel using gradient
elution CH2Cl2/EtOAc (3:7 to 0:10) to EtOAc/MeOH (10:0 to 8:2). A total of 2.5 L
eluent was collected in test tubes of 20 mL. These fractions were pooled on the basis of
TLC analysis to give fractions A (97.4 mg), B (40.3 mg), C (50 mg) and D (5.7 g).
Fraction A (97.4 mg) was further purified on a silica gel column using
CH2Cl2/MeOH/NH3 (99:1:1) to give (2'S)-hydroxystemofoline 114 (21.1 mg, 21.7%).
Separation of fraction B by CC using CH2Cl2/MeOH/NH3 (99:1:1) gave fraction B1 (15
mg) and stemocochinine 46 (5.9 mg, 14.6%). Further purification of fraction B1 on a
small column using CH2Cl2/NH3 (99:1) gave 1-hydroxyprotostemonine 41 (7.6 mg,
50.6%). Separation of fraction C by CC (CH2Cl2/MeOH/NH3, 95:4:1) and then CC
(diethyl ether/acetone, 7:3) gave oxystemokerrin-N-oxide 145 (2.9 mg, 5.8%). A portion
of fraction D (1.2 g) was subjected to CC using (CH2Cl2/EtOAc, 3:7) then CC (n-
hexane/EtOAc, 9:1) to give fraction D1 (520 mg). Further purification of fraction D1 by
CC (EtOAc/MeOH 9:1) gave isostemofoline 123 (27.4 mg, 5.3%) and stemofoline 111
(6.9 mg, 1.3%).
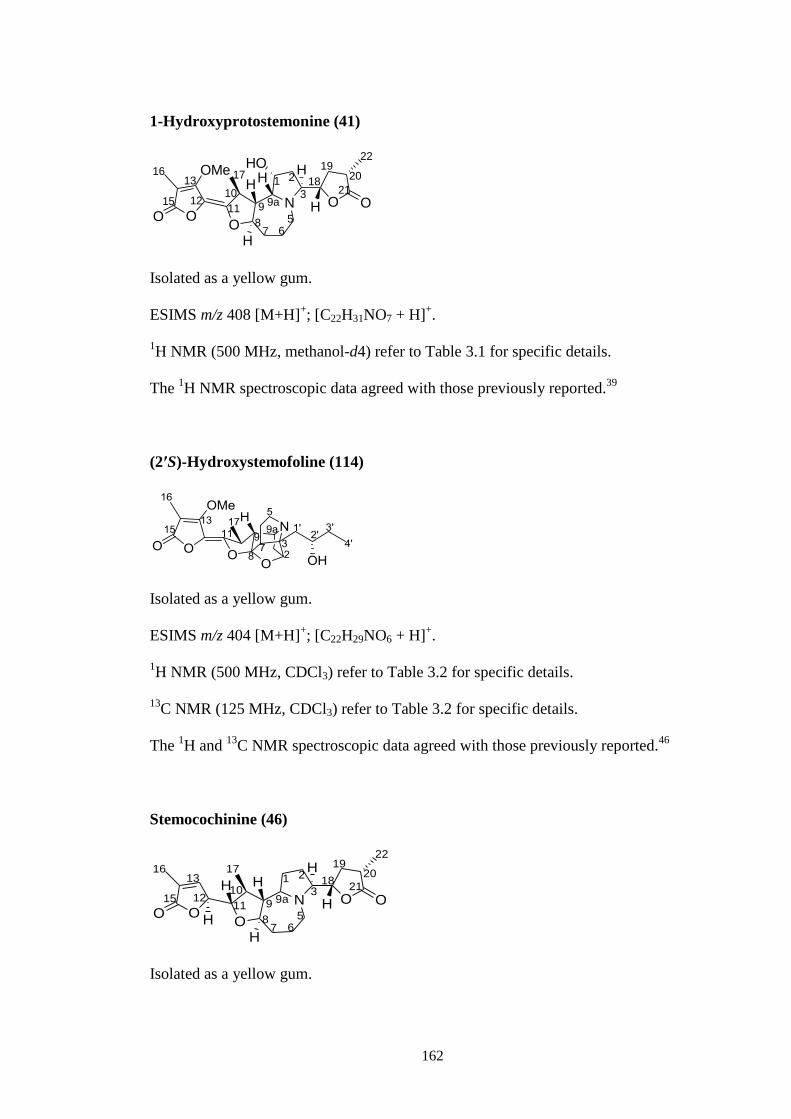
162
1-Hydroxyprotostemonine (41)
N
OOO
OMe
O O
HOH
H
H
1 2
3
567
9 9a10
1112
13
15
16 1718
1920
22
21
8
HH
Isolated as a yellow gum.
ESIMS m/z 408 [M+H]+; [C22H31NO7 + H]
+.
1H NMR (500 MHz, methanol-d4) refer to Table 3.1 for specific details.
The 1H NMR spectroscopic data agreed with those previously reported.
39
(2′S)-Hydroxystemofoline (114)
Isolated as a yellow gum.
ESIMS m/z 404 [M+H]+; [C22H29NO6 + H]
+.
1H NMR (500 MHz, CDCl3) refer to Table 3.2 for specific details.
13C NMR (125 MHz, CDCl3) refer to Table 3.2 for specific details.
The 1H and
13C NMR spectroscopic data agreed with those previously reported.
46
Stemocochinine (46)
N
OOO
O O
H
H
H
1 2
3
567
9 9a10
1112
13
15
16 1718
1920
22
21
8
HH
H
Isolated as a yellow gum.

163
ESIMS m/z 390 [M+H]+; [C22H31NO5 + H]
+.
1H NMR (500 MHz, CDCl3) refer to Table 3.3 for specific details.
13C NMR (125 MHz, CDCl3) refer to Table 3.3 for specific details.
The 1H and
13C NMR spectroscopic data agreed with those previously reported.
10
Oxystemocurtisin-N-oxide (145)
Isolated as a yellow gum.
ESIMS m/z 422 [M+H] +
; [C21H31NO7 + H]+.
1H NMR (500 MHz, methanol-d4) refer to Table 3.4 for specific details.
The 1H NMR spectroscopic data agreed with those previously reported.
10
Stemofoline (111)
Isolated as a brown gum.
ESIMS m/z 388 [M+H]+; [C22H29NO5 + H]
+.
1H NMR (500 MHz, CDCl3) refer to Table 3.5 for specific details.
The 1H NMR spectroscopic data agreed with those previously reported.
15
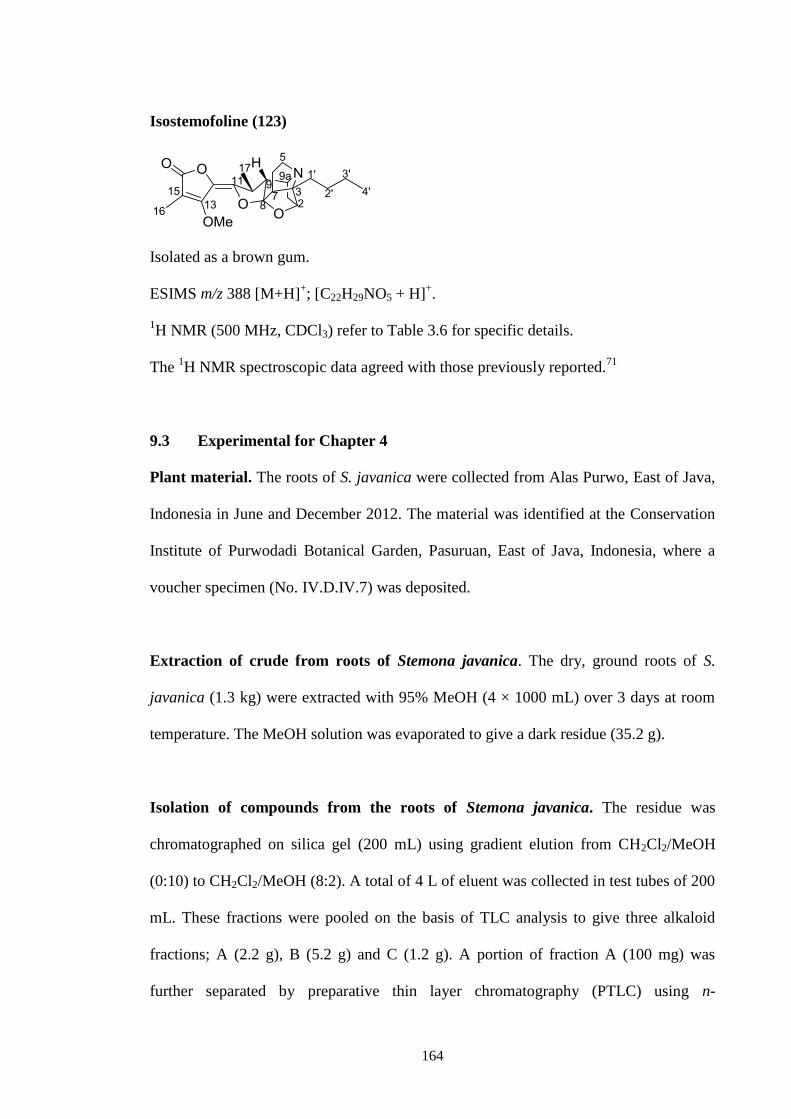
164
Isostemofoline (123)
Isolated as a brown gum.
ESIMS m/z 388 [M+H]+; [C22H29NO5 + H]
+.
1H NMR (500 MHz, CDCl3) refer to Table 3.6 for specific details.
The 1H NMR spectroscopic data agreed with those previously reported.
71
9.3 Experimental for Chapter 4
Plant material. The roots of S. javanica were collected from Alas Purwo, East of Java,
Indonesia in June and December 2012. The material was identified at the Conservation
Institute of Purwodadi Botanical Garden, Pasuruan, East of Java, Indonesia, where a
voucher specimen (No. IV.D.IV.7) was deposited.
Extraction of crude from roots of Stemona javanica. The dry, ground roots of S.
javanica (1.3 kg) were extracted with 95% MeOH (4 × 1000 mL) over 3 days at room
temperature. The MeOH solution was evaporated to give a dark residue (35.2 g).
Isolation of compounds from the roots of Stemona javanica. The residue was
chromatographed on silica gel (200 mL) using gradient elution from CH2Cl2/MeOH
(0:10) to CH2Cl2/MeOH (8:2). A total of 4 L of eluent was collected in test tubes of 200
mL. These fractions were pooled on the basis of TLC analysis to give three alkaloid
fractions; A (2.2 g), B (5.2 g) and C (1.2 g). A portion of fraction A (100 mg) was
further separated by preparative thin layer chromatography (PTLC) using n-
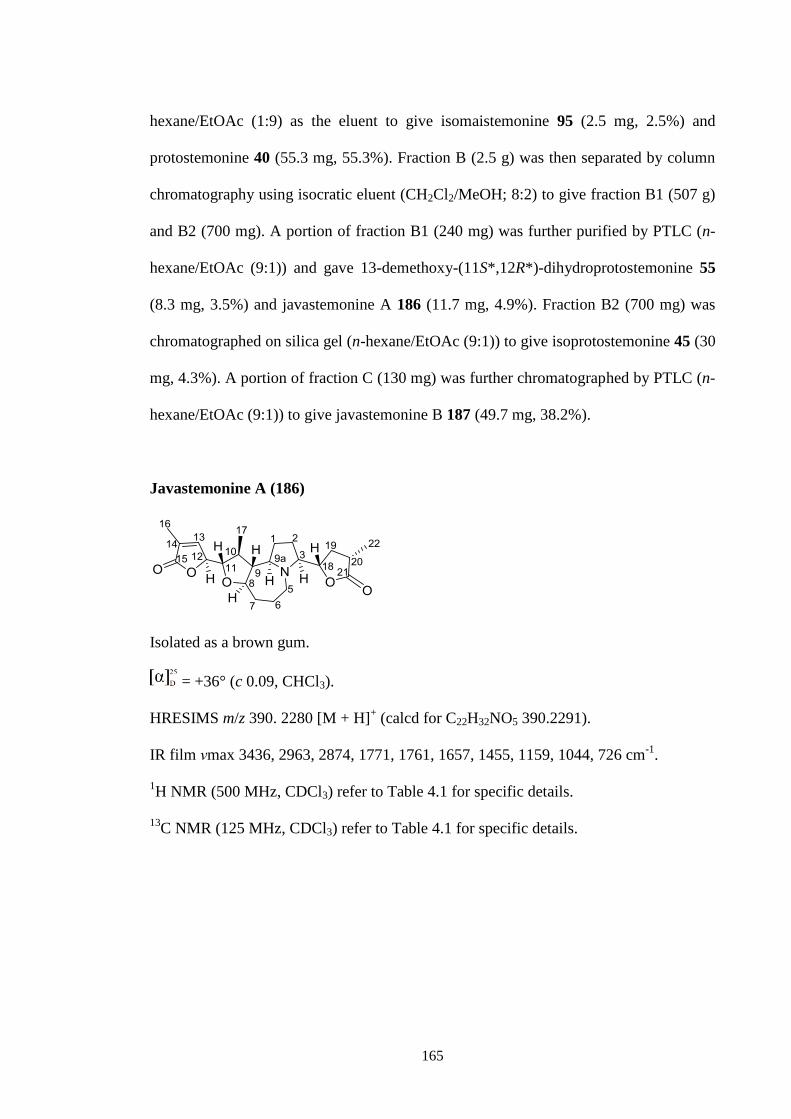
165
hexane/EtOAc (1:9) as the eluent to give isomaistemonine 95 (2.5 mg, 2.5%) and
protostemonine 40 (55.3 mg, 55.3%). Fraction B (2.5 g) was then separated by column
chromatography using isocratic eluent (CH2Cl2/MeOH; 8:2) to give fraction B1 (507 g)
and B2 (700 mg). A portion of fraction B1 (240 mg) was further purified by PTLC (n-
hexane/EtOAc (9:1)) and gave 13-demethoxy-(11S*,12R*)-dihydroprotostemonine 55
(8.3 mg, 3.5%) and javastemonine A 186 (11.7 mg, 4.9%). Fraction B2 (700 mg) was
chromatographed on silica gel (n-hexane/EtOAc (9:1)) to give isoprotostemonine 45 (30
mg, 4.3%). A portion of fraction C (130 mg) was further chromatographed by PTLC (n-
hexane/EtOAc (9:1)) to give javastemonine B 187 (49.7 mg, 38.2%).
Javastemonine A (186)
Isolated as a brown gum.
= +36° (c 0.09, CHCl3).
HRESIMS m/z 390. 2280 [M + H]+ (calcd for C22H32NO5 390.2291).
IR film νmax 3436, 2963, 2874, 1771, 1761, 1657, 1455, 1159, 1044, 726 cm-1
.
1H NMR (500 MHz, CDCl3) refer to Table 4.1 for specific details.
13C NMR (125 MHz, CDCl3) refer to Table 4.1 for specific details.
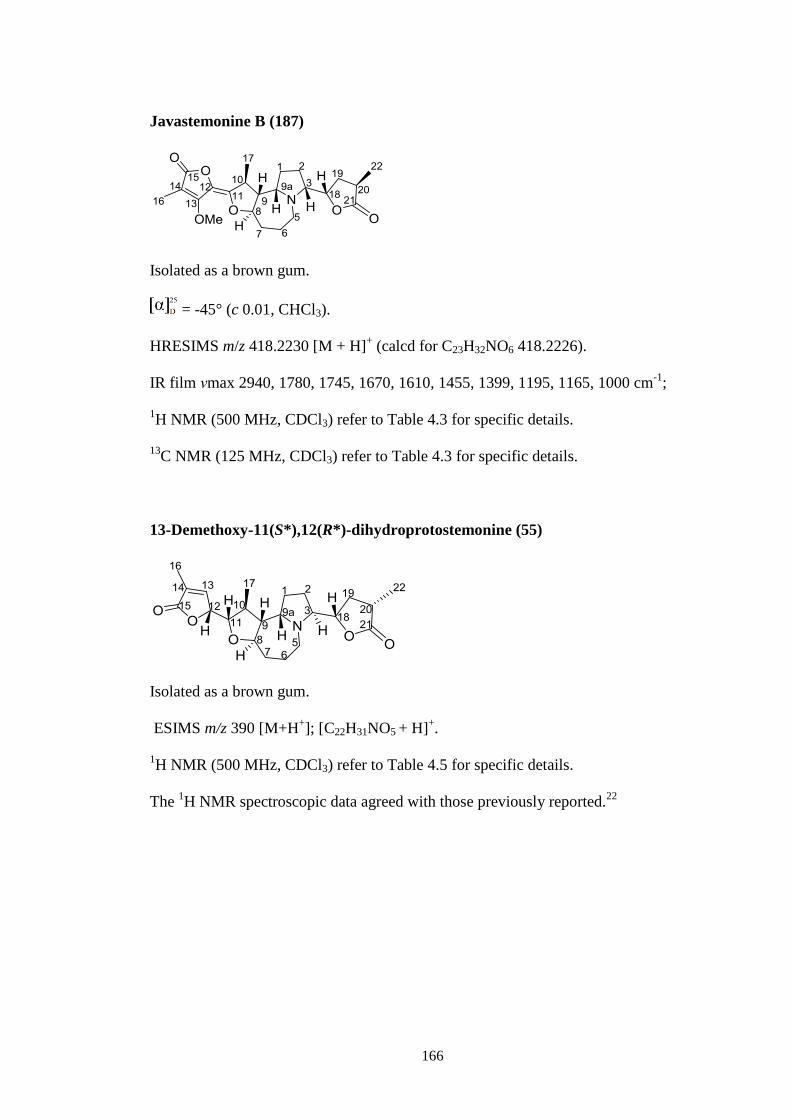
166
Javastemonine B (187)
Isolated as a brown gum.
= -45° (c 0.01, CHCl3).
HRESIMS m/z 418.2230 [M + H]+ (calcd for C23H32NO6 418.2226).
IR film νmax 2940, 1780, 1745, 1670, 1610, 1455, 1399, 1195, 1165, 1000 cm-1
;
1H NMR (500 MHz, CDCl3) refer to Table 4.3 for specific details.
13C NMR (125 MHz, CDCl3) refer to Table 4.3 for specific details.
13-Demethoxy-11(S*),12(R*)-dihydroprotostemonine (55)
Isolated as a brown gum.
ESIMS m/z 390 [M+H+]; [C22H31NO5 + H]
+.
1H NMR (500 MHz, CDCl3) refer to Table 4.5 for specific details.
The 1H NMR spectroscopic data agreed with those previously reported.
22
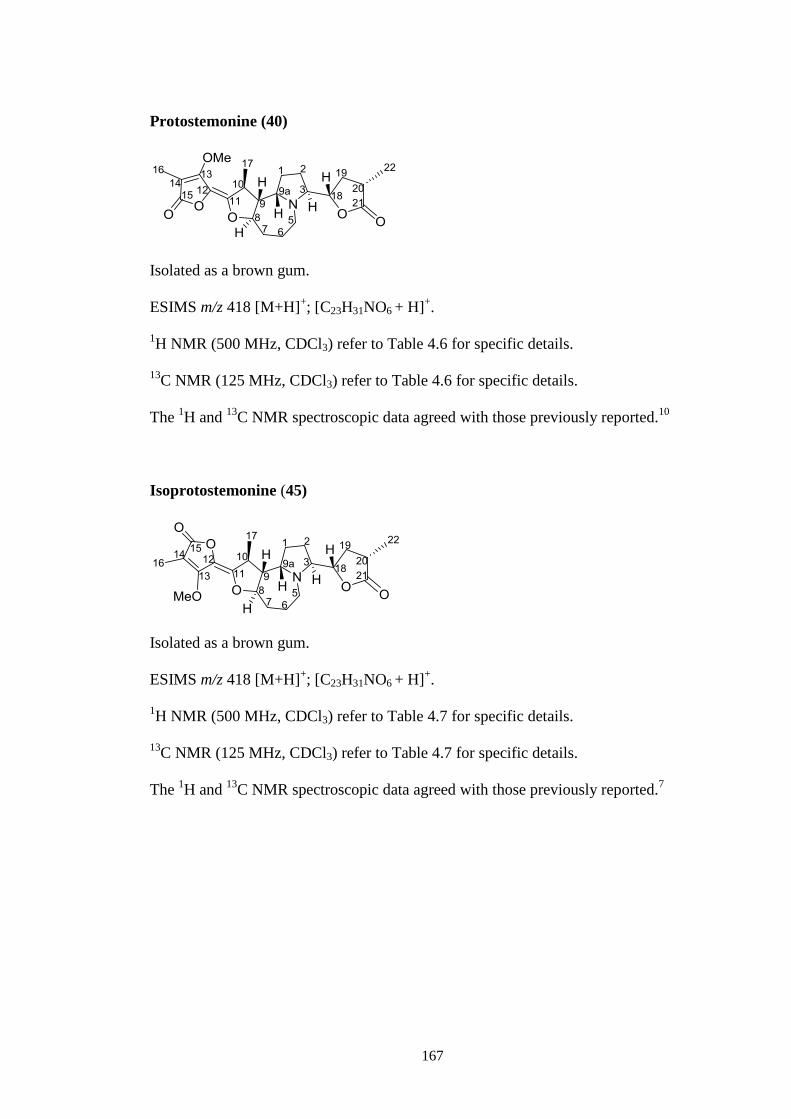
167
Protostemonine (40)
Isolated as a brown gum.
ESIMS m/z 418 [M+H]+; [C23H31NO6 + H]
+.
1H NMR (500 MHz, CDCl3) refer to Table 4.6 for specific details.
13C NMR (125 MHz, CDCl3) refer to Table 4.6 for specific details.
The 1H and
13C NMR spectroscopic data agreed with those previously reported.
10
Isoprotostemonine (45)
Isolated as a brown gum.
ESIMS m/z 418 [M+H]+; [C23H31NO6 + H]
+.
1H NMR (500 MHz, CDCl3) refer to Table 4.7 for specific details.
13C NMR (125 MHz, CDCl3) refer to Table 4.7 for specific details.
The 1H and
13C NMR spectroscopic data agreed with those previously reported.
7
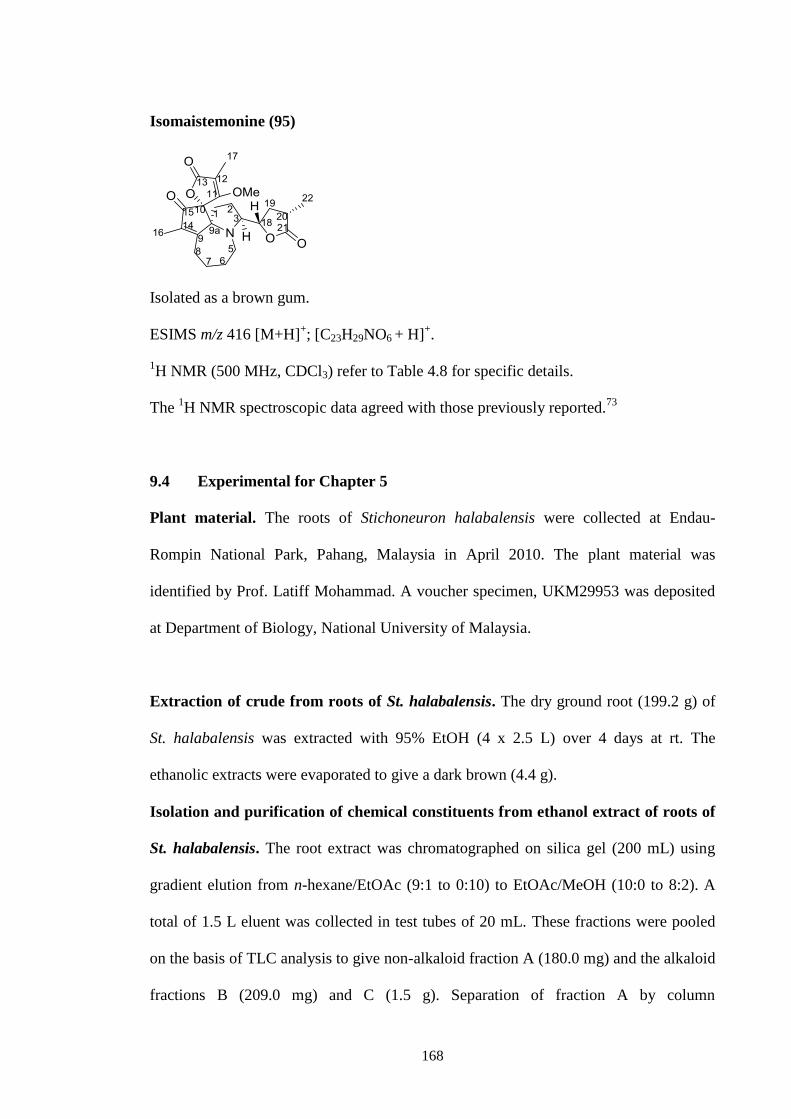
168
Isomaistemonine (95)
Isolated as a brown gum.
ESIMS m/z 416 [M+H]+; [C23H29NO6 + H]
+.
1H NMR (500 MHz, CDCl3) refer to Table 4.8 for specific details.
The 1H NMR spectroscopic data agreed with those previously reported.
73
9.4 Experimental for Chapter 5
Plant material. The roots of Stichoneuron halabalensis were collected at Endau-
Rompin National Park, Pahang, Malaysia in April 2010. The plant material was
identified by Prof. Latiff Mohammad. A voucher specimen, UKM29953 was deposited
at Department of Biology, National University of Malaysia.
Extraction of crude from roots of St. halabalensis. The dry ground root (199.2 g) of
St. halabalensis was extracted with 95% EtOH (4 x 2.5 L) over 4 days at rt. The
ethanolic extracts were evaporated to give a dark brown (4.4 g).
Isolation and purification of chemical constituents from ethanol extract of roots of
St. halabalensis. The root extract was chromatographed on silica gel (200 mL) using
gradient elution from n-hexane/EtOAc (9:1 to 0:10) to EtOAc/MeOH (10:0 to 8:2). A
total of 1.5 L eluent was collected in test tubes of 20 mL. These fractions were pooled
on the basis of TLC analysis to give non-alkaloid fraction A (180.0 mg) and the alkaloid
fractions B (209.0 mg) and C (1.5 g). Separation of fraction A by column
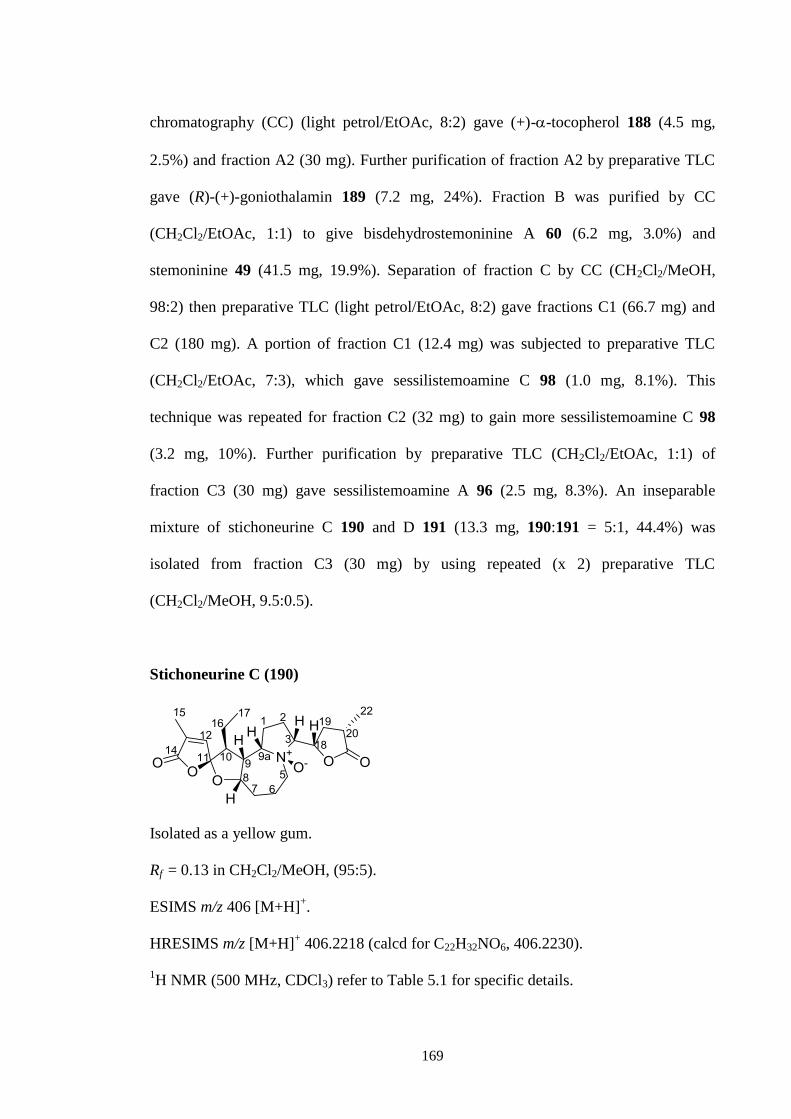
169
chromatography (CC) (light petrol/EtOAc, 8:2) gave (+)--tocopherol 188 (4.5 mg,
2.5%) and fraction A2 (30 mg). Further purification of fraction A2 by preparative TLC
gave (R)-(+)-goniothalamin 189 (7.2 mg, 24%). Fraction B was purified by CC
(CH2Cl2/EtOAc, 1:1) to give bisdehydrostemoninine A 60 (6.2 mg, 3.0%) and
stemoninine 49 (41.5 mg, 19.9%). Separation of fraction C by CC (CH2Cl2/MeOH,
98:2) then preparative TLC (light petrol/EtOAc, 8:2) gave fractions C1 (66.7 mg) and
C2 (180 mg). A portion of fraction C1 (12.4 mg) was subjected to preparative TLC
(CH2Cl2/EtOAc, 7:3), which gave sessilistemoamine C 98 (1.0 mg, 8.1%). This
technique was repeated for fraction C2 (32 mg) to gain more sessilistemoamine C 98
(3.2 mg, 10%). Further purification by preparative TLC (CH2Cl2/EtOAc, 1:1) of
fraction C3 (30 mg) gave sessilistemoamine A 96 (2.5 mg, 8.3%). An inseparable
mixture of stichoneurine C 190 and D 191 (13.3 mg, 190:191 = 5:1, 44.4%) was
isolated from fraction C3 (30 mg) by using repeated (x 2) preparative TLC
(CH2Cl2/MeOH, 9.5:0.5).
Stichoneurine C (190)
Isolated as a yellow gum.
Rf = 0.13 in CH2Cl2/MeOH, (95:5).
ESIMS m/z 406 [M+H]+.
HRESIMS m/z [M+H]+ 406.2218 (calcd for C22H32NO6, 406.2230).
1H NMR (500 MHz, CDCl3) refer to Table 5.1 for specific details.
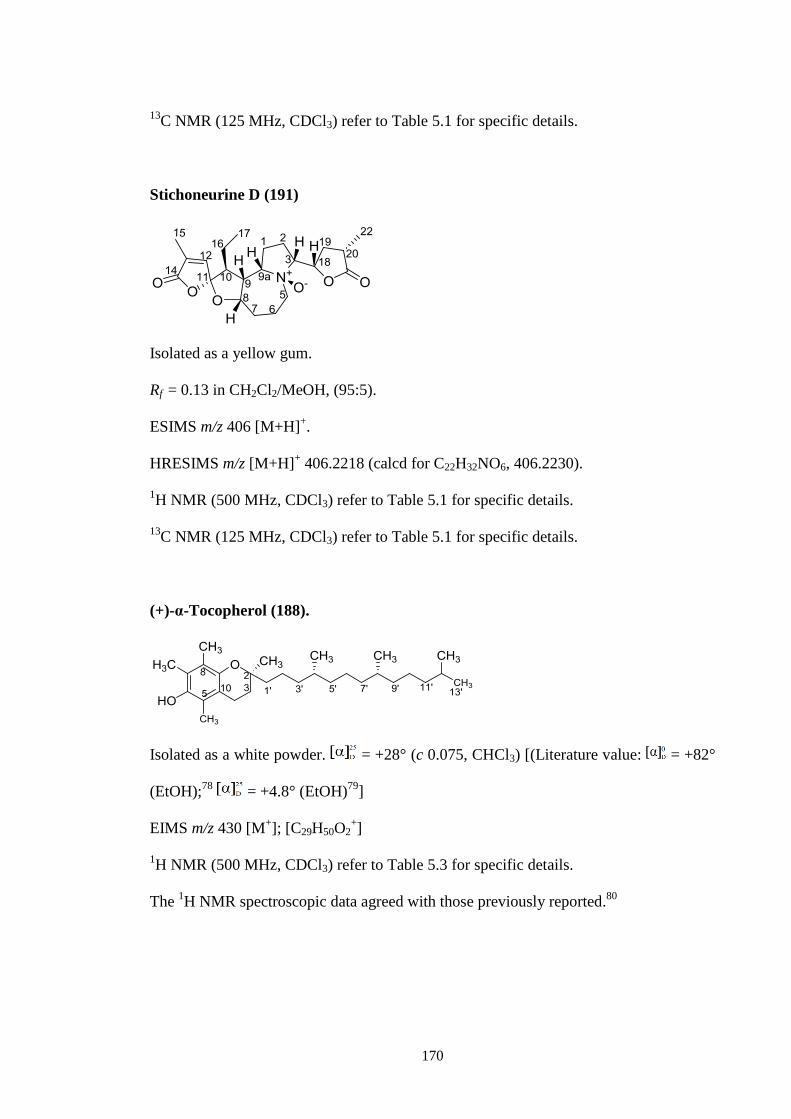
170
13C NMR (125 MHz, CDCl3) refer to Table 5.1 for specific details.
Stichoneurine D (191)
Isolated as a yellow gum.
Rf = 0.13 in CH2Cl2/MeOH, (95:5).
ESIMS m/z 406 [M+H]+.
HRESIMS m/z [M+H]+ 406.2218 (calcd for C22H32NO6, 406.2230).
1H NMR (500 MHz, CDCl3) refer to Table 5.1 for specific details.
13C NMR (125 MHz, CDCl3) refer to Table 5.1 for specific details.
(+)-α-Tocopherol (188).
Isolated as a white powder. = +28° (c 0.075, CHCl3) [(Literature value: = +82°
(EtOH);78
= +4.8° (EtOH)79
]
EIMS m/z 430 [M+]; [C29H50O2
+]
1H NMR (500 MHz, CDCl3) refer to Table 5.3 for specific details.
The 1H NMR spectroscopic data agreed with those previously reported.
80
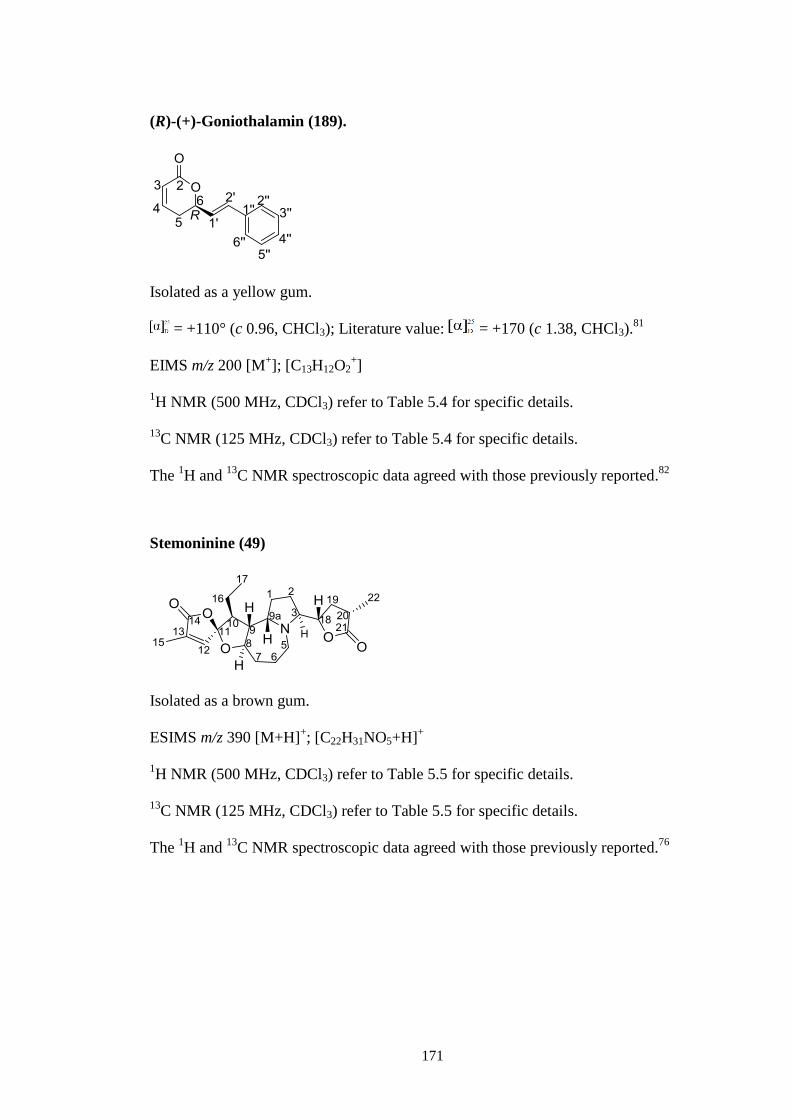
171
(R)-(+)-Goniothalamin (189).
Isolated as a yellow gum.
= +110° (c 0.96, CHCl3); Literature value: = +170 (c 1.38, CHCl3).81
EIMS m/z 200 [M+]; [C13H12O2
+]
1H NMR (500 MHz, CDCl3) refer to Table 5.4 for specific details.
13C NMR (125 MHz, CDCl3) refer to Table 5.4 for specific details.
The 1H and
13C NMR spectroscopic data agreed with those previously reported.
82
Stemoninine (49)
Isolated as a brown gum.
ESIMS m/z 390 [M+H]+; [C22H31NO5+H]
+
1H NMR (500 MHz, CDCl3) refer to Table 5.5 for specific details.
13C NMR (125 MHz, CDCl3) refer to Table 5.5 for specific details.
The 1H and
13C NMR spectroscopic data agreed with those previously reported.
76
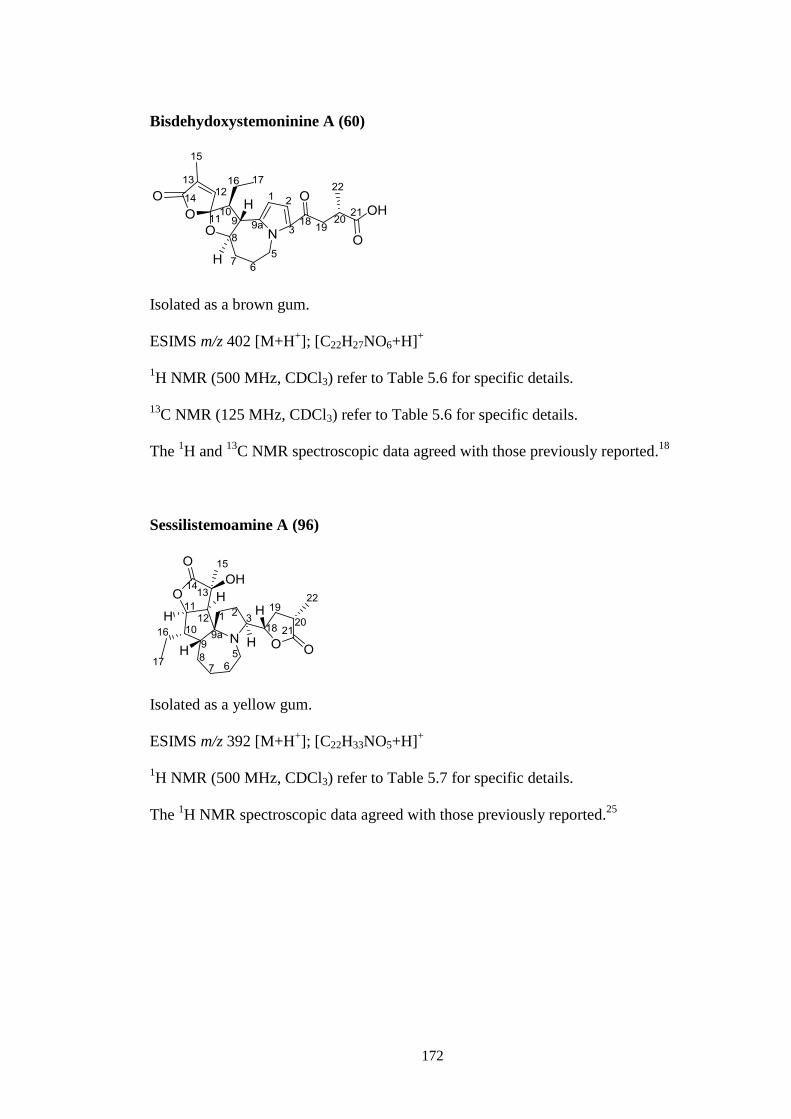
172
Bisdehydoxystemoninine A (60)
Isolated as a brown gum.
ESIMS m/z 402 [M+H+]; [C22H27NO6+H]
+
1H NMR (500 MHz, CDCl3) refer to Table 5.6 for specific details.
13C NMR (125 MHz, CDCl3) refer to Table 5.6 for specific details.
The 1H and
13C NMR spectroscopic data agreed with those previously reported.
18
Sessilistemoamine A (96)
Isolated as a yellow gum.
ESIMS m/z 392 [M+H+]; [C22H33NO5+H]
+
1H NMR (500 MHz, CDCl3) refer to Table 5.7 for specific details.
The 1H NMR spectroscopic data agreed with those previously reported.
25
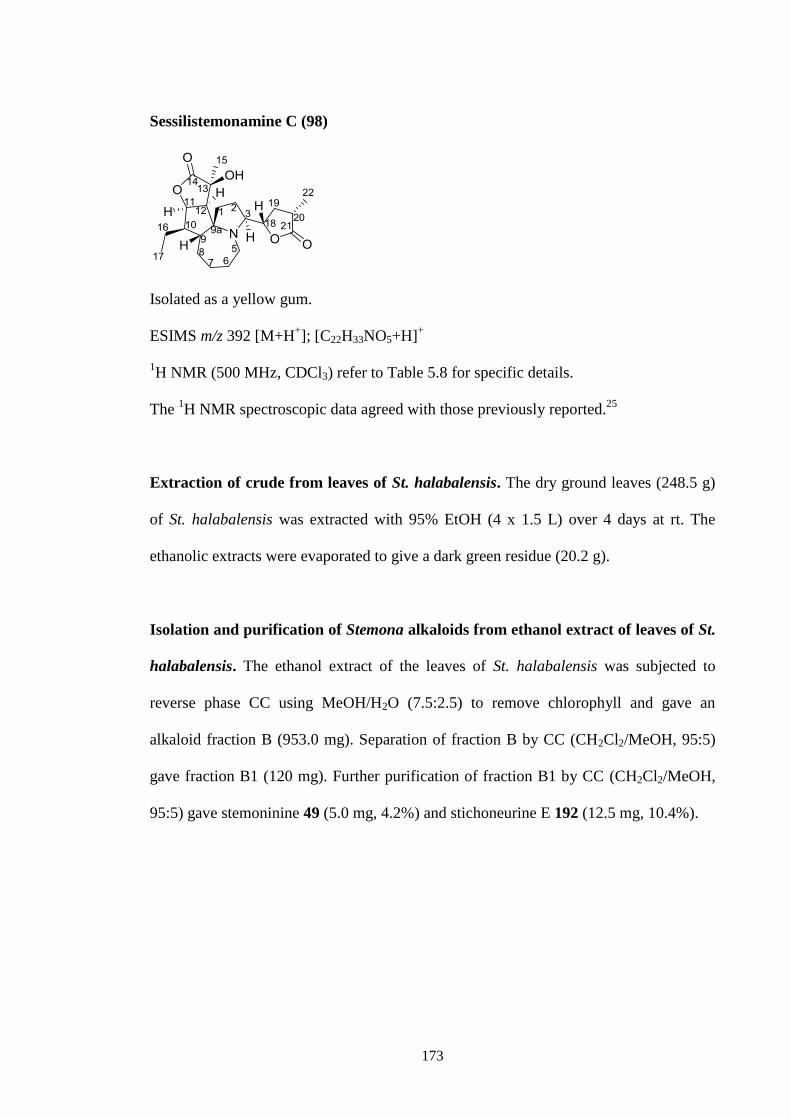
173
Sessilistemonamine C (98)
Isolated as a yellow gum.
ESIMS m/z 392 [M+H+]; [C22H33NO5+H]
+
1H NMR (500 MHz, CDCl3) refer to Table 5.8 for specific details.
The 1H NMR spectroscopic data agreed with those previously reported.
25
Extraction of crude from leaves of St. halabalensis. The dry ground leaves (248.5 g)
of St. halabalensis was extracted with 95% EtOH (4 x 1.5 L) over 4 days at rt. The
ethanolic extracts were evaporated to give a dark green residue (20.2 g).
Isolation and purification of Stemona alkaloids from ethanol extract of leaves of St.
halabalensis. The ethanol extract of the leaves of St. halabalensis was subjected to
reverse phase CC using MeOH/H2O (7.5:2.5) to remove chlorophyll and gave an
alkaloid fraction B (953.0 mg). Separation of fraction B by CC (CH2Cl2/MeOH, 95:5)
gave fraction B1 (120 mg). Further purification of fraction B1 by CC (CH2Cl2/MeOH,
95:5) gave stemoninine 49 (5.0 mg, 4.2%) and stichoneurine E 192 (12.5 mg, 10.4%).
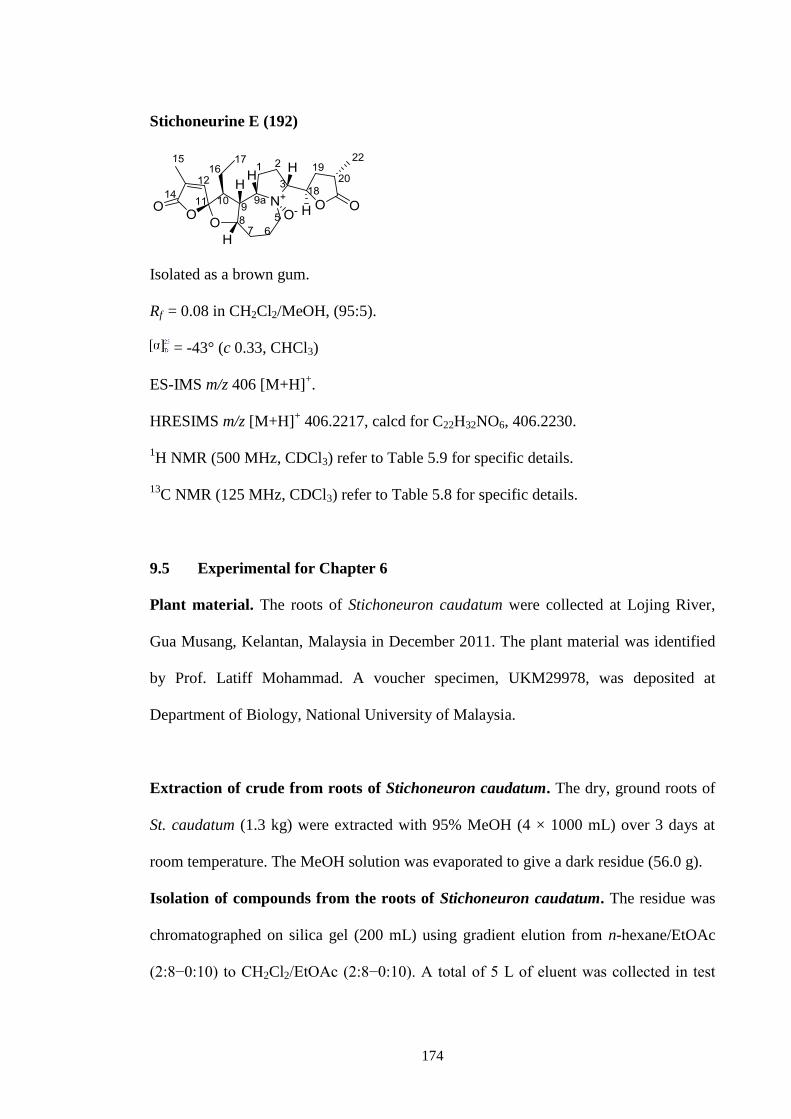
174
Stichoneurine E (192)
Isolated as a brown gum.
Rf = 0.08 in CH2Cl2/MeOH, (95:5).
= -43° (c 0.33, CHCl3)
ES-IMS m/z 406 [M+H]+.
HRESIMS m/z [M+H]+ 406.2217, calcd for C22H32NO6, 406.2230.
1H NMR (500 MHz, CDCl3) refer to Table 5.9 for specific details.
13C NMR (125 MHz, CDCl3) refer to Table 5.8 for specific details.
9.5 Experimental for Chapter 6
Plant material. The roots of Stichoneuron caudatum were collected at Lojing River,
Gua Musang, Kelantan, Malaysia in December 2011. The plant material was identified
by Prof. Latiff Mohammad. A voucher specimen, UKM29978, was deposited at
Department of Biology, National University of Malaysia.
Extraction of crude from roots of Stichoneuron caudatum. The dry, ground roots of
St. caudatum (1.3 kg) were extracted with 95% MeOH (4 × 1000 mL) over 3 days at
room temperature. The MeOH solution was evaporated to give a dark residue (56.0 g).
Isolation of compounds from the roots of Stichoneuron caudatum. The residue was
chromatographed on silica gel (200 mL) using gradient elution from n-hexane/EtOAc
(2:8−0:10) to CH2Cl2/EtOAc (2:8−0:10). A total of 5 L of eluent was collected in test

175
tubes of 200 mL. These fractions were pooled on the basis of TLC analysis to give three
alkaloid fractions; A (1.5 g), B (150 mg) and C (3.5 g). Fraction A (1.5 g) was further
separated by column chromatography (CC) using n-hexane/EtOAc (2:8) as the eluent to
give fraction A1 (500 mg) and fraction A2 (320 mg). Fraction A1 (500 mg) was then
separated by reverse phase CC (MeOH/H2O; 9:1) to give fraction A11 (205 mg).
Fraction A11 (205 mg) was further purified by silica gel CC using isocratic eluent (n-
hexane/EtOAc (4:6)) to give stichoneurine F 193 (100.5 mg, 49%). Fraction A2 (320
mg) was subjected to reverse phase CC (MeOH/H2O (7.5:2.5), 100 mL of eluent) to
give fraction A21 (23.1 mg). Fractions A21 (23.1 mg) was purified by silica gel CC
using petrol/acetone (2:8) to give sessilistemonamine E 195 (3.5 mg, 15.2%). Fraction B
(150 mg) was separated by silica gel CC (petrol/acetone (2:8) to give fraction B2 (70.5
mg) which was purified again by the same procedure to give stichoneurine G 194 (49.2
mg, 69.8%). A portion of fraction C (2.0 g) was separated by silica gel CC
(petrol/acetone (3:7) to give fraction C1 (364.9 mg). This fraction was chromatographed
on silica gel (n-hexane/acetone (3:7) to give fraction C12 (137.2 mg). This purification
procedure was repeated on fraction C12 (137.2 mg) to give pure sessilistemonamine F
196 (50.2 mg, 36.6%).
Stichoneurine F (193)
Isolated as a pale yellow gum.
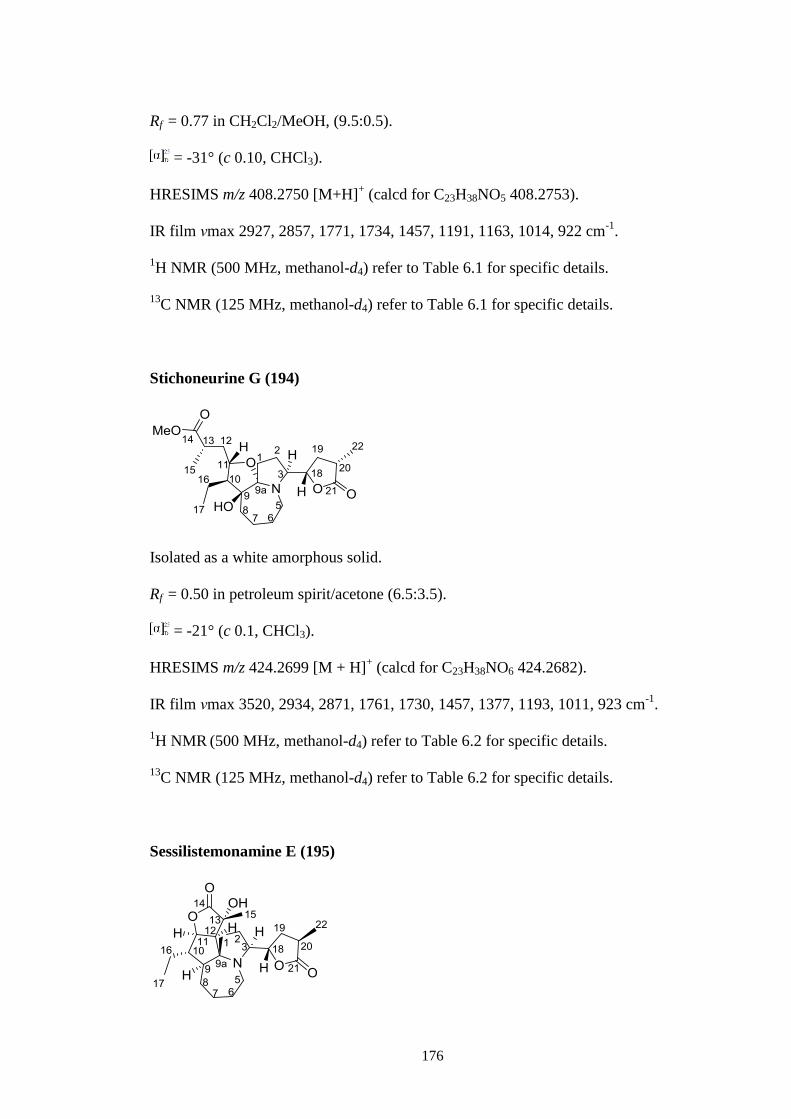
176
Rf = 0.77 in CH2Cl2/MeOH, (9.5:0.5).
= -31° (c 0.10, CHCl3).
HRESIMS m/z 408.2750 [M+H]+ (calcd for C23H38NO5 408.2753).
IR film νmax 2927, 2857, 1771, 1734, 1457, 1191, 1163, 1014, 922 cm-1
.
1H NMR (500 MHz, methanol-d4) refer to Table 6.1 for specific details.
13C NMR (125 MHz, methanol-d4) refer to Table 6.1 for specific details.
Stichoneurine G (194)
Isolated as a white amorphous solid.
Rf = 0.50 in petroleum spirit/acetone (6.5:3.5).
= -21° (c 0.1, CHCl3).
HRESIMS m/z 424.2699 [M + H]+ (calcd for C23H38NO6 424.2682).
IR film νmax 3520, 2934, 2871, 1761, 1730, 1457, 1377, 1193, 1011, 923 cm-1
.
1H NMR
(500 MHz, methanol-d4) refer to Table 6.2 for specific details.
13C NMR (125 MHz, methanol-d4) refer to Table 6.2 for specific details.
Sessilistemonamine E (195)
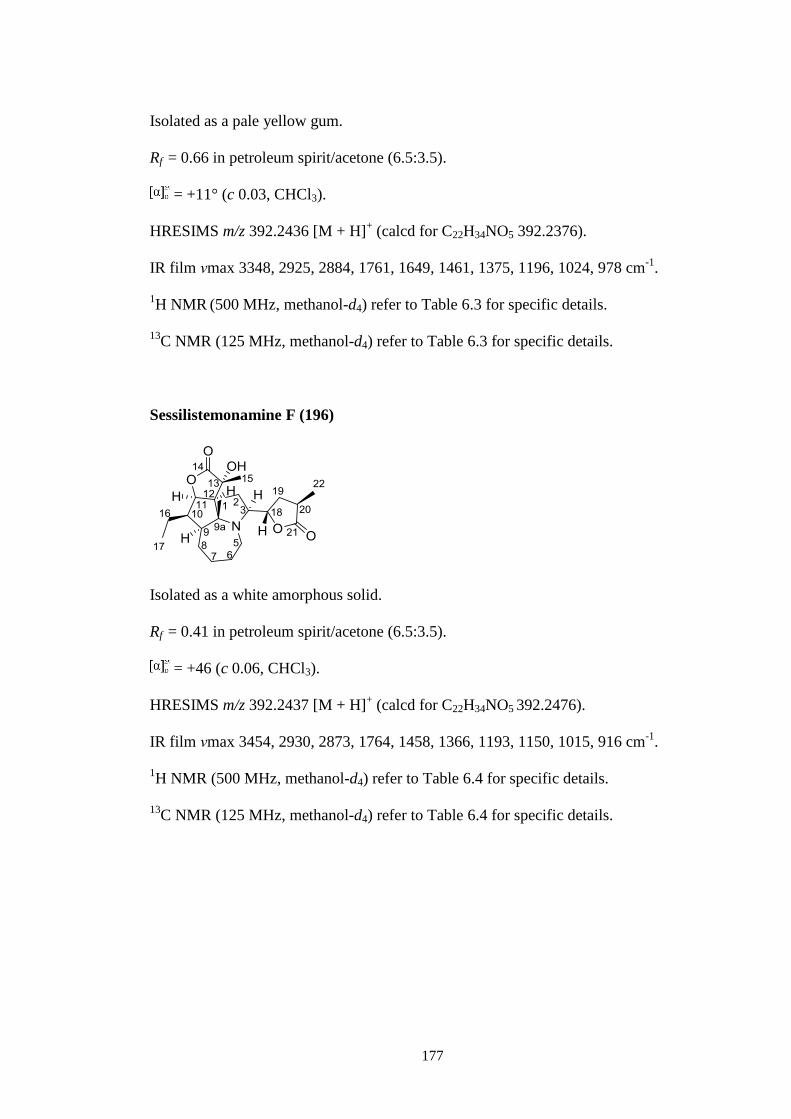
177
Isolated as a pale yellow gum.
Rf = 0.66 in petroleum spirit/acetone (6.5:3.5).
= +11° (c 0.03, CHCl3).
HRESIMS m/z 392.2436 [M + H]+ (calcd for C22H34NO5 392.2376).
IR film νmax 3348, 2925, 2884, 1761, 1649, 1461, 1375, 1196, 1024, 978 cm-1
.
1H NMR
(500 MHz, methanol-d4) refer to Table 6.3 for specific details.
13C NMR (125 MHz, methanol-d4) refer to Table 6.3 for specific details.
Sessilistemonamine F (196)
Isolated as a white amorphous solid.
Rf = 0.41 in petroleum spirit/acetone (6.5:3.5).
= +46 (c 0.06, CHCl3).
HRESIMS m/z 392.2437 [M + H]+ (calcd for C22H34NO5 392.2476).
IR film νmax 3454, 2930, 2873, 1764, 1458, 1366, 1193, 1150, 1015, 916 cm-1
.
1H NMR (500 MHz, methanol-d4) refer to Table 6.4 for specific details.
13C NMR (125 MHz, methanol-d4) refer to Table 6.4 for specific details.

178
9.6 Experimental for Chapter 7
9.6.1 AChE inhibitory activity
General methodology. AChE inhibitory assays were performed according to
Sastraruji.102
Acetylthiocholine iodide (ATChI) was used as a substrate while 5,5′-
dithiobis[2-nitrobenzoic acid] (DTNB) was used as a reagent. Two stock solutions were
used in this assay, buffer solution and substrate solution. The pH 7.0 phosphate buffer
solution was prepared from a mixture of 37.2 mM NaH2PO4⋅H2O and 62.7 mM
Na2HPO4⋅2H2O, in Milli Q H2O. The substrate solution was prepared as a 4.73 mM
ATChI solution in phosphate buffer pH 7.0. The reagent solution was prepared as a 3.15
mM DTNB solution in phosphate buffer pH 7.0. The assay was performed in 96-well
plates. In each well, 120 µL of phosphate buffer pH 7.0 was mixed with 20 µL of
reagent and 20 µL of substrate, then 20 µL of AChE (0.75 U/mL) in phosphate buffer
pH 7.0 was added with 20 µL of the sample (which was prepared in concentrations of
0.01-0.2 µM in DMSO). The final concentrations of each compound 1000, 500, 250,
125, 62.5, 31.250, 15.625, 7.813, 3.906, 1.953, 0.977, 0.488, 0.244 µM were prepared
by using the two-fold dilution technique, using the phosphate buffer to dilute the
solutions. Then the well plate was directly put into the microplate reader which was
thermostated at 25 °C. The absorbances were read using a SPECTRAmax® PLUS384
microplate thermostated spectrophotometer (California, USA) at 412 nm. Enzyme
activity was calculated as a percentage compared to an assay using a buffer without any
inhibitor. Galanthamine was used as a reference compounds. The AChE inhibitory data
were analyzed with the software package GraphPad Prism® (Graph Pad Inc., San
Diego, USA). IC50 values are means ± SD of three individual determinations each
performed in triplicate.
179
9.6.2 Antiplasmodial assay
These assays were performed by Dr. Roonglawan Rattanajak from the Medical
Molecular Biology Research Unit, National Center for Genetic Engineering and
Biotechnology, National Science and Technology Development Agency, Thailand. A
few isolated compounds were tested in vitro against a multidrug resistant K1CB1 strain
and a wild type chloroquine and antifolate sensitive TM4/8.2 strain of Plasmodium
falciparum. The method described by Trager and Jensen103
was used for maintaining the
parasites in human red blood cells in RPMI 1640 medium supplemented with 25 mM of
HEPES, 0.2% of 12 sodium bicarbonate, and 8% human serum in a 3% carbon dioxide
gas incubator maintained at 37 oC. The test samples were made up in DMSO solution
and the in vitro antiplasmodial activity testing was carried out using the Microdilution
Radioisotope Technique.104
The test sample (25 µL, in the culture medium) was placed
in triplicate in a 96-well plate where parasitised erythrocytes (200 µL) with a cell
suspension (1.5%) of parasitemia (0.5-1%) were then added to the wells. Generally, the
ranges of the final concentrations of the samples varied from 2 x 10⁻⁵ to 1 x 10⁻⁷ M or
up to 1 x 10⁻⁴ g/mL with 0.1% of the organic solvent. Due to the poor solubility of
some samples, only about 10-5 g/mL final concentration could be tested. The plates
were then cultured under standard conditions for 24 h after which 3H-hypoxanthine (25
µL, 0.5 µCi) was added to the culture medium. The culture was incubated (18-20 h)
after which the DNA from the parasite was harvested from the culture onto glass fibre
filters and a liquid scintillation counter was used to determine the amount of 3H-
hypoxanthine incorporation.105-106
The inhibitory concentration of the sample was
determined from its dose-response curves or by calculation. The assay was performed in
at least three replicates. Chloroquine (Sigma Company), pyrimethamine (Sigma
180
Company) and cycloguanil were used as positive controls for both plasmodial strains
(Table 2). DMSO (0.1%) and distilled water were used as controls to rule out the
solvent effects on the bioassay results of the test samples. All the experiments were
performed three times in duplicate (3x2).
9.6.3 Cytotoxicity assay and chemosensitivity testing
These assays were performed in Assoc. Prof. Pornngarm Limtrakul’s laboratory
at the Department of Biochemistry, Faculty of Medicine, Chiang Mai University,
Thailand.
Chemicals and reagents.
Doxorubicin (Dox), Verapamil (Ver), Paclitaxel (PTX), 3-(4,5-dimethylthiazol-2-yl)-
2,5-diphenyltetrazolium bromide (MTT) were obtained from Sigma Chemical Company
(St. Louis, MO, U.S.A.). Dulbecco’s modified Eagle’s medium (DMEM) and Roswell
Park Memorial Institute 1640 medium (RPMI1640) were purchased from Gibco BRL
(Grand Island, NY, U.S.A.).
Cell lines and culture conditions
The MDR leukemic cell line (K562/Adr) was purchased from RIKEN Cell Bank
(Tsukuba, Ibaraki, Japan). A drug-sensitive leukemic cell line (K562) was purchased
from The American type Culture Collection (ATCC, Manassas, VA, U.S.A.). Both cell
lines were cultured in RPMI1640 with 10% fetal bovine serum (FBS), 5 mm l-
glutamine, 50 IU/mL penicillin and 50 g/mL streptomycin; 700 nm of DOX was added
only to the K562/Adr culture medium. These cell lines were maintained in a humidified
181
incubator with an atmosphere comprising 95% air and 5% CO2 at 37°C.When the cells
reached 70–80% confluence, they were harvested and plated either for subsequent
passages or for drug treatments.
Cytotoxicity assay and chemosensitivity testing
K562 and K562/Adr cells were plated at 2.5×10³ cells per well in 96-well plates. 24
hours after plating increasing concentrations of isolated Stemona alkaloids (5, 10, 20,
40, 50 M) were added and the cells were then further incubated for 48 h at 37°C.
Overall cell number/viability was assessed by MTT assay. In each experiment,
determinations were carried out in triplicate. For measurement of DOX, and PTX
cytotoxicity, K562/Adr and K562 cells were plated at 2.5×10³ cells per well in 96-well
plates. After 24 hours, 5 mM of the Stemona alkaloids and various concentrations of
DOX or PTX were added. The cells were incubated for 48 h at 37°C, and then cell
growth was assessed by means of an MTT colorimetric assay. In each experiment,
determinations were carried out in triplicate. Relative resistance was calculated as the
ratio of the IC50 value of the K562/Adr cells to the IC50 value of the K562 cells.
Statistical Analysis
The results are presented as means ±S.D. from triplicate samples of three independent
experiments. Differences between the means were analyzed by one-way ANOVA.
Statistical significance was considered when p<0.05, or p<0.01, or p<0.001.
182
9.6.4 Cytotoxicity assay against Vero and KB cells
This assay was performed by Roonglawan Rattanajak from Medical Molecular Biology
Research Unit, National Center for Genetic Engineering and Biotechnology, National
Science and Technology Development Agency, Thailand. Normal Vero cells from
kidney of African green monkey, Cecopithecus aethiops and human oral carcinoma KB
cells were maintained and cultured in powdered GE Healthcare HyClone Minimal
Essential Medium with Earle's (MEM/EBSS) supplemented with heated-inactivated
fetal bovine serum (10%), NaHCO3 (2.2 g/L) and of sodium pyruvate (1%). KB cell
lines were cultured in DMEM/low glucose supplemented with heated inactivated fetal
bovine serum (10%), NaHCO3 (3.7 g/L) and non-essential amino acids (1%).
Cytotoxicity was evaluated by the sulforhodamine B (SRB) assay (OD510 nm).107
Doxorubicin and ellipticine were used as positive control drugs for cytotoxicity
activities.

183
REFERENCES
1. Inthachub, P.; Vajrodaya, S.; Duyfjes, B. E. E. Edinburgh J. Bot. 2009, 66, 213–
228.
2. Pilli, R. A.; Rosso, G. B.; De Olievera, M. D. C.; The Stemona Alkaloids, in The
Alkaloids: Chemistry and Biology; Cordell, G. A., Editor; Academic Press: San
Diego, 2005; Vol. 62, Chapter 2, pp 77–173.
3. Majumdar, K.; Datta, B. K. Modern Phytomorphology 2013, 3, 39–44.
4. Schinner, J.; Kaltenegger, E.; Pacher, T.; Vajrodaya, S.; Hofer, O.; Greger; H.
Montash. Chem. 2005, 136, 1671–1680.
5. Greger, H.; Schinner, J.; Vajrodaya, S.; Brecker, L.; Hofer, O. J. Nat. Prod. 2009,
72, 1708–1711.
6. Xu, R.-S.; Lu, Y.-J.; Chu, J.-H. Tetrahedron 1982, 38, 2667–2670.
7. Ye, Y.; Qin, G.-W.; Xu, R.-S. Phytochemistry. 1994, 37, 1201–1203.
8. Sakata, K.; Aoki, K.; Chang, C.-F.; Sakurai, A.; Mura-koshi. J. Agri. Biol. Chem.
1978, 42, 457–463.
9. Chung, H.-S.; Hon, P.-M., Lin, G.; But, P. P,-H., Dong, H. Planta Med. 2003,
914–920.
10. Kaltenegger, E.; Brem, B.; Mereiter, K.; Kalchhauser, H.; Kahlig, H. Hofer, O.;
Vajrodaya, S.; Greger, H. Phytochemistry 2003, 63, 803–816.
11. Mungkornasawakul, P.; Pyne, S. G.; Jatisatienr, A.; Supyen, D. Jatisatienr, C.;
Lie, W.; Ung, A. T.; Skelton, B. W.; White, A. H. J. Nat. Prod. 2004, 67, 675–
677.
12. Greger, H. Planta Med. 2006, 72, 99–113.
184
13. Mungkornasawakul, P.; Pyne, S. G.; Jatisatienr, A.; Supyen, D.; Lie, W; Ung, A.
T.; Skelton, B. W.; White, A. H. J. Nat. Prod. 2003, 66, 980–982.
14. Pili, R. A.; Rosso, G. B.; De Oliveira, M. D. C. F. Nat. Prod. Rep. 2010, 27,
1908–1937
15. Jiwajinda, S.; Hirai, N.; Watanabe, K.; Santisopasri, V.; Cheungsamarnyart, N.;
Koshimizu, K.; Ohigashi, H. Phytochemistry 2001, 56, 693–695.
16. Ramachandran, P. V.; Srivastava, A.; Hazra, D. Org. Lett. 2006, 9, 157–160.
17. Lin, L.-G.; Li, K. M.; Tang, C.-P.; Ke, C.-Q.; Rudd, J. A.; Lin, G.; Ye, Y. J. Nat.
Prod. 2008, 71, 1107–1110.
18. Lin, L.-G.; Zhong, Q.-X.; Cheng, T.-Y.; Tang, C.-P.; Ke, C.-Q; Lin, G.; Ye, Y. J.
Nat. Prod. 2006, 69, 1051–1054.
19. Pilli, R. A.; De Oliveira, M. D. C. F. Nat. Prod. Rep. 2000, 17, 117–127.
20. Shinozaki, H.; Ishida, M. Brain Res. 1985, 334, 33–40.
21. Thany, S. T.; Tricoire-Leignel, H.; Lapied, B.; Identification of Cholinergic
Synaptic Transmission in the Insect Nervous System, in Illustrates the finding that
the insect central nervous system is extremely rich in acetylcholine receptors
which have a predominantly nicotinic pharmacology; Thany. S. H., Editor;
Landes Bioscience and Springer Science and Business Media: France, 2010; Vol.
583, Chapter 1, pp 1–10.
22. Tang, C.-P.; Chen, T.; Velten, R.; Jeschke, P.; Ebbinghaus-Kintscher, U.; Geibel,
S.; Ye, Y. J. Nat. Prod. 2008, 71, 112–116.
23. Sussman, J. Science 1991, 253, 872–879.
24. Williams, P.; Sorribas, A.; Howes, M.-J. R. Nat. Prod. Rep. 2011, 28, 48–77.
185
25. Wang, P.; Liu, A. L; An. Z.; Li, Z. H.; Du, G. H.; Qin, H. L. Chem. Biodiv. 2007,
4, 523–530.
26. Gottesman, M. M.; Pastan, I.; Ambudkar, S.V. Current Opinion in Genetic &
Development 1996, 6, 610–617.
27. Litman, T.; Druley, T. E.; Stein, W. D.; Bates, S. E. Cell. Mol. Life Sci. 2001, 58,
931–959.
28. Ambudkar, S.V.; Kimchi-Sarfaty, C.; Sauna, Z.E.; Gottesman, M. M. Oncogene
2003, 22, 7468–7485.
29. Chanmahasathien, W.; Ampasavate, C.; Greger, H.; Limtrakul, P. Phytomed.
2011, 18, 199–204.
30. Manohar, A. Braz. Arch. Biol. Technol. 2013, 56, 21–25.
31. Lin, W.-H.; Cai, M.-S.; Ying, B.-P.; Feng, R. Acta Pharm. Sin. (Yaoxue Xuebao)
1993, 28, 202–206.
32. Hitotsuyanagi, Y.; Takeda, E.; Fukaya, H.; Takeya, K. Tetrahedron Lett. 2008,
49, 7376–7379.
33. Ueo, S.; Irie, H.; Harada, H. Chem. Pharma. Bull. 1967, 15, 768–70.
34. Hitotsuyanagi, Y.; Uemura, G.; Takeya, K. Tetrahedron Lett. 2010, 51, 5694–
5696.
35. Hitotsuyanagi, Y.; Fukaya, H.; Takeda, E.; Matsuda, S.; Saishu, Y.; Zhu, S.;
Komatsu, K.; Takeya, K. Tetrahedron 2013, 69, 6297–6304.
36. Hitotsuyanagi, Y.; Genta S.; Haruhiko F.; Maho, H.; Shu, Z.; Katsuko, K.;
Koichi, T. Tetraherdron Lett. 2013, 54, 6995–6998.
37. Lai, D.-H.; Yang, Z.-D.; Xui, W.-W; Sheng, J.; Shi, Y.; Yao, X.-J. Fitoterapia
2013, 89, 257–264.

186
38. Yu, G.; Jun, W.; Zhang, C.-F; Xu, X.-H.; Miang, Z.; Kong, L.-Y. Tetrahedron
2014, 70, 967-974.
39. Chaiyong, S.; Jatisatienr, A.; Mungkornasawakul, P.; Sastraruji, T.; Pyne, S. G.;
Ung, A. T., Urathamakul, T.; Lie, W. J. Nat. Prod. 2010, 73, 1833–1838.
40. Pudjiastuti, P.; Pyne, S. G.; Sugiyanto; Lie, W. Phytochemistry Lett. 2012, 5,
358–360.
41. Guo, J.; He, H.; Li, S.; Hua, H.; Hao, X. Acta Botanica Yunnan. 2010, 32, 463–
465.
42. Sastraruji, T.; Chaiyong, S.; Jatisatienr, A.; Pyne, S. G.; Ung, A. T.; Lie, W. J.
Nat. Prod. 2011, 74, 60-64.
43. Sastraruji, T.; Jatisatienr, A.; Issakul, K.; Pyne, S. G.; Ung, A. T.; Lie, W.;
Williams, M. C. Nat. Prod. Commun. 2006, 1, 813-818.
44. Mungkornasawakul, P.; Pyne, S. G.; Wilis, A. C.; Jatisatienr, A.; Phuthsuk, D.;
Lie, W. Phytochemistry Lett. 2013, 6, 602–605.
45. Hitotsuyanagi, Y.; Hikita, M.; Uemura, G.; Fukaya, H.; Takeya, K. Tetrahedron
2011, 67, 455–461.
46. Seger, C.; Mereiter, K.; Kaltenegger, E.; Pacher, T.; Greger, H; Hofer, O. Chem.
Biodiv. 2004, 1, 265–279.
47. Mungkornasawakul, P.; Matthews, H.; Ung, A. T.; Pyne, S. G.; Jatisatienr, A.;
Lie, W.; Skelton, B. W.; White, A. H. ACGC Chem. Res. Comm. 2005, 19, 30–
33.
48. Lin, L.-G.; Tang, C.-P.; Dien, P.-H.; Xu, R.-S.; Ye, Y. Tetrahedron Lett. 2007,
48, 1559–1561.
187
49. Takayama, H,; Ichikawa, T.; Kitajima, M.; Aimi, N.; Lopez, D.; Nonato, M. G.
Tetrahedron Lett. 2001, 42, 2995–2996.
50. Takayama, H,; Ichikawa, T.; Kuwajima, M.; Kitajima, M; Seki, H.; Aimi, N.;
Nonato, M. G. J. Am. Chem. Soc. 2000, 122, 8635–8639.
51. Duyfjes, B. E. E. Fl. Malesiana 1993, 11, 404–405.
52. Tsi, Z. H., Duyfjes, B. E. E. Stemonaceae, Wu, Z. Y., Raven, P., Editor; Flora of
China, Science Press: Beijing, 2000, 24, 70–72.
53. Kostecki, K.; Engelmeier, D.; Pacher, T.; Hofer, O.; Vajrodaya, S.; Greger, H.
Phytochemistry 2004, 65, 99–106.
54. http://users.skynet.be/fhoes/rsasucculents/stemona_sesselifolia_flowers.htm
(September 2014)
55. http://www.bihrmann.com/caudiciforms/subs/ste-col-sub.asp (September 2014)
56. https://www.geocities.jp/caposaldo/bkbbyakubu.jpg (September 2014)
57. https://www.flickr.com/photos/17457752@N00/7959902042 (September 2014)
58. https://www.google.com.au/maps/place/Dungun,+Terengganu,+Malaysia/@3.00
02712,97.8747087,5z/data=!4m2!3m1!1s0x31c805887d316621:0xab269c540626
2890) (September 2014)
59. Murugan, C. Rheedea 2010, 20, 77–79.
60. Thirapasakun, L.; Phanurai, P. Bull. Med. Sci. (Mahidol University) 1977, 19,
145-155.
61. http://www.kew.org/index.htm (September 2014)
62. Telford, I. R. Fl. Australia 1986, 46, 180.
63. http://commons.wikimedia.org/wiki/File:Stichoneuron_membranaceum_IP.png
(September 2014)

188
64. https://www.google.com.au/maps/preview?q=taman+negara+endau+rompin+pah
ang&ie=UTF-8&ei=c6TpU9O3ONXi8AW8_IGIAQ&ved=0CAkQ_AUoAg
(September 2014)
65. Pili, R. A.; Rosso, G. B.; De Olievera, M. D. C.; The Stemona Alkaloids, in The
Alkaloids: Chemistry and Biology; Cordell, G. A., Editor; Academic Press: San
Diego, 2005; Vol. 62, Chapter 2, pp 77–173.
66. Bouman, F.; Seed structure and systematics in Dioscoreales, In: Rudall, P. J.,
Editor; Cribb, P. J.; Cutler, D. F.; Humphries, C. J. (eds) Monocotyledons:
Systematics and Evolution: Royal Botanic Gardens, 1995; pp 139–156.
67. Ridley. H. N. J. Straits Branch Roy. Asiat. Soc. 1911, 57, 107.
68. Said, I. M.; Din, L. B.; Samsudin, M. W.; Zakaria, Z.; Yusoff, N. I.; Suki,
U.; Manap, A.; Ibrahim, A. Z.; Latiff, A. Malayan Nature Journal 1990, 43,260–
266.
69. Inthachub, P.; Taxonomic Revision on the Family Stemonaceae in Thailand.
Master’s thesis, 2008. Kasetsart University, Bangkok, Thailand.
70. https://www.google.com.au/maps/place/Moonriver+Lodge/@2.4142552,106.262
4157,7z/data=!4m2!3m1!1s0x31ca676565a2d71b:0x779a90d111c7239e
(September 2014)
71. Kende, A. S.; Smalley, T. L.; Jr.; Huang, H. J. Am. Chem. Soc. 1999, 121, 7431–
7432.
72. Hosoya, T.; Yamasaki ,F.; Nakata, A.; Rahman, A.; Kusumawati, I.; Zaini, N. C.;
Morita, H. Planta Med. 2011, 77, 256–258.
73. Guo, A.; Jin, L.; Cai, S.; Guo, S.; Lin, W. Chem. Biodiv. 2008, 5, 598–605.
189
74. Kongkiatpaiboon, S.; Schinnerl, J.; Felsinge, S.; Keeratinijakal, V.; Vajrodaya,
S.; Gritsanapan, W.; Brecker, L.; Greger, H. J. Nat. Prod. 2011, 74, 1931−1938.
75. Pilli, R. A.; Rosso, G. B.; de Oliveira, M. C. F. Nat. Prod. Rep. 2010, 27, 1908–
1937.
76. Cheng, D.; Guo, J.; Chu, T. T. J. Nat. Prod. 1988, 51, 202–211.
77. Sastraruji, T.; Jatistienr, A.; Pyne, S. G.; Ung, A. T.; Lie, W.; Williams, M. C. J.
Nat. Prod. 2005, 68, 1763–1767.
78. Mayer, H.; Schudel, P.; Ruegg, R.; Isler, O. Helv. Chim. Acta 1963, 46, 96382.
79. Moss, A. R.; Drummond, J. C. Biochem. J. 1938, 32, 19531956.
80. Baker, J. K.; Myers, C. W. Pharm. Res. 1991, 8, 763–770.
81. Jewers, K.; Blunden, G.; Wetchapinan, S.; Dougan, J.; Manchada, A. H.; Davis,
J. B.; Kyi, A. Phytochemistry 1972, 11, 2025.
82. Cavalheiroa, A. J.; Yoshida, M. Phytochemistry 2000, 53, 811-819.
83. Ellman, G. L; Courtney, K. D.; Andres, V. J.; Featherstone, R. M. Biochem.
Pharmacol. 1961, 7, 88–95.
84. Landis, S. H.; Murray, T.; Bolden, S.; Wingo, P. A. Cancer J. Clin. 1998, 48, 6–
29.
85. Gottesman, M. M. Cancer Res. 1993, 53, 747–754.
86. Krishna, R.; Mayer, L. D. Eur. J. Pharm. Sci. 11 2000, 265–283.
87. Fan, D.; Beltran, P. J.; O’Brien, C. A.; Reversal of multidrug Resistance, In
Reversal of Multidrug Resistance in Cancer; Kellen, J. A.; Editor; CRC Press:
Boca Raton, FL, 1994 pp 93–124.
88. Gong, J.; Jaiswal, R.; Mathys, J. -M.; Combes, V.; Grau, G. E.R.; Bebawy, M.
Cancer Treat. Rev. 2012, 38, 226–234.
190
89. Callaghan, R.; Crowley, E.; Potter, S.; Kerr, I. D. J. Clin. Pharmacol. 2008, 48,
365–378.
90. Gottesman, M. M. Annu. Rev. Med. 2002, 53, 615–627.
91. Lehnert, M. Eur. J. Cancer 1996, 32, 912–920.
92. Lage, H. Cell. Mol. Life Sci. 2008, 65, 3145–3167.
93. Hilton, J. Cancer Res. 1984, 44, 5156–5160.
94. Andersson, B. S.; Mroue, M.; Britten, R. A.; Murray, D. Cancer Res. 1994, 54,
5394–5400.
95. Simon, S. M.; Schindler, M. Proc. Nat. Acad. Sci. USA 1994, 91, 3497-3504.
96. Ling, V.; Thompson, L. H.; J. Cell. Physiol. 1974, 83, 103–116.
97. Juliano, R. L.; Ling, V. Biochim. Biophys. Acta 1976, 455, 152–162.
98. Riordan, J. R.; Ling, V. J. Biol. Chem. 1979, 254, 12701–12705.
99. Kartner, N.; Riordan, J. R.; Ling, V. Science 1983, 221, 1285–1288.
100. Nobili, S.; Landini, I.; Giglioni, B.; Mini, E. Curr. Drug Targets 2006, 7, 861–
879.
101. Zhou, T.; Shi, Q.; Bastow, K.; Lee, K. -H. J. Med. Chem. 2010, 53, 8700–8708.
102. Sastraruji, K.; Sastraruji, T.; Ung, A. T.; Griffith, R.; Jatisatienr, A.; Pyne, S. G.
Tetrahedron 2012, 68, 7103–7115.
103. Trager, W., Jensen, J. B. Science 1976, 193, 673–675.
104. Wangchuk, P.; Keller, P.A.; Pyne, S.G.; Taweechotipatr, M.; Tonsomboon, A.;
Rattanajak, R.; Kamchonwongpaisan, S. J. Ethnopharm. 2011, 137, 730–742.
105. Desjardins, R.E.; Canfield, C.J.; Haynes, J.D.; Chulay, J.D. Antimicrob. Agents
Chemother. 1979, 16, 710–718.
191
106. Kamchonwongpaisan, S.; Quarell, R.; Charoensetakul, N.; Ponsinet, R.; Vilaivan,
T.; Vanichtanankul, J.; Tarnchompoo, B.; Sirawaraporn, W.; Lowe, G.;
Yuthavong, Y. J. Med. Chem. 2004, 47, 673–680.
107. Wangchuk, P.; Keller, P.A.; Pyne, S.G.; Sastraruji, T.; Taweechotipatr, M.;
Tonsomboon, A.; Rattanajak, R.; Kamchonwongpaisan, S. Nat. Prod. Commun.
2012, 7, 575–580.