2015 new south wales election: analysis of results › researchpapers... · 2016-02-04 · nsw...
TRANSCRIPT

2015 New South Wales Election:
Analysis of Results Background Paper No 1/2015
by Antony Green

RELATED PUBLICATIONS
NSW Legislative Assembly election 2011: Two-party preferred results by polling place, by Antony Green (Background Paper 1/2012)
2011 New South Wales Election: Analysis of Results, by Antony Green (Background Paper 3/2011)
2011 NSW Election Preview – Analysis of past voting patterns
by electorate, by Antony Green (Background Paper 1/2011)
NSW Legislative Assembly Elections 2007: Two-Candidate Preferred Results by Polling Place, by Antony Green (Background Paper 2/2009)
NSW Legislative Assembly Elections 2003: Two-Candidate
Preferred Results by Polling Place, by Antony Green (Background Paper 7/2003)
ISSN 1325-4456
ISBN 978-0-7313-1937-4
July 2015
© 2015
Except to the extent of the uses permitted under the Copyright Act 1968, no part of this document may be reproduced or transmitted in any form or by any means including information storage and retrieval systems, without the prior consent from the Manager, NSW Parliamentary Research Service, other than by Members of the New South Wales Parliament in the course of
their official duties.

2015 New South Wales Election: Analysis of Results
by
Antony Green

NSW PARLIAMENTARY RESEARCH SERVICE
Gareth Griffith (BSc (Econ) (Hons), LLB (Hons), PhD), Manager, Politics & Government/Law .......................................... (02) 9230 2356 Daniel Montoya (BEnvSc (Hons), PhD), Senior Research Officer, Environment/Planning ......................... (02) 9230 2003 Lenny Roth (BCom, LLB), Senior Research Officer, Law ....................................................... (02) 9230 2768 Christopher Angus (BA(Media&Comm), LLM(Juris Doctor)), Research Officer, Law .................................................................. (02) 9230 2906 Tom Gotsis (BA, LLB, Dip Ed, Grad Dip Soc Sci) Research Officer, Law .................................................................. (02) 9230 3085 Andrew Haylen (BResEc (Hons)), Research Officer, Public Policy/Statistical Indicators .................. (02) 9230 2484 John Wilkinson (MA, PhD), Research Officer, Economics ...................................................... (02) 9230 2006
Should Members or their staff require further information about this publication please contact the author.
Information about Research Publications can be found on the Internet at:
http://www.parliament.nsw.gov.au/prod/parlment/publications.nsf/V3LIstRPSubject
Advice on legislation or legal policy issues contained in this paper is provided for use in parliamentary debate and for related parliamentary purposes. This paper is not professional legal opinion.

CONTENTS
Introduction ........................................................................................................ 1
Statistical Highlights .......................................................................................... 3
Legislative Assembly Election
Summary of Legislative Assembly Results ...................................................... 5
Legislative Assembly Results by Electoral District ......................................... 10
Summary of Two-Party Preferred Results ...................................................... 31
Regional Summaries ...................................................................................... 38
By-elections 2011 - 2015 ............................................................................... 42
Legislative Council Election
Summary of Legislative Council Result .......................................................... 44
Detail of Legislative Council First Preference Votes ....................................... 47
New and Departing Members .......................................................................... 56
Summary of 2013 Redistribution .................................................................... 58
NSW Election Results 1947-2015 .................................................................... 63

Symbols
.. Nil or rounded to zero * Sitting MP .... 'Ghost' candidate, where a party contesting the previous election did not nominate for the
current election. Party Abbreviations
- Unaffiliated Candidates ACP Australian Cyclists Party AFP #Australia First AJP Animal Justice Party ALP Australian Labor Party AMP Australian Motorists Party BAP Building Australia Party CDP Christian Democratic Party (Fred Nile Group) CLR Country Labor COM #Communist League CP #Country Party DEM Australian Democrats DLP Democratic Labor Party FP The Fishing Party FUT #Future Party IND Independents GRN The Greens LDP #Liberal Democratic Party LIB Liberal Party NAT The Nationals NLT No Land Tax NPM No Parking Meters Party ONP One Nation ORP Outdoor Recreation Party OTH Others SA Socialist Alliance SEP #Socialist Equality Party SFP Shooters and Fishers Party STR #Strata Party UNI Unity VEP Voluntary Euthanasia Party (# – not registered parties)
Important Dates Legislative Assembly dissolved Friday 6 March 2015 Issue of Writs Saturday 7 March 2015 Close of Rolls (for printing) Saturday 7 March 2015 Close of Nominations Thursday 12 March 2015 Polling Day Saturday 28 March 2015 Date set for Return of Writ Wednesday 30 April 2015 (Writ returned 21 April 2015)

NSW Election 2015
1
INTRODUCTION
This paper provides an analysis of the results of the 2015 New South Wales election. It provides summaries of the elections for both chambers, analysis of Legislative Assembly results both before and after the distribution of preferences, as well as a summary of the Legislative Council election.
2013 Redistribution
The 2015 election was contested on new electoral boundaries released in 2013. In preparing this publication, the results of the 2011 election have been adjusted to match the new boundaries. All swings and changes in vote shares shown in this publication are calculated compared to adjusted results. A summary of the redistribution changes can be found in this publication on page 58. More detail on the redistribution can be found in “2013 New South Wales Redistribution: Analysis of Final Electoral Boundaries”, NSW Parliamentary Research Service Background Paper No. 3/2013. See the notes on changing seat on page 5 where some of the complications concerning the redistribution and by-elections are explained.
Format for Legislative Assembly Results
For each Legislative Assembly electorate, full details of primary and two-candidate preferred votes and percentages are provided. The format and calculations used in the electorate results are as follows.
First Count: The votes shown for each candidate are the total primary votes received. Percentage votes are calculated as a percentage of the formal vote for each electorate. Change in vote share is calculated by subtracting the percentage vote received by a party at the previous election (adjusted for the redistribution) from the percentage received at the current election. Where the parties contesting the district differ from the previous election, ‘ghost’ candidates (indicated by "....") have been included representing candidates not contesting the current election. All primary swings add to zero, subject to rounding errors.
Final Count: Represents the two-candidate preferred count after the distribution of preferences in an electorate. All votes that did not indicate a preference between the two final candidates are included in the total of votes shown as 'Exhausted'. Two-candidate preferred percentages are calculated by dividing the two-candidate preferred vote for each candidate by the total of votes remaining in the count, that is the formal vote minus the exhausted vote. Two-candidate preferred swings are shown compared to the final two candidates from the previous election, adjusted for the redistribution. Where the party composition of the final two candidates differs from the previous election (e.g. Port Macquarie), ghost candidates appear and more than two swing figures are shown.
Two-Party Preferred: Represents a separate distribution of preferences conducted in the 16 districts that did not finish as a two-party contest between candidates of the Labor Party and the Liberal-National Party Coalition.
Two-Candidate versus Two-Party Preferred results
Two-candidate Preferred Count: To win an electorate, a candidate must receive more than 50% of the vote remaining after the distribution of preferences. The distribution is performed by successively excluding candidates with the lowest primary vote and distributing each candidate’s ballot papers according to the next preferences for a candidates remaining in the count. At the end of the count, the vote for the two final candidates is referred to as the 'two-candidate preferred vote'.
Two-Party Preferred Count: Most Australian elections finish as a contest between candidates representing the Labor Party and the Liberal-National Party Coalition. The final distribution of preferences between Labor and Coalition candidates is referred to as the 'two-party preferred count'.
At the 2015 election, there were 77 electorates where the final contest was a two-party preferred count between Labor and Coalition candidates and 16 that finished with other combinations of candidates. There were six Liberal-Green contests (Davidson, Manly, North Shore, Pittwater, Vaucluse, Willoughby), three Labor-Green contests (Balmain, Newtown, Summer Hill), two National-Green contests (Ballina, Lismore), two National-Independent contests (Murray, Tamworth), two

NSW Election 2015
2
Labor-Independent contests (Lake Macquarie, Wollongong) and one Liberal-Independent contest (Sydney).
Australian Labor Party and Country Labor
Of Labor's candidates, 26 appeared on the ballot paper as Country Labor, up from five in 2011. Country Labor candidates are indicated by the party code CLR. While separate totals for Labor and Country Labor are shown in the state totals, the two parties have been treated as the same party for the rest of the publication.
By-elections.
Seven by-elections were conducted between 2011 and 2015. Four electorates changed party status, the National Party gaining Northern Tablelands following the resignation of Independent Richard Torbay, and Labor gaining Miranda, Charlestown and Newcastle from the Liberal Party. The results of by-elections can be found on page 42.
All calculations of swing in this publication compare 2015 results to adjusted figures for the 2011 election and ignore by-election results. Footnotes have been used to draw attention to the electorates where by-elections took place.
Unregistered parties
Tables in this publication include reference to several parties contesting the 2015 election without being officially registered with the NSW Electoral Commission. These parties are Australia First, Communist League, Country Party, Liberal Democratic Party, Future Party, Socialist Equality Party and the Strata Party. All appeared on the ballot paper as either Independents or with no party affiliation.
Disclaimer
All results are based on details made available by the NSW State Electoral Office. However, responsibility for all calculations, errors and omissions is taken by the author. Note that due to rounding errors, some tables do not add to exactly 100%.
Acknowledgements
I would like to express my thanks to the staff of the NSW Electoral Commission for their assistance in providing election results in electronic format and for other assistance concerning preference counts and Legislative Council results.
Antony Green July 2015

NSW Election 2015
3
STATISTICAL HIGHLIGHTS
A total of 540 candidates contested the 93 Legislative Assembly districts, up from 498 candidates in 2011, but down from 661 candidates in 2003 and the record 732 candidates in 1999. The most significant change in nominations at the 2015 election was the 93 candidates nominated for the new No Land Tax Party, while the number of Independents declined from 91 to 46.
Five parties or groups contested every electorate representing the Liberal/National Coalition, Labor/Country Labor, the Greens, Christian Democrats and No Land Tax. Of the 93 districts, 46 had five candidates, one from each party/group, there were 25 electorate with six candidates, 16 with seven and six electorates with eight candidates.
A record 394 candidates contested the Legislative Council, up from 311 in 2011 and surpassing the previous record of 333 candidates in 2007. There were 25 columns on the ballot paper, the largest number since the current electoral system was first used in 2003. Three groups nominated with fewer than the 15 candidates required for access to a group voting square 'above the line' on the ballot paper. Despite the increase in candidates, the ballot paper was smaller than the 1999 'tablecloth' ballot paper with 264 candidates and 81 columns.
The Coalition vote in the Assembly fell to 45.6%, down 5.5 percentage points on 2011. It was the seventh highest Coalition first preference vote at 22 elections since the formation of the NSW Liberal Party, bettered only in 1950, 1956, 1965, 1976, 1988 and 2011. The 54 seats won by the Coalition has only been bettered proportionally by the 69 seats won at the 2011 election. The Coalition won 59 seats at the 1988 election in a larger 109 seat Assembly. It was only the fifth time in 22 elections the Coalition had won more than 50 seats, the others being 1968 (53), 1973 (52), 1988 (59) and 2011 (69).
The Labor Party polled 34.1%, up 8.5 percentage points from 25.6% in 2011, but still the party's second lowest first preference vote since 1907. While the 34 Assembly seats won was an increase on 20 seats in 2011, it was still the second lowest number of Labor MPs elected since Labor's three defeats under Jack Lang in the 1930s. The Labor vote of 31.1% in the Legislative Council was the second lowest Labor vote since the introduction of popular election in 1978.
The Green vote in the Assembly was unchanged at 10.3%, but its less even geographic spread saw the number Green seats won increase from one to three. In the Legislative Council the Green vote share declined from 11.1% to 9.9% and the party won two seats compared to three in 2011.
No Land Tax contested all 93 Assembly districts, but only reached the 4% required for deposit return and public funding in three electorates, Auburn (4.2%), Fairfield (7.1%) and Wollongong (4.4%). No Land Tax drew the top ballot position in those seats and clearly benefited from the 'donkey vote'.
After the distribution of preferences, the state-wide two-party preferred percentages were Coalition 54.3%, Labor 45.7%%, a swing to Labor of 9.9 percentage points since the landslide 2011 election result.
A uniform swing of 9.9% would have delivered 20 seats to Labor but only 16 fell. Three of the government's most marginal seats were retained with small swings to the government, East Hills (0.2% margin), Monaro (2.0%) and Oatley (3.8%). The Liberal Party retained three other seats under 9%, Coogee (8.3%), Kiama (8.6%) and Seven Hills (8.8%). The three seats beyond the uniform swing that fell to Labor were north of Sydney, The Entrance (11.8%), Gosford (11.9%) and Port Stephens (14.8%). Labor won six of the seven electorates where Liberal candidates stood aside over the ICAC donation inquiries, with only Terrigal (23.6%) retained by the Liberal Party.
Well away from the uniform swing, the Greens gained Ballina (24.6%) and came close to winning Lismore (24.3%), while Northern Tablelands was retained by the National Party after its 2013 by-election victory.

NSW Election 2015
4
The two-party preferred swing was 7.9% in greater Sydney, 13.6% in the Hunter/Illawarra and 12.5% in Regional/Rural areas. The swing against the Coalition government was greatest on the Central Coast (13.1%) in the Hunter Valley (17.1%) where the ICAC donation inquiries were most important, and on the North Coast (19.0%) where the Greens polled well campaigning strongly on coal seam gas issues. Overall eight seats swung to the Coalition and 85 to Labor. (See regional vote summaries, page 38 and 2-party preferred summaries page 31.)
The Labor Party won no seats classified as Country, it won 24 seats in greater Sydney and another 10 seats in the Hunter and Illawarra. The Liberal Party won a majority of the seats in greater Sydney, 30 of the 57 seats.
Sixty-five members of the Legislative Assembly were re-elected at the 2015 election, 32 Liberal, 15 Labor, 15 National, one Green and two Independents. Nineteen members did not contest the 2015 election (eight Labor, eight Liberal and three National), one National member contested the Legislative Council unsuccessfully, while seven Liberals and one ex-Liberal were defeated.
There were 28 new members elected, 19 Labor, five Liberal, two National and two Greens. Two members transferred from the Legislative Council, Luke Foley (Labor) and Melinda Pavey (National), while two members returned after defeat in 2011, Jodi McKay (Strathfield) and David Harris (Wyong).
Fifty eight electorates were decided on first preferences, 30 being won by the Liberal Party, 17 by the Labor Party and 11 by the National Party.
Thirty five electorates were decided after the distribution of preferences and four seats saw the candidate leading on first preferences defeated. Exhausted preferences resulted in 20 seats being won by a candidate without a majority of the formal vote. Labor won 17 seats on preferences, including 10 minority winners, with Labor winning Gosford, Strathfield and The Entrance from second place. These were Labor's first wins from second place since 1995. The Liberal Party won seven seats on preferences (three minority winners), the National Party six (three minority winners) and the Greens three (all minority winners) with Ballina being won from second place. Both Independents were elected on preferences, with Sydney being won on a minority of the formal vote.
Compared to the 2007 Legislative Council, the Legislative Council election saw the Labor Party lose two seats, the Liberal Party gain one and the Animal Justice Party win its first seat.
98.31% of all Legislative Council ballot papers were counted as 'above the line' votes, with only 1.69% 'below the line'. Only 15.34% of formal ballot papers used the 'above the line' preference option introduced at the 2003 election. (See Legislative Council summary page 44.)
As in 2003 and 2007, more than 80% of ballot papers exhausted their preferences during the distribution of Legislative Council preferences. This rate fell to only 59.6% on the exclusion of the final Green candidate, and preferences on this exclusion resulted in the Animal Justice Party passing No Land Tax to win the final seat. Seventeen vacancies were filled on the initial counts with full quotas, the final four vacancies filled by candidates with less than a quota of votes.
The Animal Justice Party polled 1.78% (0.29 quotas) and reached 2.12% (0.47 quotas) after preferences. This was the lowest vote for a successful candidate since the current electoral system was introduced in 2003. It was lower than the 2.05% for the elected Shooters Party in 2003, equal to the unsuccessful Australian Democrats in 2007 (1.78%) and lower than for Pauline Hanson's unsuccessful contests in 2003 (1.92%) and 2011 (2.41%).
With 54 seats, the Coalition would have to lose eight seats on a uniform swing of 6.6% to lose majority government. Four of those seats would be National Party seats. Assuming Greens and Independents retain their seats, Labor would need 13 seats on a uniform swing of 8.7% for majority government, though minority government could be formed on a smaller swing.

NSW Election 2015
5
LEGISLATIVE ASSEMBLY STATE-WIDE TOTALS Roll 5,040,662
Candi- Seats Party dates Won Change Votes % Votes Swing
Liberal Party 74 37 -14 1,545,168 35.08 -3.50 National Party 19 17 -1 464,653 10.55 -2.02 Total Coalition 93 54 -15 2,009,821 45.63 -5.52 Labor Party 67 31 +12 1,141,289 25.91 +1.89 Country Labor 26 3 +2 359,566 8.16 +6.64 Total Labor 93 34 +14 1,500,855 34.07 +8.53 Greens 93 3 +2 453,031 10.29 .. Independent 44 2 -1 169,731 3.85 -4.99 Christian Democratic Party 93 .. .. 142,632 3.24 +0.12 No Land Tax Party 93 .. .. 88,792 2.02 +2.02 Country Party 2 .. .. 11,911 0.27 +0.27 Unaffiliated Candidates 4 .. .. 6,223 0.14 +0.09 Animal Justice Party 5 .. .. 5,164 0.12 +0.12 Australian Cyclists Party 6 .. .. 4,892 0.11 +0.11 Unity 1 .. .. 3,647 0.08 +0.08 Outdoor Recreation Party 2 .. .. 3,096 0.07 -0.04 #Socialist Equality 4 .. .. 1,374 0.03 -0.02 Socialist Alliance 2 .. .. 1,295 0.03 -0.05 #Australia First 3 .. .. 1,092 0.02 +0.01 #Communist League 1 .. .. 490 0.01 +0.01 #Liberal Democratic Party 1 .. .. 288 0.01 +0.01 Others .. .. .. .. .. -0.74
Formal 540 .. .. 4,404,334 96.56 -0.24 Informal 156,900 3.44 +0.24 Total Votes 4,561,234 90.49 -2.06
Note: The change of seats column above is calculated compared to the actual seats won by each party at the
2011 election. If the notional seat holdings following the redistribution were used, the change column would be Liberal (-16), Labor (+16), Greens (+1) and Independents (-1), as shown in the seat change listing below. See page 58 for details of the redistribution. '#' indicates unregistered parties.
Labor gains from Liberal (16) Blue Mountains Newcastle (by-election)
Campbelltown Port Stephens Charlestown (by-election) Prospect Gosford Rockdale Granville Strathfield Londonderry Swansea Macquarie Fields (see notes) The Entrance Maitland Wyong
Green gains from National (1) Ballina
National gain from Independent (1) Northern Tablelands (by-election)
Notes: Northern Tablelands was won by the National Party at a 2013 by-election and retained at the 2015 election. The Labor Party gained Charlestown and Newcastle at by-elections in 2014 and retained both seats at the 2015 election. Labor gained Miranda at a 2013 by-election, but it is not shown as changing party because victorious candidate Barry Collier retired at the 2015 election and the seat was recovered by the Liberal Party.

NSW Election 2015
6
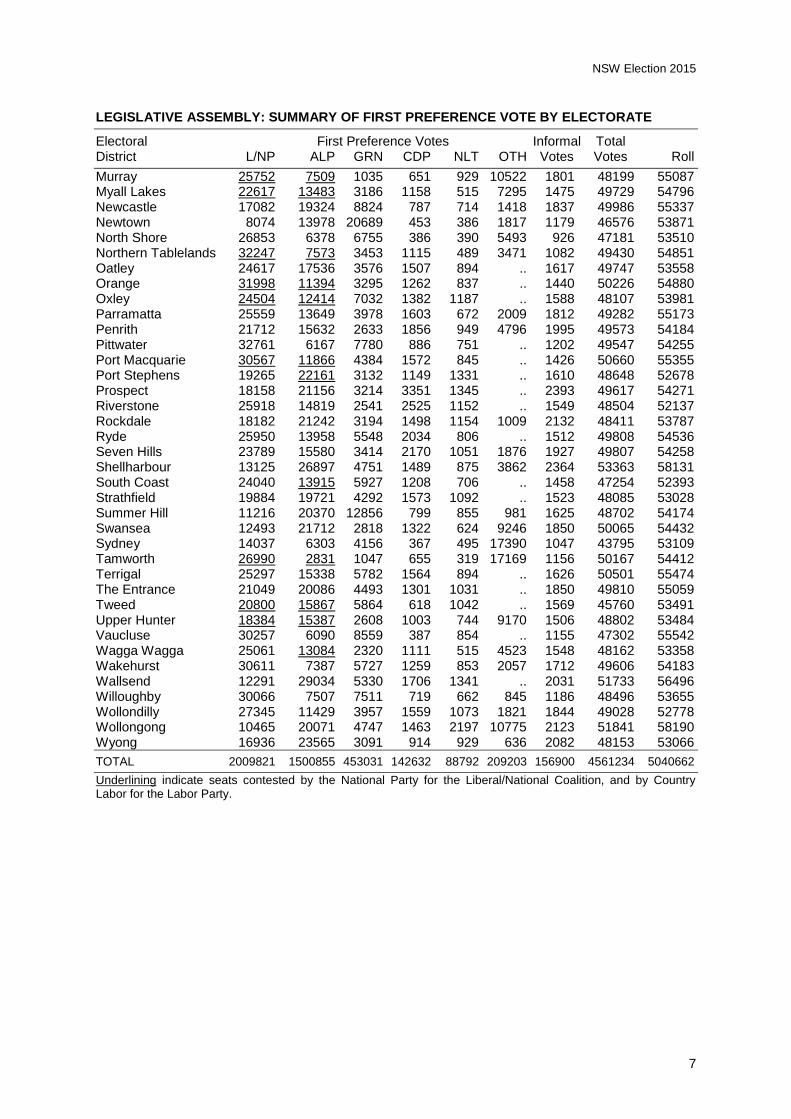
LEGISLATIVE ASSEMBLY: SUMMARY OF FIRST PREFERENCE VOTE BY ELECTORATE
Electoral First Preference Votes Informal Total District L/NP ALP GRN CDP NLT OTH Votes Votes Roll
Albury 26800 14684 2603 1254 1006 .. 1681 48028 54641 Auburn 15471 19504 2658 1836 1857 2457 2560 46343 53262 Ballina 17392 11738 12824 679 291 4534 1141 48599 54958 Balmain 11682 14930 17556 393 527 1864 999 47951 54286 Bankstown 13408 24170 1903 1813 1113 501 2785 45693 52535 Barwon 23426 11454 2942 1192 646 8051 1670 49381 56356 Bathurst 29135 13314 4436 1010 750 .. 1314 49959 54105 Baulkham Hills 31793 10920 3894 1686 973 .. 1390 50656 54002 Bega 25379 15652 4817 683 1138 .. 1427 49096 54510 Blacktown 14250 24916 2937 2750 1411 .. 2262 48526 54495 Blue Mountains 17241 19995 7888 1507 450 1470 1252 49803 53377 Cabramatta 13472 28568 2466 1959 1233 .. 2243 49941 55076 Camden 29545 13105 2551 1440 1513 .. 1800 49954 53653 Campbelltown 17089 22703 2515 1646 1181 .. 2002 47136 52493 Canterbury 12859 23929 4608 4854 1386 .. 2395 50031 55787 Castle Hill 34137 7686 3353 1535 1381 .. 1311 49403 53050 Cessnock 10652 28519 3857 1339 1465 .. 2111 47943 52475 Charlestown 14821 23584 5378 1054 544 3542 2001 50924 54788 Clarence 23799 13431 4308 1143 427 4076 1520 48704 54305 Coffs Harbour 24652 11698 6126 1958 733 .. 1503 46670 52507 Coogee 21564 15073 8609 464 612 .. 1117 47439 54322 Cootamundra 31080 12253 1642 1072 1118 .. 1305 48470 52781 Cronulla 31189 11029 4580 2571 978 .. 1550 51897 55820 Davidson 34234 6222 6615 1067 1014 .. 1118 50270 54364 Drummoyne 28616 11103 5141 706 716 544 1200 48026 52441 Dubbo 28165 10939 2062 1181 1306 2933 1578 48164 52994 East Hills 20975 19958 3141 2310 1078 .. 2124 49586 53843 Epping 26917 9757 7001 1878 664 3317 1250 50784 54553 Fairfield 11079 24670 2406 4500 3281 .. 2637 48573 54512 Gosford 20535 18654 4346 1091 938 2698 1573 49835 55001 Goulburn 23725 16681 3827 1196 692 2552 1373 50046 53960 Granville 17032 18555 2441 5609 732 857 2223 47449 53212 Hawkesbury 26530 10520 3534 1250 935 4096 2063 48928 53064 Heathcote 25554 16724 4729 1518 717 1893 1654 52789 56013 Heffron 13775 20539 9788 873 1392 .. 1558 47925 54971 Holsworthy 23336 17178 2123 1909 1180 1407 2438 49571 54299 Hornsby 29097 9647 6925 1256 542 2379 1164 51010 54625 Keira 13988 26893 7110 1703 911 .. 1500 52105 56897 Kiama 24618 15288 5271 1505 1016 .. 1382 49080 53141 Kogarah 15866 21084 3015 1638 1173 3647 2225 48648 53744 Ku-ring-gai 30294 7927 7650 1375 1192 .. 1185 49623 53498 Lake Macquarie 8007 14625 2363 898 412 21394 1596 49295 54178 Lakemba 9271 25638 3348 5728 757 .. 2624 47366 54496 Lane Cove 27789 9790 7203 1060 754 2029 1317 49942 54485 Lismore 19975 12056 12435 1339 525 717 1067 48114 53585 Liverpool 10728 27264 1947 3627 1753 .. 2565 47884 54443 Londonderry 16523 23359 2229 2332 1503 .. 2607 48553 54564 Macquarie Fields 17247 23978 1787 1484 863 1831 2096 49286 54977 Maitland 11877 20298 3040 912 577 11124 1695 49523 53493 Manly 32160 6098 8103 420 517 .. 1031 48329 53866 Maroubra 16440 24358 4107 672 918 .. 1376 47871 53212 Miranda 27325 14654 3450 2139 777 1109 1705 51159 54856 Monaro 22518 18761 3620 613 691 .. 1237 47440 53048 Mount Druitt 13128 25460 2300 2450 1610 .. 2510 47458 53635 Mulgoa 25709 16909 2024 2193 1425 .. 2132 50392 54148
NSW Election 2015
7
LEGISLATIVE ASSEMBLY: SUMMARY OF FIRST PREFERENCE VOTE BY ELECTORATE
Electoral First Preference Votes Informal Total District L/NP ALP GRN CDP NLT OTH Votes Votes Roll
Murray 25752 7509 1035 651 929 10522 1801 48199 55087 Myall Lakes 22617 13483 3186 1158 515 7295 1475 49729 54796 Newcastle 17082 19324 8824 787 714 1418 1837 49986 55337 Newtown 8074 13978 20689 453 386 1817 1179 46576 53871 North Shore 26853 6378 6755 386 390 5493 926 47181 53510 Northern Tablelands 32247 7573 3453 1115 489 3471 1082 49430 54851 Oatley 24617 17536 3576 1507 894 .. 1617 49747 53558 Orange 31998 11394 3295 1262 837 .. 1440 50226 54880 Oxley 24504 12414 7032 1382 1187 .. 1588 48107 53981 Parramatta 25559 13649 3978 1603 672 2009 1812 49282 55173 Penrith 21712 15632 2633 1856 949 4796 1995 49573 54184 Pittwater 32761 6167 7780 886 751 .. 1202 49547 54255 Port Macquarie 30567 11866 4384 1572 845 .. 1426 50660 55355 Port Stephens 19265 22161 3132 1149 1331 .. 1610 48648 52678 Prospect 18158 21156 3214 3351 1345 .. 2393 49617 54271 Riverstone 25918 14819 2541 2525 1152 .. 1549 48504 52137 Rockdale 18182 21242 3194 1498 1154 1009 2132 48411 53787 Ryde 25950 13958 5548 2034 806 .. 1512 49808 54536 Seven Hills 23789 15580 3414 2170 1051 1876 1927 49807 54258 Shellharbour 13125 26897 4751 1489 875 3862 2364 53363 58131 South Coast 24040 13915 5927 1208 706 .. 1458 47254 52393 Strathfield 19884 19721 4292 1573 1092 .. 1523 48085 53028 Summer Hill 11216 20370 12856 799 855 981 1625 48702 54174 Swansea 12493 21712 2818 1322 624 9246 1850 50065 54432 Sydney 14037 6303 4156 367 495 17390 1047 43795 53109 Tamworth 26990 2831 1047 655 319 17169 1156 50167 54412 Terrigal 25297 15338 5782 1564 894 .. 1626 50501 55474 The Entrance 21049 20086 4493 1301 1031 .. 1850 49810 55059 Tweed 20800 15867 5864 618 1042 .. 1569 45760 53491 Upper Hunter 18384 15387 2608 1003 744 9170 1506 48802 53484 Vaucluse 30257 6090 8559 387 854 .. 1155 47302 55542 Wagga Wagga 25061 13084 2320 1111 515 4523 1548 48162 53358 Wakehurst 30611 7387 5727 1259 853 2057 1712 49606 54183 Wallsend 12291 29034 5330 1706 1341 .. 2031 51733 56496 Willoughby 30066 7507 7511 719 662 845 1186 48496 53655 Wollondilly 27345 11429 3957 1559 1073 1821 1844 49028 52778 Wollongong 10465 20071 4747 1463 2197 10775 2123 51841 58190 Wyong 16936 23565 3091 914 929 636 2082 48153 53066
TOTAL 2009821 1500855 453031 142632 88792 209203 156900 4561234 5040662
Underlining indicate seats contested by the National Party for the Liberal/National Coalition, and by Country Labor for the Labor Party.

NSW Election 2015
8
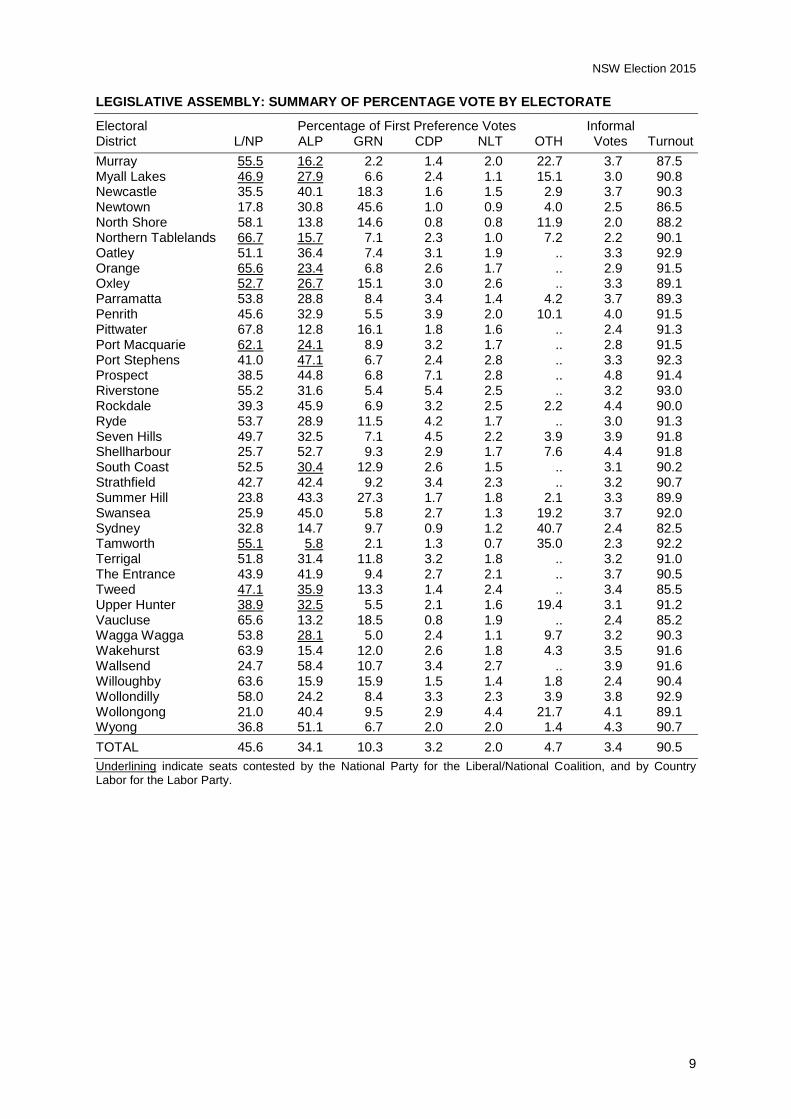
LEGISLATIVE ASSEMBLY: SUMMARY OF PERCENTAGE VOTE BY ELECTORATE
Electoral Percentage of First Preference Votes Informal District L/NP ALP GRN CDP NLT OTH Votes Turnout
Albury 57.8 31.7 5.6 2.7 2.2 .. 3.5 87.9 Auburn 35.3 44.5 6.1 4.2 4.2 5.6 5.5 87.0 Ballina 36.6 24.7 27.0 1.4 0.6 9.6 2.3 88.4 Balmain 24.9 31.8 37.4 0.8 1.1 4.0 2.1 88.3 Bankstown 31.2 56.3 4.4 4.2 2.6 1.2 6.1 87.0 Barwon 49.1 24.0 6.2 2.5 1.4 16.9 3.4 87.6 Bathurst 59.9 27.4 9.1 2.1 1.5 .. 2.6 92.3 Baulkham Hills 64.5 22.2 7.9 3.4 2.0 .. 2.7 93.8 Bega 53.2 32.8 10.1 1.4 2.4 .. 2.9 90.1 Blacktown 30.8 53.9 6.3 5.9 3.0 .. 4.7 89.0 Blue Mountains 35.5 41.2 16.2 3.1 0.9 3.0 2.5 93.3 Cabramatta 28.2 59.9 5.2 4.1 2.6 .. 4.5 90.7 Camden 61.4 27.2 5.3 3.0 3.1 .. 3.6 93.1 Campbelltown 37.9 50.3 5.6 3.6 2.6 .. 4.2 89.8 Canterbury 27.0 50.2 9.7 10.2 2.9 .. 4.8 89.7 Castle Hill 71.0 16.0 7.0 3.2 2.9 .. 2.7 93.1 Cessnock 23.2 62.2 8.4 2.9 3.2 .. 4.4 91.4 Charlestown 30.3 48.2 11.0 2.2 1.1 7.2 3.9 92.9 Clarence 50.4 28.5 9.1 2.4 0.9 8.6 3.1 89.7 Coffs Harbour 54.6 25.9 13.6 4.3 1.6 .. 3.2 88.9 Coogee 46.6 32.5 18.6 1.0 1.3 .. 2.4 87.3 Cootamundra 65.9 26.0 3.5 2.3 2.4 .. 2.7 91.8 Cronulla 61.9 21.9 9.1 5.1 1.9 .. 3.0 93.0 Davidson 69.6 12.7 13.5 2.2 2.1 .. 2.2 92.5 Drummoyne 61.1 23.7 11.0 1.5 1.5 1.2 2.5 91.6 Dubbo 60.5 23.5 4.4 2.5 2.8 6.3 3.3 90.9 East Hills 44.2 42.1 6.6 4.9 2.3 .. 4.3 92.1 Epping 54.3 19.7 14.1 3.8 1.3 6.7 2.5 93.1 Fairfield 24.1 53.7 5.2 9.8 7.1 .. 5.4 89.1 Gosford 42.5 38.7 9.0 2.3 1.9 5.6 3.2 90.6 Goulburn 48.7 34.3 7.9 2.5 1.4 5.2 2.7 92.7 Granville 37.7 41.0 5.4 12.4 1.6 1.9 4.7 89.2 Hawkesbury 56.6 22.4 7.5 2.7 2.0 8.7 4.2 92.2 Heathcote 50.0 32.7 9.2 3.0 1.4 3.7 3.1 94.2 Heffron 29.7 44.3 21.1 1.9 3.0 .. 3.3 87.2 Holsworthy 49.5 36.4 4.5 4.1 2.5 3.0 4.9 91.3 Hornsby 58.4 19.4 13.9 2.5 1.1 4.8 2.3 93.4 Keira 27.6 53.1 14.0 3.4 1.8 .. 2.9 91.6 Kiama 51.6 32.1 11.1 3.2 2.1 .. 2.8 92.4 Kogarah 34.2 45.4 6.5 3.5 2.5 7.9 4.6 90.5 Ku-ring-gai 62.5 16.4 15.8 2.8 2.5 .. 2.4 92.8 Lake Macquarie 16.8 30.7 5.0 1.9 0.9 44.9 3.2 91.0 Lakemba 20.7 57.3 7.5 12.8 1.7 .. 5.5 86.9 Lane Cove 57.1 20.1 14.8 2.2 1.6 4.2 2.6 91.7 Lismore 42.5 25.6 26.4 2.8 1.1 1.5 2.2 89.8 Liverpool 23.7 60.2 4.3 8.0 3.9 .. 5.4 88.0 Londonderry 36.0 50.8 4.9 5.1 3.3 .. 5.4 89.0 Macquarie Fields 36.5 50.8 3.8 3.1 1.8 3.9 4.3 89.6 Maitland 24.8 42.4 6.4 1.9 1.2 23.3 3.4 92.6 Manly 68.0 12.9 17.1 0.9 1.1 .. 2.1 89.7 Maroubra 35.4 52.4 8.8 1.4 2.0 .. 2.9 90.0 Miranda 55.3 29.6 7.0 4.3 1.6 2.2 3.3 93.3 Monaro 48.7 40.6 7.8 1.3 1.5 .. 2.6 89.4 Mount Druitt 29.2 56.6 5.1 5.5 3.6 .. 5.3 88.5 Mulgoa 53.3 35.0 4.2 4.5 3.0 .. 4.2 93.1
NSW Election 2015
9
LEGISLATIVE ASSEMBLY: SUMMARY OF PERCENTAGE VOTE BY ELECTORATE
Electoral Percentage of First Preference Votes Informal District L/NP ALP GRN CDP NLT OTH Votes Turnout
Murray 55.5 16.2 2.2 1.4 2.0 22.7 3.7 87.5 Myall Lakes 46.9 27.9 6.6 2.4 1.1 15.1 3.0 90.8 Newcastle 35.5 40.1 18.3 1.6 1.5 2.9 3.7 90.3 Newtown 17.8 30.8 45.6 1.0 0.9 4.0 2.5 86.5 North Shore 58.1 13.8 14.6 0.8 0.8 11.9 2.0 88.2 Northern Tablelands 66.7 15.7 7.1 2.3 1.0 7.2 2.2 90.1 Oatley 51.1 36.4 7.4 3.1 1.9 .. 3.3 92.9 Orange 65.6 23.4 6.8 2.6 1.7 .. 2.9 91.5 Oxley 52.7 26.7 15.1 3.0 2.6 .. 3.3 89.1 Parramatta 53.8 28.8 8.4 3.4 1.4 4.2 3.7 89.3 Penrith 45.6 32.9 5.5 3.9 2.0 10.1 4.0 91.5 Pittwater 67.8 12.8 16.1 1.8 1.6 .. 2.4 91.3 Port Macquarie 62.1 24.1 8.9 3.2 1.7 .. 2.8 91.5 Port Stephens 41.0 47.1 6.7 2.4 2.8 .. 3.3 92.3 Prospect 38.5 44.8 6.8 7.1 2.8 .. 4.8 91.4 Riverstone 55.2 31.6 5.4 5.4 2.5 .. 3.2 93.0 Rockdale 39.3 45.9 6.9 3.2 2.5 2.2 4.4 90.0 Ryde 53.7 28.9 11.5 4.2 1.7 .. 3.0 91.3 Seven Hills 49.7 32.5 7.1 4.5 2.2 3.9 3.9 91.8 Shellharbour 25.7 52.7 9.3 2.9 1.7 7.6 4.4 91.8 South Coast 52.5 30.4 12.9 2.6 1.5 .. 3.1 90.2 Strathfield 42.7 42.4 9.2 3.4 2.3 .. 3.2 90.7 Summer Hill 23.8 43.3 27.3 1.7 1.8 2.1 3.3 89.9 Swansea 25.9 45.0 5.8 2.7 1.3 19.2 3.7 92.0 Sydney 32.8 14.7 9.7 0.9 1.2 40.7 2.4 82.5 Tamworth 55.1 5.8 2.1 1.3 0.7 35.0 2.3 92.2 Terrigal 51.8 31.4 11.8 3.2 1.8 .. 3.2 91.0 The Entrance 43.9 41.9 9.4 2.7 2.1 .. 3.7 90.5 Tweed 47.1 35.9 13.3 1.4 2.4 .. 3.4 85.5 Upper Hunter 38.9 32.5 5.5 2.1 1.6 19.4 3.1 91.2 Vaucluse 65.6 13.2 18.5 0.8 1.9 .. 2.4 85.2 Wagga Wagga 53.8 28.1 5.0 2.4 1.1 9.7 3.2 90.3 Wakehurst 63.9 15.4 12.0 2.6 1.8 4.3 3.5 91.6 Wallsend 24.7 58.4 10.7 3.4 2.7 .. 3.9 91.6 Willoughby 63.6 15.9 15.9 1.5 1.4 1.8 2.4 90.4 Wollondilly 58.0 24.2 8.4 3.3 2.3 3.9 3.8 92.9 Wollongong 21.0 40.4 9.5 2.9 4.4 21.7 4.1 89.1 Wyong 36.8 51.1 6.7 2.0 2.0 1.4 4.3 90.7
TOTAL 45.6 34.1 10.3 3.2 2.0 4.7 3.4 90.5
Underlining indicate seats contested by the National Party for the Liberal/National Coalition, and by Country Labor for the Labor Party.

NSW Election 2015
10
LEGISLATIVE ASSEMBLY ELECTORATE RESULTS Albury Roll 54641
Candidate Party Votes % Swing
First Count Jackson ALP 14684 31.7 +16.4 Wade CDP 1254 2.7 +0.2 Marra NLT 1006 2.2 +2.2 Aplin * LIB 26800 57.8 -0.9 King GRN 2603 5.6 +0.6 .... NAT 0.0 -3.1 .... OTH 0.0 -15.4
Final Count Jackson ALP 16233 36.8 +13.9 Aplin * LIB 27915 63.2 -13.9 Exhausted 2199 4.7
Formal 46347 96.5 +0.2 Informal 1681 3.5 -0.2 Total / Turnout 48028 87.9
Auburn Roll 53262
Candidate Party Votes % Swing
First Count Ahmed NLT 1857 4.2 +4.2 Oueik LIB 15471 35.3 +1.9 Walker CDP 1836 4.2 -0.5 Michels GRN 2658 6.1 -0.4 Foley ALP 19504 44.5 -1.0 Garrard IND 2457 5.6 +3.8 .... OTH 0.0 -8.0
Final Count Oueik LIB 16816 44.1 +1.2 Foley ALP 21343 55.9 -1.2 Exhausted 5624 12.8
Formal 43783 94.5 -0.8 Informal 2560 5.5 +0.8 Total / Turnout 46343 87.0
Note: Contested by new Labor Leader Luke Foley as
he transferred from the Legislative Council. Labor MP Barbara Perry announced her retirement shortly after Foley announced he would nominate for Labor endorsement in Auburn.
Ballina (GRN gain) Roll 54958
Candidate Party Votes % Swing
First Count Hartley IND 826 1.7 +1.7 Johnson IND 3708 7.8 +7.8 Beavis NAT 17392 36.6 -19.6 Zylber NLT 291 0.6 +0.6 Smith GRN 12824 27.0 +4.5 Stott CDP 679 1.4 -0.5 Spooner CLR 11738 24.7 +12.8 .... OTH 0.0 -7.3
Final Count Beavis NAT 18996 46.9 -20.1 Smith GRN 21528 53.1 +20.1 Exhausted 6934 14.6
2-Party Preferred Beavis NAT 19031 47.0 -27.7 Spooner CLR 21484 53.0 +27.7 Exhausted 6943 14.6
Formal 47458 97.7 -0.3 Informal 1141 2.3 +0.3 Total / Turnout 48599 88.4
Note: National MP Don Page retired.
Balmain Roll 54286
Candidate Party Votes % Swing
First Count
Fogarty ACP 951 2.0 +2.0 Brown NLT 527 1.1 +1.1 Gannon LIB 11682 24.9 -5.8 Avasalu CDP 393 0.8 -0.1 Nielsen AJP 913 1.9 +1.9 Parker * GRN 17556 37.4 +6.3 Firth ALP 14930 31.8 +1.9 .... OTH 0.0 -7.5
Final Count Parker * GRN 20019 54.7 +4.3 Firth ALP 16557 45.3 -4.3 Exhausted 10376 22.1
2-Party Preferred Gannon LIB 13456 34.2 -11.1 Firth ALP 25840 65.8 +11.1 Exhausted 7656 16.3
Formal 46952 97.9 +0.3 Informal 999 2.1 -0.3 Total / Turnout 47951 88.3

NSW Election 2015
11
Bankstown Roll 52535
Candidate Party Votes % Swing
First Count Zakhia LIB 13408 31.2 +0.9 Nasr CDP 1813 4.2 -0.2 Grenfell SEP 501 1.2 -0.3 Lawrance NLT 1113 2.6 +2.6 Poliszcuk GRN 1903 4.4 -0.8 Mihailuk * ALP 24170 56.3 +8.8 .... OTH 0.0 -11.0
Final Count Zakhia LIB 14293 36.0 -3.4 Mihailuk * ALP 25382 64.0 +3.4 Exhausted 3233 7.5
Formal 42908 93.9 +0.4 Informal 2785 6.1 -0.4 Total / Turnout 45693 87.0
Barwon Roll 56356
Candidate Party Votes % Swing
First Count Jones GRN 2942 6.2 +0.3 Ashby CLR 11454 24.0 +2.5 Boehm IND 8051 16.9 +16.9 Lopreiato NLT 646 1.4 +1.4 Humphries * NAT 23426 49.1 -22.9 Hutchinson CDP 1192 2.5 +2.3 .... IND 0.0 -0.5
Final Count Ashby CLR 15065 37.1 +12.9 Humphries * NAT 25524 62.9 -12.9 Exhausted 7122 14.9
Formal 47711 96.6 -1.0 Informal 1670 3.4 +1.0 Total / Turnout 49381 87.6
Bathurst Roll 54105
Candidate Party Votes % Swing
First Count
Rigby CDP 1010 2.1 +2.1 Coleman CLR 13314 27.4 +6.5 Toole * NAT 29135 59.9 -7.4 Carpenter GRN 4436 9.1 +2.9 Cripps NLT 750 1.5 +1.5 .... IND 0.0 -5.6
Final Count Coleman CLR 15704 34.2 +7.9 Toole * NAT 30241 65.8 -7.9 Exhausted 2700 5.6
Formal 48645 97.4 -0.5 Informal 1314 2.6 +0.5 Total / Turnout 49959 92.3
Baulkham Hills Roll 54002
Candidate Party Votes % Swing
First Count Elliott * LIB 31793 64.5 -3.1 Thorpe CDP 1686 3.4 -0.9 Holden NLT 973 2.0 +2.0 Suttie GRN 3894 7.9 -2.0 Tracey ALP 10920 22.2 +5.9 .... OTH 0.0 -1.9
Final Count Elliott * LIB 33021 71.8 -6.6 Tracey ALP 12975 28.2 +6.6 Exhausted 3270 6.6
Formal 49266 97.3 .. Informal 1390 2.7 .. Total / Turnout 50656 93.8
Bega Roll 54510
Candidate Party Votes % Swing
First Count Archard NLT 1138 2.4 +2.4 Perger GRN 4817 10.1 -2.0 Atkinson CLR 15652 32.8 +10.7 Bennett CDP 683 1.4 -0.2 Constance * LIB 25379 53.2 -5.1 .... NAT 0.0 -0.5 .... IND 0.0 -5.3
Final Count Atkinson CLR 18696 41.8 +10.3 Constance * LIB 26023 58.2 -10.3 Exhausted 2950 6.2
Formal 47669 97.1 +0.2 Informal 1427 2.9 -0.2 Total / Turnout 49096 90.1
Blacktown Roll 54495
Candidate Party Votes % Swing
First Count Robertson * ALP 24916 53.9 +9.5 Cacciotti NLT 1411 3.0 +3.0 Bate GRN 2937 6.3 +0.8 Hanna CDP 2750 5.9 +0.2 Bhalla LIB 14250 30.8 -5.3 .... OTH 0.0 -8.3
Final Count Robertson * ALP 26679 63.2 +9.0 Bhalla LIB 15547 36.8 -9.0 Exhausted 4038 8.7
Formal 46264 95.3 -0.2 Informal 2262 4.7 +0.2 Total / Turnout 48526 89.0

NSW Election 2015
12
Blue Mountains (ALP gain) Roll 53377
Candidate Party Votes % Swing
First Count Doyle ALP 19995 41.2 +18.7 Tasire GRN 7888 16.2 -0.7 Harrison IND 1470 3.0 +3.0 Sage * LIB 17241 35.5 -4.1 Piper CDP 1507 3.1 -1.1 Maiorana NLT 450 0.9 +0.9 .... OTH 0.0 -16.8
Final Count Doyle ALP 25866 58.1 +13.5 Sage * LIB 18616 41.9 -13.5 Exhausted 4069 8.4
Formal 48551 97.5 .. Informal 1252 2.5 .. Total / Turnout 49803 93.3
Cabramatta Roll 55076
Candidate Party Votes % Swing
First Count Cashman GRN 2466 5.2 -2.6 Diep LIB 13472 28.2 -13.6 Canto NLT 1233 2.6 +2.6 Modarelli CDP 1959 4.1 -0.3 Lalich * ALP 28568 59.9 +14.5 .... IND 0.0 -0.7
Final Count Diep LIB 14519 32.8 -15.3 Lalich * ALP 29745 67.2 +15.3 Exhausted 3434 7.2
Formal 47698 95.5 .. Informal 2243 4.5 .. Total / Turnout 49941 90.7
Camden Roll 53653
Candidate Party Votes % Swing
First Count Sajn GRN 2551 5.3 -0.2 Broadbridge CDP 1440 3.0 -0.1 Patterson * LIB 29545 61.4 -2.8 Tabone NLT 1513 3.1 +3.1 Cagney ALP 13105 27.2 +4.5 .... OTH 0.0 -4.5
Final Count Patterson * LIB 30693 68.3 -4.5 Cagney ALP 14258 31.7 +4.5 Exhausted 3203 6.7
Formal 48154 96.4 -0.3 Informal 1800 3.6 +0.3 Total / Turnout 49954 93.1
Campbelltown (ALP gain) Roll 52493
Candidate Party Votes % Swing
First Count Warren ALP 22703 50.3 +16.3 Ramsay CDP 1646 3.6 -1.3 Doyle * LIB 17089 37.9 -7.6 Moroney GRN 2515 5.6 -0.8 Stephandellis NLT 1181 2.6 +2.6 .... OTH 0.0 -9.3
Final Count Warren ALP 24228 57.3 +14.1 Doyle * LIB 18035 42.7 -14.1 Exhausted 2871 6.4
Formal 45134 95.8 +0.8 Informal 2002 4.2 -0.8 Total / Turnout 47136 89.8
Canterbury Roll 55787
Candidate Party Votes % Swing
First Count Issa CDP 4854 10.2 +6.0 Maiorana NLT 1386 2.9 +2.9 Burney * ALP 23929 50.2 +1.4 Eisler GRN 4608 9.7 +0.3 Panayiotakis LIB 12859 27.0 -9.9 .... IND 0.0 -0.7
Final Count Burney * ALP 27663 65.7 +8.3 Panayiotakis LIB 14447 34.3 -8.3 Exhausted 5526 11.6
Formal 47636 95.2 -0.1 Informal 2395 4.8 +0.1 Total / Turnout 50031 89.7
Castle Hill Roll 53050
Candidate Party Votes % Swing
First Count Stevis NLT 1381 2.9 +2.9 Williams * LIB 34137 71.0 -3.7 Bellstedt GRN 3353 7.0 -1.1 Sultana CDP 1535 3.2 -0.4 Ritchie ALP 7686 16.0 +4.5 .... OTH 0.0 -2.2
Final Count Williams * LIB 35544 79.4 -5.3 Ritchie ALP 9224 20.6 +5.3 Exhausted 3324 6.9
Formal 48092 97.3 .. Informal 1311 2.7 .. Total / Turnout 49403 93.1
Note: Ray Williams had been MP for Hawkesbury.
Castle Hill MP Dominic Perrottet contested Hawkesbury.

NSW Election 2015
13
Cessnock Roll 52475
Candidate Party Votes % Swing
First Count Price-Purnell NAT 10652 23.2 -1.8 Johnson CDP 1339 2.9 -0.5 Lopreiato NLT 1465 3.2 +3.2 Williams GRN 3857 8.4 -0.2 Barr * CLR 28519 62.2 +28.1 .... IND 0.0 -28.8
Final Count Price-Purnell NAT 11685 28.0 -18.1 Barr * CLR 30057 72.0 +18.1 Exhausted 4090 8.9
Formal 45832 95.6 +0.2 Informal 2111 4.4 -0.2 Total / Turnout 47943 91.4
Charlestown (ALP gain) Roll 54788
Candidate Party Votes % Swing
First Count Oakley GRN 5378 11.0 +1.9 Martin IND 712 1.5 +1.0 Harrison * ALP 23584 48.2 +19.2 Morvillo NLT 544 1.1 +1.1 Tucker CDP 1054 2.2 .. Pauling LIB 14821 30.3 -12.7 Arms IND 2830 5.8 +5.8 .... OTH 0.0 -16.3
Final Count Harrison * ALP 26976 62.9 +22.1 Pauling LIB 15912 37.1 -22.1 Exhausted 6035 12.3
Formal 48923 96.1 -0.6 Informal 2001 3.9 +0.6 Total / Turnout 50924 92.9
Note: Charlestown had been gained by Labor at a
2014 by-election. See by-elections p42.
Clarence Roll 54305
Candidate Party Votes % Swing
First Count Gulaptis * NAT 23799 50.4 -13.0 Ordish CDP 1143 2.4 +0.6 Gilbert CLR 13431 28.5 +18.5 Robinson IND 833 1.8 +1.8 Novak IND 2202 4.7 +4.7 Lopreiato NLT 427 0.9 +0.9 Robins IND 1041 2.2 +2.2 Cavanaugh GRN 4308 9.1 +2.4 ... (Williamson) IND 0.0 -16.6 .... IND 0.0 -1.3
Final Count
Gulaptis * NAT 25082 59.7 -22.2 Gilbert CLR 16947 40.3 +22.2 Exhausted 5155 10.9
Formal 47184 96.9 -1.1 Informal 1520 3.1 +1.1 Total / Turnout 48704 89.7
Note: See by-elections p42.
Coffs Harbour Roll 52507
Candidate Party Votes % Swing
First Count Smith CLR 11698 25.9 +11.7 Guerry NLT 733 1.6 +1.6 Sutherland CDP 1958 4.3 +0.7 Christie GRN 6126 13.6 +3.1 Fraser * NAT 24652 54.6 -11.3 .... OTH 0.0 -5.9
Final Count Smith CLR 14537 35.7 +13.0 Fraser * NAT 26184 64.3 -13.0 Exhausted 4446 9.8
Formal 45167 96.8 -0.7 Informal 1503 3.2 +0.7 Total / Turnout 46670 88.9

NSW Election 2015
14
Coogee Roll 54322
Candidate Party Votes % Swing
First Count Pearce ALP 15073 32.5 +6.8 Gervay-ruben NLT 612 1.3 +1.3 Dinkha CDP 464 1.0 -0.4 Shurey GRN 8609 18.6 -2.8 Notley-Smith * LIB 21564 46.6 -1.1 .... IND 0.0 -3.9
Final Count Pearce ALP 20031 47.1 +5.4 Notley-Smith * LIB 22517 52.9 -5.4 Exhausted 3774 8.1
Formal 46322 97.6 .. Informal 1117 2.4 .. Total / Turnout 47439 87.3
Cootamundra Roll 52781
Candidate Party Votes % Swing
First Count Cacciotti NLT 1118 2.4 +2.4 Therkelsen GRN 1642 3.5 -1.9 Sheahan CLR 12253 26.0 +9.3 Hodgkinson * NAT 31080 65.9 -8.8 Langfield CDP 1072 2.3 -0.9
Final Count
Sheahan CLR 13400 29.6 +9.9 Hodgkinson * NAT 31896 70.4 -9.9 Exhausted 1869 4.0
Formal 47165 97.3 -0.3 Informal 1305 2.7 +0.3 Total / Turnout 48470 91.8
Note: Katrina Hodgkinson was MP for the abolished
seat of Burrinjuck.
Cronulla Roll 55820
Candidate Party Votes % Swing
First Count Speakman * LIB 31189 61.9 -3.1 Scaysbrook ALP 11029 21.9 +2.3 Hunt GRN 4580 9.1 +0.3 Mortimer NLT 978 1.9 +1.9 Capsis CDP 2571 5.1 +1.8 .... IND 0.0 -3.3
Final Count Speakman * LIB 32788 70.9 -3.9 Scaysbrook ALP 13436 29.1 +3.9 Exhausted 4123 8.2
Formal 50347 97.0 -0.4 Informal 1550 3.0 +0.4 Total / Turnout 51897 93.0
Davidson Roll 54364
Candidate Party Votes % Swing
First Count Salama CDP 1067 2.2 +0.1 Bevan NLT 1014 2.1 +2.1 O'Dea * LIB 34234 69.6 -4.2 Sentinella GRN 6615 13.5 +0.7 St Quintin ALP 6222 12.7 +4.3 .... OTH 0.0 -3.0
Final Count O'Dea * LIB 35447 78.8 -4.1 Sentinella GRN 9525 21.2 +4.1 Exhausted 4180 8.5
2-Party Preferred
O'Dea * LIB 35600 79.0 -7.2 St Quintin ALP 9469 21.0 +7.2 Exhausted 4083 8.3
Formal 49152 97.8 -0.1 Informal 1118 2.2 +0.1 Total / Turnout 50270 92.5
Drummoyne Roll 52441
Candidate Party Votes % Swing
First Count Sidoti * LIB 28616 61.1 +4.5 Belgrave ORP 544 1.2 +1.2 Mantel GRN 5141 11.0 +1.2 Khoury ALP 11103 23.7 -1.1 Di Cosmo NLT 716 1.5 +1.5 Zafirian CDP 706 1.5 -0.5 .... IND 0.0 -6.8
Final Count Sidoti * LIB 29668 68.8 +1.7 Khoury ALP 13468 31.2 -1.7 Exhausted 3690 7.9
Formal 46826 97.5 .. Informal 1200 2.5 .. Total / Turnout 48026 91.6

NSW Election 2015
15
Dubbo Roll 52994
Candidate Party Votes % Swing
First Count Shepherd NLT 1306 2.8 +2.8 Grant * NAT 28165 60.5 +0.3 Scherer CDP 1181 2.5 +2.5 Pryor IND 973 2.1 +2.1 Lawrence CLR 10939 23.5 +14.0 Hamilton IND 1960 4.2 +4.2 Parmeter GRN 2062 4.4 +0.8 .... OTH 0.0 -8.5 ... (Fardell) IND 0.0 -18.2
Final Count Grant * NAT 29932 70.4 -10.9 Lawrence CLR 12571 29.6 +10.9 Exhausted 4083 8.8
Formal 46586 96.7 -1.1 Informal 1578 3.3 +1.1 Total / Turnout 48164 90.9
East Hills Roll 53843
Candidate Party Votes % Swing
First Count O'Neill GRN 3141 6.6 +1.7 Murphy ALP 19958 42.1 +1.0 Abdulla CDP 2310 4.9 +0.7 Russell NLT 1078 2.3 +2.3 Brookes * LIB 20975 44.2 +2.9 .... OTH 0.0 -8.6
Final Count
Murphy ALP 21812 49.6 -0.2 Brookes * LIB 22184 50.4 +0.2 Exhausted 3466 7.3
Formal 47462 95.7 -0.2 Informal 2124 4.3 +0.2 Total / Turnout 49586 92.1
Epping Roll 54553
Candidate Party Votes % Swing
First Count Tudehope LIB 26917 54.3 -8.4 Fox IND 3317 6.7 +6.7 Havyatt ALP 9757 19.7 +5.2 Heyde GRN 7001 14.1 +1.9 Allen CDP 1878 3.8 -0.1 Kong NLT 664 1.3 +1.3 .... OTH 0.0 -6.7
Final Count Tudehope LIB 29201 66.2 -11.3 Havyatt ALP 14890 33.8 +11.3 Exhausted 5443 11.0
Formal 49534 97.5 +0.1 Informal 1250 2.5 -0.1 Total / Turnout 50784 93.1
Note: Liberal MP Greg Smith retired.
Fairfield Roll 54512
Candidate Party Votes % Swing
First Count
Lazar NLT 3281 7.1 +7.1 Zangari * ALP 24670 53.7 +10.8 Royal CDP 4500 9.8 +4.6 Saliba LIB 11079 24.1 -14.8 Nicholson GRN 2406 5.2 -1.5 .... OTH 0.0 -6.2
Final Count Zangari * ALP 26667 67.8 +15.5 Saliba LIB 12669 32.2 -15.5 Exhausted 6600 14.4
Formal 45936 94.6 +0.2 Informal 2637 5.4 -0.2 Total / Turnout 48573 89.1
Gosford (ALP gain) Roll 55001
Candidate Party Votes % Swing
First Count
Maroney NLT 938 1.9 +1.9 Holstein * LIB 20535 42.5 -7.6 Church CDP 1091 2.3 -1.2 Smith ALP 18654 38.7 +11.0 Da Costa GRN 4346 9.0 -2.9 Cassar IND 2698 5.6 +1.0 .... OTH 0.0 -2.3
Final Count
Holstein * LIB 21826 49.8 -12.2 Smith ALP 22029 50.2 +12.2 Exhausted 4407 9.1
Formal 48262 96.8 +0.2 Informal 1573 3.2 -0.2 Total / Turnout 49835 90.6

NSW Election 2015
16
Goulburn Roll 53960
Candidate Party Votes % Swing
First Count Ashton ORP 2552 5.2 +5.2 Goward * LIB 23725 48.7 +9.7 Fyfe GRN 3827 7.9 -2.1 Van Der Byl CDP 1196 2.5 -0.5 Fitzpatrick NLT 692 1.4 +1.4 Stephens CLR 16681 34.3 +18.5 .... NAT 0.0 -25.4 .... IND 0.0 -6.8
Final Count Goward * LIB 25138 56.6 -20.2 Stephens CLR 19248 43.4 +20.2 Exhausted 4287 8.8
Formal 48673 97.3 +0.1 Informal 1373 2.7 -0.1 Total / Turnout 50046 92.7
Granville (ALP gain) Roll 53212
Candidate Party Votes % Swing
First Count
Atanasious GRN 2441 5.4 -0.4 Marra NLT 732 1.6 +1.6 Finn ALP 18555 41.0 +4.2 Issa * LIB 17032 37.7 -4.8 Taouk Sleiman CDP 5609 12.4 +7.1 Lopez IND 857 1.9 +1.9 .... OTH 0.0 -9.6
Final Count
Finn ALP 20662 52.1 +5.9 Issa * LIB 18987 47.9 -5.9 Exhausted 5577 12.3
Formal 45226 95.3 -0.3 Informal 2223 4.7 +0.3 Total / Turnout 47449 89.2
Hawkesbury Roll 53064
Candidate Party Votes % Swing
First Count Calvert ALP 10520 22.4 +7.1 Perrottet * LIB 26530 56.6 -9.9 Rollinson AFP 518 1.1 +0.4 Alberts NLT 935 2.0 +2.0 Fraser CDP 1250 2.7 -1.1 Harlander IND 733 1.6 +1.6 Mackaness IND 2845 6.1 +6.1 Wheeler GRN 3534 7.5 -2.8 .... OTH 0.0 -3.3
Final Count Calvert ALP 13246 32.2 +10.6 Perrottet * LIB 27866 67.8 -10.6 Exhausted 5753 12.3
Formal 46865 95.8 -0.8 Informal 2063 4.2 +0.8 Total / Turnout 48928 92.2
Note: Dominic Perrottet had been MP for Castle Hill.
Liberal MP for Hawkesbury Ray Williams contested Castle Hill.
Heathcote Roll 56013
Candidate Party Votes % Swing
First Count
Elawaad NLT 717 1.4 +1.4 Falanga CDP 1518 3.0 -1.3 Petty IND 1893 3.7 -2.4 Stuart ALP 16724 32.7 +11.5 Evans * LIB 25554 50.0 -4.6 Watson GRN 4729 9.2 -1.9 .... OTH 0.0 -2.7
Final Count Stuart ALP 19873 42.4 +11.4 Evans * LIB 26989 57.6 -11.4 Exhausted 4273 8.4
Formal 51135 96.9 -0.1 Informal 1654 3.1 +0.1 Total / Turnout 52789 94.2

NSW Election 2015
17
Heffron Roll 54971
Candidate Party Votes % Swing
First Count Bakss NLT 1392 3.0 +3.0 Hoenig * ALP 20539 44.3 +4.4 Arbeau CDP 873 1.9 .. Koutsoukis LIB 13775 29.7 -5.1 Faruqi GRN 9788 21.1 +3.5 .... OTH 0.0 -5.7
Final Count Hoenig * ALP 26529 64.1 +8.9 Koutsoukis LIB 14860 35.9 -8.9 Exhausted 4978 10.7
Formal 46367 96.7 -0.1 Informal 1558 3.3 +0.1 Total / Turnout 47925 87.2
Note: See by-elections p42.
Holsworthy Roll 54299
Candidate Party Votes % Swing
First Count Gibbons * LIB 23336 49.5 +2.2 Westerberg GRN 2123 4.5 -1.4 Atelj NLT 1180 2.5 +2.5 Kaliyanda ALP 17178 36.4 +6.0 Maka CDP 1909 4.1 -1.5 Byrne - 1407 3.0 +3.0 .... OTH 0.0 -10.8
Final Count Gibbons * LIB 24551 56.7 -4.0 Kaliyanda ALP 18749 43.3 +4.0 Exhausted 3833 8.1
Formal 47133 95.1 -0.4 Informal 2438 4.9 +0.4 Total / Turnout 49571 91.3
Note: Holsworthy largely replaced the abolished seat
of Menai which had been represented since 2011 by Melanie Gibbons.
Hornsby Roll 54625
Candidate Party Votes % Swing
First Count Ackerman ALP 9647 19.4 +8.4 Kean * LIB 29097 58.4 +8.1 Storey GRN 6925 13.9 +1.4 Di Cosmo NLT 542 1.1 +1.1 Gallagher IND 2379 4.8 +1.4 Thew CDP 1256 2.5 -0.8 ... (Berman) IND 0.0 -19.3 .... FFP 0.0 -0.2
Final Count Ackerman ALP 14065 31.1 +7.5 Kean * LIB 31225 68.9 -7.5 Exhausted 4556 9.1
Formal 49846 97.7 +0.2 Informal 1164 2.3 -0.2 Total / Turnout 51010 93.4
Keira Roll 56897
Candidate Party Votes % Swing
First Count
Carolan CDP 1703 3.4 +0.2 Clifford LIB 13988 27.6 -7.6 Leto NLT 911 1.8 +1.8 Park * ALP 26893 53.1 +17.1 Martinez GRN 7110 14.0 -1.6 .... OTH 0.0 -9.8
Final Count Clifford LIB 15298 32.6 -14.5 Park * ALP 31626 67.4 +14.5 Exhausted 3681 7.3
Formal 50605 97.1 +0.2 Informal 1500 2.9 -0.2 Total / Turnout 52105 91.6
Kiama Roll 53141
Candidate Party Votes % Swing
First Count
Pellegrini NLT 1016 2.1 +2.1 Ward * LIB 24618 51.6 +8.0 Kolomeitz CLR 15288 32.1 +4.4 Ryan CDP 1505 3.2 -0.7 Barratt GRN 5271 11.1 +2.2 .... IND 0.0 -15.9
Final Count Ward * LIB 26114 58.7 +0.1 Kolomeitz CLR 18404 41.3 -0.1 Exhausted 3180 6.7
Formal 47698 97.2 -0.5 Informal 1382 2.8 +0.5 Total / Turnout 49080 92.4

NSW Election 2015
18
Kogarah Roll 53744
Candidate Party Votes % Swing
First Count Tang UNI 3647 7.9 +7.9 Heber GRN 3015 6.5 -2.3 Aroney LIB 15866 34.2 -3.9 Susilo CDP 1638 3.5 -2.2 Lin NLT 1173 2.5 +2.5 Minns ALP 21084 45.4 -2.0 .... IND 0.0 ..
Final Count Aroney LIB 17492 43.1 -1.5 Minns ALP 23058 56.9 +1.5 Exhausted 5873 12.7
Formal 46423 95.4 -0.4 Informal 2225 4.6 +0.4 Total / Turnout 48648 90.5
Note: Labor MP Cherie Burton retired.
Ku-ring-gai Roll 53498
Candidate Party Votes % Swing
First Count
Gervay NLT 1192 2.5 +2.5 Archer CDP 1375 2.8 +0.7 Henskens LIB 30294 62.5 -10.3 Armstrong ALP 7927 16.4 +8.5 McInnes GRN 7650 15.8 +1.9 .... OTH 0.0 -3.3
Final Count Henskens LIB 31954 73.0 -8.6 Armstrong ALP 11832 27.0 +27.0 McInnes GRN 0 0.0 -18.4 Exhausted 4652 9.6
2-Party Preferred Henskens LIB 31954 73.0 -13.9 Armstrong ALP 11832 27.0 +13.9 Exhausted 4652 9.6
Formal 48438 97.6 -0.7 Informal 1185 2.4 +0.7 Total / Turnout 49623 92.8
Note: Liberal MP and former Premier Barry O'Farrell
retired.
Lake Macquarie Roll 54178
Candidate Party Votes % Swing
First Count MacFadyen GRN 2363 5.0 -1.7 Piper * IND 20251 42.5 +1.1 Collard LIB 8007 16.8 -10.6 Cleary ALP 14625 30.7 +10.2 Gritten CDP 898 1.9 -0.9 Coroneo NLT 412 0.9 +0.9 Strain AJP 1143 2.4 +2.4 .... OTH 0.0 -1.3
Final Count Piper * IND 24152 60.7 -3.9 Collard LIB 0 0.0 -35.4 Cleary ALP 15646 39.3 +39.3 Exhausted 7901 16.6
2-Party Preferred Collard LIB 11262 36.8 -20.6 Cleary ALP 19309 63.2 +20.6 Exhausted 17128 35.9
Formal 47699 96.8 -0.1 Informal 1596 3.2 +0.1 Total / Turnout 49295 91.0
Lakemba Roll 54496
Candidate Party Votes % Swing
First Count Dib ALP 25638 57.3 +11.1 Garvin GRN 3348 7.5 +1.9 Bhuiyan LIB 9271 20.7 -13.1 El-Dahr CDP 5728 12.8 +8.2 Chehab NLT 757 1.7 +1.7 .... OTH 0.0 -9.8
Final Count Dib ALP 27338 71.6 +14.2 Bhuiyan LIB 10864 28.4 -14.2 Exhausted 6540 14.6
Formal 44742 94.5 +0.3 Informal 2624 5.5 -0.3 Total / Turnout 47366 86.9
Note: Labor MP Robert Furolo retired.

NSW Election 2015
19
Lane Cove Roll 54485
Candidate Party Votes % Swing
First Count Colsell CDP 1060 2.2 -0.5 Sanderson IND 2029 4.2 +4.2 Di Cosmo NLT 754 1.6 +1.6 Masse GRN 7203 14.8 -2.7 Roberts * LIB 27789 57.1 -8.3 Zbik ALP 9790 20.1 +6.1 .... IND 0.0 -0.3
Final Count Masse GRN 0 0.0 -24.3 Roberts * LIB 29451 67.8 -7.9 Zbik ALP 13972 32.2 +32.2 Exhausted 5202 10.7
2-Party Preferred Roberts * LIB 29451 67.8 -9.5 Zbik ALP 13972 32.2 +9.5 Exhausted 5202 10.7
Formal 48625 97.4 .. Informal 1317 2.6 .. Total / Turnout 49942 91.7
Lismore Roll 53585
Candidate Party Votes % Swing
First Count
Guise GRN 12435 26.4 +7.4 Jones NLT 525 1.1 +1.1 George * NAT 19975 42.5 -17.2 Smith CLR 12056 25.6 +12.7 Battista CDP 1339 2.8 +1.1 Imlah AJP 717 1.5 +1.5 .... OTH 0.0 -6.7
Final Count Guise GRN 19309 47.1 +17.3 George * NAT 21654 52.9 -17.3 Exhausted 6084 12.9
2-Party Preferred George * NAT 21247 50.2 -24.1 Smith CLR 21055 49.8 +24.1 Exhausted 4745 10.1
Formal 47047 97.8 -0.2 Informal 1067 2.2 +0.2 Total / Turnout 48114 89.8
Liverpool Roll 54443
Candidate Party Votes % Swing
First Count Attia CDP 3627 8.0 +1.5 Hadid LIB 10728 23.7 -4.2 Pezzano NLT 1753 3.9 +3.9 Lynch * ALP 27264 60.2 +9.2 Bosch GRN 1947 4.3 -0.9 .... OTH 0.0 -9.5
Final Count Hadid LIB 11841 29.1 -6.9 Lynch * ALP 28842 70.9 +6.9 Exhausted 4636 10.2
Formal 45319 94.6 +0.4 Informal 2565 5.4 -0.4 Total / Turnout 47884 88.0
Londonderry (ALP gain) Roll 54564
Candidate Party Votes % Swing
First Count Girotto CDP 2332 5.1 +0.6 Car ALP 23359 50.8 +13.7 Gorman GRN 2229 4.9 -1.6 Bratusa LIB 16523 36.0 -10.8 Arduca NLT 1503 3.3 +3.3 .... OTH 0.0 -5.2
Final Count Car ALP 24889 58.8 +14.2 Bratusa LIB 17420 41.2 -14.2 Exhausted 3637 7.9
Formal 45946 94.6 -0.8 Informal 2607 5.4 +0.8 Total / Turnout 48553 89.0
Note: Sitting MP Bart Bassett was one of the Liberal
MP caught up in the ICAC donation inquiries and did not contest the election.
NSW Election 2015
20
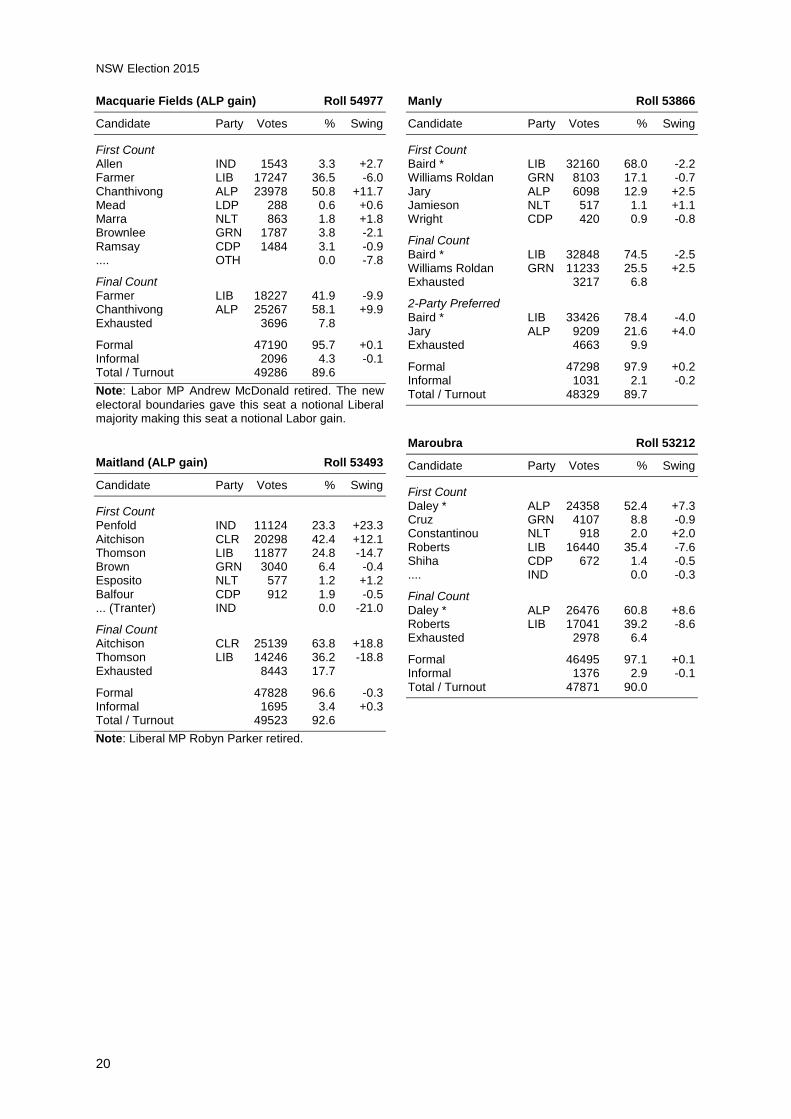
Macquarie Fields (ALP gain) Roll 54977
Candidate Party Votes % Swing
First Count Allen IND 1543 3.3 +2.7 Farmer LIB 17247 36.5 -6.0 Chanthivong ALP 23978 50.8 +11.7 Mead LDP 288 0.6 +0.6 Marra NLT 863 1.8 +1.8 Brownlee GRN 1787 3.8 -2.1 Ramsay CDP 1484 3.1 -0.9 .... OTH 0.0 -7.8
Final Count Farmer LIB 18227 41.9 -9.9 Chanthivong ALP 25267 58.1 +9.9 Exhausted 3696 7.8
Formal 47190 95.7 +0.1 Informal 2096 4.3 -0.1 Total / Turnout 49286 89.6
Note: Labor MP Andrew McDonald retired. The new
electoral boundaries gave this seat a notional Liberal majority making this seat a notional Labor gain.
Maitland (ALP gain) Roll 53493
Candidate Party Votes % Swing
First Count Penfold IND 11124 23.3 +23.3 Aitchison CLR 20298 42.4 +12.1 Thomson LIB 11877 24.8 -14.7 Brown GRN 3040 6.4 -0.4 Esposito NLT 577 1.2 +1.2 Balfour CDP 912 1.9 -0.5 ... (Tranter) IND 0.0 -21.0
Final Count Aitchison CLR 25139 63.8 +18.8 Thomson LIB 14246 36.2 -18.8 Exhausted 8443 17.7
Formal 47828 96.6 -0.3 Informal 1695 3.4 +0.3 Total / Turnout 49523 92.6
Note: Liberal MP Robyn Parker retired.
Manly Roll 53866
Candidate Party Votes % Swing
First Count Baird * LIB 32160 68.0 -2.2 Williams Roldan GRN 8103 17.1 -0.7 Jary ALP 6098 12.9 +2.5 Jamieson NLT 517 1.1 +1.1 Wright CDP 420 0.9 -0.8
Final Count
Baird * LIB 32848 74.5 -2.5 Williams Roldan GRN 11233 25.5 +2.5 Exhausted 3217 6.8
2-Party Preferred Baird * LIB 33426 78.4 -4.0 Jary ALP 9209 21.6 +4.0 Exhausted 4663 9.9
Formal 47298 97.9 +0.2 Informal 1031 2.1 -0.2 Total / Turnout 48329 89.7
Maroubra Roll 53212
Candidate Party Votes % Swing
First Count Daley * ALP 24358 52.4 +7.3 Cruz GRN 4107 8.8 -0.9 Constantinou NLT 918 2.0 +2.0 Roberts LIB 16440 35.4 -7.6 Shiha CDP 672 1.4 -0.5 .... IND 0.0 -0.3
Final Count
Daley * ALP 26476 60.8 +8.6 Roberts LIB 17041 39.2 -8.6 Exhausted 2978 6.4
Formal 46495 97.1 +0.1 Informal 1376 2.9 -0.1 Total / Turnout 47871 90.0
NSW Election 2015
21
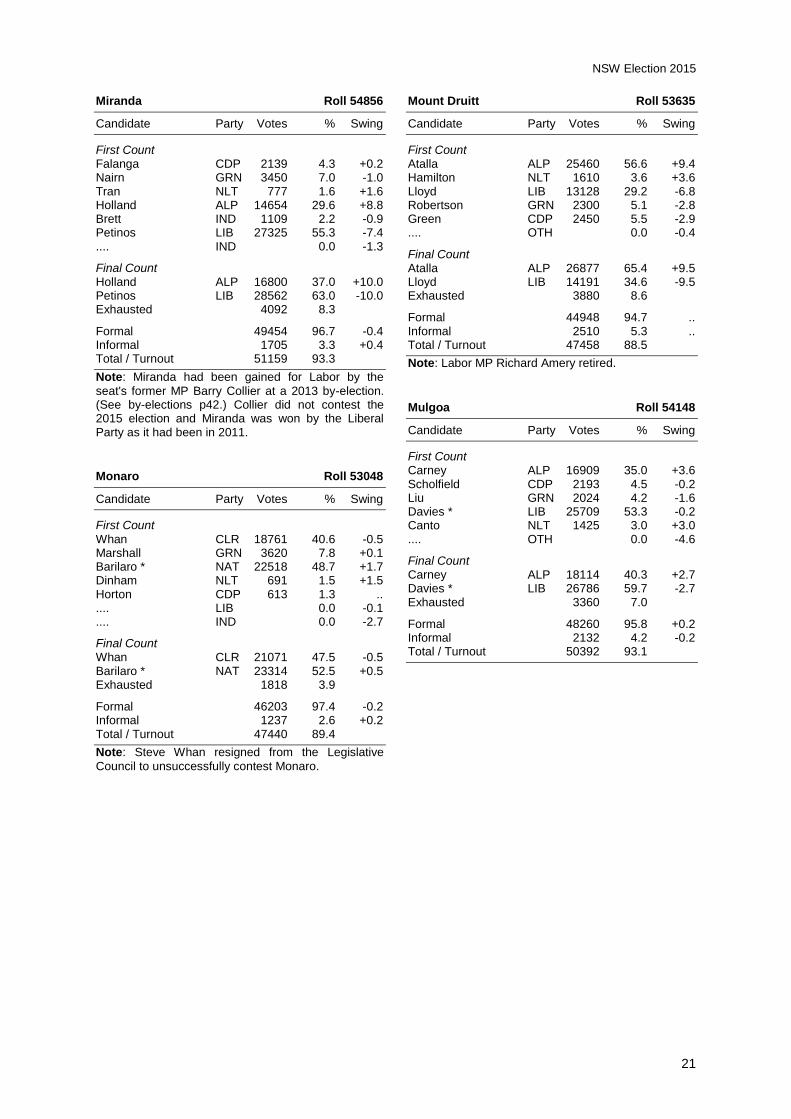
Miranda Roll 54856
Candidate Party Votes % Swing
First Count Falanga CDP 2139 4.3 +0.2 Nairn GRN 3450 7.0 -1.0 Tran NLT 777 1.6 +1.6 Holland ALP 14654 29.6 +8.8 Brett IND 1109 2.2 -0.9 Petinos LIB 27325 55.3 -7.4 .... IND 0.0 -1.3
Final Count Holland ALP 16800 37.0 +10.0 Petinos LIB 28562 63.0 -10.0 Exhausted 4092 8.3
Formal 49454 96.7 -0.4 Informal 1705 3.3 +0.4 Total / Turnout 51159 93.3
Note: Miranda had been gained for Labor by the
seat's former MP Barry Collier at a 2013 by-election. (See by-elections p42.) Collier did not contest the 2015 election and Miranda was won by the Liberal Party as it had been in 2011.
Monaro Roll 53048
Candidate Party Votes % Swing
First Count
Whan CLR 18761 40.6 -0.5 Marshall GRN 3620 7.8 +0.1 Barilaro * NAT 22518 48.7 +1.7 Dinham NLT 691 1.5 +1.5 Horton CDP 613 1.3 .. .... LIB 0.0 -0.1 .... IND 0.0 -2.7
Final Count Whan CLR 21071 47.5 -0.5 Barilaro * NAT 23314 52.5 +0.5 Exhausted 1818 3.9
Formal 46203 97.4 -0.2 Informal 1237 2.6 +0.2 Total / Turnout 47440 89.4
Note: Steve Whan resigned from the Legislative
Council to unsuccessfully contest Monaro.
Mount Druitt Roll 53635
Candidate Party Votes % Swing
First Count Atalla ALP 25460 56.6 +9.4 Hamilton NLT 1610 3.6 +3.6 Lloyd LIB 13128 29.2 -6.8 Robertson GRN 2300 5.1 -2.8 Green CDP 2450 5.5 -2.9 .... OTH 0.0 -0.4
Final Count Atalla ALP 26877 65.4 +9.5 Lloyd LIB 14191 34.6 -9.5 Exhausted 3880 8.6
Formal 44948 94.7 .. Informal 2510 5.3 .. Total / Turnout 47458 88.5
Note: Labor MP Richard Amery retired.
Mulgoa Roll 54148
Candidate Party Votes % Swing
First Count Carney ALP 16909 35.0 +3.6 Scholfield CDP 2193 4.5 -0.2 Liu GRN 2024 4.2 -1.6 Davies * LIB 25709 53.3 -0.2 Canto NLT 1425 3.0 +3.0 .... OTH 0.0 -4.6
Final Count Carney ALP 18114 40.3 +2.7 Davies * LIB 26786 59.7 -2.7 Exhausted 3360 7.0
Formal 48260 95.8 +0.2 Informal 2132 4.2 -0.2 Total / Turnout 50392 93.1

NSW Election 2015
22
Murray Roll 55087
Candidate Party Votes % Swing
First Count Mills IND 1745 3.8 +3.8 Buljubasic CLR 7509 16.2 -1.3 Codemo NLT 929 2.0 +2.0 Glassman GRN 1035 2.2 -1.1 Piccoli * NAT 25752 55.5 -22.3 Dalton CP 8440 18.2 +18.2 Elder CDP 651 1.4 .. Misra IND 337 0.7 +0.7
Final Count Buljubasic CLR 0 0.0 -19.1 Piccoli * NAT 27504 72.7 -8.3 Dalton CP 10353 27.3 +27.3 Exhausted 8541 18.4
2-Party Preferred Buljubasic CLR 9329 24.8 +5.7 Piccoli * NAT 28295 75.2 -5.7 Exhausted 8774 18.9
Formal 46398 96.3 -1.2 Informal 1801 3.7 +1.2 Total / Turnout 48199 87.5
Note: Created from an amalgamation of the abolished
seats of Murray-Darling and Murrumbidgee. Adrian Piccoli had represented Murrumbidgee, while Murray-Darling MP John Williams contested the Legislative Council at an unwinnable position on the Coalition ticket.
Myall Lakes Roll 54796
Candidate Party Votes % Swing
First Count Weatherstone CDP 1158 2.4 +2.4 Ballantine GRN 3186 6.6 -0.4 Attkins IND 7295 15.1 +1.9 Gouskos NLT 515 1.1 +1.1 Keegan CLR 13483 27.9 +15.2 Bromhead * NAT 22617 46.9 -17.7 .... IND 0.0 -2.5
Final Count Keegan CLR 17115 41.3 +19.8 Bromhead * NAT 24370 58.7 -19.8 Exhausted 6769 14.0
Formal 48254 97.0 -0.4 Informal 1475 3.0 +0.4 Total / Turnout 49729 90.8
Newcastle Roll 55337
Candidate Party Votes % Swing
First Count Osborne GRN 8824 18.3 +3.3 Caine CDP 787 1.6 +0.3 Addison NLT 714 1.5 +1.5 Howard LIB 17082 35.5 -1.7 Reich ACP 817 1.7 +1.7 O'Brien SA 601 1.2 -0.2 Crakanthorp * ALP 19324 40.1 +9.1 .... OTH 0.0 -14.0
Final Count Howard LIB 18116 42.6 -9.8 Crakanthorp * ALP 24384 57.4 +9.8 Exhausted 5649 11.7
Formal 48149 96.3 -0.9 Informal 1837 3.7 +0.9 Total / Turnout 49986 90.3
Note: Charlestown had been gained by Labor at a
2014 by-election. See by-elections p42
Newtown Roll 53871
Candidate Party Votes % Swing
First Count Leong GRN 20689 45.6 +10.1 McFarlane ACP 828 1.8 +1.8 Walsh AJP 989 2.2 +2.2 Wheldall LIB 8074 17.8 -3.2 Dinham NLT 386 0.9 +0.9 Schubert CDP 453 1.0 -0.1 Sharpe ALP 13978 30.8 +0.4 .... OTH 0.0 -12.0
Final Count Leong GRN 22605 59.3 +4.8 Sharpe ALP 15532 40.7 -4.8 Exhausted 7260 16.0
2-Party Preferred Wheldall LIB 9461 25.6 -10.4 Sharpe ALP 27526 74.4 +10.4 Exhausted 8410 18.5
Formal 45397 97.5 +0.1 Informal 1179 2.5 -0.1 Total / Turnout 46576 86.5
Note: New notionally Green held seat with no sitting
member. Labor's Penny Sharpe resigned from the Legislative Council to unsuccessfully contest Newtown and was re-appointed to the Council after her defeat.

NSW Election 2015
23
North Shore Roll 53510
Candidate Party Votes % Swing
First Count Vice ACP 838 1.8 +1.8 Chesterfield-Evans GRN 6755 14.6 -5.6 Wheeldon ALP 6378 13.8 +3.0 Ruff IND 4655 10.1 +10.1 Kertesz NLT 390 0.8 +0.8 Skinner * LIB 26853 58.1 -9.3 Rotiroti CDP 386 0.8 -0.9
Final Count Chesterfield-Evans GRN 11579 28.8 +2.1 Skinner * LIB 28613 71.2 -2.1 Exhausted 6063 13.1
2-Party Preferred Wheeldon ALP 11278 28.1 +8.5 Skinner * LIB 28874 71.9 -8.5 Exhausted 6103 13.2
Formal 46255 98.0 .. Informal 926 2.0 .. Total / Turnout 47181 88.2
Northern Tablelands (NAT gain) Roll 54851
Candidate Party Votes % Swing
First Count Beecham CDP 1115 2.3 +0.9 Mailler CP 3471 7.2 +7.2 Gay NLT 489 1.0 +1.0 Marshall * NAT 32247 66.7 +31.1 Goldstein GRN 3453 7.1 +3.7 O'Brien CLR 7573 15.7 +10.7 ... (Torbay) IND 0.0 -54.6
Final Count Marshall * NAT 34077 77.1 -0.6 O'Brien CLR 10137 22.9 +0.6 Exhausted 4134 8.6
Formal 48348 97.8 -0.9 Informal 1082 2.2 +0.9 Total / Turnout 49430 90.1
Note: Independent MP Richard Torbay resigned in
2013 and this seat was won by the National Party at a by-election. See by-election details p42.
Oatley Roll 53558
Candidate Party Votes % Swing
First Count Coure * LIB 24617 51.1 +4.0 Eades NLT 894 1.9 +1.9 Clark GRN 3576 7.4 -1.5 Smith ALP 17536 36.4 -2.6 Lawrence CDP 1507 3.1 -1.6 .... IND 0.0 -0.2
Final Count Coure * LIB 25696 56.6 +2.8 Smith ALP 19684 43.4 -2.8 Exhausted 2750 5.7
Formal 48130 96.7 -0.2 Informal 1617 3.3 +0.2 Total / Turnout 49747 92.9
Orange Roll 54880
Candidate Party Votes % Swing
First Count Fitzsimon CLR 11394 23.4 +11.5 Bicknell GRN 3295 6.8 +2.3 Fernandez NLT 837 1.7 +1.7 Gilbert CDP 1262 2.6 +2.6 Gee * NAT 31998 65.6 +8.4 .... IND 0.0 -22.2 .... OTH 0.0 -4.3
Final Count Fitzsimon CLR 13105 28.3 +5.4 Gee * NAT 33202 71.7 -5.4 Exhausted 2479 5.1
Formal 48786 97.1 -0.6 Informal 1440 2.9 +0.6 Total / Turnout 50226 91.5
Oxley Roll 53981
Candidate Party Votes % Swing
First Count Pavey NAT 24504 52.7 -14.2 Klose CDP 1382 3.0 +1.2 Armitage CLR 12414 26.7 +14.1 Costa NLT 1187 2.6 +2.6 Vernon GRN 7032 15.1 +2.8 .... IND 0.0 -6.4
Final Count Pavey NAT 25636 60.9 -17.9 Armitage CLR 16454 39.1 +17.9 Exhausted 4429 9.5
Formal 46519 96.7 -1.0 Informal 1588 3.3 +1.0 Total / Turnout 48107 89.1
Note: National MP Andrew Stoner retired. Melinda
Pavey transferred from the Legislative Council.

NSW Election 2015
24
Parramatta Roll 55173
Candidate Party Votes % Swing
First Count Kuniansky COM 490 1.0 +0.7 Arduca NLT 672 1.4 +1.4 Lee * LIB 25559 53.8 +5.3 Boutros CDP 1603 3.4 -0.7 Bradley GRN 3978 8.4 -0.3 Shaw ALP 13649 28.8 +1.4 Garrard IND 1519 3.2 +3.2 .... OTH 0.0 -11.1
Final Count Lee * LIB 26932 62.9 +0.3 Shaw ALP 15910 37.1 -0.3 Exhausted 4628 9.7
Formal 47470 96.3 +0.1 Informal 1812 3.7 -0.1 Total / Turnout 49282 89.3
Penrith Roll 54184
Candidate Party Votes % Swing
First Count
Pezzano NLT 949 2.0 +2.0 O'Sullivan GRN 2633 5.5 -3.7 Kelly - 4272 9.0 +9.0 Kennett SEP 202 0.4 +0.4 Spencer CDP 1856 3.9 -1.7 Ayres * LIB 21712 45.6 -8.7 Husar ALP 15632 32.9 +7.0 Waterson AFP 322 0.7 +0.7 .... OTH 0.0 -4.9
Final Count Ayres * LIB 23212 56.2 -9.9 Husar ALP 18061 43.8 +9.9 Exhausted 6305 13.3
Formal 47578 96.0 -0.4 Informal 1995 4.0 +0.4 Total / Turnout 49573 91.5
Pittwater Roll 54255
Candidate Party Votes % Swing
First Count Curcic CDP 886 1.8 -0.4 Arduca NLT 751 1.6 +1.6 Davis GRN 7780 16.1 -0.7 Ash ALP 6167 12.8 +3.8 Stokes * LIB 32761 67.8 -4.2 .... IND 0.0 ..
Final Count Davis GRN 10847 24.3 +2.3 Stokes * LIB 33706 75.7 -2.3 Exhausted 3792 7.8
2-Party Preferred
Ash ALP 9653 22.1 +6.6 Stokes * LIB 34015 77.9 -6.6 Exhausted 4677 9.7
Formal 48345 97.6 -0.1 Informal 1202 2.4 +0.1 Total / Turnout 49547 91.3
Port Macquarie Roll 55355
Candidate Party Votes % Swing
First Count Prinable CDP 1572 3.2 +1.1 Williams * NAT 30567 62.1 +9.7 Grasso NLT 845 1.7 +1.7 Quill CLR 11866 24.1 +18.4 Megget GRN 4384 8.9 +5.2 ... (Besseling) IND 0.0 -36.1
Final Count Williams * NAT 31699 69.0 +12.2 Quill CLR 14272 31.0 +31.0 ... (Besseling) IND 0.0 -43.2 Exhausted 3263 6.6
2-Party Preferred Williams * NAT 31699 69.0 -9.8 Quill CLR 14272 31.0 +9.8 Exhausted 3263 6.6
Formal 49234 97.2 -0.9 Informal 1426 2.8 +0.9 Total / Turnout 50660 91.5
NSW Election 2015
25
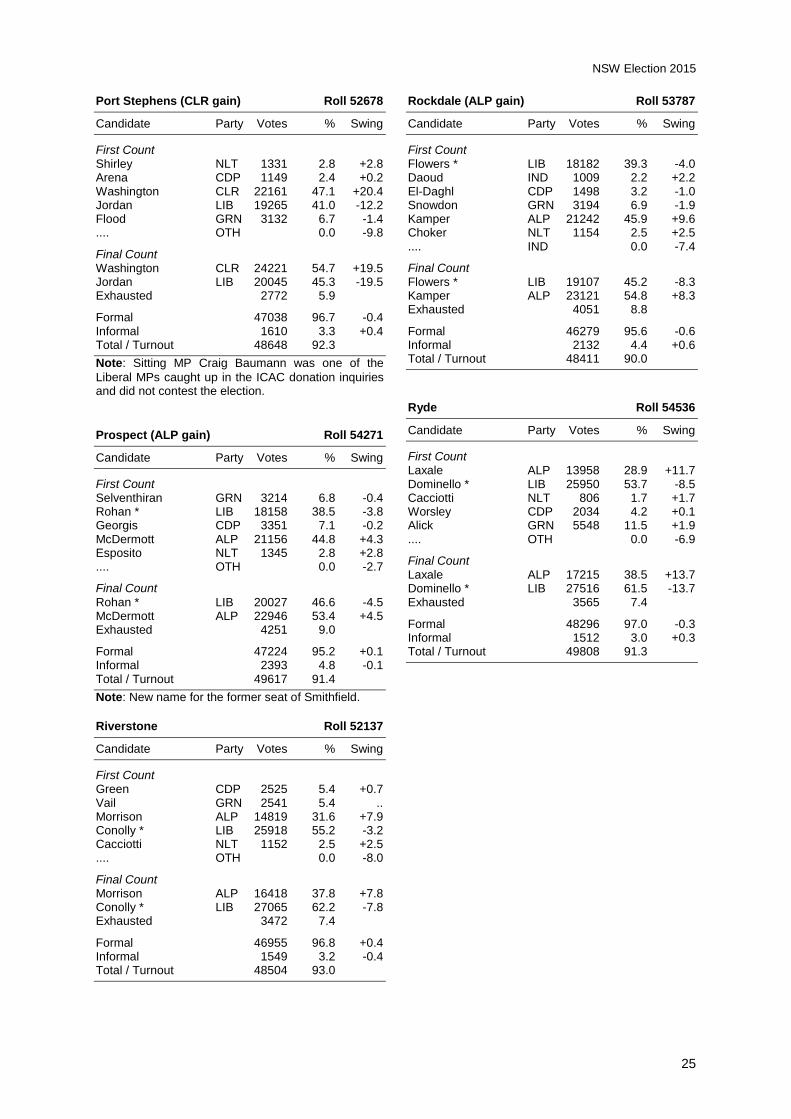
Port Stephens (CLR gain) Roll 52678
Candidate Party Votes % Swing
First Count Shirley NLT 1331 2.8 +2.8 Arena CDP 1149 2.4 +0.2 Washington CLR 22161 47.1 +20.4 Jordan LIB 19265 41.0 -12.2 Flood GRN 3132 6.7 -1.4 .... OTH 0.0 -9.8
Final Count Washington CLR 24221 54.7 +19.5 Jordan LIB 20045 45.3 -19.5 Exhausted 2772 5.9
Formal 47038 96.7 -0.4 Informal 1610 3.3 +0.4 Total / Turnout 48648 92.3
Note: Sitting MP Craig Baumann was one of the
Liberal MPs caught up in the ICAC donation inquiries and did not contest the election.
Prospect (ALP gain) Roll 54271
Candidate Party Votes % Swing
First Count Selventhiran GRN 3214 6.8 -0.4 Rohan * LIB 18158 38.5 -3.8 Georgis CDP 3351 7.1 -0.2 McDermott ALP 21156 44.8 +4.3 Esposito NLT 1345 2.8 +2.8 .... OTH 0.0 -2.7
Final Count
Rohan * LIB 20027 46.6 -4.5 McDermott ALP 22946 53.4 +4.5 Exhausted 4251 9.0
Formal 47224 95.2 +0.1 Informal 2393 4.8 -0.1 Total / Turnout 49617 91.4
Note: New name for the former seat of Smithfield.
Riverstone Roll 52137
Candidate Party Votes % Swing
First Count Green CDP 2525 5.4 +0.7 Vail GRN 2541 5.4 .. Morrison ALP 14819 31.6 +7.9 Conolly * LIB 25918 55.2 -3.2 Cacciotti NLT 1152 2.5 +2.5 .... OTH 0.0 -8.0
Final Count Morrison ALP 16418 37.8 +7.8 Conolly * LIB 27065 62.2 -7.8 Exhausted 3472 7.4
Formal 46955 96.8 +0.4 Informal 1549 3.2 -0.4 Total / Turnout 48504 93.0
Rockdale (ALP gain) Roll 53787
Candidate Party Votes % Swing
First Count Flowers * LIB 18182 39.3 -4.0 Daoud IND 1009 2.2 +2.2 El-Daghl CDP 1498 3.2 -1.0 Snowdon GRN 3194 6.9 -1.9 Kamper ALP 21242 45.9 +9.6 Choker NLT 1154 2.5 +2.5 .... IND 0.0 -7.4
Final Count Flowers * LIB 19107 45.2 -8.3 Kamper ALP 23121 54.8 +8.3 Exhausted 4051 8.8
Formal 46279 95.6 -0.6 Informal 2132 4.4 +0.6 Total / Turnout 48411 90.0
Ryde Roll 54536
Candidate Party Votes % Swing
First Count Laxale ALP 13958 28.9 +11.7 Dominello * LIB 25950 53.7 -8.5 Cacciotti NLT 806 1.7 +1.7 Worsley CDP 2034 4.2 +0.1 Alick GRN 5548 11.5 +1.9 .... OTH 0.0 -6.9
Final Count Laxale ALP 17215 38.5 +13.7 Dominello * LIB 27516 61.5 -13.7 Exhausted 3565 7.4
Formal 48296 97.0 -0.3 Informal 1512 3.0 +0.3 Total / Turnout 49808 91.3
NSW Election 2015
26
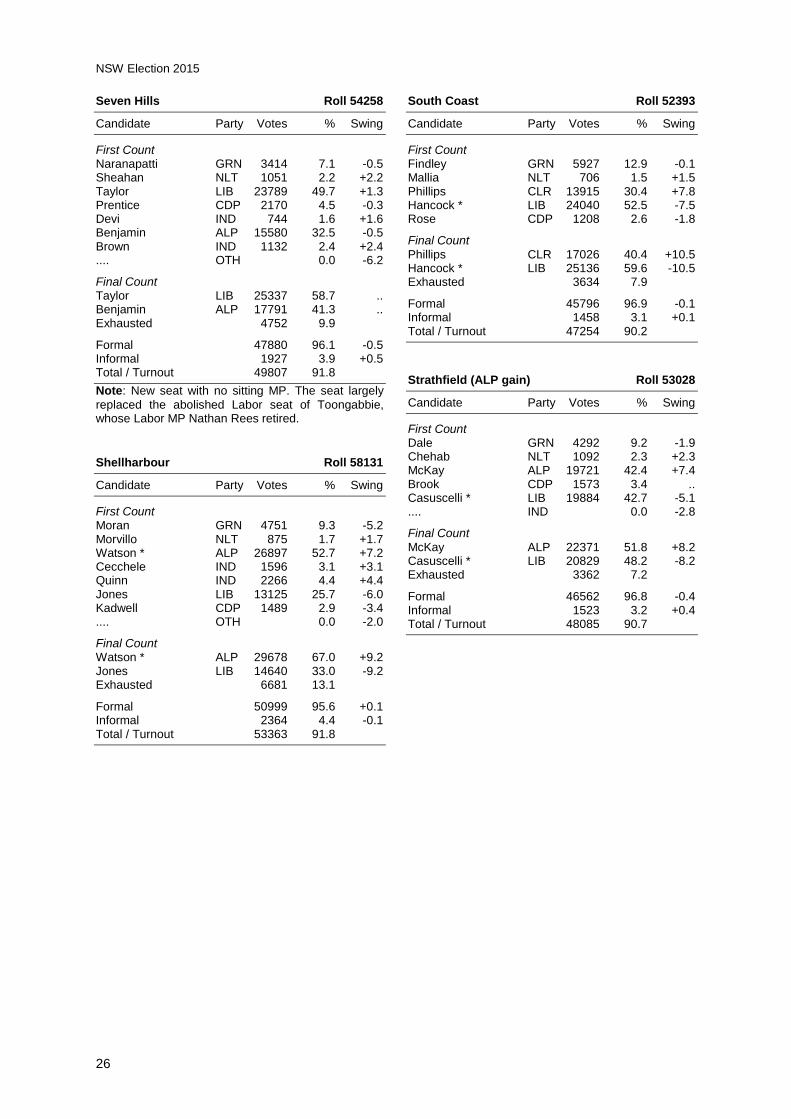
Seven Hills Roll 54258
Candidate Party Votes % Swing
First Count Naranapatti GRN 3414 7.1 -0.5 Sheahan NLT 1051 2.2 +2.2 Taylor LIB 23789 49.7 +1.3 Prentice CDP 2170 4.5 -0.3 Devi IND 744 1.6 +1.6 Benjamin ALP 15580 32.5 -0.5 Brown IND 1132 2.4 +2.4 .... OTH 0.0 -6.2
Final Count Taylor LIB 25337 58.7 .. Benjamin ALP 17791 41.3 .. Exhausted 4752 9.9
Formal 47880 96.1 -0.5 Informal 1927 3.9 +0.5 Total / Turnout 49807 91.8
Note: New seat with no sitting MP. The seat largely
replaced the abolished Labor seat of Toongabbie, whose Labor MP Nathan Rees retired.
Shellharbour Roll 58131
Candidate Party Votes % Swing
First Count Moran GRN 4751 9.3 -5.2 Morvillo NLT 875 1.7 +1.7 Watson * ALP 26897 52.7 +7.2 Cecchele IND 1596 3.1 +3.1 Quinn IND 2266 4.4 +4.4 Jones LIB 13125 25.7 -6.0 Kadwell CDP 1489 2.9 -3.4 .... OTH 0.0 -2.0
Final Count Watson * ALP 29678 67.0 +9.2 Jones LIB 14640 33.0 -9.2 Exhausted 6681 13.1
Formal 50999 95.6 +0.1 Informal 2364 4.4 -0.1 Total / Turnout 53363 91.8
South Coast Roll 52393
Candidate Party Votes % Swing
First Count Findley GRN 5927 12.9 -0.1 Mallia NLT 706 1.5 +1.5 Phillips CLR 13915 30.4 +7.8 Hancock * LIB 24040 52.5 -7.5 Rose CDP 1208 2.6 -1.8
Final Count
Phillips CLR 17026 40.4 +10.5 Hancock * LIB 25136 59.6 -10.5 Exhausted 3634 7.9
Formal 45796 96.9 -0.1 Informal 1458 3.1 +0.1 Total / Turnout 47254 90.2
Strathfield (ALP gain) Roll 53028
Candidate Party Votes % Swing
First Count Dale GRN 4292 9.2 -1.9 Chehab NLT 1092 2.3 +2.3 McKay ALP 19721 42.4 +7.4 Brook CDP 1573 3.4 .. Casuscelli * LIB 19884 42.7 -5.1 .... IND 0.0 -2.8
Final Count
McKay ALP 22371 51.8 +8.2 Casuscelli * LIB 20829 48.2 -8.2 Exhausted 3362 7.2
Formal 46562 96.8 -0.4 Informal 1523 3.2 +0.4 Total / Turnout 48085 90.7

NSW Election 2015
27
Summer Hill Roll 54174
Candidate Party Votes % Swing
First Count Haylen ALP 20370 43.3 +1.5 Tauriello NLT 855 1.8 +1.8 Phillips GRN 12856 27.3 +3.0 Passas LIB 11216 23.8 -4.4 Price SA 694 1.5 +0.8 Cogan SEP 287 0.6 -0.2 French CDP 799 1.7 -0.3 .... OTH 0.0 -2.2
Final Count Haylen ALP 22148 60.5 -2.1 Phillips GRN 14440 39.5 +39.5 Passas LIB 0 0.0 -37.3 Exhausted 10489 22.3
2-Party Preferred Haylen ALP 28608 70.1 +7.5 Passas LIB 12183 29.9 -7.5 Exhausted 6286 13.4
Formal 47077 96.7 .. Informal 1625 3.3 .. Total / Turnout 48702 89.9
Note: New seat largely replacing the abolished seat of
Marrickville, whose Labor MP Carmel Tebbutt retired.
Swansea (ALP gain) Roll 54432
Candidate Party Votes % Swing
First Count Cubis CDP 1322 2.7 +0.3 Uidam LIB 12493 25.9 -11.4 Agland AJP 1402 2.9 +2.9 Osborne IND 1360 2.8 +2.8 Doughty NLT 624 1.3 +1.3 Edwards * IND 6484 13.4 +13.4 Catley ALP 21712 45.0 +8.8 Parsons GRN 2818 5.8 -2.9 .... IND 0.0 -15.3
Final Count
Uidam LIB 14192 37.0 -13.3 Catley ALP 24148 63.0 +13.3 Exhausted 9875 20.5
Formal 48215 96.3 -0.5 Informal 1850 3.7 +0.5 Total / Turnout 50065 92.0
Note: Sitting MP Garry Edwards was one of the
Liberal MPs caught up in the ICAC donation inquiries. He was denied Liberal re-endorsement and contested the election as an Independent.
Sydney Roll 53109
Candidate Party Votes % Swing
First Count Lloyd ALP 6303 14.7 +4.3 Taffa IND 213 0.5 +0.5 Greenwich * IND 16947 39.6 +4.8 Pelzman NLT 495 1.2 +1.2 Pandeleos LIB 14037 32.8 -6.1 Rzetelski - 230 0.5 +0.5 Addae CDP 367 0.9 -0.2 Brentin GRN 4156 9.7 -2.6 .... OTH 0.0 -2.3
Final Count Greenwich * IND 20612 58.1 +7.8 Pandeleos LIB 14885 41.9 -7.8 Exhausted 7251 17.0
2-Party Preferred Lloyd ALP 12401 43.3 +11.3 Pandeleos LIB 16212 56.7 -11.3 Exhausted 14135 33.1
Formal 42748 97.6 -0.3 Informal 1047 2.4 +0.3 Total / Turnout 43795 82.5
Note: Alex Greenwich succeeded Clover Moore at a
2012 by-election. Swing figures for Greenwich are compared to Moore's vote in 2011. See by-elections p42.
Tamworth Roll 54412
Candidate Party Votes % Swing
First Count Draper IND 16855 34.4 -4.2 Schultz GRN 1047 2.1 +0.6 Nock NLT 319 0.7 +0.7 Hillard CLR 2831 5.8 +1.2 Ryan CDP 655 1.3 +1.3 Anderson * NAT 26990 55.1 +0.9 Heuston - 314 0.6 +0.6 .... OTH 0.0 -1.1
Final Count Draper IND 18491 40.0 -3.2 Anderson * NAT 27777 60.0 +3.2 Exhausted 2743 5.6
2-Party Preferred Hillard CLR 8215 21.1 +1.8 Anderson * NAT 30783 78.9 -1.8 Exhausted 10013 20.4
Formal 49011 97.7 -0.8 Informal 1156 2.3 +0.8 Total / Turnout 50167 92.2
Note: Independent Peter Draper was the former MP
for Tamworth defeated at the 2011 election.

NSW Election 2015
28
Terrigal Roll 55474
Candidate Party Votes % Swing
First Count Byrnes CDP 1564 3.2 +0.2 Ruben NLT 894 1.8 +1.8 Crouch LIB 25297 51.8 -8.7 Sundstrom ALP 15338 31.4 +13.2 Williamson GRN 5782 11.8 -1.6 .... IND 0.0 -4.9
Final Count Crouch LIB 26526 59.0 -14.6 Sundstrom ALP 18420 41.0 +14.6 Exhausted 3929 8.0
Formal 48875 96.8 -0.5 Informal 1626 3.2 +0.5 Total / Turnout 50501 91.0
Note: Sitting MP Chris Hartcher was one of the
Liberal MPs caught up in the ICAC donation inquiries and did not contest the election.
The Entrance (ALP gain) Roll 55059
Candidate Party Votes % Swing
First Count Sharpe LIB 21049 43.9 -6.7 Ervin CDP 1301 2.7 -1.7 Rickard GRN 4493 9.4 -1.4 Mehan ALP 20086 41.9 +12.0 Lopreiato NLT 1031 2.1 +2.1 .... OTH 0.0 -4.3
Final Count
Sharpe LIB 22054 49.6 -12.1 Mehan ALP 22392 50.4 +12.1 Exhausted 3514 7.3
Formal 47960 96.3 -0.2 Informal 1850 3.7 +0.2 Total / Turnout 49810 90.5
Note: Sitting MP Chris Spence was one of the Liberal
MPs caught up in the ICAC donation inquiries and did not contest the election.
Tweed Roll 53491
Candidate Party Votes % Swing
First Count Collins NLT 1042 2.4 +2.4 Goodman CLR 15867 35.9 +14.5 Provest * NAT 20800 47.1 -15.0 Sichel CDP 618 1.4 -1.1 Vickers GRN 5864 13.3 -0.8
Final Count
Goodman CLR 18931 46.8 +18.5 Provest * NAT 21508 53.2 -18.5 Exhausted 3752 8.5
Formal 44191 96.6 -0.1 Informal 1569 3.4 +0.1 Total / Turnout 45760 85.5
Upper Hunter Roll 53484
Candidate Party Votes % Swing
First Count Watts IND 9170 19.4 +19.4 Checchin NLT 744 1.6 +1.6 Stretton CDP 1003 2.1 -0.3 Kaye GRN 2608 5.5 -0.1 Rush CLR 15387 32.5 +14.3 Johnsen NAT 18384 38.9 -15.6 .... IND 0.0 -19.3
Final Count Rush CLR 18764 47.8 +20.8 Johnsen NAT 20496 52.2 -20.8 Exhausted 8036 17.0
Formal 47296 96.9 -0.3 Informal 1506 3.1 +0.3 Total / Turnout 48802 91.2
Note: National MP George Souris retired.
Vaucluse Roll 55542
Candidate Party Votes % Swing
First Count McEwin GRN 8559 18.5 +0.3 Nicol ALP 6090 13.2 +2.5 Gervay NLT 854 1.9 +1.9 Thomas CDP 387 0.8 -0.4 Upton * LIB 30257 65.6 -4.2
Final Count McEwin GRN 11551 27.1 +3.2 Upton * LIB 31118 72.9 -3.2 Exhausted 3478 7.5
2-Party Preferred Nicol ALP 10331 24.7 +6.1 Upton * LIB 31493 75.3 -6.1 Exhausted 4323 9.4
Formal 46147 97.6 +0.1 Informal 1155 2.4 -0.1 Total / Turnout 47302 85.2

NSW Election 2015
29
Wagga Wagga Roll 53358
Candidate Party Votes % Swing
First Count Hayes CLR 13084 28.1 +18.0 Sidoti NLT 515 1.1 +1.1 Pech CDP 1111 2.4 .. Funnell IND 4523 9.7 +9.7 Poynter GRN 2320 5.0 +1.6 Maguire * LIB 25061 53.8 +0.2 ... (McGirr) IND 0.0 -30.6
Final Count Hayes CLR 15756 37.1 +37.1 Maguire * LIB 26704 62.9 +2.6 ... (McGirr) IND 0.0 -39.7 Exhausted 4154 8.9
2-Party Preferred Hayes CLR 15756 37.1 +14.9 Maguire * LIB 26704 62.9 -14.9 Exhausted 4154 8.9
Formal 46614 96.8 -1.0 Informal 1548 3.2 +1.0 Total / Turnout 48162 90.3
Wakehurst Roll 54183
Candidate Party Votes % Swing
First Count
Di Cosmo NLT 853 1.8 +1.8 Nero CDP 1259 2.6 -0.2 Hazzard * LIB 30611 63.9 -5.5 Barsi ALP 7387 15.4 +2.4 Harris IND 2057 4.3 +4.3 King GRN 5727 12.0 -2.8
Final Count Hazzard * LIB 32105 75.2 -3.3 Barsi ALP 10565 24.8 +24.8 King GRN 0 0.0 -21.5 Exhausted 5224 10.9
2-Party Preferred Hazzard * LIB 32105 75.2 -5.3 Barsi ALP 10565 24.8 +5.3 Exhausted 5224 10.9
Formal 47894 96.5 -0.3 Informal 1712 3.5 +0.3 Total / Turnout 49606 91.6
Wallsend Roll 56496
Candidate Party Votes % Swing
First Count Cotton CDP 1706 3.4 +1.3 Di Cosmo NLT 1341 2.7 +2.7 Hornery * ALP 29034 58.4 +19.5 Swegen GRN 5330 10.7 +2.2 Eves LIB 12291 24.7 -2.2 .... NAT 0.0 -2.1 .... SA 0.0 -21.4
Final Count Hornery * ALP 32124 70.8 +14.5 Eves LIB 13246 29.2 -14.5 Exhausted 4332 8.7
Formal 49702 96.1 -0.2 Informal 2031 3.9 +0.2 Total / Turnout 51733 91.6
Willoughby Roll 53655
Candidate Party Votes % Swing
First Count Cavanagh ALP 7507 15.9 +3.8 Re ACP 845 1.8 +1.8 Haines GRN 7511 15.9 -0.9 Berejiklian * LIB 30066 63.6 -5.4 Ho CDP 719 1.5 -0.7 Di Cosmo NLT 662 1.4 +1.4
Final Count Haines GRN 10739 25.6 +3.2 Berejiklian * LIB 31234 74.4 -3.2 Exhausted 5337 11.3
2-Party Preferred Cavanagh ALP 11163 26.2 +6.6 Berejiklian * LIB 31481 73.8 -6.6 Exhausted 4666 9.9
Formal 47310 97.6 .. Informal 1186 2.4 .. Total / Turnout 48496 90.4

NSW Election 2015
30
Wollondilly Roll 52778
Candidate Party Votes % Swing
First Count Pinsuti CDP 1559 3.3 -0.2 Rowell * LIB 27345 58.0 +2.1 Darley-Jones GRN 3957 8.4 +1.1 Styles IND 1821 3.9 +3.9 O'Brien ALP 11429 24.2 +5.3 Foia NLT 1073 2.3 +2.3 .... OTH 0.0 -14.4
Final Count Rowell * LIB 28795 67.3 -4.3 O'Brien ALP 13994 32.7 +4.3 Exhausted 4395 9.3
Formal 47184 96.2 -0.2 Informal 1844 3.8 +0.2 Total / Turnout 49028 92.9
Wollongong Roll 58190
Candidate Party Votes % Swing
First Count Colonelli NLT 2197 4.4 +4.4 Walters LIB 10465 21.0 -0.1 Pratt CDP 1463 2.9 +0.4 Rorris IND 10162 20.4 +20.4 Latz ACP 613 1.2 +1.2 Hay * ALP 20071 40.4 +3.6 Bresser GRN 4747 9.5 -0.2 ... (Bradbery) IND 0.0 -26.4 .... OTH 0.0 -3.4
Final Count Rorris IND 15556 41.1 +41.1 Hay * ALP 22293 58.9 +5.4 ... (Bradbery) IND 0.0 -46.5 Exhausted 11869 23.9
2-Party Preferred Walters LIB 14019 36.6 -4.2 Hay * ALP 24326 63.4 +4.2 Exhausted 11373 22.9
Formal 49718 95.9 -0.3 Informal 2123 4.1 +0.3 Total / Turnout 51841 89.1
Wyong (ALP gain) Roll 53066
Candidate Party Votes % Swing
First Count Harris ALP 23565 51.1 +13.2 Dragojevic CDP 914 2.0 -1.2 Holt SEP 384 0.8 +0.8 Dimond GRN 3091 6.7 -3.6 Kerr LIB 16936 36.8 -10.5 Norwick AFP 252 0.5 +0.5 McGeechan NLT 929 2.0 +2.0 .... IND 0.0 -1.4
Final Count Harris ALP 25037 58.7 +13.3 Kerr LIB 17597 41.3 -13.3 Exhausted 3437 7.5
Formal 46071 95.7 -0.5 Informal 2082 4.3 +0.5 Total / Turnout 48153 90.7
Note: Sitting MP Darren Webber was one of the
Liberal MPs caught up in the ICAC donation inquiries and did not contest the election.

NSW Election 2015
31
LEGISLATIVE ASSEMBLY: SUMMARY OF TWO-PARTY RESULTS BY ELECTORATE
Electoral 2PP Votes 2PP Percent District Labor Coalition Labor Coalition Swing
Albury 16233 27915 36.8 63.2 13.9 to Labor Auburn 21343 16816 55.9 44.1 1.2 to Coalition Ballina
1 21484 19031 53.0 47.0 27.7 to Labor
Balmain 1 25840 13456 65.8 34.2 11.1 to Labor
Bankstown 25382 14293 64.0 36.0 3.4 to Labor Barwon 15065 25524 37.1 62.9 12.9 to Labor Bathurst 15704 30241 34.2 65.8 7.9 to Labor Baulkham Hills 12975 33021 28.2 71.8 6.6 to Labor Bega 18696 26023 41.8 58.2 10.3 to Labor Blacktown 26679 15547 63.2 36.8 9.0 to Labor Blue Mountains 25866 18616 58.1 41.9 13.5 to Labor Cabramatta 29745 14519 67.2 32.8 15.3 to Labor Camden 14258 30693 31.7 68.3 4.5 to Labor Campbelltown 24228 18035 57.3 42.7 14.1 to Labor Canterbury 27663 14447 65.7 34.3 8.3 to Labor Castle Hill 9224 35544 20.6 79.4 5.3 to Labor Cessnock 30057 11685 72.0 28.0 18.1 to Labor Charlestown 26976 15912 62.9 37.1 22.1 to Labor Clarence 16947 25082 40.3 59.7 22.2 to Labor Coffs Harbour 14537 26184 35.7 64.3 13.0 to Labor Coogee 20031 22517 47.1 52.9 5.4 to Labor Cootamundra 13400 31896 29.6 70.4 9.9 to Labor Cronulla 13436 32788 29.1 70.9 3.9 to Labor Davidson
1 9469 35600 21.0 79.0 7.2 to Labor
Drummoyne 13468 29668 31.2 68.8 1.7 to Coalition Dubbo 12571 29932 29.6 70.4 10.9 to Labor East Hills 21812 22184 49.6 50.4 0.2 to Coalition Epping 14890 29201 33.8 66.2 11.3 to Labor Fairfield 26667 12669 67.8 32.2 15.5 to Labor Gosford 22029 21826 50.2 49.8 12.2 to Labor Goulburn 19248 25138 43.4 56.6 20.2 to Labor Granville 20662 18987 52.1 47.9 5.9 to Labor Hawkesbury 13246 27866 32.2 67.8 10.6 to Labor Heathcote 19873 26989 42.4 57.6 11.4 to Labor Heffron 26529 14860 64.1 35.9 8.9 to Labor Holsworthy 18749 24551 43.3 56.7 4.0 to Labor Hornsby 14065 31225 31.1 68.9 7.5 to Labor Keira 31626 15298 67.4 32.6 14.5 to Labor Kiama 18404 26114 41.3 58.7 0.1 to Coalition Kogarah 23058 17492 56.9 43.1 1.5 to Labor Ku-ring-gai 11832 31954 27.0 73.0 13.9 to Labor Lake Macquarie
1 19309 11262 63.2 36.8 20.6 to Labor
Lakemba 27338 10864 71.6 28.4 14.2 to Labor Lane Cove 13972 29451 32.2 67.8 9.5 to Labor Lismore
1 21055 21247 49.8 50.2 24.1 to Labor
Liverpool 28842 11841 70.9 29.1 6.9 to Labor Londonderry 24889 17420 58.8 41.2 14.2 to Labor Macquarie Fields 25267 18227 58.1 41.9 9.9 to Labor Maitland 25139 14246 63.8 36.2 18.8 to Labor Manly
1 9209 33426 21.6 78.4 4.0 to Labor
Maroubra 26476 17041 60.8 39.2 8.6 to Labor Miranda 16800 28562 37.0 63.0 10.0 to Labor Monaro 21071 23314 47.5 52.5 0.5 to Coalition Mount Druitt 26877 14191 65.4 34.6 9.5 to Labor Mulgoa 18114 26786 40.3 59.7 2.7 to Labor

NSW Election 2015
32
LEGISLATIVE ASSEMBLY: SUMMARY OF TWO-PARTY RESULTS BY ELECTORATE
Electoral 2PP Votes 2PP Percent District Labor Coalition Labor Coalition Swing
Murray 1 9329 28295 24.8 75.2 5.7 to Labor
Myall Lakes 17115 24370 41.3 58.7 19.8 to Labor Newcastle 24384 18116 57.4 42.6 9.8 to Labor Newtown
1 27526 9461 74.4 25.6 10.4 to Labor
North Shore 1 11278 28874 28.1 71.9 8.5 to Labor
Northern Tablelands 10137 34077 22.9 77.1 0.6 to Labor Oatley 19684 25696 43.4 56.6 2.8 to Coalition Orange 13105 33202 28.3 71.7 5.4 to Labor Oxley 16454 25636 39.1 60.9 17.9 to Labor Parramatta 15910 26932 37.1 62.9 0.3 to Coalition Penrith 18061 23212 43.8 56.2 9.9 to Labor Pittwater
1 9653 34015 22.1 77.9 6.6 to Labor
Port Macquarie 14272 31699 31.0 69.0 9.8 to Labor Port Stephens 24221 20045 54.7 45.3 19.5 to Labor Prospect 22946 20027 53.4 46.6 4.5 to Labor Riverstone 16418 27065 37.8 62.2 7.8 to Labor Rockdale 23121 19107 54.8 45.2 8.3 to Labor Ryde 17215 27516 38.5 61.5 13.7 to Labor Seven Hills 17791 25337 41.3 58.7 (No swing) Shellharbour 29678 14640 67.0 33.0 9.2 to Labor South Coast 17026 25136 40.4 59.6 10.5 to Labor Strathfield 22371 20829 51.8 48.2 8.2 to Labor Summer Hill
1 28608 12183 70.1 29.9 7.5 to Labor
Swansea 24148 14192 63.0 37.0 13.3 to Labor Sydney
1 12401 16212 43.3 56.7 11.3 to Labor
Tamworth 1 8215 30783 21.1 78.9 1.8 to Labor
Terrigal 18420 26526 41.0 59.0 14.6 to Labor The Entrance 22392 22054 50.4 49.6 12.1 to Labor Tweed 18931 21508 46.8 53.2 18.5 to Labor Upper Hunter 18764 20496 47.8 52.2 20.8 to Labor Vaucluse
1 10331 31493 24.7 75.3 6.1 to Labor
Wagga Wagga 15756 26704 37.1 62.9 14.9 to Labor Wakehurst 10565 32105 24.8 75.2 5.3 to Labor Wallsend 32124 13246 70.8 29.2 14.5 to Labor Willoughby
1 11163 31481 26.2 73.8 6.6 to Labor
Wollondilly 13994 28795 32.7 67.3 4.3 to Labor Wollongong
1 24326 14019 63.4 36.6 4.2 to Labor
Wyong 25037 17597 58.7 41.3 13.3 to Labor
Total 1801195 2141898 45.7 54.3 9.9 to Labor 1 – see table on next page for the actual two-candidate preferred results for these electorates.

NSW Election 2015
33
LEGISLATIVE ASSEMBLY: ACTUAL TWO-CANDIDATE PREFERRED RESULTS
Winning Candidate Defeated Candidate Electorate Party Vote % Party Vote %
Ballina GRN 21528 53.1 NAT 18996 46.9 Balmain GRN 20019 54.7 ALP 16557 45.3 Davidson LIB 35447 78.8 GRN 9525 21.2 Lake Macquarie IND 24152 60.7 ALP 15646 39.3 Lismore NAT 21654 52.9 GRN 19309 47.1 Manly LIB 32848 74.5 GRN 11233 25.5 Murray NAT 27504 72.7 CP 10353 27.3 Newtown GRN 22605 59.3 ALP 15532 40.7 North Shore LIB 28613 71.2 GRN 11579 28.8 Pittwater LIB 33706 75.7 GRN 10847 24.3 Summer Hill ALP 22148 60.5 GRN 14440 39.5 Sydney IND 20612 58.1 LIB 14885 41.9 Tamworth NAT 27777 60.0 IND 18491 40.0 Vaucluse LIB 31118 72.9 GRN 11551 27.1 Willoughby LIB 31234 74.4 GRN 10739 25.6 Wollongong ALP 22293 58.9 IND 15556 41.1
Comparing State Wide Two-Candidate Preferred Vote 2011-2015
Votes % including exhausted % excluding exhausted Party 2007 2011 2007 2011 Change 2007 2011 Change
2-Candidate Preferred Liberal 1,706,839 1,584,065 41.1 36.0 -5.1 46.1 40.0 -6.1 National 548,322 490,777 13.2 11.1 -2.1 14.8 12.4 -2.4 Labor 1,074,041 1,634,175 25.9 37.1 +11.2 29.0 41.3 +12.3 Greens 152,251 163,375 3.7 3.7 .. 4.1 4.1 .. Independents 224,725 89,164 5.4 2.0 -3.4 6.1 2.3 -3.8 Exhausted 447,157 442,778 10.8 10.1 -0.7 2-Party Preferred Coalition 2,324,226 2,141,898 56.0 48.6 -7.3 64.2 54.3 -9.9 Labor 1,294,824 1,801,195 31.2 40.9 +9.7 35.8 45.7 +9.9 Exhausted 534,285 461,241 12.9 10.5 -2.4

NSW Election 2015
34
LEGISLATIVE ASSEMBLY: ELECTORATES RANKED BY 2-PARTY PREFERRED MARGINS
Electoral Margin Electorate Margin
Liberal (37) / National (17) Castle Hill 29.4 Davidson (28.8 v GRN) 29.0 Tamworth (NAT 10.0 v IND) 28.9 Manly (24.5 v GRN) 28.4 Pittwater (25.7 v GRN) 27.9 Northern Tablelands (NAT) 27.1 Vaucluse (22.9 v GRN) 25.3 Wakehurst 25.2 Murray (NAT 22.7 v IND) 25.2 Willoughby (24.4 v GRN) 23.8 Ku-ring-gai 23.0 North Shore (21.2 v GRN) 21.9 Baulkham Hills 21.8 Orange (NAT) 21.7 Cronulla 20.9 Dubbo (NAT) 20.4 Cootamundra (NAT) 20.4 Port Macquarie (NAT) 19.0 Hornsby 18.9 Drummoyne 18.8 Camden 18.3 Lane Cove 17.8 Hawkesbury 17.8 Wollondilly 17.3 Epping 16.2 Bathurst (NAT) 15.8 Coffs Harbour (NAT) 14.3 Albury 13.2 Miranda 13.0 Wagga Wagga 12.9 Barwon (NAT) 12.9 Parramatta 12.9 Riverstone 12.2 Ryde 11.5 Oxley (NAT) 10.9 Clarence (NAT) 9.7 Mulgoa 9.7 South Coast 9.6 Terrigal 9.0 Seven Hills 8.7 Myall Lakes (NAT) 8.7 Kiama 8.7 Bega 8.2 Heathcote 7.6 Holsworthy 6.7 Sydney (IND held) 6.7 Goulburn 6.6 Oatley 6.6 Penrith 6.2 Tweed (NAT) 3.2 Ballina (GRN held) 3.0
Coogee 2.9 Monaro (NAT) 2.5 Upper Hunter (NAT) 2.2 East Hills 0.4 Lismore (NAT 2.9 v GRN) 0.2 Labor (34) Newtown (GRN held) 24.4 Cessnock 22.0 Lakemba 21.6 Liverpool 20.9 Wallsend 20.8 Summer Hill (10.5 v GRN) 20.1 Fairfield 17.8 Keira 17.4 Cabramatta 17.2 Shellharbour 17.0 Balmain (GRN held) 15.8 Canterbury 15.7 Mount Druitt 15.4 Heffron 14.1 Bankstown 14.0 Maitland 13.8 Wollongong (8.9 v IND) 13.4 Blacktown 13.2 Lake Macquarie (IND held) 13.2 Swansea 13.0 Charlestown 12.9 Maroubra 10.8 Londonderry 8.8 Wyong 8.7 Blue Mountains 8.1 Macquarie Fields 8.1 Newcastle 7.4 Campbelltown 7.3 Kogarah 6.9 Auburn 5.9 Rockdale 4.8 Port Stephens 4.7 Prospect 3.4 Granville 2.1 Strathfield 1.8 The Entrance 0.4 Gosford 0.2 Greens (3) / Independents (2) Lake Macquarie (IND v ALP) 10.7 Newtown (GRN v ALP) 9.3 Sydney (IND v LIB) 8.1 Balmain (GRN v ALP) 4.7 Ballina (GRN v NAT) 3.1
All 93 electorates are listed in order of descending Labor or Coalition 2-party preferred margin. Independent and Green held seats are shown bottom right with their 2-candidate preferred margins, but also in bold according to 2-party preferred margins. Alternate 2-candidate preferred margins and opposing party in Coalition and Labor-held seats are shown in brackets. Underlining indicates electorates changing party status at the 2011 election.

NSW Election 2015
35
LEGISLATIVE ASSEMBLY: ELECTORATES RANKED BY TWO-PARTY PREFERRED SWING
2-Party 2-Party Electorate Swing Electorate Swing
Swing to Coalition Oatley 2.8 Drummoyne 1.7 Auburn 1.2 Monaro 0.5 Parramatta 0.3 East Hills 0.2 Kiama 0.1 Seven Hills 0.03 Swing to Labor Northern Tablelands 0.6 Kogarah 1.5 Tamworth 1.8 Mulgoa 2.7 Bankstown 3.4 Cronulla 3.9 Manly 4.0 Holsworthy 4.0 Wollongong 4.2 Wollondilly 4.3 Prospect 4.5 Camden 4.5 Castle Hill 5.3 Wakehurst 5.3 Coogee 5.4 Orange 5.4 Murray 5.7 Granville 5.9 Vaucluse 6.1 Baulkham Hills 6.6 Willoughby 6.6 Pittwater 6.6 Liverpool 6.9 Davidson 7.2 Summer Hill 7.5 Hornsby 7.5 Riverstone 7.8 Bathurst 7.9 Strathfield 8.2 Canterbury 8.3 Rockdale 8.3 North Shore 8.5 Maroubra 8.6 Heffron 8.9 Blacktown 9.0 Shellharbour 9.2 Mount Druitt 9.5 Lane Cove 9.5
Newcastle 9.8 Port Macquarie 9.8 Cootamundra 9.9 Penrith 9.9 Macquarie Fields 9.9 Miranda 10.0 Bega 10.3 Newtown 10.4 South Coast 10.5 Hawkesbury 10.6 Dubbo 10.9 Balmain 11.1 Sydney 11.3 Epping 11.3 Heathcote 11.4 The Entrance 12.1 Gosford 12.2 Barwon 12.9 Coffs Harbour 13.0 Swansea 13.3 Wyong 13.3 Blue Mountains 13.5 Ryde 13.7 Albury 13.9 Ku-ring-gai 13.9 Campbelltown 14.1 Londonderry 14.2 Lakemba 14.2 Wallsend 14.5 Keira 14.5 Terrigal 14.6 Wagga Wagga 14.9 Cabramatta 15.3 Fairfield 15.5 Oxley 17.9 Cessnock 18.1 Tweed 18.5 Maitland 18.8 Port Stephens 19.5 Myall Lakes 19.8 Goulburn 20.2 Lake Macquarie 20.6 Upper Hunter 20.8 Charlestown 22.1 Clarence 22.2 Lismore 24.1 Ballina 27.7
Underlining indicates seats that changed party status at the 2015 elections.

NSW Election 2015
36
LEGISLATIVE ASSEMBLY: ELECTORATES RANKED BY 2007 ELECTION MARGIN
2-Party 2-Party Electorate (Margin) Swing Electorate (Margin) Swing
Newtown (GRN held) +10.4 Liverpool (ALP 14.0%) +6.9 Summer Hill (ALP 12.7%) +7.5 Bankstown (ALP 10.6%) +3.4 Wollongong (ALP 9.3%) +4.2 Shellharbour (ALP 7.8%) +9.2 Canterbury (ALP 7.4%) +8.3 Lakemba (ALP 7.3%) +14.2 Auburn (ALP 7.2%) -1.2 Wallsend (ALP 6.3%) +14.5 Mount Druitt (ALP 6.0%) +9.5 Kogarah (ALP 5.4%) +1.5 Heffron (ALP 5.2%) +8.9 Balmain (GRN held) +11.1 Blacktown (ALP 4.1%) +9.0 Cessnock (ALP 3.9%) +18.1 Keira (ALP 2.9%) +14.5 Maroubra (ALP 2.3%) +8.6 Fairfield (ALP 2.2%) +15.5 Cabramatta (ALP 1.9%) +15.3 East Hills (LIB 0.2%) -0.2 Swansea (LIB 0.3%) +13.3 Prospect (LIB 1.1%) +4.5 Macquarie Fields (LIB 1.8%) +9.9 Monaro (NAT 2.0%) -0.5 Newcastle (ALP 2.5% - by-elec) +9.8 Rockdale (LIB 3.5%) +8.3 Granville (LIB 3.8%) +5.9 Oatley (LIB 3.8%) -2.8 Wyong (LIB 4.6%) +13.3 Maitland (LIB 4.9%) +18.8 Londonderry (LIB 5.3%) +14.2 Blue Mountains (LIB 5.4%) +13.5 Strathfield (LIB 6.4%) +8.2 Campbelltown (LIB 6.8%) +14.1 Lake Macquarie (IND held) +20.6 Coogee (LIB 8.3%) +5.4 Kiama (LIB 8.6%) -0.1 Seven Hills (LIB 8.8%) 0.0 Charlestown (ALP 9.2% - by-elec) +22.1 Holsworthy (LIB 10.7%) +4.0 The Entrance (LIB 11.8%) +12.1 Gosford (LIB 11.9%) +12.2 Mulgoa (LIB 12.4%) +2.7 Parramatta (LIB 12.5%) -0.3 Port Stephens (LIB 14.8%) +19.5 Penrith (LIB 16.1%) +9.9
Drummoyne (LIB 17.1%) -1.7 Sydney (IND held) +11.3 Bega (LIB 18.5%) +10.3 Heathcote (LIB 19.0%) +11.4 Riverstone (LIB 20.1%) +7.8 South Coast (LIB 20.1%) +10.5 Wollondilly (LIB 21.6%) +4.3 Tweed (NAT 21.7%) +18.5 Camden (LIB 22.8%) +4.5 Miranda (LIB 23.0%) +10.0 Upper Hunter (NAT 23.0%) +20.8 Terrigal (LIB 23.6%) +14.6 Bathurst (NAT 23.7%) +7.9 Lismore (NAT 24.3%) +24.1 Ballina (NAT 24.6%) +27.7 Cronulla (LIB 24.8%) +3.9 Ryde (LIB 25.2%) +13.7 Barwon (NAT 25.8%) +12.9 Hornsby (LIB 26.5%) +7.5 Goulburn (LIB 26.8%) +20.2 Albury (LIB 27.1%) +13.9 Orange (NAT 27.1%) +5.4 Coffs Harbour (NAT 27.3%) +13.0 Lane Cove (LIB 27.3%) +9.5 Epping (LIB 27.5%) +11.3 Northern Tablelands (NAT 27.6%) +0.6 Wagga Wagga (LIB 27.8%) +14.9 Baulkham Hills (LIB 28.4%) +6.6 Hawkesbury (LIB 28.4%) +10.6 Myall Lakes (NAT 28.6%) +19.8 Oxley (NAT 28.8%) +17.9 Port Macquarie (NAT 28.8%) +9.8 Cootamundra (NAT 30.3%) +9.9 North Shore (LIB 30.4%) +8.5 Willoughby (LIB 30.4%) +6.6 Wakehurst (LIB 30.5%) +5.3 Tamworth (NAT 30.7%) +1.8 Murray (NAT 30.9%) +5.7 Dubbo (NAT 31.3%) +10.9 Vaucluse (LIB 31.4%) +6.1 Clarence (NAT 31.9%) +22.2 Manly (LIB 32.4%) +4.0 Pittwater (LIB 34.5%) +6.6 Castle Hill (LIB 34.7%) +5.3 Davidson (LIB 36.2%) +7.2 Ku-ring-gai (LIB 36.9%) +13.9
All electorates are listed in pre-election 2-party preferred electoral pendulum order from safe Labor to safe Coalition. Independent and Green held seats are indicated as are seats that changed party at by-elections. Results are adjusted for the redistribution. Underlining indicates seats that changed party status at the 2015 election. '+' indicates 2-party preferred swing towards Labor, '-' a swing to the Coalition.

NSW Election 2015
37
LEGISLATIVE ASSEMBLY: TWO-PARTY SWING BY PARTY AND SEAT SAFETY STATUS
Electoral 2PP Votes 2PP Percent District (No. of Seats) Labor Coalition Labor Coalition Swing
Marginal Liberal (11) 258571 206299 55.6 44.4 8.8 to Labor Safe Liberal (8) 165995 181263 47.8 52.2 7.0 to Labor Very Safe Liberal (32) 469019 931749 33.5 66.5 8.9 to Labor Liberal (51) 893585 1319311 40.4 59.6 8.5 to Labor Marginal National (1) 21071 23314 47.5 52.5 0.5 to Coalition Safe National (1) 8215 30783 21.1 78.9 1.8 to Labor Very Safe National (16) 248870 428420 36.7 63.3 14.0 to Labor National (18) 278156 482517 36.6 63.4 12.6 to Labor Marginal Labor (8) 220837 119111 65.0 35.0 11.5 to Labor Safe Labor (9) 239115 130632 64.7 35.3 8.1 to Labor Very Safe Labor (3) 84426 39936 67.9 32.1 12.4 to Labor Labor (20) 544378 289679 65.3 34.7 10.1 to Labor Marginal Greens (2) 53366 22917 70.0 30.0 10.9 to Labor Greens (2) 53366 22917 70.0 30.0 10.9 to Labor Marginal Independent (1) 12401 16212 43.3 56.7 11.3 to Labor Very Safe Independent (1) 19309 11262 63.2 36.8 20.6 to Labor Independent (2) 31710 27474 53.6 46.4 15.7 to Labor
Note Electorates have been classified by party and margin based on the 2011 election adjusted for the 2013 redistribution. All swings calculated based on adjusted 2011 results. All swings are two-party preferred swings, including in Green and Independent held seats. Three seats affected by by-elections have been categorised differently. Northern Tablelands has been classed as a very safe National seat, Charlestown as very safe Labor and Newcastle as safe Labor. While the classification of these seats has been altered, the swing is still based on comparing the 2015 2-party preferred result with the redistribution adjusted value for 2011. Electorates with margins under 6% are classed as Marginal, from 6% to 12% as Safe, while electorates with margins above 12% are classified as Very Safe.
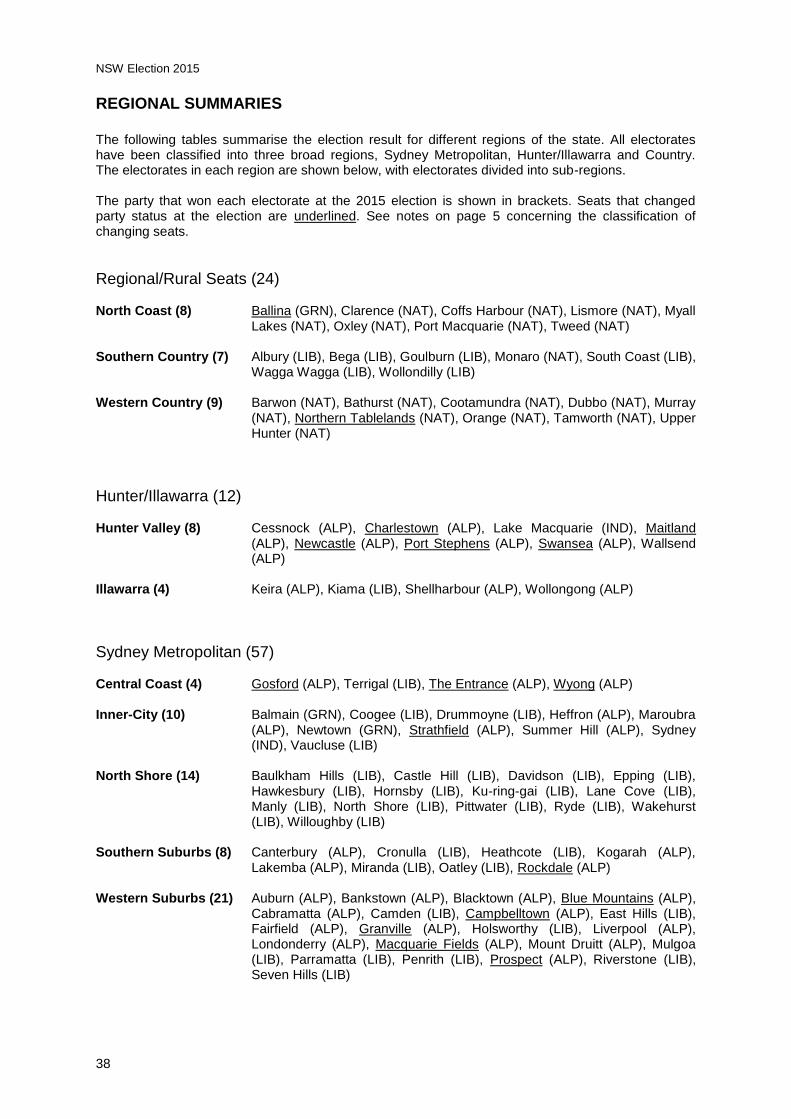
NSW Election 2015
38
REGIONAL SUMMARIES
The following tables summarise the election result for different regions of the state. All electorates have been classified into three broad regions, Sydney Metropolitan, Hunter/Illawarra and Country. The electorates in each region are shown below, with electorates divided into sub-regions. The party that won each electorate at the 2015 election is shown in brackets. Seats that changed party status at the election are underlined. See notes on page 5 concerning the classification of changing seats.
Regional/Rural Seats (24) North Coast (8) Ballina (GRN), Clarence (NAT), Coffs Harbour (NAT), Lismore (NAT), Myall
Lakes (NAT), Oxley (NAT), Port Macquarie (NAT), Tweed (NAT) Southern Country (7) Albury (LIB), Bega (LIB), Goulburn (LIB), Monaro (NAT), South Coast (LIB),
Wagga Wagga (LIB), Wollondilly (LIB) Western Country (9) Barwon (NAT), Bathurst (NAT), Cootamundra (NAT), Dubbo (NAT), Murray
(NAT), Northern Tablelands (NAT), Orange (NAT), Tamworth (NAT), Upper Hunter (NAT)
Hunter/Illawarra (12) Hunter Valley (8) Cessnock (ALP), Charlestown (ALP), Lake Macquarie (IND), Maitland
(ALP), Newcastle (ALP), Port Stephens (ALP), Swansea (ALP), Wallsend (ALP)
Illawarra (4) Keira (ALP), Kiama (LIB), Shellharbour (ALP), Wollongong (ALP)
Sydney Metropolitan (57) Central Coast (4) Gosford (ALP), Terrigal (LIB), The Entrance (ALP), Wyong (ALP) Inner-City (10) Balmain (GRN), Coogee (LIB), Drummoyne (LIB), Heffron (ALP), Maroubra
(ALP), Newtown (GRN), Strathfield (ALP), Summer Hill (ALP), Sydney (IND), Vaucluse (LIB)
North Shore (14) Baulkham Hills (LIB), Castle Hill (LIB), Davidson (LIB), Epping (LIB),
Hawkesbury (LIB), Hornsby (LIB), Ku-ring-gai (LIB), Lane Cove (LIB), Manly (LIB), North Shore (LIB), Pittwater (LIB), Ryde (LIB), Wakehurst (LIB), Willoughby (LIB)
Southern Suburbs (8) Canterbury (ALP), Cronulla (LIB), Heathcote (LIB), Kogarah (ALP),
Lakemba (ALP), Miranda (LIB), Oatley (LIB), Rockdale (ALP) Western Suburbs (21) Auburn (ALP), Bankstown (ALP), Blacktown (ALP), Blue Mountains (ALP),
Cabramatta (ALP), Camden (LIB), Campbelltown (ALP), East Hills (LIB), Fairfield (ALP), Granville (ALP), Holsworthy (LIB), Liverpool (ALP), Londonderry (ALP), Macquarie Fields (ALP), Mount Druitt (ALP), Mulgoa (LIB), Parramatta (LIB), Penrith (LIB), Prospect (ALP), Riverstone (LIB), Seven Hills (LIB)
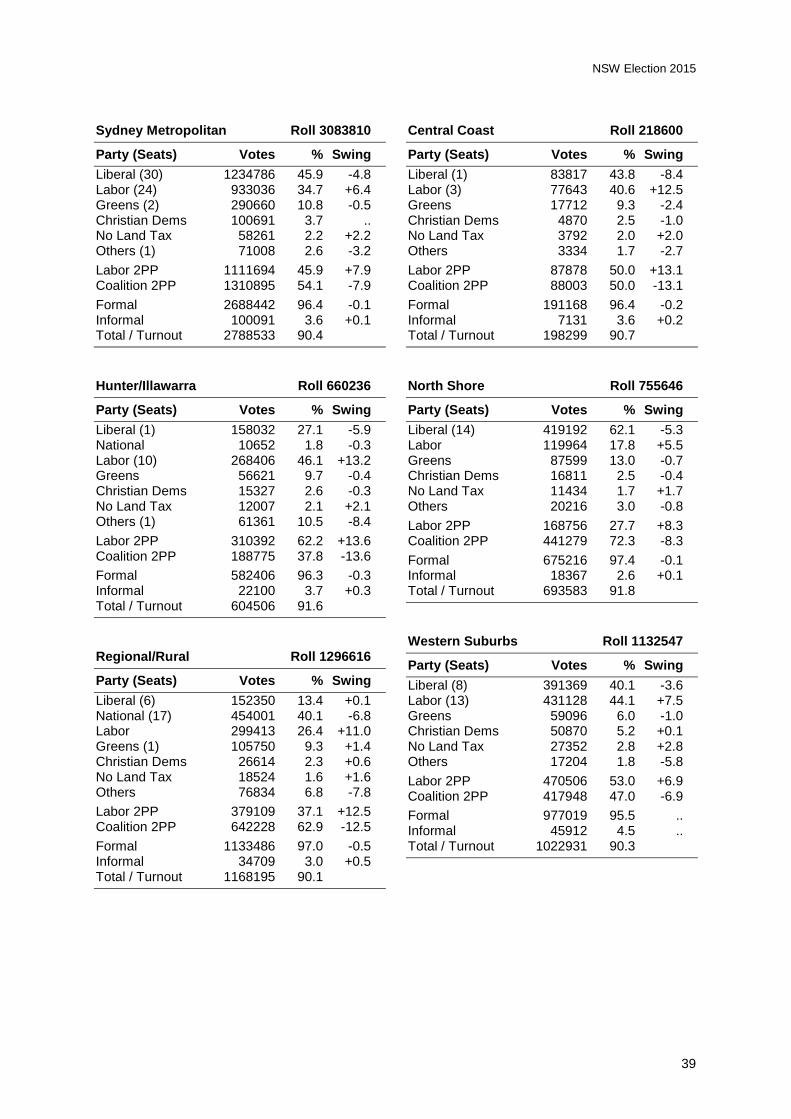
NSW Election 2015
39
Sydney Metropolitan Roll 3083810
Party (Seats) Votes % Swing
Liberal (30) 1234786 45.9 -4.8 Labor (24) 933036 34.7 +6.4 Greens (2) 290660 10.8 -0.5 Christian Dems 100691 3.7 .. No Land Tax 58261 2.2 +2.2 Others (1) 71008 2.6 -3.2
Labor 2PP 1111694 45.9 +7.9 Coalition 2PP 1310895 54.1 -7.9
Formal 2688442 96.4 -0.1 Informal 100091 3.6 +0.1 Total / Turnout 2788533 90.4
Hunter/Illawarra Roll 660236
Party (Seats) Votes % Swing
Liberal (1) 158032 27.1 -5.9 National 10652 1.8 -0.3 Labor (10) 268406 46.1 +13.2 Greens 56621 9.7 -0.4 Christian Dems 15327 2.6 -0.3 No Land Tax 12007 2.1 +2.1 Others (1) 61361 10.5 -8.4
Labor 2PP 310392 62.2 +13.6 Coalition 2PP 188775 37.8 -13.6
Formal 582406 96.3 -0.3 Informal 22100 3.7 +0.3 Total / Turnout 604506 91.6
Regional/Rural Roll 1296616
Party (Seats) Votes % Swing
Liberal (6) 152350 13.4 +0.1 National (17) 454001 40.1 -6.8 Labor 299413 26.4 +11.0 Greens (1) 105750 9.3 +1.4 Christian Dems 26614 2.3 +0.6 No Land Tax 18524 1.6 +1.6 Others 76834 6.8 -7.8
Labor 2PP 379109 37.1 +12.5 Coalition 2PP 642228 62.9 -12.5
Formal 1133486 97.0 -0.5 Informal 34709 3.0 +0.5 Total / Turnout 1168195 90.1
Central Coast Roll 218600
Party (Seats) Votes % Swing
Liberal (1) 83817 43.8 -8.4 Labor (3) 77643 40.6 +12.5 Greens 17712 9.3 -2.4 Christian Dems 4870 2.5 -1.0 No Land Tax 3792 2.0 +2.0 Others 3334 1.7 -2.7
Labor 2PP 87878 50.0 +13.1 Coalition 2PP 88003 50.0 -13.1
Formal 191168 96.4 -0.2 Informal 7131 3.6 +0.2 Total / Turnout 198299 90.7
North Shore Roll 755646
Party (Seats) Votes % Swing
Liberal (14) 419192 62.1 -5.3 Labor 119964 17.8 +5.5 Greens 87599 13.0 -0.7 Christian Dems 16811 2.5 -0.4 No Land Tax 11434 1.7 +1.7 Others 20216 3.0 -0.8
Labor 2PP 168756 27.7 +8.3 Coalition 2PP 441279 72.3 -8.3
Formal 675216 97.4 -0.1 Informal 18367 2.6 +0.1 Total / Turnout 693583 91.8
Western Suburbs Roll 1132547
Party (Seats) Votes % Swing
Liberal (8) 391369 40.1 -3.6 Labor (13) 431128 44.1 +7.5 Greens 59096 6.0 -1.0 Christian Dems 50870 5.2 +0.1 No Land Tax 27352 2.8 +2.8 Others 17204 1.8 -5.8
Labor 2PP 470506 53.0 +6.9 Coalition 2PP 417948 47.0 -6.9
Formal 977019 95.5 .. Informal 45912 4.5 .. Total / Turnout 1022931 90.3

NSW Election 2015
40
Inner City Roll 538956
Party (Seats) Votes % Swing
Liberal (3) 175545 38.1 -4.0 Labor (4) 152465 33.1 +3.4 Greens (2) 95753 20.8 +1.7 Christian Dems 6687 1.5 -0.3 No Land Tax 7847 1.7 +1.7 Others (1) 22596 4.9 -2.6
Labor 2PP 213581 53.2 +7.6 Coalition 2PP 187720 46.8 -7.6
Formal 460893 97.3 .. Informal 12779 2.7 .. Total / Turnout 473672 87.9
Southern Suburbs Roll 438061
Party (Seats) Votes % Swing
Liberal (4) 164863 42.9 -5.3 Labor (4) 151836 39.5 +5.1 Greens 30500 7.9 -0.8 Christian Dems 21453 5.6 +1.2 No Land Tax 7836 2.0 +2.0 Others 7658 2.0 -2.3
Labor 2PP 170973 49.3 +6.6 Coalition 2PP 175945 50.7 -6.6
Formal 384146 96.0 -0.3 Informal 15902 4.0 +0.3 Total / Turnout 400048 91.3
Hunter Roll 433877
Party (Seats) Votes % Swing
Liberal 95836 25.0 -8.2 National 10652 2.8 -0.4 Labor (7) 179257 46.8 +15.9 Greens 34742 9.1 +0.1 Christian Dems 9167 2.4 .. No Land Tax 7008 1.8 +1.8 Others (1) 46724 12.2 -9.2
Labor 2PP 206358 63.5 +17.1 Coalition 2PP 118704 36.5 -17.1
Formal 383386 96.3 -0.4 Informal 14731 3.7 +0.4 Total / Turnout 398117 91.8
Illawarra Roll 226359
Party (Seats) Votes % Swing
Liberal (1) 62196 31.3 -1.5 Labor (3) 89149 44.8 +8.2 Greens 21879 11.0 -1.3 Christian Dems 6160 3.1 -0.9 No Land Tax 4999 2.5 +2.5 Others 14637 7.4 -7.0
Labor 2PP 104034 59.8 +6.9 Coalition 2PP 70071 40.2 -6.9
Formal 199020 96.4 -0.1 Informal 7369 3.6 +0.1 Total / Turnout 206389 91.2
North Coast Roll 432978
Party (Seats) Votes % Swing
National (7) 184306 49.1 -12.2 Labor 102553 27.3 +14.8 Greens (1) 56159 15.0 +3.1 Christian Dems 9849 2.6 +0.7 No Land Tax 5565 1.5 +1.5 Others 16622 4.4 -7.9
Labor 2PP 140795 42.0 +19.0 Coalition 2PP 194757 58.0 -19.0
Formal 375054 97.1 -0.6 Informal 11289 2.9 +0.6 Total / Turnout 386343 89.2
Southern Rural Roll 374688
Party (Seats) Votes % Swing
Liberal (6) 152350 46.4 -0.1 National (1) 22518 6.9 -4.0 Labor 104206 31.7 +11.0 Greens 27071 8.2 -0.1 Christian Dems 7624 2.3 -0.4 No Land Tax 5821 1.8 +1.8 Others 8896 2.7 -8.2
Labor 2PP 122024 40.0 +10.4 Coalition 2PP 183025 60.0 -10.4
Formal 328486 96.9 -0.2 Informal 10568 3.1 +0.2 Total / Turnout 339054 90.5

NSW Election 2015
41
Western Rural Roll 488950
Party (Seats) Votes % Swing
National (9) 247177 57.5 -3.9 Labor 92654 21.6 +7.6 Greens 22520 5.2 +0.9 Christian Dems 9141 2.1 +1.2 No Land Tax 7138 1.7 +1.7 Others 51316 11.9 -7.5
Labor 2PP 116290 30.5 +8.4 Coalition 2PP 264446 69.5 -8.4
Formal 429946 97.1 -0.7 Informal 12852 2.9 +0.7 Total / Turnout 442798 90.6

NSW Election 2015
42
Legislative Assembly By-elections 2011-2015 Clarence Roll 52272 (19 Nov 2011 – Resignation of Steve Cansdell)
Candidate Party Votes % Swing
First Count
Walker IND 979 2.3 +2.3 Ellem CLR 12098 28.0 +17.7 Scott-Irving IND 372 0.9 +0.9 Robinson DEM 272 0.6 +0.6 Camac CDP 832 1.9 +0.1 Gulaptis NAT 24555 56.7 -6.0 Mead ORP 1066 2.5 +2.5 Cavanaugh GRN 3099 7.2 +0.3 ... (Williamson) IND 0.0 -17.0 … FFP 0.0 -1.3
Final Count Ellem CLR 13657 34.9 +34.9 Gulaptis NAT 25512 65.1 -8.2 ... (Williamson) IND 0 0.0 -26.7 Exhausted 4104 9.5
2-Party Preferred Ellem CLR 13657 34.9 +16.2 Gulaptis NAT 25512 65.1 -16.2 Exhausted 4104 9.5
Formal 43273 97.4 -0.5 Informal 1139 2.6 +0.5 Total Vote / Turnout 44412 85.0
Heffron Roll 55712 (25 Aug 2012 – Resignation of Kristina Keneally)
Candidate Party Votes % Swing
First Count Hoenig ALP 20501 58.9 +17.7 Peebles CDP 2442 7.0 +5.1 Faruqi GRN 8122 23.3 +4.4 Simmons DEM 3749 10.8 +10.8 .... LIB 0.0 -33.3 … OTH 0.0 -4.6
Final Count
Hoenig ALP 21863 70.0 +12.9 Faruqi GRN 9366 30.0 +30.0 .... LIB 0 0.0 -42.9 Exhausted 3585 10.3
Formal 34814 94.8 -1.9 Informal 1910 5.2 +1.9 Total Vote / Turnout 36724 65.9
Sydney Roll 61428 (27 Oct 2012 – Resignation of Clover Moore)
Candidate Party Votes % Swing
First Count
Peebles CDP 724 1.9 +0.8 Greenwich IND 17687 47.3 +47.3 Harris GRN 6616 17.7 +4.9 Mallard LIB 11543 30.9 -5.3 Wall IND 825 2.2 +2.2 ... (Moore) IND 0.0 -36.3 ... ALP 0.0 -11.3 … OTH 0.0 -2.4
Final Count
Greenwich IND 21283 63.7 +63.7 Mallard LIB 12120 36.3 -10.6 ... (Moore) IND 0.0 -53.1 Exhausted 3992 10.7
Formal 37395 97.2 -0.6 Informal 1062 2.8 +0.6 Total Vote / Turnout 38457 62.6
Northern Tablelands (NAT gain) Roll 51802 (25 May 2013 – Resignation of Richard Torbay)
Candidate Party Votes % Swing
First Count Bush IND 1270 2.9 +2.9 Marshall NAT 27276 63.3 +35.0 Koops GRN 1782 4.1 +0.8 Beyersdorf CLR 4190 9.7 +6.3 Nicholson IND 1845 4.3 +4.3 Maher IND 5814 13.5 +13.5 Nero CDP 912 2.1 +0.5 ... (Torbay) IND -63.4
Final Count
Marshall NAT 29817 81.0 +50.4 Beyersdorf CLR 7014 19.0 +19.0 ... (Torbay) IND 0 0.0 -69.4 Exhausted 6258 14.5
2-Party Preferred Marshall NAT 29817 81.0 +4.9 Beyersdorf CLR 7014 19.0 -4.9 Exhausted 6258 14.5
Formal 43089 97.1 -1.8 Informal 1304 2.9 +1.8 Total Vote / Turnout 44393 85.7

NSW Election 2015
43
Miranda (ALP gain) Roll 48683 (19 Oct 2013 – Resignation of Graham Annesley)
Candidate Party Votes % Swing
First Count Scott GRN 1757 4.3 -4.4 Walters IND 842 2.1 +2.1 Collier ALP 18812 46.5 +24.2 Capsis CDP 2840 7.0 +3.5 Thomas LIB 15883 39.2 -21.5 Brett - 342 0.8 -3.9
Final Count Collier ALP 20751 55.1 +26.1 Thomas LIB 16916 44.9 -26.1 Exhausted 2809 6.9
Formal 40476 98.0 +0.7 Informal 813 2.0 -0.7 Total Vote / Turnout 41289 84.8
Charlestown (ALP gain) Roll 49928 (25 Oct 2014 – Resignation of Andrew Cornwell)
Candidate Party Votes % Swing
First Count Arms IND 4807 12.2 +12.2 Sky IND 1068 2.7 +2.7 Oakley GRN 5613 14.2 +5.8 Wrightson PUP 2592 6.6 +6.6 Harrison ALP 19429 49.3 +20.4 Cubis IND 1366 3.5 +3.5 Martin - 611 1.5 +1.0 Tucker CDP 1804 4.6 +2.4 Hope IND 2144 5.4 +5.4 ... LIB 0.0 -43.8 … OTH 0.0 -16.1
Final Count Oakley GRN 8762 29.2 +29.2 Harrison ALP 21206 70.8 +30.6 ... LIB 0 0.0 -59.9 Exhausted 9466 24.0
Formal 39434 92.6 -3.9 Informal 3158 7.4 +3.9 Total Vote / Turnout 42592 85.3
Note: Despite having won Charlestown at the 2011
election, the Liberal Party did not contest the by-election as an 'act of atonement' following revelations at the ICAC political donation inquiries.
Newcastle (ALP gain) Roll 54161 (25 Oct 2014 – Resignation of Tim Owen)
Candidate Party Votes % Swing
First Count O'Brien SA 1086 2.6 +1.0 Crakanthorp ALP 15253 36.9 +6.3 Osborne GRN 8236 19.9 +5.1 Haines IND 3019 7.3 +7.3 Stefanac PUP 1332 3.2 +3.2 Howard IND 10796 26.1 +26.1 Caine CDP 834 2.0 +0.9 Buckley Clare IND 762 1.8 +1.8 ... LIB 0.0 -36.7 … OTH 0.0 -15.1
Final Count Crakanthorp ALP 18795 58.7 +11.2 Howard IND 13235 41.3 +41.3 ... LIB 0 0.0 -52.6 Exhausted 9288 22.5
Formal 41318 94.7 -2.5 Informal 2327 5.3 +2.5 Total Vote / Turnout 43645 80.6
Note: Despite having won Newcastle at the 2011
election, the Liberal Party did not contest the by-election as an 'act of atonement' following revelations at the ICAC political donation inquiries.

NSW Election 2015
44
Legislative Council
State-wide Totals Roll 5,040,662
Seats Change Party (Group) Votes % Vote Swing Quotas Won on 2007
Liberal / Nationals (E) 1,839,452 42.61 -5.06 9.3752 9 +1 Labor / Country Labor (K) 1,341,943 31.09 +7.36 6.8395 7 -2 The Greens (S) 428,036 9.92 -1.20 2.1816 2 .. Shooters and Fishers (N) 167,871 3.89 +0.19 0.8556 1 .. Christian Democratic Party (Q) 126,305 2.93 -0.20 0.6437 1 .. No Land Tax (A) 82,054 1.90 +1.90 0.4182 .. .. Animal Justice Party (C) 76,819 1.78 +1.78 0.3915 1 +1 Voluntary Euthanasia Party (L) 40,710 0.94 +0.94 0.2075 .. .. No Parking Meters Party (I) 34,852 0.81 -0.41 0.1776 .. .. The Fishing Party (R) 31,882 0.74 -0.59 0.1625 .. .. Outdoor Recreation Party (B) 31,445 0.73 -0.04 0.1603 .. .. Australian Motorists Party (F) 27,785 0.64 +0.64 0.1416 .. .. Australian Democrats (T) 23,466 0.54 -0.29 0.1196 .. .. Australian Cyclists Party (X) 21,280 0.49 +0.49 0.1085 .. .. Building Australia Party (G) 12,466 0.29 +0.07 0.0635 .. .. Socialist Alliance (O) 8,489 0.20 -0.06 0.0433 .. .. Independents (D) 6,251 0.14 +0.14 0.0319 .. .. Independents (J) 4,361 0.10 +0.10 0.0222 .. .. #Strata Party (H) 3,024 0.07 +0.07 0.0154 .. .. #Future Party (M) 2,782 0.06 +0.06 0.0142 .. .. Independents (P) 2,767 0.06 +0.06 0.0141 .. .. #Country Party (V) 959 0.02 +0.02 0.0049 .. .. Independents (U) 113 0.00 +0.00 0.0006 .. .. Independents (W) 113 0.00 +0.00 0.0006 .. .. Ungrouped Candidates 1,273 0.03 -0.08 0.0065 .. .. Others -5.92
Formal 4,316,498 Informal 258,368 5.65 +0.30 Total Vote / Turnout 4,574,866 90.76 -2.13 Quota 196,205
# - Not a registered party. No affiliation shown on the ballot paper.
Party Composition of Retiring and Continuing Legislative Councillors.
LIB NAT ALP GRN CDP SFP AJP Seats
Retiring 5 3 9 2 1 1 .. 21 Newly elected 6 3 7 2 1 1 1 21 Continuing 7 4 5 3 1 1 .. 21
Old Council 12 7 14 5 2 2 .. 42 New Council 13 7 12 5 2 2 1 42
Note – Party affiliation based on party membership at time of election.

NSW Election 2015
45
Incidence of Ticket Voting
No. Above the Line Votes Below the Line Votes Party (Group) Cands. % Vote No Prefs With Prefs No.1 Cand Others
Liberal / Nationals (E) 16 42.61 88.4 10.9 0.4 0.4 Labor / Country Labor (K) 21 31.09 83.7 15.1 0.7 0.5 The Greens (S) 21 9.92 67.0 29.4 2.8 0.8 Shooters and Fishers (N) 21 3.89 85.2 12.7 1.5 0.6 Christian Democratic Party (Q) 20 2.93 76.1 20.2 3.2 0.6 No Land Tax (A) 16 1.90 72.7 21.5 3.0 2.7 Animal Justice Party (C) 16 1.78 73.1 23.9 1.7 1.3 Voluntary Euthanasia Party (L) 15 0.94 74.9 20.7 3.5 0.8 No Parking Meters Party (I) 21 0.81 78.7 19.2 1.2 0.9 The Fishing Party (R) 20 0.74 84.8 13.1 1.5 0.6 Outdoor Recreation Party (B) 15 0.73 73.2 23.5 2.0 1.3 Australian Motorists Party (F) 17 0.64 75.7 21.6 1.7 1.0 Australian Democrats (T) 15 0.54 77.2 17.9 3.6 1.3 Australian Cyclists Party (X) 15 0.49 66.1 27.8 4.4 1.7 Building Australia Party (G) 17 0.29 79.4 17.2 1.9 1.5 Socialist Alliance (O) 16 0.20 63.9 28.7 4.9 2.5 Independents (D) 16 0.14 75.2 20.2 2.1 2.6 Independents (J) 15 0.10 82.0 14.1 2.2 1.7 # Strata Party (H) 15 0.07 81.3 13.5 2.6 2.6 # Future Party (M) 16 0.06 74.9 15.7 4.6 4.8 Independents (P) 15 0.06 78.7 12.1 3.0 6.1 Ungrouped Candidates 17 0.03 0.0 0.0 20.9 79.1 # Country Party (V) 14 0.02 0.0 0.0 86.4 13.6 Independents (U) 2 0.00 0.0 0.0 79.6 20.4 Independents (w) 2 0.00 0.0 0.0 84.1 15.9
Election Totals 394 83.0 15.3 1.1 0.6
The table below summarises the Legislative Council distribution of preferences. Counts 374-390 excluded leading candidates from each ballot paper group. See next page for commentary.
Summary of Legislative Council Preference Distributions
Change to Totals Count 374 Counts 374-390 Totals Count 390 Party (Group) Count 374 Votes Quotas Change % Votes Quotas
Shooters and Fishers (N) -173 167,855 0.8555 +9,708 2.69 177,563 0.9050 Labor/Country Labor (K) -694 162,995 0.8307 +21,059 5.84 184,054 0.9381 Christian Democrats (Q) +59 126,695 0.6457 +7,294 2.02 133,989 0.6829 No Land Tax (A) -1042 81,161 0.4137 +7,082 1.96 88,243 0.4497 Animal Justice (C) -216 76,782 0.3913 +14,638 4.06 91,420 0.4659 Liberal/Nationals (E) +49 72,915 0.3716 Voluntary Euthanasia (L) +112 41,077 0.2094 The Greens (S) -402 35,091 0.1788 No Parking Meters (I) -16 34,888 0.1778 The Fishing Party (R) +36 31,959 0.1629 Outdoor Recreation (B) -15 31,469 0.1604 Australian Motorists (F) -69 27,784 0.1416 Australian Democrats (T) +50 23,780 0.1212 Australian Cyclists (X) -40 21,395 0.1090 Building Australia (G) +4 12,512 0.0638 Socialist Alliance (O) +4 8,563 0.0436 Independents (D) -27 6,250 0.0319 Independents (J) +85 4,464 0.0228 # Strata Party (H) +34 3,072 0.0157 # Future Party (M) -33 2,759 0.0141 Independents (P) -13 2,760 0.0141 Ungrouped / Others -2480 0
Exhausted +4787 4787 0.0244 300,957 83.43 305,744 1.5583

NSW Election 2015
46
Counts 2-18 distributed the preferences of the leading candidates on the Liberal/National Coalition, Labor and Green tickets, electing nine Coalition, six Labor and two Green MLCs. Four vacancies remained to be filled, the count continuing by the successive exclusion of the lowest polling candidates in the count and the distribution of each candidate's preferences. By the end of Count 374 only 21 candidates remained in the count, one from each group on the ballot paper with a group ticket vote. These candidates were the 10
th Coalition candidate, 7
th Labor
candidate, 3rd
Green candidate and the lead candidate for the other 18 groups. The total votes for each remaining candidate at the end of Count 374 includes the above the line ballot papers for each group. In the table on the previous page, the column headed 'Change to Count 374' shows the change in vote tally for the remaining candidate in each group compared to the initial tally of first preference votes for each group, taking account of the quotas set aside for elected candidates. This column represents the leakage of below the line votes from the total first preference votes for each group. The table lists parties in descending order of votes at the end of Count 374. The table shows the total of votes for each candidate as well as the fraction of a quota those votes represent. Counts 374 to 390 excluded 16 candidates beginning with Andrew Thaler in Group P and finishing with the tenth Coalition candidate Hollie Hughes. The total flow of preferences distributed in these counts is shown in the column headed 'Counts 374-390'. A total of 360,738 ballot papers were distributed during these counts. 83.43% of these ballot papers exhausted their preferences before reaching one of the final five candidates remaining in the count at Count 390 Of the ballot papers distributed between Counts 374 and 390, 5.84% flowed to the final Labor candidate Courtney Houssos, 4.06% to Mark Pearson of Animal Justice while only 1.96% flowed to Peter Jones of the No Land Tax Party. The count was completed with the formal exclusion of Peter Jones of the No Land Tax Party. His preferences were not distributed and the final four candidates representing Labor, the Shooters and Fishers, Christian Democrats and Animal Justice Party were declared elected with less than a quota of votes. In the race for the final seat, Peter Jones of No Land Tax led Mark Pearson of the Animal Justice Party until the end of Count 388. At that point Jones led Pearson by 2,004 votes, 86,093 to 84,089. Count 389 excluded the remaining Green candidate Justin Field. 40.4% of Field's votes had preferences for candidates remaining in the count, the strongest flow of preferences seen at an exclusion since the Legislative Council's electoral system was first used at the 2003 election. Of Field's 48,815 votes on exclusion, 29,072 (59.6%) exhausted, 10,415 (21.3%) flowed to Labor, 5,631 (11.5%) to Animal Justice, 1,410 (2.9%) to the Coalition, 806 (1.7%) to the Christian Democrats, 744 (1.5%) to No Land Tax and 737 (1.5%) to the Shooters and Fishers. This preference flow put Pearson ahead of Jones by 2,883 votes, 89,720 to 86,837. The exclusion of the final Liberal/National candidate saw an exhaustion rate of 86.1% while Pearson gained a further 1,700 vote to 1,406 to Jones. Count 390 saw five candidates remaining with four vacancies to be filled. Pearson led Jones by 3,177 votes. Jones was excluded as the lowest polling candidate and the four remaining candidates declared elected. The Animal Justice Party polled 1.78% (0.29 quotas) and reached 2.12% (0.47 quotas) after preferences. This was the lowest vote for a successful candidate since the current electoral system was introduced in 2003. It was lower than the 2.05% for the elected Shooters Party in 2003, equal to the unsuccessful Australian Democrats in 2007 (1.78%) and lower than for Pauline Hanson's unsuccessful contests in 2003 (1.92%) and 2011 (2.41%).

NSW Election 2015
47
DETAILS OF LEGISLATIVE COUNCIL ELECTION
Group Party / Candidate Votes % Vote Quotas % Ticket A NO LAND TAX 82,054 1.90 0.4182 94.24 Ticket Votes (no preferences) 59,661 1.38 0.3041 72.71 Ticket Votes (with preferences) 17,667 0.41 0.0900 21.53 JONES Peter 2474 0.06 0.0126 CARBONE Pat 333 0.01 0.0017 MACRI Gus 223 0.01 0.0011 RUBEN James 223 0.01 0.0011 ADAMSON Gary 182 .. 0.0009 O'TOOLE Cathy 177 .. 0.0009 FITZPATRICK Sharon 179 .. 0.0009 WILSON Ron 155 .. 0.0008 LOPREIATO Joe 70 .. 0.0004 ARMER Jezza 64 .. 0.0003 CACCIOTTI Emma 99 .. 0.0005 AUSTIN James 79 .. 0.0004 FRANZONE Frank 49 .. 0.0002 MACLAREN Ulysses 67 .. 0.0003 LYNCH Kate 158 .. 0.0008 COOK Patria 194 .. 0.0010 B OUTDOOR RECREATION PARTY 31,445 0.73 0.1603 96.67 Ticket Votes (no preferences) 23,005 0.53 0.1172 73.16 Ticket Votes (with preferences) 7,394 0.17 0.0377 23.51 WHELAN Peter 623 0.01 0.0032 ELLIS Mark 89 .. 0.0005 WHELAN James 59 .. 0.0003 BELL S 38 .. 0.0002 DE LIMA Joaquim 20 .. 0.0001 BERNER Richard 21 .. 0.0001 FROST Adam 61 .. 0.0003 NICKOLS Graham 12 .. 0.0001 MUSGRAVE Jim 17 .. 0.0001 PETERSEN Terje 22 .. 0.0001 KOLHATKAR Vinay 14 .. 0.0001 DENTON Stephen 19 .. 0.0001 GAREMYN Keith 12 .. 0.0001 BEREGSZASZI Janos 10 .. 0.0001 DAWSON R W 29 .. 0.0001 C ANIMAL JUSTICE PARTY 76,819 1.78 0.3915 97.06 Ticket Votes (no preferences) 56,188 1.30 0.2864 73.14 Ticket Votes (with preferences) 18,374 0.43 0.0936 23.92 PEARSON Mark (Elected 21) 1280 0.03 0.0065 STONER Lynda 397 0.01 0.0020 KEENAN Tracey 90 .. 0.0005 GARLICK Rosemary 81 .. 0.0004 WOOLFE Marcel 58 .. 0.0003 RISELEY Julia 49 .. 0.0002 DINGLE WALL Sally 48 .. 0.0002 DAVISON Douglas 31 .. 0.0002 ROBERTSON Ellie 49 .. 0.0002 ERICKSEN Wayne 10 .. 0.0001 ERICKSEN Joanna 17 .. 0.0001 BELLENGER Carol 13 .. 0.0001 TOMASUMS Debbie 9 .. ..
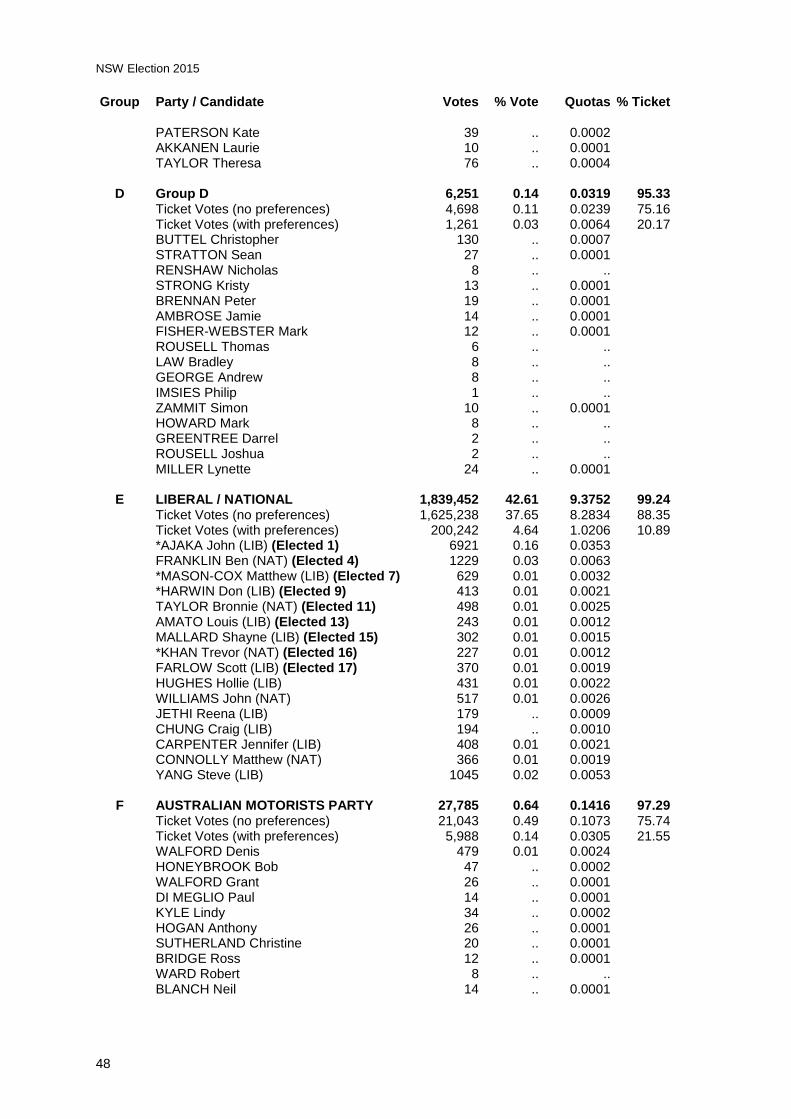
NSW Election 2015
48
Group Party / Candidate Votes % Vote Quotas % Ticket PATERSON Kate 39 .. 0.0002 AKKANEN Laurie 10 .. 0.0001 TAYLOR Theresa 76 .. 0.0004 D Group D 6,251 0.14 0.0319 95.33 Ticket Votes (no preferences) 4,698 0.11 0.0239 75.16 Ticket Votes (with preferences) 1,261 0.03 0.0064 20.17 BUTTEL Christopher 130 .. 0.0007 STRATTON Sean 27 .. 0.0001 RENSHAW Nicholas 8 .. .. STRONG Kristy 13 .. 0.0001 BRENNAN Peter 19 .. 0.0001 AMBROSE Jamie 14 .. 0.0001 FISHER-WEBSTER Mark 12 .. 0.0001 ROUSELL Thomas 6 .. .. LAW Bradley 8 .. .. GEORGE Andrew 8 .. .. IMSIES Philip 1 .. .. ZAMMIT Simon 10 .. 0.0001 HOWARD Mark 8 .. .. GREENTREE Darrel 2 .. .. ROUSELL Joshua 2 .. .. MILLER Lynette 24 .. 0.0001 E LIBERAL / NATIONAL 1,839,452 42.61 9.3752 99.24 Ticket Votes (no preferences) 1,625,238 37.65 8.2834 88.35 Ticket Votes (with preferences) 200,242 4.64 1.0206 10.89 *AJAKA John (LIB) (Elected 1) 6921 0.16 0.0353 FRANKLIN Ben (NAT) (Elected 4) 1229 0.03 0.0063 *MASON-COX Matthew (LIB) (Elected 7) 629 0.01 0.0032 *HARWIN Don (LIB) (Elected 9) 413 0.01 0.0021 TAYLOR Bronnie (NAT) (Elected 11) 498 0.01 0.0025 AMATO Louis (LIB) (Elected 13) 243 0.01 0.0012 MALLARD Shayne (LIB) (Elected 15) 302 0.01 0.0015 *KHAN Trevor (NAT) (Elected 16) 227 0.01 0.0012 FARLOW Scott (LIB) (Elected 17) 370 0.01 0.0019 HUGHES Hollie (LIB) 431 0.01 0.0022 WILLIAMS John (NAT) 517 0.01 0.0026 JETHI Reena (LIB) 179 .. 0.0009 CHUNG Craig (LIB) 194 .. 0.0010 CARPENTER Jennifer (LIB) 408 0.01 0.0021 CONNOLLY Matthew (NAT) 366 0.01 0.0019 YANG Steve (LIB) 1045 0.02 0.0053 F AUSTRALIAN MOTORISTS PARTY 27,785 0.64 0.1416 97.29 Ticket Votes (no preferences) 21,043 0.49 0.1073 75.74 Ticket Votes (with preferences) 5,988 0.14 0.0305 21.55 WALFORD Denis 479 0.01 0.0024 HONEYBROOK Bob 47 .. 0.0002 WALFORD Grant 26 .. 0.0001 DI MEGLIO Paul 14 .. 0.0001 KYLE Lindy 34 .. 0.0002 HOGAN Anthony 26 .. 0.0001 SUTHERLAND Christine 20 .. 0.0001 BRIDGE Ross 12 .. 0.0001 WARD Robert 8 .. .. BLANCH Neil 14 .. 0.0001

NSW Election 2015
49
Group Party / Candidate Votes % Vote Quotas % Ticket MUNN Brendon 8 .. .. FOSTER Terry 14 .. 0.0001 DIIORIO Phillip 8 .. .. WARDLE John 5 .. .. WARD Wes 10 .. 0.0001 WALFORD Nicole 12 .. 0.0001 WARD Kath 17 .. 0.0001 G BUILDING AUSTRALIA PARTY 12,466 0.29 0.0635 96.63 Ticket Votes (no preferences) 9,904 0.23 0.0505 79.45 Ticket Votes (with preferences) 2,142 0.05 0.0109 17.18 BROWN Ray 233 0.01 0.0012 EMRICH Eva 22 .. 0.0001 O'DONNELL Michael 28 .. 0.0001 WALTER David 9 .. .. ATKINS Nikki 25 .. 0.0001 CRAIG Geoff 15 .. 0.0001 HARWOOD Ross 11 .. 0.0001 MURRAY Christine 7 .. .. HEARN Bob 8 .. .. JONES Neville 8 .. .. VELLENGA John 7 .. .. BOLAND Helen 8 .. .. ERICOLI Chris 5 .. .. ROSTIROLLA John 9 .. .. COSTIGAN Simon 6 .. .. ATKINS Gregory 5 .. .. CRANFIELD kevin 14 .. 0.0001 H #STRATA PARTY 3,024 0.07 0.0154 94.81 Ticket Votes (no preferences) 2,460 0.06 0.0125 81.35 Ticket Votes (with preferences) 407 0.01 0.0021 13.46 BYRNE Christine 78 .. 0.0004 RASHBROOK Jan 6 .. .. DILWORTH Pamela 11 .. 0.0001 HUTCHINSON John 7 .. .. PARKES Ken 6 .. .. CLARK Brent 7 .. .. DERWENT Luke 7 .. .. HOY Allan 7 .. .. JONES Adam 4 .. .. HATCHER S 2 .. .. DONALD Janet 4 .. .. GIBSON Tonja 3 .. .. DRISCOLL Peter 3 .. .. AITKEN Bruce 7 .. .. JOHNSON W 5 .. .. I NO PARKING METERS PARTY 34,852 0.81 0.1776 97.86 Ticket Votes (no preferences) 27,421 0.64 0.1398 78.68 Ticket Votes (with preferences) 6,685 0.15 0.0341 19.18 MATTHEWS Charles 431 0.01 0.0022 MORRIS Robert 52 .. 0.0003 SAYLE Jeff 37 .. 0.0002 BROOKING Victor 29 .. 0.0001 NASR Eddie 18 .. 0.0001 BARRON Kevin 23 .. 0.0001

NSW Election 2015
50
Group Party / Candidate Votes % Vote Quotas % Ticket MORRISEY Louise 16 .. 0.0001 BENNETT Frank 16 .. 0.0001 DEAN Paul 16 .. 0.0001 MORRISEY Michael 16 .. 0.0001 SINGH Ranbir 15 .. 0.0001 GOHIL Hasmukhlal 7 .. .. MORRISEY Jo-Anne 8 .. .. MORRISEY Michelle 8 .. .. MATTHEWS Carol 8 .. .. DOWNEY John 12 .. 0.0001 PAINE Neil 5 .. .. GARNETT Michael 5 .. .. BISARO Susan 6 .. .. QUINANE Christopher 0 .. .. QUINANE Eileen 18 .. 0.0001 J Group J 4,361 0.10 0.0222 96.10 Ticket Votes (no preferences) 3,577 0.08 0.0182 82.02 Ticket Votes (with preferences) 614 0.01 0.0031 14.08 LIU James 94 .. 0.0005 JING Wei 13 .. 0.0001 FOUNTAIN Cerelia 5 .. .. XIAN Bao Ming 3 .. .. LIANG Jie 4 .. .. RUAN Hua Mei 3 .. .. ZHOU Xiao Fang 8 .. .. GUO Xiao Yi 5 .. .. CHEUNG Lam Chong 15 .. 0.0001 NG Iok Long 3 .. .. PAN Xue Ming 1 .. .. NG Kim Fong 6 .. .. MA Yingxi 0 .. .. YIN Nan 2 .. .. NI Feng Yi 8 .. .. K LABOR / COUNTRY LABOR 1,341,943 31.09 6.8395 98.79 Ticket Votes (no preferences) 1,122,913 26.01 5.7232 83.68 Ticket Votes (with preferences) 202,846 4.70 1.0338 15.12 *COTSIS Sophie (ALP) (Elected 2) 9974 0.23 0.0508 *SECORD Walt (ALP) (Elected 5) 672 0.02 0.0034 *VOLTZ Lynda (ALP) (Elected 8) 475 0.01 0.0024 *MOSELMANE Shaoquett (ALP) (Elected 10) 265 0.01 0.0014 *VEITCH Mick (CLR) (Elected 12) 477 0.01 0.0024 *SEARLE Adam (ALP) (Elected 14) 505 0.01 0.0026 HOUSSOS Courtney (ALP) (Elected 18) 322 0.01 0.0016 MOOKHEY Daniel (ALP) 236 0.01 0.0012 *WESTWOOD Helen (ALP) 531 0.01 0.0027 AMJAD Aisha (ALP) 371 0.01 0.0019 PRIEST Annette (CLR) 268 0.01 0.0014 LAY Jill (ALP) 236 0.01 0.0012 LAM Floris (ALP) 149 .. 0.0008 MOONEY Blake (CLR) 186 .. 0.0009 WILLIAMS Keith (CLR) 234 0.01 0.0012 ALAFACI Frank (ALP) 198 .. 0.0010 HUANG Kun (ALP) 172 .. 0.0009 McKENNA Lucille (ALP) 152 .. 0.0008 CLAPHAM Jennifer 134 .. 0.0007

NSW Election 2015
51
Group Party / Candidate Votes % Vote Quotas % Ticket MAKER Rosemary (ALP) 163 .. 0.0008 BARBAR Daniel (ALP) 464 0.01 0.0024 L VOLUNTARY EUTHANASIA PARTY 40,710 0.94 0.2075 95.61 Ticket Votes (no preferences) 30,486 0.71 0.1554 74.89 Ticket Votes (with preferences) 8,437 0.20 0.0430 20.72 HIGSON Shayne 1444 0.03 0.0074 MILLS Richard 39 .. 0.0002 JOHNSON Deirdre 59 .. 0.0003 BEAUMONT OWLES Brian 16 .. 0.0001 DALEY Judith 37 .. 0.0002 KING Bill 27 .. 0.0001 MULHALL Natasha 35 .. 0.0002 BRITT Joshua 11 .. 0.0001 SCHILLING Kath 13 .. 0.0001 MACKENZIE John 18 .. 0.0001 STEEP Sandi 17 .. 0.0001 MEYER Ken 5 .. .. BAYLEY Donald 4 .. .. DRISCOLL Patricia 17 .. 0.0001 WILLIAMS Geoffrey 45 .. 0.0002 M #FUTURE PARTY 2,782 0.06 0.0142 90.58 Ticket Votes (no preferences) 2,083 0.05 0.0106 74.87 Ticket Votes (with preferences) 437 0.01 0.0022 15.71 JANSSON James 129 .. 0.0007 FINNO Andrea 6 .. .. MANICKAM Saritha 5 .. .. POWELL Daniel 5 .. .. BILL Cory 8 .. .. PFISTER Markus 9 .. .. GORDON Thomas 9 .. .. SIMMER Colin 2 .. .. ACKERMAN Jared 15 .. 0.0001 COVER Myles 20 .. 0.0001 SLAVICH Eve 5 .. .. WALSH Cameron 3 .. .. ROCKOFF Todd 7 .. .. HAGGERTY James 11 .. 0.0001 BYRT T 3 .. .. PAGE Nathan 25 .. 0.0001 N SHOOTERS AND FISHERS 167,871 3.89 0.8556 97.89 Ticket Votes (no preferences) 142,978 3.31 0.7287 85.17 Ticket Votes (with preferences) 21,352 0.49 0.1088 12.72 *BORSAK Robert (Elected 19) 2509 0.06 0.0128 JOHNSON Peter 201 .. 0.0010 HOUSEMAN Karl 44 .. 0.0002 LEE Steve 127 .. 0.0006 SPEARS Daniel 59 .. 0.0003 WOOD Jacqui 62 .. 0.0003 NOUJAIM Alain 36 .. 0.0002 VAN DER NEUT Dane 33 .. 0.0002 PALMER L 48 .. 0.0002 CANNULI Sam 24 .. 0.0001 NEVILLE Danielle 33 .. 0.0002 SARKIS Nadrra 107 .. 0.0005

NSW Election 2015
52
Group Party / Candidate Votes % Vote Quotas % Ticket LESAGE Jason 23 .. 0.0001 STEEL Craig 44 .. 0.0002 McMANUS Tony 34 .. 0.0002 CROCKFORD Mike 15 .. 0.0001 RICHARDS Peter 16 .. 0.0001 BAKER Arthur 6 .. .. PATCHETT Linda 18 .. 0.0001 SHAW Bob 37 .. 0.0002 COOK Dave 65 .. 0.0003 O SOCIALIST ALLIANCE 8,489 0.20 0.0433 92.64 Ticket Votes (no preferences) 5,426 0.13 0.0277 63.92 Ticket Votes (with preferences) 2,438 0.06 0.0124 28.72 LEROY-DYER Sharlene 413 0.01 0.0021 RAINFORD John 17 .. 0.0001 SANDERS Mia 18 .. 0.0001 BYRNES Howard 7 .. .. HINMAN Pip 26 .. 0.0001 McFARLANE Gregory 17 .. 0.0001 EVANS Rachel 34 .. 0.0002 COLEMAN John 12 .. 0.0001 WYNTER Coral 11 .. 0.0001 KOHLER Ben 4 .. .. NOTT Jemma 10 .. 0.0001 BENEDEK Paul 5 .. .. FAIRFAX Kathryn 7 .. .. RODEN Duncan 0 .. .. ALLAN Margaret 6 .. .. McGREGOR Nicole 38 .. 0.0002 P Group P 2,767 0.06 0.0141 90.86 Ticket Votes (no preferences) 2,178 0.05 0.0111 78.71 Ticket Votes (with preferences) 336 0.01 0.0017 12.14 THALER Andrew 84 .. 0.0004 SCHWAGER Kate 50 .. 0.0003 QUINCE David 19 .. 0.0001 KENNEDY Anne 37 .. 0.0002 HILL Peter 2 .. .. WILSON Venecia 17 .. 0.0001 ROBINSON Mark 12 .. 0.0001 HESLOP Benjamin 3 .. .. MARSHALL Sonya 6 .. .. CAMPEY Ron 5 .. .. GOLDSMITH Pam 5 .. .. SIMMONS Drew 6 .. .. HILL Rusan 2 .. .. THALER Alisa 4 .. .. SCHWAGER Bill 1 .. .. Q CHRISTIAN DEMOCRATIC PARTY 126,305 2.93 0.6437 96.24 Ticket Votes (no preferences) 96,089 2.23 0.4897 76.08 Ticket Votes (with preferences) 25,466 0.59 0.1298 20.16 *NILE Fred (Elected 20) 4048 0.09 0.0206 CLIFFORD Ross 314 0.01 0.0016 TADROS Peter 41 .. 0.0002 KHOURY Simon 89 .. 0.0005 KWON Soon-Hyung 23 .. 0.0001
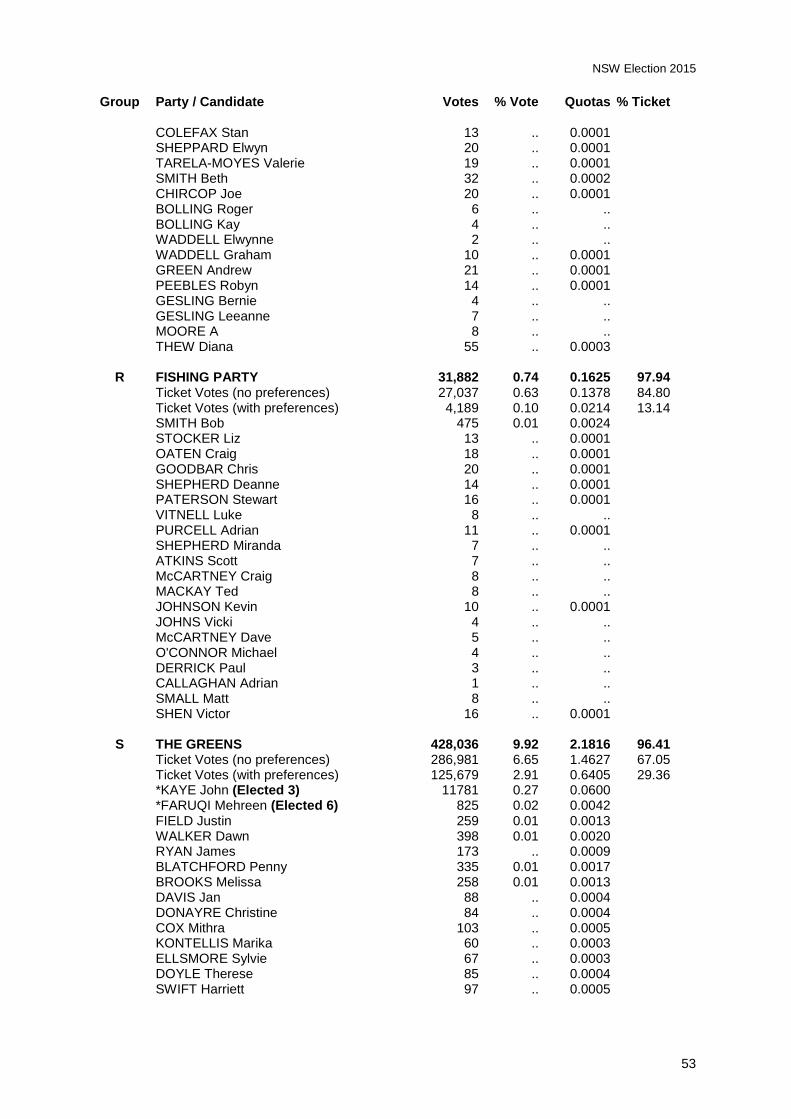
NSW Election 2015
53
Group Party / Candidate Votes % Vote Quotas % Ticket COLEFAX Stan 13 .. 0.0001 SHEPPARD Elwyn 20 .. 0.0001 TARELA-MOYES Valerie 19 .. 0.0001 SMITH Beth 32 .. 0.0002 CHIRCOP Joe 20 .. 0.0001 BOLLING Roger 6 .. .. BOLLING Kay 4 .. .. WADDELL Elwynne 2 .. .. WADDELL Graham 10 .. 0.0001 GREEN Andrew 21 .. 0.0001 PEEBLES Robyn 14 .. 0.0001 GESLING Bernie 4 .. .. GESLING Leeanne 7 .. .. MOORE A 8 .. .. THEW Diana 55 .. 0.0003 R FISHING PARTY 31,882 0.74 0.1625 97.94 Ticket Votes (no preferences) 27,037 0.63 0.1378 84.80 Ticket Votes (with preferences) 4,189 0.10 0.0214 13.14 SMITH Bob 475 0.01 0.0024 STOCKER Liz 13 .. 0.0001 OATEN Craig 18 .. 0.0001 GOODBAR Chris 20 .. 0.0001 SHEPHERD Deanne 14 .. 0.0001 PATERSON Stewart 16 .. 0.0001 VITNELL Luke 8 .. .. PURCELL Adrian 11 .. 0.0001 SHEPHERD Miranda 7 .. .. ATKINS Scott 7 .. .. McCARTNEY Craig 8 .. .. MACKAY Ted 8 .. .. JOHNSON Kevin 10 .. 0.0001 JOHNS Vicki 4 .. .. McCARTNEY Dave 5 .. .. O'CONNOR Michael 4 .. .. DERRICK Paul 3 .. .. CALLAGHAN Adrian 1 .. .. SMALL Matt 8 .. .. SHEN Victor 16 .. 0.0001 S THE GREENS 428,036 9.92 2.1816 96.41 Ticket Votes (no preferences) 286,981 6.65 1.4627 67.05 Ticket Votes (with preferences) 125,679 2.91 0.6405 29.36 *KAYE John (Elected 3) 11781 0.27 0.0600 *FARUQI Mehreen (Elected 6) 825 0.02 0.0042 FIELD Justin 259 0.01 0.0013 WALKER Dawn 398 0.01 0.0020 RYAN James 173 .. 0.0009 BLATCHFORD Penny 335 0.01 0.0017 BROOKS Melissa 258 0.01 0.0013 DAVIS Jan 88 .. 0.0004 DONAYRE Christine 84 .. 0.0004 COX Mithra 103 .. 0.0005 KONTELLIS Marika 60 .. 0.0003 ELLSMORE Sylvie 67 .. 0.0003 DOYLE Therese 85 .. 0.0004 SWIFT Harriett 97 .. 0.0005

NSW Election 2015
54
Group Party / Candidate Votes % Vote Quotas % Ticket DUNCAN Darelle 27 .. 0.0001 JARNASON Susan 33 .. 0.0002 BLOCH Barbara 36 .. 0.0002 THOMPSON Matthew 69 .. 0.0004 STOCK Sue 69 .. 0.0004 BRIERLEY NEWTON De 41 .. 0.0002 TURNER Kylie 488 0.01 0.0025 T AUSTRALIAN DEMOCRATS 23,466 0.54 0.1196 95.13 Ticket Votes (no preferences) 18,114 0.42 0.0923 77.19 Ticket Votes (with preferences) 4,210 0.10 0.0215 17.94 WAGNER Rendall 846 0.02 0.0043 VILLAVER Ronaldo 27 .. 0.0001 LOVELL Simon 15 .. 0.0001 MELLAND Julia 70 .. 0.0004 WALLACE Andrew 13 .. 0.0001 OLSEN Sue-Maree 23 .. 0.0001 MATERAZZO Mayo 6 .. .. KING David 25 .. 0.0001 ELLIOTT-HALLS Samantha 22 .. 0.0001 LUXFORD Glenn 6 .. .. BINGLE Stephen 12 .. 0.0001 DALRYMPLE Garry 10 .. 0.0001 WIGGIN John 4 .. .. BARCA Thomas 4 .. .. RIDINGS Chris 59 .. 0.0003 U Group U 113 .. 0.0006 0.00 STEFANAC Jennifer 90 .. 0.0005 COOLEY Tucky 23 .. 0.0001 V #COUNTRY PARTY 959 0.02 0.0049 0.00 PIKE Ron 829 0.02 0.0042 SNAIDERO Paul 14 .. 0.0001 PIEROTTI Paul 21 .. 0.0001 MAILLER Pete 33 .. 0.0002 BARTON Alan 8 .. .. DAVIDSON Ross 8 .. .. EGAN John 2 .. .. HARKER-MORTLOCK James 22 .. 0.0001 HOPPER Brian 7 .. .. McLACHLAN Ellemarie 4 .. .. MOUAFI Lorraine 2 .. .. PIKE Julie 2 .. .. WILLS Jenny 2 .. .. WOODS Carmen 5 .. .. W Group W 113 .. 0.0006 0.00 ERWIN Warwick 95 .. 0.0005 ROBINSON Ray 18 .. 0.0001 X AUSTRALIAN CYCLISTS PARTY 21,280 0.49 0.1085 93.91 Ticket Votes (no preferences) 14,074 0.33 0.0717 66.14 Ticket Votes (with preferences) 5,911 0.14 0.0301 27.78 KHALIFA Omar 926 0.02 0.0047 NEW Anthony 55 .. 0.0003 RALPH Ingrid 38 .. 0.0002

NSW Election 2015
55
Group Party / Candidate Votes % Vote Quotas % Ticket THOMPSON Ken 21 .. 0.0001 PAXINOS George 35 .. 0.0002 PAXINOS Yvette 25 .. 0.0001 PENNEFATHER James 15 .. 0.0001 GRIFFITHS Philip 18 .. 0.0001 BONICH Nick 27 .. 0.0001 MASON Chloe 33 .. 0.0002 DENTON David 10 .. 0.0001 GARDINER Dave 12 .. 0.0001 CIURPITA Roman 5 .. .. HICKSON Barbara 25 .. 0.0001 HARKER-SMITH Angus 50 .. 0.0003 UNGROUPED CANDIDATES 1273 0.03 0.0065 NUTHALL Ramsay 266 0.01 0.0014 WARD Jane 118 .. 0.0006 HOOD Alan 62 .. 0.0003 COLLINS PJ 233 0.01 0.0012 CRAIG Anthony 39 .. 0.0002 CRISP Gordon 28 .. 0.0001 SPREADBOROUGH Robert 20 .. 0.0001 BAANSTRA Stuart 23 .. 0.0001 SCEVOLA Sal 111 .. 0.0006 BRIX-NIELSEN Alain 38 .. 0.0002 ASH David 83 .. 0.0004 CHEN David 70 .. 0.0004 JUSTICE John 18 .. 0.0001 BALDWIN Aaron 20 .. 0.0001 COX Geoff 21 .. 0.0001 BENNETT Tony 42 .. 0.0002 PUNDPAL Mahesh 81 .. 0.0004 Formal Votes 4,316,498 Informal Votes 258,368 Total Votes / Turnout 4,574,866 Quota 196,205 Ticket Votes 4,243,629 98.31 Ticket Votes (no preferences) 3,581,554 82.97 Ticket Votes (with preferences) 662,075 15.34 Below the line votes 72,869 1.69

NSW Election 2015
56
New and Departing Members In total 65 members of the Legislative Assembly were re-elected at the 2015 election, 32 Liberal, 15 Labor, 15 National, one Green and two Independents. Nineteen members did not contest the 2015 election (eight Labor, eight Liberal and three National), one National member contested the Legislative Council, while seven Liberals and one ex-Liberal were defeated. There were 28 new members, 19 Labor, five Liberal, two National and two Greens. This includes Luke Foley (Labor) and Melinda Pavey (National) who made the transition from the Legislative Council. Two former Labor members defeated in 2011 returned to the Assembly at the 2015 election. Former Newcastle member Jodi Mckay won Strathfield, while David Harris recovered his former seat of Wyong. Legislative Assembly
Electorate Departing MP (Party) Reason New MP (Party)
Auburn Barbara Perry (ALP) Retired Luke Foley (ALP) 1
Ballina Don Page (NAT) Retired Tamara Smith (GRN) Blue Mountains Roza Sage (LIB) Defeated Trish Doyle (ALP) Campbelltown Bryan Doyle (LIB) Defeated Greg Warren (ALP) Epping Greg Smith (LIB) Retired Damien Tudehope (LIB) Gosford Chris Holstein (LIB) Defeated Kathy Smith (ALP) Granville Tony Issa (LIB) Defeated Julia Finn (ALP) Kogarah Cherie Burton (ALP) Retired Chris Minns (ALP) Ku-ring-gai Barry O'Farrell (LIB) Retired Alister Henskens (LIB) Lakemba Robert Furolo (ALP) Retired Jihad Dib (ALP) Londonderry Bart Bassett (LIB/IND) Retired Prue Car (ALP) Macquarie Fields Andrew McDonald (ALP) Retired Anoulack Chanthivong (ALP) Maitland Robyn Parker (LIB) Retired Jenny Aitchison (ALP) Marrickville Carmel Tebbutt (ALP) Retired (Seat abolished) Miranda Barry Collier (ALP) Retired Eleni Petinos (LIB) Mount Druitt Richard Amery (ALP) Retired Edmond Atalla (ALP) Murray-Darling John Williams (NAT) Contested LC (Seat abolished) Newtown (New seat) Jenny Leong (GRN) Oxley Andrew Stoner (NAT) Retired Melinda Pavey (NAT)
1
Port Stephens Craig Baumann (LIB/IND) Retired Kate Washington (ALP) Prospect Andrew Rohan (LIB) Defeated Hugh McDermott (ALP) Rockdale John Flowers (LIB) Defeated Steve Kamper (ALP) Seven Hills (New seat) Mark Taylor (LIB) Strathfield Charles Casuscelli (LIB) Defeated Jodi McKay (ALP) Summer Hill (New seat) Jo Haylen (ALP) Swansea Garry Edwards (LIB/IND) Defeated Yasmin Catley (ALP) Terrigal Chris Hartcher (LIB/IND) Retired Adam Crouch (LIB) The Entrance Chris Spence (LIB/IND) Retired David Mehan (ALP) Toongabbie Nathan Rees (ALP) Retired (Seat abolished) Upper Hunter George Souris (NAT) Retired Michael Johnsen (NAT) Wyong Darren Webber (LIB/IND) Retired David Harris (ALP)
Footnotes 1 Transferring from the Legislative Council
Bold indicates seats that changed party status at the 2011 election. Note that Miranda reverted to being a Liberal
seat after being won by Labor at a 2013 by-election. Macquarie Fields had become a notional Liberal seat in the redistribution but was recovered by the Labor Party at the 2015 election.
There were seven by-election held during the life of the 2011-15 Parliament, four resulting in a change in party status.

NSW Election 2015
57
Legislative Assembly By-election Changes 2007-2011
Electorate Departing MP (Party) Reason New MP (Party)
Clarence Steve Cansdell (NAT) Resigned Chris Gulaptis (NAT) Heffron Kristina Keneally (ALP) Resigned Ron Hoenig (ALP) Sydney Clover Moore (IND) Resigned Alex Greenwich (IND) Northern Tablelands Richard Torbey (IND) Resigned Adam Marshall (NAT) Miranda Graham Annesley (LIB) Resigned Barry Collier (ALP) Charlestown Andrew Cornwell (LIB) Resigned Jodie Harrison (ALP) Newcastle Tim Owen (LIB) Resigned Tim Crakanthorp (ALP)
Note – See details of by-elections page 42
Compared to the 2007 Legislative Council, the Legislative Council election saw the Labor Party lose two seats, the Liberal Party gain one seat and the Animal Justice Party win its first seat. Legislative Council
Departing MLCs New MLCs
Amanda Fazio (ALP) 2 Louis Amato (LIB)
Marie Ficarra (LIB) 2 Scott Farlow (LIB)
Luke Foley (ALP) 3 Ben Franklin (NAT)
Jenny Gardiner (NAT) 2 Courtney Houssos (ALP)
Charlie Lynn (LIB) 2 Shayne Mallard (LIB)
Melinda Pavey (NAT) 3 Mark Pearson (AJP)
Helen Westwood (ALP) 1 Bronnie Taylor (NAT)
1 Defeated at election from unwinnable position on Labor Party ticket.
2 Did not contest re-election
3 Elected to Legislative Assembly, Luke Foley for Auburn and Melinda Pavey for Oxley.
Two continuing Labor members resigned from the Legislative Council to contest the Legislative Assembly at the 2015 election. Penny Sharpe was defeated contesting the lower house seat of Newtown and was subsequently re-appointed to her Council seat. Steve Whan was defeated contesting the lower house seat of Monaro and replaced in the Council after the election by Daniel Mookhey, who had been the eighth candidate on Labor's 2015 Labor Legislative Council ticket. John Williams, the National MP for the abolished Legislative Assembly seat of Murray-Darling, failed to win election from 11
th position on the Liberal/National Legislative Council ticket.

NSW Election 2015
58
SUMMARY OF REDISTRIBUTION
(Details in this section taken from “2013 New South Wales Redistribution: Analysis of Final Electoral Boundaries”, NSW Parliamentary Library Background PapeNo. 3/2013.)
S e a t s H e l d b y P a r t y State of Parties Liberal National Labor Greens Inds Total
Old Boundaries 51 18 20 1 3 93 New Boundaries 53 17 18 2 3 93 Including by-elections 50 18 21 2 2 93
Note: The table summarises changes brought about by the redistribution and through by-elections. It does not
take account of MPs who withdrew from the Liberal party room following the ICAC donation inquiries.
The above table reflects the following changes –
The National held seats of Burrinjuck, Murrumbidgee and Murray-Darling were abolished and replaced by the new National seats of Cootamundra and Murray.
The Labor seat of Marrickville was abolished and replaced by two new seats in notionally Labor-held Summer Hill and the notionally Green-held seat of Newtown.
The Labor held seat of Toongabbie was abolished and replaced by the notionally Liberal seat of Seven Hills.
The Labor seat of Macquarie Fields became notionally Liberal held on its new boundaries.
The Liberal seat of Smithfield was replaced by Prospect.
The Liberal seat of Menai was replaced by Holsworthy.
The Independent held seat of Northern Tablelands was won by the National Party at a May 2013 by-election.
The Liberal held seat of Miranda was won by the Labor Party at an October 2013 by-election.
The Liberal held seats Charlestown and Newcastle were gained by the Labor Party at by-elections in October 2014.
The most politically significant changes in margins for electorates were as follows –
Campbelltown moved south, its Liberal margin doubling from 3.4% to 6.8%
Heathcote lost parts of the Illawarra and moved west of the Woronora River, its Liberal margin increasing from 12.9% to 19.0%.
The abolished seat of Menai had a Liberal margin of 24.4%, but its replacement in the new seat of Holsworthy had an estimated Liberal margin on 10.7%.
The Labor margin in Kogarah increased from 1.9% to an estimated 5.4%.
Major boundary changes to Londonderry saw the Liberal margin decline from 12.3% to an estimated 5.3%.
The Labor margin of 1.5% in Macquarie Fields became a notional Liberal margin of 1.8% on the new boundaries.
The Liberal margin in Oatley increased from 0.5% to an estimated 3.8%.
Toongabbie was held by Labor with a margin of 0.3%, but the new seat of Seven Hills had a notional Liberal margin of 8.8%.
Wollondilly moved south out of Campbelltown, its Liberal margin increasing from 14.7% to an estimated 21.6%.
Old and new margins for all seats, plus notes on retiring members and other issues affecting each electorate are set out on the following pages.
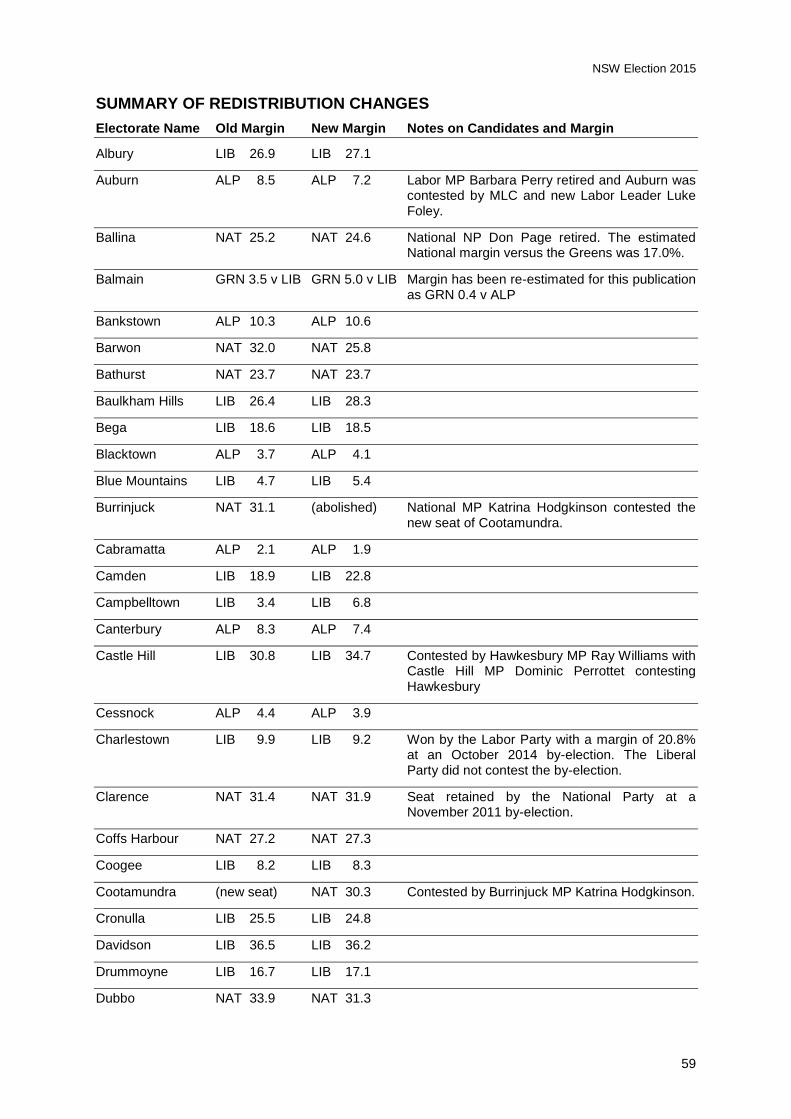
NSW Election 2015
59
SUMMARY OF REDISTRIBUTION CHANGES
Electorate Name Old Margin New Margin Notes on Candidates and Margin
Albury LIB 26.9 LIB 27.1
Auburn ALP 8.5 ALP 7.2 Labor MP Barbara Perry retired and Auburn was contested by MLC and new Labor Leader Luke Foley.
Ballina NAT 25.2 NAT 24.6 National NP Don Page retired. The estimated National margin versus the Greens was 17.0%.
Balmain GRN 3.5 v LIB GRN 5.0 v LIB Margin has been re-estimated for this publication as GRN 0.4 v ALP
Bankstown ALP 10.3 ALP 10.6
Barwon NAT 32.0 NAT 25.8
Bathurst NAT 23.7 NAT 23.7
Baulkham Hills LIB 26.4 LIB 28.3
Bega LIB 18.6 LIB 18.5
Blacktown ALP 3.7 ALP 4.1
Blue Mountains LIB 4.7 LIB 5.4
Burrinjuck NAT 31.1 (abolished) National MP Katrina Hodgkinson contested the new seat of Cootamundra.
Cabramatta ALP 2.1 ALP 1.9
Camden LIB 18.9 LIB 22.8
Campbelltown LIB 3.4 LIB 6.8
Canterbury ALP 8.3 ALP 7.4
Castle Hill LIB 30.8 LIB 34.7 Contested by Hawkesbury MP Ray Williams with Castle Hill MP Dominic Perrottet contesting Hawkesbury
Cessnock ALP 4.4 ALP 3.9
Charlestown LIB 9.9 LIB 9.2 Won by the Labor Party with a margin of 20.8% at an October 2014 by-election. The Liberal Party did not contest the by-election.
Clarence NAT 31.4 NAT 31.9 Seat retained by the National Party at a November 2011 by-election.
Coffs Harbour NAT 27.2 NAT 27.3
Coogee LIB 8.2 LIB 8.3
Cootamundra (new seat) NAT 30.3 Contested by Burrinjuck MP Katrina Hodgkinson.
Cronulla LIB 25.5 LIB 24.8
Davidson LIB 36.5 LIB 36.2
Drummoyne LIB 16.7 LIB 17.1
Dubbo NAT 33.9 NAT 31.3
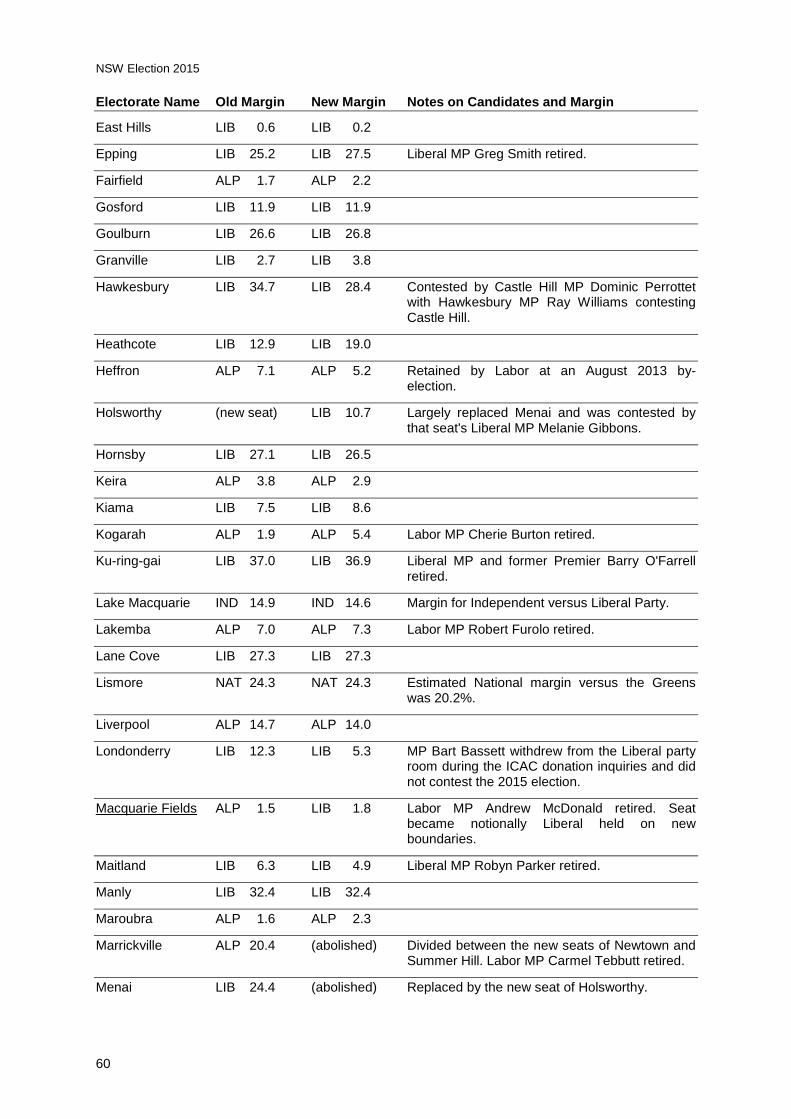
NSW Election 2015
60
Electorate Name Old Margin New Margin Notes on Candidates and Margin
East Hills LIB 0.6 LIB 0.2
Epping LIB 25.2 LIB 27.5 Liberal MP Greg Smith retired.
Fairfield ALP 1.7 ALP 2.2
Gosford LIB 11.9 LIB 11.9
Goulburn LIB 26.6 LIB 26.8
Granville LIB 2.7 LIB 3.8
Hawkesbury LIB 34.7 LIB 28.4 Contested by Castle Hill MP Dominic Perrottet with Hawkesbury MP Ray Williams contesting Castle Hill.
Heathcote LIB 12.9 LIB 19.0
Heffron ALP 7.1 ALP 5.2 Retained by Labor at an August 2013 by-election.
Holsworthy (new seat) LIB 10.7 Largely replaced Menai and was contested by that seat's Liberal MP Melanie Gibbons.
Hornsby LIB 27.1 LIB 26.5
Keira ALP 3.8 ALP 2.9
Kiama LIB 7.5 LIB 8.6
Kogarah ALP 1.9 ALP 5.4 Labor MP Cherie Burton retired.
Ku-ring-gai LIB 37.0 LIB 36.9 Liberal MP and former Premier Barry O'Farrell retired.
Lake Macquarie IND 14.9 IND 14.6 Margin for Independent versus Liberal Party.
Lakemba ALP 7.0 ALP 7.3 Labor MP Robert Furolo retired.
Lane Cove LIB 27.3 LIB 27.3
Lismore NAT 24.3 NAT 24.3 Estimated National margin versus the Greens was 20.2%.
Liverpool ALP 14.7 ALP 14.0
Londonderry LIB 12.3 LIB 5.3 MP Bart Bassett withdrew from the Liberal party room during the ICAC donation inquiries and did not contest the 2015 election.
Macquarie Fields ALP 1.5 LIB 1.8 Labor MP Andrew McDonald retired. Seat became notionally Liberal held on new boundaries.
Maitland LIB 6.3 LIB 4.9 Liberal MP Robyn Parker retired.
Manly LIB 32.4 LIB 32.4
Maroubra ALP 1.6 ALP 2.3
Marrickville ALP 20.4 (abolished) Divided between the new seats of Newtown and Summer Hill. Labor MP Carmel Tebbutt retired.
Menai LIB 24.4 (abolished) Replaced by the new seat of Holsworthy.

NSW Election 2015
61
Electorate Name Old Margin New Margin Notes on Candidates and Margin
Miranda LIB 21.0 LIB 23.0 Gained for Labor by former MP Barry Collier at a 2013 by-election. Collier did not contest the 2015 election.
Monaro NAT 2.1 NAT 2.0 Was contested by Labor MLC Steve Whan.
Mount Druitt ALP 6.7 ALP 6.0 Labor MP Richard Amery retired.
Mulgoa LIB 12.0 LIB 12.4
Murray (new seat) NAT 30.9 Contested by National MP for Murrumbidgee Adrian Piccoli.
Murray-Darling NAT 27.2 (abolished) National MP John Williams unsuccessfully contested the Legislative Council.
Murrumbidgee NAT 27.9 (abolished) See Murray.
Myall Lakes NAT 28.6 NAT 28.6
Newcastle LIB 2.6 LIB 2.5 Won by the Labor Party with a margin of 8.7% at an October 2014 by-election. The Liberal Party did not contest the by-election.
Newtown (new seat) GRN 4.4 New notionally Green-held seat with no sitting member. Contested unsuccessfully by Labor MLC Penny Sharpe.
North Shore LIB 30.3 NAT 30.4
Nthn Tablelands NAT 26.1 NAT 27.6 Won by Independent Richard Torbay in 2013, Northern Tablelands was gained by the National Party at a 2013 by-election.
Oatley LIB 0.5 LIB 3.8
Orange NAT 24.2 NAT 27.1
Oxley NAT 29.1 NAT 28.8 National MP and former Leader Andrew Stoner retired.
Parramatta LIB 12.1 LIB 12.5
Penrith LIB 16.3 LIB 16.1
Pittwater LIB 34.5 LIB 34.5
Port Macquarie NAT 28.7 NAT 28.8
Port Stephens LIB 12.4 LIB 14.7 MP Craig Baumann withdrew from the Liberal party room during the ICAC donation inquiries and did not contest the 2015 election.
Prospect (new seat) LIB 1.1 Contested by Smithfield Liberal MP Andrew Rohan.
Riverstone LIB 20.2 LIB 20.1
Rockdale LIB 3.6 LIB 3.6
Ryde LIB 25.7 LIB 25.2
Seven Hills (new seat) LIB 8.8 Largely replaced the abolished Labor seat of Toongabbie.

NSW Election 2015
62
Electorate Name Old Margin New Margin Notes on Candidates and Margin
Shellharbour ALP 8.6 ALP 7.8
Smithfield LIB 4.8 (abolished) See Prospect.
South Coast LIB 20.4 LIB 20.1
Strathfield LIB 4.4 LIB 6.4
Summer Hill (new seat) ALP 12.7 New seat with no sitting member. (See Marrickville)
Swansea LIB 1.1 LIB 0.3 MP Garry Edwards withdrew from the Liberal party room during the ICAC donation inquiries. He contested the 2015 election as an Independent.
Sydney IND 3.1 IND 0.3 Following the retirement of former MP Clover Moore, fellow Independent Alex Greenwich won the seat with a margin of 13.7% at an October 2012 by-election.
Tamworth NAT 30.6 NAT 30.7 The National margin versus Independent Peter Draper was 7.8% at the 2011 election and an estimated 6.8% on the new boundaries.
Terrigal LIB 24.1 LIB 23.6 MP Chris Hartcher withdrew from the Liberal party room during the ICAC donation inquiries and did not contest the 2015 election.
The Entrance LIB 12.5 LIB 11.8 MP Chris Spence withdrew from the Liberal party room during the ICAC donation inquiries and did not contest the 2015 election.
Toongabbie ALP 0.3 (abolished) See Seven Hills. Labor MP and former Premier Nathan Rees retired.
Tweed NAT 21.7 NAT 21.7
Upper Hunter NAT 23.3 NAT 23.0 National MP and former Leader George Souris retired.
Vaucluse LIB 31.4 LIB 31.4
Wagga Wagga LIB 27.8 LIB 27.8
Wakehurst LIB 30.5 LIB 30.5
Wallsend ALP 6.6 ALP 6.3
Willoughby LIB 30.8 LIB 30.8
Wollondilly LIB 14.7 LIB 21.6
Wollongong ALP 8.9 ALP 9.3
Wyong LIB 2.6 LIB 4.6 MP Darren Webber withdrew from the Liberal caucus during the ICAC donation inquiries and did not contest the 2015 election.
Underlining indicates seats changing party status on the new boundaries.

NSW Election 2015
63
New South Wales Election Results 1947-2011 Legislative Assembly: Percentage Vote By Party 1947-2011
Election ALP LIB NAT DLP DEM CDP GRN ONP OTH
1947 45.9 30.5 10.2 .. .. .. .. .. 13.4 1950 46.7 37.5 9.0 .. .. .. .. .. 6.8 1953 55.0 27.9 11.6 .. .. .. .. .. 5.4 1956 47.2 36.1 10.2 .. .. .. .. .. 6.5 1959 49.1 35.4 8.4 1.3 .. .. .. .. 5.8 1962 48.6 34.9 9.4 1.5 .. .. .. .. 5.7 1965 43.3 39.6 10.2 2.1 .. .. .. .. 4.8 1968 43.1 38.5 10.6 2.3 .. .. .. .. 5.5 1971 45.0 36.1 8.6 3.2 .. .. .. .. 7.1 1973 42.9 33.8 10.5 6.0 .. .. .. .. 6.8 1976 49.8 36.3 10.0 .. .. .. .. .. 3.9 1978 57.8 27.0 9.9 .. 2.6 .. .. .. 2.7 1981 55.7 27.6 11.2 .. 2.5 .. .. .. 2.9 1984 48.8 32.2 10.8 .. 2.8 .. .. .. 5.4 1988 38.5 35.8 13.7 .. 1.8 0.4 .. .. 9.7 1991 39.1 34.2 10.5 .. 5.4 1.2 0.5 .. 9.2 1995 41.3 32.8 11.1 .. 2.8 1.4 2.6 .. 7.9 1999 42.2 24.8 8.9 .. 3.3 1.5 3.9 7.5 7.9 2003 42.7 24.7 9.6 .. 0.9 1.7 8.3 1.3 10.8 2007 39.0 26.9 10.1 .. 0.5 2.5 9.0 .. 12.1 2011 25.6 38.6 12.6 .. .. 3.1 10.3 .. 9.9 2015 34.1 35.1 10.5 .. .. 3.2 10.3 .. 6.8
Note: National Party known as the Country Party until 1981. Christian Democratic Party known as Call to
Australia until 1995. Labor total includes Country Labor.
Legislative Assembly: Seats Won by Party
Election ALP LIB NAT DLP GRN OTH Total
1947 52 19 15 .. .. 4 90 1950 46 29 17 .. .. 2 94 1953 57 22 14 .. .. 1 94 1956 50 27 15 .. .. 2 94 1959 49 28 16 .. .. 1 94 1962 54 25 14 .. .. 1 94 1965 45 31 16 .. .. 2 94 1968 39 36 17 .. .. 2 94 1971 45 32 17 .. .. 2 96 1973 44 34 18 1 .. 2 99 1976 50 30 18 .. .. 1 99 1978 63 18 17 .. .. 1 99 1981 69 14 14 .. .. 2 99 1984 58 22 15 .. .. 4 99 1988 43 39 20 .. .. 7 109 1991 46 32 17 .. .. 4 99 1995 50 29 17 .. .. 3 99 1999 55 20 13 .. .. 5 93 2003 55 20 12 .. .. 6 93 2007 52 22 13 .. .. 6 93 2011 20 51 18 .. 1 3 93 2015 34 37 17 .. 3 2 93
Note: Underlining indicates the party/parties that formed government after each election.

NSW Election 2015
64
Legislative Council: Percentage Votes by Party 1978-2011
ALP LIB/NAT DEM CDP GRN SFP ONP Others Informal
1978 54.9 36.3 2.8 .. .. .. .. 6.0 4.1 1981 51.8 33.8 4.0 9.1 .. .. .. 1.3 6.8 1984 46.9 42.6 3.2 6.1 .. .. .. 1.2 6.7 1988 37.5 46.1 2.7 5.7 1.6 .. .. 6.3 8.1 1991 37.3 45.3 6.7 3.6 3.3 .. .. 3.6 5.7 1995 35.3 38.5 3.2 3.0 3.7 2.8 .. 13.5 6.1 1999 37.3 27.4 4.0 3.2 2.9 1.7 6.3 17.2 7.2 2003 43.5 33.3 1.6 3.0 8.6 2.0 1.5 6.5 5.3 2007 39.1 34.2 1.8 4.4 9.1 2.8 .. 8.6 6.1 2011 23.7 47.7 0.8 3.1 11.1 3.7 .. 9.9 5.3 2015 31.1 42.6 0.5 2.9 9.9 3.9 .. 9.0 5.6
Note: National Party known as the Country Party until 1981. The Christian Democratic Party (CDP) known as
Call to Australia until 1995. Shooters Party re-named the Shooters and Fishers Party at the 2011 election.
Legislative Council: Seats won by Party 1978-2011
ALP LIB/NAT DEM CDP GRN SP ONP Others Elected
1978 9 6 .. .. .. .. .. .. 15 1981 8 5 1 1 .. .. .. .. 15 1984 7 7 .. 1 .. .. .. .. 15 1988 6 7 1 1 .. .. .. .. 15 1991 6 7 1 1 .. .. .. .. 15 1995 8 8 1 1 1 1 .. 1 21 1999 8 6 1 1 1 .. 1 3 21 2003 10 7 .. 1 2 1 .. .. 21 2007 9 8 .. 1 2 1 .. .. 21 2011 5 11 .. 1 3 1 .. .. 21 2015 7 9 .. 1 2 1 .. 1 21
Composition of the Legislative Council by Party 1978-2011
ALP LIB/NAT DEM CDP GRN SP ONP Others Seats
1978-81 23 20 .. .. .. .. .. .. 43 1981-84 24 18 1 1 .. .. .. .. 44 1984-88 24 18 1 2 .. .. .. .. 45 1988-91 21 19 2 3 .. .. .. .. 45 1991-95 18 20 2 2 .. .. .. .. 42 1995-99 17 18 2 2 1 1 .. 1 42 1999-2003 16 14 2 2 2 1 1 4 42 2003-07 18 13 1 2 3 1 1 3 42 2007-11 19 15 .. 2 4 2 .. .. 42 2011-15 14 19 .. 2 5 2 .. .. 42 2015-19 12 20 .. 2 5 2 .. 1 42
Note: Composition based on results at elections and does not take account of resignations and changes of party
by elected members between elections.
Candidates and Groups contesting Legislative Council elections 1978-2011
Election 1978 1981 1984 1988 1991
Vacancies 15 15 15 15 15 Groups 8 9 8 13 12 Candidates 46 48 43 56 54
Election 1995 1999 2003 2007 2011 2015
Vacancies 21 21 21 21 21 21 Groups 28 81 16 20 17 25 Candidates 99 264 284 333 311 394
Note: Groups total includes an ‘Ungrouped’ column. Three groups at the 2015 election did not have an 'above
the line' voting box.