2015 hypertext-election prediction
TRANSCRIPT

Twitter-based election prediction in the developing worldNugroho Dwi Prasetyo & Claudia Hauff

Twitter-based election polling is a cheap alternative to traditional “offline” polls.
Twitter-based election polling should achieve a prediction accuracy similar to traditional polls.
millions of potential voters inferred votes biases
The what & why

@flickr:misteraitch
“No, you cannot predict elections with Twitter.” D. Gayo-Avello. Internet Computing, IEEE 16.6 (2012): 91-94.

@flickr:misteraitch
“No, you cannot predict elections with Twitter.” D. Gayo-Avello. Internet Computing, IEEE 16.6 (2012): 91-94.
That hasn’t stopped people from trying!

@flickr:practicalowl
Germany Federal Count tweets & hashtags 5 weeks6 party names 1.7%
Singapore Presidential Count tweets + sentiment 1 week4 candidate names 6.1%
USA Presidential Count tweets + sentiment 6 months2 candidate names 11.6%
Ireland General Count tweets + sentiment 3 weeks5 party names +
election hashtag 3-6%
Netherlands Senate Count tweets 1 month12 Dutch words 1.3%
USA Presidential Count tweets 6 weeks2 N/A 1.7%
Germany Federal Count hashtags + sentiment 4 months6 party names +
election hashtags N/A
USA, France Presidential sentiment 2 months2 candidate names + election hashtag N/A
USA Republican nomination
Count tweets + sentiment 1 year7 candidate names N/A
Venezuela, Paraguay, Ecuador
Presidential Count tweets + users 7 months
232
candidate names and aliases
0.1%-19%

So far …Twitter-based predictions lack behind traditional polls.
Most works focus on elections in the developed world.
Traditional polls are accurate.
Traditional polls are conducted often.

So far …Twitter-based predictions lack behind traditional polls.
Most works focus on elections in the developed world.
What do Twitter-based methods add?

In the developing world
… traditional polls are less likely to be reliable.
… the demographic bias of Twitter users is high.
4.08%3.45%11.75%
4.21%
12.24%
5.64%
6.25%1.36%
2.69%
1.19%
7.02%
4.20%
8.84%0.98%
3.96%
3.13%
4.24%1.15%
0.87%11.49%
Mean Absolute Error of 20 traditional polls conducted in the run-up to the 2014 Indonesian presidential election

A detailed analysis of all major factors of Twitter-based election forecasting with a special emphasis on de-
biasing through “offline” data.
An in-depth comparison of 20 traditional polls and Twitter-based forecasts for the 2014 Indonesian
presidential election.
Our contributions
@flickr:carbonnyc

Approach

Processing pipeline(1) Data collection
election type data access duration keywords
(3) Data de-biasingage gender location
(2) Data filteringspam organisations geo-location
(4) Election predictioncandidate mentions one vote per user tweet sentiment

The ground truth
election outcome&
traditional polls
predicted vote %
election vote %#candidates

Use case &
data
@flickr:rh2ox

2014 Indonesian presidential election
Joko Widodo vs. Prabowo Subianto
Widodo won 53.15% of the votes.
Widodo won in 23 of the 33 provinces.
Widodo was supported by the opposition.
July 9, 2014

Gathered tweets
Crawling period
#Electoral tweets
Max. tweets / day
#Users
Max. active users / day
April 15 - July 8, 2014
7,020,228
375,064
490,270
148,135
Manually curated keyword list (updated daily); only tweets geo-located in Indonesia are included.
POLLDATA

Gathered tweets II
#Users
Most recent 100 tweets per user. Not used for prediction purposes.
USERDATA
Crawling period July 25 - 30, 2014
#Tweets ~42,000,000
490,270

Insights into data
@flickr:edith_soto

Is spam a problem?
7.4% are spam users
2.1% are “slacktivists”
3.8% are non-personal users
Based on a manual classification of 600 randomly selected users in USERDATA

How large is the bias?
Based on a manual classification of 600 randomly selected users in USERDATA
0%
20%
40%
60%
80%
Female Male
Twitter Population
gender
0%
20%
40%
60%
80%
0-19 20-49 50+
Twitter Population
age

How large is the bias?
0%
20%
40%
60%
80%
Female Male
Twitter Population
gender
0%
20%
40%
60%
80%
0-19 20-49 50+
Twitter Population
age
Automatic classification of POLLDATA.
age gender

How large is the bias?
Based on reserve geo-coding & population data for Indonesia.
location
JakartaInternet penetration rate: 17%
location

Results
@flickr:nathanmac87

From tweets to users
tweet count 56.45% 3.3% +7 23/3343.55% -13 0.27
Widodo
Subianto
MAEtraditional
pollsprovince level
correct min. MAE
26.09
max. MAE
user count 54.45% 1.3% +4 24/3345.55% -16 0.05 25.01
On the national level, “one user one vote” outperforms tweet-based predictions (confirming prior works).
On the province level the changes are miniscule.
our baselines

Keyword selectionall keywords
candidate name
5 keywords
Simply using more keywords does not always lead to better results.

Location de-biasing
tweet count 55.14% 2.0% +544.86% -15
Widodo
Subianto
MAEtraditional
polls
user count 54.26% 1.1% +245.74% -18
Decreasing the influence of tweets from overrepresented locations in the dataset improves the prediction.

Gender de-biasing
tweet count 56.36% 3.2% +7 21/3343.64% -13 0.33
Widodo
Subianto
MAEtraditional
pollsprovince level
correct min. MAE
28.05
max. MAE
user count 54.89% 1.7% +5 23/3345.11% -15 0.10 26.72
Correcting for gender biases degrades the prediction accuracy on the national & province level.

Impact of sentiment
tweet count 53.98% 0.8% +046.02% -20
Widodo
Subianto
MAEtraditional
pollsprovince level
correct min. MAE max. MAE
user count 54.02% 0.9% +045.98% -20
On the national level, sentiment yields the best forecast.
tweet count 50.67% 2.5% +549.33% -15
user count 53.77% 0.6% +046.23% -20
14/33 0.01 54.90
19/33 0.26 26.51
14/33 0.01 49.79
19/33 0.01 26.40
POS
POS+
NEG
The impact on the province level prediction is negative.
More than 700 languages
are spoken in Indonesia
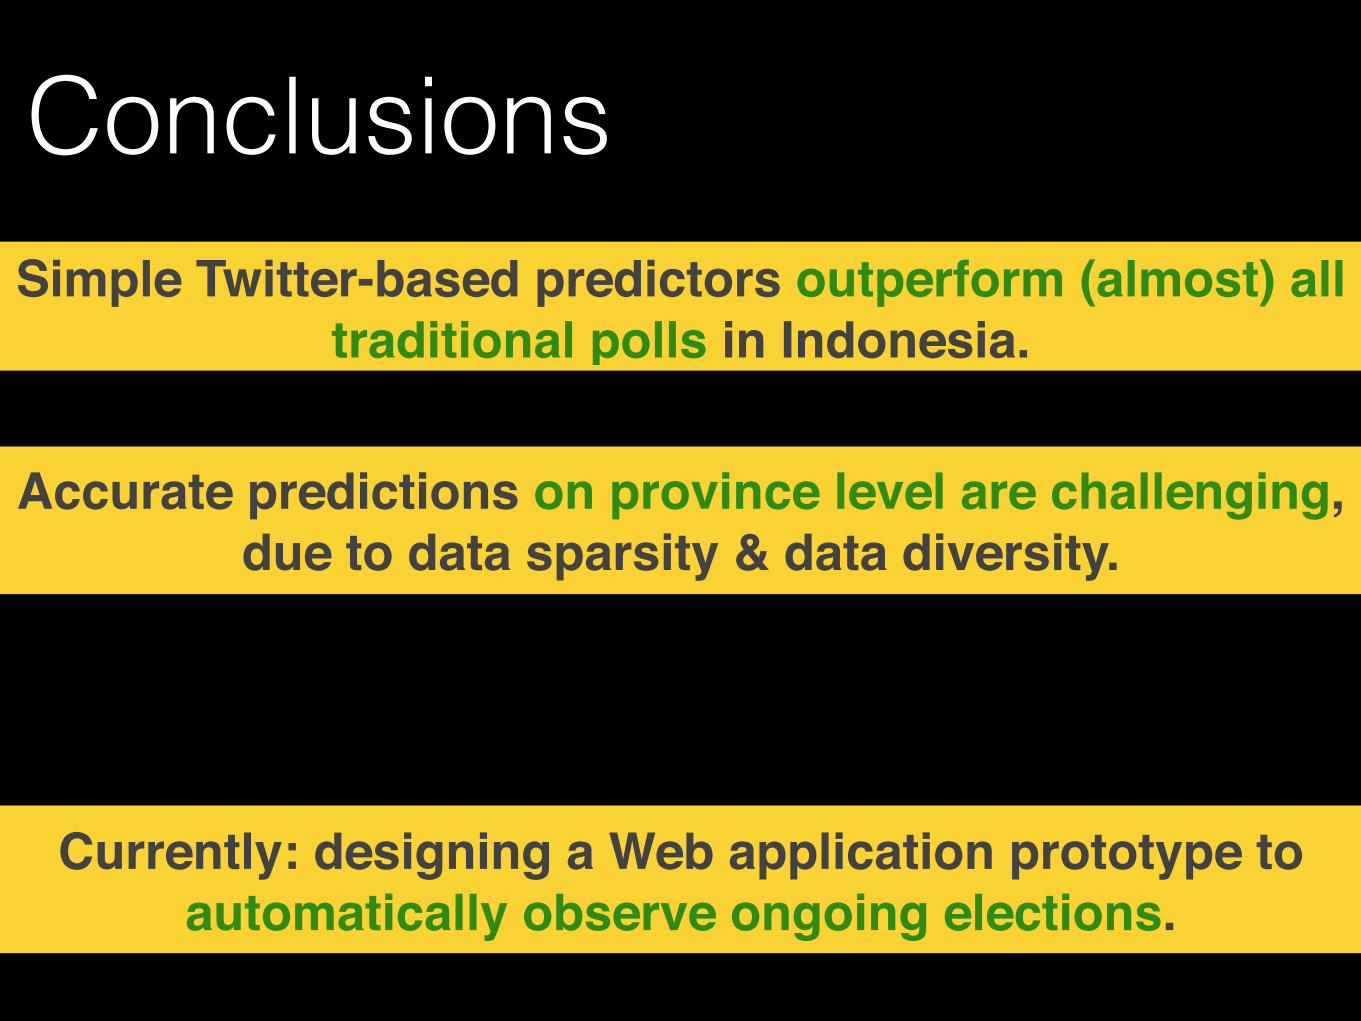
ConclusionsSimple Twitter-based predictors outperform (almost) all
traditional polls in Indonesia.
Accurate predictions on province level are challenging, due to data sparsity & data diversity.
Currently: designing a Web application prototype to automatically observe ongoing elections.