2015 middle east / africa salary survey - ima · pdf file2015 iddle ast/ria alar ure 2 about...
TRANSCRIPT

The Association ofAccountants and Financial Professionals in Business
ima
2015 Middle East / Africa Salary Survey

22015 Middle East/Africa Salary Survey www.imanet.org/salary_survey
About IMA®
IMA, the association of accountants and financial
professionals in business, is one of the largest and
most respected associations focused exclusively on
advancing the management accounting profession.
Globally, IMA supports the profession through research,
the CMA® (Certified Management Accountant) program,
continuing education, networking, and advocacy
of the highest ethical business practices. IMA has a
global network of more than 80,000 members in 140
countries and 300 professional and student chapters.
Headquartered in Montvale, N.J., USA, IMA provides
localized services through its four global regions:
The Americas, Asia/Pacific, Europe, and Middle East/
Africa. For more information about IMA, please visit
www.imanet.org.
© August 2016Institute of Management Accountants10 Paragon Drive, Suite 1Montvale, NJ, 07645www.imanet.org/thought_leadership
2015 Middle East/Africa Salary Survey

32015 Middle East/Africa Salary Survey www.imanet.org/salary_survey
About the AuthorKip Krumwiede, CMA, CPA, Ph.D., is the director of
research for IMA. Kip received his Master of Accounting
degree from Brigham Young University and his Ph.D.
from the University of Tennessee. Prior to joining IMA,
Kip spent 18 years as a management accounting
professor at universities, including Brigham Young
University, Boise State University, and the University of
Richmond, and worked for two Fortune 500 companies
in a variety of positions. In addition, Kip has published
more than 20 articles in both practice and academic
journals. He can be reached at (201) 474-1732 or
2015 Middle East/Africa Salary Survey
For many years, IMA® (Institute of Management Accountants) has conducted the very popular salary survey of its members around the world, enabling its members to compare their compensation to others, assess the value of education and certification, and more. The global report presents high-level results from this survey and compares compensation levels and job satisfaction across the globe. This is the second year IMA conducted a single global salary survey, making global trends easier to track and enhancing regional comparison. Additionally, we also look at other factors that contribute to job satisfaction, such as hours worked, opportunity for advancement, and work-life balance. Using the survey data, IMA is also able to provide country- and region-specific reports, such as this report for respondents in the Middle East/Africa. All the reports will be posted on IMA’s Thought Leadership website at www.imanet.org/salary_survey.
2015 Global Salary Survey

42015 Middle East/Africa Salary Survey www.imanet.org/salary_survey
IMA 2015 Salary Survey: Middle East/AfricaFor the second consecutive year, IMA has conducted a single,
combined global salary survey of its members. This report examines
in detail the responses of members located in the Middle East/Africa
(MEA) region. Not only does this analysis include comparisons to last
year’s survey results, but it also incorporates the results from previous
salary surveys that were focused only on MEA members. Key findings
for MEA respondents in 2015 include:
• Overall, the median base salary for IMA members in the MEA
region is highest in the United Arab Emirates (UAE), and the
median total compensation is highest in the Kingdom of Saudi
Arabia (KSA).
• Women in the 20-29 age group report higher overall median
compensation than men, but a gender pay gap continues to
exist in the older age ranges.
• Fifty-eight percent of the respondents received raises in the past year. The average raise
was 15%. Seventy-five percent of respondents are expecting raises in the coming year. The
raises in this year’s survey are more modest compared to last year.
• The average work week reported this year is 45.9 with a median of 45.0 hours, which is
about the global average.
• About half of the respondents are satisfied with their jobs. The most important factors
overall to job satisfaction in MEA are opportunity for advancement and salary.
• The number of respondents with the CMA® (Certified Management Accountant) credential
increased from 44% last year to 50% this year. CMAs in MEA earn 30% more in median
salary and 33% more in median total compensation than their non-CMA counterparts.
That’s about $10,000 to $12,000 more per year.
Respondent Demographics Table 1 presents the demographic characteristics of the survey respondents. Compared with
respondents globally, MEA members are slightly younger and more likely to be male (86%).
Nearly all (99%) possess at least a baccalaureate degree, and 33% have an advanced degree.
Compared to last year, there is a slightly higher concentration of respondents in senior
management positions and fewer in lower management positions. They have spent about the
same number of years in their field (10) and with their employer (four) as respondents globally.
Overall, 50% are CMAs, which is a significant increase over last year’s 44% and about the same
percentage as respondents globally.
In October-November 2015, survey invitations were sent to 9,051 IMA members in the Middle East/Africa (MEA) region. For the purposes of the salary results, we considered only respondents who indicated that they were either full-time employees or self-employed and included salary information. The survey was completed by 782 members (8.6% response rate). This report provides a summary of those responses.
How We Conducted the Survey

52015 Middle East/Africa Salary Survey www.imanet.org/salary_survey
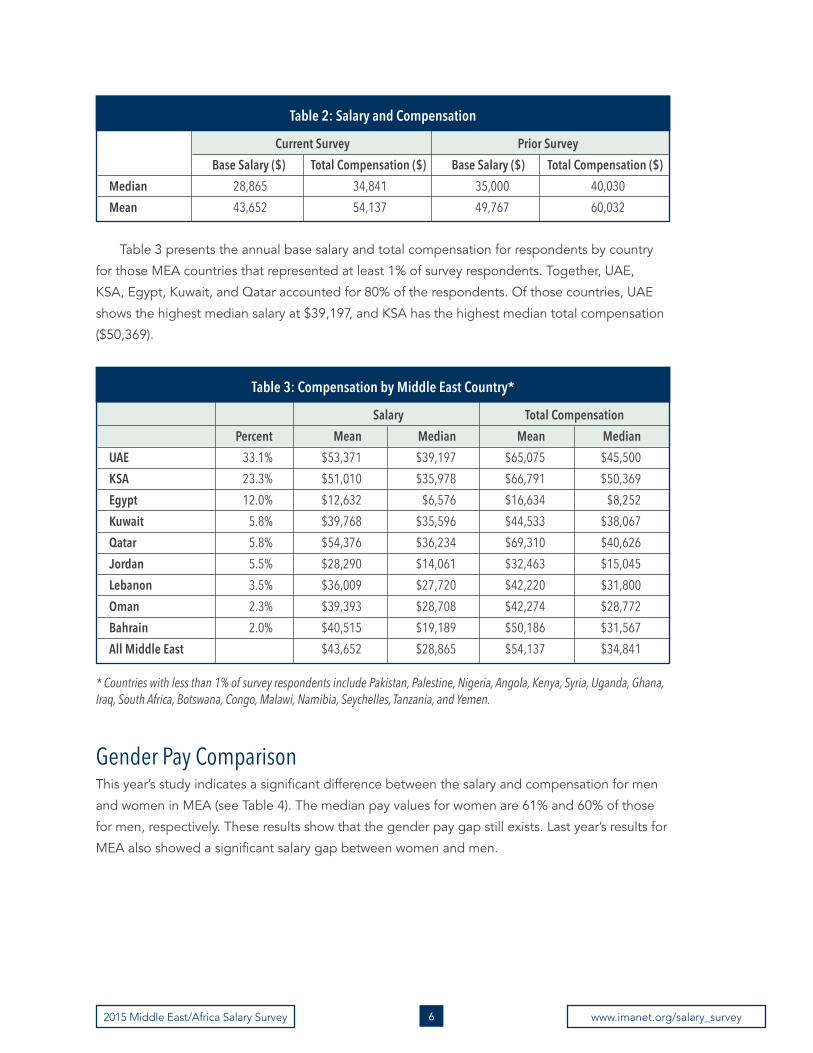
Salary Results The mean base salary for IMA members in MEA is $43,652, and the median salary is $28,865.1
Mean total compensation (salary and additional compensation) is $54,137, and median total
compensation is $34,841 (see Table 2). These results are down 13%-18% over last year, likely a
reflection of the sharp decline in the price of oil.
1 All compensation data is reported here in U.S. dollars. To convert to UAE dirham (AED), multiply the U.S. dollar amounts by the exchange rate prevalent at the time the survey was conducted (approximately 3.67 AED per U.S. dollar on average for the month of November 2015. For other currency exchange rates, see www.x-rates.com).
This Year Last Year GlobalGender
Female 14% 12% 35%Male 86% 88% 65%
AgeMean 36 35 39Median 35 34 37
DegreeBaccalaureate 99% 99% 96%Advanced 33% 34% 41%
Management LevelTop management 9% 10% 10%Senior management 30% 27% 23%Middle management 43% 43% 32%Lower management/entry level 16% 19% 28%Academic position in college/university 1% 1% 7%
Years of Experience (Median)Current position 3 5 3Current employer 4 5 4Years in field 10 11 11
CertificationCMA 50% 44% 53%CPA 9% 7% 15%
Table 1: Respondent Demographics
62015 Middle East/Africa Salary Survey www.imanet.org/salary_survey
Table 3 presents the annual base salary and total compensation for respondents by country
for those MEA countries that represented at least 1% of survey respondents. Together, UAE,
KSA, Egypt, Kuwait, and Qatar accounted for 80% of the respondents. Of those countries, UAE
shows the highest median salary at $39,197, and KSA has the highest median total compensation
($50,369).
Gender Pay Comparison This year’s study indicates a significant difference between the salary and compensation for men
and women in MEA (see Table 4). The median pay values for women are 61% and 60% of those
for men, respectively. These results show that the gender pay gap still exists. Last year’s results for
MEA also showed a significant salary gap between women and men.
Table 2: Salary and Compensation
Current Survey Prior Survey Base Salary ($) Total Compensation ($) Base Salary ($) Total Compensation ($)Median 28,865 34,841 35,000 40,030Mean 43,652 54,137 49,767 60,032
Salary Total Compensation Percent Mean Median Mean MedianUAE 33.1% $53,371 $39,197 $65,075 $45,500KSA 23.3% $51,010 $35,978 $66,791 $50,369Egypt 12.0% $12,632 $6,576 $16,634 $8,252Kuwait 5.8% $39,768 $35,596 $44,533 $38,067Qatar 5.8% $54,376 $36,234 $69,310 $40,626Jordan 5.5% $28,290 $14,061 $32,463 $15,045Lebanon 3.5% $36,009 $27,720 $42,220 $31,800Oman 2.3% $39,393 $28,708 $42,274 $28,772Bahrain 2.0% $40,515 $19,189 $50,186 $31,567All Middle East $43,652 $28,865 $54,137 $34,841
Table 3: Compensation by Middle East Country*
* Countries with less than 1% of survey respondents include Pakistan, Palestine, Nigeria, Angola, Kenya, Syria, Uganda, Ghana, Iraq, South Africa, Botswana, Congo, Malawi, Namibia, Seychelles, Tanzania, and Yemen.

72015 Middle East/Africa Salary Survey www.imanet.org/salary_survey
Traditionally, the gender pay gap has been narrower among younger respondents—those in
the early stages of their career. The median salaries and total compensation for women in MEA
are significantly higher than those of men in the 20-29 age range (see Table 5), with women
earning 55% and 44%, respectively, more than men. Last year, women’s median values in that age
group were 20% and 16% higher, respectively.
Unfortunately, women’s median salaries and compensation are lower than men’s in the 30-39
age range (82%) and considerably lower in the 40-49 age range (60% and 53%, respectively). The
gender pay gap in the latter age group is a bit worse than last year. It should be noted, however,
that here are only 16 women in this age group compared to 143 men, which can lead to more
variation in the women’s results. So these numbers should be used with extreme caution.
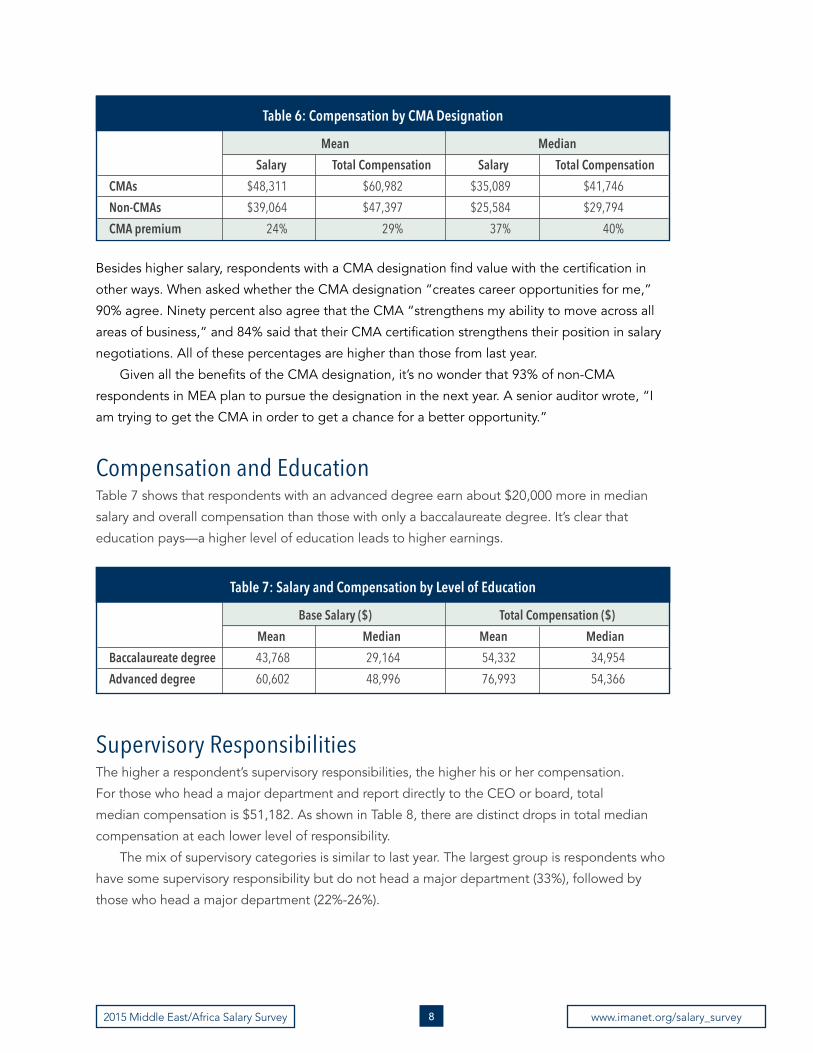
Compensation and CertificationAs is true throughout the world, CMAs in the MEA earn substantially more than their non-CMA
counterparts. CMAs in Middle East/Africa report a median salary of $35,089 and median total
compensation of $41,746, compared to $25,584 and $29,794, respectively, for non-CMAs. Thus,
members with the CMA designation earn about $10,000 (37%) more in salary and about $12,000
(40%) more in total compensation than non-CMAs (see Table 6). This is a significant increase over
last year’s premiums of 22% and 28%, respectively.
Age Range Base Salary Total Compensation Women Men Women % of Men Women Men Women % of Men20-29 $16,406 $10,576 155% $17,498 $12,126 144%30-39 $26,785 $32,664 82% $32,936 $39,975 82%40-49 $38,499 $63,960 60% $39,282 $74,620 53%* There were too few female respondents over the age of 50 to make a meaningful salary gap comparison.
Table 5: Women’s Median Compensation as a Percentage of Men’s*
Base Salary Total Compensation Mean Median Mean MedianWomen $26,256 $19,958 $31,757 $22,253 Men $46,730 $31,980 $58,024 $37,240 Women as a percentage of men 56% 61% 55% 60%
Table 4: Compensation by Gender
82015 Middle East/Africa Salary Survey www.imanet.org/salary_survey
Besides higher salary, respondents with a CMA designation find value with the certification in
other ways. When asked whether the CMA designation “creates career opportunities for me,”
90% agree. Ninety percent also agree that the CMA “strengthens my ability to move across all
areas of business,” and 84% said that their CMA certification strengthens their position in salary
negotiations. All of these percentages are higher than those from last year.
Given all the benefits of the CMA designation, it’s no wonder that 93% of non-CMA
respondents in MEA plan to pursue the designation in the next year. A senior auditor wrote, “I
am trying to get the CMA in order to get a chance for a better opportunity.”
Compensation and EducationTable 7 shows that respondents with an advanced degree earn about $20,000 more in median
salary and overall compensation than those with only a baccalaureate degree. It’s clear that
education pays—a higher level of education leads to higher earnings.
Supervisory ResponsibilitiesThe higher a respondent’s supervisory responsibilities, the higher his or her compensation.
For those who head a major department and report directly to the CEO or board, total
median compensation is $51,182. As shown in Table 8, there are distinct drops in total median
compensation at each lower level of responsibility.
The mix of supervisory categories is similar to last year. The largest group is respondents who
have some supervisory responsibility but do not head a major department (33%), followed by
those who head a major department (22%-26%).
Base Salary ($) Total Compensation ($) Mean Median Mean MedianBaccalaureate degree 43,768 29,164 54,332 34,954 Advanced degree 60,602 48,996 76,993 54,366
Table 7: Salary and Compensation by Level of Education
Table 6: Compensation by CMA Designation
Mean Median Salary Total Compensation Salary Total CompensationCMAs $48,311 $60,982 $35,089 $41,746Non-CMAs $39,064 $47,397 $25,584 $29,794CMA premium 24% 29% 37% 40%

92015 Middle East/Africa Salary Survey www.imanet.org/salary_survey
Responsibility AreaFigure 1 shows the median salaries and total compensation by area of responsibility (for
those areas with more than five respondents). Employees working in the areas of government
accounting, risk management, education, and general management are the highest paid (median
total compensation exceeding $60,000). After these areas, there is a big drop in compensation
for the other areas. Those working in cost accounting and public accounting are the lowest paid
(median total compensation of less than $20,000).
The highest median additional compensation is reported by those in general management
($12,000), followed by that in education ($11,764). Government accountants report the highest
median base salary but relatively low additional compensation ($5,754). The lowest median
additional compensation is reported by those in cost accounting ($2,427).
Head of a major department and reports directly to a CEO or board of directors
Head of a major department but does not report directly to a CEO or board of directors
Little or no supervisory responsibility and reports directly to a CEO or board of directors
Some supervisory responsibility but not head of a major department
No supervisory responsibility
Table 8: Supervisory Responsibilities
Age Base Salary Total Compensation Percentage of Respondents Mean Mean Median Mean Median This Year Last Year
38.8 $59,083 $46,018 $71,717 $51,182 26% 26%
38.2 $51,093 $38,108 $65,818 $45,076 22% 22%
32.0 $32,337 $26,131 $38,272 $35,000 7% 7%
33.6 $36,228 $25,529 $43,563 $30,221 33% 32%
30.9 $24,183 $14,686 $31,400 $19,249 12% 13%

102015 Middle East/Africa Salary Survey www.imanet.org/salary_survey
Salary IncreasesFifty-eight percent of MEA survey respondents received a raise in the past year. The average raise
was 15%, and the median raise was 10% (see Table 9). A larger percentage of respondents (75%)
expect a salary increase in the coming year, with the amounts of the expected increases similar
to those received this past year. This is illustrated in Figure 2, which is based on the values of the
right two columns of Table 9).
Table 9: Raises Received and Expected
Raise Percentage Received a Raise in the Past Year Expect a Raise in the Coming Year
At Least (%) Less Than (%) 1 5 8% 8% 5 10 17% 21% 10 15 13% 20% 15 20 7% 7% 20 25 6% 8% 25 50 7% 8% 50 100 0% 2% 100 >100 0% 1%
$90,000
$80,000
$70,000
$60,000
$50,000
$40,000
$30,000
$20,000
$10,000
$0
Figure 1: Median Total Compensation by Responsibility Area
Government Accounting
Risk Management
Education
General Management
Internal Auditing
Budgeting and PlanningFin
ance
Corporate Accounting
Information Systems
General Accounting
Cost Acco
unting
Public Acco
unting
n Additional compensation n Base salary

112015 Middle East/Africa Salary Survey www.imanet.org/salary_survey
Employee SatisfactionCompensation levels, while important, are only one factor contributing to employee satisfaction.
Other factors examined in this survey include the number of hours worked, job satisfaction, and
employee benefits.
Hours Worked
The average work week for MEA respondents is 45.9 hours (median 45.0 hours), which is almost
the same as the global average (46.0). When asked how their hours worked had changed in the
past year, 5% indicated a decrease in hours worked, 73% indicate their hours have stayed the
same, and 23% indicate they are working more hours.
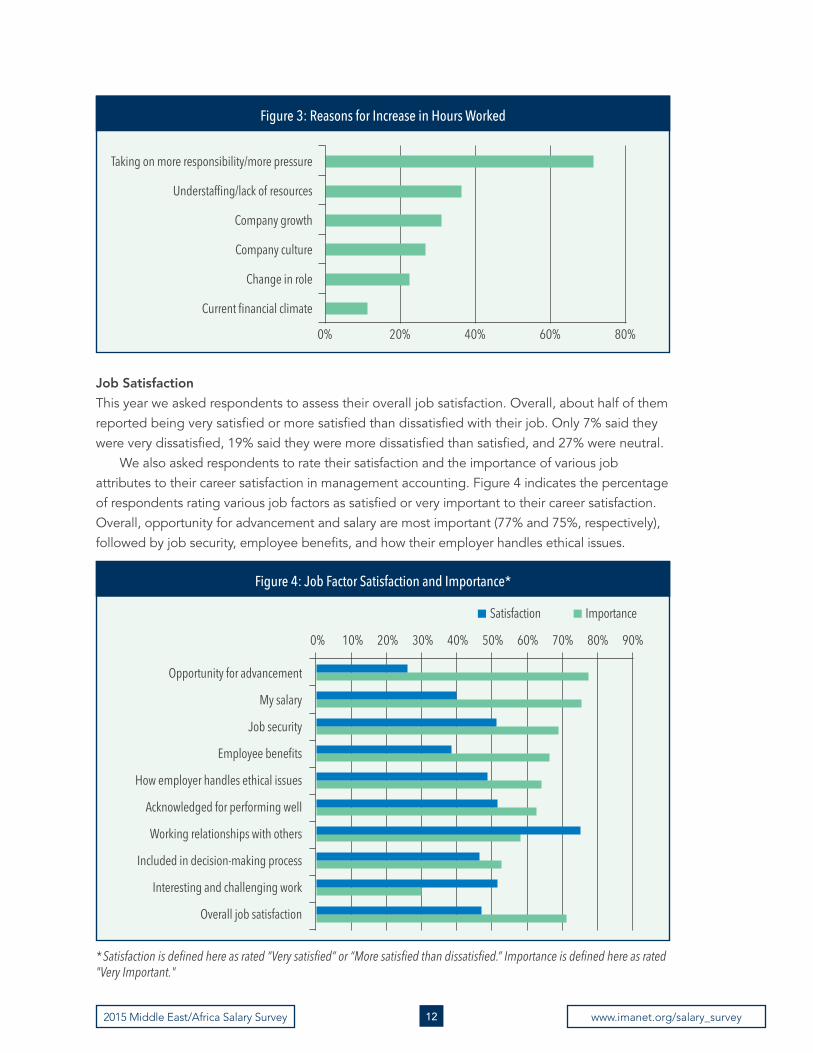
The reasons for working more hours varied, and respondents often cited multiple reasons.
Of those reporting an increase in hours worked, 72% identified taking on more responsibility/
more pressure on the job as contributing to their increased workload (see Figure 3).
Hours worked also varied somewhat by supervisory level. Those who are a head of major
departments or who have some supervisory responsibility have a median of 48.0 hours per week
(mean 46.4 hours). Those with little or no supervisory responsibility have a median of 40.0 hours
per week (mean 45.2 hours).
80%
70%
60%
50%
40%
30%
20%
10%
0%5 10 15 20 25 50 100 >100
Figure 2: Salary Raise Percentage: (Cumulative) Past Year vs. Next Year*
— Past year
— Next year
* The horizontal axis represents the percent raise while the vertical axis represents the percentage of respondents receiving or expecting that percent raise.
122015 Middle East/Africa Salary Survey www.imanet.org/salary_survey
Job Satisfaction
This year we asked respondents to assess their overall job satisfaction. Overall, about half of them reported being very satisfied or more satisfied than dissatisfied with their job. Only 7% said they were very dissatisfied, 19% said they were more dissatisfied than satisfied, and 27% were neutral.
We also asked respondents to rate their satisfaction and the importance of various job attributes to their career satisfaction in management accounting. Figure 4 indicates the percentage of respondents rating various job factors as satisfied or very important to their career satisfaction. Overall, opportunity for advancement and salary are most important (77% and 75%, respectively), followed by job security, employee benefits, and how their employer handles ethical issues.
Figure 3: Reasons for Increase in Hours Worked
0% 20% 40% 60% 80%
Taking on more responsibility/more pressure
Understaffing/lack of resources
Company growth
Company culture
Change in role
Current financial climate
Figure 4: Job Factor Satisfaction and Importance*
0% 10% 20% 30% 40% 50% 60% 70% 80% 90%
Opportunity for advancement
My salary
Job security
Employee benefits
How employer handles ethical issues
Acknowledged for performing well
Working relationships with others
Included in decision-making process
Interesting and challenging work
Overall job satisfaction
n Satisfaction n Importance
* Satisfaction is defined here as rated “Very satisfied” or “More satisfied than dissatisfied.” Importance is defined here as rated "Very Important."

132015 Middle East/Africa Salary Survey www.imanet.org/salary_survey
Respondents rated their satisfaction with opportunities for advancement as lowest overall.
Only 26% said they were mostly or very satisfied with their opportunities for advancement, while
40% were satisfied with their salary and 51% with their job security. They were most satisfied with
their working relationships with others (75%).
Although these results provide overall trends, it’s important to remember each individual has
his or her own unique needs and talents. For example, a group vice president commented, “More
than salary, it is the job content and the overall atmosphere that is important and keeps me in the
current organization. I have been fortunate enough to have been provided with the opportunity
to challenge a new area of work every couple of years or so within the finance field.”
Desire for Job Change
About 51% of survey respondents plan to look for another job in the short term, and 33% are
considering it. Last year’s survey found 57% looking to change jobs within a year and 26%
considering it. This continuing high percentage of job seekers reflects the dynamic nature of
the accounting profession in MEA. The two most commonly identified reasons for considering
a job move are improved salary (69%) and seeking a new career opportunity (64%). As shown in
Figure 5, the two other reasons commonly mentioned are an improved quality of life and better
employment opportunities.
Of those planning to look for another job, 35% are very confident and 48% somewhat
confident they will be able to find one in the next year.
0% 10% 20% 30% 40% 50% 60% 70% 80%
Improved salary
New career opportunity
Improved quality of life
Better employment opportunities
Experience a different culture
Work promotion
Improved employment conditions
Stronger economy
Friends and family
Take time off/travel
Internal company transfer
To learn a new language
Figure 5: Reasons for Considering a Job Change

142015 Middle East/Africa Salary Survey www.imanet.org/salary_survey
Employee Benefits
Historically, the most commonly received benefit has been healthcare or healthcare insurance.
This year, 84% of respondents report receiving this benefit (and another 15% desire it). As
illustrated in Figure 6, the other most common benefits are bonus (62%), company car (48%),
travel benefits (46%), mobile phone (42%), and life insurance (38%).
Figure 6 also shows the difference between benefits received vs. those identified as very to
extremely important. The biggest gap between benefits rated as important and those received
include pension benefits, share options, life insurance, and flexible hours.
Figure 6: Benefits Currently Received or Desired
0% 10% 20% 30% 40% 50% 60% 70% 80% 90%
n Currently receive this benefit n Very or extremely important
Healthcare/health insurance
Bonus
Company car/allowance
Travel benefits/allowance
Mobile phone
Life insurance
Pension
Flexible hours
Extra holiday
Payment of IMA dues
Working from home
iPad or tablet
Share/share options

152015 Middle East/Africa Salary Survey www.imanet.org/salary_survey
Final Thoughts The median base salary in the UAE and median total compensation reported by IMA members
in the KSA are the highest for Middle East/Africa countries. The majority of MEA respondents
received moderate raises this year, and about three-fourths expect similar increases in the coming
year. Overall, salaries and compensation in MEA are down 13%-18% compared to last year, likely
a reflection of the sharp decline in the price of oil.
Although the gender pay gap in base salary and total compensation continues to exist later in
their careers, the good news is it disappears for women in their 20s.
Respondents reported an average work week this year of 45.9 hours, which is about the
global average. About half of the respondents said they are satisfied with their jobs. Clearly
the most important factors overall to job satisfaction in MEA are opportunity for advancement
and salary, followed by job security, employee benefits, and how their employer handles ethical
issues. More than half of MEA respondents are considering a job change in the next year, citing
a desire for improved salaries, new career opportunities, and improved quality of life as primary
motivations.
The value of participation in the CMA program continues to be clear: The median salary for
CMAs is 37% more—and the median total compensation is 40% more—than that for non-CMAs
in the Middle East/Africa region. A lower-level manager commented, “I will be looking for new
employment soon, and I will use my CMA qualification to search for the position.”