2015 global logistics guide · traditional low-cost sourcing countries are becoming new consumption...
TRANSCRIPT

SPONSORED BY
March 2015 • Inbound Logistics 41
2015Global Logistics Guide
Inbound Logistics’ 11th annual Global Logistics Guide presents a transportation and logistics world atlas to help you identify and map continents and countries that require further exploration.

42 Inbound Logistics • March 2015
In one word, the world of 2015 is dynamic. Against a backdrop of social, economic, and political upheaval in the Middle East, Ukraine, Greece, Thailand, and parts of Africa, the spreading threat of terrorism, and the pervasive influence of technology and social media, global consumption patterns are changing. Entrenched worldviews have come unhinged as emerging economies mature and new ones take seed.
E-commerce is sweeping the globe en force and at pace. In its wake, consumer expectations for speed, service, economy, and availability are converging.
The world’s demographic shift is undeniable. By 2025, two-thirds of the global middle class will reside in Asia. Traditional low-cost sourcing countries are becoming new consumption markets, which presents a formidable challenge for manufacturers and retailers as they re-engineer their supply chains.
Consequently, supply chain design is fast becoming a core competency as U.S. consignees and shippers consider strategic sourcing initiatives, alternative trade routes, and new partnerships to best match supply to demand—all over the world.
To help you better understand these changing global dynamics, and map out locations for further exploration, Inbound Logistics’ 11th-annual Global Logistics Guide offers a transportation and logistics world atlas replete with need-to-know information.
IL identifies global hotspots as excelling in three key critical areas:
1. Transportation Infrastructure. The density and breadth of airport, port, and road infrastructure.
2. IT Competency. The progressiveness of information and communication technology investment and development as measured by The World Economic Forum’s Networked Readiness Index.
3. Business Culture. The strength and expertise of homegrown logistics talent, cultural and language similarities, government leadership, historical U.S. foreign direct investment outflows, and economic freedom. This index takes into account variables that might appeal to U.S. businesses, as well as pro-business sensibilities ranging from investment trends to future economic potential.
There are intangibles at play as well. Our X-Factor qualification considers other determinants such as political stability, labor availability, and foreign investment policy that may shade a company’s location decision one way or the other.
Our Global Logistics Guide offers a macro perspective of global regions to help you quantify and qualify expansion opportunities. We then break each area down with country-specific snapshots that identify strengths and weaknesses to help you align logistics and supply chain needs. If you have questions or comments about our methodology and selections, please email: [email protected]
ABOUT THE RANKINGS
Countries are ranked on three criteria: transportation infrastructure (T: 1–4 points), IT competency (I: 1–3 points), and business culture (B: 1–3 points). Points are totaled for all categories — taking into consideration X-Factor (X: plus or minus) points — to determine final ranking: 10 is highest, 3 is lowest.
Sources: U.S. Department of State; World Port Rankings, American Association of Port Authorities (AAPA); Airports Council International; World Economic Forum’s Growth Competitiveness Index; World Economic Forum’s Global Information Technology Report; Central Intelligence Agency’s World Fact Book; Bureau of Economic Analysis, U.S. Direct Investment Abroad; 2015 Index of Economic Freedom, The Heritage Foundation.

SPONSORED BY
March 2015 • Inbound Logistics 43
GDP: $1,825
EXPORTS: $459
IMPORTS: $471
FDI 2013: $368
Securing free trade agreements with the European Union and South Korea—Canada’s first with an Asian country—signals a more open trade policy.
CANADATOTAL RANK
8T I B X2 3 3 0
GDP: $1,327
EXPORTS: $371
IMPORTS: $371
FDI 2013: $102
X-FACTOR Cheaper energy and nearshoring continue to favor economic development. Government’s decision to open up the oil and gas industry will further foreign investment.
MEXICOTOTAL RANK
7T I B X2 1 3 1
GDP: $41
EXPORTS: $19
IMPORTS: $27
FDI 2013: $6
X-FACTOR With the Canal expansion imminent, the country is focused on building out port and logistics infrastructure to make it more attractive as an Americas distribution hub.
PANAMATOTAL RANK
7T I B X3 1 2 1
GDP: $2,190
EXPORTS: $245
IMPORTS: $241
FDI 2013: $78
Poor infrastructure, high logistics costs, and labyrinthine tax policies remain outstanding concerns.
BRAZILTOTAL RANK
5T I B X2 1 2 0
GDP: $282
EXPORTS: $78
IMPORTS: $76
FDI 2013: $41
The most open and IT-mature South American economy, Chile’s recent labor unrest has done little to unsettle steady 4-percent GDP growth.
CHILETOTAL RANK
6T I B X2 2 2 0
The AmericasChina’s competitive edge as a low-cost sourcing location is no longer
as dominant as it once was. In fact, Mexico has now surpassed China as a more competitive manufacturing location, as some recent studies suggest. When you consider distance to market and energy prices, the nearshoring reality has legs.
The energy renaissance in the Americas is an added incentive for U.S. companies looking to locate manufacturing closer to demand. While oil and natural gas exploration in Canada and the United States has been robust over the past few years, Mexico’s energy industry remains largely untapped. The government’s decision to invite more foreign investment and competition into the country will help expedite its oil and gas boom.
South America is a tale of two coastlines. On the Pacific side, Colombia, Chile, and Peru continue to shine; on the Atlantic seaboard, Venezuela, Brazil, and Argentina remain laggards. The commodity-rich continent, and countries where oil and gas production are important economic drivers (Colombia and Venezuela), will likely feel the pinch as price volatility endures.
Finally, as the Panama Canal’s expansion project nears completion, the race is on. Jamaica, Colombia, Puerto Rico, the Bahamas, and Panama are all looking to stake a claim as the next transshipment hub of the Americas.
GDP: $369
EXPORTS: $59
IMPORTS: $54
FDI 2013: $8
Dependence on oil, which accounts for more than half of all exports, is expected to take the steam out of Colombia’s reborn economic engine.
COLOMBIATOTAL RANK
5T I B X2 1 2 -1
FDI U.S. Foreign Direct Investment
T Transportation Infrastructure
I IT Competency
B Business Culture
X X-Factor All amounts in $US billions.

SPONSORED BY
44 Inbound Logistics • March 2015
GDP: $3,593
EXPORTS: $1,493
IMPORTS: $1,233
FDI 2013: $118
Germany remains one of the few bright spots in a struggling eurozone. A pedigree for manufacturing output is now equaled by strong domestic consumption, which is raising the tide on the continent.
GERMANYTOTAL RANK
9T I B X4 3 2 0
GDP: $2,739
EXPORTS: $570
IMPORTS: $640
FDI 2013: $78
A push for more liberalized economic policies and business-friendly laws is offset by entrenched pro-labor positions. That tension is a recurring hurdle for foreign investors.
FRANCETOTAL RANK
6T I B X3 2 1 0
EuropeThere’s no shortage of plot lines as the European
community endures a currency crisis amid threats of terrorism and Russia’s “uneasy diplomacy” in Ukraine. As the euro falls closer to parity with the U.S. dollar, and the European Central Bank considers quantitative easing to stimulate domestic consumption and private investment, the continent is on edge.
Even Switzerland, once an island of stability inside an otherwise chaotic regional economy, is starting to show signs of cracking. The Swiss franc is appreciating wildly and threatening to unsettle the country’s important export industries.
Germany remains a model of efficiency—and an example of how progressive labor policy can foster stability. Neighboring Poland also shows signs of becoming a future contributor to the European Union as a manufacturing hub. The Netherlands and Belgium remain FDI targets largely because of their transportation and logistics assets and pedigree.
But Europe’s economic recovery is being tested. As austerity measures feed social unrest and provocation in places such as Greece and Italy, countries are struggling to strike a balance between capitalistic ambition and entrenched entitlements. Talk of nearshoring is forcing the EU into some difficult debates over energy policy and labor reform.

March 2015 • Inbound Logistics 45
GDP: $801
EXPORTS: $551
IMPORTS: $478
FDI 2013: $723
Favorable tax treaties aside, the country attracts foreign investment because of its transportation assets—Rotterdam remains the top container port in Europe, and Amsterdam Schiphol is ranked third for airfreight tonnage.
NETHERLANDSTOTAL RANK
8T I B X3 3 2 0
GDP: $646
EXPORTS: $312
IMPORTS: $276
FDI 2013: $130
X-FACTOR Efforts to control Swiss franc valuation by pegging the currency to the euro have been abandoned. An uncapped and wildly appreciating currency is likely to have a negative impact on exports.
SWITZERLANDTOTAL RANK
7T I B X2 3 3 -1
GDP: $514
EXPORTS: $202
IMPORTS: $207
FDI 2013: $14
X-FACTOR Poland was the only EU country to avoid recession during the global crisis. Sound economic policies and a flexible exchange rate paved the way for the country to build a major manufacturing presence.
POLANDTOTAL RANK
5T I B X2 1 1 1
GDP: $822
EXPORTS: $168
IMPORTS: $243
FDI 2013: $5
X-FACTOR Turkey’s fortunes have reversed course quickly. Not long ago, the country was lauded as one of the MINT economies. Currency deflation is worrisome. Geopolitical stress and falling FDI are equal concerns.
TURKEYTOTAL RANK
3T I B X2 1 1 -1
GDP: $507
EXPORTS: $295
IMPORTS: $310
FDI 2013: $48
A diverse economy that has become a favored European distribution location for multinationals, Belgium has demonstrated positive GDP growth for seven consecutive quarters.
BELGIUMTOTAL RANK
7T I B X3 2 2 0
FDI U.S. Foreign Direct Investment
T Transportation Infrastructure
I IT Competency
B Business Culture
X X-Factor All amounts in $US billions.
SPONSORED BY
46 Inbound Logistics • March 2015
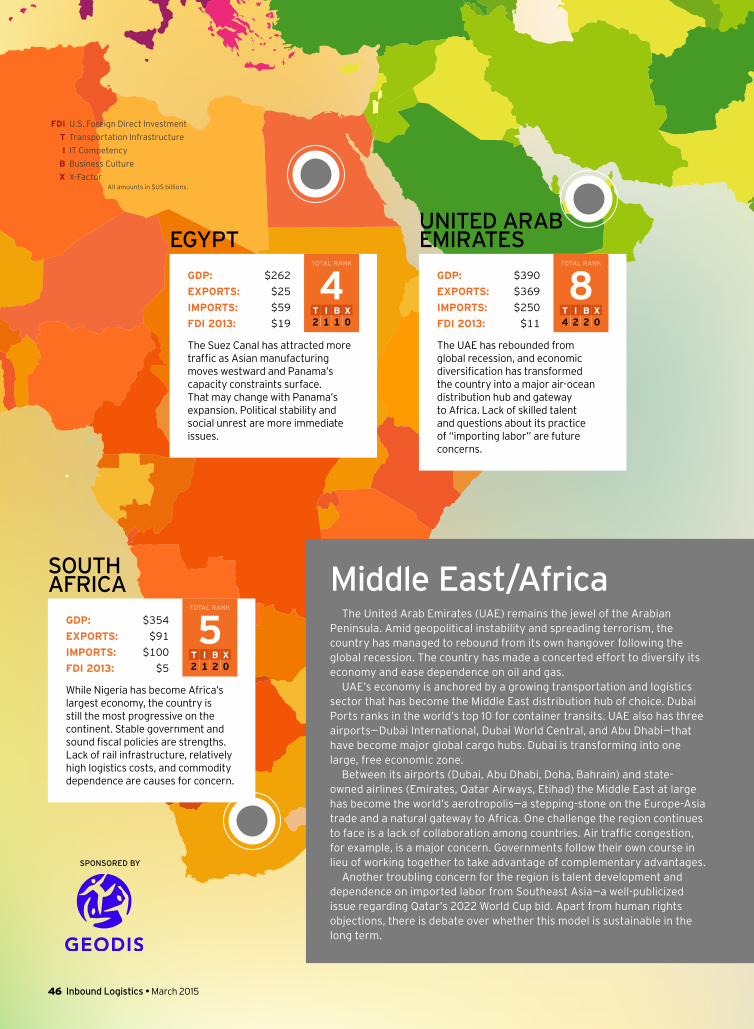
Middle East/AfricaThe United Arab Emirates (UAE) remains the jewel of the Arabian
Peninsula. Amid geopolitical instability and spreading terrorism, the country has managed to rebound from its own hangover following the global recession. The country has made a concerted effort to diversify its economy and ease dependence on oil and gas.
UAE’s economy is anchored by a growing transportation and logistics sector that has become the Middle East distribution hub of choice. Dubai Ports ranks in the world’s top 10 for container transits. UAE also has three airports—Dubai International, Dubai World Central, and Abu Dhabi—that have become major global cargo hubs. Dubai is transforming into one large, free economic zone.
Between its airports (Dubai, Abu Dhabi, Doha, Bahrain) and state-owned airlines (Emirates, Qatar Airways, Etihad) the Middle East at large has become the world’s aerotropolis—a stepping-stone on the Europe-Asia trade and a natural gateway to Africa. One challenge the region continues to face is a lack of collaboration among countries. Air traffic congestion, for example, is a major concern. Governments follow their own course in lieu of working together to take advantage of complementary advantages.
Another troubling concern for the region is talent development and dependence on imported labor from Southeast Asia—a well-publicized issue regarding Qatar’s 2022 World Cup bid. Apart from human rights objections, there is debate over whether this model is sustainable in the long term.
GDP: $390
EXPORTS: $369
IMPORTS: $250
FDI 2013: $11
The UAE has rebounded from global recession, and economic diversification has transformed the country into a major air-ocean distribution hub and gateway to Africa. Lack of skilled talent and questions about its practice of “importing labor” are future concerns.
UNITED ARAB EMIRATES
TOTAL RANK
8T I B X4 2 2 0
GDP: $354
EXPORTS: $91
IMPORTS: $100
FDI 2013: $5
While Nigeria has become Africa’s largest economy, the country is still the most progressive on the continent. Stable government and sound fiscal policies are strengths. Lack of rail infrastructure, relatively high logistics costs, and commodity dependence are causes for concern.
SOUTH AFRICA
TOTAL RANK
5T I B X2 1 2 0
GDP: $262
EXPORTS: $25
IMPORTS: $59
FDI 2013: $19
The Suez Canal has attracted more traffic as Asian manufacturing moves westward and Panama’s capacity constraints surface. That may change with Panama’s expansion. Political stability and social unrest are more immediate issues.
EGYPTTOTAL RANK
4T I B X2 1 1 0
FDI U.S. Foreign Direct Investment
T Transportation Infrastructure
I IT Competency
B Business Culture
X X-Factor All amounts in $US billions.

Your reputation and success depend on whether you receive or deliver your products on time and at a reasonable price from anywhere in the world. GEODIS is a reliable and dedicated partner providing global end-to-end logistics solutions that turn your supply chain into a competitive advantage. Geodis Freight Forwarding can serve you with integrated supply chain solutions, managing the delivery of your cargo via sea, air, or ground. Combining the global reach and the personal touch you expect from a logistics partner, we ensure our solution is tailor-made to your requirements. You can expect more from us because we expect more from ourselves.
Untitled-2 1 3/6/15 2:48 PM

48 Inbound Logistics • March 2015
GDP: $8,939
EXPORTS: $2,210
IMPORTS: $1,772
FDI 2013: $61
GDP estimates are dropping, but China still expects to post 5-percent gains in the near term. As its middle class and domestic consumption grows, trade dynamics are changing.
CHINATOTAL RANK
6T I B X3 1 2 0
GDP: $272
EXPORTS: $456
IMPORTS: $521
FDI 2013: $59
The world’s busiest cargo airport and one of the top ports in terms of container transits, the special administrative region is transition-ing into an Asian transshipment hub. Increasing competition from Shenzhen, and exorbitant real estate prices, place a premium on distribu-tion space and activity.
HONG KONGTOTAL RANK
10T I B X4 3 3 0
Southeast AsiaThe story in Southeast Asia is India’s rising profile under
Prime Minister Narendra Modi. The country, which has long been overshadowed by China’s explosive growth, is finally showing signs of progress. Modi has set out to modernize an economy that is burdened by bureaucracy and timeworn ways of doing business. Palletization and bar codes are still novel concepts. India’s cold chain is underdeveloped. Under Modi’s watch, India is in the process of implementing a goods and services tax that will help harmonize tax policy across the country.
India has also softened its FDI policies over the past few years to attract investors and stimulate over-protected domestic industries.
Elsewhere in Southeast Asia, Malaysia and Singapore are bright spots. The city-state remains the leading transshipment hub, with a port and airport that regularly rank among the best in the world. Malaysia, too, is a top performer in the region, touting above-average IT readiness, quality road infrastructure, and leading container port facilities in Tanjung Pelepas and Port Kelang.
By contrast, Indonesia and Thailand remain fettered by lingering infrastructure issues and lack of FDI. In 2014, Jakarta made the radical decision to stop all nickel-ore exports in a move to attract more foreign investment and develop the country’s industrial base. Political stability and social unrest continue to plague Thailand’s economic progress.
GDP: $1,758
EXPORTS: $318
IMPORTS: $515
FDI 2013: $24
X-FACTOR Prime Minister Modi has set out to reform India’s economy. GDP growth is expected to approach 8 percent in the next year, surpassing China. A national goods and services tax is expected to help standardize trade within the country.
INDIATOTAL RANK
7T I B X2 1 3 1
GDP: $401
EXPORTS: $229
IMPORTS: $223
FDI 2013: $14
Political instability contributes to lackluster foreign investment. High labor and logistics costs relative to other ASEAN countries hurt exports.
THAILANDTOTAL RANK
4T I B X2 1 1 0
GDP: $312
EXPORTS: $231
IMPORTS: $193
FDI 2013: $16
Malaysia is Southeast Asia’s strongest contender. It ranks 27th, 30th, and 31st in the world in terms of road quality, IT readiness, and economic freedom—all tops in the region.
MALAYSIATOTAL RANK
6T I B X3 2 1 0

SPONSORED BY
March 2015 • Inbound Logistics 49
GDP: $5,007
EXPORTS: $697
IMPORTS: $767
FDI 2013: $123
X-FACTOR An aging population and unsustainable government debt are leading toward an inevitable crisis. Officials recently raised the sales tax to help curb the problem. That, in turn, has hurt consumption amid weak recovery.
JAPANTOTAL RANK
8T I B X4 3 2 -1
GDP: $1,198
EXPORTS: $557
IMPORTS: $517
FDI 2013: $33
Samsung accounts for one quarter of the country’s economy. In turn, declining smartphone sales have negatively impacted near-term prospects. South Korea has been active, signing and tweaking FTAs with Canada, China, and Turkey.
SOUTH KOREATOTAL RANK
8T I B X3 3 2 0
GDP: $485
EXPORTS: $306
IMPORTS: $269
FDI 2013: $17
With two seaports and one airport among the world’s Top 50 in terms of cargo tonnage, the Maryland-sized country has strong infrastructure credentials. GDP growth has been dialed back due to Asian slowdown. There are still concerns about Taiwan’s uneasy relationship with China and lack of FDI.
TAIWANTOTAL RANK
7T I B X3 3 1 0
AsiaThe continent is in the
midst of major transitions due in large part to China’s evolving economy. In the wake of Europe’s crisis, and a slowdown in exports, China has made a concerted effort to prioritize domestic investment and stimulate consumption. It also remains aggressive on the global front, bankrolling infrastructure projects in Central America, the Caribbean, and Africa, among other places.
As China’s middle class expands and economy slows down, intra-Asian trade is heating up.
Low-cost manufacturing is migrating into Southeast Asian countries such as Vietnam, Laos, and Cambodia. These countries are now helping to feed the “factory of the world.”
Japan’s situation is more tenuous. The country’s aging population has created an inevitable tinderbox in terms of the future ramifications of growing public debt. The government has initiated a series of sales tax increases over the next several years to help ease this burden. While the country emerged from recession in late 2014, weak economic growth and inflation are still underlying concerns.
Meanwhile, South Korea’s economic recovery is contingent on the government’s resolve to engage structural reforms. A spate of free trade agreements over the past several years signals the country’s willingness to expand its horizons and insulate against risks in China, Japan, and the EU.
GDP: $287
EXPORTS: $443
IMPORTS: $380
FDI 2013: $154
The city-state remains the envy of many. Its port is the largest transshipment facility in the world and second in terms of container traffic and tonnage. On the downside, its heavy dependence on trade makes it more vulnerable to global fluctuations.
SINGAPORETOTAL RANK
9T I B X4 3 2 0
GDP: $868
EXPORTS: $179
IMPORTS: $179
FDI 2013: $13
The commodity-driven economy has felt the impact of fluctuating global oil prices. Infrastructure development remains a concern.
INDONESIATOTAL RANK
4T I B X2 1 1 0
FDI U.S. Foreign Direct Investment
T Transportation Infrastructure
I IT Competency
B Business Culture
X X-Factor All amounts in $US billions.