2015 fiduciary management fees survey - ey - united...
TRANSCRIPT

2015 FiduciaryManagement FeesSurvey
April 2016

2

Survey highlights 4
Introduction 5
Components of fees in a fiduciary management mandate 6
Context for survey 7
Base fiduciary management fees 8
Investment management fees 12
Combined base and investment management fees 15
Other fees 17
Getting help 18
Appendix A: How to read a box plot 20
Appendix B: Distribution of investment management feesfor model portfolio 21
Contents
3

This is EY’s second survey of fiduciary management fees. Our previous survey was conducted in 2013. It is based on responsesfrom 15 fiduciary managers (FMs) who, collectively, manage the vast majority of assets in the fiduciary management market. Weasked participating FMs what their fees would be for a specified set of services that is typical of what we see in the market forfour hypothetical pension schemes with assets of £50mn, £250mn, £750mn and, new for this year, £1.5bn.
Survey highlights
Figure i – Combined base fiduciary management fees plus investment management fees for medium scheme
42015 Fiduciary Management Fees Survey
0.40%
0.50%
0.60%
0.70%
0.80%
0.90%
1.00%
Medium £250mn Medium £250mn
This year, we note that there is a wider range of fees, compared to the 2013 survey. This has been driven primarily by a widerrange of fiduciary offerings in the market, both through new entrants to the market, as well as a lower fees from some existingproviders.
2013 2015
Median 0.62%
Q3 0.69% Q3 0.70%
Q1 0.56%Q1 0.53%
Median 0.63%

IntroductionThe concept of fiduciary management continues to gain traction in the UK. As advisors, EY are seeing more trustees andcorporates reaching the conclusion that fiduciary management is the right investment governance solution for their pensionscheme. Possibly in response to this, we have seen a number of new fiduciary managers enter the market.
As always, a very relevant question from parties interested in fiduciary management is how much it will cost. To help answerthis question we are releasing our second Fiduciary Management Fee Survey. Our previous survey was released in March2014 based on data collected in the third quarter of 2013.
Fiduciary management is a service as opposed to a product and, as with most service provision, the cost of fiduciarymanagement will depend on exactly what services are provided. As you might expect, not all fiduciary managementappointments are the same. In some cases trustees delegate more services to their fiduciary manager than others – thisdecision typically has cost implications.
To help you understand what fiduciary management fees could be, we asked participating fiduciary managers what their feeswould be for a specified level of fiduciary management services that is quite common in the UK market. As you would expect,in a growing and competitive market, fees will tend to come down and indeed this is what we have found this year. To help yousee how fees have come down, we have asked the same questions in this survey as in our previous survey and have showncomparative results.
The information in this survey is based on responses received in the fourth quarter of 2015 from 15 fiduciary managers whoserve the UK fiduciary management market (listed below). Collectively, these 15 firms manage the vast majority of assets inthe UK fiduciary management market. We would like to extend our gratitude to these firms for their participation.
The information in this survey may be reproduced on the condition that EY and this document are acknowledged as the sourceof the material.
We hope you find our survey insightful.
Iain Brown Matthew MignaultPartner Director
Alliance Bernstein BNP Paribas Goldman Sachs Asset Management LGIM P-Solve
Aon Hewitt Cambridge Associates JLT Mercer SEI
BlackRock Charles Stanley Kempen & Co. Russell Investments Willis Towers Watson
52015 Fiduciary Management Fees Survey

Components of feesIn our view, the fees in a fiduciary management mandate can be neatly separated into three components, as follows:
Typical services in an FM mandateFiduciary management is a service and the fees for it are reflective of the services provided. In our experience, many schemeswill have different service needs. As a result, the fiduciary management fees payable by one scheme could be very different thanthe fees payable by another scheme of similar size. For instance, the fiduciary management fees for a pension scheme with aninvestment strategy that involves a fixed asset allocation, where the FM is only tasked with quarterly rebalancing to this assetmix, will be lower than the fees if the same FM designs a ‘flight plan’ to dynamically reallocate growth type investments tomatching type investments as market condition allow and is tasked by the trustees with monitoring progress against the flightplan on a daily basis (and making necessary changes when triggers are hit).
The following is a description of services that we often come across in fiduciary management mandates:
Components of fees in a fiduciarymanagement mandate
Advisory (FM advises trustees whoultimately make decision)
Implementation (trustees have delegated authority to the FM to takeactions on their behalf) Communication
Initial investment strategy advice Implementation of investment strategy (including hedging strategy) Meetings
Annual recalibration of strategy Execution of flight plan de-risking mechanism Performance reporting
Design of flight plan Tactical asset allocation Trustee training
Generation of new investment ideas Selection/replacement of underlying investment managers
Base fiduciarymanagement fees
Investmentmanagement fees
Other fees
This is essentially the fees the fiduciary manager (FM) charges for providing advice, modellingand implementation of the trustees’ investment strategy. This includes manager selection,tactical asset allocation, implementing hedges, etc. There can be a performance-relatedcomponent to the base fiduciary management fees.
Typically, fiduciary managers implement the chosen investment strategy via underlyinginvestment managers. These fees continue to make up a large part of overall costs.
There are other fees associated with a fiduciary management mandate. These are notconsidered within this survey.
62015 Fiduciary Management Fees Survey

Context for surveyHypothetical pension schemesTo ensure the survey responses we received from theparticipating FMs were comparable we created fourhypothetical pension schemes – which we have calledSmall (£50mn), Medium (£250mn), Large (£750mn) and, newfor this year, Very Large (£1.5bn) where, in all cases, thetrustees require the following services from their FM:
Investment strategy – Initial investment strategy advice
Flight plan – Advice on design of a flight plan which involvesgradually decreasing the scheme’s asset allocation from thecurrent 60% growth/40% matching allocation to a targetallocation of 100% in the matching portfolio as the scheme’sfinancial position improves
Implementation of investment strategy – Implementation ofthe above flight plan with de-risking from the growth portfolioto the matching portfolio based on daily testing of the fundedratio against flight plan parameters, making tactical assetallocation decisions to over/underweight certain asset classesbased on the FM’s short to mid-term views of the relativeattractiveness of various asset classes, selection andreplacement of underlying investment managers
Meetings – Quarterly meetings and reporting to the trusteeswith periodic trustee training on relevant investment issues
In our experience, this service specification is quite commonin the UK market.
Model portfolioFurthermore, to ensure comparability of the fees, we specifiedthe following initial asset mix (model portfolio) which, initially,the trustees would want to maintain:
Asset class Benchmark weighting
Growth portfolio 60%
Developed market equity (actively managed) 30%
Emerging market equity 5%
High yield debt 5%
Emerging market debt 5%
UK property 5%
Hedge funds 10%
Matching portfolio 40%
Fixed-interest UK government bonds 15%
Inflation-linked UK government bonds 15%
Investment grade corporate bonds 10%
Total 100%
Initially the trustees would not be interested in hedging thescheme’s interest rate or inflation exposures beyond physicalholdings of fixed-interest and inflation-linked UK governmentbonds although, in practice, this is something that manytrustees decide to do.
72015 Fiduciary Management Fees Survey

Base fiduciary management fees cover most of the services provided by the FM. This includes the advice they give to thetrustees in connection with the scheme’s investment strategy plus the implementation of the trustees’ investment strategy. Italso includes the analysis, reporting and meetings associated with the advice and implementation. Base fiduciary managementfees are typically charged on a percentage of assets basis.
Base fiduciary management fees
How have base fiduciary management feeschanged since 2013?Figure 1 shows the median base fiduciary management fees.
Figure 1 – Median base fiduciary management feesin 2013 and 2015
Figure 1 shows that median base fiduciary management feeshave fallen by about 20% since 2013. This reduction in is dueto the impact of new firms entering the market and lower feesfrom some existing providers. It is important to note that a 20%reduction in median base fiduciary management fees does notmean that the typical FM reduced their base fees by 20% –indeed, for those FMs who participated in both our 2013 and2015 surveys, the average reduction in base fiduciarymanagement fees was between 5% and 10%.
As in our previous survey, the results show that as the size of ascheme increases the base fiduciary management fees,expressed in basis point terms, decreases (for 2015: 29bps fora small scheme to 13bps for a large scheme). This is natural asthe FM needs to provide the same services to the trusteesregardless of size – essentially spreading what is in manyrespects a fixed cost across a larger asset base.
Investmentmanagement fees
Other fees
Base fiduciarymanagement fees
EY Insight:Since 2013, median base fiduciary management fees have fallen by about 20%. This has been driven by new entrants to themarket as well as lower fees from some existing providers.
0.35%
0.25%
0.16%
0.29%
0.20%
0.13%0.10%
0.00%
0.10%
0.20%
0.30%
0.40%
0.50%
Small £50m Medium£250m
Large £750m Jumbo£1.5bn
Med
ian
2013 2015
82015 Fiduciary Management Fees Survey
Small£50mn
Large£750mn
Medium£250mn
Very Large£1.5bn

Distribution of base fiduciary management feesFigure 2 below expands on the results from figure 1; it shows the distribution of base fiduciary management fees amongst theFMs participating in our survey.
0.00%
0.10%
0.20%
0.30%
0.40%
Small £50m Small £50m Medium £250m Medium £250m Large £750m Large £750m n/a Jumbo £1.5bn
Median 0.29%
Median 0.25%
Median 0.20%
Median 0.16%
Median 0.13%
Median 0.10%
Q3 0.36%
Q3 0.33%
Q3 0.26%Q3 0.25%
Q3 0.19%Q3 0.20%
Q3 0.12%
Q1 0.28%
Q1 0.25%
Q1 0.15% Q1 0.15%
Q1 0.10%
Q1 0.08%
Small£50mn
Small£50mn
Medium£250mn
Medium£250mn
Large£750mn
Large£750mn
N/A Very Large£1.5bn
Median 0.35%
Q1 0.15%
2013 2015
As figure 2 shows, although the range of fees is similar, the shape of the distribution has changed. There is less skew in thedistribution of fees.
Figure 2 – Distribution of base fiduciary management fees in 2013 and 20151
1 Refer to Appendix A for how to read a box plot
92015 Fiduciary Management Fees Survey

Base fiduciary management fees(cont’d)Prevalence of performance-related feesSome fiduciary management mandates are structured toinclude a performance-related component to the base fiduciarymanagement fees whereby the overall base fiduciarymanagement fees payable can go up if, during the period inquestion, the FM is able to meet or exceed quantitative criteria(and vice versa if results are poor). Generally, the criteria isthe FM generating investment returns that outperform thescheme’s liabilities by more than a threshold amount.
As can be seen from Figure 3, around three-quarters of theFMs surveyed are willing to include a performance-relatedcomponent to their base fiduciary management fees and this isbroadly unchanged from 2013.
The potential benefit of a performance-related approach is todirectly align the interests of trustees and the FM. However,where FMs do not offer a performance-related component, thisis often driven by the belief that the approach creates aconflict of interest such that the FM is incentivised to targetshort-term performance rather than focus on the long-termobjectives of the trustees. A number of FMs have alsocommented that getting the right outperformance objectivesin place in relation to performance-related fees can be complexand challenging.
If we restrict our attention to those FMs who are willing toincorporate performance-related fees into their fee models,Figure 4 shows that, for most of these FMs, the proportion oftheir clients using performance-related fees is still relativelysmall. This suggests that as FMs’ client bases have grown, arelatively stable proportion of their new clients are adopting aperformance-related fee structure.
Investmentmanagement fees
Other fees
Base fiduciarymanagement fees
Figure 4 – Prevalence of performance-related fees acrossclient base (in FMs who are willing to accommodate aperformance-related fee structure)
75%
0%13% 13%
82%
9%0%
9%
0%
20%
40%
60%
80%
100%
0-25% 26-50% 51-75% 76-100%
2013 2015
EY Insight:The majority of FMs are willing to incorporate aperformance-related component into their base fiduciarymanagement fees. However, the reality continues to be thatmost fiduciary management mandates in the UK do nothave a performance-related fee structure.
Figure 3 – % of FMs willing to incorporate a performance-related component into base fiduciary management fees
73%
78%
0% 20% 40% 60% 80% 100%
2015
2013
102015 Fiduciary Management Fees Survey

What services are included in basefiduciary management feesFor most fiduciary management mandates, the base fiduciarymanagement fees include almost all of the services thetrustees will require (e.g., investment strategy advice, periodicasset/liability studies, implementation of investment strategyand reporting). This means that, apart from investmentmanagement fees, for an given level of investment delegation,trustees should not expect to incur significant additional fees.
As shown in Figure 5, the market preference for an‘all-inclusive’ fiduciary management service continues to grow.In particular, the proportion of FMs who now include transitionmanagement fees and initial advice fees within their base feehas increased since 2013.
We note that additional, one-off fees tend to be incurred at theoutset of a fiduciary management relationship, as some FMswill charge transition management fees to transfer the assetsfrom existing arrangements. In some cases, the transitionmanagement fees only apply when an external transitionmanagement firm is used.
EY Insight:An increasing number of FMs have expanded the level ofservices included in their base fiduciary management fees.This reflects the expectation that FMs are engaged toprovide an overarching investment governance solution.
Figure 5 – Does the base fiduciary management fee include:
21%
100%
100%
71%
10%
100%
89%
44%
0% 20% 40% 60% 80% 100%
Custodial fee
Regularasset/liability
studies
Initial advice
Transitionmanagement
fees
2013 2015
112015 Fiduciary Management Fees Survey

For the majority of FMs surveyed, investment managementfees, expressed in basis point terms, were the same for ourSmall, Medium, Large and Very Large schemes (see Figure 6).This is consistent with the notion that FMs use their ‘bulkbuying power’ to give all of their clients the same low costaccess to their preferred investment managers. Indeed, forsmall pension schemes, this is often one of the advantages to afiduciary management model.
Investment management feesHow do FMs deal with investmentmanagement fees?There are significant differences in the way FMs approachinvestment management. In most cases, FMs will not selectindividual securities themselves but will instead constructportfolios using the funds of external investment managers.However, some FMs are also equipped to act as the underlyinginvestment manager in their own right and, if instructed to doso by the trustees, will select securities ‘in-house’. Similarly,some FMs create pooled funds consisting of investments in anumber of underlying investment managers (i.e., a fund offunds approach) whilst others invest directly in the underlyinginvestment managers’ funds.
In all cases, unless the trustees give an explicit instruction tothe contrary, the holdings in each asset class will be investedin the FM’s ‘best ideas’. For example, for developed marketequities, the external investment managers chosen by the FMwould be those underlying investment managers that the FMprefers based on their research.
In practice, from a fees perspective, the trustees pay the FMcombined fees equal to the base fiduciary management feesplus the underlying investment management fees. The FM thenpays the underlying investment manager(s) the fees it has‘negotiated’ with them.
Some FMs use a ‘cost pass-through model’ for investmentmanagement fees (whereby they do not make any profit on theinvestment management fees component of the combinedfees) and will show the fiduciary management base fees andinvestment management fees separately in the investmentmanagement agreement. However, for some FMs, this elementof their charging structure can be more opaque.
Investmentmanagement fees
Other fees
Base fiduciarymanagement fees
Figure 6 – % of FMs where investment management fees werethe same (in bps terms) regardless of scheme size
60%
67%
0% 20% 40% 60% 80% 100%
2015
2013
EY Insight:One of the advantages of using FMs is their ‘bulk buyingpower’. This can be particularly advantageous for smallschemes who can access investment managers at apotentially significantly lower cost than would be possibleon their own. Our survey shows that cost savings arepassed to clients in different ways; 60% of fiduciarymanagers negotiate the same fee rate for all clientsregardless of size, while the rest have investmentmanagement fees that differ depending on size.
122015 Fiduciary Management Fees Survey

Investment management fees for ourmodel portfolioFigure 7 shows the median investment management feespayable for the model portfolio described on page 5.
The investment management fees for our model portfolio werelargely unchanged from 2013. Trustees should be aware thatthe investment management fees in a fiduciary managementmandate are a function of both the scheme’s asset allocationand the underlying investment managers selected by the FMand will therefore be scheme specific.
Figure 7 – Median investment management fees for modelportfolio1
Interestingly, as shown in Figure 8, there is a wider distributionof investment management fees in 2015 than 2013 (see alsoAppendix B). This is due, in part, to new FMs entering oursurvey this year.
Figure 8 – Distribution of investment management fees formodel portfolio1
EY Insight:The wider range of investment management fees is drivenprimarily by new participants in our 2015 survey, along withrevised fee structures from existing providers.
1 Some of the participating FMs prefer to invest completely in passive underlying investment managers. For comparability, we have excludedthese FMs from the data as passively managed funds typically have lower investment management fees than actively managed funds
0.42% 0.44%0.47%
N/A
0.47% 0.44%0.42%
0.38%
0.00%
0.10%
0.20%
0.30%
0.40%
0.50%
Small£50m
Medium£250m
Large£750m
Jumbo£1.5b
Med
ian
2013 2015
Very Large£1.5bn
0.20%
0.30%
0.40%
0.50%
0.60%
0.70%
Medium £250m Medium £250m
Median 0.44% Median 0.44%
Q1 0.34%
Q3 0.49%
Q1 0.38%
Q3 0.55%
2013 2015
132015 Fiduciary Management Fees Survey
Small£50mn
Large£750mn
Medium£250mn
Medium £250mn Medium £250mn

14

Combined base and investmentmanagement feesAs noted, in most situations, the ongoing fees for a fiduciarymanagement mandate consists of base fiduciary managementfees plus investment management fees – it represents the‘running cost’ of a fiduciary management mandate. Figure 9shows the median combined fees for our four hypotheticalschemes.
Figure 9 – Combined base fiduciary management fees plusinvestment management fees
Investmentmanagement fees
Other fees
Base fiduciarymanagement fees
EY Insight:Combined fees have remained fairly stable since 2013.Similar to our 2013 survey, we found that those FMs thathad the higher base fiduciary management fees tended tohave lower investment management fees and vice versa.
The combined base fiduciary management fees plusinvestment management fees represents the major componentof the ‘running cost’ for a fiduciary management mandate. Themedian combined fees have remained fairly stable relative toour 2013 survey.
152015 Fiduciary Management Fees Survey
0.71%0.63%
0.57%
0.73%
0.62%0.55%
0.49%
0.00%
0.10%
0.20%
0.30%
0.40%
0.50%
0.60%
0.70%
0.80%
Small£50m
Medium£250m
Large£750m
Jumbo£1.5bn
Med
ian
2013 2015
Small£50mn
Large£750mn
Medium£250mn
Very Large£1.5bn

Distribution of combined base fiduciary management fees plus investmentmanagement feesFigure 10 below expands on the results from Figure 9; it shows the distribution of the combined base fiduciary management feesplus investment management fees amongst the FMs participating in our survey.
EY Insight:In 2013 we found that the distribution of combined fees amongst participating FMs was fairly tightly concentrated (i.e., manyfirms had similar combined fees). In 2015, we are seeing a wider distribution of combined fees, which has been driven by newentrants to the market along with existing providers offering lower fees.
2013 2015
As previously mentioned, we found that those FMs that had the higher base fiduciary management fees tended to have lowerinvestment management fees and vice versa. This had the effect of narrowing the distributions of the combined fees in both2013 and 2015.
Figure 10 – Distribution of combined base fiduciary management fees plus investment management fees
0.30%
0.40%
0.50%
0.60%
0.70%
0.80%
0.90%
1.00%
1.10%
1.20%
Median 0.63%
Median 0.55%
Median 0.49%
Q3 0.81%
Q3 0.69% Q3 0.70%Q3 0.67%
Q3 0.65%Q1 0.68%
Small£50mn
Small£50mn
Medium£250mn
Medium£250mn
Large£750mn
Large£750mn
N/A Very Large£1.5bn
Median 0.71%
Q3 0.77%
Q3 0.57%
Q1 0.69%
Q1 0.53%Q1 0.50%
Q1 0.56%
Q1 0.48%
Q1 0.40%
Median 0.62%
Median 0.57%
Median 0.73%
162015 Fiduciary Management Fees Survey

Other feesThere is a wide range of agents involved in delivering returnsto a pension scheme, and each agent’s fees add to the totalcosts experienced by trustees. With pension schemes facingsignificant challenges in plugging deficits, and generalausterity that corporates continue to face, we believe it isimportant to pay close attention to all costs.
Fiduciary manager and investment management fees form thelargest part of overall costs of a fiduciary mandate. To be ableto understand and evaluate total costs, it is important tounderstand all other costs involved in managing pensionscheme assets. These include:
► Performance fees payable to a fiduciary manager and tounderlying investment managers
► Administration fees through the use of fiduciary managerpooled funds, as well as investment manager pooled funds
► Transition management fees
► Custodian and performance measurement fees
► Legal fees
► Any other investment advisory fees
Whilst we see improvement in transparency in fees across theindustry, different providers quote fees in different ways, andwe encourage trustees to ensure that all costs are understoodclearly, to avoid any unpleasant surprises in the future.
172015 Fiduciary Management Fees Survey
Investmentmanagement fees
Other fees
Base fiduciarymanagement fees
EY Insight:Periodic reviews of fiduciary managers, whilst optional,have become recognised as a ‘best practice’ governanceactivity. The exact form and content of these reviews willvary but the central theme is that they help trustees form aconsidered view of whether the FM is providing value formoney. A full assessment of costs is a meaningful part ofthese reviews.

Matthew MignaultDirector
Tel: + 44 20 7951 7630Mobile: + 44 7827 257 370Email: [email protected]
At EY, we have considerable experience in helping clients develop their strategic investment goals and understanding thegovernance challenges they face to be able to execute these strategies efficiently. We work with our clients to identify the rightinvestment governance solution that works for both trustees and corporate sponsors, and we provide a complete, unbiasedservice to help trustees select and implement the approach that works best for each pension scheme. Our clients continue tobenefit from independent annual reviews in monitoring fiduciary managers from a performance and operational perspective,ensuring they continue to utilise their scarce resources in the most efficient way.
For further information, please visit www.ey.com/fiduciarymanagement or contact:
Getting help
Iain BrownPartner
Tel: + 44 20 7951 7546Mobile: + 44 7977 023 389Email: [email protected]
Sean BottomleyDirector
Tel: + 44 113 298 2327Mobile: + 44 7740 923 265Email: [email protected]
182015 Fiduciary Management Fees Survey
Christopher BownDirector
Tel: + 44 20 7951 3231Mobile: + 44 7730 733 861Email: [email protected]

19

We have used several box plots throughout this document to illustrate the spread of survey responses. In particular, the boxplots show at a glance the range of the middle 50% of responses. The example below explains how to interpret the graphs.
Appendix A: How to read a box plot
Example – Investment management fees for model portfolio
0.25%
0.30%
0.35%
0.40%
0.45%
0.50%
0.55%
0.60%
0.65%
0.70%
Medium £250m (2015)
Median 0.44%
Q3 0.55%
Q1 0.38%
This line represents the75th percentile and islabelled ‘Q3’
This line represents themedian, i.e., the 50thpercentile
This line represents the25th percentile and islabelled ‘Q1’
This is the minimum valueobserved
The highest 25% of values areabove 0.55% pa
The middle 50% of values arebetween 0.38% pa and 0.55% pa,i.e., between Q1 and Q3
The lowest 25% of values arebelow 0.38% pa
This is the maximum valueobserved
202015 Fiduciary Management Fees Survey
Medium £250mn (2015)
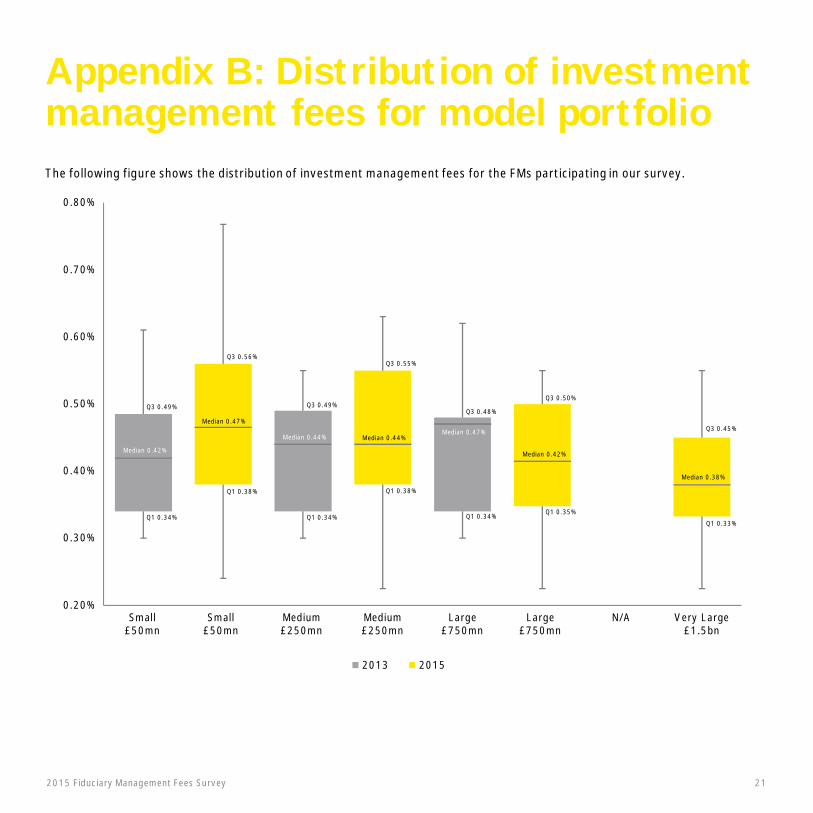
The following figure shows the distribution of investment management fees for the FMs participating in our survey.
Appendix B: Distribution of investmentmanagement fees for model portfolio
0.20%
0.30%
0.40%
0.50%
0.60%
0.70%
0.80%
Median 0.47%
Median 0.44% Median 0.44%Median 0.47%
Median 0.42%
Median 0.38%
Q3 0.56%
Q3 0.50%
Small£50mn
Small£50mn
Medium£250mn
Medium£250mn
Large£750mn
Large£750mn
N/A Very Large£1.5bn
Median 0.42%
Q3 0.49% Q3 0.49%
Q3 0.55%
Q3 0.48%
Q3 0.45%
Q1 0.34%
Q1 0.38%
Q1 0.34%
Q1 0.38%
Q1 0.34%Q1 0.35%
Q1 0.33%
2013 2015
212015 Fiduciary Management Fees Survey

Notes
222015 Fiduciary Management Fees Survey

232015 Fiduciary Management Fees Survey

EY | Assurance | Tax | Transactions | Advisory
About EYEY is a global leader in assurance, tax, transaction and advisoryservices. The insights and quality services we deliver help build trustand confidence in the capital markets and in economies the worldover. We develop outstanding leaders who team to deliver on ourpromises to all of our stakeholders. In so doing, we play a critical rolein building a better working world for our people, for our clients andfor our communities.
EY refers to the global organization and may refer to one or more ofthe member firms of Ernst & Young Global Limited, each of which is aseparate legal entity. Ernst & Young Global Limited, a UK companylimited by guarantee, does not provide services to clients. For moreinformation about our organization, please visit ey.com.
Ernst & Young LLPThe UK firm Ernst & Young LLP is a limited liability partnership registered in England andWales with registered number OC300001 and is a member firm of Ernst & Young GlobalLimited.
Ernst & Young LLP, 1 More London Place, London, SE1 2AF.
© 2016 Ernst & Young LLP. Published in the UK.All Rights Reserved.
ED None
1446348 (UK) 04/16. Creative Services Group.
ey.com/uk