2015 | colliers asia report - tug of war
TRANSCRIPT

TUG OF WAR : Emerged as a Winner in the Game

3 Tug of War : Emerged as a Winner in the Game | Colliers International
ContentsExecutive Summary 04
Tug of War 06
Section 1 - Asia Capital Flows 081.1 Direct Investment Flows 091.2 Real Estate Capital Flows 10
Section 2 - Intra-Asia Cross-Border Flows 14
Section 3 - Opportunities for Outbound Investment 203.1 Outbound Investment to the United States 223.2 Outbound Investment to Europe 263.3 Outbound Investment to Australia 30

5 Tug of War : Emerged as a Winner in the Game | Colliers International
United StatesExpEctEd IRR (%)*
ExpEctEd IRR (%)*
ExpEctEd IRR (%)*
ExpEctEd IRR (%)* ExpEctEd IRR (%)*
The most attractive asset type to buy
The most attractive asset type to buy
The most attractive asset type to buy
The most attractive asset type to buy
New York
London
Shanghai
Los Angeles
Paris
Hong Kong
San Francisco
Frankfurt
Singapore
Sydney Melbourne
* Before leverage # Assume an existing asset with similar quality available for sale
Australia
Asia
Office
Grade A
8.00%
12.00-15.00% 12.00-13.00%
Europe
6.00-7.00%
8.00-9.00%
5.00-5.50%
6.00-7.00%
Office
OfficeOffice
Office
Office
Office Residential
Grade A buildingsin city core
Grade A stock in City of London Off-plan and
tenant free
Grade A
Grade A quality in secondary location
Grade A buildings insuburban locations
Residential sites incore downtown
8.00%
12.00-15.00%
Office Office
Buildingsin Pudong
Grade A buildings in decentralised locations
Residential
High-end luxury apartments
4.00-4.25%
4.00-4.50%
4.00-5.50% 3.50% 2.00-
3.00%
EntryYield (%)
EntryYield (%)
EntryYield (%)
EntryYield (%)
3.25%#
5.00-6.00%
5.50-6.00%
5.75-6.00%
7.07% 6.65%
6.00-6.50%
ExpEctEd IRR (%)*
ExpEctEd IRR (%)*
ExpEctEd IRR (%)*
ExpEctEd IRR (%)* ExpEctEd IRR (%)*
12.00-15.00%
ExpEctEd IRR (%)*
Executive SummaryIn 2015, the flow of real estate investment out of Asia is set to accelerate faster than the past couple of years, increasing 61% over the previous year as investors seek geographical diversification and find better returns in overseas real estate. There is also a significant weight of money looking abroad after several Asian nations changed regulations to allow international investment.
As usual, the two-way flow between inbound and outbound investment resembles a tug of war. Outbound flow will continue to be the main game but the difference this year is that the pace of inbound activity is due to more than double thanks to sustained investment demand from a batch of long-term players and, more importantly, the start of a cycle of office completions, bringing more stock for sale at realistic prices.
We recommend prime gateway cities in the United States, Europe and Australia as the leading destinations for outbound investment in 2015. The United States and Europe are expected to absorb more than 70% of the flows from Asia, while Australia is gaining momentum by virtue of its premium yields.
Let’s say an investor has a time horizon of five years and is prepared to invest total equity of US$100 million on income-producing assets. Grade A offices in the core business districts of gateway cities such as New York, London, Sydney and Melbourne will be the best buys in 2015. Entry prices for New York and London are US$900 to US$1,500 per square foot and are currently yielding 4.0 to 4.5%. Sydney and Melbourne are lower at US$480 to US$620 per square foot, and current yields are higher, at 6.7 to 7.1%.
Due to strong competition in prime locations, secondary locations such as Los Angeles and Frankfurt will be the favourites for investors looking for better returns. Entry prices in Los Angeles range from US$200 to US$275 per square foot, which looks attractive since the assets are currently priced below their replacement cost. The decentralized play for Frankfurt is also convincing as the city emerges as one of the major offshore clearing centres for Chinese yuan (RMB). In Paris, buying off-plan offices in core locations from developers is a win-win arrangement for both overseas purchaser and vendor.
By asset type, San Francisco is the exception to the rule. Residential development opportunities in core downtown neighbourhoods will be the best type of asset to buy for Asian outbound investors in 2015. The similarity among the various markets is that the expected internal rates of return (IRR) are estimated to fetch a premium of 100 to 300 basis points (bps)above the entry yields.
Looking at flows into Asia, Shanghai, Hong Kong and Singapore will remain the three best target destinations. Offices in Pudong stand out due to their lower barriers to entry in terms
of price, simple deal structures and stable rental-income streams. Decentralised office buildings in Hong Kong are the most attractive plays because the gap between rents in core and decentralised districts stands at about three times, and will continue to narrow as tenants relocate, infrastructure improves and commercial facilities come on stream. Pricing-wise, expected IRRs are to fetch a premium of 800 to 900 bps above entry yields. In Singapore, high-end luxury residential apartments are the top pick as inventory builds up and asking prices soften.

-
5
10
15
20
25
30
35
40
45
50
2001 2002 2003 2004 2005 2006 2007 2008 2009 2010 2011 2012 2013 2014
7 Tug of War : Emerged as a Winner in the Game | Colliers International
Tug of WarAsia’s weight making the difference Asia stands out globally not only in terms of economic growth compared to other parts of the world but also because of the sheer volume of investment by almost every measure. With foreign direct investment, for example, Asia leads the world, responsible for 30% of the total flow around the globe. That’s thanks largely to the entry of China into the World Trade Organization at the start of the century and a number of pro-business initiatives and structural reforms that the Chinese government has pushed over the past few years.
Direct real estate investment in Asia has quickly expanded across the board driven by positive demographics, growing public investment and the deregulation of a number of industries, including banking and finance. The flow has become a flood as liquidity improved in the wake of the global financial crisis.
Growing Appetite for Overseas AssetsReal estate prices in Asia have gone too far and too fast. That’s because investment demand is only increasing while real estate supply has lagged. In response, various Asian governments have over the past couple of years imposed a litany of real estate cooling measures including new tax laws, buying restrictions and tighter access to real estate finance. The aim is to stem the tide of real estate inflows and stop asset bubbles from developing further. A huge volume of investment-ready Asian capital has therefore shifted to markets outside Asia. As Asian nations ease restrictions on overseas investment, the appetite for overseas real estate has surged continuously since 2009. The volume of transactions increased more than 10-fold times during the past seven years.
Outbound or Inbound?In 2014, the total outbound real estate flow from Asia surged 38% year-on-year (YoY) to an all-time high at US$46 billion, but the yield spread between Asia and overseas markets compressed. For example, the average yield difference between Grade A offices in London’s West End and Hong Kong’s Central district contracted from about 200 bps in 2008 to about 60 bps in 2014. Sourcing investment-grade assets becomes a challenge for investors since the development cycle in most overseas gateway cities cannot catch up with the pace of capital flows. Individual Asian investors have resorted to development opportunities as an alternative strategy. Some of them extend their search to fringe locations around overseas gateway cities, and to second-tier cities as well.
Another group of Asian investors has refocused on Asia, where the availability of stock for sale at realistic prices might look better in 2015. Office real estate is one of the most popular asset classes in Asia and is going to see a significant increase in transactions thanks to much-improved supply in 2015. Outbound flows have overshadowed inbound real estate investment in the past couple of years, but inbound could make a comeback this year.
The Tug of WarIn 2015, the picture for real estate investment in Asia looks like a tug of war between outbound and inbound capital. Will the game end up with a winner or simply as a tie?
To answer this question, this paper adopts a two-pronged approach. The first is to analyze prospective changes in the key factors driving inbound and outbound investment, to gain insight into which way the tide will turn with the two-way real estate flows. In order to ride on the flows, Colliers has consolidated our recommendations to reveal the best asset to buy in select cities in Asia and three overseas regions – the United States, Europe and Australia – by taking a micro-perspective on the latest investment trends in each of these markets. For the sake of comparison, benchmarks on entry yields and expected internal rates of return (IRR) are provided together with the underlying investment rationale, based on the assumption that an investor has a horizon of five years and is prepared to invest total of equity of US$100 million on income-producing real estate.
Asia Real Estate Capital Flows(Inbound versus Outbound)
Source: Real Capital Analytics Note: Inbound = Real estate flows from Global to Asia (NOT including cross-border flows within Asia)Outbound = Real estate flows from Asia to Global (NOT including cross-border flows within Asia)
Rea
l Est
ate
Inve
stm
ents
(US
$ bi
llion
)
Inbound outbound vs

0
50
100
150
200
250
300
350
400
450
500
2001 2002 2003 2004 2005 2006 2007 2008 2009 2010 2011 2012 2013 2014E 2015F
9 Tug of War : Emerged as a Winner in the Game | Colliers International
Exhibit 1.1 Inward and Outward Direct Investment(China, Hong Kong, India, Japan and Singapore)
1.1 Direct Investment FlowsOver the past couple of years, the United States has shown increasingly encouraging signs in the pace of recovery. But Europe is still struggling to show sustainable growth as of 1Q 2015. Asia is obviously in a very different cycle, and the average growth in gross domestic product (GDP) in 2015 is going to lead the key regions. Individual countries will enter entirely new eras of growth. For example, India will be forging ahead if the new government pushes through more structural reforms (such as tax incentives). China in particular is likely to ease monetary policy further to support growth. Direct investment flows should then pick up momentum in 2015. Our quantitative
Source: United Nations Conference on Trade & Development; Colliers (Forecast)
CAGR
CAGR
+12% 2015
+18% 2015
-0.3%
+8.7%
Foreign Inward Direct Investment Outward Direct Investment
US
D b
illio
n
model suggests that the prospective pace of direct investment flow into Asia will increase 12% in contrast to flat growth between 2011 and 2014.
Spanning different sectors, including real estate, the pace of outward flows has increased steadily, at a compound annual growth rate (“CAGR”) of 9%. But we expect it to accelerate to 18% this year, surpassing the inward flow’s increase of 12% in 2015. One of the key drivers is the diversification of investors’ portfolios.
Asia Capital Flows
SectionONE

ForecastInbound Outbound
2002 2003 2004 2005 2006 2007 2008 2009 2010 2011 2012 2013 2014 2015-150%
-100%
-50%
0%
50%
100%
150%
200%
250%
300%
102%
61%
PULL factors
By Overseas Markets
By Asia Markets
10 11Tug of War : Emerged as a Winner in the Game | Colliers International Tug of War : Emerged as a Winner in the Game | Colliers International
1.2 Real Estate Capital FlowsOn the real estate front, both inbound and outbound flows exceeded market expectations with growth of more than 30% YoY in 2014. The clear conclusion we can draw is that Asia is again going to see a rising tide of both outbound and inbound real estate flows in 2015. The only difference that we anticipate this year is the exceptional magnitude of growth in inbound flows, which we predict will take a quantum leap to 102%, in contrast to just 33% in 2014. One of key reasons is the availability of more investment-grade assets for sale.
Meanwhile, we forecast that outbound flows will increase 61% in 2015 thanks to the growing appetite for overseas investments from traditional investors and a vast number of high-net-worth individuals (HNWIs) who are seeking overseas real estate as a way of generating better returns and diversification. At the same time, more Asian investors will go outbound given the relaxation of the restrictions on overseas investment. For the sake of analysis, all these factors are broadly grouped under either “PULL” or “PUSH.” The former represents the draw from overseas market while the latter refers to local factors in Asia such as government policies.
In 2014, Colliers initiated an analysis of these key “PULL” and “PUSH” factors in a paper titled “Riding the Next Wave of Asian Buying Spree.” Over the past 12 months, some of these factors have changed. More importantly, there are fluctuations in the strength of the “PULL” and “PUSH” factors as well, altering the magnitude of real estate flows.
Overall, the qualitative assessment of seven selected factors suggests the overall change in 2015 will be a slight drop in the strength of outward-bound pressure. But that results in a slight easing of the rate of increase – Asian capital still needs to go overseas. The following is the assessment in detail.
Higher Returns in Overseas Markets Diminished Diminishing
More Opportunities for Sales Diminished Diminishing
Benefit of Foreign Currency Appreciation Intact Intact
2014 vs 2013 2015 vs 2014
Rising Funding Costs Intact Intact
Supportive Government Policies on Grew Slightly GrowingOverseas Investments
Cooling Measures on Local Real Estate Markets Intact Intact
Asset Allocation to Overseas Markets - Grew GrowingDiversification Needs
Premium yields One of the key reasons for investors to look outside Asia has been the promise of superior returns in overseas gateway cities. However, we see the pull strength of higher yields diminishing as yields compress for prime assets in gateway cities. For example, the yield-spread difference between prime office assets in Hong Kong and London West End compressed from around 200 bps in 2008 to about 60 bps in 2014, with prime
Strength : Diminished in 2014 and will diminish further in 2015
Strength : Diminished in 2014 and will diminish further in 2015
Strength : Largely intact in 2014 and will remain the same in 2015
Source: Colliers; HKSAR Government
More opportunities for salesAsian investors have looked overseas in their search for greater investment opportunities – but face increasing challenges. Far fewer income-producing assets are available for sale than in the last couple of years because existing developments have largely been snapped up. In addition, the global financial crisis has left ample supply in the real estate sector in the United States, which has been weighing down the market. We believe there are now more opportunities in secondary locations around overseas gateway cities, and in second-tier cities. But investors continue to focus on traditional gateway cities.
Currency appreciationBy market consensus, the U.S. dollar is going to strengthen in 2015 against other major currencies such as the euro and Japanese yen. The euro is weakening in anticipation of more quantitative easing by the European Central Bank. U.S. real estate looks more expensive this year but could continue to draw buying interest from Asia owning to the fact that there might be further currency appreciation ahead. Analysts forecast that the U.S. dollar will appreciate another 3 to 4% against the euro.
0.00
1.00
2.00
3.00
4.00
5.00
6.00
7.00
8.00
9.00
10.00
1990 1991 1992 1993 1994 1995 1996 1997 1998 1999 2000 2001 2002 2003 2004 2005 2006 2007 2008 2009 2010 2011 2012 2013 2014
office yields in London declining from around 6% in 2008 to 3.5% in 2014 while prime office yields in Hong Kong remained stable at around 2.9%.
London (West End) Hong Kong
Exhibit 1.3 Grade A Office Yields (London West End versus Hong Kong)
Yiel
d (%
per
ann
um)
Exhibit 1.2 Asia Real Estate Capital Flows (Outbound versus Inbound Investments)
Source: Real Capital Analytics; Colliers (Forecast)
Ann
ual g
row
th ra
te

12 13Tug of War : Emerged as a Winner in the Game | Colliers International Tug of War : Emerged as a Winner in the Game | Colliers International
Exhibit 1.4 Asian Sovereign Wealth Funds and National Pension Funds
Value of assets under management (USD Trillion)
Source: Sovereign Wealth Fund Institute
0.0 0.2 0.4 0.6 0.8 1.0 1.2
Government Pension Investment Fund, Japan
Abu Dhabi Investment Authority, UAE
SAMA Foreign Holdings, Saudi Arabia
China Investment Corporation, PRC
SAFE Investment Company, PRC
Kuwait Investment Authority, Kuwait
National Pension Service of Republic of Korea, South Korea
Hong Kong Monetary Authority Investment Portfolio, HKSAR
Government of Singapore Investment Corporation, Singapore
Qatar Investment Authority, Qatar
National Social Security Fund, PRC
Temasek Holdings, Singapore
National Pension Sovereign Wealth Funds
Rising funding costs As of 1Q 2015, some market watchers expect the U.S. Fed to kick-start a new tightening cycle in 2Q 2015. Despite the likelihood of a deferred U.S. rate rise, financing costs are still rising, and Asian banks are generally cautious on real estate debt.
The availability of financing in China and Singapore is very much depending on individual banks’ assessment on real estate risks and whether they are foreign or local banks and their costs of funds. Financing cost in Singapore is expected to increase in 2015, depending on how Sibor trends, while there might be more monetary easing (i.e. further rate cut) in China to come through in 2015.
In Hong Kong, because of the currency peg to the U.S. dollar, the average cost of financing has been steady at 2.4%. However, if the U.S. Fed kick start the interest rate cycle in 2Q 2015, the overall financing cost will be on the rise in the second half of 2015.
Asset allocationSovereign wealth funds (SWFs) in Asia (e.g. GIC and the China Investment Corp.) have been allocating aggressively to overseas real estate. They group real estate under alternative investments, which is generally 5% of the total portfolio. However, there are signs that SWFs are increasing their exposure to real estate, and certain SWFs have an exposure of more than 10% of the total assets under management. The Government of Singapore Investment Corp., now calling itself simply GIC, is one of the most-active players with 9-13% of its assets invested in real estate.
Government policies Another push factor has been the relaxation of government policies toward outbound direct investment. In mainland China, the Ministry of Commerce amended outbound-investment regulations in September 2014 to streamline approval procedures for mainland firms. In late December 2014, the State Council released guidelines cutting the red tape that mainland firms face when investing or raising funds overseas.
In India, structural reforms are ongoing, attracting more inbound capital in 2015. Overall, the strength of this “PUSH” factor rose in 2014. We foresee it will gain further traction in 2015.
Cooling measuresIn mainland China, an increasing number of cities have eased their home-purchase restrictions since mid-2014, enabling more genuine homebuyers to enter the market. However, the government is now planning to introduce a new property tax in 2016 or 2017, which is another major push for outbound investment.
Hong Kong and Singapore introduced no new cooling measures in 2014. Given the projection that the existing cooling measures in both Hong Kong and Singapore will remain intact in 2015, investment capital should continue to look for overseas opportunities. The technical adjustment from the charging of double stamp duty to buyers of all type of real estate in Hong Kong resulted in an increase only in first-hand residential sales. Contrary to market expectations, residential prices edged up in 2014, and the government expressed its intention to launch new measures if prices rise in an uncontrollable manner.
Strength : Largely intact in 2014 and will remain the same in 2015
Strength : Growing and is expected to grow further in 2015
Strength : Grew in 2014 and predicted to grow further in 2015
Strength: Largely intact in 2014 and will remain the same in 2015
PUsh factors
In Japan, the US$1.1 trillion Government Pension Investment Fund (GPIF) is considering allocating 3 to 5% of funds to the global real estate market in the first phase of a five-year investment programme, making it the world’s largest real estate allocation. The Japanese government is trying to increase the fund’s exposure to riskier investments, primarily to boost returns for the nation’s burgeoning population of retirees.
In Taipei, taxes on non-owner occupied housing have doubled since July 2014. Rates have risen from 1.2% to 2.4% for the first two non-owner occupied housing units, and 3.6% thereafter. The whole purpose of the new tax is to keep people from hoarding housing units. Commercial properties are unaffected but net yields for prime assets remain low. In search of better yields, more local institutions and HNWIs are expected to go outbound in 2015.
0
10
20
30
40
50
60
70
80
90
100
2004 2005 2006 2007 2008 2009 2010 2011 2012 2013 2014
Exhibit 2.2 Asia Real Estate Capital Flows (Inbound and Intra-regional)
Source: Real Capital Analytics; Colliers (Forecast)Note: Inbound = Real estate flows from the rest of the world to Asia (NOT including cross-border flows within Asia)Intra-regional = Cross-border flows within Asia
Rea
l Est
ate
Inve
stm
ents
(US
$ bi
llion
)
61.726.6Intra-regional Inbound
Exhibit 2.1 Asia Grade A Office Supply (By new completion per year)
Source: Colliers
Tota
l Flo
or A
rea
(mill
ion
sq ft
)
0.0
20.0
40.0
60.0
80.0
100.0
120.0
2005 2006 2007 2008 2009 2010 2011 2012 2013 2014 2015 F
97.6
15 Tug of War : Emerged as a Winner in the Game | Colliers International
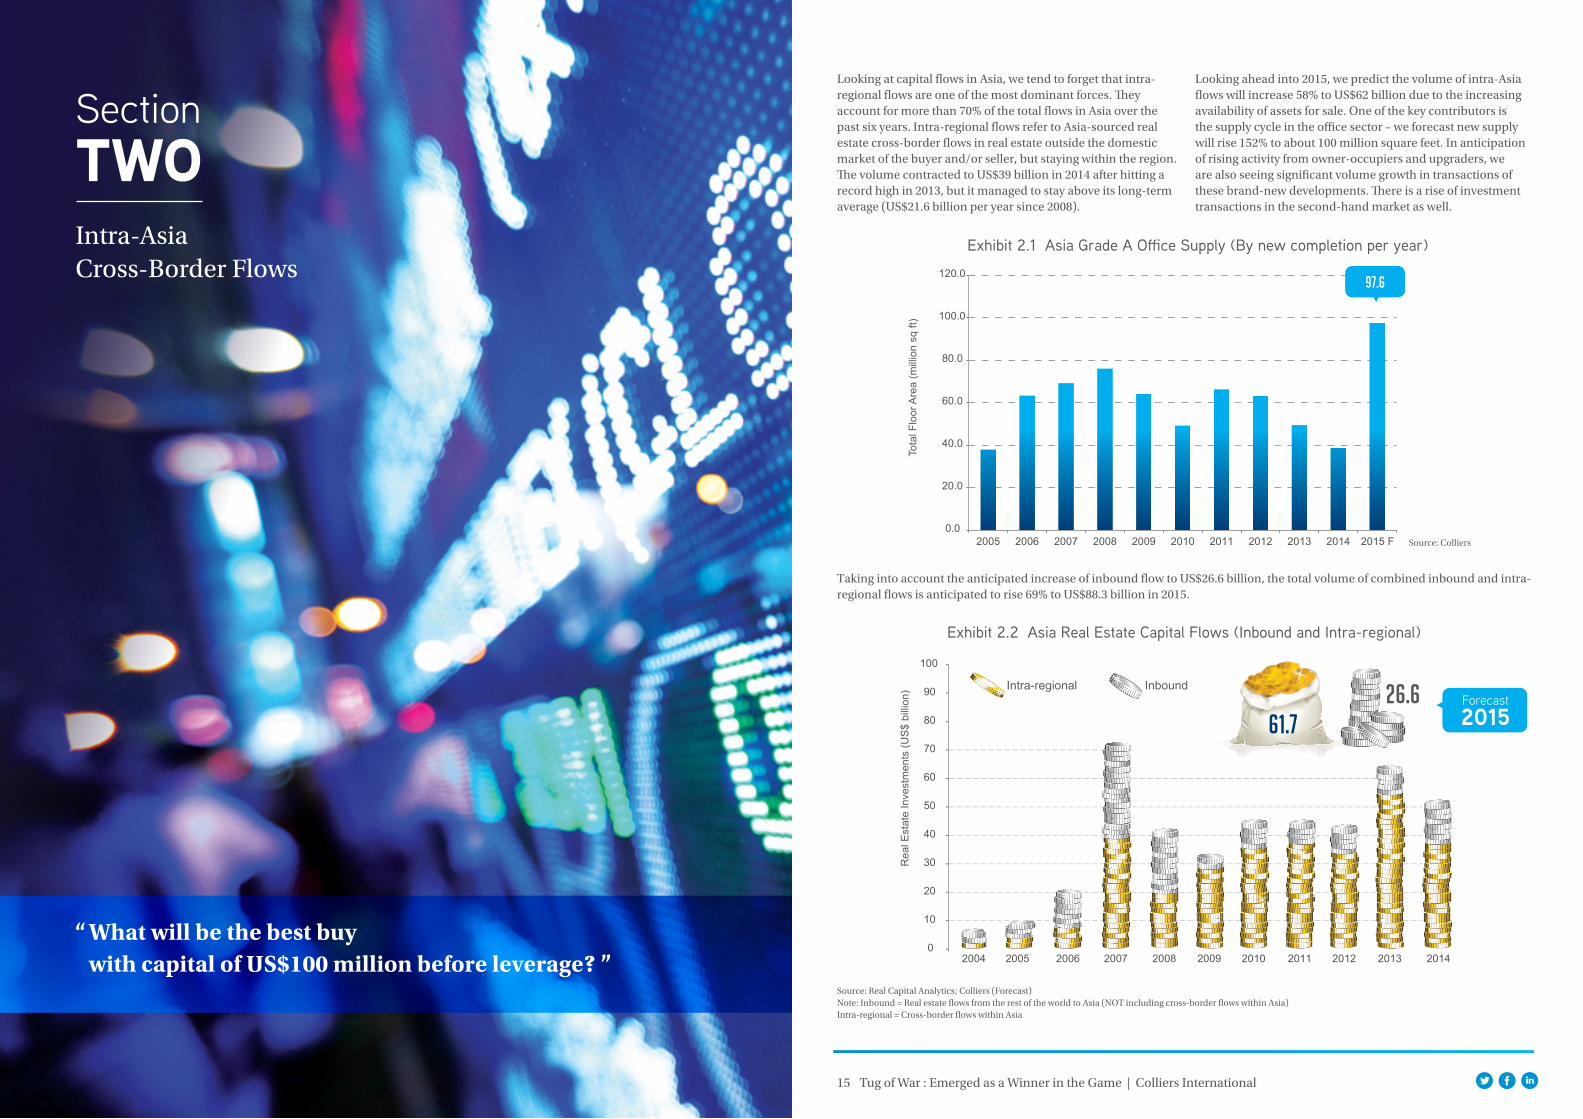
Looking at capital flows in Asia, we tend to forget that intra-regional flows are one of the most dominant forces. They account for more than 70% of the total flows in Asia over the past six years. Intra-regional flows refer to Asia-sourced real estate cross-border flows in real estate outside the domestic market of the buyer and/or seller, but staying within the region. The volume contracted to US$39 billion in 2014 after hitting a record high in 2013, but it managed to stay above its long-term average (US$21.6 billion per year since 2008).
Taking into account the anticipated increase of inbound flow to US$26.6 billion, the total volume of combined inbound and intra-regional flows is anticipated to rise 69% to US$88.3 billion in 2015.
Intra-AsiaCross-Border Flows
Looking ahead into 2015, we predict the volume of intra-Asia flows will increase 58% to US$62 billion due to the increasing availability of assets for sale. One of the key contributors is the supply cycle in the office sector – we forecast new supply will rise 152% to about 100 million square feet. In anticipation of rising activity from owner-occupiers and upgraders, we are also seeing significant volume growth in transactions of these brand-new developments. There is a rise of investment transactions in the second-hand market as well.
SectiontWO
“ What will be the best buy with capital of US$100 million before leverage? ”

Source: Real Capital Analytics
5%
0%
10%
15%
20%
25%
30%
35%
40%
45%
50%
55%
60%
65%
Office Retail Industrial Apartment Hotel Land
2014 5-year average 10-year average
Exhibit 2.3 Asia Inbound and Intra-regional Real Estate Flows (By key sector in Asia)
Hong Kong I
Tokyo I
Singapore I
2,571
3,080
2,579
Shanghai I
Guangzhou I
5,505
2,692Beijing I 2,212
Exhibit 2.4 Destination of Asian Inbound and Intra-regional Flows (By key Asian city)A
s a
% o
f the
per
iod
tota
l
16 17Tug of War : Emerged as a Winner in the Game | Colliers International Tug of War : Emerged as a Winner in the Game | Colliers International
Recommendation: Offices in Pudong
Despite the recent slowdown in economic growth in China, the momentum of retail sales in Shanghai is strong, currently running at around 9% per year. That has proved to be the strongest of the major Asian cities. Heartened by the increasing ranks of the middle class and the government’s initiatives to push urbanization and encourage e-commerce, investors have sought out investment-grade retail developments.
Spilling off from the ongoing growth of e-commerce and online retailing, quality logistics real estate in Shanghai remains attractive to investors. Transaction volume has remained active in the past couple of years despite multiple challenges: large deal sizes, long investment time frames, limited supply and low transparency with market data and government policy. The winning strategy as demonstrated by a number of dominant players such as Global Logistic Properties and the Goodman Group is to build up a portfolio of critical size through both acquisition and development, and add value to the assets by actively manage the whole portfolio.
Regarding the best type of asset to buy in Shanghai, office real estate should stand out due to its lower barriers to entry, simple deal structures, less-demanding asset management and stable rental income stream. In addition, the increasingly sophisticated infrastructure network in the city has brought about more office and business-park investment opportunities in a number of decentralized nodes. Considering our projection that a batch of new supply is in the pipeline, investors may need to extend their original investment time frame to achieve their target returns.
Back to traditional core locations, office buildings in Pudong currently yielding 4.0 to 5.5% are the best investment opportunities in 2015 given sustained end-user demand and prospective rental growth. Depending on the investor’s risk appetite, expected IRR ranges from 12.0 to 15.0% within an investment time frame of five years.
Shanghai
Source: Colliers* Expected IRR before leverage
Favourite Asset ClassesBy key sector, land for development remains the favourite play in Asia, consistent with historical real estate investment trends. Such deals accounted for the majority of transactions over the past 10 years. The office segment has seen the most notable increase in transactions, with the percentage representing 20 to 30% of the total volume in 2014. Logistics as a niche sector has become increasingly popular in Asia.
The Top DestinationsBy virtue of its market size, China is the most-popular destination for inbound real estate and cross-border flows within Asia. In terms of target city, Shanghai stays at the top while the other first-tier Chinese cities including Guangzhou and Beijing are with the top six. Other markets such as Hong Kong, Singapore and Tokyo are on the shopping list since these markets offer similar levels of liquidity, in the order of US$2 billion to US$3 billion per year.
Again, we have focused our recommendations on what asset type to buy in Shanghai, Hong Kong and Singapore, and more importantly at what price (i.e. yield and expected IRR) by answering the question: “What will be the best buy for US$100 million in capital, before leverage?”
FACTOR 1 FACTOR 2 FACTOR 3 FACTOR 4
RecommendationThe most attractive asset type to buy (e.g. Grade A office; Neigbourhood retail mall)
Price levels (USD per sq ft) Entry yield (%) Expected IRR (%) *
Shanghai Office (Buildings in Pudong) 854 4.00 - 5.50 12.00 - 15.00
Source: Real Capital AnalyticsNote: Figures refer to the annual average between 2009 and 2014
Average Annual Volume (US$ million)

FACTOR 1 FACTOR 2 FACTOR 3 FACTOR 4
RecommendationThe most attractive asset type to buy (e.g. Grade A office; Neigbourhood retail mall)
Price levels (USD per sq ft) Entry yield (%) Expected IRR (%) *
Hong Kong Office (Grade A buildings in decentralised locations) 1,282 3.50 12.00 - 13.00
18 19Tug of War : Emerged as a Winner in the Game | Colliers International Tug of War : Emerged as a Winner in the Game | Colliers International
Recommendation: Decentralised Grade A Offices
With real estate yields compressed, a passive “buy-and-hold” strategy is no longer an attractive proposition for investors looking for better risk-adjusted returns in Hong Kong. Amid the expectation of rising funding costs, investors are increasingly turning to value-add opportunities that could provide more promising medium- to long-term capital growth. Other than the quest for better returns, the ongoing need for diversification and the internationalization of the Chinese yuan have created a lot of demand from mainland investors who are determined to move money offshore. Hong Kong is one of the most-important destinations for capital by virtue of its mature legal and regulatory systems, and sophisticated financial market close to home.
Recommendation: Luxury Apartments
In Singapore, quality office assets remain appealing to a broad range of investors including institutional players, opportunistic private-equity investors, wealthy individuals and family offices. The investment rationale continues to rest on the prevailing under-supply situation and buoyant occupancy rates. We expect the substantiation of Singapore’s status as a global business hub to foster further growth in rents and capital values for office properties – particularly unique boutique office assets – in the near to medium term.
Another investment idea is to buy retail assets in well-located suburban areas. The key reason is that rents are expected to hold firm thanks to the growing demand from retailers and F&B operators, who are confident in the market despite the challenge of mounting costs and labour supply issues. With more operators expanding their foothold in suburban locations, investors can seek out opportunities in second-tier developments for creative retail plays that are differentiated from conventional shopping malls, which are mostly dominated by existing industry players.
However, in terms of the best type of asset to buy, high-end luxury apartments should be the top pick in 2015. Transaction volumes have been continuously falling, and the inventory of apartment units from both launched and launch-ready developments has built up as a result. This leads to a softening
In addition, local investors have expressed strong interest in decentralized neighbourhood malls. The investment rationale is principally a defensive play based on steadily growing consumption by the general population, particularly when the local economy is running at about 4% inflation per year. Decentralization is the theme because more people are opting to move outside the city core to suburban districts thanks to the continued improvement of mass-transportation links.
Although the government cooling measures dragged down transaction volumes, pricing in the commercial sector has proved largely immune to the downdraft. Encouraged by the push for industrial revitalization, repositioning plays in Hong Kong, either through conversions or the repositioning of tenants, will continue to attract interest from investors. Given the combination of the scant available of prime office buildings in core areas and cap rates that are compressed to record low levels (i.e. around 3% as of 1Q 2015), there is a natural migration to decentralized locations such as Kowloon East.
Grade A office rents stabilised in 2014 and are expected to pick up in 2015, partly due to the continual growth in mainland financial-services tenants that want to build their presence in Hong Kong. The rental gap between core and decentralized districts, with Central rents currently about three times the size of suburban ones, will continue to narrow as tenants relocate, infrastructure improves, and new commercial facilities open. Current entry yield for Grade A offices in decentralized locations is about 3.5%, and expected IRR before leverage can reach 12 to 13% within a time frame of 5 years.
Hong Kong Singapore
Source: Colliers* Expected IRR before leverage
Source: Colliers* Expected IRR before leverage
FACTOR 1 FACTOR 2 FACTOR 3 FACTOR 4
RecommendationThe most attractive asset type to buy (e.g. Grade A office; Neigbourhood retail mall)
Price levels (USD per sq ft) Entry yield (%) Expected IRR (%) *
Singapore Residential (High-end luxury apartments) 1,300 - 1,700 2.00 - 3.00 12.00 - 15.00
Hong Kong
rmb
MainlandInvestors
of asking prices. With a narrowing price gap between buyers and sellers, we anticipate that residential volume will pick up. We forecast that prospective buyers, particularly wealthy individuals and family offices, will keep an eye out for good-value opportunities, especially in the high-end luxury segment.

0
10
20
30
40
50
2001 2002 2003 2004 2005 2006 2007 2008 2009 2010 2011 2012 2013 2014
21 Tug of War : Emerged as a Winner in the Game | Colliers International
Asian outbound real estate investment continues to strengthen with the latest statistics showing the total volume hitting a record high at US$46 billion in 2014, an increase of 38% YoY. Outbound flows to the United States and Europe constituted about 80% of the total, a typical figure, but Australia is emerging as another popular region for Asia-based investors. As of 2014, the real estate flow from Asia to Australia increased 62% YoY.
Based on our quantitative and qualitative assessment of the pull and push factors, we estimate that the total volume of outbound real estate will increase 61% YoY in 2015. The United States and Europe are very likely to responsible for the bulk of the volume, but Australia has the potential to close the gap with the other two regions in the year ahead.
But what are the interesting hotspots for Asian outbound investors in 2015? Interestingly, London, New York and Sydney were the top three destinations for real estate investment in 2014, but we are seeing Asian investors starting to adapt their strategy to include new markets and assets classes in the search for enhanced returns.
From an investment perspective, Colliers has consolidated our recommendations to suggest the best asset type to buy
Exhibit 3.1 Asia Outbound Real Estate Capital Flows (By key region)
Source: Real Capital Analytics
Americas EMEA Australia Others
in specific overseas cities in the United States, Europe and Australia, and more importantly at what price (i.e. yield and expected IRR) to enter by answering the question: “What will be the best buy with capital of US$100 million before leverage?”
Rea
l Est
ate
Inve
stm
ents
(US
$ bi
llion
)
Opportunities forOutbound Investment
SectiontHREE
“ What will be the best buy with capital of US$100 million before leverage? ”

San Francisco ICalifornia
Chicago IIllinois
Los Angeles ICalifornia
New York City I New York
Houston I Texas
516281
887
2,118
182
Source: Real Capital Analytics
5%
0%
10%
15%
20%
25%
30%
35%
40%
45%
50%
Office Retail Industrial Apartment Hotel Land
2014 5-year average 10-year average
Exhibit 3.2 Asia Outbound Real Estate Investment(By key sector in the United States)
As
a %
of t
he p
erio
d to
tal
22 23Tug of War : Emerged as a Winner in the Game | Colliers International Tug of War : Emerged as a Winner in the Game | Colliers International
3.1 Outbound Investmentto the United States
Source: Real Capital AnalyticsNote: The volume is the annual average between 2009 and 2014, and the minimum cut off per city is US$100 million
Exhibit 3.3 Destination of Asian Investment Capital (By key United States city)
Average Annual Volume (US$ million)
The Top DestinationsNew York’s 8.4 million population makes it the biggest city in the United States. That and its position as the country’s economic capital make it the leading destination for real estate transactions by Asian investors, with an annual average of around US$2.1 billion changing hands between 2009 and 2014. New York remains a primary focus for Asian investors, but there is obvious and increasing interest in a broader spread of locations in the United States due to improved market confidence as well as lack of quality supply in core cities. We are seeing more and more interest from Asian buyers in West Coast cities such as Los Angeles and San Francisco.
Historical Trends
Favourite Asset ClassesDriven by the overall improvement of the U.S. economy and the relative transparency of its political and monetary policies, the United States has been the most popular destination for Asian outbound investment, attracting US$19.1 billion in 2014. Asian investors seek investment in office assets above all else, representing 35 to 40% of the total volume in 2014. But that is a step back from the long-term average of 45 to 50% over the past 10 years.
At the same time, hotels and land have drawn more and more interest from Asian investors in recent years, with hotels accounting for about 30% and land sales 15 to 20% of the total volume of transactions in 2014.

FACTOR 1 FACTOR 2 FACTOR 3 FACTOR 4
RecommendationThe most attractive asset type to buy (e.g. Grade A office; Neigbourhood retail mall)
Price levels (USD per sq ft) Entry yield (%) Expected IRR (%) *
New York City Office (Grade A buildings in city core) 900 - 1,100 4.00 - 4.25 6.00 - 7.00
Source: Colliers* Expected IRR is before leverage
FACTOR 1 FACTOR 2 FACTOR 3 FACTOR 4
RecommendationThe most attractive asset type to buy (e.g. Grade A office; Neigbourhood retail mall)
Price levels (USD per sq ft) Entry yield (%) Expected IRR (%) *
San Francisco Residential (residential sites in core downtown) 200 - 300 3.25 # 12.00 - 15.00
Source: Colliers* Expected IRR is before leverage
24 25Tug of War : Emerged as a Winner in the Game | Colliers International Tug of War : Emerged as a Winner in the Game | Colliers International
Recommendation: Core Offices - Capitalizing on the Growth of TAMI
We recommend that foreign investors with US$100 million in equity capital participate in the core office market through partial interest acquisitions that are effective in terms of tax structure. Although the average deal size is currently about US$218 million, partnering with experienced local owners and operators could help buyers accelerate their entry to the market.
The fundamental reason for the above recommendation is the promising growth of office rents in New York City thanks to a strengthening local economy and the sustained growth of the technology, advertising, media, and information (“TAMI”) industries. TAMI tenants have actually backfilled the vast majority of space vacated by the finance, insurance and real estate (“FIRE”) sector during the aftermath of the global financial crisis. New York City has therefore gradually emerged as a leading global technology hub. The city brought in more than US$3 billion in investment into the TAMI sector in 2014, less than the San Francisco Bay Area but ahead of Boston. New hires in the TAMI sector continue to outpace other business sectors, sustaining NYC’s status as a leading U.S. tech hub
The concrete real estate evidence is the encouraging leasing velocity. A total of 37 million square feet transacted in 2014, the second-highest on record. On the supply side, availability in New York has been falling since 2012, and is currently about 11.5%. There is less than 20 million square feet in office space in the pipeline, either under planning or construction, a small amount for Manhattan, a 500-million-square-foot market.
From an investment perspective, New York City offers a robust and liquid market for office real estate. In 2014, the office investment volume was close to US$17 billion. Historically, pricing for core office assets in Manhattan has ranged from US$700 to 1,000 per square foot, which is largely below
Recommendation: Suburban Offices
The real estate recovery cycle is well under way in Southern California and is maturing for the most-sought-after assets and locations. Core assets are very fully priced and are only appropriate for investors with a much-longer time horizon than five years. These assets are quality offices in the central business district, Class A logistics buildings, in-fill retail, and most of the multi-family sector.
Opportunities for a more-attractive purchase basis (i.e. below replacement cost) with higher current and total returns lie with suburban offices in good locations, but with a little bit of vacancy, under-market rent rolls, or the need for cosmetic upgrades (such as more-appealing entry lobbies, interior finishes and exterior gathering areas). This is due to the still-lingering capital constraints of some owners, and also the emerging appeal of the residential industry.
Recommendation: Residential Development Sites
The investment sweetspot is income-producing office buildings downtown with stable cash flow. That’s the target of most buyers for long-term hold. The most-interesting trend is that overseas buyers, predominantly from Asia, have started snapping up residential units.
For example, China Vanke is the equity purchaser for the Lumina condo towers, a project of 650 luxury condos developed by Tishman Speyer. In addition, Oceanwide is under contract to purchase a site in downtown San Francisco that will be turned into a mixed-use development, comprising over 2 million square feet of residential, hotel, office and retail space.
replacement cost. Currently, the realistic market entry level is from US$900 to US$1,100 per square foot. With an investment time frame of five years, the anticipated exit IRR could reach 6.0 to 7.0%, representing a premium of about 200 to 300 bps over the entry yields.
The all-cash yield for well-located suburban offices is currently in the 5 to 6% range, and we reckon total five-year return is 8 to 9%. With a loan-to-value (LTV) ratio of 50 to 65% and financing costs at 4.0 to 4.5%, leveraged returns can reach 11 to 13%. Average price levels vary widely in Southern California depending on the sub-market but are generally below replacement cost. In many cases, we project the resale price in five years will still be below replacement cost. In Los Angeles and Orange County, current prices range from US$200 to US$275 per square foot for these opportunities. We advise investors to plan for an additional US$15 to US$25 per square foot in spending on any capital upgrades. The current deal sizes are in the range of US$25 million to US$50 million. Transactions would likely involve multiple buildings or small portfolios that require on-site and very-active management. To that end, joint ventures with local operators are a proven and effective entry strategy.
There are other smaller Chinese developers now in the market acquiring much smaller sites for boutique condo projects. For example, a 39-unit condo site was recently sold to a private Chinese investor who is looking to do more of these mid-sized projects in San Francisco.
In terms of pricing, the current average land cost is about US$200 to US$300 per square foot, based on buildable floor area. The all-in development cost will be about US$800 per square foot, but high-quality units might be higher at US$1,000 per square foot. Unleveraged IRR is expected at 12.00 to 15.00% given a two-year construction period within the overall five-year investment time frame.
New York City
Los Angeles
San Francisco
Source: Colliers Note: Price level refers to the average land cost only# Entry yield is based on valuation assuming an existing asset with the said quality is available for sale* Expected IRR before leverage
FACTOR 1 FACTOR 2 FACTOR 3 FACTOR 4
RecommendationThe most attractive asset type to buy (e.g. Grade A office; Neigbourhood retail mall)
Price levels (USD per sq ft) Entry yield (%) Expected IRR (%) *
Los Angeles Office (Grade A buildings in suburban locations) 200 - 275 5.00 - 6.00 8.00 - 9.00
5%
0%
10%
15%
20%
25%
30%
35%
40%
45%
50%
55%
60%
65%
Office Retail Industrial Apartment Hotel Land
Source: Real Capital Analytics
2014 5-year average 10-year average
Exhibit 3.4 Asia Outbound Real Estate Investment(By key sector in EMEA)
Exhibit 3.5 Destination of Asian Investment Capital(By key European city)
As
a %
of t
he p
erio
d to
tal
Source: Real Capital AnalyticsNote: The volume is the annual average between 2009 and 2014, and the minimum cut off per city is US$100 million
London I UK
Frankfurt IGermany
Warsaw I Poland
Brussels I Belgium
Bristol IUK
Milan IItaly
Berlin IGermany
Rome I Italy
Paris I France
6,566
525 210
102
102160290
137812
26 27Tug of War : Emerged as a Winner in the Game | Colliers International Tug of War : Emerged as a Winner in the Game | Colliers International
Historical Trends
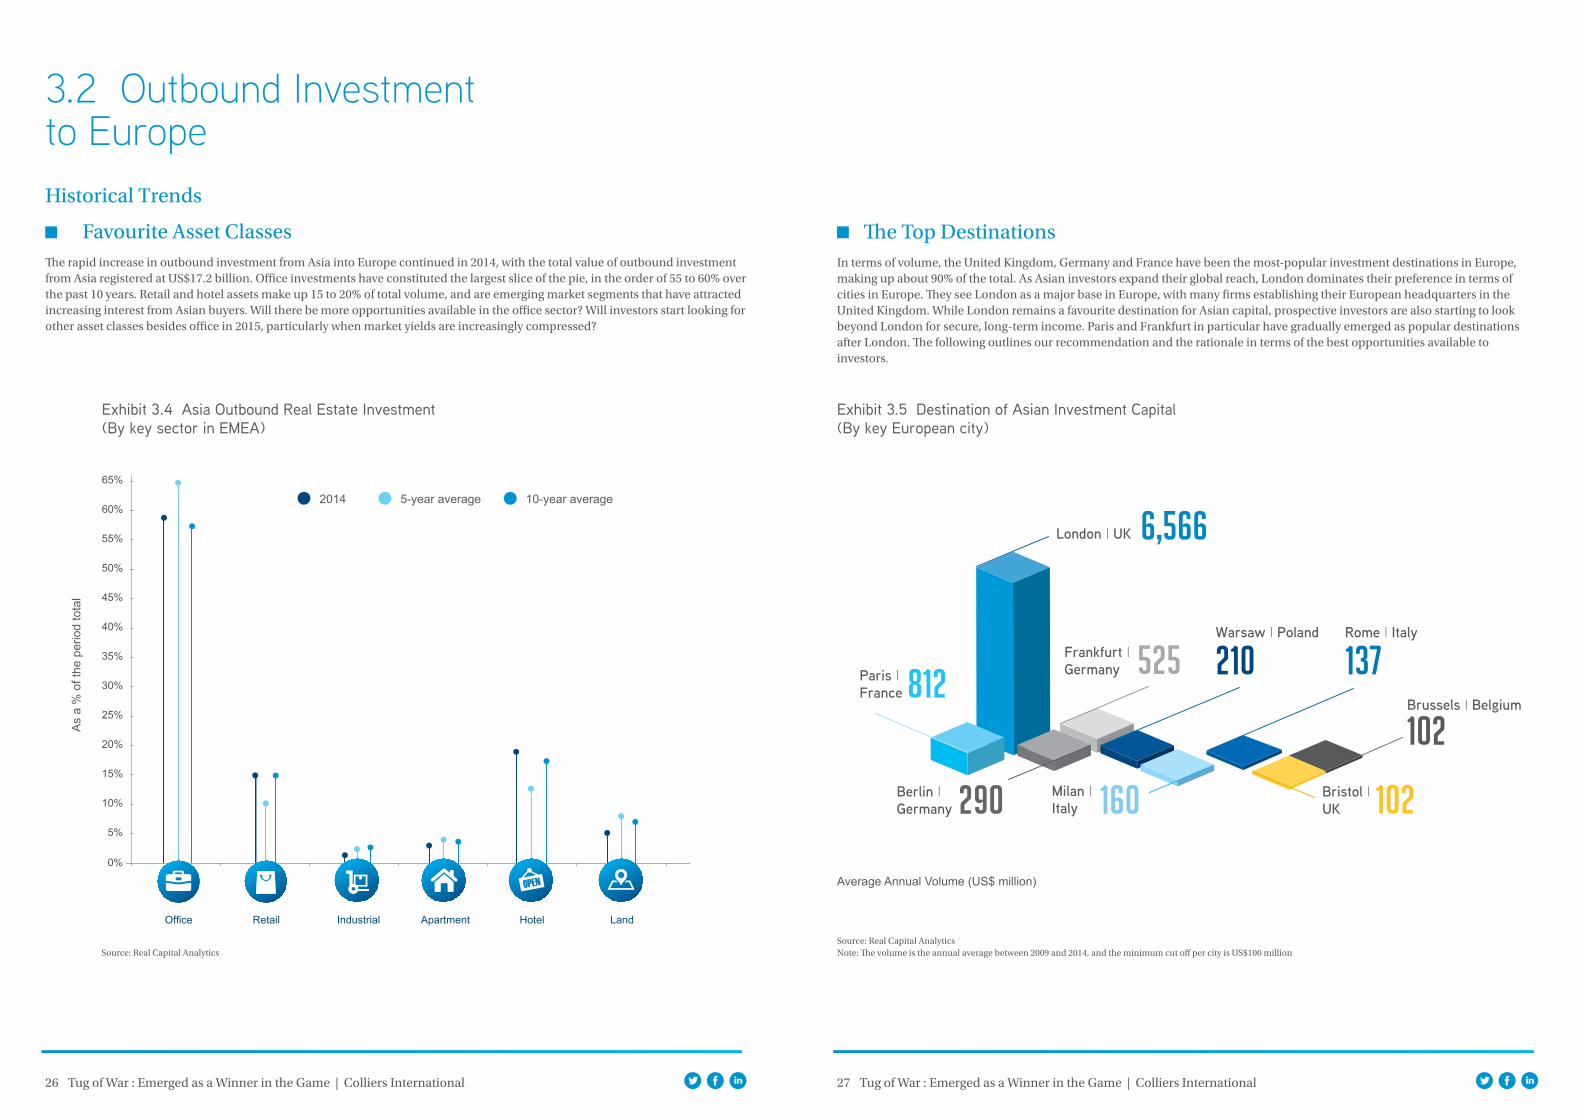
Favourite Asset ClassesThe rapid increase in outbound investment from Asia into Europe continued in 2014, with the total value of outbound investment from Asia registered at US$17.2 billion. Office investments have constituted the largest slice of the pie, in the order of 55 to 60% over the past 10 years. Retail and hotel assets make up 15 to 20% of total volume, and are emerging market segments that have attracted increasing interest from Asian buyers. Will there be more opportunities available in the office sector? Will investors start looking for other asset classes besides office in 2015, particularly when market yields are increasingly compressed?
The Top DestinationsIn terms of volume, the United Kingdom, Germany and France have been the most-popular investment destinations in Europe, making up about 90% of the total. As Asian investors expand their global reach, London dominates their preference in terms of cities in Europe. They see London as a major base in Europe, with many firms establishing their European headquarters in the United Kingdom. While London remains a favourite destination for Asian capital, prospective investors are also starting to look beyond London for secure, long-term income. Paris and Frankfurt in particular have gradually emerged as popular destinations after London. The following outlines our recommendation and the rationale in terms of the best opportunities available to investors.
3.2 Outbound Investmentto Europe
Average Annual Volume (US$ million)

FACTOR 1 FACTOR 2 FACTOR 3 FACTOR 4
RecommendationThe most attractive asset type to buy (e.g. Grade A office; Neigbourhood retail mall)
Price levels (USD per sq ft) Entry yield (%) Expected IRR (%) *
London Office (Grade A stock in City of London) 1,500 4.00 - 4.50 5.00 - 5.50
£1,000 per sq ft
28 29Tug of War : Emerged as a Winner in the Game | Colliers International Tug of War : Emerged as a Winner in the Game | Colliers International
Recommendation: Grade A Office in City of London
By virtue of its high level of market transparency and simple tax laws, London is the undisputed king in terms of the destination for Asian real estate investment. The prestigious schools and universities have also prompted a vast group of well-off Asian families to buy real estate in London for both the investment and education. The trend not only creates tremendous demand for residential units, serviced apartments and hotels but also attracts development interest from a group of developers from Asia, including the Greenland Group and Dalian Wanda from mainland China. Greenland entered London in early 2014 by acquiring the historic Ram Brewery in southwest London with a plan to turn the site into a commercial and residential development. Dalian Wanda actually entered London in 2013 via a hotel development on London’s “South Bank.” However, office acquisitions always make the headlines, and the latest landmark transaction is the sale of Tower Place, an office property in the City of London, to Ping An Insurance from China for US$482 million in late January 2015.
As the top pick for real estate investment in the British capital, we recommend quality office stock in City of London. Our rental forecast for offices in City of London suggests that even entering the market at a low yield is likely to pay off over the next few years, given that rental growth in a number of submarkets (e.g. Victoria) is running at a rate of 10% per year. While this rate is likely to moderate, we are forecasting high single-digit growth over the next few years. Entry yield currently ranges from 4.0 to 4.5% based on an average price level of US$1,500 per square foot. Given projected rental growth, and on a 100% equity basis, the anticipated exit yield is in the region of 5.5% over an investment time frame of five years.
Recommendation: Buying Off-Plan Offices inCore Locations
For most investors, liquidity has been one of the key considerations in sourcing attractive investment opportunities. With an investment time frame of five years, income-producing prime commercial developments are the most attractive assets for prospective investors because of lower liquidity risk and better security of income. However, the investment market in Paris is getting increasingly competitive, and current yields have remained at low levels.
To achieve better returns, buying off-plan office developments in core areas is an attractive investment alternative, as those
Recommendation: Quality Offices in Secondary Locations
Our top investment pick in Frankfurt is existing Grade A office stock in secondary locations. The local office market is extremely liquid, with offices consistently accounting for about 70% of total volumes, and benefits from Frankfurt’s position as leading European financial center. The investment thesis becomes even more-convincing after the central People’s Bank of China (PBoC) appointed the Bank of China as the offshore clearing bank for Chinese yuan in Frankfurt in June 2014.
locations are typically less-sensitive to the economic cycle. On a 100% equity basis and assuming an 18-month rent-free period, the projected exit yield can be at least 100 bps above entry yield (i.e. 5.75 to 6.0%), estimated on the basis of achievable market rents.
At the same time, opportunities remain out there in the marketplace since major local developers are open to teaming up with equity partners for their authorized projects, looking to create a win-win situation for both parties. Buying off-plan from a developer or the so-called “Vente en état futur d’achèvement” (VEFA) contract is very structured and regulated in Paris, so the interests of both the purchaser and vendor are well-protected.
The intense competition for top-quality office space in prime locations has led to substantial yield compression, pushing prime yields below 5% (4.75% as of 1Q 2015). So we recommend looking at Grade A office stock in secondary locations, which offers better risk-adjusted returns.
Average price levels for this type of product are currently in the range of US$300 to US$420 per square foot (or €2,800 to €4,000 per square meter). Average entry yield ranges from 5.5 to 6.0%, or 75 to 100 bps higher than a similar asset in the core areas. Given equity of US$100 million, office properties in secondary locations can provide an unleveraged IRR of 6.0 to 7.0%, 9.0 to 12.0% when leverage is added.
London Paris
Frankfurt
Source: Colliers USD to GBP = 1 to 0.6647 (as of 28 Jan 2015)* Expected IRR is before leverage
However, the opportunity for high returns in London is linked to the growing shortage of institutional-grade assets for sale. As such, joint ventures and partnerships with local asset managers are proving a feasible and profitable way to source both redevelopment and development opportunities, especially outside London’s traditional City and West End core areas.
FACTOR 1 FACTOR 2 FACTOR 3 FACTOR 4
RecommendationThe most attractive asset type to buy (e.g. Grade A office; Neigbourhood retail mall)
Price levels (USD per sq ft) Entry yield (%) Expected IRR (%) *
Frankfurt Office (Grade A quality in secondary location) 300 - 420 5.50 - 6.00 6.00 - 7.00
€2,800 - 4,000 per sq m
FACTOR 1 FACTOR 2 FACTOR 3 FACTOR 4
RecommendationThe most attractive asset type to buy (e.g. Grade A office; Neigbourhood retail mall)
Price levels (USD per sq ft) Entry yield (%) Expected IRR (%) *
Paris Office (Off-plan and tenant free) 650 - 750 5.75 - 6.00 6.00 - 6.50
€6,000 - 7,000 per sq m
Source: Colliers USD to Euro = 1 to 0.8824 (as of 28 Jan 2015)* Expected IRR is before leverage
Source: Colliers USD to Euro = 1 to 0.8824 (as of 28 Jan 2015)* Expected IRR is before leverage

5%
0%
10%
15%
20%
25%
30%
35%
40%
45%
50%
Office Retail Industrial Apartment Hotel Land
2014 5-year average 10-year average
Source: Real Capital Analytics
Exhibit 3.6 Asia Outbound Real Estate Investment(By key sector in Australia)
Source: Real Capital AnalyticsNote: The volume is the annual average between 2009 and 2014, and the minimum cut off by city is US$100 million
Exhibit 3.7 Destination of Asia Investment Capital (By key Australian city)
Melbourne I
Perth I
Brisbane I
Sydney I
1,018
303439
2,164
As
a %
of t
he p
erio
d to
tal
30 31Tug of War : Emerged as a Winner in the Game | Colliers International Tug of War : Emerged as a Winner in the Game | Colliers International
Recommendation: Stick to the Basics
Existing Grade A office buildings in both Sydney and Melbourne are the best real estate assets to purchase in Australia. In terms of the investment rationale, there are a number of key factors supporting this recommendation.
The higher level of liquidity is a very important reason. The second is the consideration of yields. Occupiers in Australia generally sign long leases of up to 10 years. Such security of tenure tends to support higher yields than those associated with other markets in other regions. The entry yield is currently in the order of 6.6 to 7.1%. The average price level in Sydney is US$620 per square foot, which is 30% more expensive than Melbourne. Expected IRR is 8.0% for both cities.
In recent years, one of the key risk factors has been the weakness in occupier demand. However, this is starting to
change, in our view, since we have started seeing a rise in enquiries in the two largest markets in Australia, Sydney and Melbourne. Vacancy rates in Sydney CBD dipped at the end of 2014 thanks to merger activity in the Australian commercial property market. For example, the Canada Pension Plan Investment Board (CPPIB) together with Dexus Property Group finished the acquisition of 100% of the units in the Commonwealth Property Office Fund in April 2014. Frasers Centrepoint from Singapore announced the takeover of Australand Property Group in July 2014.
The opportunities coming up next will be interesting. One of the highlights is that the Investa property portfolio will come to market, we expect. Given the high quality of office assets in the portfolio, the launch is going to be hotly contested by prospective purchasers.
Australia
Source: ColliersUSD to AUD = 1 to 1.2839 (as of 28 Jan 2015)* Expected IRR is before leverage
Historical Trends
Favourite Asset ClassesAsian investors prefer office assets, a persistent pattern over the years. In percentage terms, investment in office assets represents 40 to 45% of the total volume over the last five years, with a retreat to about 35% in 2014. Industrial property assets and land show signs of picking up. The most-obvious increase has occurred in the transaction of development land, where the percentage rose to 30% of volume in 2014 compared with the longer-term average of approximately 15%.
3.3 Outbound Investmentto Australia
FACTOR 1 FACTOR 2 FACTOR 3 FACTOR 4
RecommendationThe most attractive asset type to buy (e.g. Grade A office; Neigbourhood retail mall)
Price levels (USD per sq ft) Entry yield (%) Expected IRR (%) *
Sydney Office (Grade A) 620 7.07 8.00
AUD8,556 per sq m
Melbourne Office (Grade A) 479 6.65 8.00
AUD6,601 per sq m
The Top DestinationsIn terms of geography, Sydney and Melbourne have historically tended to attract the most investment. However, other locations in Australia such as Brisbane and Perth are also on the radar of investors. While investment into other state-capital cities has occurred it remains at levels well below those of Sydney and Melbourne.
In response to the question “What property asset class and which location in Australia would you invest US$100 million?” we provide the following recommendations. It is notable that our picks may not perfectly align with historical trends.
Average Annual Volume (US$ million)

502 offices in 67 countries on 6 continentsUnited States: 140 Canada: 31 Latin America: 24 Asia : 39 ANZ: 160 EMEA: 108
$2.3billion in annual revenue
1.70billion square feet under management
16,300professionals and staff
Copyright © 2015 Colliers International.
The information contained herein has been obtained from sources deemed reliable. While every reasonable effort has been made to ensure its accuracy, we cannot guarantee it. No responsibility is assumed for any inaccuracies. Readers are encouraged to consult their professional advisors prior to acting on any of the material contained in this report.
About Colliers International
Colliers International is a global leader in commercial real estate services, with over 16,300 professionals operating out of more than 502 offices in 67 countries. A subsidiary of FirstService Corporation, Colliers International delivers a full range of services to real estate users, owners and investors worldwide, including global corporate solutions, brokerage, property and asset management, hotel investment sales and consulting, valuation, consulting and appraisal services, mortgage banking and insightful research. The latest annual survey by the Lipsey Company ranked Colliers International as the second-most recognized commercial real estate firm in the world.
colliers.com
Colliers International (Hong Kong) LimitedSuite 5701 Central Plaza 18 Harbour Road, WanchaiHong Kong
TEL +852 2828 9888Company Licence No: C-006052
Primary Authors:Simon Lo Executive DirectorResearch and Advisory | [email protected]
Jessy ChungAssistant ManagerResearch and Advisory | [email protected]
Contributors:ChinaCarlby XieDirectorResearch | [email protected]
SingaporeSiew-Chuin ChiaDirectorResearch & [email protected]
Hong KongJoanne LeeSenior ManagerResearch and [email protected]
United StatesPete CullineyDirectorResearch | [email protected]
EuropeBruno BerrettaSenior Research AnalystResearch & Forecasting | [email protected]
AustraliaNerida ConisbeeNational Director | [email protected]