2015 business survey - dallas › government › council meeting... · 2016-02-01 · confer for...
TRANSCRIPT


2015 Business SurveyCity of Dallas, Texas
Presented by
February 2016

More than 2,050,000 Persons Surveyed Since 2006 for more than 850 cities in 49 States
A National Leader in Market Research for Local Governmental Organizations…helping city and county governments gather and use survey data to enhance
organizational performance for more than 30 years
2
ETC Institute

Agenda
3
• Purpose and methodology• Perceptions of the community• Reasons business will stay in Dallas• Satisfaction with city services• Services that are most important to
businesses• How the survey results vary by
district and type of business • Summary and Questions

• Objectively assess how well the City of Dallas is serving the needs of the City’s business community
• Gather information about the characteristics of businesses in the City
• Provide a tool for assessing the City’s performance over time
Purpose
4

Methodology
5
• Survey Description six-page survey took about 15-20 minutes to complete
• Method of Administration by mail, phone and online random sample of business owners/managers in the City
• Sample size: 1,470 completed surveys, including at least 100 in each of
the 14 Council Districts• Confidence level: 95% • Margin of error: +/- 2.5% overall
• All sizes of business (large and small) were represented in the survey

6
Good RepresentationBy Type of Business
7
Good RepresentationBy Size of Business

8
2015 City of Dallas Business Survey Location of Respondents
Good RepresentationBy Location

Bottom Line Up Front
9
Dallas businesses give the City’s business climate very high marks!
Most businesses are satisfied with the quality of city services, but there are opportunities to do better.
The most important city services to businesses are: police services street maintenance water services
The factors that will have the most influence of the City’s ability to keep existing businesses in Dallas are: the crime rate level of taxation access to major highways

Perceptions of the Community
10

11Businesses Have a Positive Perception of How the City Is Working to Attract New Businesses, Retain Existing Businesses, & Support Business Growth & Development 11

Businesses Gave Good Ratings for the City’s Labor Pool 12

62% of Businesses Are Satisfied with the Current Business Climate in the City, Compared to only 13% Who Are Dissatisfied
1313

Most areas are in BLUE, which indicates that
businesses in most parts of the City are satisfied
SatisfactionMean rating on a 5-point scale
ETC INSTITUTE
1.0-1.8 Very Dissatisfied
1.8-2.6 Dissatisfied
2.6-3.4 Neutral
3.4-4.2 Satisfied
4.2-5.0 Very Satisfied
No Response
Q6. How satisfied are you with the current overall business climate in the City of Dallas?
14
75% of Businesses Feel the Business Climate in the City Will Get Better or Stay the Same Over the Next Two Years, Compared to only 12% Who Feel It Will Get Worse
1515

78% of Businesses Would Be Very Likely, Likely, or Somewhat Likely to Locate Their Business in the City if They Started Over Today, Compared to only 17% Who Would Not Be Likely
1616

83% of Businesses Would Be Very Likely, Likely, or Somewhat Likely to Recommend Dallas as a Business Location, Compared to only 12% Who Would Not Be Likely
1717

Reasons Businesses Will Stay in Dallas
18

Low Crime Rate, Level of Taxation and Access to Major Highways Are Most Important
1919

Satisfaction with City Services
20
Most Businesses Give Positive Ratings for City Services 21
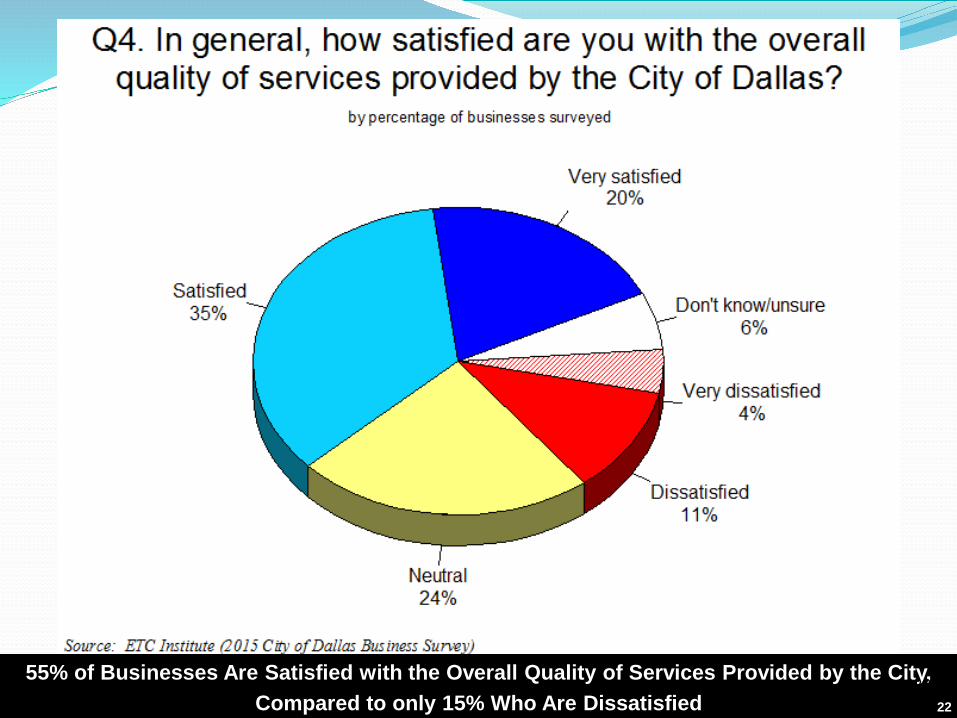
55% of Businesses Are Satisfied with the Overall Quality of Services Provided by the City, Compared to only 15% Who Are Dissatisfied
2222
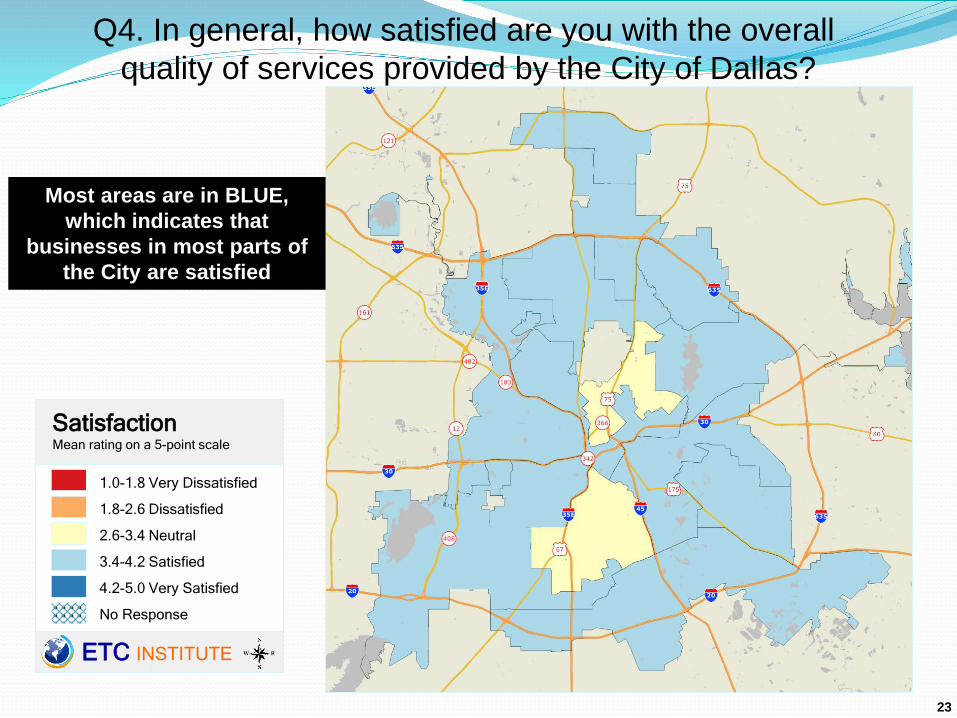
Most areas are in BLUE, which indicates that
businesses in most parts of the City are satisfied
SatisfactionMean rating on a 5-point scale
ETC INSTITUTE
1.0-1.8 Very Dissatisfied
1.8-2.6 Dissatisfied
2.6-3.4 Neutral
3.4-4.2 Satisfied
4.2-5.0 Very Satisfied
No Response
Q4. In general, how satisfied are you with the overall quality of services provided by the City of Dallas?
23
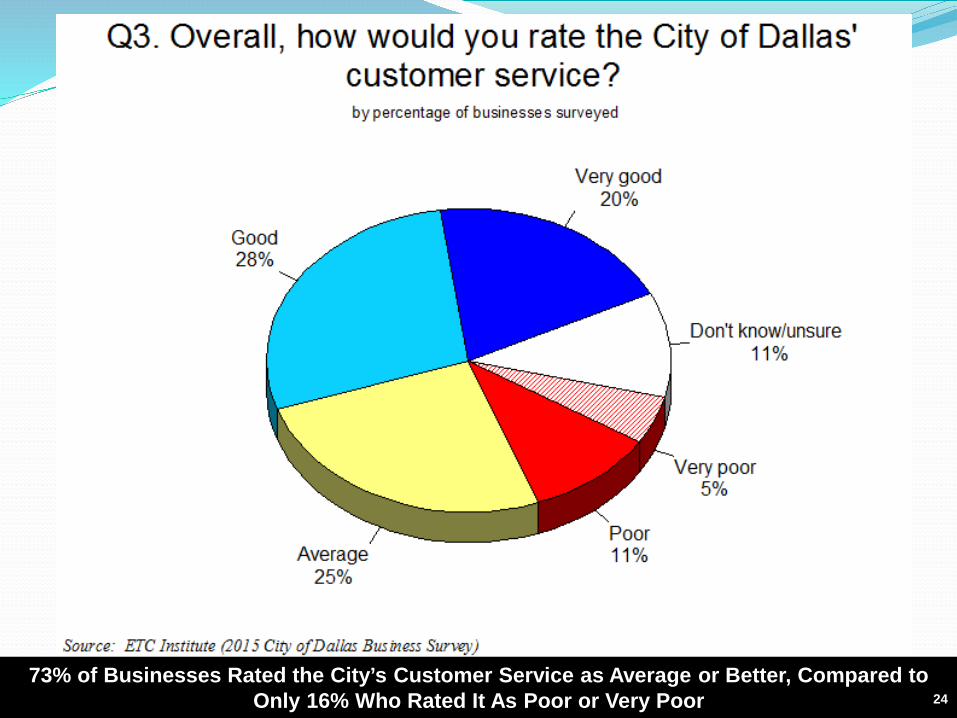
73% of Businesses Rated the City’s Customer Service as Average or Better, Compared to Only 16% Who Rated It As Poor or Very Poor 24
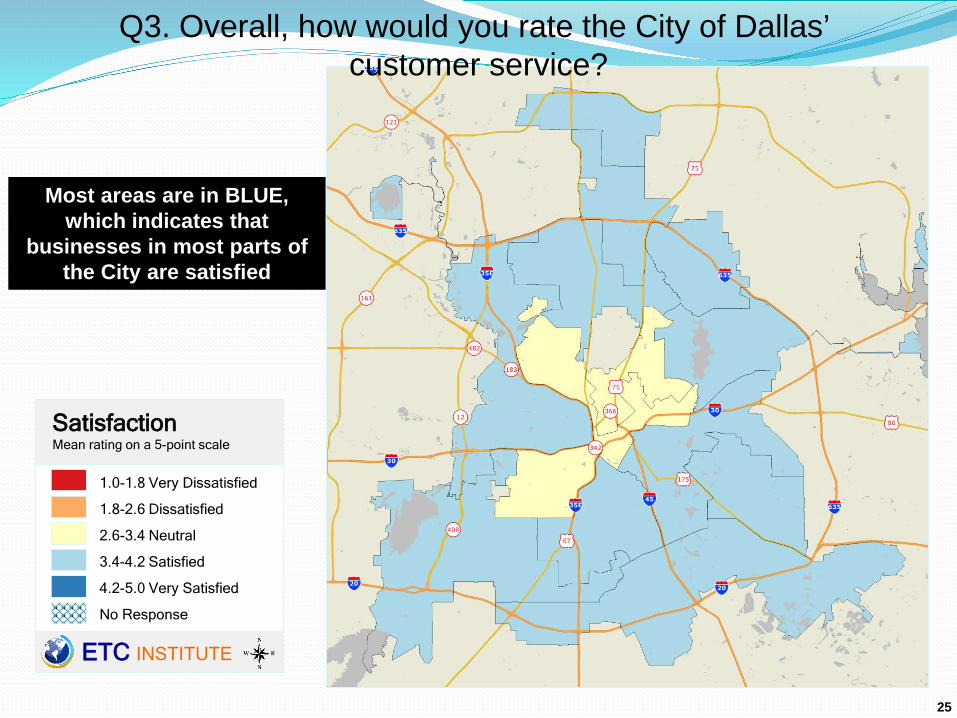
Most areas are in BLUE, which indicates that
businesses in most parts of the City are satisfied
SatisfactionMean rating on a 5-point scale
ETC INSTITUTE
1.0-1.8 Very Dissatisfied
1.8-2.6 Dissatisfied
2.6-3.4 Neutral
3.4-4.2 Satisfied
4.2-5.0 Very Satisfied
No Response
Q3. Overall, how would you rate the City of Dallas’ customer service?
25

Services That Are Most Important to Businesses
26

The Police Department, Water Services and Street Maintenance Are the Most Important Services/Departments to Businesses 27
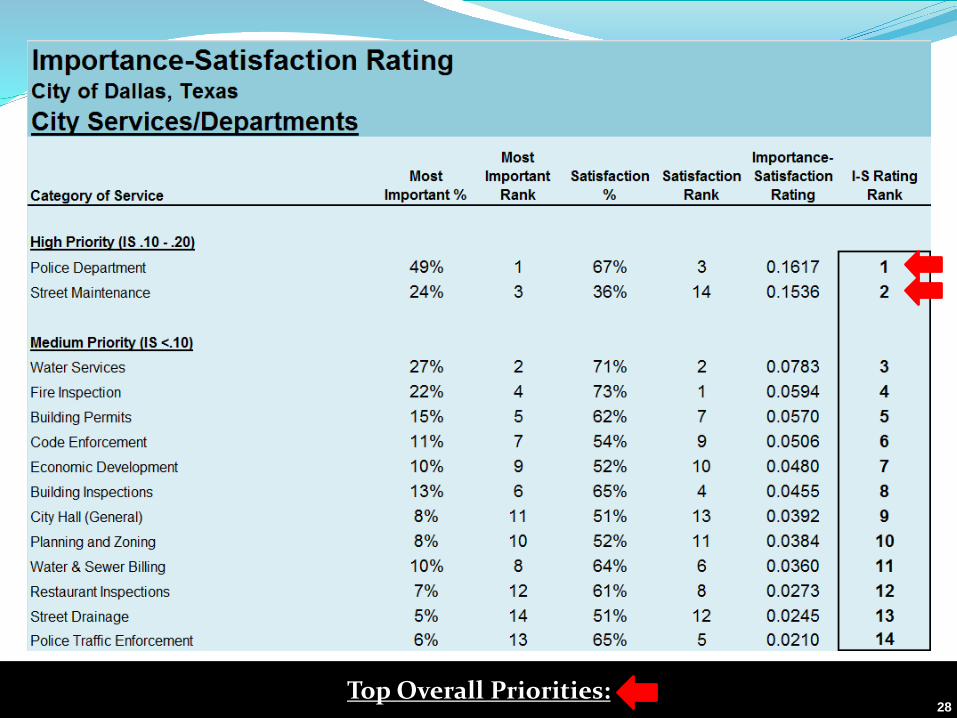
28Top Overall Priorities:28

How Does Dallas Compare to Other
Large Cities?
29

30

31

32
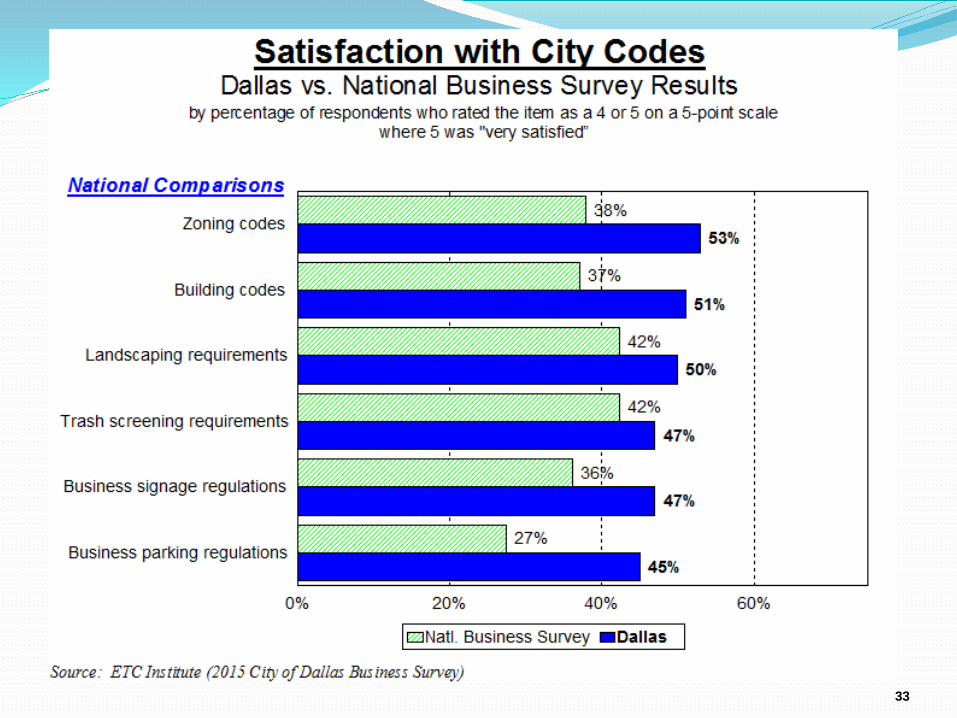
33
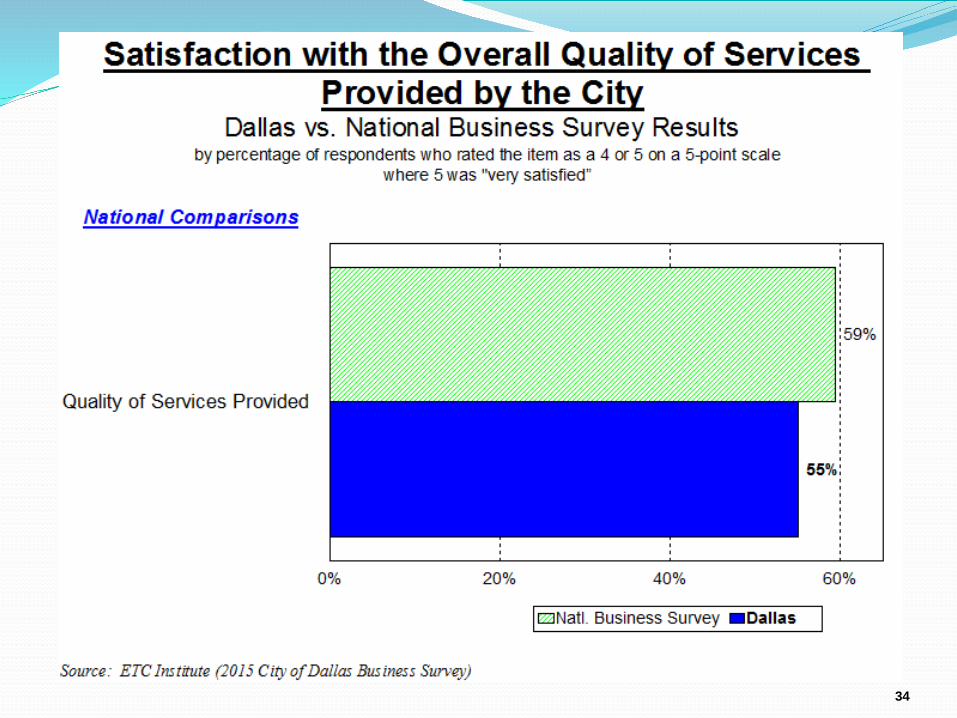
34
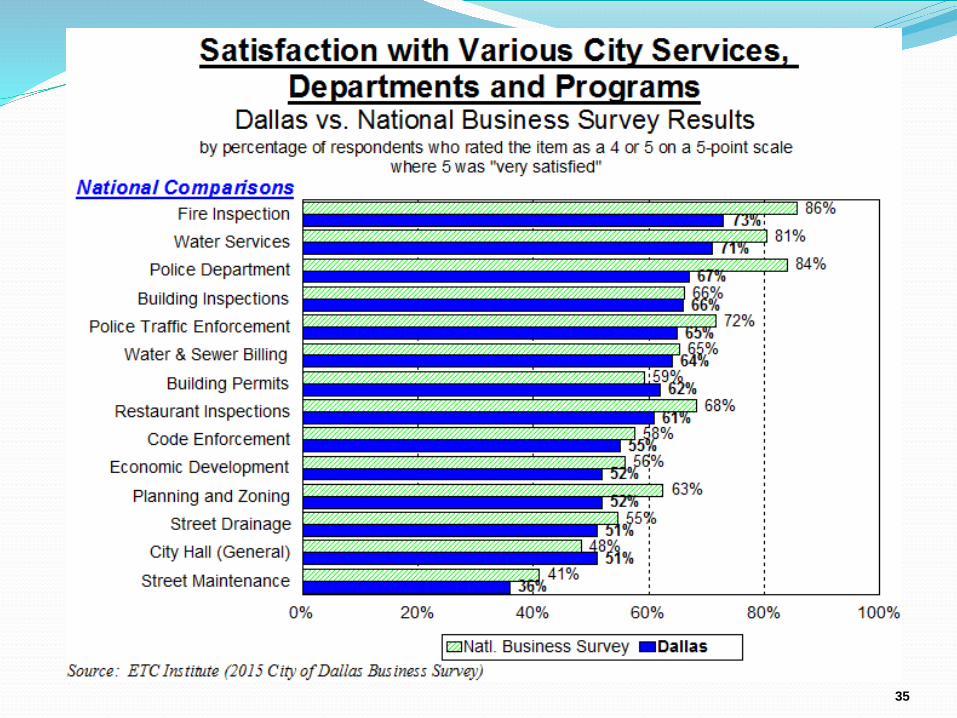
35
Comparisons by Council District and
Type of Business
36

37
In general, how satisfied are you with the overall quality of services provided by the City of Dallas?

38
How satisfied are you with the current overall business climate in the City of Dallas?

39
Which of the following best describes what you believe the business climate will be like in Dallas two years from now?
How Do the Business Survey Results Compare to the
Resident Survey?
40

41
How Business Satisfaction Compares to Resident Satisfaction in Dallas
Businesses Residents DifferenceSatisfaction with City ServicesCode Enforcement 55% 42% 13%Water Services 71% 69% 2%Police Department 67% 68% -1%Planning and Zoning 52% 53% -1%Customer Service 48% 50% -2%Street Drainage 51% 64% -13%Fire Inspection 73% 89% -16%Economic Development 52% 73% -21%
Perceptions of the CityOverall quality of services provided 55% 59% -4%Value received for City taxes paid 36% 44% -8%Working on easing traffic congestion 33% 49% -16%Quality of development in the City 55% 73% -18%

Summary
42
Dallas businesses give the City’s business climate very high marks!
Most businesses are satisfied with the quality of city services, but there are opportunities to do better.
The most important city services to businesses are: police services street maintenance water services
The factors that will have the most influence of the City’s ability to keep existing businesses in Dallas are: the crime rate level of taxation access to major highways

Questions?
THANK YOU!!
43
Dallas City Council RetreatFebruary 2, 2016
Dallas Police and Fire Pension SystemKelly Gottschalk, Executive Director
1

DPFP Update • Actuarial Services
• New Actuary - Segal Consulting engaged January 2016• Transition is underway, however the change will delay both the
experience study and the final recommendation on the Plan Amendment changes.
• Legal Services• Outside Legal Counsel
• Will be issuing an RFQ for Legal Services. A subcommittee of the Board will review the RFQ and interview firms. CM Griggs is the Chair of the subcommittee. The full Board will hire the Legal Counsel.
2

DPFP Update• Asset Allocation & Investment Policy
• On track to have a new Asset Allocation and Investment Policy presented to the Board in March.
• Diamond McCarthy Review• First phase was originally expected to be compete by
12/31/15. The volume of the data and the complexity of the transactions exceeded their expectations so additional time is necessary to complete the first phase. The first phase on most areas will be complete in March or April.
• The Board was presented a portion of the first phase results in January and we are proceeding to the next phases on the information presented.
3

Timeline for Plan Amendment
January-March Actuarial Firm TransitionMarch Conduct Member SurveyEnd of March Actuarial Experience Study CompleteFebruary - April Scenario AnalysisMay Present Preferred Committee Recommendation to the BoardMay Seek City Feedback on Committee Recommendation as Amended by the BoardJune Member Meetings to Discuss Preliminary RecommendationJune Board Adopts Plan Amendment Proposal and Calls ElectionJuly Member Meetings to Discuss Proposed Plan AmendmentsJuly Actuarial Valuation CompleteAugust Plan Amendment ElectionAugust Discuss Potential Legislative Actions with the CityJuly - October Talk with Legislative Consultants and/or Legislators Regarding Upcoming Pension LegislationNovember Complete Final Draft of Proposed LegislationJanuary 2017 Introduce Bill to Legislature
Plan Amendment Timeline
4


City of Dallas
Meet & Confer and Uniformed Pay Concepts
February 2016
1
Presentation Overview
Meet & Confer Overview Elements of Uniformed Pay Steps Special Pay
Appendix – Special Pay Schedules
2
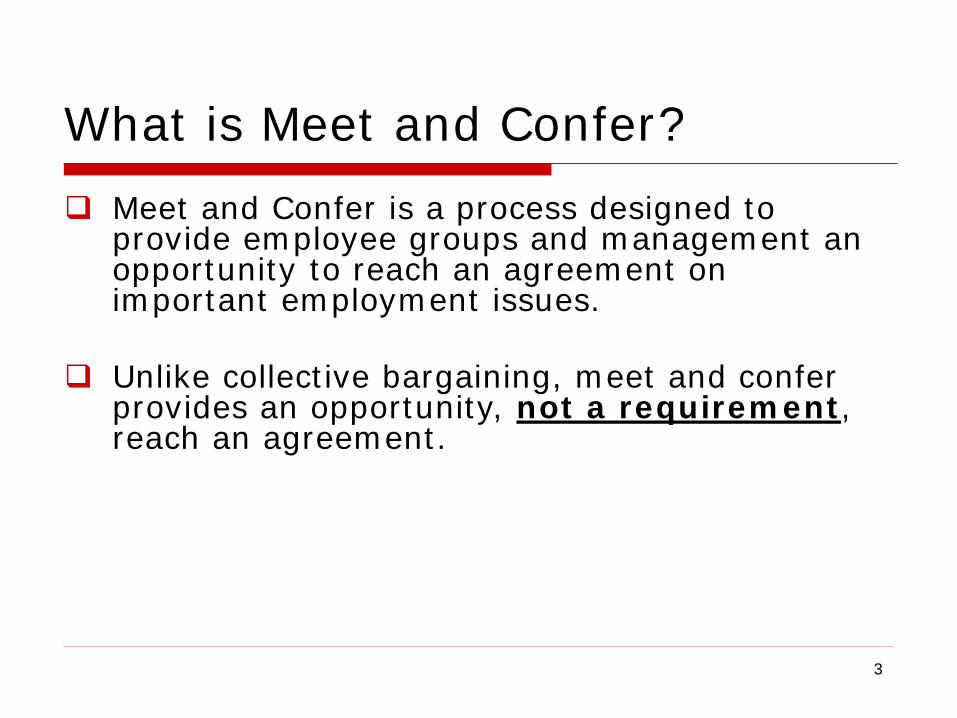
What is Meet and Confer? Meet and Confer is a process designed to
provide employee groups and management an opportunity to reach an agreement on important employment issues.
Unlike collective bargaining, meet and confer provides an opportunity, not a requirement, reach an agreement.
3

Meet and Confer Overview
Date Action
2009 Texas State Legislature approved Meet and Confer for Dallas Police & Fire
February 5, 2010 Uniform Coalition Team submitted petition to City Manager to Meet and Confer
Feb. 24, 2010Council accepted petition and authorized management team to begin discussions with the Uniform Coalition Team
September 1, 2010
Council approves 1st Meet & Confer Agreement• Effective 10/1/2010 – 9/30/2013• Includes six-month extension
December 11, 2013Council approves 2nd Meet & Confer Agreement• Effective 12/11/2013 – 9/30/2016 4
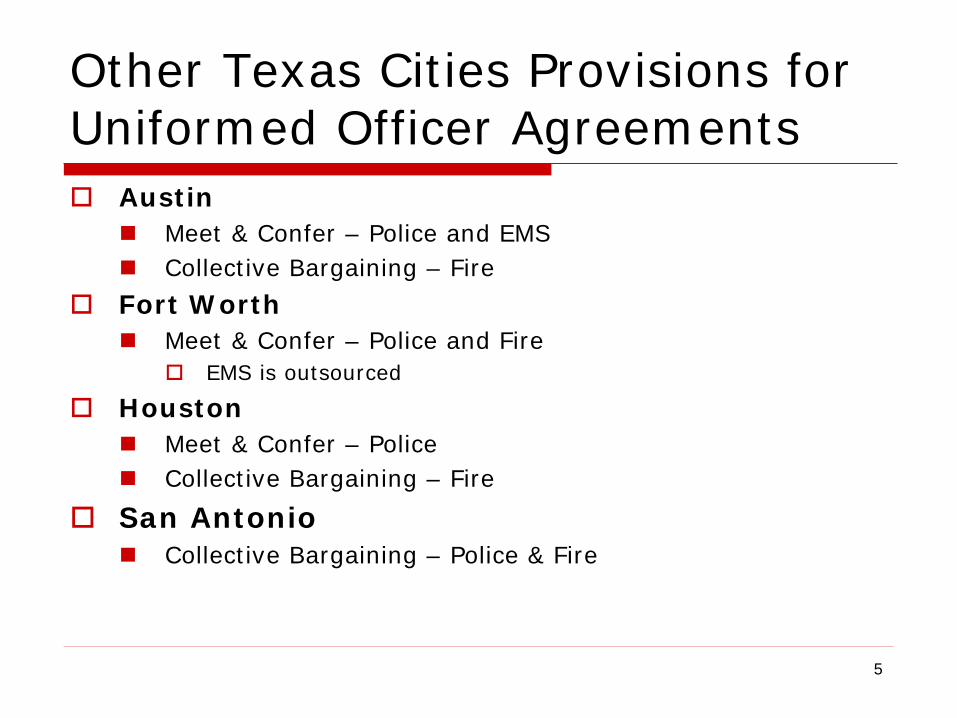
Other Texas Cities Provisions for Uniformed Officer Agreements Austin
Meet & Confer – Police and EMS Collective Bargaining – Fire
Fort Worth Meet & Confer – Police and Fire
EMS is outsourced
Houston Meet & Confer – Police Collective Bargaining – Fire
San Antonio Collective Bargaining – Police & Fire
5

Year 1 (FY10-11) Year 2 (FY11-12) Year 3 (FY12-13)• 40 Hours Mandatory City Leave (aka
“Furlough Days”) (Equates to a 1.9231% pay reduction)*
• Comp Time for Overtime• Establish Phase Down Plan• Delay Fire Rookie Classes from
Paramedic School • Reduce Number of Fire Rescue
Replacements • Delay Truck 10 Implementation to Jan.
2011• Hiring for ½ Attrition in DPD• Modify Loss of Merit Step Procedure in
DPD• Off Duty Jobs for Special Events• Time Off For Association Business• Reconfigure Fire Dispatch Schedule• Study Single Career Path in Fire• Suspend Fire Wellness Program
• 24 Hours Mandatory City Leave (aka “Furlough Days”) (Equates to a 1.1538% pay reduction)
• Reinstate Merit Step Increase (If City Meets Revenue Trigger)
– If revenue trigger is not met, a “Retention Incentive” will go into effect for recently hired officers
• Reinstate (or continue) Merit Step Increase (if City Meets Revenue Trigger)
– If revenue trigger is not met, a “Retention Incentive” will go into effect for recently hired officers
• 3% Across The Board Pay Raise
• 2 Additional Holidays for Uniformed Staff
• Increase Education Incentive Pay (April 1st)
6* Fire Personnel in the Emergency Response Bureau work a schedule that is not the ‘Standard’ 40/hrs per week. Because of this, all
work hours must be adjusted to account for their modified schedule. For the purpose of this agreement, hours quoted are based on astandard work schedule.
Summary 2010 Meet & Confer Agreement Overview
Revenue triggers not met - Steps not reinstated. Retention incentive of $1,000 provided to newly hired officers.

Year 1 (FY13-14) Year 2 (FY14-15) Year 3 (FY15-16)• Merit Steps• Add “Swift Water Pay” as a
special pay item in Fire Department
• Revise “Phase Down” program
• Merit Steps• 4% Across-the-Board
Increase• Eliminate two additional
holidays awarded in 2010 Agreement
• Merit Steps
7
Summary 2013 Meet & Confer Agreement Overview

ELEMENTS OF UNIFORMED PAY
8

Elements of Uniform Pay Two components of Uniform Pay
1. Steps Sometimes referred to as ‘base pay’
2. Special Pay Items
9

STEPS
10

What are “Steps”?
Police and Fire Uniformed officers are on a “Step” pay system.
Each Rank (Police Officer, Sr. Corporal, Fire Fighter, etc.) has Steps. The number of Steps ranges from 11 to 13, depending on the
Rank
11

Step Distribution
12
Step FireRescue Officer
Fire Driver/ Engineer
FireLieutenant
Fire Captain
Fire BattalionChief
Police Officer
Police Sr. Corporal
PoliceSgt
PoliceLieutenant
PoliceCaptain
1 226 3702 168 13 27 3 398 252 94 64 119 11 112 47 355 9 14 1 59 87 21 86 12 26 13 1 39 114 41 97 125 26 20 20 4 32 110 34 28 264 33 21 12 3 45 114 36 109 18 30 11 14 3 33 91 37 610 24 18 14 3 3 23 67 38 711 41 27 82 83 24 210 63 226 48 212 26 167 43813 3714 2215 207
= Ghost Steps (no longer in use)
Step Distribution as of January 2016 (Does not include Executive Ranks)Fire Ranks (Grades) Police Ranks (Grades)
Data as of January 2016= Top Step for Rank

How do Officers get “Steps”?
Officers receive Step increases in two ways: ‘Within-Rank Step increases’
Awarded as part of the budgetary process. Within-Rank Step increases are either ‘yes’ or ‘no’ and the
award of the Step does not vary based on performance. As long as officers meet the minimum standards for the position, they may receive a Within-Rank Step increase.
Generally, Steps are about a 5% increase from the previous Step.
Once officers “Top Out” (i.e. hit the top Step of their Rank), they are not eligible for any more Within-Rank Step increases.
‘Promotional Step increases’ Awarded when officers promote to a new rank (Police Officer to
Sr. Corporal, for example). Officers’ pay is increased to the Step in the new rank that
gives them at least a 4.5% pay increase.
13

Other Important Step Concepts “Topped-Out”
Once officers reach the top Step in their Rank, they are no longer eligible for additional Within-Rank Step increases. This is referred to as “topped-out”.
Data as of January 2016 – Number of topped out officers should increase as more are given steps throughout FY15-16
The City occasionally adds Steps to the Pay Schedule to allow officers in Ranks to earn more money. Last time steps were added was in FY07-08 and FY08-09 (one each year)
Topped-out officers can also receive additional base pay with across-the-board increases – schedule shifts up by the percent increase Pay schedule increased 4% on 4/1/15
Not eligible for a Within-Rank Step increase
% Topped OutNo 571Yes 1356No 937Yes 2543
Fire
Police
Step Eligible
29.6%
26.9%
14

Other Important Step Concepts “Compression/Decompression”
Currently, all Steps are one-year minimum Steps - this is the minimum number of years an Officer must be in the Step before being eligible for the next Within-Rank Step.
There have been other times when some Steps were one-year Steps while others were two-year Steps.
When all Steps became minimum one-year Steps (in FY07-08), it was referred to as “Compressing the Steps.”
If some Steps changed to two-year Steps again, this would be referred to as “Decompressing the Steps.”
15
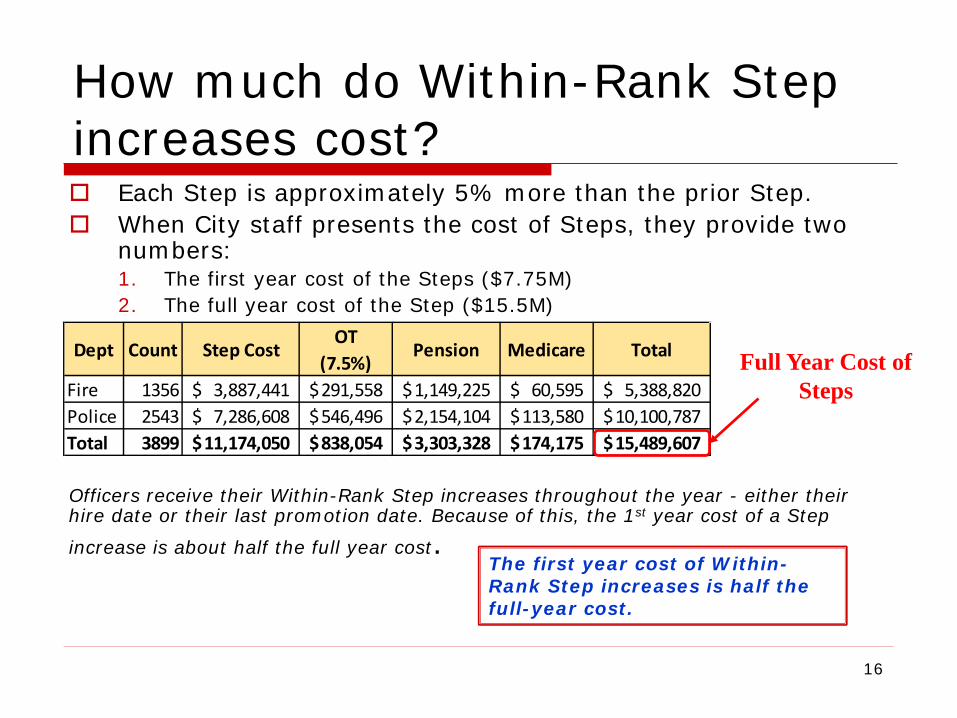
How much do Within-Rank Step increases cost? Each Step is approximately 5% more than the prior Step. When City staff presents the cost of Steps, they provide two
numbers:1. The first year cost of the Steps ($7.75M)2. The full year cost of the Step ($15.5M)
Officers receive their Within-Rank Step increases throughout the year - either their hire date or their last promotion date. Because of this, the 1st year cost of a Step
increase is about half the full year cost.The first year cost of Within-Rank Step increases is half the full-year cost.
Dept Count Step CostOT
(7.5%)Pension Medicare Total
Fire 1356 3,887,441$ 291,558$ 1,149,225$ 60,595$ 5,388,820$ Police 2543 7,286,608$ 546,496$ 2,154,104$ 113,580$ 10,100,787$ Total 3899 11,174,050$ 838,054$ 3,303,328$ 174,175$ 15,489,607$
Full Year Cost of Steps
16

What does the Police “Pay Schedule” look like?
Pay (monthly and annual) associated with the Grade/Step. Generally, each Step is 5% more than the prior Step.
Rank
Grade/Step
Minimum number of years an officer has to be in the Step before they are eligible for the next Step
Important!
17

What does the Fire “Pay Schedule” look like?
Important!
18
SPECIAL PAY
19

What is “Special Pay”? In addition to ‘Step’ Pay (often called ‘base pay’), officers are also
eligible for a variety of “Special Pay” items Special Pay items include:
Up to $3,600 per year - Education Incentive Pay Up to $6,000 per year - Certification Pay Up to $1,200 per year - Service Pay (also called Longevity Pay) $1,200 per year - Detective Assignment Pay $1,200 per year - Field Training Officer Pay Up to $1,800 per year - Patrol Duty Pay 3.5% or 6.5% of pay - Police Shift Assignment Pay Up to $4,200 per year - Aircraft Rescue (ARFF) Pay Up to $4,800 per year - EMS Assignment Pay $2,100 per year - Arson Investigator Pay Up to $4,200 per year - HAZMAT Pay Up to $4,200 per year - Urban Search and Rescue Pay
Special Pay items are a large component of officers’ pay Fire special pay averages $7,711 per year Police special pay averages $7,755 per year See next page for Special Pay by rank
Complete list of Dallas’ Special Pay Items are on pages 24 & 25of this briefing 20

Base and Special Pay averages by Rank
RankNumber of
OfficersAverageBase Pay
AverageSpecial Pay
AverageTotal Pay
F2 - Fire Rescue Officer 1054 55,347$ 6,423$ 61,770$ F3 - Fire Driver Engineer 468 67,799$ 8,653$ 76,453$ F4 - Fire Lieutenant 202 78,488$ 9,385$ 87,873$ F5 - Fire Captain 146 89,788$ 10,225$ 100,013$ F6 - Battalion/Section Chief 38 100,661$ 11,713$ 112,374$ F7 - Deputy Chief 12 104,453$ 10,877$ 115,330$ F8 - Assistant Chief 6 122,789$ 11,732$ 134,521$ F9 - Chief 1 189,520$ 5,544$ 195,064$ Average for all Fire Ranks 1927 64,886$ 7,711$ 72,597$ P2 - Trainee/Offier 1489 53,040$ 5,914$ 58,953$ P3 - Senior Corporal 1383 67,160$ 8,874$ 76,033$ P4 - Sergeant 478 79,761$ 9,504$ 89,265$ P5 - Lieutenant 90 89,136$ 10,309$ 99,444$ P6 - Captain/Major 15 99,435$ 10,845$ 110,281$ P7 - Deputy Chief 15 106,481$ 11,085$ 117,566$ P8 - Assistant Chief 9 124,225$ 11,094$ 135,318$ P9 - Chief 1 208,945$ 10,800$ 219,746$ Average for all Police Ranks 3480 63,914$ 7,755$ 71,669$
Average Pay for Uniformed Officers as of January, 2016Fi
rePo
lice
21
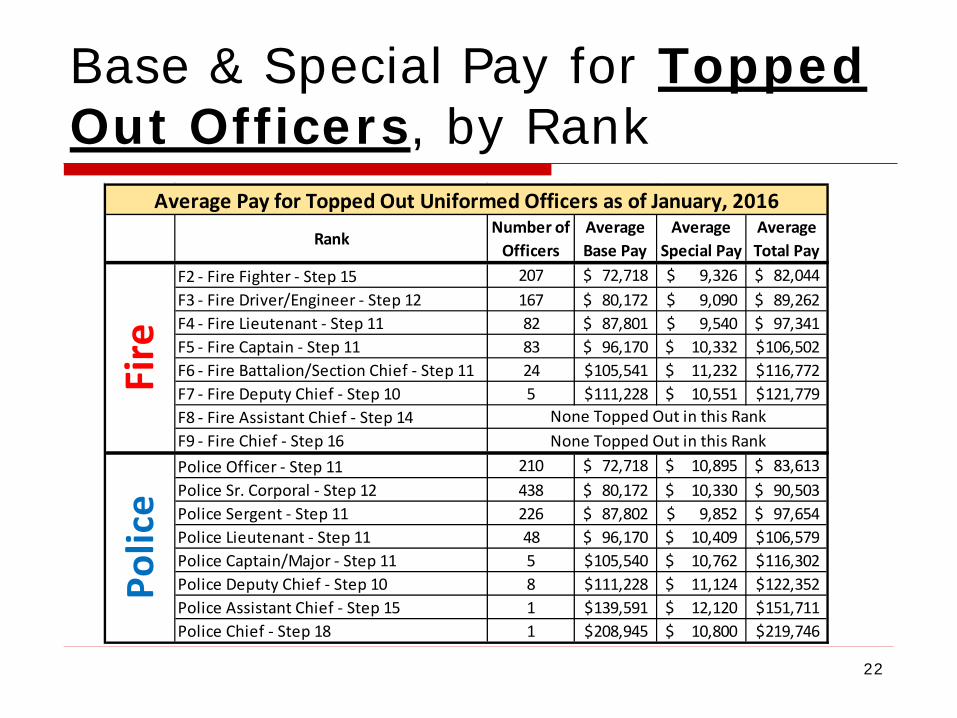
Base & Special Pay for Topped Out Officers, by Rank
22
RankNumber of
OfficersAverageBase Pay
AverageSpecial Pay
AverageTotal Pay
F2 - Fire Fighter - Step 15 207 72,718$ 9,326$ 82,044$ F3 - Fire Driver/Engineer - Step 12 167 80,172$ 9,090$ 89,262$ F4 - Fire Lieutenant - Step 11 82 87,801$ 9,540$ 97,341$ F5 - Fire Captain - Step 11 83 96,170$ 10,332$ 106,502$ F6 - Fire Battalion/Section Chief - Step 11 24 105,541$ 11,232$ 116,772$ F7 - Fire Deputy Chief - Step 10 5 111,228$ 10,551$ 121,779$ F8 - Fire Assistant Chief - Step 14F9 - Fire Chief - Step 16Police Officer - Step 11 210 72,718$ 10,895$ 83,613$ Police Sr. Corporal - Step 12 438 80,172$ 10,330$ 90,503$ Police Sergent - Step 11 226 87,802$ 9,852$ 97,654$ Police Lieutenant - Step 11 48 96,170$ 10,409$ 106,579$ Police Captain/Major - Step 11 5 105,540$ 10,762$ 116,302$ Police Deputy Chief - Step 10 8 111,228$ 11,124$ 122,352$ Police Assistant Chief - Step 15 1 139,591$ 12,120$ 151,711$ Police Chief - Step 18 1 208,945$ 10,800$ 219,746$
Polic
eAverage Pay for Topped Out Uniformed Officers as of January, 2016
Fire
None Topped Out in this RankNone Topped Out in this Rank

CITY OF DALLAS SPECIAL PAY SCHEDULES
23
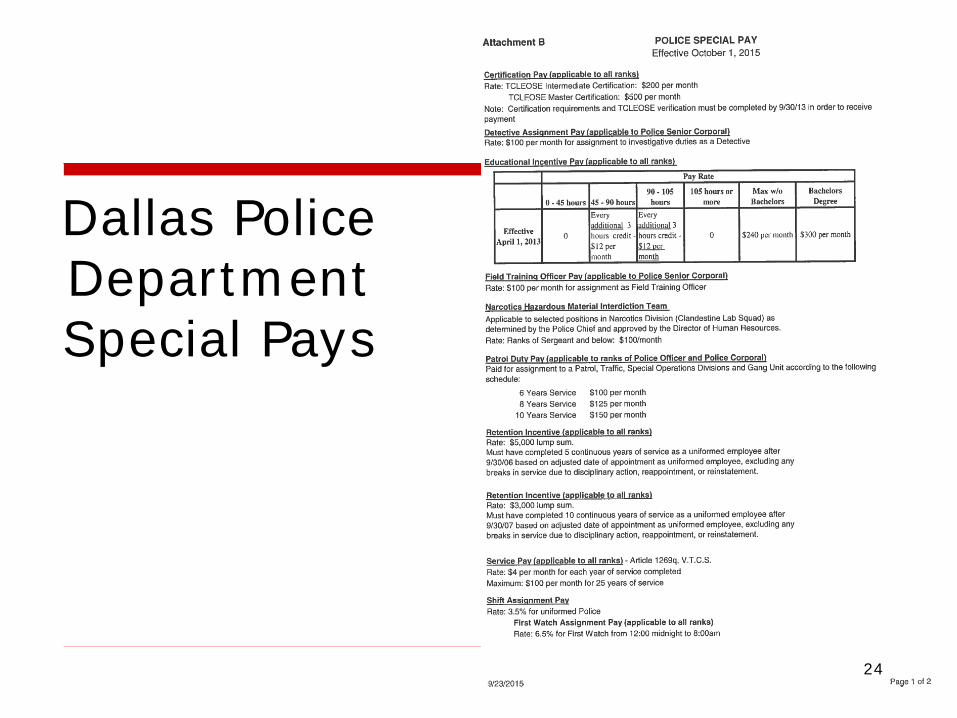
Dallas Police Department Special Pays
24

Dallas Fire Rescue Special Pays
25

General Obligation Bond Program DevelopmentCity Council RetreatFebruary 2, 2016

Purpose of Briefing• Seek Council policy direction regarding the next General Obligation (GO) bond program:
• When should the election be held?• Should City move more to pay-as-you-go financing?
2
Briefing Overview• Provide general overview of bond program
• Discuss bond program development process
• Discuss schedule alternatives• Review financing considerations
3
General Overview of Bond ProgramGeneral Obligation Bond Program Development

City’s infrastructure funded through two major methods
• General purpose infrastructure - financed with cash, general obligation (GO) bonds or certificates of obligation (CO) repaid with ad valorem taxes
• Streets, bridges & alleys• Flood protection and storm drainage • City buildings• Park facilities
• Enterprise program infrastructure - financed with cash and revenue bonds paid for by revenues from services
• Dallas Water Utilities pipelines/treatment plants• Aviation facilities• Convention center facilities
5
General Purpose Infrastructure
Enterprise Program Infrastructure
Financing tools
- Cash- General obligation
bonds(GO) - Certificates of obligation (CO)
- Cash- Revenue bonds
Builds
-Streets, alleys, bridges-Parks-Flood protection and storm drainage facilities-City buildings
-Water/sewer pipelinesand treatment plants-Aviation facilities-Convention facilities
Bond Repayment Source
-Ad valorem taxes -Rate payers-User fees

What are GO Bonds?• GO bonds are primary mechanism for financing long-term infrastructure improvements
• Spread cost of asset over average useful life of asset (typically 20+ years)
• Carry pledge of property tax revenue for repayment and must be approved by voters
• Must be used for capital improvements that benefit the public
6

Typical Uses of GO Bonds• GO bonds are used for permanent public improvements including:
• Streets and transportation • Flood protection and storm drainage • Park and recreation facilities• Libraries• Arts and cultural facilities• Police and fire stations• City service and maintenance facilities• Infrastructure related to housing or economic
development projects
7

Non-Eligible Uses of Bonds• Not everything is eligible for GO bond financing:
• Day-to-day operating and maintenance (O&M) expenses
• Such as salaries/benefits, electricity, supplies, services, etc.
• Motor vehicles/equipment (due to their shorter useful life)
• Computers, cameras, and other short-term technology that does not last for the duration of the bond life
8

Bond Program Development ProcessGeneral Obligation Bond Program Development

Key Components for Developing Bond Program
1. Guiding Principles
2. Needs Inventory
3. Public Input
6. Financial Considerations
5. Policy Considerations
4. Schedule
10
Strategic Objective for Program
• Bond program should have an overarching objective to achieve
• Past examples include:• 2012 Bond Program: A Strategic Investment in
the Economic Health and Future of Dallas• 2006 Bond Program: A Strategic Investment
Protecting Our City, Creating Our Future
• Council will set objective for next bond program at a future briefing
11
Guiding Principles

Determine Guiding Principles Early in Planning Process
• Council will also set guiding principles for next bond program at a future briefing
• Past examples include:• Promote public safety (including streets/drainage)
• Promote economic development • Leverage additional funding from other agencies and private sector
• Minimize new O&M expenses12
Guiding Principles

How the City’s capital needs are prioritized
• City has a capital Needs Inventory which is derived from:
• Public input• Council requests• 311 complaints• Comprehensive plans & studies
• Projects are scored and ranked using technical criteria which was last reviewed by Council in 2000
13
Needs Inventory

“Needs” vs “Wants”
• Needs Inventory has bothneeds & wants
• Both are in the eye of the beholder – examples:
• Wider sidewalks and tree-lined streets• Replacement fire station
• Staff will:• Focus on projects that meet Council’s strategic
goals• Categorize projects according to:
• New construction• Replacements• Improvement/betterment of existing facilities
14
Needs Inventory

Assessing Needs & Wants• Entire Needs Inventory will be completely updated and cost estimates brought to current dollars
• Any new projects identified during public input phase are analyzed and included as appropriate
• All projects categorized in Needs Inventory will be prioritized based on technical criteria
15
Needs Inventory
Upcoming Agenda Items related to Bond Program Development• Facility needs to be refined through asset management initiatives coming to council this spring:
• Major facility condition assessment• Computerized Maintenance Management System
(work order system)• This effort supports both DWU and City buildings
• Consulting services contracts may also be needed to support project prioritization and selection
• Such as traffic counts, ADA, and pedestrian safety
• Council committees will be briefed prior to agenda items
16
Needs Inventory
ADA- Americans with Disabilities Act

Public Input & Involvement• Public input has traditionally occurred in two rounds
• Process has been used since 1995 Bond Program
• Input obtained via:• Town hall meetings (including electronic)• Presentations to HOAs/groups• Web-based feedback (Twitter, Facebook,
Instagram, etc.)
17
Public Input
Public Input & Involvement
• First round of public input covers:
• Whether to conduct a bondprogram
• Overall size of bond program• Priorities between propositions (street conditions,
park needs, drainage, etc.)• Citywide project priorities• Individual, specific projects/problems that need to
be investigated for inclusion in bond program
• Second round of public input to be conducted to receive feedback on recommended program prior to Council calling the bond election
18
Public Input

Possible Bond Election Schedules
Event May 2017 Election Nov 2017 Election
Council briefings on policies and technical criteria Feb-June 2016 Feb-June 2016
Update needs inventory Feb-Oct 2016 Feb-Dec 2016
Hold initial public input meetings Oct 2016 Jan 2017
Brief Council committees on program needs Oct-Nov 2016 Jan-Apr 2017
Brief Council on updated needs inventory Dec 7, 2016 Apr 5, 2017
Brief Council on financial capacity Dec 7, 2016 Apr 5, 2017
Council election N/A May 13, 2017
Present City Manager’s recommended bond program Jan 4, 2017 May 17, 2017
Conduct second round of public input meetings Jan 2017 May 17-Jun 9, 2017
Council finalizes the recommendations Feb 1, 2017 Aug 2, 2017
Council calls the election Feb 13-Mar 3, 2017
Aug 9-29, 2017
Election date May 13, 2017 Nov 7, 2017
19
Schedule

Election Timetable Variables• May 2017 is already scheduled for Mayor & City Council elections
• FY17 budget will include expenses for County to conduct election/runoff
• Holding bond election in November or when there is not a Mayor/Council election will result in additional cost
• Cost associated with special election is approximately $1.0m
20
Schedule

Policy considerations related to bond program development• Council may wish to revisit other policies related to infrastructure in developing next bond program
• Examples:• Review technical criteria• Cost sharing with citizens on sidewalks• Alley petition process• ADA compliance• Incorporating Neighborhood Plus into technical
criteria; prioritizing projects that address quality of life improvements in those areas
21
Policy Consideration

Financial Considerations and Funding Options General Obligation Bond Program Development
Financial Considerations

Financial Capacity Analysis• General Obligation (GO)bonds are primary method the City has used to finance capital improvements
• Voter approval is required • Allows for the improvement to be paid for over the
useful life of the improvement
• Pay-as-you-go is an alternative method, and is used within the City on a limited basis
• Cash is not currently available to fund significant amounts of capital improvements each year
• Including a pay-as-you-go component can be a consideration in developing upcoming bond program
23
Financial Capacity Analysis• Determining financial capacity for upcoming bond program should consider:
1. Current outstanding debt2. Voter authorized but unissued debt3. Tax base value and future growth4. Tax rate allocated to debt service fund5. Policy direction for future debt
• Current analysis does not consider impact of other potential debt such as pension obligation bonds for Police & Fire Pension Fund
24

(1) Outstanding Debt• Current outstanding debt is $1.7B (principal) as of December 2015
• Financial advisors monitor debt for refunding opportunities to reduce debt cost
• Debt service cost for FY16 is $120.5m principal + $98.3m interest = $218.8m total (includes GOs, COs, and pension obligation bonds)
• Based on most recent GO bonds sold (November 2015), interest cost is $0.29 per $1 borrowed over the life of the GO bonds
25

(2) Voter Approved Debt• Continue to utilize $350m commercial paper (CP) program to provide “just-in-time” interim financing of projects, and retire CP with long-term GO bonds already approved by voters
• GO debt is structured with the first year being interest only and years 2 through 19 being level principal plus interest
• Issue remaining $437m of voter approved bonds from 2006 and 2012 bond programs
• November 2016 - $175m• November 2017 - $150m• November 2018 - $112m
26

(3) Property Tax Base Values• Future capacity is impacted by revenue within
the City’s debt service fund • Property tax base values have grown for 4
consecutive years after 3 years of declining growth during the recession
• Growth projections are designed to reflect long-term trends rather than current growth rates
• Current growth projections:• FY17: 5.00% (same as General Fund forecast)• FY18 – FY27: 2.84% (30-year average)• Beyond FY27: no growth assumed
• Growth projections will be revised after the FY17 certified values are provided by the 4 appraisal districts on 7/25/16
27

(4) Property Tax Rate• Current property tax rate is $0.7970 with $0.5646 (71%) allocated to the General Fund and $0.2324 (29%) allocated to debt service
• Debt service allocation has decreased for 5 consecutive years from 34% to current 29%
• Potential exists to reallocate part of the debt service tax rate to a pay-as-you-go program
• Reallocation over time may be necessary to ensure that the roll-back tax rate is not exceeded in any year
28

(5) Policy Direction for Potential Scenarios• Potential scenarios for 2017 bond program are based on revenue assumptions:
A. Maintain current $0.2324 (29%) tax rate, and use maximum capacity
B. Reduce the tax rate allocated to debt service over 5 years to $0.1992 (25% of total tax rate)
29

Potential Financial Scenarios ($ in millions)
30
$219$239$230$223$208$204$197$191$178$167$157
$140$117$105$105 $96 $96 $86 $86
$61
$6 $21 $37 $53 $47$41 $40
$39$38
$37$35
$34$33 $32
$31 $29$28 $27
$26
$16 $8$0
$50
$100
$150
$200
$250
$300
$350
Existing Bond Debt Service Projected Authorized Unissued Bond Debt Service
Maintain Current Tax Rate Scenario DS Tax Rate Capped at 25% Scenario
(A) $0.2324 or 29% of tax rate
(B) $0.1992 or 25% of tax rate

Scenario A: Maintain 29% or $0.2324 Tax Rate ($ in millions)
31
$219$239$230$223$208$204$197$191$178$167$157
$140$117$105$105 $96 $96 $86 $86
$61
$6 $21 $37 $53 $47$41 $40
$39$38
$37$35
$34$33 $32
$31 $29$28 $27
$26
$16 $8
$23 $43 $59 $79 $91$79
$79
$81$78 $76
$73 $71$68 $66
$63
$61$58
$56 $45 $33 $24 $12$0
$50
$100
$150
$200
$250
$300
$350
Existing Bond Debt Service Projected Authorized Unissued Bond Debt Service
Future Bond Program Capacity Revenues
Commercial Paper is used to interim finance projects before issuing bonds for new bond program
Potential future bond election in May/Nov 2017 (FY18) and begin projects using Commercial Paper.
Maintaining $0.2324 tax rate
provides capacity for $1.0B 2017BP
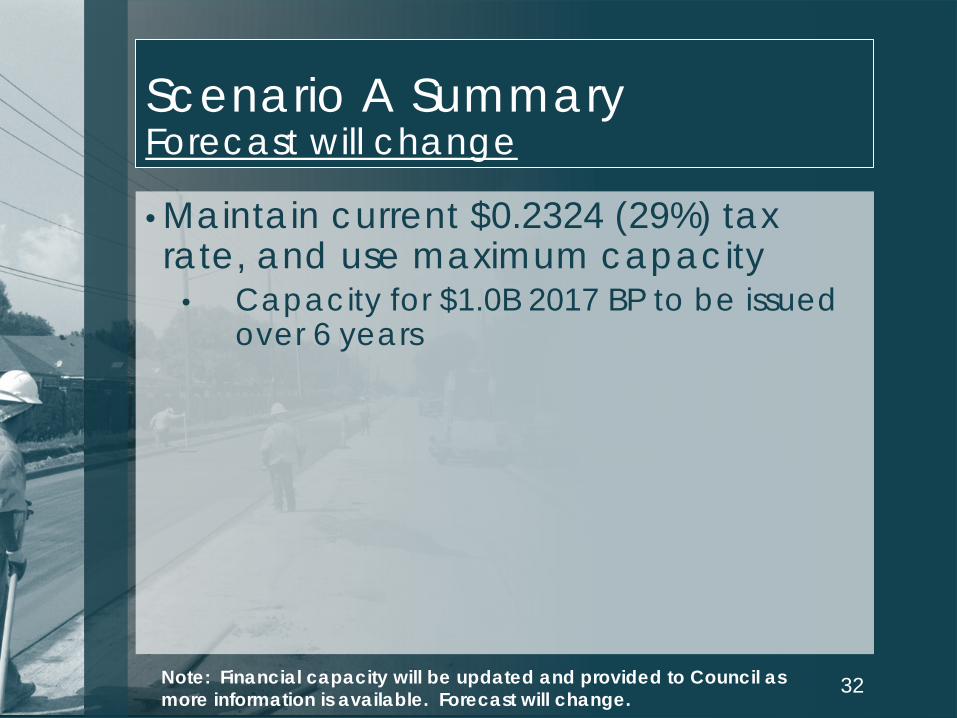
Scenario A SummaryForecast will change
• Maintain current $0.2324 (29%) tax rate, and use maximum capacity
• Capacity for $1.0B 2017 BP to be issued over 6 years
32Note: Financial capacity will be updated and provided to Council as more information is available. Forecast will change.
$219$239$230$223$208$204$197$191$178$167$157
$140$117$105$105$96 $96 $86 $86
$61
$6 $21 $37 $53 $47$41 $40
$39$38
$37$35
$34$33 $32
$31 $29$28 $27
$26
$16 $8
$16 $29 $39$51 $62
$60$58
$57$55 $53
$51 $50$48 $46
$44
$43$41
$39 $32 $23 $16 $10$0
$50
$100
$150
$200
$250
$300
$350
Existing Bond Debt Service (incld Refunding Cash Savings) Projected Authorized Unissued Bond Debt ServiceFuture Bond Program Capacity Revenues
Commercial Paper is used to interim finance projects before issuing bonds for new bond program
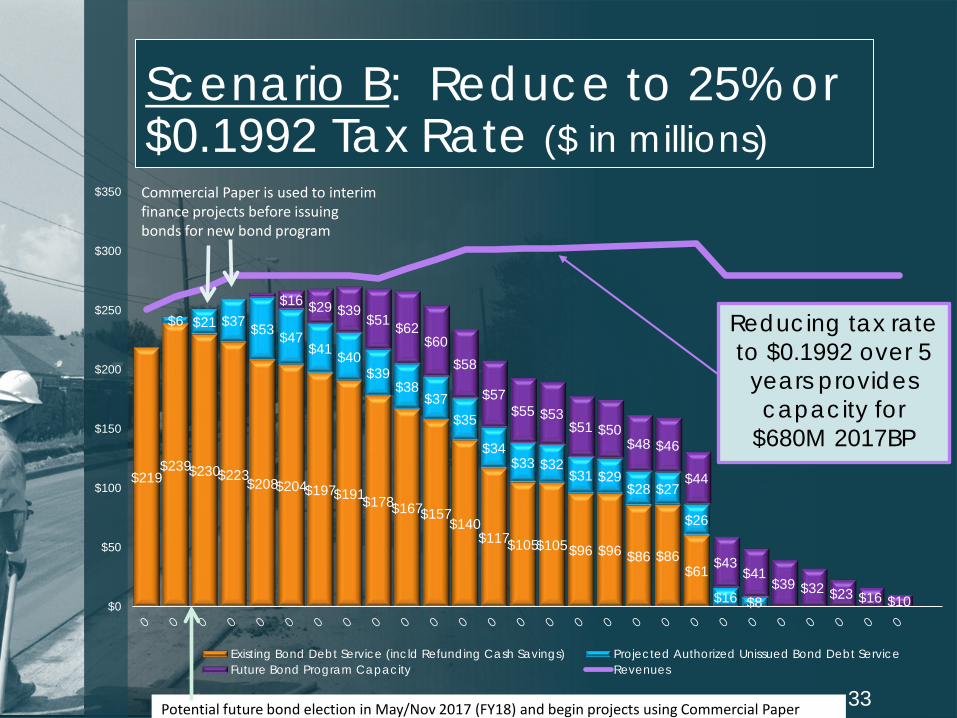
Scenario B: Reduce to 25% or $0.1992 Tax Rate ($ in millions)
33
Reducing tax rate to $0.1992 over 5
years provides capacity for
$680M 2017BP
Potential future bond election in May/Nov 2017 (FY18) and begin projects using Commercial Paper.

Scenario B SummaryForecast will change
• Reduce the tax rate allocated to debt service over 5 years to $0.1992 (25%)
• Capacity for $680m 2017 BP to be issued over 6 years
• Shift tax rate and establish pay-as-you-go program- $120m over same time frame of the 2017 bond program
• Combined $680m bonds and $120m pay-as-you-go would provide $800m of improvements and reduce percent of tax rate allocated to debt service to 25%
34Note: Financial capacity will be updated and provided to Council as more information is available. Forecast will change.

Alternative Scenarios (A2/B2)• Alternatively, the bond election could be delayed from 2017 to 2018
• To have net zero street degradation, additional funding would be required in the interim in addition to increasing O&M funding in each year:
• Additional 55 lane miles and $15m would be required in FY17
• Additional 112 lane miles and $31m would be required in FY18
• Certificates of obligation (10-year debt) could provide the funding
35Note: These figures are based on current data. On-going data analysis will result in adjustments.

Preliminary Financial Capacity (Forecast will change)
Scenario A Scenario A2 Scenario B Scenario B2
Tax rate for Debt Service
Maintain $0.2324 (29%)
Maintain $0.2324 (29%)
Lower to $0.1992 (25%)
Lower to $0.1992 (25%)
Election May or Nov 2017
2018 May or Nov 2017
2018
GO Bonds $1.0B $945M $680M $525M
Number of yearsof bond sales
6 5 6 5
Tax rate shift to General Fund
None None $0.0332 $0.0332
Pay as you go $0 $0 $120M $120M
Certificates of Obligation
$0 $46M $0 $46M
Total of Funds for Projects
$1.0B $991M $800M $691M
36Note: These figures are based on current data. On-going data analysis will result in adjustments

Questions for discussion
•When should the election be held?
•Should City transition to pay-as-you-go financing?
•Other comments
37
Appendix A –History of Bond Programs

History of City Bond Programs
39
Year Date of Election
Number of Propositions Program Size
Tax Rate Increase
Projected?
Number of Bond Issues
2012 Nov 2012 3 $642.0m No 3 (to-date)
2006 Nov 2006 12 $1,353.5mYes
(advertised but not implemented)
8 (to-date)
2005 Nov 2005 1 $23.8m No 1
2003 May 2003 17 $579.0m Yes (for some propositions)
4
1998 May 1998 11 $543.5m No 10*
1995 May 1995 8 $174.7m N/A 3
1989 May 1989 2 $60.7m N/A 2
1985 May 1985 11 $428.1m N/A 6
*Number of bond issuances timed to support Trinity River Corridor Project

Previous Bond Programs-Size & Propositions
40
Propositions Addressed
Year Program SizeStreetsAlleys
Sidewalks
FloodProtection
City Facilities, New
Renovation &Major Repair
ParkFacilities
Libraries& CulturalFacilities
PublicSafety
Facilities
EconomicDevelop
2012 $642.0m
2006 $1,353.5m
2005$23.8m
Homeless Assist. Center
2003 $579.0m
1998 $543.5m
1995 $174.7m
1989 $60.7m
1985 $428.1m

Historical Allocations by Propositions(% of ‘98, ‘03, ‘06, and ‘12 Programs)
$0 $200 $400 $600 $800 $1,000 $1,200
Arts & Cultural
Libraries
Economic Development/Housing
City Facilities
Public Safety
Trinity River Project
Park & Rec
Flood Control
Streets/Transportation
1998 BP 2003 BP 2006 BP 2012 BP
41
$1.04B; 33.4%
$692m; 22.2%
$491m; 15.8%
$246m; 7.9%
$160m; 5.1%
$151m; 4.8%
$124m; 4.0%
$112m; 3.6%
$100m; 3.2%
Chart reflects projects as grouped by their bond proposition on the ballot. Chart has not been modified to reflect projects that can serve multiple areas
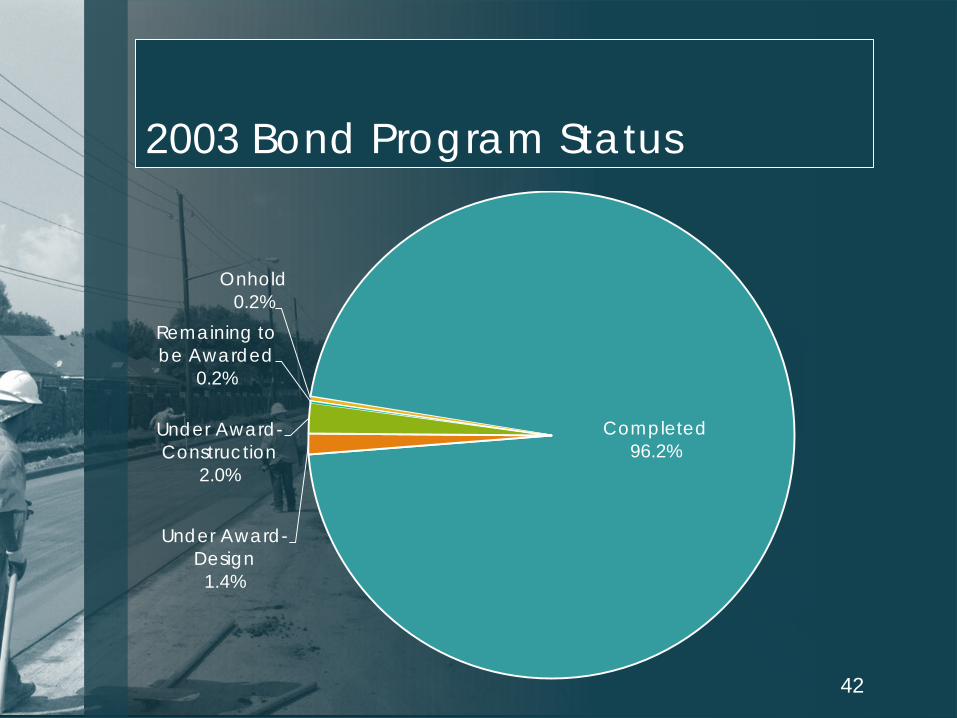
2003 Bond Program Status
Completed96.2%
Under Award-Design
1.4%
Under Award-Construction
2.0%
Remaining to be Awarded
0.2%
Onhold0.2%
42

2006 Bond Program Status
Completed88.4%
Remaining to be Awarded
0.9%
On Hold2.0%
Under AwardDesign4.1%
Under AwardConstruction
4.6%
43

2012 Bond Program Status
Completed14.1%
Under AwardConstruction
31.6%
Under AwardDesign22.1%
Remaining to be Awarded
31.8%
Onhold0.4%
44

Examples of Recent Bond Program Projects
• Of the 11,700 street lane miles:• Reconstructed 507 street lane miles• Resurfaced 953 street lane miles
• Implemented 3 funded pump stations
• Constructed or renovated 164 playgrounds out of a total of 215 playgrounds.
45
Greenville Ave. Complete StreetPavaho Pump Station Belo Garden

Examples of Recent Bond Program Projects
• Built 5 new libraries (Arcadia, Grauwyler, Timberglen, Prairie Creek, and White Rock)
• Constructed 11 fire stations out of a total of 58 fire stations.
• Renovated Courts portion of Old City Hall
• Repaired/improved over 100 city facilities
46
White Rock Branch LibraryFire Station 50
Streets Dept. HQ

Appendix B –State Tax Law Implication

Tax Law Implications of Pay-as-you-Go• Transitioning to Pay-as-you-go (PayGo) financing has State tax law implications
• PayGo requires shifting property tax rate from Debt Service to General Fund
• Growth in General Fund property tax revenue is capped at 8%/year
• Ability to shift tax rate will depend each year on growth in certified tax roll so as not to exceed Rollback Rate
• More growth in tax base reduces ability to shift rate/fund PayGo
48

Tax Law Implications of Pay-as-you-Go• Rollback rate calculation:
• Plus - Revenue from reappraised property values(property taxed both in current and prior years)
• Plus - Revenue from shifting tax rate between General Fund and Debt Service
• Minus - Revenue derived from new construction• Minus - Revenue City pays into TIF Districts
• Revenue from above as compared to prior year property tax revenue cannot exceed 8% growth
49

FY 2016-17 Budget Workshop #2: Council Direction
City Council RetreatFebruary 2 & 3, 2016

Budget process begins with Council input
2
Feb 3 Council Input
March 2 Gap Update
May 4 Options
June 15 Budget Update
Aug 9 CMO Recommendation
Aug-Sept Council Deliberations
Council input will assist in starting the
“climb”
Sept 21 Budget Adoption

Purpose of briefing
▪ Seek early input from City Council to use in developing FY 2016-17 (FY17) general fund budget▪ Key Focus Area (KFA) allocations▪ Guiding principles for developing FY17 general fund budget▪ Budget projections for FY17 general fund budget
▪ Review budget schedule
▪ Questions and comments
3
Funding is limited. Not all needs and wants can be funded. Trade-offs are necessary to balance the budget.
Understanding Council priorities is necessary to begin budget development process.
Key Focus Areas (KFAs) 4

Services provided by the City roll-up to Key Focus Areas (KFAs)
5 KFAs
9 Operating Funds (i.e. General Fund)
33 Departments
200 Services
KFAs provide high level goals for the
allocation of budget resources.

Current Key Focus Area (KFA) goals1) Public Safety – enhance public safety to ensure people feel
safe and secure where they live, work, and play2) Economic Vibrancy – grow a sustainable economy by job
creation, private investment in the region, a broadened tax base, sustainable neighborhoods, and livability and quality of the built environment
3) Clean Healthy Environment – Create a sustainable community with a clean, healthy environment
4) Culture, Arts, Recreation, and Education – support lifelong opportunities for Dallas residents and visitors in cultural, artistic, recreational, and educational programs that contribute to Dallas’ prosperity, health and well-being
5) E-Government – provide excellent government services to meet the needs of the City
6

General Fund resources allocated to achieve 5 goals
7
64.3% 64.9% 67.9% 67.0% 67.4% 65.5% 64.8% 63.9% 63.1%
10.4% 10.3% 9.5% 10.3% 10.4% 11.1% 11.6% 11.9% 12.5%
11.7% 11.5% 9.6% 9.5% 9.6% 10.4% 10.2% 10.5% 10.7%
9.0% 8.5% 9.2% 9.3% 8.7% 8.8% 8.9% 8.8% 8.9%4.7% 4.8% 3.8% 3.9% 3.8% 4.2% 4.5% 4.8% 4.8%
0%
10%
20%
30%
40%
50%
60%
70%
80%
90%
100%
FY08 FY09 FY10 FY11 FY12 FY13 FY14 FY15 FY16
Public Safety Economic Vibrancy Culture Arts Recreation & Education E-Government Clean Healthy Environment
Note: Prior years have been restated to exclude Sanitation Services budget.Note: KFA historical chart including debt services is located in the appendix.
General Fund departments align to various KFAs based on services provided
City
Att
orne
y
City
Aud
itor
City
Con
trol
ler
City
Man
ager
City
Sec
reta
ry
Civi
l Ser
vice
Code
Com
plia
nce
Cour
t Ser
vice
s
Equi
pmen
t& B
uild
ing
Srvs
.
Fire
-Res
cue
Hou
sing
& C
omm
unity
Srv
s.
Hum
an R
esou
rces
Judi
ciar
y
Libr
ary
Man
agem
entS
ervi
ces
May
or &
City
Cou
ncil
Off
ice
of C
ultu
ral A
ffai
rs
Off
ice
of E
cono
mic
Dev
elop
.
Off
ice
of F
inan
cial
Ser
vice
s
Park
& R
ecre
atio
n
Plan
ning
& U
rban
Des
ign
Polic
e
Publ
icW
orks
Purc
hasi
ng
Stre
et S
ervi
ces
Sust
aina
ble
Dev
elop
men
t
Trin
ity W
ater
shed
Mgm
t.
Public Safety X X X X X X X X
Economic Vibrancy X X X X X X X X X X X
Culture, Arts, Recreation & Education
X X X
Clean Healthy Environment
X X X X X X
E-Government X X X X X X X X X X X X X
8Note: Additional departmental information will be provided in future briefings.

E-Gov KFA supports and can be distributed to other 4 KFAs
9
69.2% 69.6% 73.0% 72.1% 72.2% 70.3% 69.7% 68.7% 68.0%
11.7% 11.6%10.9% 11.7% 11.7% 12.4% 12.9% 13.2% 13.8%
13.5% 13.3% 11.5% 11.4% 11.4% 12.2% 12.1% 12.4% 12.5%
5.6% 5.6% 4.7% 4.8% 4.7% 5.1% 5.3% 5.7% 5.7%
0%
10%
20%
30%
40%
50%
60%
70%
80%
90%
100%
FY 2008 FY 2009 FY 2010 FY 2011 FY 2012 FY 2013 FY 2014 FY 2015 FY 2016Public Safety Economic Vibrancy Culture Arts Recreation & Education Clean Healthy Environment
*E-Gov KFA retroactively distributed for all years based on allocations; Sanitation excluded.

Should the KFA allocations be adjusted for the FY17 general fund budget?
68.0%
13.8%
12.5%
5.7%
Public Safety
Economic Vibrancy
Culture, Arts, Recreation, & Education
Clean Healthy Environment
KFA FY16 Percent
Increase Percent
Same Percent
Decrease Percent
Public Safety 68.0%
Economic Vibrancy 13.8%
Culture, Arts, Recreation & Education
12.5%
Clean Healthy Environment
5.7%
Note: For each KFA with increase in percent, there should be an offsetting decrease in percent for another KFA.
10

Guiding Principles for FY17 11

FY16 budget was developed to focus on Council top priorities (identified during January 2015 retreat)
12
Budget Priorities Count Percent
Invest in technology to improve services and efficiencies 8 22.2%
Focus on top 3 priorities identified in citizen survey: maintenance of infrastructure, code enforcement, and police services
6 16.7%
Phase increases in percent of budget allocated to Culture, Arts, Recreation, and Education KFA
6 16.7%
Scrutinize services for efficiencies and cost reductions 6 16.7%
No increase in ad valorem tax rate 4 11.1%
Honor commitment to uniform employees through meet and confer agreement
2 5.6%
Invest in civilian employees through fair compensation and improved training
2 5.6%
Fund additional infrastructure needs with cash instead of using debt financing
2 5.6%
Total 36 100%
Note: Top 4 priorities were referred to throughout FY16 budget development process.

Identifying Council top priorities will assist in developing FY17 budget
Potential Guiding Principles Yes
Maintain current ad valorem tax rate
Decrease ad valorem tax rate
Focus budget allocations on citizen priorities
Invest in technology to improve services and efficiencies
Scrutinize services for efficiencies and cost reductions
Maintain service levels next year (FY17) at the same level provided during current year (FY16)
Enhance or expand service levels above those provided in current year
Focus resources on infrastructure needs
Focus resources to address neighborhood issues
Target allocations to areas with highest concentration of needs
Reduce civilian staffing levels
Invest in uniform employees through increased compensation (including pension system)
Invest in civilian employees through fair compensation and improved training
Are there others that should be added?
13

Budget Projections for FY17 14

Preliminary projections for FY17 General Fund
▪ Developing budget for FY17 (10/1/16 – 9/30/17) is underway and will run for 8 more months▪ Significant amount of work being done to review what
expenses/services could/should be cut
▪ Preliminary gap for FY17 only includes funding for commitments made in prior years and funding adjustments anticipated to maintain current services - $4.4m shortfall
▪ Alternative gap for FY17 also includes cost increases that require Council input about whether the cost should be included or not -$71.3m shortfall
15

Preliminary projections for FY17 General Fund
16
FY 2015-16Adopted Budget
Preliminary Commitments
and Adjustments
FY 2016-17Preliminary Projection
Council Input Required
FY 2016-17 Alternative Projection
General FundRevenue
$1,144.8m +$32.1m $1,176.9m $0 $1,176.9m
General Fund Expense
$1,144.8m +$36.5m $1,181.3m +$66.9m $1,248.2m
Variance or Gap
$0 ($4.4m) ($4.4m) ($66.9m) ($71.3m)
Note: Forecasts are preliminary and will change through budget development process and as additional information is available.

-$10
-$5
$0
$5
$10
$15
$20
$25
$30
$35
$40
PropertyTax
Sales Tax OtherRevenueChanges
UniformPay
CivilianMerit
MasterLease
Payments
CapitalProjectO&M
Wage Floor TIFpayment
LiabilityClaims
CISService
911Reimb
Lean/SixSigma
Balanced Budget
+$6.6m
+$27.6m ($2.2m)
($7.7m)
($3.2m)($2.6m)
($5.5m)
+$2.5m($3.1m)
($5.0m)
Revenue Changes: +$32.1m
($4.7m)
Preliminary Projections for FY17 General Fund
17
($6.1m)
Expense Changes: ($36.5m)
Note: Forecasts are preliminary and will change through budget development process and as additional information is available.Note: Additional information regarding preliminary expense projections are included in the appendix.
($1.1m)
$4.4m preliminary
gap between revenues and
expenses

Council direction
▪ Council early input will provide direction about whether or not the following should be included in FY17 budget or not (cost can be scaled and partially included) 1) Ad valorem property tax revenues2) Employee compensation - civilian merit pay3) Employee compensation - uniform pay4) Employee/retiree health benefits5) Fair Park public-private-partnership6) Master lease program7) Neighborhood Plus8) Police force strength9) Service enhancements10) Service/expense reductions11) Street and alley improvements
18
As adjustments are made, the FY17 gap will change.
Reduction options will be presented at a later time
to rebalance FY17 budget.
Note: Departments will provide funding requests through the Spring, therefore, the above list of considerations is preliminary.
Early Council input will provide direction for development of FY17 budget
Question – Should the FY17 General Fund budget….?
(1) … limit property tax revenue by lowering the ad valorem tax rate?
(2) … include funding for a merit increase program for civilian employees?
(3) … address police and fire uniform employee compensation?
(4) … include funding for employee/retire health benefit cost increases?
(5) … include increased funding for Fair Park as needed as part of the public-private partnership proposal?
(6)… include funding to continue both fleet replacement and information technology replacement/upgrades through the master lease financing program?
(7) … include funding to further Neighborhood Plus initiatives?
(8) … include funding for additional police officers above attrition?
(9) … include new services and/or enhancements? If so, what services/enhancements?
(10) … include service/expense reductions? If so, what services/expenses?
(11)… include funding to achieve net zero degradation in street and alley condition until the implementation of the next bond program?
19

(1) Ad Valorem property tax revenues▪ Current projection for FY17 is that property values will grow by 5% and tax rate
will remain at $0.7970 per $100 valuation▪ 5% growth will generate approximately $27.6m additional revenue
▪ Appraisal Districts will provide additional information through summer and certify tax roll on July 25th
▪ Dallas County will then calculate roll-back and effective-tax rates in early August▪ Adopting effective tax rate for FY16 would have required reducing tax rate by $0.0371
and revenue by $36.3m
▪ Growth in property value is made up of both reappraisals and new construction▪ New construction value will not be known until July 25th
▪ Revenue from new construction value was $16.1m in FY16
▪ Each $0.01 change in tax rate is approximately $10m revenue
▪ Should the FY17 general fund budget limit property tax revenue by lowering the ad valorem tax rate?
20

(2) Employee compensation – civilian merit pay
▪ Civilian employee pay was reduced during economic recession▪ 2 furlough days in FY09; 5 furlough days in FY10; and 8 furlough days plus an
additional 0%-3% salary reduction in FY11
▪ Pay was restored to pre-recession level through phased increases in FY12-FY13
▪ Merit increase of 3% (average) for last 3 years; FY14, FY15, FY16
▪ Of the last 15 budgets, only FY05 included a cost-of-living increase (2%) for civilians to offset employee health benefit cost increase
▪ Each 1% civilian merit costs approximately $2.2m per year
▪ Should the FY17 general fund budget include funding for a merit increase program for civilian employees?
21

(3) Employee compensation – uniform pay
▪ City has had multi-year compensation agreements through Meet and Confer with police and fire uniform employees▪ 1st agreement approved by Council on 9/1/10 for FY11, FY12, and FY13 ▪ Included 5 furlough days, comp time for overtime, reduced hiring,
delayed paramedic training, 3% across the board pay, 2 new holidays, increased education pay
▪ 2nd agreement approved by Council on 12/11/13 for FY14, FY15, and FY16 ▪ Included step pay increases for 3 years and 4% across the board
▪ Each police and fire uniform step costs about $15.4m
▪ Should the FY17 budget address police and fire uniform employee compensation?
22
(4) Employee/retiree health benefits
▪ City provides health benefits to civilian and uniform employees, retirees, and dependents (22,175 individuals)
▪ Total cost in FY16 is expected to be $144.8m▪ City cost - $78.4m (54%)▪ Employee & retiree cost - $66.4m (46%)
▪ According to Total Compensation Study conducted by Milliman in 2012, City’s health benefits plan is in the bottom quartile compared to both public and private employees
▪ Medical/prescription expense are anticipated to increase by 5% for next year (additional $4.0m for general fund in FY17)
▪ Should the FY17 general fund budget include funding for employee/retire health benefit cost increases?
23

(5) Fair Park public-private partnership
▪ Fair Park operates as a service within Park and Recreation Department▪ Cultural facilities located at Fair Park receive direct and indirect support
from Office of Cultural Affairs
▪ Council briefed on 11/18/15 regarding public-private partnership for Fair Park ▪ City management fee initially projected to be $25m to $35m (ramp up
from 2017 to 2020)▪ $125m to $175m needed in next City bond program
▪ Operating and capital needs analysis is underway and will be provided to Council in a future briefing
▪ Should the FY17 general fund budget include increased funding for Fair Park as needed as part of the public-private partnership proposal?
24

(6) Master lease program▪ City has utilized a master lease program to fund an average of $25m
of fleet and information technology capital purchases for 5 years▪ Master lease financing allows both just-in-time borrowing and
repayment schedule to match estimated-useful-life of the asset▪ Needs exist for continuation of the master lease program
▪ Should the FY17 general fund budget include funding to continue both fleet replacement and information technology replacement/upgrades through the master lease financing program?
25
Department Capital Expense FY17 Forecast
5 Year Forecast
Equipment & Building Services Fleet (cars, trucks, vans, etc.) $15.0m TBD
Fire-Rescue Apparatus (MICU, trucks, engines, etc.) $10.6m $59.8m
Communication & Information Services Technology upgrades and replacement $21.2m $81.0m
Sanitation Collection & landfill fleet/equipment $12.0m $58.0m
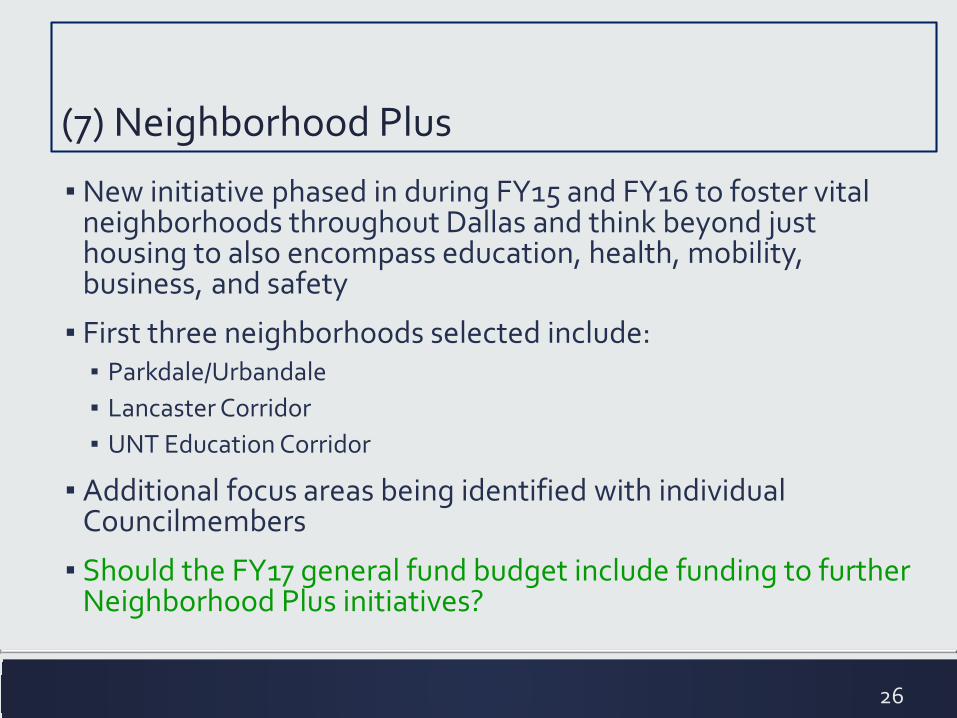
(7) Neighborhood Plus
▪ New initiative phased in during FY15 and FY16 to foster vital neighborhoods throughout Dallas and think beyond just housing to also encompass education, health, mobility, business, and safety
▪ First three neighborhoods selected include: ▪ Parkdale/Urbandale▪ Lancaster Corridor▪ UNT Education Corridor
▪ Additional focus areas being identified with individual Councilmembers
▪ Should the FY17 general fund budget include funding to further Neighborhood Plus initiatives?
26

(8) Police force strength
▪ 50 police officers above attrition, as an example▪ To improve response times that have gone up since 2010 when hiring was
200 below attrition▪ To address upticks in violent crime, expand domestic violence home visits,
and expand violent crime investigation▪ To expand SAFE case enforcement and gang crime enforcement
▪ Cost to add 50 officers is $4.2m with $2.3m needed for partial year cost in FY17, and additional $1.9m needed in FY18 for full-year funding
▪ Should the FY17 general fund budget include funding for additional police officers above attrition?
27

(8) Police officer strength compared to officers per 1,000 population
2,880 2,900 2,981 2,964 2,932 2,972 3,018 3,186 3,389 3,597 3,690 3,511 3,519 3,496 3,523 3,445
6 47
2.37 2.34 2.42 2.41 2.38 2.38 2.44 2.50 2.63
3.00 3.02 2.83 2.80 2.75 2.73 2.67
0
0.5
1
1.5
2
2.5
3
3.5
0
500
1,000
1,500
2,000
2,500
3,000
3,500
4,000
FY01 FY02 FY03 FY04 FY05 FY06 FY07 FY08 FY09 FY10 FY11 FY12 FY13 FY14 FY15* FY16*
Sworn Strength Public Service Officers Officers per 1,000
3,529 3,492
*Estimated
28

(9) Service Enhancements▪ Current and prior year budgets have included both new services and enhanced
service levels
▪ Recent examples include: ▪ Public Safety Officers added: 20 in FY15 and 30 in FY16▪ City Marshals added: 12 marshals and $533k in FY16▪ Neighborhood Plus▪ Animal services enhanced to include City funding for PetSmart Everyday Adoption in
FY15 and 15 new positions ($1.4m) to address loose animals in FY16▪ Two year plan to enhance Library services – over $6m added over two years, and hours
expanded to 1,510.5 per week which is an all-time high ▪ Senior program division added within Park Department in FY16
▪ Should the FY17 general fund budget include new services and/or enhancements?
▪ If so, what services and/or enhancements?
29

(10) Service/expense reductions
▪ In order to balance annual operating budget, trade-offs are required
▪ FY16 budget included expense reductions of $15.7m:
▪ Municipal court operations
▪ Fuel expense
▪ Salary and vacancy rate adjustments
▪ Adjustments in contract pricing and utilization
▪ Other miscellaneous adjustments from line-item review
▪ Should the FY17 General Fund budget include service/expense reductions?
▪ If so, what services/expenses?
30

(11) Street and alley improvements▪ Based on 4/15/15 briefing, a multi-year strategy is needed to improve street
condition to 87% satisfactory citywide (minimum of 80% satisfactory in each Council District)
▪ Multi-year strategy requires increased O&M funding for streets and alleys each year along with increased bond funding
▪ Goal (revised Sept 2015) is to have net zero degradation of current condition until next bond program when funding will be available to start improving street/alley condition
▪ Net zero degradation is being achieved in FY16 with increase of $24.1m
▪ To continue net zero degradation, additional $28m would be required in FY17
▪ Should the FY17 general fund budget include funding to achieve net zero degradation in street and alley condition until the implementation of the next bond program?
31Note: Amounts are preliminary and will be adjusted based on further analysis.

FY17 Budget Schedule
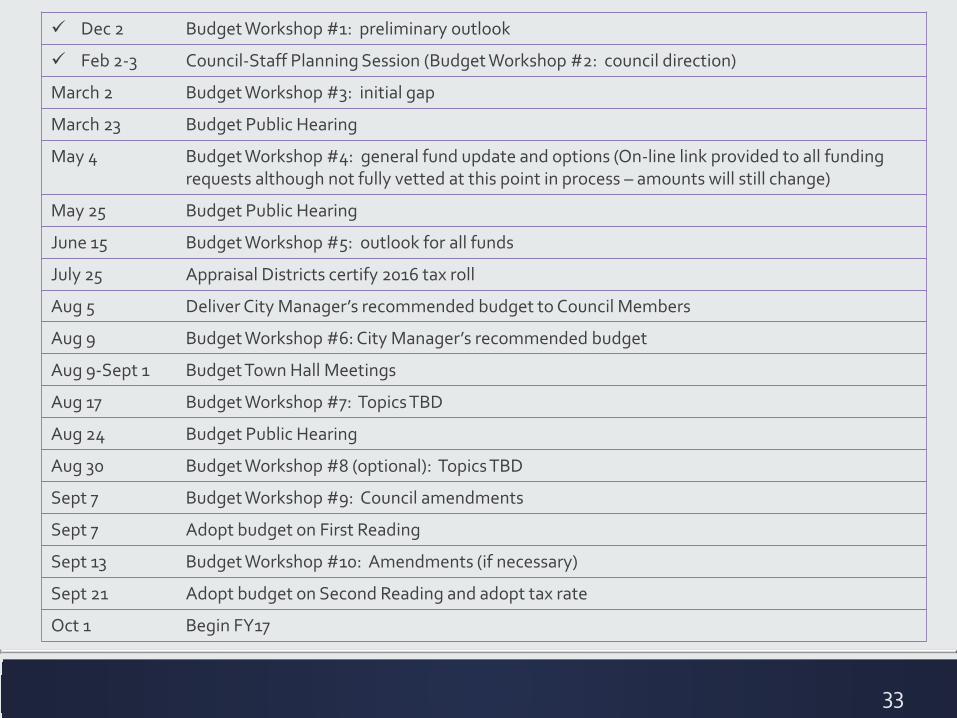
Dec 2 Budget Workshop #1: preliminary outlook
Feb 2-3 Council-Staff Planning Session (Budget Workshop #2: council direction)
March 2 Budget Workshop #3: initial gap
March 23 Budget Public Hearing
May 4 Budget Workshop #4: general fund update and options (On-line link provided to all funding requests although not fully vetted at this point in process – amounts will still change)
May 25 Budget Public Hearing
June 15 Budget Workshop #5: outlook for all funds
July 25 Appraisal Districts certify 2016 tax roll
Aug 5 Deliver City Manager’s recommended budget to Council Members
Aug 9 Budget Workshop #6: City Manager’s recommended budget
Aug 9-Sept 1 Budget Town Hall Meetings
Aug 17 Budget Workshop #7: Topics TBD
Aug 24 Budget Public Hearing
Aug 30 Budget Workshop #8 (optional): Topics TBD
Sept 7 Budget Workshop #9: Council amendments
Sept 7 Adopt budget on First Reading
Sept 13 Budget Workshop #10: Amendments (if necessary)
Sept 21 Adopt budget on Second Reading and adopt tax rate
Oct 1 Begin FY17
33

Questions and Comments 34
Appendix 35
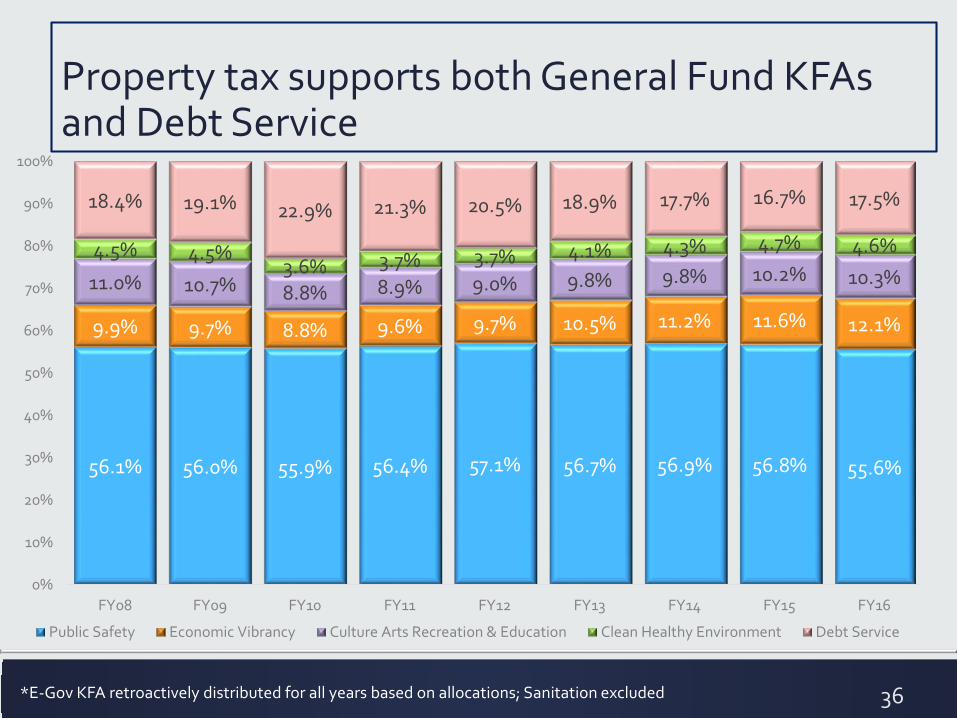
Property tax supports both General Fund KFAs and Debt Service
36*E-Gov KFA retroactively distributed for all years based on allocations; Sanitation excluded
56.1% 56.0% 55.9% 56.4% 57.1% 56.7% 56.9% 56.8% 55.6%
9.9% 9.7% 8.8% 9.6% 9.7% 10.5% 11.2% 11.6% 12.1%
11.0% 10.7% 8.8% 8.9% 9.0% 9.8% 9.8% 10.2% 10.3%4.5% 4.5%
3.6% 3.7% 3.7% 4.1% 4.3% 4.7% 4.6%
18.4% 19.1% 22.9% 21.3% 20.5% 18.9% 17.7% 16.7% 17.5%
0%
10%
20%
30%
40%
50%
60%
70%
80%
90%
100%
FY08 FY09 FY10 FY11 FY12 FY13 FY14 FY15 FY16
Public Safety Economic Vibrancy Culture Arts Recreation & Education Clean Healthy Environment Debt Service

Commitments made in prior years that have a cost increase in FY17
37
Uniform compensation – full-year funding for FY16 step pay increase as part of current Meet and Confer agreement ($7.7m)
Civilian employee pay adjustments – full-year funding for FY16 average 3% merit on 12/2/15 ($1.1m)
Master lease cost increases – required to pay debt for equipment and technology enhancements added in FY16 budget ($3.2m)
O&M cost required in FY17 for capital projects being completed and placed in-service (includes year-2 O&M for Oak Cliff Streetcar) ($2.6m)
Wage floor of $10.37 per hour for employees of contracted services (based on contract increases as new contracts are awarded) ($5.0m)
Tax Increment Financing cost increase as property values in TIF districts increase ($5.5m)
Note: Forecasts are preliminary and will change through budget development process and as additional information is available.

Adjustments that will impact costs in FY17
38
Liability/claims cost increases anticipated due to increased litigation ($6.1m)
Technology and communication services will require increased transfers from customer departments due to year-end surplus not anticipated for the end of FY16 as it was at the end of FY15 ($4.7m)
Police cost increase to offset less reimbursements from 911 Fund for overtime ($3.1m)
Efficiencies and cost reductions from Lean/Six Sigma projects currently underway ($2.5m reduction). Additional cost reductions will be identified through the budget process, line-item review, analysis, and Sunset efforts.
Note: Forecasts are preliminary and will change through budget development process and as additional information is available.