2015-2016 theatrical season report · 2015-2016 theatrical season report an analysis of employment,...
TRANSCRIPT

2015-2016
Theatrical Season
Report
An Analysis of
Employment, Earnings,
Membership and Finance
Steven DiPaola Assistant Executive Director
for Finance and Administration

As the country moved away from the tremendous and difficult recession of late 2008, and the long and
slow recovery from that event began to take hold, it still cast a deep shadow over the country’s view of
our economic stability and the strength of the recovery. Work was returning and unemployment was
falling, the stock market regained its losses and then some, and a sense of normalcy started to return.
However, people were still scared; there were questions regarding the stability of the new footing.
After suffering such a blow in 2008, there appeared to be a greater precariousness as individuals,
businesses and the country took their first steps into the future hoping the ground would hold.
Our industry was not spared those feelings. Employment and member earnings were recovering their
losses, but it was happening slowly and momentum seemed to be weak.
In the most recently concluded theatrical season of 2015-2016, which ended in late May, there seems to
finally be firm signs of growing strength. Tell-tale thresholds were crossed, new all-time highs were set,
and with work weeks once again surpassing the 300,000 mark and member earnings surging, it is
beginning to feel like 2008 may finally be receding into the past.
To be clear, there are still many challenges; neither the industry, nor the country nor the world lack for
potential trouble spots. At least for the 2015-2016 season, however, things seemed markedly improved.

1
Membership:
Prior to taking a look at the season’s employment and earnings, we will look first to the members who
create that work on stages all around the country. In the past, these reports have addressed both
“active” and “paid” members, with the former defined as all those members who report themselves
active in the industry and who, therefore, ought to be paying basic dues (the fixed rate of $118 per
year); and the latter defined as those who have actually paid those dues and are not delinquent. For the
sake of consistency, in this year’s report whenever a member count is cited, it will always represent the
active count.
Earlier this year when the magazine format of Equity News debuted, the cover proclaimed “50,000
Strong,” with the names of members printed on the back and front covers. Dictionary.com defines
“labor union” as “an organization of wage earners or salaried employees for mutual aid and protection
and dealing collectively with employers.” That issue of Equity News celebrated the fact that Actors’
Equity Association represents the aspirations and needs of 50,000 active members, talented and diverse
individuals living in nearly every state in this country, and working for their mutual aid and protection.
Opinions might differ on individual issues, but all are united in the fundamental belief that actors and
stage managers, while artists, are also workers and as such must be protected in the workplace.
As Table 1 depicts, the active membership count as of October 1st, when this table was created, was
51,057. Equity’s membership continues to grow at a time when labor unions are challenged by
shrinking numbers of members. Just 10 years ago, the number of active members was 46,867, meaning
that membership in the union has grown by 9% in that period.
The percentages of the membership living in each region are also depicted and there has been little
change in those distributions over 10 years. And finally, in this past year 2,055 individuals began the
process of joining Equity.

2
Table 2 shows how the membership is distributed across race, ethnicity and gender. Members
voluntarily identify themselves, and as you can see, slightly more than 16% of the membership has
chosen not to provide this information.
Table 3 shows the 10 cities in the country that have the greatest numbers of Equity members living in
them. These have been the 10 most populous cities for some time, though some have shifted positions.
Table 3, Membership 2015-16
by Major Cities New York 19,800
Los Angeles 8,357
Chicago 1,839
San Francisco 1,154
Philadelphia 1,052
Washington D.C./Baltimore 1,028
Boston 1,001
Orlando 761
Minneapolis/St. Paul 533
Seattle 494
As we shift to a look at employment this season and having seen where our members live, a logical
question might be: Where do our members work? Not surprising, with the density of population and the
strength of the Production contract on Broadway, New York is the origin of the most employment. It is
followed by Chicago, the Baltimore/Washington D.C. area and Central Florida, all of which had at least
15,000 work weeks. They are followed by Los Angeles, Boston, Minneapolis/St. Paul, San Francisco and
Philadelphia, all of which had at least 7,000 work weeks.

3
Employment:
Work weeks for this season stood at 305,827, an increase of 3.9% over last season, and have broken the
300,000 threshold once again. A work week is defined as one week of work for one member. Following
three seasons during which growth in work weeks amounted to only about 2,100 cumulatively, this
year’s leap of more than 11,000 represents a significant post-2008 recession increase in employment.
Looking to see how this impacts the members, we can see that 17,834 members worked this season,
and while still down from the level as the recession was beginning, it represents the largest number of
working members since that time period. Those members worked an average of 17.1 weeks this season,
up a bit from the plateau that had been in place for the prior three seasons. As you can see from the
bottom of Table 4, that represents an average of 220 more members working each week than did last
season, and all regions and categories of employments saw growth.

4
175,000
180,000
185,000
190,000
195,000
200,000
205,000
Chart 5A, Eastern Region Work Weeks
40,000
42,000
44,000
46,000
48,000
50,000
52,000
54,000
Chart 5B, Central Region Work Weeks
45,000
50,000
55,000
60,000
65,000
70,000
Chart 5C, Western Region Work Weeks

5
Work weeks in the East topped the 200,000 level for the first time ever while growing by 2.4%, and as
Chart 5 A illustrates, this is the fifth consecutive season of growth in Eastern employment. The
Production contract, which accounted for 37% of the work in the region this season, has driven much of
that increase over the past several seasons because it is such a big employer. However, there were
many other contributing contracts, as most had gains over the past several years.
You can see in Chart 5B that work weeks in the Central region have now grown for four consecutive
seasons, logged a very large increase of just under 10% since last season, and its 51,948 work weeks this
season represents its highest total in eight years. The LORT (League of Regional Theatres) contract is the
largest source of regional employment at 19.3%; however, right behind it at 17.9% is the CAT (Chicago
Area Theatre) contract.
Chart 5C illustrates the difficult path that employment in the Western region has followed since 2008
and the recession. After two years of decline and establishing a 10-year low last season, this season
gains were made and work weeks increased by 4.2%. Like the Production contract in the East, the LORT
contract was the source of 37.5% of Western employment this season, and its increase over last season
of 1,426 work weeks certainly helped drive the overall employment growth in the region. There was
also notable growth, however, on the Small Professional Theatre (SPT) and Western Civic Light Opera
(WCLO) contracts.

6
Table 6 breaks down employment in each region by contract type and, to provide context, also provides
work week totals by contract for the previous four seasons. The two largest contracts, Production and
LORT, were the sources of 137,312 work weeks, just under 45% of all employment, and will be explored
in greater detail later in the report. First, though, we will examine some of the other contracts,
especially those particularly important to certain regions.

7
As noted, the LORT agreement occurring in established regional theaters in cities like Houston, Seattle
and San Diego, to name just a few, is the largest source of employment in the Western region. The
Small Professional Theatre (SPT) and Letters of Agreement (LOA) contracts, which combine to make up
the so-called Developing Theatre agreements, account for an additional 31% of employment in the
region.
Contracts unique to the region, such as the WCLO, Hollywood Area Theatre (HAT) and Bay Area Theatre
(BAT) contracts are found at the bottom of the list of contractual work weeks in the West and provide
9% of the overall regional employment. In this report employment under the new 99-Seat Agreement,
established last year, appears for the first time generating 350 work weeks.
Looking to the important contracts in the Central region, the LORT and CAT contracts had regional
growth of 7.1% and 15.3%, respectively, and provided the catalyst for the significant regional
employment growth, but there were also notable gains in SPT, Stock and Dinner Theatre. The 559 work
weeks produced under the New Orleans Area (NOLA) agreement also means that work under this
contract has grown by 69% since the 2011-2012 season.
Moving to the Eastern region, the Disney World and Off-Broadway agreements represent the two
largest region-specific sources of employment. Work weeks at Disney World have fallen for the past
three consecutive seasons, and this season’s drop of 14% was particularly steep. Nevertheless, the
contract remains very important to many members living in Florida, and it still represented more than
7% of all employment in the region.
The Off-Broadway contract generated a similar number of work weeks as in the previous season, and
has now strung together several strong and steady seasons. Further, in November Equity and the
producers using this contract and those using the ANTC (Association of Non-Profit Theatre Companies,
responsible for 3,168 work weeks of its own) agreement reached accord with Equity on a new contract
that substantially increased salaries for members. While the impact of those negotiations is not seen in
this report, we are optimistic about how member earnings will be affected by them in future seasons.
These three agreements and the other Eastern region-specific contracts accounted for 39,719 work
weeks, or nearly 20% of the work in the East.
As noted, this season the Production and LORT contracts provided nearly half of all employment for
Equity members nation-wide, so it’s worth exploring how these contracts performed this season relative
to their past performance.

8
Production work weeks increased by 9.1% this season, and since the post-recession bottom in the 2012-
2013 season, the contract has added 17,670 work weeks. Employment under the contract is still
somewhat down from its highs prior to the recession, but the significant increase in employment that
has occurred over three seasons is a hopeful sign that it might return to those levels.
Looking at the components of Production contract employment offers further hopeful indicators. This
employment is made up of two parts: Point of Organization, which are shows that stay in New York,
Chicago and Los Angeles for extended periods, and Touring, which are shows that originate in one of
those cities and then have a second production of the show mounted, which tours to various cities
around the country. Chart 8 depicts the ten-year performance of those components. As you can see,
30,000
40,000
50,000
60,000
70,000
80,000
Chart 7, Total Production Work Weeks
0
10,000
20,000
30,000
40,000
50,000
Chart 8, Production Work WeeksPoint of Organization vs. Production Touring
P of O Touring

9
Point of Organization employment actually topped its pre-recession highs this season, and grew by 11%
over last season, and has increased by nearly 29% since its post-recession low.
The Touring component of Production employment was hit much more profoundly by the recession, but
as the chart shows, this was the fourth consecutive season of growth and recovery in this area and
employment has now increased by 39% since the post-recession low. So, both components of
Production contract employment seem to be on a steady upward trajectory, though the touring
component, which is much more sensitive to economic factors, is climbing toward its previous highs
much more slowly.
Because of the many cities and regional areas where LORT theatres are located and the numbers of
members who live in those cities, employment on the LORT contract is very important to the members.
As the chart shows, LORT employment has yet to return to its pre-recession highs, but it recovered most
of its lost work in the 2010-2011 season. Since then it has been somewhat inconsistent, but
employment this season represented the highest figure in all but one of the previous five seasons.
48,000
50,000
52,000
54,000
56,000
58,000
60,000
62,000
Chart 9, Resident Theatre (LORT) Work Weeks
10
16,000
17,000
18,000
19,000
20,000
21,000
22,000
Chart 10A, Western Region LORT Work Weeks
5,000
6,000
7,000
8,000
9,000
10,000
Chart 10B, Central Region LORT Work Weeks
20,000
22,000
24,000
26,000
28,000
30,000
32,000
Chart 10C, Eastern Region LORT Work Weeks

11
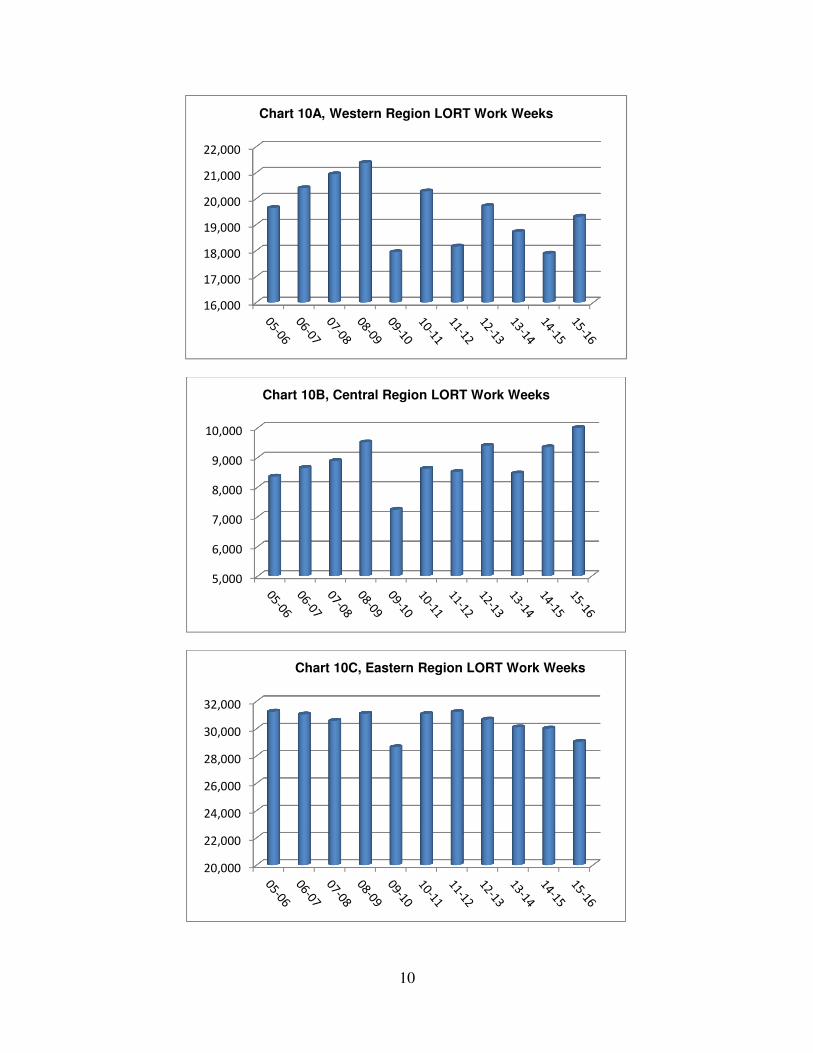
Since the LORT contract is an important source of work all over the country — and is the largest source
in the Central and Western regions — Charts 10A, 10B and 10C show the regional performance of the
contract over the past 10 seasons.
Beginning in the Western region, where the contract accounts for about 1/3 of the employment, LORT
work weeks increased by 8%, the largest growth in any of the regions. That’s a good sign for members
in the West, where LORT employment has been erratic since the recession.
LORT employment in the Central region, which has also been inconsistent since the recession, rose by
about 7.4% this season and posted its highest number in 10 years, offering a hopeful sign for members
in the region.
LORT employment in the Eastern region continued to decline, a trend that began in the 2012-2013
season, falling by a total of 2,181 weeks over those four seasons. Much of this decline, however, can be
traced to the closings of The King and I and Anything Goes, two large and successful shows in New York
City, whose runs came to an end during that time period.
Finally, Chart 11 visually displays that 74% of member employment in Equity’s jurisdiction is
concentrated across eight contracts. Yet, while the many other contracts represent much smaller
percentages, the nearly 80,000 work weeks they offer is important in an industry where obtaining
employment is always difficult.
Production
25%
LORT
19%
SPT
10%
LOA
7%
Disney World
5%
SETA
2%TYA
3%
Stock
3%
All Other
26%
Chart 11, Annual Work Weeks by selected Contract Types
12
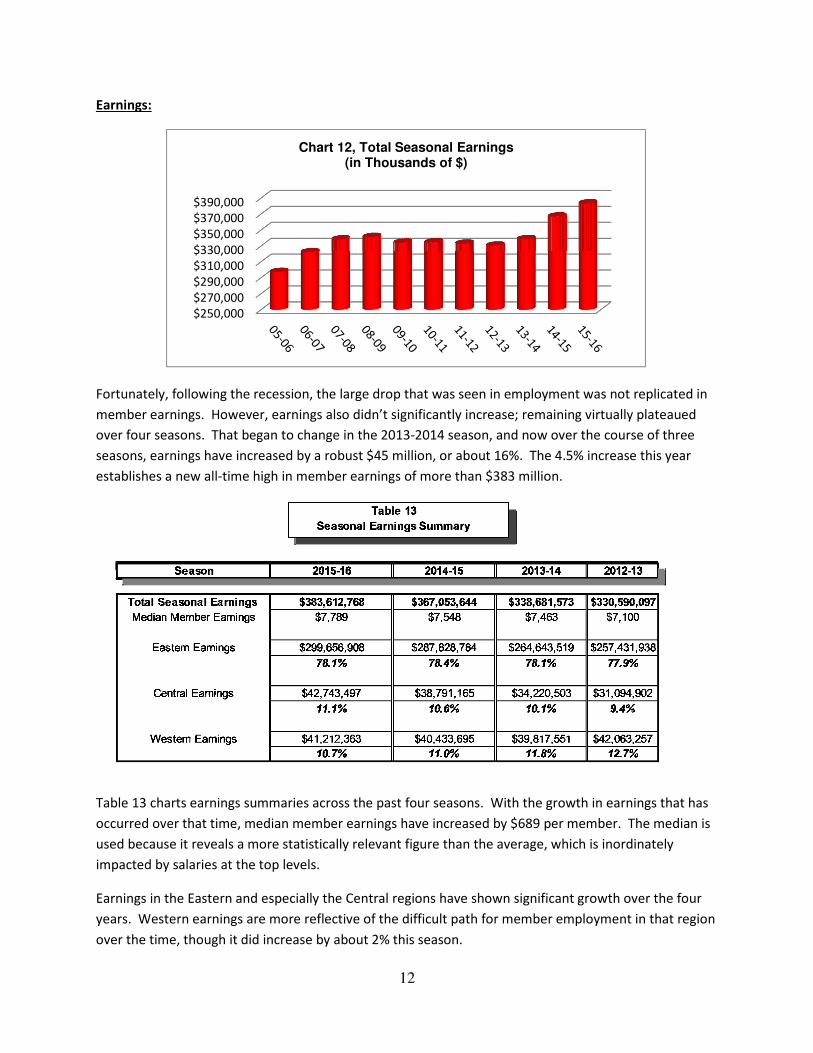
Earnings:
Fortunately, following the recession, the large drop that was seen in employment was not replicated in
member earnings. However, earnings also didn’t significantly increase; remaining virtually plateaued
over four seasons. That began to change in the 2013-2014 season, and now over the course of three
seasons, earnings have increased by a robust $45 million, or about 16%. The 4.5% increase this year
establishes a new all-time high in member earnings of more than $383 million.
Table 13 charts earnings summaries across the past four seasons. With the growth in earnings that has
occurred over that time, median member earnings have increased by $689 per member. The median is
used because it reveals a more statistically relevant figure than the average, which is inordinately
impacted by salaries at the top levels.
Earnings in the Eastern and especially the Central regions have shown significant growth over the four
years. Western earnings are more reflective of the difficult path for member employment in that region
over the time, though it did increase by about 2% this season.
$250,000
$270,000
$290,000
$310,000
$330,000
$350,000
$370,000
$390,000
Chart 12, Total Seasonal Earnings(in Thousands of $)

13
$150,000,000
$170,000,000
$190,000,000
$210,000,000
$230,000,000
$250,000,000
$270,000,000
$290,000,000
$310,000,000
Chart 14A, Eastern Region Earnings
$0
$10,000,000
$20,000,000
$30,000,000
$40,000,000
$50,000,000
Chart 14B, Central Region Earnings
$0
$10,000,000
$20,000,000
$30,000,000
$40,000,000
$50,000,000
$60,000,000
Chart 14C, Western Region Earnings

14
Looking to earnings in each region over the past 10 years, it’s clear that all have followed a different
course. In the East, save for a small dip immediately following the recession, there has been steady
growth in member earnings, with the rate even accelerating a bit more recently. This past season,
Eastern earnings grew by 4.1%, and have grown by nearly 25% since the aforementioned dip.
In the Central region, a clear trough is observed in the aftermath of the recession, when member
earnings declined by 32% over the course of four seasons. However, beginning in the 2013-2014
season, member earnings began to ascend, and while still somewhat off their pre-recession high, there
has been growth of more than 37% over that period.
In the Western region, the employment struggle observed in work weeks has also made a mark on
member earnings and, following the recession, they dropped by a total of more than 26% over the
course of four seasons – a lesser decline percentage-wise than endured in the Central region, but one
from which recovery has been more elusive. While earnings have increased in the past two seasons,
those increases have been modest and the regional member earnings are still well off their pre-
recession high.
Just as the Production contract dominates overall work weeks, that preeminence is even more
pronounced in earnings, where this contract accounts for more than half of all member income in
Equity’s jurisdiction. While the Production contract suffered an earnings drop of about 20% in the
aftermath of the recession, earnings under the contract have now come roaring back and grew by about
6% this season while breaking the $200 million mark for the first time and have well-surpassed their
level prior to the recession.
$10,000
$60,000
$110,000
$160,000
$210,000
Chart 15, Total Production Earnings(in thousands of $)
15
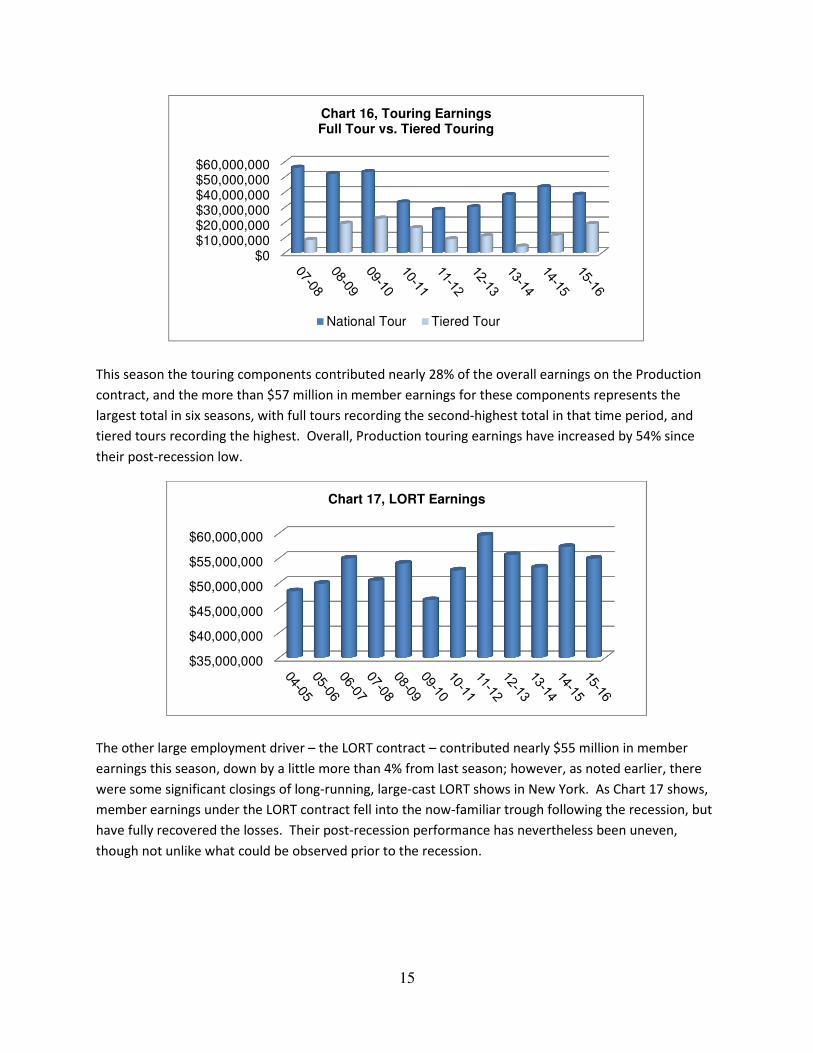
This season the touring components contributed nearly 28% of the overall earnings on the Production
contract, and the more than $57 million in member earnings for these components represents the
largest total in six seasons, with full tours recording the second-highest total in that time period, and
tiered tours recording the highest. Overall, Production touring earnings have increased by 54% since
their post-recession low.
The other large employment driver – the LORT contract – contributed nearly $55 million in member
earnings this season, down by a little more than 4% from last season; however, as noted earlier, there
were some significant closings of long-running, large-cast LORT shows in New York. As Chart 17 shows,
member earnings under the LORT contract fell into the now-familiar trough following the recession, but
have fully recovered the losses. Their post-recession performance has nevertheless been uneven,
though not unlike what could be observed prior to the recession.
$0$10,000,000$20,000,000$30,000,000$40,000,000$50,000,000$60,000,000
Chart 16, Touring EarningsFull Tour vs. Tiered Touring
National Tour Tiered Tour
$35,000,000
$40,000,000
$45,000,000
$50,000,000
$55,000,000
$60,000,000
Chart 17, LORT Earnings
16
17
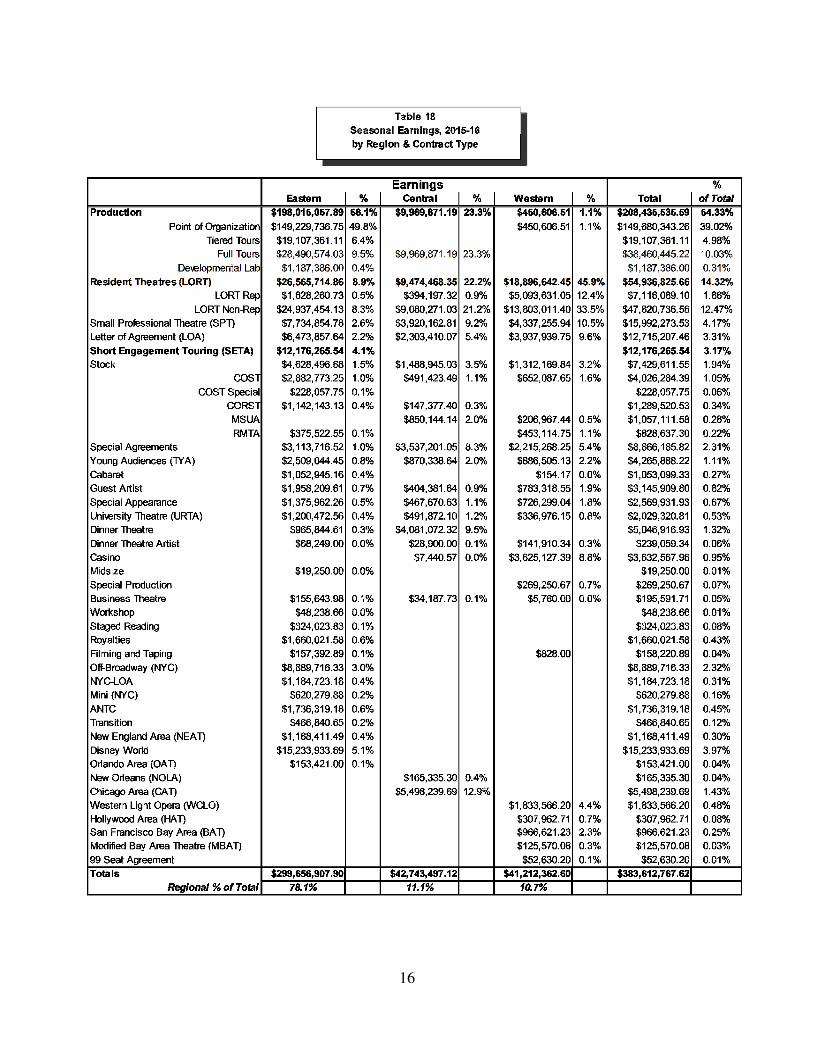
Table 18 outlines member earnings on all contracts in all regions. In addition to the strong performance
on the Production contract, nice gains were also recorded on some other larger contracts. LOAs and
SPTs added more than $2 million in additional earnings combined. The Short Engagement Touring
Agreement (SETA), which is used for smaller-budget tours of shows, had more than $1.5 million in
additional member earnings this season, growth of about 16% from last season.
Regionally, the Disney World contract had $1.1 million more in member earnings this season and is the
fourth largest earnings source overall. The Off-Broadway contract had about $600,000 in additional
earnings this season; the CAT contract also had growth of about $600,000, which represented about a
14% increase for that contract, while the NOLA had growth of more than 50%. The WCLO contract had
more than $400,000 in additional earnings this season, representing almost 30% on that contract, and
the new 99-Seat Agreement registered member earnings for the very first time.
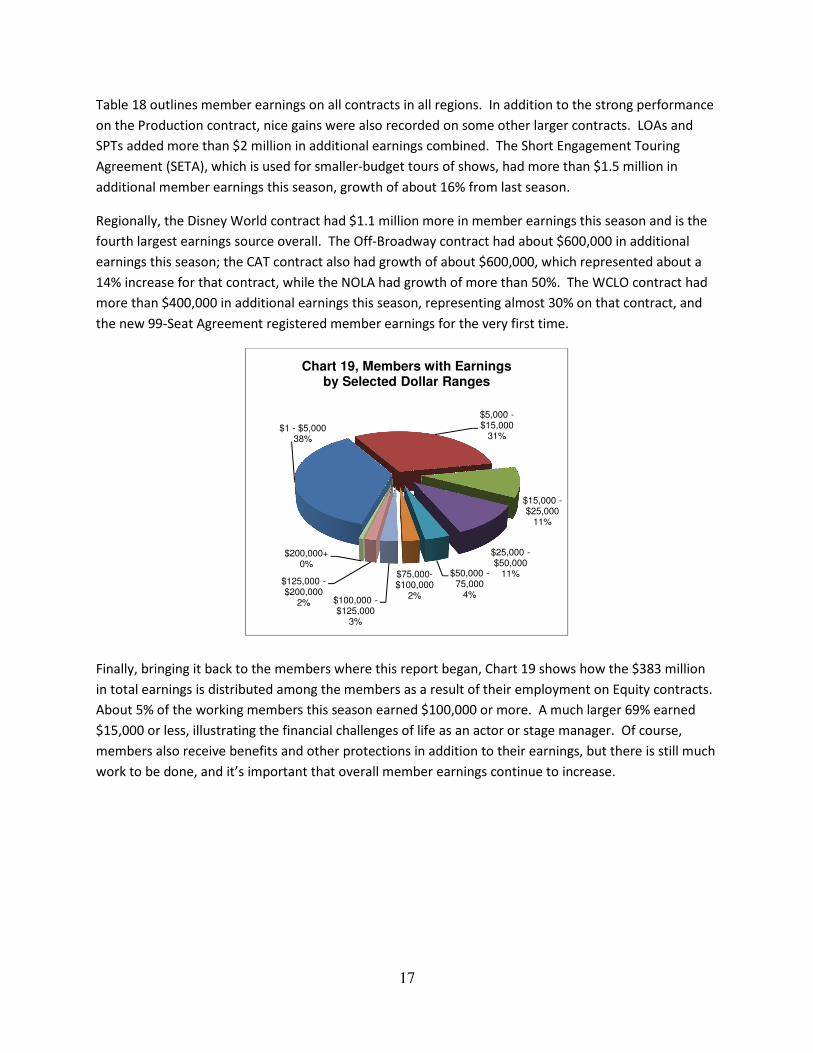
Finally, bringing it back to the members where this report began, Chart 19 shows how the $383 million
in total earnings is distributed among the members as a result of their employment on Equity contracts.
About 5% of the working members this season earned $100,000 or more. A much larger 69% earned
$15,000 or less, illustrating the financial challenges of life as an actor or stage manager. Of course,
members also receive benefits and other protections in addition to their earnings, but there is still much
work to be done, and it’s important that overall member earnings continue to increase.
$1 - $5,00038%
$5,000 -$15,000
31%
$15,000 -$25,000
11%
$25,000 -$50,000
11%$50,000 -75,000
4%
$75,000-$100,000
2%$100,000 -$125,000
3%
$125,000 -$200,000
2%
$200,000+0%
Chart 19, Members with Earningsby Selected Dollar Ranges

18
Finance:
Having examined employment and earnings during the 2015-2016 theatrical season, we will take a brief
look at the finances of the union at the conclusion of the 2015-2016 fiscal year, which ended on March
31, 2016.
Income for the fiscal year was $20.2 million, with the largest sources of revenue being the working dues
and basic dues that the members pay. These are followed by land and building rent derived from the
buildings that Equity owns in Chicago and Los Angeles, as well as the land it owns in Times Square, upon
which the building that houses the Eastern region and National offices stands. Next come initiation fees
paid by new members of the union, followed by income from the union’s investments, and income from
various administrative fees. In the past ten years, working dues has grown to represent about a 1%
greater share of overall income, while the share derived from basic dues has shrunk by about 3.4%. The
portion of income derived from land rent has shown the most movement; while 10 years ago it
represented 3.9% of overall income, it now represents 14.5%, mostly recognized from a lucrative deal
negotiated several years ago on the Times Square property.
Basic Dues: $5,65828.0%
Working Dues: $8,75843.3%
Initiation Fees: $2,22711.0%
All Others: $1800.9%
Investment Income:
$4812.4%
Land & Building
Rent: $2,92714.5%
Chart 20,Total Income: $20,231
FY 2015-16(in thousands of $)
$5,000
$5,100
$5,200
$5,300
$5,400
$5,500
$5,600
Chart 21, Basic Dues Income(in thousands of $)

19
As noted earlier, all active members are required to pay basic dues of $118/year, payable each May and
November in $59 installments. Chart 21 shows basic dues income over the past 10 years. The rate of
$118 has been in effect since the last dues increase asked of the membership in 2002, so the growth
observed is largely the function of a greater number of members in the union and lower rates of
delinquency.
Working dues are paid by Equity members when they work on an Equity contract at a rate of 2.25% of
gross earnings. Chart 22 illustrates working dues income over the past 10 years. The working dues rate
has been in effect since 2002, so growth observed here is strictly a function of greater member earnings
through more employment and higher negotiated salaries.
An initiation fee of $1,100 is paid by each member joining Equity. The fees are often not paid in a lump
sum, as new members have a maximum of two years to pay the entire fee once they begin the process
of joining. Once again, this fee has remained at $1,100 since the last dues increase in 2002. Chart 23
shows initiation fee income over the past 10 years.
$4,000
$5,000
$6,000
$7,000
$8,000
$9,000
Chart 22, Working Dues Income(in thousands of $)
$1,000
$1,500
$2,000
$2,500
$3,000
Chart 23, Initiation Fee Income(in thousands of $)

20
Chart 24 shows a breakdown of expenses into several major categories for the fiscal year. As is true of
most unions, the largest segment of expenses is allotted to payroll and fringe benefits for the staff that
administers the contracts on which the members work, provides support to all members and keeps the
union offices functioning. While this has long represented the largest segment of the budget, its share
of the expenses has fallen by about 1.8% over the past decade as a result of efficiencies identified and
natural staff turnover. All other proportional percentages have remained relatively stable, with the
exception of office expenses, which have grown by 2.8% and encompass items like insurance, facility
expenses and repairs, postage and printing. The "All Others" category comprises legal and other
professional service fees, affiliation fees and travel expenses, among other elements.
Over the 10-year period that we have examined, income has grown by a total of 24%, while expenses
have grown by 47% -- notwithstanding employment and earning gains that have increased income
despite the historic recession occurring in the middle of that period, and successful efforts that have
somewhat curtailed the growth of expenses.
Payroll & Fringes: $12,36361.6%
Office Expenses:
$4,02320.1%
Member Services:
$6383.2%
All Others: $2,36211.8%
Chart 24,Total Expenses: $20,061
FY 2015-16(in thousands of $)
InformationTechnology:
$6703.5%
InformationTechnology:
$6753.4%

21
Finally, Chart 25 provides a snapshot of the market value of the union’s investment portfolio at the end
of the fiscal year for each of the past 10 years. It should be noted that this is indeed a snapshot,
capturing the value at a moment in time, subject to market fluctuation, and large expenditures, such as
the purchase of the buildings in Chicago and Los Angeles over the past 10 years.
As 2017 begins and the 2016-2017 theatrical season is at its approximate mid-point, the hope is that the
significant gains that occurred in this season are built upon. A new all-time high in work weeks and
member earnings of $400 million can be seen on the horizon, and the aspiration is that the momentum
seen this season carries us there.
Special thanks to the IT, Finance and Membership Departments, and their respective Directors, Doug
Beebe, Joe DeMichele and John Fasulo, for all their work in providing the data that serves as the
foundation of this report. And very special thanks to Joey Stamp, the Associate for Finance and
Administration, who pulls all that data together into a usable format for this report. Without their
efforts, this wouldn’t be possible.
$0
$5,000
$10,000
$15,000
$20,000
$25,000
$30,000
Chart 25, Portfolio Market Value(in thousands of $)

22
Index:
Chart 5A Chart 5B Chart 5C
Season Eastern Central Western Totals
06-07 193,261 52,303 58,894 304,458
07-08 197,185 52,238 65,258 314,681
08-09 193,720 51,071 61,519 306,310
09-10 187,216 44,410 56,449 288,075
10-11 187,962 45,567 56,881 290,410
11-12 188,503 42,438 50,673 281,614
12-13 193,729 44,515 54,029 292,273
13-14 196,712 45,373 50,627 292,712
14-15 197,731 47,295 49,341 294,367
15-16 202,471 51,928 51,428 305,827
Workweeks by Region, Charts 5, A - C
P of O Touring
06-07 46,882 28,161
07-08 53,314 26,152
08-09 51,465 28,424
09-10 50,775 31,332
10-11 50,243 23,262
11-12 45,131 17,142
12-13 41,841 18,146
13-14 44,749 19,101
14-15 48,430 22,749
15-16 53,771 23,886
Chart 8 Year LORT
05-06 59,250
06-07 60,103
07-08 60,403
08-09 61,988
09-10 53,827
10-11 59,982
11-12 57,898
12-13 59,785
13-14 57,288
14-15 57,274
15-16 58,390
Chart 9
Work Weeks
Chart 10A Chart 10B Chart 10C
Season Eastern Central Western Totals
05-06 31,252 8,357 19,641 59,250
06-07 31,049 8,650 20,404 60,103
07-08 30,580 8,883 20,940 60,403
08-09 31,099 9,511 21,378 61,988
09-10 28,650 7,238 17,939 53,827
10-11 31,079 8,622 20,281 59,982
11-12 31,226 8,514 18,158 57,898
12-13 30,674 9,398 19,713 59,785
13-14 30,105 8,464 18,719 57,288
14-15 30,018 9,347 17,882 57,247
15-16 29,045 10,037 19,308 58,390
LORT Workweeks by Region, Charts 10, A - C
2015-16 Season Work Weeks %
Production 77,657 25.4%
LORT 58,390 19.1%
SPT 31,870 10.4%
LOA 20,433 6.7%
Disney World 14,444 4.7%
SETA 6,717 2.2%
TYA 8,336 2.7%
Stock 8,226 2.7%
All Other 79,754 26.1%
Grand Total 305,827
Chart 11
05-06 $297,435
06-07 $322,310
07-08 $338,417
08-09 $341,393
09-10 $334,207
10-11 $334,560
11-12 $333,031
12-13 $330,590
13-14 $338,681
14-15 $367,053
15-16 $383,612
Chart 12
Total Seasonal
All Earnings (in thous.)
Chart 14A Chart 14B Chart 14C
Season Eastern Central Western Totals
05-06 $217,743,280 $35,985,760 $43,706,097 $297,435,136
06-07 $227,964,519 $40,119,798 $49,530,442 $317,614,759
07-08 $236,012,522 $44,829,508 $57,574,685 $338,416,714
08-09 $242,316,719 $45,709,539 $53,366,901 $341,393,159
09-10 $240,472,898 $39,731,626 $54,002,802 $334,207,326
10-11 $247,095,465 $35,858,429 $51,605,569 $334,559,463
11-12 $252,426,578 $33,088,312 $47,516,309 $333,031,199
12-13 $257,431,938 $31,094,902 $42,063,257 $330,590,097
13-14 $264,643,519 $34,220,503 $39,817,551 $338,681,573
14-15 $287,828,784 $38,791,165 $40,433,695 $367,053,644
15-16 $299,656,908 $42,743,497 $41,212,363 $383,612,768
Earnings by Region, Charts 14, A - C

23
05-06 $154,471
06-07 $166,722
07-08 $178,869
08-09 $186,670
09-10 $193,250
10-11 $183,185
11-12 $157,949
12-13 $153,677
13-14 $167,458
14-15 $196,773
15-16 $208,435
Chart 15
Total Production
Earnings (in thous.)Full Tour Tiered Tour
07-08 $56,255,155 $8,610,303
08-09 $52,183,423 $19,402,914
09-10 $53,339,968 $22,705,072
10-11 $33,402,148 $16,394,387
11-12 $28,434,669 $9,063,532
12-13 $30,238,739 $11,076,416
13-14 $38,230,751 $4,314,265
14-15 $43,437,540 $11,539,185
15-16 $38,460,445 $19,107,361
Chart 16
LORT
04-05 $48,396,346
05-06 $49,902,327
06-07 $54,972,844
07-08 $50,494,190
08-09 $53,969,195
09-10 $46,584,313
10-11 $52,583,175
11-12 $59,602,524
12-13 $55,674,648
13-14 $53,187,302
14-15 $57,307,269
15-16 $54,936,826
Chart 17
DOLLAR RANGE 2015-16
$1 - $5,000 6,615
$5,000 - $15,000 5,431
$15,000 - $25,000 1,889
$25,000 - $50,000 1,969
$50,000 - 75,000 642
$75,000-$100,000 434
$100,000 - $125,000 458
$125,000 - $200,000 295
$200,000+ 101
TOTALS 17,834
Chart 19
% of
Total
Basic Dues: $5,658 $5,658 28.0%
Working Dues: $8,758 $8,758 43.3%
Initiation Fees: $2,227 $2,227 11.0%
All Other: $180 $180 0.9%
Investment Income: $481 $481 2.4%
Land & Building Rent: $2,927 $2,927 14.5%
Total Income $20,231
Fiscal Year, 2015-16
Chart 20
Income
Fiscal Year Total (in thous.)
06-07 $5,202
07-08 $5,388
08-09 $5,473
09-10 $5,405
10-11 $5,453
11-12 $5,558
12-13 $5,451
13-14 $5,561
14-15 $5,572
15-16 $5,568
Chart 21
Basic Dues Income
Fiscal Year Total (in thous.)
06-07 $7,093
07-08 $7,541
08-09 $7,817
09-10 $7,663
10-11 $7,453
11-12 $7,516
12-13 $7,431
13-14 $7,737
14-15 $8,516
15-16 $8,758
Chart 22
Working Dues Income
Fiscal Year Total (in thous.)
06-07 $2,910
07-08 $2,888
08-09 $2,764
09-10 $2,503
10-11 $2,410
11-12 $2,307
12-13 $2,460
13-14 $2,390
14-15 $2,700
15-16 $2,227
Chart 23
Initiation Fee Revenue

24
% of
Total
Payroll & Fringes: $12,363 $12,363 61.6%
Office Expenses: $4.023 $4,023 20.1%
Member Services: $638 $638 3.2%
Information Technology: $675 $675 3.4%
All Other: $2,362 $2,362 11.8%
Total Expenses $20,061
Fiscal Year, 2015-16
Expenses
Chart 24
Fiscal Year Total (in thous.)
05-06 $23,652
06-07 $27,785
07-08 $28,649
08-09 $22,368
09-10 $29,802
10-11 $29,204
11-12 $27,439
12-13 $22,590
13-14 $24,994
14-15 $22,048
15-16 $20,816
Chart 25
Portfolio Market Value
At March 31