2014 washington small fruit conference proceedings
TRANSCRIPT

2014 Washington Small Fruit Conference Proceedings

Table of Contents Summary of Sprayer Tip Selection ................................................................................................. 3
Cold Damage in Washington Berry Crops ..................................................................................... 8
Perennial Weed Control in Red Raspberries ................................................................................ 12
Perennial Weed Control in Blueberries ........................................................................................ 17
Weed Control in Strawberries ....................................................................................................... 19
Fertigation practices for high yield and quality in blueberry ........................................................ 23
Water requirements for drip and sprinkler irrigation of raspberry ............................................... 25
Irrigation practices to reduce heat-related fruit damage in blueberries ........................................ 26
Irrigation Scheduling Made Easy.................................................................................................. 28
Understanding the Relationship between Pollination Services and Yield in Blueberry ............... 30
SWD and the Threat of Re-Emerging Pests ................................................................................. 34
Fresh Market Strawberries: Varieties, Management Practices, and Organic Considerations ...... 40
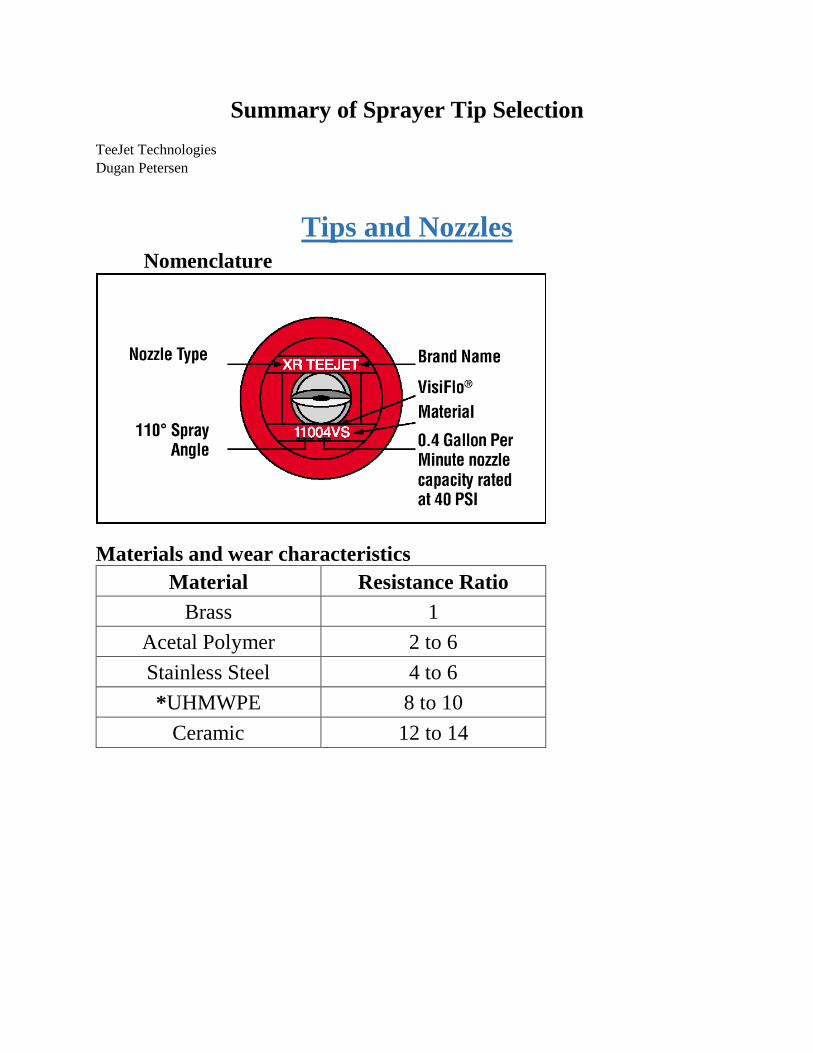
Summary of Sprayer Tip Selection TeeJet Technologies Dugan Petersen
Tips and Nozzles Nomenclature
Materials and wear characteristics
Material Resistance Ratio Brass 1
Acetal Polymer 2 to 6 Stainless Steel 4 to 6 *UHMWPE 8 to 10
Ceramic 12 to 14

Worn tips and how they look
Cv Calcualtion (Coefficient of variation)
Spray Particle sizes in Microns 2000µm = #2 Pencil Lead 850µm = Paper Clip 420µm = Staple 300µm = Toothbrush Bristle 150µm = Sewing Thread 100µm = Human Hair
Micron Measurement tools

ASABE Standard S572.1 Droplet size Classification
Category Symbol Color Code Approximate Dv0.5 (VDM)
(microns)
Extremely Fine XF Purple ≈ 50
Very Fine VF Red < 136
Fine F Orange 136 – 177
Medium M Yellow 177 – 218
Coarse C Blue 218 – 349
Very Coarse VC Green 349 – 428
Extremely Coarse XC White 428 – 622
Ultra Coarse UC Black > 622
Ways to reduce Drift • Select a nozzle that produces coarser droplets • Use the lower end of the pressure range • Lower boom height • Increase nozzle size • Spray when wind speeds are less than 10 mph • Spray when wind is moving away from sensitive crops • Do not spray when the air is very calm • Use a drift control additive when needed
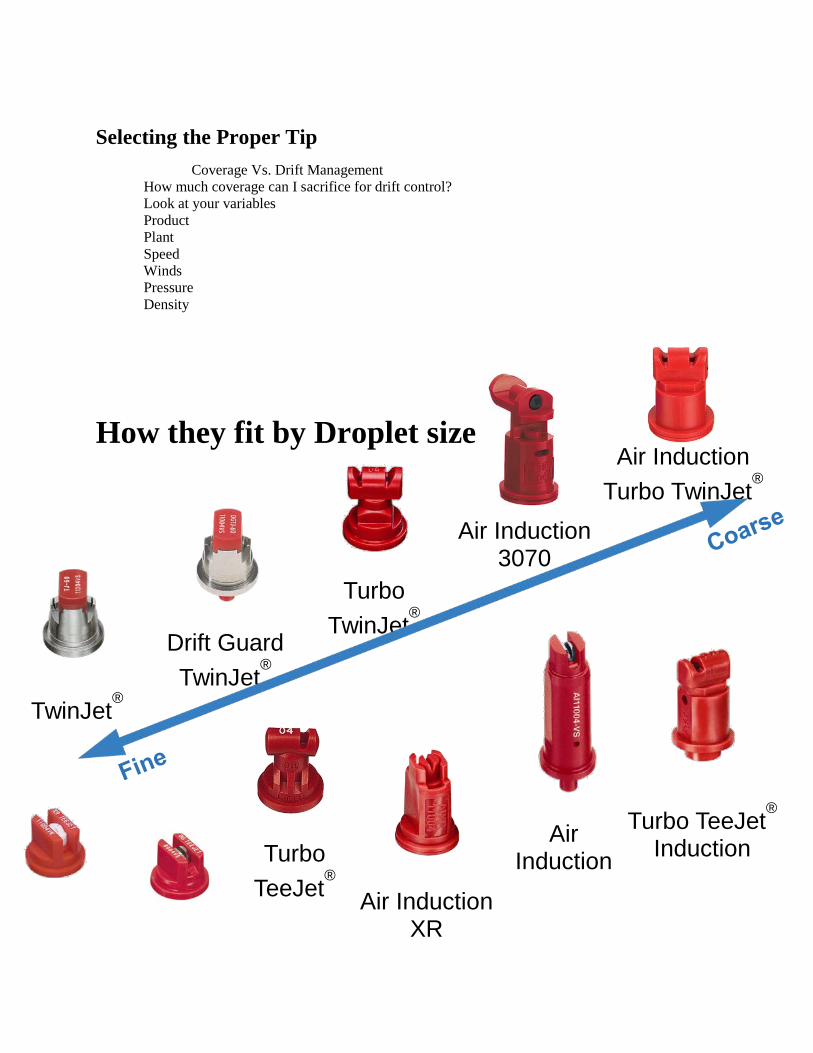
Selecting the Proper Tip Coverage Vs. Drift Management How much coverage can I sacrifice for drift control? Look at your variables Product Plant Speed Winds Pressure Density
How they fit by Droplet size
Turbo TeeJet®
Induction
Turbo TwinJet
®
Air Induction
Turbo TwinJet®
Air Induction
3070
Drift Guard TwinJet
®
TwinJet®
Air Induction
Air Induction XR
Turbo TeeJet
®
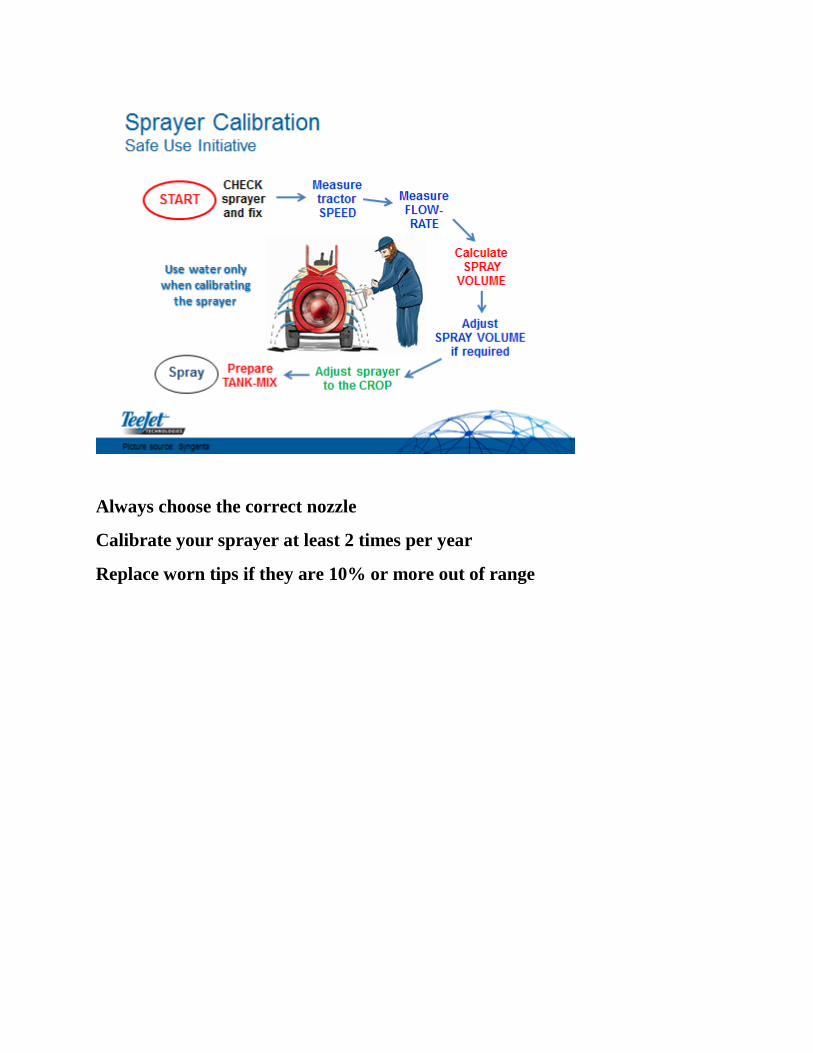
Always choose the correct nozzle
Calibrate your sprayer at least 2 times per year
Replace worn tips if they are 10% or more out of range

Cold Damage in Washington Berry Crops
Lisa W. DeVetter (presenter), Chris Benedict, and Gwen Hoheisel Washington State University
The objectives of this presentation were to review the biological mechanisms of cold injury in berry crops, discuss the winter of 2013/2014, and to provide an update on current research related to cold hardiness determination of blueberries.
Mechanisms of Cold Injury
Low temperature is one of the primary factor limiting plant distribution in the world. If not adapted or sufficiently acclimated, freezing injury can occur when plant tissues are exposed to temperatures below the freezing point of water (32 oF). Freezing that occurs outside of plant cells is referred to as extracellular freezing and can lead to damage through cellular dehydration due to the dry nature of ice around cells. Water inside a plant cell will move from the cell to the dry ice, causing freeze-induced dehydration inside the cell. This, in turn, can disrupt the function of important cellular properties and result in damage or cell death. Freezing may also occur within the plant cell. The occurrence and extent of injury is related to several factors, including the minimum temperature achieved during a cold event, the rate of temperature decrease, the duration of a low temperature event, rate of thawing, genetics of the plant or cultivar (i.e., the hardiness level of the species or cultivar), and management.
Cold Requirements
Although low temperatures can injure plants, they are also necessary for perennial plant growth and development. Specifically, many plants need a period of chilling temperatures between 32 and 45 oF for plants to exit dormancy and properly flower. This is referred to as a chilling requirement. Chilling requirements vary based on species and cultivar, with raspberry having a reported chilling requirement of 700 to 800+ chilling hours. Northern highbush blueberry has an average chilling requirement of 800 hours, but this likewise depends on cultivar genetics. The chilling requirement for strawberry is shorter and ranges from 200 to 300 hours.
Preventing Cold Injury
Even though plant genetics greatly influences the incidence of cold injury, there are several strategies that can reduce the likelihood of incurring damage. First is the encouragement of plants to go and stay dormant. Mid-to-late-summer and early-fall applications of fertilizer, particularly nitrogen, can promote growth and discourage the natural acclimation process that help plants prepare for winter. Therefore, it is advised to avoid late fertilizer applications during

this period. Late season or early fall pruning can also interfere with acclimation by stimulating growth and leading to subsequent reductions of hardiness. The best time to prune is when plants are dormant and it is therefore recommended to prune late winter to early spring. A site may also provide protection through various environmental management practices, including: sprinkler irrigation, heaters, windbreaks, and protected culture (e.g., row covers). Some growers in other countries will mulch raspberry floricanes in order to provide winter protection. Surfactants, antitranspirants, and bactericide ice-nucleation inhibitors are also available tools for preventing cold injury, but little research has been performed regarding their efficacy.
Winter of 2013/2014
Several low-temperature events occurred during the winter of 2013/2014 in Whatcom County (Figure 1). Damage was observed the following growing season in raspberries, even though dormant floricanes have been reported to be tolerant to temperatures of -20 to -30 °F. A survey of eight fields from three commercial growers was performed in order to assess potential factors that could be attributed to this observed damage. Damage was visually assessed in ‘Meeker’, ‘Wakefield’, and ‘Chemainus’ raspberry. Pruning and tying dates, fertilizer rates, field age, yield, and grower-reported vigor was provided for individual fields from grower cooperators.
Figure 1. Temperature data for Whatcom County, WA. Dates presented are from 9/1/2013 to 4/1/2014. Vertical lines represent pruning/tying dates for individual fields and purple horizontal lines denote the monthly five-year averages of extreme temperatures. Weather data provided courtesy of WSU AgWeatherNet. Data are copyright of WSU.

Damage was observed across Whatcom County and ranged from minimal to severe, depending on the location (Figure 2). There was no strong relationship between timing of pruning/tying of floricanes and the observed severity of injury. However, it was observed that less damage occurred near areas where canes were protected by a windbreak. This can be explained because strong, dehydrating winds accompanied by cold can exacerbate injury. Windbreaks protect against this occurrence.
Figure 2. Field locations for cold injury assessments and spatial representation of damage in Whatcom County, WA. Stars represent individual fields. Scale is: 1 to 3 = no-to-minimal damage (blue colors); 4 to 6 = mild damage (yellow colors); 7 to 10 = severe damage (orange to red colors).
Several fluctuations in maximum and minimum air temperatures were experienced over short periods of time, suggesting that acquisition of maximum plant hardiness was limited and explains why injury was observed above the reported cold tolerance range of floricane raspberry. Plants generally need gradual decreases in temperature in order to reach maximum winter hardiness and freeze-thaw events can interfere with this process. Furthermore, hardiness can be lost when temperatures rise above freezing and can explain why injury was observed above the reported cold tolerance range. Cultivar genetics and subsequent plant hardiness may also be a factor.
Despite winter injury, the evaluated fields had reported yields of 3.5 to 7.3 tons/acre. The severity of injury was not strongly related to current-season yields. Some of the fields with the most winter injury sustained high yields, such as a field of ‘Wakefield’ that yielded 7.3 tons/acre

despite having the most observed cold injury. This observation suggests plants are compensating for the injury. However, it remains to be observed how yields in future years are affected in these plantings.
Update on Blueberry Cold Hardiness Project
The Washington Blueberry Commission is supporting a project that seeks to determine the cold hardiness of blueberries grown in Washington. The investigators of this project are Gwen Hoheisel (primary investigator), Melba Salazar, Gerrit Hoogenboom, and Lisa DeVetter. The short-term objectives of this project are to: 1) Determine appropriate and reliable methods for assessing cold damage in blueberries; 2) Determine cold hardiness curves for two blueberry cultivars from dormancy to bloom, and; 3) Update existing hardiness
charts for key phenological stages of Washington-grown blueberry. Long-term, the investigators of this project
would like to develop a model that predicts cold hardiness for several varieties and can be utilized with the WSU AgWeatherNet system. The investigators are currently working on objective one by conducting weekly estimates of hardiness using a “vending machine” freezing instrument. Three different methodologies are also being compared every month from November 2014 to March 2015. These comparisons will guide future work so that the most reliable and efficient method for cold hardiness determination is utilized. Figure 3 shows the three different methods currently being compared.
Figure 3. The methods being compared for blueberry cold hardiness determination, including (A) glycol bath; (B) “vending machine” programmable freezer, and (C) differential thermal analysis.

Perennial Weed Control in Red Raspberries
Project Number: 13C-3419-7297
Personnel: Timothy W. Miller, WSU Mount Vernon NWREC
Carl R. Libbey, WSU Mount Vernon NWREC
Reporting Period: 2013-14
Accomplishments: The new herbicide trial was conducted at the Mukhtar Singh Farm near Lynden, WA. Three other raspberry trials were conducted during 2014: an IR-4 efficacy and crop safety trial for saflufenacil, a Zeus (sulfentrazone) timing trial, and cane burning/fruit quality trial at WSU NWREC. Data for the new herbicide trial are reported here and will be available at the red raspberry portion of the Northwestern Washington Small Fruit Conference in Lynden in December, 2014.
Materials and Methods:
The trial was conducted on established ‘Meeker’ red raspberry near Lynden, WA. Products were applied at two timings: at time of primocane burning (PRIMO, 6-inch primocanes) and to 3-ft tall primocanes (POST). Herbicides were applied March 27 (PRIMO) and May 20 (POST), 2014 using a CO2-pressurized backpack sprayer. Herbicides and rates are provided in Tables 1 through 4. Primocane injury and weed control were evaluated April 10 and 28, May 7, and June 9. Berries were sampled by hand on July 7. The design was a randomized complete block with three replicates.
Results:
There was no visible floricane injury resulting from any treatment (data not shown). Gramoxone and Treevix PRIMO applications gave satisfactory primocane control by the April 11 evaluation (Table 1). By early June, there was no significant growth reduction by herbicide treatment. Broadleaf weed control was uniform for all treatments in this trial, ranging from 73 to 100% control at all evaluation timings (Table 2). Plots scheduled to receive quinclorac POST were generally more weedy than plots receiving a PRIMO treatment; following quinclorac application, broadleaf weed control was similar across all treatments. Primary broadleaf weeds in the plots were common groundsel (Senecio vulgaris), fringed willow-herb (Epilobium ciliatum), dandelion (Taraxacum officinale), and wild buckwheat (Polygonum convolvulus). Quackgrass (Elymus repens) was present to some degree in most plots, ranging from 13 to 83% cover among all plots prior to herbicide application (Table 3). Most subsequent control ratings did not significantly differ, although it appears that Gramoxone was more effective in burning back emerged quackgrass than Treevix. Berry yield and fruit size was similar for all treatments (Table 4). The single sampling averaged about 600 g fruit per m of row. Fruit size ranged from 2.4 to 3.0 g/berry.
These results indicate that new herbicides tested in this trial were safe for established red raspberry. Alion combinations with Gramoxone gave effective broadleaf weed control, as well as initial burn of quackgrass. Treevix combinations were effective for primocane management and subsequent broadleaf weed control, and quinclorac, alone and in combination with other herbicides, should continue to be a high priority for ultimate registration in red raspberry.

Table 1. Primocane growth reduction following application of several herbicides in red raspberry (2014).
Treatmenta
Rate
Timing
Primocane growth reductionb
4/10 4/28 5/7 6/9
product/a % % % %
Alion + Gramoxone 5 fl.oz + 2 pt PRIMO 83 ab 68 a-d 30 abc 2
Alion + Gramoxone 10 fl.oz + 2 pt PRIMO 93 ab 58 bcd 10 bc 2
Treevix 1 oz PRIMO 93 ab 73 a-d 53 abc 2
Treevix 2 oz PRIMO 100 a 82 abc 65 ab 2
Alion + Treevix 5 fl.oz + 1 oz PRIMO 100 a 83 abc 57 abc 0
Alion + Sinbar + Gramoxone
5 fl.oz + 1.5 lb + 2 pt
PRIMO 87 ab 82 abc 57 abc 2
Alion + simazine + Gramoxone
5 fl.oz + 2 qt + 2 pt
PRIMO 63 a-d 73 a-d 35 abc 2
Alion + diruon + Gramoxone
5 fl.oz + 2 lb + 2 pt
PRIMO 72 abc 60 a-d 28 abc 2
Treevix + Sinbar 1 oz + 1.5 lb PRIMO 100 a 62 a-d 30 abc 2
Treevix + simazine 1 oz + 2 qt PRIMO 95 a 50 cd 23 abc 2
Treevix + diuron 1 oz + 2 lb PRIMO 100 a 68 a-d 42 abc 2
Quinclorac 12 fl.oz POST 40 a-d 95 a 73 a 0
Quinclorac 1.5 pt POST 0 d 90 ab 55 abc 2
(Alion + Gramoxone) fb Quinclorac
(5 fl.oz + 2 pt) fb 12 fl.oz
(PRIMO + PRIMO) fb POST
60 a-d 62 a-d 28 abc 2
Treevix fb Quinclorac 1 oz fb 12 fl.oz PRIMO fb POST 43 a-d 38 d 8 bc 2
Sinbar fb Quinclorac 1.5 lb fb 12 fl.oz PRIMO fb POST 25 bcd 83 abc 48 abc 2
Simazine fb Quinclorac 2 qt fb 12 fl.oz PRIMO fb POST 0 d 88 ab 58 abc 2
Diuron fb Quinclorac 2 lb fb 12 fl.oz PRIMO fb POST 13 cd 83 abc 67 ab 0
Means within a column and followed by the same letter, or not followed by a letter, are not significantly different (P < 0.05).
aHerbicides applied March 27 (6-inch primocanes) and May 20 (POST, 3-ft primocanes), 2014; “fb” =
“followed by”.
bPerecent primocane burn is the level of primocane suppression visible in the plot compared to nontreated
primocanes; quinclorac was not applied until May 20, 2014.

Table 2. Weed control following application of several herbicides in red raspberry (2014).
Treatmenta
Rate
Timing
Weed controlb
4/10 4/28 5/7 6/9 8/7
product/a % % % % %
Alion + Gramoxone 5 fl.oz + 2 pt PRIMO 100 a 100 a 100 a 95 a 93 a
Alion + Gramoxone 10 fl.oz + 2 pt PRIMO 100 a 100 a 100 a 100 a 100 a
Treevix 1 oz PRIMO 97 a 90 ab 87 ab 88 a 82 a
Treevix 2 oz PRIMO 98 a 98 a 100 a 100 a 98 a
Alion + Treevix 5 fl.oz + 1 oz PRIMO 98 a 100 a 100 a 100 a 98 a
Alion + Sinbar + Gramoxone
5 fl.oz + 1.5 lb + 2 pt
PRIMO 100 a 100 a 100 a 98 a 97 a
Alion + simazine + Gramoxone
5 fl.oz + 2 qt + 2 pt
PRIMO 100 a 100 a 100 a 97 a 97 a
Alion + diruon + Gramoxone
5 fl.oz + 2 lb + 2 pt
PRIMO 100 a 100 a 100 a 100 a 100 a
Treevix + Sinbar 1 oz + 1.5 lb PRIMO 98 a 100 a 100 a 98 a 100 a
Treevix + simazine 1 oz + 2 qt PRIMO 93 a 85 ab 80 ab 82 a 88 a
Treevix + diuron 1 oz + 2 lb PRIMO 98 a 93 ab 92 ab 92 a 83 a
Quinclorac 12 fl.oz POST 83 a 92 ab 88 ab 80 a 78 a
Quinclorac 1.5 pt POST 75 a 83 ab 82 ab 85 a 85 a
(Alion + Gramoxone) fb Quinclorac
(5 fl.oz + 2 pt) fb 12 fl.oz
(PRIMO + PRIMO) fb POST
98 a 98 a 100 a 98 a 98 a
Treevix fb Quinclorac 1 oz fb 12 fl.oz PRIMO fb POST 85 a 77 b 73 b 85 a 85 a
Sinbar fb Quinclorac 1.5 lb fb 12 fl.oz PRIMO fb POST 95 a 98 a 98 ab 97 a 97 a
Simazine fb Quinclorac 2 qt fb 12 fl.oz PRIMO fb POST 78 a 98 a 98 ab 95 a 95 a
Diuron fb Quinclorac 2 lb fb 12 fl.oz PRIMO fb POST 83 a 98 a 97 ab 93 a 88 a
Nontreated --- --- 0 b 0 c 0 c 0 b 0 b
Means within a column and followed by the same letter, or not followed by a letter, are not significantly different (P < 0.05).
aHerbicides applied March 27 (6-inch primocanes) and May 20 (POST, 3-ft primocanes), 2014; “fb” =
“followed by”.
bQuinclorac was not applied until May 20, 2014.

Table 3. Quackgrass cover following application of several herbicides in red raspberry (2014).
Treatmenta
Rate
Timing
Quackgrass coverb
Preburn 4/10 4/28 5/7 6/9 8/7
product/a % % % % % %
Alion + Gramoxone 5 fl.oz + 2 pt PRIMO 52 7 15 18 12 8
Alion + Gramoxone 10 fl.oz + 2 pt PRIMO 33 5 8 13 7 5
Treevix 1 oz PRIMO 53 47 60 73 52 33
Treevix 2 oz PRIMO 60 57 60 65 53 35
Alion + Treevix 5 fl.oz + 1 oz PRIMO 83 80 82 90 62 28
Alion + Sinbar + Gramoxone
5 fl.oz + 1.5 lb + 2 pt
PRIMO 83 20 23 38 12 43
Alion + simazine + Gramoxone
5 fl.oz + 2 qt + 2 pt
PRIMO 47 7 8 8 10 7
Alion + diruon + Gramoxone
5 fl.oz + 2 lb + 2 pt
PRIMO 65 13 17 37 25 13
Treevix + Sinbar 1 oz + 1.5 lb PRIMO 35 33 33 32 5 3
Treevix + simazine 1 oz + 2 qt PRIMO 13 13 13 25 13 20
Treevix + diuron 1 oz + 2 lb PRIMO 42 42 45 48 32 25
Quinclorac 12 fl.oz POST 65 65 58 65 47 32
Quinclorac 1.5 pt POST 35 35 28 35 18 17
(Alion + Gramoxone) fb Quinclorac
(5 fl.oz + 2 pt) fb 12 fl.oz
(PRIMO + PRIMO) fb POST
28 2 3 10 5 5
Treevix fb Quinclorac 1 oz fb 12 fl.oz PRIMO fb POST 35 35 35 35 25 12
Sinbar fb Quinclorac 1.5 lb fb 12 fl.oz PRIMO fb POST 33 32 25 23 7 2
Simazine fb Quinclorac 2 qt fb 12 fl.oz PRIMO fb POST 28 28 28 35 23 13
Diuron fb Quinclorac 2 lb fb 12 fl.oz PRIMO fb POST 27 27 27 35 18 15
Nontreated --- --- 68 68 73 77 65 38
Means within a column and followed by the same letter, or not followed by a letter, are not significantly different (P < 0.05).
aHerbicides applied March 27 (6-inch primocanes) and May 20 (POST, 3-ft primocanes), 2014; “fb” =
“followed by”.
bPercent quackgrass cover given for prior to herbicide application “preburn” and following herbicide
treatment; quinclorac was not applied until May 20, 2014.

Table 4. Red raspberry yield and fruit size following application of several herbicides (2014).
Treatmenta Rate Timing Fruit yieldb Berry sizeb
product/a g/m g/berry
Alion + Gramoxone 5 fl.oz + 2 pt PRIMO 670 2.6
Alion + Gramoxone 10 fl.oz + 2 pt PRIMO 658 2.7
Treevix 1 oz PRIMO 698 2.5
Treevix 2 oz PRIMO 717 2.7
Alion + Treevix 5 fl.oz + 1 oz PRIMO 719 2.4
Alion + Sinbar + Gramoxone
5 fl.oz + 1.5 lb + 2 pt
PRIMO 733 2.6
Alion + simazine + Gramoxone
5 fl.oz + 2 qt + 2 pt
PRIMO 521 3.0
Alion + diruon + Gramoxone
5 fl.oz + 2 lb + 2 pt
PRIMO 601 2.7
Treevix + Sinbar 1 oz + 1.5 lb PRIMO 829 2.7
Treevix + simazine 1 oz + 2 qt PRIMO 754 2.5
Treevix + diuron 1 oz + 2 lb PRIMO 869 2.6
Quinclorac 12 fl.oz POST 563 2.9
Quinclorac 1.5 pt POST 797 2.9
(Alion + Gramoxone) fb Quinclorac
(5 fl.oz + 2 pt) fb 12 fl.oz
(PRIMO + PRIMO) fb POST
611 2.9
Treevix fb Quinclorac 1 oz fb 12 fl.oz PRIMO fb POST 811 2.7
Sinbar fb Quinclorac 1.5 lb fb 12 fl.oz PRIMO fb POST 738 2.6
Simazine fb Quinclorac 2 qt fb 12 fl.oz PRIMO fb POST 678 2.5
Diuron fb Quinclorac 2 lb fb 12 fl.oz PRIMO fb POST 713 2.7
Nontreated --- --- 805 2.4
Means within a column and followed by the same letter, or not followed by a letter, are not significantly different (P < 0.05).
aHerbicides applied March 27 (6-inch primocanes) and May 20 (POST, 3-ft primocanes), 2014;
“fb” = “followed by”.
bFruit yield from 1 m of row, picked July 7, 2014; berry size calculated from the weight of 50
berries.

Perennial Weed Control in Blueberries
Project No: 13C 3419 5229
Reporting Period: FY 2013-14
Personnel:
Timothy W. Miller, WSU Mount Vernon NWREC
Carl R. Libbey, WSU Mount Vernon NWREC
Accomplishments: The herbicide trial was conducted in blueberry during 2013. The data will be provided at grower meetings during winter 2013-14.
Results:
Young ‘Draper’ blueberries, transplanted in September, 2011 (Craig Ford, South Alder Farms, Lynden, cooperator), were treated with directed sprays of Callisto (mesotrione), Matrix (rimsulfuron), Sandea (halosulfuron), Sinbar (terbacil), Stinger (clopyralid), Treevix (saflufenacil), Karmex (diuron), Lorox (linuron), Reflex (fomesafen), Alion (indaziflam), Dual Magnum (s-metolachlor), Gramoxone (paraquat), and Velpar (hexazinone) either during late dormancy (March 4, 2013) or post bud break (April 30, 2013; POST). The same plots were treated with the same herbicides in 2012. Plots in the first replicate were also inadvertently treated by the cooperator with a directed spray of Callisto in mid-April. Percent weed control from dormant-season applications was estimated April 24, 2013 and for all plots on May 13 and 28 and September 14, 2013. As these were young blueberry plants, no berries were harvested from these plots. The experimental design was a randomized complete block with four replicates. Means were separated using Tukey’s HSD (P < 0.05).
Some weeds were emerged at the time the dormant application timing (early March). Primary weed species in the plots were common chickweed (Stellaria media), shepherd’s-purse (Capsella bursa-pastoris), purple deadnettle (Lamium purpureum), white clover (Trifolium repens), common groundsel (Senecio vulgaris), spring whitlowgrass (Draba verna), and annual bluegrass (Poa annua). Other weeds included prostrate knotweed (Polygonum aviculare), panicle willow-herb (Epilobium ciliatum), dandelion (Taraxacum officinale), quackgrass (Elymus repens), and corn spurry (Spergula arvensis).
Weed control at about 6 weeks after the dormant treatment (April 23) was excellent, ranging from 87 to 100% (Table). Note that products listed as “POST” in the Table were not applied until May 2, 2013 but those plots had received the same treatment during the 2012 season. Those treatments ranged from 62 to 88% control, although none differed significantly. Weed control at the May 13 evaluation ranged from 48 to 100%, with Reflex at 1 pt/a or Stinger alone (during dormancy or POST) or POST with Sandea resulting in <72% weed control. By May 28, the only treatments resulting in <70% weed control were the same treatments as well as Treevix at 2 oz/a, Reflex at 2 pt/a; control with Sandea + Stinger POST had improved to 87% at that timing. There were still no significant differences in weed control among the treatments by September, although it was clear that the rows had been treated with Gramoxone by the cooperator during the summer to control emerged weeds throughout the plots. No treatments caused visible blueberry foliar injury at any evaluation.

Based on these data, continued testing of these product combinations is warranted. In particular, Treevix and Alion remain as high priorities for registration in nonbearing and newly-planted blueberry, and Reflex also appears to be a good fit for these uses.
Table 1. Weed control after treatment with several herbicides in second-year ‘Draper’ blueberry (2013).
Treatmenta
Rate
Timinga
Weed control Apr 24 May 13 May 28
product/a % % % Sandea 2 oz Dormant 95 ab 82 ab 73 a-d Stinger 5.3 fl.oz Dormant 87 abc 50 cde 38 ef Callisto 6 fl.oz Dormant 93 abc 85 ab 77 a-d Matrix 4 oz Dormant 95 ab 88 ab 90 a-d Sinbar + Lorox 2 lb + 1 lb Dormant 100 a 95 ab 93 abc Sinbar + Lorox 2 lb + 2 lb Dormant 100 a 98 ab 95 abc Sinbar + Karmex + Lorox 2 lb + 1 lb + 1 lb Dormant 100 a 100 a 100 a Sinbar + Karmex + Lorox 2 lb + 2 lb + 2 lb Dormant 100 a 100 a 98 ab Sinbar + Callisto 2 lb + 6 fl.oz Dormant 98 a 97 ab 95 abc Sinbar + Matrix 2 lb + 4 oz Dormant 100 a 100 a 100 a Velpar + Sinbar + Karmex 1 lb + 1 lb + 1 lb Dormant 100 a 98 ab 97 abc Treevix + mso + ams 1 oz + 1% + 2% Dormant 98 a 85 ab 70 a-e Treevix + mso + ams 2 oz + 1% + 2% Dormant 93 abc 82 ab 67 b-e Alion + Gramoxone 2.5 fl.oz + 2 pt Dormant 98 a 90 ab 80 a-d Alion + Gramoxone 5 fl.oz + 2 pt Dormant 98 a 92 ab 82 a-d Reflex 1 pt Dormant 93 abc 72 bcd 60 def Reflex 2 pt Dormant 92 abc 77 abc 65 cde Reflex + Dual Magnum 2 pt + 1 pt Dormant 95 ab 85 ab 80 a-d Reflex + Callisto 2 pt + 3 fl.oz Dormant 98 a 87 ab 78 a-d Sandea 2 oz POST 85 a-d 87 ab 87 a-d Stinger 5.3 fl.oz POST 68 a-d 48 de 32 fg Callisto 6 fl.oz POST 53 d 75 a-d 87 a-d Matrix 4 oz POST 73 a-d 85 ab 92 a-d Sandea + Matrix 2 oz + 4 oz POST 77 a-d 90 ab 97 abc Sandea + Callisto 2 oz + 6 fl.oz POST 65 bcd 72 bcd 87 a-d Sandea + Stinger 2 oz + 5.3 fl.oz POST 78 a-d 75 a-d 82 a-d Stinger + Matrix 5.3 fl.oz + 4 oz POST 83 a-d 85 ab 92 a-d Stinger + Callisto 5.3 fl.oz + 6 fl.oz POST 88 abc 88 ab 85 a-d Matrix + Callisto 4 oz + 6 fl.oz POST 72 a-d 82 ab 95 abc Sandea + Matrix + Callisto 2 oz + 4 oz + 6 fl.oz POST 75 a-d 80 ab 95 abc Sandea + Matrix + Stinger 2 oz + 4 oz + 5.3 fl.oz POST 73 a-d 75 a-d 92 a-d Sandea + Callisto + Stinger 2 oz + 6 fl.oz + 5.3 fl.oz POST 82 a-d 83 ab 93 abc Matrix + Callisto + Stinger 4 oz + 6 fl.oz + 5.3 fl.oz POST 65 bcd 77 abc 97 abc Nontreated check --- --- 62 cd 28 e 0 g
Means within a column followed by the same letter or with no letters are not statistically different (P < 0.05).
aDormant applications were made March 8-9, 2012 and POST applications were made May 2, 2012; plots were maintained in 2013, with dormant applications made March 4, 2013 and POST applications made April 30, 2013; all treatments were mixed with nonionic surfactant (0.25%, v/v) prior to application.
Weed Control in Strawberries
Project No: 13C-3419-8228
Reporting Period: 2013-14
Personnel: Tim Miller and Carl Libbey, WSU Mount Vernon NWREC
Accomplishments: Two studies were completed in 2013-14: a newly-planted strawberry trial and an established strawberry trial. Ten herbicides were tested for crop safety and weed control and a total of 48 treatments were applied. ‘Totem’ was used for both the established trial and the newly-planted strawberry trial. Plant material was generously donated by Sakuma Brothers Farms.
Results:
Newly-planted strawberry: Strawberries were transplanted at WSU Mount Vernon NWREC May 16, 2014. Herbicides were applied May 20, 2014 (post-transplant, POSTR); no weeds were emerged at the time of herbicide application. Crop injury and weed control were estimated June 10, July 1, and July 14, 2014. The plots were severely infested with seed from nonharvested buckwheat the previous year, however, so volunteer buckwheat formed a dense growth in all plots throughout the trial. Therefore, postemergence (POST) applications were made June 26, 2014 primarily to gauge impact of the herbicides on that weed, although it was also of interest to look at damage to young strawberry plants. Treatments with POST activity were reapplied, other treatments received Chateau alone (0.75 oz/a + 0.25% nonionic surfactant) as the POST treatment. Given the regrowth of the buckwheat by late July, the experiment was declared complete at that point and plots were tilled. The experimental design was a randomized complete block with four replicates. Data are provided in Table 1.
None of the herbicides applied POSTR had caused visual injury to transplanted strawberries by the June crop injury rating (data not shown). Only after the POST treatments did strawberry show damage. Herbicides applied POST that caused < 15 injury included Spartan (alone or mixed with Trellis or Alion), Reflex (alone or mixed with Devrinol or Dual Magnum), and surprisingly, Treevix + Devrinol (other Treevix treatments caused 30 and 48% injury). It appears that Spartan and Reflex, therefore, may offer the best potential for mid-season applications for weed management rescue operations. Other products resulted in appreciable strawberry leaf damage, although normal new growth was visible in most plots by two weeks after the POST treatment.
Initial weed control ranged from 70 to 95% on June 10, with only Devrinol (70%) or Dual Magnum (73%) providing statistically limited weed control. As mentioned above, poor control of volunteer buckwheat resulted in only about half of the plots showing > 50% weed control by June 26. Weed control after POST herbicide treatments was good to excellent, with all treatments providing at least 83% weed control by July 1. By July 14, Spartan treatments were giving 60 to 65% weed control, Chateau treatments 50 to 70%, Reflex 65 to 90%, and Treevix 60 to 83% at that evaluation (data not shown). Top weed control at that time was observed in strawberries treated with Fierce, Reflex + Dual Magnum, and Treevix + Devrinol.
From these data, it appears that Gallery, Alion, Fierce, Reflex, and Dual Magnum remain excellent candidates for registration in newly-planted strawberry.

Established strawberry: Strawberries were transplanted at WSU Mount Vernon NWREC May 10, 2013. All plots were treated with Spartan + Prowl H2O (5 fl.oz/a + 3.2 pt/a) POSTR for weed control during the establishment year. All plots were also treated with Assure II (quizalofop) October 4, 2013 and Select Max (clethodim) April 28 and/or June 1, 2014 to control Italian ryegrass. The strawberry block was rototilled several times from late summer until winter to maintain weed control between the rows. Plots were treated with dormant-season herbicides January 16, 2014, prior to onset of new growth. Crop injury and weed control were estimated April 9 and May 21, 2014. Berries were picked three times (June 6, 16, and 23, 2014) and marketable berries were counted and weighed. The experimental design was a randomized complete block with three replicates. Crop injury, weed control, and harvest data are provided in Table 2.
Visual strawberry injury coming out of the winter was quite variable, with injury ratings from 0 to 20% in early May, most not differing statistically from each other. By June, there was no visual crop injury from any treatment. Weed control was excellent with all treatments by May 3. Reflex alone and Treevix + Devrinol were the only products controlling < 85% of the weeds. By June 6, there was not a significant difference in weed control among all the treatments, which ranged from 78 to 93% control. Neither berry yield not fruit size differed statistically among treatments.
All tested products continue to show promise for use in established strawberry, combining generally good weed control with low crop injury.
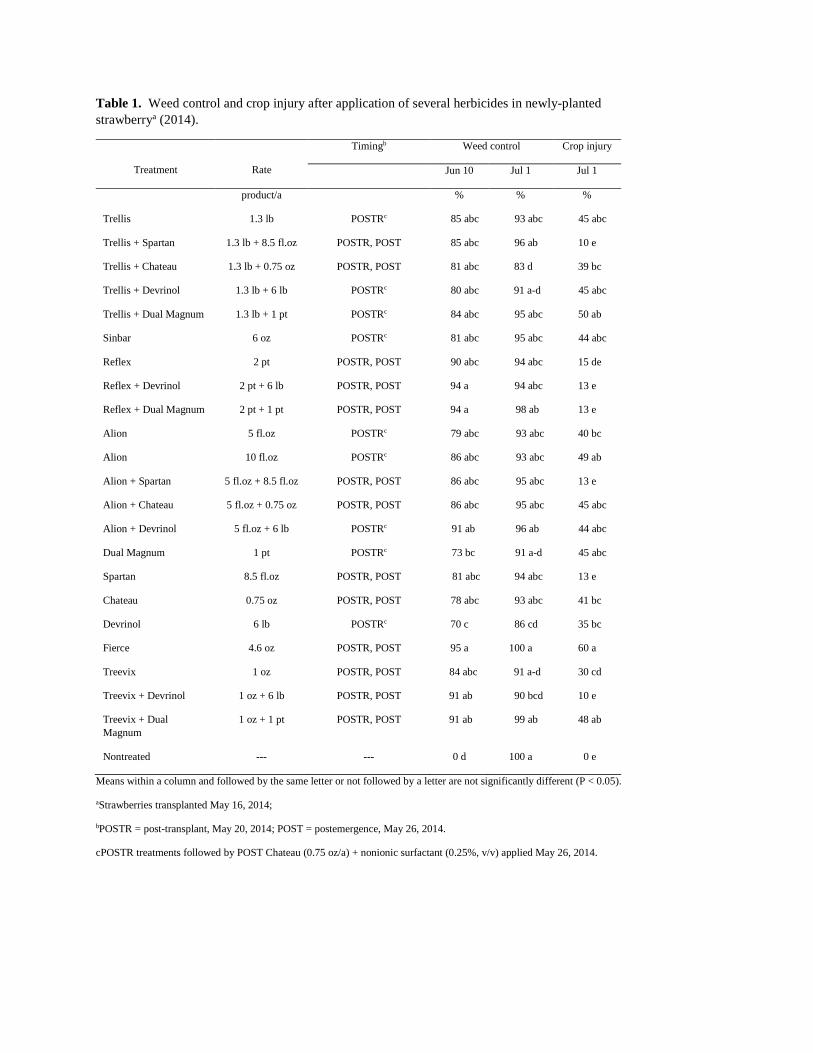
Table 1. Weed control and crop injury after application of several herbicides in newly-planted strawberrya (2014).
Treatment
Rate
Timingb Weed control Crop injury
Jun 10 Jul 1 Jul 1
product/a % % %
Trellis 1.3 lb POSTRc 85 abc 93 abc 45 abc
Trellis + Spartan 1.3 lb + 8.5 fl.oz POSTR, POST 85 abc 96 ab 10 e
Trellis + Chateau 1.3 lb + 0.75 oz POSTR, POST 81 abc 83 d 39 bc
Trellis + Devrinol 1.3 lb + 6 lb POSTRc 80 abc 91 a-d 45 abc
Trellis + Dual Magnum 1.3 lb + 1 pt POSTRc 84 abc 95 abc 50 ab
Sinbar 6 oz POSTRc 81 abc 95 abc 44 abc
Reflex 2 pt POSTR, POST 90 abc 94 abc 15 de
Reflex + Devrinol 2 pt + 6 lb POSTR, POST 94 a 94 abc 13 e
Reflex + Dual Magnum 2 pt + 1 pt POSTR, POST 94 a 98 ab 13 e
Alion 5 fl.oz POSTRc 79 abc 93 abc 40 bc
Alion 10 fl.oz POSTRc 86 abc 93 abc 49 ab
Alion + Spartan 5 fl.oz + 8.5 fl.oz POSTR, POST 86 abc 95 abc 13 e
Alion + Chateau 5 fl.oz + 0.75 oz POSTR, POST 86 abc 95 abc 45 abc
Alion + Devrinol 5 fl.oz + 6 lb POSTRc 91 ab 96 ab 44 abc
Dual Magnum 1 pt POSTRc 73 bc 91 a-d 45 abc
Spartan 8.5 fl.oz POSTR, POST 81 abc 94 abc 13 e
Chateau 0.75 oz POSTR, POST 78 abc 93 abc 41 bc
Devrinol 6 lb POSTRc 70 c 86 cd 35 bc
Fierce 4.6 oz POSTR, POST 95 a 100 a 60 a
Treevix 1 oz POSTR, POST 84 abc 91 a-d 30 cd
Treevix + Devrinol 1 oz + 6 lb POSTR, POST 91 ab 90 bcd 10 e
Treevix + Dual Magnum
1 oz + 1 pt POSTR, POST 91 ab 99 ab 48 ab
Nontreated --- --- 0 d 100 a 0 e
Means within a column and followed by the same letter or not followed by a letter are not significantly different (P < 0.05).
aStrawberries transplanted May 16, 2014;
bPOSTR = post-transplant, May 20, 2014; POST = postemergence, May 26, 2014.
cPOSTR treatments followed by POST Chateau (0.75 oz/a) + nonionic surfactant (0.25%, v/v) applied May 26, 2014.

Table 2. Crop injury, weed control, and berry yield after applications of various herbicides during dormancy of established strawberry (2014).
Treatmenta
Rate
Crop injury Weed control Total berry yieldb
Average berry
weightb May 3 May 3 Jun 6
product/a % % % g/plot g/berry
Trellis 1.3 lb 5 ab 90 ab 85 a 3064 14.3
Trellis + Spartan 1.3 lb + 6.4 fl.oz 13 ab 92 ab 88 a 2537 15.0
Trellis + Chateau 1.3 lb + 0.75 oz 12 ab 90 ab 87 a 2614 14.4
Trellis + Devrinol 1.3 lb + 6 lb 5 ab 88 ab 87 a 3116 14.1
Trellis + Sinbar 1.3 lb + 2 oz 0 b 90 ab 85 a 2169 13.6
Sinbar 6 oz 7 ab 85 ab 82 a 2102 17.0
Reflex 2 pt 5 ab 83 b 92 a 2739 15.1
Reflex + Dual Magnum 1 pt + 1.05 pt 7 ab 92 ab 92 a 3148 15.5
Alion 5 fl.oz 0 b 93 ab 90 a 3446 16.3
Alion 10 fl.oz 7 ab 93 ab 88 a 2508 12.8
Alion + Spartan 5 fl.oz + 6.4 fl.oz 13 ab 92 ab 90 a 2754 16.6
Alion + Chateau 5 fl.oz + 0.75 oz 10 ab 92 ab 87 a 2625 14.4
Alion + Devrinol 5 fl.oz + 6 lb 3 ab 92 ab 92 a 2637 14.9
Alion + Sinbar 5 fl.oz + 2 oz 3 ab 93 ab 93 a 3253 15.7
Treevix 1.44 oz 10 ab 87 ab 82 a 2484 15.6
Treevix 2.9 oz 7 ab 88 ab 87 a 2535 14.5
Treevix + Spartan 1.44 oz + 6.4 fl.oz 10 ab 93 ab 93 a 2788 14.4
Treevix + Chateau 1.44 oz + 0.75 oz 12 ab 92 ab 87 a 2581 14.0
Treevix + Devrinol 1.44 oz + 6 lb 0 b 83 b 78 a 2908 13.4
Treevix + Sinbar 1.44 oz + 2 oz 2 ab 92 ab 87 a 2693 14.6
Fierce 4.6 oz 12 ab 87 ab 80 a 2539 13.1
Fierce + Spartan 4.6 oz + 6.4 fl.oz 17 ab 90 ab 88 a 2267 13.6
Fierce + Devrinol 4.6 oz + 6 lb 8 ab 95 a 85 a 2275 13.3
Fiece + Sinbar 4.6 oz + 2 oz 20 a 88 ab 78 a 1972 14.8
Hand weeded --- 0 b 0 c 0 b 2717 15.1
Means within a column and followed by the same letter or not followed by a letter are not significantly different (P < 0.05).
aStrawberries transplanted May 10, 2013; dormant-season herbicides applied January 16, 2014.
bBerries picked three times (June 6, 16 and 23, 2014).
Fertigation practices for high yield and quality in blueberry
David Bryla USDA-ARS Horticultural Crops Research Unit
Corvallis, OR Email: [email protected]
New management practices are needed to sustain high production and reduce labor cost of
highbush blueberry in the Pacific Northwest. Blueberry production is often limited by soil nutrient availability in the region, and many growers struggle with questions on how much fertilizer is needed, the best type or form of fertilizer to apply, and the best method to apply it.
We previously found that N fertigation, or injection of N fertilizer through a single drip line, produced more growth and less salt injury than conventional fertilizers in blueberry, but fertigated plants required much more N during establishment because 1) the form of N used in blueberry is immobile in soil and 2) half or more of the fertilizer wound up between the plants and away from the roots. The common practice of using two laterals of drip per row only made matters worse because, in this case, the fertilizer was even further from the roots. The work indicated that a new method was needed to apply the fertilizer closer to the roots in the young plants.
Most recently, we conducted a study to identify fertigation and alternative fertilizer practices to increase growth and early production and reduce labor costs during establishment of highbush blueberry. We also determined if pre-plant applications of N were necessary with fertigation and whether late-season applications increased the risk of winter injury. The first year, we found that shoot growth was greatest in plants fertilized by organic acid or urea sulfuric acid and was lowest, regardless of fertilizer source, in plants fertilized using two lines of drip fixed away from the plants. Fixed drip lines limited N availability to the plant roots and resulted in lower leaf N concentrations than fertigation with either one or two drip lines located near the plants.
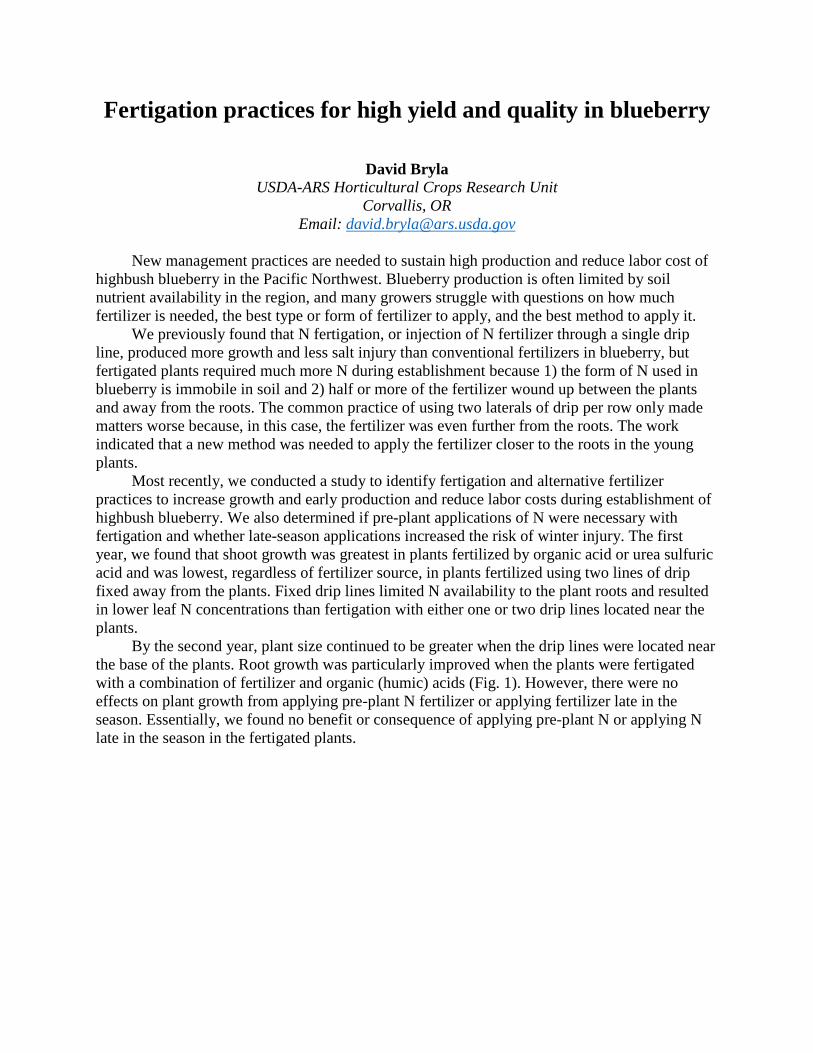
By the second year, plant size continued to be greater when the drip lines were located near the base of the plants. Root growth was particularly improved when the plants were fertigated with a combination of fertilizer and organic (humic) acids (Fig. 1). However, there were no effects on plant growth from applying pre-plant N fertilizer or applying fertilizer late in the season. Essentially, we found no benefit or consequence of applying pre-plant N or applying N late in the season in the fertigated plants.

Fig. 1. ‘Draper’ blueberries fertigated for 2 years with or without organic acids.
So far, based on the results of this and previous trials, we recommend using two lines of drip per row but locating the lines near the base of the plants during first year or two after planting, and then moving them away from the plant the following year. We also recommend fertigation over the use of granular N fertilizers (including controlled-release fertilizers) whenever possible and to use urea sulfuric acid or organic acids for fertigation in high pH soils. Fertigation with liquid ammonium sulfate, tested in a previous study, is also well suited to blueberry.
With organic acids
Without organic acids
Roots 349 g
Roots 236 g
Water requirements for drip and sprinkler irrigation of raspberry
Two studies were conducted in western Oregon to identify irrigation practices for maximizing yield and fruit quality in red raspberry. Soil at the site was a Willamette silt loam.
In the first study, ‘Meeker’ and ‘Coho’ raspberry were irrigated by sprinkler or subsurface drip with optimum, excessive, or inadequate amounts of water. Excessive and inadequate irrigations were included to determine the consequences of over- or under-irrigating the crop. After 4 years, subsurface drip irrigation produced more yield than sprinklers every year, except the baby crop year, and reduced water use by 70%. Subsurface drip also increased berry weight in ‘Coho’ but had not ‘Meeker’. ‘Coho’ was heavily infected by Phytophthora after 3 years. However, contrary to expectations, root rot was more prevalent in plants irrigated by sprinklers than in those irrigated by subsurface drip. Less surprisingly, sprinklers also increased problems with fruit rot.
In the second study, six raspberry cultivars, including four floricane-fruiting (‘Meeker’, ‘Cascade Delight’, ‘Cowachin’, and ‘Tulameen’) and two primocane-fruiting (‘Caroline’ and ‘Heritage’) types, were each irrigated with three different drip lateral configurations. The lateral configurations included: one surface lateral per row suspended from a trellis wire; one buried lateral per row located near the center of the planting bed; and two buried laterals per row located on each side of the planting bed. In each cultivar, drip configuration had little effect on fruit production. It also had no effect on root or fruit rot.
Despite the heavy soil at the site, drip irrigation resulted in more yield, larger berries, and less root and fruit rot than sprinklers. Placement of the drip lines had no effect on fruit production or plant health and, therefore, could be selected by the grower based on convenience.

Irrigation practices to reduce heat-related fruit damage in blueberries
A new study was initiated last summer to evaluate the efficacy of cooling with microsprinklers to reduce fruit temperature in blueberry plants irrigated by drip. It was conducted in a commercial field of ‘Aurora’ blueberries in Salem, OR. Low-volume overhead microsprinklers were located in every other row for cooling and chemigation. Three treatments were applied, including 1) continuous cooling (microsprinklers turned on when ambient air temperature reached > 88 oF and turned off at 7:00 PM), 2) cyclic cooling (microsprinklers turned “on” when air temperature reached > 88 oF and then turned “off” for 60 min every other hour until 7:00 PM), and 3) no cooling.
The warmest air temperature during the measurement period (July 25–30) occurred between 2:00 and 6:00 PM each day. Without cooling, berry temperatures reached a maximum of 100-105 oF on the first two days of measurements, when air temperatures reached 85–86 oF (i.e., days with no cooling), and 105–111 oF the following two days, when the maximum temperatures reached 93–94 oF. Surprisingly, berry temperatures were warmer in the lower part of the canopy than in the upper part in the late afternoon each day. Relative humidity ranged from 25% to 53% in the daytime and 46% to 100% at night.
When the microsprinklers were turned “on”, air temperatures decreased rapidly in both cooling treatments. Only 20 min of cooling was required to reduce the air temperature to 84 oF when the system was initiated at 89 oF on 28 July, while 60 min was required to reduce it to 86 oF when the system was initiated at higher temperature of 92 oF on the following day. Air temperature remained < 88 oF in the rows with continuous cooling but increased rapidly when the microsprinkler were turned “off” during cyclic cooling. After only 20-25 min in the “off” cycle, air temperature was similar between rows with cyclic cooling and no cooling.
Berry temperatures with continuous cooling were 3 to 7 oF lower than those with no cooling and ranged from 89 to 103 oF on 28 July and 77 to 79 oF on 29 July. Cyclic cooling also reduced berry temperatures when the microsprinklers were “on” but not when they were turned “off”. Interestingly, when the misters were turned “off”, berries in the rows with cyclic cooling were up to 15 oF warmer than those in the rows with no cooling during the daytime and as much as 5 oF cooler at night. At this point, it is uncertain if this was a result of differences in humidity and moisture in the rows with and without cooling or simply due to variability among the treatments. Additional measurements will be collected next season to verify the result. We will also examine the potential of cycling the microsprinklers “on” and “off” at higher frequencies (e.g., every 30 min).
Berry temperatures were also lower with continuous cooling in the adjacent row without the microspinklers than in the row with the microspinklers. This was probably because the microspinklers had an umbrella-like wetting pattern and sprayed more water in the row without the microspinklers. Berry temperatures were likewise lower with cyclic cooling in the row without microspinklers; however, in this case, the difference between rows was greatest when the microspinklers were turned “off”.
These early results indicate that continuous cooling with microspinklers effectively reduces berry temperatures on warmer days (> 90 oF). However, more time was required to cool down the berries when cooling was initiated at higher temperatures. Cycling the microspinklers “on” and “off” every 60 min also cooled the berries, but only when the microspinklers were “on”. When the microspinklers were “off”, berry temperatures were actually greater in the row

with cycling than in the row with no cooling. This suggests that wet berries heat up more in the sun than dry berries and, therefore, cycling cooling could potentially cause more damage than no cooling. More frequent cycling may reduce the problem and will be investigated next season. We will also investigate the use of microspinklers for cooling under drier climatic conditions in a commercial blueberry field located near Prosser, WA.

7-Day Budget Table: View crop water use, precipitation and soil moisture characteristics, add irrigation amounts
Cummulative Water Chart: Graphical representation of crop ET, precipitation and irrigation
Estimated Yield Reduction: Graphical representation of estimated yield loss due to water stress if stress levels were maintained
Help Screen: Each page contains a link to a help
Irrigation Scheduling Made Easy
User Guide
Crop Coefficient Chart: Graphic representation of root zone and crop coefficient (ratio of crop water use compared to a full stand of alfalfa)
Daily Crop Water Use Chart: Graphical representation of daily crop water use Full Website: A full website version is available and
completely compatible with the mobile version
Daily Crop Water Use Chart: Graphical representation of daily crop water use
For additional help, a manual is also available at weather.wsu.edu/ism/ISMManual.pdf or if you would like to submit any questions or comments, please contact: Troy Peters [email protected] 509-786-9247
weather.wsu.edu/ism/

IRRIGATION SCHEDULER FEATURES:
• Tracks simple soil water balance based on ET
• Functions with any desktop browser as well as smartphones
• Sets up field accounts easily
• Retrieves ET data from select automated weather stations
• Generates seven day crop water use (ETc) forecasts
• Calculates hours of irrigation run time instead of inches of applied water
• Notifies users via mail or text
Available Weather Stations
Using the Irrigation Scheduler Mobile App User Guide
Login screen: Register for a new account, request username reminder or reset password.
Add New Field page: Name field, select station and define field variables
Advanced Field Variables: Add more detailed irrigation data for a specific field.
7-Day Budget Table: View crop water use, precipitation and soil moisture characteristics, add irrigation amounts.
Irrigation Scheduling Made Easy Smart water management begins with two questions. When do I turn the water on and for how long? The answer lies with the Irrigation Scheduler Mobile App, because the payoff can be big. Using Irrigation Scheduler growers can increase yields, improve crop quality, decrease fertilizer use, save pumping costs, conserve water, and reduce non-point source pollution. Irrigation Scheduler, originally developed by Washington State University1, is a unique smartphone2-enabled irrigation scheduling tool available for growers across the West. It’s ideal for running simplified check-book style irrigation scheduling. Best of all, Irrigation Scheduler is fully integrated with a wide variety of agricultural weather networks so that daily crop water use (ET) estimates and rainfall data are automatically filled in.
Start Using
• Register for a free username and password at weather.wsu.edu
• Name your field, select a weather station and define field variables
Try it today at weather.wsu.edu/ism/
Follow this step-by-step User Guide and learn how to generate custom data sets for your own growing operation. 12013 partners: Bureau of Reclamation, Anheuser-Busch and Bonneville Power Administration.
2Currently available for Android phones. IPhone, MS Windows Phone & Blackberry planned for Fall 2014.

Understanding the Relationship between Pollination Services and Yield in
Blueberry
Lisa W. DeVetter
Washington State University, NWREC
Pollination is the transfer of pollen to the plant stigma, which is a necessary prerequisite for seed and berry development in many species of flowering plants. Many species of insects perform pollination, but single-species pollination by the European honeybee (Apis mellifera), or “honeybee”, is the most common in agriculture. Concerns about pollination services have been increasing, particularly with reported declines in honeybee health due to Colony Collapse Disorder and other underlying factors threatening honeybee health. This concern extends to blueberries, which have been reported to have poor pollination and fruit set in Washington. The objectives of this presentation were to provide an update on current research addressing honeybee activity in Washington blueberry and to provide recommendations on ways to promote pollination.
Pollination Research
Pollination may be limited by several factors. Weather can be a significant challenge in western Washington because springs are often cool and wet, which are unfavorable conditions for honeybee activity. Floral morphology can also limit pollination, with cultivars having narrow flower openings and longer flower length being more challenging for pollinators to physically access pollen. Bumblebees (Bombus spp.) can overcome this challenge through sonication, which entails vibrational motion that causes pollen to be shed and more easily accessed by bumblebees. Honeybees do not have this ability and are therefore less effective pollinators relative to bumblebees. Landscape features and field management can also impact the populations of pollinators, both wild and domestic (see “Promoting Pollination” for more details).
Knowledge of honeybee health, pollination services, and pollination limitations in Washington blueberry is currently lacking. A pollination study was initiated in 2014 and the objectives of this project were to: 1) Survey and evaluate honeybee activity and its role in yield within Washington highbush blueberry; and 2) Determine the primary limitations of pollination. Long term, the goal of this project is to assist in the development of guidelines and provide
information on management practices to promote pollination for the specific conditions found in Washington blueberry production.
Information on year one of a two-year project was presented at the Washington Small Fruit Conference (data presented from Canada are not included in this proceedings report). Data were collected from 16 sites in Washington [10 sites in western Washington (Skagit and Whatcom counties) and 6 sites in eastern Washington (Benton County)]. Four of the eastern sites were certified organic. Honeybee visitation data were collected from established ‘Duke’ plants at 30-100% bloom, with 30 plants measured per site. Data collected include: honeybee visitations, honeybee colony strength/health, pollinator diversity, estimated yield, berry size, and seed number. Visitation was assessed at least three separate days per site and were only collected on days >55 oF from 10 AM to 4 PM, which is standard protocol for pollination measurements.
Honeybee visitation rates were significantly greater at organic sites relative to conventional sites across all locations (Figure 1). Visitation was also slightly greater for conventional sites in eastern Washington relative to western Washington. However, conventional fields at both locations were below the recommendation of having 4 to 8 bees/bush/minute (shaded green in Figure 1). Hive numbers across all sites ranged from 1.5 to 6 hives/acre and increasing hive density was not related to increasing visitation rates nor yield. Estimated yield was also not strongly related to honeybee visitation, although there was a slight relationship between increasing visitation and larger berry size. The health of honeybee hives was evaluated by counting the number of bees entering a hive per minute, repeated throughout the course of the bloom period. A healthy hive should have 100 or more bees entering the hive per minute. None of the hives met this recommendation (Figure 2), despite measurements being taken during the time of the day when bees are most active. Pollinator diversity and seed number data are still being analyzed. We hope to repeat this study in 2015 and include more organic sites in western Washington in order to clarify the relationship between increasing honeybee visitations and organic management.

Figure 1. Average number of honeybee visitations per minute in eastern and western Washington blueberry (2014).
Figure 2. Honeybee hive strength in eastern and western Washington blueberry, assessed as the average number of honeybees entering a hive in one minute (2014).
Promoting Pollination
Several tactics can be utilized to increase pollination services in blueberry fields. First, it is advised to discuss changes in management with beekeepers so that an agreement is reached before any action is pursued. One approach is to reduce the number of pesticides, including herbicides. Herbicides can decrease floral diversity and lead to declines in pollinator services. Recent research is beginning to clarify the role of pesticides on honeybee health. The additive and synergistic effects of fungicides, adjuvants, and other products has been shown to decrease honeybee brood health. Decreases in brood health leads to smaller broods, less foraging, and decreases in pollination by honeybees. Insecticides are particularly dangerous and should be avoided during bloom. How to Reduce Bee Poisonings from Pesticides (PNW 591) by Hooven et al. (2013) is a publication that outlines strategies to reduce honeybee poisoning from pesticides. Some recommendations include: 1) Applying pesticides in the evening, when honeybees are less active and the applied product has more time to dry; 2) Select less toxic pesticides with shorter residuals; 3) Maintain buffers between hives, water sources, and wild flowers when spraying; and 4) Avoid tank mixing insecticides and fungicides due to the potential additive effects. Research in this area is active and more information is continuing to be learned by researchers.
Other was to enhance pollination include planting hedgerows or native flower strips along the border of fields. Research in Michigan has shown this strategy can lead to increases in blueberry yield and profits because hedgerows/flower strips appear to supplement domestic honeybees with wild pollinators. Lastly are honeybee attractants, which are designed to mimic bee pheromones and enhances pollination. Research done by the DeVetter Small Fruit Horticulture program has tested some of these products and found slight increases in honeybee visitation, but no increases in yield when attractants were applied at low or high rates.
Factors causing declines in honeybee health and ways to promote pollinator services is a very active area of research. Please contact Lisa DeVetter ([email protected]) if you have any questions or would like to access some of the information mentioned in this report.
*Acknowledgements: Ramesh Sagili (OSU), Elizabeth Elle, Tim Lawrence (WSU), Karina Sakalauskas (BC Blueberry), Sean Watkinson, Carrie Scott, Ben Guadagnoli, China Moss, Rachel Rudolph, Doug Walsh, Tora rooks, Yajun Li, and Marina.
Special thanks to grower cooperators and Leighton Overson for project assistance.
This project was funded by the Washington Blueberry Commission.
SWD and the Threat of Re-Emerging Pests
L. Tanigoshi, B. Gerdeman and H. Spitler
Washington State University
Northwest Washington Research & Extension Center
Mount Vernon, WA
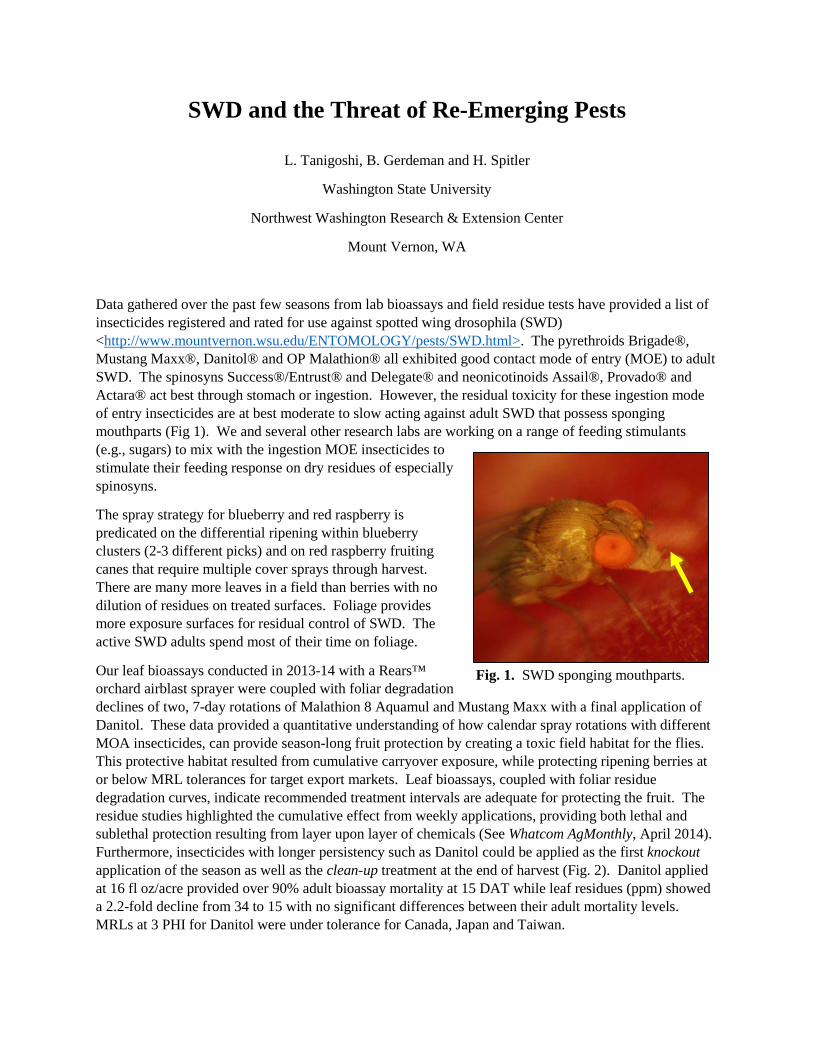
Data gathered over the past few seasons from lab bioassays and field residue tests have provided a list of insecticides registered and rated for use against spotted wing drosophila (SWD) <http://www.mountvernon.wsu.edu/ENTOMOLOGY/pests/SWD.html>. The pyrethroids Brigade®, Mustang Maxx®, Danitol® and OP Malathion® all exhibited good contact mode of entry (MOE) to adult SWD. The spinosyns Success®/Entrust® and Delegate® and neonicotinoids Assail®, Provado® and Actara® act best through stomach or ingestion. However, the residual toxicity for these ingestion mode of entry insecticides are at best moderate to slow acting against adult SWD that possess sponging mouthparts (Fig 1). We and several other research labs are working on a range of feeding stimulants (e.g., sugars) to mix with the ingestion MOE insecticides to stimulate their feeding response on dry residues of especially spinosyns.
The spray strategy for blueberry and red raspberry is predicated on the differential ripening within blueberry clusters (2-3 different picks) and on red raspberry fruiting canes that require multiple cover sprays through harvest. There are many more leaves in a field than berries with no dilution of residues on treated surfaces. Foliage provides more exposure surfaces for residual control of SWD. The active SWD adults spend most of their time on foliage.
Our leaf bioassays conducted in 2013-14 with a Rears™ orchard airblast sprayer were coupled with foliar degradation declines of two, 7-day rotations of Malathion 8 Aquamul and Mustang Maxx with a final application of Danitol. These data provided a quantitative understanding of how calendar spray rotations with different MOA insecticides, can provide season-long fruit protection by creating a toxic field habitat for the flies. This protective habitat resulted from cumulative carryover exposure, while protecting ripening berries at or below MRL tolerances for target export markets. Leaf bioassays, coupled with foliar residue degradation curves, indicate recommended treatment intervals are adequate for protecting the fruit. The residue studies highlighted the cumulative effect from weekly applications, providing both lethal and sublethal protection resulting from layer upon layer of chemicals (See Whatcom AgMonthly, April 2014). Furthermore, insecticides with longer persistency such as Danitol could be applied as the first knockout application of the season as well as the clean-up treatment at the end of harvest (Fig. 2). Danitol applied at 16 fl oz/acre provided over 90% adult bioassay mortality at 15 DAT while leaf residues (ppm) showed a 2.2-fold decline from 34 to 15 with no significant differences between their adult mortality levels. MRLs at 3 PHI for Danitol were under tolerance for Canada, Japan and Taiwan.
Fig. 1. SWD sponging mouthparts.

Field decline, MRLs and efficacy of spinosyns in controlling SWD in blueberry
We conducted 3 field trials in 2014 to measure the efficacy, foliar leaf degradation and MRL tolerances for Success and Delegate. Both Success and Delegate are in the same IRAC mode of action class but Delegate (spinetoram) is a second-generation spinosad derivative. It is faster acting, more potent molecule with longer residual activity than spinosad. This study allowed us the opportunity to measure three major parameters needed to confirm our earlier field characterization of the novel MOA insecticides known for their efficacy to control many chewing insects through ingestion.
Berry and leaf samples were collected at -1, 0, 1, 3, 5 and 7 days following an airblast application for each of the 3 field trials. In early August 4 oz/A of Delegate was applied to ripening ‘Elliott’ highbush blueberries. In late August 6 fl oz/A of Success was applied to ripening ‘Aurora’ blueberries. In September 6 oz/A of Delegate was applied to a second ‘Aurora’ blueberry field.
Average SWD percent mortality when exposed to Success leaf residues at 0 DAT was greater than that of Delegate in the September ‘Aurora’ trial (52% and 48% respectively) (Figs. 3-4).
0.37 0.45 1.11 0.65 0.59 0.65 0.68
0
5
10
15
20
25
30
35
40
50556065707580859095
100
0 1 2 4 8 12 15
Res
idue
(ppm
)
Perc
ent
Mor
talit
y% MortalityLeaf residue (ppm)Fruit residue (ppm)
Days After Treatment
Fig. 2. Danitol residue decline in blueberry leaves, fruit and SWD mortality.

00.209 0.165 0.119 0.085
0.064
0
0.5
1
1.5
2
2.5
3
3.5
4
4.5
0
10
20
30
40
50
60
70
-1 0 1 3 5 7
Res
idue
(ppm
)
Prec
ent
Mor
talit
y
Days After Treatment
Percent Mortalityppm Leavesppm Fruit
0.0000.172 0.166 0.125 0.127 0.102
0.000
0.500
1.000
1.500
2.000
2.500
3.000
0
10
20
30
40
50
60
-1 0 1 3 5 6
Res
idue
(pp
m)
Perc
ent m
orta
lity
Days After Treatment
Percent Mortalityppm Leavesppm Fruit
Fig. 3. Success residue decline in blueberry leaves, fruit and SWD mortality.
Fig. 4. Delegate residue decline in blueberry leaves, fruit and SWD mortality.

Success experienced a precipitous drop at 3 DAT unlike Delegate which exhibited a more gradual decline, dropping to approximately 30% - 35% mortality through 6 DAT. Thirty percent mortality could result in potential economic loss from SWD ovipositing in unprotected fruit. Percent mortality in the August Delegate trial was almost twice that observed in the September Delegate trial (98% and 48% respectively) (Fig. 5), much greater than expected from the 2oz/A difference in rate.
This improvement was caused by carryover from a tank mix of Mustang Maxx and Malathion applied 8 days earlier. Carryover resulting from layering of insecticides accumulating as the season progresses provides a method for including less SWD efficacious products such as the spinosyns, into a rotational program by boosting their insecticidal activity. Incorporating more insecticides representing different mode of action classes, protects against resistance development in the SWD population.
Average spinosyn residues on berries were low immediately following applications of both Delegate and Success and had fallen to nearly zero seven days after treatment (Figs. 3-5). MRLs at 3 PHI for Delegate were under tolerance for EU, UK, Canada, Japan, Korea and Taiwan and similarly for Success, except for Taiwan with NT.
Combining miticides and SWD controls into a season long effective program for red raspberry
Serious economic levels of spider mites in red raspberry have occurred when exposed to carbamates, organophosphates and pyrethroids by stimulating reproduction through hormonal-like action. These compounds are also toxic to beneficial insects and especially to predatory phytoseiid mites, which assist in biological control of spider mite populations. SWD is primarily managed in red raspberry using pyrethroids and organophosphates, increasing the likelihood for potential mite outbreaks. Extended dry periods experienced in 2014 in northwest Washington promoted mite outbreaks that resulted in several
0.00 0.13 0.10 0.06 0.05 0.04
0.00
0.50
1.00
1.50
2.00
2.50
3.00
3.50
0102030405060708090
100
-1 0 1 3 5 7
Res
idue
(pp
m)
Perc
ent
Mor
talit
y
Days After Treatment
Percent Mortalityppm Leavesppm Fruit
Fig. 5. Delegate residue decline in blueberry leaves, fruit and SWD mortality.

reports of economic injury. Growers need to have a spider mite program in place that minimizes the potential for flare-ups through an early season tank mix application. It should also provide an effective rescue treatment when necessary, which is compatible with their SWD control program.
The major premise for effective spider mite management is early detection of emerging, overwintered females in April-May for red raspberry before the onset of SWD applications in July. Acramite® tank mixed with the IGR Savey® is an excellent preventative combination to impact early emerging females and their eggs. If required during red raspberry harvest, Kanemite® or Vendex® are excellent contact acaricides compatible with weekly SWD spray programs (See Whatcom Ag Monthly, Oct 2014).
Evaluation of several weevilcides for the control of rough strawberry root weevil in strawberry
Rough strawberry root weevil (RSRW) is one of four to five species of root weevils that remain perennial pests for strawberry growers in the Pacific Northwest. However, RSRW has emerged as the dominant root weevil pest in Washington and Oregon strawberries over the past decade. Growers commonly overlook RSRW’s presence in PNW summer varieties because it normally does not cause characteristic notching of leaves used to detect a weevil infestation (Fig. 6). Adult RSRW were easily collected in the soil/crown in a heavily infested 2 year-old ‘Totem’ field, in June 2014 (Fig. 7). Five ‘Totem’ leaves per treatment were individually dipped in field rates of registered insecticides equivalent to 100 gpa. These leaves were individually placed on cotton absorbent pads in 100 x 15 mm Petri dishes. Five adult RSRW were placed on drying foliage/arena and replicated 5 times. Arenas were held under lab conditions and observed at 24 and 48 hours after treatment (HAT) for adult mortality. Moribund adults were also scored as dead.
After 24 HAT, all adults were dead on the foliar residues of Brigade (Table 1). Other than Athena®, the remaining treatments were significantly different from the UTC. Mortality was 100% for both formulations of thiamethoxam (i.e., Platinum®, Actara) and unregistered Exirel® (cyantraniliprole, IRAC 28). The excellent contact activity for both neonicotinoids and 75% mortality for Admire Pro® after 48 HAT were unexpected, given past trends for slower and often incomplete population knockdown in the field. The dual modes of action Athena (bifenthrin + avermectin) was disappointing given its near equivalent concentration of bifenthrin compared with Brigade. We will reevaluate its activity next season with and without a non-ionic or organosilicone surfactant (See Whatcom Ag Monthly, July 2014).

Table 1. Efficacy of foliar residues to RSRW adults on strawberry, 2014
Treatment Rate/acre 24 HAT 48 HAT
Platinum 75SG 4.01 oz 96.5±3.5a 100.0±0.0a
Actara 25WG 4 oz 90.0±5.8a 100.0±0.0a
Admire Pro 14 fl oz 60.0±0.0b 75.0±9.6b
Brigade WSB 32 oz 100.0±0.0a
Athena 17 fl oz 10.0±5.8c 15.0±5.0c
Exirel 10SE* 20.5 fl oz 95.0±5.0a 100.0±0.0a
Untreated check 0.0±0.0c 15.0±15.0c
Means within columns followed by the same letter are not significantly different (Fisher's Protected LSD, P<0.05), PRC ANOVA SAS. *Unregistered
Fig. 7. RSRW adults in soil. Fig. 6. Severe damage no notched leaves.

Fresh Market Strawberries: Varieties, Management Practices, and Organic Considerations
December 5, 2014
Wendy Hoashi-Erhardt
Small Fruit Plant Breeding
Washington State University - Puyallup Research and Extension
Local Fresh Strawberries are in high demand.
Increased demand for fresh market strawberries is being driven by the strong local foods
Loyalty among consumers. There is a strong connection in many people’s minds between local produce and excellent flavor. A second reason is that the idea of a strawberry “season” is slowly being eroded. A recent article in the New York Times, “Americans are eating a lot more berries, and here’s why” (December 1, 2014) details how berries are making up a larger portion of fruits Americans eat, and that it is because producers have gradually figured out how to expand the season of many berry crops. They have done this through the use of new varieties, pruning techniques, and protective structures. For strawberries in the Pacific Northwest, day-neutral varieties are making the strawberry season longer and longer, fortifying the idea that the Northwest is a great place to eat local strawberries through the traditional June season and beyond.
The introduction of some really good day-neutral varieties is a major reason fresh strawberries are growing in importance in the region. The plant sales numbers bear this out: day-neutral strawberries have been growing in sales over the last 8 years, while June-bearer sales have declined over the same time period. Since day-neutrals are almost all geared toward the fresh market, what we’re seeing is a steady shift away from processing and toward fresh production.
Fresh Market Varieties
Albion leads the list. Its outstanding fruit quality makes it a very reliable variety for fresh market. It is large, relatively disease resistant, and has a sweet pleasant flavor that may not be as intense as our traditional PNW varieties, but which most people will eat happily. It has adequate firmness to confer a good shelf life, but not so firm as to interfere with eating quality.

Seascape is also important as the second most frequently planted day-neutral cultivar. It is a 1991 release out of the University of California. Seascape often out-yields Albion and is quite an attractive berry with a good red color. It is generally smaller than Albion and a bit more inconsistent in flavor.
San Andreas is a 2008 day-neutral release out of University of California. It, too, often out-yields Albion and is larger than Albion. But it is also lighter in color and Albion is often better in flavor.
Puget Reliance and Rainier are June-bearing varieties from WSU that is commonly planted for fresh production. They are favored for their upright habit, ease of picking, attractive gloss, high yields, good flavor, and deep red color.
Sweet Sunrise and Sweet Bliss may work well for fresh production. They are new releases from the USDA-OSU breeding program in Corvallis. Sweet Sunrise is an early season cultivar while Sweet Bliss is mid-season. Both boast high yields of large, attractive, and good-flavored berries.
Puget Crimson and ORUS 2678-1 may be good late season June-bearing varieties to try for fresh market, especially to fill in the production gap that day-neutrals experience around early July. Both have high yields, large and attractive fruit, and excellent fresh flavor.
There are other cultivars that may be suited for fresh market production not listed here. Please
see the recently updated Strawberry Cultivar guide available from OSU extension.
Production Practices
Production practices for strawberries destined for the fresh market differ enough from those of processing that it’s worthwhile to think of them as different crops.
Strawberries destined for the fresh market are usually planted on raised beds covered with plastic. Beds need to be 8-12” high on 42-52” centers. A bed shaper is needed to get uniform beds that allow proper distribution of irrigation water and a tight fit of the plastic over the bed. Plants are set out in staggered double rows, with 8 or 10” between the two rows and 12” between plants within the rows.
The plant type and planting time will be different compared to matted row strawberry production. The best results in the Pacific Northwest will be realized by the use of plug plants planted between about August 25 and September 15. Dormant bare root plants may also be grown successfully when planting in

the spring, as early as is practical. Waiting until spring to form beds, however, may set back planting date significantly because of wet soils.
Please see further resources in the references section for other production practices pertaining to fresh market strawberries.
Post-Harvest Handling
Another major adjustment in a transition between growing for processing and growing for fresh is post-harvest handling. Packaging, relationship with your customers, being up front with delivery schedules are all crucial, but consistent high quality is paramount. It starts in the field and must keep up all the way through to delivery. Growers must work carefully with pickers to make sure that only the best berries end up in the flat. The next step is to remove the field heat from the berries as soon as possible by pre-cooling the berries to 34˚F using forced air. Maintaining that optimal temperature while limiting water loss in storage and transport will help the berries have adequate shelf life and fresh quality.
A lot of resources are available for fresh market strawberries. Peerbolt Crop Management has compiled an excellent working list, part of which appears below.
Further Resources
Antonelli, A., L. Tanigoshi, T. Miller, C. Daniels, and S. Martin. 2007. Pest management for commercial small fruits. Washington State University, College of Agricultural, Human, and Natural Resource Sciences.
Averre, C.W., W.O. Cline, R.K. Jones, and R.D. Milholland. 1992. Diagnosis of Strawberry Diseases. North Carolina Cooperative Extension Service.
Bell, N. and J. DeFrancesco. Strawberry-Spotted wing drosophila. In: Hollingsworth, C.S., editor. Pacific Northwest Insect Management Handbook [online]. Corvallis, OR: Oregon State University. http://pnwhandbooks.org/insect/small-fruit/strawberry/strawberry-spotted-wing-drosophila (accessed 26 Nov 2013).
Black, B.L., R. Hill, and G. Cardon. 2008. Strawberry Irrigation. Utah State University Cooperative Extension. http://extension.usu.edu/files/publications/publication/Horticulture_Fruit_2008_05pr.pdf (verified 26 Nov 2013).
Boyette, M.D., L.G. Wilson, and E.A. Estes. 1989. Postharvest Cooling and Handling of Strawberries. N.C. Agricultural Extension Service.

Finn, C.E., B.C. Strik, and P. Moore. 2014. Strawberry Cultivars for Western Oregon and Washington, EC 1618. Oregon State University Extension Service, Corvallis.
Galinato, S., and T. Walters. 2012. 2011 Cost Estimates of Producing Strawberries in High Tunnel in Washington. Washington State University Extension, Pullman.
Gerdeman, B., L. Tanigoshi, and G.H. Spitler. 2011. Spotted Wing Drosophila (SWD) Monitoring, Identifying, and Fruit Sampling. FS049E. Washington State University Extension, Pullman, WA. http://mtvernon.wsu.edu/ENTOMOLOGY/pests/FS049E.pdf (Accessed 26 Nov 2013).
Hart, J., T. Righetti, A. Sheets, and L.W. Martin. 2000. Strawberries (Western Oregon - west of Cascades). Oregon State University, Corvallis. http://ir.library.oregonstate.edu/xmlui/bitstream/handle/1957/20625/fg14-e.pdf (Accessed 26 Nov 2013).
Hess, M., B. Strik, J. Smesrud, and J. Selker. 1997. Western Oregon Strawberry Irrigation Guide. Oregon State University. http://bioe.oregonstate.edu/Documents/IrrigationGuides/STRAWBER.pdf (Accessed 26 Nov 2013).
Hoashi-Erhardt, W.K., Walters, T. 2014. Growing day-neutral strawberries in western Washington. FS032E. Washington State University Extension, Pullman, WA. http://cru.cahe.wsu.edu/CEPublications/FS132E/FS132E.pdf (Accessed 8 April 2014).
Inglis, D., B. Gunderson, C. Miles, J. Roozen, R. Wallace, A. Wszelaki, and T.W. Walters. 2011. Evaluation of gray mold and Verticillium wilt on strawberry cultivars grown in high tunnel vs. open field plots, 2010. Plant Disease Management Reports 5:SMF047. http://www.plantmanagementnetwork.org/pub/trial/PDMR/reports/2011/SMF047.pdf (verified 26 Nov 2013).
Mahovic, M., J.K. Brecht, S.A. Sargent, M.A. Ritenour, K.R. Schneider, A. Simonne, and J. Bartz. Good Agricultural Practices for the Production and handling of strawberry, raspberry, blackberry, and blueberry. North Carolina Cooperative Extension Service.Available at http://www.ces.ncsu.edu/depts/foodsci/ext/programs/ producesafety/berries.pdf (verified 26 Nov 2013).
Muramoto, J., and M. Gaskell. 2012. Nitrogen management for organic strawberries. p. 43–53. In Koike, S., Bull, C.T., Bolda, M., Daugovish, O. (eds.), Organic Strawberry Production Manual. Publication 3531. University of California, Agriculture and Natural Resources, Richmond.
Strawberry (Fragaria spp.)-Gray Mold {Fruit Rot}. In: Pscheidt, J.W., and Ocamb, C.M., senior editors. 2013. Pacific Northwest Plant Disease Management Handbook [online]. Corvallis, OR: Oregon State University. http://pnwhandbooks.org/plantdisease/strawberry-fragaria-spp-gray-mold-fruit-rot (accessed 26 Nov 2013).
Wahl, C., L. Liegel, and Seavert, C.F. 2014. Strawberry Economics: Comparing The Costs And Returns Of Establishing And Producing Fresh And Processed Market June Bearing Strawberries In A Perennial Matted Row System To Day – Neutrals In A Perennial Hill, Plasticulture System, In The Willamette Valley. Oregon State University Extension Service, Corvallis.

References
Barre, Josh. 2014. “Americans are eating a lot more berries. Here’s why.” New York Times. http://www.nytimes.com/2014/12/02/upshot/americans-are-eating-a-lot-more-berries-heres-why.html. Accessed 1 Dec 2014.