2014 state of the nonprofit sector survey arts & culture · pdf...
TRANSCRIPT
0 nonprofitfinancefund.org ©2014 Nonprofit Finance Fund 2014 Arts Feature generously sponsored by:
2014 State of the Nonprofit Sector Survey Arts & Culture
http://nff.org/survey
Filter the results yourself at http://survey.nff.org
Based on a nationwide survey of nonprofit cultural leaders conducted by Nonprofit Finance Fund, January-February 2014.

1 nonprofitfinancefund.org ©2014 Nonprofit Finance Fund 2014 Arts Feature generously sponsored by:
Table of Contents
About Nonprofit Finance Fund & the Survey
Program Trends: Demand, Engagement, & Competition
Financial Health & Management Actions Taken
Grantmaking Trends: Dynamics of Private & Public Funding
Measuring Impact
Conclusion: Looking Ahead & Tips for Cultural Nonprofits

2 nonprofitfinancefund.org ©2014 Nonprofit Finance Fund 2014 Arts Feature generously sponsored by:
About Nonprofit Finance Fund (NFF): Tailored Investments, Strategic Advice, Accessible Insights
Since 1980, we’ve helped funders, nonprofits, and other mission-driven organizations connect money to mission. Our services help great organizations stay in balance, so that they’re able to adapt to changing financial circumstances and grow and innovate when they’re ready. As a leading community development financial institution, NFF has provided over $287 million in loans and access to additional financing via grants, tax credits, and capital to support over $1.4 billion in projects for thousands of organizations.
Since our founding, NFF has been helping arts and cultural organizations solve their financial challenges and plan for a more vibrant, healthy future. We have worked with more than 1,300 arts organizations across the country, from small neighborhood-based community centers to large performing arts organizations and museums.

3 nonprofitfinancefund.org ©2014 Nonprofit Finance Fund 2014 Arts Feature generously sponsored by:
NFF’s Annual Survey: Linking Practice, Data, and Action
Support systemic change
Provide practical advice and facilitate dialogue among funders, NPOs, advocates, gov’t
Deeper analysis of subsets of survey data
Share what we learn with the field
High-level analysis of results
Test hypotheses through data collection
Develop hypotheses of NPO experiences through on-the-ground work Phase 1: Building on NFF’s
Advisory & Lending practice, we develop survey content, collect unbiased data, and share what we learn with the field.
Phase 2: Our data analysis informs our Advisory & Lending practice, in a feedback loop of learning.
Phase 3: We work with experts, advocates, funders and others to put the data in service of systems-level change.
4 nonprofitfinancefund.org ©2014 Nonprofit Finance Fund 2014 Arts Feature generously sponsored by:
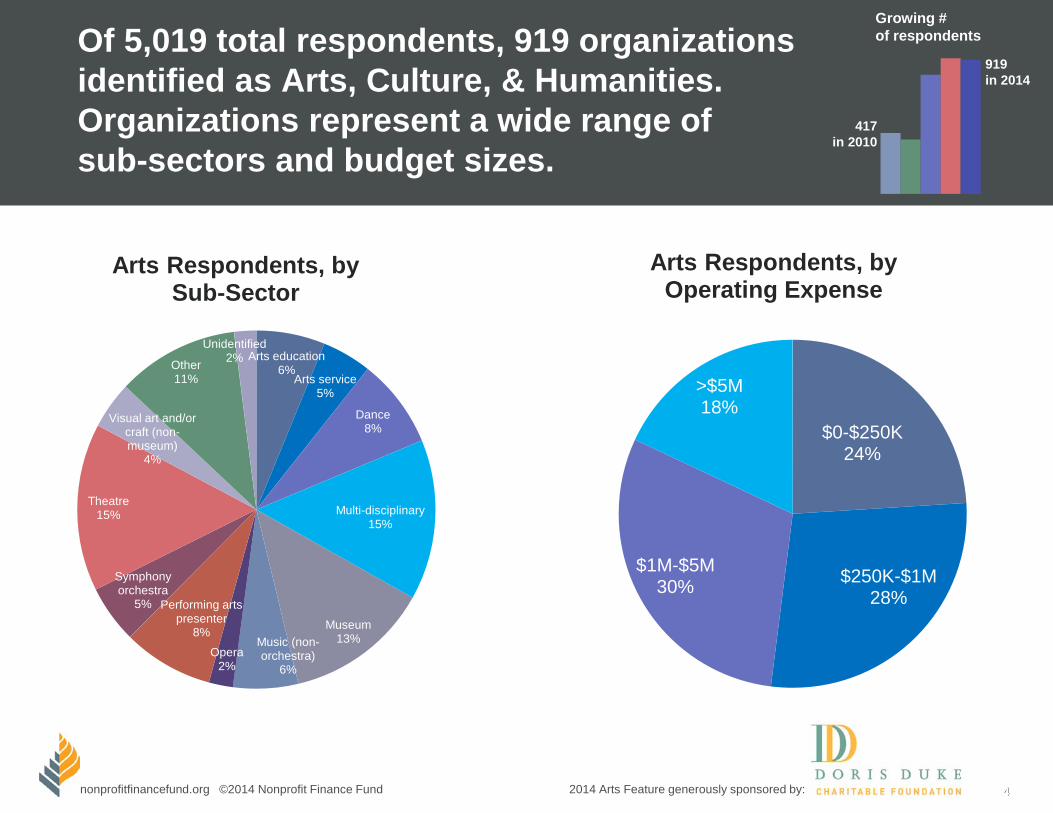
Of 5,019 total respondents, 919 organizations identified as Arts, Culture, & Humanities. Organizations represent a wide range of sub-sectors and budget sizes.
4
$0-$250K 24%
$250K-$1M 28%
$1M-$5M 30%
>$5M 18%
0%
0%
0%
0%
0%
0%
0%
0%
0%
0%
0%
0%
Arts Respondents, by Operating Expense
Growing # of respondents
919 in 2014
417 in 2010
Arts education 6%
Arts service 5%
Dance 8%
Multi-disciplinary 15%
Museum 13% Music (non-
orchestra) 6%
Opera 2%
Performing arts presenter
8%
Symphony orchestra
5%
Theatre 15%
Visual art and/or craft (non-museum)
4%
Other 11%
Unidentified 2%
Arts Respondents, by Sub-Sector

5 nonprofitfinancefund.org ©2014 Nonprofit Finance Fund 2014 Arts Feature generously sponsored by:
Table of Contents
About Nonprofit Finance Fund & the Survey
Program Trends: Demand, Engagement, & Competition
Financial Health & Management Actions Taken
Grantmaking Trends: Dynamics of Private & Public Funding
Measuring Impact
Conclusion: Looking Ahead & Tips for Cultural Nonprofits
6 nonprofitfinancefund.org ©2014 Nonprofit Finance Fund 2014 Arts Feature generously sponsored by:
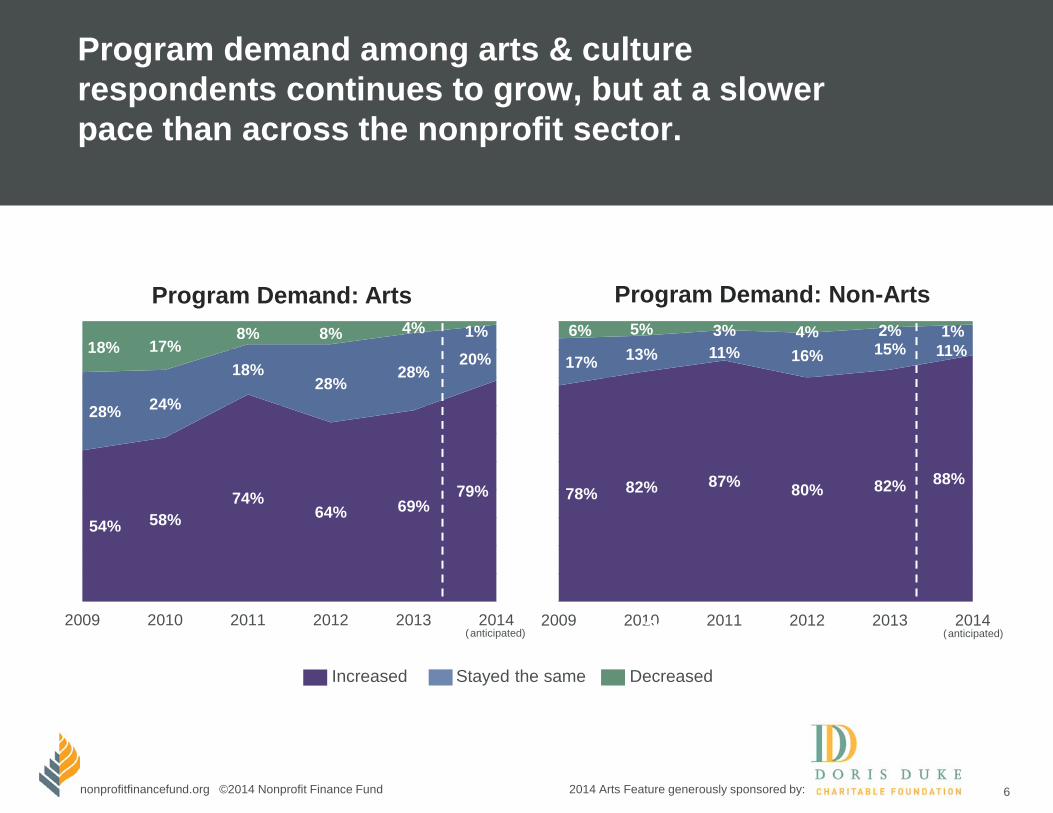
78% 82% 87% 80% 82% 88%
17% 13% 11% 16% 15% 11% 6% 5% 3% 4% 2% 1%
2009 2010 2011 2012 2013 2014
Program demand among arts & culture respondents continues to grow, but at a slower pace than across the nonprofit sector.
2012
54% 58% 74%
64% 69% 79%
28% 24%
18% 28%
28% 20%
18% 17% 8% 8% 4% 1%
2009 2010 2011 2012 2013 2014
Program Demand: Arts Program Demand: Non-Arts
Increased Stayed the same Decreased
(anticipated) (anticipated)

7 nonprofitfinancefund.org ©2014 Nonprofit Finance Fund 2014 Arts Feature generously sponsored by:
A majority of cultural organizations are keeping up with rising demand for their programs.
7
Yes 67%
No 33%
Were you able to meet demand?
Yes 38% No
62%
Organizations Met Demand (excluding arts)?
8 nonprofitfinancefund.org ©2014 Nonprofit Finance Fund 2014 Arts Feature generously sponsored by:
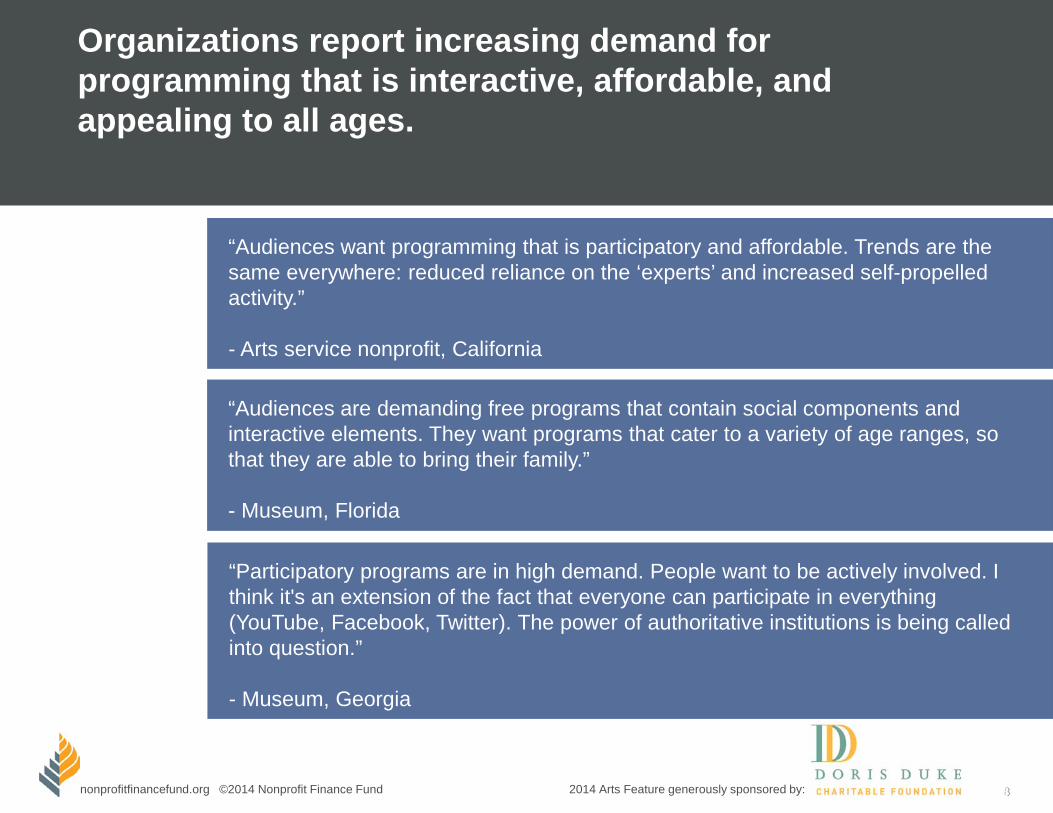
Organizations report increasing demand for programming that is interactive, affordable, and appealing to all ages.
8
“Audiences are demanding free programs that contain social components and interactive elements. They want programs that cater to a variety of age ranges, so that they are able to bring their family.” - Museum, Florida
“Audiences want programming that is participatory and affordable. Trends are the same everywhere: reduced reliance on the ‘experts’ and increased self-propelled activity.” - Arts service nonprofit, California
“Participatory programs are in high demand. People want to be actively involved. I think it's an extension of the fact that everyone can participate in everything (YouTube, Facebook, Twitter). The power of authoritative institutions is being called into question.” - Museum, Georgia

9 nonprofitfinancefund.org ©2014 Nonprofit Finance Fund 2014 Arts Feature generously sponsored by:
Arts & culture organizations are pursuing a range of strategies (e.g., program adaptation, data collection, targeted marketing) to build and engage their audience/visitor base.
How are arts organizations developing and engaging audiences/visitors?
71%
59%
56%
53%
53%
46%
29%
26%
4%
0% 10% 20% 30% 40% 50% 60% 70% 80%
Developing programs that are relevant for targetaudiences or visitor segments
Collecting data on audience/visitor preferences andbehaviors
Implementing new marketing strategy(ies)
Engaging audiences/visitors through technology
Offering participatory programming
Offering cultural experiences in unconventional spaces
Implementing new pricing model(s)
Involving audiences/visitors in program planning
We did not make a meaningful investment indevelopment or engagement strategies

10 nonprofitfinancefund.org ©2014 Nonprofit Finance Fund 2014 Arts Feature generously sponsored by:
65%
47%
44%
33%
33%
25%
14%
8%
5%
5%
0% 10% 20% 30% 40% 50% 60% 70%
Our audience/visitor base grew
Our donor base grew
We attracted younger audiences/visitors
We attracted an audience/visitor segment that is morerepresentative of our community
Our ticket revenue grew
Our surplus/deficit improved
Our financial results have not improved
The number and composition of audiences/visitors hasnot changed
We saw some audience/visitor segments decline
Don’t know
65% of arts respondents report growth in their audience/visitor base as a result of engagement strategies. However, far fewer report positive financial return on their investments.
Results from audience/visitor development

11 nonprofitfinancefund.org ©2014 Nonprofit Finance Fund 2014 Arts Feature generously sponsored by:
Organizations do not feel overly threatened by competition from other arts and non-arts experiences. Of those who did experience competition, <15% reported financial ramifications.
11
How has increased competition impacted your organization? (selected all that apply)
11%
7%
11%
13%
12%
6%
37%
0% 5% 10% 15% 20% 25% 30% 35% 40%
Decline in overall attendance
Decline in repeat attendance
Downward pricing pressure
Lower earned revenue
Lower contributed revenue
Declining bottom line
We have not experienced increasedcompetition

12 nonprofitfinancefund.org ©2014 Nonprofit Finance Fund 2014 Arts Feature generously sponsored by:
Arts & culture organizations cite some of the positive effects of competition: stronger programs, a more engaged audience, and opportunity for collaboration.
12
“A rising tide raises all boats. If people are interested in experiencing the arts, that helps us.” - Theatre, California
“As we become the dominant cultural organization in our community, we experience the inverse of competition–opportunities to be generous to struggling organizations.” - Museum, California
“More activity in the field of experimental arts only strengthens our programs and builds a more open & educated audience.” - Theatre, New York
“We cooperate with other organizations to build audiences for all of us.” - Orchestra, Utah

13 nonprofitfinancefund.org ©2014 Nonprofit Finance Fund 2014 Arts Feature generously sponsored by:
Table of Contents
About Nonprofit Finance Fund & the Survey
Program Trends: Demand, Engagement, & Competition
Financial Health & Management Actions Taken
Grantmaking Trends: Dynamics of Private & Public Funding
Measuring Impact
Conclusion: Looking Ahead & Tips for Cultural Nonprofits
14 nonprofitfinancefund.org ©2014 Nonprofit Finance Fund 2014 Arts Feature generously sponsored by:
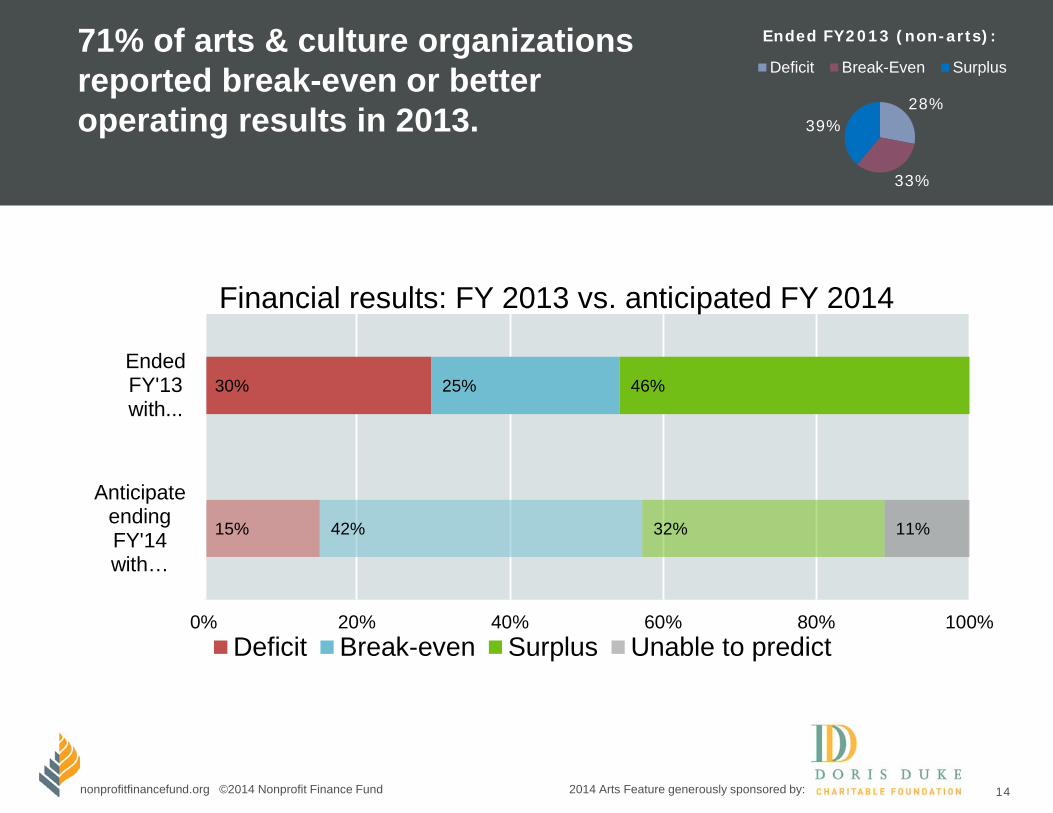
71% of arts & culture organizations reported break-even or better operating results in 2013. 28%
33%
39%
Ended FY2013 (non-arts):
Deficit Break-Even Surplus
15%
30%
42%
25%
32%
46%
11%
0% 20% 40% 60% 80% 100%
Anticipate ending FY'14 with…
EndedFY'13with...
Financial results: FY 2013 vs. anticipated FY 2014
Deficit Break-even Surplus Unable to predict

15 nonprofitfinancefund.org ©2014 Nonprofit Finance Fund 2014 Arts Feature generously sponsored by:
Trend data show declines in the percentage of arts organizations reporting deficits.
36% 33% 30% 28% 28%
28% 22% 25% 32% 33%
36% 44% 44% 40% 39%
2009 2010 2011 2012 2013
Arts Respondents: ended the year with…
Non-arts Respondents: ended the year with…
Deficit Break-even Surplus
37% 38% 34% 31% 30%
31% 21%
23% 26% 25%
32% 42% 44% 42% 46%
2009 2010 2011 2012 2013

16 nonprofitfinancefund.org ©2014 Nonprofit Finance Fund 2014 Arts Feature generously sponsored by:
Despite improving annual results, 41% of arts & culture groups persistently report having fewer than 3 months of cash.
Cash may be restricted or earmarked to future programs or time periods. NFF strongly recommends that organizations also calculate months of liquid net assets to understand the funds actually available to pay the bills:
Unrestricted net assets – (property & equipment – associated debt) / (total expenses / 12)
16%
25%
38%
21%
<1Month
1-2Months
3-6Months
>6Months
Months of cash (non-arts): 11%: <1 month 22%: 1-2 months 46%: 3-6 months 21%: >6 months
25% say they added to reserve funds, while 17% said they drew down reserves.
17 nonprofitfinancefund.org ©2014 Nonprofit Finance Fund 2014 Arts Feature generously sponsored by:
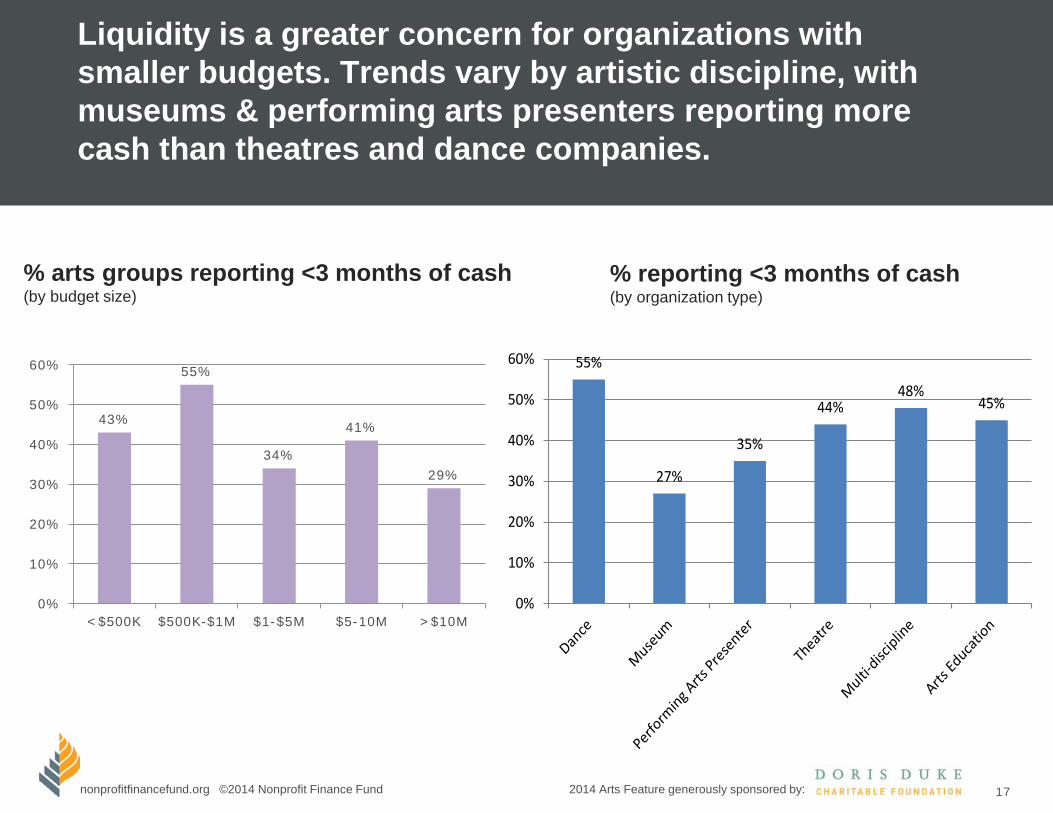
55%
27%
35%
44%48%
45%
0%
10%
20%
30%
40%
50%
60%
Liquidity is a greater concern for organizations with smaller budgets. Trends vary by artistic discipline, with museums & performing arts presenters reporting more cash than theatres and dance companies.
% arts groups reporting <3 months of cash (by budget size)
% reporting <3 months of cash (by organization type)
43%
55%
34%
41%
29%
0%
10%
20%
30%
40%
50%
60%
<$500K $500K-$1M $1-$5M $5-10M >$10M

18 nonprofitfinancefund.org ©2014 Nonprofit Finance Fund 2014 Arts Feature generously sponsored by:
Nearly 50% of arts respondents cite “achieving long-term financial sustainability” as their greatest challenge.
"The local economy is still struggling. This will make it a challenge for us to balance our need for additional revenue for long-term sustainability with our wish to keep prices low for our customers who can't afford much for entertainment.” - Theatre, Oregon
Greatest Challenges Arts Respondents are Facing (respondents chose up to 3)
47%
22%
21%
19%
16%
14%
13%
13%
11%
11%
0% 5% 10% 15% 20% 25% 30% 35% 40% 45% 50%
Achieving long-term financial sustainability
Not enough staff
Marketing, outreach, and community engagement
Diversifying funding sources
Developing cash reserves
Raising unrestricted revenue
Managing or pursuing growth
Raising funding that covers full costs
Having regular, reliable cash flow
Measuring impact

19 nonprofitfinancefund.org ©2014 Nonprofit Finance Fund 2014 Arts Feature generously sponsored by:
Financial challenges notwithstanding, program and audience expansion continued apace for many. (Notably, collaboration is less prominent in the arts than other sectors.)
50%
46%
44%
25%
20%
16%
12%
11%
53%
44%
50%
30%
19%
26%
15%
18%
0% 10% 20% 30% 40% 50% 60%
Add or expand programs or services
Increase the number of people served or audience reached
Collaborate with another organization to improve/increase programs or services offered
Upgrade hardware or software to improve service or program delivery
Expand geographies served
Use, purchase, or upgrade software specifically to capture data on program impact
Increase amount of service per client or programs per visitor/audience member
Reduce or eliminate programs or services
Program-related Actions Taken in 2013
Arts Non-arts

20 nonprofitfinancefund.org ©2014 Nonprofit Finance Fund 2014 Arts Feature generously sponsored by:
However, arts & culture nonprofits invested less in personnel (through hiring, salaries & professional development) than the greater nonprofit sector.
44%
39%
36%
36%
35%
32%
25%
20%
52%
44%
50%
49%
36%
32%
31%
30%
0% 10% 20% 30% 40% 50% 60%
Hire staff for new positions
Give raises
Invest money or time in professional development for staff
Make replacement hires
Engage more closely with your board through more frequent reports and meetings
Retain all existing personnel
Rely more on volunteers
Invest money or time in coaching or training for executive leadership
Arts Non-arts
Personnel-related Actions Taken in 2013

21 nonprofitfinancefund.org ©2014 Nonprofit Finance Fund 2014 Arts Feature generously sponsored by:
What top management strategies did arts & culture groups undertake to improve their situation? Many focused on planning. Few launched capital campaigns or purchased/renovated facilities.
37%
36%
23%
22%
21%
16%
11%
8%
0% 5% 10% 15% 20% 25% 30% 35% 40%
Conduct long-term strategic or financial planning
Upgrade hardware or software to improve organizational efficiency
Use outside help to improve financial knowledge or capacity
Collaborate with another organization to reduce administrative expenses
Pursue an earned revenue venture
Undergo organizational restructuring
Launch a capital campaign
Purchase a facility, or renovate a facility you own

22 nonprofitfinancefund.org ©2014 Nonprofit Finance Fund 2014 Arts Feature generously sponsored by:
Table of Contents
About Nonprofit Finance Fund & the Survey
Program Trends: Demand, Engagement, & Competition
Financial Health & Management Actions Taken
Grantmaking Trends: Dynamics of Private & Public Funding
Measuring Impact
Conclusion: Looking Ahead & Tips for Cultural Nonprofits

23 nonprofitfinancefund.org ©2014 Nonprofit Finance Fund 2014 Arts Feature generously sponsored by:
Addressing unhealthy finances will require more candid grantmaker-grantee dialogue. Respondents report comfort in talking to funders about program expansion, but not long-term financial needs.
My organization can have open dialogue with funders about…
“We launched a special campaign dedicated to risk capital. It is a hard case to make, and fundraising has been slow but steady. But it's really proving to be a game changer. The case is that we need support that works outside the bounds of our annual budget so we can say 'yes' to different kinds of projects.” - Theatre, Washington, DC
53%
36%
22%
21%
12%
12%
11%
9%
9%
3%
2%
0% 10% 20% 30% 40% 50% 60%
Expanding programs
General operating support
Acquiring or renovating a facility
Multi-year funding
I do not feel that my funders are willing toengage in open dialogue about these topics
Developing reserves for operating needs(money for rainy day)
Working capital (cash flow needs)
Developing reserves for long-term facility /fixed asset needs
Flexible capital for change/growth(including impact investing products)
Other reserves or topics
Paying off loans

24 nonprofitfinancefund.org ©2014 Nonprofit Finance Fund 2014 Arts Feature generously sponsored by:
General operating support & grants for expanding programs were the most common types of funding received. Far fewer organizations received funding for flexible capital and reserves.
58%
44%
30%
18%
11%
8%
8%
5%
5%
2%
0% 10% 20% 30% 40% 50% 60% 70%
General operating support
Expanding programs
Multi-year funding
Acquiring or renovating a facility
Working capital (cash flow needs)
Flexible capital for organizationalchange/growth
Developing reserves for operating needs(money for a rainy day)
Developing reserves for artistic risk-taking
Developing reserves for long-termfacility or fixed asset needs
Paying off loans
Funding received in the past year “The most helpful funding is multi-year, significant general operating support with partners that have a committed relationship with our institution.” - Theatre, New York
25 nonprofitfinancefund.org ©2014 Nonprofit Finance Fund 2014 Arts Feature generously sponsored by:
It can be easier to make a compelling case for growth than for investments in capacity & capital. But program expansion often undermines financial health.
25
“The plan of ‘we’re going to grow our way out of this problem’ is often a poor one.” -Arts nonprofit, Massachusetts
“Our current strategic plan doesn’t focus on growth. It focuses on getting better at what we do and going deeper into what we do. It’s hard to get funders excited about this message.” - Youth arts nonprofit, Massachusetts

26 nonprofitfinancefund.org ©2014 Nonprofit Finance Fund 2014 Arts Feature generously sponsored by:
42%
33%
29%
21%
21%
15%
13%
3%
0% 5% 10% 15% 20% 25% 30% 35% 40% 45%
Faced reporting requirements that were outsized relative to thesize of the grant
Benefited from a funder’s non-monetary resources or knowledge (e.g., convenings, network-building, referrals)
Applied for a grant that restricted allowable overhead rate
Invited by a funder to openly discuss financial health and long-term financial needs
Benefited from a funder’s decision to streamline application and/or due diligence process
Told by a funder that a grant award was approved because ofa track record of strong financial management and surpluses
Invited to give input on a funder’s strategy
Told by a funder that a grant award was denied because of atrack record of surpluses and savings
Cultural organizations report experiencing grantmaking practices both conducive to, and disruptive of, effective planning and management.
Grantmaking practices experienced in the past year

27 nonprofitfinancefund.org ©2014 Nonprofit Finance Fund 2014 Arts Feature generously sponsored by:
While more than 40% of respondents say private philanthropists rarely or never pay full program costs, government is even less likely to offer full cost coverage.
How often do funders cover the full costs of programs they intend to support?
“We have not generated adequate unrestricted operating support to maintain our operations. More and more gifts and grants have restrictions, and some even prohibit any indirect or overhead support. Collectively, we have to help the donor community know that programs cannot be offered [if they don’t] contribute to our indirect costs.” - Science center, Washington
54%
63%
60%
31%
36%
33%
14%
14%
15%
17%
23%
19%
13%
10%
10%
28%
19%
23%
8%
5%
8%
14%
11%
14%
9%
5%
4%
5%
3%
9%
3%
3%
3%
5%
9%
3%
0% 10% 20% 30% 40% 50% 60% 70% 80% 90% 100%
Local gov't
State gov't
Federal gov't
Private/communityfoundations
Corporations/corporate foundations
Individuals
Never Rarely Sometimes Often Always N/A
28 nonprofitfinancefund.org ©2014 Nonprofit Finance Fund 2014 Arts Feature generously sponsored by:
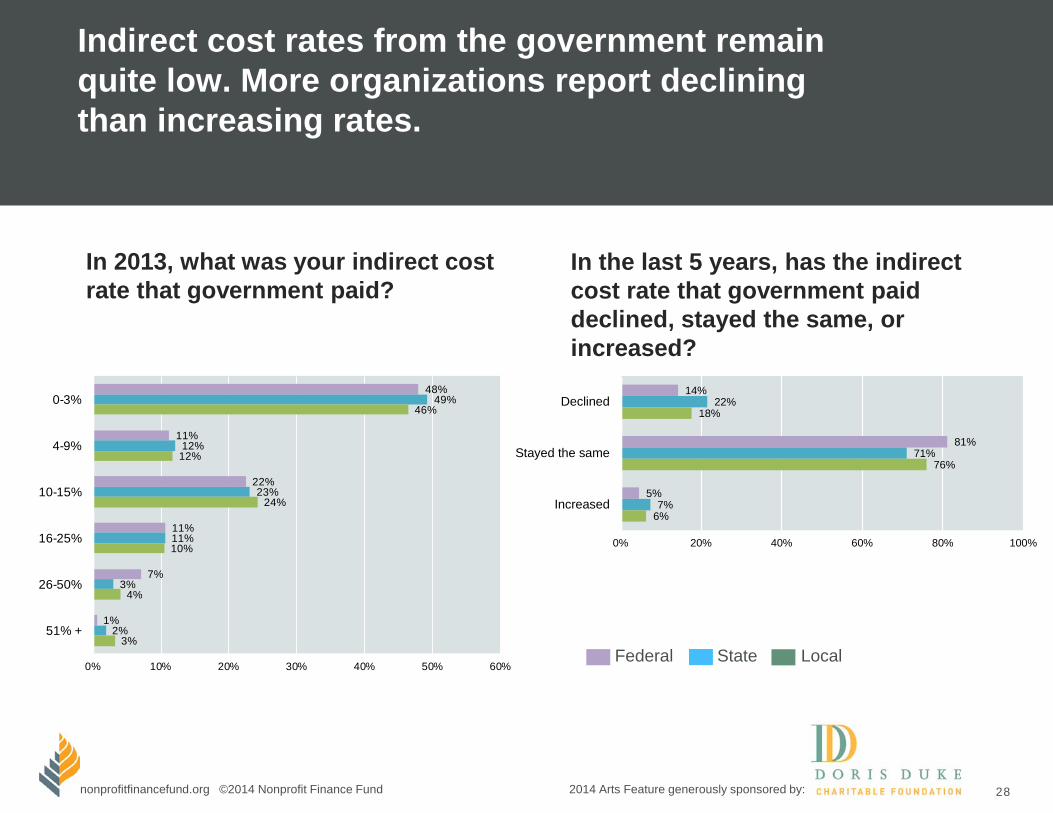
Indirect cost rates from the government remain quite low. More organizations report declining than increasing rates.
In 2013, what was your indirect cost rate that government paid?
In the last 5 years, has the indirect cost rate that government paid declined, stayed the same, or increased?
Federal State Local
48%
11%
22%
11%
7%
1%
49%
12%
23%
11%
3%
2%
46%
12%
24%
10%
4%
3%
0% 10% 20% 30% 40% 50% 60%
0-3%
4-9%
10-15%
16-25%
26-50%
51% +
14%
81%
5%
22%
71%
7%
18%
76%
6%
0% 20% 40% 60% 80% 100%
Declined
Stayed the same
Increased

29 nonprofitfinancefund.org ©2014 Nonprofit Finance Fund 2014 Arts Feature generously sponsored by:
More than 40% of organizations report that government funding at the state and local levels arrives late.
29
2%
67%
13%
11%
5%
2%
52%
15%
15%
16%
3%
56%
16%
16%
9%
0% 10% 20% 30% 40% 50% 60% 70% 80%
Ahead of scheduledpayment date
On scheduledpayment date
1-30 days late
31-90 days late
> 90 days late
Federal gov't
State gov't
Local gov't
When do you receive payments from the government?
30 nonprofitfinancefund.org ©2014 Nonprofit Finance Fund 2014 Arts Feature generously sponsored by:
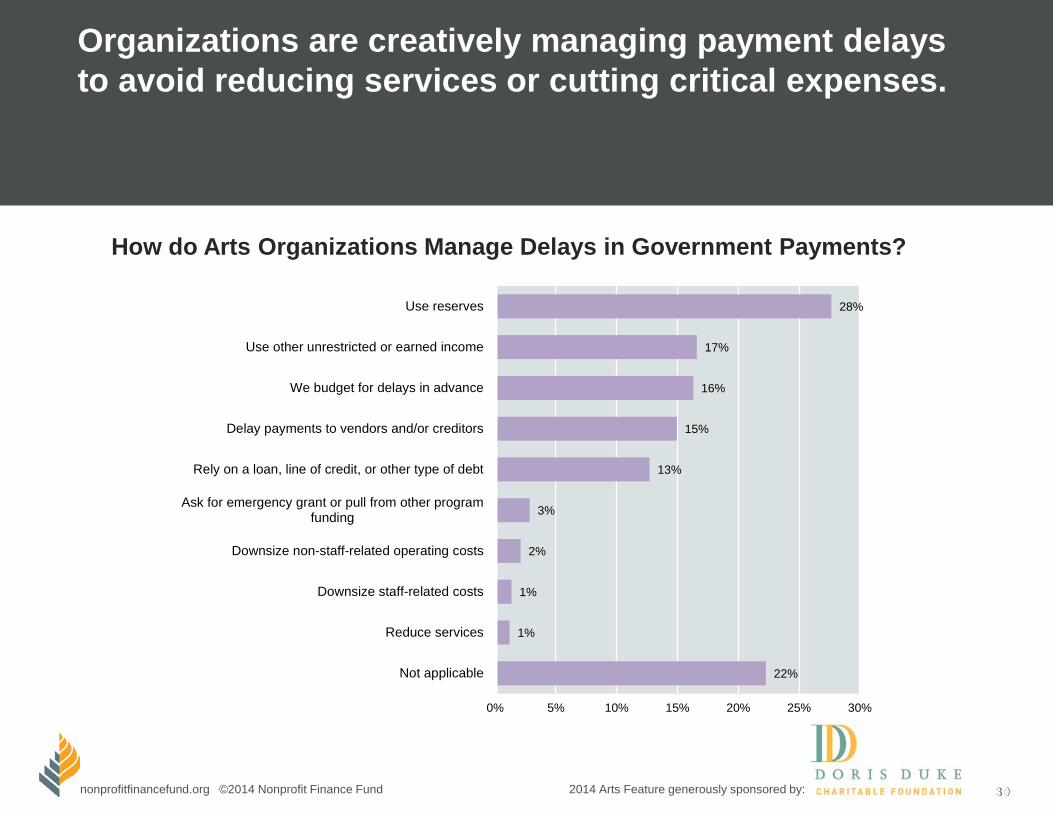
Organizations are creatively managing payment delays to avoid reducing services or cutting critical expenses.
30
How do Arts Organizations Manage Delays in Government Payments?
28%
17%
16%
15%
13%
3%
2%
1%
1%
22%
0% 5% 10% 15% 20% 25% 30%
Use reserves
Use other unrestricted or earned income
We budget for delays in advance
Delay payments to vendors and/or creditors
Rely on a loan, line of credit, or other type of debt
Ask for emergency grant or pull from other programfunding
Downsize non-staff-related operating costs
Downsize staff-related costs
Reduce services
Not applicable
31 nonprofitfinancefund.org ©2014 Nonprofit Finance Fund 2014 Arts Feature generously sponsored by:
Table of Contents
About Nonprofit Finance Fund & the Survey
Program Trends: Demand, Engagement, & Competition
Financial Health & Management Actions Taken
Grantmaking Trends: Dynamics of Private & Public Funding
Measuring Impact
Conclusion: Looking Ahead & Tips for Cultural Nonprofits

32 nonprofitfinancefund.org ©2014 Nonprofit Finance Fund 2014 Arts Feature generously sponsored by:
Proving impact becomes increasingly important in an uncertain philanthropic marketplace. The arts & culture sector measures outcomes data less frequently than the broader nonprofit sector.
How often does your organization pursue the following (related to program impact)?
32%
4%
22%
22%
30%
6%
30%
31%
31%
21%
34%
32%
7%
69%
15%
14%
0% 10% 20% 30% 40% 50% 60% 70% 80% 90% 100%
Use an external evaluator to assess the effectiveness of our programsor services
Collect program data on productivity, such as the number of clients orsize of audience served
Collect long-term data on how our services change the lives of ourclients or audience members
Collect long-term data on how our services or programs affect thecommunity in which we live
Never Rarely Sometimes Regularly
33 nonprofitfinancefund.org ©2014 Nonprofit Finance Fund 2014 Arts Feature generously sponsored by:
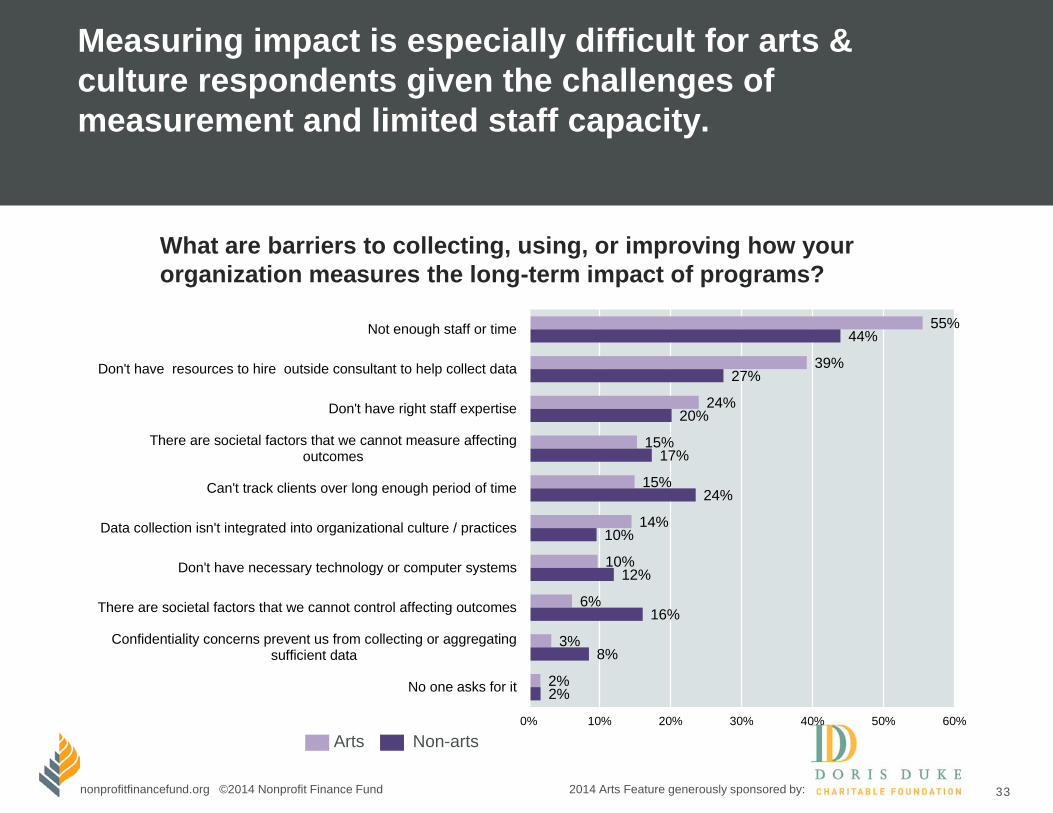
Measuring impact is especially difficult for arts & culture respondents given the challenges of measurement and limited staff capacity.
55%
39%
24%
15%
15%
14%
10%
6%
3%
2%
44%
27%
20%
17%
24%
10%
12%
16%
8%
2%
0% 10% 20% 30% 40% 50% 60%
Not enough staff or time
Don't have resources to hire outside consultant to help collect data
Don't have right staff expertise
There are societal factors that we cannot measure affectingoutcomes
Can't track clients over long enough period of time
Data collection isn't integrated into organizational culture / practices
Don't have necessary technology or computer systems
There are societal factors that we cannot control affecting outcomes
Confidentiality concerns prevent us from collecting or aggregatingsufficient data
No one asks for it
What are barriers to collecting, using, or improving how your organization measures the long-term impact of programs?
Arts Non-arts

34 nonprofitfinancefund.org ©2014 Nonprofit Finance Fund 2014 Arts Feature generously sponsored by:
78% say funders rarely or never cover the costs associated with impact measurement.
40%
38%
18%
3%
0%
0% 10% 20% 30% 40% 50%
Never
Rarely
Sometimes
Often
Always
How often do funders cover the costs associated with impact measurement?

35 nonprofitfinancefund.org ©2014 Nonprofit Finance Fund 2014 Arts Feature generously sponsored by:
Table of Contents
About Nonprofit Finance Fund & the Survey
Program Trends: Demand, Engagement, & Competition
Financial Health & Management Actions Taken
Grantmaking Trends: Dynamics of Private & Public Funding
Measuring Impact
Conclusion: Looking Ahead & Tips for Cultural Nonprofits

36 nonprofitfinancefund.org ©2014 Nonprofit Finance Fund 2014 Arts Feature generously sponsored by:
Looking Ahead: Steps cultural nonprofits & their funders can take to propel change
Nonprofits: Develop strategies that integrate financial planning with operational and program
planning, Understand and seek funding for the full costs of projects/programs, Budget and manage to operating surpluses, Prioritize working capital and savings for periodic risk-taking and change, and Clearly communicate your financial goals, priorities and timeline in the context of
your art-making.
Funders: Encourage integrated planning that links program, operations, and finances to
strategy, Fund projects and programs at full costs, Reward rather than penalize surpluses, Seed reserves for liquidity, risk-taking, and change, and Engage in dialogue with your staff, grantees, and peer funders about
capitalization principles as a means to artistic freedom.
37 nonprofitfinancefund.org ©2014 Nonprofit Finance Fund 2014 Arts Feature generously sponsored by:
Nonprofit Finance Fund Where Money Meets Mission ®
Learn more at: http://nff.org/survey [email protected]
Interact with the data yourself at: survey.nff.org
Visit our Arts Resource Page:
http://nonprofitfinancefund.org/partnerships/artsandculture
Stay connected: Twitter.com/nff_news Facebook.com/nonprofitfinancefund
37