2014 stanlib funds limited
TRANSCRIPT

STANLIB Funds LimitedUnaudited Interim Report and Financial Statements for the period 1 January 2014 to 30 June 2014
Company Number 64639

Copies of Annual and Semi-Annual Reports may be obtained at the registered office of the company at Standard Bank House, 47 - 49 La Motte Street, St Helier, Jersey JE2 4SZ. The financial statements must be read in conjunction with the detailed information contained in the prospectus.

01Management and Administration
02Report of the Directors
04Investment Manager’s Report
09Statements of Total Return
11Statements of Changes in Shareholders’ Net Assets
13Balance Sheet
16Notes to the Financial Statements
64Portfolio Statement
172Fund Statistics
175Summary of Material Portfolio Changes
You say future potential. We say STANLIB.

STANLIB Funds Limited
1
Management and Administration
Directors
Neil Deacon **Michael Farrow (Chairman) *Sidney Place *Martin Rabe
* Independent non-executive Directors**As at 23 June 2014, Neil Deacon was appointed Interim Managing Director of STANLIB Funds Managers Jersey Limited. Mr. Deacon was an Independent Director up to 23 June 2014.
Manager
STANLIB Fund Managers Jersey LimitedStandard Bank House47-49 La Motte StreetSt Helier, Jersey JE2 4SZChannel Islands
Independent Auditors
PricewaterhouseCoopers Chartered Accountants and Registered AuditorsOne Spencer DockNorth Wall QuayDublin 1Ireland
Custodian
Capita Trust Company (Jersey) Limited12 Castle StreetSt Helier, Jersey JE2 3RTChannel Islands
Sub-Custodian And Bankers
The Bank of New York Mellon SA/NV London BranchThe Bank of New York Mellon Centre160 Queen Victoria StreetLondon EC4V 4LAUnited Kingdom
Administrator
BNY Mellon Fund Services (Ireland) LimitedGuild House, Guild StreetInternational Financial Services CentreDublin 1Ireland
Investment Manager, Promoter and Distributor
STANLIB Asset Management Limited17 Melrose BoulevardMelrose Arch2196South Africa
Registered Office
Standard Bank House47-49 La Motte StreetSt Helier, Jersey JE2 4SZChannel Islands
Sponsoring Broker
J & E DavyDavy House 49 Dawson StreetDublin 2Ireland
Legal Advisers
Bedell Cristin26 New StreetSt HelierJersey JE2 3RAChannel Islands
Sole Representative in South Africa
STANLIB Collective Investments Limited17 Melrose BoulevardMelrose Arch 2196South Africa

STANLIB Funds Limited
2
Report of the Directors
The Directors present their Unaudited Interim Report and Financial Statements for the period ended 30 June 2014.
Incorporation
STANLIB Funds Limited (the “Company”) was incorporated in Jersey, Channel Islands on 18 March 1996 with an authorised share capital of USD 5,000,100 divided into 100 Founder Shares of USD 1 each and 5,000,000 Unclassified Shares of USD 1 each.
Activities
The Company was originally incorporated in Jersey on 18 March 1996.
The Company is an open-ended investment company in that it may issue and redeem Participating Shares.
As at 30 June 2014 participating Shares are offered in the Company as shares of the Global Property Fund, STANLIB Multi-Manager Global Bond Fund, STANLIB Multi-Manager Global Equity Fund, High Alpha Global Equity Fund, STANLIB Global Bond Fund, STANLIB Global Emerging Markets Fund, STANLIB Global Balanced Fund and the STANLIB Global Balanced Cautious Fund (each a “Class Fund”).
The Company is an umbrella fund and where the assets of a Class Fund are insufficient to meet that Class Fund’s liabilities, any liabilities which remain undischarged will revert to the Company as a whole and be allocated amongst other Class Funds. As at the date hereof, the Directors are not aware of any existing or contingent liability relating to a Class Fund which could not be discharged out of the assets of that Class Fund. Certain Share Classes are listed on the Irish Stock Exchange: Global Property Fund B Class, STANLIB Multi-Manager Global Bond Fund A Class, STANLIB Multi-Manager Global Equity Fund A Class, High Alpha Global Equity Fund A Class, High Alpha Global Equity Fund B Class, STANLIB Global Bond Fund A Class, STANLIB Global Emerging Markets Fund B, STANLIB Global Balanced Fund B Class and STANLIB Global Balanced Cautious Fund B Class.
Investment objectives and policy
The objectives of the Class Funds are as follows:
Global Property Fund
The primary objective is to maximise long term total return, both capital and income growth, by investing in global property company shares and REITS. The Class Fund’s benchmark is the UBS Global Real Estate Investors Index.
STANLIB Multi-Manager Global Bond Fund
The primary objective is to provide attractive investment returns from investing in major international bond markets. The investment objective is to out-perform the Barclays Capital Multiverse Index.
STANLIB Multi-Manager Global Equity Fund
The objective is to maximise long term total return by investing in global equities. The investment objective is to generate annualised investment returns in excess of the benchmark. The Class Fund’s benchmark is the MSCI All Country World Investable Market Index.
High Alpha Global Equity Fund
The objective is to maximise long term total return by investing in global equities. The Class Fund’s benchmark is the MSCI World All Country Index. Tracking error of the fund to the benchmark is expected to be in the region of 6-10%.
STANLIB Global Bond Fund
The primary objective of this single manager fund is to provide attractive investment returns from investment in major international bond markets. The criterion for investment is the preservation of capital and appropriate weighted average credit rating. The investment objective is to out-perform the Barclays Global Aggregate Bond Index.
STANLIB Global Emerging Markets Fund
The primary objective of this single manager fund is to maximise long term total return by investing in emerging market equities. The investment objective is to out-perform the MSCI Emerging Markets Free Index.
STANLIB Global Balanced Fund*
The primary objective is to provide investors with long-term capital growth from a diversified and actively managed portfolio of equities, property company shares, bonds and cash. This Class Fund’s composite benchmark comprises the MSCI AC World Index (50%), the Barclays Capital Aggregate Bond Index (30%), the UBS Global Real Estate investors Index (10%) and the JP Morgan Global Cash 1 Month Index (10%), rebalanced monthly.
STANLIB Global Balanced Cautious Fund*
The primary objective is to adopt a conservative approach to investment from a diversified and actively managed portfolio of equities, property company shares, bonds and cash. This Class Fund’s composite benchmark comprises the MSCI AC World Index (20%), the Barclays Capital Aggregate Bond Index (40%), the UBS Global Real Estate Investors Index (8%) and the JP Morgan Global Cash 1 Month Index (32%), rebalanced monthly.
The objectives shall be sought within the constraints of the investment restrictions and subject to the risks normally associated with a conservative and balanced approach to portfolio management.

STANLIB Funds Limited
Report of the Directors (continued)
3
Results and dividends
Change in net assets attributable to shareholders from investing activities
6 months to 30 June 2014 USD
12 months to 31 December 2013USD
Global Property Fund 13,372,114 (4,424,408)
STANLIB Multi-Manager Global Bond Fund 12,992,792 (15,289,567)
STANLIB Multi-Manager Global Equity Fund 128,472,647 353,657,305
High Alpha Global Equity Fund 31,785,823 205,868,215
STANLIB Global Bond Fund 7,434,486 (3,673,652)
STANLIB Global Emerging Markets Fund 7,998,406 2,092,031
STANLIB Global Balanced Fund 5,260,055 3,032,061
STANLIB Global Balanced Cautious Fund 1,396,839 337,265
Capital values
Total net assets attributable to holders of redeemable participating shares amounted to US$4.037 billion as at 30 June 2014 (31 December 2013: US$3.812 billion).
Directors
The Directors at 30 June 2014, all of whom have served as Directors for the whole period then ended unless otherwise stated, are listed below:
Љ Neil Deacon (independent up to 23 June 2014)* Љ Michael Farrow (independent) Љ Sidney Place (independent) Љ Martin Rabe
All Directors act in a non-executive capacity.*As at 23 June 2014, Neil Deacon was appointed Interim Managing Director of STANLIB Funds Managers Jersey Limited. Mr. Deacon was an Independent Director up to 23 June 2014
Directors’ interests
There were no material contracts or contracts for the provision of services existing during the period under review to which the Company was a party and in which any Director is, or was, materially interested.
The Directors had no beneficial interest in the Shares of the Company at 30 June 2014.
Directors’ responsibilities
The Directors are responsible for preparing financial statements which shall be in accordance with generally accepted accounting principles and show a true and fair view of the total return of the Company for the period and of the state of the Company’s affairs as at the end of the period.
In preparing the financial statements, the Directors should:
Љ select suitable accounting policies and then apply them consistently;
Љ make judgments and estimates that are reasonable and prudent;
Љ state whether applicable accounting standards have been followed, subject to any material departures disclosed and explained in the financial statements; and
Љ prepare the financial statements on a going concern basis unless it is inappropriate to presume that the Company will continue in business.
The Directors are responsible for keeping accounting records which are sufficient to show and explain the Company’s transactions and are such to disclose with reasonable accuracy, at any time, the financial position of the Company and to enable them to ensure that the financial statements comply with the Companies (Jersey) Law 1991 and continuing obligations of the Irish Stock Exchange. They are also responsible for safeguarding the assets of the Company and hence for taking responsible steps for the prevention and detection of fraud, error and non-compliance with laws and regulations.
The Directors confirm that they have complied with all the above requirements in preparing the financial statements.
Review of Business Risks and Uncertainities
Refer to note 11, financial instruments and associated risks, for details of the risks and uncertainities.
Future Developments
Please see the Investment Managers reports on pages 4 to 8 for each Class Fund’s outlook.
Registered office
Standard Bank House,47-49 La Motte StreetSt Helier, Jersey JE2 4SZ Channel Islands
By order of the Board,
STANLIB Fund Managers Jersey LimitedSecretary20 October 2014

STANLIB Funds Limited
4
Investment Manager’s Report
The following table sets out the results achieved since launch, net of fees, of the Funds managed by STANLIB Asset Management Limited.
USD ANNUAL RETURN SINCE LAUNCH
LAUNCH DATE CLASS FUND BENCHMARK EXCESS RETURN
Global Property Fund 01 September 2009 13.23% 14.74% -1.51%
STANLIB Multi-Manager Global Bond Fund 21 December 1998 5.14% 5.13% 0.01%
STANLIB Multi-Manager Global Equity Fund 21 December 1998 5.77% 4.41% 1.36%
High Alpha Global Equity Fund 28 September 2007 1.35% 2.53% -1.18%
STANLIB Global Bond Fund 18 July 2008 6.58% 4.29% 2.28%
STANLIB Global Emerging Markets Fund 06 December 2012 6.59% -0.28% 6.87%
STANLIB Global Balanced Fund 01 July 2013 13.34% 14.42% -1.08%
STANLIB Global Balanced Cautious Fund 01 July 2013 9.55% 12.37% -2.82%
Commentary on each of the Funds in relation to their respective benchmarks has been provided below.
GLOBAL PROPERTY FUND – 6 months to 30 June 2014 (USD)
Portfolio Return (%)Global Property Fund 15.02%
Benchmark (UBS Global Real Estate Investors Index ) 15.96%
Global listed property investors returned around 16.0% (USD total return) over the first half of 2014, significantly outperformed listed property developers. Listed property also significantly outperformed global bonds and global equities over the same period. Performance was driven mainly by strength in US government bonds and dovish comments coming from the US Fed and ECB. The best performing listed property regions were Australia, North America and Europe and the worst performing Hong Kong and Singapore. Sentiment towards emerging markets continues to improve and any improvement in economic data from China could be a catalyst for a re-rating in emerging market property stocks.
The portfolio underperformed over the first half of 2014 mainly due to cash drag in a strong market. The average cash balance for the portfolio during period under review was around 3.65%. UK and Europe made the biggest contribution to portfolio relative return. Stocks with the best attribution were GSW Immobilien AG and Hung Lung Properties. Stocks with the worst attribution were Wharf Holdings and Mitsui Fudosan Co Ltd. The positions in Brazil had positive attribution and these stocks continue to trade at better valuations than US peers.
There has been an increased positive correlation between global listed property and bond prices in recent times. This suggests that price performance over next 12 months will be more dependent on the direction of US treasury yields and actions at the Federal Reserve and other central banks. Bottom up research according to UBS Research suggests positive earnings growth over the next 12 months with global listed property investors currently trading more or less in-line with net asset value. The estimated implied forward dividend yield for the portfolio is around 3.6% using estimates from Bloomberg.
STANLIB Multi-Manager Global Bond Fund - 6 months to 30 June 2014 (USD)
Portfolio Return (%)STANLIB Multi-Manager Global Bond Fund 4.93%
Benchmark (Barclays Multiverse TR Index) 5.01%
The assets in this class fund are managed by Brandywine, Columbia, Blackrock and Capital who are the appointed sub-investment managers.
Global bonds performed well during the first half of the year as dovish commentary from the Fed resulted in 10 year Treasury yields declining 50bp to 2.5%. The highlight during the period under review was however in Europe where many government bond market yields hit record lows - the Dutch 10 year bond, where we have our longest history dating back to 1517, touched 1.45%. This was due to the ECB cutting rates to 0.15% and implementing negative deposit rates for banks. Italian and Spanish 10 year bonds have clearly been beneficiaries with yields declining 128bp and 149bp respectively in 2014. The aforementioned has resulted in investors searching for yield which in turn helped EM debt post strong gains over the second quarter - outperforming most sectors by a wide margin. In this regard Polish and Mexican yields fell 51bp and 78bp (the latter being supported by a surprise rate cut). Strong YTD gains stand in sharp contrast to negative sentiment on the sector at the start of the year. Spread product has continued to outperform this year although more recent gains have been muted. The best returns have been in higher beta assets such as high yield which have posted excess returns of 3.4%. From a currency perspective the US dollar has oscillated back and forth throughout the year but on a trade weighted basis is essentially flat. It has fallen most against the Brazilian Real (-6.4%) as well as sterling on the back of hawkish central bank comments from the BOE governor.

STANLIB Funds Limited
Investment Manager’s Report (continued)
5
The Fund has marginally underperformed the benchmark over the first half but managed to outperform global and SA peers. Being overweight sub investment grade contributed to relative returns. Similarly above benchmark allocation to corporate bonds helped but they are looking expensive and we’re glad to see our managers taking profit. Earlier this year we highlighted the significant increase in our managers’ allocation to Mexico and select emerging markets. Per above, it paid off sooner than anticipated and the thesis behind this contrarian trade still makes sense to us. With G7 yield curves generally flattening, issues with longer maturities fared best. As such shorter duration in developed markets detracted for most managers. Conversely long duration positioning in certain emerging markets contributed to returns. A major change within the portfolio has been within the Columbia mandate. To this end the allocation to peripheral Europe increased materially. This has more to do with the change in management of the portfolio (where collaboration within the Ameriprise asset management firms resulted in a restructure of the fixed income team) than chasing momentum. The head is now based at Threadneedle with Nic Pifer as the legacy Columbia PM moving to another role. We’re happy with our manager line up but continue to explore ways of evolving the strategy. Alternatives to the core mandate coupled with the inclusion of linkers and ways of dealing with minimum size constraints are all a work in progress to help improve our investors’ returns. The Fund’s duration is just under a year short of the index at 5.3 while the YTM of 2.5% is higher than the benchmark’s 1.8%. The weighted average credit quality of the portfolio (AA-) is similar to the Barclays universe of AA. These characteristics are largely as a result of being overweight higher yielding countries like Poland and Mexico at the expense of developed markets. In currencies, managers have maintained underweights to the euro and yen.
At the beginning of the year we questioned whether bonds, after recording their 2nd worst year since 1977, were pricing in too much regarding hikes. In hindsight the biggest surprise to consensus must be how well the asset class has performed. Looking forward, the short term cyclical outlook has improved, however longer-term growth will continue to be constrained by weak labour markets, demographics, political dysfunction and debt burdens. A glaring difference of the current cycle from the past is that five years into the expansionary phase, the US economy has still not been able to make the transition from recovery to boom. By historical standards, the US should have already reached the point where the economy would have moved above its full capacity and the Fed would have started raising rates. In Europe, left tail risks have diminished but deleveraging and lack of growth drivers will limit acceleration of the region’s economy. While Japan is committed to monetary stimulus beyond 2014, we are in the midst of a transition phase as the Fed effects the gradual withdrawal of QE. Over the next 12 months we expect the broadening economic recovery to exert mild upward pressure on yields, particularly if private-sector credit demand picks up. Next year is likely to pose more challenges when the absence of a price insensitive buyer will be felt. We believe our portfolio is well placed to deal with the challenges of the operating environment. In this regard the composite provides multiple sources of alpha as evidenced by this year’s results where sector allocation was the main driver of Columbia’s returns. Conversely duration positioning (and to a to a lesser extent issuer selection) contributed most to Capital’s portfolio while FX accounted for most of Brandywine’s outperformance.
STANLIB Multi-Manager Global Equity Fund - 6 months to 30 June 2014 (USD)
Portfolio Return (%)STANLIB Multi-Manager Global Equity Fund 6.00%
Benchmark (MSCI AC IMI with Net Dividends Reinvested) 6.23%
The assets in this class fund are managed by Marathon, Capital, Fidelity, Veritas, Aberdeen and Alliance Bernstein who are the appointed sub-investment managers.
Global equities have gained 6.2% in dollar terms this year with the MSCI AC World Index reaching its highest level since inception in 1988. The US and Tech sector are well known contributors while Italy (+14.5%) and Spain (+12.8%) have surprised on the upside. Asia Pacific ex-Japan (+5.5%) hasn’t done too badly either as investors took advantage of attractive valuations. Japan is one of the few areas to post negative returns this year although relative performance has picked up over the last couple of months. Following a poor first quarter, EM returns have improved (+5.6% in Q2) as the economic outlook in China surprised positively, stability in the Russia/Ukraine stand-off emerged and a new Indian government with a majority mandate was well received by the market. From an industry perspective Energy continued its rally. Having lagged for three years, the sector has outperformed in 2014 (+11.3%) as oil exporters rallied on the back of escalating tensions in Iraq. A key theme this year has been surging M&A activity, $2.2trillion according to Bloomberg which is a YoY increase of 77%. In terms of industry the biggest pickup came in Pharma (+677%) and Healthcare (+140%). Value has outperformed growth and there has been a rotation from small caps which led the way at the start of the year to large caps.
After outperforming the index for most of the year the Fund gave back 50bp in relative performance in June resulting in it lagging the benchmark. While disappointing, we managed to beat the Morningstar offshore and ASISA global equity competitors by 1.5% and 1.7% respectively. Having a beta of 0.97 detracted and a 3% cash holding also proved unhelpful in a rising market. Unfortunately country selection hurt as we were underweight Canada, which was one of the best performers (+10%) and sticking with North America, our 8.5% underweight in the US detracted. Conversely sector allocation has been good this year. Healthcare and Energy are our two largest overweights so from above, positioning has contributed. Similarly our biggest underweights are in Consumer Discretionary and Financials which were two of the worst performers. Related to the aforementioned sector moves, Schlumberger contributed significantly to the index’s return implying security selection paid off as we were double benchmark weight in the stock. Similarly, Allergan (manufacturer of Botox) where we were 3 times overweight benefitted from M&A activity as it rose 52.5% this year after being targeted by Valeant. A less than half benchmark allocation to index giant Apple, which gained 17.3% YTD detracted. Marathon has lagged this year due to their large overweight in Japan and security selection within the Tech sector. During the first 6 months of the year we explored the inclusion of their legacy global team (Hosking and Co) in our portfolio. They provide diversification to the existing composite

STANLIB Funds Limited
Investment Manager’s Report (continued)
6
but before progressing we awaited feedback from a due diligence review which was provided in Q3 and we look to have Hosking & Co appointed in Q4. Veritas lagged this quarter for similar reasons i.e. stock picking within Technology accounted for the lion’s share of underperformance. Selection within Telecommunications, specifically Vodafone, also detracted. Aberdeen was the best performer in our line up and we feel vindicated for increasing their allocation in the middle of Q1. Our portfolio benefitted from their strong relative returns due to them having an almost double overweight position in Energy and virtually zero allocation to consumer discretionary. Stock selection within the Capital and Fidelity mandates has unfortunately disappointed of late. On the passive side, our value weighted exposure added value as did the decision in February to increase the allocation to emerging markets within the Alliance Bernstein mandate.
As we enter the second half of the year, there’s no reason to expect sudden growth acceleration. The World Bank has just reduced its global growth forecast and we see major economic blocs growing at or below their potential rates. In other words, the global business cycle seems to have turned flat, with no prospect of either a boom or bust in sight. Similarly bond markets at record lows are implicitly looking towards the low rate of nominal GDP growth. This clearly has repercussions for earnings growth, which seems to be ignored by the equity market. Weak top line growth at the corporate level and lack of investment lead us to question the sustainability of what are above average operating margins. In terms of valuation, elevated multiples are often attributed to low interest rates. The problem with this argument comes when considering future returns i.e. over the long term low interest rates have been associated with higher P/E ratios but those lower rates and higher multiples are themselves highly correlated with poor future returns.
We believe weak credit demand remains the lingering problem for the world economy. A lack of incentives for businesses to leverage their balance sheets coupled with deleveraging by consumers has undercut aggregate demand and created over-savings. Companies have instead used cash to buy back shares rather than invest and this continues to be a key driver of stocks. Given the lack of pricing pressure we think monetary policy will stay accommodative in the near future which is what is needed given valuations are above long term averages. Looking forward we still worry the withdrawal of liquidity by the Fed will mean further volatility with the risks skewed to the downside. The overall portfolio trades at a discount to the market (PE of 17.5 vs. 19.2) with a 2.6% dividend yield vs. the index of 2.4%. Our managers have maintained an overweight position in Western Europe (+4.5%) at the expense of the US and are in aggregate overweight smaller companies.
High Alpha Global Equity Fund - 6 months to 30 June 2014 (USD)
Portfolio Return (%)High Alpha Global Equity Fund Class A 2.98%
High Alpha Global Equity Fund Class B 3.19%
Benchmark (MSCI AC World Index with Net Dividends Reinvested) 6.18%
The assets in this class fund are managed solely by Threadneedle Asset Management Limited who is the appointed sub-investment manager.
The commentary on this Class Fund has been provided by the sub-investment manager, Threadneedle Asset Management Limited, and has been reviewed by STANLIB Asset Management Limited, the Investment Manager.
Global equities performed strongly in the second quarter. In the US, the S&P 500 hit record highs, as dovish comments on interest rates outweighed concerns over mixed economic data, including the downward revision of first-quarter GDP growth to -2.9% at an annualised rate. After weeks of hints, the European Central Bank unveiled a package of monetary policies aimed at staving off deflation and invigorating European economies. The measures – including taking deposit rates into negative territory and providing €400bn of cheap loans for banks – were well received. Japan was the strongest big market. An April rise in consumer tax produced mixed results, serving both to push up inflation (which is an aim of the current government) and to nudge down consumer sales. The country’s ongoing commitment to loose monetary policies ensured a strong end to the quarter. After months of contraction, HSBC’s “flash” purchasing managers’ index for China topped 50 in June, indicating a return to expansion. Along with faster credit growth and strong debuts for three initial public offerings, the Chinese data enthused markets both domestically and in other developing countries. After their strong run last year, global equities made only modest progress over the quarter. Factors affecting investor sentiment included the Federal Reserve’s first reductions in QE; a slide in emerging-market currencies; weaker-than expected Chinese and US economic data; and Russia’s annexation of Crimea.
Markets have continued upwards, with sustained increases in investor confidence. In our view, the strong relative performance of cyclical stocks is warranted by improving data, but given the risk/reward balance, we still favour quality and secular growth. Our confidence in markets through the first half of the year has been justified, as the outlook has improved. With inflation remaining modest and reasonable slack in the labour market, we see little pressure on central bankers to raise rates. This supports our broadly positive view on equity markets, which are well supported by rising returns to shareholders.
STANLIB Global Bond Fund - 6 months to 30 June 2014 (USD)
Portfolio Return (%)STANLIB Global Bond Fund 6.14%
Benchmark (Barclays Capital Global Aggregate TR Index) 4.93%
The assets in this class fund are managed solely by Brandywine Asset Management LLC who is the appointed sub-investment manager.
STANLIB Funds Limited
Investment Manager’s Report (continued)
7
The commentary on this Class Fund has been provided by the sub-investment manager, Brandywine Asset Management LLC, and has been reviewed by STANLIB Asset Management Limited, the Investment Manager.
The portfolio outperformed the benchmark, yielding returns of 6.14% to 4.93%. After a relatively benign first quarter, we saw more activity during the second quarter of the 2014 year. Declining interest rates due to dovish central banks, institutional de-risking due to rising equity valuations and a lack of bond supply caused prices to move during the second quarter. Financial markets and Global policy views resulted in the European Central Bank (ECB) easing monetary policy as well as credit, while the Federal Open Market Committee (FOMC) suggested that the ultimate peak in policy rates during this cycle will likely be lower than normal. Higher-yielding and European sovereign debt typically produced the best performance. Disinflation and ECB action helped Eurozone sovereigns outperform. Relative valuations supported high-quality, high-yielding neighbour, Poland, to outperform. The U.K., New Zealand, U.S., and Canadian bond yields declined the least, as their economies produced the biggest increase in leading economic indicators. Developed economies showed some signs of acceleration and potential inflation, pulling market expectations for rate hikes nearer, and continuing year-to-date rallies in most currencies. The British pound (up 3.0%), and New Zealand dollar (up 6.6%) all outperformed. Strength in the Australian dollar (up 5.5%) reflected an improving outlook for China’s economy. The South Korean won (up 4.0%) outperformed over the past year as it approach all-time highs against the dollar. The Euro’s decline (down 1.2%) showed June’s easing action was somewhat conservative. The Japanese yen (up 3.4%) climbed on decent economic data and central bank statements that ruled out fresh new stimulus in the near term. Emerging bonds and currencies rallied for the most part as currency volatility fell, inflation and current accounts improved markedly, and investment flows returned to most of the battered Fragile Five countries. Brazil’s sovereign debt sustained strength as the Real continued its year-to-date outperformance after the central bank announced a critical volatility-dampening currency program would continue. Mexico outperformed on a currency and bond basis given its higher-quality and high-yielding characteristics. Geopolitical uncertainty in the Ukraine and have caused some concern during the second quarter but Emerging Markets have advanced since the taper talk of 2013 caused large gyrations in these markets.
We believe that there is an improvement in the US economy, but anticipate the market environment to be different than experienced over the past couple of years. Bad weather and the impact of Obama-care produced a recession-type U.S. gross domestic product (GDP) report for the first quarter. However, the preponderance of U.S. data does not suggest a U.S. recession. There are some optimistic developments occurring in Europe, however, the outlook for the Euro remains squeamish at best. With deflation fears and high unemployment figures, the ECB has officially shifted its focus to fighting deflation. We feel that this will be a key theme as officials try to reflate their way into growth by devaluing the Euro. China appears to be at the trough of its growth slowdown as policy shifts from a focus on the structural to the cyclical in an attempt to reinforce
growth. The authorities, so far, have been successful in fighting corruption, cooling the real estate market, and managing the bankruptcies that have followed. Many emerging markets (EM) are experiencing positive developments, and we could see, towards year-end, whether policy conditions in a few of these countries have stabilized or even reversed. In India, the central bank governor, Raghuram Rajan, has presided over a 12% rally in the rupee since he took office and hinted at rate reductions so long as inflationary pressures ease.
STANLIB Global Emerging Markets Fund - 6 months to 30 June 2014 (USD)
Portfolio Return (%)STANLIB Global Emerging Market Fund 6.71%
Benchmark (MSCI EM (Emerging Markets)) 4.80%
The assets in this class fund are managed solely by Threadneedle Asset Management Limited who is the appointed sub-investment manager.
The commentary on this Class Fund has been provided by the sub-investment manager, Threadneedle Asset Management Limited, and has been reviewed by STANLIB Asset Management Limited, the Investment Manager.
The MSCI emerging markets index enjoyed a strong return for the period, in line with markets globally. Despite the continued earnings downgrades seen across most sectors, the index finished in positive territory, buoyed by the ample liquidity provided by the Fed, ECB and the BoJ, plus some easing of liquidity in China. Politics proved the key driver of two of the strongest performing markets. Indian equities advanced after Narendra Modi and the BJP secured victory in the national elections by an unexpectedly high margin. Meanwhile, the Thai market benefited from optimism that the new military government will be able to restore business and consumer confidence. Taiwan was another strong performer, driven by its large weighting in the IT sector, which rose by more than 11%. Finally the Turkish market was boosted by numbers showing that the country’s trade deficit had narrowed.
In recent weeks the Chinese economy has seen a modest cyclical rebound as the government’s efforts to stimulate the economy have started to take effect, with a commensurate rebound in the local equities market. We would caution, however, that China’s structural problems remain unsolved and that the difficult process of rebalancing the economy away from the fixed asset investment-led growth model has really only just begun. Elsewhere, however, we find more reason for optimism. In India the new BJP government’s budget is due to be delivered in July, with investors hopeful that it will provide evidence that they are serious about their reform agenda. The secondary legislation related to Mexico’s far-reaching energy reform is also expected to be agreed within the coming weeks. Finally, in Indonesia votes are now being counted in the presidential elections, with initial indications that the more business friendly candidate, Jokowi, may have won.

STANLIB Funds Limited
Investment Manager’s Report (continued)
8
STANLIB Global Balanced Fund - 6 months to 30 June 2014 (USD)
Portfolio Return (%)STANLIB Global Balanced Fund 4.82%
Benchmark (50% MSCI AC World, 30% Barclays Capital Global Aggregate Bond Index, 10% UBS Global Real Estate Investors Index, 10% JPM Global Cash (1m))
6.87%
The assets in this class fund are managed solely by Threadneedle Asset Management Limited who is the appointed sub-investment manager.
The commentary on this Class Fund has been provided by the sub-investment manager, Threadneedle Asset Management Limited, and has been reviewed by STANLIB Asset Management Limited, the Investment Manager.
The portfolio underperformed its benchmark and this can be attributed to being underweight global equities in the first quarter.
Global equities performed strongly in the second quarter. In the US, the S&P 500 hit record highs, as dovish comments on interest rates outweighed concerns over mixed economic data. After early hesitations, Japan was the strongest major market in local-currency terms. In Europe, the ongoing strife in Ukraine and the recent outbreak of hostilities in Iraq weighed on market sentiment. However, after weeks of hints, the European Central Bank unveiled a package of monetary policies aimed at staving off deflation and invigorating European economies. Emerging markets saw their fortunes improve markedly over the quarter. Early jitters about the standoff in Ukraine and a slowdown in China were slowly supplanted by more encouraging news. Along with faster credit growth and strong debuts for three initial public offerings, Chinese data enthused markets both domestically and in other developing countries. In fixed-income markets, demand for corporate bonds remain strong after falling US Treasury yields saw government issues underperform their corporate counterparts.
Broad US economic data remains supportive, but the weak Q1 2014 GDP print means that GDP growth for 2014 is likely to be in the 2% range. Whilst not a bad outcome, this will be a weaker outcome than many market participants had expected at the start of the year. In Europe, we expect deflation concerns to continue in the short term but the recent policy measures implemented by the ECB, including negative deposit rates, should go some way to addressing investors’ fears on this issue. Valuation wise, we continue to see better value in equities than bonds, but it is very important that equities deliver some earnings growth this year, given that earnings growth has lagged share price growth in recent years. In fixed income, we continue to view core government markets as unattractive and continue to prefer corporate credit, but we expect only modest returns from the latter asset class this year, given the strong performance seen in credit markets in both 2012 and 2013.
STANLIB Global Balanced Cautious Fund - 6 months to 30 June 2014 (USD)
Portfolio Return (%)STANLIB Global Balanced Cautious Fund 3.78%
Benchmark (40% Barclays Capital Global Aggregate Bond Index, 32% JPM Global Cash (1m), 20% MSCI AC World, 8% UBS Global Real Estate Investors Index)
5.55%
The assets in this class fund are managed solely by Threadneedle Asset Management Limited who is the appointed sub-investment manager.
The commentary on this Class Fund has been provided by the sub-investment manager, Threadneedle Asset Management Limited, and has been reviewed by STANLIB Asset Management Limited, the Investment Manager.
The portfolio underperformed its benchmark and this can be attributed to being underweight global equities in the first quarter.
Global equities performed strongly in the second quarter. In the US, the S&P 500 hit record highs, as dovish comments on interest rates outweighed concerns over mixed economic data. After early hesitations, Japan was the strongest major market in local-currency terms. In Europe, the ongoing strife in Ukraine and the recent outbreak of hostilities in Iraq weighed on market sentiment. However, after weeks of hints, the European Central Bank unveiled a package of monetary policies aimed at staving off deflation and invigorating European economies. Emerging markets saw their fortunes improve markedly over the quarter. Early jitters about the standoff in Ukraine and a slowdown in China were slowly supplanted by more encouraging news. Along with faster credit growth and strong debuts for three initial public offerings, Chinese data enthused markets both domestically and in other developing countries. In fixed-income markets, demand for corporate bonds remain strong after falling US Treasury yields saw government issues underperform their corporate counterparts.
Broad US economic data remains supportive, but the weak Q1 2014 GDP print means that GDP growth for 2014 is likely to be in the 2% range. Whilst not a bad outcome, this will be a weaker outcome than many market participants had expected at the start of the year. In Europe, we expect deflation concerns to continue in the short term but the recent policy measures implemented by the ECB, including negative deposit rates, should go some way to addressing investors’ fears on this issue. Valuation wise, we continue to see better value in equities than bonds, but it is very important that equities deliver some earnings growth this year, given that earnings growth has lagged share price growth in recent years.In fixed income, we continue to view core government markets as unattractive and continue to prefer corporate credit, but we expect only modest returns from the latter asset class this year, given the strong performance seen in credit markets in both 2012 and 2013.
STANLIB Asset Management Limited31 July 2014

9
The
note
s on
pag
es 16
to 6
3 fo
rm a
n in
tegr
al p
art o
f the
fina
ncia
l sta
tem
ents
.
STAN
LIB
Fund
s Lim
ited
Stat
emen
ts o
f Tot
al R
etur
n
For t
he p
erio
d 1 J
anua
ry 2
014
to 3
0 Ju
ne 2
014
(Com
para
tives
are
for t
he p
erio
d 1 J
anua
ry 2
013
to 3
0 Ju
ne 2
013)
Glo
bal P
rope
rty
Fund
STA
NLI
B M
ulti
-Man
ager
Glo
bal
Bond
Fun
dST
AN
LIB
Mul
ti-M
anag
er G
loba
l Eq
uity
Fun
dH
igh
Alp
ha G
loba
l Equ
ity
Fund
30 J
une
2014
30 J
une
2013
30 J
une
2014
30 J
une
2013
30 J
une
2014
30 J
une
2013
30 J
une
2014
30 J
une
2013
Not
esU
SDU
SDU
SDU
SDU
SDU
SDU
SDU
SDIn
com
eN
et c
apita
l gai
ns/(
loss
es)
312
,197,
822
-2,6
14,3
2810
,615
,864
-23,
644,
148
108,
404,
752
84,5
82,2
06
25,9
47,2
2154
,332
,797
Reve
nue
41,
935,
664
1,92
4,0
113,
508,
058
5,12
3,69
835
,568
,274
28,8
18,8
5711
,20
4,57
28,
793,
338
Expe
nses
5-3
38,2
26-3
20,15
2-1
,065
,818
-1,7
20,6
92-8
,973
,463
-8,11
7,77
9-3
,392
,176
-2,7
46,0
20
Fina
nce
cost
s: In
tere
st-7
95–
-307
–-2
6–
-73
–
Net
reve
nue
for t
he p
erio
d be
fore
taxa
tion
1,59
6,64
31,6
03,
859
2,44
1,93
33,
403,
00
626
,594
,785
20,7
01,0
787,
812,
323
6,0
47,3
18
Taxa
tion
6-4
22,3
51-3
73,2
67-6
5,0
05
-416
,833
-6,5
26,8
90-5
,791
,811
-1,9
73,7
21-1
,80
4,51
2
Net
reve
nue
for t
he p
erio
d af
ter t
axat
ion
1,174
,292
1,23
0,5
922,
376,
928
2,98
6,17
320
,067
,895
14,9
09,
267
5,83
8,60
24,
242,
806
Cha
nge
in n
et a
sset
s att
ribut
able
to S
hare
hold
ers f
rom
in
vest
ing
activ
ities
13,3
72,11
4-1
,383
,736
12,9
92,7
92-2
0,6
57,9
7512
8,47
2,64
799
,491
,473
31,7
85,8
2358
,575
,60
3
STA
NLI
B G
loba
l Bon
d Fu
ndST
AN
LIB
Glo
bal E
mer
ging
M
arke
ts F
und
STA
NLI
B G
loba
l Bal
ance
d Fu
nd*
STA
NLI
B G
loba
l Bal
ance
d C
auti
ous F
und*
30 J
une
2014
30 J
une
2013
30 J
une
2014
30 J
une
2013
30 J
une
2014
30 J
une
2013
30 J
une
2014
30 J
une
2013
Not
esU
SDU
SDU
SDU
SDU
SDU
SDU
SDU
SDIn
com
eN
et c
apita
l gai
ns/(
loss
es)
36,
047
,023
-3,5
25,0
107,
627,
494
-5,9
45,7
03
4,43
8,10
8–
1,28
5,81
9–
Reve
nue
42,
070
,583
981,7
9389
7,73
11,
357,
836
1,37
4,34
6–
321,6
67–
Expe
nses
5-5
60,4
63-3
28,3
28-4
04,
392
-345
,212
-377
,987
–-1
69,12
5–
Fina
nce
cost
s: In
tere
st–
–-9
–-2
,779
–-3
44–
Net
reve
nue
for t
he p
erio
d be
fore
taxa
tion
1,51
0,12
065
3,46
549
3,33
01,0
12,6
2499
3,58
0–
152,
198
–
Taxa
tion
6-1
22,6
57-1
09,
115
-122
,418
-147
,337
-171
,633
–-4
1,178
–
Net
reve
nue
for t
he p
erio
d af
ter t
axat
ion
1,38
7,46
354
4,35
037
0,9
1286
5,28
782
1,94
7–
111,0
20–
Cha
nge
in n
et a
sset
s att
ribut
able
to S
hare
hold
ers f
rom
in
vest
ing
activ
ities
7,43
4,48
6-2
,980
,660
7,99
8,40
6-5
,080
,416
5,26
0,0
55–
1,39
6,83
9–
* Cla
ss F
und
laun
ched
on
1 Jul
y 20
13

10
The
note
s on
pag
es 16
to 6
3 fo
rm a
n in
tegr
al p
art o
f the
fina
ncia
l sta
tem
ents
.
STAN
LIB
Fund
s Lim
ited
Stat
emen
ts o
f Tot
al R
etur
n (c
ontin
ued)
For t
he p
erio
d 1 J
anua
ry 2
014
to 3
0 Ju
ne 2
014
(Com
para
tives
are
for t
he p
erio
d 1 J
anua
ry 2
013
to 3
0 Ju
ne 2
013)
Agg
rega
ted
Fund
30 J
une
2014
30 J
une
2013
Not
esU
SDU
SDIn
com
eN
et c
apita
l gai
ns3
176,
564,
103
103,
185,
814
Reve
nue
456
,880
,895
46,9
99,5
33
Expe
nses
5-1
5,28
1,650
-13,
578,
183
Fina
nce
cost
s: In
tere
st-4
,333
–
Net
reve
nue
for t
he p
erio
d be
fore
taxa
tion
41,5
94,9
1233
,421
,350
Taxa
tion
6-9
,445
,853
-8,6
42,8
74
Net
reve
nue
for t
he p
erio
d af
ter t
axat
ion
32,14
9,0
5924
,778
,476
Cha
nge
in n
et a
sset
s att
ribut
able
to S
hare
hold
ers f
rom
in
vest
ing
activ
ities
208,
713,
162
127,
964,
290

11
The
note
s on
pag
es 16
to 6
3 fo
rm a
n in
tegr
al p
art o
f the
fina
ncia
l sta
tem
ents
.
STAN
LIB
Fund
s Lim
ited
Stat
emen
ts o
f Cha
nges
in S
hare
hold
ers’
Net
Ass
ets
For t
he p
erio
d 1 J
anua
ry 2
014
to 3
0 Ju
ne 2
014
(Com
para
tives
are
for t
he p
erio
d 1 J
anua
ry 2
013
to 3
0 Ju
ne 2
013)
Glo
bal P
rope
rty
Fund
STA
NLI
B M
ulti
-Man
ager
Glo
bal
Bond
Fun
dST
AN
LIB
Mul
ti-M
anag
er G
loba
l Eq
uity
Fun
dH
igh
Alp
ha G
loba
l Equ
ity
Fund
30 J
une
2014
30 J
une
2013
30 J
une
2014
30 J
une
2013
30 J
une
2014
30 J
une
2013
30 J
une
2014
30 J
une
2013
USD
USD
USD
USD
USD
USD
USD
USD
Net
ass
ets a
t the
sta
rt o
f the
per
iod
102,
795,
842
79,0
84,5
4139
1,472
,872
534,
143,
620
2,0
41,6
79,0
671,4
84,7
45,0
5293
9,13
8,88
968
9,10
0,7
54
Am
ount
s rec
eiva
ble
on is
sue
of s
hare
s4,
115,
044
44,6
99,7
7412
,087
,528
48,8
14,5
9817
2,0
94,2
6364
9,99
5,86
692
,20
8,25
794
,042
,436
Am
ount
s pay
able
on
rede
mpt
ion
of s
hare
s-1
7,16
0,9
78-1
9,43
6,40
9-1
59,9
07,3
17-2
43,5
29,4
74-9
8,16
7,48
4-3
72,8
42,8
78-5
0,2
81,2
71-3
0,9
13,5
62
Cha
nge
in n
et a
sset
s att
ribut
able
to S
hare
hold
ers f
rom
in
vest
ing
activ
ities
13,3
72,11
4-1
,383
,736
12,9
92,7
92-2
0,6
57,9
7512
8,47
2,64
799
,491
,473
31,7
85,8
2358
,575
,60
3
Net
ass
ets a
t the
end
of t
he p
erio
d10
3,12
2,0
2210
2,96
4,17
025
6,64
5,87
531
8,77
0,7
692,
244,
078,
493
1,86
1,38
9,51
31,0
12,8
51,6
9881
0,8
05,
231
STA
NLI
B G
loba
l Bon
d Fu
ndST
AN
LIB
Glo
bal E
mer
ging
M
arke
ts F
und
STA
NLI
B G
loba
l Bal
ance
d Fu
nd*
STA
NLI
B G
loba
l Bal
ance
d C
auti
ous F
und*
30 J
une
2014
30 J
une
2013
30 J
une
2014
30 J
une
2013
30 J
une
2014
30 J
une
2013
30 J
une
2014
30 J
une
2013
USD
USD
USD
USD
USD
USD
USD
USD
Net
ass
ets a
t the
sta
rt o
f the
per
iod
156,
854,
503
81,8
36,6
7995
,852
,388
103,
348,
932
65,3
09,
960
–18
,80
9,99
9–
Am
ount
s rec
eiva
ble
on is
sue
of s
hare
s4,
351,6
614,
276,
968
15,4
98,8
708,
679,
706
54,4
17,0
49–
26,9
24,4
88–
Am
ount
s pay
able
on
rede
mpt
ion
of s
hare
s-3
7,21
0,8
31-9
,594
,270
-660
,00
1-1
2,34
7,18
8–
–-1
,60
3,0
93–
Cha
nge
in n
et a
sset
s att
ribut
able
to S
hare
hold
ers f
rom
in
vest
ing
activ
ities
7,43
4,48
6-2
,980
,660
7,99
8,40
6-5
,080
,416
5,26
0,0
55–
1,39
6,83
9–
Net
ass
ets a
t the
end
of t
he p
erio
d13
1,429
,819
73,5
38,7
1711
8,68
9,66
394
,60
1,034
124,
987,
064
–45
,528
,233
–
* Cla
ss F
unds
laun
ched
on
1 Jul
y 20
13.

12
The
note
s on
pag
es 16
to 6
3 fo
rm a
n in
tegr
al p
art o
f the
fina
ncia
l sta
tem
ents
.
STAN
LIB
Fund
s Lim
ited
Stat
emen
ts o
f Cha
nges
in S
hare
hold
ers’
Net
Ass
ets (
cont
inue
d)
For t
he p
erio
d 1 J
anua
ry 2
014
to 3
0 Ju
ne 2
014
(Com
para
tives
are
for t
he p
erio
d 1 J
anua
ry 2
013
to 3
0 Ju
ne 2
013)
Agg
rega
ted
Fund
30 J
une
2014
30 J
une
2013
USD
USD
Net
ass
ets a
t the
sta
rt o
f the
per
iod
3,81
1,91
3,52
02,
927,
259,
578
Am
ount
s rec
eiva
ble
on is
sue
of s
hare
s38
1,697
,160
850
,50
9,34
8
Am
ount
s pay
able
on
rede
mpt
ion
of s
hare
s-3
64,9
90,9
75-6
88,6
63,7
82
Cha
nge
in n
et a
sset
s att
ribut
able
to S
hare
hold
ers f
rom
in
vest
ing
activ
ities
208,
713,
162
127,
964,
290
Net
ass
ets a
t the
end
of t
he p
erio
d4,
037
,332
,867
3,26
2,0
69,4
34

13
The
note
s on
pag
es 16
to 6
3 fo
rm a
n in
tegr
al p
art o
f the
fina
ncia
l sta
tem
ents
.
STAN
LIB
Fund
s Lim
ited
Bala
nce
Shee
t
As a
t 30
June
201
4 (C
ompa
rativ
es 3
1 Dec
embe
r 201
3)
Glo
bal P
rope
rty
Fund
STA
NLI
B M
ulti
-Man
ager
Glo
bal
Bond
Fun
dST
AN
LIB
Mul
ti-M
anag
er G
loba
l Eq
uity
Fun
dH
igh
Alp
ha G
loba
l Equ
ity
Fund
30 J
une
2014
31 D
ecem
ber 2
013
30 J
une
2014
31 D
ecem
ber 2
013
30 J
une
2014
31 D
ecem
ber 2
013
30 J
une
2014
31 D
ecem
ber 2
013
Not
esU
SDU
SDU
SDU
SDU
SDU
SDU
SDU
SDA
sset
sIn
vest
men
ts10
0,5
37,4
9710
0,6
01,
225
255,
478,
531
375,
489,
163
2,17
6,27
1,59
41,
974,
113,
664
999,
798,
443
924,
246,
520
Cas
h an
d ba
nk b
alan
ces
2,30
4,24
11,
932,
856
16,7
06,
220
30,3
75,9
8584
,40
8,07
867
,965
,216
9,88
3,33
214
,70
5,58
9
Unr
ealis
ed g
ain
on fo
reig
n cu
rren
cy c
ontr
acts
12–
–30
6,76
972
2,11
513
,120
386
––
Unr
ealis
ed g
ain/
(los
s) o
n fu
ture
s con
trac
ts12
––
21,4
9414
3,13
8–
––
–
Reve
nue
rece
ivab
le36
9,0
5235
8,22
12,
156,
012
3,66
5,49
82,
953,
473
1,99
3,63
952
9,80
484
9,22
5
Am
ount
s due
from
bro
kers
1,650
2,83
252
0,3
904,
277,
767
74,5
71,2
6025
7,91
13,
777,
160
–
Sund
ry d
ebto
rs–
––
–12
,759
––
–
Tota
l ass
ets
103,
212,
440
102,
895,
134
275,
189,
416
414,
673,
666
2,33
8,23
0,28
42,
044
,330
,816
1,01
3,98
8,73
993
9,80
1,33
4
Equi
tyN
on-r
edee
mab
le fo
unde
rs' s
hare
s–
––
–10
010
0–
–
Tota
l equ
ity
––
––
100
100
––
Liab
iliti
esU
nrea
lised
loss
on
fore
ign
curr
ency
con
trac
ts12
2–
326,
280
845,
381
7,21
460
276
–
Am
ount
s due
on
rede
mpt
ions
––
2,68
4,40
8–
17,2
80,3
03
25,3
6621
9,64
4–
Am
ount
s due
to b
roke
rs–
–15
,256
,488
22,0
01,
252
75,19
3,88
21,0
19,8
8222
5,0
86–
Man
agem
ent f
ees p
ayab
le51
,674
54,5
0714
1,678
223,
513
1,52
5,24
21,4
00
,899
574,
609
537,
538
Cus
todi
an a
nd tr
uste
e fe
es p
ayab
le2,
568
2,67
13,
887
5,20
113
,364
12,7
118,
111
7,92
4
Sub-
Cus
todi
an fe
es p
ayab
le9,
107
12,0
9954
,80
217
,40
310
7,39
414
4,56
061
,913
62,8
69
Dire
ctor
s fee
s pay
able
10,3
179,
768
16,9
4316
,394
16,8
1116
,263
12,17
311
,624
Aud
it fe
es p
ayab
le6,
571
12,0
436,
784
15,4
907,
102
16,14
87,
00
411
,796
Oth
er c
redi
tors
and
acc
rued
fees
10,17
98,
204
52,2
7176
,160
379
15,7
6028
,225
30,6
94
Tota
l lia
bilit
ies
90,4
1899
,292
18,5
43,5
4123
,20
0,79
494
,151,
691
2,65
1,64
91,1
37,0
4166
2,44
5N
et a
sset
s att
ribu
tabl
e to
Sha
reho
lder
s10
3,12
2,0
2210
2,79
5,84
225
6,64
5,87
539
1,472
,872
2,24
4,07
8,49
32,
041
,679
,067
1,01
2,85
1,69
893
9,13
8,88
9N
et a
sset
val
ue p
er s
hare
2,14
9.67
1,868
.35
2,0
88.2
71,9
90.2
92,
378.
702,
243.
601,1
22.5
41,0
87.8
7

14
The
note
s on
pag
es 16
to 6
3 fo
rm a
n in
tegr
al p
art o
f the
fina
ncia
l sta
tem
ents
.
STAN
LIB
Fund
s Lim
ited
Bala
nce
Shee
t (co
ntin
ued)
As a
t 30
June
201
4 (C
ompa
rativ
es 3
1 Dec
embe
r 201
3)
STA
NLI
B G
loba
l Bon
d Fu
ndST
AN
LIB
Glo
bal E
mer
ging
M
arke
ts F
und
STA
NLI
B G
loba
l Bal
ance
d Fu
ndST
AN
LIB
Glo
bal B
alan
ced
Cau
tiou
s Fun
d30
Jun
e 20
1431
Dec
embe
r 201
330
Jun
e 20
1431
Dec
embe
r 201
330
Jun
e 20
1431
Dec
embe
r 201
330
Jun
e 20
1431
Dec
embe
r 201
3
Not
esU
SDU
SDU
SDU
SDU
SDU
SDU
SDU
SDA
sset
sIn
vest
men
ts12
6,75
1,191
150
,773
,668
114,
752,
647
92,13
0,0
9911
1,94
5,22
554
,995
,365
35,6
52,8
1312
,262
,661
Cas
h an
d ba
nk b
alan
ces
4,64
3,52
14,
202,
00
23,
580
,378
4,95
4,96
712
,565
,413
11,18
9,60
410
,622
,074
6,80
2,29
9
Unr
ealis
ed g
ain
on fo
reig
n cu
rren
cy c
ontr
acts
1218
5,17
892
9,81
61
–97
,822
44,2
09
94,4
0741
,917
Reve
nue
rece
ivab
le99
8,62
81,1
54,2
7014
8,12
410
2,76
130
0,3
3414
2,29
813
0,7
2051
,599
Am
ount
s due
from
bro
kers
–49
9,44
755
9,95
41,
292,
244
599,
508
–19
6,0
37–
Sund
ry d
ebto
rs–
–30
,180
41,0
4027
7,38
444
,563
33,12
937
,270
Tota
l ass
ets
132,
578,
518
157,
559,
203
119,
071,
284
98,5
21,11
112
5,78
5,68
666
,416
,039
46,7
29,18
019
,195,
746
Liab
iliti
esU
nrea
lised
loss
on
fore
ign
curr
ency
con
trac
ts12
314,
297
570
,30
6–
236
127,
265
116,
961
127,
386
84,11
9
Am
ount
s due
on
rede
mpt
ions
160
,00
0–
––
––
––
Am
ount
s due
to b
roke
rs56
4,88
2–
290
,237
2,58
1,92
259
7,44
694
4,71
71,0
40,9
4628
4,32
1
Man
agem
ent f
ees p
ayab
le83
,321
103,
292
59,8
1845
,70
062
,948
29,3
1023
,054
9,32
9
Cus
todi
an a
nd tr
uste
e fe
es p
ayab
le2,
818
3,14
02,
704
2,35
12,
756
1,656
1,35
455
3
Sub-
Cus
todi
an fe
es p
ayab
le1,
328
2,26
512
,434
18,9
86–
––
–
Dire
ctor
s fee
s pay
able
9,46
18,
912
8,98
08,
432
1,96
52,
116
1,96
52,
116
Aud
it fe
es p
ayab
le6,
769
12,2
426,
190
10,12
86,
242
2,57
66,
242
2,57
6
Oth
er c
redi
tors
and
acc
rued
fees
5,82
34,
543
1,25
896
8–
8,74
3–
2,73
3
Tota
l lia
bilit
ies
1,148
,699
704,
700
381,
621
2,66
8,72
379
8,62
21,1
06,
079
1,20
0,94
738
5,74
7N
et a
sset
s att
ribu
tabl
e to
Sha
reho
lder
s13
1,429
,819
156,
854,
503
118,
689,
663
95,8
52,3
8812
4,98
7,0
6465
,30
9,96
045
,528
,233
18,8
09,
999
Net
ass
et v
alue
per
sha
re1,4
65.3
31,
382.
301,1
25.14
1,054
.38
1,121
.01
1,068
.29
1,067
.06
1,025
.91

15
The
note
s on
pag
es 16
to 6
3 fo
rm a
n in
tegr
al p
art o
f the
fina
ncia
l sta
tem
ents
.
STAN
LIB
Fund
s Lim
ited
Bala
nce
Shee
t (co
ntin
ued)
As a
t 30
June
201
4 (C
ompa
rativ
es 3
1 Dec
embe
r 201
3)
Agg
rega
ted
Fund
30 J
une
2014
31 D
ecem
ber 2
013
Not
esU
SDU
SDA
sset
sIn
vest
men
ts3,
921,1
87,9
413,
684,
612,
365
Cas
h an
d ba
nk b
alan
ces
144,
713,
257
142,
128,
518
Unr
ealis
ed g
ain
on fo
reig
n cu
rren
cy c
ontr
acts
1269
7,29
71,7
38,4
43
Unr
ealis
ed g
ain/
(los
s) o
n fu
ture
s con
trac
ts12
21,4
9414
3,13
8
Reve
nue
rece
ivab
le7,
586,
147
8,31
7,51
1
Am
ount
s due
from
bro
kers
80,2
25,9
596,
330
,20
1
Sund
ry d
ebto
rs35
3,45
212
2,87
3
Tota
l ass
ets
4,15
4,78
5,54
73,
843,
393,
049
Equi
tyN
on-r
edee
mab
le fo
unde
rs' s
hare
s10
010
0
Tota
l equ
ity
100
100
Liab
iliti
esU
nrea
lised
loss
on
fore
ign
curr
ency
con
trac
ts12
902,
720
1,617
,063
Am
ount
s due
on
rede
mpt
ions
20,3
44,3
5525
,366
Am
ount
s due
to b
roke
rs93
,168,
967
26,8
32,0
94
Man
agem
ent f
ees p
ayab
le2,
522,
344
2,40
4,0
88
Cus
todi
an a
nd tr
uste
e fe
es p
ayab
le37
,562
36,2
07
Sub-
Cus
todi
an fe
es p
ayab
le24
6,97
825
8,18
2
Dire
ctor
s fee
s pay
able
78,6
1575
,625
Aud
it fe
es p
ayab
le52
,90
482
,999
Oth
er c
redi
tors
and
acc
rued
fees
98,13
514
7,80
5To
tal l
iabi
litie
s11
7,45
2,58
031
,479
,429
Net
ass
ets
attr
ibut
able
to S
hare
hold
ers
4,0
37,3
32,8
673,
811,9
13,5
20
The
finan
cial
sta
tem
ents
wer
e ap
prov
ed b
y th
e B
oard
on
20 O
ctob
er 2
014
and
sig
ned
on it
s be
half
by:
Dir
ecto
r

STANLIB Funds Limited
16
Notes to the Financial Statements
1. Incorporation
STANLIB Funds Limited (the “Company”) was incorporated in Jersey on 18 March 1996.
The Company is an open-ended investment company in that it may issue and redeem participating shares. The Company is listed on the Irish Stock Exchange.
As at 30 June 2014, participating shares were offered in the Company as shares of the Global Property Fund, STANLIB Multi-Manager Global Bond Fund, STANLIB Multi-Manager Global Equity Fund, High Alpha Global Equity Fund, STANLIB Global Bond Fund, STANLIB Global Emerging Markets Fund, STANLIB Global Balanced Fund and STANLIB Global Balanced Cautious Fund.
2. Accounting policies
Basis of accounting
The financial statements have been prepared on a going concern basis under the historical cost convention, as modified by the fair valuation of investments, financial assets and financial liabilities, and in accordance with United Kingdom Accounting Standards and with the Statement of Recommended Practice (“SORP”) for financial statements of Authorised Funds issued by the Investment Management Association (“IMA”) in October 2010.
The principal accounting policies applied in the preparation of these financial statements are set out below. These policies have been consistently applied to all periods presented unless otherwise stated in the following text.
Investments
Investments listed on a recognised stock exchange or any other organised market are valued at bid price, or in the event that there are several such markets, on the basis of the last available bid price on the main market for the relevant investment on the balance sheet date. If the last available bid price for a given investment does not truly reflect its value, then the investment is valued on the basis of the probable sale price which the Company’s Board of Directors deems prudent to assume. No such estimates have been included in the financial statements as at 30 June 2014 and 31 December 2013.
Purchases and sales of investments are recognised on trade date – the date on which the Company commits to purchase or sell the asset. Investments are initially recognised at fair value, and transaction costs for all financial assets and financial liabilities carried at fair value through profit or loss are expensed as incurred. Investments are derecognised when the rights to receive cash flows from the investments have expired or the Company has transferred substantially all risks and rewards of ownership.
Realised and unrealised gains and losses arising from changes in the fair value of the “Investments category” are included in the Statement of Total Return in the period in which they arise.
Cash and Cash Equivalents
Cash is valued at cost, which approximates fair value.
Cash is held in accounts at The Bank of New York Mellon SA/NV which allows the Class Funds instant access to their accounts.
Derivative financial instruments
Derivatives are initially recognised at cost on the date a derivative contract is entered into and are subsequently re-measured at their fair value. Changes in fair value are recognised immediately in the Statement of Total Return.
Income
Dividends on equities are accounted for on an ex-dividend basis. Dividends are shown gross of withholding tax. Bank and deposit interest are accounted for on an accrual basis. Interest from debt securities is recognised as revenue using the effective interest method by reference to the purchase price.
Expenses
The Company is responsible for the payment of management, audit, director, custodian and Sub-Custodian fees which are accrued for on each valuation point, and the payment of other expenses as detailed in the Company’s prospectus. All expenses are accounted for on an accruals basis.
Share issues and redemptions
Participating shares in the Company may be issued and redeemed at prices calculated at each valuation date in accordance with the Articles of Association and Prospectus.
Foreign currency translation
The functional currency and reporting currency of the Company is USD.
Assets and liabilities in all other currencies different from the functional currency, are translated based on the exchange rates in effect at the date of the financial statements. Income and expenses in all other currencies different from the functional currency are translated based on the exchange rates in effect at the date of the transaction. Foreign currency translation gains or losses are credited or charged to the Statement of Total Return.
Dividend policy
Dividends may be declared on individual Share Classes from time to time provided sufficient net income is available in the proportions attributable to that Share Class in the relevant Class Fund. The Fund Rules for each Share Class may also specify whether or not dividends may be paid.
Cash flow statement
The Company is exempt from the requirement to prepare a cash flow statement, as it is an open-ended investment fund, which meets the conditions for exemption stated under Financial Reporting Standards (“FRS”) 1, “Cash Flow Statements”.

STANLIB Funds Limited
Notes to the Financial Statements (continued)
17
Total expense ratio
Total expense ratio (“TER”) is calculated and disclosed as per the guidelines issued by the IMA. The ratio expresses the sum of all costs charged on an ongoing basis to each Class Fund’s assets (operating expenses) taken retrospectively as a percentage of each Class Fund’s average net assets. Operating expenses exclude transaction costs and commissions in connection with transactions on the Class Fund’s portfolio.
Swing Pricing
To the extent that the Directors consider that it is in the best interest of the Company, given the prevailing market conditions and the level of certain subscriptions or redemptions requested by Shareholders in relation to the size of any Class Fund on any business day, an adjustment, as determined by the Directors at their discretion, may be reflected in the net asset value per share of the Class Funds for such sum as may represent the percentage estimate of costs and expenses which may be incurred by the relevant Class Fund under such conditions.
The adjustment, where applied, is included within the dealing price available to Shareholders and is disclosed separately under “Swing pricing” in the Statement of Changes in Net Assets Attributable to Holders of Redeemable Participating Shares in accordance with UK SORP.
Related party disclosures
In compliance with FRS 8, “Related party disclosures” all related party transactions and balances are disclosed in the financial statements. All Related Parties are listed in the Management and Administration Section of the report.

18
The
note
s on
pag
es 16
to 6
3 fo
rm a
n in
tegr
al p
art o
f the
fina
ncia
l sta
tem
ents
.
STAN
LIB
Fund
s Lim
ited
Not
es to
the
Fina
ncia
l Sta
tem
ents
(con
tinue
d)
3.
Net
cap
ital
mov
emen
t
Glo
bal P
rope
rty
Fund
STA
NLI
B M
ulti
-Man
ager
Glo
bal
Bond
Fun
dST
AN
LIB
Mul
ti-M
anag
er G
loba
l Eq
uity
Fun
dH
igh
Alp
ha G
loba
l Equ
ity
Fund
30 J
une
2014
30 J
une
2013
30 J
une
2014
30 J
une
2013
30 J
une
2014
30 J
une
2013
30 J
une
2014
30 J
une
2013
USD
USD
USD
USD
USD
USD
USD
USD
Non
-der
ivat
ive
secu
riti
es:
Net
real
ised
(los
s)/g
ain
on in
vest
men
ts-6
19,0
102,
784,
896
1,83
7,30
24,
520
,421
56,4
31,7
1096
,366
,80
359
,616
,814
23,3
60,5
28
Net
mov
emen
t in
unre
alis
ed g
ain
or (l
oss)
on
inve
stm
ents
12,8
25,3
76-5
,255
,099
9,91
1,36
9-2
7,57
6,40
352
,168,
936
-10
,90
2,14
2-3
3,74
9,46
731
,093
,654
12,2
06,
366
-2,4
70,2
03
11,7
48,6
71-2
3,0
55,9
8210
8,60
0,6
4685
,464
,661
25,8
67,3
4754
,454
,182
Der
ivat
ive
secu
riti
es:
Net
real
ised
(los
s)/g
ain
on fo
reig
n cu
rren
cy c
ontr
acts
/fut
ure
cont
ract
s-8
,544
-151
,751
-1,0
80,7
90-2
,439
,879
-194
,517
-812
,654
79,8
74-1
28,5
88
Net
mov
emen
t in
unre
alis
ed g
ain
or (l
oss)
on
fore
ign
exch
ange
co
ntra
cts/
futu
re c
ontr
acts
–7,
626
-52,
017
1,85
1,713
-1,3
77-6
9,80
1–
7,20
3
Net
cap
ital
gai
n/(l
oss)
12,19
7,82
2-2
,614
,328
10,6
15,8
64-2
3,64
4,14
810
8,40
4,75
284
,582
,20
625
,947
,221
54,3
32,7
97
STA
NLI
B G
loba
l Bon
d Fu
ndST
AN
LIB
Glo
bal E
mer
ging
M
arke
ts F
und
STA
NLI
B G
loba
l Bal
ance
d Fu
nd*
STA
NLI
B G
loba
l Bal
ance
d C
auti
ous F
und*
30 J
une
2014
30 J
une
2013
30 J
une
2014
30 J
une
2013
30 J
une
2014
30 J
une
2013
30 J
une
2014
30 J
une
2013
USD
USD
USD
USD
USD
USD
USD
USD
Non
-der
ivat
ive
secu
riti
es:
Net
real
ised
(los
s)/g
ain
on in
vest
men
ts-2
67,3
2994
8,68
0-2
8,21
0-1
,320
,981
1,670
,172
–36
7,16
1–
Net
mov
emen
t in
unre
alis
ed g
ain
or (l
oss)
on
inve
stm
ents
7,0
18,7
93-5
,113,
257
7,63
9,59
3-4
,60
6,80
42,
573,
052
–81
6,16
1–
6,75
1,464
-4,16
4,57
77,
611,
383
-5,9
27,7
854,
243,
224
–1,1
83,3
22–
Der
ivat
ive
secu
riti
es:
Net
real
ised
(los
s)/g
ain
on fo
reig
n cu
rren
cy c
ontr
acts
/fut
ure
cont
ract
s-2
01,6
29-4
75,7
4915
,875
-23,
503
151,6
86–
93,3
02
–
Net
mov
emen
t in
unre
alis
ed (l
oss)
or g
ain
on fo
reig
n ex
chan
ge
cont
ract
s/fu
ture
con
trac
ts-5
02,
812
1,115
,316
236
5,58
543
,198
–9,
195
–
Net
cap
ital
gai
n/(l
oss)
6,0
47,0
23-3
,525
,010
7,62
7,49
4-5
,945
,70
34,
438,
108
–1,
285,
819
–
* Cla
ss F
und
laun
ched
on
1 Jul
y 20
13.

19
The
note
s on
pag
es 16
to 6
3 fo
rm a
n in
tegr
al p
art o
f the
fina
ncia
l sta
tem
ents
.
STAN
LIB
Fund
s Lim
ited
Not
es to
the
Fina
ncia
l Sta
tem
ents
(con
tinue
d)
3.
Net
cap
ital
mov
emen
t (co
ntin
ued)
Agg
rega
ted
Fund
30 J
une
2014
30 J
une
2013
USD
USD
Non
-der
ivat
ive
secu
riti
es:
Net
real
ised
gai
n on
inve
stm
ents
119,
00
8,61
012
6,66
0,3
47
Net
mov
emen
t in
unre
alis
ed g
ain
or (l
oss)
on
inve
stm
ents
59,2
03,
813
-22,
360
,051
178,
212,
423
104,
300
,296
Der
ivat
ive
secu
riti
es:
Net
real
ised
loss
on
fore
ign
curr
ency
con
trac
ts/f
utur
e co
ntra
cts
-1,14
4,74
3-4
,032
,124
Net
mov
emen
t in
unre
alis
ed (l
oss)
or g
ain
on fo
reig
n ex
chan
ge
cont
ract
s/fu
ture
con
trac
ts-5
03,
577
2,91
7,64
2
Net
cap
ital
gai
n17
6,56
4,10
310
3,18
5,81
4
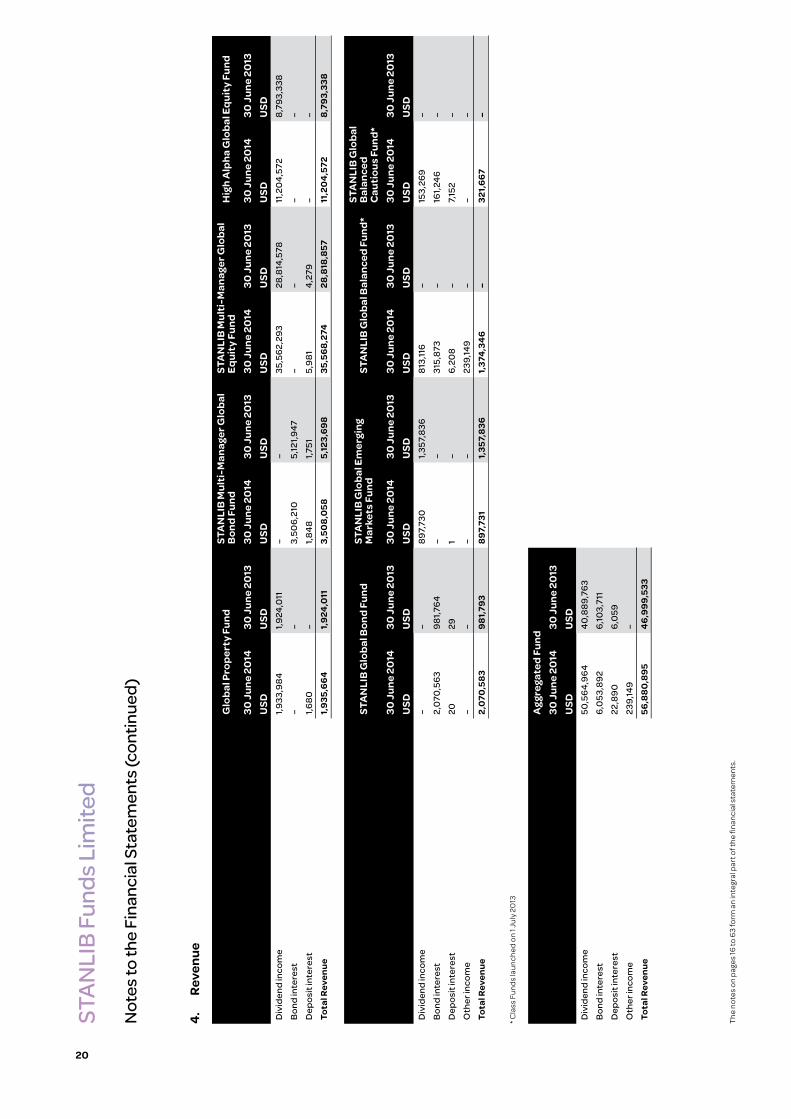
20
The
note
s on
pag
es 16
to 6
3 fo
rm a
n in
tegr
al p
art o
f the
fina
ncia
l sta
tem
ents
.
STAN
LIB
Fund
s Lim
ited
Not
es to
the
Fina
ncia
l Sta
tem
ents
(con
tinue
d)
4.
Reve
nue
Glo
bal P
rope
rty
Fund
STA
NLI
B M
ulti
-Man
ager
Glo
bal
Bond
Fun
dST
AN
LIB
Mul
ti-M
anag
er G
loba
l Eq
uity
Fun
dH
igh
Alp
ha G
loba
l Equ
ity
Fund
30 J
une
2014
30 J
une
2013
30 J
une
2014
30 J
une
2013
30 J
une
2014
30 J
une
2013
30 J
une
2014
30 J
une
2013
USD
USD
USD
USD
USD
USD
USD
USD
Div
iden
d in
com
e1,
933,
984
1,92
4,0
11–
–35
,562
,293
28,8
14,5
7811
,20
4,57
28,
793,
338
Bon
d in
tere
st–
–3,
506,
210
5,12
1,94
7–
––
–
Dep
osit
inte
rest
1,680
–1,
848
1,751
5,98
14,
279
––
Tota
l Rev
enue
1,93
5,66
41,
924,
011
3,50
8,0
585,
123,
698
35,5
68,2
7428
,818
,857
11,2
04,
572
8,79
3,33
8
STA
NLI
B G
loba
l Bon
d Fu
ndST
AN
LIB
Glo
bal E
mer
ging
M
arke
ts F
und
STA
NLI
B G
loba
l Bal
ance
d Fu
nd*
STA
NLI
B G
loba
l Ba
lanc
ed
Cau
tiou
s Fun
d*30
Jun
e 20
1430
Jun
e 20
1330
Jun
e 20
1430
Jun
e 20
1330
Jun
e 20
1430
Jun
e 20
1330
Jun
e 20
1430
Jun
e 20
13U
SDU
SDU
SDU
SDU
SDU
SDU
SDU
SDD
ivid
end
inco
me
––
897,
730
1,35
7,83
681
3,11
6–
153,
269
–
Bon
d in
tere
st2,
070
,563
981,7
64–
–31
5,87
3–
161,
246
–
Dep
osit
inte
rest
2029
1–
6,20
8–
7,15
2–
Oth
er in
com
e–
––
–23
9,14
9–
––
Tota
l Rev
enue
2,07
0,58
398
1,793
897,
731
1,35
7,83
61,
374,
346
–32
1,66
7–
* Cla
ss F
unds
laun
ched
on
1 Jul
y 20
13
Agg
rega
ted
Fund
30 J
une
2014
30 J
une
2013
USD
USD
Div
iden
d in
com
e50
,564
,964
40,8
89,7
63
Bon
d in
tere
st6,
053
,892
6,10
3,71
1
Dep
osit
inte
rest
22,8
906,
059
Oth
er in
com
e23
9,14
9–
Tota
l Rev
enue
56,8
80,8
9546
,999
,533

21
The
note
s on
pag
es 16
to 6
3 fo
rm a
n in
tegr
al p
art o
f the
fina
ncia
l sta
tem
ents
.
STAN
LIB
Fund
s Lim
ited
Not
es to
the
Fina
ncia
l Sta
tem
ents
(con
tinue
d)
5.
Expe
nses
Glo
bal P
rope
rty
Fund
STA
NLI
B M
ulti
-Man
ager
Glo
bal
Bond
Fun
dST
AN
LIB
Mul
ti-M
anag
er G
loba
l Eq
uity
Fun
dH
igh
Alp
ha
Glo
bal E
quit
y Fu
nd30
Jun
e 20
14
30 J
une
2013
30
Jun
e 20
14
30 J
une
2013
30
Jun
e 20
14
30 J
une
2013
30
Jun
e 20
14
30 J
une
2013
U
SDU
SDU
SDU
SDU
SDU
SDU
SDU
SDM
anag
emen
t fee
s28
9,80
729
2,33
791
2,27
81,
540
,817
8,49
6,74
97,
540
,417
3,27
6,57
72,
560
,829
Cus
todi
an fe
es14
,556
14,9
9924
,00
437
,531
75,4
7684
,434
46,6
4348
,781
Sub-
cust
odia
n fe
es15
,580
9,21
710
2,60
010
3,63
336
4,40
035
4,64
447
,150
96,4
33
Dire
ctor
s' fe
es7,
158
1,081
7,15
89,
950
7,15
823
,984
7,15
811
,317
Aud
it fe
es5,
760
915
5,76
08,
422
5,76
068
,826
5,76
09,
575
Oth
er o
pera
ting
expe
nses
5,36
51,6
03
14,0
1820
,339
23,9
2045
,474
8,88
819
,085
Tota
l exp
ense
s33
8,22
632
0,15
21,
065
,818
1,720
,692
8,97
3,46
38,
117,
779
3,39
2,17
62,
746,
020
STA
NLI
B G
loba
l Bon
d Fu
ndST
AN
LIB
Glo
bal E
mer
ging
M
arke
ts F
und
STA
NLI
B G
loba
l Bal
ance
d Fu
nd*
STA
NLI
B G
loba
l Bal
ance
d C
auti
ous F
und*
30 J
une
2014
30
Jun
e 20
13
30 J
une
2014
30
Jun
e 20
13
30 J
une
2014
30
Jun
e 20
13
30 J
une
2014
30
Jun
e 20
13
USD
USD
USD
USD
USD
USD
USD
USD
Man
agem
ent f
ees
499,
935
297,
786
309,
617
298,
131
294,
555
–10
3,70
0–
Cus
todi
an fe
es16
,634
13,2
9414
,881
14,7
4814
,056
–6,
099
–
Sub-
cust
odia
n fe
es26
,030
12,4
5850
,750
15,3
05
46,8
30–
36,7
80–
Dire
ctor
s' fe
es7,
158
1,462
7,15
81,7
956,
458
–6,
458
–
Aud
it fe
es5,
760
1,23
75,
760
1,52
05,
368
–5,
368
–
Oth
er o
pera
ting
expe
nses
4,94
62,
091
16,2
2613
,713
10,7
20–
10,7
20–
Tota
l exp
ense
s56
0,46
332
8,32
840
4,39
234
5,21
237
7,98
7–
169,
125
–
* Cla
ss F
unds
laun
ched
on
1 Jul
y 20
13.

22
The
note
s on
pag
es 16
to 6
3 fo
rm a
n in
tegr
al p
art o
f the
fina
ncia
l sta
tem
ents
.
STAN
LIB
Fund
s Lim
ited
Not
es to
the
Fina
ncia
l Sta
tem
ents
(con
tinue
d)
5.
Expe
nses
(con
tinu
ed)
Agg
rega
ted
Fund
30 J
une
2014
30
Jun
e 20
13
USD
USD
Man
agem
ent f
ees
14,18
3,21
812
,530
,317
Cus
todi
an fe
es21
2,34
921
3,78
7
Sub-
cust
odia
n fe
es69
0,12
059
1,690
Dire
ctor
s' fe
es55
,864
49,5
89
Aud
it fe
es45
,296
90,4
95
Oth
er o
pera
ting
expe
nses
94,8
03
102,
305
Tota
l exp
ense
s15
,281
,650
13,5
78,18
3

STANLIB Funds Limited
Notes to the Financial Statements (continued)
23
6. Taxation
For the purposes of Jersey taxation, the Company falls under Article 123C of the Income Tax (Jersey) Law 1961, as amended, as a Jersey resident company which is neither a “utility company” nor a “financial services company” and as such will be charged Jersey income tax at a rate of 0% on its income (other than on any rental income or property development profits arising in respect of Jersey situs real property or land). The Company will not be subject to tax in Jersey on any capital arising to it.
Under applicable foreign tax laws, withholding taxes may be deducted from interest, dividends and capital gains attributable to the Company, at various rates. The Company pays withholding tax on dividends, which is deducted at source. This is shown separately as a taxation charge in the Statement of Total Return.
Overseas Tax – Withholding Tax on Dividend Income Currency 30 June 2014 30 June 2013Global Property Fund USD 422,351 373,267
STANLIB Multi-Manager Global Bond Fund USD 65,005 416,833
STANLIB Multi-Manager Global Equity Fund USD 6,526,890 5,791,811
High Alpha Global Equity Fund USD 1,973,721 1,804,512
STANLIB Global Bond Fund USD 122,657 109,115
STANLIB Global Emerging Markets Fund USD 122,418 147,337
STANLIB Global Balanced Fund* USD 171,633 –
STANLIB Global Balanced Cautious Fund* USD 41,178 –
* Class Funds launched on 1 July 2013.
7. Share capital
Authorised30 June 2014 31 December 2013USD USD
100 Founders’ Shares of USD 1 each 100 100
5,000,000 Unclassified Shares of USD 1 each 5,000,000 5,000,000
5,000,100 5,000,100
Unclassified Shares
The Articles of Association of the Company provide that the unclassified shares may be issued as participating shares or nominal shares.
Under FRS 25, “Financial Instruments: Disclosure and Presentation”, each class of share capital falls under the definition of ‘non equity’ as participating shares can be redeemed at the direction of the participating shareholders or when the rights of other shareholders are restricted.
Net assets attributable to holders of the redeemable participating shares represent a liability in the Balance Sheet, carried at the redemption amount that would be payable at the balance sheet date if the holder exercised the right to redeem the shares from the Company.
Participating shares may be redeemed either out of the proceeds of the issue of nominal shares, or out of the income of the Class Fund, which would otherwise be available for dividend.
On redemption of participating shares out of the income of the Class Fund, a sum equal to the nominal value of the shares redeemed is transferred to a capital redemption reserve account.
Nominal shares are subscribed and paid for by the Manager and may be converted to participating shares upon the payment of the appropriate premium.
Classes of Shares
The founders’ shares are not redeemable and do not carry any rights to dividends. As at 30 June 2014 and 31 December 2013, 100 founders’ shares were issued and outstanding. The founders’ shares and participating shares are entitled to one vote in respect of each share held. The holder of the nominal shares is entitled to one vote irrespective of the number of shares held. All shares are entitled to participate in the property of the Fund on a winding-up as disclosed in the Prospectus.

STANLIB Funds Limited
Notes to the Financial Statements (continued)
24
Movements in Share Capital and Share Premium
Number of shares at 31 December 2013
Issued during the period
Redeemed during the period
Number of shares at 30 June 2014
Global Property Fund 55,019 1,955 -9,003 47,971
STANLIB Multi-Manager Global Bond Fund 196,691 5,918 -79,710 122,899
STANLIB Multi-Manager Global Equity Fund 909,999 76,602 -43,196 943,405
High Alpha Global Equity Fund - Class A 168,991 18,381 -23,807 163,565
High Alpha Global Equity Fund - Class B 694,290 67,284 -22,857 738,717
STANLIB Global Bond Fund 113,473 3,084 -26,864 89,693
STANLIB Global Emerging Markets Fund 90,909 15,198 -618 105,489
STANLIB Global Balanced Fund* 61,135 50,360 – 111,495
STANLIB Global Balanced Cautious Fund* 18,335 25,881 -1,549 42,667
* Class Funds launched on 1 July 2013
Number of shares at 31 December 2012
Issued during the year
Redeemed during the year
Number of shares at 30 June 2013
Global Property Fund 41,135 31,726 -17,842 55,019
STANLIB Multi-Manager Global Bond Fund 258,448 42,126 -103,883 196,691
STANLIB Multi-Manager Global Equity Fund 801,847 299,502 -191,350 909,999
High Alpha Global Equity Fund - Class A 180,980 39,188 -51,177 168,991
High Alpha Global Equity Fund - Class B 637,147 116,976 -59,833 694,290
STANLIB Global Bond Fund 56,857 75,876 -19,260 113,473
STANLIB Global Emerging Markets Fund 101,093 20,406 -30,590 90,909
STANLIB Global Balanced Fund* – 61,235 -100 61,135
STANLIB Global Balanced Cautious Fund* – 18,435 -100 18,335
* Class Funds launched on 1 July 2013
Swing Pricing
Effective 1 July 2011, a share price adjustment in the form of swing pricing has been introduced.
To the extent that the Directors consider that it is in the best interest of the Company, given the prevailing market conditions and the level of certain subscriptions or redemptions requested by Shareholders in relation to the size of any Class Fund on any business day, an adjustment, as determined by the Directors at their discretion, may be reflected in the net asset value per share of the Class Funds for such sum as may represent the percentage estimate of costs and expenses which may be incurred by the relevant Class Fund under such conditions. For the period ended 30 June 2014, all the Class Funds were subject to such adjustment.
The adjustment, where applied, is included within the dealing price available to Shareholders and is disclosed separately under “Swing Pricing” in the Statement of Changes in Net Assets Attributable to Holders of Redeemable Participating Shares in accordance with UK SORP.
8. Custodian fees
The fees of the Custodian shall be calculated as follows, subject to an overall minimum fee in respect of each Class Fund of US$5,000 per annum (such minimum fee to be waived in respect of cash funds) (the “Minimum Fee”):
i. 0.035% per annum on any and all amounts up to US$50 million of the Net Asset Value of that Class Fund;
ii. 0.025% per annum on any and all amounts above US$50 million of the Net Asset Value of that Class Fund but only up to US$100 million;
iii. 0.010% per annum on any and all amounts above US$100 million of the Net Asset Value of that Class Fund but only up to US$500 million; and
iv. 0.005% per annum on any and all amounts above US$500 million of the Net Asset Value of that Class Fund.
Such fees shall accrue daily and shall be payable to the Custodian by monthly payments in arrears becoming due on the first Business Day of each month in respect of the preceding month.
The Custodian is also entitled to be reimbursed out of the Class Funds for charges and transaction fees levied on it by the Sub-Custodian and other sub-custodians which shall be at rates which have been negotiated on an arm’s length basis or are otherwise on commercial terms.

STANLIB Funds Limited
Notes to the Financial Statements (continued)
25
The total fees charged by the Custodian for the period ended 30 June 2014 and 30 June 2013 are disclosed in note 5.
9. Directors’ fees
Any Director appointed as permanent Chairman is entitled to receive an annual fee of GBP 25,000. All other Directors receive an annual fee of GBP 20,000 with the exception of M Rabe who has waived his entitlement. The Directors may also be paid travelling, hotel and other expenses properly incurred by them in attending and returning from the meetings of the Directors or other meetings or in connection with the business of the Company.
The Directors’ fees charged for the period ended 30 June 2014 and 30 June 2013 are disclosed in note 5.
10. Related party transactions
Management and investment management
STANLIB Fund Managers Jersey Limited (the “Manager”) and STANLIB Asset Management Limited (the “Investment Manager”) are related parties of the Company, as defined by FRS 8. The Manager may receive a maximum annual fee of 2.5% of the average net asset value of each Class Fund of the Company calculated and accrued on each Dealing Day and payable monthly in arrears.
The Manager’s fees have been agreed at the following rates (per annum):
Global Property Fund 0.60%
STANLIB Multi-Manager Global Bond Fund 0.65%
STANLIB Multi-Manager Global Equity Fund 0.80%
High Alpha Global Equity Fund 1% for class A and 0.60% for class B
STANLIB Global Bond Fund 0.75%
STANLIB Global Emerging Markets Fund 0.60%
STANLIB Global Balanced Fund 0.60%
STANLIB Global Balanced Cautious Fund 0.60%
The Manager has delegated the performance of the investment management function in respect of the Company to the Investment Manager. The Manager is responsible for the payment of the fees of the Investment Manager out of the Manager’s fees.
The Manager has delegated the administration function to BNY Mellon Fund Services (Ireland) Limited. The administration fees are paid for out of the Manager’s fees.
The total fees charged by the Manager for the period ended 30 June 2014 and 30 June 2013 are disclosed in note 5.
As at 23 June 2014, Neil Deacon, a Director of STANLIB Funds Limited was appointed Interim Managing Director of STANLIB Funds Managers Jersey Limited.
11. Financial instruments and associated risks
The Class Funds hold a number of financial instruments principally comprising:
Љ Equity shares and fixed income securities which are held in accordance with each Class Fund’s investment objective and policies,
Љ Cash, liquid resources and short-term debtors and creditors that arise directly from its operations, and,
Љ Foreign currency exchange contracts which are used for efficient portfolio management.
Under the Investment Management Agreement dated 21 December 1998, STANLIB Asset Management Limited has delegated the management of each of the Class Funds to the respective managers as disclosed in the Investment Manager’s Report on pages 4 to 8. Policies for managing market, foreign currency, counterparty and liquidity risks are covered by the respective managers’ policies. The Fund Rules are used by the Administrator and the Manager in order to monitor compliance with respect to these risks.
Market price risk
Market price risk arises mainly from uncertainty about future prices of financial instruments held. It represents the potential loss the Class Funds might suffer through holdings in the investment portfolio in the face of price movements. Adherence to investment guidelines and to investment and borrowing powers set out in the Class Fund Rules mitigate the risk of excessive exposure to any particular type of security or issuer.

STANLIB Funds Limited
Notes to the Financial Statements (continued)
26
Sensitivity analysis
The table below summarises the sensitivity of the Class Funds’ net assets attributable to holders of redeemable participating shares to market price movements. It shows the increase/(decrease) in the net assets attributable to holders of redeemable participating shares for the Class Funds’ given a 5% movement in the underlying investment prices at period-end; all other variables remaining constant:
Class Fund 30 June 2014 31 December 2013USD USD
Global Property Fund 5,026,875 5,030,061
STANLIB Multi-Manager Global Bond Fund 12,773,927 18,774,458
STANLIB Multi-Manager Global Equity Fund 108,813,580 98,705,683
High Alpha Global Equity Fund 49,989,922 46,212,326
STANLIB Global Bond Fund 6,337,560 7,538,683
STANLIB Global Emerging Markets Fund 5,737,632 4,606,505
STANLIB Global Balanced Fund 5,597,261 2,749,768
STANLIB Global Balanced Cautious Fund 1,782,641 613,133
Credit risk
Each Class Fund is restricted to investing no more than 20% of its net asset value in any one issuer and to investing in no more than 20% of the total nominal amount of all issued securities of the same class in the invested corporation. Further details are included within the Portfolio Statement. These limits are tested on a daily basis by the Administrator, on a monthly basis by the Manager and confirmation of adherence is received by the Board of Directors on a quarterly basis, in order to demonstrate effective control.
The Class Funds are not exposed to credit risk from the Custodian, Sub-Custodian and banker as all assets of the class funds are maintained in a segregated account, which are designated as client assets and are not co-mingled with any proprietary assets of the Custodian.
The Class Funds that use derivative financial instruments are exposed to credit risk from the counterparty to the contracts. Before transacting with any counterparty, the Investment Manager or its affiliates evaluate both credit-worthiness and reputation by conducting a credit analysis of the party, their business and reputation. The credit risk of approved counterparties is then monitored on an ongoing basis, including periodic reviews of financial statements and interim financial reports as needed.
The following tables analyse the credit quality of the fixed income securities held on the bond class funds at 30 June 2014.
STANLIB Multi-Manager Global Bond Fund
Moody's rating
% of debt securities
Moody's rating
% of debt securities
Aaa 39.61% Baa1 4.85%
Aa1 8.17% Baa2 9.33%
Aa2 1.42% Baa3 3.81%
Aa3 11.67% Ba1 0.46%
A1 1.46% Ba2 0.76%
A2 4.61% Ba3 0.14%
A3 8.18% Caa1 0.27%
AA2 0.59% Caa2 0.04%
B1 0.25% Caa3 0.12%
B2 0.09% Other 4.02%
B3 0.15% 100.00%
STANLIB Global Bond Fund
Moody's rating
% of debt securities
Moody's rating
% of debt securities
Aaa 35.66% Baa2 7.24%
Aa1 8.82% Ba1 1.54%
Aa3 11.01% B1 0.28%
A2 8.46% Caa3 0.13%
A3 18.97% Other 3.75%
Baa1 4.14% 100.00%

STANLIB Funds Limited
Notes to the Financial Statements (continued)
27
STANLIB Global Balanced Fund
Moody's rating
% of debt securities
Moody's rating
% of debt securities
Aaa 31.44% Baa2 13.65%
Aa1 5.16% Baa3 7.55%
Aa2 1.60% Ba1 1.60%
Aa3 6.26% Ba2 2.81%
A1 1.05% Ba3 3.10%
A2 3.01% Other 5.03%
A3 6.77% 100.00%
Baa1 10.97%
STANLIB Global Balanced Cautious Fund
Moody's rating
% of debt securities
Moody's rating
% of debt securities
Aaa 29.45% Baa2 10.00%
Aa1 3.89% Baa3 7.39%
Aa2 0.48% Ba1 1.55%
Aa3 6.89% Ba2 3.14%
A1 1.16% Ba3 3.37%
A2 8.28% Other 4.93%
A3 7.52% 100.00%
Baa1 11.95%
The following tables analyse the credit quality of the fixed income securities held on the bond class funds at 31 December 2013.
STANLIB Multi-Manager Global Bond Fund
Moody's rating
% of debt securities
Moody's rating
% of debt securities
Aaa 45.70% B3 0.26%
Aa1 9.37% Baa1 7.95%
Aa2 1.27% Baa2 6.79%
Aa3 10.65% Baa3 5.81%
A1 1.63% Ba1 0.60%
A2 5.40% Ba2 0.11%
A3 3.12% Ba3 0.19%
B1 0.40% Other 0.64%
B2 0.11% 100.00%
STANLIB Global Bond Fund
Moody's rating
% of debt securities
Moody's rating
% of debt securities
Aaa 57.13% Baa2 5.67%
Aa1 13.65% Baa3 0.26%
Aa3 7.13% Ba1 1.34%
A2 8.13% Other 0.46%
Baa1 6.23% 100.00%
STANLIB Global Balanced Fund
Moody's rating
% of debt securities
Moody's rating
% of debt securities
Aaa 51.82% Baa1 5.99%
Aa1 19.40% Baa2 4.19%
Aa2 1.03% Baa3 3.34%
Aa3 2.62% Ba2 0.52%
A1 1.28% Ba3 1.56%
A2 3.88% 100.00%
A3 4.37%
STANLIB Global Balanced Cautious Fund
Moody's rating
% of debt securities
Moody's rating
% of debt securities
Aaa 50.59% Baa1 6.44%
Aa1 18.08% Baa2 4.45%
Aa2 1.09% Baa3 2.64%
Aa3 3.12% Ba2 0.52%
A1 1.33% Ba3 2.16%
A2 5.22% 100.00%
A3 4.36%
Foreign currency risk
The value of assets held by the Class Funds is reported in US Dollars although the underlying assets are denominated in a wide range of currencies. Movements in the relative values of these currencies can cause volatility in the reported US Dollar values. Although this exposure is not routinely hedged periodic positions in currencies are created through the use of currency derivatives where the investment managers believe that it is in the interest of the Class Funds.
Details of forward foreign exchange contracts outstanding at the period-end are detailed in Note 12. Realised foreign exchange gains and losses made during the period are disclosed in the Statement of Total Return for each Class Fund and unrealised movements are disclosed in Note 3.

STANLIB Funds Limited
Notes to the Financial Statements (continued)
28
Foreign currency monetary assets and liabilities
The following tables show the currency exposure for each Class Fund as at 30 June 2014 and 31 December 2013. As part of the risk analysis the tables show the estimated change in the market value of investments given a 5% movement in the underlying currency against the base currency of the Class Fund.
Global Property Fund
30 June 2014 (Values in USD) 31 December 2013 (Values in USD)Currency Market value 5% movement Market value 5% movement
Australian Dollar 8,664,355 433,218 9,126,500 456,325
Brazilian Real 2,324,417 116,221 3,384,545 169,227
British Pound 7,818,972 390,949 7,455,472 372,774
Canadian Dollar 3,422,163 171,108 4,493,705 224,685
Euro 9,817,480 490,874 9,400,180 470,009
Hong Kong Dollar 4,162,768 208,138 4,122,647 206,132
Japanese Yen 6,749,546 337,477 5,439,566 271,978
Singapore Dollar 3,251,757 162,588 3,234,906 161,745
US Dollar 55,163,094 – 53,569,528 –
Other Currency* 1,747,470 87,374 2,568,793 128,440
103,122,022 2,397,947 102,795,842 2,461,315
* Other Currency includes a number of currencies, none of which are greater than 1% of the net assets of the Class Fund.
STANLIB Multi-Manager Global Bond Fund
30 June 2014 (Values in USD) 31 December 2013 (Values in USD)Currency Market value 5% movement Market value 5% movement
Australian Dollar 5,776,986 288,849 5,292,194 264,610
Brazilian Real 2,632,925 131,646 – –
British Pound 14,257,234 712,862 21,802,404 1,090,120
Canadian Dollar 4,562,031 228,102 6,630,731 331,537
Chilean Peso 4,000,663 200,033 4,367,042 218,352
Euro 55,648,313 2,782,416 69,483,309 3,474,165
Japanese Yen 26,777,160 1,338,858 33,751,674 1,687,584
Mexican Peso 10,945,206 547,260 8,508,232 425,412
Norwegian Krone – – 4,666,229 233,311
Polish Zloty – – 6,251,949 312,597
South African Rand 2,852,075 142,604 – –
South Korean Won 5,381,482 269,074 9,420,340 471,017
US Dollar 103,933,412 – 195,717,027 –
Other Currency* 19,878,388 993,919 25,581,741 1,279,087
256,645,875 7,635,623 391,472,872 9,787,792
* Other Currency includes a number of currencies, none of which are greater than 1% of the net assets of the Class Fund.
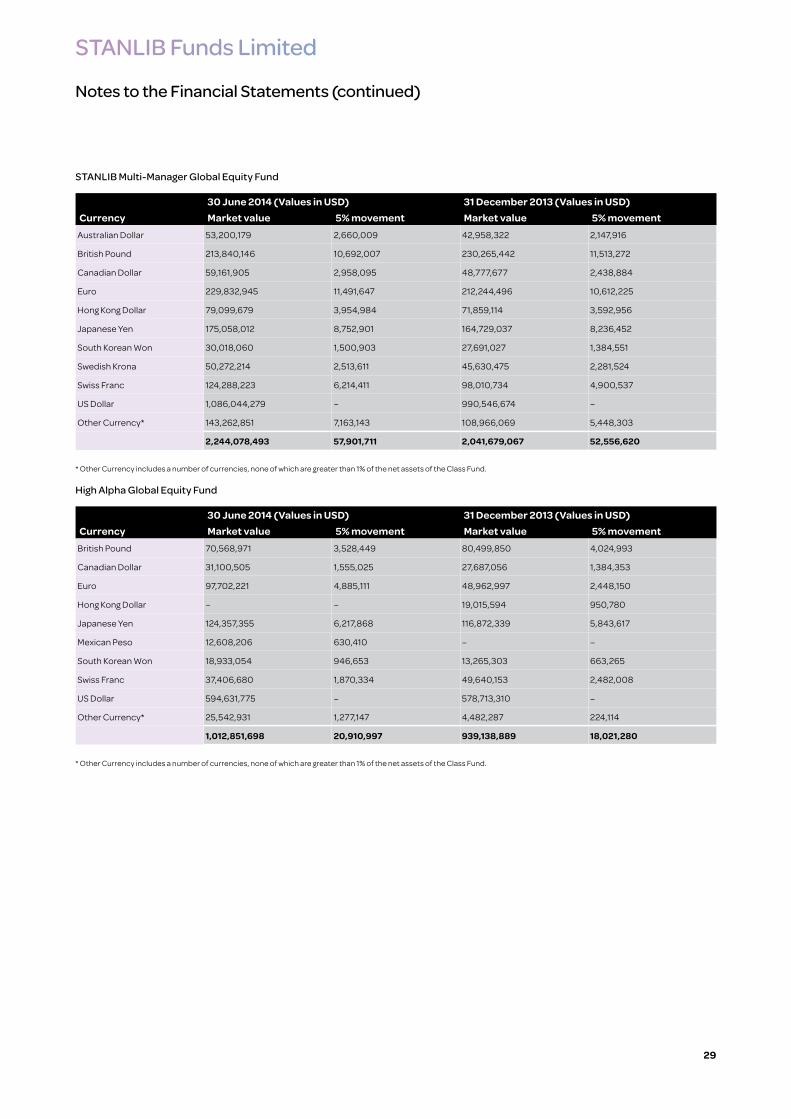
STANLIB Funds Limited
Notes to the Financial Statements (continued)
29
STANLIB Multi-Manager Global Equity Fund
30 June 2014 (Values in USD) 31 December 2013 (Values in USD)Currency Market value 5% movement Market value 5% movement
Australian Dollar 53,200,179 2,660,009 42,958,322 2,147,916
British Pound 213,840,146 10,692,007 230,265,442 11,513,272
Canadian Dollar 59,161,905 2,958,095 48,777,677 2,438,884
Euro 229,832,945 11,491,647 212,244,496 10,612,225
Hong Kong Dollar 79,099,679 3,954,984 71,859,114 3,592,956
Japanese Yen 175,058,012 8,752,901 164,729,037 8,236,452
South Korean Won 30,018,060 1,500,903 27,691,027 1,384,551
Swedish Krona 50,272,214 2,513,611 45,630,475 2,281,524
Swiss Franc 124,288,223 6,214,411 98,010,734 4,900,537
US Dollar 1,086,044,279 – 990,546,674 –
Other Currency* 143,262,851 7,163,143 108,966,069 5,448,303
2,244,078,493 57,901,711 2,041,679,067 52,556,620
* Other Currency includes a number of currencies, none of which are greater than 1% of the net assets of the Class Fund.
High Alpha Global Equity Fund
30 June 2014 (Values in USD) 31 December 2013 (Values in USD)Currency Market value 5% movement Market value 5% movement
British Pound 70,568,971 3,528,449 80,499,850 4,024,993
Canadian Dollar 31,100,505 1,555,025 27,687,056 1,384,353
Euro 97,702,221 4,885,111 48,962,997 2,448,150
Hong Kong Dollar – – 19,015,594 950,780
Japanese Yen 124,357,355 6,217,868 116,872,339 5,843,617
Mexican Peso 12,608,206 630,410 – –
South Korean Won 18,933,054 946,653 13,265,303 663,265
Swiss Franc 37,406,680 1,870,334 49,640,153 2,482,008
US Dollar 594,631,775 – 578,713,310 –
Other Currency* 25,542,931 1,277,147 4,482,287 224,114
1,012,851,698 20,910,997 939,138,889 18,021,280
* Other Currency includes a number of currencies, none of which are greater than 1% of the net assets of the Class Fund.
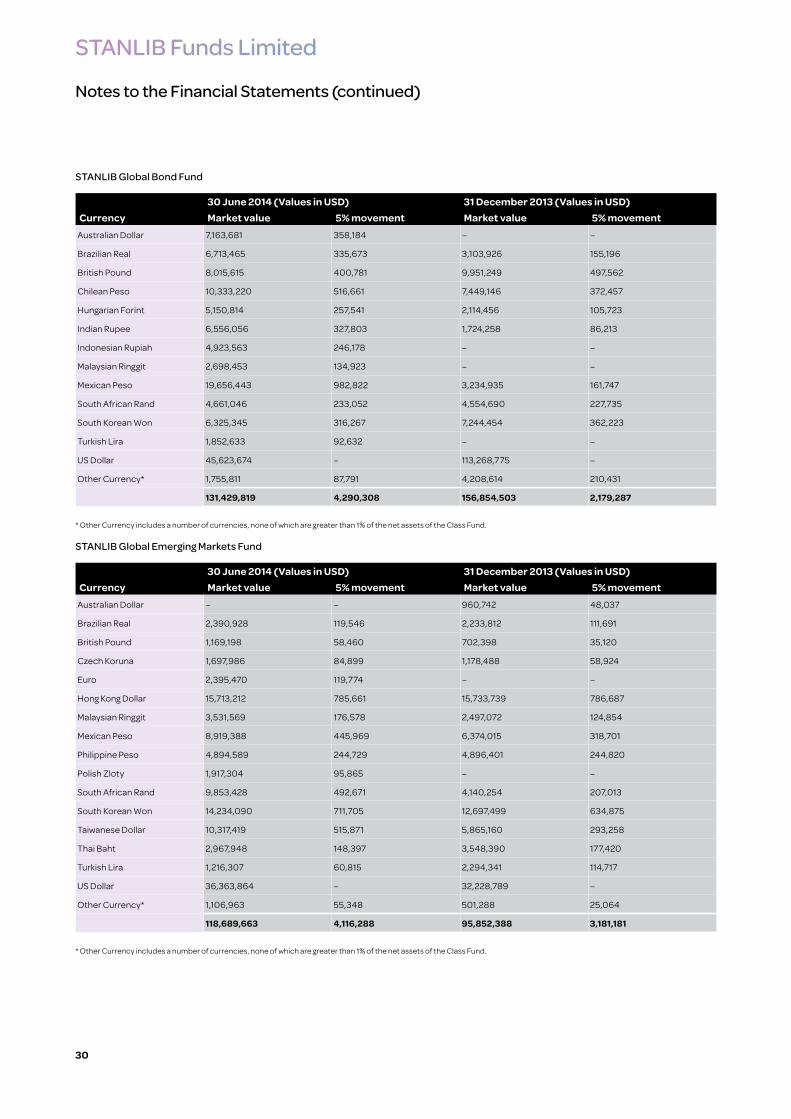
STANLIB Funds Limited
Notes to the Financial Statements (continued)
30
STANLIB Global Bond Fund
30 June 2014 (Values in USD) 31 December 2013 (Values in USD)Currency Market value 5% movement Market value 5% movement
Australian Dollar 7,163,681 358,184 – –
Brazilian Real 6,713,465 335,673 3,103,926 155,196
British Pound 8,015,615 400,781 9,951,249 497,562
Chilean Peso 10,333,220 516,661 7,449,146 372,457
Hungarian Forint 5,150,814 257,541 2,114,456 105,723
Indian Rupee 6,556,056 327,803 1,724,258 86,213
Indonesian Rupiah 4,923,563 246,178 – –
Malaysian Ringgit 2,698,453 134,923 – –
Mexican Peso 19,656,443 982,822 3,234,935 161,747
South African Rand 4,661,046 233,052 4,554,690 227,735
South Korean Won 6,325,345 316,267 7,244,454 362,223
Turkish Lira 1,852,633 92,632 – –
US Dollar 45,623,674 – 113,268,775 –
Other Currency* 1,755,811 87,791 4,208,614 210,431
131,429,819 4,290,308 156,854,503 2,179,287
* Other Currency includes a number of currencies, none of which are greater than 1% of the net assets of the Class Fund.
STANLIB Global Emerging Markets Fund
30 June 2014 (Values in USD) 31 December 2013 (Values in USD)Currency Market value 5% movement Market value 5% movement
Australian Dollar – – 960,742 48,037
Brazilian Real 2,390,928 119,546 2,233,812 111,691
British Pound 1,169,198 58,460 702,398 35,120
Czech Koruna 1,697,986 84,899 1,178,488 58,924
Euro 2,395,470 119,774 – –
Hong Kong Dollar 15,713,212 785,661 15,733,739 786,687
Malaysian Ringgit 3,531,569 176,578 2,497,072 124,854
Mexican Peso 8,919,388 445,969 6,374,015 318,701
Philippine Peso 4,894,589 244,729 4,896,401 244,820
Polish Zloty 1,917,304 95,865 – –
South African Rand 9,853,428 492,671 4,140,254 207,013
South Korean Won 14,234,090 711,705 12,697,499 634,875
Taiwanese Dollar 10,317,419 515,871 5,865,160 293,258
Thai Baht 2,967,948 148,397 3,548,390 177,420
Turkish Lira 1,216,307 60,815 2,294,341 114,717
US Dollar 36,363,864 – 32,228,789 –
Other Currency* 1,106,963 55,348 501,288 25,064
118,689,663 4,116,288 95,852,388 3,181,181
* Other Currency includes a number of currencies, none of which are greater than 1% of the net assets of the Class Fund.

STANLIB Funds Limited
Notes to the Financial Statements (continued)
31
STANLIB Global Balanced Fund
30 June 2014 (Values in USD) 31 December 2013 (Values in USD)Currency Market value 5% movement Market value 5% movement
Australian Dollar 1,975,053 98,753 1,084,612 54,231
British Pound 8,734,860 436,743 4,419,925 220,996
Canadian Dollar 4,135,524 206,776 1,895,726 94,786
Euro 20,953,492 1,047,675 7,055,687 352,784
Hong Kong Dollar – – 1,355,250 67,763
Japanese Yen 15,430,622 771,531 5,289,513 264,476
Mexican Peso 1,794,366 89,718 – –
Swedish Krona 1,355,866 67,793 – –
Swiss Franc 2,778,198 138,910 1,900,765 95,038
US Dollar 63,994,733 – 41,857,131 –
Other Currency* 3,834,350 191,718 451,351 22,567
124,987,064 3,049,617 65,309,960 1,172,641
* Other Currency includes a number of currencies, none of which are greater than 1% of the net assets of the Class Fund.
STANLIB Global Balanced Cautious Fund
30 June 2014 (Values in USD) 31 December 2013 (Values in USD)Currency Market value 5% movement Market value 5% movement
Australian Dollar 1,441,108 72,055 403,260 20,163
British Pound 3,229,462 161,473 917,188 45,859
Canadian Dollar 2,013,300 100,665 497,425 24,871
Danish Krone 1,076,401 53,820 – –
Euro 12,043,758 602,188 2,238,448 111,922
Japanese Yen 5,430,341 271,517 841,564 42,078
Mexican Peso 628,278 31,414 – –
Swedish Krona 1,139,579 56,979 – –
Swiss Franc – – 257,191 12,860
US Dollar 17,205,430 – 13,395,569 –
Other Currency* 1,320,576 66,029 259,354 12,968
45,528,233 1,416,140 18,809,999 270,721
* Other Currency includes a number of currencies, none of which are greater than 1% of the net assets of the Class Fund.

STANLIB Funds Limited
Notes to the Financial Statements (continued)
32
Liquidity risk
Liquidity risk in relation to funding of redemptions is managed by receiving daily notifications of forthcoming redemption notices and ensuring sufficient liquidity within the portfolio. In the prior period investments were split into six different categories depending on the maturity date of the fixed income securities. Securities with no maturity date were classified separately. The current period presentation uses two categories. This is appropriate from a liquidity perspective as it is the intention of the Investment Manager to hold liquid securities traded in active markets and the securities held are valued as such. As these are highly liquid they can be traded in less than 3 months.
Global Property Fund
30 June 2014 31 December 2013Less than 3 months
3 months to 1 year
Less than 3 months
3 months to 1 year
USD USD USD USDInvestments 100,537,497 – 100,601,225 –
Cash and bank balances 2,304,241 – 1,932,856 –
Other assets 370,702 – 361,053 –
Total assets 103,212,440 – 102,895,134 –
Unrealised loss on foreign currency contracts 2 – – –
Other liabilities 90,416 – 99,292 –
Net assets attributable to holders of redeemable participating shares 103,122,022 – 102,795,842 –
Total liabilities 103,212,440 – 102,895,134 –
STANLIB Multi-Manager Global Bond Fund
30 June 2014 31 December 2013Less than 3 months
3 months to 1 year
Less than 3 months
3 months to 1 year
USD USD USD USDInvestments 255,478,531 – 375,489,163 –
Cash and bank balances 16,706,220 – 30,375,985 –
Unrealised gain of foreign currency contracts 306,769 – 722,115 –
Unrealised gain on futures contracts 21,494 – 143,138 –
Other assets 2,676,402 – 7,943,265 –
Total assets 275,189,416 – 414,673,666 –
Unrealised loss on foreign currency contracts 326,280 – 845,381 –
Other liabilities 18,217,261 – 22,355,413 –
Net assets attributable to holders of redeemable participating shares 256,645,875 – 391,472,872 –
Total liabilities 275,189,416 – 414,673,666 –

STANLIB Funds Limited
Notes to the Financial Statements (continued)
33
STANLIB Multi-Manager Global Equity Fund
30 June 2014 31 December 2013Less than 3 months
3 months to 1 year
Less than 3 months
3 months to 1 year
USD USD USD USDInvestments 2,176,271,594 – 1,974,113,664 –
Cash and bank balances 84,408,078 – 67,965,216 –
Unrealised gain of foreign currency contracts 13,120 – 386 –
Other assets 77,537,492 – 2,251,550 –
Total assets 2,338,230,284 – 2,044,330,816 –
Unrealised loss on foreign currency contracts 7,214 – 60 –
Other liabilities 94,144,577 – 2,651,689 –
Net assets attributable to holders of redeemable participating shares 2,244,078,493 – 2,041,679,067 –
Total liabilities 2,338,230,284 – 2,044,330,816 –
High Alpha Global Equity Fund
30 June 2014 31 December 2013Less than 3 months
3 months to 1 year
Less than 3 months
3 months to 1 year
USD USD USD USDInvestments 999,798,443 – 924,246,520 –
Cash and bank balances 9,883,332 – 14,705,589 –
Other assets 4,306,964 – 849,225 –
Total assets 1,013,988,739 – 939,801,334 –
Unrealised loss on foreign currency contracts 276 – – –
Other liabilities 1,136,765 – 662,445 –
Net assets attributable to holders of redeemable participating shares 1,012,851,698 – 939,138,889 –
Total liabilities 1,013,988,739 – 939,801,334 –
STANLIB Global Bond Fund
30 June 2014 31 December 2013Less than 3 months
3 months to 1 year
Less than 3 months
3 months to 1 year
USD USD USD USDInvestments 126,751,191 – 150,773,668 –
Cash and bank balances 4,643,521 – 4,202,002 –
Unrealised gain of foreign currency contracts 185,178 – 929,816 –
Other assets 998,628 – 1,653,717 –
Total assets 132,578,518 – 157,559,203 –
Unrealised loss on foreign currency contracts 314,297 – 570,306 –
Other liabilities 834,402 – 134,394 –
Net assets attributable to holders of redeemable participating shares 131,429,819 – 156,854,503 –
Total liabilities 132,578,518 – 157,559,203 –

STANLIB Funds Limited
Notes to the Financial Statements (continued)
34
STANLIB Global Emerging Markets Fund
30 June 2014 31 December 2013Less than 3 months
3 months to 1 year
Less than 3 months
3 months to 1 year
USD USD USD USDInvestments 114,752,647 – 92,130,099 –
Cash and bank balances 3,580,378 – 4,954,967 –
Unrealised gain of foreign currency contracts 1 – – –
Other assets 738,258 – 1,436,045 –
Total assets 119,071,284 – 98,521,111 –
Unrealised loss on foreign currency contracts – – 236 –
Other liabilities 381,621 – 2,668,487 –
Net assets attributable to holders of redeemable participating shares 118,689,663 – 95,852,388 –
Total liabilities 119,071,284 – 98,521,111 –
STANLIB Global Balanced Fund
30 June 2014 31 December 2013Less than 3 months
3 months to 1 year
Less than 3 months
3 months to 1 year
USD USD USD USDInvestments 111,945,225 – 54,995,365 –
Cash and bank balances 12,565,413 – 11,189,604 –
Unrealised gain of foreign currency contracts 97,822 – 44,209 –
Other assets 1,177,226 – 186,861 –
Total assets 125,785,686 – 66,416,039 –
Unrealised loss on foreign currency contracts 127,265 – 116,961 –
Other liabilities 671,357 – 989,118 –
Net assets attributable to holders of redeemable participating shares 124,987,064 – 65,309,960 –
Total liabilities 125,785,686 – 66,416,039 –
STANLIB Global Balanced Cautious Fund
30 June 2014 31 December 2013Less than 3 months
3 months to 1 year
Less than 3 months
3 months to 1 year
USD USD USD USDInvestments 35,652,813 – 12,262,661 –
Cash and bank balances 10,622,074 – 6,802,299 –
Unrealised gain of foreign currency contracts 94,407 – 41,917 –
Other assets 359,886 – 88,869 –
Total assets 46,729,180 – 19,195,746 –
Unrealised loss on foreign currency contracts 127,386 – 84,119 –
Other liabilities 1,073,561 – 301,628 –
Net assets attributable to holders of redeemable participating shares 45,528,233 – 18,809,999 –
Total liabilities 46,729,180 – 19,195,746 –

STANLIB Funds Limited
Notes to the Financial Statements (continued)
35
Interest rate risk
For Global Property Fund, STANLIB Multi-Manager Global Equity Fund, High Alpha Global Equity Fund and STANLIB Global Emerging Markets Fund the majority of the Class Funds’ assets are equity shares and other investments which neither pay interest nor have a maturity date.
Within these Classes there are small holdings of interest bearing assets as disclosed in their respective portfolios. In the opinion of the Directors there would be no benefit in disclosing in the note below the interest rate profiles thereof.
The interest rate and currency profiles of the STANLIB Multi-Manager Global Bond Fund’s financial assets at 30 June 2014 and 31 December 2013 are disclosed in the following tables:
STANLIB Multi-Manager Global Bond Fund
Interest Rate
30 June 2014 31 December 2013
Total Interest bearing
Non-Interest bearing Total Interest
bearingNon-Interest bearing
USD USD USD USD USD USDInvestments 255,478,531 241,663,778 13,814,753 375,489,163 356,678,536 18,810,627
Unrealised gain of foreign currency contracts 306,769 – 306,769 722,115 – 722,115
Unrealised gain of futures contracts 21,494 – 21,494 143,138 – 143,138
Cash and bank balances 16,706,220 16,706,220 – 30,375,985 30,375,985 –
Other assets 2,676,402 – 2,676,402 7,943,265 – 7,943,265
Assets 275,189,416 258,369,998 16,819,418 414,673,666 387,054,521 27,619,145
Unrealised loss of foreign currency contracts 326,280 – 326,280 845,381 – 845,381
Other liabilities 18,217,261 – 18,217,261 22,355,413 – 22,355,413
Liabilities 18,543,541 – 18,543,541 23,200,794 – 23,200,794
Net interest bearing assets 258,369,998 387,054,521

STANLIB Funds Limited
Notes to the Financial Statements (continued)
36
STANLIB Multi-Manager Global Bond Fund
Currency Profiles
30 June 2014 31 December 2013Weighted average coupon
Weighted average maturity
Weighted average coupon
Weighted average maturity
Australian Dollar 5.58 7 years 6 months 5.88 4 years 11 months
Brazilian Real 10.38 2 years 6 months 10.12 3 years 10 months
British Pound 3.63 9 years 0 months 3.61 10 years 4 months
Canadian Dollar 3.7 8 years 12 months 3.57 7 years 6 months
Chilean Peso 5.5 6 years 1 months 5.5 6 years 7 months
Colombian Peso 5 4 years 4 months 6.22 8 months 5 months
Czech Koruna 4.79 7 years 2 months 3.95 7 years 10 months
Danish Krone 3.39 7 years 7 months 3.45 7 years 4 months
Euro 3.86 8 years 12 months 4.05 8 years 9 months
Hungarian Forint 5.5 1 years 7 months 5.5 2 years 1 month
Indonesian Rupiah 10.8 5 years 2 months 10.8 5 years 7 months
Israeli Shekel 4.66 6 years 10 months 4.84 6 years 9 months
Japanese Yen 1.48 8 years 8 months 1.62 10 years 1 month
Malaysian Ringgit 3.63 7 years 4 months 3.49 7 years 9 months
Mexican Peso 8.17 17 years 3 months 7.97 9 years 7 months
New Zealand Dollar 5.52 6 years 3 months 5.5 7 years 0 month
Norwegian Krona 4.42 4 years 3 months 4.45 4 years 11 months
Peruvian Nuevo Sol - - 7.84 6 years 7 months
Polish Zloty 5.13 6 years 6 months 5.35 5 years 8 months
Russian Rubles 7.05 5 years 7 months 6.97 4 years 2 months
Singapore Dollar 3.87 4 years 6 months 3.46 5 years 7 months
South African Rand 6.7 18 years 2 months 6.93 16 years 11 months
South Korean Won 4.61 5 years 10 months 4.75 6 years 1 month
Swedish Krona 3.73 6 years 4 months 4.06 5 years 4 months
Swiss Franc 3.38 8 years 10 months 3.5 9 years 3 months
Thai Baht 4.42 12 years 9 months 3.77 6 years 7 months
US Dollar 3.38 12 years 4 months 3.05 10 years 11 months
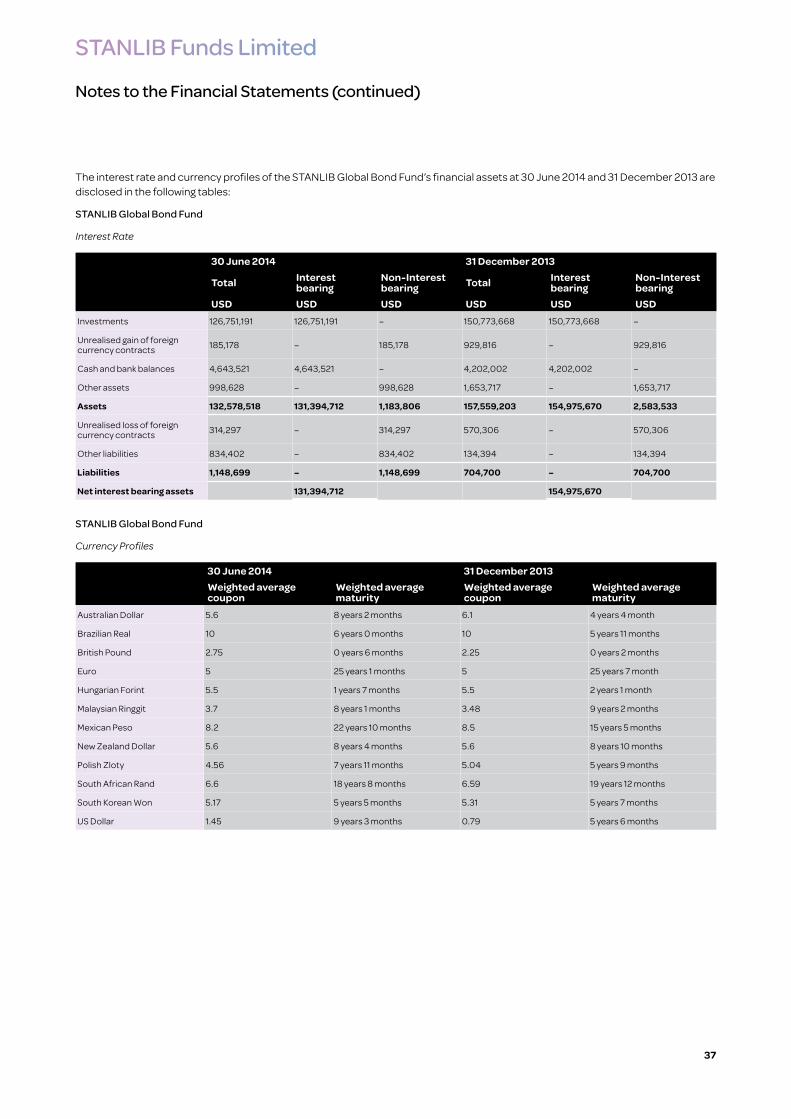
STANLIB Funds Limited
Notes to the Financial Statements (continued)
37
The interest rate and currency profiles of the STANLIB Global Bond Fund’s financial assets at 30 June 2014 and 31 December 2013 are disclosed in the following tables:
STANLIB Global Bond Fund
Interest Rate
30 June 2014 31 December 2013
Total Interest bearing
Non-Interest bearing Total Interest
bearingNon-Interest bearing
USD USD USD USD USD USDInvestments 126,751,191 126,751,191 – 150,773,668 150,773,668 –
Unrealised gain of foreign currency contracts 185,178 – 185,178 929,816 – 929,816
Cash and bank balances 4,643,521 4,643,521 – 4,202,002 4,202,002 –
Other assets 998,628 – 998,628 1,653,717 – 1,653,717
Assets 132,578,518 131,394,712 1,183,806 157,559,203 154,975,670 2,583,533
Unrealised loss of foreign currency contracts 314,297 – 314,297 570,306 – 570,306
Other liabilities 834,402 – 834,402 134,394 – 134,394
Liabilities 1,148,699 – 1,148,699 704,700 – 704,700
Net interest bearing assets 131,394,712 154,975,670
STANLIB Global Bond Fund
Currency Profiles
30 June 2014 31 December 2013Weighted average coupon
Weighted average maturity
Weighted average coupon
Weighted average maturity
Australian Dollar 5.6 8 years 2 months 6.1 4 years 4 month
Brazilian Real 10 6 years 0 months 10 5 years 11 months
British Pound 2.75 0 years 6 months 2.25 0 years 2 months
Euro 5 25 years 1 months 5 25 years 7 month
Hungarian Forint 5.5 1 years 7 months 5.5 2 years 1 month
Malaysian Ringgit 3.7 8 years 1 months 3.48 9 years 2 months
Mexican Peso 8.2 22 years 10 months 8.5 15 years 5 months
New Zealand Dollar 5.6 8 years 4 months 5.6 8 years 10 months
Polish Zloty 4.56 7 years 11 months 5.04 5 years 9 months
South African Rand 6.6 18 years 8 months 6.59 19 years 12 months
South Korean Won 5.17 5 years 5 months 5.31 5 years 7 months
US Dollar 1.45 9 years 3 months 0.79 5 years 6 months

STANLIB Funds Limited
Notes to the Financial Statements (continued)
38
The interest rate and currency profiles of the STANLIB Global Balanced Fund’s financial assets at 30 June 2014 and 31 December 2013 are disclosed in the following tables:
STANLIB Global Balanced Fund
Interest Rate
30 June 2014 31 December 2013
Total Interest bearing
Non-Interest bearing Total Interest
bearingNon-Interest bearing
USD USD USD USD USD USDInvestments 111,945,225 33,794,195 78,151,030 54,995,365 14,570,559 40,424,806
Unrealised gain of foreign currency contracts 97,822 – 97,822 44,209 – 44,209
Cash and bank balances 12,565,413 12,565,413 – 11,189,604 11,189,604 –
Other assets 1,177,226 – 1,177,226 186,861 – 186,861
Assets 125,785,686 46,359,608 79,426,078 66,416,039 25,760,163 40,655,876
Unrealised loss of foreign currency contracts 127,265 – 127,265 116,961 – 116,961
Other liabilities 671,357 – 671,357 989,118 – 989,118
Liabilities 798,622 – 798,622 1,106,079 – 1,106,079
Net interest bearing assets 46,359,608 25,760,163
STANLIB Global Balanced Fund
Currency Profiles
30 June 2014 31 December 2013Weighted average coupon
Weighted average maturity
Weighted average coupon
Weighted average maturity
Australian Dollar - - 5.41 10 years 2 months
Canadian Dollar 2.35 4 years 5 months 2.35 4 years 11 months
British Pound 6.75 29 years 11 months 4.36 11 years 10 months
Euro 3.8 10 years 4 months 3.11 5 years 8 months
Japanese Yen 1.22 15 years 2 months 1.29 16 years 9 months
New Zealand Dollar 5.5 8 years 9 months - -
Mexican Peso 10 10 years 5 months - -
US Dollar 2.62 6 years 4 months 2.31 6 years 4 months

STANLIB Funds Limited
Notes to the Financial Statements (continued)
39
The interest rate and currency profiles of the STANLIB Global Balanced Cautious Fund’s financial assets at 30 June 2014 and 31 December 2013 are disclosed in the following tables:
STANLIB Global Balanced Cautious Fund
Interest Rate
30 June 2014 31 December 2013
Total Interest bearing
Non-Interest bearing Total Interest
bearingNon-Interest bearing
USD USD USD USD USD USDInvestments 35,652,813 21,342,428 14,310,385 12,262,661 6,417,297 5,845,364
Unrealised gain of foreign currency contracts 94,407 – 94,407 41,917 – 41,917
Cash and bank balances 10,622,074 10,622,074 – 6,802,299 6,802,299 –
Other assets 359,886 – 359,886 88,869 – 88,869
Assets 46,729,180 31,964,502 14,764,678 19,195,746 13,219,596 5,976,150
Unrealised loss of foreign currency contracts 127,386 – 127,386 84,119 – 84,119
Other liabilities 1,073,561 – 1,073,561 301,628 – 301,628
Liabilities 1,200,947 – 1,200,947 385,747 – 385,747
Net interest bearing assets 31,964,502 13,219,596
STANLIB Global Balanced Cautious Fund
Currency Profiles
30 June 2014 31 December 2013Weighted average coupon
Weighted average maturity
Weighted average coupon
Weighted average maturity
Australian Dollar - - 5.39 10 years 4 months
Canadian Dollar 2.35 4 years 5 months 2.35 4 years 11 months
British Pound 6.76 34 years 1 months 3.44 10 years 4 months
Euro 3.76 10 years 7 months 3.21 6 years 9 months
Japanese Yen 1.21 14 years 12 months 1.22 15 years 9 months
New Zealand Dollar 5.5 8 years 9 months - -
Mexican Peso 10 10 years 5 months - -
US Dollar 2.86 6 years 10 months 2.33 5 years 9 months

STANLIB Funds Limited
Notes to the Financial Statements (continued)
40
The below tables indicate the weighted average interest received on fixed rate financial assets and the weighted average period for which the rate is fixed:
30 June 2014 31 December 2013Fixed rate financial assets Fixed rate financial assets
Weighted average interest rate
Weighted average period for which rate is fixed
Weighted average interest rate
Weighted average period for which rate is fixed
STANLIB Multi-Manager Global Bond Fund 7.53% 2,108 6.91% 2,338
STANLIB Global Bond Fund 5.26% 2,196 5.23% 2,105
STANLIB Global Balanced Fund 4.18% 4,339 2.14% 5,722
STANLIB Global Balanced Cautious Fund 3.88% 4,030 1.86% 6,045
STANLIB Global Balanced Cautious Fund 3.88% 4,030 1.86% 6,045
As at 30 June 2014 Total Fixed rate financial assets
Floating rate financial assets
Net assets / (liabilities) notcarrying interest
USD USD USD USDSTANLIB Multi-Manager Global Bond Fund 256,645,875 241,663,778 16,706,220 (1,724,123)
STANLIB Global Bond Fund 131,429,819 126,751,191 4,643,521 35,107
STANLIB Global Balanced Fund 124,987,064 33,794,195 12,565,413 78,627,456
STANLIB Global Balanced Cautious Fund 45,528,233 21,342,428 10,622,074 13,563,731
As at 31 December 2013 Total Fixed rate financial assets
Floating rate financial assets
Net assets not carrying interest
USD USD USD USDSTANLIB Multi-Manager Global Bond Fund 391,472,872 356,678,536 30,375,985 4,418,351
STANLIB Global Bond Fund 156,854,503 150,773,668 4,202,002 1,878,833
STANLIB Global Balanced Fund 65,309,960 14,570,559 11,189,604 39,549,797
STANLIB Global Balanced Cautious Fund 18,809,999 6,417,297 6,802,299 5,590,403
Interest rate sensitivity
The Class Funds manage interest rate risk by ensuring that not less than 90% of investments is interest bearing securities are rated investment grade by either Moody’s, Standard and Poors or Fitch. An increase of 100 basis points in interest rates as at the reporting date would have decreased the net assets attributable to holders of redeemable participating shares for each Class Fund by approximately:
As at 30 June 2014 DecreaseClass Fund USD
STANLIB Multi-Manager Global Bond Fund 2,583,700
STANLIB Global Bond Fund 1,313,947
STANLIB Global Balanced Fund 463,596
STANLIB Global Balanced Cautious Fund 319,645
As at 31 December 2013 DecreaseClass Fund USD
STANLIB Multi-Manager Global Bond Fund 3,870,545
STANLIB Global Bond Fund 1,549,757
STANLIB Global Balanced Fund 257,602
STANLIB Global Balanced Cautious Fund 132,196
A decrease of 100 basis points would have had an equal but opposite effect.
The currency and interest rate profiles of cash and bank balances (net of bank overdrafts) held at period-end which did not have a fixed maturity date, by each of the Class Funds, is disclosed in the Balance Sheet. Short-term debtors and creditors have been excluded from the disclosures of financial instruments.

STANLIB Funds Limited
Notes to the Financial Statements (continued)
41
12. Derivative financial instruments
Foreign currency contracts
The Company has entered into foreign currency contracts to hedge non-functional currency investments held at fair value and for trading purposes. The fair value of open foreign currency contracts at 30 June 2014 and 31 December 2013 is booked in the Balance Sheet under “Unrealised gain on foreign currency contracts” or “Unrealised loss on foreign currency contracts”.
As at 30 June 2014, the Class Funds had the following open foreign exchange contracts:
Global Property Fund
Unrealised gain on foreign currency contracts
Maturity date Purchase Currency Amount Sell Currency Amount Unrealised gain/
(loss) % of net assets
02/07/2014 JPY (145,496) USD 1,434 (2) 0.00
Total unrealised loss on foreign currency contracts (2) 0.00
BNY Mellon is the counterparty to this Foreign currency contract.
STANLIB Multi-Manager Global Bond Fund
Unrealised gain on foreign currency contracts
Maturity date Purchase Currency Amount Sell Currency Amount Unrealised gain/
(loss) % of net assets
18/07/2014 USD (1,105,506) AUD 1,195,000 20,757 0.01
29/08/2014 USD (1,357,112) BRL 3,120,000 33,603 0.01
18/07/2014 USD (437,358) CAD 471,000 4,615 0.00
11/09/2014 USD (145,106) CHF 130,000 1,582 0.00
10/07/2014 USD (392,298) CHF 350,000 2,416 0.00
28/07/2014 USD (308,797) CLP 172,000,000 861 0.00
28/07/2014 USD (555,495) CLP 312,000,000 6,209 0.00
18/07/2014 USD (53,168) CZK 1,070,000 216 0.00
14/07/2014 JPY (48,504,050) EUR 350,000 380 0.00
10/07/2014 PLN (1,350,000) EUR 325,544 1,490 0.00
11/07/2014 SEK (835,000) EUR 91,703 678 0.00
23/07/2014 USD (455,282) EUR 335,000 3,426 0.00
16/07/2014 USD (860,000) EUR 635,723 10,456 0.01
23/07/2014 USD (1,411,285) EUR 1,040,000 12,765 0.01
23/07/2014 USD (3,545,295) EUR 2,600,000 14,831 0.01
11/09/2014 USD (1,823,209) EUR 1,344,000 17,442 0.01
14/07/2014 USD (326,740) GBP 194,871 6,421 0.00
01/07/2014 USD (777,741) IDR 9,413,000,000 16,270 0.01
14/07/2014 EUR (350,000) JPY 48,743,450 1,983 0.00
17/07/2014 USD (82,591) JPY 8,400,000 339 0.00
16/07/2014 USD (950,000) JPY 96,924,700 6,889 0.00
16/07/2014 USD (1,336,073) JPY 136,372,977 10,269 0.00
17/07/2014 USD (2,504,051) JPY 255,000,000 13,458 0.01
17/07/2014 USD (1,704,784) JPY 174,182,000 14,842 0.01
11/09/2014 USD (2,223,347) JPY 227,560,000 24,148 0.01
17/07/2014 USD (2,053,209) JPY 210,644,000 26,392 0.01

STANLIB Funds Limited
Notes to the Financial Statements (continued)
42
Maturity date Purchase Currency Amount Sell Currency Amount Unrealised gain/
(loss) % of net assets
24/07/2014 USD (555,069) KRW 566,243,000 4,216 0.00
14/08/2014 USD (233,895) MXN 3,048,000 289 0.00
11/09/2014 USD (123,221) MYR 400,000 994 0.00
18/07/2014 USD (279,037) PHP 12,339,000 3,624 0.00
25/07/2014 USD (202,075) PLN 620,000 1,730 0.00
14/08/2014 USD (79,234) SGD 99,000 180 0.00
14/07/2014 USD (667,632) TRY 1,430,000 4,771 0.00
11/09/2014 AUD (110,000) USD 103,304 31 0.00
07/08/2014 EUR (240,000) USD 330,116 1,470 0.00
07/08/2014 EUR (1,230,000) USD 1,699,860 15,547 0.01
11/09/2014 MXN (2,000,000) USD 153,415 32 0.00
15/07/2014 NOK (3,552,000) USD 581,137 2,636 0.00
15/07/2014 NOK (6,570,000) USD 1,074,906 4,876 0.00
11/09/2014 NOK (1,540,000) USD 255,553 5,297 0.00
11/07/2014 PLN (162,000) USD 53,359 53 0.00
11/09/2014 PLN (900,000) USD 295,082 88 0.00
18/07/2014 SEK (2,362,000) USD 354,779 1,553 0.00
02/07/2014 ZAR (1,180,000) USD 111,087 172 0.00
11/09/2014 USD (812,329) ZAR 8,820,000 6,472 0.00
Total unrealised gain on foreign currency contracts 306,769 0.12
Unrealised loss on foreign currency contracts
Maturity date Purchase Currency Amount Sell Currency Amount Unrealised gain/
(loss) % of net assets
18/08/2014 USD (1,049,267) CLP 581,000,000 (5,522) 0.00
10/09/2014 USD (1,993,533) CLP 1,109,700,000 (4,855) 0.00
19/09/2014 USD (1,215,294) HUF 272,080,000 (15,425) (0.01)
08/09/2014 USD (1,803,624) IDR 21,400,000,000 (17,789) (0.01)
14/08/2014 USD (2,392,384) INR 144,000,000 (14,369) (0.01)
03/07/2014 USD (167,811) JPY 17,000,000 (1) 0.00
11/09/2014 USD (336,605) MXN 4,370,000 (1,462) 0.00
02/07/2014 USD (857,276) MYR 2,751,000 (537) 0.00
15/07/2014 USD (590,680) NOK 3,552,000 (12,180) (0.01)
18/07/2014 USD (182,899) SEK 1,220,000 (454) 0.00
14/08/2014 USD (106,128) THB 3,450,000 (56) 0.00
11/09/2014 USD (605,648) TRY 1,300,000 (1,846) 0.00
12/08/2014 AUD (2,540,000) USD 2,355,012 (34,503) (0.01)
11/09/2014 AUD (740,000) USD 684,922 (9,825) 0.00
18/07/2014 AUD (490,000) USD 460,399 (1,416) 0.00
16/07/2014 AUD (300,000) USD 281,550 (1,240) 0.00
28/07/2014 BRL (1,303,000) USD 576,090 (9,935) 0.00
28/07/2014 BRL (977,000) USD 435,189 (4,217) 0.00
11/09/2014 CAD (1,515,000) USD 1,380,681 (39,045) (0.02)
11/09/2014 CZK (2,590,000) USD 128,339 (946) 0.00

STANLIB Funds Limited
Notes to the Financial Statements (continued)
43
Maturity date Purchase Currency Amount Sell Currency Amount Unrealised gain/
(loss) % of net assets
11/09/2014 DKK (2,900,000) USD 527,536 (5,268) 0.00
16/07/2014 EUR (1,035,000) USD 1,404,547 (12,613) (0.01)
14/08/2014 GBP (780,000) USD 1,322,833 (10,355) 0.00
11/09/2014 GBP (175,000) USD 293,598 (5,443) 0.00
14/08/2014 IDR (9,413,000,000) USD 777,741 (10,612) (0.01)
01/07/2014 IDR (9,413,000,000) USD 787,238 (6,773) 0.00
14/07/2014 JPY (239,400) USD 2,344 (20) 0.00
11/09/2014 JPY (21,000,000) USD 207,395 (11) 0.00
11/09/2014 KRW (1,109,330,000) USD 1,083,658 (9,856) 0.00
14/07/2014 MXN (5,350,000) USD 411,633 (318) 0.00
14/07/2014 MXN (3,048,000) USD 234,516 (181) 0.00
23/07/2014 MXN (1,990,000) USD 152,948 (177) 0.00
02/07/2014 MYR (1,176,000) USD 364,482 (1,758) 0.00
02/07/2014 MYR (1,575,000) USD 489,267 (1,232) 0.00
14/08/2014 MYR (2,751,000) USD 855,464 (187) 0.00
15/07/2014 NZD (1,153,000) USD 971,771 (36,243) (0.01)
19/09/2014 NZD (1,670,000) USD 1,437,870 (12,983) (0.01)
11/09/2014 NZD (380,000) USD 318,638 (11,752) (0.01)
18/07/2014 PHP (12,339,000) USD 281,867 (794) 0.00
11/07/2014 PLN (4,431,000) USD 1,445,536 (12,472) (0.01)
25/07/2014 PLN (6,410,000) USD 2,101,260 (5,827) 0.00
11/09/2014 SEK (1,010,000) USD 150,925 (36) 0.00
11/09/2014 SGD (650,000) USD 517,359 (4,050) 0.00
02/07/2014 USD (112,135) ZAR 1,180,000 (1,220) 0.00
14/08/2014 USD (110,312) ZAR 1,180,000 (265) 0.00
18/07/2014 USD (426,489) ZAR 4,550,000 (211) 0.00
Total unrealised loss on foreign currency contracts (326,280) (0.13)
BNY Mellon, Citibank, Credit Suisse, Goldman Sachs, HSBC Bank Plc, JP Morgan, Morgan Stanley, Standard Chartered, State Street Bank, Westpac, Barclays and UBS are the counterparties to these Foreign currency contracts.
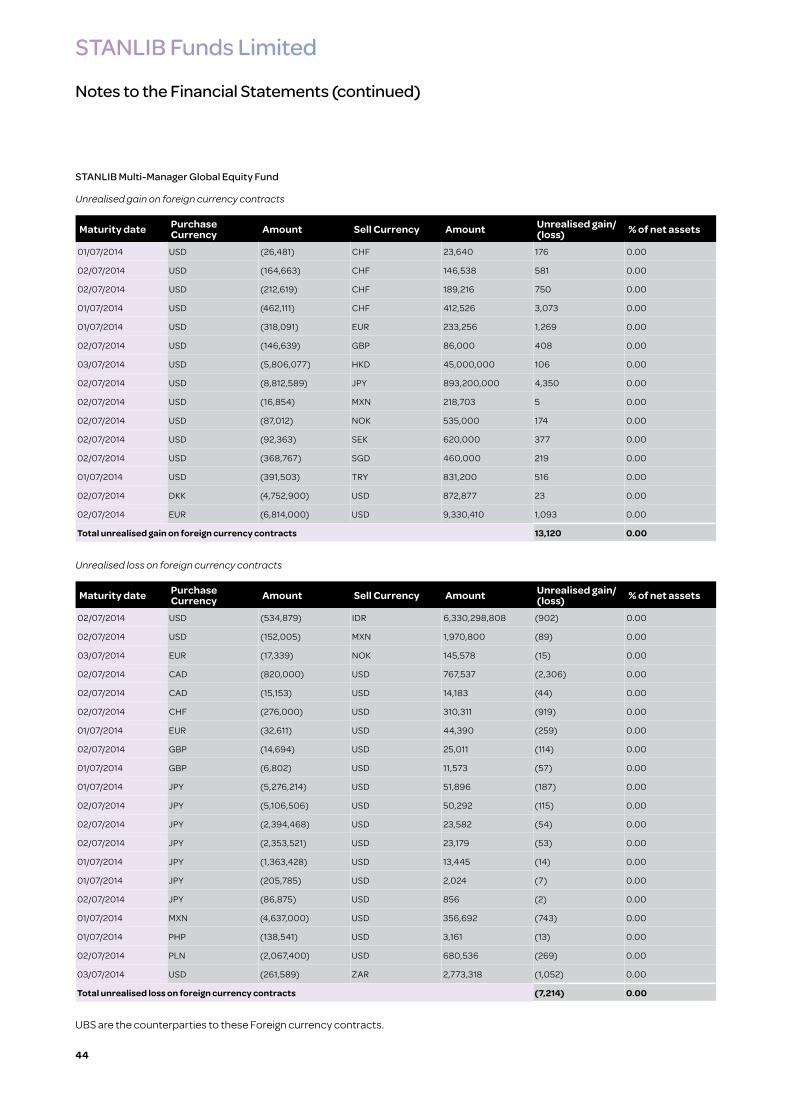
STANLIB Funds Limited
Notes to the Financial Statements (continued)
44
STANLIB Multi-Manager Global Equity Fund
Unrealised gain on foreign currency contracts
Maturity date Purchase Currency Amount Sell Currency Amount Unrealised gain/
(loss) % of net assets
01/07/2014 USD (26,481) CHF 23,640 176 0.00
02/07/2014 USD (164,663) CHF 146,538 581 0.00
02/07/2014 USD (212,619) CHF 189,216 750 0.00
01/07/2014 USD (462,111) CHF 412,526 3,073 0.00
01/07/2014 USD (318,091) EUR 233,256 1,269 0.00
02/07/2014 USD (146,639) GBP 86,000 408 0.00
03/07/2014 USD (5,806,077) HKD 45,000,000 106 0.00
02/07/2014 USD (8,812,589) JPY 893,200,000 4,350 0.00
02/07/2014 USD (16,854) MXN 218,703 5 0.00
02/07/2014 USD (87,012) NOK 535,000 174 0.00
02/07/2014 USD (92,363) SEK 620,000 377 0.00
02/07/2014 USD (368,767) SGD 460,000 219 0.00
01/07/2014 USD (391,503) TRY 831,200 516 0.00
02/07/2014 DKK (4,752,900) USD 872,877 23 0.00
02/07/2014 EUR (6,814,000) USD 9,330,410 1,093 0.00
Total unrealised gain on foreign currency contracts 13,120 0.00
Unrealised loss on foreign currency contracts
Maturity date Purchase Currency Amount Sell Currency Amount Unrealised gain/
(loss) % of net assets
02/07/2014 USD (534,879) IDR 6,330,298,808 (902) 0.00
02/07/2014 USD (152,005) MXN 1,970,800 (89) 0.00
03/07/2014 EUR (17,339) NOK 145,578 (15) 0.00
02/07/2014 CAD (820,000) USD 767,537 (2,306) 0.00
02/07/2014 CAD (15,153) USD 14,183 (44) 0.00
02/07/2014 CHF (276,000) USD 310,311 (919) 0.00
01/07/2014 EUR (32,611) USD 44,390 (259) 0.00
02/07/2014 GBP (14,694) USD 25,011 (114) 0.00
01/07/2014 GBP (6,802) USD 11,573 (57) 0.00
01/07/2014 JPY (5,276,214) USD 51,896 (187) 0.00
02/07/2014 JPY (5,106,506) USD 50,292 (115) 0.00
02/07/2014 JPY (2,394,468) USD 23,582 (54) 0.00
02/07/2014 JPY (2,353,521) USD 23,179 (53) 0.00
01/07/2014 JPY (1,363,428) USD 13,445 (14) 0.00
01/07/2014 JPY (205,785) USD 2,024 (7) 0.00
02/07/2014 JPY (86,875) USD 856 (2) 0.00
01/07/2014 MXN (4,637,000) USD 356,692 (743) 0.00
01/07/2014 PHP (138,541) USD 3,161 (13) 0.00
02/07/2014 PLN (2,067,400) USD 680,536 (269) 0.00
03/07/2014 USD (261,589) ZAR 2,773,318 (1,052) 0.00
Total unrealised loss on foreign currency contracts (7,214) 0.00
UBS are the counterparties to these Foreign currency contracts.

STANLIB Funds Limited
Notes to the Financial Statements (continued)
45
High Alpha Global Equity Fund
Unrealised loss on foreign currency contracts
Maturity date Purchase Currency Amount Sell Currency Amount Unrealised gain/
(loss) % of net assets
02/07/2014 CAD (86,000) USD 80,516 (223) 0.00
02/07/2014 JPY (14,623,000) USD 144,294 (53) 0.00
Total unrealised loss on foreign currency contracts (276) 0.00
JP Morgan and UBS are the counterparties to these Foreign currency contracts.
STANLIB Global Bond Fund
Unrealised gain on foreign currency contracts
Maturity date Purchase Currency Amount Sell Currency Amount Unrealised gain/
(loss) % of net assets
29/08/2014 USD (3,692,910) BRL 8,490,000 91,438 0.07
28/07/2014 USD (748,654) CLP 417,000,000 2,086 0.00
11/07/2014 USD (672,221) CLP 380,000,000 13,243 0.01
28/07/2014 USD (1,340,666) CLP 753,000,000 14,986 0.01
14/07/2014 USD (1,839,488) TRY 3,940,000 13,145 0.01
07/08/2014 EUR (470,000) USD 646,478 2,879 0.00
07/08/2014 EUR (3,750,000) USD 5,182,500 47,401 0.04
Total unrealised gain on foreign currency contracts 185,178 0.14
Unrealised loss on foreign currency contracts
Maturity date Purchase Currency Amount Sell Currency Amount Unrealised gain/
(loss) % of net assets
18/08/2014 USD (2,584,339) CLP 1,431,000,000 (13,601) (0.01)
10/09/2014 USD (2,599,479) CLP 1,447,000,000 (6,330) (0.01)
26/09/2014 USD (2,382,574) CLP 1,329,000,000 (5,097) 0.00
19/09/2014 USD (3,198,767) HUF 716,140,000 (40,600) (0.03)
08/09/2014 USD (4,972,609) IDR 59,000,000,000 (49,045) (0.04)
14/08/2014 USD (6,595,670) INR 397,000,000 (39,615) (0.03)
12/08/2014 AUD (7,170,000) USD 6,647,809 (97,396) (0.07)
19/09/2014 NZD (5,930,000) USD 5,105,730 (46,101) (0.04)
25/07/2014 PLN (17,580,000) USD 5,762,895 (15,981) (0.01)
18/07/2014 USD (1,072,316) ZAR 11,440,000 (531) 0.00
Total unrealised loss on foreign currency contracts (314,297) (0.24)
Citibank, HSBC Bank Plc, JP Morgan and Morgan Stanley are the counterparties to these Foreign currency contracts.
STANLIB Global Emerging Markets Fund
Unrealised gain on foreign currency contracts
Maturity date Purchase Currency Amount Sell Currency Amount Unrealised gain/
(loss) % of net assets
02/07/2014 HKD (193,000) USD 24,903 1 0.00
Total unrealised gain on foreign currency contracts 1 0.00
JP Morgan is the counterparty to this Foreign currency contracts.

STANLIB Funds Limited
Notes to the Financial Statements (continued)
46
STANLIB Global Balanced Fund
Unrealised gain on foreign currency contracts
Maturity date Purchase Currency Amount Sell Currency Amount Unrealised gain/
(loss) % of net assets
11/07/2014 USD (9,550) AUD 10,215 83 0.00
11/07/2014 USD (74,900) AUD 80,342 864 0.00
11/07/2014 USD (806,130) AUD 867,305 11,753 0.01
11/07/2014 USD (9,550) CAD 10,484 289 0.00
11/07/2014 USD (74,900) CAD 82,617 2,640 0.00
11/07/2014 USD (806,130) CAD 882,080 21,746 0.02
03/07/2014 GBP (480,295) EUR 600,000 282 0.00
01/07/2014 USD (32,433) EUR 23,752 87 0.00
03/07/2014 EUR (495,147) GBP 400,000 5,989 0.01
11/07/2014 USD (9,550) GBP 5,714 220 0.00
11/07/2014 USD (74,900) GBP 44,629 1,402 0.00
11/07/2014 USD (806,130) GBP 481,639 17,324 0.01
11/07/2014 USD (9,550) JPY 970,282 29 0.00
11/07/2014 USD (74,900) JPY 7,658,637 707 0.00
11/07/2014 USD (806,130) JPY 82,062,986 4,003 0.00
03/07/2014 USD (4,914,773) JPY 500,000,000 20,941 0.02
03/07/2014 USD (330,974) KRW 340,000,000 5,034 0.01
03/07/2014 USD (61,991) MYR 200,000 291 0.00
03/07/2014 USD (81,620) PLN 250,000 689 0.00
03/07/2014 USD (43,966) SGD 55,214 323 0.00
11/07/2014 SEK (83,874) USD 12,625 81 0.00
03/07/2014 ZAR (3,250,000) USD 308,364 3,045 0.00
Total unrealised gain on foreign currency contracts 97,822 0.08

STANLIB Funds Limited
Notes to the Financial Statements (continued)
47
Unrealised loss on foreign currency contracts
Maturity date Purchase Currency Amount Sell Currency Amount Unrealised gain/
(loss) % of net assets
11/07/2014 USD (806,130) DKK 4,350,796 (7,069) (0.01)
11/07/2014 USD (74,900) DKK 404,695 (574) 0.00
11/07/2014 USD (9,550) DKK 51,311 (126) 0.00
11/07/2014 USD (4,836,775) EUR 3,499,419 (45,348) (0.04)
11/07/2014 USD (449,400) EUR 325,438 (3,809) 0.00
11/07/2014 USD (57,290) EUR 41,259 (799) 0.00
11/07/2014 USD (21,430) EUR 15,499 (208) 0.00
11/07/2014 USD (806,130) SEK 5,248,805 (21,124) (0.02)
11/07/2014 USD (74,900) SEK 494,861 (889) 0.00
11/07/2014 USD (9,550) SEK 62,449 (210) 0.00
03/07/2014 AUD (614,987) USD 566,695 (13,625) (0.01)
11/07/2014 AUD (13,619) USD 12,625 (218) 0.00
11/07/2014 AUD (19,719) USD 18,550 (45) 0.00
03/07/2014 CAD (600,000) USD 552,156 (11,098) (0.01)
11/07/2014 CAD (13,689) USD 12,625 (223) 0.00
11/07/2014 CAD (19,920) USD 18,550 (146) 0.00
11/07/2014 DKK (101,737) USD 18,550 (135) 0.00
11/07/2014 DKK (69,208) USD 12,625 (86) 0.00
11/07/2014 EUR (81,893) USD 111,312 (816) 0.00
11/07/2014 EUR (71,372) USD 97,150 (573) 0.00
03/07/2014 GBP (480,000) USD 815,113 (5,594) 0.00
11/07/2014 GBP (7,556) USD 12,625 (293) 0.00
11/07/2014 GBP (10,909) USD 18,550 (100) 0.00
11/07/2014 JPY (1,890,307) USD 18,550 (111) 0.00
11/07/2014 JPY (1,281,882) USD 12,625 (30) 0.00
02/07/2014 JPY (11,765) USD 116 – 0.00
03/07/2014 NZD (478,000) USD 404,522 (13,873) (0.01)
11/07/2014 SEK (124,372) USD 18,550 (51) 0.00
03/07/2014 USD (361,778) ZAR 3,850,000 (92) 0.00
Total unrealised loss on foreign currency contracts (127,265) (0.10)
BNY Mellon, Goldman Sachs, JP Morgan, and UBS are the counterparties to these Foreign currency contracts.

STANLIB Funds Limited
Notes to the Financial Statements (continued)
48
STANLIB Global Balanced Cautious Fund
Unrealised gain on foreign currency contracts
Maturity date Purchase Currency Amount Sell Currency Amount Unrealised gain/
(loss) % of net assets
11/07/2014 USD (13,540) AUD 14,483 118 0.00
11/07/2014 USD (1,096,740) AUD 1,179,969 15,990 0.04
11/07/2014 USD (13,540) CAD 14,864 410 0.00
11/07/2014 USD (1,096,740) CAD 1,200,069 29,585 0.07
03/07/2014 GBP (240,148) EUR 300,000 141 0.00
01/07/2014 USD (4,633) EUR 3,393 13 0.00
11/07/2014 USD (7,173) EUR 5,277 53 0.00
03/07/2014 EUR (247,573) GBP 200,000 2,994 0.01
11/07/2014 USD (13,540) GBP 8,102 311 0.00
11/07/2014 USD (1,096,740) GBP 655,270 23,570 0.05
11/07/2014 USD (13,540) JPY 1,375,667 41 0.00
11/07/2014 USD (1,096,740) JPY 111,646,706 5,446 0.01
03/07/2014 USD (2,457,386) JPY 250,000,000 10,471 0.02
03/07/2014 USD (165,487) KRW 170,000,000 2,517 0.01
03/07/2014 USD (30,996) MYR 100,000 146 0.00
03/07/2014 USD (40,810) PLN 125,000 344 0.00
03/07/2014 USD (23,301) SGD 29,262 171 0.00
11/07/2014 DKK (26,421) USD 4,890 38 0.00
11/07/2014 EUR (11,822) USD 16,345 159 0.00
11/07/2014 EUR (21,218) USD 29,300 248 0.00
11/07/2014 SEK (32,308) USD 4,890 58 0.00
11/07/2014 SEK (126,891) USD 19,100 122 0.00
03/07/2014 ZAR (1,560,000) USD 148,015 1,461 0.00
Total unrealised gain on foreign currency contracts 94,407 0.21

STANLIB Funds Limited
Notes to the Financial Statements (continued)
49
Unrealised loss on foreign currency contracts
Maturity date Purchase Currency Amount Sell Currency Amount Unrealised gain/
(loss) % of net assets
11/07/2014 USD (1,096,740) DKK 5,919,259 (9,618) (0.02)
11/07/2014 USD (13,540) DKK 72,748 (179) 0.00
11/07/2014 USD (6,580,465) EUR 4,760,984 (61,696) (0.14)
11/07/2014 USD (81,180) EUR 58,464 (1,131) 0.00
11/07/2014 USD (1,096,740) SEK 7,141,000 (28,738) (0.06)
11/07/2014 USD (13,540) SEK 88,540 (298) 0.00
03/07/2014 AUD (309,998) USD 285,656 (6,868) (0.02)
11/07/2014 AUD (20,604) USD 19,100 (330) 0.00
11/07/2014 AUD (5,245) USD 4,890 (56) 0.00
03/07/2014 CAD (320,000) USD 294,483 (5,919) (0.01)
11/07/2014 CAD (20,710) USD 19,100 (337) 0.00
11/07/2014 CAD (5,394) USD 4,890 (172) 0.00
11/07/2014 DKK (104,704) USD 19,100 (130) 0.00
11/07/2014 EUR (72,144) USD 98,200 (580) 0.00
03/07/2014 GBP (250,000) USD 424,538 (2,914) (0.01)
11/07/2014 GBP (11,431) USD 19,100 (443) 0.00
11/07/2014 GBP (2,914) USD 4,890 (92) 0.00
11/07/2014 JPY (500,010) USD 4,890 (46) 0.00
11/07/2014 JPY (1,939,323) USD 19,100 (45) 0.00
02/07/2014 JPY (3,624) USD 36 – 0.00
03/07/2014 NZD (267,000) USD 225,957 (7,749) (0.02)
03/07/2014 USD (176,661) ZAR 1,880,000 (45) 0.00
Total unrealised loss on foreign currency contracts (127,386) (0.28)
BNY Mellon, Goldman Sachs, JP Morgan and UBS are the counterparties to these Foreign currency contracts.
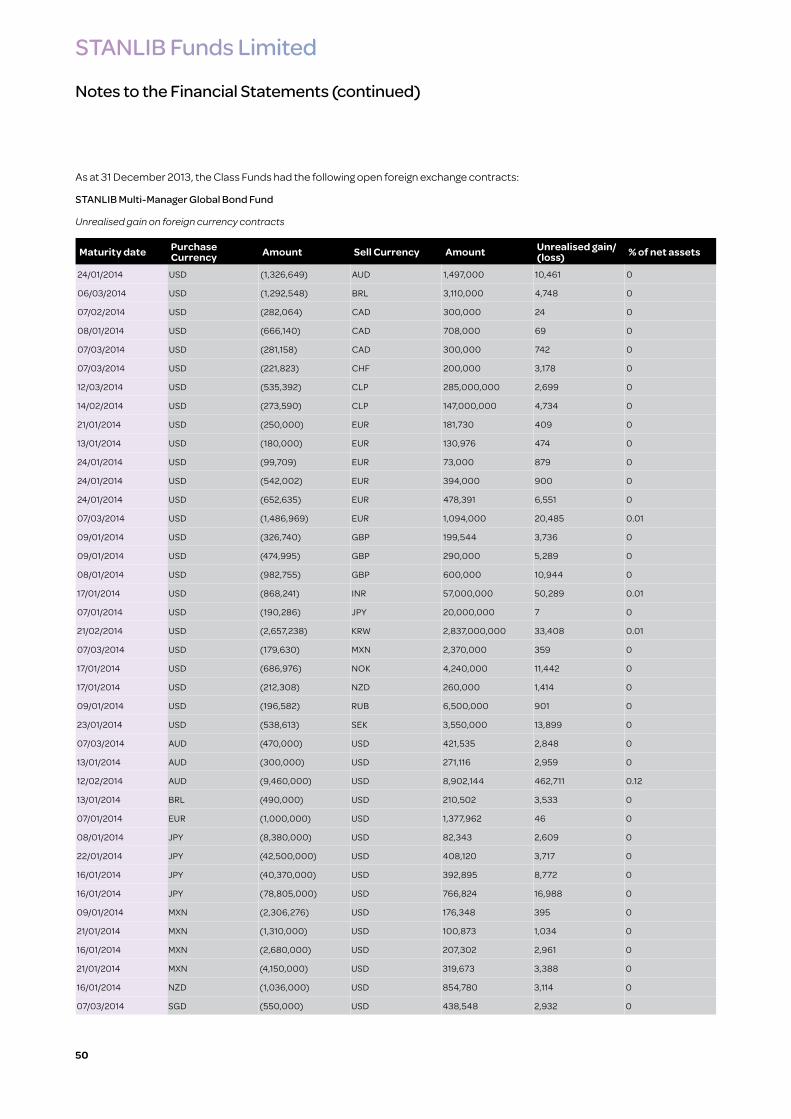
STANLIB Funds Limited
Notes to the Financial Statements (continued)
50
As at 31 December 2013, the Class Funds had the following open foreign exchange contracts:
STANLIB Multi-Manager Global Bond Fund
Unrealised gain on foreign currency contracts
Maturity date Purchase Currency Amount Sell Currency Amount Unrealised gain/
(loss) % of net assets
24/01/2014 USD (1,326,649) AUD 1,497,000 10,461 0
06/03/2014 USD (1,292,548) BRL 3,110,000 4,748 0
07/02/2014 USD (282,064) CAD 300,000 24 0
08/01/2014 USD (666,140) CAD 708,000 69 0
07/03/2014 USD (281,158) CAD 300,000 742 0
07/03/2014 USD (221,823) CHF 200,000 3,178 0
12/03/2014 USD (535,392) CLP 285,000,000 2,699 0
14/02/2014 USD (273,590) CLP 147,000,000 4,734 0
21/01/2014 USD (250,000) EUR 181,730 409 0
13/01/2014 USD (180,000) EUR 130,976 474 0
24/01/2014 USD (99,709) EUR 73,000 879 0
24/01/2014 USD (542,002) EUR 394,000 900 0
24/01/2014 USD (652,635) EUR 478,391 6,551 0
07/03/2014 USD (1,486,969) EUR 1,094,000 20,485 0.01
09/01/2014 USD (326,740) GBP 199,544 3,736 0
09/01/2014 USD (474,995) GBP 290,000 5,289 0
08/01/2014 USD (982,755) GBP 600,000 10,944 0
17/01/2014 USD (868,241) INR 57,000,000 50,289 0.01
07/01/2014 USD (190,286) JPY 20,000,000 7 0
21/02/2014 USD (2,657,238) KRW 2,837,000,000 33,408 0.01
07/03/2014 USD (179,630) MXN 2,370,000 359 0
17/01/2014 USD (686,976) NOK 4,240,000 11,442 0
17/01/2014 USD (212,308) NZD 260,000 1,414 0
09/01/2014 USD (196,582) RUB 6,500,000 901 0
23/01/2014 USD (538,613) SEK 3,550,000 13,899 0
07/03/2014 AUD (470,000) USD 421,535 2,848 0
13/01/2014 AUD (300,000) USD 271,116 2,959 0
12/02/2014 AUD (9,460,000) USD 8,902,144 462,711 0.12
13/01/2014 BRL (490,000) USD 210,502 3,533 0
07/01/2014 EUR (1,000,000) USD 1,377,962 46 0
08/01/2014 JPY (8,380,000) USD 82,343 2,609 0
22/01/2014 JPY (42,500,000) USD 408,120 3,717 0
16/01/2014 JPY (40,370,000) USD 392,895 8,772 0
16/01/2014 JPY (78,805,000) USD 766,824 16,988 0
09/01/2014 MXN (2,306,276) USD 176,348 395 0
21/01/2014 MXN (1,310,000) USD 100,873 1,034 0
16/01/2014 MXN (2,680,000) USD 207,302 2,961 0
21/01/2014 MXN (4,150,000) USD 319,673 3,388 0
16/01/2014 NZD (1,036,000) USD 854,780 3,114 0
07/03/2014 SGD (550,000) USD 438,548 2,932 0
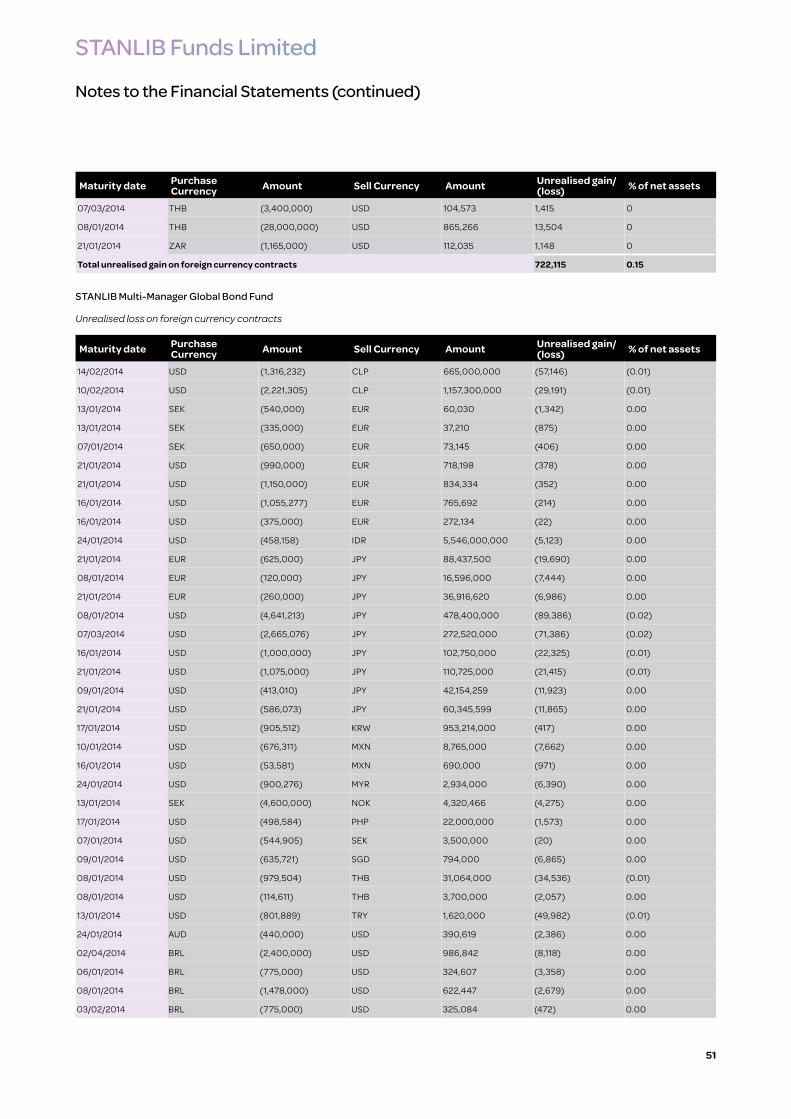
STANLIB Funds Limited
Notes to the Financial Statements (continued)
51
Maturity date Purchase Currency Amount Sell Currency Amount Unrealised gain/
(loss) % of net assets
07/03/2014 THB (3,400,000) USD 104,573 1,415 0
08/01/2014 THB (28,000,000) USD 865,266 13,504 0
21/01/2014 ZAR (1,165,000) USD 112,035 1,148 0
Total unrealised gain on foreign currency contracts 722,115 0.15
STANLIB Multi-Manager Global Bond Fund
Unrealised loss on foreign currency contracts
Maturity date Purchase Currency Amount Sell Currency Amount Unrealised gain/
(loss) % of net assets
14/02/2014 USD (1,316,232) CLP 665,000,000 (57,146) (0.01)
10/02/2014 USD (2,221,305) CLP 1,157,300,000 (29,191) (0.01)
13/01/2014 SEK (540,000) EUR 60,030 (1,342) 0.00
13/01/2014 SEK (335,000) EUR 37,210 (875) 0.00
07/01/2014 SEK (650,000) EUR 73,145 (406) 0.00
21/01/2014 USD (990,000) EUR 718,198 (378) 0.00
21/01/2014 USD (1,150,000) EUR 834,334 (352) 0.00
16/01/2014 USD (1,055,277) EUR 765,692 (214) 0.00
16/01/2014 USD (375,000) EUR 272,134 (22) 0.00
24/01/2014 USD (458,158) IDR 5,546,000,000 (5,123) 0.00
21/01/2014 EUR (625,000) JPY 88,437,500 (19,690) 0.00
08/01/2014 EUR (120,000) JPY 16,596,000 (7,444) 0.00
21/01/2014 EUR (260,000) JPY 36,916,620 (6,986) 0.00
08/01/2014 USD (4,641,213) JPY 478,400,000 (89,386) (0.02)
07/03/2014 USD (2,665,076) JPY 272,520,000 (71,386) (0.02)
16/01/2014 USD (1,000,000) JPY 102,750,000 (22,325) (0.01)
21/01/2014 USD (1,075,000) JPY 110,725,000 (21,415) (0.01)
09/01/2014 USD (413,010) JPY 42,154,259 (11,923) 0.00
21/01/2014 USD (586,073) JPY 60,345,599 (11,865) 0.00
17/01/2014 USD (905,512) KRW 953,214,000 (417) 0.00
10/01/2014 USD (676,311) MXN 8,765,000 (7,662) 0.00
16/01/2014 USD (53,581) MXN 690,000 (971) 0.00
24/01/2014 USD (900,276) MYR 2,934,000 (6,390) 0.00
13/01/2014 SEK (4,600,000) NOK 4,320,466 (4,275) 0.00
17/01/2014 USD (498,584) PHP 22,000,000 (1,573) 0.00
07/01/2014 USD (544,905) SEK 3,500,000 (20) 0.00
09/01/2014 USD (635,721) SGD 794,000 (6,865) 0.00
08/01/2014 USD (979,504) THB 31,064,000 (34,536) (0.01)
08/01/2014 USD (114,611) THB 3,700,000 (2,057) 0.00
13/01/2014 USD (801,889) TRY 1,620,000 (49,982) (0.01)
24/01/2014 AUD (440,000) USD 390,619 (2,386) 0.00
02/04/2014 BRL (2,400,000) USD 986,842 (8,118) 0.00
06/01/2014 BRL (775,000) USD 324,607 (3,358) 0.00
08/01/2014 BRL (1,478,000) USD 622,447 (2,679) 0.00
03/02/2014 BRL (775,000) USD 325,084 (472) 0.00

STANLIB Funds Limited
Notes to the Financial Statements (continued)
52
Maturity date Purchase Currency Amount Sell Currency Amount Unrealised gain/
(loss) % of net assets
07/03/2014 CAD (1,975,000) USD 1,849,840 (6,003) 0.00
08/01/2014 CAD (708,000) USD 664,870 (1,339) 0.00
07/03/2014 CZK (500,000) USD 24,815 (370) 0.00
07/03/2014 DKK (4,320,000) USD 788,330 (9,999) 0.00
07/02/2014 EUR (2,520,000) USD 3,402,454 (69,928) (0.02)
06/01/2014 EUR (450,000) USD 611,460 (8,602) 0.00
24/01/2014 EUR (400,000) USD 546,856 (4,314) 0.00
07/03/2014 EUR (220,000) USD 300,452 (2,692) 0.00
24/01/2014 EUR (60,000) USD 81,854 (822) 0.00
13/01/2014 EUR (150,000) USD 206,145 (543) 0.00
21/01/2014 EUR (150,000) USD 206,538 (150) 0.00
14/01/2014 EUR (75,000) USD 103,230 (114) 0.00
08/01/2014 GBP (280,000) USD 457,905 (5,821) 0.00
08/01/2014 GBP (320,000) USD 524,314 (5,659) 0.00
07/03/2014 GBP (155,000) USD 253,446 (3,156) 0.00
07/03/2014 ILS (260,000) USD 73,774 (1,050) 0.00
21/02/2014 KRW (2,837,000,000) USD 2,635,882 (54,764) (0.01)
07/03/2014 NOK (940,000) USD 153,272 (1,291) 0.00
17/01/2014 NZD (3,370,000) USD 2,756,711 (13,462) 0.00
17/01/2014 NZD (280,000) USD 228,588 (1,574) 0.00
07/03/2014 NZD (280,000) USD 228,055 (1,308) 0.00
24/01/2014 PLN (11,090,000) USD 3,570,667 (98,852) (0.03)
08/01/2014 PLN (2,606,000) USD 837,565 (25,626) (0.01)
24/01/2014 PLN (700,000) USD 225,263 (6,356) 0.00
07/03/2014 PLN (70,000) USD 22,534 (570) 0.00
09/01/2014 RUB (6,500,000) USD 195,389 (2,095) 0.00
22/01/2014 RUB (6,500,000) USD 196,126 (889) 0.00
23/01/2014 SEK (7,152,000) USD 1,090,045 (23,072) (0.01)
13/01/2014 SEK (960,000) USD 146,646 (2,792) 0.00
07/03/2014 SEK (300,000) USD 46,079 (578) 0.00
24/01/2014 ZAR (2,100,000) USD 199,279 (516) 0.00
07/03/2014 USD (472,795) ZAR 4,980,000 (1,844) 0.00
Total unrealised loss on foreign currency contracts (845,381) (0.22)
Barclays, Citibank, HSBC Bank Plc, JP Morgan, Morgan Stanley and UBS are the counterparties to these Foreign currency contracts.

STANLIB Funds Limited
Notes to the Financial Statements (continued)
53
STANLIB Multi-Manager Global Equity Fund
Unrealised gain on foreign currency contracts
Maturity date Purchase Currency Amount Sell Currency Amount Unrealised gain/
(loss) % of net assets
06/01/2014 JPY (33,600,000) USD 320,076 386 0
Total unrealised gain on foreign currency contracts 386 0
Unrealised loss on foreign currency contracts
Maturity date Purchase Currency Amount Sell Currency Amount Unrealised gain/
(loss) % of net assets
06/01/2014 USD (15,433) JPY 1,615,730 (60) 0
Total unrealised loss on foreign currency contracts (60) 0
BNY Mellon and JP Morgan are the counterparties to these Foreign currency contracts.
STANLIB Global Bond Fund
Unrealised gain on foreign currency contracts
Maturity date Purchase Currency Amount Sell Currency Amount Unrealised gain/
(loss) % of net assets
12/03/2014 USD (2,181,019) CLP 1,161,000,000 10,995 0.01
17/01/2014 USD (318,674) INR 20,000,000 3,617 0
17/01/2014 USD (418,994) INR 27,000,000 16,099 0.01
17/01/2014 USD (913,938) INR 60,000,000 52,936 0.03
21/02/2014 USD (2,225,448) KRW 2,376,000,000 27,980 0.02
12/02/2014 AUD (16,690,000) USD 15,705,791 816,348 0.52
17/01/2014 NZD (750,000) USD 618,349 1,841 0
Total unrealised gain on foreign currency contracts 929,816 0.59
Unrealised loss on foreign currency contracts
Maturity date Purchase Currency Amount Sell Currency Amount Unrealised gain/
(loss) % of net assets
14/02/2014 USD (1,522,079) CLP 769,000,000 (66,083) -0.04
10/02/2014 USD (2,777,351) CLP 1,447,000,000 (36,498) -0.02
14/02/2014 USD (1,093,110) CLP 560,000,000 (32,827) -0.02
17/01/2014 USD (338,189) NZD 410,000 (1,164) 0
13/01/2014 USD (1,019,686) TRY 2,060,000 (63,557) -0.04
13/01/2014 USD (438,094) TRY 880,000 (29,651) -0.02
07/02/2014 EUR (3,750,000) USD 5,063,175 (104,059) -0.07
21/02/2014 KRW (2,376,000,000) USD 2,207,563 (45,865) -0.03
17/01/2014 NZD (3,880,000) USD 3,173,898 (15,499) -0.01
17/01/2014 NZD (1,710,000) USD 1,402,970 (2,667) 0
24/01/2014 PLN (18,590,000) USD 5,985,456 (165,704) -0.11
24/01/2014 PLN (2,660,000) USD 873,423 (6,732) 0
Total unrealised loss on foreign currency contracts (570,306) -0.36
Barclays, BNP Paribas, BNY Mellon, Bank of America, Citibank, Credit Suisse, Deutsche, Goldman Sachs, HSBC Bank Plc, JP Morgan, Morgan Stanley, Royal Bank of Canada, Royal Bank of Scotland, Standard Chartered Bank London, State Street, UBS and Westpac are the counterparties to these Foreign currency contracts.

STANLIB Funds Limited
Notes to the Financial Statements (continued)
54
STANLIB Global Emerging Markets Fund
Unrealised gain on foreign currency contracts
Maturity date Purchase Currency Amount Sell Currency Amount Unrealised gain/
(loss) % of net assets
06/01/2014 USD (8,720) PHP 386,679 – –
Total unrealised gain on foreign currency contracts – –
STANLIB Global Emerging Markets Fund
Unrealised loss on foreign currency contracts
Maturity date Purchase Currency Amount Sell Currency Amount Unrealised gain/
(loss) % of net assets
03/01/2014 USD (107,748) PHP 4,777,915 (44) 0.00
03/01/2014 USD (105,857) PHP 4,694,067 (44) 0.00
03/01/2014 USD (93,372) PHP 4,140,427 (38) 0.00
03/01/2014 USD (80,226) PHP 3,557,480 (33) 0.00
03/01/2014 USD (65,371) PHP 2,898,776 (27) 0.00
03/01/2014 USD (62,639) PHP 2,777,641 (26) 0.00
03/01/2014 USD (56,603) PHP 2,509,978 (23) 0.00
03/01/2014 USD (1,288) PHP 57,106 (1) 0.00
Total unrealised loss on foreign currency contracts (236) 0.00
Barclays, Citibank, HSBC Bank Plc, JP Morgan, Morgan Stanley and UBS are the counterparties to these Foreign currency contracts.
STANLIB Global Balanced Fund
Unrealised gain on foreign currency contracts
Maturity date Purchase Currency Amount Sell Currency Amount Unrealised gain/
(loss) % of net assets
06/01/2014 USD 46 GBP 28 – –
21/01/2014 USD 31,600 AUD 33,891 1,322 0
21/01/2014 AUD 57,657 USD 51,465 44 0
21/01/2014 USD 31,600 CAD 33,161 406 0
21/01/2014 DKK 1,961,197 USD 359,115 3,184 0.01
21/01/2014 DKK 280,065 USD 51,465 273 0
21/01/2014 EUR 1,577,932 USD 2,154,685 19,584 0.03
21/01/2014 EUR 225,309 USD 308,800 1,659 0
21/01/2014 GBP 223,265 USD 359,115 10,616 0.02
21/01/2014 GBP 46,865 USD 76,690 920 0
21/01/2014 GBP 31,468 USD 51,465 647 0
21/01/2014 USD 31,600 JPY 3,167,378 1,461 0
21/01/2014 SEK 2,314,198 USD 359,115 1,073 0
21/01/2014 SEK 502,757 USD 76,690 1,560 0.01
21/01/2014 SEK 337,124 USD 51,465 1,006 0
23/01/2014 EUR 125,000 USD 172,161 78 0
23/01/2014 KRW 160,000,000 USD 151,659 376 0
Total unrealised gain on foreign currency contracts 44,209 0.07

STANLIB Funds Limited
Notes to the Financial Statements (continued)
55
STANLIB Global Balanced Fund
Unrealised loss on foreign currency contracts
Maturity date Purchase Currency Amount Sell Currency Amount Unrealised gain/
(loss) % of net assets
06/01/2014 USD 105 GBP 63 – –
21/01/2014 AUD 375,444 USD 359,115 (23,703) (0)
21/01/2014 AUD 84,843 USD 76,690 (893) 0
21/01/2014 CAD 370,672 USD 359,115 (10,433) (0)
21/01/2014 CAD 81,456 USD 76,690 (66) 0
21/01/2014 CAD 54,563 USD 51,465 (139) 0
21/01/2014 USD 31,600 DKK 174,663 (666) 0
21/01/2014 DKK 414,640 USD 76,690 (92) 0
21/01/2014 USD 41,200 EUR 30,131 (319) 0
21/01/2014 USD 148,000 EUR 109,729 (3,198) 0
21/01/2014 EUR 333,389 USD 459,730 (346) 0
21/01/2014 USD 31,600 GBP 19,614 (881) 0
21/01/2014 JPY 35,128,486 USD 359,115 (24,856) (0)
21/01/2014 JPY 7,855,280 USD 76,690 (1,944) 0
21/01/2014 JPY 5,351,279 USD 51,465 (546) 0
21/01/2014 USD 31,600 SEK 210,313 (1,134) 0
23/01/2014 JPY 43,900,224 AUD 480,000 (11,033) (0)
23/01/2014 JPY 31,419,700 CAD 325,000 (6,732) (0)
06/01/2014 JPY 35,000,000 USD 333,572 (561) 0
23/01/2014 JPY 149,292,435 USD 1,450,000 (29,419) (0)
Total unrealised loss on foreign currency contracts (116,961) (0)
Barclays, Citibank, HSBC Bank Plc, JP Morgan, Morgan Stanley and UBS are the counterparties to these Foreign currency contracts.

STANLIB Funds Limited
Notes to the Financial Statements (continued)
56
STANLIB Global Balanced Cautious Fund
Unrealised gain on foreign currency contracts
Maturity date Purchase Currency Amount Sell Currency Amount Unrealised gain/
(loss) % of net assets
06/01/2014 USD 11 GBP 6 – –
06/01/2014 USD 24 GBP 15 – –
21/01/2014 USD 12,500 AUD 13,406 523 0
21/01/2014 USD 12,500 CAD 13,118 161 0
21/01/2014 CAD 121,448 USD 113,870 373 0
21/01/2014 DKK 1,891,184 USD 346,295 3,070 0.02
21/01/2014 DKK 618,788 USD 113,870 441 0
21/01/2014 EUR 1,521,607 USD 2,077,772 18,885 0.1
21/01/2014 EUR 498,131 USD 683,360 3,026 0.02
21/01/2014 GBP 215,294 USD 346,295 10,237 0.05
21/01/2014 GBP 69,505 USD 113,870 1,231 0.01
21/01/2014 USD 12,500 JPY 1,252,919 578 0
21/01/2014 SEK 2,231,584 USD 346,295 1,035 0.01
21/01/2014 SEK 745,428 USD 113,870 2,150 0.01
02/01/2014 EUR 50,000 USD 68,865 31 0
23/01/2014 KRW 75,000,000 USD 71,090 176 0
Total unrealised gain on foreign currency contracts 41,917 0.22
Barclays, Citibank, HSBC Bank Plc, JP Morgan, Morgan Stanley and UBS are the counterparties to these Foreign currency contracts.
Unrealised loss on foreign currency contracts
Maturity date Purchase Currency Amount Sell Currency Amount Unrealised gain/
(loss) % of net assets
21/01/2014 AUD 362,041 USD 346,295 (22,857) (0.12)
21/01/2014 AUD 125,596 USD 113,870 (1,666) (0.01)
21/01/2014 CAD 357,440 USD 346,295 (10,061) (0.05)
21/01/2014 USD 12,500 DKK 69,091 (263) (0.00)
21/01/2014 USD 19,145 EUR 14,002 (148) (0.00)
21/01/2014 USD 56,000 EUR 41,519 (1,210) (0.01)
21/01/2014 USD 12,500 GBP 7,759 (349) (0.00)
21/01/2014 JPY 33,874,438 USD 346,295 (23,969) (0.13)
21/01/2014 JPY 11,736,968 USD 113,870 (2,189) (0.01)
21/01/2014 USD 12,500 SEK 83,194 (448) (0.00)
23/01/2014 JPY 20,578,230 AUD 225,000 (5,171) (0.03)
23/01/2014 JPY 14,501,400 CAD 150,000 (3,107) (0.02)
23/01/2014 JPY 64,350,188 USD 625,000 (12,681) (0.07)
Total unrealised loss on foreign currency contracts (84,119) (0.45)
Barclays, Citibank, HSBC Bank Plc, JP Morgan, Morgan Stanley and UBS are the counterparties to these Foreign currency contracts.
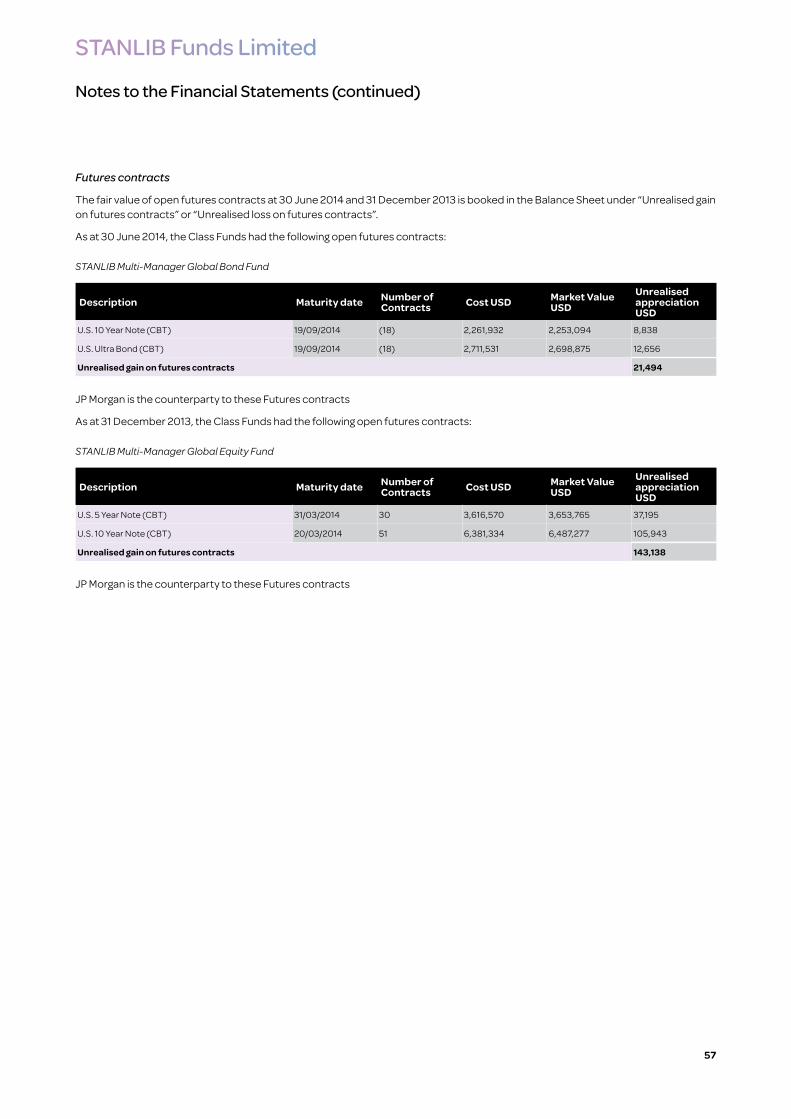
STANLIB Funds Limited
Notes to the Financial Statements (continued)
57
Futures contracts
The fair value of open futures contracts at 30 June 2014 and 31 December 2013 is booked in the Balance Sheet under “Unrealised gain on futures contracts” or “Unrealised loss on futures contracts”.
As at 30 June 2014, the Class Funds had the following open futures contracts:
STANLIB Multi-Manager Global Bond Fund
Description Maturity date Number of Contracts Cost USD Market Value
USDUnrealised appreciation USD
U.S. 10 Year Note (CBT) 19/09/2014 (18) 2,261,932 2,253,094 8,838
U.S. Ultra Bond (CBT) 19/09/2014 (18) 2,711,531 2,698,875 12,656
Unrealised gain on futures contracts 21,494
JP Morgan is the counterparty to these Futures contracts
As at 31 December 2013, the Class Funds had the following open futures contracts:
STANLIB Multi-Manager Global Equity Fund
Description Maturity date Number of Contracts Cost USD Market Value
USDUnrealised appreciation USD
U.S. 5 Year Note (CBT) 31/03/2014 30 3,616,570 3,653,765 37,195
U.S. 10 Year Note (CBT) 20/03/2014 51 6,381,334 6,487,277 105,943
Unrealised gain on futures contracts 143,138
JP Morgan is the counterparty to these Futures contracts

STANLIB Funds Limited
Notes to the Financial Statements (continued)
58
13. Exchange Rates
The following closing exchange rates at 30 June 2014 and 31 December 2013:
30 June 2014 31 December 2013USD/AUD 1.05948 1.11777
USD/BRL 2.20411 2.35925
USD/CAD 1.06515 1.06252
USD/CHF 0.88680 0.88936
USD/CLP 553.67003 525.45002
USD/CNY 6.20502 6.05392
USD/COP 1,879.75033 1,932.00039
USD/CZK 20.04895 19.86466
USD/DKK 5.44524 5.41410
USD/EGP 7.15004 6.94856
USD/EUR 0.73039 0.72574
USD/GBP 0.58485 0.60377
USD/HKD 7.75036 7.75375
USD/HUF 226.06000 215.59203
USD/IDR 11,855.00146 12,170.00151
USD/ILS 3.42875 3.47100
USD/INR 60.14498 61.85500
USD/JPY 101.30500 105.10500
USD/KRW 1,011.80000 1,055.35004
USD/MXN 12.97298 13.09715
USD/MYR 3.21101 3.27550
USD/NOK 6.13630 6.06687
USD/NZD 1.14212 1.21497
USD/PEN 2.79299 2.79671
USD/PHP 43.65000 44.38249
USD/PLN 3.03670 3.01745
USD/RUB 34.05240 32.86002
USD/SEK 6.68535 6.42258
USD/SGD 1.24666 1.26261
USD/THB 32.45498 32.86002
USD/TRY 2.12030 2.14850
USD/TWD 29.85800 29.80350
USD/ZAR 10.63877 10.47375

STANLIB Funds Limited
Notes to the Financial Statements (continued)
59
14. Portfolio transaction costs
Global Property Fund
Analysis of total purchase costs
30 June 2014 31 December 2013
USD USDPurchases before transaction costs 14,587,360 87,665,029
Total purchase transaction costs 27,848 156,284
Gross purchases 14,615,208 87,821,313
Analysis of total sales costs
30 June 2014 31 December 2013
USD USDGross sales before transaction costs 26,909,447 57,096,177
Total sales transaction costs 52,397 75,189
Total sales, net of transaction costs 26,857,050 57,020,988
STANLIB Multi-Manager Global Bond Fund
Analysis of total purchase costs
30 June 2014 31 December 2013
USD USDPurchases before transaction costs 239,101,888 708,767,650
Total purchase transaction costs – –
Gross purchases 239,101,888 708,767,650
Analysis of total sales costs
30 June 2014 31 December 2013
USD USDGross sales before transaction costs 369,770,944 841,973,318
Total sales transaction costs 18,562 39,030
Total sales, net of transaction costs 369,752,382 841,934,288
STANLIB Multi-Manager Global Equity Fund
Analysis of total purchase costs
30 June 2014 31 December 2013
USD USDPurchases before transaction costs 477,324,052 2,643,727,002
Total purchase transaction costs 508,387 1,465,565
Gross purchases 477,832,439 2,645,192,567
Analysis of total sales costs
30 June 2014 31 December 2013
USD USDGross sales before transaction costs 383,861,200 2,435,796,906
Total sales transaction costs 308,743 924,257
Total sales, net of transaction costs 383,552,457 2,434,872,649
High Alpha Global Equity Fund
Analysis of total purchase costs
30 June 2014 31 December 2013
USD USDPurchases before transaction costs 421,536,222 778,597,355
Total purchase transaction costs 762,005 749,792
Gross purchases 422,298,227 779,347,147
Analysis of total sales costs
30 June 2014 31 December 2013
USD USDGross sales before transaction costs 372,235,485 736,277,704
Total sales transaction costs 469,770 644,513
Total sales, net of transaction costs 371,765,715 735,633,191
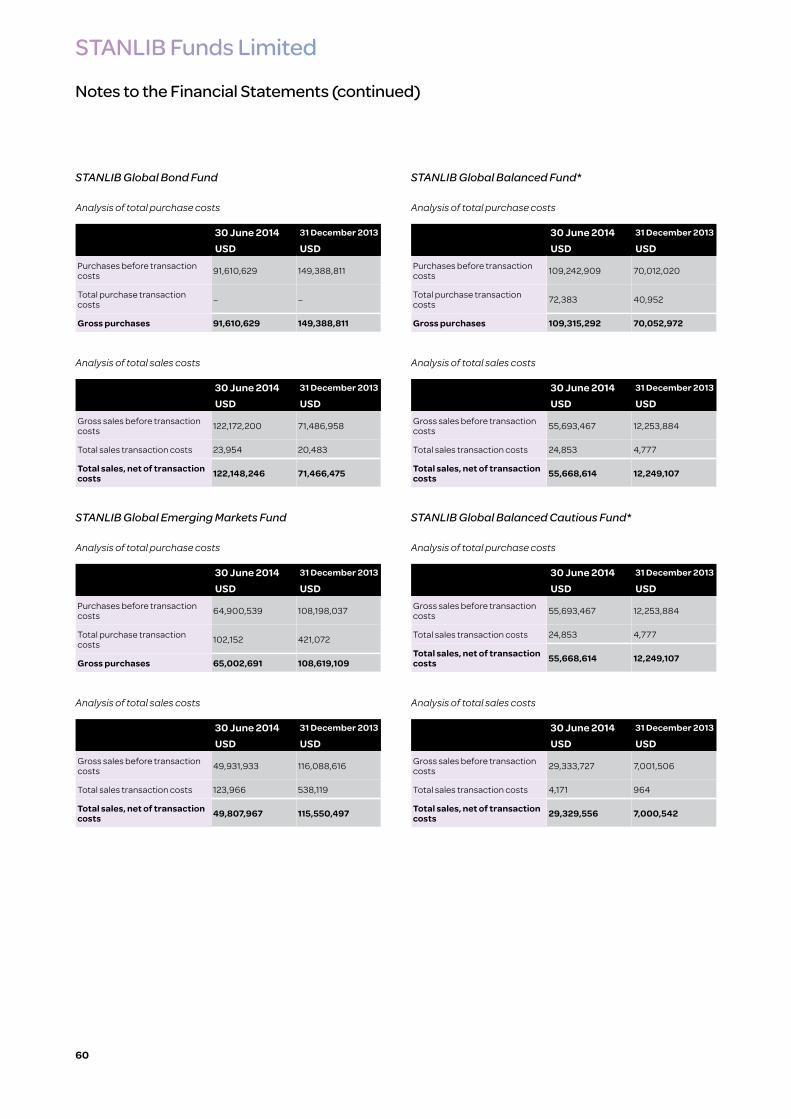
STANLIB Funds Limited
Notes to the Financial Statements (continued)
60
STANLIB Global Bond Fund
Analysis of total purchase costs
30 June 2014 31 December 2013
USD USDPurchases before transaction costs 91,610,629 149,388,811
Total purchase transaction costs – –
Gross purchases 91,610,629 149,388,811
Analysis of total sales costs
30 June 2014 31 December 2013
USD USDGross sales before transaction costs 122,172,200 71,486,958
Total sales transaction costs 23,954 20,483
Total sales, net of transaction costs 122,148,246 71,466,475
STANLIB Global Emerging Markets Fund
Analysis of total purchase costs
30 June 2014 31 December 2013
USD USDPurchases before transaction costs 64,900,539 108,198,037
Total purchase transaction costs 102,152 421,072
Gross purchases 65,002,691 108,619,109
Analysis of total sales costs
30 June 2014 31 December 2013
USD USDGross sales before transaction costs 49,931,933 116,088,616
Total sales transaction costs 123,966 538,119
Total sales, net of transaction costs 49,807,967 115,550,497
STANLIB Global Balanced Fund*
Analysis of total purchase costs
30 June 2014 31 December 2013
USD USDPurchases before transaction costs 109,242,909 70,012,020
Total purchase transaction costs 72,383 40,952
Gross purchases 109,315,292 70,052,972
Analysis of total sales costs
30 June 2014 31 December 2013
USD USDGross sales before transaction costs 55,693,467 12,253,884
Total sales transaction costs 24,853 4,777
Total sales, net of transaction costs 55,668,614 12,249,107
STANLIB Global Balanced Cautious Fund*
Analysis of total purchase costs
30 June 2014 31 December 2013
USD USDGross sales before transaction costs 55,693,467 12,253,884
Total sales transaction costs 24,853 4,777
Total sales, net of transaction costs 55,668,614 12,249,107
Analysis of total sales costs
30 June 2014 31 December 2013
USD USDGross sales before transaction costs 29,333,727 7,001,506
Total sales transaction costs 4,171 964
Total sales, net of transaction costs 29,329,556 7,000,542
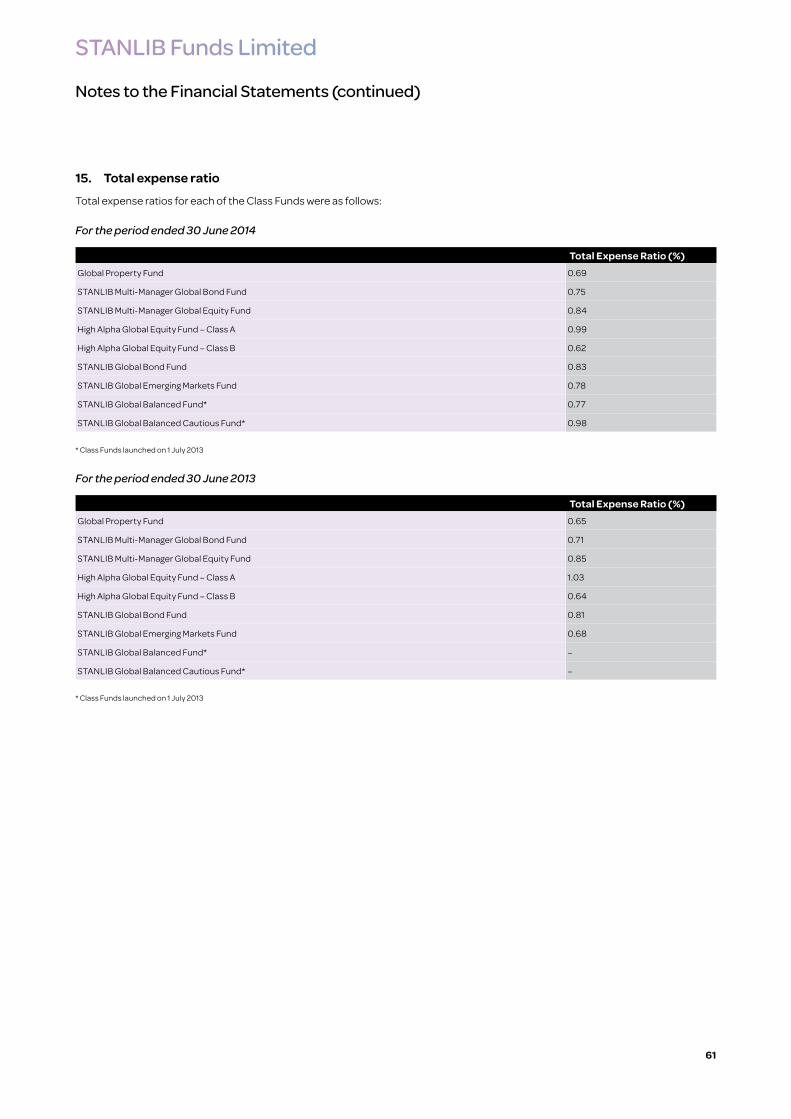
STANLIB Funds Limited
Notes to the Financial Statements (continued)
61
15. Total expense ratio
Total expense ratios for each of the Class Funds were as follows:
For the period ended 30 June 2014
Total Expense Ratio (%)Global Property Fund 0.69
STANLIB Multi-Manager Global Bond Fund 0.75
STANLIB Multi-Manager Global Equity Fund 0.84
High Alpha Global Equity Fund – Class A 0.99
High Alpha Global Equity Fund – Class B 0.62
STANLIB Global Bond Fund 0.83
STANLIB Global Emerging Markets Fund 0.78
STANLIB Global Balanced Fund* 0.77
STANLIB Global Balanced Cautious Fund* 0.98
* Class Funds launched on 1 July 2013
For the period ended 30 June 2013
Total Expense Ratio (%)Global Property Fund 0.65
STANLIB Multi-Manager Global Bond Fund 0.71
STANLIB Multi-Manager Global Equity Fund 0.85
High Alpha Global Equity Fund – Class A 1.03
High Alpha Global Equity Fund – Class B 0.64
STANLIB Global Bond Fund 0.81
STANLIB Global Emerging Markets Fund 0.68
STANLIB Global Balanced Fund* –
STANLIB Global Balanced Cautious Fund* –
* Class Funds launched on 1 July 2013

62
The
note
s on
pag
es 16
to 6
3 fo
rm a
n in
tegr
al p
art o
f the
fina
ncia
l sta
tem
ents
.
STAN
LIB
Fund
s Lim
ited
Not
es to
the
Fina
ncia
l Sta
tem
ents
(con
tinue
d)
16.
Reco
ncili
atio
n of
net
ass
ets
The
follo
win
g ta
bles
reco
ncile
the
diff
eren
ce b
etw
een
the
Cla
ss F
unds
’ net
ass
ets
for fi
nanc
ial r
epor
ting
purp
oses
and
its
net a
sset
s fo
r sha
reho
lder
dea
ling
purp
oses
for t
he p
erio
d en
ded
30 J
une
2014
and
31
Dec
embe
r 20
13.
Glo
bal P
rope
rty
Fund
STA
NLI
B M
ulti
-Man
ager
Glo
bal B
ond
Fund
STA
NLI
B M
ulti
-Man
ager
Glo
bal
Equi
ty F
und
Hig
h A
lpha
Glo
bal E
quit
y Fu
nd
30 J
une
2014
31 D
ecem
ber 2
013
30 J
une
2014
31 D
ecem
ber 2
013
30 J
une
2014
31 D
ecem
ber 2
013
30 J
une
2014
31 D
ecem
ber 2
013
USD
U
SDU
SDU
SDU
SDU
SDU
SDU
SDN
et a
sset
val
ue p
er fi
nanc
ial s
tate
men
ts10
3,12
2,0
2210
2,79
5,84
225
6,64
5,87
539
1,472
,872
2,24
4,07
8,49
32,
041
,679
,067
1,012
,851
,698
939,
138,
889
Bid
adj
ustm
ent1
72,0
3410
7,15
425
0,4
9635
7,0
00
1,193
,939
1,407
,220
398,
239
366,
665
Non
-red
eem
able
foun
ders
sha
res
––
––
100
100
––
Net
ass
et v
alue
for s
hare
hold
er d
ealin
g10
3,19
4,0
5610
2,90
2,99
625
6,89
6,37
139
1,82
9,87
22,
245,
272,
532
2,0
43,0
86,3
871,
013,
249,
937
939,
505,
554
Net
ass
et v
alue
per
sha
re fo
r rep
ortin
g pu
rpos
es2,
149.
671,
868.
352,
088
.27
1,99
0.2
92,
378.
702,
243.
601,1
22.5
41,0
87.8
7
Net
ass
et v
alue
per
sha
re fo
r sha
reho
lder
dea
ling
purp
oses
2,15
1.19
1,87
0.3
12,
090
.30
1,99
2.11
2,37
9.96
2,24
5.15
1,122
.99
1,088
.30
1 The
adj
ustm
ent i
s th
e di
ffer
ence
bet
wee
n th
e m
id v
alue
of i
nves
tmen
ts o
n th
e va
luat
ion
date
and
the
bid
valu
e of
inve
stm
ents
on
the
final
trad
ing
day
of th
e fis
cal p
erio
d. T
he S
ORP
and
Uni
ted
King
dom
Acc
ount
ing
Stan
dard
s re
quire
inve
stm
ents
in lo
ng p
ositi
ons
to b
e va
lued
at b
id p
rice
whe
re a
vaila
ble.
Inve
stm
ents
are
val
ued
at m
id-p
rice
whe
re a
vaila
ble
for t
he p
urpo
se o
f sha
reho
lder
dea
ling
valu
atio
n in
acc
orda
nce
with
the
pros
pect
us.
STA
NLI
B G
loba
l Bon
d Fu
ndST
AN
LIB
Glo
bal E
mer
ging
Mar
kets
Fu
ndST
AN
LIB
Glo
bal B
alan
ced
Fund
STA
NLI
B G
loba
l Bal
ance
d C
auti
ous
Fund
30 J
une
2014
31 D
ecem
ber 2
013
30 J
une
2014
31 D
ecem
ber 2
013
30 J
une
2014
31 D
ecem
ber 2
013
30 J
une
2014
31 D
ecem
ber 2
013
USD
U
SDU
SDU
SDU
SDU
SDU
SDU
SDN
et a
sset
val
ue p
er fi
nanc
ial s
tate
men
ts13
1,429
,819
156,
854,
503
118,
689,
663
95,8
52,3
8812
4,98
7,0
6465
,30
9,96
045
,528
,233
18,8
09,
999
Bid
adj
ustm
ent1
146,
847
(26,
944)
149,
039
125,
607
68,7
8635
,348
25,15
79,
394
Net
ass
et v
alue
for s
hare
hold
er d
ealin
g13
1,57
6,66
615
6,82
7,55
911
8,83
8,70
295
,977
,995
125,
055
,850
65,3
45,3
08
45,5
53,3
9018
,819
,393
Net
ass
et v
alue
per
sha
re fo
r rep
ortin
g pu
rpos
es1,4
65.3
31,
382.
301,1
25.14
1,054
.38
1,121
.01
1,068
.29
1,067
.06
1,025
.91
Net
ass
et v
alue
per
sha
re fo
r sha
reho
lder
dea
ling
purp
oses
1,466
.96
1,38
2.07
1,126
.55
1,055
.76
1,121
.63
1,068
.87
1,067
.66
1,026
.42
1 The
adj
ustm
ent i
s th
e di
ffer
ence
bet
wee
n th
e m
id v
alue
of i
nves
tmen
ts o
n th
e va
luat
ion
date
and
the
bid
valu
e of
inve
stm
ents
on
the
final
trad
ing
day
of th
e fis
cal p
erio
d. T
he S
ORP
and
Uni
ted
King
dom
Acc
ount
ing
Stan
dard
s re
quire
inve
stm
ents
in lo
ng p
ositi
ons
to b
e va
lued
at b
id p
rice
whe
re a
vaila
ble.
Inve
stm
ents
are
val
ued
at m
id-p
rice
whe
re a
vaila
ble
for t
he p
urpo
se o
f sha
reho
lder
dea
ling
valu
atio
n in
acc
orda
nce
with
the
pros
pect
us.

63
The
note
s on
pag
es 16
to 6
3 fo
rm a
n in
tegr
al p
art o
f the
fina
ncia
l sta
tem
ents
.
STAN
LIB
Fund
s Lim
ited
Not
es to
the
Fina
ncia
l Sta
tem
ents
(con
tinue
d)
16.
Reco
ncili
atio
n of
net
ass
ets (
cont
inue
d)
The
follo
win
g ta
bles
reco
ncile
the
diff
eren
ce b
etw
een
the
Cla
ss F
unds
’ net
ass
ets
for fi
nanc
ial r
epor
ting
purp
oses
and
its
net a
sset
s fo
r sha
reho
lder
dea
ling
purp
oses
for t
he p
erio
d en
ded
30 J
une
2014
and
31
Dec
embe
r 20
13.
Agg
rega
ted
Fund
30 J
une
2014
31 D
ecem
ber 2
013
USD
U
SDN
et a
sset
val
ue p
er fi
nanc
ial s
tate
men
ts4,
037
,332
,867
3,81
1,91
3,52
0B
id a
djus
tmen
t12,
304,
537
2,38
1,444
Non
-red
eem
able
foun
ders
sha
res
100
100
Net
ass
et v
alue
for s
hare
hold
er d
ealin
g4,
039
,637
,50
43,
814,
295,
064
1 The
adj
ustm
ent i
s th
e di
ffer
ence
bet
wee
n th
e m
id v
alue
of i
nves
tmen
ts o
n th
e va
luat
ion
date
and
the
bid
valu
e of
inve
stm
ents
on
the
final
trad
ing
day
of th
e fis
cal p
erio
d. T
he S
ORP
and
Uni
ted
King
dom
Acc
ount
ing
Stan
dard
s re
quire
inve
stm
ents
in lo
ng p
ositi
ons
to b
e va
lued
at b
id p
rice
whe
re a
vaila
ble.
Inve
stm
ents
are
val
ued
at m
id-p
rice
whe
re a
vaila
ble
for t
he p
urpo
se o
f sha
reho
lder
dea
ling
valu
atio
n in
acc
orda
nce
with
the
pros
pect
us.
17.
Sig
nific
ant E
vent
s Dur
ing
the
Peri
od
Ther
e w
ere
no s
igni
fican
t eve
nts
durin
g th
e pe
riod
ende
d 30
Jun
e 20
14.
18.
Post
Bal
ance
shee
t eve
nts
On
the
29 J
uly
2014
, the
Boa
rd a
gree
d to
cha
nge
the
Fina
ncia
l Rep
ortin
g St
anda
rd o
f STA
NLI
B Fu
nds
Lim
ited
to th
e In
tern
atio
nal F
inan
cial
Rep
ortin
g St
anda
rd (“
IFRS
”) in
repl
acem
ent o
f UK
GA
AP
with
eff
ect
from
Dec
embe
r 20
14 y
ear e
nd.
Mar
atho
n su
b-In
vest
men
t Man
agem
ent m
anda
te w
as te
rmin
ated
on
28 A
ugus
t, 20
14 a
nd a
new
sub
-Inv
estm
ent M
anag
emen
t man
date
was
giv
en to
Hos
king
& C
o on
1 O
ctob
er, 2
014
.
19.
App
rova
l of F
inan
cial
Sta
tem
ents
The
finan
cial
sta
tem
ents
wer
e ap
prov
ed b
y th
e di
rect
ors
on 2
0 O
ctob
er 2
014
.

STANLIB Funds Limited
64
Portfolio Statement
Global Property Fund
As at 30 June 2014
Transferable securities listed on an exchange or dealt in on another regulated market
Common Stock
Nominal holding Cost Market Value % of Net AssetsUSD USD
AustraliaDexus Property Group 979,455 915,722 1,026,175 1.00
Federation Centres Ltd 320,936 702,910 754,264 0.73
Goodman Group 245,470 1,046,391 1,170,033 1.13
GPT Group 165,977 542,366 601,567 0.58
Growthpoint Properties Australia Ltd 210,402 444,021 482,578 0.47
Investa Office Fund 190,719 460,591 612,036 0.59
Mirvac Group 390,201 585,480 657,411 0.64
Scentre Group 558,029 1,751,716 1,680,169 1.63
Westfield Group 210,227 1,435,948 1,418,738 1.38
Total Australia 8.15% (31 December 2013: 8.78%) 8,402,971 8.15
BermudaHongkong Land Holdings Ltd 127,705 887,784 851,792 0.83
Total Bermuda 0.83% (31 December 2013: 0.93%) 851,792 0.83
BrazilBR Malls Participacoes SA 145,580 1,689,040 1,237,765 1.20
Iguatemi Empresa de Shopping Centers SA 107,280 1,339,778 1,082,970 1.05
Total Brazil 2.25% (31 December 2013: 3.29%) 2,320,735 2.25
CanadaBoardwalk Real Estate Investment Trust 8,746 523,635 533,307 0.52
Canadian Apartment Properties REIT 30,331 705,522 650,670 0.63
Canadian Real Estate Investment Trust 13,131 520,086 565,846 0.55
H&R Real Estate Investment Trust 13,951 316,057 303,342 0.29
RioCan Real Estate Investment Trust 32,051 838,555 820,268 0.80
Total Canada 2.79% (31 December 2013: 3.02%) 2,873,433 2.79
FranceiCADE 7,313 690,856 783,179 0.76
Klepierre 10,451 412,393 532,076 0.52
Mercialys SA 22,754 479,212 529,763 0.51
Unibail-Rodamco SE 12,320 2,790,162 3,582,722 3.47
Total France 5.26% (31 December 2013: 4.99%) 5,427,740 5.26
GermanyAlstria office REIT-AG 36,186 446,288 479,385 0.47
Deutsche Annington Immobilien SE 18,637 516,915 549,374 0.53
Deutsche Wohnen AG 47,453 939,680 1,024,900 1.00
LEG Immobilien AG 11,519 611,205 776,885 0.75
Total Germany 3.59% (31 December 2013: 3.05%) 3,700,336 3.59
Hong KongHysan Development Co Ltd 76,819 335,351 358,307 0.35
Link REIT/The 234,178 871,809 1,258,449 1.22
Prosperity REIT 1,380,394 391,404 429,302 0.42
Swire Properties Ltd 178,183 473,951 520,722 0.50
Wharf Holdings Ltd 211,196 1,681,138 1,516,451 1.47
Total Hong Kong 3.96% (31 December 2013: 4.00%) 4,083,231 3.96Total Indonesia 0.00% (31 December 2013: 0.28%)
JapanActivia Properties Inc 76 601,699 664,686 0.65
Aeon Mall Co Ltd 16,000 400,910 421,381 0.41
GLP J-REIT 594 600,898 664,919 0.65
Japan Prime Realty Investment Corp 191 621,400 682,513 0.66
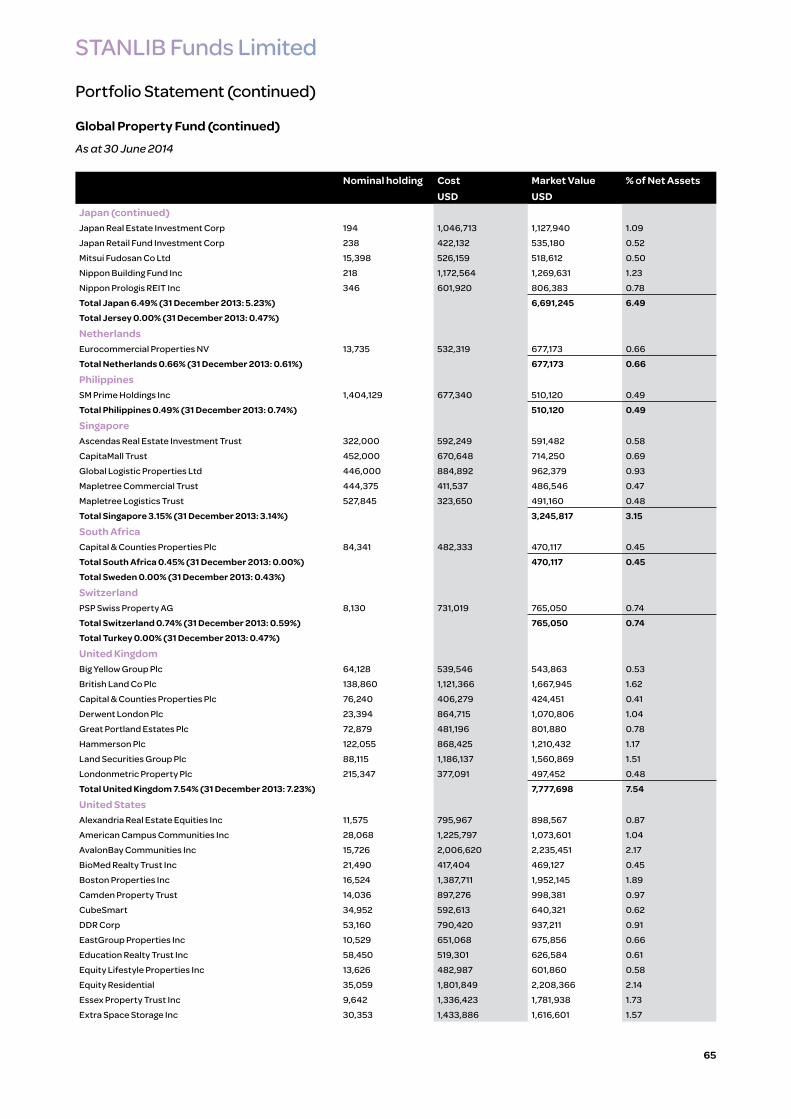
STANLIB Funds Limited
Portfolio Statement (continued)
Global Property Fund (continued)
As at 30 June 2014
65
Nominal holding Cost Market Value % of Net AssetsUSD USD
Japan (continued)Japan Real Estate Investment Corp 194 1,046,713 1,127,940 1.09
Japan Retail Fund Investment Corp 238 422,132 535,180 0.52
Mitsui Fudosan Co Ltd 15,398 526,159 518,612 0.50
Nippon Building Fund Inc 218 1,172,564 1,269,631 1.23
Nippon Prologis REIT Inc 346 601,920 806,383 0.78
Total Japan 6.49% (31 December 2013: 5.23%) 6,691,245 6.49Total Jersey 0.00% (31 December 2013: 0.47%)
NetherlandsEurocommercial Properties NV 13,735 532,319 677,173 0.66
Total Netherlands 0.66% (31 December 2013: 0.61%) 677,173 0.66
PhilippinesSM Prime Holdings Inc 1,404,129 677,340 510,120 0.49
Total Philippines 0.49% (31 December 2013: 0.74%) 510,120 0.49
SingaporeAscendas Real Estate Investment Trust 322,000 592,249 591,482 0.58
CapitaMall Trust 452,000 670,648 714,250 0.69
Global Logistic Properties Ltd 446,000 884,892 962,379 0.93
Mapletree Commercial Trust 444,375 411,537 486,546 0.47
Mapletree Logistics Trust 527,845 323,650 491,160 0.48
Total Singapore 3.15% (31 December 2013: 3.14%) 3,245,817 3.15
South AfricaCapital & Counties Properties Plc 84,341 482,333 470,117 0.45
Total South Africa 0.45% (31 December 2013: 0.00%) 470,117 0.45Total Sweden 0.00% (31 December 2013: 0.43%)
SwitzerlandPSP Swiss Property AG 8,130 731,019 765,050 0.74
Total Switzerland 0.74% (31 December 2013: 0.59%) 765,050 0.74Total Turkey 0.00% (31 December 2013: 0.47%)
United KingdomBig Yellow Group Plc 64,128 539,546 543,863 0.53
British Land Co Plc 138,860 1,121,366 1,667,945 1.62
Capital & Counties Properties Plc 76,240 406,279 424,451 0.41
Derwent London Plc 23,394 864,715 1,070,806 1.04
Great Portland Estates Plc 72,879 481,196 801,880 0.78
Hammerson Plc 122,055 868,425 1,210,432 1.17
Land Securities Group Plc 88,115 1,186,137 1,560,869 1.51
Londonmetric Property Plc 215,347 377,091 497,452 0.48
Total United Kingdom 7.54% (31 December 2013: 7.23%) 7,777,698 7.54
United StatesAlexandria Real Estate Equities Inc 11,575 795,967 898,567 0.87
American Campus Communities Inc 28,068 1,225,797 1,073,601 1.04
AvalonBay Communities Inc 15,726 2,006,620 2,235,451 2.17
BioMed Realty Trust Inc 21,490 417,404 469,127 0.45
Boston Properties Inc 16,524 1,387,711 1,952,145 1.89
Camden Property Trust 14,036 897,276 998,381 0.97
CubeSmart 34,952 592,613 640,321 0.62
DDR Corp 53,160 790,420 937,211 0.91
EastGroup Properties Inc 10,529 651,068 675,856 0.66
Education Realty Trust Inc 58,450 519,301 626,584 0.61
Equity Lifestyle Properties Inc 13,626 482,987 601,860 0.58
Equity Residential 35,059 1,801,849 2,208,366 2.14
Essex Property Trust Inc 9,642 1,336,423 1,781,938 1.73
Extra Space Storage Inc 30,353 1,433,886 1,616,601 1.57
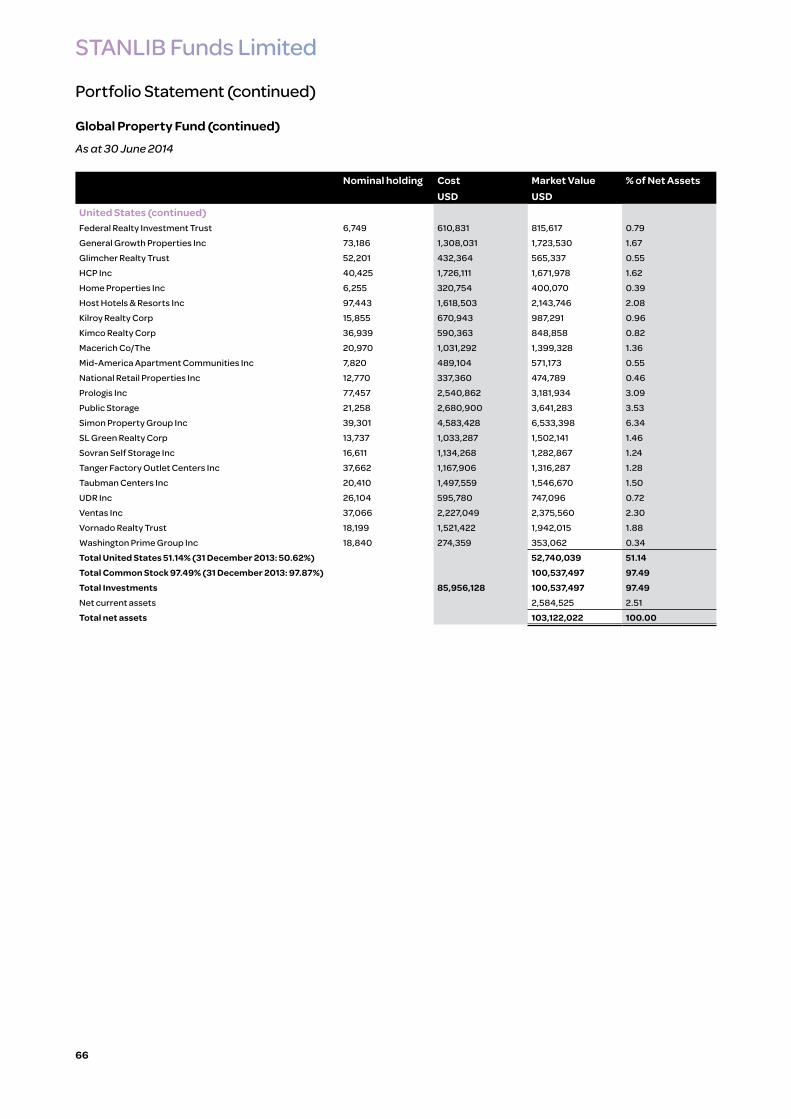
STANLIB Funds Limited
Portfolio Statement (continued)
Global Property Fund (continued)
As at 30 June 2014
66
Nominal holding Cost Market Value % of Net AssetsUSD USD
United States (continued)Federal Realty Investment Trust 6,749 610,831 815,617 0.79
General Growth Properties Inc 73,186 1,308,031 1,723,530 1.67
Glimcher Realty Trust 52,201 432,364 565,337 0.55
HCP Inc 40,425 1,726,111 1,671,978 1.62
Home Properties Inc 6,255 320,754 400,070 0.39
Host Hotels & Resorts Inc 97,443 1,618,503 2,143,746 2.08
Kilroy Realty Corp 15,855 670,943 987,291 0.96
Kimco Realty Corp 36,939 590,363 848,858 0.82
Macerich Co/The 20,970 1,031,292 1,399,328 1.36
Mid-America Apartment Communities Inc 7,820 489,104 571,173 0.55
National Retail Properties Inc 12,770 337,360 474,789 0.46
Prologis Inc 77,457 2,540,862 3,181,934 3.09
Public Storage 21,258 2,680,900 3,641,283 3.53
Simon Property Group Inc 39,301 4,583,428 6,533,398 6.34
SL Green Realty Corp 13,737 1,033,287 1,502,141 1.46
Sovran Self Storage Inc 16,611 1,134,268 1,282,867 1.24
Tanger Factory Outlet Centers Inc 37,662 1,167,906 1,316,287 1.28
Taubman Centers Inc 20,410 1,497,559 1,546,670 1.50
UDR Inc 26,104 595,780 747,096 0.72
Ventas Inc 37,066 2,227,049 2,375,560 2.30
Vornado Realty Trust 18,199 1,521,422 1,942,015 1.88
Washington Prime Group Inc 18,840 274,359 353,062 0.34
Total United States 51.14% (31 December 2013: 50.62%) 52,740,039 51.14Total Common Stock 97.49% (31 December 2013: 97.87%) 100,537,497 97.49Total Investments 85,956,128 100,537,497 97.49Net current assets 2,584,525 2.51
Total net assets 103,122,022 100.00
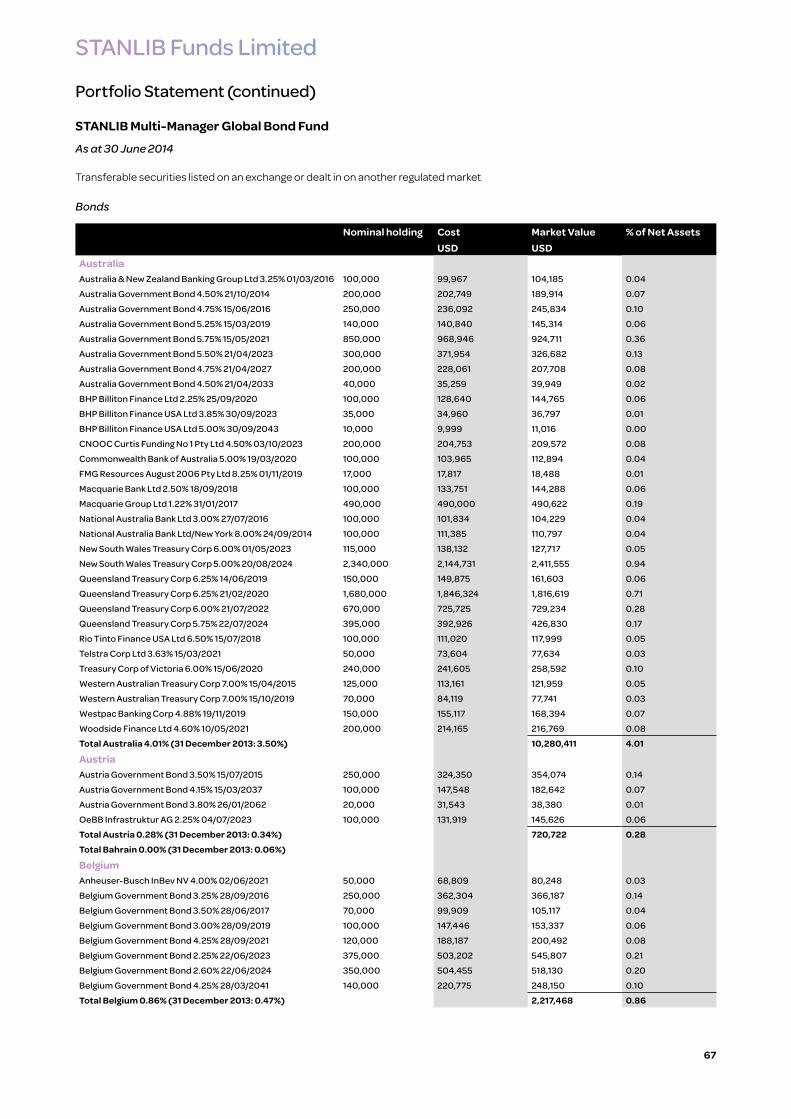
STANLIB Funds Limited
67
Portfolio Statement (continued)
STANLIB Multi-Manager Global Bond Fund
As at 30 June 2014
Transferable securities listed on an exchange or dealt in on another regulated market
Bonds
Nominal holding Cost Market Value % of Net AssetsUSD USD
AustraliaAustralia & New Zealand Banking Group Ltd 3.25% 01/03/2016 100,000 99,967 104,185 0.04
Australia Government Bond 4.50% 21/10/2014 200,000 202,749 189,914 0.07
Australia Government Bond 4.75% 15/06/2016 250,000 236,092 245,834 0.10
Australia Government Bond 5.25% 15/03/2019 140,000 140,840 145,314 0.06
Australia Government Bond 5.75% 15/05/2021 850,000 968,946 924,711 0.36
Australia Government Bond 5.50% 21/04/2023 300,000 371,954 326,682 0.13
Australia Government Bond 4.75% 21/04/2027 200,000 228,061 207,708 0.08
Australia Government Bond 4.50% 21/04/2033 40,000 35,259 39,949 0.02
BHP Billiton Finance Ltd 2.25% 25/09/2020 100,000 128,640 144,765 0.06
BHP Billiton Finance USA Ltd 3.85% 30/09/2023 35,000 34,960 36,797 0.01
BHP Billiton Finance USA Ltd 5.00% 30/09/2043 10,000 9,999 11,016 0.00
CNOOC Curtis Funding No 1 Pty Ltd 4.50% 03/10/2023 200,000 204,753 209,572 0.08
Commonwealth Bank of Australia 5.00% 19/03/2020 100,000 103,965 112,894 0.04
FMG Resources August 2006 Pty Ltd 8.25% 01/11/2019 17,000 17,817 18,488 0.01
Macquarie Bank Ltd 2.50% 18/09/2018 100,000 133,751 144,288 0.06
Macquarie Group Ltd 1.22% 31/01/2017 490,000 490,000 490,622 0.19
National Australia Bank Ltd 3.00% 27/07/2016 100,000 101,834 104,229 0.04
National Australia Bank Ltd/New York 8.00% 24/09/2014 100,000 111,385 110,797 0.04
New South Wales Treasury Corp 6.00% 01/05/2023 115,000 138,132 127,717 0.05
New South Wales Treasury Corp 5.00% 20/08/2024 2,340,000 2,144,731 2,411,555 0.94
Queensland Treasury Corp 6.25% 14/06/2019 150,000 149,875 161,603 0.06
Queensland Treasury Corp 6.25% 21/02/2020 1,680,000 1,846,324 1,816,619 0.71
Queensland Treasury Corp 6.00% 21/07/2022 670,000 725,725 729,234 0.28
Queensland Treasury Corp 5.75% 22/07/2024 395,000 392,926 426,830 0.17
Rio Tinto Finance USA Ltd 6.50% 15/07/2018 100,000 111,020 117,999 0.05
Telstra Corp Ltd 3.63% 15/03/2021 50,000 73,604 77,634 0.03
Treasury Corp of Victoria 6.00% 15/06/2020 240,000 241,605 258,592 0.10
Western Australian Treasury Corp 7.00% 15/04/2015 125,000 113,161 121,959 0.05
Western Australian Treasury Corp 7.00% 15/10/2019 70,000 84,119 77,741 0.03
Westpac Banking Corp 4.88% 19/11/2019 150,000 155,117 168,394 0.07
Woodside Finance Ltd 4.60% 10/05/2021 200,000 214,165 216,769 0.08
Total Australia 4.01% (31 December 2013: 3.50%) 10,280,411 4.01
AustriaAustria Government Bond 3.50% 15/07/2015 250,000 324,350 354,074 0.14
Austria Government Bond 4.15% 15/03/2037 100,000 147,548 182,642 0.07
Austria Government Bond 3.80% 26/01/2062 20,000 31,543 38,380 0.01
OeBB Infrastruktur AG 2.25% 04/07/2023 100,000 131,919 145,626 0.06
Total Austria 0.28% (31 December 2013: 0.34%) 720,722 0.28Total Bahrain 0.00% (31 December 2013: 0.06%)
BelgiumAnheuser-Busch InBev NV 4.00% 02/06/2021 50,000 68,809 80,248 0.03
Belgium Government Bond 3.25% 28/09/2016 250,000 362,304 366,187 0.14
Belgium Government Bond 3.50% 28/06/2017 70,000 99,909 105,117 0.04
Belgium Government Bond 3.00% 28/09/2019 100,000 147,446 153,337 0.06
Belgium Government Bond 4.25% 28/09/2021 120,000 188,187 200,492 0.08
Belgium Government Bond 2.25% 22/06/2023 375,000 503,202 545,807 0.21
Belgium Government Bond 2.60% 22/06/2024 350,000 504,455 518,130 0.20
Belgium Government Bond 4.25% 28/03/2041 140,000 220,775 248,150 0.10
Total Belgium 0.86% (31 December 2013: 0.47%) 2,217,468 0.86

STANLIB Funds Limited
Portfolio Statement (continued)
STANLIB Multi-Manager Global Bond Fund (continued)
As at 30 June 2014
68
Nominal holding Cost Market Value % of Net AssetsUSD USD
BermudaAircastle Ltd 5.13% 15/03/2021 3,000 3,000 3,105 0.00
Bermuda Government International Bond 5.60% 20/07/2020 100,000 113,725 111,496 0.05
Novartis Securities Investment Ltd 5.13% 10/02/2019 50,000 52,959 56,983 0.02
Total Bermuda 0.07% (31 December 2013: 0.30%) 171,584 0.07
BrazilBanco Bradesco SA/Cayman Islands 4.10% 23/03/2015 150,000 151,639 153,375 0.06
Banco Santander Brasil SA/Cayman Islands 4.50% 06/04/2015
100,000 100,069 102,498 0.04
Banco Votorantim SA 7.38% 21/01/2020 100,000 106,041 110,568 0.04
Brazil Notas do Tesouro Nacional Serie F 10.00% 01/01/2017 3,525,000 1,637,354 1,546,164 0.60
Brazil Notas do Tesouro Nacional Serie F 10.00% 01/01/2018 660,000 280,608 285,452 0.11
Brazilian Government International Bond 12.50% 05/01/2016 680,000 354,697 325,174 0.13
Brazilian Government International Bond 4.88% 22/01/2021 400,000 445,786 435,855 0.17
Brazilian Government International Bond 5.63% 07/01/2041 150,000 176,323 160,782 0.06
Itau Unibanco Holding SA/Cayman Island 5.75% 22/01/2021 100,000 102,951 104,000 0.04
Telemar Norte Leste SA 5.50% 23/10/2020 100,000 99,519 102,240 0.04
Vale SA 5.63% 11/09/2042 50,000 42,421 48,985 0.02
Votorantim Cimentos SA 3.25% 25/04/2021 100,000 137,228 138,449 0.06
Total Brazil 1.37% (31 December 2013: 1.36%) 3,513,542 1.37
British Virgin IslandsGTL Trade Finance Inc 7.25% 20/10/2017 100,000 111,068 113,737 0.04
Total British Virgin Islands 0.04% (31 December 2013: 0.03%)
113,737 0.04
CanadaBank of Montreal 4.55% 01/08/2017 130,000 128,075 131,700 0.05
Bank of Nova Scotia 3.34% 25/03/2015 150,000 147,562 142,795 0.06
Bank of Nova Scotia 2.46% 14/03/2019 50,000 45,626 47,280 0.02
Bombardier Inc 4.75% 15/04/2019 2,000 2,000 2,035 0.00
Bombardier Inc 7.75% 15/03/2020 8,000 8,854 9,060 0.00
Bombardier Inc 6.00% 15/10/2022 3,000 3,000 3,094 0.00
Canada Housing Trust No 1 4.10% 15/12/2018 90,000 95,458 92,932 0.04
Canada Housing Trust No 1 2.65% 15/03/2022 100,000 99,393 95,678 0.04
Canadian Government Bond 1.50% 01/03/2017 690,000 691,046 653,517 0.25
Canadian Government Bond 4.25% 01/06/2018 60,000 56,545 62,467 0.02
Canadian Government Bond 1.25% 01/09/2018 100,000 89,218 93,097 0.04
Canadian Government Bond 3.75% 01/06/2019 330,000 343,590 341,900 0.13
Canadian Government Bond 3.25% 01/06/2021 880,000 925,376 901,931 0.35
Canadian Government Bond 5.75% 01/06/2029 270,000 345,215 354,563 0.14
Canadian Government Bond 4.00% 01/06/2041 330,000 416,754 380,357 0.15
Canadian Imperial Bank of Commerce/Canada 2.60% 02/07/2015
100,000 102,062 102,490 0.04
Catamaran Corp 4.75% 15/03/2021 2,000 2,000 2,020 0.00
Encana Corp 3.90% 15/11/2021 50,000 49,686 53,044 0.02
Hydro One Inc 5.18% 18/10/2017 50,000 50,968 51,856 0.02
Hydro-Quebec 5.00% 15/02/2045 60,000 65,093 69,072 0.03
Kodiak Oil & Gas Corp 5.50% 15/01/2021 20,000 20,250 20,950 0.01
Kodiak Oil & Gas Corp 5.50% 01/02/2022 11,000 10,917 11,412 0.00
Province of British Columbia 4.70% 18/06/2037 150,000 165,349 166,570 0.07
Province of Manitoba Canada 5.50% 15/11/2018 70,000 71,654 75,786 0.03
Province of New Brunswick Canada 5.65% 27/12/2028 50,000 52,355 58,384 0.02
Province of Ontario Canada 3.25% 08/09/2014 75,000 77,259 70,688 0.03
Province of Ontario Canada 1.88% 15/09/2015 150,000 151,945 152,626 0.06
Province of Ontario Canada 2.10% 08/09/2018 270,000 256,971 256,213 0.10
Province of Ontario Canada 5.60% 02/06/2035 230,000 260,196 276,365 0.11

STANLIB Funds Limited
Portfolio Statement (continued)
STANLIB Multi-Manager Global Bond Fund (continued)
As at 30 June 2014
69
Nominal holding Cost Market Value % of Net AssetsUSD USD
Canada (continued)Province of Quebec Canada 4.50% 01/12/2017 667,000 683,736 685,525 0.27
Province of Quebec Canada 3.50% 29/07/2020 200,000 218,094 214,016 0.08
Province of Quebec Canada 4.25% 01/12/2043 100,000 107,604 101,831 0.04
Rogers Communications Inc 3.00% 06/06/2017 100,000 101,485 96,288 0.04
Royal Bank of Canada 1.13% 22/07/2016 100,000 100,116 100,917 0.04
Royal Bank of Canada 2.98% 07/05/2019 100,000 100,085 96,743 0.04
Shaw Communications Inc 5.65% 01/10/2019 50,000 55,069 53,419 0.02
Suncor Energy Inc 6.50% 15/06/2038 25,000 28,646 32,153 0.01
Thomson Reuters Corp 1.30% 23/02/2017 20,000 19,923 19,990 0.01
Thomson Reuters Corp 4.30% 23/11/2023 35,000 34,903 36,558 0.01
Thomson Reuters Corp 4.50% 23/05/2043 20,000 17,901 18,944 0.01
TransAlta Corp 4.75% 15/01/2015 375,000 381,200 383,293 0.15
TransCanada PipeLines Ltd 6.50% 15/08/2018 125,000 142,065 148,710 0.06
TransCanada PipeLines Ltd 3.75% 16/10/2023 20,000 19,883 20,628 0.01
TransCanada PipeLines Ltd 6.20% 15/10/2037 50,000 67,892 63,454 0.02
Valeant Pharmaceuticals International Inc 7.50% 15/07/2021 6,000 6,000 6,645 0.00
Videotron Ltd 5.00% 15/07/2022 11,000 11,374 11,289 0.00
Total Canada 2.64% (31 December 2013: 2.60%) 6,770,285 2.64
Cayman IslandsADCB Finance Cayman Ltd 2.50% 06/03/2018 200,000 198,647 201,361 0.08
Braskem Finance Ltd 7.00% 07/05/2020 100,000 108,330 112,700 0.04
Hutchison Whampoa International 09 Ltd 7.63% 09/04/2019 100,000 114,294 122,243 0.05
IPIC GMTN Ltd 5.88% 14/03/2021 100,000 159,476 170,666 0.07
Petrobras International Finance Co 5.75% 20/01/2020 250,000 266,950 267,166 0.10
Petrobras International Finance Co 5.38% 27/01/2021 410,000 418,798 425,849 0.17
Transocean Inc 5.05% 15/12/2016 30,000 32,107 32,590 0.01
Transocean Inc 2.50% 15/10/2017 90,000 90,973 91,884 0.04
Vale Overseas Ltd 4.38% 11/01/2022 200,000 202,598 204,130 0.08
Wynn Macau Ltd 5.25% 15/10/2021 11,000 11,132 11,330 0.00
Total Cayman Islands 0.64% (31 December 2013: 0.52%) 1,639,919 0.64
ChileChile Government International Bond 5.50% 05/08/2020 50,000,000 104,137 94,300 0.04
Chile Government International Bond 3.25% 14/09/2021 220,000 232,712 226,505 0.09
Total Chile 0.13% (31 December 2013: 0.11%) 320,805 0.13
ColombiaColombia Government International Bond 4.38% 12/07/2021 350,000 379,290 375,375 0.14
Colombia Government International Bond 6.13% 18/01/2041 100,000 95,615 119,595 0.05
Colombian TES 5.00% 21/11/2018 509,700,000 256,045 260,966 0.10
Empresa de Energia de Bogota SA ESP 6.13% 10/11/2021 250,000 255,088 273,693 0.11
Total Colombia 0.40% (31 December 2013: 0.27%) 1,029,629 0.40Total Croatia 0.00% (31 December 2013: 0.03%)
CuraçaoTeva Pharmaceutical Finance Co BV 2.95% 18/12/2022 100,000 91,953 95,838 0.04
Total Curaçao 0.04% (31 December 2013: 0.02%) 95,838 0.04
Czech RepublicCzech Republic Government Bond 4.00% 11/04/2017 1,200,000 63,208 65,916 0.03
Czech Republic Government Bond 5.00% 11/04/2019 3,900,000 224,784 235,439 0.09
Czech Republic Government Bond 5.70% 25/05/2024 2,300,000 155,311 159,229 0.06
Czech Republic Government Bond 2.50% 25/08/2028 1,200,000 57,709 62,287 0.02
Total Czech Republic 0.20% (31 December 2013: 0.07%) 522,871 0.20
DenmarkDanske Bank A/S 4.13% 26/11/2019 75,000 97,190 120,735 0.05
Denmark Government Bond 4.00% 15/11/2017 1,100,000 220,241 227,901 0.09

STANLIB Funds Limited
Portfolio Statement (continued)
STANLIB Multi-Manager Global Bond Fund (continued)
As at 30 June 2014
70
Nominal holding Cost Market Value % of Net AssetsUSD USD
Denmark (continued)Denmark Government Bond 3.00% 15/11/2021 2,200,000 438,729 463,857 0.18
Denmark Government Bond 1.50% 15/11/2023 830,000 140,773 155,166 0.06
Denmark Government Bond 4.50% 15/11/2039 400,000 91,781 105,737 0.04
Nykredit Realkredit A/S 5.00% 01/10/2028 2 1 1 0.00
Realkredit Danmark A/S 4.00% 01/01/2019 1,710,000 333,774 358,661 0.14
Total Denmark 0.56% (31 December 2013: 0.51%) 1,432,058 0.56
El SalvadorEl Salvador Government International Bond 7.75% 24/01/2023 35,000 37,388 39,497 0.02
Total El Salvador 0.02% (31 December 2013: 0.01%) 39,497 0.02
FinlandFinland Government Bond 3.38% 15/04/2020 50,000 71,243 78,881 0.03
Finland Government Bond 3.50% 15/04/2021 290,000 409,679 465,262 0.18
Finland Government Bond 2.75% 04/07/2028 40,000 53,511 60,467 0.03
Total Finland 0.24% (31 December 2013: 0.68%) 604,610 0.24
FranceAgence Francaise de Developpement 1.80% 19/06/2015 20,000,000 231,644 200,780 0.08
AXA SA 5.25% 16/04/2040 50,000 64,282 76,940 0.03
BNP Paribas SA 5.02% 13/04/2015 50,000 44,447 72,446 0.03
Caisse d'Amortissement de la Dette Sociale 1.13% 30/01/2017 100,000 99,876 100,751 0.04
Caisse d'Amortissement de la Dette Sociale 4.00% 15/12/2025 100,000 146,910 166,414 0.06
Caisse de Refinancement de l'Habitat SA 3.75% 19/02/2020 100,000 128,414 158,693 0.06
Caisse Francaise de Financement Local 1.80% 09/05/2017 56,000,000 610,492 574,168 0.22
Caisse Francaise de Financement Local 4.50% 13/11/2017 100,000 132,653 155,320 0.06
Casino Guichard Perrachon SA 3.16% 06/08/2019 100,000 138,011 149,113 0.06
Cie de Financement Foncier SA 4.50% 16/05/2018 60,000 86,378 94,598 0.04
Cie de Financement Foncier SA 4.38% 25/04/2019 100,000 134,106 160,623 0.06
CNP Assurances 4.75% 22/12/2014 50,000 36,349 71,186 0.03
Credit Agricole SA 5.97% 01/02/2018 50,000 69,023 79,070 0.03
Dexia Credit Local SA/New York NY 0.63% 11/01/2017 1,980,000 1,980,000 1,986,966 0.77
Electricite de France SA 4.63% 26/04/2030 50,000 67,892 84,917 0.03
France Government Bond OAT 0.25% 25/11/2015 295,000 399,604 404,934 0.16
France Government Bond OAT 5.00% 25/10/2016 100,000 142,990 152,401 0.06
France Government Bond OAT 1.00% 25/05/2018 560,000 741,874 786,291 0.31
France Government Bond OAT 3.25% 25/10/2021 150,000 221,222 236,986 0.09
France Government Bond OAT 2.25% 25/10/2022 575,000 830,745 847,345 0.33
France Government Bond OAT 4.25% 25/10/2023 430,000 673,780 732,070 0.29
France Government Bond OAT 5.50% 25/04/2029 90,000 141,070 175,156 0.07
France Government Bond OAT 5.75% 25/10/2032 100,000 176,685 205,962 0.08
France Government Bond OAT 4.50% 25/04/2041 120,000 177,033 223,380 0.09
France Government Bond OAT 3.25% 25/05/2045 225,000 306,101 341,596 0.13
French Treasury Note BTAN 2.00% 12/07/2015 350,000 485,496 488,744 0.19
GDF Suez 2.63% 20/07/2022 50,000 61,050 73,464 0.03
Numericable Group SA 6.00% 15/05/2022 12,000 12,236 12,483 0.00
Orange SA 3.13% 09/01/2024 100,000 131,895 148,531 0.06
Orange SA 5.50% 06/02/2044 20,000 19,925 22,336 0.01
RCI Banque SA 2.88% 22/01/2018 25,000 32,322 36,324 0.01
Reseau Ferre de France 4.25% 07/10/2026 100,000 148,678 168,516 0.07
Sanofi 4.00% 29/03/2021 50,000 49,824 54,065 0.02
Societe Generale SA 3.13% 21/09/2017 50,000 63,056 73,532 0.03
Total Capital International SA 3.75% 10/04/2024 120,000 119,139 124,635 0.05
Total Capital SA 4.88% 28/01/2019 100,000 135,733 162,370 0.06
Unibail-Rodamco SE 3.88% 05/11/2020 50,000 72,068 78,511 0.03
Veolia Environnement SA 4.25% 06/01/2021 50,000 72,791 79,788 0.03

STANLIB Funds Limited
Portfolio Statement (continued)
STANLIB Multi-Manager Global Bond Fund (continued)
As at 30 June 2014
71
Nominal holding Cost Market Value % of Net AssetsUSD USD
France (continued)Total France 3.80% (31 December 2013: 2.85%) 9,761,405 3.80
GermanyBerlin Hyp AG 1.38% 30/05/2017 100,000 123,722 141,133 0.05
Bundesobligation 1.25% 14/10/2016 580,000 766,258 816,009 0.32
Bundesrepublik Deutschland 4.00% 04/01/2018 150,000 232,481 233,378 0.09
Bundesrepublik Deutschland 3.00% 04/07/2020 880,000 1,350,505 1,382,714 0.54
Bundesrepublik Deutschland 2.50% 04/01/2021 170,000 221,253 260,819 0.10
Bundesrepublik Deutschland 2.25% 04/09/2021 300,000 412,121 453,992 0.18
Bundesrepublik Deutschland 2.00% 04/01/2022 150,000 196,049 223,160 0.09
Bundesrepublik Deutschland 1.50% 15/02/2023 555,000 761,950 789,357 0.31
Bundesrepublik Deutschland 1.50% 15/05/2023 170,000 219,296 241,181 0.09
Bundesrepublik Deutschland 6.50% 04/07/2027 271 000 538 378 585 013 0.23
Bundesrepublik Deutschland 5.50% 04/01/2031 145 000 232 073 298 822 0.12
Bundesrepublik Deutschland 4.75% 04/07/2034 120 000 216 786 236 422 0.09
Bundesrepublik Deutschland 4.75% 04/07/2040 100 000 163 559 207 868 0.08
Bundesrepublik Deutschland 3.25% 04/07/2042 253 000 385 166 426 227 0.17
Daimler AG 1.75% 21/01/2020 50 000 65 647 70 831 0.03
Deutsche Bank AG/London 6.00% 01/09/2017 100 000 113 916 113 708 0.04
Deutsche Genossenschafts-Hypothekenbank AG 4.00% 31/10/2016
150 000 225 193 223 407 0.09
Erste Abwicklungsanstalt 0.53% 29/01/2016 1 600 000 1 602 718 1 605 440 0.62
Erste Abwicklungsanstalt 0.43% 07/06/2016 1 000 000 1 002 168 1 002 190 0.39
FMS Wertmanagement AoeR 1.38% 16/01/2015 100 000 128 469 137 804 0.05
FMS Wertmanagement AoeR 1.13% 14/10/2016 200 000 200 380 202 049 0.08
Hypothekenbank Frankfurt AG 3.75% 25/05/2016 50 000 66 321 72 920 0.03
KFW 1.00% 11/06/2018 150 000 145 740 147 945 0.06
KFW 2.00% 06/12/2018 100 000 168 467 170 255 0.07
KFW 3.88% 21/01/2019 300 000 397 722 473 971 0.18
KFW 2.63% 25/01/2022 150 000 150 943 152 495 0.06
KFW 2.05% 16/02/2026 10 000 000 118 642 113 530 0.04
Landwirtschaftliche Rentenbank 1.38% 23/10/2019 150 000 149 684 146 967 0.06
Landwirtschaftliche Rentenbank 1.38% 19/11/2020 100 000 138 901 141 432 0.05
Linde AG 1.50% 18/04/2018 50 000 49 369 49 965 0.02
State of Berlin 1.88% 10/09/2021 100 000 132 640 144 332 0.06
State of North Rhine-Westphalia 4.50% 15/02/2018 150 000 202 816 235 118 0.09
UniCredit Bank AG 2.63% 31/05/2017 100 000 127 599 145 962 0.06
WL BANK AG Westfaelische Landschaft Bodenkreditbank 3.00% 18/05/2016
50 000 70 705 72 091 0.03
Total Germany 4.57% (31 December 2013: 6.53%) 11 718 507 4.57
GuatemalaGuatemala Government Bond 5.75% 06/06/2022 200 000 200 820 214 000 0.08
Total Guatemala 0.08% (31 December 2013: 0.05%) 214 000 0.08
HungaryHungary Government Bond 5.50% 12/02/2016 140 000 000 636 934 650 860 0.25
Total Hungary 0.25% (31 December 2013: 0.33%) 650 860 0.25
IndonesiaIndonesia Government International Bond 5.88% 13/03/2020 300 000 319 131 333 000 0.13
Indonesia Government International Bond 3.75% 25/04/2022 250 000 246 785 242 800 0.09
Indonesia Treasury Bond 10.75% 15/05/2016 2 850 000 000 284 726 256 500 0.1
Indonesia Treasury Bond 11.00% 15/11/2020 4 189 000 000 560 448 406 333 0.16
Indonesia Treasury Bond 10.25% 15/07/2022 1 300 000 000 169 170 123 500 0.05
Perusahaan Listrik Negara PT 5.50% 22/11/2021 200 000 190 942 209 684 0.08
Total Indonesia 0.61% (31 December 2013: 0.32%) 1 571 817 0.61

STANLIB Funds Limited
Portfolio Statement (continued)
STANLIB Multi-Manager Global Bond Fund (continued)
As at 30 June 2014
72
Nominal holding Cost Market Value % of Net AssetsUSD USD
IrelandAerCap Ireland Capital Ltd / AerCap Global Aviation Trust 4.50% 15/05/2021
1 000 1 003 1 017 0
Cloverie Plc for Zurich Insurance Co Ltd 8.25% 18/10/2014 100 000 105 724 116 000 0.05
GE Capital European Funding 5.38% 23/01/2020 175 000 237 839 293 308 0.11
German Postal Pensions Securitisation Plc 3.38% 18/01/2016 50 000 63 979 71 677 0.03
Grifols Worldwide Operations Ltd 5.25% 01/04/2022 6 000 6 137 6 240 0
Ireland Government Bond 4.50% 18/04/2020 330 000 495 054 534 898 0.21
Trade MAPS 1 Ltd 0.85% 10/12/2018 75 000 75 101 75 258 0.03
Total Ireland 0.43% (31 December 2013: 0.42%) 1 098 398 0.43
IsraelIsrael Government Bond - Fixed 5.50% 28/02/2017 890 000 252 872 294 508 0.12
Israel Government Bond - Fixed 6.00% 28/02/2019 250 000 71 684 88 458 0.03
Israel Government Bond - Fixed 4.25% 31/03/2023 1 620 000 451 581 535 928 0.21
Israel Government Bond - Fixed 3.75% 31/03/2024 500 000 147 365 158 614 0.06
Israel Government International Bond 2.88% 29/01/2024 100 000 146 292 145 436 0.06
Total Israel 0.48% (31 December 2013: 0.23%) 1 222 944 0.48
ItalyAtlantia SpA 6.25% 09/06/2022 25 000 42 570 50 320 0.02
Enel SpA 5.25% 20/05/2024 50 000 62 918 86 067 0.03
Eni SpA 4.00% 29/06/2020 50 000 71 917 78 550 0.03
Intesa Sanpaolo SpA 3.38% 24/01/2025 100 000 135 182 150 428 0.06
Italy Buoni Poliennali Del Tesoro 4.25% 01/07/2014 340 000 442 880 465 554 0.18
Italy Buoni Poliennali Del Tesoro 3.75% 01/08/2016 280 000 363 767 408 111 0.16
Italy Buoni Poliennali Del Tesoro 4.25% 01/03/2020 400 000 615 933 625 621 0.24
Italy Buoni Poliennali Del Tesoro 3.75% 01/05/2021 800 000 1 209 575 1 214 885 0.47
Italy Buoni Poliennali Del Tesoro 5.50% 01/09/2022 410 000 633 295 689 162 0.27
Italy Buoni Poliennali Del Tesoro 4.50% 01/05/2023 200 000 269 697 315 096 0.12
Italy Buoni Poliennali Del Tesoro 4.50% 01/03/2024 600 000 846 978 945 688 0.37
Italy Buoni Poliennali Del Tesoro 3.75% 01/09/2024 390 000 574 167 577 372 0.23
Italy Buoni Poliennali Del Tesoro 5.00% 01/08/2039 1 500 000 1 867 815 2 436 738 0.95
Italy Buoni Poliennali Del Tesoro 5.00% 01/09/2040 160 000 209 272 259 195 0.1
Italy Buoni Poliennali Del Tesoro 4.75% 01/09/2044 290 000 452 906 453 018 0.18
Italy Government International Bond 4.50% 31/07/2014 100 000 128 561 137 147 0.05
Italy Government International Bond 6.88% 27/09/2023 190 000 214 858 242 113 0.1
UniCredit SpA 5.75% 26/09/2017 50 000 72 484 76 398 0.03
Total Italy 3.59% (31 December 2013: 2.39%) 9 211 463 3.59
JapanDevelopment Bank of Japan Inc 1.75% 17/03/2017 30 000 000 357 100 309 120 0.12
Japan Finance Organization for Municipalities 2.00% 09/05/2016
50 000 000 591 027 511 200 0.2
Japan Government Five Year Bond 0.30% 20/06/2018 33 000 000 336 818 328 086 0.13
Japan Government Five Year Bond 0.20% 20/09/2018 55 000 000 540 400 544 280 0.21
Japan Government Forty Year Bond 2.00% 20/03/2052 20 000 000 225 706 210 080 0.08
Japan Government Ten Year Bond 1.20% 20/06/2015 122 000 000 1 326 379 1 217 560 0.47
Japan Government Ten Year Bond 1.90% 20/06/2017 42 000 000 525 817 436 884 0.17
Japan Government Ten Year Bond 1.50% 20/09/2018 70 000 000 752 067 730 870 0.28
Japan Government Ten Year Bond 1.30% 20/06/2020 80 000 000 944 191 840 800 0.33
Japan Government Ten Year Bond 0.80% 20/09/2020 50 000 000 514 262 511 350 0.2
Japan Government Ten Year Bond 1.10% 20/03/2021 30 000 000 308 831 312 660 0.12
Japan Government Ten Year Bond 1.20% 20/06/2021 148 250 000 1 656 554 1 555 736 0.61
Japan Government Ten Year Bond 0.80% 20/06/2023 50 000 000 507 612 507 200 0.2
Japan Government Thirty Year Bond 2.40% 20/12/2034 19 000 000 208 760 219 032 0.09
Japan Government Thirty Year Bond 2.50% 20/09/2035 35 000 000 450 513 408 835 0.16
Japan Government Thirty Year Bond 2.00% 20/09/2041 21 000 000 229 333 224 385 0.09

STANLIB Funds Limited
Portfolio Statement (continued)
STANLIB Multi-Manager Global Bond Fund (continued)
As at 30 June 2014
73
Nominal holding Cost Market Value % of Net AssetsUSD USD
Japan (continued)Japan Government Twenty Year Bond 0.80% 20/06/2023 87 000 000 862 870 882 528 0.34
Japan Government Twenty Year Bond 2.10% 20/06/2025 88 000 000 1 058 800 1 003 640 0.39
Japan Government Twenty Year Bond 2.10% 20/12/2026 56 200 000 636 565 643 490 0.25
Japan Government Twenty Year Bond 2.10% 20/06/2029 15 000 000 188 183 170 970 0.07
Japan Government Twenty Year Bond 2.10% 20/09/2029 25 000 000 309 184 284 675 0.11
Japan Government Twenty Year Bond 2.20% 20/03/2030 95 000 000 1 074 508 1 094 115 0.43
Japan Government Twenty Year Bond 1.80% 20/06/2030 9 000 000 103 401 98 352 0.04
Japan Government Twenty Year Bond 1.80% 20/09/2031 48 000 000 553 891 519 456 0.2
Japan Government Twenty Year Bond 1.70% 20/09/2032 30 000 000 376 675 316 410 0.12
Japan Government Two Year Bond 0.10% 15/01/2016 60 000 000 587 154 592 440 0.23
Total Japan 5.64% (31 December 2013: 5.51%) 14 474 154 5.64
JerseyAnnington Repackaging No 1 Ltd 5.32% 10/01/2023 20 000 29 577 37 782 0.01
Heathrow Funding Ltd 4.60% 15/02/2018 50 000 62 984 77 277 0.03
Total Jersey 0.04% (31 December 2013: 0.05%) 115 059 0.04
JordanHashemite Kingdom of Jordan Government AID Bond 2.50% 30/10/2020
200 000 200 000 200 250 0.08
Total Jordan 0.08% (31 December 2013: 0.05%) 200 250 0.08
KazakhstanKazMunayGas National Co JSC 9.13% 02/07/2018 200 000 222 622 241 000 0.09
Total Kazakhstan 0.09% (31 December 2013: 0.06%) 241 000 0.09
Korea, Republic of (South Korea)Export-Import Bank of Korea 0.98% 14/01/2017 490 000 490 000 493 316 0.19
Export-Import Bank of Korea 0.82% 12/05/2017 995 000 995 000 996 412 0.39
Export-Import Bank of Korea 0.85% 14/08/2017 875 000 875 000 874 339 0.34
Export-Import Bank of Korea 1.75% 27/02/2018 300 000 301 216 298 226 0.12
Export-Import Bank of Korea 5.00% 11/04/2022 180 000 195 888 203 941 0.08
Korea Treasury Bond 4.50% 10/03/2015 500 000 000 435 432 507 500 0.2
Korea Treasury Bond 3.50% 10/03/2017 900 000 000 849 419 917 100 0.36
Korea Treasury Bond 5.50% 10/09/2017 100 000 000 91 540 108 700 0.04
Korea Treasury Bond 5.75% 10/09/2018 1 565 000 000 1 594 821 1 746 540 0.68
Korea Treasury Bond 5.00% 10/06/2020 890 000 000 911 830 976 330 0.38
Korea Treasury Bond 3.75% 10/06/2022 548 400 000 523 879 567 594 0.22
Korea Treasury Bond 3.38% 10/09/2023 487 000 000 462 066 489 922 0.19
Korea Treasury Bond 4.00% 10/12/2031 450 000 000 395 331 485 100 0.19
Total Korea, Republic of (South Korea) 3.38% (31 December 2013: 2.54%)
8 665 020 3.38
LithuaniaLithuania Government International Bond 4.85% 07/02/2018 190 000 271 364 293 231 0.11
Total Lithuania 0.11% (31 December 2013: 0.18%) 293 231 0.11
LuxembourgAccudyne Industries Borrower / Accudyne Industries LLC 7.75% 15/12/2020
15 000 15 634 16 050 0.01
Altice SA 7.75% 15/05/2022 4 000 4 135 4 260 0
ArcelorMittal 6.75% 25/02/2022 20 000 20 817 22 375 0.01
Beverage Packaging Holdings Luxembourg II SA / Beverage Packaging Holdings II Is 6.00% 15/06/2017
2 000 2 000 2 050 0
Calcipar SA 6.88% 01/05/2018 8 000 7 667 8 460 0
ConvaTec Healthcare E SA 10.50% 15/12/2018 13 000 13 793 14 278 0.01
Covidien International Finance SA 6.55% 15/10/2037 20 000 24 176 26 224 0.01
Gazprom Neft OAO Via GPN Capital SA 4.38% 19/09/2022 350 000 351 892 324 625 0.13
Gazprom OAO Via Gaz Capital SA 8.15% 11/04/2018 100 000 103 124 114 892 0.05
Gazprom OAO Via Gaz Capital SA 3.39% 20/03/2020 120 000 155 345 166 227 0.07

STANLIB Funds Limited
Portfolio Statement (continued)
STANLIB Multi-Manager Global Bond Fund (continued)
As at 30 June 2014
74
Nominal holding Cost Market Value % of Net AssetsUSD USD
Luxembourg (continued)Glencore Finance Europe SA 4.63% 03/04/2018 100 000 135 660 153 331 0.06
INEOS Group Holdings SA 5.88% 15/02/2019 10 000 10 090 10 225 0
Intelsat Jackson Holdings SA 7.25% 15/10/2020 19 000 19 709 20 520 0.01
Intelsat Luxembourg SA 8.13% 01/06/2023 10 000 10 000 10 812 0
Nielsen Co Luxembourg SARL/The 5.50% 01/10/2021 6 000 6 000 6 225 0
Pacific Drilling SA 5.38% 01/06/2020 5 000 5 033 4 875 0
Schlumberger Investment SA 3.65% 01/12/2023 20 000 19 936 20 770 0.01
Telecom Italia Capital SA 7.18% 18/06/2019 8 000 8 809 9 258 0
Wind Acquisition Finance SA 6.50% 30/04/2020 10 000 10 656 10 825 0
Wind Acquisition Finance SA 4.75% 15/07/2020 6 000 6 040 6 030 0
Wind Acquisition Finance SA 7.38% 23/04/2021 8 000 8 117 8 568 0
Total Luxembourg 0.37% (31 December 2013: 0.33%) 960 880 0.37
MalaysiaMalaysia Government Bond 3.58% 28/09/2018 175 000 55 722 54 430 0.02
Malaysia Government Bond 3.49% 31/03/2020 3 100 000 988 854 947 124 0.37
Malaysia Government Bond 4.05% 30/09/2021 1 305 000 401 564 409 850 0.16
Malaysia Government Bond 3.48% 15/03/2023 1 950 000 601 902 584 136 0.23
Malaysia Government Bond 3.89% 15/03/2027 550 000 177 823 164 506 0.06
Petronas Capital Ltd 5.25% 12/08/2019 150 000 156 702 170 385 0.07
Total Malaysia 0.91% (31 December 2013: 0.67%) 2 330 431 0.91
MexicoAmerica Movil SAB de CV 3.75% 28/06/2017 100 000 138 375 148 816 0.06
America Movil SAB de CV 3.13% 16/07/2022 200 000 182 458 196 800 0.08
America Movil SAB de CV 6.38% 01/03/2035 75 000 91 171 89 482 0.03
Grupo Televisa SAB 6.63% 18/03/2025 100 000 119 339 122 546 0.05
Mexican Bonos 8.00% 17/12/2015 8 680 000 686 793 714 286 0.28
Mexican Bonos 7.75% 14/12/2017 4 600 000 384 968 396 147 0.15
Mexican Bonos 8.00% 11/06/2020 3 500 000 298 667 310 181 0.12
Mexican Bonos 6.50% 10/06/2021 7 000 000 611 765 578 025 0.23
Mexican Bonos 6.50% 09/06/2022 8 600 000 737 962 704 607 0.27
Mexican Bonos 10.00% 05/12/2024 9 300 000 380 045 957 230 0.37
Mexican Bonos 8.50% 31/05/2029 26 900 000 2 392 594 2 533 012 0.99
Mexican Bonos 10.00% 20/11/2036 2 500 000 267 120 268 163 0.1
Mexican Bonos 8.50% 18/11/2038 20 200 000 1 719 761 1 897 750 0.74
Mexican Bonos 7.75% 13/11/2042 31 900 000 2 508 430 2 784 551 1.08
Mexico Government International Bond 3.63% 15/03/2022 450 000 466 097 466 583 0.18
Mexico Government International Bond 4.00% 02/10/2023 100 000 99 577 104 980 0.04
Mexico Government International Bond 4.75% 08/03/2044 200 000 209 550 204 000 0.08
Petroleos Mexicanos 8.00% 03/05/2019 100 000 122 215 123 975 0.05
Petroleos Mexicanos 5.50% 21/01/2021 220 000 241 408 245 831 0.1
Petroleos Mexicanos 5.50% 24/02/2025 100 000 118 629 167 412 0.07
Petroleos Mexicanos 6.50% 02/06/2041 100 000 103 402 116 777 0.05
Total Mexico 5.12% (31 December 2013: 2.52%) 13 131 154 5.12Total Morocco 0.00% (31 December 2013: 0.05%)
NetherlandsABN AMRO Bank NV 1.03% 28/10/2016 650 000 650 000 655 310 0.26
ABN AMRO Bank NV 4.75% 11/01/2019 100 000 131 556 159 260 0.06
Bank Nederlandse Gemeenten 3.88% 26/05/2023 50 000 73 195 82 166 0.03
Constellium NV 5.75% 15/05/2024 2 000 2 044 2 074 0
Cooperatieve Centrale Raiffeisen-Boerenleenbank BA/Netherlands 4.75% 15/01/2020
150 000 154 920 167 263 0.06
Cooperatieve Centrale Raiffeisen-Boerenleenbank BA/Netherlands 2.00% 16/09/2021
100 000 115 543 121 990 0.05
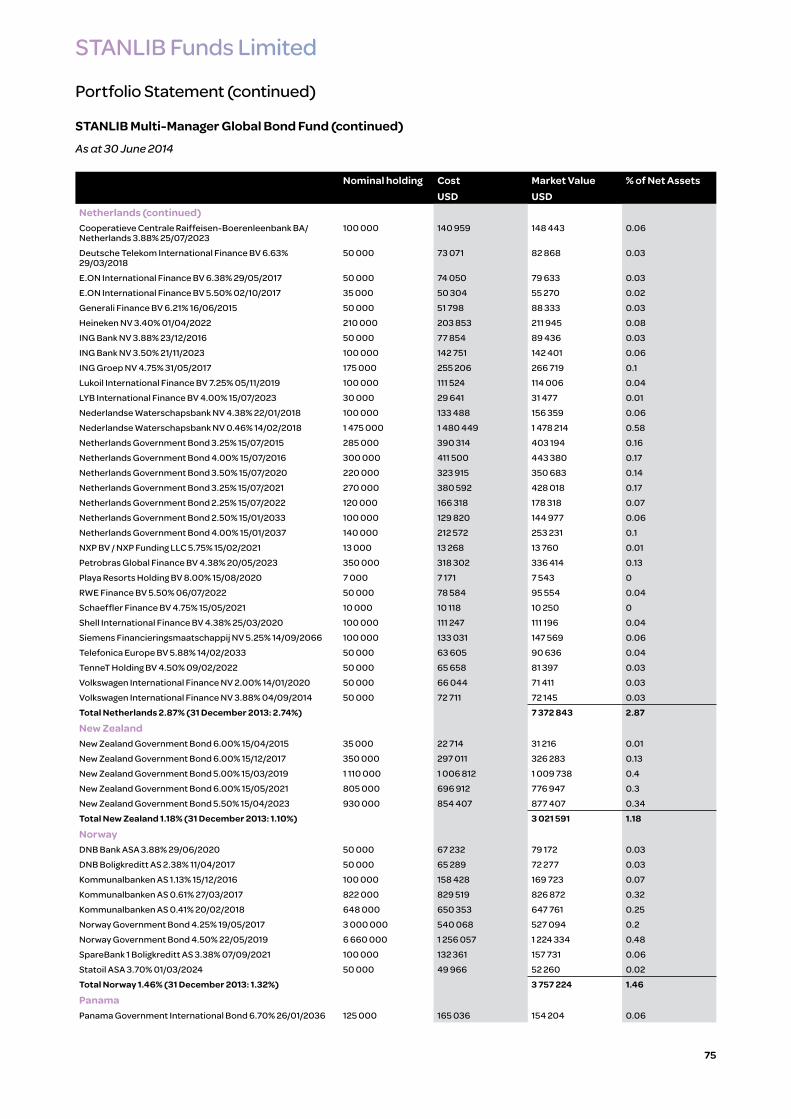
STANLIB Funds Limited
Portfolio Statement (continued)
STANLIB Multi-Manager Global Bond Fund (continued)
As at 30 June 2014
75
Nominal holding Cost Market Value % of Net AssetsUSD USD
Netherlands (continued)Cooperatieve Centrale Raiffeisen-Boerenleenbank BA/Netherlands 3.88% 25/07/2023
100 000 140 959 148 443 0.06
Deutsche Telekom International Finance BV 6.63% 29/03/2018
50 000 73 071 82 868 0.03
E.ON International Finance BV 6.38% 29/05/2017 50 000 74 050 79 633 0.03
E.ON International Finance BV 5.50% 02/10/2017 35 000 50 304 55 270 0.02
Generali Finance BV 6.21% 16/06/2015 50 000 51 798 88 333 0.03
Heineken NV 3.40% 01/04/2022 210 000 203 853 211 945 0.08
ING Bank NV 3.88% 23/12/2016 50 000 77 854 89 436 0.03
ING Bank NV 3.50% 21/11/2023 100 000 142 751 142 401 0.06
ING Groep NV 4.75% 31/05/2017 175 000 255 206 266 719 0.1
Lukoil International Finance BV 7.25% 05/11/2019 100 000 111 524 114 006 0.04
LYB International Finance BV 4.00% 15/07/2023 30 000 29 641 31 477 0.01
Nederlandse Waterschapsbank NV 4.38% 22/01/2018 100 000 133 488 156 359 0.06
Nederlandse Waterschapsbank NV 0.46% 14/02/2018 1 475 000 1 480 449 1 478 214 0.58
Netherlands Government Bond 3.25% 15/07/2015 285 000 390 314 403 194 0.16
Netherlands Government Bond 4.00% 15/07/2016 300 000 411 500 443 380 0.17
Netherlands Government Bond 3.50% 15/07/2020 220 000 323 915 350 683 0.14
Netherlands Government Bond 3.25% 15/07/2021 270 000 380 592 428 018 0.17
Netherlands Government Bond 2.25% 15/07/2022 120 000 166 318 178 318 0.07
Netherlands Government Bond 2.50% 15/01/2033 100 000 129 820 144 977 0.06
Netherlands Government Bond 4.00% 15/01/2037 140 000 212 572 253 231 0.1
NXP BV / NXP Funding LLC 5.75% 15/02/2021 13 000 13 268 13 760 0.01
Petrobras Global Finance BV 4.38% 20/05/2023 350 000 318 302 336 414 0.13
Playa Resorts Holding BV 8.00% 15/08/2020 7 000 7 171 7 543 0
RWE Finance BV 5.50% 06/07/2022 50 000 78 584 95 554 0.04
Schaeffler Finance BV 4.75% 15/05/2021 10 000 10 118 10 250 0
Shell International Finance BV 4.38% 25/03/2020 100 000 111 247 111 196 0.04
Siemens Financieringsmaatschappij NV 5.25% 14/09/2066 100 000 133 031 147 569 0.06
Telefonica Europe BV 5.88% 14/02/2033 50 000 63 605 90 636 0.04
TenneT Holding BV 4.50% 09/02/2022 50 000 65 658 81 397 0.03
Volkswagen International Finance NV 2.00% 14/01/2020 50 000 66 044 71 411 0.03
Volkswagen International Finance NV 3.88% 04/09/2014 50 000 72 711 72 145 0.03
Total Netherlands 2.87% (31 December 2013: 2.74%) 7 372 843 2.87
New ZealandNew Zealand Government Bond 6.00% 15/04/2015 35 000 22 714 31 216 0.01
New Zealand Government Bond 6.00% 15/12/2017 350 000 297 011 326 283 0.13
New Zealand Government Bond 5.00% 15/03/2019 1 110 000 1 006 812 1 009 738 0.4
New Zealand Government Bond 6.00% 15/05/2021 805 000 696 912 776 947 0.3
New Zealand Government Bond 5.50% 15/04/2023 930 000 854 407 877 407 0.34
Total New Zealand 1.18% (31 December 2013: 1.10%) 3 021 591 1.18
NorwayDNB Bank ASA 3.88% 29/06/2020 50 000 67 232 79 172 0.03
DNB Boligkreditt AS 2.38% 11/04/2017 50 000 65 289 72 277 0.03
Kommunalbanken AS 1.13% 15/12/2016 100 000 158 428 169 723 0.07
Kommunalbanken AS 0.61% 27/03/2017 822 000 829 519 826 872 0.32
Kommunalbanken AS 0.41% 20/02/2018 648 000 650 353 647 761 0.25
Norway Government Bond 4.25% 19/05/2017 3 000 000 540 068 527 094 0.2
Norway Government Bond 4.50% 22/05/2019 6 660 000 1 256 057 1 224 334 0.48
SpareBank 1 Boligkreditt AS 3.38% 07/09/2021 100 000 132 361 157 731 0.06
Statoil ASA 3.70% 01/03/2024 50 000 49 966 52 260 0.02
Total Norway 1.46% (31 December 2013: 1.32%) 3 757 224 1.46
PanamaPanama Government International Bond 6.70% 26/01/2036 125 000 165 036 154 204 0.06

STANLIB Funds Limited
Portfolio Statement (continued)
STANLIB Multi-Manager Global Bond Fund (continued)
As at 30 June 2014
76
Nominal holding Cost Market Value % of Net AssetsUSD USD
Panama (continued)Total Panama 0.06% (31 December 2013: 0.04%) 154 204 0.06
PeruPeruvian Government International Bond 7.35% 21/07/2025 300 000 383 519 397 500 0.15
Total Peru 0.15% (31 December 2013: 0.24%) 397 500 0.15
PhilippinesPhilippine Government International Bond 4.00% 15/01/2021 150 000 161 602 159 000 0.06
Total Philippines 0.06% (31 December 2013: 0.04%) 159 000 0.06
PolandPoland Government Bond 5.25% 25/10/2017 4 515 000 1 495 083 1 603 037 0.63
Poland Government Bond 5.25% 25/10/2020 3 240 000 1 081 196 1 193 337 0.47
Poland Government Bond 5.75% 25/10/2021 5 170 000 1 836 642 1 973 854 0.77
Poland Government Bond 4.00% 25/10/2023 4 075 000 1 289 615 1 394 164 0.54
Poland Government International Bond 5.25% 20/01/2025 140 000 202 845 242 679 0.09
Total Poland 2.50% (31 December 2013: 2.90%) 6 407 071 2.5
PortugalPortugal Obrigacoes do Tesouro OT 4.75% 14/06/2019 1 020 000 1 554 962 1 549 510 0.6
Total Portugal 0.60% (31 December 2013: 0.00%) 1 549 510 0.6
Puerto RicoPopular Inc 7.00% 01/07/2019 2 000 2 000 2 030 0
Total Puerto Rico 0.00% (31 December 2013: 0.00%) 2 030 0
QatarQatar Government International Bond 9.75% 15/06/2030 50 000 77 619 80 634 0.03
SoQ Sukuk A Q.S.C 3.24% 18/01/2023 200 000 198 527 202 680 0.08
Total Qatar 0.11% (31 December 2013: 0.02%) 283 314 0.11
RomaniaRomanian Government International Bond 6.75% 07/02/2022 100 000 113 045 119 125 0.05
Romanian Government International Bond 3.63% 24/04/2024 100 000 144 102 143 222 0.05
Total Romania 0.10% (31 December 2013: 0.12%) 262 347 0.1
RussiaRussian Federal Bond - OFZ 6.20% 31/01/2018 11 000 000 360 932 304 920 0.12
Russian Federal Bond - OFZ 7.50% 27/02/2019 10 000 000 276 883 287 640 0.11
Russian Federal Bond - OFZ 7.60% 14/04/2021 8 000 000 216 948 228 592 0.09
Russian Federal Bond - OFZ 7.05% 19/01/2028 3 000 000 74 341 78 981 0.03
Russian Foreign Bond - Eurobond 3.50% 16/01/2019 200 000 203 716 203 000 0.08
Russian Foreign Bond - Eurobond 3.63% 16/09/2020 100 000 138 870 143 401 0.06
Russian Foreign Bond - Eurobond 7.50% 31/03/2030 441 825 524 689 512 517 0.2
Total Russia 0.69% (31 December 2013: 0.34%) 1 759 051 0.69
SingaporeSingapore Government Bond 4.00% 01/09/2018 650 000 589 076 588 546 0.23
Singapore Government Bond 3.25% 01/09/2020 140 000 115 015 122 488 0.05
Total Singapore 0.28% (31 December 2013: 0.24%) 711 034 0.28
South AfricaSouth Africa Government Bond 6.75% 31/03/2021 5 585 000 644 766 492 781 0.19
South Africa Government Bond 7.75% 28/02/2023 1 475 000 151 794 135 349 0.05
South Africa Government Bond 6.50% 28/02/2041 11 705 000 1 032 592 819 994 0.32
Total South Africa 0.56% (31 December 2013: 0.87%) 1 448 124 0.56
SpainAyt Cedulas Cajas Global 4.00% 21/03/2017 100 000 117 818 146 946 0.06
Banco Financiero y de Ahorros SA 3.13% 21/01/2015 100 000 124 929 138 543 0.05
BBVA Senior Finance SAU 3.75% 17/01/2018 100 000 139 254 149 259 0.06
CaixaBank SA 3.00% 22/03/2018 100 000 141 918 147 163 0.06
Catalunya Banc SA 3.00% 29/10/2014 100 000 128 421 137 769 0.05
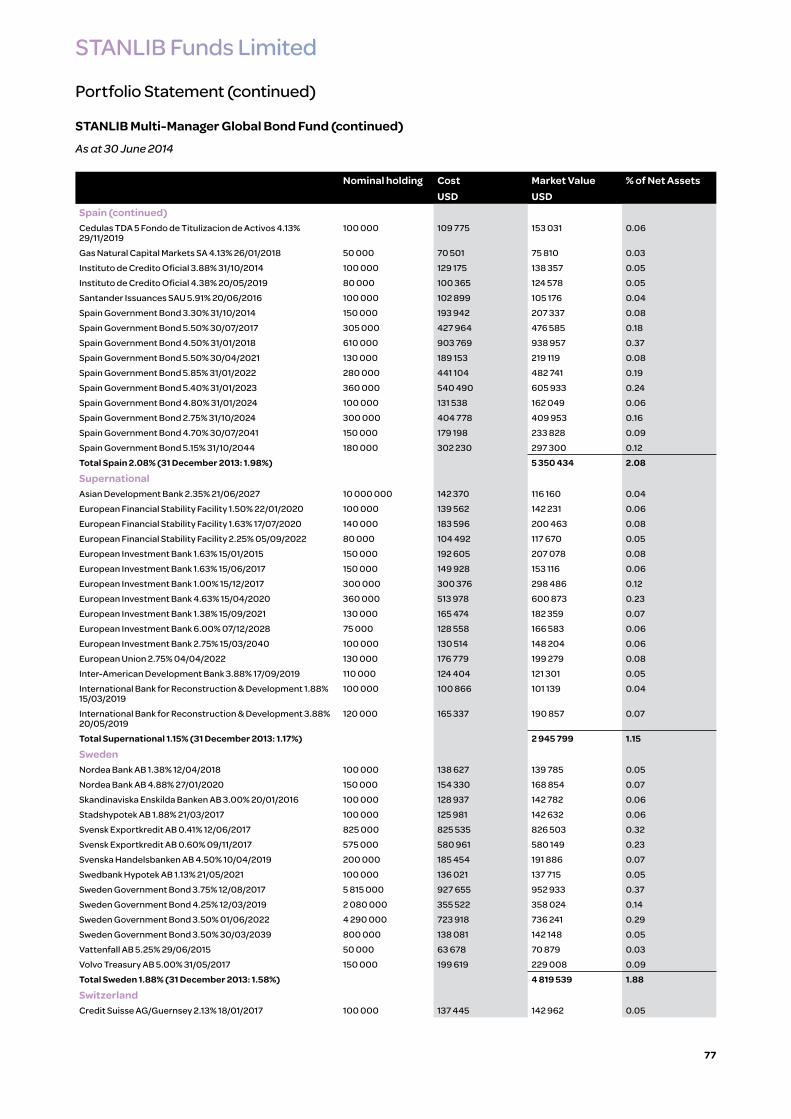
STANLIB Funds Limited
Portfolio Statement (continued)
STANLIB Multi-Manager Global Bond Fund (continued)
As at 30 June 2014
77
Nominal holding Cost Market Value % of Net AssetsUSD USD
Spain (continued)Cedulas TDA 5 Fondo de Titulizacion de Activos 4.13% 29/11/2019
100 000 109 775 153 031 0.06
Gas Natural Capital Markets SA 4.13% 26/01/2018 50 000 70 501 75 810 0.03
Instituto de Credito Oficial 3.88% 31/10/2014 100 000 129 175 138 357 0.05
Instituto de Credito Oficial 4.38% 20/05/2019 80 000 100 365 124 578 0.05
Santander Issuances SAU 5.91% 20/06/2016 100 000 102 899 105 176 0.04
Spain Government Bond 3.30% 31/10/2014 150 000 193 942 207 337 0.08
Spain Government Bond 5.50% 30/07/2017 305 000 427 964 476 585 0.18
Spain Government Bond 4.50% 31/01/2018 610 000 903 769 938 957 0.37
Spain Government Bond 5.50% 30/04/2021 130 000 189 153 219 119 0.08
Spain Government Bond 5.85% 31/01/2022 280 000 441 104 482 741 0.19
Spain Government Bond 5.40% 31/01/2023 360 000 540 490 605 933 0.24
Spain Government Bond 4.80% 31/01/2024 100 000 131 538 162 049 0.06
Spain Government Bond 2.75% 31/10/2024 300 000 404 778 409 953 0.16
Spain Government Bond 4.70% 30/07/2041 150 000 179 198 233 828 0.09
Spain Government Bond 5.15% 31/10/2044 180 000 302 230 297 300 0.12
Total Spain 2.08% (31 December 2013: 1.98%) 5 350 434 2.08
SupernationalAsian Development Bank 2.35% 21/06/2027 10 000 000 142 370 116 160 0.04
European Financial Stability Facility 1.50% 22/01/2020 100 000 139 562 142 231 0.06
European Financial Stability Facility 1.63% 17/07/2020 140 000 183 596 200 463 0.08
European Financial Stability Facility 2.25% 05/09/2022 80 000 104 492 117 670 0.05
European Investment Bank 1.63% 15/01/2015 150 000 192 605 207 078 0.08
European Investment Bank 1.63% 15/06/2017 150 000 149 928 153 116 0.06
European Investment Bank 1.00% 15/12/2017 300 000 300 376 298 486 0.12
European Investment Bank 4.63% 15/04/2020 360 000 513 978 600 873 0.23
European Investment Bank 1.38% 15/09/2021 130 000 165 474 182 359 0.07
European Investment Bank 6.00% 07/12/2028 75 000 128 558 166 583 0.06
European Investment Bank 2.75% 15/03/2040 100 000 130 514 148 204 0.06
European Union 2.75% 04/04/2022 130 000 176 779 199 279 0.08
Inter-American Development Bank 3.88% 17/09/2019 110 000 124 404 121 301 0.05
International Bank for Reconstruction & Development 1.88% 15/03/2019
100 000 100 866 101 139 0.04
International Bank for Reconstruction & Development 3.88% 20/05/2019
120 000 165 337 190 857 0.07
Total Supernational 1.15% (31 December 2013: 1.17%) 2 945 799 1.15
SwedenNordea Bank AB 1.38% 12/04/2018 100 000 138 627 139 785 0.05
Nordea Bank AB 4.88% 27/01/2020 150 000 154 330 168 854 0.07
Skandinaviska Enskilda Banken AB 3.00% 20/01/2016 100 000 128 937 142 782 0.06
Stadshypotek AB 1.88% 21/03/2017 100 000 125 981 142 632 0.06
Svensk Exportkredit AB 0.41% 12/06/2017 825 000 825 535 826 503 0.32
Svensk Exportkredit AB 0.60% 09/11/2017 575 000 580 961 580 149 0.23
Svenska Handelsbanken AB 4.50% 10/04/2019 200 000 185 454 191 886 0.07
Swedbank Hypotek AB 1.13% 21/05/2021 100 000 136 021 137 715 0.05
Sweden Government Bond 3.75% 12/08/2017 5 815 000 927 655 952 933 0.37
Sweden Government Bond 4.25% 12/03/2019 2 080 000 355 522 358 024 0.14
Sweden Government Bond 3.50% 01/06/2022 4 290 000 723 918 736 241 0.29
Sweden Government Bond 3.50% 30/03/2039 800 000 138 081 142 148 0.05
Vattenfall AB 5.25% 29/06/2015 50 000 63 678 70 879 0.03
Volvo Treasury AB 5.00% 31/05/2017 150 000 199 619 229 008 0.09
Total Sweden 1.88% (31 December 2013: 1.58%) 4 819 539 1.88
SwitzerlandCredit Suisse AG/Guernsey 2.13% 18/01/2017 100 000 137 445 142 962 0.05

STANLIB Funds Limited
Portfolio Statement (continued)
STANLIB Multi-Manager Global Bond Fund (continued)
As at 30 June 2014
78
Nominal holding Cost Market Value % of Net AssetsUSD USD
Switzerland (continued)Pfandbriefbank der schweizerischen Hypothekarinstitute AG 2.38% 30/10/2019
100 000 100 408 124 709 0.05
Switzerland Government Bond 4.00% 11/02/2023 450 000 595 695 658 568 0.26
Switzerland Government Bond 1.25% 27/06/2037 50 000 50 381 54 917 0.02
UBS AG/Stamford CT 5.75% 25/04/2018 150 000 160 699 172 333 0.07
Total Switzerland 0.45% (31 December 2013: 0.34%) 1 153 489 0.45
ThailandThailand Government Bond 3.25% 16/06/2017 6 000 000 188 591 188 430 0.07
Thailand Government Bond 3.63% 16/06/2023 300 000 9 038 9 154 0
Thailand Government Bond 5.67% 13/03/2028 4 500 000 166 312 163 580 0.07
Thailand Government Bond 4.85% 17/06/2061 1 500 000 51 655 50 922 0.02
Total Thailand 0.16% (31 December 2013: 0.25%) 412 086 0.16
TurkeyExport Credit Bank of Turkey 5.88% 24/04/2019 250 000 269 272 264 800 0.1
Turkey Government International Bond 5.50% 16/02/2017 230 000 330 491 342 589 0.14
Turkey Government International Bond 5.75% 22/03/2024 400 000 429 338 434 500 0.17
Total Turkey 0.41% (31 December 2013: 0.15%) 1 041 889 0.41
United Arab EmiratesAbu Dhabi National Energy Co 6.17% 25/10/2017 230 000 249 299 261 650 0.1
Total United Arab Emirates 0.10% (31 December 2013: 0.07%)
261 650 0.1
United KingdomAbbey National Treasury Services Plc/London 3.63% 14/10/2016
75 000 96 342 110 260 0.04
Aviva Plc 6.88% 22/05/2038 50 000 56 015 79 843 0.03
Barclays Bank Plc 0.77% 09/12/2016 455 000 455 000 456 102 0.18
Barclays Bank Plc 5.14% 14/10/2020 100 000 100 942 109 890 0.04
Barclays Bank Plc 6.63% 30/03/2022 165 000 278 079 281 233 0.11
BAT International Finance Plc 7.25% 12/03/2024 50 000 83 513 108 860 0.04
BMW UK Capital Plc 5.00% 02/10/2017 50 000 78 751 93 552 0.04
BP Capital Markets Plc 4.50% 01/10/2020 100 000 103 045 110 954 0.04
British Sky Broadcasting Group Plc 3.13% 26/11/2022 180 000 179 424 172 292 0.07
British Telecommunications Plc 6.38% 23/06/2037 50 000 89 441 106 121 0.04
Canary Wharf Finance II Plc 6.46% 22/04/2030 19 635 30 978 38 001 0.02
Diageo Capital Plc 2.63% 29/04/2023 200 000 183 011 191 169 0.07
HSBC Holdings Plc 6.50% 20/05/2024 50 000 80 176 104 706 0.04
Imperial Tobacco Finance Plc 9.00% 17/02/2022 50 000 95 998 114 050 0.04
Jaguar Land Rover Automotive Plc 5.63% 01/02/2023 10 000 9 725 10 600 0
Lloyds Bank Plc 6.50% 24/03/2020 150 000 203 632 249 371 0.1
Lloyds Bank Plc 6.96% 29/05/2020 50 000 74 866 88 790 0.04
Lloyds Bank Plc 1.38% 16/04/2021 100 000 137 982 139 541 0.05
National Grid Plc 6.30% 01/08/2016 50 000 54 304 55 358 0.02
National Grid Plc 5.00% 02/07/2018 200 000 288 600 317 023 0.12
Nationwide Building Society 4.38% 28/02/2022 50 000 63 352 84 412 0.03
Network Rail Infrastructure Finance Plc 4.63% 21/07/2020 125 000 197 074 241 006 0.09
PPL WEM Holdings Ltd 5.38% 01/05/2021 50 000 51 566 56 186 0.02
Royal Bank of Scotland Plc/The 5.50% 23/03/2020 100 000 125 268 166 037 0.07
RSA Insurance Group Plc 8.50% 08/12/2014 50 000 81 408 87 458 0.03
South Eastern Power Networks Plc 5.50% 05/06/2026 25 000 44 414 48 375 0.02
SSE Plc 5.00% 01/10/2018 50 000 78 378 94 548 0.04
Tesco Plc 5.50% 13/01/2033 25 000 42 296 45 599 0.02
United Kingdom Gilt 2.75% 22/01/2015 2 090 000 3 526 926 3 616 379 1.41
United Kingdom Gilt 4.00% 07/09/2016 322 000 530 902 585 409 0.23
United Kingdom Gilt 1.00% 07/09/2017 150 000 242 238 252 291 0.1

STANLIB Funds Limited
Portfolio Statement (continued)
STANLIB Multi-Manager Global Bond Fund (continued)
As at 30 June 2014
79
Nominal holding Cost Market Value % of Net AssetsUSD USD
United Kingdom (continued)United Kingdom Gilt 4.50% 07/03/2019 800 000 1 510 902 1 525 973 0.59
United Kingdom Gilt 1.75% 22/07/2019 900 000 1 502 064 1 517 128 0.59
United Kingdom Gilt 3.75% 07/09/2019 220 000 341 057 407 944 0.16
United Kingdom Gilt 3.75% 07/09/2021 239 000 419 815 446 199 0.17
United Kingdom Gilt 1.75% 07/09/2022 250 000 368 596 402 189 0.16
United Kingdom Gilt 2.25% 07/09/2023 430 000 664 149 709 778 0.28
United Kingdom Gilt 5.00% 07/03/2025 215 000 396 267 442 382 0.17
United Kingdom Gilt 4.75% 07/12/2030 200 000 318 661 411 313 0.16
United Kingdom Gilt 4.50% 07/09/2034 225 000 426 162 452 840 0.18
United Kingdom Gilt 4.25% 07/03/2036 50 000 78 371 97 493 0.04
United Kingdom Gilt 4.75% 07/12/2038 217 000 415 288 457 443 0.18
United Kingdom Gilt 4.25% 07/12/2040 190 000 356 430 373 627 0.15
United Kingdom Gilt 4.50% 07/12/2042 60 000 110 119 123 322 0.05
United Kingdom Gilt 4.25% 07/12/2046 230 000 435 569 458 420 0.18
United Kingdom Gilt 4.25% 07/12/2055 190 000 289 048 389 805 0.15
Vodafone Group Plc 5.45% 10/06/2019 100 000 107 096 114 878 0.05
Total United Kingdom 6.45% (31 December 2013: 6.03%) 16 546 150 6.45
United States21st Century Fox America Inc 6.90% 01/03/2019 25 000 28 633 30 167 0.01
21st Century Fox America Inc 4.00% 01/10/2023 60 000 59 665 62 527 0.02
21st Century Fox America Inc 5.40% 01/10/2043 40 000 42 607 44 553 0.02
AbbVie Inc 2.00% 06/11/2018 100 000 99 617 100 255 0.04
AbbVie Inc 4.40% 06/11/2042 30 000 29 706 29 003 0.01
Acadia Healthcare Co Inc 5.13% 01/07/2022 2 000 2 000 2 005 0
Access Midstream Partners LP / ACMP Finance Corp 4.88% 15/05/2023
18 000 17 511 18 990 0.01
Activision Blizzard Inc 5.63% 15/09/2021 11 000 11 200 11 852 0.01
ADT Corp/The 3.50% 15/07/2022 8 000 7 295 7 360 0
AES Corp/VA 7.38% 01/07/2021 3 000 3 408 3 514 0
Air Lease Corp 4.75% 01/03/2020 10 000 10 000 10 800 0
Allegion US Holding Co Inc 5.75% 01/10/2021 8 000 8 052 8 420 0
Ally Financial Inc 7.50% 15/09/2020 34 000 38 903 40 970 0.02
Ally Master Owner Trust 1.29% 15/01/2019 100 000 99 975 100 174 0.04
Alpha Natural Resources Inc 7.50% 01/08/2020 3 000 3 000 2 910 0
Alternative Loan Trust 2005-54CB 5.50% 25/11/2035 33 358 18 870 32 258 0.01
Alternative Loan Trust 2005-64CB 5.50% 25/12/2035 160 255 56 363 164 779 0.06
Altria Group Inc 4.25% 09/08/2042 50 000 49 097 46 575 0.02
AMC Entertainment Inc 5.88% 15/02/2022 8 000 8 000 8 340 0
AMC Networks Inc 4.75% 15/12/2022 15 000 15 000 14 981 0.01
American Axle & Manufacturing Inc 6.63% 15/10/2022 11 000 11 069 12 059 0.01
American Builders & Contractors Supply Co Inc 5.63% 15/04/2021
13 000 12 738 13 455 0.01
American International Group Inc 3.38% 15/08/2020 150 000 148 099 155 823 0.06
American Tower Corp 3.50% 31/01/2023 50 000 49 166 49 073 0.02
Amgen Inc 5.15% 15/11/2041 50 000 49 199 53 595 0.02
Amsted Industries Inc 5.00% 15/03/2022 4 000 4 000 4 000 0
Anadarko Petroleum Corp 6.95% 15/06/2019 50 000 54 779 61 243 0.02
Ancestry.com Inc 9.63% 15/10/2018 8 000 8 040 8 270 0
Anheuser-Busch InBev Finance Inc 3.70% 01/02/2024 20 000 19 995 20 514 0.01
Anheuser-Busch InBev Worldwide Inc 7.75% 15/01/2019 50 000 55 914 61 793 0.02
Antero Resources Corp 5.13% 01/12/2022 4 000 4 000 4 080 0
Antero Resources Finance Corp 5.38% 01/11/2021 5 000 5 000 5 212 0
Aon Corp 3.13% 27/05/2016 100 000 100 341 104 180 0.04
Apple Inc 2.10% 06/05/2019 100 000 100 481 100 620 0.04
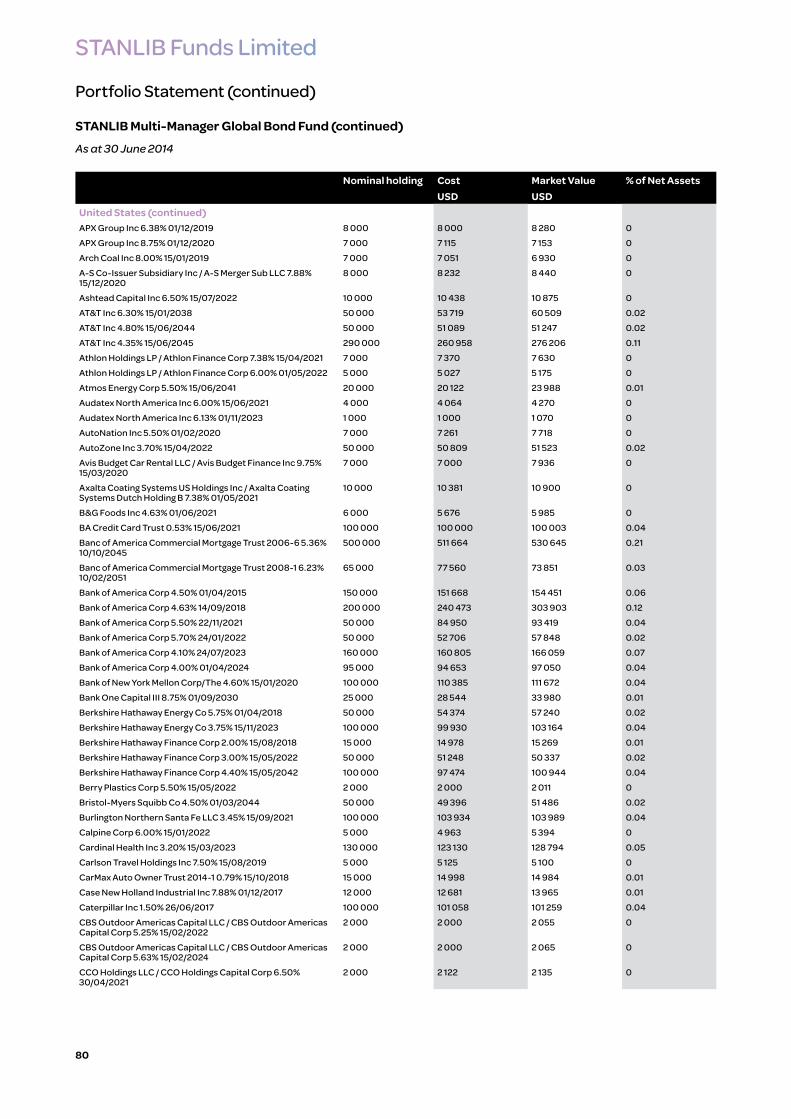
STANLIB Funds Limited
Portfolio Statement (continued)
STANLIB Multi-Manager Global Bond Fund (continued)
As at 30 June 2014
80
Nominal holding Cost Market Value % of Net AssetsUSD USD
United States (continued)APX Group Inc 6.38% 01/12/2019 8 000 8 000 8 280 0
APX Group Inc 8.75% 01/12/2020 7 000 7 115 7 153 0
Arch Coal Inc 8.00% 15/01/2019 7 000 7 051 6 930 0
A-S Co-Issuer Subsidiary Inc / A-S Merger Sub LLC 7.88% 15/12/2020
8 000 8 232 8 440 0
Ashtead Capital Inc 6.50% 15/07/2022 10 000 10 438 10 875 0
AT&T Inc 6.30% 15/01/2038 50 000 53 719 60 509 0.02
AT&T Inc 4.80% 15/06/2044 50 000 51 089 51 247 0.02
AT&T Inc 4.35% 15/06/2045 290 000 260 958 276 206 0.11
Athlon Holdings LP / Athlon Finance Corp 7.38% 15/04/2021 7 000 7 370 7 630 0
Athlon Holdings LP / Athlon Finance Corp 6.00% 01/05/2022 5 000 5 027 5 175 0
Atmos Energy Corp 5.50% 15/06/2041 20 000 20 122 23 988 0.01
Audatex North America Inc 6.00% 15/06/2021 4 000 4 064 4 270 0
Audatex North America Inc 6.13% 01/11/2023 1 000 1 000 1 070 0
AutoNation Inc 5.50% 01/02/2020 7 000 7 261 7 718 0
AutoZone Inc 3.70% 15/04/2022 50 000 50 809 51 523 0.02
Avis Budget Car Rental LLC / Avis Budget Finance Inc 9.75% 15/03/2020
7 000 7 000 7 936 0
Axalta Coating Systems US Holdings Inc / Axalta Coating Systems Dutch Holding B 7.38% 01/05/2021
10 000 10 381 10 900 0
B&G Foods Inc 4.63% 01/06/2021 6 000 5 676 5 985 0
BA Credit Card Trust 0.53% 15/06/2021 100 000 100 000 100 003 0.04
Banc of America Commercial Mortgage Trust 2006-6 5.36% 10/10/2045
500 000 511 664 530 645 0.21
Banc of America Commercial Mortgage Trust 2008-1 6.23% 10/02/2051
65 000 77 560 73 851 0.03
Bank of America Corp 4.50% 01/04/2015 150 000 151 668 154 451 0.06
Bank of America Corp 4.63% 14/09/2018 200 000 240 473 303 903 0.12
Bank of America Corp 5.50% 22/11/2021 50 000 84 950 93 419 0.04
Bank of America Corp 5.70% 24/01/2022 50 000 52 706 57 848 0.02
Bank of America Corp 4.10% 24/07/2023 160 000 160 805 166 059 0.07
Bank of America Corp 4.00% 01/04/2024 95 000 94 653 97 050 0.04
Bank of New York Mellon Corp/The 4.60% 15/01/2020 100 000 110 385 111 672 0.04
Bank One Capital III 8.75% 01/09/2030 25 000 28 544 33 980 0.01
Berkshire Hathaway Energy Co 5.75% 01/04/2018 50 000 54 374 57 240 0.02
Berkshire Hathaway Energy Co 3.75% 15/11/2023 100 000 99 930 103 164 0.04
Berkshire Hathaway Finance Corp 2.00% 15/08/2018 15 000 14 978 15 269 0.01
Berkshire Hathaway Finance Corp 3.00% 15/05/2022 50 000 51 248 50 337 0.02
Berkshire Hathaway Finance Corp 4.40% 15/05/2042 100 000 97 474 100 944 0.04
Berry Plastics Corp 5.50% 15/05/2022 2 000 2 000 2 011 0
Bristol-Myers Squibb Co 4.50% 01/03/2044 50 000 49 396 51 486 0.02
Burlington Northern Santa Fe LLC 3.45% 15/09/2021 100 000 103 934 103 989 0.04
Calpine Corp 6.00% 15/01/2022 5 000 4 963 5 394 0
Cardinal Health Inc 3.20% 15/03/2023 130 000 123 130 128 794 0.05
Carlson Travel Holdings Inc 7.50% 15/08/2019 5 000 5 125 5 100 0
CarMax Auto Owner Trust 2014-1 0.79% 15/10/2018 15 000 14 998 14 984 0.01
Case New Holland Industrial Inc 7.88% 01/12/2017 12 000 12 681 13 965 0.01
Caterpillar Inc 1.50% 26/06/2017 100 000 101 058 101 259 0.04
CBS Outdoor Americas Capital LLC / CBS Outdoor Americas Capital Corp 5.25% 15/02/2022
2 000 2 000 2 055 0
CBS Outdoor Americas Capital LLC / CBS Outdoor Americas Capital Corp 5.63% 15/02/2024
2 000 2 000 2 065 0
CCO Holdings LLC / CCO Holdings Capital Corp 6.50% 30/04/2021
2 000 2 122 2 135 0

STANLIB Funds Limited
Portfolio Statement (continued)
STANLIB Multi-Manager Global Bond Fund (continued)
As at 30 June 2014
81
Nominal holding Cost Market Value % of Net AssetsUSD USD
United States (continued)CCO Holdings LLC / CCO Holdings Capital Corp 6.63% 31/01/2022
11 000 11 768 11 853 0.01
Cedar Fair LP / Canada's Wonderland Co / Magnum Management Corp 5.38% 01/06/2024
4 000 4 000 4 050 0
Centene Corp 4.75% 15/05/2022 2 000 2 000 2 030 0
CenterPoint Energy Houston Electric LLC 4.50% 01/04/2044 45 000 44 521 47 477 0.02
Centre Point Funding LLC 2.61% 20/08/2021 240 286 243 766 241 114 0.09
CenturyLink Inc 6.75% 01/12/2023 11 000 11 000 12 081 0.01
Cequel Communications Holdings I LLC / Cequel Capital Corp 6.38% 15/09/2020
8 000 8 071 8 500 0
Chesapeake Energy Corp 6.63% 15/08/2020 34 000 35 180 39 185 0.02
Chesapeake Energy Corp 6.13% 15/02/2021 11 000 11 369 12 347 0.01
Chrysler Group LLC / CG Co-Issuer Inc 8.25% 15/06/2021 12 000 13 182 13 560 0.01
CHS/Community Health Systems Inc 5.13% 01/08/2021 3 000 3 000 3 075 0
CHS/Community Health Systems Inc 6.88% 01/02/2022 15 000 15 149 15 900 0.01
Cimarex Energy Co 4.38% 01/06/2024 2 000 2 000 2 037 0
Cisco Systems Inc 5.90% 15/02/2039 50 000 54 339 60 682 0.02
CIT Group Inc 5.00% 15/08/2022 21 000 20 823 21 840 0.01
Citigroup Inc 5.13% 12/12/2018 100 000 135 908 184 097 0.07
Citigroup Inc 5.00% 02/08/2019 105 000 155 820 169 568 0.07
Citigroup Inc 5.88% 30/01/2042 50 000 54 906 59 453 0.02
Clean Harbors Inc 5.13% 01/06/2021 4 000 4 000 4 105 0
Clear Channel Communications Inc 14.00% 01/02/2021 8 000 8 047 8 240 0
Clear Channel Communications Inc 9.00% 01/03/2021 22 000 21 538 23 540 0.01
Clear Channel Worldwide Holdings Inc 7.63% 15/03/2020 9 000 9 000 9 709 0
Clear Channel Worldwide Holdings Inc 6.50% 15/11/2022 9 000 8 925 9 652 0
CLI Funding V LLC 2.83% 18/03/2028 262 500 262 460 261 640 0.1
CME Group Inc/IL 5.30% 15/09/2043 5 000 4 991 5 708 0
CMS Energy Corp 4.70% 31/03/2043 95 000 96 473 97 268 0.04
CNH Industrial Capital LLC 3.38% 15/07/2019 4 000 3 977 3 965 0
Coca-Cola Co/The 0.75% 13/03/2015 100 000 100 219 100 408 0.04
Comcast Corp 4.65% 15/07/2042 50 000 48 677 51 993 0.02
COMM 2006-C8 Mortgage Trust 5.29% 10/12/2046 14 285 15 754 15 550 0.01
Commercial Mortgage Trust 2007-GG9 5.44% 10/03/2039 50 000 57 105 54 512 0.02
Comstock Resources Inc 9.50% 15/06/2020 16 000 16 815 18 320 0.01
ConAgra Foods Inc 3.25% 15/09/2022 210 000 214 878 205 938 0.08
Concho Resources Inc 6.50% 15/01/2022 20 000 21 315 22 000 0.01
Concho Resources Inc 5.50% 01/04/2023 8 000 8 267 8 600 0
ConocoPhillips 6.50% 01/02/2039 50 000 60 671 66 764 0.03
CONSOL Energy Inc 5.88% 15/04/2022 3 000 3 000 3 157 0
Constellation Brands Inc 3.75% 01/05/2021 4 000 4 000 3 975 0
Continental Resources Inc/OK 5.00% 15/09/2022 50 000 51 077 54 399 0.02
Credit Suisse Commercial Mortgage Trust Series 2007-C5 5.70% 15/09/2040
50 000 57 343 55 619 0.02
Crestwood Midstream Partners LP / Crestwood Midstream Finance Corp 6.13% 01/03/2022
4 000 4 000 4 210 0
Crown Castle International Corp 4.88% 15/04/2022 2 000 1 990 2 065 0
Crown Castle International Corp 5.25% 15/01/2023 13 000 13 219 13 536 0.01
CSC Holdings LLC 6.75% 15/11/2021 17 000 17 754 18 785 0.01
CSX Corp 3.70% 30/10/2020 50 000 49 616 53 103 0.02
CSX Corp 4.10% 15/03/2044 55 000 55 522 51 920 0.02
CVS Caremark Corp 4.00% 05/12/2023 75 000 74 689 78 519 0.03
CyrusOne LP / CyrusOne Finance Corp 6.38% 15/11/2022 11 000 11 106 11 866 0.01
Darling Ingredients Inc 5.38% 15/01/2022 7 000 7 082 7 262 0
Dell Inc 6.50% 15/04/2038 295 000 337 471 278 775 0.11

STANLIB Funds Limited
Portfolio Statement (continued)
STANLIB Multi-Manager Global Bond Fund (continued)
As at 30 June 2014
82
Nominal holding Cost Market Value % of Net AssetsUSD USD
United States (continued)Devon Energy Corp 3.25% 15/05/2022 25 000 25 505 25 202 0.01
Devon Energy Corp 5.60% 15/07/2041 50 000 51 906 57 873 0.02
DIRECTV Holdings LLC / DIRECTV Financing Co Inc 3.13% 15/02/2016
50 000 49 984 51 838 0.02
DIRECTV Holdings LLC / DIRECTV Financing Co Inc 3.80% 15/03/2022
35 000 33 667 36 148 0.01
DIRECTV Holdings LLC / DIRECTV Financing Co Inc 5.15% 15/03/2042
20 000 20 762 20 999 0.01
DISH DBS Corp 5.88% 15/07/2022 19 000 18 870 20 615 0.01
Dollar General Corp 3.25% 15/04/2023 100 000 99 769 94 536 0.04
Dominion Resources Inc/VA 6.00% 30/11/2017 600 000 691 022 687 014 0.27
Dominion Resources Inc/VA 4.05% 15/09/2042 50 000 43 605 46 491 0.02
Duke Energy Carolinas LLC 7.00% 15/11/2018 50 000 58 047 60 546 0.02
Duke Energy Carolinas LLC 4.25% 15/12/2041 50 000 54 494 50 898 0.02
Duke Energy Corp 3.55% 15/09/2021 10 000 10 494 10 444 0
Duke Energy Corp 3.05% 15/08/2022 70 000 66 698 69 683 0.03
DuPont Fabros Technology LP 5.88% 15/09/2021 3 000 3 000 3 142 0
EI du Pont de Nemours & Co 3.63% 15/01/2021 25 000 25 335 26 464 0.01
El Paso LLC 6.50% 15/09/2020 44 000 48 133 48 516 0.02
Energy Transfer Partners LP 5.20% 01/02/2022 50 000 52 657 55 357 0.02
Entegris Inc 6.00% 01/04/2022 6 000 6 076 6 165 0
Enterprise Products Operating LLC 5.20% 01/09/2020 50 000 51 437 57 177 0.02
Enterprise Products Operating LLC 3.35% 15/03/2023 55 000 51 698 55 067 0.02
Enterprise Products Operating LLC 5.10% 15/02/2045 35 000 35 096 37 431 0.02
Envision Healthcare Corp 5.13% 01/07/2022 3 000 3 000 3 026 0
EP Energy LLC / Everest Acquisition Finance Inc 7.75% 01/09/2022
2 000 2 000 2 250 0
EQT Corp 4.88% 15/11/2021 50 000 49 627 54 451 0.02
Equinix Inc 4.88% 01/04/2020 4 000 4 000 4 110 0
ERAC USA Finance LLC 5.63% 15/03/2042 125 000 140 554 140 887 0.06
ERP Operating LP 4.75% 15/07/2020 175 000 196 080 194 560 0.08
EXCO Resources Inc 8.50% 15/04/2022 3 000 3 000 3 240 0
Exelon Corp 4.90% 15/06/2015 50 000 51 416 51 955 0.02
Express Scripts Holding Co 4.75% 15/11/2021 50 000 56 759 55 349 0.02
Extended Stay America Trust 2013-ESH 1.83% 05/12/2031 325 000 324 999 323 764 0.13
Fannie Mae Pool 4.00% 19/07/2020 200 000 212 258 212 188 0.08
Fannie Mae Pool 2.50% 01/06/2023 320 000 322 950 324 900 0.13
Fannie Mae Pool 3.00% 01/07/2026 770 500 796 638 799 875 0.31
Fannie Mae Pool 3.50% 01/07/2026 170 000 179 164 180 094 0.07
Fannie Mae Pool 2.50% 01/05/2028 12 535 12 768 12 755 0.01
Fannie Mae Pool 2.50% 01/06/2028 23 798 24 237 24 210 0.01
Fannie Mae Pool 4.50% 13/06/2036 2 300 000 2 472 616 2 489 032 0.97
Fannie Mae Pool 5.00% 13/06/2036 290 000 319 227 321 900 0.13
Fannie Mae Pool 2.61% 01/07/2036 11 564 12 723 12 246 0.01
Fannie Mae Pool 5.50% 13/07/2036 200 000 222 359 223 750 0.09
Fannie Mae Pool 6.00% 13/07/2036 170 000 190 480 191 409 0.08
Fannie Mae Pool 4.00% 25/07/2039 1 090 000 1 146 805 1 155 400 0.45
Fannie Mae Pool 3.50% 01/07/2041 1 745 000 1 772 213 1 794 078 0.7
Fannie Mae Pool 4.00% 01/08/2041 2 017 726 2 093 670 2 145 246 0.84
Fannie Mae Pool 3.00% 01/04/2042 740 000 723 841 730 288 0.28
Fannie Mae Pool 2.51% 01/01/2043 746 286 778 513 749 025 0.29
Fannie Mae Pool 3.00% 01/04/2043 510 858 498 575 504 741 0.2
Fannie Mae-Aces 0.48% 25/09/2015 46 512 46 512 46 557 0.02
Fannie Mae-Aces 3.33% 25/10/2023 105 000 104 746 109 075 0.04

STANLIB Funds Limited
Portfolio Statement (continued)
STANLIB Multi-Manager Global Bond Fund (continued)
As at 30 June 2014
83
Nominal holding Cost Market Value % of Net AssetsUSD USD
United States (continued)Fannie Mae-Aces 3.51% 25/12/2023 70 000 70 671 73 754 0.03
Federal Home Loan Banks 0.63% 28/12/2016 305 000 304 302 304 431 0.12
Federal Home Loan Banks 4.13% 13/03/2020 250 000 274 562 279 075 0.11
Federal Home Loan Mortgage Corp 1.75% 10/09/2015 525 000 533 503 534 170 0.21
Federal Home Loan Mortgage Corp 5.25% 18/04/2016 500 000 541 939 543 469 0.21
Federal Home Loan Mortgage Corp 2.38% 13/01/2022 100 000 101 150 99 881 0.04
Federal National Mortgage Association 1.13% 27/04/2017 250 000 252 729 251 776 0.1
Federal National Mortgage Association 5.00% 11/05/2017 275 000 303 158 306 943 0.12
Federal National Mortgage Association 6.63% 15/11/2030 100 000 134 549 140 854 0.06
FHLMC Multifamily Structured Pass Through Certificates 0.53% 25/04/2020
104 797 104 796 104 567 0.04
FHLMC Multifamily Structured Pass Through Certificates 0.78% 25/07/2020
81 465 81 464 81 570 0.03
FHLMC Multifamily Structured Pass Through Certificates 1.58% 25/04/2022
47 801 48 597 47 325 0.02
FHLMC Multifamily Structured Pass Through Certificates 2.52% 25/01/2023
70 000 71 236 69 187 0.03
First Data Corp 6.75% 01/11/2020 6 000 6 024 6 510 0
First Data Corp 8.25% 15/01/2021 9 000 9 224 9 855 0
First Data Corp 12.63% 15/01/2021 13 000 12 838 16 022 0.01
First Data Corp 11.75% 15/08/2021 4 000 4 279 4 730 0
Five Corners Funding Trust 4.42% 15/11/2023 85 000 89 641 89 638 0.04
Florida East Coast Holdings Corp 6.75% 01/05/2019 7 000 7 017 7 385 0
Florida East Coast Holdings Corp 9.75% 01/05/2020 7 000 7 129 7 140 0
Ford Motor Credit Co LLC 2.38% 16/01/2018 200 000 198 566 204 279 0.08
Ford Motor Credit Co LLC 8.13% 15/01/2020 100 000 120 571 127 542 0.05
Freddie Mac Gold Pool 4.00% 01/07/2024 130 000 137 698 137 800 0.05
Freddie Mac Gold Pool 5.50% 01/03/2027 130 000 144 178 145 113 0.06
Freddie Mac Gold Pool 3.00% 15/03/2027 170 000 175 479 176 109 0.07
Freddie Mac Gold Pool 3.50% 15/07/2029 100 000 105 230 105 656 0.04
Freddie Mac Gold Pool 5.00% 14/07/2035 200 000 219 539 221 313 0.09
Freddie Mac Gold Pool 6.00% 14/07/2035 100 000 111 992 112 375 0.04
Freddie Mac Gold Pool 4.50% 01/07/2040 300 000 322 488 324 469 0.13
Freddie Mac Gold Pool 3.50% 01/07/2041 390 000 397 252 400 481 0.16
Freddie Mac Gold Pool 4.00% 01/07/2041 400 000 419 875 423 250 0.17
Freddie Mac Gold Pool 3.50% 01/04/2042 520 876 536 536 537 173 0.21
Freddie Mac Gold Pool 4.00% 01/09/2043 579 368 610 383 616 357 0.24
Freddie Mac Gold Pool 4.00% 01/11/2043 92 197 97 105 98 083 0.04
Freddie Mac Gold Pool 2.50% MBS 15yr 220 000 221 839 223 231 0.09
Freddie Mac Gold Pool 3.00% MBS 30yr 390 000 381 195 384 272 0.15
Freeport-McMoRan Inc 3.88% 15/03/2023 50 000 45 344 49 848 0.02
Fresenius Medical Care US Finance II Inc 5.88% 31/01/2022 8 000 8 181 8 820 0
Frontier Communications Corp 7.13% 15/01/2023 15 000 14 897 15 937 0.01
Gardner Denver Inc 6.88% 15/08/2021 17 000 17 097 17 850 0.01
Gates Global LLC / Gates Global Co 6.00% 15/07/2022 3 000 3 000 3 000 0
General Electric Capital Corp 2.00% 22/02/2017 20 000 000 229 962 206 340 0.08
General Electric Capital Corp 3.45% 15/05/2024 230 000 229 049 230 123 0.09
General Electric Capital Corp 5.88% 14/01/2038 150 000 160 681 181 202 0.07
General Electric Co 4.13% 09/10/2042 50 000 52 029 49 291 0.02
General Motors Co 4.88% 02/10/2023 12 000 12 158 12 600 0.01
Genworth Holdings Inc 4.90% 15/08/2023 20 000 19 943 21 437 0.01
Gibraltar Industries Inc 6.25% 01/02/2021 4 000 4 000 4 160 0
Ginnie Mae I pool 5.50% 21/07/2035 90 000 100 125 100 547 0.04
Ginnie Mae I pool 4.50% 15/07/2039 420 000 455 306 457 144 0.18

STANLIB Funds Limited
Portfolio Statement (continued)
STANLIB Multi-Manager Global Bond Fund (continued)
As at 30 June 2014
84
Nominal holding Cost Market Value % of Net AssetsUSD USD
United States (continued)Ginnie Mae I pool 5.00% 15/07/2039 240 000 263 250 263 625 0.1
Ginnie Mae I pool 6.00% 15/07/2039 60 000 67 322 67 425 0.03
Ginnie Mae I pool 3.50% 01/07/2041 615 000 634 027 638 831 0.25
Ginnie Mae I pool 4.00% 01/07/2041 470 000 498 494 501 431 0.2
Ginnie Mae I pool 3.00% MBS 30yr 490 000 487 818 493 522 0.19
GlaxoSmithKline Capital Inc 6.38% 15/05/2038 50 000 52 926 64 841 0.03
Glencore Funding LLC 4.13% 30/05/2023 20 000 19 990 20 121 0.01
GLP Capital LP / GLP Financing II Inc 5.38% 01/11/2023 5 000 5 182 5 162 0
Goldman Sachs Group Inc/The 6.38% 02/05/2018 63 000 97 305 102 878 0.04
Goldman Sachs Group Inc/The 1.32% 15/11/2018 465 000 465 000 471 351 0.18
Goldman Sachs Group Inc/The 5.25% 27/07/2021 175 000 177 374 196 429 0.08
Goldman Sachs Group Inc/The 6.13% 15/02/2033 50 000 51 205 59 808 0.02
Goldman Sachs Group Inc/The 6.75% 01/10/2037 50 000 60 591 59 687 0.02
Government National Mortgage Association 1.70% 16/04/2046
972 659 964 365 920 076 0.36
Group 1 Automotive Inc 5.00% 01/06/2022 2 000 2 000 2 000 0
GTP Towers Issuer LLC 4.44% 15/02/2015 100 000 100 000 101 625 0.04
H&E Equipment Services Inc 7.00% 01/09/2022 4 000 4 290 4 420 0
Halcon Resources Corp 9.75% 15/07/2020 4 000 4 287 4 380 0
Halcon Resources Corp 8.88% 15/05/2021 5 000 5 295 5 375 0
HCA Inc 3.75% 15/03/2019 3 000 3 000 3 034 0
HCA Inc 5.88% 01/05/2023 34 000 33 577 35 785 0.01
HD Supply Inc 11.50% 15/07/2020 10 000 10 995 12 025 0.01
Hertz Corp/The 7.50% 15/10/2018 5 000 5 332 5 244 0
Hertz Corp/The 7.38% 15/01/2021 6 000 6 408 6 533 0
Hewlett-Packard Co 4.65% 09/12/2021 50 000 50 869 54 405 0.02
Hiland Partners LP / Hiland Partners Finance Corp 7.25% 01/10/2020
12 000 12 714 13 065 0.01
Hiland Partners LP / Hiland Partners Finance Corp 5.50% 15/05/2022
5 000 5 039 5 062 0
Hilcorp Energy I LP / Hilcorp Finance Co 5.00% 01/12/2024 3 000 3 000 2 996 0
Hillman Group Inc/The 6.38% 15/07/2022 2 000 2 000 1 990 0
Hilton USA Trust 2013-HLT 2.66% 05/11/2030 110 000 110 000 111 400 0.04
Home Depot Inc/The 3.75% 15/02/2024 100 000 101 332 104 324 0.04
Hospitality Properties Trust 4.50% 15/06/2023 20 000 19 980 20 469 0.01
HSBC USA Inc 5.00% 27/09/2020 150 000 149 999 165 960 0.07
Icahn Enterprises LP / Icahn Enterprises Finance Corp 5.88% 01/02/2022
7 000 7 000 7 332 0
Illinois Tool Works Inc 3.38% 15/09/2021 50 000 50 000 52 216 0.02
IMS Health Inc 6.00% 01/11/2020 8 000 8 249 8 460 0
Indiana Michigan Power Co 3.20% 15/03/2023 360 000 363 673 358 008 0.14
Intercontinental Exchange Inc 4.00% 15/10/2023 25 000 24 820 26 300 0.01
Interface Inc 7.63% 01/12/2018 5 000 5 310 5 275 0
International Business Machines Corp 5.70% 14/09/2017 100 000 114 496 113 870 0.04
International Lease Finance Corp 3.88% 15/04/2018 1 000 1 000 1 022 0
International Lease Finance Corp 4.63% 15/04/2021 18 000 17 125 18 540 0.01
International Lease Finance Corp 8.63% 15/01/2022 15 000 15 872 18 825 0.01
Iron Mountain Inc 6.00% 15/08/2023 3 000 3 196 3 247 0
iStar Financial Inc 5.00% 01/07/2019 6 000 6 032 6 007 0
Jaguar Holding Co II / Jaguar Merger Sub Inc 9.50% 01/12/2019 5 000 5 481 5 469 0
Jefferies Group LLC 6.50% 20/01/2043 50 000 51 682 55 220 0.02
JM Huber Corp 9.88% 01/11/2019 15 000 14 923 17 081 0.01
John Deere Capital Corp 1.70% 15/01/2020 100 000 100 516 97 142 0.04
Johnson Controls Inc 4.25% 01/03/2021 50 000 49 710 53 956 0.02
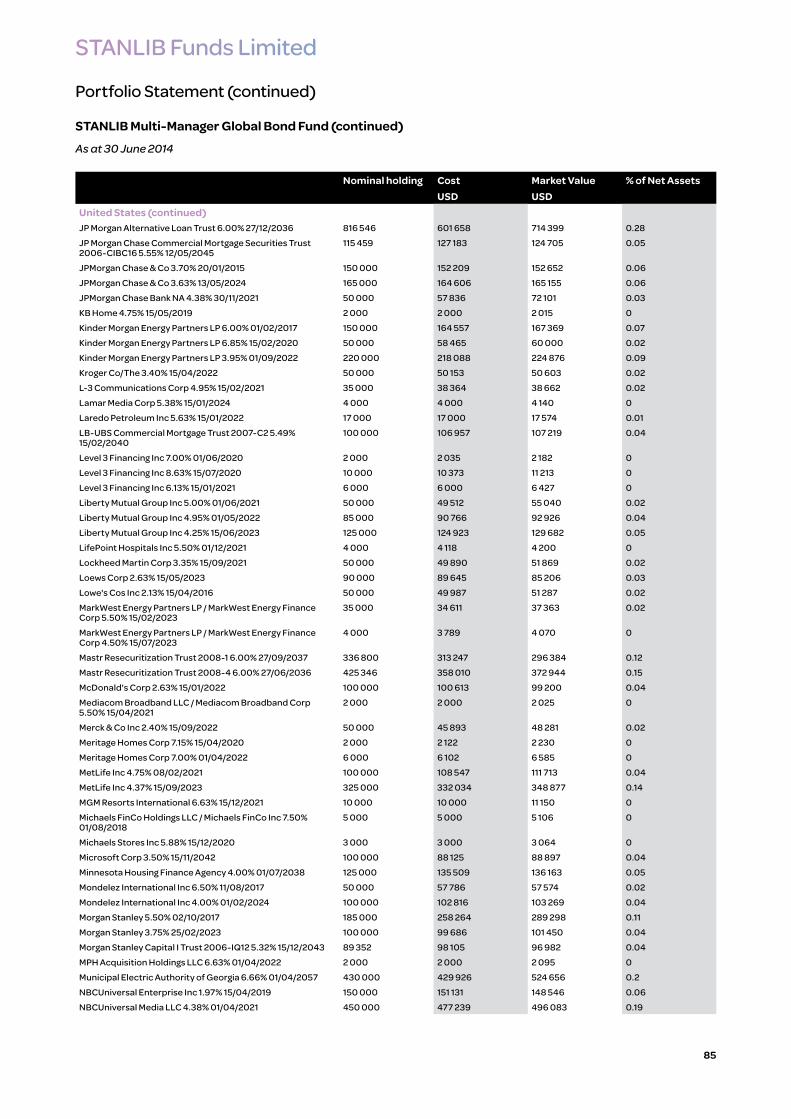
STANLIB Funds Limited
Portfolio Statement (continued)
STANLIB Multi-Manager Global Bond Fund (continued)
As at 30 June 2014
85
Nominal holding Cost Market Value % of Net AssetsUSD USD
United States (continued)JP Morgan Alternative Loan Trust 6.00% 27/12/2036 816 546 601 658 714 399 0.28
JP Morgan Chase Commercial Mortgage Securities Trust 2006-CIBC16 5.55% 12/05/2045
115 459 127 183 124 705 0.05
JPMorgan Chase & Co 3.70% 20/01/2015 150 000 152 209 152 652 0.06
JPMorgan Chase & Co 3.63% 13/05/2024 165 000 164 606 165 155 0.06
JPMorgan Chase Bank NA 4.38% 30/11/2021 50 000 57 836 72 101 0.03
KB Home 4.75% 15/05/2019 2 000 2 000 2 015 0
Kinder Morgan Energy Partners LP 6.00% 01/02/2017 150 000 164 557 167 369 0.07
Kinder Morgan Energy Partners LP 6.85% 15/02/2020 50 000 58 465 60 000 0.02
Kinder Morgan Energy Partners LP 3.95% 01/09/2022 220 000 218 088 224 876 0.09
Kroger Co/The 3.40% 15/04/2022 50 000 50 153 50 603 0.02
L-3 Communications Corp 4.95% 15/02/2021 35 000 38 364 38 662 0.02
Lamar Media Corp 5.38% 15/01/2024 4 000 4 000 4 140 0
Laredo Petroleum Inc 5.63% 15/01/2022 17 000 17 000 17 574 0.01
LB-UBS Commercial Mortgage Trust 2007-C2 5.49% 15/02/2040
100 000 106 957 107 219 0.04
Level 3 Financing Inc 7.00% 01/06/2020 2 000 2 035 2 182 0
Level 3 Financing Inc 8.63% 15/07/2020 10 000 10 373 11 213 0
Level 3 Financing Inc 6.13% 15/01/2021 6 000 6 000 6 427 0
Liberty Mutual Group Inc 5.00% 01/06/2021 50 000 49 512 55 040 0.02
Liberty Mutual Group Inc 4.95% 01/05/2022 85 000 90 766 92 926 0.04
Liberty Mutual Group Inc 4.25% 15/06/2023 125 000 124 923 129 682 0.05
LifePoint Hospitals Inc 5.50% 01/12/2021 4 000 4 118 4 200 0
Lockheed Martin Corp 3.35% 15/09/2021 50 000 49 890 51 869 0.02
Loews Corp 2.63% 15/05/2023 90 000 89 645 85 206 0.03
Lowe's Cos Inc 2.13% 15/04/2016 50 000 49 987 51 287 0.02
MarkWest Energy Partners LP / MarkWest Energy Finance Corp 5.50% 15/02/2023
35 000 34 611 37 363 0.02
MarkWest Energy Partners LP / MarkWest Energy Finance Corp 4.50% 15/07/2023
4 000 3 789 4 070 0
Mastr Resecuritization Trust 2008-1 6.00% 27/09/2037 336 800 313 247 296 384 0.12
Mastr Resecuritization Trust 2008-4 6.00% 27/06/2036 425 346 358 010 372 944 0.15
McDonald's Corp 2.63% 15/01/2022 100 000 100 613 99 200 0.04
Mediacom Broadband LLC / Mediacom Broadband Corp 5.50% 15/04/2021
2 000 2 000 2 025 0
Merck & Co Inc 2.40% 15/09/2022 50 000 45 893 48 281 0.02
Meritage Homes Corp 7.15% 15/04/2020 2 000 2 122 2 230 0
Meritage Homes Corp 7.00% 01/04/2022 6 000 6 102 6 585 0
MetLife Inc 4.75% 08/02/2021 100 000 108 547 111 713 0.04
MetLife Inc 4.37% 15/09/2023 325 000 332 034 348 877 0.14
MGM Resorts International 6.63% 15/12/2021 10 000 10 000 11 150 0
Michaels FinCo Holdings LLC / Michaels FinCo Inc 7.50% 01/08/2018
5 000 5 000 5 106 0
Michaels Stores Inc 5.88% 15/12/2020 3 000 3 000 3 064 0
Microsoft Corp 3.50% 15/11/2042 100 000 88 125 88 897 0.04
Minnesota Housing Finance Agency 4.00% 01/07/2038 125 000 135 509 136 163 0.05
Mondelez International Inc 6.50% 11/08/2017 50 000 57 786 57 574 0.02
Mondelez International Inc 4.00% 01/02/2024 100 000 102 816 103 269 0.04
Morgan Stanley 5.50% 02/10/2017 185 000 258 264 289 298 0.11
Morgan Stanley 3.75% 25/02/2023 100 000 99 686 101 450 0.04
Morgan Stanley Capital I Trust 2006-IQ12 5.32% 15/12/2043 89 352 98 105 96 982 0.04
MPH Acquisition Holdings LLC 6.63% 01/04/2022 2 000 2 000 2 095 0
Municipal Electric Authority of Georgia 6.66% 01/04/2057 430 000 429 926 524 656 0.2
NBCUniversal Enterprise Inc 1.97% 15/04/2019 150 000 151 131 148 546 0.06
NBCUniversal Media LLC 4.38% 01/04/2021 450 000 477 239 496 083 0.19

STANLIB Funds Limited
Portfolio Statement (continued)
STANLIB Multi-Manager Global Bond Fund (continued)
As at 30 June 2014
86
Nominal holding Cost Market Value % of Net AssetsUSD USD
United States (continued)NBCUniversal Media LLC 4.45% 15/01/2043 75 000 67 408 75 350 0.03
NCR Corp 6.38% 15/12/2023 7 000 7 122 7 595 0
Nebraska Investment Finance Authority 4.50% 01/09/2043 50 000 53 037 52 743 0.02
Newmont Mining Corp 3.50% 15/03/2022 50 000 43 638 48 184 0.02
Nielsen Finance LLC / Nielsen Finance Co 4.50% 01/10/2020 16 000 15 937 16 120 0.01
Nielsen Finance LLC / Nielsen Finance Co 5.00% 15/04/2022 4 000 4 015 4 035 0
NiSource Finance Corp 5.25% 15/09/2017 215 000 218 952 239 596 0.09
NiSource Finance Corp 5.45% 15/09/2020 80 000 92 174 91 554 0.04
Norfolk Southern Corp 4.84% 01/10/2041 55 000 55 000 58 419 0.02
Nortek Inc 8.50% 15/04/2021 9 000 9 807 9 968 0
North Dakota Housing Finance Agency 3.75% 01/07/2042 25 000 27 094 26 611 0.01
Northwest Pipeline LLC 7.00% 15/06/2016 65 000 62 811 72 498 0.03
Northwest Pipeline LLC 5.95% 15/04/2017 100 000 110 958 111 388 0.04
Novartis Capital Corp 3.40% 06/05/2024 100 000 100 025 101 286 0.04
NRG Energy Inc 6.25% 15/07/2022 11 000 11 029 11 632 0
Nuance Communications Inc 5.38% 15/08/2020 11 000 11 226 11 385 0
Nuveen Investments Inc 9.50% 15/10/2020 7 000 7 107 8 277 0
Oasis Petroleum Inc 6.88% 15/03/2022 2 000 2 000 2 190 0
Oasis Petroleum Inc 6.88% 15/01/2023 35 000 35 858 38 325 0.02
OBP Depositor LLC Trust 2010-OBP 4.65% 15/07/2045 1 000 000 1 085 208 1 109 531 0.43
Omnicom Group Inc 3.63% 01/05/2022 50 000 50 275 51 448 0.02
Oracle Corp 5.38% 15/07/2040 50 000 55 645 56 578 0.02
Overseas Private Investment Corp 3.49% 20/12/2029 10 000 10 000 10 238 0
Pacific Gas & Electric Co 3.85% 15/11/2023 90 000 92 146 93 934 0.04
Pacific Gas & Electric Co 5.40% 15/01/2040 50 000 51 851 57 446 0.02
Parsley Energy LLC / Parsley Finance Corp 7.50% 15/02/2022 11 000 11 265 11 742 0.01
Penn National Gaming Inc 5.88% 01/11/2021 5 000 5 000 4 737 0
PepsiCo Inc 2.75% 05/03/2022 50 000 49 929 49 534 0.02
PepsiCo Inc 2.75% 01/03/2023 200 000 185 055 195 262 0.08
Pfizer Inc 5.75% 03/06/2021 50 000 72 750 87 634 0.03
Pfizer Inc 3.40% 15/05/2024 100 000 100 683 101 482 0.04
Philip Morris International Inc 3.60% 15/11/2023 100 000 98 674 103 268 0.04
Physio-Control International Inc 9.88% 15/01/2019 5 000 5 395 5 525 0
Pinnacle Entertainment Inc 6.38% 01/08/2021 13 000 13 047 13 715 0.01
Pinnacle Foods Finance LLC / Pinnacle Foods Finance Corp 4.88% 01/05/2021
14 000 13 214 14 315 0.01
Plastipak Holdings Inc 6.50% 01/10/2021 7 000 7 122 7 385 0
Post Holdings Inc 6.00% 15/12/2022 4 000 4 000 4 080 0
PPL Capital Funding Inc 3.40% 01/06/2023 285 000 284 737 286 014 0.11
PQ Corp 8.75% 01/05/2018 19 000 20 071 20 639 0.01
Procter & Gamble Co/The 3.50% 15/02/2015 100 000 102 288 102 014 0.04
Progress Energy Inc 3.15% 01/04/2022 95 000 97 894 95 301 0.04
Provident Funding Associates LP / PFG Finance Corp 6.75% 15/06/2021
15 000 15 105 15 187 0.01
Prudential Financial Inc 6.63% 21/06/2040 50 000 52 512 65 244 0.03
QEP Resources Inc 5.38% 01/10/2022 16 000 16 688 16 520 0.01
Quiksilver Inc / QS Wholesale Inc 10.00% 01/08/2020 4 000 4 128 4 020 0
Regency Energy Partners LP / Regency Energy Finance Corp 5.50% 15/04/2023
23 000 23 920 24 150 0.01
Reynolds Group Issuer Inc / Reynolds Group Issuer LLC / Reynolds Group Issuer Lu 7.88% 15/08/2019
22 000 22 225 23 925 0.01
Reynolds Group Issuer Inc / Reynolds Group Issuer LLC / Reynolds Group Issuer Lu 9.88% 15/08/2019
17 000 16 487 18 828 0.01
Reynolds Group Issuer Inc / Reynolds Group Issuer LLC / Reynolds Group Issuer Lu 8.25% 15/02/2021
5 000 5 078 5 437 0

STANLIB Funds Limited
Portfolio Statement (continued)
STANLIB Multi-Manager Global Bond Fund (continued)
As at 30 June 2014
87
Nominal holding Cost Market Value % of Net AssetsUSD USD
United States (continued)Rice Energy Inc 6.25% 01/05/2022 6 000 6 027 6 180 0
Rite Aid Corp 7.70% 15/02/2027 4 000 3 611 4 505 0
RKI Exploration & Production LLC / RKI Finance Corp 8.50% 01/08/2021
2 000 2 114 2 167 0
Roche Holdings Inc 7.00% 01/03/2039 50 000 63 772 71 079 0.03
Rose Rock Midstream LP / Rose Rock Finance Corp 5.63% 15/07/2022
2 000 2 000 2 025 0
RREF 2013 LT2 LLC 2.83% 22/05/2028 259 099 259 096 259 266 0.1
Sabine Pass Liquefaction LLC 6.25% 15/03/2022 2 000 2 000 2 175 0
Sabine Pass Liquefaction LLC 5.75% 15/05/2024 7 000 7 087 7 315 0
San Diego Gas & Electric Co 3.00% 15/08/2021 50 000 49 792 51 215 0.02
SandRidge Energy Inc 8.13% 15/10/2022 3 000 3 266 3 300 0
SandRidge Energy Inc 7.50% 15/02/2023 1 000 1 064 1 085 0
SBA Telecommunications Inc 5.75% 15/07/2020 12 000 12 398 12 750 0.01
Sempra Energy 4.05% 01/12/2023 60 000 62 867 63 349 0.03
Serta Simmons Holdings LLC 8.13% 01/10/2020 7 000 7 069 7 578 0
Signode Industrial Group Lux SA/Signode Industrial Group US Inc 6.38% 01/05/2022
7 000 7 048 7 087 0
Simon Property Group LP 2.20% 01/02/2019 50 000 50 031 50 592 0.02
SM Energy Co 5.00% 15/01/2024 2 000 2 000 2 000 0
Southern California Edison Co 5.95% 01/02/2038 50 000 55 293 62 917 0.02
Southern Copper Corp 6.75% 16/04/2040 50 000 54 568 54 365 0.02
Southern Natural Gas Co LLC 5.90% 01/04/2017 966 000 1 008 435 1 084 573 0.42
Southern Star Central Corp 6.75% 01/03/2016 7 000 7 064 7 000 0
Spectrum Brands Inc 6.38% 15/11/2020 7 000 7 153 7 542 0
Springleaf Finance Corp 6.00% 01/06/2020 3 000 3 040 3 097 0
Springleaf Finance Corp 7.75% 01/10/2021 6 000 6 135 6 750 0
Springleaf Finance Corp 8.25% 01/10/2023 4 000 4 000 4 550 0
Springs Industries Inc 6.25% 01/06/2021 7 000 6 971 7 140 0
Sprint Communications Inc 9.00% 15/11/2018 18 000 19 565 21 825 0.01
Sprint Communications Inc 11.50% 15/11/2021 14 000 14 000 18 970 0.01
Sprint Corp 7.25% 15/09/2021 2 000 2 000 2 200 0
Sprint Corp 7.13% 15/06/2024 4 000 4 224 4 240 0
State of California 7.60% 01/11/2040 80 000 114 982 120 951 0.05
STHI Holding Corp 8.00% 15/03/2018 7 000 7 301 7 429 0
Synovus Financial Corp 7.88% 15/02/2019 11 000 11 979 12 595 0.01
TAL Advantage V LLC 2.83% 22/02/2038 216 667 216 637 215 883 0.08
Target Corp 2.30% 26/06/2019 100 000 100 870 100 846 0.04
Taylor Morrison Communities Inc / Monarch Communities Inc 5.25% 15/04/2021
10 000 9 619 10 125 0
Tenet Healthcare Corp 6.00% 01/10/2020 5 000 5 000 5 450 0
Tenet Healthcare Corp 8.13% 01/04/2022 12 000 12 788 13 935 0.01
Tennessee Valley Authority 3.88% 15/02/2021 150 000 158 638 164 991 0.06
Tennessee Valley Authority 5.25% 15/09/2039 25 000 27 388 30 067 0.01
Tennessee Valley Authority 3.50% 15/12/2042 37 000 35 985 33 756 0.01
Thermo Fisher Scientific Inc 3.60% 15/08/2021 50 000 49 923 51 866 0.02
Thermo Fisher Scientific Inc 4.15% 01/02/2024 25 000 25 078 26 119 0.01
Time Warner Cable Inc 7.30% 01/07/2038 50 000 58 095 67 163 0.03
Time Warner Cable Inc 4.50% 15/09/2042 50 000 48 052 48 818 0.02
Time Warner Inc 4.05% 15/12/2023 50 000 49 858 51 897 0.02
Time Warner Inc 6.25% 29/03/2041 120 000 147 882 143 969 0.05
T-Mobile USA Inc 6.54% 28/04/2020 4 000 4 000 4 320 0
T-Mobile USA Inc 6.13% 15/01/2022 3 000 3 000 3 184 0
T-Mobile USA Inc 6.73% 28/04/2022 3 000 3 158 3 240 0

STANLIB Funds Limited
Portfolio Statement (continued)
STANLIB Multi-Manager Global Bond Fund (continued)
As at 30 June 2014
88
Nominal holding Cost Market Value % of Net AssetsUSD USD
United States (continued)T-Mobile USA Inc 6.63% 01/04/2023 9 000 9 086 9 765 0
T-Mobile USA Inc 6.84% 28/04/2023 2 000 1 963 2 177 0
T-Mobile USA Inc 6.50% 15/01/2024 3 000 3 000 3 206 0
Toyota Motor Credit Corp 2.00% 15/09/2016 100 000 102 177 102 610 0.04
TransDigm Inc 5.50% 15/10/2020 1 000 1 012 1 018 0
TransDigm Inc 7.50% 15/07/2021 5 000 5 315 5 538 0
TransDigm Inc 6.00% 15/07/2022 2 000 2 000 2 055 0
TransDigm Inc 6.50% 15/07/2024 5 000 5 000 5 206 0
Travelers Cos Inc/The 5.35% 01/11/2040 50 000 48 021 58 564 0.02
Union Pacific Corp 2.75% 15/04/2023 125 000 124 342 122 285 0.05
United Parcel Service Inc 1.13% 01/10/2017 100 000 100 757 99 922 0.04
United Rentals North America Inc 7.63% 15/04/2022 19 000 20 694 21 375 0.01
United Rentals North America Inc 6.13% 15/06/2023 2 000 2 102 2 145 0
United Rentals North America Inc 5.75% 15/11/2024 2 000 2 000 2 080 0
United States Treasury Bill 0% 25/09/2014 1 400 000 1 399 925 1 399 916 0.55
United States Treasury Floating Rate Note 0.07% 31/01/2016 2 010 000 2 009 419 2 009 477 0.78
United States Treasury Inflation Indexed Bonds 0.13% 15/04/2018
461 457 468 028 476 454 0.19
United States Treasury Inflation Indexed Bonds 0.38% 15/07/2023
305 580 297 907 311 214 0.12
United States Treasury Inflation Indexed Bonds 2.38% 15/01/2025
44 015 50 847 53 265 0.02
United States Treasury Inflation Indexed Bonds 0.63% 15/02/2043
701 100 574 233 634 277 0.25
United States Treasury Note/Bond 4.13% 15/05/2015 1 250 000 1 297 274 1 293 555 0.5
United States Treasury Note/Bond 0.38% 31/08/2015 930 000 929 936 932 325 0.36
United States Treasury Note/Bond 0.25% 15/10/2015 1 500 000 1 497 482 1 501 407 0.59
United States Treasury Note/Bond 0.38% 31/03/2016 475 000 474 787 475 074 0.19
United States Treasury Note/Bond 1.00% 30/09/2016 805 000 810 620 812 799 0.32
United States Treasury Note/Bond 2.75% 30/11/2016 950 000 1 000 715 998 391 0.39
United States Treasury Note/Bond 0.88% 28/02/2017 1 400 000 1 408 956 1 405 032 0.55
United States Treasury Note/Bond 1.00% 31/03/2017 1 070 000 1 073 896 1 076 186 0.42
United States Treasury Note/Bond 4.50% 15/05/2017 1 940 000 2 120 144 2 142 185 0.84
United States Treasury Note/Bond 1.38% 28/02/2019 1 500 000 1 522 111 1 488 750 0.58
United States Treasury Note/Bond 3.63% 15/02/2020 360 000 394 960 395 888 0.15
United States Treasury Note/Bond 1.75% 15/05/2023 460 000 420 650 435 419 0.17
United States Treasury Note/Bond 2.50% 15/08/2023 50 000 49 275 50 266 0.02
United States Treasury Note/Bond 6.00% 15/02/2026 200 000 266 130 267 125 0.1
United States Treasury Note/Bond 6.13% 15/11/2027 150 000 200 868 205 828 0.08
United States Treasury Note/Bond 5.38% 15/02/2031 330 000 395 102 432 764 0.17
United States Treasury Note/Bond 4.38% 15/02/2038 100 000 101 209 119 172 0.05
United States Treasury Note/Bond 4.50% 15/05/2038 180 100 193 974 218 596 0.09
United States Treasury Note/Bond 3.75% 15/08/2041 885 000 1 002 038 959 257 0.37
United States Treasury Note/Bond 2.75% 15/08/2042 1 250 000 1 145 008 1 115 430 0.44
United States Treasury Note/Bond 2.88% 15/05/2043 3 530 000 2 993 236 3 218 919 1.25
United States Treasury Note/Bond 3.63% 15/08/2043 90 000 86 641 94 866 0.04
United States Treasury Note/Bond 3.63% 15/02/2044 702 000 713 407 739 294 0.29
United States Treasury Note/Bond 3.38% 15/05/2044 300 000 301 630 301 406 0.12
United Technologies Corp 3.10% 01/06/2022 100 000 106 039 101 239 0.04
UnitedHealth Group Inc 2.88% 15/03/2023 15 000 14 947 14 684 0.01
UnitedHealth Group Inc 6.63% 15/11/2037 50 000 55 094 65 775 0.03
Univision Communications Inc 6.75% 15/09/2022 14 000 14 607 15 505 0.01
Univision Communications Inc 5.13% 15/05/2023 11 000 11 000 11 646 0
US Bancorp/MN 3.15% 04/03/2015 100 000 101 017 101 890 0.04
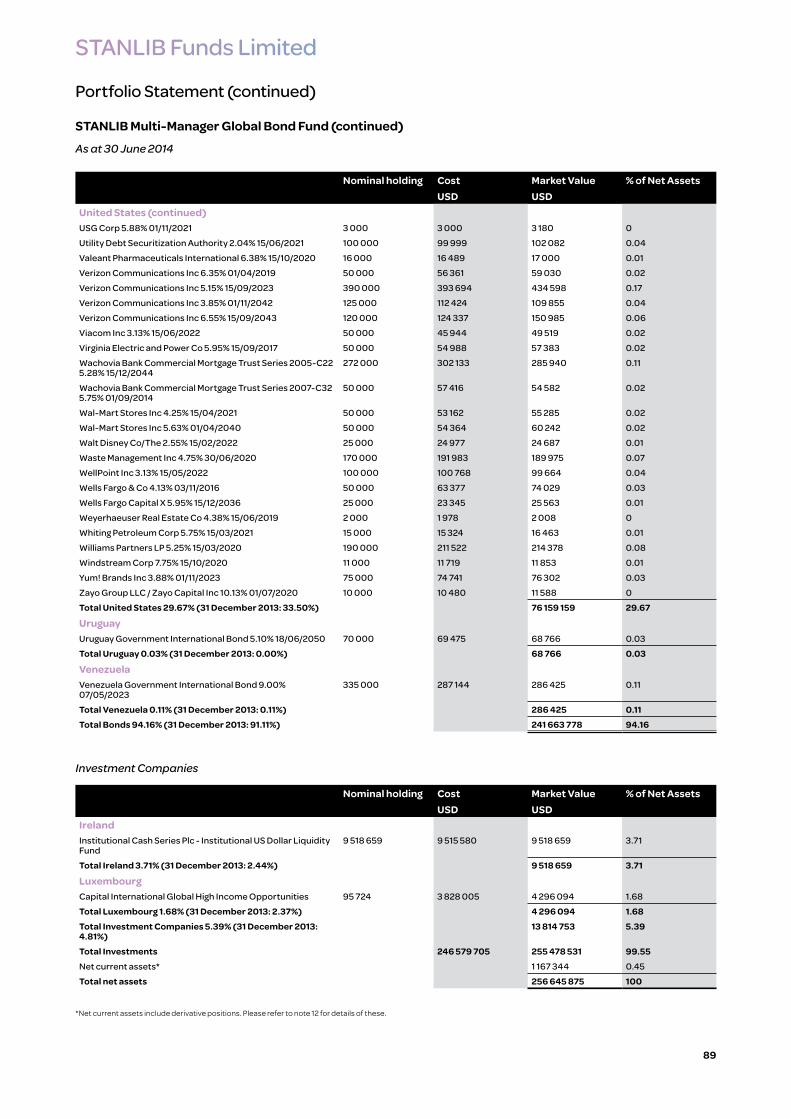
STANLIB Funds Limited
Portfolio Statement (continued)
STANLIB Multi-Manager Global Bond Fund (continued)
As at 30 June 2014
89
Nominal holding Cost Market Value % of Net AssetsUSD USD
United States (continued)USG Corp 5.88% 01/11/2021 3 000 3 000 3 180 0
Utility Debt Securitization Authority 2.04% 15/06/2021 100 000 99 999 102 082 0.04
Valeant Pharmaceuticals International 6.38% 15/10/2020 16 000 16 489 17 000 0.01
Verizon Communications Inc 6.35% 01/04/2019 50 000 56 361 59 030 0.02
Verizon Communications Inc 5.15% 15/09/2023 390 000 393 694 434 598 0.17
Verizon Communications Inc 3.85% 01/11/2042 125 000 112 424 109 855 0.04
Verizon Communications Inc 6.55% 15/09/2043 120 000 124 337 150 985 0.06
Viacom Inc 3.13% 15/06/2022 50 000 45 944 49 519 0.02
Virginia Electric and Power Co 5.95% 15/09/2017 50 000 54 988 57 383 0.02
Wachovia Bank Commercial Mortgage Trust Series 2005-C22 5.28% 15/12/2044
272 000 302 133 285 940 0.11
Wachovia Bank Commercial Mortgage Trust Series 2007-C32 5.75% 01/09/2014
50 000 57 416 54 582 0.02
Wal-Mart Stores Inc 4.25% 15/04/2021 50 000 53 162 55 285 0.02
Wal-Mart Stores Inc 5.63% 01/04/2040 50 000 54 364 60 242 0.02
Walt Disney Co/The 2.55% 15/02/2022 25 000 24 977 24 687 0.01
Waste Management Inc 4.75% 30/06/2020 170 000 191 983 189 975 0.07
WellPoint Inc 3.13% 15/05/2022 100 000 100 768 99 664 0.04
Wells Fargo & Co 4.13% 03/11/2016 50 000 63 377 74 029 0.03
Wells Fargo Capital X 5.95% 15/12/2036 25 000 23 345 25 563 0.01
Weyerhaeuser Real Estate Co 4.38% 15/06/2019 2 000 1 978 2 008 0
Whiting Petroleum Corp 5.75% 15/03/2021 15 000 15 324 16 463 0.01
Williams Partners LP 5.25% 15/03/2020 190 000 211 522 214 378 0.08
Windstream Corp 7.75% 15/10/2020 11 000 11 719 11 853 0.01
Yum! Brands Inc 3.88% 01/11/2023 75 000 74 741 76 302 0.03
Zayo Group LLC / Zayo Capital Inc 10.13% 01/07/2020 10 000 10 480 11 588 0
Total United States 29.67% (31 December 2013: 33.50%) 76 159 159 29.67
UruguayUruguay Government International Bond 5.10% 18/06/2050 70 000 69 475 68 766 0.03
Total Uruguay 0.03% (31 December 2013: 0.00%) 68 766 0.03
VenezuelaVenezuela Government International Bond 9.00% 07/05/2023
335 000 287 144 286 425 0.11
Total Venezuela 0.11% (31 December 2013: 0.11%) 286 425 0.11Total Bonds 94.16% (31 December 2013: 91.11%) 241 663 778 94.16
Investment Companies
Nominal holding Cost Market Value % of Net AssetsUSD USD
IrelandInstitutional Cash Series Plc - Institutional US Dollar Liquidity Fund
9 518 659 9 515 580 9 518 659 3.71
Total Ireland 3.71% (31 December 2013: 2.44%) 9 518 659 3.71
LuxembourgCapital International Global High Income Opportunities 95 724 3 828 005 4 296 094 1.68
Total Luxembourg 1.68% (31 December 2013: 2.37%) 4 296 094 1.68Total Investment Companies 5.39% (31 December 2013: 4.81%)
13 814 753 5.39
Total Investments 246 579 705 255 478 531 99.55Net current assets* 1 167 344 0.45
Total net assets 256 645 875 100
*Net current assets include derivative positions. Please refer to note 12 for details of these.

STANLIB Funds Limited
90
Portfolio Statement (continued)
STANLIB Multi-Manager Global Equity Fund
As at 30 June 2014
Transferable securities listed on an exchange or dealt in on another regulated market
Common Stock
Nominal holding Cost Market Value % of Net AssetsUSD USD
AustraliaAGL Energy Ltd 7 726 109 292 112 811 0.01
ALS Ltd/Queensland 23 856 183 921 199 274 0.01
Alumina Ltd 408 888 426 757 519 083 0.02
Amcor Ltd/Australia 85 636 755 098 841 425 0.04
AMP Ltd 23 728 102 678 118 699 0.01
Ansell Ltd 7 114 118 800 132 949 0.01
APA Group 8 851 48 150 57 560 0
ARB Corp Ltd 4 193 47 708 48 441 0
Arrium Ltd 71 183 88 608 53 074 0
Asciano Ltd 9 433 50 838 50 037 0
ASX Ltd 1 793 60 654 60 213 0
Aurizon Holdings Ltd 21 646 95 000 101 541 0.01
Australia & New Zealand Banking Group Ltd 43 810 1 242 609 1 378 214 0.06
Bank of Queensland Ltd 5 551 54 233 63 815 0
Bendigo and Adelaide Bank Ltd 8 016 76 231 92 305 0.01
BHP Billiton Ltd 52 718 1 719 356 1 785 828 0.08
BlueScope Steel Ltd 75 665 320 422 386 368 0.02
Boral Ltd 12 600 56 053 62 199 0
Bradken Ltd 5 249 29 330 18 827 0
Brambles Ltd 392 329 3 072 638 3 403 101 0.15
Breville Group Ltd 5 821 47 158 44 558 0
Caltex Australia Ltd 2 809 50 444 57 109 0
Cardno Ltd 8 099 48 071 48 312 0
carsales.com Ltd 4 599 49 011 45 926 0
CFS Retail Property Trust Group 26 959 49 833 51 910 0
Challenger Ltd/Australia 27 347 100 473 192 039 0.01
Coca-Cola Amatil Ltd 58 640 657 524 523 039 0.02
Cochlear Ltd 115 335 6 081 477 6 713 408 0.3
Commonwealth Bank of Australia 18 803 1 288 841 1 435 410 0.07
Computershare Ltd 5 129 48 552 60 417 0
Credit Corp Group Ltd 5 050 48 062 41 230 0
Crown Resorts Ltd 3 300 48 685 47 095 0
CSL Ltd 77 574 4 769 031 4 871 259 0.22
Dexus Property Group 62 300 66 613 65 272 0
DuluxGroup Ltd 25 832 116 668 137 757 0.01
Fairfax Media Ltd 510 263 314 266 435 867 0.02
Flight Centre Travel Group Ltd 2 739 122 749 114 862 0.01
Fortescue Metals Group Ltd 25 452 109 751 104 501 0.01
Goodman Fielder Ltd 259 328 170 923 166 437 0.01
Goodman Group 15 800 77 399 75 311 0
GPT Group 21 571 71 034 78 182 0
GrainCorp Ltd 6 689 62 132 52 970 0
GUD Holdings Ltd 8 402 48 016 49 247 0
Iluka Resources Ltd 41 373 394 287 317 480 0.02
Incitec Pivot Ltd 30 203 75 224 82 672 0
Insurance Australia Group Ltd 23 836 127 100 131 386 0.01
Invocare Ltd 4 788 49 200 45 644 0
IOOF Holdings Ltd 5 863 49 182 46 263 0
Iress Ltd 5 566 47 722 42 869 0
JB Hi-Fi Ltd 3 479 55 754 59 862 0
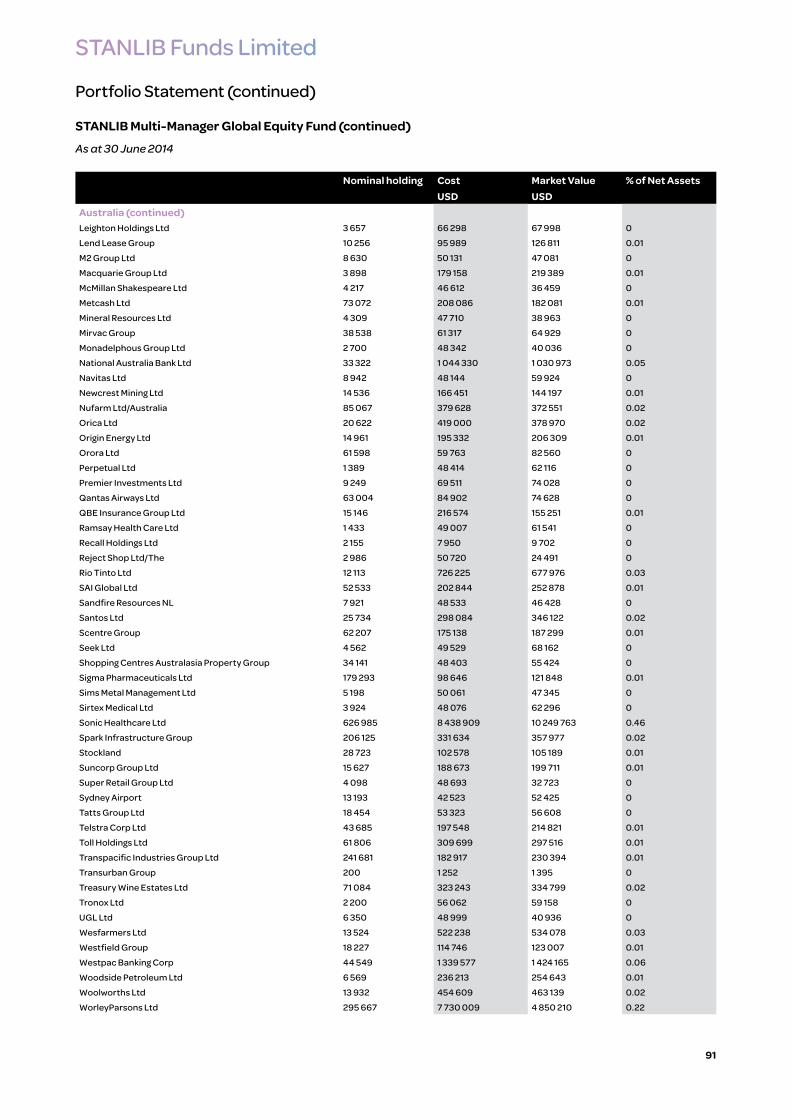
STANLIB Funds Limited
Portfolio Statement (continued)
STANLIB Multi-Manager Global Equity Fund (continued)
As at 30 June 2014
91
Nominal holding Cost Market Value % of Net AssetsUSD USD
Australia (continued)Leighton Holdings Ltd 3 657 66 298 67 998 0
Lend Lease Group 10 256 95 989 126 811 0.01
M2 Group Ltd 8 630 50 131 47 081 0
Macquarie Group Ltd 3 898 179 158 219 389 0.01
McMillan Shakespeare Ltd 4 217 46 612 36 459 0
Metcash Ltd 73 072 208 086 182 081 0.01
Mineral Resources Ltd 4 309 47 710 38 963 0
Mirvac Group 38 538 61 317 64 929 0
Monadelphous Group Ltd 2 700 48 342 40 036 0
National Australia Bank Ltd 33 322 1 044 330 1 030 973 0.05
Navitas Ltd 8 942 48 144 59 924 0
Newcrest Mining Ltd 14 536 166 451 144 197 0.01
Nufarm Ltd/Australia 85 067 379 628 372 551 0.02
Orica Ltd 20 622 419 000 378 970 0.02
Origin Energy Ltd 14 961 195 332 206 309 0.01
Orora Ltd 61 598 59 763 82 560 0
Perpetual Ltd 1 389 48 414 62 116 0
Premier Investments Ltd 9 249 69 511 74 028 0
Qantas Airways Ltd 63 004 84 902 74 628 0
QBE Insurance Group Ltd 15 146 216 574 155 251 0.01
Ramsay Health Care Ltd 1 433 49 007 61 541 0
Recall Holdings Ltd 2 155 7 950 9 702 0
Reject Shop Ltd/The 2 986 50 720 24 491 0
Rio Tinto Ltd 12 113 726 225 677 976 0.03
SAI Global Ltd 52 533 202 844 252 878 0.01
Sandfire Resources NL 7 921 48 533 46 428 0
Santos Ltd 25 734 298 084 346 122 0.02
Scentre Group 62 207 175 138 187 299 0.01
Seek Ltd 4 562 49 529 68 162 0
Shopping Centres Australasia Property Group 34 141 48 403 55 424 0
Sigma Pharmaceuticals Ltd 179 293 98 646 121 848 0.01
Sims Metal Management Ltd 5 198 50 061 47 345 0
Sirtex Medical Ltd 3 924 48 076 62 296 0
Sonic Healthcare Ltd 626 985 8 438 909 10 249 763 0.46
Spark Infrastructure Group 206 125 331 634 357 977 0.02
Stockland 28 723 102 578 105 189 0.01
Suncorp Group Ltd 15 627 188 673 199 711 0.01
Super Retail Group Ltd 4 098 48 693 32 723 0
Sydney Airport 13 193 42 523 52 425 0
Tatts Group Ltd 18 454 53 323 56 608 0
Telstra Corp Ltd 43 685 197 548 214 821 0.01
Toll Holdings Ltd 61 806 309 699 297 516 0.01
Transpacific Industries Group Ltd 241 681 182 917 230 394 0.01
Transurban Group 200 1 252 1 395 0
Treasury Wine Estates Ltd 71 084 323 243 334 799 0.02
Tronox Ltd 2 200 56 062 59 158 0
UGL Ltd 6 350 48 999 40 936 0
Wesfarmers Ltd 13 524 522 238 534 078 0.03
Westfield Group 18 227 114 746 123 007 0.01
Westpac Banking Corp 44 549 1 339 577 1 424 165 0.06
Woodside Petroleum Ltd 6 569 236 213 254 643 0.01
Woolworths Ltd 13 932 454 609 463 139 0.02
WorleyParsons Ltd 295 667 7 730 009 4 850 210 0.22

STANLIB Funds Limited
Portfolio Statement (continued)
STANLIB Multi-Manager Global Equity Fund (continued)
As at 30 June 2014
92
Nominal holding Cost Market Value % of Net AssetsUSD USD
Australia (continued)Wotif.com Holdings Ltd 18 316 42 933 41 836 0
Total Australia 2.27% (31 December 2013: 1.98%) 50 975 317 2.27
AustriaAndritz AG 4 870 217 637 280 644 0.01
Erste Group Bank AG 6 611 211 236 213 115 0.01
Flughafen Wien AG 659 43 881 61 354 0
IMMOFINANZ AG 19 500 68 945 68 535 0
Mayr Melnhof Karton AG 765 84 782 90 735 0
Oesterreichische Post AG 4 565 173 247 225 879 0.01
OMV AG 6 473 303 911 290 998 0.01
Raiffeisen Bank International AG 4 809 155 910 152 622 0.01
Schoeller-Bleckmann Oilfield Equipment AG 500 63 072 64 117 0
Vienna Insurance Group AG Wiener Versicherung Gruppe 1 841 96 763 98 038 0.01
Voestalpine AG 2 831 135 108 134 169 0.01
Wienerberger AG 16 574 230 374 278 092 0.01
Zumtobel AG 6 300 90 378 146 247 0.01
Total Austria 0.09% (31 December 2013: 0.09%) 2 104 545 0.09
BelgiumAckermans & van Haaren NV 518 48 854 65 177 0
Ageas 4 311 172 506 171 965 0.01
Anheuser-Busch InBev NV 15 634 1 308 253 1 795 676 0.08
Barco NV 1 000 75 113 79 588 0
Belgacom SA 3 815 95 476 126 560 0.01
Cofinimmo 568 63 524 70 768 0
Colruyt SA 1 648 97 107 83 710 0
Delhaize Group SA 3 623 225 403 245 093 0.01
Gimv NV 3 202 161 298 160 235 0.01
Groupe Bruxelles Lambert SA 1 276 106 703 132 564 0.01
KBC Groep NV 65 381 3 263 298 3 557 354 0.16
Kinepolis Npv 300 57 107 56 970 0
Solvay SA 974 148 468 167 560 0.01
UCB SA 843 50 454 71 363 0
Umicore SA 2 237 109 343 103 905 0.01
Total Belgium 0.31% (31 December 2013: 0.38%) 6 888 488 0.31
BermudaArch Capital Group Ltd 2 300 121 762 132 112 0.01
Axis Capital Holdings Ltd 2 300 99 245 101 844 0.01
Brilliance China Automotive Holdings Ltd 22 000 32 288 41 160 0
Bunge Ltd 4 900 380 907 370 636 0.02
Cafe de Coral Holdings Ltd 16 000 50 097 53 882 0
Cheung Kong Infrastructure Holdings Ltd 100 000 684 657 687 070 0.03
China Gas Holdings Ltd 32 000 32 334 65 731 0
China Resources Gas Group Ltd 52 700 153 380 164 893 0.01
China Singyes Solar Technologies Holdings Ltd 33 000 32 726 55 777 0
Chow Sang Sang Holdings International Ltd 18 000 48 808 44 917 0
COSCO Pacific Ltd 28 000 40 769 38 657 0
Digital China Holdings Ltd 28 000 33 816 25 253 0
Endurance Specialty Holdings Ltd 8 285 446 507 427 257 0.02
Enstar Group Ltd 400 55 725 60 036 0
Esprit Holdings Ltd 650 813 895 349 922 007 0.04
Everest Re Group Ltd 800 110 468 128 416 0.01
First Pacific Co Ltd/Hong Kong 440 500 355 256 492 215 0.02
Freescale Semiconductor Ltd 22 100 272 392 519 129 0.02

STANLIB Funds Limited
Portfolio Statement (continued)
STANLIB Multi-Manager Global Equity Fund (continued)
As at 30 June 2014
93
Nominal holding Cost Market Value % of Net AssetsUSD USD
Bermuda (continued)Genting Hong Kong Ltd 299 000 118 867 116 610 0.01
GOME Electrical Appliances Holding Ltd 322 000 39 168 52 357 0
Great Eagle Holdings Ltd 13 000 47 285 47 133 0
GuocoLeisure Ltd 259 000 149 992 234 758 0.01
Haier Electronics Group Co Ltd 19 000 34 839 49 520 0
Helen of Troy Ltd 1 400 58 937 84 868 0.01
Hopson Development Holdings Ltd 26 000 35 106 25 160 0
Invesco Ltd 3 600 111 726 135 936 0.01
Jardine Matheson Holdings Ltd 19 809 718 977 1 174 674 0.05
Johnson Electric Holdings Ltd 69 000 47 352 61 610 0
Kerry Logistics Network Ltd 40 500 59 838 63 962 0
Kerry Properties Ltd 17 000 61 539 59 442 0
Kunlun Energy Co Ltd 95 700 154 492 157 312 0.01
Li & Fung Ltd 7 723 057 11 421 325 11 400 004 0.51
Marvell Technology Group Ltd 6 200 77 779 88 784 0.01
Nabors Industries Ltd 7 000 114 345 205 520 0.01
Nine Dragons Paper Holdings Ltd 41 000 33 769 27 720 0
Noble Group Ltd 291 000 220 648 319 780 0.02
North Mining Shares Co Ltd 730 000 32 818 40 953 0
Orient Overseas International Ltd 8 000 49 009 39 121 0
PartnerRe Ltd 1 500 133 072 163 995 0.01
Platinum Underwriters Holdings Ltd 1 000 59 630 64 830 0
RenaissanceRe Holdings Ltd 9 024 812 261 965 568 0.04
Road King Infrastructure Ltd 153 900 143 060 139 202 0.01
Seadrill Ltd 40 837 1 493 179 1 619 158 0.07
Signet Jewelers Ltd 1 000 94 228 110 590 0.01
Sinopec Kantons Holdings Ltd 76 000 68 689 61 484 0
SmarTone Telecommunications Holdings Ltd 71 212 82 808 89 677 0.01
Stolt-Nielsen Ltd 2 211 57 420 53 867 0
Texwinca Holdings Ltd 39 563 46 492 39 001 0
VTech Holdings Ltd 4 000 45 267 53 107 0
Yue Yuen Industrial Holdings Ltd 17 000 47 973 57 577 0
Total Bermuda 0.99% (31 December 2013: 1.00%) 22 134 272 0.99
BrazilAbril Educacao SA 3 400 48 142 53 712 0
AMBEV SA 20 500 154 149 145 558 0.01
Arezzo Industria e Comercio SA 2 900 47 789 41 524 0
B2W Cia Digital 37 500 117 512 476 212 0.02
Banco Bradesco SA 11 900 171 854 174 064 0.01
Banco Bradesco SA ADR 738 700 10 561 632 10 725 924 0.48
Banco do Brasil SA 35 100 377 189 394 935 0.02
Banco Santander Brasil SA/Brazil 21 600 117 834 148 174 0.01
BB Seguridade Participacoes SA 9 900 93 122 144 809 0.01
BM&FBovespa SA 22 300 124 299 117 160 0.01
Brasil Pharma S.A. - Rct Brl Npv 35 696 60 139 59 759 0
Brasil Pharma SA 85 800 223 525 143 638 0.01
BRF SA 5 800 136 864 140 519 0.01
Centrais Eletricas Brasileiras SA 19 400 52 091 56 155 0
Cia de Saneamento Basico do Estado de Sao Paulo 5 200 48 912 55 560 0
Cia de Saneamento de Minas Gerais-COPASA 489 010 7 838 618 8 741 396 0.39
Cia Hering 3 300 50 808 33 298 0
Cia Siderurgica Nacional SA 35 000 150 498 148 631 0.01
Cielo SA 3 800 48 567 78 427 0

STANLIB Funds Limited
Portfolio Statement (continued)
STANLIB Multi-Manager Global Equity Fund (continued)
As at 30 June 2014
94
Nominal holding Cost Market Value % of Net AssetsUSD USD
Brazil (continued)Cosan SA Industria e Comercio 2 500 47 828 45 483 0
Cremer SA 25 000 178 750 187 490 0.01
EDP - Energias do Brasil SA 162 300 896 860 798 938 0.04
Embraer SA 6 200 51 705 56 568 0
Fibria Celulose SA 3 800 48 397 36 895 0
Grupo BTG Pactual 18 000 267 623 280 930 0.01
Iguatemi Empresa de Shopping Centers SA 8 900 108 663 89 844 0
Iochpe-Maxion SA 3 700 47 992 32 986 0
JBS SA 16 000 53 337 55 024 0
Kroton Educacional SA 3 400 48 586 95 578 0
Localiza Rent a Car SA 3 300 48 300 54 558 0
LPS Brasil Consultoria de Imoveis SA 35 900 168 491 162 878 0.01
M Dias Branco SA 2 900 109 983 127 454 0.01
Mahle-Metal Leve SA Industria e Comercio 4 100 48 561 42 356 0
Mills Estruturas e Servicos de Engenharia SA 3 600 49 132 42 352 0
MRV Engenharia e Participacoes SA 118 000 366 027 396 173 0.02
Multiplan Empreendimentos Imobiliarios SA 2 200 49 371 51 204 0
Multiplus SA 5 000 105 507 82 709 0
Natura Cosmeticos SA 2 300 49 320 38 870 0
Petroleo Brasileiro SA ADR 420 700 7 354 799 6 575 541 0.29
Petroleo Brasileiro SA NPV 105 600 763 139 773 752 0.04
Porto Seguro SA 4 100 49 019 58 707 0
Sao Carlos Empreendimentos e Participacoes SA 8 100 120 098 124 030 0.01
Sao Martinho SA 3 900 49 460 68 317 0
Souza Cruz SA 4 000 48 234 41 305 0
Tegma Gestao Logistica 10 800 165 074 102 948 0.01
Tim Participacoes SA 12 200 53 430 71 015 0
Totvs SA 32 900 492 048 567 212 0.03
Tractebel Energia SA 3 000 48 756 44 902 0
Ultrapar Participacoes SA 5 000 122 630 118 756 0.01
Vale SA (Pref) ADR 600 700 9 928 556 7 136 316 0.32
Vale SA ADR 158 200 2 147 812 2 092 986 0.09
Vale SA NPV 43 200 679 149 572 314 0.03
Valid Solucoes e Servicos de Seguranca em Meios de Pagamento e Identificacao S.A
3 700 49 238 64 125 0
WEG SA 5 070 48 253 64 246 0
Total Brazil 1.92% (31 December 2013: 1.56%) 43 034 217 1.92
CanadaAdvantage Oil & Gas Ltd 15 200 49 141 101 176 0.01
AG Growth International Inc 800 28 641 35 308 0
Agnico Eagle Mines Ltd 2 400 63 546 91 976 0.01
Agrium Inc 2 200 194 606 201 834 0.01
Aimia Inc 1 800 28 301 31 517 0
Alaris Royalty Corp 800 27 891 21 706 0
Alimentation Couche Tard Inc 4 500 92 646 123 109 0.01
Allied Properties Real Estate Investment Trust 900 27 136 29 869 0
AltaGas Ltd 800 28 465 36 855 0
ARC Resources Ltd 2 200 56 002 66 796 0
Atco Ltd/Canada 900 39 666 43 481 0
Athabasca Oil Corp 5 800 41 861 41 711 0
AutoCanada Inc 800 28 886 59 154 0
Badger Daylighting Ltd 1 500 30 464 49 303 0
Bank of Montreal 11 800 763 996 868 533 0.04

STANLIB Funds Limited
Portfolio Statement (continued)
STANLIB Multi-Manager Global Equity Fund (continued)
As at 30 June 2014
95
Nominal holding Cost Market Value % of Net AssetsUSD USD
Canada (continued)Bank of Nova Scotia 18 000 1 038 206 1 199 830 0.05
Barrick Gold Corp 31 900 579 335 584 000 0.03
Baytex Energy Corp 1 000 39 847 46 237 0
BCE Inc 3 100 130 926 140 775 0.01
Bell Aliant Inc 1 200 30 011 31 320 0
Black Diamond Group Ltd 1 200 28 835 38 642 0
BlackBerry Ltd 17 000 176 886 174 126 0.01
Boardwalk Real Estate Investment Trust 500 27 571 30 489 0
Bombardier Inc 35 200 158 308 124 256 0.01
Bonterra Energy Corp 500 26 279 29 343 0
Brookfield Asset Management Inc 27 874 1 054 029 1 226 542 0.06
Brookfield Canada Office Properties 1 200 29 336 30 261 0
CAE Inc 2 700 30 045 35 361 0
Calfrac Well Services Ltd 1 800 29 500 32 784 0
Calloway Real Estate Investment Trust 1 200 28 557 29 911 0
Cameco Corp 12 000 287 617 235 009 0.01
Canadian Apartment Properties REIT 1 500 30 038 32 178 0
Canadian Imperial Bank of Commerce/Canada 6 400 505 222 582 827 0.03
Canadian National Railway Co 122 400 4 780 106 7 965 780 0.36
Canadian Natural Resources Ltd 90 956 2 994 047 4 186 796 0.19
Canadian Oil Sands Ltd 7 000 135 674 158 841 0.01
Canadian Pacific Railway Ltd 900 113 471 163 253 0.01
Canadian Tire Corp Ltd 1 300 115 064 124 489 0.01
Canadian Utilities Ltd 900 30 911 33 781 0
Canadian Western Bank 1 000 29 801 37 394 0
Canfor Corp 16 500 342 382 359 850 0.02
Capital Power Corp 1 400 29 617 34 239 0
Catamaran Corp 2 500 131 487 110 336 0.01
Celestica Inc 3 600 40 541 45 289 0
Cenovus Energy Inc 84 400 2 687 135 2 733 691 0.12
Centerra Gold Inc 102 500 957 965 641 855 0.03
CGI Group Inc 2 100 69 810 74 544 0
CI Financial Corp 900 28 537 29 573 0
Cineplex Inc 700 26 416 27 175 0
Cogeco Cable Inc 600 28 468 33 285 0
Constellation Software Inc/Canada 1 400 165 117 347 006 0.02
Corus Entertainment Inc 1 200 29 556 27 996 0
Crescent Point Energy Corp 2 900 106 694 128 480 0.01
DH Corp 1 100 28 518 32 014 0
DirectCash Payments Inc 1 500 28 734 20 814 0
Dollarama Inc 400 31 707 32 904 0
Dominion Diamond Corp 10 800 156 040 154 119 0.01
Dorel Industries Inc 800 28 664 29 066 0
Dream Office Real Estate Investment Trust 1 000 28 770 27 480 0
Dundee Corp 1 600 28 580 25 311 0
Eldorado Gold Corp 12 300 85 964 93 882 0.01
Empire Co Ltd 1 100 78 354 74 717 0
Enbridge Inc 35 600 1 491 924 1 687 835 0.08
Enbridge Income Fund Holdings Inc 1 300 29 649 33 710 0
Encana Corp 10 100 179 067 239 426 0.01
Enerplus Corp 2 500 42 978 62 878 0
Fairfax Financial Holdings Ltd 200 93 921 94 918 0.01
Finning International Inc 2 400 52 195 66 695 0

STANLIB Funds Limited
Portfolio Statement (continued)
STANLIB Multi-Manager Global Equity Fund (continued)
As at 30 June 2014
96
Nominal holding Cost Market Value % of Net AssetsUSD USD
Canada (continued)First Quantum Minerals Ltd 132 652 2 417 238 2 833 248 0.13
FirstService Corp/Canada 800 30 273 40 520 0
Fortis Inc/Canada 2 500 72 907 76 045 0
Franco-Nevada Corp 800 34 986 45 710 0
Freehold Royalties Ltd 1 300 29 456 32 672 0
Genworth MI Canada Inc 1 200 34 084 42 721 0
George Weston Ltd 1 000 79 433 73 783 0
Gibson Energy Inc 1 300 29 871 41 326 0
Gildan Activewear Inc 800 37 716 46 942 0
Gluskin Sheff + Associates Inc 1 400 27 241 41 560 0
Goldcorp Inc 10 200 265 515 284 889 0.01
Granite Real Estate Investment Trust 800 28 062 29 667 0
Great-West Lifeco Inc 3 500 104 623 98 643 0.01
H&R Real Estate Investment Trust 1 700 34 801 36 964 0
Home Capital Group Inc 1 300 50 520 58 266 0
Hudson's Bay Co 1 700 28 736 26 414 0
Husky Energy Inc 5 100 144 475 164 565 0.01
IAMGOLD Corp 12 100 63 515 49 870 0
IGM Financial Inc 900 43 101 43 135 0
Imperial Oil Ltd 4 300 184 429 226 435 0.01
Industrial Alliance Insurance & Financial Services Inc 1 800 76 743 78 851 0
Intact Financial Corp 1 700 100 809 117 339 0.01
Jean Coutu Group PJC Inc/The 13 000 229 373 276 318 0.01
Keyera Corp 1 700 98 430 125 367 0.01
Kinross Gold Corp 15 200 77 869 62 933 0
Labrador Iron Ore Royalty Corp 3 400 100 418 97 676 0.01
Laurentian Bank of Canada 700 30 222 32 695 0
Lightstream Resources Ltd 6 500 46 308 49 429 0
Linamar Corp 900 28 510 53 147 0
Loblaw Cos Ltd 3 988 174 444 178 030 0.01
Lundin Mining Corp 8 300 38 547 45 585 0
MacDonald Dettwiler & Associates Ltd 400 31 965 32 221 0
Magna International Inc 3 500 283 164 377 223 0.02
Mainstreet Equity Corp 1 000 28 959 36 483 0
Manitoba Telecom Services Inc 900 28 943 26 008 0
Manulife Financial Corp 21 500 372 454 427 113 0.02
MEG Energy Corp 1 100 38 032 39 791 0
Metro Inc 1 700 108 408 105 098 0.01
Mullen Group Ltd 1 200 29 406 34 080 0
National Bank of Canada 5 800 239 155 246 342 0.01
New Gold Inc 5 900 36 179 37 223 0
Norbord Inc 1 000 29 048 24 550 0
North West Co Inc/The 1 300 29 325 28 828 0
Northern Property Real Estate Investment Trust 1 100 29 622 29 546 0
Onex Corp 1 800 92 539 111 533 0.01
Open Text Corp 800 29 225 38 244 0
Pacific Rubiales Energy Corp 4 000 76 966 81 303 0
Pan American Silver Corp 3 200 35 492 48 519 0
Paramount Resources Ltd 900 29 602 50 190 0
Parkland Fuel Corp 1 700 29 080 32 814 0
Pason Systems Inc 5 300 109 890 148 180 0.01
Pembina Pipeline Corp 1 700 53 569 72 970 0
Pengrowth Energy Corp 11 600 68 072 83 203 0

STANLIB Funds Limited
Portfolio Statement (continued)
STANLIB Multi-Manager Global Equity Fund (continued)
As at 30 June 2014
97
Nominal holding Cost Market Value % of Net AssetsUSD USD
Canada (continued)Penn West Petroleum Ltd 13 500 157 754 131 940 0.01
Peyto Exploration & Development Corp 1 000 30 002 37 553 0
Potash Corp of Saskatchewan Inc 203 600 7 793 402 7 737 614 0.35
Power Corp of Canada 7 500 215 151 208 561 0.01
Power Financial Corp 3 400 108 601 105 720 0.01
Precision Drilling Corp 2 800 29 702 39 562 0
Progressive Waste Solutions Ltd 1 100 27 910 28 245 0
Quebecor Inc 12 700 255 507 307 618 0.01
RioCan Real Estate Investment Trust 1 500 35 970 38 389 0
Ritchie Bros Auctioneers Inc 1 500 30 247 36 488 0
Rogers Communications Inc 46 931 1 407 828 1 891 071 0.09
RONA Inc 2 900 31 225 31 201 0
Royal Bank of Canada 18 800 1 200 077 1 344 051 0.06
Russel Metals Inc 1 100 29 286 35 112 0
Saputo Inc 900 41 444 53 925 0
Shaw Communications Inc 4 100 96 618 104 737 0.01
ShawCor Ltd 700 28 580 38 846 0
Sherritt International Corp 8 900 33 682 36 013 0
Silver Wheaton Corp 3 200 77 020 83 999 0
SNC-Lavalin Group Inc 1 800 72 473 94 330 0.01
Stantec Inc 600 30 066 37 048 0
Sun Life Financial Inc 9 000 294 971 330 967 0.02
Suncor Energy Inc 209 909 7 077 884 8 956 817 0.4
Tahoe Resources Inc 1 000 17 748 25 977 0
Talisman Energy Inc 19 700 216 917 208 255 0.01
Teck Resources Ltd 14 500 385 889 330 662 0.02
TELUS Corp 1 700 63 218 63 474 0
Thomson Reuters Corp 3 600 124 964 131 035 0.01
Tim Hortons Inc 1 000 56 818 54 781 0
TMX Group Ltd 1 100 49 969 60 311 0
Toromont Industries Ltd 1 300 28 744 31 855 0
Toronto-Dominion Bank/The 27 300 1 198 966 1 407 864 0.06
Tourmaline Oil Corp 700 28 462 36 934 0
TransAlta Corp 3 200 41 519 39 296 0
TransCanada Corp 5 800 255 613 277 162 0.01
TransForce Inc 1 400 28 425 32 255 0
Trican Well Service Ltd 14 100 202 045 219 214 0.01
Trilogy Energy Corp 1 100 29 067 29 887 0
Valeant Pharmaceuticals International Inc 900 89 657 113 435 0.01
Vermilion Energy Inc 600 33 142 41 673 0
Wajax Corp 800 28 921 26 257 0
West Fraser Timber Co Ltd 800 34 388 38 748 0
Westport Innovations Inc 1 000 28 564 17 885 0
WSP Global Inc 1 100 27 862 38 469 0
Yamana Gold Inc 11 300 115 889 93 146 0.01
Total Canada 2.62% (31 December 2013: 2.33%) 58 896 230 2.62
Cayman IslandsAgile Property Holdings Ltd 32 000 36 126 22 419 0
Ajisen China Holdings Ltd 129 000 109 273 99 201 0.01
ANTA Sports Products Ltd 27 000 33 142 42 711 0
ASM Pacific Technology Ltd 4 700 47 500 51 334 0
Baidu Inc 6 286 604 244 1 174 288 0.05
Belle International Holdings Ltd 145 100 173 791 160 452 0.01

STANLIB Funds Limited
Portfolio Statement (continued)
STANLIB Multi-Manager Global Equity Fund (continued)
As at 30 June 2014
98
Nominal holding Cost Market Value % of Net AssetsUSD USD
Cayman Islands (continued)China Medical System Holdings Ltd 141 700 153 657 173 327 0.01
China Mengniu Dairy Co Ltd 124 000 474 032 571 169 0.03
China Metal Recycling Holdings Ltd 13 800 16 783 16 790 0
China Resources Land Ltd 82 700 166 958 150 878 0.01
China Shineway Pharmaceutical Group Ltd 23 000 33 207 40 301 0
China State Construction International Holdings Ltd 22 000 35 210 38 434 0
China Tian Lun Gas Holdings Ltd 39 000 34 601 45 942 0
China Yongda Automobiles Services Holdings Ltd 85 600 81 447 75 876 0
CIMC Enric Holdings Ltd 30 000 36 260 39 558 0
Country Garden Holdings Co Ltd 66 000 42 772 26 057 0
Daphne International Holdings Ltd 114 000 43 957 44 711 0
ENN Energy Holdings Ltd 20 900 130 115 148 856 0.01
Eurasia Drilling Co Ltd 4 800 126 564 151 200 0.01
Evergrande Real Estate Group Ltd 185 000 81 417 71 854 0
GCL-Poly Energy Holdings Ltd 146 000 40 756 48 603 0
Golden Eagle Retail Group Ltd 22 000 33 732 26 286 0
Goodbaby International Holdings Ltd 324 000 125 659 158 436 0.01
Greenland Hong Kong Holdings Ltd 43 200 35 990 18 671 0
Haitian International Holdings Ltd 81 000 184 489 187 912 0.01
Hengan International Group Co Ltd 14 500 156 498 152 102 0.01
Herbalife Ltd 800 56 484 51 632 0
Intime Retail Group Co Ltd 164 500 153 231 142 835 0.01
Kingboard Chemical Holdings Ltd 79 300 171 827 162 478 0.01
Kingsoft Corp Ltd 53 500 154 352 160 837 0.01
Li Ning Co Ltd 637 000 410 295 507 116 0.02
Longfor Properties Co Ltd 19 500 33 875 23 878 0
MGM China Holdings Ltd 16 000 49 903 55 430 0
Mindray Medical International Ltd 9 510 315 868 299 280 0.01
Minth Group Ltd 79 300 153 022 152 867 0.01
NetDragon Websoft Inc 79 800 154 665 147 239 0.01
Pacific Textiles Holdings Ltd 68 000 80 728 85 367 0
Phoenix Satellite Television Holdings Ltd 640 000 229 420 237 824 0.01
Real Gold Mining Ltd 9 000 10 226 10 230 0
Sands China Ltd 8 800 53 985 66 536 0
Shenzhou International Group Holdings Ltd 106 500 274 925 361 397 0.02
Shimao Property Holdings Ltd 91 600 181 484 168 297 0.01
Shui On Land Ltd 1 604 000 604 914 384 960 0.02
SOHO China Ltd 40 000 33 561 31 328 0
Stella International Holdings Ltd 18 500 47 934 49 769 0
Sunac China Holdings Ltd 220 000 151 768 124 608 0.01
Sunny Optical Technology Group Co Ltd 57 000 66 884 80 017 0
Tencent Holdings Ltd 19 000 218 776 290 012 0.01
Tingyi Cayman Islands Holding Corp 55 600 153 068 155 313 0.01
Towngas China Co Ltd 74 000 67 649 86 602 0
Uni-President China Holdings Ltd 34 000 34 094 25 796 0
Vinda International Holdings Ltd 24 000 33 495 35 858 0
Want Want China Holdings Ltd 112 800 159 024 161 552 0.01
Wynn Macau Ltd 78 800 240 989 308 573 0.01
Yingde Gases Group Co Ltd 594 200 643 572 643 221 0.03
Yip's Chemical Holdings Ltd 38 000 33 215 24 711 0
Zhongsheng Group Holdings Ltd 114 200 154 314 147 352 0.01
Total Cayman Islands 0.40% (31 December 2013: 0.36%) 8 920 283 0.4

STANLIB Funds Limited
Portfolio Statement (continued)
STANLIB Multi-Manager Global Equity Fund (continued)
As at 30 June 2014
99
Nominal holding Cost Market Value % of Net AssetsUSD USD
ChileCia Cervecerias Unidas SA 24 617 553 539 576 776 0.02
Latam Airlines Group SA 26 481 362 165 355 076 0.02
Chile (continued)Sociedad Quimica y Minera de Chile SA 7 089 183 486 207 708 0.01
Total Chile 0.05% (31 December 2013: 0.03%) 1 139 560 0.05
ChinaAgricultural Bank of China Ltd 771 900 360 408 339 636 0.02
Aluminum Corp of China Ltd 102 000 38 609 36 322 0
Anhui Conch Cement Co Ltd 39 900 151 773 136 941 0.01
Bank of China Ltd 3 188 500 1 450 781 1 427 491 0.06
Bank of Communications Co Ltd 397 500 290 601 274 394 0.01
Beijing Jingneng Clean Energy Co Ltd 406 000 192 608 181 238 0.01
Byd Co Ltd 25 800 136 507 147 968 0.01
China CITIC Bank Corp Ltd 350 800 195 065 212 725 0.01
China Coal Energy Co Ltd 126 000 85 085 65 356 0
China Communications Construction Co Ltd 233 400 178 843 156 285 0.01
China Construction Bank Corp 2 667 600 2 050 714 2 010 037 0.09
China International Marine Containers Group Co Ltd 18 100 33 872 34 703 0
China Life Insurance Co Ltd 96 100 267 734 251 705 0.01
China Longyuan Power Group Corp 33 000 32 941 35 765 0
China Merchants Bank Co Ltd 161 100 307 960 317 190 0.01
China Minsheng Banking Corp Ltd 132 000 136 133 119 566 0.01
China National Building Material Co Ltd 139 100 134 344 122 408 0.01
China Oilfield Services Ltd 69 600 170 549 167 033 0.01
China Pacific Insurance Group Co Ltd 36 300 135 259 127 631 0.01
China Petroleum & Chemical Corp 950 000 770 882 907 060 0.04
China Railway Construction Corp Ltd 211 900 203 186 187 002 0.01
China Railway Group Ltd 175 000 99 479 85 347 0
China Shenhua Energy Co Ltd 85 900 275 391 248 268 0.01
China Telecom Corp Ltd 316 000 167 371 154 524 0.01
Chongqing Rural Commercial Bank 77 000 38 873 35 466 0
CITIC Securities Co Ltd 782 000 1 959 322 1 719 305 0.08
CSR Corp Ltd 45 000 33 419 33 849 0
Datang International Power Generation Co Ltd 82 000 37 680 31 849 0
Dongfeng Motor Group Co Ltd 60 000 87 504 107 454 0
Dongjiang Environmental Co Ltd 15 300 33 472 49 551 0
Great Wall Motor Co Ltd 28 100 135 438 104 420 0
Guangzhou Automobile Group Co Ltd 30 000 34 008 34 644 0
Guangzhou R&F Properties Co Ltd 118 700 153 748 146 262 0.01
Guangzhou Shipyard International Co Ltd 34 000 34 344 60 275 0
Hainan Meilan International Airport Co Ltd 34 000 32 899 31 147 0
Haitong Securities Co Ltd 20 800 33 706 32 205 0
Huaneng Power International Inc 159 400 170 955 179 341 0.01
Industrial & Commercial Bank of China Ltd 3 815 400 2 576 396 2 412 096 0.11
Jiangsu Expressway Co Ltd 30 000 34 705 35 496 0
Jiangxi Copper Co Ltd 41 000 87 221 64 751 0
New China Life Insurance Co Ltd 42 200 133 424 139 116 0.01
People's Insurance Co Group of China Ltd 74 000 36 818 29 023 0
PetroChina Co Ltd 5 381 100 6 331 277 6 790 410 0.3
PICC Property & Casualty Co Ltd 133 700 198 262 201 486 0.01
Ping An Insurance Group Co of China Ltd 28 000 219 379 216 583 0.01
Shandong Luoxin Pharmacy Stock Co Ltd 112 400 150 850 161 845 0.01
Shandong Weigao Group Medical Polymer Co Ltd 162 600 157 334 158 389 0.01

STANLIB Funds Limited
Portfolio Statement (continued)
STANLIB Multi-Manager Global Equity Fund (continued)
As at 30 June 2014
100
Nominal holding Cost Market Value % of Net AssetsUSD USD
China (continued)Shanghai Pharmaceuticals Holding Co Ltd 17 700 33 721 36 814 0
Shenzhen Expressway Co Ltd 170 000 72 135 89 267 0
Sinopharm Group Co Ltd 57 600 153 274 159 045 0.01
Tong Ren Tang Technologies Co Ltd 22 000 33 886 31 907 0
Travelsky Technology Ltd 281 600 259 666 258 340 0.01
Tsingtao Brewery Co Ltd 77 000 493 528 599 576 0.03
Weichai Power Co Ltd 34 600 136 547 133 483 0.01
Wumart Stores Inc 18 000 35 325 13 957 0
Yanzhou Coal Mining Co Ltd 76 000 77 260 57 365 0
Zhejiang Expressway Co Ltd 38 000 34 259 38 293 0
Zhuzhou CSR Times Electric Co Ltd 42 800 133 963 130 604 0.01
Zijin Mining Group Co Ltd 150 000 35 691 33 870 0
ZTE Corp 17 800 33 897 35 093 0
Total China 0.99% (31 December 2013: 0.90%) 22 139 172 0.99
China, Republic of (Taiwan)Advantech Co Ltd 36 204 227 301 306 771 0.01
Asustek Computer Inc 117 000 920 382 1 302 912 0.06
Catcher Technology Co Ltd 95 900 482 238 894 507 0.04
Chipbond Technology Corp 57 000 88 319 100 035 0
Chunghwa Telecom Co Ltd 384 200 1 159 546 1 237 854 0.06
Delta Electronics Inc 86 000 420 961 620 705 0.03
Giant Manufacturing Co Ltd 32 000 157 869 248 109 0.01
Hon Hai Precision Industry Co Ltd 419 900 1 158 557 1 404 901 0.06
Hotai Motor Co Ltd 98 700 1 208 481 1 257 803 0.06
Largan Precision Co Ltd 11 800 474 532 938 610 0.04
MediaTek Inc 81 100 1 015 318 1 368 960 0.06
Taiwan Semiconductor Manufacturing Co Ltd 545 194 1 739 132 2 309 824 0.1
Taiwan Semiconductor Manufacturing Co Ltd ADR 506 000 6 607 632 10 818 280 0.48
Yungtay Engineering Co Ltd 346 000 717 237 822 753 0.04
Total China, Republic of (Taiwan) 1.05% (31 December 2013: 1.09%)
23 632 024 1.05
ColombiaAlmacenes Exito SA 11 162 168 155 187 047 0.01
Bancolombia SA 8 300 450 327 479 823 0.02
Total Colombia 0.03% (31 December 2013: 0.03%) 666 870 0.03Total Curaçao 0.00% (31 December 2013: 0.42%)
CyprusGlobaltrans Investment Plc 7 309 110 848 83 103 0
Total Cyprus 0.00% (31 December 2013: 0.01%) 83 103 0
Czech RepublicKomercni Banka AS 837 149 084 192 541 0.01
Total Czech Republic 0.01% (31 December 2013: 0.01%) 192 541 0.01
DenmarkAP Moeller - Maersk A/S 225 414 875 558 653 0.02
Auriga Industries A/S 2 271 75 774 115 943 0
Carlsberg A/S 7 762 711 940 836 035 0.04
Coloplast A/S 25 655 1 126 491 2 319 448 0.1
Danske Bank A/S 13 995 304 285 395 543 0.02
FLSmidth & Co A/S 1 740 97 906 97 110 0
GN Store Nord A/S 34 783 556 305 995 855 0.04
Jyske Bank A/S 6 901 246 843 391 610 0.02
Novo Nordisk A/S 199 151 6 600 656 9 161 643 0.41
TDC A/S 13 109 109 259 135 658 0.01

STANLIB Funds Limited
Portfolio Statement (continued)
STANLIB Multi-Manager Global Equity Fund (continued)
As at 30 June 2014
101
Nominal holding Cost Market Value % of Net AssetsUSD USD
Denmark (continued)Topdanmark A/S 5 644 91 362 171 334 0.01
Tryg A/S 18 202 1 616 643 1 836 833 0.08
Vestas Wind Systems A/S 40 579 596 973 2 047 117 0.09
William Demant Holding A/S 6 392 455 690 580 243 0.03
Total Denmark 0.87% (31 December 2013: 0.77%) 19 643 025 0.87Total Egypt 0.00% (31 December 2013: 0.00%)
FinlandAmer Sports OYJ 13 800 188 811 282 467 0.01
Cargotec OYJ 4 766 166 815 181 665 0.01
Caverion Corp 5 580 42 039 58 979 0
Fortum OYJ 17 150 407 468 460 457 0.02
Kesko OYJ 1 418 45 248 56 030 0
Kone OYJ 2 174 96 960 90 724 0.01
Metso OYJ 13 946 458 941 528 332 0.02
Neste Oil OYJ 4 100 85 202 79 992 0
Nokia OYJ 24 646 172 515 186 602 0.01
Nokian Renkaat OYJ 1 924 96 379 75 049 0
Outokumpu OYJ 55 854 567 615 560 919 0.03
Outotec OYJ 6 540 93 266 68 723 0
PKC Group OYJ 1 895 59 796 54 277 0
Ramirent OYJ 18 500 189 930 206 939 0.01
Sampo Oyj 92 183 2 927 068 4 658 459 0.21
Stora Enso OYJ 11 862 110 779 115 472 0.01
Tikkurila Oyj 51 420 1 104 730 1 406 615 0.06
UPM-Kymmene OYJ 12 866 192 931 219 664 0.01
Valmet OYJ 13 021 127 366 155 813 0.01
Wartsila OYJ Abp 6 947 318 719 344 503 0.02
Total Finland 0.44% (31 December 2013: 0.45%) 9 791 681 0.44
FranceAccor SA 2 645 110 337 137 558 0.01
Aeroports de Paris 1 095 110 534 144 209 0.01
Air France-KLM 34 077 327 798 429 285 0.02
Air Liquide SA 28 726 3 432 352 3 877 536 0.17
Alten SA 1 500 49 988 71 274 0
Arkema SA 1 016 115 388 98 862 0
AtoS 1 488 113 564 123 907 0.01
AXA SA 22 268 451 255 532 016 0.02
BNP Paribas SA 67 806 4 334 406 4 599 091 0.2
Bouygues SA 9 471 345 368 393 942 0.02
Carrefour SA 20 168 671 555 743 889 0.03
Casino Guichard Perrachon SA 9 736 944 335 1 290 605 0.06
Cie de St-Gobain 12 027 563 286 678 426 0.03
Cie Generale des Etablissements Michelin 4 085 426 196 487 983 0.02
CNP Assurances 7 444 141 657 154 407 0.01
Credit Agricole SA 32 676 362 472 460 578 0.02
Danone SA 19 879 1 390 677 1 475 712 0.07
Edenred 311 532 9 439 795 9 430 603 0.42
Eiffage SA 2 039 112 426 138 579 0.01
Electricite de France SA 6 313 181 515 198 711 0.01
Euler Hermes Group 800 66 644 95 884 0
Eurazeo SA 1 812 112 484 150 540 0.01
Fonciere Des Regions 1 405 110 872 152 122 0.01
GDF Suez 34 972 851 818 962 660 0.04

STANLIB Funds Limited
Portfolio Statement (continued)
STANLIB Multi-Manager Global Equity Fund (continued)
As at 30 June 2014
102
Nominal holding Cost Market Value % of Net AssetsUSD USD
France (continued)Gecina SA 928 113 014 135 061 0.01
Groupe Eurotunnel SA 35 954 327 720 485 810 0.02
Havas SA 21 800 134 036 178 993 0.01
iCADE 1 297 111 718 138 901 0.01
Iliad SA 504 119 521 152 293 0.01
Imerys SA 2 742 181 201 230 882 0.01
Innate Pharma SA 16 000 170 824 195 403 0.01
IPSOS 5 800 202 734 217 544 0.01
Kering 771 173 612 168 844 0.01
Lafarge SA 2 632 179 639 228 467 0.01
Legrand SA 27 858 1 366 605 1 704 352 0.08
L'Oreal SA 5 202 841 608 895 625 0.04
LVMH Moet Hennessy Louis Vuitton SA 1 853 346 972 357 085 0.02
Natixis 31 623 155 917 202 713 0.01
Neopost SA 6 926 534 580 518 512 0.02
Orange SA 50 412 596 011 795 466 0.03
Pernod Ricard SA 29 842 3 329 553 3 581 601 0.16
Peugeot SA 33 124 458 577 489 341 0.02
Publicis Groupe SA 1 616 128 425 137 022 0.01
Rallye SA 3 482 131 083 189 907 0.01
Renault SA 16 052 1 290 951 1 450 730 0.06
Safran SA 163 370 7 275 175 10 695 082 0.48
Sanofi 21 438 2 088 662 2 277 099 0.1
Schneider Electric SE 76 155 5 606 185 7 167 305 0.32
SEB SA 1 319 109 734 116 751 0
Ses Npv 122 448 3 965 196 4 602 784 0.2
Societe BIC SA 938 110 607 128 246 0.01
Societe d'Edition de Canal + 22 900 185 591 193 450 0.01
Societe Generale SA 21 346 1 110 644 1 117 881 0.05
Sodexo 1 243 110 693 133 663 0.01
Suez Environnement Co 7 026 116 998 134 433 0.01
Technip SA 1 200 90 994 131 257 0.01
Thales SA 5 445 301 552 328 690 0.01
Total SA 50 532 2 913 049 3 648 143 0.16
Unibail-Rodamco SE 1 057 249 653 307 381 0.01
Vallourec SA 9 642 533 000 431 747 0.02
Veolia Environnement SA 14 417 254 290 274 567 0.01
Vicat 1 996 175 627 173 861 0.01
Vinci SA 10 113 578 235 755 582 0.03
Vivendi SA 31 370 706 697 767 514 0.03
Wendel SA 835 112 912 119 296 0
Zodiac Aerospace 30 145 924 395 1 020 056 0.04
Total France 3.29% (31 December 2013: 3.35%) 73 807 719 3.29
GermanyAdidas AG 3 572 324 812 361 804 0.02
Allianz SE 9 848 1 508 830 1 645 635 0.07
Aurubis AG 1 248 73 425 63 939 0
Axel Springer AG 1 685 63 947 102 638 0.01
Axel Springer SE 1 434 75 164 88 154 0
BASF SE 24 833 2 045 627 2 899 166 0.13
Bayer AG 6 312 710 282 893 152 0.04
Bayerische Motoren Werke AG 17 360 1 548 933 2 204 744 0.1
BayWa AG 1 459 71 577 81 391 0
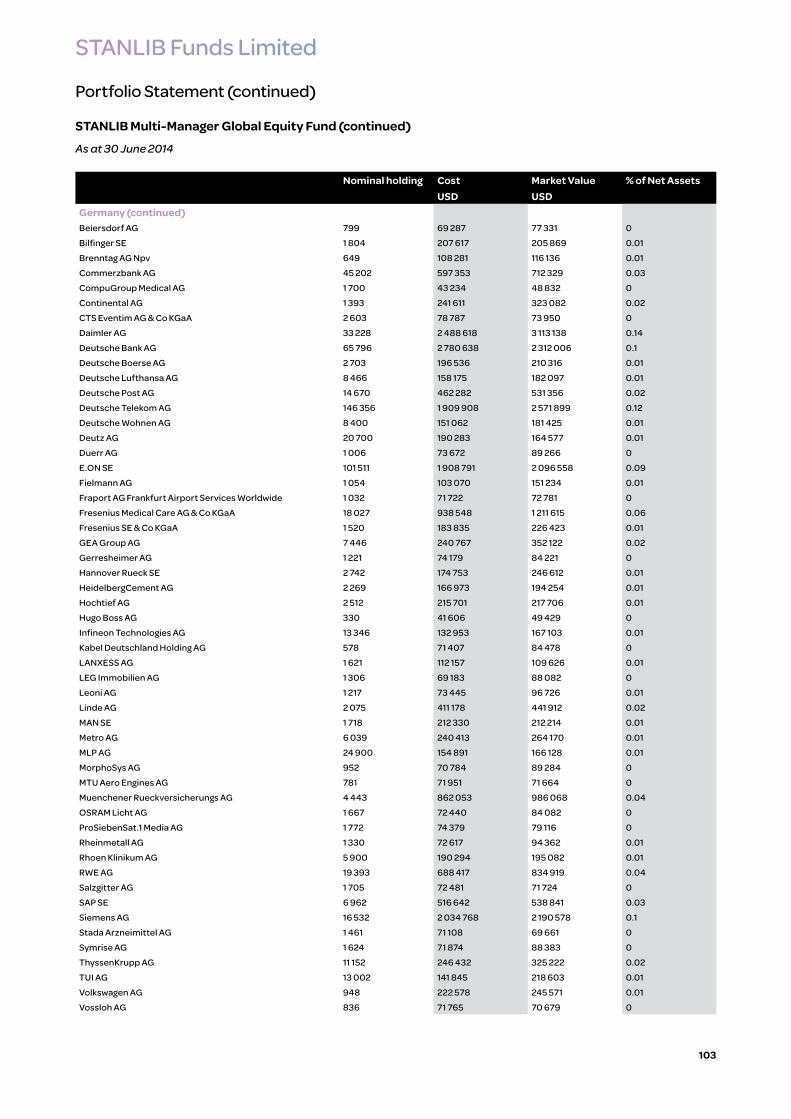
STANLIB Funds Limited
Portfolio Statement (continued)
STANLIB Multi-Manager Global Equity Fund (continued)
As at 30 June 2014
103
Nominal holding Cost Market Value % of Net AssetsUSD USD
Germany (continued)Beiersdorf AG 799 69 287 77 331 0
Bilfinger SE 1 804 207 617 205 869 0.01
Brenntag AG Npv 649 108 281 116 136 0.01
Commerzbank AG 45 202 597 353 712 329 0.03
CompuGroup Medical AG 1 700 43 234 48 832 0
Continental AG 1 393 241 611 323 082 0.02
CTS Eventim AG & Co KGaA 2 603 78 787 73 950 0
Daimler AG 33 228 2 488 618 3 113 138 0.14
Deutsche Bank AG 65 796 2 780 638 2 312 006 0.1
Deutsche Boerse AG 2 703 196 536 210 316 0.01
Deutsche Lufthansa AG 8 466 158 175 182 097 0.01
Deutsche Post AG 14 670 462 282 531 356 0.02
Deutsche Telekom AG 146 356 1 909 908 2 571 899 0.12
Deutsche Wohnen AG 8 400 151 062 181 425 0.01
Deutz AG 20 700 190 283 164 577 0.01
Duerr AG 1 006 73 672 89 266 0
E.ON SE 101 511 1 908 791 2 096 558 0.09
Fielmann AG 1 054 103 070 151 234 0.01
Fraport AG Frankfurt Airport Services Worldwide 1 032 71 722 72 781 0
Fresenius Medical Care AG & Co KGaA 18 027 938 548 1 211 615 0.06
Fresenius SE & Co KGaA 1 520 183 835 226 423 0.01
GEA Group AG 7 446 240 767 352 122 0.02
Gerresheimer AG 1 221 74 179 84 221 0
Hannover Rueck SE 2 742 174 753 246 612 0.01
HeidelbergCement AG 2 269 166 973 194 254 0.01
Hochtief AG 2 512 215 701 217 706 0.01
Hugo Boss AG 330 41 606 49 429 0
Infineon Technologies AG 13 346 132 953 167 103 0.01
Kabel Deutschland Holding AG 578 71 407 84 478 0
LANXESS AG 1 621 112 157 109 626 0.01
LEG Immobilien AG 1 306 69 183 88 082 0
Leoni AG 1 217 73 445 96 726 0.01
Linde AG 2 075 411 178 441 912 0.02
MAN SE 1 718 212 330 212 214 0.01
Metro AG 6 039 240 413 264 170 0.01
MLP AG 24 900 154 891 166 128 0.01
MorphoSys AG 952 70 784 89 284 0
MTU Aero Engines AG 781 71 951 71 664 0
Muenchener Rueckversicherungs AG 4 443 862 053 986 068 0.04
OSRAM Licht AG 1 667 72 440 84 082 0
ProSiebenSat.1 Media AG 1 772 74 379 79 116 0
Rheinmetall AG 1 330 72 617 94 362 0.01
Rhoen Klinikum AG 5 900 190 294 195 082 0.01
RWE AG 19 393 688 417 834 919 0.04
Salzgitter AG 1 705 72 481 71 724 0
SAP SE 6 962 516 642 538 841 0.03
Siemens AG 16 532 2 034 768 2 190 578 0.1
Stada Arzneimittel AG 1 461 71 108 69 661 0
Symrise AG 1 624 71 874 88 383 0
ThyssenKrupp AG 11 152 246 432 325 222 0.02
TUI AG 13 002 141 845 218 603 0.01
Volkswagen AG 948 222 578 245 571 0.01
Vossloh AG 836 71 765 70 679 0
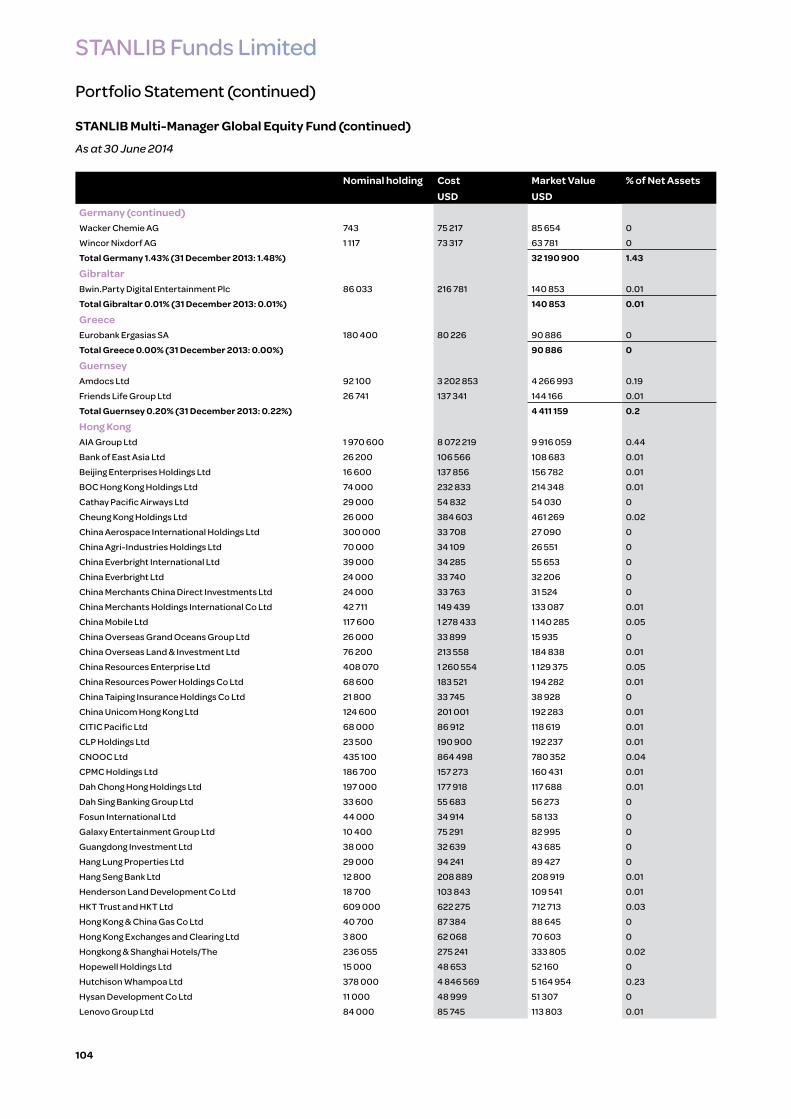
STANLIB Funds Limited
Portfolio Statement (continued)
STANLIB Multi-Manager Global Equity Fund (continued)
As at 30 June 2014
104
Nominal holding Cost Market Value % of Net AssetsUSD USD
Germany (continued)Wacker Chemie AG 743 75 217 85 654 0
Wincor Nixdorf AG 1 117 73 317 63 781 0
Total Germany 1.43% (31 December 2013: 1.48%) 32 190 900 1.43
GibraltarBwin.Party Digital Entertainment Plc 86 033 216 781 140 853 0.01
Total Gibraltar 0.01% (31 December 2013: 0.01%) 140 853 0.01
GreeceEurobank Ergasias SA 180 400 80 226 90 886 0
Total Greece 0.00% (31 December 2013: 0.00%) 90 886 0
GuernseyAmdocs Ltd 92 100 3 202 853 4 266 993 0.19
Friends Life Group Ltd 26 741 137 341 144 166 0.01
Total Guernsey 0.20% (31 December 2013: 0.22%) 4 411 159 0.2
Hong KongAIA Group Ltd 1 970 600 8 072 219 9 916 059 0.44
Bank of East Asia Ltd 26 200 106 566 108 683 0.01
Beijing Enterprises Holdings Ltd 16 600 137 856 156 782 0.01
BOC Hong Kong Holdings Ltd 74 000 232 833 214 348 0.01
Cathay Pacific Airways Ltd 29 000 54 832 54 030 0
Cheung Kong Holdings Ltd 26 000 384 603 461 269 0.02
China Aerospace International Holdings Ltd 300 000 33 708 27 090 0
China Agri-Industries Holdings Ltd 70 000 34 109 26 551 0
China Everbright International Ltd 39 000 34 285 55 653 0
China Everbright Ltd 24 000 33 740 32 206 0
China Merchants China Direct Investments Ltd 24 000 33 763 31 524 0
China Merchants Holdings International Co Ltd 42 711 149 439 133 087 0.01
China Mobile Ltd 117 600 1 278 433 1 140 285 0.05
China Overseas Grand Oceans Group Ltd 26 000 33 899 15 935 0
China Overseas Land & Investment Ltd 76 200 213 558 184 838 0.01
China Resources Enterprise Ltd 408 070 1 260 554 1 129 375 0.05
China Resources Power Holdings Co Ltd 68 600 183 521 194 282 0.01
China Taiping Insurance Holdings Co Ltd 21 800 33 745 38 928 0
China Unicom Hong Kong Ltd 124 600 201 001 192 283 0.01
CITIC Pacific Ltd 68 000 86 912 118 619 0.01
CLP Holdings Ltd 23 500 190 900 192 237 0.01
CNOOC Ltd 435 100 864 498 780 352 0.04
CPMC Holdings Ltd 186 700 157 273 160 431 0.01
Dah Chong Hong Holdings Ltd 197 000 177 918 117 688 0.01
Dah Sing Banking Group Ltd 33 600 55 683 56 273 0
Fosun International Ltd 44 000 34 914 58 133 0
Galaxy Entertainment Group Ltd 10 400 75 291 82 995 0
Guangdong Investment Ltd 38 000 32 639 43 685 0
Hang Lung Properties Ltd 29 000 94 241 89 427 0
Hang Seng Bank Ltd 12 800 208 889 208 919 0.01
Henderson Land Development Co Ltd 18 700 103 843 109 541 0.01
HKT Trust and HKT Ltd 609 000 622 275 712 713 0.03
Hong Kong & China Gas Co Ltd 40 700 87 384 88 645 0
Hong Kong Exchanges and Clearing Ltd 3 800 62 068 70 603 0
Hongkong & Shanghai Hotels/The 236 055 275 241 333 805 0.02
Hopewell Holdings Ltd 15 000 48 653 52 160 0
Hutchison Whampoa Ltd 378 000 4 846 569 5 164 954 0.23
Hysan Development Co Ltd 11 000 48 999 51 307 0
Lenovo Group Ltd 84 000 85 745 113 803 0.01

STANLIB Funds Limited
Portfolio Statement (continued)
STANLIB Multi-Manager Global Equity Fund (continued)
As at 30 June 2014
105
Nominal holding Cost Market Value % of Net AssetsUSD USD
Hong Kong (continued)Link REIT/The 83 451 423 641 448 457 0.02
Melco International Development Ltd 64 000 224 907 193 229 0.01
MTR Corp Ltd 22 500 87 064 86 222 0
New World Development Co Ltd 154 606 213 388 175 942 0.01
Power Assets Holdings Ltd 14 500 125 572 126 846 0.01
Shanghai Industrial Holdings Ltd 49 800 155 526 150 356 0.01
Sino Land Co Ltd 58 000 85 211 95 190 0
Sino-Ocean Land Holdings Ltd 70 500 44 142 35 384 0
SJM Holdings Ltd 18 000 49 400 45 103 0
Sun Art Retail Group Ltd 24 000 33 211 27 312 0
Sun Hung Kai Properties Ltd 33 000 443 357 452 612 0.02
Swire Pacific Ltd 317 500 3 384 583 3 902 011 0.17
Swire Properties Ltd 24 000 67 593 70 138 0
Techtronic Industries Co 142 000 240 279 450 708 0.02
Television Broadcasts Ltd 50 300 308 445 326 447 0.02
Wharf Holdings Ltd 94 000 814 393 674 948 0.03
Wheelock & Co Ltd 18 000 86 912 75 249 0
Wing Hang Bank Ltd 4 500 72 007 72 461 0
Total Hong Kong 1.34% (31 December 2013: 1.37%) 30 128 113 1.34
IndiaAxis Bank Ltd 24 070 327 342 767 263 0.03
Bank of Baroda 32 503 300 230 473 858 0.02
Bharti Airtel Ltd 70 221 363 535 391 475 0.02
CESC Ltd 125 954 687 250 1 478 486 0.07
Housing Development Finance Corp 51 400 663 294 843 489 0.04
ICICI Bank Ltd 20 393 1 041 296 1 017 611 0.05
Infosys Ltd 11 024 525 167 596 610 0.03
Infosys Ltd ADR 19 100 1 025 343 1 027 007 0.05
Larsen & Toubro Ltd 19 400 542 272 549 342 0.02
MRF Ltd 1 400 544 533 550 061 0.02
Reliance Industries Ltd 30 896 420 670 520 678 0.02
State Bank of India 12 300 296 114 548 689 0.02
Total India 0.39% (31 December 2013: 0.25%) 8 764 569 0.39
IndonesiaBakrie and Brothers Tbk PT 5 386 500 23 450 22 623 0
Bakrie Telecom Tbk PT 2 000 000 8 707 8 400 0
Bakrieland Development Tbk PT 1 196 500 5 209 5 025 0
Bank Central Asia Tbk PT 581 100 527 745 534 263 0.02
Bank Mandiri Persero Tbk PT 1 700 200 1 532 577 1 391 104 0.06
Gudang Garam Tbk PT 139 700 563 185 624 850 0.03
Tower Bersama Infrastructure Tbk PT 387 300 198 922 261 350 0.01
Unilever Indonesia Tbk PT 229 900 557 025 567 715 0.03
XL Axiata Tbk PT 245 500 101 950 104 068 0.01
Total Indonesia 0.16% (31 December 2013: 0.01%) 3 519 398 0.16
IrelandAccenture Plc 21 116 1 519 226 1 706 384 0.08
Actavis plc 600 81 840 133 176 0.01
Allegion Plc 1 033 39 548 58 540 0
Bank of Ireland 2 423 686 496 254 819 691 0.04
Covidien Plc 4 300 264 020 387 946 0.02
CRH Plc 3 106 75 119 79 662 0
DCC Plc 8 908 341 208 545 434 0.02
Eaton Corp Plc 44 300 2 488 568 3 418 188 0.15

STANLIB Funds Limited
Portfolio Statement (continued)
STANLIB Multi-Manager Global Equity Fund (continued)
As at 30 June 2014
106
Nominal holding Cost Market Value % of Net AssetsUSD USD
Ireland (continued)Endo International Plc 1 300 86 853 91 013 0
Independent News & Media Plc 201 669 299 210 42 579 0
Ingersoll-Rand Plc 3 100 156 418 193 781 0.01
Irish Continental Group Plc 43 010 105 610 160 174 0.01
James Hardie Industries Plc 5 151 48 932 67 239 0
Jazz Pharmaceuticals Plc 700 63 694 102 872 0.01
Mallinckrodt Plc 1 300 56 363 103 961 0.01
Paddy Power Plc 6 320 332 957 415 731 0.02
Pentair Plc 1 300 83 362 93 717 0
Perrigo Co Plc 1 300 190 318 189 436 0.01
Seagate Technology Plc 5 100 204 950 289 731 0.01
UDG Healthcare Plc 14 282 77 903 83 541 0
Weatherford International Plc 504 100 7 703 154 11 589 259 0.52
Willis Group Holdings Plc 1 300 55 919 56 277 0
XL Group Plc 5 200 157 664 170 144 0.01
Total Ireland 0.93% (31 December 2013: 0.60%) 20 798 476 0.93
Isle of ManGVC Holdings Plc 10 624 52 474 79 564 0
Playtech Plc 18 015 111 792 189 747 0.01
Total Isle of Man 0.01% (31 December 2013: 0.01%) 269 311 0.01
IsraelBank Hapoalim BM 17 765 88 955 102 795 0.01
Bank Leumi Le-Israel BM 36 487 131 668 142 172 0.01
Bezeq The Israeli Telecommunication Corp Ltd 45 400 75 051 85 139 0
ClickSoftware Technologies Ltd 16 700 175 986 134 769 0.01
Delek Group Ltd 125 38 140 51 768 0
Elbit Systems Ltd 950 45 097 58 489 0
Harel Insurance Investments & Financial Services Ltd 10 029 55 734 59 436 0
Israel Chemicals Ltd 6 900 59 359 59 165 0
Israel Corp Ltd/The 121 61 206 68 992 0
Mizrahi Tefahot Bank Ltd 11 400 108 369 147 290 0.01
NICE Systems Ltd 2 448 95 642 100 026 0
NICE Systems Ltd ADR 3 200 124 478 130 432 0.01
Teva Pharmaceutical Industries Ltd 11 148 421 035 589 140 0.03
Total Israel 0.08% (31 December 2013: 0.08%) 1 729 613 0.08
ItalyAnsaldo STS SpA 7 916 73 269 84 483 0
Assicurazioni Generali SpA 30 393 612 822 666 211 0.03
Atlantia SpA 4 385 87 244 124 997 0.01
Azimut Holding SpA 3 308 71 978 85 193 0
Banca Monte dei Paschi di Siena SpA 143 631 293 324 277 869 0.01
Banca Popolare dell'Emilia Romagna SC 10 265 77 695 92 758 0.01
Banca Popolare di Milano Scarl 68 400 62 883 61 341 0
Banco Popolare SC 8 376 95 570 137 845 0.01
Brembo SpA 3 001 74 082 109 540 0.01
Cnh Industrial NV Eur0.01 75 306 788 639 773 280 0.04
Danieli & C Officine Meccaniche SpA 2 465 71 148 78 130 0
Danieli & C Officine Meccaniche SpA RSP 3 683 72 764 82 546 0
Davide Campari-Milano SpA 13 765 79 667 118 825 0.01
De' Longhi 10 500 140 511 224 840 0.01
Enel Green Power SpA 21 900 62 552 62 008 0
Enel SpA 204 680 813 076 1 192 118 0.05
Eni SpA 415 359 9 596 284 11 356 621 0.51

STANLIB Funds Limited
Portfolio Statement (continued)
STANLIB Multi-Manager Global Equity Fund (continued)
As at 30 June 2014
107
Nominal holding Cost Market Value % of Net AssetsUSD USD
Italy (continued)Exor SpA 3 452 129 443 141 694 0.01
Fiat SpA 50 060 422 828 493 827 0.02
Finmeccanica SpA 10 961 74 222 104 149 0.01
GTECH SpA 2 515 72 831 61 430 0
Industria Macchine Automatiche SpA 1 271 35 060 59 775 0
Interpump Group SpA 21 900 180 228 301 342 0.01
Intesa Sanpaolo SpA 310 778 706 394 959 061 0.04
Italmobiliare SpA RSP 2 083 31 273 56 354 0
Italmobiliare SpA 1 410 34 686 54 285 0
Luxottica Group SpA 14 402 664 533 833 099 0.04
Luxottica Group SpA ADR 7 535 133 631 435 975 0.02
Mediaset SpA 18 100 101 198 88 123 0
Piaggio & C SpA 409 589 1 127 773 1 456 908 0.07
Pirelli & C. SpA 5 685 72 487 91 223 0.01
Prysmian SpA 3 110 72 764 70 044 0
Saipem SpA 36 437 784 555 980 286 0.04
Salvatore Ferragamo SpA 2 124 71 653 63 337 0
Snam SpA 14 809 71 181 89 131 0
Societa Cattolica di Assicurazioni SCRL 3 196 72 859 71 281 0
Societa Iniziative Autostradali e Servizi SpA 7 360 73 133 94 521 0.01
Telecom Italia SpA 379 821 326 984 480 777 0.02
Telecom Italia SpA RSP 295 392 195 180 291 788 0.01
Terna Rete Elettrica Nazionale SpA 17 100 87 859 90 184 0
UniCredit SpA 118 079 808 323 988 593 0.05
Unione di Banche Italiane SCpA 39 856 199 492 344 599 0.02
Total Italy 1.08% (31 December 2013: 1.02%) 24 230 391 1.08
Japan77 Bank Ltd/The 7 000 33 236 36 829 0
ADEKA Corp 5 000 64 831 66 976 0
Aeon Co Ltd 21 400 298 018 262 786 0.01
Aeon Mall Co Ltd 2 800 76 104 73 742 0
Aichi Bank Ltd/The 900 40 920 46 908 0
Air Water Inc 5 000 76 966 79 907 0
Aisin Seiki Co Ltd 3 600 143 840 142 856 0.01
Ajinomoto Co Inc 9 000 115 054 140 812 0.01
Alfresa Holdings Corp 15 700 769 701 1 010 454 0.05
Alps Electric Co Ltd 3 700 27 482 47 407 0
Amada Co Ltd 8 000 79 087 81 338 0
ANA Holdings Inc 26 000 58 053 61 082 0
AOKI Holdings Inc 800 12 330 11 301 0
Aoyama Trading Co Ltd 3 600 90 421 98 329 0.01
Aozora Bank Ltd 26 000 77 756 85 207 0
Asahi Glass Co Ltd 33 000 201 355 193 822 0.01
Asahi Group Holdings Ltd 5 600 142 664 175 731 0.01
Asahi Kasei Corp 26 000 194 258 198 648 0.01
Asics Corp 3 400 71 266 79 273 0
Astellas Pharma Inc 70 200 774 504 921 635 0.04
Awa Bank Ltd/The 3 000 15 740 16 998 0
Azbil Corp 15 400 314 538 393 418 0.02
Bandai Namco Holdings Inc 37 900 634 590 887 406 0.04
Bank of Kyoto Ltd/The 10 000 87 771 90 716 0.01
Bank of Nagoya Ltd/The 4 000 14 520 15 912 0
Bank of Yokohama Ltd/The 82 000 446 886 471 090 0.02
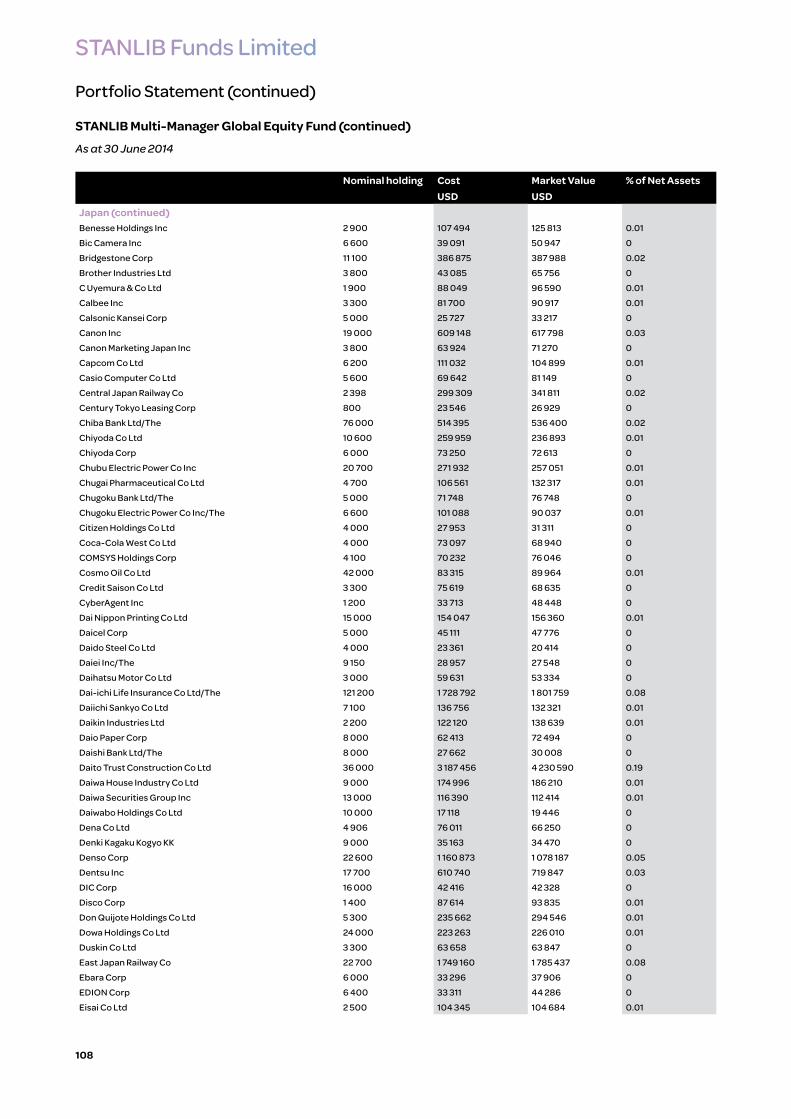
STANLIB Funds Limited
Portfolio Statement (continued)
STANLIB Multi-Manager Global Equity Fund (continued)
As at 30 June 2014
108
Nominal holding Cost Market Value % of Net AssetsUSD USD
Japan (continued)Benesse Holdings Inc 2 900 107 494 125 813 0.01
Bic Camera Inc 6 600 39 091 50 947 0
Bridgestone Corp 11 100 386 875 387 988 0.02
Brother Industries Ltd 3 800 43 085 65 756 0
C Uyemura & Co Ltd 1 900 88 049 96 590 0.01
Calbee Inc 3 300 81 700 90 917 0.01
Calsonic Kansei Corp 5 000 25 727 33 217 0
Canon Inc 19 000 609 148 617 798 0.03
Canon Marketing Japan Inc 3 800 63 924 71 270 0
Capcom Co Ltd 6 200 111 032 104 899 0.01
Casio Computer Co Ltd 5 600 69 642 81 149 0
Central Japan Railway Co 2 398 299 309 341 811 0.02
Century Tokyo Leasing Corp 800 23 546 26 929 0
Chiba Bank Ltd/The 76 000 514 395 536 400 0.02
Chiyoda Co Ltd 10 600 259 959 236 893 0.01
Chiyoda Corp 6 000 73 250 72 613 0
Chubu Electric Power Co Inc 20 700 271 932 257 051 0.01
Chugai Pharmaceutical Co Ltd 4 700 106 561 132 317 0.01
Chugoku Bank Ltd/The 5 000 71 748 76 748 0
Chugoku Electric Power Co Inc/The 6 600 101 088 90 037 0.01
Citizen Holdings Co Ltd 4 000 27 953 31 311 0
Coca-Cola West Co Ltd 4 000 73 097 68 940 0
COMSYS Holdings Corp 4 100 70 232 76 046 0
Cosmo Oil Co Ltd 42 000 83 315 89 964 0.01
Credit Saison Co Ltd 3 300 75 619 68 635 0
CyberAgent Inc 1 200 33 713 48 448 0
Dai Nippon Printing Co Ltd 15 000 154 047 156 360 0.01
Daicel Corp 5 000 45 111 47 776 0
Daido Steel Co Ltd 4 000 23 361 20 414 0
Daiei Inc/The 9 150 28 957 27 548 0
Daihatsu Motor Co Ltd 3 000 59 631 53 334 0
Dai-ichi Life Insurance Co Ltd/The 121 200 1 728 792 1 801 759 0.08
Daiichi Sankyo Co Ltd 7 100 136 756 132 321 0.01
Daikin Industries Ltd 2 200 122 120 138 639 0.01
Daio Paper Corp 8 000 62 413 72 494 0
Daishi Bank Ltd/The 8 000 27 662 30 008 0
Daito Trust Construction Co Ltd 36 000 3 187 456 4 230 590 0.19
Daiwa House Industry Co Ltd 9 000 174 996 186 210 0.01
Daiwa Securities Group Inc 13 000 116 390 112 414 0.01
Daiwabo Holdings Co Ltd 10 000 17 118 19 446 0
Dena Co Ltd 4 906 76 011 66 250 0
Denki Kagaku Kogyo KK 9 000 35 163 34 470 0
Denso Corp 22 600 1 160 873 1 078 187 0.05
Dentsu Inc 17 700 610 740 719 847 0.03
DIC Corp 16 000 42 416 42 328 0
Disco Corp 1 400 87 614 93 835 0.01
Don Quijote Holdings Co Ltd 5 300 235 662 294 546 0.01
Dowa Holdings Co Ltd 24 000 223 263 226 010 0.01
Duskin Co Ltd 3 300 63 658 63 847 0
East Japan Railway Co 22 700 1 749 160 1 785 437 0.08
Ebara Corp 6 000 33 296 37 906 0
EDION Corp 6 400 33 311 44 286 0
Eisai Co Ltd 2 500 104 345 104 684 0.01
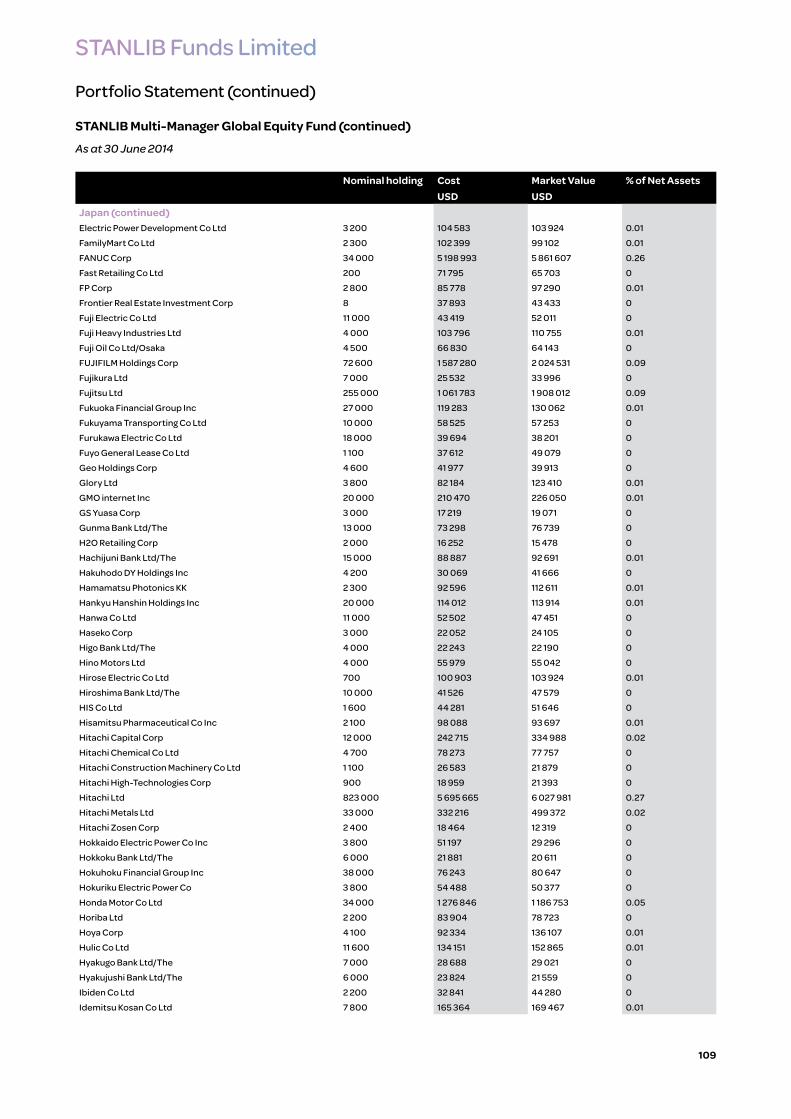
STANLIB Funds Limited
Portfolio Statement (continued)
STANLIB Multi-Manager Global Equity Fund (continued)
As at 30 June 2014
109
Nominal holding Cost Market Value % of Net AssetsUSD USD
Japan (continued)Electric Power Development Co Ltd 3 200 104 583 103 924 0.01
FamilyMart Co Ltd 2 300 102 399 99 102 0.01
FANUC Corp 34 000 5 198 993 5 861 607 0.26
Fast Retailing Co Ltd 200 71 795 65 703 0
FP Corp 2 800 85 778 97 290 0.01
Frontier Real Estate Investment Corp 8 37 893 43 433 0
Fuji Electric Co Ltd 11 000 43 419 52 011 0
Fuji Heavy Industries Ltd 4 000 103 796 110 755 0.01
Fuji Oil Co Ltd/Osaka 4 500 66 830 64 143 0
FUJIFILM Holdings Corp 72 600 1 587 280 2 024 531 0.09
Fujikura Ltd 7 000 25 532 33 996 0
Fujitsu Ltd 255 000 1 061 783 1 908 012 0.09
Fukuoka Financial Group Inc 27 000 119 283 130 062 0.01
Fukuyama Transporting Co Ltd 10 000 58 525 57 253 0
Furukawa Electric Co Ltd 18 000 39 694 38 201 0
Fuyo General Lease Co Ltd 1 100 37 612 49 079 0
Geo Holdings Corp 4 600 41 977 39 913 0
Glory Ltd 3 800 82 184 123 410 0.01
GMO internet Inc 20 000 210 470 226 050 0.01
GS Yuasa Corp 3 000 17 219 19 071 0
Gunma Bank Ltd/The 13 000 73 298 76 739 0
H2O Retailing Corp 2 000 16 252 15 478 0
Hachijuni Bank Ltd/The 15 000 88 887 92 691 0.01
Hakuhodo DY Holdings Inc 4 200 30 069 41 666 0
Hamamatsu Photonics KK 2 300 92 596 112 611 0.01
Hankyu Hanshin Holdings Inc 20 000 114 012 113 914 0.01
Hanwa Co Ltd 11 000 52 502 47 451 0
Haseko Corp 3 000 22 052 24 105 0
Higo Bank Ltd/The 4 000 22 243 22 190 0
Hino Motors Ltd 4 000 55 979 55 042 0
Hirose Electric Co Ltd 700 100 903 103 924 0.01
Hiroshima Bank Ltd/The 10 000 41 526 47 579 0
HIS Co Ltd 1 600 44 281 51 646 0
Hisamitsu Pharmaceutical Co Inc 2 100 98 088 93 697 0.01
Hitachi Capital Corp 12 000 242 715 334 988 0.02
Hitachi Chemical Co Ltd 4 700 78 273 77 757 0
Hitachi Construction Machinery Co Ltd 1 100 26 583 21 879 0
Hitachi High-Technologies Corp 900 18 959 21 393 0
Hitachi Ltd 823 000 5 695 665 6 027 981 0.27
Hitachi Metals Ltd 33 000 332 216 499 372 0.02
Hitachi Zosen Corp 2 400 18 464 12 319 0
Hokkaido Electric Power Co Inc 3 800 51 197 29 296 0
Hokkoku Bank Ltd/The 6 000 21 881 20 611 0
Hokuhoku Financial Group Inc 38 000 76 243 80 647 0
Hokuriku Electric Power Co 3 800 54 488 50 377 0
Honda Motor Co Ltd 34 000 1 276 846 1 186 753 0.05
Horiba Ltd 2 200 83 904 78 723 0
Hoya Corp 4 100 92 334 136 107 0.01
Hulic Co Ltd 11 600 134 151 152 865 0.01
Hyakugo Bank Ltd/The 7 000 28 688 29 021 0
Hyakujushi Bank Ltd/The 6 000 23 824 21 559 0
Ibiden Co Ltd 2 200 32 841 44 280 0
Idemitsu Kosan Co Ltd 7 800 165 364 169 467 0.01

STANLIB Funds Limited
Portfolio Statement (continued)
STANLIB Multi-Manager Global Equity Fund (continued)
As at 30 June 2014
110
Nominal holding Cost Market Value % of Net AssetsUSD USD
Japan (continued)IHI Corp 27 000 114 219 125 531 0.01
Inaba Denki Sangyo Co Ltd 2 800 86 843 94 250 0.01
Inabata & Co Ltd 1 600 15 112 15 020 0
Inpex Corp 18 800 218 720 285 604 0.01
Internet Initiative Japan Inc 6 300 168 793 154 725 0.01
Isetan Mitsukoshi Holdings Ltd 71 100 878 631 925 025 0.04
Isuzu Motors Ltd 11 000 70 003 72 642 0
IT Holdings Corp 1 500 18 427 25 749 0
Ito En Ltd 2 600 63 483 66 550 0
ITOCHU Corp 120 200 1 508 380 1 542 466 0.07
Itochu Enex Co Ltd 3 500 18 362 25 152 0
Itoham Foods Inc 15 000 64 349 66 037 0
Iwatani Corp 6 000 22 052 42 466 0
Iyo Bank Ltd/The 6 000 61 333 60 589 0
Izumi Co Ltd 1 500 43 930 47 530 0
J Front Retailing Co Ltd 12 000 97 705 83 984 0
Jafco Co Ltd 1 700 84 259 74 256 0
Japan Airlines Co Ltd 2 300 118 509 126 914 0.01
Japan Hotel REIT Investment Corp 245 114 425 128 661 0.01
Japan Logistics Fund Inc 35 68 654 82 987 0
Japan Petroleum Exploration Co 1 100 40 822 45 822 0
Japan Real Estate Investment Corp 9 52 129 52 327 0
Japan Steel Works Ltd/The 4 000 22 193 17 531 0
Japan Tobacco Inc 62 187 2 072 345 2 265 143 0.1
JFE Holdings Inc 15 900 388 201 328 030 0.02
JGC Corp 3 000 109 021 91 091 0.01
Joyo Bank Ltd/The 17 000 90 089 90 617 0.01
JSR Corp 3 200 55 757 54 900 0
JTEKT Corp 3 800 51 465 63 880 0
Juroku Bank Ltd/The 8 000 30 217 29 850 0
JX Holdings Inc 240 970 1 311 078 1 286 852 0.06
Kagoshima Bank Ltd/The 4 000 26 724 26 928 0
Kajima Corp 19 000 79 206 83 836 0
Kameda Seika Co Ltd 3 100 88 617 98 687 0.01
Kamigumi Co Ltd 4 000 33 028 36 721 0
Kandenko Co Ltd 10 000 58 562 57 944 0
Kaneka Corp 6 000 38 244 37 491 0
Kanematsu Corp 21 000 28 335 37 521 0
Kansai Electric Power Co Inc/The 24 400 284 986 229 536 0.01
Kansai Paint Co Ltd 2 000 25 435 33 345 0
Kao Corp 60 600 1 818 403 2 384 398 0.11
Kato Sangyo Co Ltd 800 16 594 17 989 0
Kawasaki Heavy Industries Ltd 27 000 104 597 102 878 0.01
Kawasaki Kisen Kaisha Ltd 32 000 72 605 66 650 0
KDDI Corp 64 165 2 729 800 3 913 051 0.18
Keikyu Corp 3 000 28 698 26 948 0
Keio Corp 6 000 44 044 47 026 0
Keisei Electric Railway Co Ltd 8 000 81 723 79 602 0
Keiyo Bank Ltd/The 5 000 25 961 25 270 0
Kewpie Corp 4 500 71 350 73 160 0
Keyence Corp 9 100 2 536 280 3 964 996 0.18
Kikkoman Corp 3 000 60 393 62 336 0
Kinden Corp 29 000 227 612 281 683 0.01

STANLIB Funds Limited
Portfolio Statement (continued)
STANLIB Multi-Manager Global Equity Fund (continued)
As at 30 June 2014
111
Nominal holding Cost Market Value % of Net AssetsUSD USD
Japan (continued)Kintetsu Corp 23 000 86 028 83 778 0
Kirin Holdings Co Ltd 73 000 1 088 549 1 053 514 0.05
Kobe Steel Ltd 103 000 173 557 153 522 0.01
Koito Manufacturing Co Ltd 1 000 17 934 25 576 0
Komatsu Ltd 14 800 358 934 343 465 0.02
Konami Corp 1 000 24 167 22 072 0
Konica Minolta Inc 11 000 94 340 108 583 0.01
K's Holdings Corp 1 600 46 002 46 324 0
Kubota Corp 7 000 104 107 99 225 0.01
Kuraray Co Ltd 6 700 80 687 84 722 0
Kurita Water Industries Ltd 1 500 32 111 34 737 0
KYB Co Ltd 2 000 12 632 9 397 0
Kyocera Corp 3 800 205 605 180 313 0.01
Kyoritsu Maintenance Co Ltd 2 400 89 444 99 738 0.01
Kyowa Exeo Corp 4 800 65 273 68 182 0
Kyowa Hakko Kirin Co Ltd 3 000 30 329 40 600 0
Kyushu Electric Power Co Inc 9 600 137 116 108 125 0.01
Lawson Inc 1 600 116 227 119 876 0.01
Leopalace21 Corp 3 000 21 083 15 429 0
Lintec Corp 4 400 85 387 88 256 0
Lion Corp 3 000 18 336 17 383 0
LIXIL Group Corp 23 700 573 579 638 675 0.03
M3 Inc 4 800 61 166 76 332 0
Mabuchi Motor Co Ltd 1 500 89 512 113 420 0.01
Maeda Road Construction Co Ltd 4 000 69 916 69 098 0
Makita Corp 2 100 118 637 129 559 0.01
Mandom Corp 2 500 85 683 88 841 0.01
Marubeni Corp 282 000 2 086 473 2 057 134 0.09
Maruha Nichiro Corp 1 400 26 644 22 830 0
Marui Group Co Ltd 58 000 576 890 555 924 0.03
Matsumotokiyoshi Holdings Co Ltd 2 900 92 324 100 049 0.01
Mazda Motor Corp 29 000 127 396 135 975 0.01
McDonald's Holdings Co Japan Ltd 600 15 920 16 809 0
Medipal Holdings Corp 6 200 75 444 87 763 0
Megmilk Snow Brand Co Ltd 1 300 19 060 16 862 0
MEIJI Holdings Co Ltd 1 400 77 535 92 730 0.01
Message Co Ltd 1 300 36 610 49 405 0
Minebea Co Ltd 5 000 23 109 56 069 0
Miraca Holdings Inc 1 000 46 228 48 418 0
Mirait Holdings Corp 6 700 63 970 66 997 0
Mitsubishi Chemical Holdings Corp 62 500 287 625 276 394 0.01
Mitsubishi Corp 122 900 2 417 802 2 552 510 0.11
Mitsubishi Electric Corp 32 000 354 277 394 531 0.02
Mitsubishi Estate Co Ltd 31 000 777 766 765 018 0.04
Mitsubishi Gas Chemical Co Inc 8 000 61 776 51 094 0
Mitsubishi Heavy Industries Ltd 193 000 1 134 473 1 204 050 0.05
Mitsubishi Logistics Corp 24 000 347 946 358 915 0.02
Mitsubishi Materials Corp 36 000 138 509 126 155 0.01
Mitsubishi Motors Corp 21 600 236 570 238 164 0.01
Mitsubishi Shokuhin Co Ltd 2 400 61 149 60 293 0
Mitsubishi Tanabe Pharma Corp 3 000 42 080 44 894 0
Mitsubishi UFJ Financial Group Inc 663 800 4 111 194 4 062 522 0.18
Mitsubishi UFJ Lease & Finance Co Ltd 11 600 58 984 66 642 0
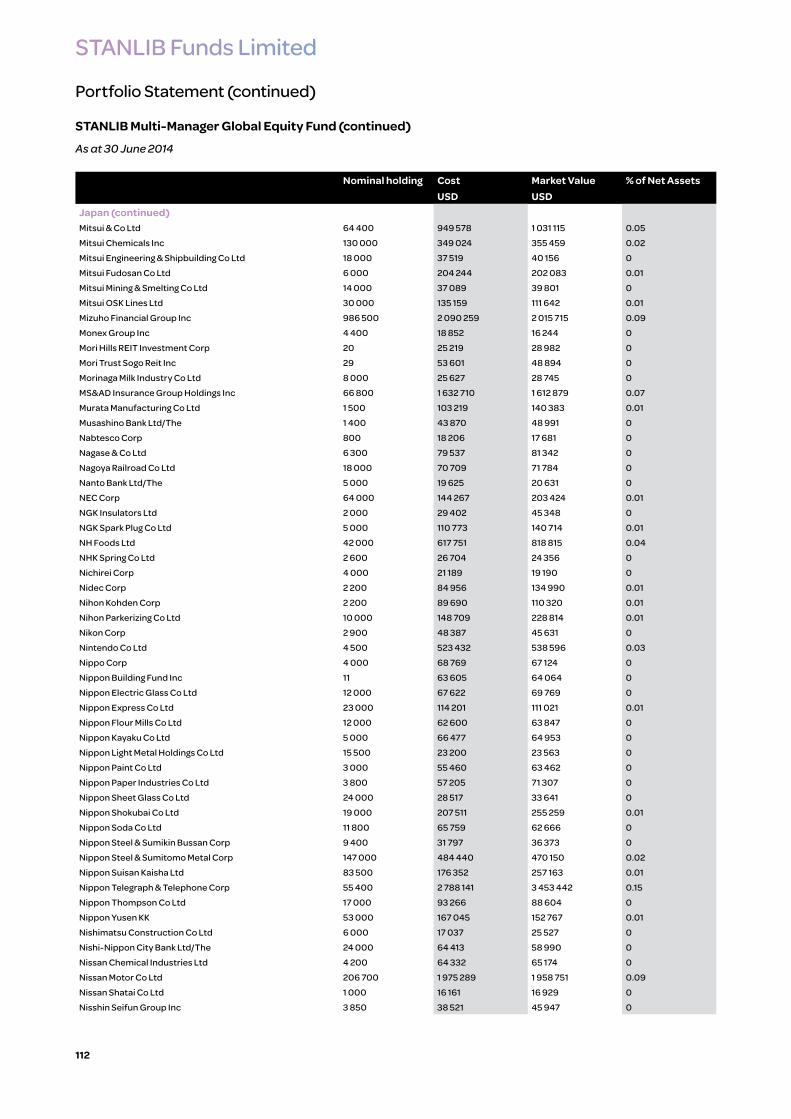
STANLIB Funds Limited
Portfolio Statement (continued)
STANLIB Multi-Manager Global Equity Fund (continued)
As at 30 June 2014
112
Nominal holding Cost Market Value % of Net AssetsUSD USD
Japan (continued)Mitsui & Co Ltd 64 400 949 578 1 031 115 0.05
Mitsui Chemicals Inc 130 000 349 024 355 459 0.02
Mitsui Engineering & Shipbuilding Co Ltd 18 000 37 519 40 156 0
Mitsui Fudosan Co Ltd 6 000 204 244 202 083 0.01
Mitsui Mining & Smelting Co Ltd 14 000 37 089 39 801 0
Mitsui OSK Lines Ltd 30 000 135 159 111 642 0.01
Mizuho Financial Group Inc 986 500 2 090 259 2 015 715 0.09
Monex Group Inc 4 400 18 852 16 244 0
Mori Hills REIT Investment Corp 20 25 219 28 982 0
Mori Trust Sogo Reit Inc 29 53 601 48 894 0
Morinaga Milk Industry Co Ltd 8 000 25 627 28 745 0
MS&AD Insurance Group Holdings Inc 66 800 1 632 710 1 612 879 0.07
Murata Manufacturing Co Ltd 1 500 103 219 140 383 0.01
Musashino Bank Ltd/The 1 400 43 870 48 991 0
Nabtesco Corp 800 18 206 17 681 0
Nagase & Co Ltd 6 300 79 537 81 342 0
Nagoya Railroad Co Ltd 18 000 70 709 71 784 0
Nanto Bank Ltd/The 5 000 19 625 20 631 0
NEC Corp 64 000 144 267 203 424 0.01
NGK Insulators Ltd 2 000 29 402 45 348 0
NGK Spark Plug Co Ltd 5 000 110 773 140 714 0.01
NH Foods Ltd 42 000 617 751 818 815 0.04
NHK Spring Co Ltd 2 600 26 704 24 356 0
Nichirei Corp 4 000 21 189 19 190 0
Nidec Corp 2 200 84 956 134 990 0.01
Nihon Kohden Corp 2 200 89 690 110 320 0.01
Nihon Parkerizing Co Ltd 10 000 148 709 228 814 0.01
Nikon Corp 2 900 48 387 45 631 0
Nintendo Co Ltd 4 500 523 432 538 596 0.03
Nippo Corp 4 000 68 769 67 124 0
Nippon Building Fund Inc 11 63 605 64 064 0
Nippon Electric Glass Co Ltd 12 000 67 622 69 769 0
Nippon Express Co Ltd 23 000 114 201 111 021 0.01
Nippon Flour Mills Co Ltd 12 000 62 600 63 847 0
Nippon Kayaku Co Ltd 5 000 66 477 64 953 0
Nippon Light Metal Holdings Co Ltd 15 500 23 200 23 563 0
Nippon Paint Co Ltd 3 000 55 460 63 462 0
Nippon Paper Industries Co Ltd 3 800 57 205 71 307 0
Nippon Sheet Glass Co Ltd 24 000 28 517 33 641 0
Nippon Shokubai Co Ltd 19 000 207 511 255 259 0.01
Nippon Soda Co Ltd 11 800 65 759 62 666 0
Nippon Steel & Sumikin Bussan Corp 9 400 31 797 36 373 0
Nippon Steel & Sumitomo Metal Corp 147 000 484 440 470 150 0.02
Nippon Suisan Kaisha Ltd 83 500 176 352 257 163 0.01
Nippon Telegraph & Telephone Corp 55 400 2 788 141 3 453 442 0.15
Nippon Thompson Co Ltd 17 000 93 266 88 604 0
Nippon Yusen KK 53 000 167 045 152 767 0.01
Nishimatsu Construction Co Ltd 6 000 17 037 25 527 0
Nishi-Nippon City Bank Ltd/The 24 000 64 413 58 990 0
Nissan Chemical Industries Ltd 4 200 64 332 65 174 0
Nissan Motor Co Ltd 206 700 1 975 289 1 958 751 0.09
Nissan Shatai Co Ltd 1 000 16 161 16 929 0
Nisshin Seifun Group Inc 3 850 38 521 45 947 0

STANLIB Funds Limited
Portfolio Statement (continued)
STANLIB Multi-Manager Global Equity Fund (continued)
As at 30 June 2014
113
Nominal holding Cost Market Value % of Net AssetsUSD USD
Japan (continued)Nisshin Steel Co Ltd 5 600 72 595 74 018 0
Nisshinbo Holdings Inc 8 000 75 451 80 154 0
Nissin Foods Holdings Co Ltd 2 300 98 616 118 286 0.01
Nitori Holdings Co Ltd 2 450 113 408 133 740 0.01
Nitto Denko Corp 2 300 127 997 107 752 0.01
NKSJ Holdings Inc 28 750 724 613 774 197 0.04
NOK Corp 4 000 71 003 80 233 0
Nomura Holdings Inc 48 700 362 886 344 679 0.02
Nomura Real Estate Holdings Inc 3 700 77 656 69 979 0
Nomura Research Institute Ltd 1 500 51 235 47 160 0
North Pacific Bank Ltd 15 800 66 661 68 000 0
NSK Ltd 22 000 235 943 286 007 0.01
NTN Corp 8 000 35 444 34 826 0
NTT Data Corp 27 602 903 811 1 058 523 0.05
NTT DOCOMO Inc 28 600 467 042 488 688 0.02
NTT Urban Development Corp 4 500 59 541 50 595 0
Nuflare Technology Inc 1 900 226 270 104 467 0.01
Obayashi Corp 160 000 864 892 1 141 904 0.05
Obic Co Ltd 14 840 330 739 489 270 0.02
Odakyu Electric Railway Co Ltd 7 000 69 185 67 233 0
Ogaki Kyoritsu Bank Ltd/The 7 000 19 666 19 624 0
Ohsho Food Service Corp 1 100 35 725 48 645 0
Oita Bank Ltd/The 6 000 19 232 21 677 0
Oji Holdings Corp 23 000 98 280 94 447 0.01
Okinawa Cellular Telephone Co 8 100 170 437 217 562 0.01
Okinawa Electric Power Co Inc/The 2 700 90 406 95 815 0.01
Olympus Corp 3 700 114 899 127 466 0.01
Omron Corp 1 800 63 566 75 692 0
Ono Pharmaceutical Co Ltd 700 43 983 61 636 0
Onward Holdings Co Ltd 47 000 419 498 336 360 0.02
Oriental Land Co Ltd/Japan 800 124 090 136 894 0.01
ORIX Corp 19 480 300 223 322 472 0.02
Osaka Gas Co Ltd 42 000 175 877 176 614 0.01
Otsuka Corp 2 400 98 667 116 203 0.01
Otsuka Holdings Co Ltd 16 100 505 236 498 710 0.02
Paltac Corp 1 300 17 686 18 286 0
Panasonic Corp 41 900 393 718 509 973 0.02
Rakuten Inc 5 999 80 335 77 515 0
Relo Holdings Inc 800 42 777 51 409 0
Rengo Co Ltd 5 000 26 181 23 839 0
Resona Holdings Inc 270 400 1 395 619 1 572 133 0.07
Ricoh Co Ltd 11 000 126 804 130 843 0.01
Rinnai Corp 1 200 95 227 115 848 0.01
Rohm Co Ltd 1 500 58 000 86 027 0
Ryohin Keikaku Co Ltd 1 000 92 714 113 321 0.01
San-Ai Oil Co Ltd 5 000 21 277 37 609 0
San-In Godo Bank Ltd/The 5 000 39 772 37 116 0
Sankyo Co Ltd 2 500 106 528 95 997 0.01
Sankyu Inc 6 000 18 888 30 383 0
Sanrio Co Ltd 2 100 86 375 60 924 0
Santen Pharmaceutical Co Ltd 900 40 728 50 550 0
Sapporo Holdings Ltd 6 000 23 522 24 106 0
Sawai Pharmaceutical Co Ltd 1 300 81 435 76 482 0

STANLIB Funds Limited
Portfolio Statement (continued)
STANLIB Multi-Manager Global Equity Fund (continued)
As at 30 June 2014
114
Nominal holding Cost Market Value % of Net AssetsUSD USD
Japan (continued)SBI Holdings Inc/Japan 5 499 67 717 67 309 0
SCSK Corp 3 100 87 428 87 304 0
Secom Co Ltd 35 600 1 863 279 2 174 900 0.1
Sega Sammy Holdings Inc 20 700 462 638 406 827 0.02
Seiko Epson Corp 2 500 37 962 106 115 0.01
Seino Holdings Co Ltd 4 000 40 963 45 328 0
Sekisui Chemical Co Ltd 6 000 58 846 69 355 0
Sekisui House Ltd 74 300 947 140 1 018 735 0.05
Seven & I Holdings Co Ltd 51 900 1 763 246 2 185 021 0.1
Seven Bank Ltd 5 300 17 345 21 660 0
Sharp Corp/Japan 30 000 108 806 95 949 0.01
Shiga Bank Ltd/The 5 000 27 161 30 107 0
Shikoku Electric Power Co Inc 3 400 55 712 47 356 0
Shimachu Co Ltd 2 800 64 072 66 694 0
Shimadzu Corp 3 000 28 305 27 482 0
Shimamura Co Ltd 1 100 100 799 108 149 0.01
Shimano Inc 500 41 844 55 476 0
Shimizu Corp 106 000 424 765 749 187 0.03
Shin-Etsu Chemical Co Ltd 153 200 8 740 219 9 304 970 0.42
Shinsei Bank Ltd 38 000 81 793 85 150 0
Shionogi & Co Ltd 2 700 54 144 56 316 0
Ship Healthcare Holdings Inc 2 300 64 910 80 371 0
Shiseido Co Ltd 27 500 413 843 500 838 0.02
Shizuoka Bank Ltd/The 14 000 153 740 151 325 0.01
Showa Denko KK 43 000 56 721 60 699 0
Showa Shell Sekiyu KK 8 500 94 132 96 407 0.01
SKY Perfect JSAT Holdings Inc 13 270 74 031 77 809 0
SMC Corp/Japan 3 100 604 426 829 431 0.04
SoftBank Corp 26 700 1 186 385 1 986 456 0.09
Sohgo Security Services Co Ltd 2 700 60 569 64 765 0
Sojitz Corp 112 500 215 376 197 674 0.01
Sony Corp 33 000 655 584 547 909 0.03
Sony Financial Holdings Inc 2 500 45 866 42 570 0
Sotetsu Holdings Inc 5 000 19 434 19 200 0
Stanley Electric Co Ltd 179 900 4 140 883 4 684 632 0.21
Sugi Holdings Co Ltd 2 200 87 496 100 113 0.01
Sumitomo Chemical Co Ltd 253 000 981 346 956 517 0.04
Sumitomo Corp 51 900 689 054 699 820 0.03
Sumitomo Dainippon Pharma Co Ltd 1 500 19 031 17 250 0
Sumitomo Electric Industries Ltd 63 300 803 675 890 403 0.04
Sumitomo Forestry Co Ltd 44 700 511 281 544 491 0.03
Sumitomo Heavy Industries Ltd 12 000 58 000 56 976 0
Sumitomo Metal Mining Co Ltd 10 000 137 120 162 282 0.01
Sumitomo Mitsui Financial Group Inc 240 100 10 284 447 10 049 097 0.45
Sumitomo Mitsui Trust Holdings Inc 92 000 427 142 419 566 0.02
Sumitomo Osaka Cement Co Ltd 6 000 23 381 22 802 0
Sumitomo Real Estate Sales Co Ltd 2 800 85 004 89 275 0.01
Sumitomo Realty & Development Co Ltd 2 000 95 156 85 781 0
Sumitomo Rubber Industries Ltd 2 700 40 537 38 966 0
Sundrug Co Ltd 2 000 83 871 88 841 0
Suruga Bank Ltd 17 000 198 319 329 747 0.02
Suzuken Co Ltd/Aichi Japan 2 500 82 349 93 036 0.01
Suzuki Motor Corp 5 400 121 256 169 135 0.01

STANLIB Funds Limited
Portfolio Statement (continued)
STANLIB Multi-Manager Global Equity Fund (continued)
As at 30 June 2014
115
Nominal holding Cost Market Value % of Net AssetsUSD USD
Japan (continued)Sysmex Corp 3 000 85 164 112 383 0.01
T&D Holdings Inc 14 300 187 828 194 374 0.01
Taiheiyo Cement Corp 15 000 62 229 60 411 0
Taisei Corp 16 000 82 972 88 446 0
Taisho Pharmaceutical Holdings Co Ltd 1 400 100 083 101 989 0.01
Taiyo Nippon Sanso Corp 38 000 241 981 336 467 0.02
Takashimaya Co Ltd 5 000 46 974 48 517 0
Takata Corp 2 900 65 383 62 291 0
Takeda Pharmaceutical Co Ltd 8 700 407 085 403 289 0.02
TDK Corp 2 400 90 746 112 413 0.01
Teijin Ltd 32 000 76 198 79 917 0
Terumo Corp 2 400 58 541 53 612 0
THK Co Ltd 9 700 174 542 228 460 0.01
Toagosei Co Ltd 4 000 16 527 17 966 0
Tobu Railway Co Ltd 16 000 85 232 83 550 0
Toho Bank Ltd/The 5 000 15 284 18 213 0
Toho Co Ltd/Tokyo 3 200 70 785 74 989 0
Toho Gas Co Ltd 7 000 35 314 38 350 0
Toho Holdings Co Ltd 1 400 24 303 28 192 0
Tohoku Electric Power Co Inc 12 400 143 297 145 292 0.01
Tokai Rika Co Ltd 3 200 63 436 64 123 0
Tokio Marine Holdings Inc 14 200 469 154 466 909 0.02
Tokuyama Corp 8 000 31 078 25 270 0
Tokyo Electric Power Co Inc 66 100 317 136 275 346 0.01
Tokyo Electron Ltd 1 600 68 328 108 078 0.01
Tokyo Gas Co Ltd 180 000 937 740 1 050 102 0.05
Tokyo Ohka Kogyo Co Ltd 7 100 146 231 169 326 0.01
Tokyo Tatemono Co Ltd 2 000 18 548 18 459 0
Tokyu Corp 19 000 137 052 134 474 0.01
Tokyu Fudosan Holdings Corp 7 000 56 293 55 140 0
Tokyu REIT Inc 15 17 098 20 922 0
TOMONY Holdings Inc 9 900 37 132 43 488 0
TonenGeneral Sekiyu KK 15 000 140 442 142 441 0.01
Toppan Printing Co Ltd 18 000 142 331 138 947 0.01
Toray Industries Inc 28 000 179 219 184 078 0.01
Toshiba Corp 118 000 506 973 549 786 0.03
Toshiba Plant Systems & Services Corp 12 000 178 896 178 392 0.01
Tosoh Corp 11 000 43 309 53 206 0
TOTO Ltd 3 000 41 567 40 423 0
Towa Pharmaceutical Co Ltd 1 800 87 037 73 205 0
Toyo Ink SC Holdings Co Ltd 3 000 14 893 14 747 0
Toyo Seikan Group Holdings Ltd 39 800 583 556 610 130 0.03
Toyo Suisan Kaisha Ltd 30 000 896 453 925 422 0.04
Toyo Tire & Rubber Co Ltd 1 500 16 436 25 512 0
Toyobo Co Ltd 14 000 24 084 24 185 0
Toyoda Gosei Co Ltd 3 500 75 790 72 622 0
Toyota Boshoku Corp 5 900 66 650 62 375 0
Toyota Industries Corp 19 200 834 052 989 330 0.05
Toyota Motor Corp 165 300 9 468 958 9 927 306 0.44
Toyota Tsusho Corp 8 600 231 856 247 036 0.01
Trend Micro Inc/Japan 14 800 448 584 487 222 0.02
TS Tech Co Ltd 2 700 89 899 78 491 0
Tsumura & Co 3 300 89 281 77 789 0

STANLIB Funds Limited
Portfolio Statement (continued)
STANLIB Multi-Manager Global Equity Fund (continued)
As at 30 June 2014
116
Nominal holding Cost Market Value % of Net AssetsUSD USD
Japan (continued)Tsuruha Holdings Inc 900 42 208 49 573 0
Tsutsumi Jewelry Co Ltd 3 400 89 615 83 569 0
Ube Industries Ltd/Japan 27 000 49 753 46 907 0
Unicharm Corp 15 400 910 520 916 354 0.04
Unipres Corp 2 800 65 118 67 302 0
United Arrows Ltd 2 400 82 026 96 422 0.01
UNY Group Holdings Co Ltd 8 200 54 093 51 238 0
Ushio Inc 4 900 60 763 63 121 0
USS Co Ltd 68 720 869 431 1 172 865 0.05
West Japan Railway Co 20 860 882 690 918 165 0.04
Yahoo Japan Corp 4 500 22 906 20 744 0
Yakult Honsha Co Ltd 900 43 046 45 575 0
Yamada Denki Co Ltd 104 800 390 988 373 455 0.02
Yamaguchi Financial Group Inc 8 000 77 621 84 182 0
Yamaha Corp 4 900 73 269 77 390 0
Yamaha Motor Co Ltd 4 200 60 012 72 263 0
Yamanashi Chuo Bank Ltd/The 4 000 16 534 18 913 0
Yamato Holdings Co Ltd 66 100 1 221 260 1 368 263 0.06
Yamato Kogyo Co Ltd 2 800 86 945 82 061 0
Yamazaki Baking Co Ltd 3 000 32 283 37 402 0
Yaoko Co Ltd 1 300 61 526 68 269 0
Yaskawa Electric Corp 5 000 62 906 60 461 0
Yokogawa Electric Corp 1 600 22 282 20 232 0
Yokohama Rubber Co Ltd/The 3 000 27 339 25 942 0
Zeon Corp 7 000 77 782 74 834 0
Total Japan 7.71% (31 December 2013: 7.99%) 173 088 342 7.71
JerseyDelphi Automotive Plc 29 900 1 628 129 2 054 728 0.09
Experian Plc 36 272 589 148 612 754 0.03
Glencore Plc 476 774 2 606 419 2 653 533 0.12
Petrofac Ltd 7 699 171 901 158 233 0.01
Randgold Resources Ltd 2 964 228 241 246 964 0.01
Regus Plc 59 700 93 853 184 861 0.01
Shire Plc 3 248 127 702 253 799 0.01
UBM Plc 6 481 75 734 73 748 0
Wolseley Plc 60 111 3 440 105 3 292 069 0.14
WPP Plc 120 786 2 074 749 2 631 142 0.12
Total Jersey 0.54% (31 December 2013: 0.42%) 12 161 831 0.54
Korea, Republic of (South Korea)CJ Corp 2 100 294 517 290 571 0.01
Dae Han Flour Mills Co Ltd 1 800 303 155 305 100 0.01
E-Mart Co Ltd 1 318 291 566 301 559 0.01
GS Holdings 7 200 312 066 320 933 0.02
GS Home Shopping Inc 1 200 289 791 285 353 0.01
GS Retail Co Ltd 6 153 150 697 150 511 0.01
Hana Financial Group Inc 38 428 1 360 290 1 420 445 0.06
Hankook Shell Oil Co Ltd 343 151 497 150 855 0.01
Hankook Tire Co Ltd 4 900 294 609 291 540 0.01
Hyundai Heavy Industries Co Ltd 1 915 457 416 335 002 0.02
Hyundai Mobis 4 186 1 160 589 1 172 891 0.05
Hyundai Motor Co 9 477 1 975 142 2 144 923 0.1
KB Financial Group Inc 28 343 1 027 105 984 639 0.05
KCC Corp 531 210 134 323 281 0.02

STANLIB Funds Limited
Portfolio Statement (continued)
STANLIB Multi-Manager Global Equity Fund (continued)
As at 30 June 2014
117
Nominal holding Cost Market Value % of Net AssetsUSD USD
Korea, Republic of (South Korea) (continued)KEPCO Plant Service & Engineering Co Ltd 4 447 212 477 303 704 0.01
Kolon Industries Inc 8 948 462 631 628 783 0.03
Korea Gas Corp 5 300 288 972 289 148 0.01
Korea Zinc Co Ltd 829 249 356 324 865 0.02
Korean Reinsurance Co 10 067 110 704 103 476 0.01
KT&G Corp 3 400 296 368 299 407 0.01
Kyungbang Ltd 416 46 831 47 488 0
LG Chem Ltd 1 034 297 245 302 494 0.01
LG Corp 4 900 303 903 302 194 0.01
LG Hausys Ltd 1 500 279 690 286 865 0.01
LG Uplus Corp 40 040 378 937 364 864 0.02
Lotte Shopping Co Ltd 3 482 1 129 723 1 059 949 0.05
LS Corp 4 100 300 673 300 672 0.01
Namyang Dairy Products Co Ltd 281 224 227 224 400 0.01
NAVER Corp 413 198 564 340 017 0.02
NongShim Co Ltd 1 000 281 612 281 676 0.01
POSCO 3 180 969 033 950 731 0.04
POSCO Chemtech Co Ltd 1 080 123 922 169 717 0.01
S-1 Corp 8 337 485 714 669 893 0.03
Samsung Electro-Mechanics Co Ltd 5 200 299 927 299 110 0.01
Samsung Electronics Co Ltd 3 796 4 643 465 4 956 035 0.22
Samsung Electronics Co Ltd (REGs) 1 078 691 633 695 849 0.03
Samsung Electronics Co Ltd GDR 18 168 5 336 047 9 501 864 0.42
Samsung Fire & Marine Insurance Co Ltd 1 189 267 184 302 597 0.01
Samsung SDI Co Ltd 1 800 267 917 287 310 0.01
SeAH Holdings Corp 518 79 111 79 353 0
Shinhan Financial Group Co Ltd 41 390 1 610 462 1 904 234 0.09
SK Holdings Co Ltd 2 775 503 142 499 160 0.02
SK Hynix Inc 6 700 319 694 321 160 0.02
SK Innovation Co Ltd 5 300 665 970 589 296 0.03
Total Korea, Republic of (South Korea) 1.57% (31 December 2013: 1.81%)
35 163 914 1.57
LiberiaRoyal Caribbean Cruises Ltd 30 600 1 136 444 1 700 748 0.08
Total Liberia 0.08% (31 December 2013: 0.06%) 1 700 748 0.08
LuxembourgArcelorMittal 63 865 921 093 946 537 0.04
Eurofins Scientific SE 1 409 186 524 432 412 0.02
GAGFAH SA 17 300 272 620 314 078 0.01
Millicom International Cellular SA 98 635 8 888 800 9 007 249 0.4
O'Key Group SA 28 262 243 406 258 880 0.01
Oriflame Cosmetics SA 3 366 113 173 78 393 0
Samsonite International SA 18 900 51 723 62 306 0
SES SA 425 585 11 294 521 16 076 303 0.72
Subsea 7 SA 5 200 100 658 96 945 0.01
Tenaris SA ADR 250 000 9 213 620 11 790 000 0.53
Tenaris SA 5 563 130 947 130 928 0.01
Total Luxembourg 1.75% (31 December 2013: 1.65%) 39 194 031 1.75
MalaysiaAirAsia BHD 697 800 638 049 495 508 0.02
IJM Corp Bhd 64 400 114 888 134 177 0.01
Kuala Lumpur Kepong Bhd 71 500 484 836 538 416 0.02
Malayan Banking Bhd 280 700 844 436 859 307 0.04

STANLIB Funds Limited
Portfolio Statement (continued)
STANLIB Multi-Manager Global Equity Fund (continued)
As at 30 June 2014
118
Nominal holding Cost Market Value % of Net AssetsUSD USD
Malaysia (continued)Petronas Gas Bhd 74 600 486 830 566 871 0.03
Public Bank Bhd 88 800 483 887 540 925 0.02
Total Malaysia 0.14% (31 December 2013: 0.12%) 3 135 204 0.14
MaltaUnibet Group Plc 1 589 58 043 78 673 0
Total Malta 0.00% (31 December 2013: 0.00%) 78 673 0
MauritiusGolden Agri-Resources Ltd 208 000 91 248 92 602 0
Total Mauritius 0.00% (31 December 2013: 0.00%) 92 602 0
MexicoAmerica Movil SAB de CV 35 875 706 188 744 406 0.03
America Movil SAB de CV Series C 764 100 765 564 792 219 0.03
Banregio Grupo Financiero SAB de CV 30 100 177 612 178 424 0.01
Bolsa Mexicana de Valores SAB de CV 101 900 205 183 215 926 0.01
Corp GEO SAB de CV 21 300 2 726 2 726 0
Fomento Economico Mexicano SAB de CV 18 800 190 950 175 959 0.01
Fomento Economico Mexicano SAB de CV ADR 74 400 5 604 266 6 967 560 0.31
Grupo Comercial Chedraui SA de CV 231 600 811 306 816 575 0.04
Grupo Financiero Banorte SAB de CV 28 700 188 954 205 280 0.01
Grupo Financiero Interacciones SA de CV 24 900 179 282 180 403 0.01
Grupo Simec SAB de CV 38 600 180 731 178 733 0.01
Grupo Televisa SAB 49 500 278 069 339 476 0.01
Industrias CH SAB de CV 30 900 180 662 174 758 0.01
Industrias Penoles SAB de CV 10 300 270 560 257 251 0.01
Promotora y Operadora de Infraestructura SAB de CV 12 900 176 893 172 116 0.01
Total Mexico 0.51% (31 December 2013: 0.51%) 11 401 812 0.51
NetherlandsAccell Group 2 800 54 050 53 900 0
Aegon NV 57 578 449 065 502 478 0.02
AerCap Holdings NV 3 500 49 817 160 300 0.01
Airbus Group NV 21 424 1 428 399 1 435 382 0.06
Akzo Nobel NV 6 712 496 268 502 583 0.02
ASML Holding NV 30 001 1 891 138 2 793 549 0.13
ASML Holding NV NY 2 894 193 218 269 924 0.01
Brunel International NV 1 838 48 534 53 639 0
Core Laboratories NV 400 66 001 66 820 0
Corio NV 1 774 73 587 90 584 0.01
Delta Lloyd NV 2 900 72 803 73 593 0
Eurocommercial Properties NV 1 824 72 675 89 928 0.01
Fugro NV 3 821 244 423 218 728 0.01
Gemalto NV 13 348 1 171 337 1 382 707 0.06
Heineken Holding NV 1 610 98 626 105 499 0.01
Heineken NV 14 683 870 421 1 053 602 0.05
ING Groep NV 94 636 1 159 766 1 328 737 0.06
Koninklijke Ahold NV 42 805 770 545 803 197 0.04
Koninklijke Boskalis Westminster NV 18 558 677 517 1 064 108 0.05
Koninklijke DSM NV 13 755 909 816 1 001 137 0.05
Koninklijke KPN NV 197 541 634 738 719 425 0.03
Koninklijke Philips NV 130 642 4 257 254 4 145 245 0.19
Koninklijke Vopak NV 1 227 72 674 59 974 0
LyondellBasell Industries NV 5 500 394 042 536 965 0.02
Nielsen NV 55 700 1 891 815 2 695 880 0.12
Nutreco NV 1 475 72 251 65 078 0

STANLIB Funds Limited
Portfolio Statement (continued)
STANLIB Multi-Manager Global Equity Fund (continued)
As at 30 June 2014
119
Nominal holding Cost Market Value % of Net AssetsUSD USD
Netherlands (continued)OCI 1 870 75 202 72 968 0
PostNL NV 11 590 57 535 54 714 0
Randstad Holding NV 3 735 175 849 202 427 0.01
Reed Elsevier NV 5 241 102 935 120 156 0.01
Royal Dutch Shell Plc A shares 17 884 556 622 739 591 0.03
Sensata Technologies Holding NV 1 500 57 768 70 170 0
TNT Express NV 7 500 66 419 67 875 0
Unilever NV 170 003 6 794 919 7 431 953 0.33
Vastned Retail NV 1 662 73 427 84 626 0
Vistaprint NV 1 000 54 668 40 410 0
Wolters Kluwer NV 3 381 83 197 100 057 0.01
Total Netherlands 1.35% (31 December 2013: 1.47%) 30 257 909 1.35
New ZealandTelecom Corp of New Zealand Ltd 1 685 710 3 712 039 3 940 853 0.18
Total New Zealand 0.18% (31 December 2013: 0.02%) 3 940 853 0.18
NorwayAker ASA 1 311 43 725 51 489 0
Aker Solutions ASA 14 500 243 194 251 894 0.01
DNB ASA 57 262 856 281 1 046 079 0.05
Fred Olsen Energy ASA 1 932 96 115 54 658 0
Leroy Seafood Group ASA 3 722 98 038 135 868 0.01
Norsk Hydro ASA 24 100 120 463 128 937 0.01
Norwegian Air Shuttle AS 2 498 97 235 81 987 0
Opera Software ASA 4 300 57 834 57 216 0
Orkla ASA 9 700 74 881 86 388 0
Schibsted ASA 7 866 361 222 409 432 0.02
Statoil ASA 193 792 5 258 839 5 949 899 0.27
Storebrand ASA 10 900 62 345 61 337 0
Telenor ASA 9 726 217 352 221 266 0.01
TGS Nopec Geophysical Co ASA 2 975 95 810 95 025 0
Yara International ASA 3 921 160 796 196 360 0.01
Total Norway 0.39% (31 December 2013: 0.19%) 8 827 835 0.39
PanamaCarnival Corp 5 800 215 673 218 312 0.01
Norstar Holdings Inc 3 381 98 626 101 270 0
Total Panama 0.01% (31 December 2013: 0.03%) 319 582 0.01
Papua New GuineaOil Search Ltd 144 409 1 032 320 1 316 678 0.06
Total Papua New Guinea 0.06% (31 December 2013: 0.04%) 1 316 678 0.06
PhilippinesCebu Air Inc 59 800 94 640 78 087 0
Energy Development Corp 6 493 200 976 755 936 969 0.04
Lopez Holdings Corp 1 979 154 212 482 242 050 0.01
Robinsons Land Corp 321 500 162 924 173 835 0.01
Total Philippines 0.06% (31 December 2013: 0.05%) 1 430 941 0.06
PolandBank Pekao SA 13 038 717 329 743 630 0.03
KGHM Polska Miedz SA 21 900 839 772 896 424 0.04
Powszechna Kasa Oszczednosci Bank Polski SA 4 900 69 691 60 833 0
Warsaw Stock Exchange 8 200 103 761 103 691 0.01
Total Poland 0.08% (31 December 2013: 0.08%) 1 804 578 0.08
PortugalEDP - Energias de Portugal SA 294 240 1 410 205 1 471 229 0.06

STANLIB Funds Limited
Portfolio Statement (continued)
STANLIB Multi-Manager Global Equity Fund (continued)
As at 30 June 2014
120
Nominal holding Cost Market Value % of Net AssetsUSD USD
Portugal (continued)Jeronimo Martins SGPS SA 9 290 191 140 152 759 0.01
NOS SGPS 22 800 167 317 148 747 0.01
Semapa-Sociedade de Investimento e Gestao 11 800 166 686 166 083 0.01
Total Portugal 0.09% (31 December 2013: 0.07%) 1 938 818 0.09
RussiaGazprom OAO 359 682 3 180 855 3 132 830 0.14
LSR Group 8 583 35 230 33 499 0
Lukoil OAO 23 728 1 488 167 1 419 409 0.06
Lukoil OAO U.S 2 300 138 429 137 333 0.01
Magnit OJSC GDR 16 730 1 050 507 986 234 0.04
Mobile Telesystems OJSC 65 000 1 130 187 1 281 800 0.06
NOVATEK OAO 13 229 1 778 182 1 645 688 0.07
Total Russia 0.38% (31 December 2013: 0.36%) 8 636 793 0.38
SingaporeAscendas Real Estate Investment Trust 1 733 000 3 092 498 3 183 348 0.14
Avago Technologies Ltd 14 300 628 325 1 030 458 0.05
CapitaLand Ltd 40 000 102 519 102 032 0.01
CapitaRetail China Trust 168 778 174 908 200 373 0.01
City Developments Ltd 457 000 3 533 007 3 750 096 0.17
DBS Group Holdings Ltd 93 573 1 211 782 1 257 237 0.06
Flextronics International Ltd 20 000 186 997 221 400 0.01
Great Eastern Holdings Ltd 47 000 494 231 823 760 0.04
Hutchison Port Holdings Trust 90 300 65 856 65 016 0
Jardine Cycle & Carriage Ltd 2 000 57 887 71 006 0
Keppel Corp Ltd 23 000 192 195 198 699 0.01
Keppel Land Ltd 34 000 101 086 92 181 0
M1 Ltd/Singapore 37 000 97 958 104 174 0.01
OUE Hospitality Trust 90 933 65 064 64 553 0
OUE Ltd 44 000 92 240 85 061 0
Oversea-Chinese Banking Corp Ltd 55 000 436 213 420 888 0.02
Raffles Medical Group Ltd 28 200 73 820 91 159 0
Sembcorp Industries Ltd 24 000 97 664 102 996 0.01
Sembcorp Marine Ltd 27 000 96 568 88 363 0
Singapore Airlines Ltd 12 000 95 054 99 722 0
Singapore Exchange Ltd 16 000 94 028 89 070 0
Singapore Press Holdings Ltd 30 000 94 604 100 347 0.01
Singapore Technologies Engineering Ltd 30 000 100 658 91 203 0
Singapore Telecommunications Ltd 941 000 2 661 677 2 898 468 0.13
StarHub Ltd 24 000 80 896 80 086 0
Super Group Ltd/Singapore 54 000 96 553 61 074 0
United Industrial Corp Ltd 25 000 26 655 66 980 0
United Overseas Bank Ltd 25 000 413 943 450 805 0.02
UOL Group Ltd 20 000 103 563 104 278 0.01
Venture Corp Ltd 16 000 95 785 98 696 0
Wilmar International Ltd 51 000 130 335 130 499 0.01
Total Singapore 0.72% (31 December 2013: 0.65%) 16 224 028 0.72
South AfricaAfrican Bank Investments Ltd 603 821 688 298 383 668 0.02
Anglo American Platinum Ltd 11 172 488 580 482 698 0.02
Anglo American Plc 14 818 378 365 362 484 0.02
Bidvest Group Ltd 18 584 486 416 493 091 0.02
Clicks Group Ltd 34 898 220 136 208 233 0.01
JSE Ltd 17 600 169 953 157 988 0.01

STANLIB Funds Limited
Portfolio Statement (continued)
STANLIB Multi-Manager Global Equity Fund (continued)
As at 30 June 2014
121
Nominal holding Cost Market Value % of Net AssetsUSD USD
South Africa (continued)Kumba Iron Ore Ltd 27 989 1 074 394 888 964 0.04
MTN Group Ltd 724 203 12 576 418 15 227 744 0.68
Nampak Ltd 107 900 374 821 372 827 0.02
Naspers Ltd 5 047 478 465 593 589 0.03
Old Mutual Plc 151 427 403 314 511 263 0.02
Pinnacle Holdings Ltd 83 100 187 281 105 446 0
Sasol Ltd 9 799 475 983 579 691 0.02
Standard Bank Group Ltd 37 580 460 275 512 193 0.02
Tiger Brands Ltd 16 014 488 828 461 570 0.02
Total South Africa 0.95% (31 December 2013: 0.87%) 21 341 449 0.95
SpainAcciona SA 5 372 347 793 480 430 0.02
Acerinox SA 26 285 309 515 465 683 0.02
ACS Actividades de Construccion y Servicios SA 4 457 138 250 203 815 0.01
Amadeus IT Holding SA 2 878 98 870 118 684 0
Banco Bilbao Vizcaya Argentaria SA 95 427 1 033 045 1 216 122 0.05
Banco de Sabadell SA 90 555 236 375 308 838 0.01
Banco Popular Espanol SA 28 756 162 921 192 130 0.01
Banco Santander SA 306 108 2 324 533 3 197 757 0.14
CaixaBank SA 34 400 213 389 212 179 0.01
Corp Financiera Alba SA 1 907 102 507 123 994 0.01
Ebro Foods SA 4 333 96 367 96 166 0
Enagas SA 4 152 98 002 133 590 0.01
Ferrovial SA 8 135 145 384 181 159 0.01
Fomento de Construcciones y Contratas SA 4 969 95 379 115 825 0
Gas Natural SDG SA 7 116 144 092 224 718 0.01
Grifols SA 2 324 96 958 126 989 0.01
Grupo Catalana Occidente SA 3 492 97 683 126 602 0.01
Iberdrola SA 123 799 708 857 946 307 0.04
Inditex SA 5 286 618 250 813 469 0.04
Liberbank SA 139 700 145 045 133 693 0.01
Mediaset Espana Comunicacion SA 44 968 394 023 523 940 0.02
Melia Hotels International SA 13 400 153 183 164 476 0.01
Obrascon Huarte Lain SA 2 567 96 171 112 625 0
Repsol SA 24 024 589 831 633 503 0.03
Telefonica SA 98 665 1 481 393 1 691 276 0.08
Viscofan SA 8 233 307 664 490 507 0.02
Total Spain 0.58% (31 December 2013: 0.63%) 13 034 477 0.58
SwedenAAK AB 1 349 86 959 90 056 0
AF AB 3 906 63 415 69 965 0
Assa Abloy AB 62 046 2 146 246 3 155 504 0.14
Atlas Copco AB - A Shares 244 701 6 341 980 7 067 944 0.32
Atlas Copco AB - B Shares 3 212 84 677 85 761 0
Axfood AB 1 350 64 361 73 282 0
Boliden AB 6 848 109 375 99 309 0.01
Castellum AB 6 700 90 361 118 660 0.01
Electrolux AB 3 869 105 376 97 805 0.01
Getinge AB 4 977 177 171 130 728 0.01
Hennes & Mauritz AB 98 367 3 885 226 4 296 434 0.19
Hexagon AB 2 093 63 387 67 436 0
Holmen AB 1 994 63 323 71 255 0
ICA Gruppen AB 2 002 62 860 68 157 0

STANLIB Funds Limited
Portfolio Statement (continued)
STANLIB Multi-Manager Global Equity Fund (continued)
As at 30 June 2014
122
Nominal holding Cost Market Value % of Net AssetsUSD USD
Sweden (continued)Industrivarden AB 3 373 62 913 66 347 0
Indutrade AB 2 036 90 688 94 866 0.01
Intrum Justitia AB 8 800 141 375 262 340 0.01
Investment AB Kinnevik 2 194 78 312 93 466 0
Investor AB 14 484 474 305 543 149 0.02
JM AB 2 226 63 482 82 543 0
Lundbergforetagen AB 1 508 62 736 72 520 0
Mekonomen AB 5 243 151 295 134 499 0.01
Modern Times Group AB 9 406 410 943 404 078 0.02
NCC AB 2 548 81 734 87 698 0
Nordea Bank AB 765 298 8 210 199 10 794 911 0.48
Sandvik AB 11 259 161 218 153 676 0.01
Securitas AB 6 423 73 215 76 140 0
Skandinaviska Enskilda Banken AB 23 907 259 079 319 340 0.02
Skanska AB 6 748 129 919 153 929 0.01
SKF AB 4 781 131 790 121 932 0.01
Svenska Cellulosa AB SCA 6 135 160 765 159 768 0.01
Svenska Handelsbanken AB 50 761 1 947 872 2 481 350 0.11
Swedbank AB 14 426 352 990 382 155 0.02
Swedish Match AB 31 648 1 132 004 1 097 800 0.05
Swedish Orphan Biovitrum AB 26 700 139 432 355 847 0.02
Tele2 AB 7 548 96 027 88 742 0
Telefonaktiebolaget LM Ericsson 574 390 6 692 927 6 933 577 0.31
TeliaSonera AB 39 146 290 027 285 805 0.01
Volvo AB 22 278 338 569 306 576 0.01
Total Sweden 1.83% (31 December 2013: 1.75%) 41 045 350 1.83
SwitzerlandABB Ltd 24 877 539 882 572 830 0.03
ACE Ltd 15 800 1 255 242 1 638 144 0.07
Adecco SA 13 138 795 695 1 080 756 0.05
Baloise Holding AG 1 541 193 089 181 416 0.01
Cie Financiere Richemont SA 27 369 2 062 478 2 871 761 0.13
Coca-Cola HBC AG 2 478 77 386 56 861 0
Credit Suisse Group AG 30 726 919 521 878 327 0.04
Galenica AG 97 74 921 94 615 0
Geberit AG 7 224 1 786 789 2 534 256 0.11
Georg Fischer AG 135 81 422 96 667 0
Givaudan SA 147 228 944 245 165 0.01
Helvetia Holding AG 718 288 641 329 730 0.02
Holcim Ltd 53 557 4 485 394 4 707 660 0.21
Julius Baer Group Ltd 214 178 9 593 294 8 827 453 0.39
Lindt & Spruengli AG 47 183 584 239 080 0.01
Logitech International SA 22 109 192 528 286 707 0.01
Lonza Group AG 948 76 139 103 052 0.01
Nestle SA 269 590 17 864 362 20 884 949 0.93
Novartis AG 194 846 12 471 057 17 632 316 0.79
Partners Group Holding AG 1 463 316 957 399 569 0.02
Roche Holding AG 139 585 29 783 337 41 632 957 1.86
Schindler Holding AG 543 79 370 82 478 0
SGS SA 47 115 670 112 571 0.01
Sika AG 60 143 090 245 195 0.01
Sonova Holding AG 2 067 223 541 315 130 0.01
Swatch Group AG/The 837 510 572 505 426 0.02

STANLIB Funds Limited
Portfolio Statement (continued)
STANLIB Multi-Manager Global Equity Fund (continued)
As at 30 June 2014
123
Nominal holding Cost Market Value % of Net AssetsUSD USD
Switzerland (continued)Swatch Group AG/The REG 5 473 453 363 607 904 0.03
Swiss Life Holding AG 1 199 231 185 284 336 0.01
Swiss Prime Site AG 1 021 72 566 84 565 0
Swiss Re AG 8 464 633 323 752 576 0.03
Swisscom AG 10 326 4 786 934 6 002 520 0.27
Syngenta AG 671 265 618 249 846 0.01
TE Connectivity Ltd 4 500 237 712 278 235 0.01
Transocean Ltd 6 071 290 054 273 120 0.02
Tyco International Ltd 79 686 2 275 814 3 632 885 0.16
UBS AG 112 519 2 140 470 2 064 364 0.09
Zurich Insurance Group AG 30 281 6 435 798 9 120 465 0.41
Total Switzerland 5.79% (31 December 2013: 5.47%) 129 905 887 5.79
ThailandAdvanced Info Service PCL 11 700 101 247 79 310 0
AP Thailand PCL 759 200 181 146 149 714 0.01
AP Thailand PCL - NVDR 82 400 27 110 15 870 0
Bangkok Bank PCL 15 200 99 627 90 390 0.01
Bangkok Bank PCL - Foreign 83 200 499 594 496 047 0.02
Bumrungrad Hospital PCL 15 000 39 091 53 151 0
Central Pattana PCL 35 000 52 995 52 843 0
Delta Electronics Thailand PCL 28 700 53 540 55 046 0
Dynasty Ceramic PCL 30 800 54 940 55 043 0
Glow Energy PCL 33 300 71 626 84 649 0
Kasikornbank PCL 10 200 60 748 63 799 0
Kasikornbank PCL Foreign 19 500 114 471 123 170 0.01
Kiatnakin Bank PCL 38 000 52 255 51 517 0
Krung Thai Bank PCL 676 100 489 001 435 408 0.02
MK Restaurants Group PCL 29 000 53 503 55 175 0
OfficeMate PCL 32 100 54 701 56 130 0
PTT Exploration & Production PCL 18 200 101 161 93 930 0.01
PTT Global Chemical PCL 43 000 95 513 89 100 0
PTT PCL 27 200 289 537 265 673 0.01
Siam Cement PCL/The 7 100 99 375 98 444 0.01
Siam Cement PCL/The (REGs) 6 800 97 908 94 704 0.01
Siam Commercial Bank PCL 21 900 99 486 113 700 0.01
Thaicom PCL 43 800 52 111 51 623 0
Thanachart Capital PCL 567 600 464 796 612 100 0.03
Total Thailand 0.15% (31 December 2013: 0.24%) 3 336 536 0.15
TurkeyCoca-Cola Icecek AS 21 200 517 192 522 926 0.02
Eregli Demir ve Celik Fabrikalari TAS 1 1 1 0
KOC Holding AS 48 890 217 920 238 652 0.01
Tupras Turkiye Petrol Rafinerileri AS 42 553 1 042 562 991 425 0.05
Turk Hava Yollari – 2 2 0
Turkiye Garanti Bankasi AS 236 836 854 162 924 868 0.04
Turkiye Garanti Bankasi AS ADR 76 000 431 389 300 200 0.01
Turkiye Halk Bankasi AS 74 300 391 934 557 168 0.03
Yazicilar Holding AS 47 500 390 769 418 926 0.02
Total Turkey 0.18% (31 December 2013: 0.16%) 3 954 168 0.18Total United Arab Emirates 0.00% (31 December 2013: 0.00%)
United Kingdom3i Group Plc 83 522 373 681 573 955 0.03

STANLIB Funds Limited
Portfolio Statement (continued)
STANLIB Multi-Manager Global Equity Fund (continued)
As at 30 June 2014
124
Nominal holding Cost Market Value % of Net AssetsUSD USD
United Kingdom (continued)Admiral Group Plc 21 441 423 262 567 878 0.03
Aggreko Plc 8 285 221 932 233 741 0.01
AMEC Plc 16 335 251 949 339 075 0.02
Anglo American Plc 37 042 944 893 905 866 0.04
Antofagasta Plc 5 662 77 438 73 868 0
Aon Plc 7 300 497 376 657 584 0.03
ARM Holdings Plc 40 781 635 203 614 317 0.03
ASOS Plc 6 736 514 145 340 920 0.02
Associated British Foods Plc 3 542 101 286 184 596 0.01
AstraZeneca Plc 19 435 1 127 902 1 442 223 0.07
AVEVA Group Plc 1 880 76 004 65 448 0
Aviva Plc 41 263 283 642 359 822 0.02
Awilco Drilling Plc 2 200 50 078 50 014 0
Babcock International Group Plc 3 997 76 823 79 414 0
BAE Systems Plc 153 140 886 842 1 133 006 0.05
Balfour Beatty Plc 23 291 103 631 92 989 0
Bank of Georgia Holdings Plc 2 606 78 515 104 267 0.01
Barclays Plc 643 234 3 069 722 2 339 378 0.1
Barratt Developments Plc 22 370 64 588 142 862 0.01
Bellway Plc 3 501 76 753 93 624 0
Berendsen Plc 5 284 77 305 88 406 0
Berkeley Group Holdings Plc 2 247 76 455 92 900 0
Betfair Group Plc 16 848 281 759 294 126 0.01
BG Group Plc 468 826 8 484 228 9 900 011 0.44
BHP Billiton Plc 245 999 7 336 741 7 947 637 0.35
Bodycote Plc 15 600 119 894 183 381 0.01
Bovis Homes Group Plc 6 287 76 355 85 031 0
BP Plc 703 736 5 137 631 6 195 692 0.28
British American Tobacco Plc 238 102 11 307 367 14 159 593 0.63
British Land Co Plc 8 348 75 796 100 274 0.01
British Sky Broadcasting Group Plc 11 564 136 359 178 745 0.01
BT Group Plc 102 150 574 366 672 270 0.03
Bunzl Plc 41 423 731 384 1 148 109 0.05
Burberry Group Plc 19 096 410 817 483 893 0.02
Cable & Wireless Communications Plc 329 518 246 627 277 421 0.01
Capita Plc 1 013 624 11 391 806 19 827 195 0.88
Carnival Plc 18 977 763 180 716 448 0.03
Centrica Plc 1 035 455 5 431 577 5 532 747 0.25
Clarkson Plc 2 323 79 279 94 970 0
Close Brothers Group Plc 9 605 143 164 209 723 0.01
Compass Group Plc 99 283 1 035 194 1 724 754 0.08
Croda International Plc 1 836 78 175 69 096 0
Daily Mail & General Trust Plc 22 618 323 590 321 569 0.02
De La Rue Plc 10 659 157 709 147 351 0.01
Derwent London Plc 2 027 76 257 92 781 0
Devro Plc 43 789 192 051 186 248 0.01
Diageo Plc 49 011 1 235 268 1 563 319 0.07
Dialight Plc 4 236 79 747 64 498 0
Dignity Plc 3 276 76 913 76 404 0
Diploma Plc 7 607 77 077 83 243 0
Domino's Pizza Group Plc 19 500 171 716 174 213 0.01
Drax Group Plc 17 600 166 072 192 597 0.01
Dunelm Group Plc 5 110 80 906 72 869 0

STANLIB Funds Limited
Portfolio Statement (continued)
STANLIB Multi-Manager Global Equity Fund (continued)
As at 30 June 2014
125
Nominal holding Cost Market Value % of Net AssetsUSD USD
United Kingdom (continued)easyJet Plc 3 687 78 503 86 053 0
Ensco Plc 15 800 900 268 878 006 0.04
Fidessa Group Plc 6 169 239 145 231 636 0.01
Firstgroup Plc 73 657 145 072 159 445 0.01
Fresnillo Plc 4 045 67 351 60 276 0
G4S Plc 195 434 777 486 852 776 0.04
Galliford Try Plc 4 523 77 365 88 318 0
Genus Plc 3 622 78 193 70 477 0
GlaxoSmithKline Plc 50 127 1 279 140 1 340 070 0.06
Go-Ahead Group Plc 3 081 77 643 124 747 0.01
Great Portland Estates Plc 21 100 137 509 232 161 0.01
Greene King Plc 5 732 77 120 82 670 0
Hargreaves Lansdown Plc 4 755 77 741 100 653 0.01
Hays Plc 141 611 238 977 353 518 0.02
Hikma Pharmaceuticals Plc 19 544 252 473 560 743 0.03
HomeServe Plc 84 052 406 212 462 622 0.02
HSBC Holdings Plc 1 531 900 15 678 211 15 528 805 0.69
Hunting Plc 5 589 76 704 81 898 0
ICAP Plc 62 331 326 856 404 989 0.02
IG Group Holdings Plc 44 486 347 691 446 497 0.02
IMI Plc 7 637 160 435 194 044 0.01
Imperial Tobacco Group Plc 51 726 1 940 371 2 325 187 0.1
Inchcape Plc 7 784 76 717 84 249 0
Informa Plc 79 258 593 444 648 592 0.03
InterContinental Hotels Group Plc 2 520 75 670 104 274 0.01
International Personal Finance Plc 73 421 456 401 736 288 0.03
Intertek Group Plc 30 570 1 094 832 1 436 383 0.06
Intl Consolidated Airline-Di Eur0.5 18 700 140 307 118 567 0.01
ITV Plc 320 820 626 352 977 539 0.04
J D Wetherspoon Plc 6 418 75 807 86 748 0
J Sainsbury Plc 37 497 229 446 202 154 0.01
Jardine Lloyd Thompson Group Plc 5 284 77 438 93 962 0
John Menzies Plc 6 140 79 087 69 973 0
John Wood Group Plc 15 600 197 048 214 990 0.01
Jupiter Fund Management Plc 102 776 620 555 701 868 0.03
Keller Group Plc 4 272 76 251 67 274 0
Kier Group Plc 2 917 78 019 88 381 0
Kingfisher Plc 37 213 238 532 228 428 0.01
Ladbrokes Plc 41 652 132 975 99 919 0.01
Land Securities Group Plc 7 023 104 396 124 405 0.01
Legal & General Group Plc 65 779 213 875 253 400 0.01
Liberty Global Plc Series A 21 000 834 016 928 620 0.04
Liberty Global Plc Series C 5 600 209 791 236 992 0.01
Lloyds Banking Group Plc 3 954 094 4 898 951 5 020 118 0.22
London Stock Exchange Group Plc 7 553 231 324 258 936 0.01
Marks & Spencer Group Plc 22 492 185 106 163 524 0.01
Merlin Entertainments Plc 71 101 415 948 434 136 0.02
Michael Page International Plc 14 077 73 856 103 741 0.01
Millennium & Copthorne Hotels Plc 12 917 88 616 128 320 0.01
Mondi Plc 4 401 76 478 79 916 0
Moneysupermarket.com Group Plc 24 226 74 384 77 627 0
Mulberry Group Plc 4 870 79 686 62 452 0
National Express Group Plc 21 623 74 317 96 756 0.01

STANLIB Funds Limited
Portfolio Statement (continued)
STANLIB Multi-Manager Global Equity Fund (continued)
As at 30 June 2014
126
Nominal holding Cost Market Value % of Net AssetsUSD USD
United Kingdom (continued)National Grid Plc 100 735 1 157 879 1 446 827 0.07
Next Plc 1 078 88 751 119 256 0.01
Noble Corp plc 5 000 183 286 167 800 0.01
Northgate Plc 10 931 147 557 97 937 0.01
Ocado Group Plc 39 800 241 021 252 471 0.01
Old Mutual Plc 64 534 196 233 218 151 0.01
Oxford Instruments Plc 12 000 245 433 266 736 0.01
Pearson Plc 9 839 198 598 193 972 0.01
Pennon Group Plc 17 581 185 138 235 828 0.01
Perform Group Plc 26 247 122 628 103 670 0.01
Persimmon Ord Gbp0.10 4 141 4 010 4 956 0
Persimmon Plc 4 141 72 294 90 064 0
Premier Oil Plc 28 200 165 083 160 999 0.01
Priory Group No 3 Plc 1 300 63 774 79 105 0
Provident Financial Plc 25 966 545 730 1 013 606 0.05
Prudential Plc 117 530 1 964 957 2 694 857 0.12
PZ Cussons Plc 13 200 71 015 78 025 0
Reckitt Benckiser Group Plc 68 968 4 730 793 6 014 168 0.27
Reed Elsevier Plc 56 272 643 446 904 437 0.04
Renishaw Plc 2 658 79 201 74 807 0
Rentokil Initial Plc 89 800 181 845 170 584 0.01
Rexam Plc 62 327 491 603 569 613 0.03
Rightmove Plc 39 683 1 106 254 1 454 069 0.07
Rio Tinto Plc 115 182 6 020 927 6 122 004 0.27
Rolls-Royce Holdings Plc 48 386 799 803 884 414 0.04
Rotork Plc 1 729 77 577 78 875 0
Royal Bank of Scotland Group Plc 100 467 579 360 564 132 0.03
Royal Dutch Shell Plc 96 039 3 176 329 3 969 830 0.18
Royal Dutch Shell Plc B shares 371 436 13 047 899 16 147 400 0.72
RSA Insurance Group Plc 16 841 167 224 136 722 0.01
SABMiller Plc 6 837 346 758 396 007 0.02
Sage Group Plc/The 110 404 552 420 725 078 0.03
Schroders Plc 1 929 77 629 82 622 0
SDL Plc 13 000 135 689 75 908 0
Senior Plc 33 400 108 925 161 733 0.01
Serco Group Plc 45 163 338 244 282 169 0.01
Severn Trent Plc 7 993 233 295 264 043 0.01
Shanks Group Plc 78 000 132 496 142 038 0.01
Smith & Nephew Plc 17 644 197 887 313 149 0.01
Smiths Group Plc 21 778 398 053 482 594 0.02
Spectris Plc 14 562 473 871 552 257 0.03
Spirax-Sarco Engineering Plc 1 594 76 386 74 488 0
SSE Plc 17 582 439 620 471 080 0.02
Stagecoach Group Plc 82 396 320 859 529 724 0.02
Standard Chartered Plc 464 745 10 848 530 9 488 048 0.42
Standard Life Plc 21 261 120 015 135 960 0.01
SThree Plc 21 600 117 379 142 467 0.01
SuperGroup Plc 3 939 75 506 71 123 0
Synergy Health Plc 4 365 77 432 105 235 0.01
Tate & Lyle Plc 6 096 76 889 71 347 0
Taylor Wimpey Plc 192 824 196 837 375 853 0.02
Telecity Group Plc 5 787 77 079 74 558 0
Telecom Plus Plc 3 592 78 132 81 747 0

STANLIB Funds Limited
Portfolio Statement (continued)
STANLIB Multi-Manager Global Equity Fund (continued)
As at 30 June 2014
127
Nominal holding Cost Market Value % of Net AssetsUSD USD
United Kingdom (continued)Tesco Plc 279 003 1 578 987 1 355 787 0.06
Thomas Cook Group Plc 265 053 515 733 605 010 0.03
Travis Perkins plc 6 986 155 590 195 659 0.01
TUI Travel Plc 82 152 463 679 558 921 0.03
Tullow Oil Plc 18 317 300 851 267 154 0.01
Ultra Electronics Holdings Plc 2 534 77 695 80 763 0
Unilever Plc 118 730 4 559 282 5 379 775 0.24
Vedanta Resources Plc 4 164 77 921 78 959 0
Victrex Plc 2 943 78 156 85 545 0
Vodafone Group Plc 4 363 955 15 629 768 14 546 808 0.65
Weir Group Plc/The 6 031 232 656 270 074 0.01
WH Smith Plc 23 170 255 150 423 904 0.02
Whitbread Plc 6 900 336 196 519 228 0.02
WM Morrison Supermarkets Plc 75 269 318 920 236 036 0.01
WS Atkins Plc 3 893 75 168 87 798 0
Total United Kingdom 9.18% (31 December 2013: 11.14%) 206 052 448 9.18
United States3D Systems Corp 1 200 60 655 71 748 0
3M Co 28 150 3 228 810 4 031 924 0.18
Abbott Laboratories 151 681 5 510 705 6 200 719 0.28
AbbVie Inc 26 000 1 284 032 1 466 400 0.07
Activision Blizzard Inc 124 700 1 849 286 2 780 810 0.13
Adobe Systems Inc 2 900 138 170 209 815 0.01
ADT Corp/The 3 300 125 100 115 269 0.01
ADTRAN Inc 5 300 139 928 119 515 0.01
Advance Auto Parts Inc 800 64 292 107 944 0.01
Advisory Board Co/The 1 000 58 191 51 800 0
AES Corp/VA 30 500 437 853 474 275 0.02
Aetna Inc 5 600 368 689 454 048 0.02
Aflac Inc 7 600 464 900 473 024 0.02
AGCO Corp 1 700 101 085 95 557 0.01
Agilent Technologies Inc 3 000 145 845 172 260 0.01
AGL Resources Inc 1 300 57 229 71 513 0
Air Methods Corp 8 400 329 732 433 692 0.02
Air Products & Chemicals Inc 2 100 222 075 270 039 0.01
Airgas Inc 1 800 188 907 196 020 0.01
Akamai Technologies Inc 1 100 56 450 67 144 0
Alaska Air Group Inc 4 000 313 571 380 200 0.02
Albany International Corp 1 700 57 530 64 447 0
Albemarle Corp 4 600 288 903 328 900 0.02
Alcoa Inc 18 700 152 379 278 256 0.01
Alexandria Real Estate Equities Inc 900 56 849 69 867 0
Alexion Pharmaceuticals Inc 500 56 935 78 120 0
Alleghany Corp 7 229 2 832 841 3 162 615 0.14
Allegheny Technologies Inc 8 700 271 657 392 370 0.02
Allergan Inc/United States 41 500 3 647 679 7 017 235 0.31
ALLETE Inc 1 200 55 967 61 584 0
Allstate Corp/The 8 000 400 920 469 760 0.02
Alnylam Pharmaceuticals Inc 1 000 55 525 63 130 0
Altera Corp 119 249 4 207 601 4 145 095 0.19
Altria Group Inc 14 600 518 707 612 032 0.03
Amazon.com Inc 3 900 927 077 1 266 642 0.06
Ambac Financial Group Inc 5 200 140 509 142 012 0.01

STANLIB Funds Limited
Portfolio Statement (continued)
STANLIB Multi-Manager Global Equity Fund (continued)
As at 30 June 2014
128
Nominal holding Cost Market Value % of Net AssetsUSD USD
United States (continued)AMC Networks Inc 4 300 288 390 264 278 0.01
Ameren Corp 4 200 137 487 171 612 0.01
American Capital Agency Corp 9 200 214 184 215 280 0.01
American Electric Power Co Inc 7 800 344 976 434 850 0.02
American Express Co 25 461 1 832 645 2 414 976 0.11
American Financial Group Inc/OH 1 200 64 162 71 472 0
American International Group Inc 38 500 1 904 483 2 100 945 0.09
American Science & Engineering Inc 1 000 57 189 69 540 0
American States Water Co 2 200 56 687 73 040 0
American Tower Corp 37 300 2 402 869 3 354 762 0.15
American Water Works Co Inc 1 900 74 544 93 974 0.01
American Woodmark Corp 1 600 58 570 50 960 0
Ameriprise Financial Inc 2 200 198 869 263 934 0.01
AmerisourceBergen Corp 7 000 432 443 508 550 0.02
AMETEK Inc 1 400 63 805 73 178 0
Amgen Inc 37 572 4 266 094 4 447 398 0.2
Amphenol Corp 1 100 97 853 105 941 0.01
AmTrust Financial Services Inc 4 100 142 932 171 298 0.01
Anadarko Petroleum Corp 45 819 3 487 255 5 014 890 0.22
Analog Devices Inc 51 423 2 428 647 2 779 927 0.13
Analogic Corp 2 000 185 330 156 380 0.01
Andersons Inc/The 1 200 54 996 61 860 0
Anixter International Inc 600 52 530 60 030 0
Annaly Capital Management Inc 20 200 241 677 230 684 0.01
ANSYS Inc 600 52 681 45 468 0
AO Smith Corp 1 300 57 587 64 428 0
Apache Corp 8 400 732 804 845 040 0.04
Apple Inc 170 603 12 850 344 15 854 137 0.71
Applied Industrial Technologies Inc 1 100 54 930 55 770 0
Applied Materials Inc 12 800 203 968 288 640 0.01
AptarGroup Inc 1 000 59 412 67 020 0
Archer-Daniels-Midland Co 17 400 635 315 767 514 0.04
Arctic Cat Inc 1 000 56 604 39 390 0
Armada Hoffler Properties Inc 15 900 167 220 153 594 0.01
Armstrong World Industries Inc 1 100 58 152 63 173 0
Arrow Electronics Inc 3 600 173 839 217 440 0.01
Arthur J Gallagher & Co 1 300 57 343 60 580 0
Asbury Automotive Group Inc 1 100 57 922 75 570 0
Ascena Retail Group Inc 15 900 315 827 271 731 0.01
Ascent Capital Group Inc 700 55 352 46 137 0
Ashland Inc 1 000 94 897 108 780 0.01
Aspen Technology Inc 7 800 163 060 361 920 0.02
Assurant Inc 2 200 121 187 144 166 0.01
AT&T Inc 77 700 2 671 792 2 746 695 0.12
Atmos Energy Corp 1 400 56 709 74 718 0
Atwood Oceanics Inc 1 000 57 252 52 460 0
Autodesk Inc 1 500 58 595 84 570 0
Autoliv Inc 1 400 121 780 149 212 0.01
Automatic Data Processing Inc 11 607 835 872 920 203 0.04
AutoZone Inc 200 83 424 107 198 0.01
AvalonBay Communities Inc 1 500 193 880 213 225 0.01
Avery Dennison Corp 1 300 57 663 66 651 0
Avis Budget Group Inc 2 200 65 945 131 296 0.01

STANLIB Funds Limited
Portfolio Statement (continued)
STANLIB Multi-Manager Global Equity Fund (continued)
As at 30 June 2014
129
Nominal holding Cost Market Value % of Net AssetsUSD USD
United States (continued)Avnet Inc 4 600 189 655 203 872 0.01
Avon Products Inc 3 700 76 238 54 020 0
Axiall Corp 1 500 60 618 70 875 0
AZZ Inc 4 000 188 901 183 800 0.01
B/E Aerospace Inc 8 500 499 390 785 910 0.04
Badger Meter Inc 1 300 58 485 68 367 0
Baker Hughes Inc 7 400 372 730 550 930 0.03
Ball Corp 1 800 80 316 112 824 0.01
Bally Technologies Inc 800 59 347 52 584 0
BancFirst Corp 1 100 58 606 67 925 0
Bank of America Corp 211 700 3 090 142 3 251 712 0.15
Bank of Hawaii Corp 1 100 57 795 64 581 0
Bank of New York Mellon Corp/The 22 900 713 165 857 834 0.04
BankUnited Inc 1 900 58 024 63 574 0
Barrett Business Services Inc 900 62 877 42 300 0
Baxter International Inc 236 357 16 052 417 17 083 884 0.76
BB&T Corp 11 800 401 344 465 274 0.02
Becton Dickinson and Co 1 700 169 413 201 042 0.01
Bed Bath & Beyond Inc 2 700 181 773 154 899 0.01
Belden Inc 900 57 219 70 488 0
Bemis Co Inc 1 500 59 926 60 975 0
Berkshire Hathaway Inc 34 109 3 130 003 4 316 494 0.19
Best Buy Co Inc 8 700 331 647 269 787 0.01
Biogen Idec Inc 800 187 464 252 248 0.01
BioMarin Pharmaceutical Inc 4 200 179 848 261 282 0.01
Bio-Rad Laboratories Inc 500 58 136 59 860 0
Black Hills Corp 1 200 57 530 73 668 0
Blackhawk Network Holdings Inc 1 823 35 655 48 948 0
BlackRock Inc 2 100 492 546 671 076 0.03
Bob Evans Farms Inc/DE 1 100 59 190 55 044 0
Boeing Co/The 21 900 2 184 386 2 781 957 0.13
BofI Holding Inc 2 300 180 249 168 912 0.01
Boise Cascade Co 6 600 168 965 188 958 0.01
BOK Financial Corp 900 58 381 59 958 0
BorgWarner Inc 2 200 108 135 143 396 0.01
Boston Private Financial Holdings Inc 30 400 345 887 407 968 0.02
Boston Scientific Corp 12 200 145 485 155 672 0.01
Bottomline Technologies de Inc 6 700 127 217 200 464 0.01
Bright Horizons Family Solutions Inc 1 600 57 878 68 688 0
Brinker International Inc 1 400 56 751 68 082 0
Bristol-Myers Squibb Co 66 400 2 503 643 3 219 736 0.14
Bristow Group Inc 800 55 665 64 472 0
Broadcom Corp 31 400 1 018 132 1 165 568 0.05
Broadridge Financial Solutions Inc 2 500 59 085 104 050 0.01
Brown-Forman Corp 800 55 688 75 328 0
Bruker Corp 21 700 361 425 526 659 0.02
Brunswick Corp/DE 6 400 221 986 269 568 0.01
Buckle Inc/The 1 100 59 242 48 697 0
CA Inc 3 300 100 751 94 809 0.01
Cabela's Inc 900 58 824 56 160 0
Cablevision Systems Corp 3 900 69 015 68 796 0
Cabot Corp 1 400 57 725 81 172 0
Cabot Oil & Gas Corp 1 500 57 075 51 210 0

STANLIB Funds Limited
Portfolio Statement (continued)
STANLIB Multi-Manager Global Equity Fund (continued)
As at 30 June 2014
130
Nominal holding Cost Market Value % of Net AssetsUSD USD
United States (continued)CACI International Inc 900 61 503 63 171 0
Camden Property Trust 900 59 139 64 017 0
Cameron International Corp 1 900 111 483 128 630 0.01
Campbell Soup Co 1 600 67 816 73 296 0
Capella Education Co 1 000 57 144 54 390 0
Capital One Financial Corp 13 400 913 939 1 106 840 0.05
CARBO Ceramics Inc 600 57 296 92 412 0.01
Cardinal Health Inc 8 700 478 437 596 298 0.03
CareFusion Corp 2 200 81 609 97 548 0.01
Carlisle Cos Inc 2 500 141 652 216 450 0.01
CarMax Inc 2 400 122 626 124 824 0.01
Carpenter Technology Corp 1 000 57 136 63 250 0
Carter's Inc 800 59 108 55 144 0
Casey's General Stores Inc 800 56 887 56 232 0
Caterpillar Inc 22 700 2 040 941 2 466 355 0.11
Cavium Inc 8 100 265 565 402 246 0.02
CBIZ Inc 27 500 247 451 248 050 0.01
CBOE Holdings Inc 1 300 59 302 63 973 0
CBS Corp 16 188 858 228 1 005 922 0.05
Celanese Corp 1 900 93 281 122 151 0.01
Celgene Corp 2 600 194 545 223 288 0.01
Celldex Therapeutics Inc 2 908 46 179 47 400 0
Centene Corp 1 000 60 267 75 590 0
CenterPoint Energy Inc 5 500 125 812 140 470 0.01
CenturyLink Inc 10 700 346 466 387 126 0.02
Cerner Corp 4 400 155 933 226 908 0.01
CF Industries Holdings Inc 900 174 919 216 495 0.01
CH Robinson Worldwide Inc 24 374 1 408 588 1 554 574 0.07
Charles Schwab Corp/The 6 800 150 110 183 056 0.01
Chemed Corp 800 54 247 74 936 0
Chesapeake Energy Corp 14 400 386 103 447 552 0.02
Chesapeake Utilities Corp 1 100 57 475 78 342 0
Chevron Corp 112 300 13 369 268 14 655 150 0.65
Children's Place Inc/The 4 600 244 537 228 114 0.01
Chipotle Mexican Grill Inc 300 152 558 177 753 0.01
Chubb Corp/The 37 442 3 409 620 3 451 404 0.15
Church & Dwight Co Inc 900 54 955 62 937 0
Chuy's Holdings Inc 1 600 60 342 58 096 0
Cigna Corp 4 000 330 700 367 840 0.02
Cimarex Energy Co 1 100 99 689 157 773 0.01
Cincinnati Financial Corp 1 600 74 120 76 864 0
Cintas Corp 1 200 60 433 76 248 0
CIRCOR International Inc 900 55 120 69 354 0
Cisco Systems Inc 192 032 4 412 586 4 771 995 0.21
CIT Group Inc 3 100 149 209 141 918 0.01
Citigroup Inc 213 600 9 139 444 10 058 424 0.45
Citrix Systems Inc 51 095 3 113 560 3 195 992 0.14
City National Corp/CA 5 500 290 366 416 625 0.02
Civeo Corp 5 800 110 762 145 174 0.01
CLARCOR Inc 1 000 56 544 61 800 0
Clean Harbors Inc 25 511 1 472 477 1 639 337 0.07
Clearwater Paper Corp 1 200 56 860 74 040 0
Cleco Corp 1 300 57 480 76 622 0

STANLIB Funds Limited
Portfolio Statement (continued)
STANLIB Multi-Manager Global Equity Fund (continued)
As at 30 June 2014
131
Nominal holding Cost Market Value % of Net AssetsUSD USD
United States (continued)Cliffs Natural Resources Inc 8 000 160 546 120 400 0.01
Clorox Co/The 5 073 437 880 463 571 0.02
CME Group Inc/IL 93 922 6 591 324 6 663 766 0.3
CMS Energy Corp 3 300 86 449 102 828 0.01
CNO Financial Group Inc 5 200 75 154 92 508 0.01
Coach Inc 9 200 497 793 314 456 0.02
Cobalt International Energy Inc 49 800 989 498 913 332 0.04
Coca-Cola Bottling Co Consolidated 900 57 771 66 303 0
Coca-Cola Co/The 286 967 11 157 227 12 147 313 0.54
Coca-Cola Enterprises Inc 2 700 109 307 128 979 0.01
Cogent Communications Holdings Inc 7 300 137 630 252 215 0.01
Cognex Corp 900 27 902 34 506 0
Cognizant Technology Solutions Corp 3 800 149 815 185 820 0.01
Coherent Inc 1 000 58 439 66 140 0
Colfax Corp 3 100 128 639 230 919 0.01
Colgate-Palmolive Co 61 284 3 615 624 4 176 505 0.19
Columbia Sportswear Co 1 000 59 341 82 560 0
Comcast Corp Class A 447 893 20 096 732 24 042 896 1.07
Comcast Corp Special Class A 6 800 293 645 362 644 0.02
Comerica Inc 3 300 135 578 165 462 0.01
Commerce Bancshares Inc/MO 1 365 56 333 63 459 0
Community Health Systems Inc 3 000 122 248 136 110 0.01
CommVault Systems Inc 700 59 518 34 419 0
Compass Minerals International Inc 800 61 011 76 560 0
Computer Programs & Systems Inc 1 000 57 666 63 550 0
Computer Sciences Corp 2 300 121 082 145 337 0.01
Compuware Corp 6 800 62 447 67 864 0
ConAgra Foods Inc 5 500 171 756 163 185 0.01
Concho Resources Inc 800 83 036 115 600 0.01
Conn's Inc 1 100 56 175 54 318 0
ConocoPhillips 38 900 2 801 572 3 334 119 0.15
CONSOL Energy Inc 2 900 100 238 133 603 0.01
Consolidated Edison Inc 5 000 275 662 288 600 0.01
Constellation Brands Inc 1 200 70 875 105 768 0.01
Continental Resources Inc/OK 600 60 645 94 824 0.01
Cooper Cos Inc/The 1 400 181 321 189 616 0.01
Cooper Tire & Rubber Co 8 800 212 759 263 912 0.01
Core-Mark Holding Co Inc 1 800 58 664 82 098 0
Cornerstone OnDemand Inc 3 100 124 659 142 631 0.01
Corning Inc 27 400 407 354 601 156 0.03
Corporate Executive Board Co/The 800 55 391 54 600 0
CorVel Corp 5 000 107 100 225 750 0.01
Costco Wholesale Corp 19 799 1 347 127 2 280 053 0.1
Covance Inc 700 59 948 59 878 0
Cracker Barrel Old Country Store Inc 1 800 179 237 179 136 0.01
Crane Co 1 000 60 247 74 360 0
Cree Inc 1 000 59 441 49 950 0
Crown Castle International Corp 800 56 660 59 392 0
Crown Holdings Inc 1 700 74 060 84 592 0
CST Brands Inc 1 900 57 476 65 512 0
CSX Corp 10 300 265 482 317 137 0.02
CubeSmart 18 500 240 248 338 920 0.02
Cubic Corp 1 100 57 844 48 928 0

STANLIB Funds Limited
Portfolio Statement (continued)
STANLIB Multi-Manager Global Equity Fund (continued)
As at 30 June 2014
132
Nominal holding Cost Market Value % of Net AssetsUSD USD
United States (continued)Cubist Pharmaceuticals Inc 4 600 304 637 321 034 0.02
Cullen/Frost Bankers Inc 800 55 668 63 496 0
Cummins Inc 1 800 239 517 277 632 0.01
Curtiss-Wright Corp 1 300 60 473 85 150 0
CVB Financial Corp 18 800 204 370 301 176 0.01
CVS Caremark Corp 307 900 12 849 650 23 197 186 1.03
Cytec Industries Inc 700 54 745 73 801 0
Danaher Corp 33 800 1 878 810 2 660 060 0.12
Darden Restaurants Inc 1 600 77 128 74 016 0
DaVita HealthCare Partners Inc 1 400 79 548 101 248 0.01
Dean Foods Co 3 400 65 976 59 806 0
Deckers Outdoor Corp 1 000 59 781 86 280 0
Deere & Co 4 600 382 985 416 438 0.02
Delta Air Lines Inc 4 700 131 525 181 937 0.01
Deltic Timber Corp 900 55 797 54 306 0
Deluxe Corp 1 400 56 145 81 998 0
Denbury Resources Inc 6 800 120 633 125 460 0.01
DENTSPLY International Inc 1 300 57 902 61 542 0
Devon Energy Corp 6 200 364 888 492 280 0.02
Diamond Offshore Drilling Inc 900 58 387 44 667 0
Diamondback Energy Inc 1 300 58 266 115 440 0.01
Dick's Sporting Goods Inc 1 200 60 909 55 860 0
Digital Realty Trust Inc 1 000 54 769 58 340 0
Dillard's Inc 700 56 151 81 627 0
DineEquity Inc 900 59 878 71 541 0
DIRECTV 5 300 325 075 450 553 0.02
Discover Financial Services 7 200 376 378 446 184 0.02
Discovery Communications Inc Class A 2 300 186 598 170 844 0.01
Discovery Communications Inc Class C 800 58 215 58 072 0
DISH Network Corp 1 900 89 233 123 652 0.01
Dollar General Corp 3 600 209 875 206 460 0.01
Dollar Tree Inc 1 600 87 400 87 136 0.01
Dominion Resources Inc/VA 4 600 275 011 328 854 0.02
Domino's Pizza Inc 900 59 196 65 763 0
Domtar Corp 1 800 68 759 77 130 0
Dorman Products Inc 1 200 60 248 59 124 0
Douglas Emmett Inc 2 200 49 850 62 084 0
Dover Corp 1 700 126 907 154 581 0.01
Dow Chemical Co/The 17 900 709 648 920 776 0.04
Dr Pepper Snapple Group Inc 71 300 3 174 246 4 176 754 0.19
DreamWorks Animation SKG Inc 9 600 201 959 223 296 0.01
Dresser-Rand Group Inc 19 814 1 161 440 1 262 548 0.06
Dril-Quip Inc 4 000 319 303 437 000 0.02
DST Systems Inc 800 60 122 73 736 0
DSW Inc 1 400 58 578 39 116 0
DTE Energy Co 2 400 158 905 186 912 0.01
Duke Energy Corp 10 100 671 207 749 218 0.04
Dun & Bradstreet Corp/The 500 53 008 55 090 0
DXP Enterprises Inc 2 000 179 070 151 080 0.01
E*TRADE Financial Corp 4 600 78 250 97 750 0.01
EastGroup Properties Inc 1 000 58 536 64 190 0
Eastman Chemical Co 1 500 116 497 130 995 0.01
eBay Inc 58 902 2 536 803 2 948 634 0.14

STANLIB Funds Limited
Portfolio Statement (continued)
STANLIB Multi-Manager Global Equity Fund (continued)
As at 30 June 2014
133
Nominal holding Cost Market Value % of Net AssetsUSD USD
United States (continued)Ecolab Inc 1 400 135 778 155 820 0.01
Edison International 5 200 234 630 302 172 0.01
Edwards Lifesciences Corp 800 57 276 68 656 0
EI du Pont de Nemours & Co 9 000 527 607 588 780 0.03
Eli Lilly & Co 10 900 580 373 677 653 0.03
EMC Corp/MA 18 700 504 245 492 371 0.02
EMCOR Group Inc 14 700 432 625 654 297 0.03
Emerson Electric Co 27 119 1 629 572 1 798 803 0.08
Employers Holdings Inc 6 000 170 489 126 960 0.01
Enbridge Energy Manage Fraction Npv 19 987 19 20 0
Energen Corp 2 600 196 665 231 036 0.01
Energizer Holdings Inc 2 000 191 811 244 100 0.01
EnerSys 1 000 54 860 68 770 0
Engility Holdings Inc 1 700 56 155 65 025 0
EnPro Industries Inc 1 000 59 084 73 160 0
Entergy Corp 3 700 231 618 303 770 0.01
EOG Resources Inc 91 400 5 047 522 10 677 348 0.48
EQT Corp 2 000 189 833 213 760 0.01
Equifax Inc 900 54 694 65 277 0
Equinix Inc 300 52 302 63 027 0
Equity Residential 1 200 65 670 75 588 0
Essex Property Trust Inc 726 108 784 134 172 0.01
Estee Lauder Cos Inc/The 1 000 70 375 74 250 0
Esterline Technologies Corp 700 56 855 80 535 0
Exelis Inc 4 000 63 018 67 920 0
Exelon Corp 16 500 506 460 601 755 0.03
ExOne Co/The 1 000 50 068 39 610 0
Expedia Inc 1 100 56 281 86 636 0
Expeditors International of Washington Inc 28 906 1 223 837 1 276 489 0.06
Exponent Inc 800 55 007 59 240 0
Express Scripts Holding Co 86 175 5 548 627 5 973 651 0.27
Exxon Mobil Corp 143 313 12 739 639 14 420 154 0.64
Ezchip Semiconductor Ltd 7 400 179 571 190 698 0.01
F5 Networks Inc 600 54 375 66 846 0
Facebook Inc 2 800 125 286 188 384 0.01
FactSet Research Systems Inc 500 55 616 60 140 0
Fair Isaac Corp 1 100 57 778 70 114 0
Family Dollar Stores Inc 1 100 80 060 72 743 0
Fastenal Co 1 200 60 153 59 388 0
Federal Realty Investment Trust 600 59 883 72 510 0
FedEx Corp 4 200 455 580 635 670 0.03
FEI Co 700 59 469 63 490 0
Fidelity National Financial Inc 3 100 77 050 102 455 0.01
Fidelity National Information Services Inc 2 700 126 139 147 771 0.01
Fifth Third Bancorp 18 800 355 841 401 380 0.02
Financial Engines Inc 1 000 59 411 45 260 0
First Cash Financial Services Inc 1 000 56 363 57 540 0
First Citizens BancShares Inc/NC 300 61 061 73 437 0
First Financial Bankshares Inc 2 000 57 143 62 700 0
First Financial Holdings Inc 1 000 56 703 60 670 0
First Niagara Financial Group Inc 6 400 65 949 55 872 0
First Republic Bank/CA 1 300 60 471 71 461 0
FirstEnergy Corp 9 700 350 071 336 687 0.02

STANLIB Funds Limited
Portfolio Statement (continued)
STANLIB Multi-Manager Global Equity Fund (continued)
As at 30 June 2014
134
Nominal holding Cost Market Value % of Net AssetsUSD USD
United States (continued)FirstMerit Corp 17 400 327 307 343 302 0.02
Fiserv Inc 103 050 5 868 903 6 215 976 0.28
FleetCor Technologies Inc 500 53 597 65 895 0
FLIR Systems Inc 68 103 2 278 479 2 363 855 0.11
Flowserve Corp 1 100 67 589 81 785 0
Fluor Corp 22 895 1 735 554 1 760 168 0.08
FMC Corp 900 63 216 64 062 0
FMC Technologies Inc 1 100 61 137 67 177 0
Ford Motor Co 116 100 1 995 617 2 000 403 0.09
Forest Laboratories Inc 3 000 134 361 298 020 0.01
Fortune Brands Home & Security Inc 1 400 57 239 55 888 0
Forum Energy Technologies Inc 6 700 186 978 244 081 0.01
Fossil Group Inc 1 500 176 878 156 765 0.01
Franklin Resources Inc 69 146 3 406 532 4 000 096 0.18
Freeport-McMoRan Inc 30 400 1 130 936 1 109 296 0.05
Fresh Market Inc/The 1 200 58 822 40 152 0
Frontier Communications Corp 25 100 109 078 146 333 0.01
G&K Services Inc 1 000 55 390 52 030 0
GAMCO Investors Inc 800 58 933 66 312 0
GameStop Corp 2 300 121 298 93 081 0.01
Gaming and Leisure Properties Inc 195 7 452 6 622 0
Gannett Co Inc 3 300 83 698 103 224 0.01
Gap Inc/The 2 700 111 334 112 212 0.01
Gartner Inc 1 000 57 890 70 470 0
GATX Corp 1 200 57 093 80 304 0
Generac Holdings Inc 1 400 58 314 68 222 0
General Dynamics Corp 4 300 372 632 501 122 0.02
General Electric Co 319 737 7 744 971 8 399 491 0.38
General Mills Inc 5 200 254 098 273 104 0.01
General Motors Co 55 100 2 011 734 1 999 579 0.09
Genesco Inc 900 56 934 73 908 0
Genesee & Wyoming Inc 600 56 055 62 976 0
Genuine Parts Co 1 300 103 893 114 114 0.01
Genworth Financial Inc 13 300 163 709 231 287 0.01
G-III Apparel Group Ltd 1 100 58 280 89 826 0.01
Gilead Sciences Inc 94 300 3 236 637 7 818 413 0.35
Global Payments Inc 1 200 59 581 87 396 0.01
GNC Holdings Inc 5 500 239 369 187 495 0.01
Goldman Sachs Group Inc/The 41 468 5 923 706 6 945 061 0.31
Goodyear Tire & Rubber Co/The 5 600 121 843 155 512 0.01
Google Inc Class A 24 970 9 388 541 14 598 960 0.66
Google Inc Class C 17 973 5 945 273 10 339 328 0.46
Graco Inc 800 57 884 62 456 0
Graham Holdings Co 100 58 182 71 633 0
Greif Inc 1 100 55 913 59 950 0
Group 1 Automotive Inc 700 55 277 59 010 0
Guidewire Software Inc 1 200 56 333 48 792 0
Gulfport Energy Corp 900 55 655 56 511 0
Hackett Group Inc/The 13 000 76 273 77 480 0
Haemonetics Corp 7 200 231 984 254 016 0.01
Hain Celestial Group Inc/The 700 55 669 62 104 0
Halliburton Co 99 534 3 997 491 7 065 919 0.32
Hanesbrands Inc 900 55 175 88 551 0.01

STANLIB Funds Limited
Portfolio Statement (continued)
STANLIB Multi-Manager Global Equity Fund (continued)
As at 30 June 2014
135
Nominal holding Cost Market Value % of Net AssetsUSD USD
United States (continued)Hanger Inc 10 900 258 705 342 587 0.02
Hanmi Financial Corp 12 700 210 785 267 335 0.01
Hanover Insurance Group Inc/The 1 100 56 580 69 432 0
Harley-Davidson Inc 1 500 94 537 104 775 0.01
Harman International Industries Inc 900 59 585 96 678 0.01
Harris Corp 1 700 99 281 128 758 0.01
Hartford Financial Services Group Inc 10 100 319 186 361 580 0.02
Hasbro Inc 1 200 55 794 63 648 0
HCA Holdings Inc 4 800 197 064 270 576 0.01
HCC Insurance Holdings Inc 1 300 55 972 63 609 0
HCP Inc 2 400 98 964 99 264 0.01
Health Care REIT Inc 1 100 67 424 68 926 0
HEICO Corp 1 125 58 764 58 421 0
Helmerich & Payne Inc 1 100 73 199 127 666 0.01
Henry Schein Inc 27 104 2 226 391 3 215 076 0.14
Hershey Co/The 1 800 183 500 175 248 0.01
Hertz Global Holdings Inc 5 700 155 122 159 828 0.01
Hess Corp 7 200 557 826 712 008 0.03
Hewlett-Packard Co 46 000 1 019 711 1 548 820 0.07
Hexcel Corp 30 100 1 171 955 1 231 391 0.06
Hillshire Brands Co 1 800 57 064 112 122 0.01
Hittite Microwave Corp 900 57 048 70 155 0
HMS Holdings Corp 6 900 171 473 140 691 0.01
HollyFrontier Corp 5 200 218 112 227 188 0.01
Home Depot Inc/The 27 600 1 762 608 2 234 220 0.1
Home Properties Inc 1 000 58 628 63 960 0
Honeywell International Inc 6 100 521 474 566 812 0.02
Hormel Foods Corp 1 300 56 063 64 129 0
Hornbeck Offshore Services Inc 1 000 56 887 46 900 0
Hospira Inc 1 800 72 735 92 448 0.01
Host Hotels & Resorts Inc 4 200 75 747 92 400 0.01
Howard Hughes Corp/The 3 100 309 786 488 808 0.02
HSN Inc 1 000 55 014 59 230 0
Hub Group Inc 3 500 118 000 176 330 0.01
Hubbell Inc 500 52 189 61 510 0
Hudson City Bancorp Inc 17 000 154 485 166 940 0.01
Humana Inc 3 600 354 155 459 684 0.02
Huntington Bancshares Inc/OH 12 300 104 880 117 342 0.01
Huntington Ingalls Industries Inc 900 61 802 85 095 0
Huntsman Corp 3 100 59 344 87 079 0.01
Hyster-Yale Materials Handling Inc 2 100 198 057 185 934 0.01
IAC/InterActiveCorp 1 100 58 358 76 153 0
Iberiabank Corp 1 100 59 809 76 109 0
ICU Medical Inc 800 55 789 48 624 0
IDACORP Inc 1 200 55 933 69 408 0
IDEX Corp 11 300 587 283 912 136 0.04
IDEXX Laboratories Inc 600 57 804 80 136 0
Illinois Tool Works Inc 4 100 303 051 358 996 0.02
Illumina Inc 700 58 488 124 978 0.01
Impax Laboratories Inc 6 800 159 804 203 796 0.01
Imperva Inc 1 100 54 212 28 798 0
Independent Bank Corp/MI 15 100 163 203 194 186 0.01
Infinity Property & Casualty Corp 900 55 099 60 444 0
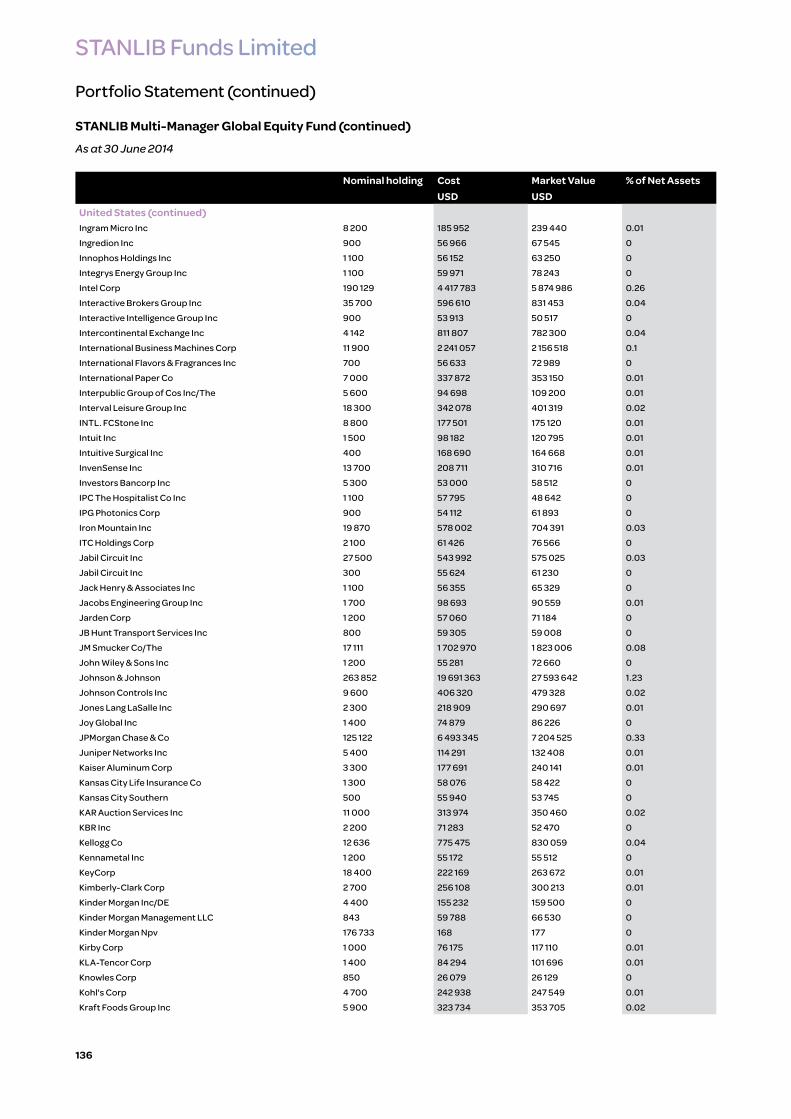
STANLIB Funds Limited
Portfolio Statement (continued)
STANLIB Multi-Manager Global Equity Fund (continued)
As at 30 June 2014
136
Nominal holding Cost Market Value % of Net AssetsUSD USD
United States (continued)Ingram Micro Inc 8 200 185 952 239 440 0.01
Ingredion Inc 900 56 966 67 545 0
Innophos Holdings Inc 1 100 56 152 63 250 0
Integrys Energy Group Inc 1 100 59 971 78 243 0
Intel Corp 190 129 4 417 783 5 874 986 0.26
Interactive Brokers Group Inc 35 700 596 610 831 453 0.04
Interactive Intelligence Group Inc 900 53 913 50 517 0
Intercontinental Exchange Inc 4 142 811 807 782 300 0.04
International Business Machines Corp 11 900 2 241 057 2 156 518 0.1
International Flavors & Fragrances Inc 700 56 633 72 989 0
International Paper Co 7 000 337 872 353 150 0.01
Interpublic Group of Cos Inc/The 5 600 94 698 109 200 0.01
Interval Leisure Group Inc 18 300 342 078 401 319 0.02
INTL. FCStone Inc 8 800 177 501 175 120 0.01
Intuit Inc 1 500 98 182 120 795 0.01
Intuitive Surgical Inc 400 168 690 164 668 0.01
InvenSense Inc 13 700 208 711 310 716 0.01
Investors Bancorp Inc 5 300 53 000 58 512 0
IPC The Hospitalist Co Inc 1 100 57 795 48 642 0
IPG Photonics Corp 900 54 112 61 893 0
Iron Mountain Inc 19 870 578 002 704 391 0.03
ITC Holdings Corp 2 100 61 426 76 566 0
Jabil Circuit Inc 27 500 543 992 575 025 0.03
Jabil Circuit Inc 300 55 624 61 230 0
Jack Henry & Associates Inc 1 100 56 355 65 329 0
Jacobs Engineering Group Inc 1 700 98 693 90 559 0.01
Jarden Corp 1 200 57 060 71 184 0
JB Hunt Transport Services Inc 800 59 305 59 008 0
JM Smucker Co/The 17 111 1 702 970 1 823 006 0.08
John Wiley & Sons Inc 1 200 55 281 72 660 0
Johnson & Johnson 263 852 19 691 363 27 593 642 1.23
Johnson Controls Inc 9 600 406 320 479 328 0.02
Jones Lang LaSalle Inc 2 300 218 909 290 697 0.01
Joy Global Inc 1 400 74 879 86 226 0
JPMorgan Chase & Co 125 122 6 493 345 7 204 525 0.33
Juniper Networks Inc 5 400 114 291 132 408 0.01
Kaiser Aluminum Corp 3 300 177 691 240 141 0.01
Kansas City Life Insurance Co 1 300 58 076 58 422 0
Kansas City Southern 500 55 940 53 745 0
KAR Auction Services Inc 11 000 313 974 350 460 0.02
KBR Inc 2 200 71 283 52 470 0
Kellogg Co 12 636 775 475 830 059 0.04
Kennametal Inc 1 200 55 172 55 512 0
KeyCorp 18 400 222 169 263 672 0.01
Kimberly-Clark Corp 2 700 256 108 300 213 0.01
Kinder Morgan Inc/DE 4 400 155 232 159 500 0
Kinder Morgan Management LLC 843 59 788 66 530 0
Kinder Morgan Npv 176 733 168 177 0
Kirby Corp 1 000 76 175 117 110 0.01
KLA-Tencor Corp 1 400 84 294 101 696 0.01
Knowles Corp 850 26 079 26 129 0
Kohl's Corp 4 700 242 938 247 549 0.01
Kraft Foods Group Inc 5 900 323 734 353 705 0.02

STANLIB Funds Limited
Portfolio Statement (continued)
STANLIB Multi-Manager Global Equity Fund (continued)
As at 30 June 2014
137
Nominal holding Cost Market Value % of Net AssetsUSD USD
United States (continued)Kroger Co/The 14 300 557 398 706 563 0.03
L Brands Inc 2 000 118 321 117 300 0.01
L-3 Communications Holdings Inc 2 000 191 570 241 460 0.01
Laboratory Corp of America Holdings 103 200 9 761 300 10 567 680 0.47
Lam Research Corp 1 700 85 671 114 869 0.01
Lancaster Colony Corp 800 61 262 76 080 0
Landauer Inc 1 200 58 647 50 352 0
Lands' End Inc 300 11 577 10 062 0
Landstar System Inc 1 000 56 592 63 990 0
Laredo Petroleum Inc 7 300 196 779 226 081 0.01
Las Vegas Sands Corp 2 000 132 935 152 440 0.01
Lattice Semiconductor Corp 28 100 188 593 231 544 0.01
Lear Corp 1 900 134 146 169 632 0.01
Leidos Holdings Inc 1 275 54 800 48 858 0
Lennox International Inc 800 58 222 71 656 0
Leucadia National Corp 4 300 118 400 112 703 0.01
Liberty Interactive Corp 6 000 141 870 176 160 0.01
Liberty Media Corp 2 000 276 879 273 300 0.01
Liberty Ventures 1 400 61 439 103 250 0.01
Life Time Fitness Inc 5 100 228 983 248 574 0.01
Lincoln Electric Holdings Inc 900 60 116 62 883 0
Lincoln National Corp 5 900 261 646 303 437 0.01
Lindsay Corp 700 56 123 59 080 0
Linear Technology Corp 79 563 3 070 291 3 744 235 0.17
LinnCo LLC 3 984 114 110 124 620 0.01
Lithia Motors Inc 800 57 032 75 248 0
Littelfuse Inc 700 54 614 65 030 0
LKQ Corp 1 800 56 996 48 024 0
Lockheed Martin Corp 86 372 7 108 960 13 878 253 0.62
Loews Corp 54 587 2 526 898 2 401 828 0.11
Loral Space & Communications Inc 900 60 813 65 421 0
Lorillard Inc 2 600 112 957 158 496 0.01
Lowe's Cos Inc 11 000 517 000 528 000 0.02
Lululemon Athletica Inc 21 500 1 345 470 870 105 0.04
Lumber Liquidators Holdings Inc 500 53 728 37 975 0
M&T Bank Corp 16 028 1 632 189 1 988 434 0.09
Macerich Co/The 1 000 57 010 66 730 0
Macquarie Infrastructure Co LLC 1 100 59 389 68 563 0
Macy's Inc 5 300 230 682 307 400 0.01
Madison Square Garden Co/The 1 000 56 051 62 450 0
Magellan Health Inc 1 000 59 397 62 220 0
Manhattan Associates Inc 2 400 55 308 82 560 0
Manpowergroup Inc 1 700 126 919 144 194 0.01
Marathon Oil Corp 13 200 479 975 526 812 0.02
Marathon Petroleum Corp 8 300 555 530 648 064 0.03
Markel Corp 1 916 1 093 699 1 253 677 0.06
MarketAxess Holdings Inc 1 100 61 517 59 422 0
Marriott International Inc/DE 1 600 68 168 102 560 0.01
Marriott Vacations Worldwide Corp 1 300 57 014 76 193 0
Marsh & McLennan Cos Inc 46 600 1 702 280 2 413 880 0.11
Martin Marietta Materials Inc 7 528 799 273 993 922 0.04
MasterCard Inc 4 000 266 768 293 840 0.01
Mattel Inc 3 400 139 325 132 498 0.01

STANLIB Funds Limited
Portfolio Statement (continued)
STANLIB Multi-Manager Global Equity Fund (continued)
As at 30 June 2014
138
Nominal holding Cost Market Value % of Net AssetsUSD USD
United States (continued)McCormick & Co Inc/MD 900 60 556 64 431 0
McDonald's Corp 52 687 5 180 463 5 307 162 0.23
McGraw Hill Financial Inc 1 700 105 451 141 151 0.01
McKesson Corp 3 700 496 197 688 903 0.03
MDU Resources Group Inc 2 200 59 271 77 176 0
Mead Johnson Nutrition Co 800 59 832 74 536 0
MeadWestvaco Corp 2 000 76 250 88 500 0.01
Measurement Specialties Inc 1 100 56 104 94 666 0.01
Medivation Inc 6 600 274 198 508 662 0.02
MEDNAX Inc 2 700 106 363 156 978 0.01
Medtronic Inc 9 200 492 982 586 684 0.03
MercadoLibre Inc 3 900 332 580 371 514 0.02
Merck & Co Inc 54 805 2 660 192 3 169 921 0.14
Mercury General Corp 1 200 55 833 56 424 0
Meredith Corp 1 300 57 643 62 894 0
Merit Medical Systems Inc 13 800 166 003 208 104 0.01
MetLife Inc 21 800 1 077 223 1 210 554 0.06
Mettler-Toledo International Inc 700 169 559 177 233 0.01
MGE Energy Inc 1 650 57 783 65 142 0
MGM Resorts International 4 000 77 267 105 600 0.01
Micron Technology Inc 6 100 122 976 200 934 0.01
MICROS Systems Inc 1 100 55 054 74 668 0
Microsoft Corp 759 664 22 806 047 31 677 989 1.41
MicroStrategy Inc 500 52 628 70 250 0
Mid-America Apartment Communities Inc 900 56 229 65 736 0
Middleby Corp/The 900 62 579 74 376 0
Minerals Technologies Inc 1 200 55 901 78 636 0
Mohawk Industries Inc 1 300 181 231 179 842 0.01
Molson Coors Brewing Co 46 225 2 376 623 3 427 584 0.15
Mondelez International Inc 22 500 737 058 846 225 0.04
Monolithic Power Systems Inc 6 300 118 144 266 805 0.01
Monsanto Co 50 609 4 644 873 6 311 448 0.28
Monster Beverage Corp 1 000 56 000 71 020 0
Moody's Corp 900 60 763 78 876 0
Moog Inc 1 100 60 374 80 080 0
Morgan Stanley 178 399 5 133 421 5 765 856 0.26
Morningstar Inc 700 54 913 50 267 0
Mosaic Co/The 28 100 1 468 315 1 389 545 0.07
Motorola Solutions Inc 2 300 132 296 153 111 0.01
MRC Global Inc 11 300 302 197 319 677 0.02
MSA Safety Inc 1 100 55 668 63 228 0
MSC Industrial Direct Co Inc 17 872 1 557 469 1 708 742 0.08
MSCI Inc 1 400 55 696 64 176 0
MTS Systems Corp 1 000 60 212 67 670 0
Mueller Industries Inc 2 000 55 798 58 760 0
Murphy Oil Corp 4 100 253 672 272 527 0.01
Mylan Inc/PA 70 987 2 937 354 3 659 380 0.16
NACCO Industries Inc 1 000 55 221 50 520 0
NASDAQ OMX Group Inc/The 6 100 186 905 235 582 0.01
National Fuel Gas Co 900 58 828 70 461 0
National Health Investors Inc 1 000 56 187 62 560 0
National Oilwell Varco Inc 16 068 1 139 714 1 323 039 0.06
National Presto Industries Inc 800 58 084 58 176 0

STANLIB Funds Limited
Portfolio Statement (continued)
STANLIB Multi-Manager Global Equity Fund (continued)
As at 30 June 2014
139
Nominal holding Cost Market Value % of Net AssetsUSD USD
United States (continued)Nationstar Mortgage Holdings Inc 1 100 60 036 39 886 0
Navient Corp 6 600 105 603 116 886 0.01
Navigators Group Inc/The 1 000 56 895 66 990 0
Neogen Corp 1 500 58 199 60 705 0
NetApp Inc 2 700 117 841 98 577 0.01
Netflix Inc 200 60 294 88 120 0.01
NETGEAR Inc 10 500 318 422 364 560 0.02
NeuStar Inc 1 100 57 537 28 622 0
New Jersey Resources Corp 1 300 55 176 74 308 0
New York Community Bancorp Inc 8 900 134 971 142 133 0.01
Newell Rubbermaid Inc 28 100 746 711 870 538 0.04
Newfield Exploration Co 2 900 74 962 128 151 0.01
NewMarket Corp 200 57 149 78 422 0
Newmont Mining Corp 11 500 325 104 292 560 0.01
News Corp 7 700 134 768 138 138 0.01
Nexstar Broadcasting Group Inc 4 000 189 294 206 160 0.01
NextEra Energy Inc 4 800 380 448 491 808 0.02
NIKE Inc 41 448 2 587 704 3 213 463 0.14
NiSource Inc 3 500 103 670 137 655 0.01
Noble Energy Inc 17 400 889 735 1 347 630 0.06
Nordson Corp 800 57 769 64 016 0
Nordstrom Inc 1 500 87 211 101 880 0.01
Norfolk Southern Corp 5 400 389 815 556 200 0.03
Northeast Utilities 3 100 124 263 146 475 0.01
Northern Trust Corp 2 500 138 641 160 525 0.01
Northrop Grumman Corp 4 100 392 987 490 442 0.02
NOW Inc/DE 1 300 40 039 47 086 0
NRG Energy Inc 5 800 152 946 215 702 0.01
Nu Skin Enterprises Inc 600 56 004 44 358 0
Nuance Communications Inc 83 079 1 740 851 1 559 393 0.07
Nucor Corp 3 500 169 207 172 340 0.01
NVIDIA Corp 90 442 1 206 359 1 675 890 0.08
Oasis Petroleum Inc 8 300 324 036 463 887 0.02
Occidental Petroleum Corp 34 840 3 468 826 3 574 236 0.17
Oceaneering International Inc 4 200 240 487 328 020 0.02
Ocwen Financial Corp 1 000 54 995 37 100 0
OGE Energy Corp 1 900 66 738 74 233 0
Oil States International Inc 2 900 147 603 185 803 0.01
Old Dominion Freight Line Inc 1 200 55 100 76 404 0
Omnicare Inc 1 400 78 329 93 198 0.01
Omnicom Group Inc 43 520 2 730 887 3 098 624 0.14
ON Semiconductor Corp 37 000 307 239 337 440 0.02
ONEOK Inc 2 100 94 249 142 947 0.01
OpenTable Inc 800 58 569 82 856 0
Oracle Corp 776 535 26 514 442 31 465 198 1.4
O'Reilly Automotive Inc 700 87 103 105 378 0.01
Oshkosh Corp 1 600 74 918 88 848 0.01
OSI Systems Inc 800 58 254 53 376 0
Outerwall Inc 1 000 49 956 59 350 0
Owens Corning 1 600 63 619 61 888 0
Oxford Industries Inc 900 60 001 60 021 0
PACCAR Inc 3 900 223 491 244 998 0.01
Packaging Corp of America 1 100 61 446 78 628 0

STANLIB Funds Limited
Portfolio Statement (continued)
STANLIB Multi-Manager Global Equity Fund (continued)
As at 30 June 2014
140
Nominal holding Cost Market Value % of Net AssetsUSD USD
United States (continued)Pall Corp 2 200 179 016 187 814 0.01
Palo Alto Networks Inc 1 200 56 504 100 644 0.01
Panera Bread Co 300 50 548 44 937 0
Papa John's International Inc 4 500 157 380 190 665 0.01
Parker Hannifin Corp 1 600 167 240 201 136 0.01
Patterson Cos Inc 1 400 57 872 55 286 0
Paychex Inc 11 550 460 877 479 902 0.02
PBF Energy Inc 4 900 137 213 130 536 0.01
PDC Energy Inc 1 000 58 591 63 110 0
Peabody Energy Corp 5 900 108 980 96 406 0.01
Penn National Gaming Inc 1 000 12 727 12 130 0
Penske Automotive Group Inc 1 400 58 211 69 314 0
People's United Financial Inc 5 500 79 667 83 435 0
Pepco Holdings Inc 4 400 80 064 120 868 0.01
PepsiCo Inc 119 600 8 257 129 10 682 672 0.48
PetSmart Inc 800 57 904 47 840 0
Pfizer Inc 107 211 3 102 696 3 180 950 0.14
PG&E Corp 6 500 272 718 312 000 0.01
Pharmacyclics Inc 1 400 187 724 125 580 0.01
Philip Morris International Inc 150 800 10 849 752 12 709 424 0.57
Phillips 66 16 000 905 626 1 286 560 0.06
Pier 1 Imports Inc 9 800 201 703 151 018 0.01
Pinnacle West Capital Corp 1 300 69 504 75 153 0
Pioneer Natural Resources Co 900 165 208 206 802 0.01
Pitney Bowes Inc 3 500 60 221 96 740 0.01
Plum Creek Timber Co Inc 1 200 55 140 54 120 0
PNC Financial Services Group Inc/The 11 600 856 147 1 032 864 0.05
Polaris Industries Inc 500 62 007 65 120 0
Polypore International Inc 28 800 1 034 146 1 374 048 0.06
Portfolio Recovery Associates Inc 1 000 58 518 59 520 0
Post Holdings Inc 1 400 61 578 71 288 0
Powell Industries Inc 1 000 59 289 65 340 0
Power Integrations Inc 1 100 60 951 63 239 0
PPG Industries Inc 1 100 181 784 231 154 0.01
PPL Corp 8 600 257 527 305 472 0.01
Praxair Inc 102 261 12 456 189 13 581 283 0.61
Precision Castparts Corp 900 209 313 227 142 0.01
Preformed Line Products Co 800 56 836 43 048 0
Priceline Group Inc/The 200 225 338 240 600 0.01
Principal Financial Group Inc 3 900 169 397 196 833 0.01
ProAssurance Corp 1 200 56 188 53 280 0
Procter & Gamble Co/The 104 694 8 185 641 8 224 761 0.37
Progress Software Corp 9 800 231 573 235 494 0.01
Progressive Corp/The 7 000 183 921 177 450 0.01
Prologis Inc 2 500 92 625 102 700 0.01
Prosperity Bancshares Inc 900 54 014 56 331 0
Protective Life Corp 1 400 61 616 97 062 0.01
Proto Labs Inc 800 59 863 65 552 0
Prudential Financial Inc 10 100 814 929 896 577 0.04
PS Business Parks Inc 800 58 591 66 752 0
PTC Inc 12 800 289 461 496 640 0.02
Public Service Enterprise Group Inc 7 700 245 014 314 006 0.02
PulteGroup Inc 6 600 130 894 133 056 0.01

STANLIB Funds Limited
Portfolio Statement (continued)
STANLIB Multi-Manager Global Equity Fund (continued)
As at 30 June 2014
141
Nominal holding Cost Market Value % of Net AssetsUSD USD
United States (continued)PVH Corp 1 600 192 658 186 560 0.01
QEP Resources Inc 2 700 76 724 93 150 0.01
Quaker Chemical Corp 800 54 367 61 360 0
QUALCOMM Inc 185 100 11 890 928 14 658 069 0.65
Quest Diagnostics Inc 1 800 111 583 105 624 0.01
Questcor Pharmaceuticals Inc 900 57 592 83 142 0
Rackspace Hosting Inc 1 100 57 396 37 015 0
RAIT Financial Trust 14 200 95 728 117 292 0.01
Ralph Lauren Corp 1 100 175 048 176 704 0.01
Range Resources Corp 2 100 177 842 182 553 0.01
Raymond James Financial Inc 7 000 300 605 354 970 0.02
Rayonier Advanced Materials Inc 333 14 084 12 904 0
Rayonier Inc 1 000 41 445 35 530 0
Raytheon Co 4 500 348 863 415 080 0.02
RBC Bearings Inc 900 55 799 57 645 0
Realogy Holdings Corp 1 300 56 570 49 023 0
Red Hat Inc 1 100 58 130 60 764 0
Red Robin Gourmet Burgers Inc 800 54 939 56 928 0
Redwood Trust Inc 23 500 340 041 457 310 0.02
Regal-Beloit Corp 4 700 309 691 369 185 0.02
Regeneron Pharmaceuticals Inc 200 54 757 56 494 0
Regions Financial Corp 29 700 291 566 315 414 0.02
Reinsurance Group of America Inc 7 200 429 983 567 288 0.03
Reliance Steel & Aluminum Co 900 64 045 66 339 0
Republic Services Inc 3 700 123 007 140 415 0.01
ResMed Inc 1 100 58 871 55 682 0
Reynolds American Inc 2 200 108 872 132 748 0.01
Rite Aid Corp 22 400 81 202 160 608 0.01
Riverbed Technology Inc 16 800 270 025 346 416 0.02
RLI Corp 1 400 56 747 64 022 0
Rock-Tenn Co 5 900 505 043 622 686 0.03
Rockwell Automation Inc 900 95 767 112 617 0.01
Rockwell Collins Inc 1 100 80 981 85 943 0
Rockwood Holdings Inc 900 58 721 68 373 0
Rogers Corp 1 000 59 789 66 340 0
Rosetta Resources Inc 1 200 59 826 65 808 0
Ross Stores Inc 1 600 113 432 105 808 0.01
Royal Gold Inc 1 100 56 065 83 699 0
RR Donnelley & Sons Co 6 516 105 455 110 511 0.01
RTI Surgical Inc 23 700 91 005 102 858 0.01
Ryder System Inc 3 500 205 749 308 280 0.01
Ryland Group Inc/The 10 100 434 894 398 344 0.02
Ryman Hospitality Properties Inc 887 35 323 42 709 0
Safety Insurance Group Inc 1 100 56 545 56 430 0
Safeway Inc 11 100 304 374 380 952 0.02
salesforce.com inc 1 100 54 962 63 877 0
Salix Pharmaceuticals Ltd 900 60 137 110 979 0.01
Sanderson Farms Inc 900 58 612 87 444 0.01
SanDisk Corp 2 400 144 228 250 584 0.01
SBA Communications Corp 2 000 180 899 204 600 0.01
Sberbank-Sponsored 52 189 567 296 528 414 0.02
SCANA Corp 1 700 77 784 91 443 0.01
Schlumberger Ltd 108 400 8 459 338 12 785 780 0.57

STANLIB Funds Limited
Portfolio Statement (continued)
STANLIB Multi-Manager Global Equity Fund (continued)
As at 30 June 2014
142
Nominal holding Cost Market Value % of Net AssetsUSD USD
United States (continued)Schweitzer-Mauduit International Inc 1 000 60 027 43 620 0
Science Applications International Corp 728 24 787 32 141 0
Scotts Miracle-Gro Co/The 1 000 55 536 56 830 0
Scripps Networks Interactive Inc 4 400 327 973 356 928 0.02
Seaboard Corp 47 131 825 141 470 0.01
SEACOR Holdings Inc 600 53 099 49 350 0
Sears Holdings Corp 1 000 49 444 39 930 0
Seattle Genetics Inc 44 300 1 468 765 1 694 032 0.08
SemGroup Corp 1 100 59 626 86 713 0
Sempra Energy 2 400 205 247 251 232 0.01
Service Corp International/US 10 500 192 407 217 455 0.01
Shutterstock Inc 1 000 57 368 82 960 0
Sigma-Aldrich Corp 18 408 1 546 723 1 867 860 0.08
Signature Bank/New York NY 700 63 015 88 326 0.01
Silgan Holdings Inc 1 200 56 944 60 984 0
Simon Property Group Inc 1 300 189 079 216 112 0.01
Sirius XM Holdings Inc 16 900 63 798 58 474 0
Sirona Dental Systems Inc 900 59 893 74 214 0
SL Green Realty Corp 1 000 96 808 109 350 0.01
SLM Corp 6 600 58 704 54 846 0
SM Energy Co 800 60 132 67 296 0
Snap-on Inc 600 59 097 71 052 0
Solera Holdings Inc 1 100 58 304 73 843 0
Sotheby's 1 200 57 895 50 376 0
South Jersey Industries Inc 5 300 281 621 319 961 0.02
Southern Co/The 10 900 450 558 494 424 0.02
Southwest Gas Corp 1 200 56 046 63 324 0
Southwestern Energy Co 3 100 118 746 140 957 0.01
Sovran Self Storage Inc 800 56 355 61 784 0
Spectra Energy Corp 5 700 188 300 242 079 0.01
Spectrum Brands Holdings Inc 900 60 669 77 409 0
Sprint Corp 10 300 68 856 87 756 0.01
SPS Commerce Inc 900 60 950 56 871 0
St Jude Medical Inc 2 700 143 330 186 948 0.01
StanCorp Financial Group Inc 3 200 129 251 204 768 0.01
Stanley Black & Decker Inc 1 600 143 517 140 480 0.01
Staples Inc 20 400 275 019 220 728 0.01
Starbucks Corp 23 899 1 423 536 1 849 305 0.08
Starwood Hotels & Resorts Worldwide Inc 1 200 81 882 96 972 0.01
Starz 5 400 143 651 160 704 0.01
State Street Corp 7 700 521 612 517 671 0.02
Stepan Co 1 000 56 281 52 840 0
Stericycle Inc 500 57 363 59 205 0
Steven Madden Ltd 7 350 275 037 252 031 0.01
Stifel Financial Corp 1 400 59 447 66 248 0
Stryker Corp 2 400 166 812 202 320 0.01
Sturm Ruger & Co Inc 1 000 59 121 58 990 0
SunTrust Banks Inc 10 400 346 180 416 520 0.02
Superior Energy Services Inc 74 403 1 928 361 2 689 668 0.12
SUPERVALU Inc 19 000 141 911 155 990 0.01
Susser Holdings Corp 1 100 57 706 88 836 0.01
Symantec Corp 90 056 1 921 360 2 062 282 0.09
SYNNEX Corp 1 000 60 412 72 810 0

STANLIB Funds Limited
Portfolio Statement (continued)
STANLIB Multi-Manager Global Equity Fund (continued)
As at 30 June 2014
143
Nominal holding Cost Market Value % of Net AssetsUSD USD
United States (continued)Synovus Financial Corp 9 000 212 324 219 420 0.01
Sysco Corp 8 100 264 344 303 345 0.01
T Rowe Price Group Inc 1 300 93 086 109 733 0.01
Tableau Software Inc 5 400 445 908 385 236 0.02
Talmer Bancorp Inc 10 200 132 600 140 352 0.01
Targa Resources Corp 800 56 325 111 664 0.01
Target Corp 12 000 749 893 695 160 0.03
Taubman Centers Inc 900 61 489 68 202 0
Team Inc 5 500 228 197 225 225 0.01
Tech Data Corp 2 000 100 814 125 020 0.01
Techne Corp 800 62 093 74 040 0
Teledyne Technologies Inc 700 57 978 67 942 0
Teleflex Inc 700 55 462 73 892 0
Tenet Healthcare Corp 1 800 69 509 84 456 0
Tennant Co 1 000 56 759 76 290 0
Tenneco Inc 1 200 59 513 78 840 0
Teradata Corp 900 53 618 36 171 0
Tesoro Corp 4 500 225 009 264 015 0.01
Texas Industries Inc 900 56 847 83 142 0
Texas Instruments Inc 42 230 1 752 308 2 018 172 0.09
Textron Inc 3 500 99 488 133 980 0.01
Thermo Fisher Scientific Inc 3 000 273 240 354 000 0.02
Thor Industries Inc 1 100 56 885 62 535 0
Tidewater Inc 1 000 57 850 56 140 0
Tiffany & Co 2 300 196 354 230 506 0.01
Time Inc 1 700 35 327 41 174 0
Time Warner Cable Inc 3 700 409 128 544 936 0.03
Time Warner Inc 55 353 2 874 675 3 887 995 0.17
Timken Co 900 56 394 61 056 0
TJX Cos Inc 6 000 322 414 318 900 0.01
T-Mobile US Inc 73 872 2 440 218 2 482 838 0.11
Torchmark Corp 1 300 93 776 106 457 0.01
Toro Co/The 1 100 60 003 69 938 0
Towers Watson & Co 4 723 410 355 492 373 0.02
Tractor Supply Co 800 52 174 48 312 0
TransDigm Group Inc 1 100 182 671 183 942 0.01
Travelers Cos Inc/The 30 425 2 639 858 2 861 167 0.13
TreeHouse Foods Inc 800 55 399 63 992 0
Trinity Industries Inc 2 600 58 355 113 620 0.01
TripAdvisor Inc 800 58 741 86 896 0
Triumph Group Inc 3 900 274 930 272 181 0.01
Trulia Inc 1 200 58 030 56 868 0
TRW Automotive Holdings Corp 2 800 199 695 250 712 0.01
Tupperware Brands Corp 3 500 227 818 292 915 0.01
Twenty-First Century Fox Inc A Shares 11 700 378 086 411 255 0.02
Twenty-First Century Fox Inc B Shares 3 000 98 369 102 660 0.01
Tyler Technologies Inc 700 55 947 63 826 0
Tyson Foods Inc 7 200 217 404 270 360 0.01
Ulta Salon Cosmetics & Fragrance Inc 500 58 510 45 705 0
UMB Financial Corp 1 100 58 115 69 674 0
Under Armour Inc 1 400 53 310 83 286 0
Union Pacific Corp 46 636 3 246 974 4 651 941 0.21
Unit Corp 1 200 56 032 82 548 0

STANLIB Funds Limited
Portfolio Statement (continued)
STANLIB Multi-Manager Global Equity Fund (continued)
As at 30 June 2014
144
Nominal holding Cost Market Value % of Net AssetsUSD USD
United States (continued)United Natural Foods Inc 900 57 746 58 581 0
United Parcel Service Inc 4 600 414 377 472 190 0.02
United Rentals Inc 1 000 55 865 104 770 0.01
United States Steel Corp 4 200 85 122 109 284 0.01
United Stationers Inc 1 400 56 987 58 030 0
United Technologies Corp 73 800 5 784 325 8 518 734 0.38
United Therapeutics Corp 800 62 107 70 792 0
UnitedHealth Group Inc 187 000 9 465 755 15 283 510 0.68
Universal Corp/VA 1 100 56 954 60 863 0
Universal Health Services Inc 900 63 799 86 148 0
Unum Group 5 400 169 108 187 650 0.01
Urban Outfitters Inc 1 500 57 457 50 775 0
URS Corp 1 500 78 758 68 745 0
US Bancorp/MN 247 172 8 876 350 10 702 548 0.48
Valero Energy Corp 18 900 655 594 946 701 0.04
Valmont Industries Inc 400 56 481 60 756 0
Valspar Corp/The 900 57 172 68 544 0
Varian Medical Systems Inc 103 786 6 264 502 8 627 730 0.39
Ventas Inc 1 300 82 098 83 317 0
Vera Bradley Inc 4 900 118 260 107 163 0.01
VeriSign Inc 57 600 2 807 617 2 810 880 0.12
Verisk Analytics Inc 900 59 412 54 000 0
Verizon Communications Inc 125 356 5 880 566 6 129 908 0.27
Vertex Pharmaceuticals Inc 700 56 973 66 269 0
VF Corp 2 400 117 713 151 152 0.01
Viacom Inc 4 600 379 753 398 958 0.02
ViaSat Inc 900 58 601 52 137 0
Virtus Investment Partners Inc 1 100 219 586 232 067 0.01
Visa Inc 28 700 5 111 513 6 046 803 0.27
Visteon Corp 1 100 88 870 106 711 0.01
VMware Inc 600 52 776 58 074 0
Vornado Realty Trust 1 000 84 325 106 710 0.01
Vulcan Materials Co 1 100 57 473 70 136 0
WABCO Holdings Inc 700 57 789 74 788 0
Wabtec Corp/DE 900 55 174 74 295 0
Waddell & Reed Financial Inc 1 100 56 092 68 849 0
WageWorks Inc 6 000 260 063 289 260 0.01
Walgreen Co 9 600 530 282 711 360 0.03
Wal-Mart Stores Inc 81 405 6 048 007 6 107 817 0.27
Walt Disney Co/The 78 156 5 421 637 6 700 314 0.3
Washington Prime Group Inc 500 8 863 9 370 0
Waste Management Inc 4 600 188 025 205 666 0.01
Waters Corp 82 700 6 935 688 8 634 707 0.39
Watsco Inc 1 900 183 058 195 225 0.01
Watts Water Technologies Inc 1 000 55 653 61 670 0
WD-40 Co 900 56 571 67 653 0
Web.com Group Inc 6 500 100 815 187 525 0.01
WellCare Health Plans Inc 800 54 517 59 720 0
WellPoint Inc 21 565 1 533 073 2 320 178 0.1
Wells Fargo & Co 175 493 7 670 171 9 220 402 0.41
WESCO International Inc 6 700 448 980 578 344 0.03
West Pharmaceutical Services Inc 1 400 55 300 59 052 0
Westamerica Bancorporation 1 200 57 129 62 688 0

STANLIB Funds Limited
Portfolio Statement (continued)
STANLIB Multi-Manager Global Equity Fund (continued)
As at 30 June 2014
145
Nominal holding Cost Market Value % of Net AssetsUSD USD
United States (continued)Western Digital Corp 3 100 201 540 286 130 0.01
Western Union Co/The 6 800 125 766 117 844 0.01
WEX Inc 700 58 912 73 479 0
Weyerhaeuser Co 5 000 141 575 165 450 0.01
WGL Holdings Inc 1 400 57 184 60 326 0
Whirlpool Corp 7 400 706 092 1 030 006 0.05
Whiting Petroleum Corp 1 600 84 414 128 368 0.01
Whole Foods Market Inc 3 400 161 876 131 342 0
Williams Cos Inc/The 4 600 162 495 267 674 0.01
Williams-Sonoma Inc 31 393 2 029 407 2 253 703 0.1
Windstream Holdings Inc 9 100 77 305 90 545 0.01
Wisconsin Energy Corp 2 200 87 153 103 202 0.01
Wolverine World Wide Inc 2 000 56 193 52 100 0
World Acceptance Corp 1 900 180 950 144 305 0.01
World Fuel Services Corp 2 900 108 383 142 738 0.01
WP Carey Inc 900 58 492 57 960 0
WR Berkley Corp 1 800 74 961 83 376 0
WR Grace & Co 700 59 941 66 045 0
WSFS Financial Corp 1 000 59 615 73 560 0
WW Grainger Inc 800 205 268 203 360 0.01
Wyndham Worldwide Corp 1 200 75 703 90 852 0.01
Wynn Resorts Ltd 400 59 864 83 016 0
Xcel Energy Inc 6 600 179 517 212 586 0.01
Xerox Corp 30 400 311 035 378 176 0.02
Xilinx Inc 1 800 85 926 85 158 0
Xoom Corp 1 800 57 235 47 448 0
Xylem Inc/NY 2 100 57 085 82 047 0
Yahoo! Inc 10 000 296 450 351 200 0.02
Yum! Brands Inc 2 700 195 480 219 186 0.01
Zebra Technologies Corp 1 300 58 213 107 029 0.01
Zillow Inc 600 57 494 85 752 0
Zimmer Holdings Inc 1 600 129 968 166 144 0.01
Zoetis Inc 4 600 143 037 148 396 0.01
Total United States 39.46% (31 December 2013: 38.00%) 885 550 485 39.46Total Common Stock 94.70% (31 December 2013: 93.59%) 2 125 258 688 94.7
Preferred Stock
Nominal holding Cost Market Value % of Net AssetsUSD USD
AustraliaMultiplex SITES Trust 609 47 121 49 434 0
Total Australia 0.00% (31 December 2013: 0.00%) 49 434 0
BrazilAlpargatas SA 49 100 260 210 254 176 0.01
Banco Bradesco SA 40 500 517 039 588 910 0.03
Bradespar SA 6 100 69 348 55 905 0
Cia Brasileira de Distribuicao 3 000 127 743 139 594 0.01
Cia Energetica de Minas Gerais 14 907 95 442 109 159 0.01
Cia Energetica de Sao Paulo 4 700 49 347 59 280 0
Cia Paranaense de Energia 3 600 49 510 54 912 0
Gerdau SA 23 400 170 470 137 377 0.01

STANLIB Funds Limited
Portfolio Statement (continued)
STANLIB Multi-Manager Global Equity Fund (continued)
As at 30 June 2014
146
Nominal holding Cost Market Value % of Net AssetsUSD USD
Brazil (continued)Itau Unibanco Holding SA 46 680 578 205 675 600 0.03
Itausa - Investimentos Itau SA 69 850 241 878 275 391 0.01
Metalurgica Gerdau SA 14 900 137 361 104 579 0
Oi SA 31 800 59 976 28 133 0
Petroleo Brasileiro SA 139 900 1 074 607 1 096 172 0.05
Telefonica Brasil SA 5 200 111 421 106 118 0.01
Vale SA 117 600 1 757 518 1 402 168 0.06
Total Brazil 0.23% (31 December 2013: 0.21%) 5 087 474 0.23
GermanyBayerische Motoren Werke AG 1 380 111 359 132 372 0.01
Biotest AG 815 71 171 105 336 0
Fuchs Petrolub SE 1 702 71 795 76 946 0
Henkel AG & Co KGaA 1 286 125 621 148 358 0.01
Porsche Automobil Holding SE 5 609 523 097 585 332 0.03
Sartorius AG 900 103 100 108 768 0.01
Volkswagen AG 26 805 6 723 399 7 035 350 0.31
Total Germany 0.37% (31 December 2013: 0.43%) 8 192 462 0.37
Korea, Republic of (South Korea)Hyundai Motor Co 2 000 237 442 295 513 0.01
Hyundai Motor Co (Pref) 5 100 651 458 796 402 0.04
Samsung Electronics Co Ltd 1 160 974 578 1 215 260 0.05
Total Korea, Republic of (South Korea) 0.10% (31 December 2013: 0.05%)
2 307 175 0.1
United KingdomRolls-Royce Holdings Prf 28 865 342 – 49 071 0
Total United Kingdom 0.00% (31 December 2013: 0.00%) 49 071 0Total Preferred Stock 0.70% (31 December 2013: 0.69%) 15 685 616 0.7
Investment Companies
Nominal holding Cost Market Value % of Net AssetsUSD USD
Total Ireland 0.00% (31 December 2013: 0.63%)
LuxembourgCapital International Emerging Markets Fund 276 547 32 043 921 32 693 408 1.46
DB x-trackers CSI300 Index UCITS ETF-EUR 325 000 2 241 787 2 267 135 0.1
Total Luxembourg 1.56% (31 December 2013: 1.52%) 34 960 543 1.56Total United States 0.00% (31 December 2013: 0.26%)Total Investment Companies 1.56% (31 December 2013: 2.41%)
34 960 543 1.56
Warrant
Nominal holding Cost Market Value % of Net AssetsUSD USD
FrancePeugeot SA 29/04/2017 33 124 – 72 608 0
Total France 0.00% (31 December 2013: 0.00%) 72 608 0
Hong KongSun Hung Kai Properties Ltd 22/04/2016 2 000 – 2 611 0
Total Hong Kong 0.00% (31 December 2013: 0.00%) 2 611 0Total Singapore 0.00% (31 December 2013: 0.00%)

STANLIB Funds Limited
Portfolio Statement (continued)
STANLIB Multi-Manager Global Equity Fund (continued)
As at 30 June 2014
147
Nominal holding Cost Market Value % of Net AssetsUSD USD
United Arab EmiratesFirst Gulf Bank PJSC 14/08/2015 23 500 102 741 102 695 0.01
Total United Arab Emirates 0.01% (31 December 2013: 0.00%)
102 695 0.01
Total Warrant 0.01% (31 December 2013: 0.00%) 177 914 0.01
Right
Nominal holding Cost Market Value % of Net AssetsUSD USD
BrazilB2W Cia Digital - Rights 17/07/2014 22 452 – 19 863 0
Total Brazil 0.00% (31 December 2013: 0.00%) 19 863 0
FranceAir Liquide(L') - Rights 07/03/2014 16 – 216 0
Eurazeo - Rights 04/07/2014 6 – 25 0
Total France 0.00% (31 December 2013: 0.00%) 241 0
GermanyDeutsche Bank AG - Rights 06/07/2014 9 – 14 0
Total Germany 0.00% (31 December 2013: 0.00%) 14 0
Hong KongHKT Trust and HKT - Rights 28/07/2014 109 620 – 31 538 0
Total Hong Kong 0.00% (31 December 2013: 0.00%) 31 538 0
ItalyBanca Monte dei Paschi di Siena - Rights 30/06/2015 2 731 70 695 78 035 0.01
Banca Popolare dell'Emilia Romagna SC - Rights 21/07/2014 10 265 – 8 742 0
Total Italy 0.01% (31 December 2013: 0.00%) 86 777 0.01
MalaysiaPublic Bank Berhad - Rights 01/08/2014 8 880 – 15 127 0
Total Malaysia 0.00% (31 December 2013: 0.00%) 15 127 0Total Poland 0.00% (31 December 2013: 0.00%)
SpainAcerinox S.A. - Rights 18/07/2014 26 285 – 15 942 0
Repsol S.A. - Rights 30/07/2014 28 524 – 19 331 0
Total Spain 0.00% (31 December 2013: 0.00%) 35 273 0Total Right 0.01% (31 December 2013: 0.00%) 188 833 0.01Total Investments 1 840 247 949 2 176 271 594 96.98Net current assets* 67 806 899 3.02
Total net assets 2 244 078 493 100
*Net current assets include derivative positions. Please refer to note 12 for details of these.

STANLIB Funds Limited
148
Portfolio Statement (continued)
High Alpha Global Equity Fund
As at 30 June 2014
Transferable securities listed on an exchange or dealt in on another regulated market.
Common Stock
Nominal holding Cost USD Market Value USD % of Net AssetsBelgiumAnheuser-Busch InBev NV 184 183 17 891 240 21 154 725 2.09
Total Belgium 2.09% (31 December 2013: 1.44%) 21 154 725 2.09
BermudaMarkit Ltd 249 087 6 449 574 6 715 386 0.66
Total Bermuda 0.66% (31 December 2013: 0.00%) 6 715 386 0.66
CanadaMethanex Corp 155 500 5 736 413 9 601 674 0.95
Suncor Energy Inc 502 400 16 541 749 21 437 408 2.11
Total Canada 3.06% (31 December 2013: 2.94%) 31 039 082 3.06
ChinaPing An Insurance Group Co of China Ltd 896 500 8 156 216 6 934 517 0.69
Total China 0.69% (31 December 2013: 1.38%) 6 934 517 0.69
ColombiaBancolombia SA 105 000 5 031 566 6 070 050 0.6
Total Colombia 0.60% (31 December 2013: 0.00%) 6 070 050 0.6FranceTotal SA 265 506 18 242 196 19 168 126 1.89
Total France 1.89% (31 December 2013: 0.00%) 19 168 126 1.89
GermanyBrenntag AG Npv 71 073 10 295 430 12 718 265 1.26
Continental AG 66 974 11 707 040 15 533 427 1.53
Total Germany 2.79% (31 December 2013: 3.77%) 28 251 692 2.79Total Hong Kong 0.00% (31 December 2013: 0.64%)
IndonesiaBank Rakyat Indonesia Persero Tbk PT 6 059 000 5 040 295 5 276 783 0.52
Total Indonesia 0.52% (31 December 2013: 0.00%) 5 276 783 0.52
IrelandBank of Ireland 43 976 650 17 027 571 14 811 336 1.46
Covidien Plc 78 121 4 362 431 7 048 076 0.7
Total Ireland 2.16% (31 December 2013: 1.30%) 21 859 412 2.16
JapanJapan Exchange Group Inc 646 500 15 988 028 15 915 989 1.57
Mazda Motor Corp 4 052 000 18 400 774 18 999 018 1.88
Mitsui Fudosan Co Ltd 384 000 12 617 595 12 933 312 1.28
Nomura Holdings Inc 2 146 700 15 094 684 15 193 484 1.5
Ryohin Keikaku Co Ltd 61 800 5 542 933 7 003 250 0.69
Sekisui Chemical Co Ltd 1 686 000 19 247 928 19 488 811 1.92
Shimadzu Corp 812 000 7 497 088 7 438 326 0.73
Sumitomo Mitsui Trust Holdings Inc 3 632 000 17 264 586 16 563 736 1.64
Taiheiyo Cement Corp 2 610 000 10 487 816 10 511 514 1.04
Total Japan 12.25% (31 December 2013: 12.44%) 124 047 440 12.25
JerseyWolseley Plc 307 692 17 667 518 16 851 214 1.66
Total Jersey 1.66% (31 December 2013: 0.00%) 16 851 214 1.66
Korea, Republic of (South Korea)Samsung Electronics Co Ltd 14 496 16 390 423 18 925 891 1.87
Total Korea, Republic of (South Korea) 1.87% (31 December 2013: 1.40%)
18 925 891 1.87
MexicoFomento Economico Mexicano SAB de CV ADR 127 100 11 888 811 11 902 915 1.18

STANLIB Funds Limited
Portfolio Statement (continued)
High Alpha Global Equity Fund (continued)
As at 30 June 2014
149
Nominal holding Cost USD Market Value USD % of Net AssetsMexico (continued)Grupo Financiero Banorte SAB de CV 1 761 900 11 543 445 12 602 166 1.24
Total Mexico 2.42% (31 December 2013: 0.00%) 24 505 081 2.42
NetherlandsAegon NV 1 629 640 14 626 275 14 221 705 1.4
Total Netherlands 1.40% (31 December 2013: 0.72%) 14 221 705 1.4
SingaporeGlobal Logistic Properties Ltd 2 492 000 5 691 283 5 377 238 0.53
Total Singapore 0.53% (31 December 2013: 0.48%) 5 377 238 0.53
SwedenNordea Bank AB 558 239 7 806 911 7 874 240 0.78
Total Sweden 0.78% (31 December 2013: 0.00%) 7 874 240 0.78
SwitzerlandNestle SA 255 815 17 219 322 19 817 809 1.96
TE Connectivity Ltd 222 328 7 937 916 13 746 540 1.36
UBS AG 958 000 18 880 697 17 576 235 1.73
Total Switzerland 5.05% (31 December 2013: 8.42%) 51 140 584 5.05
United KingdomAon Plc 111 600 6 858 196 10 052 928 0.99
BG Group Plc 772 172 14 476 884 16 305 647 1.61
HSBC Holdings Plc 1 419 150 14 468 597 14 386 917 1.42
Liberty Global Plc Series A 131 726 5 139 538 5 824 924 0.58
Liberty Global Plc Series C 118 026 4 417 823 4 994 860 0.49
Tullow Oil Plc 465 716 9 006 558 6 792 468 0.67
Unilever Plc 357 808 14 447 577 16 212 638 1.6
Total United Kingdom 7.36% (31 December 2013: 11.01%) 74 570 382 7.36
United StatesAirgas Inc 120 454 11 411 054 13 117 441 1.29
American Express Co 166 840 9 749 578 15 824 774 1.56
American International Group Inc 259 111 8 951 782 14 139 687 1.4
Amgen Inc 79 442 8 991 048 9 403 550 0.93
Amphenol Corp 106 600 9 890 722 10 266 646 1.01
Apollo Global Management LLC 415 600 13 535 476 11 520 432 1.14
Apple Inc 256 557 18 671 174 23 841 842 2.35
Applied Materials Inc 453 300 10 265 593 10 221 915 1.01
Blackstone Group LP 332 021 6 548 647 11 102 782 1.1
Bristol-Myers Squibb Co 212 950 11 263 002 10 325 945 1.02
Charter Communications Inc 93 500 12 759 167 14 807 595 1.46
Comcast Corp Class A 262 443 11 339 400 14 087 940 1.39
Copa Holdings SA 101 868 12 734 979 14 523 321 1.43
Discover Financial Services 138 192 4 806 873 8 563 758 0.85
Enterprise Products Partners LP 68 651 3 921 197 5 371 941 0.53
Estee Lauder Cos Inc/The 136 600 9 766 263 10 142 550 1
Facebook Inc 170 945 7 669 113 11 501 180 1.14
Gilead Sciences Inc 279 021 20 601 998 23 133 631 2.28
Google Inc Class A 24 028 9 576 939 14 048 210 1.39
Google Inc Class C 19 628 7 165 024 11 291 400 1.11
Halliburton Co 156 600 10 064 340 11 117 034 1.1
Hewlett-Packard Co 436 000 14 402 968 14 680 120 1.45
JPMorgan Chase & Co 355 019 16 038 219 20 441 994 2.02
Lam Research Corp 193 923 7 860 991 13 103 377 1.29
MasterCard Inc 127 110 7 490 396 9 337 501 0.92
Mead Johnson Nutrition Co 117 096 9 110 236 10 909 834 1.08
NIKE Inc 130 000 9 994 583 10 078 900 0.99
Occidental Petroleum Corp 156 543 14 403 510 16 059 746 1.59

STANLIB Funds Limited
Portfolio Statement (continued)
High Alpha Global Equity Fund (continued)
As at 30 June 2014
150
Nominal holding Cost USD Market Value USD % of Net AssetsUnited States (continued)Pfizer Inc 763 472 21 048 640 22 652 214 2.24
Praxair Inc 75 483 9 913 922 10 024 897 0.99
Priceline Group Inc/The 8 640 6 043 359 10 393 920 1.03
QUALCOMM Inc 88 695 4 997 708 7 023 757 0.69
Sabre Corp 214 623 3 544 315 4 298 899 0.42
Sirona Dental Systems Inc 157 991 10 163 382 13 027 938 1.29
TJX Cos Inc 165 000 9 424 148 8 769 750 0.87
Union Pacific Corp 101 454 6 821 714 10 120 036 1
United Rentals Inc 192 801 9 663 128 20 199 761 1.99
Visa Inc 58 700 11 996 266 12 367 503 1.22
Walt Disney Co/The 155 482 8 773 575 13 329 472 1.32
WESCO International Inc 239 130 17 726 770 20 641 702 2.04
Total United States 50.93% (31 December 2013: 52.47%) 515 814 895 50.93Total Common Stock 98.71% (31 December 2013: 98.41%) 999 798 443 98.71Total Investments 866 192 126 999 798 443 98.71Net current assets 13 053 255 1.29
Total net assets 1 012 851 698 100

STANLIB Funds Limited
151
Portfolio Statement (continued)
STANLIB Global Bond Fund
As at 30 June 2014
Transferable securities listed on an exchange or dealt in on another regulated market.
Bonds
Nominal holding Cost USD Market Value USD % of Net AssetsAustraliaMacquarie Group Ltd 1.22% 31/01/2017 1 770 000 1 770 000 1 772 248 1.35
New South Wales Treasury Corp 5.00% 20/08/2024 6 485 000 5 928 279 6 683 305 5.08
Queensland Treasury Corp 6.25% 21/02/2020 4 520 000 4 605 553 4 887 571 3.72
Queensland Treasury Corp 6.00% 21/07/2022 1 930 000 1 963 153 2 100 629 1.6
Total Australia 11.75% (31 December 2013: 8.63%) 15 443 753 11.75BrazilBrazil Notas do Tesouro Nacional Serie F 10.00% 01/01/2017 2 150 000 1 075 478 943 050 0.72
Brazil Notas do Tesouro Nacional Serie F 10.00% 01/01/2021 1 480 000 639 618 613 546 0.46
Brazil Notas do Tesouro Nacional Serie F 10.00% 01/01/2023 3 010 000 1 249 983 1 222 042 0.93
Total Brazil 2.11% (31 December 2013: 2.12%) 2 778 638 2.11
FranceDexia Credit Local SA/New York NY 0.63% 11/01/2017 3 460 000 3 460 000 3 472 172 2.64
Total France 2.64% (31 December 2013: 2.21%) 3 472 172 2.64
GermanyErste Abwicklungsanstalt 0.53% 29/01/2016 1 000 000 1 001 699 1 003 400 0.76
Erste Abwicklungsanstalt 0.43% 07/06/2016 2 000 000 2 003 723 2 004 380 1.53
Total Germany 2.29% (31 December 2013: 2.88%) 3 007 780 2.29
HungaryHungary Government Bond 5.50% 12/02/2016 420 000 000 1 846 251 1 952 580 1.49
Total Hungary 1.49% (31 December 2013: 1.29%) 1 952 580 1.49
ItalyItaly Buoni Poliennali Del Tesoro 5.00% 01/08/2039 3 940 000 4 809 018 6 400 498 4.87
Total Italy 4.87% (31 December 2013: 3.58%) 6 400 498 4.87
Korea, Republic of (South Korea)Export-Import Bank of Korea 0.98% 14/01/2017 840 000 840 000 845 684 0.64
Export-Import Bank of Korea 0.82% 12/05/2017 1 805 000 1 805 000 1 807 561 1.38
Export-Import Bank of Korea 0.85% 14/08/2017 1 585 000 1 585 000 1 583 804 1.21
Korea Treasury Bond 5.75% 10/09/2018 4 240 000 000 4 227 636 4 731 840 3.6
Korea Treasury Bond 3.38% 10/09/2023 1 507 000 000 1 429 729 1 516 042 1.15
Total Korea, Republic of (South Korea) 7.98% (31 December 2013: 4.65%)
10 484 931 7.98
MalaysiaMalaysia Government Bond 4.05% 30/09/2021 3 355 000 1 032 372 1 053 674 0.8
Malaysia Government Bond 3.48% 15/03/2023 5 395 000 1 666 925 1 616 110 1.23
Total Malaysia 2.03% (31 December 2013: 0.94%) 2 669 784 2.03
MexicoMexican Bonos 8.50% 31/05/2029 68 810 000 6 080 354 6 479 425 4.93
Mexican Bonos 8.50% 18/11/2038 55 000 000 4 679 420 5 167 140 3.93
Mexican Bonos 7.75% 13/11/2042 91 100 000 7 163 574 7 952 119 6.05
Total Mexico 14.91% (31 December 2013: 2.06%) 19 598 684 14.91
NetherlandsABN AMRO Bank NV 1.03% 28/10/2016 2 165 000 2 165 000 2 182 686 1.66
Achmea Bank NV 3.20% 03/11/2014 595 000 600 747 600 758 0.46
Bank Nederlandse Gemeenten 0.50% 08/02/2016 355 000 356 110 356 379 0.27
Bank Nederlandse Gemeenten 0.40% 18/07/2016 3 496 000 3 501 952 3 504 076 2.66
Nederlandse Waterschapsbank NV 0.46% 14/02/2018 3 920 000 3 934 481 3 928 541 2.99
Total Netherlands 8.04% (31 December 2013: 2.57%) 10 572 440 8.04
New ZealandNew Zealand Government Bond 6.00% 15/05/2021 1 145 000 965 185 1 105 099 0.84
New Zealand Government Bond 5.50% 15/04/2023 4 730 000 4 137 682 4 462 514 3.4
Total New Zealand 4.24% (31 December 2013: 3.28%) 5 567 613 4.24

STANLIB Funds Limited
Portfolio Statement (continued)
STANLIB Global Bond Fund (continued)
As at 30 June 2014
152
Nominal holding Cost USD Market Value USD % of Net AssetsNorwayKommunalbanken AS 0.61% 27/03/2017 2 178 000 2 197 922 2 190 909 1.67
Total Norway 1.67% (31 December 2013: 0.91%) 2 190 909 1.67
PolandPoland Government Bond 5.25% 25/10/2020 7 465 000 2 407 979 2 749 464 2.09
Poland Government Bond 4.00% 25/10/2023 10 055 000 3 215 888 3 440 077 2.62
Total Poland 4.71% (31 December 2013: 4.48%) 6 189 541 4.71
South AfricaSouth Africa Government Bond 6.75% 31/03/2021 15 810 000 1 766 536 1 394 964 1.06
South Africa Government Bond 6.50% 28/02/2041 29 965 000 2 454 715 2 099 198 1.6
Total South Africa 2.66% (31 December 2013: 2.82%) 3 494 162 2.66
SwedenSvensk Exportkredit AB 0.41% 12/06/2017 1 175 000 1 175 762 1 177 141 0.9
Svensk Exportkredit AB 0.60% 09/11/2017 2 625 000 2 650 418 2 648 504 2.01
Total Sweden 2.91% (31 December 2013: 0.79%) 3 825 645 2.91
United KingdomBarclays Bank Plc 0.77% 09/12/2016 1 595 000 1 595 000 1 598 863 1.22
United Kingdom Gilt 2.75% 22/01/2015 4 575 000 7 752 510 7 916 237 6.02
Total United Kingdom 7.24% (31 December 2013: 7.31%) 9 515 100 7.24
United StatesDell Inc 6.50% 15/04/2038 375 000 460 106 354 375 0.27
Goldman Sachs Group Inc/The 1.32% 15/11/2018 1 735 000 1 735 000 1 758 697 1.34
JP Morgan Alternative Loan Trust 6.00% 27/12/2036 2 059 786 1 504 983 1 802 115 1.37
Mastr Resecuritization Trust 2008-1 6.00% 27/09/2037 188 888 146 546 166 222 0.13
Mastr Resecuritization Trust 2008-4 6.00% 27/06/2036 236 769 213 132 207 600 0.16
Municipal Electric Authority of Georgia 6.64% 01/04/2057 75 000 75 107 91 789 0.07
Municipal Electric Authority of Georgia 6.66% 01/04/2057 620 000 618 907 756 481 0.57
United States Treasury FRN 4 740 000 4 738 608 4 738 767 3.6
United States Treasury Note/Bond 2.75% 15/08/2042 3 530 000 3 126 013 3 149 974 2.4
United States Treasury Note/Bond 2.88% 15/05/2043 7 195 000 6 263 541 6 560 941 4.99
Total United States 14.90% (31 December 2013: 45.60%) 19 586 961 14.9Total Bonds 96.44% (31 December 2013: 96.12%) 126 751 191 96.44Total Investments 120 622 595 126 751 191 96.44Net current assets* 4 678 628 3.56
Total net assets 131 429 819 100
*Net current assets include derivative positions. Please refer to note 12 for details of these.
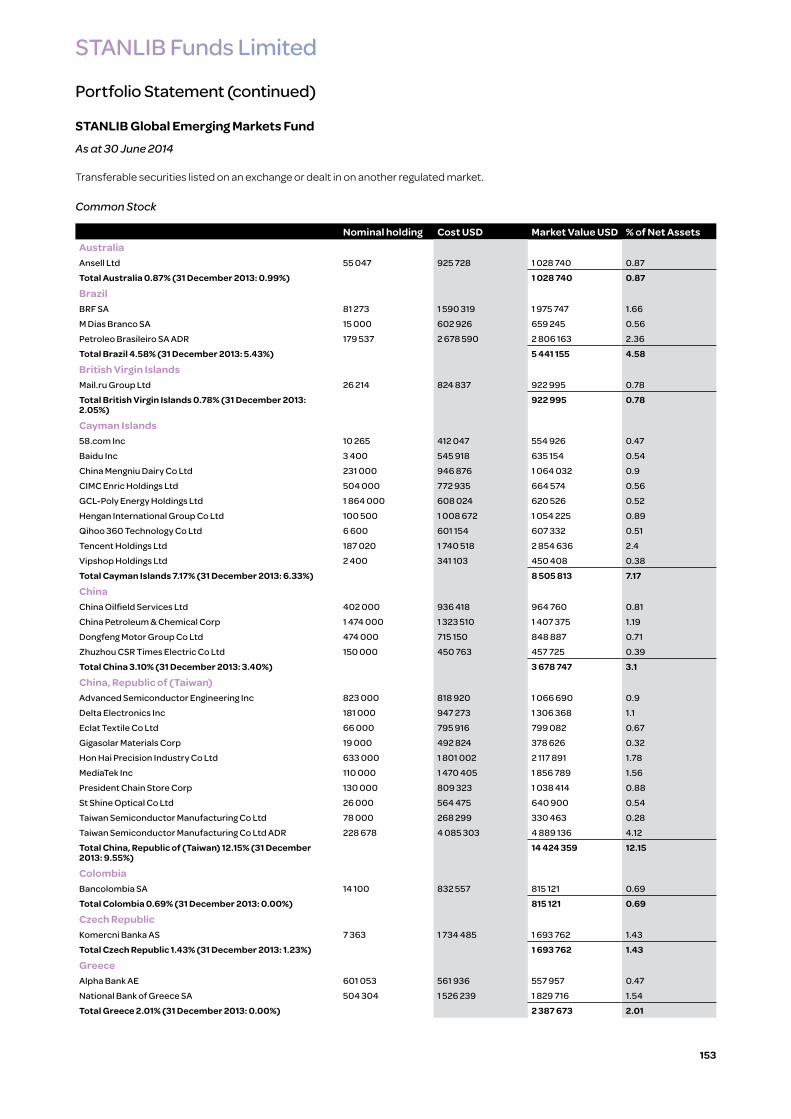
STANLIB Funds Limited
153
Portfolio Statement (continued)
STANLIB Global Emerging Markets Fund
As at 30 June 2014
Transferable securities listed on an exchange or dealt in on another regulated market.
Common Stock
Nominal holding Cost USD Market Value USD % of Net AssetsAustraliaAnsell Ltd 55 047 925 728 1 028 740 0.87
Total Australia 0.87% (31 December 2013: 0.99%) 1 028 740 0.87
BrazilBRF SA 81 273 1 590 319 1 975 747 1.66
M Dias Branco SA 15 000 602 926 659 245 0.56
Petroleo Brasileiro SA ADR 179 537 2 678 590 2 806 163 2.36
Total Brazil 4.58% (31 December 2013: 5.43%) 5 441 155 4.58
British Virgin IslandsMail.ru Group Ltd 26 214 824 837 922 995 0.78
Total British Virgin Islands 0.78% (31 December 2013: 2.05%)
922 995 0.78
Cayman Islands58.com Inc 10 265 412 047 554 926 0.47
Baidu Inc 3 400 545 918 635 154 0.54
China Mengniu Dairy Co Ltd 231 000 946 876 1 064 032 0.9
CIMC Enric Holdings Ltd 504 000 772 935 664 574 0.56
GCL-Poly Energy Holdings Ltd 1 864 000 608 024 620 526 0.52
Hengan International Group Co Ltd 100 500 1 008 672 1 054 225 0.89
Qihoo 360 Technology Co Ltd 6 600 601 154 607 332 0.51
Tencent Holdings Ltd 187 020 1 740 518 2 854 636 2.4
Vipshop Holdings Ltd 2 400 341 103 450 408 0.38
Total Cayman Islands 7.17% (31 December 2013: 6.33%) 8 505 813 7.17
ChinaChina Oilfield Services Ltd 402 000 936 418 964 760 0.81
China Petroleum & Chemical Corp 1 474 000 1 323 510 1 407 375 1.19
Dongfeng Motor Group Co Ltd 474 000 715 150 848 887 0.71
Zhuzhou CSR Times Electric Co Ltd 150 000 450 763 457 725 0.39
Total China 3.10% (31 December 2013: 3.40%) 3 678 747 3.1
China, Republic of (Taiwan)Advanced Semiconductor Engineering Inc 823 000 818 920 1 066 690 0.9
Delta Electronics Inc 181 000 947 273 1 306 368 1.1
Eclat Textile Co Ltd 66 000 795 916 799 082 0.67
Gigasolar Materials Corp 19 000 492 824 378 626 0.32
Hon Hai Precision Industry Co Ltd 633 000 1 801 002 2 117 891 1.78
MediaTek Inc 110 000 1 470 405 1 856 789 1.56
President Chain Store Corp 130 000 809 323 1 038 414 0.88
St Shine Optical Co Ltd 26 000 564 475 640 900 0.54
Taiwan Semiconductor Manufacturing Co Ltd 78 000 268 299 330 463 0.28
Taiwan Semiconductor Manufacturing Co Ltd ADR 228 678 4 085 303 4 889 136 4.12
Total China, Republic of (Taiwan) 12.15% (31 December 2013: 9.55%)
14 424 359 12.15
ColombiaBancolombia SA 14 100 832 557 815 121 0.69
Total Colombia 0.69% (31 December 2013: 0.00%) 815 121 0.69
Czech RepublicKomercni Banka AS 7 363 1 734 485 1 693 762 1.43
Total Czech Republic 1.43% (31 December 2013: 1.23%) 1 693 762 1.43
GreeceAlpha Bank AE 601 053 561 936 557 957 0.47
National Bank of Greece SA 504 304 1 526 239 1 829 716 1.54
Total Greece 2.01% (31 December 2013: 0.00%) 2 387 673 2.01

STANLIB Funds Limited
Portfolio Statement (continued)
STANLIB Global Emerging Markets Fund (continued)
As at 30 June 2014
154
Nominal holding Cost USD Market Value USD % of Net AssetsHong KongAIA Group Ltd 238 000 1 024 752 1 197 616 1.01
China Everbright International Ltd 478 000 622 175 682 106 0.57
China Mobile Ltd 61 551 661 100 596 817 0.5
Guangdong Investment Ltd 814 000 760 696 935 775 0.79
Lenovo Group Ltd 1 144 000 1 262 051 1 549 891 1.31
Total Hong Kong 4.18% (31 December 2013: 6.71%) 4 962 205 4.18
IndiaHDFC Bank Ltd 24 696 847 975 1 156 020 0.97
ICICI Bank Ltd 17 716 706 424 884 028 0.75
Larsen & Toubro Ltd 22 085 614 663 619 926 0.52
Total India 2.24% (31 December 2013: 2.68%) 2 659 974 2.24
Korea, Republic of (South Korea)CJ O Shopping Co Ltd 2 519 935 478 909 459 0.77
GS Retail Co Ltd 30 140 859 235 737 266 0.62
Halla Visteon Climate Control Corp 21 478 854 835 967 975 0.82
Hana Financial Group Inc 61 800 2 255 886 2 284 363 1.92
Hyundai Department Store Co Ltd 2 116 304 414 290 694 0.25
Hyundai Development Co-Engineering & Construction 19 770 574 565 628 194 0.53
Hyundai Motor Co 5 101 1 086 949 1 154 506 0.97
Korea Electric Power Corp 63 197 936 770 1 162 193 0.98
NAVER Corp 2 687 1 625 445 2 212 167 1.86
Samsung Electronics Co Ltd 2 773 3 748 256 3 620 412 3.05
SK Hynix Inc 29 540 971 907 1 415 982 1.19
SK Telecom Co Ltd 39 911 912 466 1 035 291 0.87
Total Korea, Republic of (South Korea) 13.83% (31 December 2013: 15.25%)
16 418 502 13.83
LuxembourgSamsonite International SA 249 900 610 020 823 820 0.69
Total Luxembourg 0.69% (31 December 2013: 1.81%) 823 820 0.69
MalaysiaDiGi.Com Bhd 753 200 1 175 246 1 341 750 1.13
IJM Corp Bhd 473 100 893 541 985 704 0.83
Tenaga Nasional Bhd 309 300 916 939 1 169 371 0.99
Total Malaysia 2.95% (31 December 2013: 1.99%) 3 496 825 2.95
MexicoAlfa SAB de CV 465 000 1 113 633 1 284 283 1.08
Alsea SAB de CV 94 000 330 338 338 015 0.29
Bolsa Mexicana de Valores SAB de CV 638 200 1 267 421 1 352 346 1.14
Cemex SAB de CV 145 669 1 694 229 1 927 201 1.62
El Puerto de Liverpool SAB de CV 76 600 860 654 897 614 0.76
Fomento Economico Mexicano SAB de CV ADR 6 123 600 337 573 419 0.48
Grupo Financiero Banorte SAB de CV 340 400 2 193 997 2 434 745 2.05
Grupo Televisa SAB 44 500 1 407 887 1 526 795 1.29
OHL Mexico SAB de CV 372 700 853 888 1 137 369 0.96
TF Administradora Industrial S de RL de CV 655 217 1 319 757 1 463 165 1.23
Total Mexico 10.90% (31 December 2013: 9.01%) 12 934 952 10.9
PhilippinesAlliance Global Group Inc 893 200 493 807 593 442 0.5
GT Capital Holdings Inc 42 510 775 497 835 594 0.7
Melco Crown Philippines Resorts Corp 2 540 200 658 371 663 500 0.56
Metro Pacific Investments Corp 7 431 600 882 516 850 918 0.72
Metropolitan Bank & Trust Co 303 965 544 027 608 629 0.51
Robinsons Retail Holdings Inc 382 790 517 065 623 527 0.53
Universal Robina Corp 198 320 539 182 700 585 0.59

STANLIB Funds Limited
Portfolio Statement (continued)
STANLIB Global Emerging Markets Fund (continued)
As at 30 June 2014
155
Nominal holding Cost USD Market Value USD % of Net AssetsPhilippines (continued)Total Philippines 4.11% (31 December 2013: 5.17%) 4 876 195 4.11
PolandBank Pekao SA 17 107 1 056 051 975 708 0.82
Energa SA 131 574 740 620 892 559 0.75
Total Poland 1.57% (31 December 2013: 0.52%) 1 868 267 1.57
RussiaAlrosa Ao 869 444 933 021 1 072 112 0.9
Gazprom OAO 169 292 1 392 439 1 474 533 1.24
Magnit OJSC GDR 4 083 1 010 535 1 060 342 0.89
MegaFon OAO 41 244 1 121 123 1 299 186 1.1
NOVATEK OAO 4 142 505 837 515 265 0.44
TMK OAO 45 794 408 518 443 286 0.37
Total Russia 4.94% (31 December 2013: 6.33%) 5 864 724 4.94
South AfricaAspen Pharmacare Holdings Ltd 61 712 1 349 378 1 733 181 1.46
Discovery Ltd 78 902 705 940 719 989 0.61
Impala Platinum Holdings Ltd 117 350 1 592 019 1 178 816 0.99
Mediclinic International Ltd 91 947 668 689 703 165 0.59
Naspers Ltd 26 267 2 444 004 3 089 322 2.6
SABMiller Plc 15 058 867 357 871 229 0.73
Sasol Ltd 26 207 1 575 013 1 550 359 1.31
Total South Africa 8.29% (31 December 2013: 4.31%) 9 846 061 8.29
ThailandAirports of Thailand PCL 99 900 549 934 609 470 0.52
Kasikornbank PCL 140 800 852 590 880 676 0.74
Thai Union Frozen Products PCL 576 200 1 084 746 1 149 576 0.97
Total Access Communication PCL 93 000 318 732 322 366 0.27
Total Thailand 2.50% (31 December 2013: 3.69%) 2 962 088 2.5
TurkeyCoca-Cola Icecek AS 29 298 764 222 722 673 0.61
Turkiye Sise ve Cam Fabrikalari AS 348 892 460 804 490 368 0.41
Total Turkey 1.02% (31 December 2013: 2.39%) 1 213 041 1.02
United KingdomAl Noor Hospitals Group Plc 32 220 369 386 559 729 0.47
Lonmin Plc 149 876 751 586 607 612 0.51
Total United Kingdom 0.98% (31 December 2013: 0.73%) 1 167 341 0.98
United StatesCopa Holdings SA 3 723 421 527 530 788 0.45
Total United States 0.45% (31 December 2013: 0.80%) 530 788 0.45Total Common Stock 91.43% (31 December 2013: 90.37%) 108 523 148 91.43
Preferred Stock
Nominal holding Cost USD Market Value USD % of Net AssetsBrazilAlpargatas SA 331 309 1 813 566 1 715 087 1.45
Total Brazil 1.45% (31 December 2013: 1.29%) 1 715 087 1.45Total Russia 0.00% (31 December 2013: 1.20%)Total Preferred Stock 1.45% (31 December 2013: 2.49%) 1 715 087 1.45

STANLIB Funds Limited
Portfolio Statement (continued)
STANLIB Global Emerging Markets Fund (continued)
As at 30 June 2014
156
Investment Companies
Nominal holding Cost USD Market Value USD % of Net AssetsSingaporeiShares MSCI India Index ETF 624 400 3 939 274 4 514 412 3.8
Total Singapore 3.80% (31 December 2013: 3.25%) 4 514 412 3.8Total Investment Companies 3.80% (31 December 2013: 3.25%)
4 514 412 3.8
Total Investments 102 645 750 114 752 647 96.68Net current assets 3 937 016 3.32
Total net assets 118 689 663 100

STANLIB Funds Limited
157
Portfolio Statement (continued)
STANLIB Global Balanced Fund
As at 30 June 2014
Transferable securities listed on an exchange or dealt in on another regulated market.
Common Stock
Nominal holding Cost USD Market Value USD % of Net AssetsAustraliaDexus Property Group 118 688 113 104 124 349 0.1
Federation Centres Ltd 39 517 85 586 92 873 0.07
Goodman Group 30 267 132 107 144 268 0.12
GPT Group 20 224 68 191 73 300 0.06
Growthpoint Properties Australia Ltd 23 105 51 925 52 994 0.04
Investa Office Fund 23 388 67 148 75 054 0.06
Mirvac Group 47 329 74 956 79 740 0.06
Scentre Group 67 023 188 083 201 800 0.16
Westfield Group 25 261 154 111 170 476 0.14
Total Australia 0.81% (31 December 2013: 0.64%) 1 014 854 0.81
BelgiumAnheuser-Busch InBev NV 12 379 1 265 616 1 421 816 1.14
Total Belgium 1.14% (31 December 2013: 0.80%) 1 421 816 1.14
BermudaHongkong Land Holdings Ltd 19 000 124 041 126 730 0.1
Markit Ltd 16 712 432 821 450 556 0.36
Total Bermuda 0.46% (31 December 2013: 0.05%) 577 286 0.46
BrazilBR Malls Participacoes SA 14 311 114 073 121 676 0.1
Iguatemi Empresa de Shopping Centers SA 6 063 58 327 61 205 0.05
Total Brazil 0.15% (31 December 2013: 0.08%) 182 881 0.15
CanadaBoardwalk Real Estate Investment Trust 1 170 64 070 71 343 0.06
Canadian Apartment Properties REIT 3 200 62 050 68 647 0.05
Canadian Real Estate Investment Trust 1 614 64 933 69 551 0.05
H&R Real Estate Investment Trust 1 741 35 633 37 855 0.03
Methanex Corp 8 100 447 104 500 152 0.4
RioCan Real Estate Investment Trust 3 855 90 708 98 660 0.08
Suncor Energy Inc 33 600 1 162 070 1 433 712 1.15
Total Canada 1.82% (31 December 2013: 1.70%) 2 279 920 1.82
ChinaPing An Insurance Group Co of China Ltd 57 500 504 589 444 768 0.36
Total China 0.36% (31 December 2013: 1.29%) 444 768 0.36
ColombiaBancolombia SA 6 600 327 669 381 546 0.3
Total Colombia 0.30% (31 December 2013: 0.00%) 381 546 0.3
FranceiCADE 907 87 132 97 134 0.08
Klepierre 1 264 55 728 64 352 0.05
Mercialys SA 2 782 57 742 64 771 0.05
Total SA 18 170 1 247 666 1 311 778 1.05
Unibail-Rodamco SE 1 443 361 658 419 632 0.34
Total France 1.57% (31 December 2013: 0.31%) 1 957 667 1.57
GermanyAlstria office REIT-AG 4 377 56 790 57 986 0.05
Brenntag AG Npv 4 496 770 666 804 543 0.64
Continental AG 4 413 887 694 1 023 517 0.82
Deutsche Annington Immobilien SE 2 261 60 230 66 649 0.05
Deutsche Wohnen AG 5 893 118 429 127 278 0.1
GSW Immobilien AG 1 911 84 644 95 814 0.08

STANLIB Funds Limited
Portfolio Statement (continued)
STANLIB Global Balanced Fund (continued)
As at 30 June 2014
158
Nominal holding Cost USD Market Value USD % of Net AssetsGermany (continued)LEG Immobilien AG 1 397 80 316 94 219 0.08
Total Germany 1.82% (31 December 2013: 2.36%) 2 270 006 1.82
Hong KongHysan Development Co Ltd 9 134 40 502 42 604 0.03
Link REIT/The 24 965 119 739 134 159 0.11
Prosperity REIT 177 240 51 221 55 122 0.05
Swire Properties Ltd 21 699 59 512 63 413 0.05
Wharf Holdings Ltd 26 165 202 567 187 873 0.15
Total Hong Kong 0.39% (31 December 2013: 0.76%) 483 171 0.39
IndonesiaBank Rakyat Indonesia Persero Tbk PT 401 400 338 138 349 579 0.28
Total Indonesia 0.28% (31 December 2013: 0.00%) 349 579 0.28
IrelandBank of Ireland 2 914 867 1 129 069 981 727 0.78
Covidien Plc 5 264 367 754 474 918 0.38
Total Ireland 1.16% (31 December 2013: 0.75%) 1 456 645 1.16
JapanActivia Properties Inc 9 70 347 78 713 0.06
Aeon Mall Co Ltd 1 924 50 345 50 671 0.04
GLP J-REIT 75 74 557 83 954 0.07
Japan Exchange Group Inc 41 900 1 024 009 1 031 524 0.83
Japan Prime Realty Investment Corp 23 75 064 82 188 0.07
Japan Real Estate Investment Corp 25 133 924 145 353 0.12
Japan Retail Fund Investment Corp 28 54 400 62 962 0.05
Mazda Motor Corp 270 000 1 236 340 1 265 976 1.01
Mitsui Fudosan Co Ltd 26 587 874 277 895 464 0.72
Nippon Building Fund Inc 26 145 720 151 424 0.12
Nippon Prologis REIT Inc 43 83 368 100 215 0.08
Nomura Holdings Inc 139 600 989 300 988 033 0.79
Ryohin Keikaku Co Ltd 4 100 386 609 464 617 0.37
Sekisui Chemical Co Ltd 107 000 1 138 768 1 236 834 0.99
Shimadzu Corp 62 000 554 919 567 951 0.45
Sumitomo Mitsui Trust Holdings Inc 234 000 1 038 502 1 067 157 0.85
Taiheiyo Cement Corp 173 000 695 205 696 740 0.56
Total Japan 7.18% (31 December 2013: 7.00%) 8 969 776 7.18
JerseyWolseley Plc 20 295 1 165 033 1 111 486 0.89
Total Jersey 0.89% (31 December 2013: 0.03%) 1 111 486 0.89
Korea, Republic of (South Korea)Samsung Electronics Co Ltd 1 921 1 236 318 1 240 006 0.99
Total Korea, Republic of (South Korea) 0.99% (31 December 2013: 0.86%)
1 240 006 0.99
MexicoFomento Economico Mexicano SAB de CV 8 100 751 054 758 565 0.61
Grupo Financiero Banorte SAB de CV 112 400 732 298 803 952 0.64
Total Mexico 1.25% (31 December 2013: 0.00%) 1 562 517 1.25
NetherlandsAegon NV 107 467 963 749 937 854 0.75
Eurocommercial Properties NV 1 563 65 967 77 060 0.06
Total Netherlands 0.81% (31 December 2013: 0.35%) 1 014 914 0.81
PhilippinesSM Prime Holdings Inc 130 628 46 059 47 457 0.04
Total Philippines 0.04% (31 December 2013: 0.02%) 47 457 0.04

STANLIB Funds Limited
Portfolio Statement (continued)
STANLIB Global Balanced Fund (continued)
As at 30 June 2014
159
Nominal holding Cost USD Market Value USD % of Net AssetsSingaporeAscendas Real Estate Investment Trust 46 000 81 585 84 497 0.07
CapitaMall Trust 56 000 85 162 88 491 0.07
Global Logistic Properties Ltd 226 000 501 336 487 663 0.39
Mapletree Commercial Trust 52 605 49 999 57 597 0.05
Mapletree Logistics Trust 60 423 50 543 56 224 0.04
Parkway Life Real Estate Investment Trust 7 695 14 375 14 505 0.01
Total Singapore 0.63% (31 December 2013: 0.55%) 788 977 0.63
South AfricaCapital & Counties Properties Plc 12 335 70 543 68 755 0.05
Total South Africa 0.05% (31 December 2013: 0.00%) 68 755 0.05
SwedenNordea Bank AB 36 580 511 567 515 979 0.41
Total Sweden 0.41% (31 December 2013: 0.03%) 515 979 0.41
SwitzerlandNestle SA 18 681 1 355 847 1 447 204 1.16
PSP Swiss Property AG 993 87 108 93 443 0.08
TE Connectivity Ltd 14 642 804 371 905 315 0.72
UBS AG 67 402 1 346 386 1 236 611 0.99
Total Switzerland 2.95% (31 December 2013: 4.78%) 3 682 573 2.95
United KingdomAon Plc 7 409 587 574 667 403 0.53
BG Group Plc 54 560 1 047 532 1 152 122 0.92
Big Yellow Group Plc 7 826 65 783 66 371 0.05
British Land Co Plc 17 180 177 339 206 361 0.17
Capital & Counties Properties Plc 8 619 47 802 47 985 0.04
Derwent London Plc 2 863 120 680 131 047 0.11
Great Portland Estates Plc 9 268 90 615 101 975 0.08
Hammerson Plc 14 347 123 475 142 281 0.11
HSBC Holdings Plc 98 453 1 050 019 998 087 0.8
Land Securities Group Plc 10 174 167 571 180 222 0.15
Liberty Global Plc Series A 10 859 450 662 480 185 0.38
Liberty Global Plc Series C 8 659 345 177 366 449 0.29
Londonmetric Property Plc 27 867 60 069 64 373 0.05
Tullow Oil Plc 32 218 479 522 469 899 0.38
Unilever Plc 23 717 974 916 1 074 641 0.86
Total United Kingdom 4.92% (31 December 2013: 6.34%) 6 149 401 4.92
United StatesAirgas Inc 7 888 843 431 859 003 0.69
Alexandria Real Estate Equities Inc 1 577 106 994 122 423 0.1
American Campus Communities Inc 3 266 115 626 124 924 0.1
American Express Co 10 963 923 189 1 039 841 0.83
American International Group Inc 16 570 817 439 904 225 0.72
Amgen Inc 5 051 589 181 597 887 0.48
Amphenol Corp 7 500 697 098 722 325 0.58
Apollo Global Management LLC 27 471 863 470 761 496 0.61
Apple Inc 16 492 1 247 372 1 532 602 1.23
Applied Materials Inc 30 000 679 391 676 500 0.54
AvalonBay Communities Inc 1 937 247 633 275 345 0.22
BioMed Realty Trust Inc 2 456 47 698 53 614 0.04
Blackstone Group LP 22 314 634 809 746 180 0.6
Boston Properties Inc 1 985 214 620 234 508 0.19
Bristol-Myers Squibb Co 14 195 751 938 688 316 0.55
Camden Property Trust 1 815 118 816 129 101 0.1
Charter Communications Inc 6 358 838 324 1 006 916 0.81

STANLIB Funds Limited
Portfolio Statement (continued)
STANLIB Global Balanced Fund (continued)
As at 30 June 2014
160
Nominal holding Cost USD Market Value USD % of Net AssetsUnited States (continued)Comcast Corp 17 559 862 063 942 567 0.75
Copa Holdings SA 6 455 910 258 920 289 0.74
CubeSmart 4 280 74 267 78 410 0.06
DDR Corp 6 604 105 477 116 429 0.09
Discover Financial Services 9 729 524 567 602 906 0.48
EastGroup Properties Inc 1 153 71 008 74 011 0.06
Education Realty Trust Inc 6 098 56 017 65 371 0.05
Enterprise Products Partners LP 5 277 352 292 412 925 0.33
Equity Lifestyle Properties Inc 2 173 82 850 95 981 0.08
Equity Residential 4 366 241 085 275 014 0.22
Essex Property Trust Inc 1 500 239 598 277 215 0.22
Estee Lauder Cos Inc/The 8 667 619 801 643 525 0.51
Extra Space Storage Inc 3 789 171 966 201 802 0.16
Facebook Inc 10 928 677 673 735 236 0.59
Federal Realty Investment Trust 869 93 363 105 019 0.08
General Growth Properties Inc 8 876 183 296 209 030 0.17
Gilead Sciences Inc 18 329 1 348 677 1 519 657 1.22
Glimcher Realty Trust 6 531 64 147 70 731 0.06
Google Inc Class A 1 517 788 365 886 929 0.71
Google Inc Class C 1 017 511 070 585 050 0.47
Halliburton Co 10 000 642 683 709 900 0.57
HCP Inc 4 756 188 285 196 708 0.16
Hewlett-Packard Co 27 800 917 654 936 026 0.75
Home Properties Inc 738 43 237 47 202 0.04
Host Hotels & Resorts Inc 12 086 230 041 265 892 0.21
JPMorgan Chase & Co 23 924 1 335 367 1 377 544 1.1
Kilroy Realty Corp 1 879 100 828 117 005 0.09
Kimco Realty Corp 5 281 110 259 121 357 0.1
Lam Research Corp 11 181 586 453 755 500 0.6
Macerich Co/The 2 561 150 953 170 896 0.14
MasterCard Inc 8 470 623 687 622 206 0.5
Mead Johnson Nutrition Co 7 827 629 631 729 242 0.58
Mid-America Apartment Communities Inc 969 62 720 70 776 0.06
National Retail Properties Inc 1 572 51 021 58 447 0.05
NIKE Inc 8 500 651 616 659 005 0.53
Occidental Petroleum Corp 9 923 922 475 1 018 001 0.81
Pfizer Inc 47 900 1 463 240 1 421 193 1.14
Praxair Inc 5 308 701 195 704 955 0.56
Priceline Group Inc 589 681 072 708 567 0.57
Prologis Inc 9 397 363 559 386 029 0.31
Public Storage 2 573 415 662 440 729 0.35
QUALCOMM Inc 6 405 475 394 507 212 0.41
Sabre Corp 15 000 247 727 300 450 0.24
Simon Property Group Inc 4 788 703 335 795 957 0.64
Sirona Dental Systems Inc 10 039 713 271 827 816 0.66
SL Green Realty Corp 2 243 213 449 245 272 0.2
Sovran Self Storage Inc 2 017 141 541 155 773 0.12
Tanger Factory Outlet Centers Inc 4 562 152 657 159 442 0.13
Taubman Centers Inc 2 467 167 667 186 949 0.15
TJX Cos Inc 10 100 587 410 536 815 0.43
UDR Inc 3 260 79 439 93 301 0.07
Union Pacific Corp 6 772 584 854 675 507 0.54
United Rentals Inc 12 316 972 304 1 290 347 1.03
Ventas Inc 4 560 278 312 292 250 0.23

STANLIB Funds Limited
Portfolio Statement (continued)
STANLIB Global Balanced Fund (continued)
As at 30 June 2014
161
Nominal holding Cost USD Market Value USD % of Net AssetsUnited States (continued)Visa Inc 3 808 804 695 802 308 0.64
Vornado Realty Trust 2 255 205 531 240 631 0.19
Walt Disney Co/The 10 393 811 977 890 992 0.71
Washington Prime Group Inc 2 394 44 707 44 864 0.04
WESCO International Inc 15 323 1 272 032 1 322 681 1.06
Total United States 32.15% (31 December 2013: 33.20%) 40 179 050 32.15Total Common Stock 62.53% (31 December 2013: 61.90%) 78 151 030 62.53
Bonds
Nominal holding Cost USD Market Value USD % of Net AssetsAustraliaBHP Billiton Finance USA Ltd 3.85% 30/09/2023 292 000 297 088 306 994 0.25
Total Australia 0.25% (31 December 2013: 1.12%) 306 994 0.25
BelgiumBelgium Government Bond 3.00% 22/06/2034 65 000 89 906 95 108 0.08
KBC Groep NV 5.63% 29/03/2049 220 000 303 327 303 201 0.24
Total Belgium 0.32% (31 December 2013: 0.00%) 398 309 0.32
CanadaCanada Housing Trust No 1 2.35% 15/12/2018 1 510 000 1 431 783 1 453 817 1.16
Glencore Finance Canada Ltd 4.95% 15/11/2021 154 000 158 838 166 173 0.13
Province of Ontario Canada 2.00% 30/01/2019 200 000 199 895 202 166 0.16
Thomson Reuters Corp 4.30% 23/11/2023 80 000 80 436 83 561 0.07
Total Canada 1.52% (31 December 2013: 1.48%) 1 905 717 1.52
DenmarkDanske Bank A/S 5.75% 31/10/2049 220 000 304 455 312 063 0.25
Total Denmark 0.25% (31 December 2013: 0.00%) 312 063 0.25Total Finland 0.00% (31 December 2013: 0.23%)
FranceDexia Credit Local SA 1.38% 18/09/2019 150 000 206 937 209 209 0.17
Electricite de France SA 5.88% 18/07/2031 145 000 280 625 291 138 0.23
France Government Bond OAT 4.00% 25/10/2014 340 000 474 162 471 262 0.38
France Government Bond OAT 3.25% 25/04/2016 300 500 420 546 435 109 0.35
France Government Bond OAT 2.50% 25/05/2030 180 000 246 253 252 981 0.2
Total France 1.33% (31 December 2013: 2.82%) 1 659 699 1.33
GermanyBundesobligation 2.50% 10/10/2014 275 000 385 112 379 015 0.31
Landeskreditbank Baden-Wuerttemberg Foerderbank 1.63% 25/04/2017
150 000 152 515 152 812 0.12
Total Germany 0.43% (31 December 2013: 3.06%) 531 827 0.43
GuernseyCredit Suisse Group Guernsey I Ltd 7.88% 24/02/2041 340 000 369 606 367 200 0.29
Total Guernsey 0.29% (31 December 2013: 0.17%) 367 200 0.29
ItalyItaly Buoni Poliennali Del Tesoro 4.00% 01/09/2020 70 000 106 932 108 277 0.09
Italy Buoni Poliennali Del Tesoro 3.75% 01/05/2021 220 000 331 468 334 094 0.27
Italy Buoni Poliennali Del Tesoro 3.75% 01/09/2024 535 000 776 407 792 036 0.63
Italy Buoni Poliennali Del Tesoro 4.75% 01/09/2028 90 000 138 804 143 091 0.11
Italy Buoni Poliennali Del Tesoro 4.75% 01/09/2044 125 000 189 342 195 266 0.16
Total Italy 1.26% (31 December 2013: 0.32%) 1 572 764 1.26
JapanJapan Government Ten Year Bond 0.80% 20/12/2022 38 500 000 385 992 391 814 0.31
Japan Government Thirty Year Bond 2.00% 20/03/2042 19 850 000 208 676 212 177 0.17

STANLIB Funds Limited
Portfolio Statement (continued)
STANLIB Global Balanced Fund (continued)
As at 30 June 2014
162
Nominal holding Cost USD Market Value USD % of Net AssetsJapan (continued)Total Japan 0.48% (31 December 2013: 0.58%) 603 991 0.48
LuxembourgEuropean Financial Stability Facility 1.75% 29/10/2020 110 000 150 465 158 421 0.13
Total Luxembourg 0.13% (31 December 2013: 0.46%) 158 421 0.13
MexicoMexican Bonos 10.00% 05/12/2024 9 250 000 899 126 952 084 0.76
Petroleos Mexicanos 5.75% 01/03/2018 175 000 193 402 196 985 0.16
United Mexican States 5.63% 19/03/2114 110 000 178 710 184 894 0.15
Total Mexico 1.07% (31 December 2013: 0.12%) 1 333 963 1.07
NetherlandsBharti Airtel International Netherlands BV 5.35% 20/05/2024 200 000 199 834 208 030 0.17
ING Bank NV 6.13% 29/05/2023 200 000 304 719 312 098 0.25
Linde Finance BV 8.13% 14/07/2066 160 000 302 358 306 038 0.24
Petrobras Global Finance BV 3.25% 17/03/2017 295 000 295 153 301 371 0.24
Total Netherlands 0.90% (31 December 2013: 0.41%) 1 127 537 0.9
New ZealandNew Zealand Government Bond 5.50% 15/04/2023 450 000 413 462 424 552 0.34
Total New Zealand 0.34% (31 December 2013: 0.00%) 424 552 0.34
NorwayEksportfinans ASA 3.00% 17/11/2014 183 000 183 520 183 913 0.15
Eksportfinans ASA 2.00% 15/09/2015 226 000 223 803 225 752 0.18
Eksportfinans ASA 2.38% 25/05/2016 280 000 277 831 281 520 0.22
Total Norway 0.55% (31 December 2013: 0.35%) 691 185 0.55
PolandPoland Government International Bond 5.00% 23/03/2022 100 000 105 155 111 189 0.09
Poland Government International Bond 3.00% 15/01/2024 100 000 142 385 147 060 0.12
Total Poland 0.21% (31 December 2013: 0.16%) 258 249 0.21
PortugalPortugal Obrigacoes do Tesouro OT 4.75% 14/06/2019 425 000 601 253 645 629 0.52
Portugal Obrigacoes do Tesouro OT 5.65% 15/02/2024 110 000 159 424 174 336 0.14
Total Portugal 0.66% (31 December 2013: 0.00%) 819 965 0.66
RomaniaRomanian Government International Bond 3.63% 24/04/2024 275 000 377 824 393 859 0.32
Total Romania 0.32% (31 December 2013: 0.00%) 393 859 0.32
SloveniaSlovenia Government Bond 3.00% 08/04/2021 330 000 454 573 467 777 0.37
Total Slovenia 0.37% (31 December 2013: 0.00%) 467 777 0.37
SpainSpain Government Bond 2.75% 31/10/2024 285 000 384 539 389 456 0.31
Total Spain 0.31% (31 December 2013: 0.29%) 389 456 0.31
SupernationalCorp Andina de Fomento 1.88% 29/05/2021 120 000 163 528 166 356 0.13
Total Supernational 0.13% (31 December 2013: 0.00%) 166 356 0.13
SwedenSvensk Exportkredit AB 5.13% 01/03/2017 170 000 188 584 189 082 0.15
Total Sweden 0.15% (31 December 2013: 0.24%) 189 082 0.15
SwitzerlandUBS AG 5.13% 15/05/2024 260 000 259 756 265 001 0.21
Total Switzerland 0.21% (31 December 2013: 0.00%) 265 001 0.21
United KingdomAbbey National Treasury Services Plc/London 4.00% 13/03/2024
290 000 290 057 299 814 0.24
BAT International Finance Plc 3.25% 07/06/2022 312 000 306 008 311 277 0.25
BUPA Finance Plc 5.00% 25/04/2023 220 000 372 610 383 254 0.31

STANLIB Funds Limited
Portfolio Statement (continued)
STANLIB Global Balanced Fund (continued)
As at 30 June 2014
163
Nominal holding Cost USD Market Value USD % of Net AssetsUnited Kingdom (continued)Imperial Tobacco Finance Plc 3.50% 11/02/2023 300 000 286 878 297 061 0.24
Legal & General Group Plc 10.00% 23/07/2041 100 000 221 699 229 234 0.18
Pennon Group Plc 6.75% 08/03/2049 215 000 386 718 391 917 0.31
Royal Bank of Scotland Group Plc 6.13% 15/12/2022 194 000 200 249 212 620 0.17
RSA Insurance Group Plc 9.38% 20/05/2039 70 000 143 219 145 316 0.12
SABMiller Plc 6.50% 15/07/2018 153 000 179 023 179 032 0.14
Tesco Plc 5.50% 13/12/2019 178 000 326 428 339 539 0.27
Total United Kingdom 2.23% (31 December 2013: 2.03%) 2 789 064 2.23
United StatesAmerican International Group Inc 4.13% 15/02/2024 146 000 148 290 153 597 0.12
Amgen Inc 5.38% 15/05/2043 150 000 167 820 165 367 0.13
Anheuser-Busch InBev Worldwide Inc 5.38% 15/01/2020 279 000 319 516 321 638 0.26
AT&T Inc 2.38% 27/11/2018 374 000 376 255 380 695 0.31
Bank of America Corp 4.00% 01/04/2024 320 000 319 648 326 906 0.26
Citigroup Inc 4.25% 25/02/2030 102 000 148 444 148 024 0.12
DIRECTV Holdings LLC / DIRECTV Financing Co Inc 4.45% 01/04/2024
295 000 294 684 312 370 0.25
Enterprise Products Operating LLC 3.90% 15/02/2024 125 000 124 828 129 119 0.1
Federal Home Loan Banks 0.63% 28/12/2016 960 000 957 131 958 209 0.77
Federal Home Loan Mortgage Corp 0.88% 14/10/2016 950 000 953 744 955 475 0.77
Federal National Mortgage Association 0.63% 26/08/2016 970 000 969 110 971 125 0.78
Kansas City Southern Railway Co/The 3.85% 15/11/2023 75 000 74 322 74 962 0.06
L-3 Communications Corp 3.95% 28/05/2024 328 000 326 197 330 584 0.27
McKesson Corp 2.28% 15/03/2019 303 000 303 384 304 014 0.24
Metropolitan Life Global Funding I 2.30% 10/04/2019 240 000 239 700 242 401 0.19
Novartis Capital Corp 3.40% 06/05/2024 310 000 309 313 313 985 0.25
Pacific Gas & Electric Co 3.85% 15/11/2023 141 000 141 344 147 164 0.12
PPL Capital Funding Inc 4.20% 15/06/2022 59 000 61 092 63 098 0.05
PPL Capital Funding Inc 3.95% 15/03/2024 150 000 150 624 155 465 0.12
Prudential Financial Inc 3.50% 15/05/2024 330 000 328 394 329 630 0.26
SABMiller Holdings Inc 2.20% 01/08/2018 200 000 200 798 202 671 0.16
Sempra Energy 3.55% 15/06/2024 320 000 319 070 321 244 0.26
Time Warner Cable Inc 5.50% 01/09/2041 159 000 147 630 177 838 0.14
United States Treasury Bill 0% 31/07/2014 1 500 000 1 499 968 1 499 968 1.2
United States Treasury Note/Bond 0.25% 15/12/2015 250 000 250 117 250 039 0.2
United States Treasury Note/Bond 0.75% 15/03/2017 1 800 000 1 797 825 1 799 719 1.44
United States Treasury Note/Bond 3.75% 15/11/2043 90 000 91 526 97 017 0.08
United States Treasury Note/Bond 3.63% 15/02/2044 225 000 234 901 236 953 0.19
Verizon Communications Inc 2.45% 01/11/2022 335 000 304 038 314 097 0.25
Verizon Communications Inc 5.15% 15/09/2023 205 000 217 898 228 442 0.18
Yum! Brands Inc 3.88% 01/11/2023 147 000 146 288 149 552 0.12
Total United States 9.65% (31 December 2013: 8.47%) 12 061 368 9.65Total Bonds 23.36% (31 December 2013: 22.31%) 29 194 399 23.36
Commercial Paper
Nominal holding Cost USD Market Value USD % of Net AssetsUnited StatesBanque Federative Du Credit S.A. 0.12% 07/07/2014 800 000 799 976 799 982 0.64
Caisse Des Depots Et Consignations 0.05% 07/07/2014 500 000 499 986 499 995 0.4
National Bank of Abu Dhabi 0.12% 10/07/2014 500 000 499 971 499 983 0.4
Nationwide Building Society 0.10% 10/07/2014 1 000 000 999 953 999 972 0.8
Total United States 2.24% (31 December 2013: 0.00%) 2 799 932 2.24Total Commercial Paper 2.24% (31 December 2013: 0.00%) 2 799 932 2.24

STANLIB Funds Limited
Portfolio Statement (continued)
STANLIB Global Balanced Fund (continued)
As at 30 June 2014
164
Certificates of Deposit
Nominal holding Cost USD Market Value USD % of Net AssetsUnited StatesBank of Montreal 0% 02/07/2014 800 000 799 996 800 000 0.64
Mizuho Trust & Banking (Lux) S.A 0% 24/07/2014 500 000 499 927 499 927 0.4
Skandinaviska Enskilda Banken 0.15% 31/07/2014 500 000 499 921 499 937 0.4
Total United States 1.44% (31 December 2013: 0.00%) 1 799 864 1.44Total Certificates of Deposit 1.44% (31 December 2013: 0.00%)
1 799 864 1.44
Total Investments 106 477 636 111 945 225 89.57Net current assets* 13 041 839 10.43
Total net assets 124 987 064 100
*Net current assets include derivative positions. Please refer to note 12 for details of these.

STANLIB Funds Limited
165
Portfolio Statement (continued)
STANLIB Global Balanced Cautious Fund
As at 30 June 2014
Transferable securities listed on an exchange or dealt in on another regulated market.
Common Stock
Nominal holding Cost USD Market Value USD % of Net AssetsAustraliaDexus Property Group 37 180 35 470 38 953 0.09
Federation Centres Ltd 12 124 26 245 28 494 0.06
Goodman Group 9 667 41 895 46 078 0.1
GPT Group 6 302 20 583 22 841 0.05
Growthpoint Properties Australia Ltd 7 015 15 711 16 090 0.04
Investa Office Fund 7 129 20 465 22 878 0.05
Mirvac Group 14 643 23 267 24 671 0.05
Scentre Group 20 766 58 070 62 524 0.14
Westfield Group 7 771 47 075 52 443 0.11
Total Australia 0.69% (31 December 2013: 0.56%) 314 972 0.69
BelgiumAnheuser-Busch InBev NV 2 078 211 715 238 673 0.52
Total Belgium 0.52% (31 December 2013: 0.37%) 238 673 0.52
BermudaHongkong Land Holdings Ltd 4 316 27 272 28 788 0.06
Markit Ltd 2 623 67 923 70 716 0.16
Total Bermuda 0.22% (31 December 2013: 0.04%) 99 504 0.22
BrazilBR Malls Participacoes SA 4 408 35 155 37 478 0.08
Iguatemi Empresa de Shopping Centers SA 1 971 17 639 19 897 0.05
Total Brazil 0.13% (31 December 2013: 0.07%) 57 375 0.13
CanadaBoardwalk Real Estate Investment Trust 335 18 072 20 427 0.04
Canadian Apartment Properties REIT 954 18 447 20 465 0.04
Canadian Real Estate Investment Trust 495 19 832 21 331 0.05
H&R Real Estate Investment Trust 547 11 111 11 894 0.03
Methanex Corp 1 500 89 918 92 621 0.2
RioCan Real Estate Investment Trust 1 219 28 600 31 197 0.07
Suncor Energy Inc 5 200 177 104 221 884 0.49
Total Canada 0.92% (31 December 2013: 0.83%) 419 819 0.92
ChinaPing An Insurance Group Co of China Ltd 9 500 81 883 73 483 0.16
Total China 0.16% (31 December 2013: 0.39%) 73 483 0.16
ColombiaBancolombia SA 1 086 54 902 62 782 0.14
Total Colombia 0.14% (31 December 2013: 0.00%) 62 782 0.14
FranceiCADE 286 27 394 30 629 0.07
Klepierre 401 17 662 20 415 0.04
Mercialys SA 909 18 943 21 163 0.05
Total SA 2 870 196 926 207 199 0.45
Unibail-Rodamco SE 448 112 796 130 281 0.29
Total France 0.90% (31 December 2013: 0.26%) 409 687 0.9
GermanyAlstria office REIT-AG 1 404 18 281 18 600 0.04
Brenntag AG Npv 715 126 112 127 947 0.28
Continental AG 701 150 120 162 585 0.36
Deutsche Annington Immobilien SE 620 16 570 18 276 0.04
Deutsche Wohnen AG 1 809 36 632 39 071 0.09
GSW Immobilien AG 611 27 723 30 634 0.07
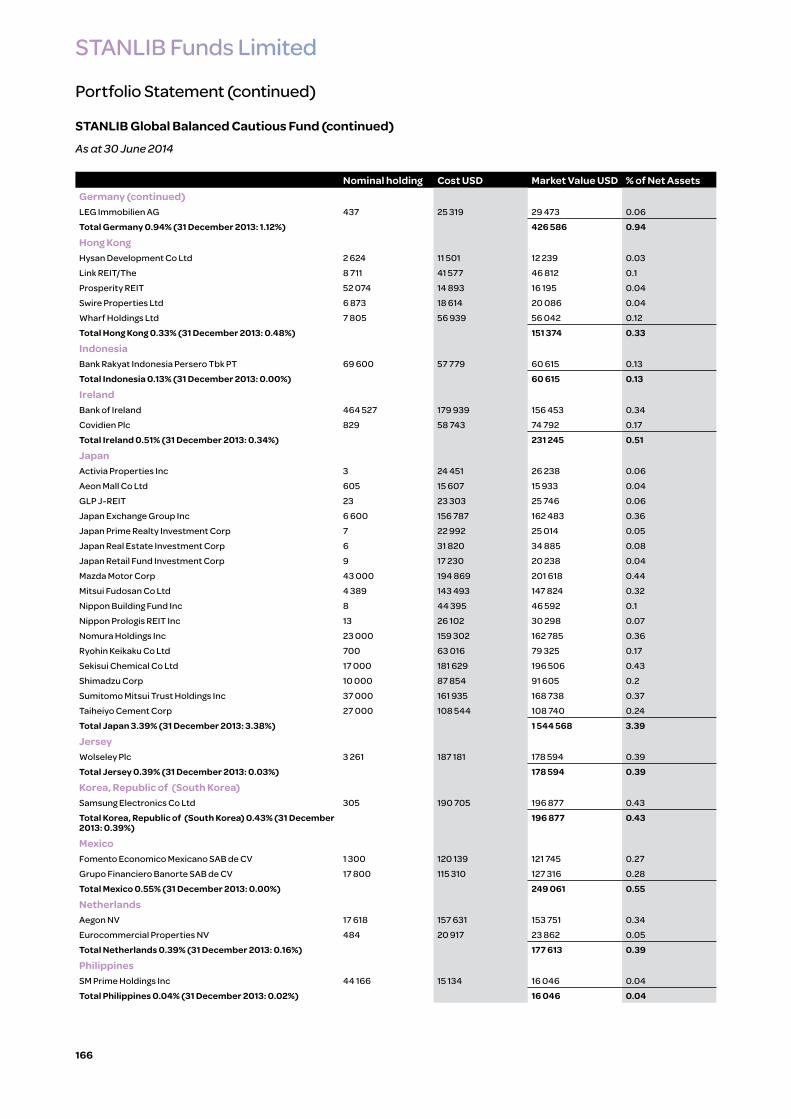
STANLIB Funds Limited
Portfolio Statement (continued)
STANLIB Global Balanced Cautious Fund (continued)
As at 30 June 2014
166
Nominal holding Cost USD Market Value USD % of Net AssetsGermany (continued)LEG Immobilien AG 437 25 319 29 473 0.06
Total Germany 0.94% (31 December 2013: 1.12%) 426 586 0.94
Hong KongHysan Development Co Ltd 2 624 11 501 12 239 0.03
Link REIT/The 8 711 41 577 46 812 0.1
Prosperity REIT 52 074 14 893 16 195 0.04
Swire Properties Ltd 6 873 18 614 20 086 0.04
Wharf Holdings Ltd 7 805 56 939 56 042 0.12
Total Hong Kong 0.33% (31 December 2013: 0.48%) 151 374 0.33
IndonesiaBank Rakyat Indonesia Persero Tbk PT 69 600 57 779 60 615 0.13
Total Indonesia 0.13% (31 December 2013: 0.00%) 60 615 0.13
IrelandBank of Ireland 464 527 179 939 156 453 0.34
Covidien Plc 829 58 743 74 792 0.17
Total Ireland 0.51% (31 December 2013: 0.34%) 231 245 0.51
JapanActivia Properties Inc 3 24 451 26 238 0.06
Aeon Mall Co Ltd 605 15 607 15 933 0.04
GLP J-REIT 23 23 303 25 746 0.06
Japan Exchange Group Inc 6 600 156 787 162 483 0.36
Japan Prime Realty Investment Corp 7 22 992 25 014 0.05
Japan Real Estate Investment Corp 6 31 820 34 885 0.08
Japan Retail Fund Investment Corp 9 17 230 20 238 0.04
Mazda Motor Corp 43 000 194 869 201 618 0.44
Mitsui Fudosan Co Ltd 4 389 143 493 147 824 0.32
Nippon Building Fund Inc 8 44 395 46 592 0.1
Nippon Prologis REIT Inc 13 26 102 30 298 0.07
Nomura Holdings Inc 23 000 159 302 162 785 0.36
Ryohin Keikaku Co Ltd 700 63 016 79 325 0.17
Sekisui Chemical Co Ltd 17 000 181 629 196 506 0.43
Shimadzu Corp 10 000 87 854 91 605 0.2
Sumitomo Mitsui Trust Holdings Inc 37 000 161 935 168 738 0.37
Taiheiyo Cement Corp 27 000 108 544 108 740 0.24
Total Japan 3.39% (31 December 2013: 3.38%) 1 544 568 3.39
JerseyWolseley Plc 3 261 187 181 178 594 0.39
Total Jersey 0.39% (31 December 2013: 0.03%) 178 594 0.39
Korea, Republic of (South Korea)Samsung Electronics Co Ltd 305 190 705 196 877 0.43
Total Korea, Republic of (South Korea) 0.43% (31 December 2013: 0.39%)
196 877 0.43
MexicoFomento Economico Mexicano SAB de CV 1 300 120 139 121 745 0.27
Grupo Financiero Banorte SAB de CV 17 800 115 310 127 316 0.28
Total Mexico 0.55% (31 December 2013: 0.00%) 249 061 0.55
NetherlandsAegon NV 17 618 157 631 153 751 0.34
Eurocommercial Properties NV 484 20 917 23 862 0.05
Total Netherlands 0.39% (31 December 2013: 0.16%) 177 613 0.39
PhilippinesSM Prime Holdings Inc 44 166 15 134 16 046 0.04
Total Philippines 0.04% (31 December 2013: 0.02%) 16 046 0.04

STANLIB Funds Limited
Portfolio Statement (continued)
STANLIB Global Balanced Cautious Fund (continued)
As at 30 June 2014
167
Nominal holding Cost USD Market Value USD % of Net AssetsSingaporeAscendas Real Estate Investment Trust 12 000 21 131 22 043 0.05
CapitaMall Trust 17 000 25 533 26 863 0.06
Global Logistic Properties Ltd 47 000 102 404 101 417 0.22
Mapletree Commercial Trust 12 258 11 558 13 421 0.03
Mapletree Logistics Trust 19 436 16 118 18 085 0.04
Parkway Life Real Estate Investment Trust 4 000 7 584 7 540 0.02
Total Singapore 0.42% (31 December 2013: 0.36%) 189 369 0.42
South AfricaCapital & Counties Properties Plc 3 610 20 647 20 122 0.04
Total South Africa 0.04% (31 December 2013: 0.00%) 20 122 0.04
SwedenNordea Bank AB 5 817 81 350 82 052 0.18
Total Sweden 0.18% (31 December 2013: 0.03%) 82 052 0.18
SwitzerlandNestle SA 2 949 214 350 228 457 0.5
PSP Swiss Property AG 309 27 177 29 078 0.07
TE Connectivity Ltd 2 299 128 202 142 147 0.31
UBS AG 10 240 207 323 187 871 0.41
Total Switzerland 1.29% (31 December 2013: 2.21%) 587 553 1.29
United KingdomAon Plc 1 213 102 015 109 267 0.24
BG Group Plc 8 842 165 240 186 713 0.41
Big Yellow Group Plc 2 478 20 829 21 016 0.05
British Land Co Plc 5 311 55 665 63 794 0.14
Capital & Counties Properties Plc 2 836 16 143 15 789 0.03
Derwent London Plc 894 38 245 40 921 0.09
Great Portland Estates Plc 3 389 34 326 37 289 0.08
Hammerson Plc 4 457 39 026 44 200 0.1
HSBC Holdings Plc 15 635 163 943 158 503 0.35
Land Securities Group Plc 3 149 51 263 55 781 0.12
Liberty Global Plc Series A 1 746 73 389 77 208 0.17
Liberty Global Plc Series C 1 046 41 978 44 267 0.1
Londonmetric Property Plc 8 434 18 658 19 482 0.04
Tullow Oil Plc 5 081 73 060 74 106 0.16
Unilever Plc 3 780 152 945 171 276 0.38
Total United Kingdom 2.46% (31 December 2013: 3.24%) 1 119 612 2.46
United StatesAirgas Inc 1 254 134 310 136 561 0.3
Alexandria Real Estate Equities Inc 489 33 620 37 961 0.08
American Campus Communities Inc 966 34 408 36 949 0.08
American Express Co 1 811 157 330 171 773 0.38
American International Group Inc 2 591 129 284 141 391 0.31
Amgen Inc 796 94 815 94 223 0.21
Amphenol Corp 1 200 111 348 115 572 0.25
Apollo Global Management LLC 4 300 133 113 119 196 0.26
Apple Inc 2 681 202 854 249 145 0.55
Applied Materials Inc 4 700 106 438 105 985 0.23
AvalonBay Communities Inc 600 76 897 85 290 0.19
BioMed Realty Trust Inc 771 15 110 16 831 0.04
Blackstone Group LP 3 505 106 340 117 207 0.26
Boston Properties Inc 619 67 307 73 129 0.16
Bristol-Myers Squibb Co 2 293 123 538 111 188 0.24
Camden Property Trust 558 36 582 39 691 0.09
Charter Communications Inc 1 020 133 596 161 537 0.35

STANLIB Funds Limited
Portfolio Statement (continued)
STANLIB Global Balanced Cautious Fund (continued)
As at 30 June 2014
168
Nominal holding Cost USD Market Value USD % of Net AssetsUnited States (continued)Comcast Corp 2 775 136 162 148 962 0.33
Copa Holdings SA 1 044 144 197 148 843 0.33
CubeSmart 1 313 22 670 24 054 0.05
DDR Corp 2 052 32 833 36 177 0.08
Discover Financial Services 1 585 87 484 98 222 0.22
EastGroup Properties Inc 406 25 144 26 061 0.06
Education Realty Trust Inc 1 899 17 682 20 357 0.04
Enterprise Products Partners LP 900 60 489 70 425 0.15
Equity Lifestyle Properties Inc 676 26 332 29 859 0.07
Equity Residential 1 361 75 651 85 729 0.19
Essex Property Trust Inc 371 58 922 68 564 0.15
Estee Lauder Cos Inc/The 1 290 91 732 95 782 0.21
Extra Space Storage Inc 1 193 54 905 63 539 0.14
Facebook Inc 1 820 118 248 122 450 0.27
Federal Realty Investment Trust 269 28 897 32 509 0.07
General Growth Properties Inc 2 778 58 045 65 422 0.14
Gilead Sciences Inc 2 857 212 723 236 874 0.52
Glimcher Realty Trust 1 963 19 207 21 259 0.05
Google Inc Class A 292 156 759 170 721 0.37
Google Inc Class C 192 102 061 110 452 0.24
Halliburton Co 1 500 96 396 106 485 0.23
HCP Inc 1 470 56 464 60 799 0.13
Hewlett-Packard Co 4 400 145 365 148 148 0.33
Home Properties Inc 228 13 364 14 583 0.03
Host Hotels & Resorts Inc 3 779 72 286 83 138 0.18
JPMorgan Chase & Co 3 679 210 468 211 837 0.47
Kilroy Realty Corp 576 31 700 35 868 0.08
Kimco Realty Corp 1 646 34 772 37 825 0.08
Lam Research Corp 1 839 98 566 124 261 0.27
Macerich Co/The 806 47 616 53 784 0.12
MasterCard Inc 1 410 105 233 103 579 0.23
Mead Johnson Nutrition Co 1 257 101 600 117 115 0.26
Mid-America Apartment Communities Inc 305 19 808 22 277 0.05
National Retail Properties Inc 403 13 141 14 984 0.03
NIKE Inc 1 300 100 986 100 789 0.22
Occidental Petroleum Corp 1 590 149 949 163 118 0.36
Pfizer Inc 7 600 235 191 225 492 0.5
Praxair Inc 857 112 952 113 818 0.25
Priceline Group Inc 68 91 027 81 804 0.18
Prologis Inc 2 914 113 589 119 707 0.26
Public Storage 797 129 786 136 518 0.3
QUALCOMM Inc 1 076 80 382 85 208 0.19
Sabre Corp 2 400 39 640 48 072 0.11
Simon Property Group Inc 1 496 219 637 248 695 0.55
Sirona Dental Systems Inc 1 599 114 801 131 854 0.29
SL Green Realty Corp 728 69 747 79 607 0.17
Sovran Self Storage Inc 600 42 601 46 338 0.1
Tanger Factory Outlet Centers Inc 1 397 46 789 48 825 0.11
Taubman Centers Inc 776 52 966 58 805 0.13
TJX Cos Inc 1 600 95 260 85 040 0.19
UDR Inc 1 018 25 099 29 135 0.06
Union Pacific Corp 1 084 98 215 108 129 0.24
United Rentals Inc 2 050 176 911 214 778 0.47
Ventas Inc 1 430 85 643 91 649 0.2
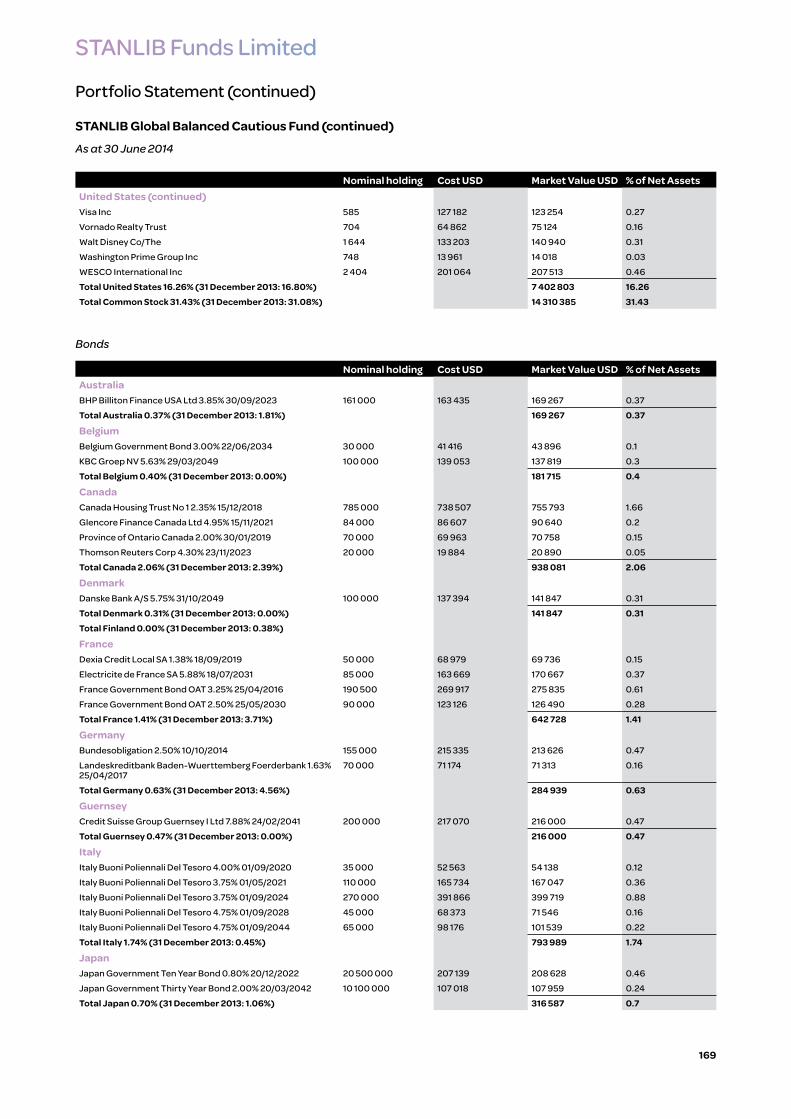
STANLIB Funds Limited
Portfolio Statement (continued)
STANLIB Global Balanced Cautious Fund (continued)
As at 30 June 2014
169
Nominal holding Cost USD Market Value USD % of Net AssetsUnited States (continued)Visa Inc 585 127 182 123 254 0.27
Vornado Realty Trust 704 64 862 75 124 0.16
Walt Disney Co/The 1 644 133 203 140 940 0.31
Washington Prime Group Inc 748 13 961 14 018 0.03
WESCO International Inc 2 404 201 064 207 513 0.46
Total United States 16.26% (31 December 2013: 16.80%) 7 402 803 16.26Total Common Stock 31.43% (31 December 2013: 31.08%) 14 310 385 31.43
Bonds
Nominal holding Cost USD Market Value USD % of Net AssetsAustraliaBHP Billiton Finance USA Ltd 3.85% 30/09/2023 161 000 163 435 169 267 0.37
Total Australia 0.37% (31 December 2013: 1.81%) 169 267 0.37
BelgiumBelgium Government Bond 3.00% 22/06/2034 30 000 41 416 43 896 0.1
KBC Groep NV 5.63% 29/03/2049 100 000 139 053 137 819 0.3
Total Belgium 0.40% (31 December 2013: 0.00%) 181 715 0.4
CanadaCanada Housing Trust No 1 2.35% 15/12/2018 785 000 738 507 755 793 1.66
Glencore Finance Canada Ltd 4.95% 15/11/2021 84 000 86 607 90 640 0.2
Province of Ontario Canada 2.00% 30/01/2019 70 000 69 963 70 758 0.15
Thomson Reuters Corp 4.30% 23/11/2023 20 000 19 884 20 890 0.05
Total Canada 2.06% (31 December 2013: 2.39%) 938 081 2.06
DenmarkDanske Bank A/S 5.75% 31/10/2049 100 000 137 394 141 847 0.31
Total Denmark 0.31% (31 December 2013: 0.00%) 141 847 0.31Total Finland 0.00% (31 December 2013: 0.38%)
FranceDexia Credit Local SA 1.38% 18/09/2019 50 000 68 979 69 736 0.15
Electricite de France SA 5.88% 18/07/2031 85 000 163 669 170 667 0.37
France Government Bond OAT 3.25% 25/04/2016 190 500 269 917 275 835 0.61
France Government Bond OAT 2.50% 25/05/2030 90 000 123 126 126 490 0.28
Total France 1.41% (31 December 2013: 3.71%) 642 728 1.41
GermanyBundesobligation 2.50% 10/10/2014 155 000 215 335 213 626 0.47
Landeskreditbank Baden-Wuerttemberg Foerderbank 1.63% 25/04/2017
70 000 71 174 71 313 0.16
Total Germany 0.63% (31 December 2013: 4.56%) 284 939 0.63
GuernseyCredit Suisse Group Guernsey I Ltd 7.88% 24/02/2041 200 000 217 070 216 000 0.47
Total Guernsey 0.47% (31 December 2013: 0.00%) 216 000 0.47
ItalyItaly Buoni Poliennali Del Tesoro 4.00% 01/09/2020 35 000 52 563 54 138 0.12
Italy Buoni Poliennali Del Tesoro 3.75% 01/05/2021 110 000 165 734 167 047 0.36
Italy Buoni Poliennali Del Tesoro 3.75% 01/09/2024 270 000 391 866 399 719 0.88
Italy Buoni Poliennali Del Tesoro 4.75% 01/09/2028 45 000 68 373 71 546 0.16
Italy Buoni Poliennali Del Tesoro 4.75% 01/09/2044 65 000 98 176 101 539 0.22
Total Italy 1.74% (31 December 2013: 0.45%) 793 989 1.74
JapanJapan Government Ten Year Bond 0.80% 20/12/2022 20 500 000 207 139 208 628 0.46
Japan Government Thirty Year Bond 2.00% 20/03/2042 10 100 000 107 018 107 959 0.24
Total Japan 0.70% (31 December 2013: 1.06%) 316 587 0.7

STANLIB Funds Limited
Portfolio Statement (continued)
STANLIB Global Balanced Cautious Fund (continued)
As at 30 June 2014
170
Nominal holding Cost USD Market Value USD % of Net AssetsLuxembourgEuropean Financial Stability Facility 1.75% 29/10/2020 70 000 96 342 100 814 0.22
Total Luxembourg 0.22% (31 December 2013: 1.14%) 100 814 0.22
MexicoMexican Bonos 10.00% 05/12/2024 4 680 000 454 666 481 703 1.06
Petroleos Mexicanos 5.75% 01/03/2018 100 000 110 801 112 563 0.24
United Mexican States 5.63% 19/03/2114 100 000 159 124 168 085 0.37
Total Mexico 1.67% (31 December 2013: 0.24%) 762 351 1.67
NetherlandsBharti Airtel International Netherlands BV 5.35% 20/05/2024 200 000 199 834 208 031 0.46
ING Bank NV 6.13% 29/05/2023 100 000 152 920 156 049 0.34
Linde Finance BV 8.13% 14/07/2066 90 000 170 077 172 146 0.38
Petrobras Global Finance BV 3.25% 17/03/2017 170 000 170 025 173 671 0.38
Total Netherlands 1.56% (31 December 2013: 0.68%) 709 897 1.56
New ZealandNew Zealand Government Bond 5.50% 15/04/2023 250 000 229 701 235 862 0.52
Total New Zealand 0.52% (31 December 2013: 0.00%) 235 862 0.52
NorwayEksportfinans ASA 3.00% 17/11/2014 69 000 69 055 69 344 0.15
Eksportfinans ASA 2.00% 15/09/2015 140 000 138 997 139 846 0.31
Eksportfinans ASA 2.38% 25/05/2016 170 000 168 683 170 923 0.37
Total Norway 0.83% (31 December 2013: 0.74%) 380 113 0.83
PolandPoland Government International Bond 5.00% 23/03/2022 50 000 52 587 55 595 0.12
Poland Government International Bond 3.00% 15/01/2024 40 000 56 954 58 824 0.13
Total Poland 0.25% (31 December 2013: 0.28%) 114 419 0.25
PortugalPortugal Obrigacoes do Tesouro OT 4.75% 14/06/2019 230 000 328 409 349 399 0.77
Portugal Obrigacoes do Tesouro OT 5.65% 15/02/2024 70 000 103 664 110 941 0.24
Total Portugal 1.01% (31 December 2013: 0.00%) 460 340 1.01
RomaniaRomanian Government International Bond 3.63% 24/04/2024 150 000 206 086 214 832 0.47
Total Romania 0.47% (31 December 2013: 0.00%) 214 832 0.47
SloveniaSlovenia Government Bond 3.00% 08/04/2021 160 000 219 576 226 801 0.5
Total Slovenia 0.50% (31 December 2013: 0.00%) 226 801 0.5
SpainSpain Government Bond 2.75% 31/10/2024 145 000 195 643 198 144 0.44
Total Spain 0.44% (31 December 2013: 0.45%) 198 144 0.44
SupernationalCorp Andina de Fomento 1.88% 29/05/2021 100 000 136 274 138 630 0.3
Total Supernational 0.30% (31 December 2013: 0.00%) 138 630 0.3
SwedenSvensk Exportkredit AB 5.13% 01/03/2017 60 000 66 603 66 735 0.15
Total Sweden 0.15% (31 December 2013: 0.36%) 66 735 0.15
SwitzerlandUBS AG 5.13% 15/05/2024 200 000 199 812 203 847 0.45
Total Switzerland 0.45% (31 December 2013: 0.00%) 203 847 0.45
United KingdomAbbey National Treasury Services Plc/London 4.00% 13/03/2024
160 000 159 799 165 414 0.36
BAT International Finance Plc 3.25% 07/06/2022 163 000 159 941 162 622 0.36
BUPA Finance Plc 5.00% 25/04/2023 100 000 170 036 174 207 0.38
Legal & General Group Plc 10.00% 23/07/2041 50 000 111 877 114 617 0.25
Pennon Group Plc 6.75% 08/03/2049 100 000 177 621 182 287 0.4

STANLIB Funds Limited
Portfolio Statement (continued)
STANLIB Global Balanced Cautious Fund (continued)
As at 30 June 2014
171
Nominal holding Cost USD Market Value USD % of Net AssetsUnited Kingdom (continued)Royal Bank of Scotland Group Plc 6.13% 15/12/2022 103 000 106 472 112 886 0.25
RSA Insurance Group Plc 9.38% 20/05/2039 50 000 102 299 103 797 0.23
SABMiller Plc 6.50% 15/07/2018 172 000 200 736 201 265 0.44
Tesco Plc 5.50% 13/12/2019 94 000 171 868 179 307 0.4
Total United Kingdom 3.07% (31 December 2013: 2.96%) 1 396 402 3.07
United StatesAmerican International Group Inc 4.13% 15/02/2024 77 000 78 132 81 007 0.18
Amgen Inc 5.38% 15/05/2043 75 000 83 910 82 684 0.18
Anheuser-Busch InBev Worldwide Inc 5.38% 15/01/2020 141 000 161 429 162 548 0.36
AT&T Inc 2.38% 27/11/2018 202 000 203 482 205 616 0.45
Bank of America Corp 4.00% 01/04/2024 160 000 159 415 163 453 0.36
Citigroup Inc 4.25% 25/02/2030 52 000 75 677 75 463 0.17
DIRECTV Holdings LLC / DIRECTV Financing Co Inc 4.45% 01/04/2024
155 000 154 624 164 126 0.36
Enterprise Products Operating LLC 3.90% 15/02/2024 85 000 84 947 87 801 0.19
Federal Home Loan Banks 0.63% 28/12/2016 395 000 394 011 394 263 0.87
Federal Home Loan Mortgage Corp 0.88% 14/10/2016 390 000 391 731 392 248 0.86
Federal National Mortgage Association 0.63% 26/08/2016 400 000 399 765 400 464 0.88
Kansas City Southern Railway Co/The 3.85% 15/11/2023 34 000 33 643 33 983 0.08
L-3 Communications Corp 3.95% 28/05/2024 164 000 163 098 165 292 0.36
McKesson Corp 2.28% 15/03/2019 165 000 164 731 165 552 0.36
Metropolitan Life Global Funding I 2.30% 10/04/2019 150 000 149 812 151 501 0.33
Novartis Capital Corp 3.40% 06/05/2024 160 000 159 263 162 057 0.36
Pacific Gas & Electric Co 3.85% 15/11/2023 80 000 80 647 83 497 0.18
PPL Capital Funding Inc 4.20% 15/06/2022 33 000 34 117 35 292 0.08
PPL Capital Funding Inc 3.95% 15/03/2024 85 000 85 047 88 097 0.19
Prudential Financial Inc 3.50% 15/05/2024 165 000 164 197 164 815 0.36
Sempra Energy 3.55% 15/06/2024 160 000 159 535 160 622 0.35
Time Warner Cable Inc 5.50% 01/09/2041 88 000 88 048 98 426 0.22
United States Treasury Bill 0% 31/07/2014 600 000 599 978 599 987 1.32
United States Treasury Note/Bond 0.25% 15/12/2015 100 000 100 047 100 016 0.22
United States Treasury Note/Bond 0.75% 15/03/2017 950 000 949 631 949 852 2.09
United States Treasury Note/Bond 3.75% 15/11/2043 87 000 88 350 93 783 0.21
United States Treasury Note/Bond 3.63% 15/02/2044 100 000 104 401 105 312 0.23
Verizon Communications Inc 2.45% 01/11/2022 181 000 163 821 169 706 0.37
Verizon Communications Inc 5.15% 15/09/2023 112 000 119 380 124 807 0.27
Yum! Brands Inc 3.88% 01/11/2023 85 000 84 705 86 476 0.19
Total United States 12.63% (31 December 2013: 12.91%) 5 748 746 12.63Total Bonds 32.16% (31 December 2013: 34.12%) 14 643 086 32.16
Commercial Paper
Nominal holding Cost USD Market Value USD % of Net AssetsUnited StatesBanque Federative Du Credit S.A. 0.12% 07/07/2014 1 200 000 1 199 964 1 199 972 2.63
Caisse Des Depots Et Consignations 0.05% 07/07/2014 500 000 499 987 499 995 1.1
Caisse Des Depots Et Consignations 0.18% 22/09/2014 500 000 499 827 499 796 1.1
National Bank of Abu Dhabi 0.12% 10/07/2014 500 000 499 972 499 983 1.1
National Bank of Abu Dhabi 0.19% 14/08/2014 500 000 499 878 499 882 1.1
Nationwide Building Society 0.10% 10/07/2014 500 000 499 976 499 986 1.1
Total United States 8.13% (31 December 2013: 0.00%) 3 699 614 8.13Total Commercial Paper 8.13% (31 December 2013: 0.00%) 3 699 614 8.13

STANLIB Funds Limited
Portfolio Statement (continued)
STANLIB Global Balanced Cautious Fund (continued)
As at 30 June 2014
172
Certificates of Deposit
Nominal holding Cost USD Market Value USD % of Net AssetsUnited StatesBank of Montreal 0% 02/07/2014 1 000 000 999 995 1 000 000 2.2
Mizuho Trust & Banking (Lux) S.A 0% 24/07/2014 1 000 000 999 853 999 853 2.2
Skandinaviska Enskilda Banken 0.15% 31/07/2014 1 000 000 999 842 999 875 2.19
Total United States 6.59% (31 December 2013: 0.00%) 2 999 728 6.59Total Certificates of Deposit 6.59% (31 December 2013: 0.00%)
2 999 728 6.59
Total Investments 34 480 267 35 652 813 78.31Net current assets* 9 875 420 21.69
Total net assets 45 528 233 100
*Net current assets include derivative positions. Please refer to note 12 for details of these.

STANLIB Funds Limited
173
Fund Statistics as at 30 June 2014
CCY 2013 2012 2011 2010 2009Combined Net Assets USD 3,811,913,520 2,972,259,578 2,587,118,908 2,663,504,317 2,247,387,030
STANLIB Global Property Fund
CCY 2013 2012 2011 2010 2009Net Assets USD 102,795,842 79,084,541 33,557,524 37,808,990 4,643,953
Participating shares in issue USD 55,019 41,135 21,964 24,936 3,710
Net asset value (NAV) per participating share at year end
USD 1,868.35 1,922.56 1,527.84 1,516.24 1,251.74
Highest NAV per participating share during the year
USD 2,166.57 1,928.56 1,704.90 1,527.51 2,006.73
Lowest NAV per participating share during the year
USD 1,809.37 1,517.84 1,350.19 1,166.74 985.62
STANLIB Multi-Manager Global Bond Fund
CCY 2013 2012 2011 2010 2009Net Assets USD 391,472,872 534,143,620 358,653,440 476,386,117 287,212,648
Participating shares in issue 196,691 258,448 184,298 259,935 166,519
Net asset value (NAV) per participating share at year end
USD 1,990.29 2,066.74 1,946.05 1,832.71 1,724.80
Highest NAV per participating share during the year
2,070.46 2,075.81 1,995.52 1,898.07 1,780.39
Lowest NAV per participating share during the year
1,940.39 1,931.85 1,805.45 1,691.15 1,436.36
STANLIB Multi-Manager Global Equity Fund
CCY 2013 2012 2011 2010 2009Net Assets USD 2,041,679,067 1,484,745,052 1,367,888,233 1,171,930,890 664,711,715
Participating shares in issue 909,999 801,847 865,422 691,313 444,051
Net asset value (NAV) per participating share at year end
USD 2,243.60 1,851.66 1,580.60 1,695.22 1,496.93
Highest NAV per participating share during the year
USD 2,245.15 1,858.36 1,827.75 1,695.22 1,052.38
Lowest NAV per participating share during the year
USD 1,853.16 1,597.81 1,434.98 1,352.96 851.52

STANLIB Funds Limited
Fund Statistics as at 30 June 2014 (continued)
174
High Alpha Global Equity Fund
CCY 2013 2012 2011 2010 2009Net Assets USD 939,138,889 689,100,754 753,842,969 889,228,404 1,006,474,687
Participating shares in issue - Class A 168,991 180,980 217,416 334,929 945,953
Net asset value (NAV) per participating share at year end
USD 1,066.05 773.02 742.51 802.76 697.23
Highest NAV per participating share during the year
USD 1,066.05 834.24 924.78 803.45 699.45
Lowest NAV per participating share during the year
USD 843.62 738.63 673.65 624.99 447.19
Participating shares in issue - Class B 694,290 637,147 783,907 762,342 492,814
Net asset value (NAV) per participating share at year end
USD 1,093.71 789.56 755.71 813.76 703.97
Highest NAV per participating share during the year
USD 1,093.71 852.37 939.39 814.37 706.09
Lowest NAV per participating share during the year
USD 862.13 753.23 685.15 632.02 449.98
STANLIB Global Bond Fund
CCY 2013 2012 2011 2010 2009Net Assets USD 156,854,503 81,836,679 73,176,742 88,149,916 284,344,027 Participating shares in issue 113,473 56,857 56,057 73,868 264,317 Net asset value (NAV) per participating share at year end
USD 1,382.30 1,439.34 1,305.40 1,193.34 1,075.77
Highest NAV per participating share during the year
USD 1,450.48 1,441.25 1,320.79 1,225.17 1,100.81
Lowest NAV per participating share during the year
USD 1,365.50 1,294.60 1,177.20 1,074.37 843.31
STANLIB Global Emerging Markets Fund
CCY 2013 2012 2011 2010 2009Net Assets USD 95,852,388 103,348,932 - - - Participating shares in issue 90,909 101,093 - - - Net asset value (NAV) per participating share at year end
USD 1,054.38 1,022.32 - - -
Highest NAV per participating share during the year
USD 1,074.09 1,026.04 - - -
Lowest NAV per participating share during the year
USD 915.06 1,000.00 - - -
STANLIB Global Balanced Fund*
CCY 2013 2012 2011 2010 2009Net Assets USD 65,309,960 - - - - Participating shares in issue 61,135 - - - - Net asset value (NAV) per participating share at year end
USD 1,068.29 - - - -
Highest NAV per participating share during the year
USD 1,070.05 - - - -
Lowest NAV per participating share during the year
USD 980.44 - - - -
* Class Funds launched on 1 July 2013.

STANLIB Funds Limited
Fund Statistics as at 30 June 2014 (continued)
175
STANLIB Global Balanced Cautious Fund*
CCY 2013 2012 2011 2010 2009Net Assets USD 18,809,999 - - - - Participating shares in issue 18,335 - - - - Net asset value (NAV) per participating share at year end
USD 1,025.91 - - - -
Highest NAV per participating share during the year
USD 1,028.73 - - - -
Lowest NAV per participating share during the year
USD 989.5 - - - -
* Class Funds launched on 1 July 2013.

STANLIB Funds Limited
176
Summary of Material Portfolio Changes for the period ended 30 June 2014
Global Property Fund
Purchases Cost USD'000 Sales Proceeds USD'000
HCP Inc 1,675 HCP Inc 2,314
Macerich Co/The 974 Macerich Co/The 1,323
Camden Property Trust 911 Simon Property Group Inc 1,279
Extra Space Storage Inc 884 BR Malls Participacoes SA 1,273
iCADE 726 Camden Property Trust 948
Japan Prime Realty Investment Corp 644 Unibail-Rodamco SE 919
Deutsche Wohnen AG 578 Digital Realty Trust Inc 810
Sovran Self Storage Inc 562 American Campus Communities Inc 728
Big Yellow Group Plc 540 Public Storage 696
Mid-America Apartment Communities Inc 491 Prologis Inc 620
Capital & Counties Properties Plc 482 Mid-America Apartment Communities Inc 598
Swire Properties Ltd 481 Equity Residential 554
Aeon Mall Co Ltd 401 Big Yellow Group Plc 542
Prosperity REIT 397 Wharf Holdings Ltd 531
Deutsche Annington Immobilien SE 392 GSW Immobilien AG 511
PSP Swiss Property AG 360 Kenedix Realty Investment Corp 498
Ventas Inc 356 Atrium European Real Estate Ltd 477
Goodman Group 322 Castellum AB 470
Japan Real Estate Investment Corp 319 Is Gayrimenkul Yatirim Ortakligi AS 441
Derwent London Plc 288 CapitaRetail China Trust 428
Cost of investments purchased during the period USD 14,587,360Proceeds of investments sold during the period USD 26,909,447
The schedule refers to the top 20 securities bought and sold during the period. The Directors consider that disclosure of the 20 largest purchases and 20 largest sales is sufficient to reflect the nature of the operating activity of the Class Fund and that further disclosure of all transactions of the Class Fund would not add any further value.

STANLIB Funds Limited
Summary of Material Portfolio Changes for the period ended 30 June 2014 (continued)
177
STANLIB Multi-Manager Global Bond Fund
Purchases Cost USD'000 Sales Proceeds USD'000
Institutional Cash Series Plc - Institutional US Dollar Liquidity Fund 9,516 United States Treasury Bill 0.00% 06/03/2014 14,910
United States Treasury Floating Rate Note 0.07% 31/01/2016 8,982 United States Treasury Bill 0.00% 21/08/2014 10,946
New South Wales Treasury Corp 5.00% 20/08/2024 3,909 Institutional Cash Series Plc - Institutional US Dollar Liquidity Fund 9,516
Fannie Mae Pool 0.00% 13/02/2036 3,466 United States Treasury Floating Rate Note 0.07% 31/01/2016 6,973
Fannie Mae Pool 0.00% 13/03/2036 3,448 United Kingdom Gilt 2.25% 07/03/2014 5,529
Fannie Mae Pool 0.00% 01/03/2041 3,188 Capital International Global High Income Opportunities 5,300
Fannie Mae Pool 0.00% 01/05/2039 3,112 New South Wales Treasury Corp 6.00% 01/04/2016 4,113
United Kingdom Gilt 2.75% 22/01/2015 3,013 Fannie Mae Pool 0.00% 13/02/2036 3,492
Fannie Mae Pool 0.00% 25/04/2039 2,741 Fannie Mae Pool 0.00% 13/03/2036 3,447
Fannie Mae Pool 0.00% 01/02/2041 2,729 Fannie Mae Pool 0.00% 01/03/2041 3,176
Fannie Mae Pool 0.00% 25/06/2039 2,710 Fannie Mae Pool 0.00% 01/05/2039 3,133
Freddie Mac Gold Pool 0.00% MBS 30yr 2,669 United States Treasury Note/Bond 2.88% 15/05/2043 2,960
Freddie Mac Gold Pool 0.00% MBS 30yr 2,640 Bundesrepublik Deutschland 4.25% 04/07/2018 2,841
Mexican Bonos 7.75% 13/11/2042 2,587 Fannie Mae Pool 0.00% 25/01/2040 2,800
Fannie Mae Pool 4.50% 13/06/2036 2,473 Fannie Mae Pool 0.00% 01/02/2041 2,759
Erste Abwicklungsanstalt 0.43% 07/06/2016 2,406 Fannie Mae Pool 0.00% 25/04/2039 2,737
Fannie Mae Pool 0.00% 01/09/2039 2,383 Fannie Mae Pool 0.00% 25/06/2039 2,726
Fannie Mae Pool 0.00% 01/02/2040 2,340 Freddie Mac Gold Pool 0.00% MBS 30yr 2,684
Fannie Mae Pool 0.00% 01/06/2041 2,280 Freddie Mac Gold Pool 0.00% MBS 30yr 2,657
Fannie Mae Pool 0.00% 15/10/2041 2,270 Freddie Mac Gold Pool 0.00% MBS 30yr 2,616
Cost of investments purchased during the period USD 239,101,888Proceeds of investments sold during the period USD 369,770,944
The schedule refers to the top 20 securities bought and sold during the year. The Directors consider that disclosure of the 20 largest purchases and 20 largest sales is sufficient to reflect the nature of the operating activity of the Class Fund and that further disclosure of all transactions of the Class Fund would not add any further value.

STANLIB Funds Limited
Summary of Material Portfolio Changes for the period ended 30 June 2014 (continued)
178
STANLIB Multi-Manager Global Equity Fund
Purchases Cost USD'000 Sales Proceeds USD'000
Comcast Corp Class A 14,493 GlaxoSmithKline PLC 17,385
Roche Holding AG 11,102 Vodafone Group Plc 14,556
Baxter International Inc 9,810 BP Plc 14,290
Julius Baer Group Ltd 9,520 iShares MSCI World UCITS ETF Inc 12,915
Vodafone Group Plc 9,143 Verizon Communications Inc 9,624
Apple Inc 7,595 Weatherford International Ltd/Switzerland 7,703
Oracle Corp 7,297 Allergan Inc/United States 6,699
Cochlear Ltd 5,865 Northern Trust Corp 6,408
Fiserv Inc 5,768 Coca-Cola Co/The 6,129
Praxair Inc 5,767 Novo Nordisk A/S 6,109
Verizon Communications Inc 5,180 Pfizer Inc 5,325
Coca-Cola Co/The 5,086 McKesson Corp 4,344
CSL Ltd 4,727 Accenture Plc 3,906
Statoil ASA 4,257 Kellogg Co 3,870
Stanley Electric Co Ltd 4,161 FedEx Corp 3,823
Visa Inc 4,045 Quest Diagnostics Inc 3,572
Capital International Emerging Markets Fund 3,920 Masco Corp 3,560
Chevron Corp 3,718 Astellas Pharma Inc 3,532
Google Inc Class A 3,662 iShares MSCI Emerging Markets ETF 3,514
Morgan Stanley 3,409 Stryker Corp 3,345
Cost of investments purchased during the period USD 477,324,052Proceeds of investments sold during the period USD 383,861,200
The schedule refers to the top 20 securities bought and sold during the year. The Directors consider that disclosure of the 20 largest purchases and 20 largest sales is sufficient to reflect the nature of the operating activity of the Class Fund and that further disclosure of all transactions of the Class Fund would not add any further value.

STANLIB Funds Limited
Summary of Material Portfolio Changes for the period ended 30 June 2014 (continued)
179
High Alpha Global Equity Fund
Purchases Cost USD'000 Sales Proceeds USD'000
Gilead Sciences Inc 21,655 eBay Inc 23,123
Total SA 19,467 Tyco International Ltd 19,065
Wolseley Plc 17,668 Equifax Inc 17,481
Bank of Ireland 17,028 Novartis AG 14,907
Aegon NV 14,626 Las Vegas Sands Corp 14,831
Hewlett-Packard Co 14,403 Whitbread Plc 14,625
Apollo Global Management LLC 13,535 Autodesk Inc 11,895
Charter Communications Inc 12,759 Fresenius Medical Care AG & Co KGaA 11,836
Mitsui Fudosan Co Ltd 12,618 EMC Corp/MA 11,564
Fomento Economico Mexicano SAB de CV 11,889 Fidelity National Financial Inc 10,993
Grupo Financiero Banorte SAB de CV 11,543 Covidien Plc 10,271
Taiheiyo Cement Corp 10,488 Walt Disney Co/The 9,871
Pfizer Inc 10,350 National Oilwell Varco Inc 9,749
Applied Materials Inc 10,266 Konami Corp 9,198
Halliburton Co 10,064 Jabil Circuit Inc 8,681
NIKE Inc 9,995 LyondellBasell Industries NV 8,639
Praxair Inc 9,914 Unilever Plc 8,160
Amphenol Corp 9,891 McDonald's Corp 7,803
TJX Cos Inc 9,424 United Rentals Inc 7,768
BG Group Plc 7,834 Facebook Inc 7,388
Cost of investments purchased during the period USD 421,536,222Proceeds of investments sold during the period USD 372,235,485
The schedule refers to the top 20 securities bought and sold during the year. The Directors consider that disclosure of the 20 largest purchases and 20 largest sales is sufficient to reflect the nature of the operating activity of the Class Fund and that further disclosure of all transactions of the Class Fund would not add any further value.

STANLIB Funds Limited
Summary of Material Portfolio Changes for the period ended 30 June 2014 (continued)
180
STANLIB Global Bond Fund
Purchases Cost USD'000 Sales Proceeds USD'000
United States Treasury FRN 31/01/2016 32,764 United States Treasury Bill 0.00% 21/08/2014 28,729
New South Wales Treasury Corp 5.00% 20/08/2024 8,318 United States Treasury FRN 31/01/2016 28,025
United Kingdom Gilt 2.75% 22/01/2015 7,809 United States Treasury Bill 0.00% 06/03/2014 26,764
Mexican Bonos 7.75% 13/11/2042 7,167 United Kingdom Gilt 2.25% 07/03/2014 9,914
Mexican Bonos 8.50% 18/11/2038 4,687 New South Wales Treasury Corp 6.00% 01/04/2016 7,687
Mexican Bonos 8.50% 31/05/2029 4,041 New South Wales Treasury Corp 5.00% 20/08/2024 2,432
Nederlandse Waterschapsbank NV 0.46% 14/02/2018 3,935 Poland Government Bond 5.50% 25/04/2015 2,106
Svensk Exportkredit AB 0.60% 09/11/2017 2,652 United States Treasury Note/Bond 2.88% 15/05/2043 1,837
Bank Nederlandse Gemeenten 0.40% 18/07/2016 2,598 Erste Abwicklungsanstalt 0.63% 20/11/2014 1,604
Svensk Exportkredit AB 0.41% 12/06/2017 2,407 KFW 6.25% 04/12/2019 1,524
Kommunalbanken AS 0.61% 27/03/2017 2,198 Mexican Bonos 8.50% 31/05/2029 1,297
Poland Government Bond 4.00% 25/10/2023 2,182 Svensk Exportkredit AB 1.75% 20/10/2015 1,247
Export-Import Bank of Korea 0.82% 12/05/2017 1,805 Svensk Exportkredit AB 0.41% 12/06/2017 1,233
Macquarie Group Ltd 1.22% 31/01/2017 1,770 Kommunalbanken AS 0.32% 18/03/2016 1,206
Erste Abwicklungsanstalt 0.43% 07/06/2016 1,604 Korea Treasury Bond 5.75% 10/09/2018 1,187
Export-Import Bank of Korea 0.85% 14/08/2017 1,585 Queensland Treasury Corp 6.25% 21/02/2020 857
Malaysia Government Bond 4.05% 30/09/2021 1,033 United States Treasury Note/Bond 2.75% 15/08/2042 745
Queensland Treasury Corp 6.25% 21/02/2020 1,004 South Africa Government Bond 6.50% 28/02/2041 684
Queensland Treasury Corp 6.00% 21/07/2022 858 Poland Government Bond 5.25% 25/10/2020 599
Export-Import Bank of Korea 0.98% 14/01/2017 840 Poland Government Bond 4.00% 25/10/2023 589
Cost of investments purchased during the period USD 91,610,629Proceeds of investments sold during the period USD 122,172,200
The schedule refers to the top 20 securities bought and sold during the year. The Directors consider that disclosure of the 20 largest purchases and 20 largest sales is sufficient to reflect the nature of the operating activity of the Class Fund and that further disclosure of all transactions of the Class Fund would not add any further value.

STANLIB Funds Limited
Summary of Material Portfolio Changes for the period ended 30 June 2014 (continued)
181
STANLIB Global Emerging Markets Fund
Purchases Cost USD'000 Sales Proceeds USD'000
Taiwan Semiconductor Manufacturing Co Ltd ADR 2,096 Turkiye Garanti Bankasi AS 2,235
Petroleo Brasileiro SA ADR 2,095 Tencent Holdings Ltd 2,050
Grupo Televisa SAB 1,820 Infosys Ltd ADR 1,779
Hon Hai Precision Industry Co Ltd 1,801 Taiwan Semiconductor Manufacturing Co Ltd ADR 1,731
Naspers Ltd 1,716 CTBC Financial Holding Co Ltd 1,433
National Bank of Greece SA 1,707 CNOOC Ltd 1,334
Sasol Ltd 1,575 Itau Unibanco Holding SA 1,308
MegaFon OAO 1,423 Yandex NV 1,240
Gazprom OAO 1,392 Samsung Electronics Co Ltd 1,131
Turkiye Garanti Bankasi AS 1,383 ICICI Bank Ltd 1,095
China Petroleum & Chemical Corp 1,324 Surgutneftegas OAO 1,069
Yandex NV 1,272 SINA Corp/China 1,031
Bolsa Mexicana de Valores SAB de CV 1,267 Baidu Inc 1,015
Alpha Bank AE 1,244 Total Access Communication PCL 1,003
Baidu Inc 1,157 SK Hynix Inc 996
Bank Pekao SA 1,056 Sun Art Retail Group Ltd 982
Korea Electric Power Corp 1,052 Magnit OJSC GDR 937
Advanced Semiconductor Engineering Inc 1,016 Philippine Long Distance Telephone Co 922
58.com Inc 1,006 Grupo Lala SAB de CV 908
BRF SA 957 Great Wall Motor Co Ltd 823
Cost of investments purchased during the period USD 64,900,539Proceeds of investments sold during the period USD 41,931,933
The schedule refers to the top 20 securities bought and sold during the year. The Directors consider that disclosure of the 20 largest purchases and 20 largest sales is sufficient to reflect the nature of the operating activity of the Class Fund and that further disclosure of all transactions of the Class Fund would not add any further value.

STANLIB Funds Limited
Summary of Material Portfolio Changes for the period ended 30 June 2014 (continued)
182
STANLIB Global Balanced Fund
Purchases Cost USD'000 Sales Proceeds USD'000
Italy Buoni Poliennali Del Tesoro 3.75% 01/09/2024 2,094 Spain Government Bond 3.80% 30/04/2024 1,674
United States Treasury Note/Bond 0.75% 15/03/2017 1,798 Bundesrepublik Deutschland 1.75% 15/02/2024 1,548
Spain Government Bond 3.80% 30/04/2024 1,654 United States Treasury Note/Bond 0.63% 15/08/2016 1,517
Bundesrepublik Deutschland 1.75% 15/02/2024 1,549 Italy Buoni Poliennali Del Tesoro 3.75% 01/09/2024 1,346
United States Treasury Bill 0.00% 31/07/2014 1,500 eBay Inc 1,330
Gilead Sciences Inc 1,349 Las Vegas Sands Corp 1,048
Total SA 1,248 Tyco International Ltd 1,044
Wolseley Plc 1,165 Nestle Holdings Inc 2.13% 14/01/2020 988
Bank of Ireland 1,129 Italy Buoni Poliennali Del Tesoro 4.50% 01/03/2024 943
United States Treasury Note/Bond 0.63% 15/08/2016 1,003 Bundesobligation 2.50% 10/10/2014 892
Nestle Holdings Inc 2.13% 14/01/2020 985 Spain Government Bond 2.75% 30/04/2019 857
Aegon NV 964 Equifax Inc 850
Pfizer Inc 964 Australia Government Bond 5.50% 21/04/2023 778
Hewlett-Packard Co 918 France Government Bond OAT 4.25% 25/10/2018 777
Mexican Bonos 10.00% 05/12/2024 903 Novartis AG 753
Apollo Global Management LLC 863 United States Treasury Note/Bond 1.75% 15/05/2023 738
Spain Government Bond 2.75% 30/04/2019 850 Walt Disney Co/The 680
Mitsui Fudosan Co Ltd 840 Bundesobligation 1.00% 12/10/2018 675
Charter Communications Inc 838 Fidelity National Financial Inc 671
Nestle SA 834 Barclays Bank Plc 3.75% 15/05/2024 668
Cost of investments purchased during the period USD 109,242,909Proceeds of investments sold during the period USD 55,693,467
The schedule refers to the top 20 securities bought and sold during the year. The Directors consider that disclosure of the 20 largest purchases and 20 largest sales is sufficient to reflect the nature of the operating activity of the Class Fund and that further disclosure of all transactions of the Class Fund would not add any further value.

STANLIB Funds Limited
Summary of Material Portfolio Changes for the period ended 30 June 2014 (continued)
183
STANLIB Global Balanced Cautious Fund
Purchases Cost USD'000 Sales Proceeds USD'000
Italy Buoni Poliennali Del Tesoro 3.75% 01/09/2024 1,072 Spain Government Bond 3.80% 30/04/2024 851
United States Treasury Note/Bond 0.75% 15/03/2017 950 Bundesrepublik Deutschland 1.75% 15/02/2024 840
United States Treasury Bill 0% 31/07/2014 900 United States Treasury Note/Bond 2.75% 15/02/2024 722
Spain Government Bond 3.80% 30/04/2024 841 Italy Buoni Poliennali Del Tesoro 3.75% 01/09/2024 694
Bundesrepublik Deutschland 1.75% 15/02/2024 841 United States Treasury Note/Bond 0.63% 15/08/2016 657
United States Treasury Note/Bond 2.75% 15/02/2024 723 Bundesobligation 2.50% 10/10/2014 600
Bundesobligation 2.5% 10/10/2014 583 Nestle Holdings Inc 2.13% 14/01/2020 499
Nestle Holdings Inc 2.125% 14/01/2020 497 Australia Government Bond 5.50% 21/04/2023 402
Mexican Bonos 10% 05/12/2024 457 Spain Government Bond 2.75% 30/04/2019 376
United States Treasury Note/Bond 0.63% 15/08/2016 451 Italy Buoni Poliennali Del Tesoro 4.50% 01/03/2024 369
Canada Housing Trust No 1 2.35% 15/12/2018 405 Barclays Bank Plc 3.75% 15/05/2024 337
Spain Government Bond 2.75% 30/04/2019 374 State Grid Overseas Investment 2014 Ltd 4.13% 07/05/2024 329
Barclays Bank Plc 3.75% 15/05/2024 335 France Government Bond OAT 4.25% 25/10/2018 312
Portugal Obrigacoes do Tesouro OT 4.75% 14/06/2019 329 United States Treasury Bill 0.00% 31/07/2014 300
State Grid Overseas Investment 2014 Ltd 4.13% 07/05/2024 326 Belgium Government Bond 2.60% 22/06/2024 276
United States Treasury Note/Bond 3.625% 15/02/2044 308 Bundesobligation 1.00% 12/10/2018 273
Italy Buoni Poliennali Del Tesoro 4.5% 01/03/2024 274 CNOOC Nexen Finance 2014 ULC 4.25% 30/04/2024 268
Belgium Government Bond 2.6% 22/06/2024 272 United States Treasury Note/Bond 1.75% 15/05/2023 260
CNOOC Nexen Finance 2014 ULC 4.25% 30/04/2024 269 eBay Inc 250
Prudential Financial Inc 3.5% 15/05/2024 249 Spain Government Bond 5.40% 31/01/2023 233
Cost of investments purchased during the period USD 53,244,808Proceeds of investments sold during the period USD 29,333,727
The schedule refers to the top 20 securities bought and sold during the year. The Directors consider that disclosure of the 20 largest purchases and 20 largest sales is sufficient to reflect the nature of the operating activity of the Class Fund and that further disclosure of all transactions of the Class Fund would not add any further value.

17 Melrose Boulevard, Melrose Arch2196PO Box 203Melrose Arch2076T0860 123 003 (SA only) T+27 (0)11 448 6000 [email protected] Wstanlib.comGPS coordinatesS 26.13433°, E 028.06800°W
STA
NLI
B A
sset
Man
agem
ent L
imite
d | R
eg. N
o. 19
69/0
027
53/0
6 | A
utho
rised
FSP
in te
rms o
f the
FA
IS A
ct, 2
00
2 (L
icen
ce N
o. 2
6/10
/719
) 264
7_Q
420
12