2014 q2 google_earnings_slides
TRANSCRIPT

Google Confidential and Proprietary
Q2 2014Quarterly Earnings Summary
Financial Highlights:
Revenue growth of 22% Y/Y and 3% Q/Q.
Revenues were $15.96 billion.
• Google sites revenues increased 23% Y/Y and 4% Q/Q
• Network revenues increased 7% Y/Y and 1% Q/Q
• Other revenues increased 53% Y/Y and 3% Q/Q
• Consolidated international revenues were $9.33 billion.
Q2 2014 Highlights
Operational Highlights:
Strong financial metrics: revenue growth and cash flow.
Continuing to invest in three major areas of focus:
• Core ads: Search and Display advertising
• Businesses demonstrating high consumer success:
YouTube, Android/Play, and Chrome
• New businesses where we are investing to drive
adoption and innovation: Social, Commerce, and
Enterprise
Our infrastructure, real estate, and facilities continue to be
key strategic areas of investment.
2Please note: Results from Motorola Mobile are presented as net loss from discontinued operations on the consolidated statements of income, and are excluded from all other results unlessotherwise noted. Previously reported quarters have been adjusted to conform with current period presentation.
All references to share and per share amounts have been retroactively restated to reflect the stock-split which was effected in the form of a stock dividend on April 2, 2014.
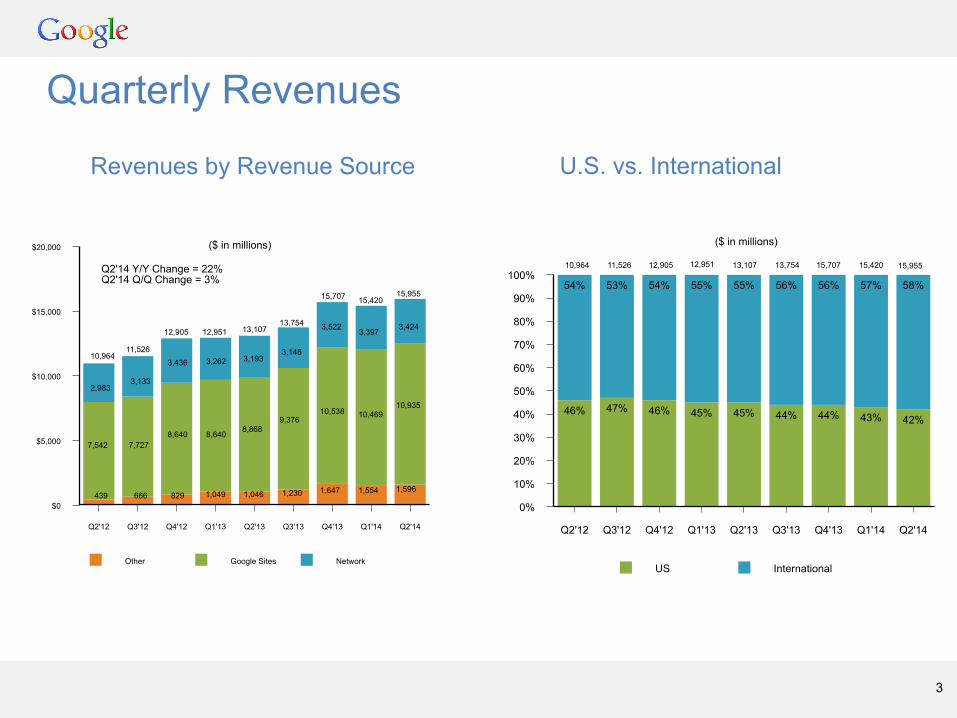
($ in millions)
Revenues by Revenue Source
Other Google Sites Network
$20,000
$15,000
$10,000
$5,000
$0
Q2'12 Q3'12 Q4'12 Q1'13 Q2'13 Q3'13 Q4'13 Q1'14 Q2'14
Quarterly Revenues
Q2'14 Y/Y Change = 22%Q2'14 Q/Q Change = 3%
($ in millions)
3,522
10,538
1,647
3,148
9,376
1,230
3,262
2,983
3,436
3,133
3,193
7,542 7,727
666439
8,6408,640
829 1,049 1,046
8,868
U.S. vs. International
US International
100%
90%
80%
70%
60%
50%
40%
30%
20%
10%
0%
Q2'12 Q3'12 Q4'12 Q1'13 Q2'13 Q3'13 Q4'13 Q1'14 Q2'14
46% 47% 46% 45% 45% 44% 44% 43% 42%
54% 53% 54% 55% 55% 56% 56% 57% 58%
3
10,964
15,955
3,424
10,935
1,596
11,526
12,905 12,95113,754
15,707
13,107
15,95510,964 11,526 12,905 12,951 13,107 13,754 15,707
3,397
10,469
1,554
15,420
15,420

Paid Clicks (1)
Aggregated Network Google Sites
50%
40%
30%
20%
10%
0%
Q1'13 Q2'13 Q3'13 Q4'13 Q1'14 Q2'14
20%
23%
26%
31%
26%25%
20%
13%
5%
10%9% 9%
20%
29%
40%
44%
37%
33%
3
Aggregated Network Google Sites
20%
15%
10%
5%
0%
-5%
-10%
Q1'13 Q2'13 Q3'13 Q4'13 Q1'14 Q2'14
3%
4%
8%
13%
-1%
2%
5%
-5%
3%
7%
4%
-5%
2%
9%
11%
16%
-3%
6%
Y/Y Paid Clicks Growth % Q/Q Paid Clicks Growth %
(1) Include clicks related to ads served on Google owned and operated properties across different geographies and form factors including search, YouTube engagement ads like TrueView, and otherowned and operated properties like Maps and Finance, as well as clicks related to ads served on non-Google properties participating in our AdSense for Search, AdSense for Content, and AdMobbusinesses.
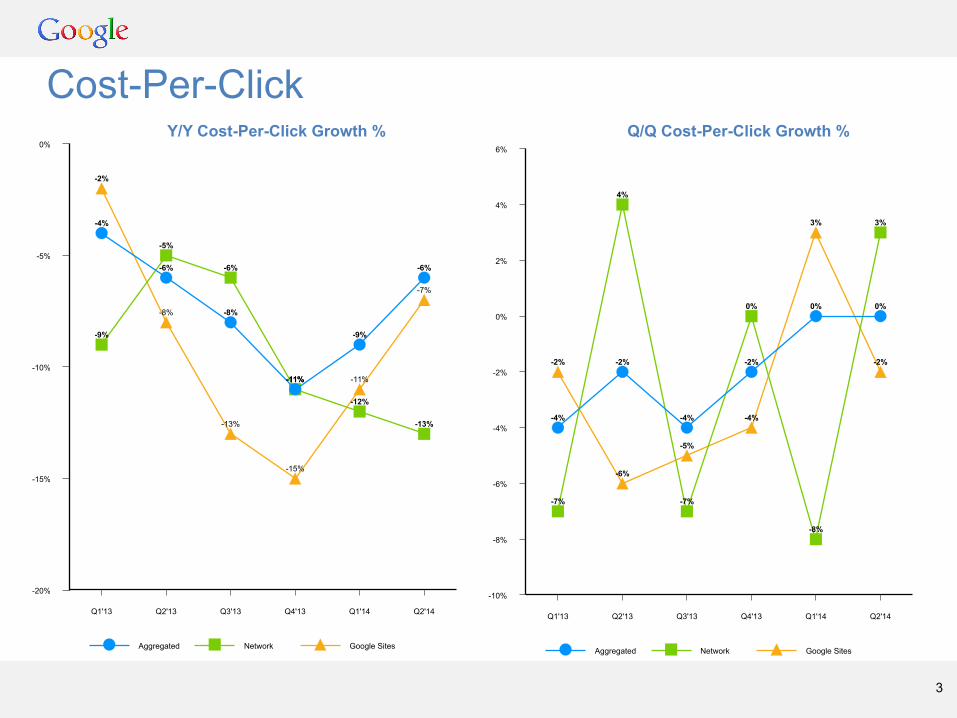
Cost-Per-Click
Aggregated Network Google Sites
0%
-5%
-10%
-15%
-20%
Q1'13 Q2'13 Q3'13 Q4'13 Q1'14 Q2'14
-4%
-6%
-8%
-11%
-9%
-6%
-9%
-5%
-6%
-11%
-12%
-13%
-2%
-8%
-13%
-15%
-11%
-7%
3
Aggregated Network Google Sites
6%
4%
2%
0%
-2%
-4%
-6%
-8%
-10%
Q1'13 Q2'13 Q3'13 Q4'13 Q1'14 Q2'14
-4%
-2%
-4%
-2%
0% 0%
-7%
4%
-7%
0%
-8%
3%
-2%
-6%
-5%
-4%
3%
-2%
Y/Y Cost-Per-Click Growth % Q/Q Cost-Per-Click Growth %
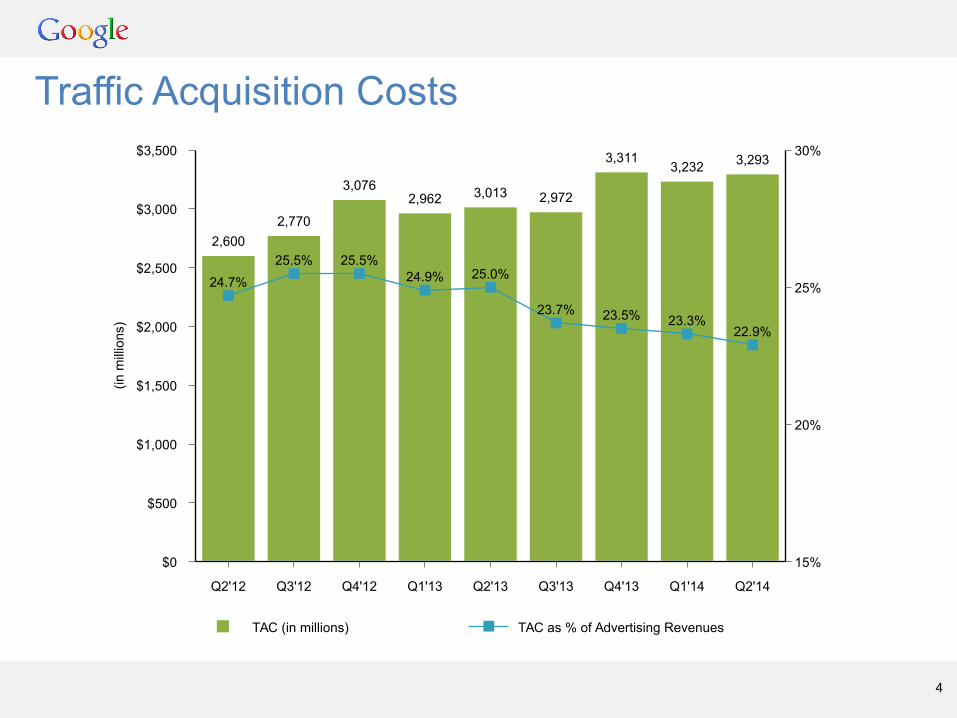
Traffic Acquisition Costs
TAC (in millions) TAC as % of Advertising Revenues
$3,500
$3,000
$2,500
$2,000
$1,500
$1,000
$500
$0
(inm
illio
ns)
30%
25%
20%
15%
Q2'12 Q3'12 Q4'12 Q1'13 Q2'13 Q3'13 Q4'13 Q1'14 Q2'14
2,6002,770
3,0762,962 3,013 2,972
3,3113,232 3,293
24.7%25.5% 25.5%
24.9% 25.0%
23.7% 23.5% 23.3%22.9%
4
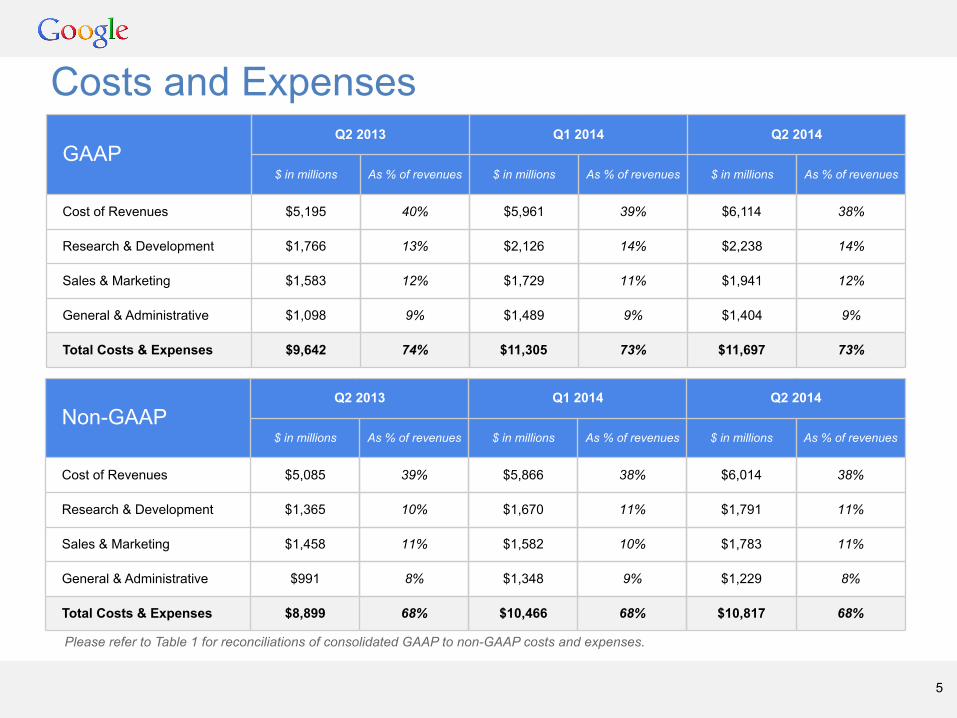
Costs and Expenses GAAP
Q2 2013 Q1 2014 Q2 2014
$ in millions As % of revenues $ in millions As % of revenues $ in millions As % of revenues
Cost of Revenues $5,195 40% $5,961 39% $6,114 38%
Research & Development $1,766 13% $2,126 14% $2,238 14%
Sales & Marketing $1,583 12% $1,729 11% $1,941 12%
General & Administrative $1,098 9% $1,489 9% $1,404 9%
Total Costs & Expenses $9,642 74% $11,305 73% $11,697 73%
Non-GAAPQ2 2013 Q1 2014 Q2 2014
$ in millions As % of revenues $ in millions As % of revenues $ in millions As % of revenues
Cost of Revenues $5,085 39% $5,866 38% $6,014 38%
Research & Development $1,365 10% $1,670 11% $1,791 11%
Sales & Marketing $1,458 11% $1,582 10% $1,783 11%
General & Administrative $991 8% $1,348 9% $1,229 8%
Total Costs & Expenses $8,899 68% $10,466 68% $10,817 68%
Please refer to Table 1 for reconciliations of consolidated GAAP to non-GAAP costs and expenses.
5
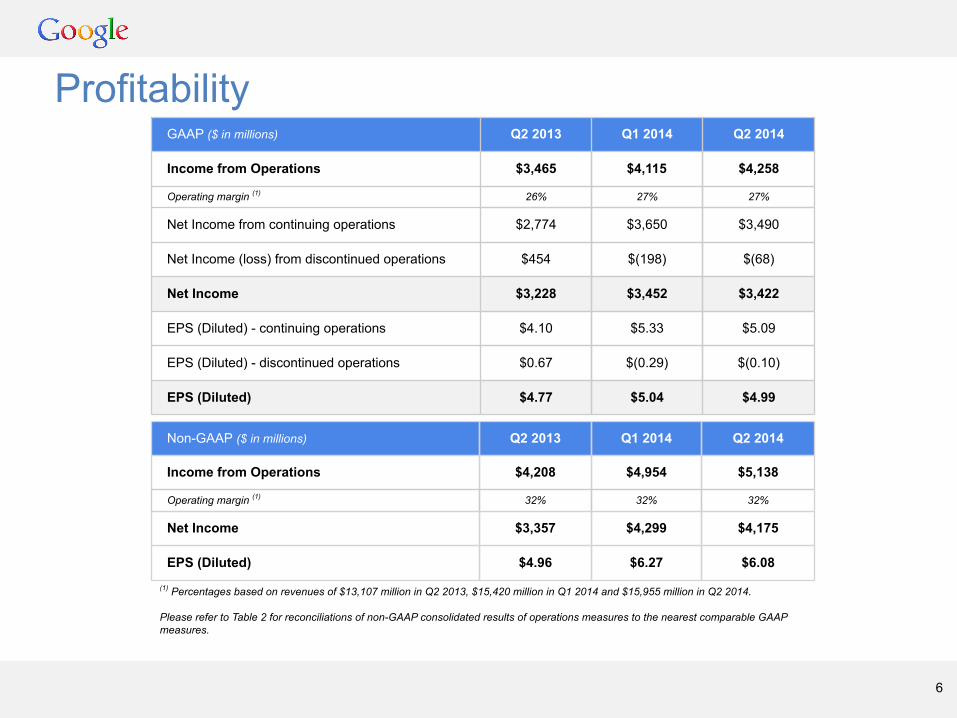
Profitability
(1) Percentages based on revenues of $13,107 million in Q2 2013, $15,420 million in Q1 2014 and $15,955 million in Q2 2014.
Please refer to Table 2 for reconciliations of non-GAAP consolidated results of operations measures to the nearest comparable GAAPmeasures.
GAAP ($ in millions) Q2 2013 Q1 2014 Q2 2014
Income from Operations $3,465 $4,115 $4,258
Operating margin (1) 26% 27% 27%
Net Income from continuing operations $2,774 $3,650 $3,490
Net Income (loss) from discontinued operations $454 $(198) $(68)
Net Income $3,228 $3,452 $3,422
EPS (Diluted) - continuing operations $4.10 $5.33 $5.09
EPS (Diluted) - discontinued operations $0.67 $(0.29) $(0.10)
EPS (Diluted) $4.77 $5.04 $4.99
Non-GAAP ($ in millions) Q2 2013 Q1 2014 Q2 2014
Income from Operations $4,208 $4,954 $5,138
Operating margin (1) 32% 32% 32%
Net Income $3,357 $4,299 $4,175
EPS (Diluted) $4.96 $6.27 $6.08
6
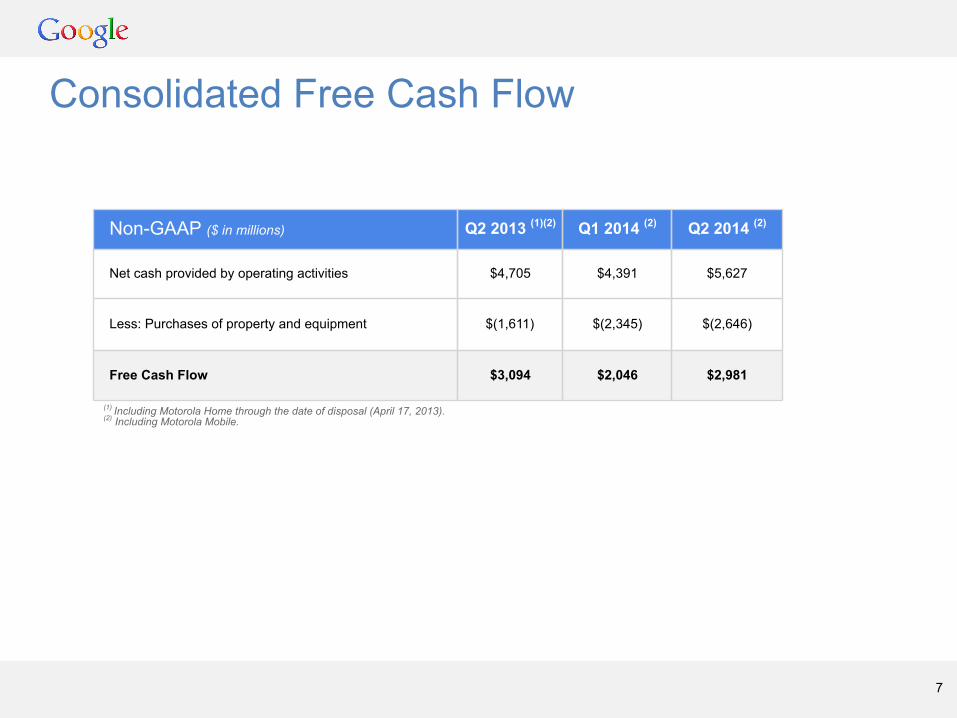
Consolidated Free Cash Flow
(1) Including Motorola Home through the date of disposal (April 17, 2013). (2) Including Motorola Mobile.
Non-GAAP ($ in millions) Q2 2013 (1)(2) Q1 2014 (2) Q2 2014 (2)
Net cash provided by operating activities $4,705 $4,391 $5,627
Less: Purchases of property and equipment $(1,611) $(2,345) $(2,646)
Free Cash Flow $3,094 $2,046 $2,981
7
Overview of Q2 2014 OI&E and FX• In Q2, we recognized $145M of Interest and Other Income, net.
• In Q2, we recognized $169M of interest income earned on our investments, $48M of netrealized gains on marketable securities, $23M of realized gain on equity interests, $21Mof gains on non-marketable equity investments and $27M of interest expense on ourlong-term debt.
• We recognized $93M of foreign exchange loss, of which $67M related to the cost of ourFX cash flow hedging program.
• Excluding gains related to our foreign exchange risk management program, had foreignexchange rates remained constant from the first quarter of 2014 through the secondquarter of 2014, our revenues in the second quarter of 2014 would have been $77Mlower. Excluding gains related to our foreign exchange risk management program, hadforeign exchange rates remained constant from the second quarter of 2013 through thesecond quarter of 2014, our revenues in the second quarter of 2014 would have been$120M lower.
• Our FX cash flow hedging program allowed us to recognize a benefit of approximately$6M to international revenues this quarter.
8
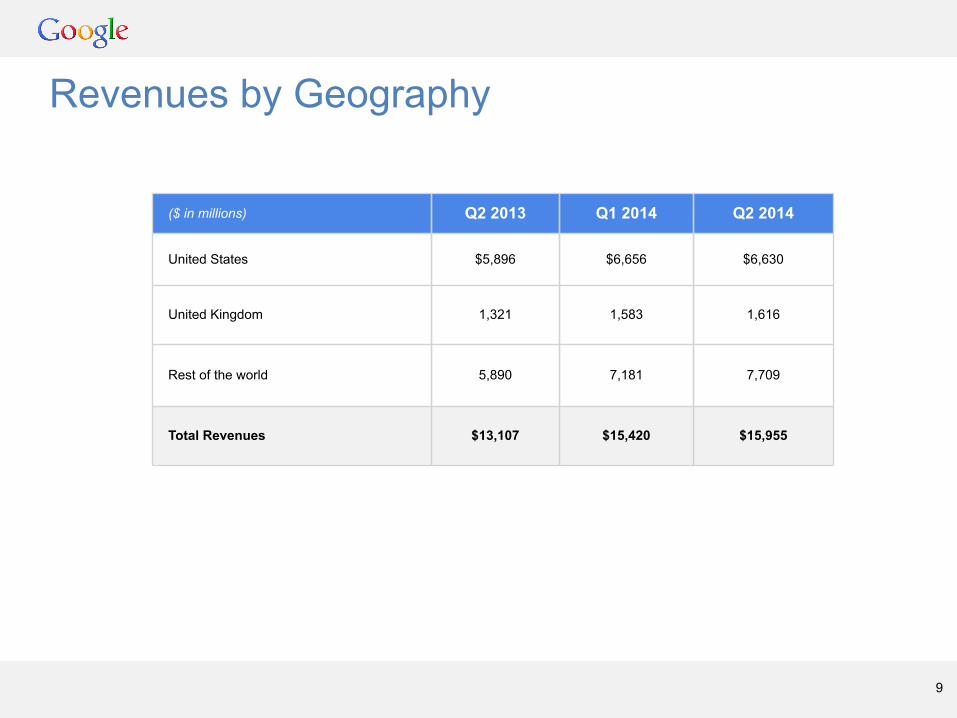
Revenues by Geography
($ in millions) Q2 2013 Q1 2014 Q2 2014
United States $5,896 $6,656 $6,630
United Kingdom 1,321 1,583 1,616
Rest of the world 5,890 7,181 7,709
Total Revenues $13,107 $15,420 $15,955
9
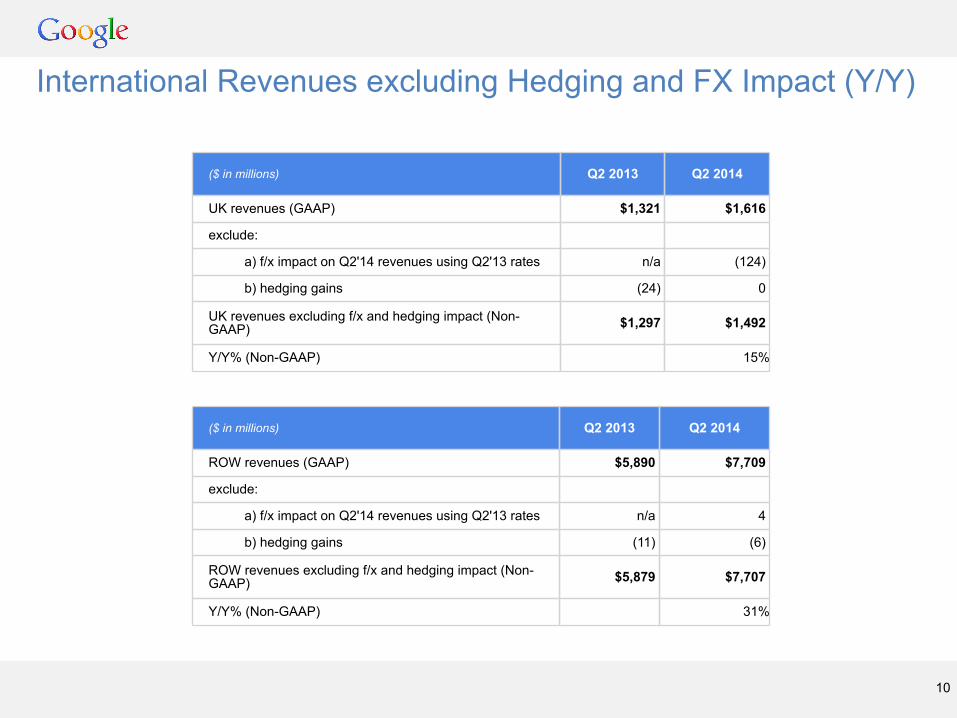
International Revenues excluding Hedging and FX Impact (Y/Y)
($ in millions) Q2 2013 Q2 2014
UK revenues (GAAP) $1,321 $1,616
exclude:
a) f/x impact on Q2'14 revenues using Q2'13 rates n/a (124)
b) hedging gains (24) 0
UK revenues excluding f/x and hedging impact (Non-GAAP) $1,297 $1,492
Y/Y% (Non-GAAP) 15%
($ in millions) Q2 2013 Q2 2014
ROW revenues (GAAP) $5,890 $7,709
exclude:
a) f/x impact on Q2'14 revenues using Q2'13 rates n/a 4
b) hedging gains (11) (6)
ROW revenues excluding f/x and hedging impact (Non-GAAP) $5,879 $7,707
Y/Y% (Non-GAAP) 31%
10
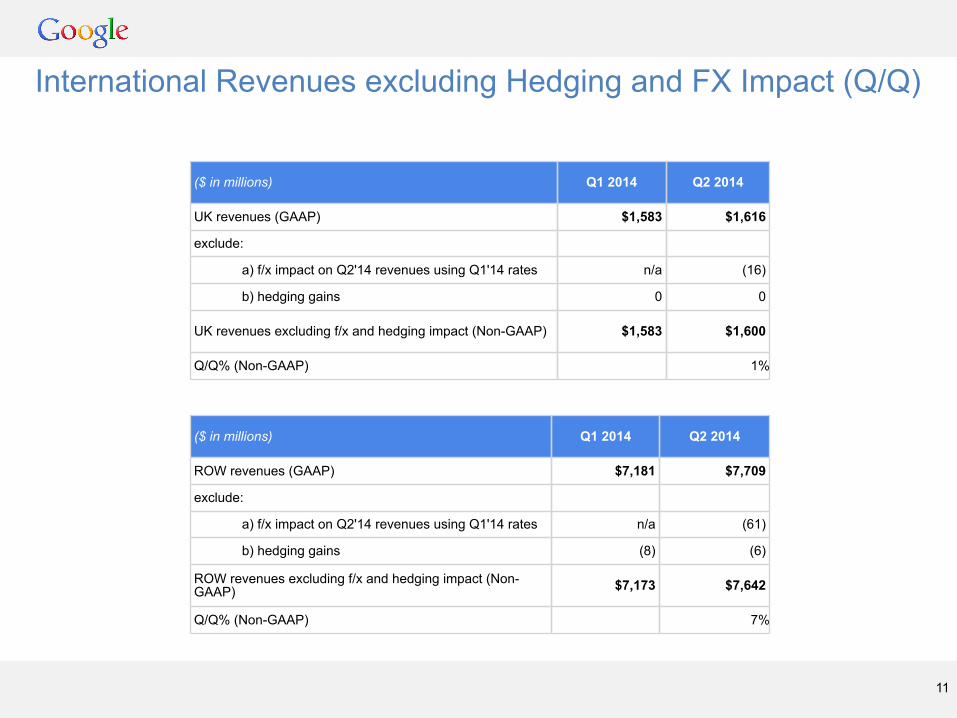
International Revenues excluding Hedging and FX Impact (Q/Q)
($ in millions) Q1 2014 Q2 2014
UK revenues (GAAP) $1,583 $1,616
exclude:
a) f/x impact on Q2'14 revenues using Q1'14 rates n/a (16)
b) hedging gains 0 0
UK revenues excluding f/x and hedging impact (Non-GAAP) $1,583 $1,600
Q/Q% (Non-GAAP) 1%
($ in millions) Q1 2014 Q2 2014
ROW revenues (GAAP) $7,181 $7,709
exclude:
a) f/x impact on Q2'14 revenues using Q1'14 rates n/a (61)
b) hedging gains (8) (6)
ROW revenues excluding f/x and hedging impact (Non-GAAP) $7,173 $7,642
Q/Q% (Non-GAAP) 7%
11
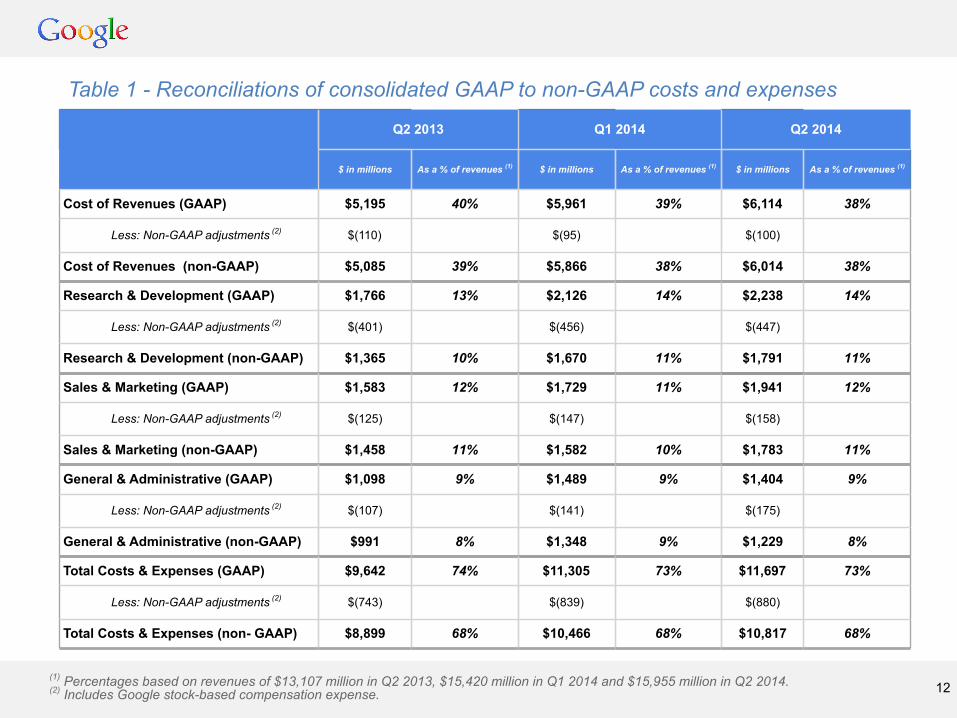
(1) Percentages based on revenues of $13,107 million in Q2 2013, $15,420 million in Q1 2014 and $15,955 million in Q2 2014.(2) Includes Google stock-based compensation expense.
Table 1 - Reconciliations of consolidated GAAP to non-GAAP costs and expenses
Q2 2013 Q1 2014 Q2 2014
$ in millions As a % of revenues (1) $ in millions As a % of revenues (1) $ in millions As a % of revenues (1)
Cost of Revenues (GAAP) $5,195 40% $5,961 39% $6,114 38%
Less: Non-GAAP adjustments (2) $(110) $(95) $(100)
Cost of Revenues (non-GAAP) $5,085 39% $5,866 38% $6,014 38%
Research & Development (GAAP) $1,766 13% $2,126 14% $2,238 14%
Less: Non-GAAP adjustments (2) $(401) $(456) $(447)
Research & Development (non-GAAP) $1,365 10% $1,670 11% $1,791 11%
Sales & Marketing (GAAP) $1,583 12% $1,729 11% $1,941 12%
Less: Non-GAAP adjustments (2) $(125) $(147) $(158)
Sales & Marketing (non-GAAP) $1,458 11% $1,582 10% $1,783 11%
General & Administrative (GAAP) $1,098 9% $1,489 9% $1,404 9%
Less: Non-GAAP adjustments (2) $(107) $(141) $(175)
General & Administrative (non-GAAP) $991 8% $1,348 9% $1,229 8%
Total Costs & Expenses (GAAP) $9,642 74% $11,305 73% $11,697 73%
Less: Non-GAAP adjustments (2) $(743) $(839) $(880)
Total Costs & Expenses (non- GAAP) $8,899 68% $10,466 68% $10,817 68%
12
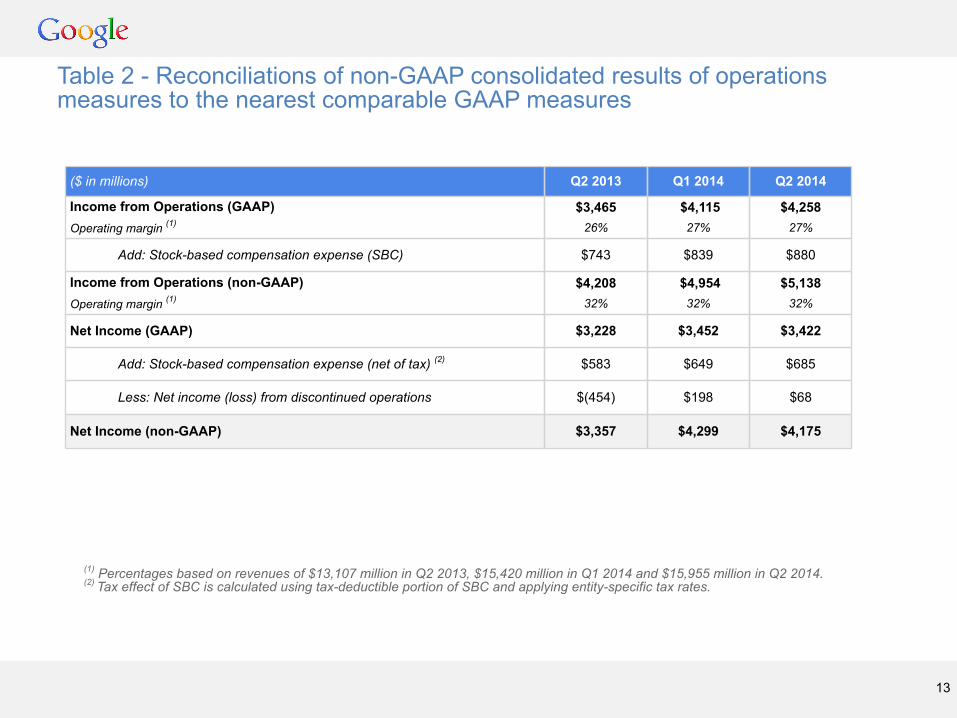
(1) Percentages based on revenues of $13,107 million in Q2 2013, $15,420 million in Q1 2014 and $15,955 million in Q2 2014.(2) Tax effect of SBC is calculated using tax-deductible portion of SBC and applying entity-specific tax rates.
($ in millions) Q2 2013 Q1 2014 Q2 2014
Income from Operations (GAAP)Operating margin (1)
$3,46526%
$4,11527%
$4,25827%
Add: Stock-based compensation expense (SBC) $743 $839 $880
Income from Operations (non-GAAP)Operating margin (1)
$4,20832%
$4,95432%
$5,13832%
Net Income (GAAP) $3,228 $3,452 $3,422
Add: Stock-based compensation expense (net of tax) (2) $583 $649 $685
Less: Net income (loss) from discontinued operations $(454) $198 $68
Net Income (non-GAAP) $3,357 $4,299 $4,175
Table 2 - Reconciliations of non-GAAP consolidated results of operationsmeasures to the nearest comparable GAAP measures
13