2014 mid-year economic update san antonio economy: steady as she goes
DESCRIPTION
2014 Mid-year economic update San antonio Economy: steady as she goes. Presented by: Steve Nivin, Ph.D. Please contact Steve Nivin with any questions or comments at [email protected] or 210-517-3609. Presented on: August 27, 2014. 2014 San Antonio Economic Forecast. 2. - PowerPoint PPT PresentationTRANSCRIPT

Presented by: Steve Nivin, Ph.D.Please contact Steve Nivin with any questions or comments at [email protected] or 210-517-3609.
2014 MID-YEAR ECONOMIC UPDATE
SAN ANTONIO ECONOMY: STEADY AS SHE GOES
Presented on:August 27, 2014

2014 San Antonio Economic Forecast
Employment growth of 2.5-3.0% 22,800-27,500 jobs
Unemployment rate will decline to 4.8-5.0%
2

3
Single family housing market is very strong in San Antonio and across Texas.
Source: Texas A&M Real Estate CenterMonths in inventory measures how many months will take to sell the current inventory, based on the average number of sales per month in the previous year.

4
Increases in home prices are indicative of a tight market.
Source: Texas A&M Real Estate Center; Calculations by Steve Nivin, Ph.D.
5
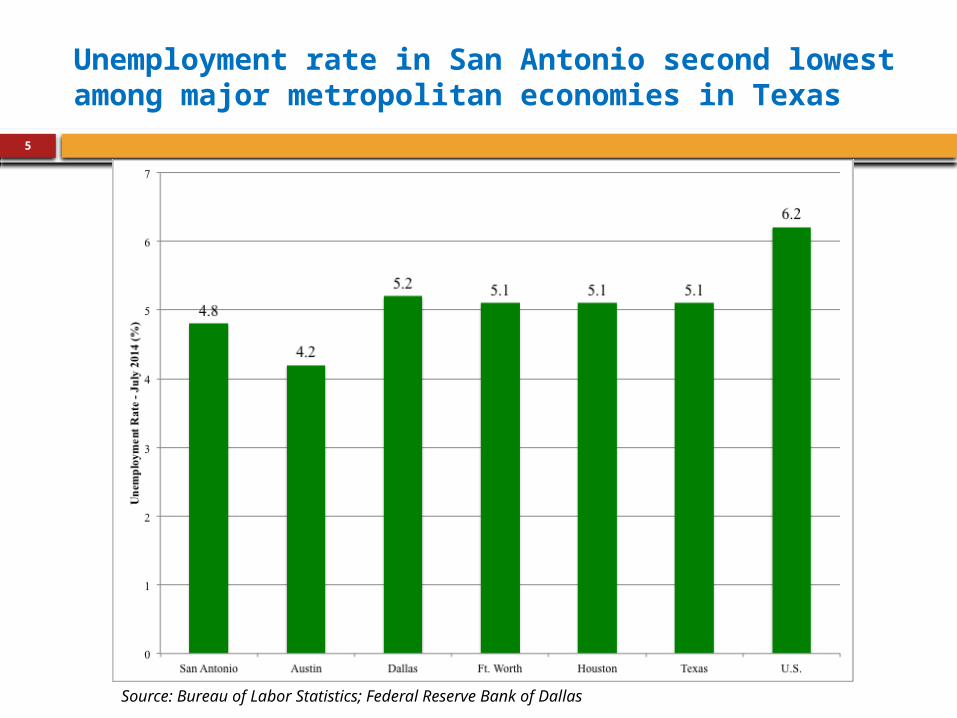
Unemployment rate in San Antonio second lowest among major metropolitan economies in Texas
Source: Bureau of Labor Statistics; Federal Reserve Bank of Dallas

6
Unemployment rate in San Antonio has been oscillating between 4.7% and 4.9% from April through July.
Source: Bureau of Labor Statistics; seasonal adjustment by Federal Reserve Bank of Dallas

7
Unemployment rate in San Antonio has been below long-term average since Jan. 2014.
Source: Bureau of Labor Statistics; seasonal adjustment by Federal Reserve Bank of Dallas
Avg. unemployment rate since 2000 = 5.6%

8
Growth trend since end of recession similar to growth pre-recession.
Source: BLS; Federal Reserve Bank of Dallas; Calculations by Steve Nivin, Ph.D.

9
Major metros and Texas showing solid growth through July 2014.
Source: BLS; Federal Reserve Bank of Dallas; Calculations by Steve Nivin, Ph.D.

10
Employment growth has come back to its long-term (since 1991) trend
Source: BLS; Federal Reserve Bank of Dallas; Calculations by Steve Nivin, Ph.D.
Avg. annual employment growth in San Antonio since 1991 = 2.26%

11
Employment growth in San Antonio was slower than some major metros in July but ahead of Dallas and the U.S.
Source: BLS; Federal Reserve Bank of Dallas; Calculations by Steve Nivin, Ph.D.

12
Employment growth in San Antonio continues to be broad-based.
Source: BLS; Federal Reserve Bank of Dallas; Calculations by Steve Nivin, Ph.D.
13
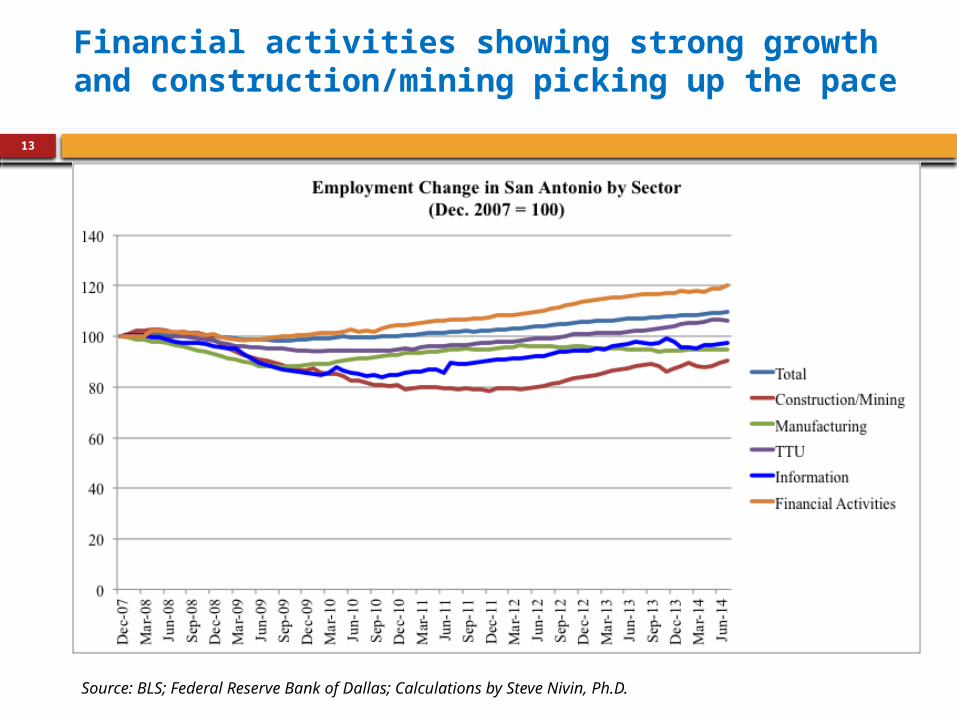
Financial activities showing strong growth and construction/mining picking up the pace
Source: BLS; Federal Reserve Bank of Dallas; Calculations by Steve Nivin, Ph.D.
14
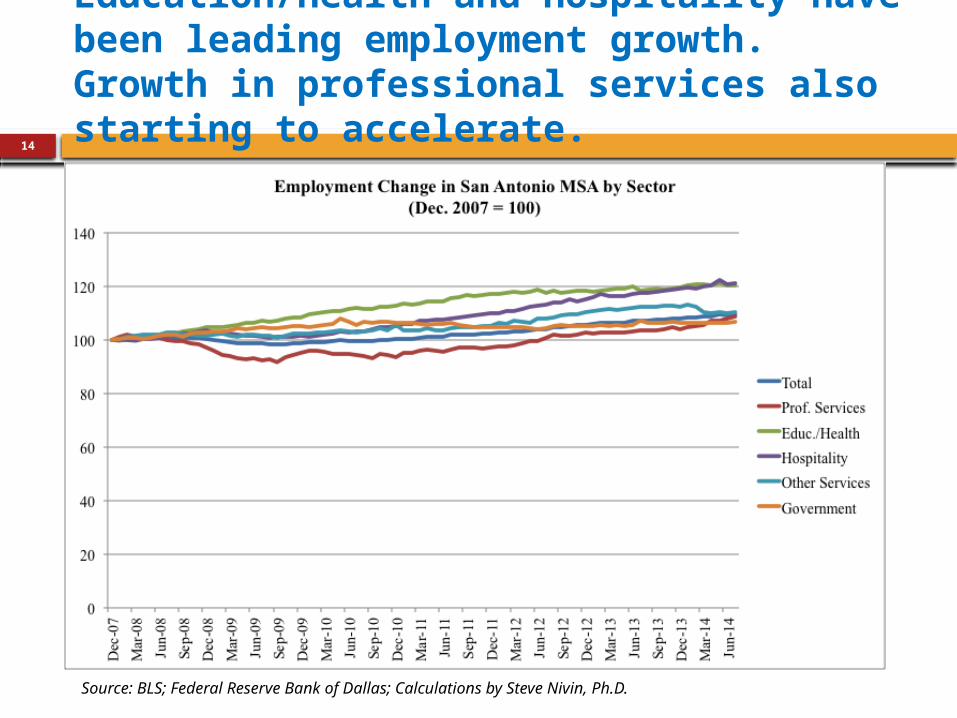
Education/health and hospitality have been leading employment growth. Growth in professional services also starting to accelerate.
Source: BLS; Federal Reserve Bank of Dallas; Calculations by Steve Nivin, Ph.D.

15
Employment growth broad-based in Austin and being lead by other services, hospitality, professional services, and education/health sectors.
Source: BLS; Federal Reserve Bank of Dallas; Calculations by Steve Nivin, Ph.D.

16
Employment growth in Houston being propelled by construction/mining, education/health, hospitality, and professional services sectors.
Source: BLS; Federal Reserve Bank of Dallas; Calculations by Steve Nivin, Ph.D.

Summary
Trends are on forecast…for the most part. Unemployment already at low end of forecast, so might see it
go a bit lower. Employment growth slightly below forecast as of July, but
optimistic economy will still reach at least lower end of forecast.
17

Thank you!!!
Questions?
18