port state control - paris mou report 2006.pdf · the paris memorandum of understanding on port...
TRANSCRIPT

TH
E P
AR
IS M
EM
OR
AN
DU
M O
F U
ND
ER
ST
AN
DIN
G O
N P
OR
T S
TA
TE
CO
NT
RO
L
2 0 0 6annual report
PORT STATECONTROLsteady she goes


black
li s
t
grey
lis
t
whit
elis
t
3 3
3 5
3 7
2 0 0 6
con t en t s
e xe cu t i v e s umma r y 6
P a r i s MoU d e v e l o pmen t s 8
l o o k i n g a h e a d 14
con c e n t r a t e d i n s p e c t i o n c ampa i gn s 1 6
Memb e r sh i p o f t h e P a r i s MoU 1 8
co - o p e r a t i o n w i t h o t h e r o r g an i z a t i o n s 2 0
Fa c t s a n d f i g u r e s 2 2
s t a t i s t i c a l a nn e x e s a nnua l r e p o r t 2 0 0 6 2 7
e xp l a n a t o r y n o t e – b l a c k , g r e y a n d wh i t e l i s t s 5 0
P a r i s MoU s e c r e t a r i a t
c o l o phon , a d d r e s s a n d s t a f f 5 2
a n n u a l r e p o r t

The Port State Control Committee (PSCC) held its 39th meeting in Nantes, France on 9-12 May 2006. Progress was made on the development of a New Inspection Regime and a New Information System. A number of relevant studies were completed and presented to the Committee. The Committee discussed these matters and accepted a positive way forward.
In this Annual report for 2006 you can read about the significant achievements of the Paris MoU for the year 2006 as well as review the statistics we produce. Some of the main events during 2006 was the membership of Cyprus, Lithuania and Malta as full members of the Paris MoU. Cyprus and Malta were congratulated on having achieved a position on the Paris MoU White List through careful and continued monitoring of their fleet performance.
During the year the general principles of a training scheme for Port State Control Officers was developed setting common and consistent standards, providing training to PSCOs and the continued updating of technical knowledge. A number of initiatives will be financed and developed jointly by the European Maritime Safety Agency, the MoU Secretariat and member States.
The Paris MoU developed a Code of Good Practice for PSCOs. For transparency the Code has been made available to the public. It is intended to enhance the professionalism and integrity of the Paris MoU and it is expected it will serve as an example to other PSC regions.
The Paris MoU continued to develop actions in response to the 2nd Joint Paris/Tokyo MoU Ministerial Conference, held in Vancouver in 2004 and gave high importance to Concentrated Inspection Campaigns (CICs). Scheduled for 2007 is a CIC on the International Safety Management Code to be carried out from September to November 2007 jointly with the Tokyo MoU. In addition to the ISM Code CIC the Committee considered a number of options for joint CICs with the Tokyo MoU for 2008 and beyond.
It has been a very successful year for us in the Paris MoU and I would like to thank all of our Member States for their contribution during the year and I would especially like to thank all of our Port State Control Officers and Administrators for their excellent work throughout the year. We are very fortunate in having a dedicated Secretariat who provided us with excellent service during the year. We have a challenging year ahead and we now look forward to celebrating our 25th Anniversary during 2007.
theParisMemorandumofUnderstandingonPortstatecontrol,ParisMoU,
hasplayedasignificantroleinmaritimesafety,securityandpollution
preventionduring2006.
1.executivesummaryP a r i s M o U c h a i r m a n ’ s s t a t e m e n t 2 0 0 6 p r e f a c e
4

When the Memorandum was established by the 14 founding members in 1982, these aims were practiced mostly in the framework of informing each other on the results of inspections of ships carried out in the region. Today, cooperation should be seen in a much wider context. Not only has the agreement expanded to 25 members in 2006, but also the involvement of the European Commission and the European Maritime Safety Agency has now become an integral part of cooperating with each other.When a new management structure was established in the mid nineties, the EU members, the non-EU members and the European Commission agreed to cooperate in the Advisory Board. This board has not only been very successful in taking policy forward between meetings of the Port State Control Committee, but also to consider matters of a more political and strategically nature, as well as giving guidance to the Secretariat.
With 25 members the challenges to cooperate between the members have also gained a new perspective. With different levels of experience and expertise in the region, the authorities were required to invest in a higher degree of harmonization and standardization. It almost took nearly 10 years to develop and implement a more structural system of training for the Port State Control Officers. In 2006 the first phase of distant learning modules has been finalized and the Secretariat is organizing several expert and specialized training programmes each year. During these one week training sessions inspectors are made more aware of the procedures and more complex requirements under the international Conventions. This has created a solid basis for a more uniform application of the inspection requirements throughout the region.
Cooperation also extends beyond the borders of the agreement. This year the Paris Memorandum achieved status as an Inter Governmental Organization with the IMO. Truly a sign of recognition for regional port State control agreements and an opportunity to work more closely with flag States and the maritime industry. By submitting data on the performance of flag States and recognized organizations to the IMO, a more meaningful discussion will contribute to a safer environment and better working and living conditions on board ships. This also applies to the new Maritime Labour Convention, where the Paris Memorandum has taken the lead to draft new guidelines to enforce this instrument.
With the 25th anniversary of the Paris Memorandum on Port State Control coming up in 2007, the commitment to cooperate still remains a critical success factor for the future.
Richard W.J. Schiferli
statementbythegeneral-secretary
OneofthemainobjectivesundertheParisMemorandumis“toconsult,
cooperateandexchangeinformation”.
P a r i s M o U c h a i r m a n ’ s s t a t e m e n t 2 0 0 6 p r e f a c e
5

1.executivesummary
Work has also started on the details of the NIR and a Task Force is preparing proposals for the level and scope of inspections. These inspection matrices should provide a more harmonized approach to the levels to which different ship types are inspected. This would then also provide more accurate data on the results of the inspections and the level of responsibility. A new element in the NIR will measure the performance of the company of the ships. It is anticipated that the European decision making process will be finalized by the end of 2007. This would mean that the NIR will enter into force in 2010 or 2011 at the latest.
With Cyprus, Lithuania and Malta joining the Memorandum in 2006, the 25 members of the agreement have carried out 21,566 inspections in 2006. For the first time in 6 years, the number of detentions has gone up from 944 in 2005 to 1,174 in 2006. Given the fact that the freight market is very good, old tonnage may stay in service longer that planned. This
could have an adverse effect on the safety of older ships. The relatively low costs of repairs following a detention do not outweigh high profits of carrying cargo. Hopefully this rise in detentions is not the start of a trend.
On the other hand a decreasing number of ships have been refused access to ports in the region. In 2006 a total of 14 ships were banned, compared to 28 in 2005, thereby bringing the total number of ships banned between 2004 and 2006 to 77. Research has indicated that most of these unwanted ships are still in operation in other areas, mostly in the Black Sea.The decisions taken by Ministers during the 2nd Joint Ministerial Conference of the Paris and Tokyo MoUs in 2004 have been considered for implementation by the Paris and Tokyo Memoranda. A joint list of actions was agreed in 2005 and work programmes have been started for implementation. The intensified co-operation between the 2 regions has already
NowthatthemainprinciplesoftheNewinspectionregime(Nir)havebeen
agreed,theParisMoUiscontinuingitsworktofillinthedetailsofanew
approachtoportstatecontrol.whilelow-riskshipswillberewardedwitha24
monthinterval,thehighriskshipswillbesubjecttoamorerigorousinspection
regimewithaninspectionevery6months.During2006thediscussiononthe
Nirhadtotakeintoaccountwhathappenedattheeuropeancommunitylevel
ontheproposedrecastDirectiveonportstatecontrol.
e x e c u t i v e s u m m a r y
6
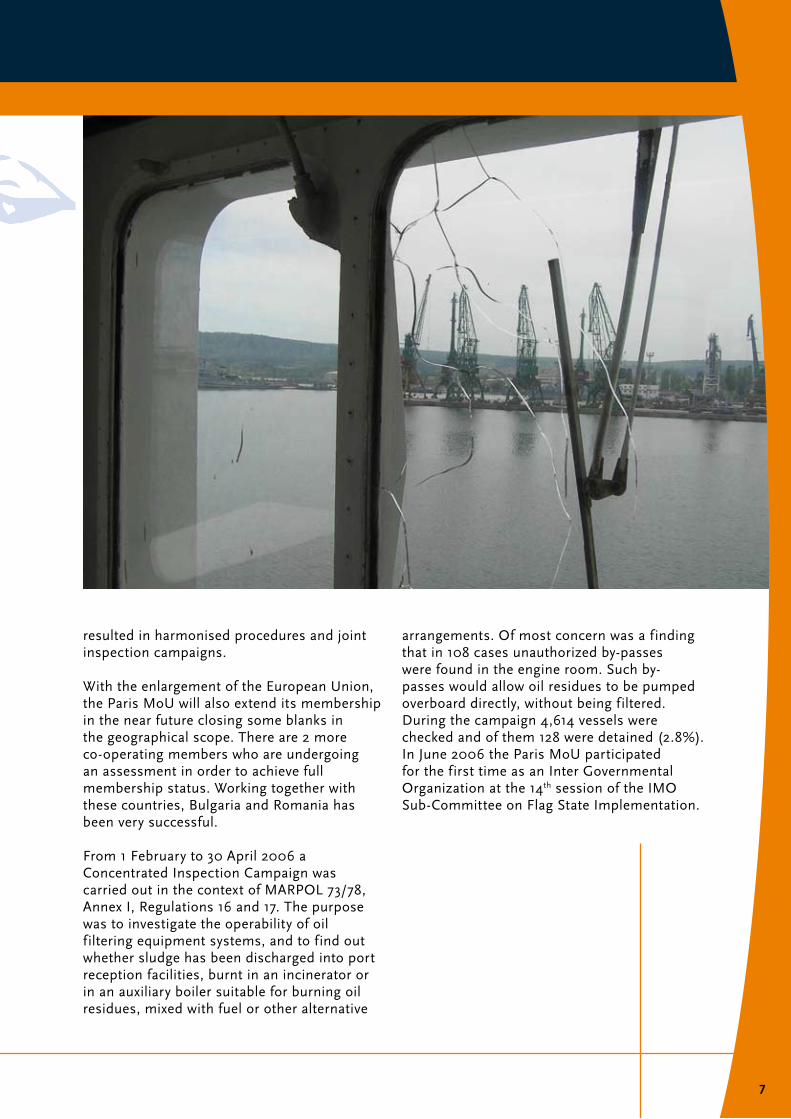
resulted in harmonised procedures and joint inspection campaigns.
With the enlargement of the European Union, the Paris MoU will also extend its membership in the near future closing some blanks in the geographical scope. There are 2 more co-operating members who are undergoing an assessment in order to achieve full membership status. Working together with these countries, Bulgaria and Romania has been very successful. From 1 February to 30 April 2006 a Concentrated Inspection Campaign was carried out in the context of MARPOL 73/78, Annex I, Regulations 16 and 17. The purpose was to investigate the operability of oil filtering equipment systems, and to find out whether sludge has been discharged into port reception facilities, burnt in an incinerator or in an auxiliary boiler suitable for burning oil residues, mixed with fuel or other alternative
arrangements. Of most concern was a finding that in 108 cases unauthorized by-passes were found in the engine room. Such by-passes would allow oil residues to be pumped overboard directly, without being filtered. During the campaign 4,614 vessels were checked and of them 128 were detained (2.8%).In June 2006 the Paris MoU participated for the first time as an Inter Governmental Organization at the 14th session of the IMO Sub-Committee on Flag State Implementation.
7

1.executivesummary
The task forces, of which 11 were active in 2006, are each assigned a specific work programme to investigate improvement of operational, technical and administrative port State control procedures. Reports of the task forces are submitted to the Technical Evaluation Group (TEG) at which all Paris MoU members and observers are represented. The evaluation of the TEG is submitted to the Committee for final consideration and decision making.
The MoU Advisory Board advises the Port State Control Committee on matters of a political and strategic nature, and provides direction to the task forces and Secretariat between meetings of the Committee. The board meets several times a year and in 2006 was composed of participants from Canada, Germany, Norway, Spain and the European Commission.
PORT STATE CONTROL COMMITTEE
The Port State Control Committee (PSCC) held its 39th meeting in Nantes, France on 9-12 May 2006. Significant progress was made on the development of a New Inspection Regime and a New Information System. A number of relevant studies were completed and presented to the
Committee. The Committee discussed these matters and accepted a positive way forward.
On the first day of the PSCC meeting, Cyprus, Lithuania and Malta were welcomed as full members of the Paris MoU. Cyprus and Malta were congratulated on having achieved a position on the Paris MoU White List through careful and continued monitoring of their f leet performance.
One of the main items on the agenda was the proposal for a common training programme of Port State Control Officers. Papers were presented by the European Commission and Paris MoU Secretariat on this essential subject. The general principles of setting common and consistent standards, providing training to PSCOs and the continued updating of technical knowledge were embraced. A number of initiatives will be financed and developed jointly by the European Maritime Safety Agency, the MoU Secretariat and member States.
A very important document on the Code of Good Practice for PSCOs was developed and agreed by the Committee. For transparency the
OnceayearthePortstatecontrolcommittee,whichistheexecutivebodyof
theParisMoU,meetsinoneoftheMemberstates.
thecommitteeconsiderspolicymattersconcerningregionalenforcementof
portstatecontrol,reviewstheworkofthetechnicalevaluationgroupandtask
forcesanddecidesonadministrativeprocedures.
P a r i s M o U d e v e l o p m e n t s
8

TECHNICAL EVALUATION GROUP
The Technical Evaluation Group (TEG) convened in March and November 2006. Several task forces submitted reports to the TEG for evaluation before submission to the Port State Control Committee.Issues considered by the TEG included:
• development of a new inspection regime• enhancement of the SIReNaC information
system• evaluation of statistics• revisions of the manual for Port State Control
Officers• development of a new training policy• development of guidelines for campaigns on
the International Safety Management Code (2007) and navigational equipment (2008)
• development of guidelines for Ballast Water Management
• development of new PSC guidelines on working and living conditions.
Code has been made available to the public. It is intended to enhance the professionalism and integrity of the Paris MoU and it is hoped it will serve as an example to other PSC regions.
The Committee was presented with a proposal for a new user friendly electronic manual for PSCOs. The manual is regarded as an important and effective tool for assisting PSCOs in their work and makes use of the advances of current information technologies.
The Committee continued to develop actions in response to the 2nd Joint Paris/Tokyo MoU Ministerial Conference, held in Vancouver in 2004 and gave high importance to Concentrated Inspection Campaigns (CICs). Scheduled for 2007 is a CIC on the ISM Code to be carried out from September to November 2007 jointly with the Tokyo MoU.In addition to the ISM Code CIC the Committee considered a number of options for joint CICs with the Tokyo MoU for 2008 and beyond.
�

1.executivesummary
PORT STATE CONTROL TRAINING INITIATIVES
The Paris MoU will continue to invest in the training and development of Port State Control officers in order to establish a higher degree of harmonisation and standardization in inspections throughout the region. The Secretariat organizes three different training programmes for Port State Control Officers:• Seminars (twice a year)• Expert training (twice a year)• Specialized training (once a year)The Seminars are open to members, co-operating members and observers. The agenda is more topical and deals with current issues such as inspection campaigns and new requirements.Expert and Specialized Training aims to promote a high degree of professional knowledge and harmonisation of more complex PSC issues and procedures. These 5-day training sessions are concluded with an assessment and certification.
42Nd PSC SEMINAR
The 42nd Port State Control Seminar was held on 7 – 9 June 2006, in Ljubljana, Slovenia. The Seminar was attended by Port State Control officers from the Paris MoU, as well as participants from Bulgaria, Cyprus, Lithuania, Malta, Romania and the Black Sea MoU. The Seminar covered the latest developments within the Paris MoU. The main topics of discussion were related to the inspection of voyage data recorders and an in depth introduction to the new requirements in MARPOL 73/78, Annex II.
43Rd PSC SEMINAR
The 43rd Port State Control Seminar was held on 5 – 7 December 2006, in Hamburg, Germany. The Seminar was attended by Port State Control Officers from the Paris MoU, as well as participants from Bulgaria, Romania and the Black Sea MoU. Apart from new developments in the MoU, the Seminar discussed the development of the New Inspection Regime (NIR) and specifically the use the NIR matrices. Also discussed were the changes to MARPOL 73/78 Annex I and an introduction into MARPOL 73/78 Annex VI.
ExPERT ANd SPECIALIzEd TRAINING
For the Expert Training the central themes are “The Human Element” and “Safety and Environment”. The theme of the Specialized Training will change every year. In 2006 this training dealt with inspections of passenger ships. Both training programmes are intended for experienced Port State Control Officers. Using that experience, the participants can work together to establish a higher degree of harmonisation and standardisation of their inspection practice. Lecturers for the training programmes are recruited from the maritime Administrations of the member States, international organizations, and educational institutions and from the maritime industry. For the training programmes in 2006, lecturers were provided by the United Kingdom, The Netherlands, France, Denmark, as well as Lloyds Register, shipping companies, suppliers and others.
P a r i s M o U d e v e l o p m e n t s
10

THE 5TH ExPERT TRAINING “THE HUMAN ELEMENT”
In October 2006 the fifth Expert Training programme was held in The Hague with the Human Element as the central theme. Participants from member States as well as from the co-operating members took part in this training. The issues discussed during the training session were the ILO and STCW conventions, the Code of Good practice and inter-cultural communication.
dISTANCE LEARNING PROGRAMME
The first phase of the Distance Learning Programme has been completed. There are now 4 CDs available focussing on the Human Element. The module on Paris MoU procedures has been developed in co-operation with the European Maritime Safety Agency (EMSA) and several member States.
THE 2Nd ExPERT TRAINING “SAfETy ANd
ENVIRONMENT”
The second Expert Training programme was held in The Hague in February 2006. Participants from member States and co-operating members took part in the programme. Important issues during this training were the IMDG code, Load Lines, life saving appliances and oil filtering equipment.
THE 1ST SPECIALIzEd TRAINING ON THE INSPECTION
Of PASSENGER SHIPS
The first Specialized Training programme was conducted in April 2006 in Nantes, France, and was developed in co-operation with the naval academy in Nantes and the shipyard Chantiers d’Atlantique. Participants from members States and co-operating members took part in this training. The presentations covered a broad range of subjects with regard to passenger ships and inspection procedures.
11
1.executivesummary
TRAINING PILOT SESSIONS
In 2006 two training pilot sessions were held. These trainings were organized by EMSA and will lead up to the development of a professional development scheme for Port State Control Officers. The Paris MoU contributed to these trainings by delegating a lecturer who also contributed in the production of training material. Officers from many member States of the Paris MoU participated.
REVIEw PANEL
The Review Panel became a permanent feature of Paris MoU procedures in 2003. Flag States or recognized organizations that cannot resolve a dispute concerning a detention with the port State may submit their case for review.The Review Panel is composed of representatives of 3 different MoU Authorities, on a rotating basis, plus the Secretariat.
In 2006 the Secretariat received several official requests for review. Each case was administrated by the Secretariat and submitted to MoU members for review. Different members are used for each case. In one case the port State withdrew the detention based on the advice from the Review Panel to reconsider.In another case the f lag State decided to withdraw the case when the owner withdrew his complaint.
In four cases the Review Panel concluded that the port State decision to detain was justified.In one case the panel concluded that the port State should reconsider it decision.
The port State in question declined to revoke the detention.
PARIS MOU ON INTERNET
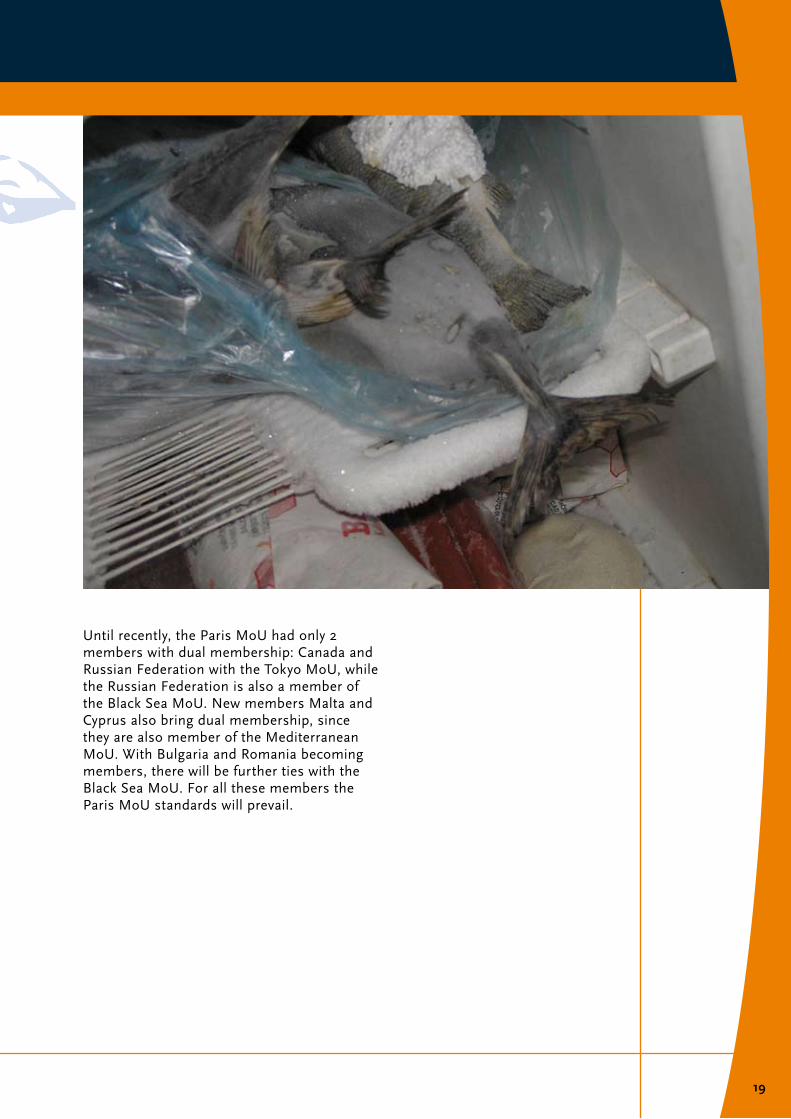
The Paris MoU Internet site has continued to enjoy an increasing demand from a variety of visitors. In particular from flag and port States, government agencies, charterers, insurers and classification societies, who are able to monitor their performance and the performance of others on a continuous basis. Ships which are currently under detention are entered in a listing by the port State. Previously the information on detained ships was not made public until after the detention was lifted. The inspection database on the web site has been modified. PSC inspections are no longer updated on a weekly basis, but can now be accessed live and provide the visitor with more detailed information. The regular publication of ships “Caught in the Net” has highlighted particularly serious detentions. These are described in detail and supported with photographs to make the general public aware of unsafe ships that have been caught by port State control.
During 2006 details were published of the m/v Gnocchi registered in Cambodia and detained in Italy, the m/v Heidi II registered in Georgia and detained in Slovenia, the m/v Little Star registered in Georgia and detained in Poland, the m/v Pummy Star, ex Spirit II, registered in Honduras and detained in Italy, the m/v Skylark registered under the St. Vincent and Grenadine f lag and detained in the United
P a r i s M o U d e v e l o p m e n t s
12

Kingdom, the m/v Traun registered in Austria and detained in Poland, the m/v Matabol registered in Latvia and detained in Poland, and the Bilkar I registered in Georgia and detained in Italy.The annual award for the best contribution to the “Caught in the Net” has been presented to Poland.
Other information of interest such as the monthly list of detentions, the annual report, the statistics of the “Blue Book” and news items can be downloaded from the website, which is found at “www.parismou.org”.
13

1.executivesummary
althoughthedetentionlevelappearsrelativelylowcomparedtosomeyears
ago,Portstatecontrolresultsfor2006indicatethateffortsstillneedtobe
enhancedtoobtainasubstantialreductioninthenumberofsubstandardships
visitingtheregion.
Actions agreed by the Committee during its 39th session (2006) are in the process of being implemented.
NEw TRAINING POLICy
Training of Port State Control Officers has always been high on the agenda of the Paris MoU. In addition to the current training programmes, a completely new training policy is under development. This policy will examine all aspects of training and will consider the introduction of a standard for a common level of competency, both for new entrants and for existing inspectors. Part of this policy is the development of a comprehensive Distant Learning Programme, covering all important convention areas, and a Rule Check System. This system will provide a tool to enable Port State Control officers to identify which requirements apply to a particular ship. The policy will be developed in close co-operation with the European Maritime Safety Agency.
PERfORMANCE Of ROS
For several years the Committee has closely monitored the performance of classification societies acting as recognized organizations (ROs) for f lag States. A table indicating a performance ranking, based on similar
principles to the table for f lag States has been published for several years. When comparing the performance with results published by the Paris MoU over the past years, the ranking in the list is unlikely to lead to many surprises.
On the other hand, the list may provide an incentive, as it does for f lag States, to compete for higher quality.
Among the best performing recognized organizations were:• Det Norske Veritas (Norway)• Registro Italiano Navale• Germanischer Lloyd (Germany)
The lowest performing organizations were:• Register of Shipping (DPR Korea)• Register of Shipping (Albania)• Intern. Register of Shipping (U.S.A.)
l o o k i n g a h e a d
14
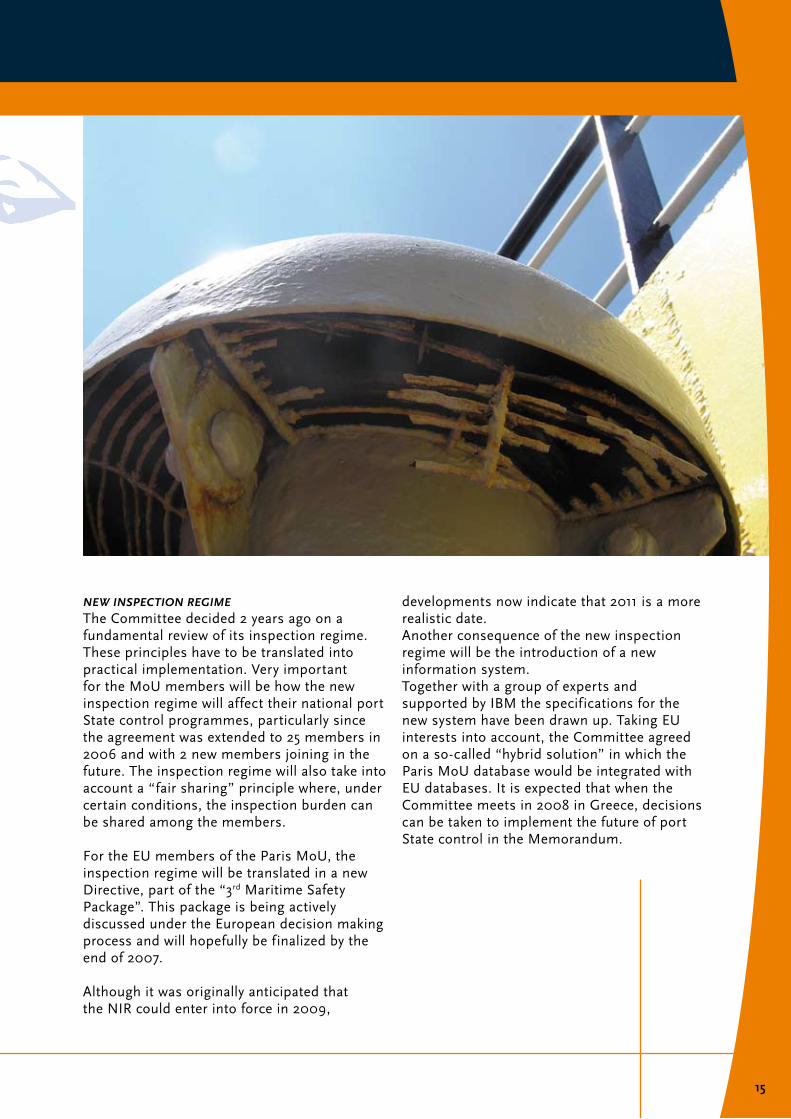
developments now indicate that 2011 is a more realistic date.Another consequence of the new inspection regime will be the introduction of a new information system. Together with a group of experts and supported by IBM the specifications for the new system have been drawn up. Taking EU interests into account, the Committee agreed on a so-called “hybrid solution” in which the Paris MoU database would be integrated with EU databases. It is expected that when the Committee meets in 2008 in Greece, decisions can be taken to implement the future of port State control in the Memorandum.
NEw INSPECTION REGIME
The Committee decided 2 years ago on a fundamental review of its inspection regime. These principles have to be translated into practical implementation. Very important for the MoU members will be how the new inspection regime will affect their national port State control programmes, particularly since the agreement was extended to 25 members in 2006 and with 2 new members joining in the future. The inspection regime will also take into account a “fair sharing” principle where, under certain conditions, the inspection burden can be shared among the members.
For the EU members of the Paris MoU, the inspection regime will be translated in a new Directive, part of the “3rd Maritime Safety Package”. This package is being actively discussed under the European decision making process and will hopefully be finalized by the end of 2007.
Although it was originally anticipated that the NIR could enter into force in 2009,
15
1.executivesummary
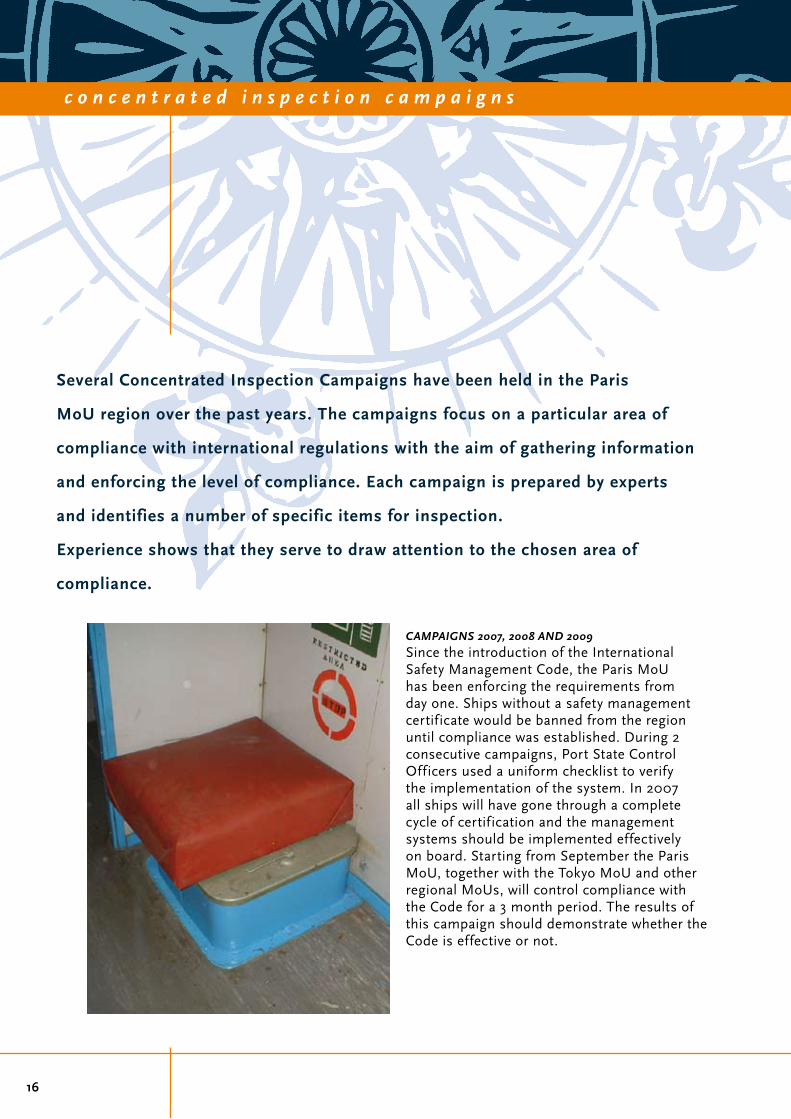
severalconcentratedinspectioncampaignshavebeenheldintheParis
MoUregionoverthepastyears.thecampaignsfocusonaparticularareaof
compliancewithinternationalregulationswiththeaimofgatheringinformation
andenforcingthelevelofcompliance.eachcampaignispreparedbyexperts
andidentifiesanumberofspecificitemsforinspection.
experienceshowsthattheyservetodrawattentiontothechosenareaof
compliance.
CAMPAIGNS 2007, 2008 ANd 2009
Since the introduction of the International Safety Management Code, the Paris MoU has been enforcing the requirements from day one. Ships without a safety management certificate would be banned from the region until compliance was established. During 2 consecutive campaigns, Port State Control Officers used a uniform checklist to verify the implementation of the system. In 2007 all ships will have gone through a complete cycle of certification and the management systems should be implemented effectively on board. Starting from September the Paris MoU, together with the Tokyo MoU and other regional MoUs, will control compliance with the Code for a 3 month period. The results of this campaign should demonstrate whether the Code is effective or not.
c o n c e n t r a t e d i n s p e c t i o n c a m p a i g n s
16

For 2008 it has been decided that the Concentrated Inspection Campaign will focus on the requirements of SOLAS Chapter V (navigation) including passage planning, voyage data recorder, automatic identification system and electronic chart display and information system. Integrated navigation bridge systems have developed rapidly in the past decade and have become increasingly complex. Reliance on complex automated systems has therefore also developed simultaneously. The still relatively high number of deficiencies in this area has led to a focus on these aspects.
For 2009 the Committee agreed to join the Tokyo MoU in a campaign focused on life saving arrangements. Maintenance and familiarity of the crew are areas for attention.
17

1.executivesummary
inpreparationforprospectivenewmembersoftheParisMoU,thePortstate
controlcommitteehasadoptedcriteriaforco-operatingstatusfornon-member
statesandobserverstatusfornewlydevelopedPscregions.
Specific criteria, including a self-evaluation exercise, have to be made before co-operating status can be granted. Regional agreements seeking observer status must demonstrate that their member Authorities have an acceptable overall f lag State record and have a similar approach in terms of commitment and goals to that of the Paris MoU.
In 2006 the following maritime Authorities had a co-operating member status:• Lithuania has been a co-operating member
since 2003 and has implemented the recommendations to meet the qualitative criteria. A fact-finding mission visited in 2005 to verify that all the criteria are in place. In May 2006 the Committee welcomed Lithuania as a full member.
• Cyprus has been a co-operating member since 2003. Cyprus has shown significant improvement in moving from the “Black List” to the “Grey List” in 2004 and from the “Grey List” to the “White List” in 2005. The Committee decided to send a fact-finding mission to Cyprus in 2005. In May 2006 the Committee welcomed Cyprus as a full member.
• Malta has been a co-operating member since 2003. The authorities have taken positive action and it can now be reported that Malta
has moved up to the “Grey List” in 2004 and to the “White List” in 2005. A fact-finding mission visited Malta early in 2006. In May 2006 the Committee welcomed Malta as a full member.
• Bulgaria joined the MoU in 2004 as a co-operating member. After the visit of the monitoring team, recommendations for improvements were adopted by the Committee. In 2006 a fact-finding mission visited Bulgaria to verify that all recommendations had been implemented. It is anticipated that the Committee will decide on full membership in May 2007.
• Romania joined the MoU one year after Bulgaria and has undergone the membership process in just 2 years. Early in 2007 a fact-finding mission will visit Romania to carry out the final audits before the Committee takes a decision on full membership. This decision is also expected in May 2007.
m e m b e r s h i p o f t h e P a r i s M o U
18
Until recently, the Paris MoU had only 2 members with dual membership: Canada and Russian Federation with the Tokyo MoU, while the Russian Federation is also a member of the Black Sea MoU. New members Malta and Cyprus also bring dual membership, since they are also member of the Mediterranean MoU. With Bulgaria and Romania becoming members, there will be further ties with the Black Sea MoU. For all these members the Paris MoU standards will prevail.
1�

1.executivesummary
thestrengthofregionalregimesofportstatecontrol,whichareboundby
geographicalcircumstancesandinterests,iswidelyrecognised.Nineregional
MoUshavebeenestablished.thecommitteehasexpressedconcernthat
someoftheseMoUsaredominatedbyMemberswhohavenotmadeefforts
toexerciseeffectivecontrolovertheirownfleet.severalflagstatesbelonging
toregionalMoUsappearonthe“blacklist”oftheParisMoU.inorderto
providetechnicalco-operationtothesenewMoUs,theymayapplyforassociate
observerstatus.
Two regional agreements have obtained official observer status to the Paris MoU: the Tokyo MoU and the Caribbean MoU. The United States Coast Guard is also an observer at Paris MoU meetings.
The Port State Control Committee agreed to the requests from the Black Sea MoU, the Mediterranean MoU and the West and Central African MoU for associate observer status. Although these MoUs will not be represented in the Committee, there is a commitment from the Paris MoU to assist them on a technical and administrative basis. This will include participation in seminars and technical meetings.
The International Labour Organization and the International Maritime Organization have participated in the meetings of the Paris MoU on a regular basis since 1982.
In 2006 the Paris MoU obtained official status at the IMO as an Inter Governmental Organization. A delegation of the MoU participated in the 14th session of the Sub-Committee on Flag State Implementation in June 2006.
The 2004 Annual report, including inspection data, an analysis of 2004 statistics, a combined list of f lags targeted by the Paris MoU, the Tokyo MoU and the USCG and a summary of the actions from the 2004 Ministerial Conference were submitted to the Sub-Committee on Flag State Implementation (FSI). The figures have generated a good discussion on how several f lag States have implemented measures to improve their records. The status of both Cyprus and Malta on the “White List” have shown that through determined action by the maritime authority and careful monitoring of the f leets performance, a significant
c o - o p e r a t i o n w i t h o t h e r o r g a n i z a t i o n s
20

improvement can be made over a relatively short period.The Paris MoU welcomed the decision of FSI to continue this dialogue at the next session in 2007.
21

1.executivesummary
During2006,21,566inspectionswerecarriedoutintheParisMoUregion
on13,417foreignshipsregisteredin112differentflagstates.thenumberof
inspectionshasnotsignificantlyincreasedcomparedwiththeinspection
figurefor2005of21,302.
The number of individual ships inspected in 2006, 13,417, increased by 393 compared with the number of individual ships inspected in 2005 of 13,024.
The overall inspection rate in the region was 30,2% in 2006, compared with 31,8% in 2005 and 31,5% in 2004.All member States reached the 25% inspection commitment of the Memorandum.A chart showing the individual efforts of Paris MoU members is included in the statistical annexes to this Annual Report.
dETENTIONS
Detention rates are expressed as a percentage of the number of inspections, rather than the number of individual ships inspected to take into account that many ships are detained more than once during any one year. The number of ships detained in 2006 for deficiencies clearly hazardous to safety, health or the environment amounted to 1,174. It compares with the number of 994 detained in 2005, 1,187 in 2004, and 1,431 in 2003. The significant increase of 180 (18,1%) detentions compared with 2005 leads to an average detention percentage of 5,4% in 2006, compared with 4,7% in 2005, 5,8% in 2004
and 7,1% in 2003. The Concentrated Inspection Campaign on MARPOL 73/78, Annex1, may have caused the sudden increase in the number of detentions.
“BLACk, GREy ANd wHITE LIST”
In the 1999 Annual report the traditional “Black List” of f lags was replaced by a “Black, Grey and White List”. The tables are still based on performance over a 3-year rolling period but now show the full spectrum between quality f lags and flags with a poor performance which are considered a high or very high risk.The “Black List” is composed of 16 flags States, 2 less than last year. The “White List” includes 37 flag States, again 3 more than last year. A “hard core” of f lag States reappear on the “Black List”. Most f lags that were considered “very high risk” in 2004 and 2005 remain so in 2006. The poorest performing f lags are still Korea DPR and Albania.There are 3 new flag States on the “Black List”; Belize, Morocco and St. Kitts and Nevis.Algeria, Taiwan, Turkey and Ukraine have moved from the “Black List” to the “Grey List” and will hopefully maintain this trend.
The “White List” represents quality f lags with a consistently low detention record. The
f a c t s a n d f i g u r e s
22

all detentions, the average detention rate has increased compared with previous years.Almost all ship types show a slightly increasing detention rate compared with 2005.Statistical annexes to this report show the detention percentage for each ship type in 2006, 2005 and 2004.
BANNING Of SHIPS
A total of 14 ships were banned from the Paris MoU region in 2006, because they failed to call at an agreed repair yard (6), jumped detention (2) or because of multiple detentions (6). Nine of the 14 bannings were applied to ships f lying a “black listed” f lag. By the end of 2006 the ban had been lifted on 5 of these ships after verification that all deficiencies had been rectified. A number of ships remain banned from previous years.An up-to-date list of banned ships can be found on the internet site of the Paris MoU on Port State Control.
United Kingdom, Sweden, Finland and China are placed highest in terms of performance. Azerbaijan has moved down to the “Grey List”.New to the “White List” are Estonia and the Islamic Republic of Iran. Flag States with an average performance are shown on the “Grey List”. Their appearance on this list may act as an incentive to improve and move to the “White List”. At the same time f lags at the lower end of the “Grey List” should be careful not to neglect control over their ships and risk ending up on the “Black List” next year. From the figures it may be concluded that since the “Grey List” and “the Black List” are getting smaller and the “White List” is increasing, there is a movement towards quality f lags.
SHIP TyPES
Looking at detentions by ship type over several years, it is noted that general dry cargo ships and bulk carriers still account for over 74% of
23

1.executivesummary
The number of deficiencies in these areas has slightly increased from 30,076 in 2005 to 30,493 in 2006.
SECURITy
On 1 July 2004 the ISPS code was implemented. Until the end of 2004 107 ISPS related deficiencies were recorded. This number has increased to 817 deficiencies in 2005 and 735 deficiencies in 2006.
MARINE ENVIRONMENT
MARPOL 73/78 Annex I, II, III, IV, V, VI and operational deficiencies have increased by 38%, from 3,965 in 2005 to 5,453 in 2006. This may be caused by the concentrated Inspection Campaign on MARPOL 73/78, Annex 1.
wORkING ANd LIVING CONdITIONS
Major categories related to working and living conditions are “crew and accommodation”, “food and catering”, “working places” and “accident prevention”. Deficiencies in these areas increased by 3%, from 6,964 in 2005 to 7,175 in 2006.
CERTIfICATION Of CREw
Compliance with the standards for training, certification and watch keeping for seafarers indicated a slight increase of 6,1%, from 2,529 in 2005 to 2,684 in 2006.
OPERATIONAL
Operational deficiencies have steadily increased from 1,694 in 2002 to 2,256 deficiencies in 2006 (33,2%). However
PERfORMANCE Of RECOGNIzEd ORGANIzATIONS
Details of the responsibility of recognized organizations (ROs) for detainable deficiencies have been published since 1999. When one or more detainable deficiencies are attributed to a recognized organization in accordance with the criteria it is recorded and the RO is informed. Out of 1,174 detentions recorded in 2006, 13% (148) were considered RO related. When considering the rate of RO related detentions as a percentage of inspections in 2006, Register of Shipping (Korea, DPR) 9,3% and Inclamar (Cyprus) 7,3%, scored highest as indicated in the Statistical Annex.
dEfICIENCIES
A total of 66,142 deficiencies were recorded during port State control inspections in 2006, an increase of 5,9% on the number of 62,434 recorded in 2005.With some exceptions, ships older than 15 years show substantially more deficiencies than ships of less than 5 years.The trends in key safety areas are shown below. More detailed information may be found in the Statistical Annex.
SAfETy
In 2006 deficiencies in vital safety areas such as life saving appliances, fire fighting equipment, safety in general and navigation accounted for 46% of the total number of deficiencies.
f a c t s a n d f i g u r e s
24

the number of deficiencies has decreased significantly in relation to 2004 and 2003 (about 25%).
MANAGEMENT
The International Safety Management Code came into force for certain categories of ships from July 1998, and was extended to other ships in July 2002. In the year under review 3,087 (major) non-conformities were recorded. The trend from the past years that showed a major increase of ISM related deficiencies appeared to have stopped in 2004, however in 2005 and 2006 a slight increase in ISM deficiencies can be seen again.
25

1.executivesummary
statisticalaNNexesannual report 2006
27

nu
mb
er
of
ind
ivid
ua
l
ship
s in
spe
cte
dn
um
be
r o
f in
spe
cti
on
s
b a s i c p o r t s t a t e c o n t r o l f i g u r e s
28

de
ten
tio
ns
in %
of
in
spe
cti
on
sn
um
be
r o
f d
ete
nti
on
sn
um
be
r o
f d
efi
cie
nc
ies
ob
serv
ed
b a s i c p o r t s t a t e c o n t r o l f i g u r e s
2�

i n s p e c t i o n e f f o r t s - 1
i n s p e c t i o n e f f o r t s o f m e m b e r s c o m p a r e d t o t a r g e t
30

MO U p o r t s t a t e s ’ i n d i v i d u a l c o n t r i b u t i o n t o t h e t o t a l a m o u n t o f i n s p e c t i o n s
M OUp o r ts t a t e
individ
ualship
s1
inspectio
ns
inspectio
ns
with
deficiencies
Dete
ntions
Dete
ntsw
ithr
O
relate
d
deficiencies
%-insp.with
deficiencies
%D
eta
ined
%individ
ual
ship
sinspected
(25%
commitment)
%inspectio
n
ofMOUtota
l
b e lg ium 5067 1300 468 6� 10 36,00 5,31 25,66 6,02
canada 17�0 771 252 20 7 32,68 2,5� 43,07 3,57
croa t i a 1356 370 248 31 4 67,03 8,38 27,2� 1,71
cyprus 12� 5� 15 0 45,74 11,63 0,60
Denmark 2240 606 20� 2� 0 34,4� 4,7� 27,05 2,81
es ton ia 1505 385 117 7 1 30,3� 1,82 25,58 1,78
F in land 1288 444 �8 7 0 22,07 1,58 34,47 2,06
France 5843 17�� �01 78 11 50,08 4,34 30,74 8,33
germany 5277 152� 818 53 6 53,50 3,47 28,�7 7,08
greece 214� 651 335 34 3 51,46 5,22 30,2� 3,02
ice land 352 102 26 3 0 25,4� 2,�4 28,�8 0,47
i re land 12�� 43� 242 28 � 55,13 6,38 33,80 2,03
i ta l y 64�4 2528 162� 261 27 64,44 10,32 38,�3 11,71
la tv ia 1812 476 223 6 2 46,85 1,26 26,27 2,21
l i thuan ia 1423 164 140 1 0 85,37 0,61 0,76
Mal ta 138 86 10 1 62,32 7,25 0,64
Nether l ands 5400 1387 728 70 � 52,4� 5,05 25,6� 6,43
Norway 1�67 503 168 12 1 33,40 2,3� 25,57 2,33
Po land 2248 7�1 385 2� 0 48,67 3,67 35,1� 3,66
Por tuga l 274� �46 506 51 7 53,4� 5,3� 34,41 4,38
russ ian Fed . 38�5 1262 815 44 8 64,58 3,4� 32,40 5,85
s loven ia 708 258 114 48 7 44,1� 18,60 36,44 1,20
spa in 6002 2166 14�6 173 14 6�,07 7,�� 36,0� 10,04
sweden 2728 741 22� 13 0 30,�0 1,75 27,16 3,43
Uni ted k ingdom 6255 16�� 1275 82 21 75,04 4,83 27,16 7,87
i n s p e c t i o n e f f o r t s - 1 i n s p e c t i o n e f f o r t s - 2
31

32

Flagstateinspec -t ions
2004-2006
Deten -t ions
2004-2006
b lack togrey l im i t
grey towhi tel im i t
excessFac to r
b lack l i s t
korea , DPr 3�4 135 37 8,70
a lban ia 344 �8 32 6,84
bo l i v i a 36 10 6 4,0�
comoros 326 63 31 3,�5
georg ia 718 126 62 3,76
s lovak ia 202 3� 21 3,65
s t .k i t t s and Nev is 40 10 6 3,53
sy r i an arab repub l i c 170 32 18 3,38
honduras 116 22 13 3,11
s t V incent and thegrenad ines
2450 2�6 1�3 2,34
cambod ia 526 6� 47 2,27
lebanon 16� 24 18 2,03
braz i l 38 7 6 1,7�
egypt 157 1� 17 1,40
be l i ze 622 5� 55 1,22
Morocco 170 18 18 1,02
very highrisk
high risk
mediumtohighrisk
mediumrisk
b l a c k l i s t
33
b a s i c p o r t s t a t e c o n t r o l f i g u r e sb a s i c p o r t s t a t e c o n t r o l f i g u r e s
34

b a s i c p o r t s t a t e c o n t r o l f i g u r e sb a s i c p o r t s t a t e c o n t r o l f i g u r e s
Flagstateinspec -t ions
2004-2006
Deten -t ions
2004-2006
b lack togrey l im i t
grey towhi tel im i t
excessFac to r
grey l i s tPanama 6877 514 517 446 0,�6
ta iwan 45 6 6 0 0,�3
turkey 1�68 154 157 11� 0,�2
a lge r i a 138 14 15 4 0,�0
Ukra ine 583 48 51 30 0,84
Mongo l i a 47 5 7 0 0,75
Jama ica 41 4 6 0 0,68
tha i l and 235 18 23 10 0,61
Faroe i s l ands 82 5 10 1 0,41
aus t r i a 36 2 6 0 0,41
croa t i a 204 13 21 8 0,40
Domin ica 101 6 12 2 0,3�
tun is ia 3� 2 6 0 0,38
azerba i j an 117 7 13 3 0,38
bu lga r i a 318 20 30 14 0,36
Domin ican repub l i c 30 1 5 0 0,30
russ ian Federa t ion 2706 177 212 167 0,22
Po land 145 7 16 5 0,22
la tv ia 113 5 13 3 0,21
ind ia 143 6 16 4 0,14
i re land 183 8 1� 7 0,11
l i thuan ia 2�3 14 28 13 0,08
romania 7� 2 10 1 0,08
korea , repub l i c o f 158 6 17 5 0,06
Vanuatu 122 4 14 3 0,06
Japan 65 1 8 1 0,04
Malays ia 125 4 14 4 0,04
g r e y l i s t
35

36

Flagstateinspec -t ions
2004-2006
Deten -t ions
2004-2006
b lack togrey l im i t
grey towhi tel im i t
excessFac to r
kuwa i t 32 0 5 0 0,00
saud i a rab ia 4� 0 7 0 0,00
is rae l 50 0 7 0 -0,04
ant i l l es , Nether l ands 740 37 64 40 -0,15
Ma l ta 4226 247 324 268 -0,17
gib ra l t a r 800 3� 68 44 -0,22
es ton ia 177 4 18 6 -0,57
swi t ze r l and 65 0 8 1 -0,57
cayman i s l ands 403 13 37 1� -0,62
i ran i s l amic repub l i c o f 262 7 26 11 -0,64
Uni ted s ta tes o f amer i ca 18� 4 20 7 -0,68
cyprus 2852 120 223 177 -0,71
greece 1513 52 123 8� -0,8�
barbados 346 8 33 16 -0,�2
be lg ium 161 2 17 5 -0,�6
ant igua and barbuda 4407 157 337 280 -0,�8
spa in 278 5 27 12 -1,04
Por tuga l 548 13 4� 28 -1,07
hong kong , ch ina 1125 31 �3 64 -1,0�
bahamas 3434 �8 265 215 -1,21
l ibe r i a 306� 7� 23� 1�1 -1,31
Nether l ands 2�57 74 230 184 -1,33
luxembourg 166 1 18 6 -1,34
i ta l y 1150 23 �5 66 -1,40
Norway 2686 5� 210 166 -1,43
s ingapore 8�2 16 75 4� -1,43
Denmark 1245 24 102 72 -1,44
Man i s l e o f 836 14 71 46 -1,47
Ph i l ipp ines 200 1 20 8 -1,52
Marsha l l i s l ands 1365 24 112 80 -1,52
France 26� 2 26 11 -1,54
germany 11�4 1� �� 6� -1,56
bermuda 282 2 27 12 -1,58
ch ina 2�0 2 28 13 -1,60
F in land 55� 6 50 2� -1,63
sweden �5� 11 81 54 -1,71
Un i ted k ingdom 1573 1� 127 �3 -1,75
w h i t e l i s t
37
Flagstate
inspectio
ns
Deten
tions
inspectio
ns
with
deficiencies
inspectio
n%with
deficiencies
Deten
tion
%
e r i t r ea 1 - 1 100,00 -
es ton ia 5� 3 31 52,54 5,08
eth iop ia 5 - 5 100,00 -
Faroe i s l ands 36 2 24 66,67 5,56
F in land 1�1 3 �5 4�,74 1,57
France 113 1 61 53,�8 0,88
georg ia 280 52 236 84,2� 18,57
germany 432 5 166 38,43 1,16
gibra l t a r 31� 15 138 43,26 4,70
greece 481 � 165 34,30 1,87
grenada 1 - 1 100,00 -
honduras 30 6 21 70,00 20,00
hong kong , ch ina 3�2 7 150 38,27 1,7�
ind ia 41 - 16 3�,02 -
indones ia 1 - 0 - -
i r an , i s l amic repub l i c o f 77 2 3� 50,65 2,60
i re land 44 1 14 31,82 2,27
is rae l 12 - 1 8,33 -
i t a l y 414 � 163 3�,37 2,17
Jama ica 20 2 18 �0,00 10,00
Japan 18 - � 50,00 -
Jo rdan 1 1 1 100,00 100,00
kazakhs tan 11 - 5 45,45 -
korea , DPr 114 42 107 �3,86 36,84
korea , repub l i c o f 50 3 32 64,00 6,00
kuwa i t 12 - 4 33,33 -
la tv ia 43 2 22 51,16 4,65
lebanon 3� 6 33 84,62 15,38
l ibe r i a 1077 23 476 44,20 2,14
l ibyan arab Jamah i r i ya 5 2 5 100,00 40,00
Flagstate
inspectio
ns
Deten
tions
inspectio
ns
with
deficiencies
inspectio
n%with
deficiencies
Deten
tion
%
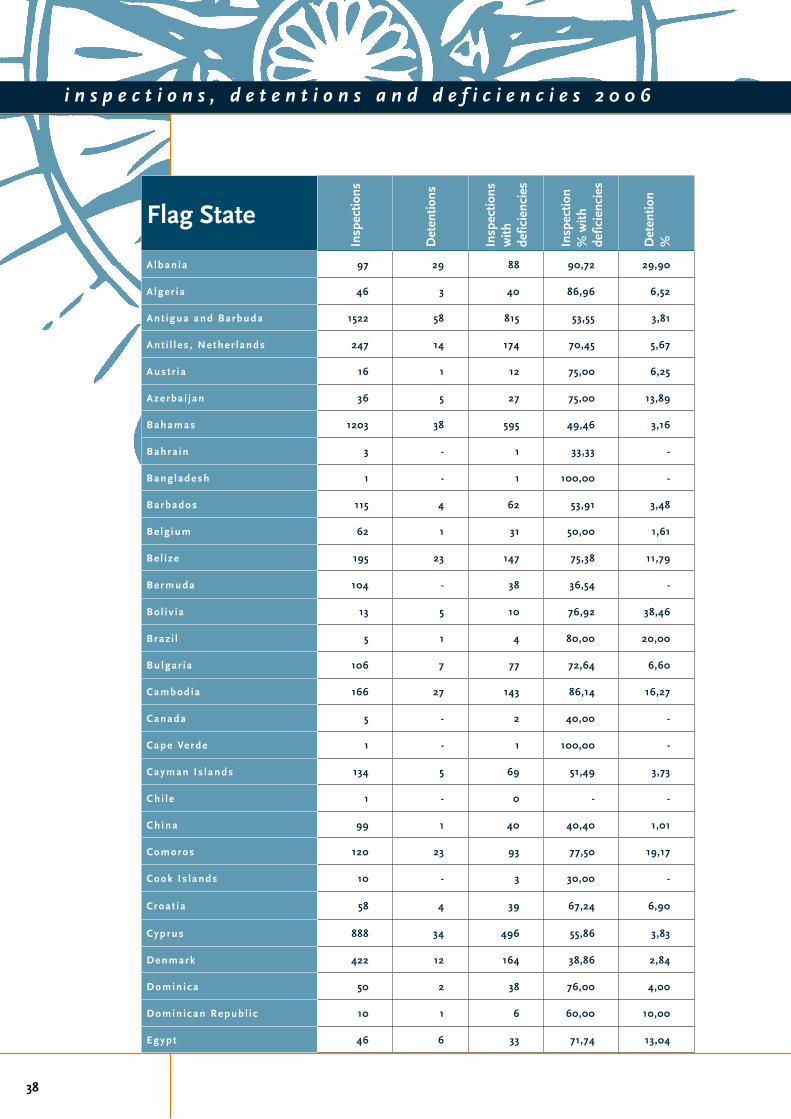
a l ban ia �7 2� 88 �0,72 2�,�0
a lge r i a 46 3 40 86,�6 6,52
ant igua and barbuda 1522 58 815 53,55 3,81
ant i l l es , Nether l ands 247 14 174 70,45 5,67
aus t r i a 16 1 12 75,00 6,25
azerba i j an 36 5 27 75,00 13,8�
bahamas 1203 38 5�5 4�,46 3,16
bahra in 3 - 1 33,33 -
bang ladesh 1 - 1 100,00 -
barbados 115 4 62 53,�1 3,48
be lg ium 62 1 31 50,00 1,61
be l i ze 1�5 23 147 75,38 11,7�
bermuda 104 - 38 36,54 -
bo l i v i a 13 5 10 76,�2 38,46
braz i l 5 1 4 80,00 20,00
bu lgar i a 106 7 77 72,64 6,60
cambod ia 166 27 143 86,14 16,27
canada 5 - 2 40,00 -
cape Verde 1 - 1 100,00 -
cayman i s l ands 134 5 6� 51,4� 3,73
ch i l e 1 - 0 - -
ch ina �� 1 40 40,40 1,01
comoros 120 23 �3 77,50 1�,17
cook i s l ands 10 - 3 30,00 -
croa t i a 58 4 3� 67,24 6,�0
cyprus 888 34 4�6 55,86 3,83
Denmark 422 12 164 38,86 2,84
Domin ica 50 2 38 76,00 4,00
Domin ican repub l i c 10 1 6 60,00 10,00
egypt 46 6 33 71,74 13,04
i n s p e c t i o n s , d e t e n t i o n s a n d d e f i c i e n c i e s 2 0 0 6
38

Flagstate
inspectio
ns
Deten
tions
inspectio
ns
with
deficiencies
inspectio
n%with
deficiencies
Deten
tion
%
e r i t r ea 1 - 1 100,00 -
es ton ia 5� 3 31 52,54 5,08
eth iop ia 5 - 5 100,00 -
Faroe i s l ands 36 2 24 66,67 5,56
F in land 1�1 3 �5 4�,74 1,57
France 113 1 61 53,�8 0,88
georg ia 280 52 236 84,2� 18,57
germany 432 5 166 38,43 1,16
gibra l t a r 31� 15 138 43,26 4,70
greece 481 � 165 34,30 1,87
grenada 1 - 1 100,00 -
honduras 30 6 21 70,00 20,00
hong kong , ch ina 3�2 7 150 38,27 1,7�
ind ia 41 - 16 3�,02 -
indones ia 1 - 0 - -
i r an , i s l amic repub l i c o f 77 2 3� 50,65 2,60
i re land 44 1 14 31,82 2,27
is rae l 12 - 1 8,33 -
i t a l y 414 � 163 3�,37 2,17
Jama ica 20 2 18 �0,00 10,00
Japan 18 - � 50,00 -
Jo rdan 1 1 1 100,00 100,00
kazakhs tan 11 - 5 45,45 -
korea , DPr 114 42 107 �3,86 36,84
korea , repub l i c o f 50 3 32 64,00 6,00
kuwa i t 12 - 4 33,33 -
la tv ia 43 2 22 51,16 4,65
lebanon 3� 6 33 84,62 15,38
l ibe r i a 1077 23 476 44,20 2,14
l ibyan arab Jamah i r i ya 5 2 5 100,00 40,00
i n s p e c t i o n s , d e t e n t i o n s a n d d e f i c i e n c i e s 2 0 0 6
3�

Flagstate
inspectio
ns
Deten
tions
inspectio
ns
with
deficiencies
inspectio
n%with
deficiencies
Deten
tion
%
spa in 86 2 35 40,70 2,33
sr i lanka 4 2 4 100,00 50,00
st.Vincentandthegrenadines 813 100 577 70,�7 12,30
st . k i t t s and Nev is 37 10 34 �1,8� 27,03
sweden 320 1 123 38,44 0,31
swi t ze r l and 23 - 8 34,78 -
sy r i an arab repub l i c 48 8 34 70,83 16,67
ta iwan 17 1 13 76,47 5,88
tha i l and �0 7 60 66,67 7,78
tonga 6 1 4 66,67 16,67
tun is ia 14 1 12 85,71 7,14
turkey 5�5 42 3�2 65,88 7,08
tuva lu 7 - 3 42,86 -
Ukra ine 180 16 134 74,44 8,8�
Uni ted arab emi ra tes � - 3 33,33 -
Un i ted k ingdom 528 6 214 40,53 1,14
Uni ted s ta tes o f amer i ca 54 1 2� 53,70 1,85
Vanuatu 38 - 16 42,11 -
V ie t Nam 3 - 2 66,67 -
to ta l s 21566 1174 1154� - -
Flagstate
inspectio
ns
Deten
tions
inspectio
ns
with
deficiencies
inspectio
n%with
deficiencies
Deten
tion
%
l i thuan ia 78 5 48 61,54 6,41
luxembourg 48 - 16 33,33 -
Ma lays ia 34 1 16 47,06 2,�4
Mald ives 3 - 2 66,67 -
Ma l ta 14�7 86 883 58,�8 5,74
Man i s l e o f 312 8 110 35,26 2,56
Marsha l l i s l ands 556 8 22� 41,1� 1,44
Maur i tan ia 1 1 1 100,00 100,00
Moldova , rep . o f � - � 100,00 -
Mongo l i a � - 8 88,8� -
Morocco 55 7 50 �0,�1 12,73
Myanmar 2 - 0 - -
Namib ia 1 1 1 100,00 100,00
Nether l ands �74 28 422 43,33 2,87
Niger ia 1 - 1 100,00 -
Norway 856 26 410 47,�0 3,04
Pak is tan 8 2 8 100,00 25,00
Panama 2451 210 1422 58,02 8,57
Ph i l ipp ines 60 1 38 63,33 1,67
Po land 5� 2 30 50,85 3,3�
Por tuga l 165 5 8� 53,�4 3,03
Qata r 10 - 7 70,00 -
romania 11 - 6 54,55 -
russ ian Federa t ion �21 55 507 55,05 5,�7
saud i a rab ia 16 - 10 62,50 -
se rb ia and Montenegro 8 3 7 87,50 37,50
seyche l l es 1 - 0 - -
s ie r ra leone 22 5 21 �5,45 22,73
s ingapore 324 3 130 40,12 0,�3
s lovak ia 101 18 82 81,1� 17,82
i n s p e c t i o n s , d e t e n t i o n s a n d d e f i c i e n c i e s 2 0 0 6
40

Flagstate
inspectio
ns
Deten
tions
inspectio
ns
with
deficiencies
inspectio
n%with
deficiencies
Deten
tion
%
spa in 86 2 35 40,70 2,33
sr i lanka 4 2 4 100,00 50,00
st.Vincentandthegrenadines 813 100 577 70,�7 12,30
st . k i t t s and Nev is 37 10 34 �1,8� 27,03
sweden 320 1 123 38,44 0,31
swi t ze r l and 23 - 8 34,78 -
sy r i an arab repub l i c 48 8 34 70,83 16,67
ta iwan 17 1 13 76,47 5,88
tha i l and �0 7 60 66,67 7,78
tonga 6 1 4 66,67 16,67
tun is ia 14 1 12 85,71 7,14
turkey 5�5 42 3�2 65,88 7,08
tuva lu 7 - 3 42,86 -
Ukra ine 180 16 134 74,44 8,8�
Uni ted arab emi ra tes � - 3 33,33 -
Un i ted k ingdom 528 6 214 40,53 1,14
Uni ted s ta tes o f amer i ca 54 1 2� 53,70 1,85
Vanuatu 38 - 16 42,11 -
V ie t Nam 3 - 2 66,67 -
to ta l s 21566 1174 1154� - -
i n s p e c t i o n s , d e t e n t i o n s a n d d e f i c i e n c i e s 2 0 0 6
41

Flagstate
inspectio
ns
Deten
tions
Deten
tions
% excessof
average
ko rea , DPr 114 42 36,84 31,40
a lban ia �7 2� 2�,�0 24,46
st.kittsandNevis 37 10 27,03 21,5�
s ie r ra leone 22 5 22,73 17,2�
honduras 30 6 20,00 14,56
comoros 120 23 1�,17 13,73
georg ia 280 52 18,57 13,13
s lovak ia 101 18 17,82 12,38
sy r i an arab repub l i c 48 8 16,67 11,23
cambod ia 166 27 16,27 10,83
lebanon 3� 6 15,38 �,�4
azerba i j an 36 5 13,8� 8,45
egypt 46 6 13,04 7,60
Morocco 55 7 12,73 7,2�
st . V incent & the grenadines 813 100 12,30 6,86
be l i ze 1�5 23 11,7� 6,35
Ukra ine 180 16 8,8� 3,45
Panama 2451 210 8,57 3,13
tha i l and �0 7 7,78 2,34
turkey 5�5 42 7,06 1,62
croa t i a 58 4 6,�0 1,46
bu lga r i a 106 7 6,60 1,16
a lge r i a 46 3 6,52 1,08
l i thuan ia 78 5 6,41 0,�7
korea , repub l i c o f 50 3 6,00 0,56
russ ian Federa t ion �21 55 5,�7 0,53
Ma l ta 14�7 86 5,74 0,30
ant i l l es , Nether l ands 247 14 5,67 0,23
Faroe i s l ands 36 2 5,56 0,12
● Only f lags with more than 20 port State control inspections in 2006 are recorded in this table and the graph
● The orange area in the graph represents the 2006 average detention percentage (5,44%)
2 0 0 6 d e t e n t i o n s p e r f l a g S t a t e , e x c e e d i n g a v e r a g e p e r c e n t a g e
42

Flagstate
inspectio
ns
Deten
tions
Deten
tions
% excessof
average
ko rea , DPr 114 42 36,84 31,40
a lban ia �7 2� 2�,�0 24,46
st.kittsandNevis 37 10 27,03 21,5�
s ie r ra leone 22 5 22,73 17,2�
honduras 30 6 20,00 14,56
comoros 120 23 1�,17 13,73
georg ia 280 52 18,57 13,13
s lovak ia 101 18 17,82 12,38
sy r i an arab repub l i c 48 8 16,67 11,23
cambod ia 166 27 16,27 10,83
lebanon 3� 6 15,38 �,�4
azerba i j an 36 5 13,8� 8,45
egypt 46 6 13,04 7,60
Morocco 55 7 12,73 7,2�
st . V incent & the grenadines 813 100 12,30 6,86
be l i ze 1�5 23 11,7� 6,35
Ukra ine 180 16 8,8� 3,45
Panama 2451 210 8,57 3,13
tha i l and �0 7 7,78 2,34
turkey 5�5 42 7,06 1,62
croa t i a 58 4 6,�0 1,46
bu lga r i a 106 7 6,60 1,16
a lge r i a 46 3 6,52 1,08
l i thuan ia 78 5 6,41 0,�7
korea , repub l i c o f 50 3 6,00 0,56
russ ian Federa t ion �21 55 5,�7 0,53
Ma l ta 14�7 86 5,74 0,30
ant i l l es , Nether l ands 247 14 5,67 0,23
Faroe i s l ands 36 2 5,56 0,12
● Only f lags with more than 20 port State control inspections in 2006 are recorded in this table and the graph
● The orange area in the graph represents the 2006 average detention percentage (5,44%)
2 0 0 6 d e t e n t i o n s p e r f l a g S t a t e , e x c e e d i n g a v e r a g e p e r c e n t a g e
43

shiptype
inspectio
ns
inspectio
nswith
deficiencies
%ofinspe
ctionswith
deficiencies
individu
alships
Deten
tions
Deten
tion%2006
Deten
tion%2005
Deten
tion%2004
+/-average
detention%
bu l k car r i e rs 34�3 1��5 57,11 2521 174 4,�8 4,08 6,01 -0,46
chemica l tankers 1376 5�7 43,3� 882 30 2,18 3,42 3,02 -3,26
gas car r i e rs 450 188 41,78 31� 3 0,67 1,75 1,�5 -4,77
genera l Dry cargo 8747 5235 5�,85 4625 6�� 7,�� 6,61 7,66 2,55
Other types 844 464 54,�8 677 52 6,16 4,62 7,54 0,72
Passenger sh ips Fe r r i es 8�6 522 58,26 520 30 3,35 2,8 3,� -2,0�
re f r ige ra ted cargo 627 426 67,�4 427 42 6,7 5,62 8,04 1,26
ro-ro / conta ine r Veh ic l e 2��4 128� 43,05 2050 81 2,71 2,66 3,53 -2,73
tankers / comb. car r i e rs 213� 833 38,�4 1536 63 2,�5 2,34 2,48 -2,4�
a l l t ypes 21566 1154� - - 1174 5,44 4,67 5,84 -
i n s p e c t i o n s a n d d e t e n t i o n sPER SHIP TyPE
2004 2005 2006 2004 2005 2006 2004 2005 2006 2004 2005 2006
ship'scertificatesanddocuments
31�8 3583 41�8 4,�� 5,74 6,35 15,74 16,82 1�,47 25,51 27,51 31,2�
trainingcertificationandwatchkeepingforseafarers
3127 252� 2684 4,88 4,05 4,06 15,3� 11,87 12,45 24,�4 1�,42 20,00
crewandaccommodation(ilO147)
2150 1720 1684 3,35 2,75 2,55 10,58 8,07 7,81 17,15 13,21 12,55
accidentprevention(ilO147) 671 1048 136� 1,05 1,68 2,07 3,30 4,�2 6,35 5,35 8,05 10,20
Foodandcatering(ilO147)
1�28 1634 1673 3,01 2,62 2,53 �,4� 7,67 7,76 15,38 12,55 12,47
workingspace(ilO147)
2858 2562 244� 4,46 4,1 3,70 14,07 12,03 11,36 22,7� 1�,67 18,25
Mooringarrangements(ilO147)
1052 �30 �36 1,64 1,4� 1,42 5,18 4,37 4,34 8,3� 7,14 6,�8
safetyingeneral 51�4 5165 5183 8,10 8,27 7,84 25,57 24,25 24,03 41,43 3�,66 38,63
safetyofnavigation 67�5 6681 7570 10,60 10,7 11,45 33,45 31,36 35,10 54,20 51,30 56,42
Firesafetymeasures �022 8631 8511 14,07 13,82 12,87 44,41 40,52 3�,46 71,�6 66,27 63,43
lifesavingappliances 67�3 6147 6017 10,60 �,85 �,10 33,44 28,86 27,�0 54,18 47,20 44,85
alarm–signals 435 425 488 0,68 0,68 0,74 2,14 2,00 2,26 3,47 3,26 3,64
radiocommunication 2028 3027 2724 3,16 4,85 4,12 �,�8 14,21 12,63 16,17 23,24 20,30
bulkcarriers-additionalsafetymeasures
135 111 171 0,21 0,18 0,26 0,66 0,52 0,7� 1,08 0,85 1,27
gasandchemicalcarriers 135 214 1�2 0,21 0,34 0,2� 0,66 1,00 0,8� 1,08 1,64 1,43
carriageofcargoanddangerousgoods
600 588 567 0,�4 0,�4 0,86 2,�5 2,76 2,63 4,7� 4,51 4,23
loadlines 351� 31�7 3118 5,4� 5,12 4,71 17,32 15,01 14,46 28,07 24,55 23,24
Propulsion&auxmachinery 4346 4287 5077 6,78 6,87 7,68 21,3� 20,12 23,54 34,66 32,�2 37,84
sOlasrelatedoperationaldeficiencies
2361 20�� 2135 3,68 3,36 3,23 11,62 �,85 �,�0 18,83 16,12 15,�1
isMrelateddeficiencies 27�4 2�40 3087 4,36 4,71 4,67 13,75 13,80 14,31 22,28 22,57 23,01
MarPOl-annexi 3646 3270 4601 5,6� 5,24 6,�6 17,�5 15,35 21,33 2�,08 25,11 34,2�
MarPOl-annexii 52 40 68 0,08 0,06 0,10 0,26 0,1� 0,32 0,41 0,31 0,51
MarPOl-annexiii 7 6 13 0,01 0,01 0,02 0,03 0,03 0,06 0,06 0,05 0,10
MarPOl-annexiV 24 3� 0,04 0,06 0,11 0,18 0,18 0,2�
MarPOl-annexV � 608 640 0,01 0,�7 0,�7 0,04 2,85 2,�7 0,07 4,67 4,77
MarPOl-annexVi 17 �2 0,03 0,14 0,08 0,43 0,13 0,6�
MarPOlrelatedoperationaldeficiencies 610 134 121 0,�5 0,21 0,18 3,00 0,63 0,56 4,87 1,03 0,�0
security(isPs) 107 817 735 0,17 1,31 1,11 0,53 3,84 3,41 0,85 6,27 5,48
tOtal 64113 62434 66142
44

i n s p e c t i o n s a n d d e t e n t i o n sPER SHIP TyPE
m a j o r c a t e g o r i ePER OF DEFICIENCIES IN RELATION TO INSPECTIONS/SHIPS
2004 2005 2006 2004 2005 2006 2004 2005 2006 2004 2005 2006
ship'scertificatesanddocuments
31�8 3583 41�8 4,�� 5,74 6,35 15,74 16,82 1�,47 25,51 27,51 31,2�
trainingcertificationandwatchkeepingforseafarers
3127 252� 2684 4,88 4,05 4,06 15,3� 11,87 12,45 24,�4 1�,42 20,00
crewandaccommodation(ilO147)
2150 1720 1684 3,35 2,75 2,55 10,58 8,07 7,81 17,15 13,21 12,55
accidentprevention(ilO147) 671 1048 136� 1,05 1,68 2,07 3,30 4,�2 6,35 5,35 8,05 10,20
Foodandcatering(ilO147)
1�28 1634 1673 3,01 2,62 2,53 �,4� 7,67 7,76 15,38 12,55 12,47
workingspace(ilO147)
2858 2562 244� 4,46 4,1 3,70 14,07 12,03 11,36 22,7� 1�,67 18,25
Mooringarrangements(ilO147)
1052 �30 �36 1,64 1,4� 1,42 5,18 4,37 4,34 8,3� 7,14 6,�8
safetyingeneral 51�4 5165 5183 8,10 8,27 7,84 25,57 24,25 24,03 41,43 3�,66 38,63
safetyofnavigation 67�5 6681 7570 10,60 10,7 11,45 33,45 31,36 35,10 54,20 51,30 56,42
Firesafetymeasures �022 8631 8511 14,07 13,82 12,87 44,41 40,52 3�,46 71,�6 66,27 63,43
lifesavingappliances 67�3 6147 6017 10,60 �,85 �,10 33,44 28,86 27,�0 54,18 47,20 44,85
alarm–signals 435 425 488 0,68 0,68 0,74 2,14 2,00 2,26 3,47 3,26 3,64
radiocommunication 2028 3027 2724 3,16 4,85 4,12 �,�8 14,21 12,63 16,17 23,24 20,30
bulkcarriers-additionalsafetymeasures
135 111 171 0,21 0,18 0,26 0,66 0,52 0,7� 1,08 0,85 1,27
gasandchemicalcarriers 135 214 1�2 0,21 0,34 0,2� 0,66 1,00 0,8� 1,08 1,64 1,43
carriageofcargoanddangerousgoods
600 588 567 0,�4 0,�4 0,86 2,�5 2,76 2,63 4,7� 4,51 4,23
loadlines 351� 31�7 3118 5,4� 5,12 4,71 17,32 15,01 14,46 28,07 24,55 23,24
Propulsion&auxmachinery 4346 4287 5077 6,78 6,87 7,68 21,3� 20,12 23,54 34,66 32,�2 37,84
sOlasrelatedoperationaldeficiencies
2361 20�� 2135 3,68 3,36 3,23 11,62 �,85 �,�0 18,83 16,12 15,�1
isMrelateddeficiencies 27�4 2�40 3087 4,36 4,71 4,67 13,75 13,80 14,31 22,28 22,57 23,01
MarPOl-annexi 3646 3270 4601 5,6� 5,24 6,�6 17,�5 15,35 21,33 2�,08 25,11 34,2�
MarPOl-annexii 52 40 68 0,08 0,06 0,10 0,26 0,1� 0,32 0,41 0,31 0,51
MarPOl-annexiii 7 6 13 0,01 0,01 0,02 0,03 0,03 0,06 0,06 0,05 0,10
MarPOl-annexiV 24 3� 0,04 0,06 0,11 0,18 0,18 0,2�
MarPOl-annexV � 608 640 0,01 0,�7 0,�7 0,04 2,85 2,�7 0,07 4,67 4,77
MarPOl-annexVi 17 �2 0,03 0,14 0,08 0,43 0,13 0,6�
MarPOlrelatedoperationaldeficiencies 610 134 121 0,�5 0,21 0,18 3,00 0,63 0,56 4,87 1,03 0,�0
security(isPs) 107 817 735 0,17 1,31 1,11 0,53 3,84 3,41 0,85 6,27 5,48
tOtal 64113 62434 66142
NUMberOFDeFicieNcies
DeF.iN%OFtOtalNUMber
ratioofdef.toindiv.
shipsx100
ratioofdef.toinspectionsx
100
45

recognizedorganization*
totaln
umbe
rof
insp
ection
s
Numbe
rof
individu
alships
insp
ected
totaln
umbe
rof
detention
s
Deten
tion
-%of
totaln
umbe
rof
insp
ection
s
+/-Percentage
of
average
Deten
tion
-%of
individu
alships
insp
ected
+/-Percentage
of
average
americanbureauofshipping abs 1.684 1.243 6 0.36 -0,37 0,48 -0,70
bulgarskikorabenregistar bkr 68 2� 2 2,�4 2,21 6,�0 5,72
bureausecuritas 11 10 0 0,00 -0,73 0,00 -1,18
bureauVeritas bV 3.406 2.0�1 15 0,44 -0,2� 0,72 -0,46
chinaclassificationsociety ccs 33� 273 1 0,2� -0,44 0,37 -0,81
chinacorporationregisterofshipping ccrs 3� 31 0 0,00 -0,73 0,00 -1,18
croatianregisterofshipping crs 107 57 2 1,87 1,14 3,51 2,33
DetNorskeVeritas DNVc 4.165 2.7�2 8 0,1� -0,54 0,2� -0,8�
germanischerlloyd gl 4.504 2.4�2 10 0,22 -0,51 0,40 -0,78
hellenicregisterofshipping hrs 24� 144 4 1,61 0,88 2,78 1,60
hondurasint.surveyinginsp.bureau hiNsib 27 8 1 3,70 2,�7 12,50 11,32
iNclaMar iNc 55 28 4 7,27 6,54 14,2� 13,11
indianregisterofshipping irs 41 36 0 0,00 -0,73 0,00 -1,18
internationalNavalsurveysbureau iNsb 200 �8 4 2,00 1,27 4,08 2,�0
internationalregisterofshipping is 223 125 � 4,04 3,31 7,20 6,02
isthmusbureauofshipping ibs 83 42 2 2,41 1,68 4,76 3,58
koreanregisterofshipping krs 204 156 3 1,47 0,74 1,�2 0,74
lloyd’sregister lr 4.462 2.863 12 0,27 -0,46 0,42 -0,76
Nipponkaijikyokai Nkk 2.102 1.573 � 0,43 -0,30 0,57 -0,61
Panamabureauofshipping Pbs 16 12 1 6,25 5,52 8,33 7,15
PanamaMaritimeDoc.services PMDs 60 33 1 1,67 0,�4 3,03 1,85
Panamaregistercorporation Prc 54 30 1 1,85 1,12 3,33 2,15
Polskirejestrstatkow Prs 360 170 6 1,67 0,�4 3,53 2,35
registerofshipping(albania rs �7 31 4 4,12 3,3� 12,�0 11,72
registerofshipping(korea,DPr) 75 38 7 �,33 8,60 18,42 17,24
registroitalianoNavale riNa �64 608 3 0,31 -0,42 0,4� -0,6�
riNaVePortuguesa rP 23 11 0 0,00 -0,73 0,00 -1,18
russianMaritimeregisterofshipping rMrs 2.55� 1.382 21 0,82 0,05 1,52 0,34
shippingregisterofUkraine srU 138 �6 5 3,62 2,8� 5,21 4,03
turkishlloyd tl 432 231 0 0,00 -0,73 0,00 -1,18
* Where a count r y i s shown a f te r a Recogn ized Organ iza t ion th i s ind ica tes i t s loca t ion and not necessa r i l y any connec t ion w i th the mar i t ime admin is t ra t ion o f tha t count r y.
DeteNtiONsOFshiPswithrOrelateDDetaiNableDeFicieNciesPerrecOgNizeDOrgaNizatiON
(CASES IN WHICH MORE THAN 10 INSPECTIONS ARE INVOLVED)
46

DeteNtiONsOFshiPswithrOrelateDDetaiNableDeFicieNciesPerrecOgNizeDOrgaNizatiON
(CASES IN WHICH MORE THAN 10 INSPECTIONS ARE INVOLVED, SEE TABLE ON PAGE 46)
47

insp
ection
s*
detention
s
low/med
iumlimit
Med
ium/highlimit
excessfactor
Perform
an-celevel
registerofshipping(korea,DPr) 184 17 7 0 5,07
Verylowregisterofshipping(albania) rs 340 23 12 2 3,73
internationalregisterofshipping(Usa) is 565 30 17 5 2,8�
iNclaMar(cyprus) iNc 145 7 6 0 1,40 low
shippingregisterofUkraine srU 361 11 12 2 0,8�
Medium
internationalNavalsurveysbureau(greece) iNsb 626 17 1� 6 0,86
bulgarskikorabenregistar bkr 15� 5 7 0 0,77
hellenicregisterofshipping(greece) hrs 784 18 23 � 0,67
hondurasint.surveyinginspectionbureau hiNsib 64 2 4 0 0,65
chinacorporationregisterofshipping ccrs 102 2 5 0 0,4�
isthmusbureauofshipping(greece) ibs 177 3 7 0 0,42
indianregisterofshipping irs 12� 2 6 0 0,41
riNaVePortuguesa rP 74 1 4 0 0,40
PanamaMaritimeDocumentationservices PMDs 157 0 7 0 0,33
Polskirejestrstatkow Prs 1.027 17 28 13 0,28
Panamaregistercorporation Prc 132 1 6 0 0,24
croatianregisterofshipping crs 325 4 11 2 0,23
koreanregisterofshipping krs 5�� 5 18 6 -0,1�
russianMaritimeregisterofshipping rMrs 7.106 61 162 122 -0,�4
high
turkishlloyd tl 1.21� 6 33 16 -1,00
bureauVeritas(France) bV �.628 46 216 16� -1,42
lloyd’sregister(U.k.) lr 12.786 62 282 22� -1,43
Nipponkaijikyokai(Japan) Nkk 6.0�6 27 140 103 -1,43
americanbureauofshipping abs 4.845 15 113 80 -1,58
chinaclassificationsociety ccs �07 1 26 11 -1,64
germanischerlloyd(germany) gl 12.688 35 280 227 -1,67
registroitalianoNavale(italy) riNa 2.628 5 65 40 -1,6�
DetNorskeVeritas(Norway) DNVc 11.874 26 263 212 -1,74
R e c o g n i z e d O r g a n i z a t i o n p e r f o r m a n c e t a b l e ( 2 0 0 4 - 2 0 0 6 )
In th i s t ab le on l y Recogn ized Organ iza t ions tha t had more than 60 inspec t ions a re t aken in to account . The fo rmula used i s ident i ca l to the one used fo r the
B lack Grey and Whi te l i s t . However, the va lues fo r P and Q a re ad jus ted to P=0 ,02 and Q=0,01
*Where a count r y i s shown a f te r a Recogn ized Organ iza t ion th i s ind ica tes i t s loca t ion and not necessa r i l y any connec t ion w i th the mar i t ime admin is t ra t ion o f tha t count r y
48

Flag
ban
ned
ships
Novalid
isM
certificates
Jumpe
d
detention
Faile
dtocalla
t
indicated
repa
iryard
Multiple
detention
s
albania 2 2
algeria 2 1 1
bahamas 1 1
belize 2 2
bolivia 2 2
cambodia 5 2 3
comoros 2 2
cyprus 2 1 1
georgia 2 2
honduras 1 1
korea,DPr 8 6 1
lebanon 2 1 1
lithuania 1 1
Madagascar 1 1
Mongolia 1 1
Nigeria 1 1
Panama 15 2 4 �
romania 1 1
slovakia 1 1
st.kitts&Nevis 1 1
st.Vincent&thegrenadines 13 2 11
syrianarabrepublic 3 1 2
turkey 8 1 1 6
totals 77 1 7 24 45
r e f u s a l o f a c c e s s ( b a n n i n g ) p e r f l a g s t a t e 2 0 0 4 - 2 0 0 6
4�

1
10
100
1000
30 50 100 250 500 1000 2000
Number of Inspections
Number of Detentions
EF = 4 and above very high riskEF = 3 to 4 high riskEF = 2 to 3 medium to high riskEF = 1 to 2 medium risk
EF = 4 EF = 3 EF = 2 EF = 1 BlackEF = 0 White
EF = -1
EF = -2
thenewnormativelistingofflagstatesprovidesanindependent
categorizationthathasbeenpreparedonthebasisofParisMOUportstate
inspectionresults.comparedtothecalculationmethodofpreviousyear,
thissystemhastheadvantageofprovidinganexcesspercentagethatis
significantandalsoreviewingthenumberofinspectionsanddetentionsover
a3-yearperiodatthesametime,basedonbinomialcalculus.
The performance of each f lag State is calculated using a standard formula for statistical calculations in which certain values have been fixed in accordance with agreed Paris MOU policy. Two limits have been included in the new system, the ‘black to grey’ and the ‘grey to white’ limit, each with its own specific formula:
In the formula “N” is the number of inspections, “p” is the allowable detention limit (yardstick), set to 7% by the Paris MOU Port State Control Committee, and “z” is the significance requested (z=1.645 for a statistically acceptable certainty level of 95%). The result “u“ is the allowed number of detentions for either the black or white list. The “u“ results can be found in the table A
number of detentions above this ‘black to grey’ limit means significantly worse than average, where a number of detentions below the ‘grey to white’ limit means significantly better than average. When the aMoUnt of detentions for a particular f lag State is positioned between the two, the f lag State will find itself on the grey list. The formula is applicable for sample sizes of 30 or more inspections over a 3-year period.To sort results on the black or white list, simply alter the target and repeat the calculation. Flags which are still significantly above this second target, are worse than the f lags which are not. This process can be repeated, to create as many refinements as desired. (Of course the maximum detention rate remains 100%!) To make the f lags’ performance comparable, the excess factor (EF) is introduced. Each incremental or decremental step corresponds with one whole EF-point of difference. Thus
E x p l a n a t o r y n o t e – B l a c k , G r e y a n d w h i t e l i s t
50

the excess factor EF is an indication for the number of times the yardstick has to be altered and recalculated. Once the excess factor is determined for all f lags, the f lags can be ordered by EF. The excess factor can be found in the last column the black, grey or white list. The target (yardstick) has been set on 7% and the size of the increment and decrement on 3%. The Black/Grey/White lists have been calculated in accordance with the above principles.
The graphical representation of the system, below, is showing the direct relations between the number of inspected ships and the number of detentions. Both axis have a logarithmic character.as the ‘black to grey’ or the ‘grey to white’ limit.
Example f lag on Black list:
Ships of f lag State A were subject to 108 inspections of which 25 resulted in a detention. The “black to grey limit” is 12 detentions.The excess factor is 4,26
N= total inspectionsP = 7%Q =3%Z = 1.645
How to determine the black to grey limit:
The excess factor is 4,26. This means that ‘p’ has to be adjusted in the formula. The black to grey limit has an excess factor of 1, so to determine the new value for ‘p’, ‘q’ has to be multiplied with 3,26 and the outcome has to be added to the normal value for ‘p’:
Example f lag on Grey list:
Ships of f lag State B were subject to 141 inspections, of which 10 resulted in a detention. The ‘ black to grey limit” is 15 and the “ grey to white limit” is 4. The excess factor is 0.51.How to determine the black to grey limit:
How to determine the grey to white limit:
To determine the excess factor the following formula is used:
= Detentions – grey to white limit / grey to black limit – grey to white limit
Example f lag on white list:
Ships of f lag State C were subject to 297 inspections of which 11 resulted in detention. The “grey to white limit” is 13 detentions. The excess factor is –0,28.How to determine the grey to white limit:
The excess factor is - 0,28 This means that ‘p’ has to be adjusted in the formula. The grey to white limit has an excess factor of 0, so to determine the new value for ’p’, ‘q’ has to be multiplied with –0,28, and the outcome has to be added to the normal value for ‘p’:
E x p l a n a t o r y n o t e – B l a c k , G r e y a n d w h i t e l i s t
51

1.executivesummary
Address Secretariat:
Nieuwe Uitleg 1P.O.Box 906532509 LR The HagueTelephone: +31 70 456 1508Fax: +31 70 456 [email protected]
Layout and design
Rooduijn bureau voor communicatie & design
Photographs
Richard W. J. SchiferliParis MoU AuthoritiesMinistry of TransportLitho and print
web site
The Paris MoU maintains a web site which can be found at www.parismou.org. The site contains information on operation of the Paris MoU and a database of inspection results.
Staff
Mr. Richard W.J. SchiferliGeneral SecretaryTelephone: +31 70 456 1509E-mail: [email protected]
Mrs. Carien DroppersSecretaryTelephone: +31 70 456 1507E-mail: [email protected]
Mr. Ivo SnijdersSecretaryTelephone: +31 70 456 1849E-mail: [email protected]
Mr. Alexander SindramICT AdvisorTelephone: +31 70 456 1375E-mail: [email protected]
Mr. Roy WelbornOffice ManagerTelephone: +31 70 456 1436E-mail: [email protected]
Mrs. Babette HendrikseTemp. Assistant SecretaryTelephone: +31 70 456 1510
Mrs. Ingrid de VreeTemp. Management AssistantTelephone: +31 70 456 1508
Secretariat Paris Memorandum of Understanding on Port State Control
52
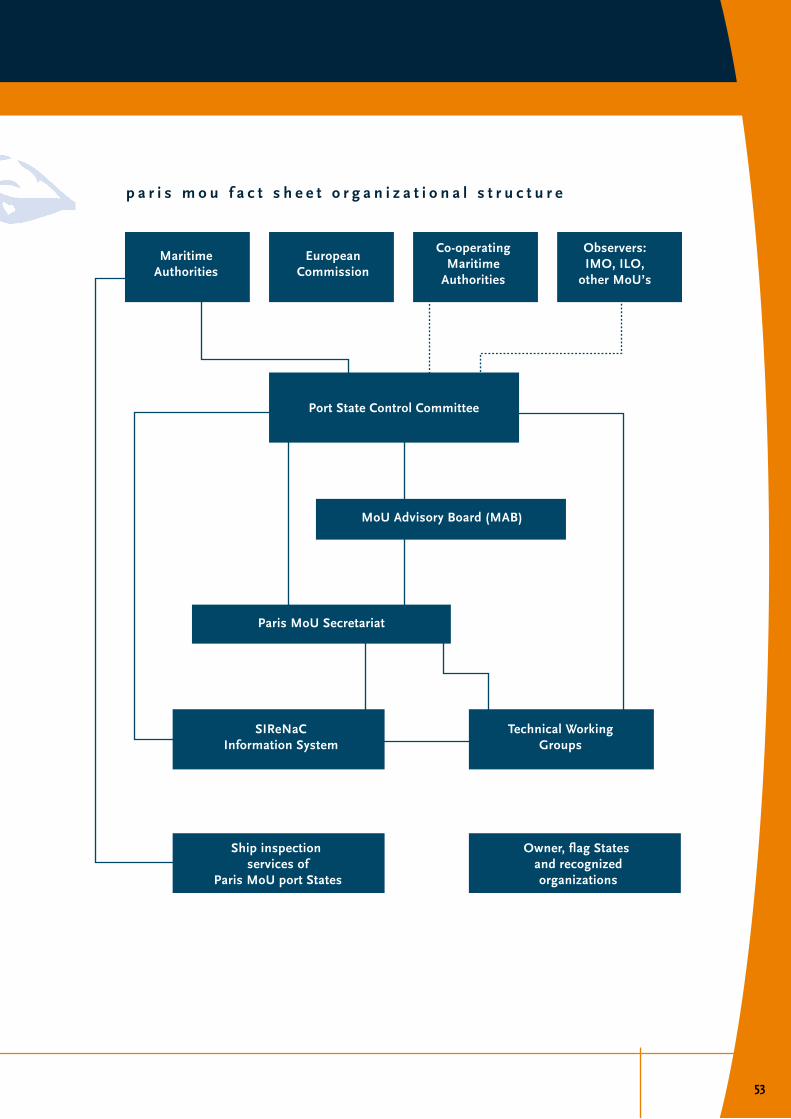
p a r i s m o u f a c t s h e e t o r g a n i z a t i o n a l s t r u c t u r e
53

1.executivesummaryn o t e s
54

