2014: commercial real estate houston commercial real estate dan bellow president – houston jones...
TRANSCRIPT

2014: Commercial Real Estate
Dan BellowPresident – Houston
Jones Lang LaSalle Americas, Inc.
Houston

Houston 2nd Hottest Real Estate Market for 2014HBJ – January 16, 2014
Fortune Names Houston Companies Among 100 Best to Work for in U.S.Fortune – January 16, 2014
Houston # 1 U.S. City for JobsForbes – September 10, 2013
Most Robust Economy in North AmericaBrookings Institute – August 2013
Largest Export Market in the U.S.Department of Commerce – June 2013
Most Multifamily ConstructionAXIOMetrics Inc – January 30, 2013
Top U.S. Manufacturing CitiesManufacture’s News – January 23, 2013
Houston’s Rankings
2

MSA New Construction Starts thru November 2013*
Houston 46,462New York 35,360
Dallas 35,113
Washington DC 22,716
Atlanta 22,447
Los Angeles 21,245
Austin 19,049
Miami 19,032
Houston’s Housing Market: Constant Growth
*Single & MultifamilySource: Bureau of Labor and Statistics
3

December 20135,813 Units
Single Family Home Sales10,0009,0008,0007,0006,0005,0004,0003,0002,000
Houston’s Housing Market: Constant Growth
4

Houston’s Retail Market: Reflective of Economy’s Boom
• 265 MSF of rentable area
• 2013 absorption of 1.7 MSF
• 1 MSF of construction entering 2014
• Rental rates up 2.8% Y-Y from Q4 2012
• Premiere sites (Uptown, Woodlands) averaging $40.00 to $70.00 PSF
• Neighborhood center rentals averaging $25.00 to $35.00 PSF
• $180 PSF average sale price; 6.7% average cap rate
5

Houston’s Office Market: Metro Comparison
Gross Rental Rate Growth (4Q 2012 – 4Q 2013)
6

Key Market IndicatorsSupply
2013Year End
2014Forecast
Supply 152,083,838 SF
Direct market vacancy 11.4%
Total market vacancy 12.3%
Under construction (70% preleased) 6.8 MSF
Houston’s Office Market: Unprecedented Growth
7
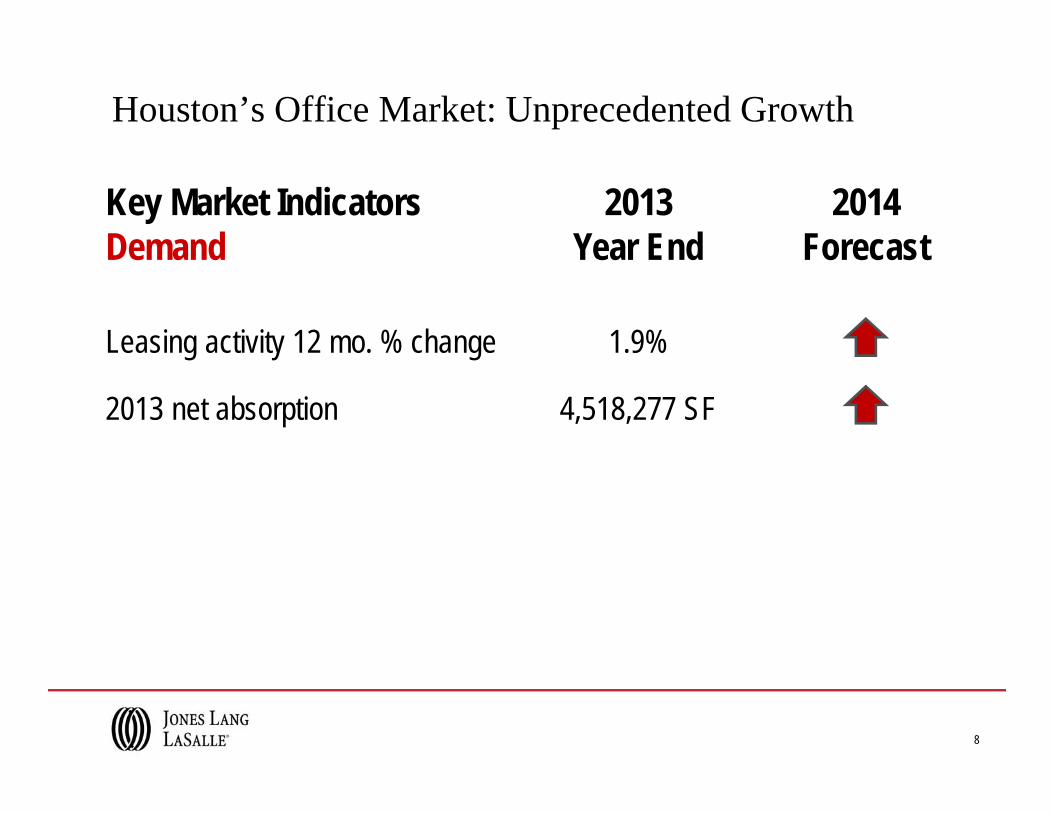
Key Market IndicatorsDemand
2013Year End
2014Forecast
Leasing activity 12 mo. % change 1.9%
2013 net absorption 4,518,277 SF
Houston’s Office Market: Unprecedented Growth
8

Key Market IndicatorsPricing
2013Year End
2014Forecast
Overall rent 12 mo. % change 4.2%
Class A overall asking rent $34.14 PSF
Class B overall asking rent $21.00 PSF
Houston’s Office Market: Unprecedented Growth
9

10
Houston Office Market
74%76%78%80%82%84%86%88%90%92%
2004 2005 2006 2007 2008 2009 2010 2011 2012 2013
Overall Occupancy Class A&B (%) CBDSuburban

1. Central Business District: KBR, United, Rosetta Resources, Transcanda
2. Galleria: Stewart, BBVA, Alliant, Williams Co., Blue Cross Blue Shield
3. Greenway Plaza: ExxonMobil, Occidental, UHY, Seahawk Drilling
Houston Office Market: 6 Submarkets Driving Houston
11

4. Katy Freeway (Energy Corridor):BP, Murphy Oil, Nexen, Technip
5. Westchase District: Halliburton, ABB, National Oilwell Varco
6. The Woodlands (“New” Energy Corridor): ExxonMobil, Southwestern Energy, Nexeo Solutions, Newfield
Houston Office Market: 6 Submarkets Driving Houston
12
• Contributed to 85% of Houston 2013 Absorption
• Average Class A Rent = $35.42
• Average Class A Vacancy = 7.3%
Houston Office Market: 6 Submarkets Driving Houston
13

Activity / Absorption
Prices / Rental Rates
Supply / Vacancy
Market Condition 2013 Year End4.5 MSF absorbed in 2013; 8 MSF in past 2 years
4.4% Rent Growth YOY 2012 to 2013 in Class A space; $40 PSF Gross Rates in CBD
Overall vacancy decreased 2.8% YOY from 2012; 7 submarkets with single digit overall vacancy
Houston Office Market Conclusions
14

Activity / Absorption
Prices / Rental Rates
Supply / Vacancy
Tenant leverage in Big 6 submarkets to diminish; Demand and absorption will increase
Growth to continue with increased demand particularly West Houston, The Woodlands and CBD
New projects are preleased, will increase supply but decrease vacancy rates
Market Condition 2014 Forecast
Houston Office Market Outlook
15

Houston Industrial Market: Metro Comparison
Gross Rental Rate Growth (4Q 2012 – 4Q 2013)
16

Key Market IndicatorsSupply
2013 Year End
2014Forecast
Supply 389,478,498 SF
Direct market vacancy 4.8%
Total market vacancy 4.9%
Under construction (65% preleased) 5.8 MSF
Houston’s Industrial Market: Continued Growth
17

Key Market IndicatorsDemand
2013 Year End
2014Forecast
Leasing activity 12 mo. % change 2.2%
2013 net absorption 3,213,308 SF
Houston’s Industrial Market: Continued Growth
18

Key Market IndicatorsPricing
2013 Year End
2014Forecast
Overall rent 12 mo. % change 7.3%
Warehouse/distribution asking rent $5.28 PSF
Manufacturing asking rent $5.16 PSF
Houston’s Industrial Market: Continued Growth
19

Activity / Absorption
Prices / Rental Rates
Supply / Vacancy
Market Condition 2013 Year End
4.3% rent growth overall Q-Q; $6.00 PSF asking rates in North and Northwest markets
Vacancy decreased in most submarkets; Over 50% of new supply is speculative
Majority of activity in North, Northwest, and Port of Houston; Build-to-suit construction strong
Houston Industrial Market Conclusions
20

Activity will remain strong in North & Northwest; Big Box users continue to take space
Lease rates to increase as Build-to-suit market expands
Vacancy rates will continue to decrease throughout much of market, possibly to below 4.5%
Activity / Absorption
Prices / Rental Rates
Supply / Vacancy
Market Condition 2014 Forecast
Houston Industrial Market Outlook
21

Houston’s Capital Markets 2013 Conclusions:Shifting from Secondary to Primary Market
• Allowing for portfolio diversification for investors
• Growth of offshore investors
• Large scale transactions dominated market
• Lack of small to medium sized offerings
• Class A transaction volume increased 54% Y-Y
• Suburban price PSF breaks pricing record 3x in 2013
• 6.9% average cap rate is 50 basis point reduction from 2012
22

Houston’s Capital Markets 2013 Conclusions:Shifting from Secondary to Primary Market
• Williams Tower in the Galleria traded at $278 PSF and 5.75% cap rate (Trophy Class A building)
• BG Group Place in the CBD traded at $493 PSF and 5.75% cap rate (Trophy Class A building)
• Greenway Plaza (10 buildings in Houston) traded at $218 PSF and 7.6% cap rate (Class A buildings)
23

More large entity-level transactions and partial interest offerings on the way
Suburban price PSF to increase, likely to $400 PSF;Westchase & Greenway cap rates to compress
Supply of traded buildings to tieto vacancy of buildings; 90% occupied buildings preferred
Activity / Absorption
Prices / Rental Rates
Supply / Vacancy
Market Condition 2014 ForecastHouston’s Capital Markets Outlook
24

Q & A
Dan BellowPresident – Houston
Jones Lang LaSalle, Americas Inc.