2014 assisted reproductive technology fertility … talbert fertility institute cary, north carolina...
TRANSCRIPT
265041_ART-FertilityClinic_Title-Divider.indd 2 6/1/2016 4:57:22 PM
2014 Fertility Clinic Tables
NORTH CAROLINA–WISCONSIN

364
NO
RT
H C
AR
OLIN
A NORTH CAROLINA CENTER FOR REPRODUCTIVE MEDICINETHE TALBERT FERTILITY INSTITUTE
CARY, NORTH CAROLINAComparison of success rates across clinics may not be meaningful. Patient medical characteristics and treatment approaches vary (see pages 11–20).
Data verified by Sameh K. Toma, MD2014 ART CYCLE PROFILE
Type of ART and Procedural Factors a
IVF 100%Unstimulated 0%Used gestational carrier 0%
With ICSI 85%PGD/PGS 0%
Patient Diagnosis b
Tubal factor 16%Ovulatory dysfunction 15%Diminished ovarian reserve 32%Endometriosis 5%
Uterine factor 13%Male factor 38%Other factor 9%Unknown factor 8%
Multiple Factors: Female factors only 11%Female & male factors 21%
2014 ART SUCCESS RATES c Total number of cyclesd: 416 (includes 10 cycle[s] using frozen eggs)
Type of CycleAge of Woman
<35 35–37 38–40 41–42 43–44 >44Fresh Embryos from Nondonor Eggs
Number of cycles 98 40 23 8 1 2Percentage of cancellations before retrieval (%) 7.1 17.5 17.4 3 / 8 0 / 1 1 / 2Average number of embryos transferred 2.0 2.0 Percentage of embryos transferred resulting in implantation (%) 0 / 2 0 / 2 Percentage of elective single embryo transfers (eSET) (%) 0 / 1 0 / 1
Outcomes per CyclePercentage of cycles resulting in term, normal weight & singleton live births
e (%) 0.0 0.0 0.0 0 / 8 0 / 1 0 / 2
Percentage of cycles resulting in singleton live births (%) 0.0 0.0 0.0 0 / 8 0 / 1 0 / 2Percentage of cycles resulting in twin live births (%) 0.0 0.0 0.0 0 / 8 0 / 1 0 / 2Percentage of cycles resulting in live births (%) 0.0 0.0 0.0 0 / 8 0 / 1 0 / 2Percentage of cycles resulting in pregnancies (%) 0.0 0.0 0.0 0 / 8 0 / 1 0 / 2
Outcomes per TransferNumber of transfers 1 1 0 0 0 0Percentage of transfers resulting in term, normal weight & singleton live births
e (%) 0 / 1 0 / 1
Percentage of transfers resulting in singleton live births (%) 0 / 1 0 / 1 Percentage of transfers resulting in twin live births (%) 0 / 1 0 / 1 Percentage of transfers resulting in live births (%) 0 / 1 0 / 1 Percentage of transfers resulting in pregnancies (%) 0 / 1 0 / 1
Frozen Embryos from Nondonor EggsNumber of cycles 92 35 26 4 2 5Number of transfers 85 34 24 4 2 5Estimated average number of transfers per retrieval 1.0 1.3 1.3 1.3 2.0 Average number of embryos transferred 2.0 2.0 2.1 1.8 1.5 2.2Percentage of embryos transferred resulting in implantation (%) 44.7 36.9 21.6 1 / 7 0 / 3 2 / 11Percentage of transfers resulting in term, normal weight & singleton live births
e (%) 29.4 20.6 12.5 0 / 4 0 / 2 0 / 5
Percentage of transfers resulting in singleton live births (%) 35.3 20.6 20.8 1 / 4 0 / 2 0 / 5Percentage of transfers resulting in twin live births (%) 21.2 20.6 8.3 0 / 4 0 / 2 1 / 5Percentage of transfers resulting in live births (%) 56.5 41.2 29.2 1 / 4 0 / 2 1 / 5Percentage of transfers resulting in pregnancies (%) 67.1 52.9 37.5 1 / 4 0 / 2 1 / 5
Number of Egg/Embryo Banking Cycles 7 3 4 0 0 0
Donor Eggs Fresh Embryosf Frozen Embryosf
Number of cycles 28 28Number of transfers 16 23Average number of embryos transferred 2.1 2.1Percentage of embryos transferred resulting in implantation (%) 35.5 37.0Percentage of transfers resulting in term, normal weight & singleton live births
e (%) 6 / 16 21.7
Percentage of transfers resulting in singleton live births (%) 7 / 16 30.4Percentage of transfers resulting in twin live births (%) 2 / 16 17.4Percentage of transfers resulting in live births (%) 9 / 16 47.8Percentage of transfers resulting in pregnancies (%) 10 / 16 60.9
CURRENT SERVICES & PROFILE Current Name: North Carolina Center for Reproductive Medicine, The Talbert Fertility Institute
Donor eggs? YesDonor embryos? Yes
Gestational carriers? YesEmbryo cryopreservation? Yes
Single women? YesSART member? Yes
Verified lab accreditation? Yes(See Appendix C for details.)
a Reflects features of fresh nondonor cycles. If IVF is less than 100%, the remaining cycles are GIFT, ZIFT, or a combination of these procedures with IVF.
b Total patient diagnosis percentages may be greater than 100% because more than one diagnosis can be reported for each ART cycle.
c Fractions are used for rates with denominators less than 20. Multiple-infant births (for example, twins) with at least one live infant are counted as one live birth.
d Total cycle number includes those using frozen eggs. It excludes 0 cycle(s) evaluating new procedures. Both cycle types are excluded from ART success rates.
e In this report, births are defined as term if at least 37 full weeks gestation and normal birth weight if at least 2,500 grams (approximately 5 pounds, 8 ounces).
f All ages are reported together because previous data show that patient age does not materially affect success with donor eggs.

365
NO
RT
H C
AR
OLIN
ACMC REPRODUCTIVE MEDICINE AND INFERTILITY
CMC WOMEN’S INSTITUTECHARLOTTE, NORTH CAROLINA
Comparison of success rates across clinics may not be meaningful. Patient medical characteristics and treatment approaches vary (see pages 11–20).
Data verified by Bradley S. Hurst, MD2014 ART CYCLE PROFILE
Type of ART and Procedural Factors a
IVF 100%Unstimulated 0%Used gestational carrier 0%
With ICSI 85%PGD/PGS 0%
Patient Diagnosis b
Tubal factor 17%Ovulatory dysfunction 25%Diminished ovarian reserve 17%Endometriosis 8%
Uterine factor 6%Male factor 37%Other factor 21%Unknown factor 9%
Multiple Factors: Female factors only 18%Female & male factors 19%
2014 ART SUCCESS RATES c Total number of cyclesd: 498 (includes 26 cycle[s] using frozen eggs)
Type of CycleAge of Woman
<35 35–37 38–40 41–42 43–44 >44Fresh Embryos from Nondonor Eggs
Number of cycles 83 39 30 13 2 0Percentage of cancellations before retrieval (%) 3.6 15.4 23.3 3 / 13 1 / 2 Average number of embryos transferred 1.6 1.8 2.2 2.2 2.0 Percentage of embryos transferred resulting in implantation (%) 35.1 30.6 31.3 4.5 0 / 2 Percentage of elective single embryo transfers (eSET) (%) 41.0 17.2 0 / 19 0 / 8 0 / 1
Outcomes per CyclePercentage of cycles resulting in term, normal weight & singleton live births
e (%) 20.5 7.7 10.0 1 / 13 0 / 2
Percentage of cycles resulting in singleton live births (%) 32.5 15.4 13.3 1 / 13 0 / 2 Percentage of cycles resulting in twin live births (%) 2.4 7.7 13.3 0 / 13 0 / 2 Percentage of cycles resulting in live births (%) 34.9 23.1 26.7 1 / 13 0 / 2 Percentage of cycles resulting in pregnancies (%) 39.8 30.8 33.3 1 / 13 0 / 2
Outcomes per TransferNumber of transfers 64 30 22 10 1 0Percentage of transfers resulting in term, normal weight & singleton live births
e (%) 26.6 10.0 13.6 1 / 10 0 / 1
Percentage of transfers resulting in singleton live births (%) 42.2 20.0 18.2 1 / 10 0 / 1 Percentage of transfers resulting in twin live births (%) 3.1 10.0 18.2 0 / 10 0 / 1 Percentage of transfers resulting in live births (%) 45.3 30.0 36.4 1 / 10 0 / 1 Percentage of transfers resulting in pregnancies (%) 51.6 40.0 45.5 1 / 10 0 / 1
Frozen Embryos from Nondonor EggsNumber of cycles 87 42 39 6 1 0Number of transfers 73 37 34 5 1 0Estimated average number of transfers per retrieval 1.0 1.4 1.2 0.5 1.0 0.0Average number of embryos transferred 1.2 1.3 1.3 1.0 1.0 Percentage of embryos transferred resulting in implantation (%) 42.7 41.3 46.2 2 / 2 0 / 1 Percentage of transfers resulting in term, normal weight & singleton live births
e (%) 30.1 29.7 41.2 1 / 5 0 / 1
Percentage of transfers resulting in singleton live births (%) 37.0 40.5 44.1 1 / 5 0 / 1 Percentage of transfers resulting in twin live births (%) 1.4 2.7 0.0 0 / 5 0 / 1 Percentage of transfers resulting in live births (%) 38.4 43.2 44.1 1 / 5 0 / 1 Percentage of transfers resulting in pregnancies (%) 52.1 51.4 58.8 5 / 5 0 / 1
Number of Egg/Embryo Banking Cycles 53 20 25 10 1 1
Donor Eggs Fresh Embryosf Frozen Embryosf
Number of cycles 3 17Number of transfers 3 14Average number of embryos transferred 1.7 1.5Percentage of embryos transferred resulting in implantation (%) 4 / 5 10 / 17Percentage of transfers resulting in term, normal weight & singleton live births
e (%) 2 / 3 6 / 14
Percentage of transfers resulting in singleton live births (%) 2 / 3 7 / 14Percentage of transfers resulting in twin live births (%) 1 / 3 1 / 14Percentage of transfers resulting in live births (%) 3 / 3 8 / 14Percentage of transfers resulting in pregnancies (%) 3 / 3 10 / 14
CURRENT SERVICES & PROFILE Current Name: CMC Reproductive Medicine and Infertility, CMC Women’s Institute
Donor eggs? YesDonor embryos? Yes
Gestational carriers? YesEmbryo cryopreservation? Yes
Single women? YesSART member? Yes
Verified lab accreditation? Yes(See Appendix C for details.)
a Reflects features of fresh nondonor cycles. If IVF is less than 100%, the remaining cycles are GIFT, ZIFT, or a combination of these procedures with IVF.
b Total patient diagnosis percentages may be greater than 100% because more than one diagnosis can be reported for each ART cycle.
c Fractions are used for rates with denominators less than 20. Multiple-infant births (for example, twins) with at least one live infant are counted as one live birth.
d Total cycle number includes those using frozen eggs. It excludes 0 cycle(s) evaluating new procedures. Both cycle types are excluded from ART success rates.
e In this report, births are defined as term if at least 37 full weeks gestation and normal birth weight if at least 2,500 grams (approximately 5 pounds, 8 ounces).
f All ages are reported together because previous data show that patient age does not materially affect success with donor eggs.

366
NO
RT
H C
AR
OLIN
A INSTITUTE FOR ASSISTED REPRODUCTIONCHARLOTTE, NORTH CAROLINA
Comparison of success rates across clinics may not be meaningful. Patient medical characteristics and treatment approaches vary (see pages 11–20).
Data verified by Jack L. Crain, MD2014 ART CYCLE PROFILE
Type of ART and Procedural Factors a
IVF 100%Unstimulated 0%Used gestational carrier 2%
With ICSI 84%PGD/PGS 1%
Patient Diagnosis b
Tubal factor 10%Ovulatory dysfunction 19%Diminished ovarian reserve 19%Endometriosis 11%
Uterine factor 4%Male factor 25%Other factor 10%Unknown factor 13%
Multiple Factors: Female factors only 4%Female & male factors 7%
2014 ART SUCCESS RATES c Total number of cyclesd: 1,082 (includes 26 cycle[s] using frozen eggs)
Type of CycleAge of Woman
<35 35–37 38–40 41–42 43–44 >44Fresh Embryos from Nondonor Eggs
Number of cycles 185 76 61 48 18 6Percentage of cancellations before retrieval (%) 6.5 11.8 18.0 14.6 5 / 18 2 / 6Average number of embryos transferred 1.9 1.8 2.1 2.0 2.7 2.5Percentage of embryos transferred resulting in implantation (%) 42.8 29.7 17.9 7.0 1 / 13 1 / 5Percentage of elective single embryo transfers (eSET) (%) 3.1 0.0 3.8 0 / 17 0 / 6 0 / 2
Outcomes per CyclePercentage of cycles resulting in term, normal weight & singleton live births
e (%) 9.2 2.6 8.2 0.0 0 / 18 1 / 6
Percentage of cycles resulting in singleton live births (%) 10.3 5.3 9.8 0.0 0 / 18 1 / 6Percentage of cycles resulting in twin live births (%) 8.1 7.9 1.6 2.1 0 / 18 0 / 6Percentage of cycles resulting in live births (%) 18.9 13.2 11.5 2.1 0 / 18 1 / 6Percentage of cycles resulting in pregnancies (%) 22.2 15.8 16.4 4.2 2 / 18 1 / 6
Outcomes per TransferNumber of transfers 75 35 29 21 6 2Percentage of transfers resulting in term, normal weight & singleton live births
e (%) 22.7 5.7 17.2 0.0 0 / 6 1 / 2
Percentage of transfers resulting in singleton live births (%) 25.3 11.4 20.7 0.0 0 / 6 1 / 2Percentage of transfers resulting in twin live births (%) 20.0 17.1 3.4 4.8 0 / 6 0 / 2Percentage of transfers resulting in live births (%) 46.7 28.6 24.1 4.8 0 / 6 1 / 2Percentage of transfers resulting in pregnancies (%) 54.7 34.3 34.5 9.5 2 / 6 1 / 2
Frozen Embryos from Nondonor EggsNumber of cycles 210 84 58 23 12 3Number of transfers 204 83 54 22 10 3Estimated average number of transfers per retrieval 1.4 1.2 0.9 0.9 0.6 0.4Average number of embryos transferred 1.6 1.6 1.5 1.8 1.9 1.3Percentage of embryos transferred resulting in implantation (%) 47.5 40.3 41.9 22.2 6 / 19 0 / 4Percentage of transfers resulting in term, normal weight & singleton live births
e (%) 30.9 33.7 29.6 18.2 3 / 10 0 / 3
Percentage of transfers resulting in singleton live births (%) 35.8 34.9 37.0 18.2 3 / 10 0 / 3Percentage of transfers resulting in twin live births (%) 12.3 8.4 5.6 4.5 1 / 10 0 / 3Percentage of transfers resulting in live births (%) 48.5 43.4 42.6 22.7 4 / 10 0 / 3Percentage of transfers resulting in pregnancies (%) 60.8 57.8 57.4 40.9 5 / 10 0 / 3
Number of Egg/Embryo Banking Cycles 70 36 47 16 14 6
Donor Eggs Fresh Embryosf Frozen Embryosf
Number of cycles 38 45Number of transfers 29 43Average number of embryos transferred 1.7 1.6Percentage of embryos transferred resulting in implantation (%) 68.9 46.9Percentage of transfers resulting in term, normal weight & singleton live births
e (%) 41.4 20.9
Percentage of transfers resulting in singleton live births (%) 51.7 27.9Percentage of transfers resulting in twin live births (%) 24.1 16.3Percentage of transfers resulting in live births (%) 75.9 44.2Percentage of transfers resulting in pregnancies (%) 82.8 58.1
CURRENT SERVICES & PROFILE Current Name: Institute for Assisted Reproduction
Donor eggs? YesDonor embryos? No
Gestational carriers? YesEmbryo cryopreservation? Yes
Single women? YesSART member? Yes
Verified lab accreditation? Yes(See Appendix C for details.)
a Reflects features of fresh nondonor cycles. If IVF is less than 100%, the remaining cycles are GIFT, ZIFT, or a combination of these procedures with IVF.
b Total patient diagnosis percentages may be greater than 100% because more than one diagnosis can be reported for each ART cycle.
c Fractions are used for rates with denominators less than 20. Multiple-infant births (for example, twins) with at least one live infant are counted as one live birth.
d Total cycle number includes those using frozen eggs. It excludes 0 cycle(s) evaluating new procedures. Both cycle types are excluded from ART success rates.
e In this report, births are defined as term if at least 37 full weeks gestation and normal birth weight if at least 2,500 grams (approximately 5 pounds, 8 ounces).
f All ages are reported together because previous data show that patient age does not materially affect success with donor eggs.

367
NO
RT
H C
AR
OLIN
ADUKE FERTILITY CENTER
DUKE UNIVERSITY MEDICAL CENTERDURHAM, NORTH CAROLINA
Comparison of success rates across clinics may not be meaningful. Patient medical characteristics and treatment approaches vary (see pages 11–20).
Data verified by Jennifer L. Eaton, MD2014 ART CYCLE PROFILE
Type of ART and Procedural Factors a
IVF 100%Unstimulated 0%Used gestational carrier 0%
With ICSI 86%PGD/PGS 0%
Patient Diagnosis b
Tubal factor 8%Ovulatory dysfunction 6%Diminished ovarian reserve 21%Endometriosis 8%
Uterine factor 3%Male factor 40%Other factor 11%Unknown factor 23%
Multiple Factors: Female factors only 5%Female & male factors 10%
2014 ART SUCCESS RATES c Total number of cyclesd: 307 (includes 0 cycle[s] using frozen eggs)
Type of CycleAge of Woman
<35 35–37 38–40 41–42 43–44 >44Fresh Embryos from Nondonor Eggs
Number of cycles 78 24 24 18 4 0Percentage of cancellations before retrieval (%) 5.1 4.2 20.8 2 / 18 0 / 4 Average number of embryos transferred 1.7 1.9 2.6 2.9 2.3 Percentage of embryos transferred resulting in implantation (%) 32.7 21.6 14.6 10.6 0 / 7 Percentage of elective single embryo transfers (eSET) (%) 28.3 6 / 19 0 / 15 0 / 15 0 / 3
Outcomes per CyclePercentage of cycles resulting in term, normal weight & singleton live births
e (%) 30.8 20.8 4.2 3 / 18 0 / 4
Percentage of cycles resulting in singleton live births (%) 35.9 20.8 4.2 3 / 18 0 / 4 Percentage of cycles resulting in twin live births (%) 3.8 4.2 8.3 1 / 18 0 / 4 Percentage of cycles resulting in live births (%) 39.7 25.0 12.5 4 / 18 0 / 4 Percentage of cycles resulting in pregnancies (%) 43.6 29.2 20.8 4 / 18 0 / 4
Outcomes per TransferNumber of transfers 66 20 17 16 3 0Percentage of transfers resulting in term, normal weight & singleton live births
e (%) 36.4 25.0 1 / 17 3 / 16 0 / 3
Percentage of transfers resulting in singleton live births (%) 42.4 25.0 1 / 17 3 / 16 0 / 3 Percentage of transfers resulting in twin live births (%) 4.5 5.0 2 / 17 1 / 16 0 / 3 Percentage of transfers resulting in live births (%) 47.0 30.0 3 / 17 4 / 16 0 / 3 Percentage of transfers resulting in pregnancies (%) 51.5 35.0 5 / 17 4 / 16 0 / 3
Frozen Embryos from Nondonor EggsNumber of cycles 46 29 26 9 0 1Number of transfers 45 24 25 9 0 1Estimated average number of transfers per retrieval 1.6 2.7 3.6 2.3 Average number of embryos transferred 1.6 1.7 1.9 1.9 1.0Percentage of embryos transferred resulting in implantation (%) 41.5 45.9 18.4 1 / 14 0 / 1Percentage of transfers resulting in term, normal weight & singleton live births
e (%) 48.9 29.2 20.0 0 / 9 0 / 1
Percentage of transfers resulting in singleton live births (%) 51.1 33.3 20.0 0 / 9 0 / 1Percentage of transfers resulting in twin live births (%) 4.4 12.5 0.0 0 / 9 0 / 1Percentage of transfers resulting in live births (%) 55.6 45.8 20.0 0 / 9 0 / 1Percentage of transfers resulting in pregnancies (%) 60.0 66.7 44.0 3 / 9 0 / 1
Number of Egg/Embryo Banking Cycles 9 1 2 1 0 0
Donor Eggs Fresh Embryosf Frozen Embryosf
Number of cycles 17 18Number of transfers 16 17Average number of embryos transferred 1.7 1.6Percentage of embryos transferred resulting in implantation (%) 37.0 36.0Percentage of transfers resulting in term, normal weight & singleton live births
e (%) 5 / 16 2 / 17
Percentage of transfers resulting in singleton live births (%) 5 / 16 2 / 17Percentage of transfers resulting in twin live births (%) 1 / 16 1 / 17Percentage of transfers resulting in live births (%) 6 / 16 3 / 17Percentage of transfers resulting in pregnancies (%) 8 / 16 9 / 17
CURRENT SERVICES & PROFILE Current Name: Duke Fertility Center, Duke University Medical Center
Donor eggs? YesDonor embryos? Yes
Gestational carriers? YesEmbryo cryopreservation? Yes
Single women? YesSART member? Yes
Verified lab accreditation? Yes(See Appendix C for details.)
a Reflects features of fresh nondonor cycles. If IVF is less than 100%, the remaining cycles are GIFT, ZIFT, or a combination of these procedures with IVF.
b Total patient diagnosis percentages may be greater than 100% because more than one diagnosis can be reported for each ART cycle.
c Fractions are used for rates with denominators less than 20. Multiple-infant births (for example, twins) with at least one live infant are counted as one live birth.
d Total cycle number includes those using frozen eggs. It excludes 0 cycle(s) evaluating new procedures. Both cycle types are excluded from ART success rates.
e In this report, births are defined as term if at least 37 full weeks gestation and normal birth weight if at least 2,500 grams (approximately 5 pounds, 8 ounces).
f All ages are reported together because previous data show that patient age does not materially affect success with donor eggs.

368
NO
RT
H C
AR
OLIN
A WOMACK ARMY MEDICAL CENTERFORT BRAGG, NORTH CAROLINA
Comparison of success rates across clinics may not be meaningful. Patient medical characteristics and treatment approaches vary (see pages 11–20).
Data verified by Jason Parker, DO2014 ART CYCLE PROFILE
Type of ART and Procedural Factors a
IVF 100%Unstimulated 0%Used gestational carrier 0%
With ICSI 76%PGD/PGS 4%
Patient Diagnosis b
Tubal factor 30%Ovulatory dysfunction 5%Diminished ovarian reserve 14%Endometriosis 9%
Uterine factor 2%Male factor 15%Other factor <1%Unknown factor 29%
Multiple Factors: Female factors only 4%Female & male factors 2%
2014 ART SUCCESS RATES c Total number of cyclesd: 138 (includes 0 cycle[s] using frozen eggs)
Type of CycleAge of Woman
<35 35–37 38–40 41–42 43–44 >44Fresh Embryos from Nondonor Eggs
Number of cycles 65 17 10 14 7 1Percentage of cancellations before retrieval (%) 6.2 1 / 17 0 / 10 0 / 14 0 / 7 0 / 1Average number of embryos transferred 1.9 2.0 2.2 2.5 2.0 1.0Percentage of embryos transferred resulting in implantation (%) 35.1 33.3 40.9 14.3 1 / 14 0 / 1Percentage of elective single embryo transfers (eSET) (%) 1.9 0 / 13 0 / 9 0 / 13 0 / 6
Outcomes per CyclePercentage of cycles resulting in term, normal weight & singleton live births
e (%) 33.8 6 / 17 3 / 10 1 / 14 1 / 7 0 / 1
Percentage of cycles resulting in singleton live births (%) 36.9 6 / 17 3 / 10 4 / 14 1 / 7 0 / 1Percentage of cycles resulting in twin live births (%) 10.8 1 / 17 2 / 10 0 / 14 0 / 7 0 / 1Percentage of cycles resulting in live births (%) 47.7 7 / 17 5 / 10 4 / 14 1 / 7 0 / 1Percentage of cycles resulting in pregnancies (%) 50.8 7 / 17 7 / 10 5 / 14 1 / 7 0 / 1
Outcomes per TransferNumber of transfers 59 15 10 14 7 1Percentage of transfers resulting in term, normal weight & singleton live births
e (%) 37.3 6 / 15 3 / 10 1 / 14 1 / 7 0 / 1
Percentage of transfers resulting in singleton live births (%) 40.7 6 / 15 3 / 10 4 / 14 1 / 7 0 / 1Percentage of transfers resulting in twin live births (%) 11.9 1 / 15 2 / 10 0 / 14 0 / 7 0 / 1Percentage of transfers resulting in live births (%) 52.5 7 / 15 5 / 10 4 / 14 1 / 7 0 / 1Percentage of transfers resulting in pregnancies (%) 55.9 7 / 15 7 / 10 5 / 14 1 / 7 0 / 1
Frozen Embryos from Nondonor EggsNumber of cycles 15 3 3 1 0 0Number of transfers 15 3 3 1 0 0Estimated average number of transfers per retrieval 7.5 Average number of embryos transferred 2.0 1.7 2.0 2.0 Percentage of embryos transferred resulting in implantation (%) 23.3 3 / 5 3 / 6 0 / 2 Percentage of transfers resulting in term, normal weight & singleton live births
e (%) 3 / 15 1 / 3 1 / 3 0 / 1
Percentage of transfers resulting in singleton live births (%) 3 / 15 1 / 3 1 / 3 0 / 1 Percentage of transfers resulting in twin live births (%) 1 / 15 0 / 3 0 / 3 0 / 1 Percentage of transfers resulting in live births (%) 4 / 15 1 / 3 1 / 3 0 / 1 Percentage of transfers resulting in pregnancies (%) 6 / 15 2 / 3 2 / 3 0 / 1
Number of Egg/Embryo Banking Cycles 2 0 0 0 0 0
Donor Eggs Fresh Embryosf Frozen Embryosf
Number of cycles 0 0Number of transfers 0 0Average number of embryos transferred Percentage of embryos transferred resulting in implantation (%) Percentage of transfers resulting in term, normal weight & singleton live births
e (%)
Percentage of transfers resulting in singleton live births (%) Percentage of transfers resulting in twin live births (%) Percentage of transfers resulting in live births (%) Percentage of transfers resulting in pregnancies (%)
CURRENT SERVICES & PROFILE Current Name: Womack Army Medical Center
Donor eggs? NoDonor embryos? No
Gestational carriers? NoEmbryo cryopreservation? Yes
Single women? YesSART member? No
Verified lab accreditation? Yes(See Appendix C for details.)
a Reflects features of fresh nondonor cycles. If IVF is less than 100%, the remaining cycles are GIFT, ZIFT, or a combination of these procedures with IVF.
b Total patient diagnosis percentages may be greater than 100% because more than one diagnosis can be reported for each ART cycle.
c Fractions are used for rates with denominators less than 20. Multiple-infant births (for example, twins) with at least one live infant are counted as one live birth.
d Total cycle number includes those using frozen eggs. It excludes 0 cycle(s) evaluating new procedures. Both cycle types are excluded from ART success rates.
e In this report, births are defined as term if at least 37 full weeks gestation and normal birth weight if at least 2,500 grams (approximately 5 pounds, 8 ounces).
f All ages are reported together because previous data show that patient age does not materially affect success with donor eggs.

369
NO
RT
H C
AR
OLIN
AEAST CAROLINA UNIVERSITY
GREENVILLE, NORTH CAROLINAComparison of success rates across clinics may not be meaningful. Patient medical characteristics and treatment approaches vary (see pages 11–20).
Data verified by Clifford C. Hayslip, MD2014 ART CYCLE PROFILE
Type of ART and Procedural Factors a
IVF 100%Unstimulated 0%Used gestational carrier 0%
With ICSI 46%PGD/PGS 0%
Patient Diagnosis b
Tubal factor 33%Ovulatory dysfunction 22%Diminished ovarian reserve 22%Endometriosis 9%
Uterine factor 2%Male factor 35%Other factor 7%Unknown factor 13%
Multiple Factors: Female factors only 16%Female & male factors 16%
2014 ART SUCCESS RATES c Total number of cyclesd: 56 (includes 0 cycle[s] using frozen eggs)
Type of CycleAge of Woman
<35 35–37 38–40 41–42 43–44 >44Fresh Embryos from Nondonor Eggs
Number of cycles 19 10 2 4 0 0Percentage of cancellations before retrieval (%) 1 / 19 1 / 10 0 / 2 0 / 4 Average number of embryos transferred 2.1 2.0 2.0 2.5 Percentage of embryos transferred resulting in implantation (%) 37.8 7 / 14 0 / 4 0 / 5 Percentage of elective single embryo transfers (eSET) (%) 0 / 18 0 / 8 0 / 2 0 / 2
Outcomes per CyclePercentage of cycles resulting in term, normal weight & singleton live births
e (%) 4 / 19 0 / 10 0 / 2 0 / 4
Percentage of cycles resulting in singleton live births (%) 5 / 19 1 / 10 0 / 2 0 / 4 Percentage of cycles resulting in twin live births (%) 3 / 19 3 / 10 0 / 2 0 / 4 Percentage of cycles resulting in live births (%) 8 / 19 4 / 10 0 / 2 0 / 4 Percentage of cycles resulting in pregnancies (%) 10 / 19 5 / 10 0 / 2 0 / 4
Outcomes per TransferNumber of transfers 18 8 2 2 0 0Percentage of transfers resulting in term, normal weight & singleton live births
e (%) 4 / 18 0 / 8 0 / 2 0 / 2
Percentage of transfers resulting in singleton live births (%) 5 / 18 1 / 8 0 / 2 0 / 2 Percentage of transfers resulting in twin live births (%) 3 / 18 3 / 8 0 / 2 0 / 2 Percentage of transfers resulting in live births (%) 8 / 18 4 / 8 0 / 2 0 / 2 Percentage of transfers resulting in pregnancies (%) 10 / 18 5 / 8 0 / 2 0 / 2
Frozen Embryos from Nondonor EggsNumber of cycles 8 5 1 1 0 0Number of transfers 8 5 1 1 0 0Estimated average number of transfers per retrieval 8.0 1.7 1.0 Average number of embryos transferred 1.6 1.4 2.0 2.0 Percentage of embryos transferred resulting in implantation (%) 4 / 13 3 / 7 0 / 2 Percentage of transfers resulting in term, normal weight & singleton live births
e (%) 3 / 8 2 / 5 0 / 1 0 / 1
Percentage of transfers resulting in singleton live births (%) 4 / 8 2 / 5 0 / 1 0 / 1 Percentage of transfers resulting in twin live births (%) 0 / 8 0 / 5 0 / 1 0 / 1 Percentage of transfers resulting in live births (%) 4 / 8 2 / 5 0 / 1 0 / 1 Percentage of transfers resulting in pregnancies (%) 4 / 8 3 / 5 1 / 1 0 / 1
Number of Egg/Embryo Banking Cycles 0 1 0 0 0 0
Donor Eggs Fresh Embryosf Frozen Embryosf
Number of cycles 0 5Number of transfers 0 5Average number of embryos transferred 1.8Percentage of embryos transferred resulting in implantation (%) 3 / 9Percentage of transfers resulting in term, normal weight & singleton live births
e (%) 1 / 5
Percentage of transfers resulting in singleton live births (%) 2 / 5Percentage of transfers resulting in twin live births (%) 0 / 5Percentage of transfers resulting in live births (%) 2 / 5Percentage of transfers resulting in pregnancies (%) 3 / 5
CURRENT SERVICES & PROFILE
This clinic has closed since 2014. Information on current clinic services and profile therefore is not provided here. Contact the NASS Help Desk for further information.
a Reflects features of fresh nondonor cycles. If IVF is less than 100%, the remaining cycles are GIFT, ZIFT, or a combination of these procedures with IVF.
b Total patient diagnosis percentages may be greater than 100% because more than one diagnosis can be reported for each ART cycle.
c Fractions are used for rates with denominators less than 20. Multiple-infant births (for example, twins) with at least one live infant are counted as one live birth.
d Total cycle number includes those using frozen eggs. It excludes 0 cycle(s) evaluating new procedures. Both cycle types are excluded from ART success rates.
e In this report, births are defined as term if at least 37 full weeks gestation and normal birth weight if at least 2,500 grams (approximately 5 pounds, 8 ounces).
f All ages are reported together because previous data show that patient age does not materially affect success with donor eggs.

370
NO
RT
H C
AR
OLIN
A PREMIER FERTILITY CENTERHIGH POINT REGIONAL HEALTH SYSTEM
HIGH POINT, NORTH CAROLINAComparison of success rates across clinics may not be meaningful. Patient medical characteristics and treatment approaches vary (see pages 11–20).
Data verified by Jeffrey L. Deaton, MD2014 ART CYCLE PROFILE
Type of ART and Procedural Factors a
IVF 100%Unstimulated 0%Used gestational carrier 0%
With ICSI 80%PGD/PGS 0%
Patient Diagnosis b
Tubal factor 21%Ovulatory dysfunction 34%Diminished ovarian reserve 30%Endometriosis 6%
Uterine factor 0%Male factor 44%Other factor 10%Unknown factor 5%
Multiple Factors: Female factors only 17%Female & male factors 27%
2014 ART SUCCESS RATES c Total number of cyclesd: 121 (includes 3 cycle[s] using frozen eggs)
Type of CycleAge of Woman
<35 35–37 38–40 41–42 43–44 >44Fresh Embryos from Nondonor Eggs
Number of cycles 31 13 5 1 0 0Percentage of cancellations before retrieval (%) 6.5 0 / 13 1 / 5 0 / 1 Average number of embryos transferred 1.6 1.7 1.3 1.0 Percentage of embryos transferred resulting in implantation (%) 43.6 8 / 19 0 / 4 0 / 1 Percentage of elective single embryo transfers (eSET) (%) 43.5 2 / 10 0 / 1
Outcomes per CyclePercentage of cycles resulting in term, normal weight & singleton live births
e (%) 38.7 4 / 13 0 / 5 0 / 1
Percentage of cycles resulting in singleton live births (%) 41.9 5 / 13 0 / 5 0 / 1 Percentage of cycles resulting in twin live births (%) 3.2 1 / 13 0 / 5 0 / 1 Percentage of cycles resulting in live births (%) 45.2 6 / 13 0 / 5 0 / 1 Percentage of cycles resulting in pregnancies (%) 48.4 7 / 13 0 / 5 0 / 1
Outcomes per TransferNumber of transfers 25 11 3 1 0 0Percentage of transfers resulting in term, normal weight & singleton live births
e (%) 48.0 4 / 11 0 / 3 0 / 1
Percentage of transfers resulting in singleton live births (%) 52.0 5 / 11 0 / 3 0 / 1 Percentage of transfers resulting in twin live births (%) 4.0 1 / 11 0 / 3 0 / 1 Percentage of transfers resulting in live births (%) 56.0 6 / 11 0 / 3 0 / 1 Percentage of transfers resulting in pregnancies (%) 60.0 7 / 11 0 / 3 0 / 1
Frozen Embryos from Nondonor EggsNumber of cycles 31 10 5 0 1 0Number of transfers 29 8 5 0 0 0Estimated average number of transfers per retrieval 4.1 2.7 Average number of embryos transferred 1.6 1.4 1.4 Percentage of embryos transferred resulting in implantation (%) 26.7 2 / 11 1 / 7 Percentage of transfers resulting in term, normal weight & singleton live births
e (%) 27.6 1 / 8 0 / 5
Percentage of transfers resulting in singleton live births (%) 27.6 2 / 8 0 / 5 Percentage of transfers resulting in twin live births (%) 3.4 0 / 8 0 / 5 Percentage of transfers resulting in live births (%) 31.0 2 / 8 0 / 5 Percentage of transfers resulting in pregnancies (%) 37.9 2 / 8 1 / 5
Number of Egg/Embryo Banking Cycles 2 0 0 0 0 0
Donor Eggs Fresh Embryosf Frozen Embryosf
Number of cycles 7 12Number of transfers 5 11Average number of embryos transferred 1.6 1.5Percentage of embryos transferred resulting in implantation (%) 5 / 8 3 / 16Percentage of transfers resulting in term, normal weight & singleton live births
e (%) 3 / 5 2 / 11
Percentage of transfers resulting in singleton live births (%) 3 / 5 3 / 11Percentage of transfers resulting in twin live births (%) 1 / 5 0 / 11Percentage of transfers resulting in live births (%) 4 / 5 3 / 11Percentage of transfers resulting in pregnancies (%) 4 / 5 3 / 11
CURRENT SERVICES & PROFILE Current Name: Premier Fertility Center, High Point Regional Health System
Donor eggs? YesDonor embryos? Yes
Gestational carriers? YesEmbryo cryopreservation? Yes
Single women? YesSART member? Yes
Verified lab accreditation? Yes(See Appendix C for details.)
a Reflects features of fresh nondonor cycles. If IVF is less than 100%, the remaining cycles are GIFT, ZIFT, or a combination of these procedures with IVF.
b Total patient diagnosis percentages may be greater than 100% because more than one diagnosis can be reported for each ART cycle.
c Fractions are used for rates with denominators less than 20. Multiple-infant births (for example, twins) with at least one live infant are counted as one live birth.
d Total cycle number includes those using frozen eggs. It excludes 0 cycle(s) evaluating new procedures. Both cycle types are excluded from ART success rates.
e In this report, births are defined as term if at least 37 full weeks gestation and normal birth weight if at least 2,500 grams (approximately 5 pounds, 8 ounces).
f All ages are reported together because previous data show that patient age does not materially affect success with donor eggs.

371
NO
RT
H C
AR
OLIN
AADVANCED REPRODUCTIVE CONCEPTS
HUNTERSVILLE, NORTH CAROLINAComparison of success rates across clinics may not be meaningful. Patient medical characteristics and treatment approaches vary (see pages 11–20).
Data verified by Mark L. Jutras, MD2014 ART CYCLE PROFILE
Type of ART and Procedural Factors a
IVF 100%Unstimulated 0%Used gestational carrier 0%
With ICSI 83%PGD/PGS 0%
Patient Diagnosis b
Tubal factor 13%Ovulatory dysfunction 14%Diminished ovarian reserve 30%Endometriosis 5%
Uterine factor 4%Male factor 33%Other factor 5%Unknown factor 21%
Multiple Factors: Female factors only 10%Female & male factors 13%
2014 ART SUCCESS RATES c Total number of cyclesd: 110 (includes 0 cycle[s] using frozen eggs)
Type of CycleAge of Woman
<35 35–37 38–40 41–42 43–44 >44Fresh Embryos from Nondonor Eggs
Number of cycles 22 10 9 0 0 0Percentage of cancellations before retrieval (%) 4.5 3 / 10 1 / 9 Average number of embryos transferred 1.6 2.2 2.0 Percentage of embryos transferred resulting in implantation (%) 37.9 9 / 13 3 / 12 Percentage of elective single embryo transfers (eSET) (%) 5 / 17 0 / 6 0 / 5
Outcomes per CyclePercentage of cycles resulting in term, normal weight & singleton live births
e (%) 22.7 3 / 10 1 / 9
Percentage of cycles resulting in singleton live births (%) 22.7 3 / 10 3 / 9 Percentage of cycles resulting in twin live births (%) 9.1 2 / 10 0 / 9 Percentage of cycles resulting in live births (%) 31.8 5 / 10 3 / 9 Percentage of cycles resulting in pregnancies (%) 40.9 5 / 10 3 / 9
Outcomes per TransferNumber of transfers 19 6 6 0 0 0Percentage of transfers resulting in term, normal weight & singleton live births
e (%) 5 / 19 3 / 6 1 / 6
Percentage of transfers resulting in singleton live births (%) 5 / 19 3 / 6 3 / 6 Percentage of transfers resulting in twin live births (%) 2 / 19 2 / 6 0 / 6 Percentage of transfers resulting in live births (%) 7 / 19 5 / 6 3 / 6 Percentage of transfers resulting in pregnancies (%) 9 / 19 5 / 6 3 / 6
Frozen Embryos from Nondonor EggsNumber of cycles 15 6 10 2 0 0Number of transfers 15 6 10 2 0 0Estimated average number of transfers per retrieval 0.7 1.2 1.0 0.4 Average number of embryos transferred 1.8 1.7 1.5 1.5 Percentage of embryos transferred resulting in implantation (%) 61.5 7 / 10 3 / 15 2 / 3 Percentage of transfers resulting in term, normal weight & singleton live births
e (%) 4 / 15 2 / 6 2 / 10 2 / 2
Percentage of transfers resulting in singleton live births (%) 4 / 15 3 / 6 3 / 10 2 / 2 Percentage of transfers resulting in twin live births (%) 5 / 15 1 / 6 0 / 10 0 / 2 Percentage of transfers resulting in live births (%) 9 / 15 4 / 6 3 / 10 2 / 2 Percentage of transfers resulting in pregnancies (%) 11 / 15 6 / 6 3 / 10 2 / 2
Number of Egg/Embryo Banking Cycles 15 4 9 5 0 0
Donor Eggs Fresh Embryosf Frozen Embryosf
Number of cycles 0 3Number of transfers 0 2Average number of embryos transferred 1.5Percentage of embryos transferred resulting in implantation (%) 1 / 3Percentage of transfers resulting in term, normal weight & singleton live births
e (%) 1 / 2
Percentage of transfers resulting in singleton live births (%) 1 / 2Percentage of transfers resulting in twin live births (%) 0 / 2Percentage of transfers resulting in live births (%) 1 / 2Percentage of transfers resulting in pregnancies (%) 1 / 2
CURRENT SERVICES & PROFILE Current Name: Advanced Reproductive Concepts
Donor eggs? YesDonor embryos? Yes
Gestational carriers? YesEmbryo cryopreservation? Yes
Single women? NoSART member? Yes
Verified lab accreditation? Yes(See Appendix C for details.)
a Reflects features of fresh nondonor cycles. If IVF is less than 100%, the remaining cycles are GIFT, ZIFT, or a combination of these procedures with IVF.
b Total patient diagnosis percentages may be greater than 100% because more than one diagnosis can be reported for each ART cycle.
c Fractions are used for rates with denominators less than 20. Multiple-infant births (for example, twins) with at least one live infant are counted as one live birth.
d Total cycle number includes those using frozen eggs. It excludes 0 cycle(s) evaluating new procedures. Both cycle types are excluded from ART success rates.
e In this report, births are defined as term if at least 37 full weeks gestation and normal birth weight if at least 2,500 grams (approximately 5 pounds, 8 ounces).
f All ages are reported together because previous data show that patient age does not materially affect success with donor eggs.

372
NO
RT
H C
AR
OLIN
A ATLANTIC REPRODUCTIVE MEDICINE SPECIALISTSRALEIGH, NORTH CAROLINA
Comparison of success rates across clinics may not be meaningful. Patient medical characteristics and treatment approaches vary (see pages 11–20).
Data verified by Susannah D. Copland, MD2014 ART CYCLE PROFILE
Type of ART and Procedural Factors a
IVF 100%Unstimulated 0%Used gestational carrier 0%
With ICSI 72%PGD/PGS 3%
Patient Diagnosis b
Tubal factor 7%Ovulatory dysfunction 19%Diminished ovarian reserve 38%Endometriosis 4%
Uterine factor 6%Male factor 34%Other factor 19%Unknown factor 6%
Multiple Factors: Female factors only 15%Female & male factors 15%
2014 ART SUCCESS RATES c Total number of cyclesd: 220 (includes 0 cycle[s] using frozen eggs)
Type of CycleAge of Woman
<35 35–37 38–40 41–42 43–44 >44Fresh Embryos from Nondonor Eggs
Number of cycles 30 28 23 7 3 1Percentage of cancellations before retrieval (%) 6.7 21.4 26.1 0 / 7 2 / 3 1 / 1Average number of embryos transferred 1.2 1.5 1.7 1.8 Percentage of embryos transferred resulting in implantation (%) 43.5 45.5 30.0 0 / 9 Percentage of elective single embryo transfers (eSET) (%) 13 / 17 1 / 9 1 / 8 0 / 4
Outcomes per CyclePercentage of cycles resulting in term, normal weight & singleton live births
e (%) 20.0 10.7 17.4 0 / 7 0 / 3 0 / 1
Percentage of cycles resulting in singleton live births (%) 23.3 14.3 17.4 0 / 7 0 / 3 0 / 1Percentage of cycles resulting in twin live births (%) 3.3 7.1 0.0 0 / 7 0 / 3 0 / 1Percentage of cycles resulting in live births (%) 26.7 21.4 17.4 0 / 7 0 / 3 0 / 1Percentage of cycles resulting in pregnancies (%) 36.7 28.6 26.1 0 / 7 0 / 3 0 / 1
Outcomes per TransferNumber of transfers 21 15 12 5 0 0Percentage of transfers resulting in term, normal weight & singleton live births
e (%) 28.6 3 / 15 4 / 12 0 / 5
Percentage of transfers resulting in singleton live births (%) 33.3 4 / 15 4 / 12 0 / 5 Percentage of transfers resulting in twin live births (%) 4.8 2 / 15 0 / 12 0 / 5 Percentage of transfers resulting in live births (%) 38.1 6 / 15 4 / 12 0 / 5 Percentage of transfers resulting in pregnancies (%) 52.4 8 / 15 6 / 12 0 / 5
Frozen Embryos from Nondonor EggsNumber of cycles 26 15 9 1 0 0Number of transfers 26 15 8 1 0 0Estimated average number of transfers per retrieval 1.0 1.0 0.6 0.2 0.0 0.0Average number of embryos transferred 1.6 1.5 1.6 1.0 Percentage of embryos transferred resulting in implantation (%) 34.1 33.3 1 / 11 0 / 1 Percentage of transfers resulting in term, normal weight & singleton live births
e (%) 26.9 5 / 15 1 / 8 0 / 1
Percentage of transfers resulting in singleton live births (%) 34.6 5 / 15 1 / 8 0 / 1 Percentage of transfers resulting in twin live births (%) 3.8 0 / 15 0 / 8 0 / 1 Percentage of transfers resulting in live births (%) 38.5 5 / 15 1 / 8 0 / 1 Percentage of transfers resulting in pregnancies (%) 50.0 6 / 15 2 / 8 0 / 1
Number of Egg/Embryo Banking Cycles 14 14 12 6 7 1
Donor Eggs Fresh Embryosf Frozen Embryosf
Number of cycles 14 9Number of transfers 13 9Average number of embryos transferred 1.1 1.7Percentage of embryos transferred resulting in implantation (%) 11 / 13 4 / 14Percentage of transfers resulting in term, normal weight & singleton live births
e (%) 6 / 13 3 / 9
Percentage of transfers resulting in singleton live births (%) 9 / 13 3 / 9Percentage of transfers resulting in twin live births (%) 1 / 13 0 / 9Percentage of transfers resulting in live births (%) 10 / 13 3 / 9Percentage of transfers resulting in pregnancies (%) 11 / 13 5 / 9
CURRENT SERVICES & PROFILE Current Name: Atlantic Reproductive Medicine Specialists
Donor eggs? YesDonor embryos? Yes
Gestational carriers? YesEmbryo cryopreservation? Yes
Single women? YesSART member? Yes
Verified lab accreditation? Yes(See Appendix C for details.)
a Reflects features of fresh nondonor cycles. If IVF is less than 100%, the remaining cycles are GIFT, ZIFT, or a combination of these procedures with IVF.
b Total patient diagnosis percentages may be greater than 100% because more than one diagnosis can be reported for each ART cycle.
c Fractions are used for rates with denominators less than 20. Multiple-infant births (for example, twins) with at least one live infant are counted as one live birth.
d Total cycle number includes those using frozen eggs. It excludes 0 cycle(s) evaluating new procedures. Both cycle types are excluded from ART success rates.
e In this report, births are defined as term if at least 37 full weeks gestation and normal birth weight if at least 2,500 grams (approximately 5 pounds, 8 ounces).
f All ages are reported together because previous data show that patient age does not materially affect success with donor eggs.

373
NO
RT
H C
AR
OLIN
ACAROLINA CONCEPTIONS, PARALEIGH, NORTH CAROLINA
Comparison of success rates across clinics may not be meaningful. Patient medical characteristics and treatment approaches vary (see pages 11–20).
Data verified by John K. Park, MD2014 ART CYCLE PROFILE
Type of ART and Procedural Factors a
IVF 100%Unstimulated 0%Used gestational carrier 2%
With ICSI 84%PGD/PGS 15%
Patient Diagnosis b
Tubal factor 13%Ovulatory dysfunction 17%Diminished ovarian reserve 37%Endometriosis 8%
Uterine factor 7%Male factor 35%Other factor 11%Unknown factor 10%
Multiple Factors: Female factors only 11%Female & male factors 22%
2014 ART SUCCESS RATES c Total number of cyclesd: 665 (includes 3 cycle[s] using frozen eggs)
Type of CycleAge of Woman
<35 35–37 38–40 41–42 43–44 >44Fresh Embryos from Nondonor Eggs
Number of cycles 160 72 55 16 7 0Percentage of cancellations before retrieval (%) 7.5 16.7 14.5 3 / 16 2 / 7 Average number of embryos transferred 1.8 1.7 1.9 2.8 2.5 Percentage of embryos transferred resulting in implantation (%) 41.0 41.0 32.9 2.9 3 / 10 Percentage of elective single embryo transfers (eSET) (%) 18.5 27.3 21.9 0 / 11 0 / 3
Outcomes per CyclePercentage of cycles resulting in term, normal weight & singleton live births
e (%) 20.6 23.6 21.8 1 / 16 1 / 7
Percentage of cycles resulting in singleton live births (%) 24.4 25.0 25.5 1 / 16 2 / 7 Percentage of cycles resulting in twin live births (%) 13.1 8.3 5.5 0 / 16 0 / 7 Percentage of cycles resulting in live births (%) 38.8 33.3 30.9 1 / 16 2 / 7 Percentage of cycles resulting in pregnancies (%) 42.5 40.3 36.4 1 / 16 3 / 7
Outcomes per TransferNumber of transfers 135 51 38 12 4 0Percentage of transfers resulting in term, normal weight & singleton live births
e (%) 24.4 33.3 31.6 1 / 12 1 / 4
Percentage of transfers resulting in singleton live births (%) 28.9 35.3 36.8 1 / 12 2 / 4 Percentage of transfers resulting in twin live births (%) 15.6 11.8 7.9 0 / 12 0 / 4 Percentage of transfers resulting in live births (%) 45.9 47.1 44.7 1 / 12 2 / 4 Percentage of transfers resulting in pregnancies (%) 50.4 56.9 52.6 1 / 12 3 / 4
Frozen Embryos from Nondonor EggsNumber of cycles 66 42 28 7 1 0Number of transfers 64 37 26 7 1 0Estimated average number of transfers per retrieval 1.2 1.0 1.6 2.3 0.5 0.0Average number of embryos transferred 1.5 1.5 1.6 2.1 1.0 Percentage of embryos transferred resulting in implantation (%) 48.0 42.6 19.5 4 / 15 1 / 1 Percentage of transfers resulting in term, normal weight & singleton live births
e (%) 25.0 35.1 15.4 1 / 7 0 / 1
Percentage of transfers resulting in singleton live births (%) 35.9 40.5 15.4 2 / 7 0 / 1 Percentage of transfers resulting in twin live births (%) 14.1 8.1 3.8 0 / 7 0 / 1 Percentage of transfers resulting in live births (%) 50.0 48.6 19.2 2 / 7 0 / 1 Percentage of transfers resulting in pregnancies (%) 56.3 54.1 26.9 2 / 7 1 / 1
Number of Egg/Embryo Banking Cycles 20 18 12 2 2 1
Donor Eggs Fresh Embryosf Frozen Embryosf
Number of cycles 71 82Number of transfers 67 78Average number of embryos transferred 1.7 1.8Percentage of embryos transferred resulting in implantation (%) 52.3 33.6Percentage of transfers resulting in term, normal weight & singleton live births
e (%) 31.3 28.2
Percentage of transfers resulting in singleton live births (%) 40.3 35.9Percentage of transfers resulting in twin live births (%) 19.4 7.7Percentage of transfers resulting in live births (%) 59.7 43.6Percentage of transfers resulting in pregnancies (%) 65.7 47.4
CURRENT SERVICES & PROFILE Current Name: Carolina Conceptions, PA
Donor eggs? YesDonor embryos? Yes
Gestational carriers? YesEmbryo cryopreservation? Yes
Single women? YesSART member? Yes
Verified lab accreditation? Yes(See Appendix C for details.)
a Reflects features of fresh nondonor cycles. If IVF is less than 100%, the remaining cycles are GIFT, ZIFT, or a combination of these procedures with IVF.
b Total patient diagnosis percentages may be greater than 100% because more than one diagnosis can be reported for each ART cycle.
c Fractions are used for rates with denominators less than 20. Multiple-infant births (for example, twins) with at least one live infant are counted as one live birth.
d Total cycle number includes those using frozen eggs. It excludes 0 cycle(s) evaluating new procedures. Both cycle types are excluded from ART success rates.
e In this report, births are defined as term if at least 37 full weeks gestation and normal birth weight if at least 2,500 grams (approximately 5 pounds, 8 ounces).
f All ages are reported together because previous data show that patient age does not materially affect success with donor eggs.

374
NO
RT
H C
AR
OLIN
A UNC FERTILITYRALEIGH, NORTH CAROLINA
Comparison of success rates across clinics may not be meaningful. Patient medical characteristics and treatment approaches vary (see pages 11–20).
Data verified by Jennifer E. Mersereau, MD2014 ART CYCLE PROFILE
Type of ART and Procedural Factors a
IVF 100%Unstimulated 0%Used gestational carrier <1%
With ICSI 56%PGD/PGS 2%
Patient Diagnosis b
Tubal factor 17%Ovulatory dysfunction 11%Diminished ovarian reserve 23%Endometriosis 7%
Uterine factor 2%Male factor 35%Other factor 12%Unknown factor 15%
Multiple Factors: Female factors only 5%Female & male factors 15%
2014 ART SUCCESS RATES c Total number of cyclesd: 301 (includes 18 cycle[s] using frozen eggs)
Type of CycleAge of Woman
<35 35–37 38–40 41–42 43–44 >44Fresh Embryos from Nondonor Eggs
Number of cycles 72 50 31 9 1 0Percentage of cancellations before retrieval (%) 16.7 24.0 16.1 1 / 9 0 / 1 Average number of embryos transferred 1.2 1.7 2.4 3.4 Percentage of embryos transferred resulting in implantation (%) 66.2 42.9 15.8 16.7 Percentage of elective single embryo transfers (eSET) (%) 76.9 25.8 0.0 0 / 7
Outcomes per CyclePercentage of cycles resulting in term, normal weight & singleton live births
e (%) 43.1 16.0 19.4 2 / 9 0 / 1
Percentage of cycles resulting in singleton live births (%) 50.0 18.0 19.4 2 / 9 0 / 1 Percentage of cycles resulting in twin live births (%) 2.8 10.0 3.2 0 / 9 0 / 1 Percentage of cycles resulting in live births (%) 52.8 28.0 22.6 2 / 9 0 / 1 Percentage of cycles resulting in pregnancies (%) 58.3 44.0 29.0 4 / 9 0 / 1
Outcomes per TransferNumber of transfers 54 35 25 7 0 0Percentage of transfers resulting in term, normal weight & singleton live births
e (%) 57.4 22.9 24.0 2 / 7
Percentage of transfers resulting in singleton live births (%) 66.7 25.7 24.0 2 / 7 Percentage of transfers resulting in twin live births (%) 3.7 14.3 4.0 0 / 7 Percentage of transfers resulting in live births (%) 70.4 40.0 28.0 2 / 7 Percentage of transfers resulting in pregnancies (%) 77.8 62.9 36.0 4 / 7
Frozen Embryos from Nondonor EggsNumber of cycles 32 14 17 2 2 0Number of transfers 31 12 16 1 2 0Estimated average number of transfers per retrieval 1.2 1.1 1.3 Average number of embryos transferred 1.6 1.9 1.7 3.0 2.0 Percentage of embryos transferred resulting in implantation (%) 53.2 26.1 31.8 0 / 3 1 / 4 Percentage of transfers resulting in term, normal weight & singleton live births
e (%) 25.8 2 / 12 7 / 16 0 / 1 1 / 2
Percentage of transfers resulting in singleton live births (%) 32.3 2 / 12 7 / 16 0 / 1 1 / 2 Percentage of transfers resulting in twin live births (%) 19.4 1 / 12 0 / 16 0 / 1 0 / 2 Percentage of transfers resulting in live births (%) 51.6 3 / 12 7 / 16 0 / 1 1 / 2 Percentage of transfers resulting in pregnancies (%) 61.3 5 / 12 10 / 16 0 / 1 1 / 2
Number of Egg/Embryo Banking Cycles 10 4 1 0 0 0
Donor Eggs Fresh Embryosf Frozen Embryosf
Number of cycles 10 28Number of transfers 8 23Average number of embryos transferred 1.4 1.7Percentage of embryos transferred resulting in implantation (%) 7 / 10 36.1Percentage of transfers resulting in term, normal weight & singleton live births
e (%) 4 / 8 8.7
Percentage of transfers resulting in singleton live births (%) 5 / 8 26.1Percentage of transfers resulting in twin live births (%) 1 / 8 8.7Percentage of transfers resulting in live births (%) 6 / 8 34.8Percentage of transfers resulting in pregnancies (%) 7 / 8 52.2
CURRENT SERVICES & PROFILE Current Name: UNC Fertility
Donor eggs? YesDonor embryos? No
Gestational carriers? YesEmbryo cryopreservation? Yes
Single women? YesSART member? Yes
Verified lab accreditation? Yes(See Appendix C for details.)
a Reflects features of fresh nondonor cycles. If IVF is less than 100%, the remaining cycles are GIFT, ZIFT, or a combination of these procedures with IVF.
b Total patient diagnosis percentages may be greater than 100% because more than one diagnosis can be reported for each ART cycle.
c Fractions are used for rates with denominators less than 20. Multiple-infant births (for example, twins) with at least one live infant are counted as one live birth.
d Total cycle number includes those using frozen eggs. It excludes 0 cycle(s) evaluating new procedures. Both cycle types are excluded from ART success rates.
e In this report, births are defined as term if at least 37 full weeks gestation and normal birth weight if at least 2,500 grams (approximately 5 pounds, 8 ounces).
f All ages are reported together because previous data show that patient age does not materially affect success with donor eggs.

375
NO
RT
H C
AR
OLIN
AWAKE FOREST UNIVERSITY CENTER FOR REPRODUCTIVE MEDICINE
WINSTON-SALEM, NORTH CAROLINAComparison of success rates across clinics may not be meaningful. Patient medical characteristics and treatment approaches vary (see pages 11–20).
Data verified by Erika B. Johnston-Macananny, MD2014 ART CYCLE PROFILE
Type of ART and Procedural Factors a
IVF 100%Unstimulated 0%Used gestational carrier 0%
With ICSI 80%PGD/PGS 1%
Patient Diagnosis b
Tubal factor 14%Ovulatory dysfunction 18%Diminished ovarian reserve 14%Endometriosis 14%
Uterine factor 3%Male factor 29%Other factor 11%Unknown factor 20%
Multiple Factors: Female factors only 8%Female & male factors 11%
2014 ART SUCCESS RATES c Total number of cyclesd: 394 (includes 0 cycle[s] using frozen eggs)
Type of CycleAge of Woman
<35 35–37 38–40 41–42 43–44 >44Fresh Embryos from Nondonor Eggs
Number of cycles 88 49 37 6 5 0Percentage of cancellations before retrieval (%) 1.1 4.1 13.5 1 / 6 0 / 5 Average number of embryos transferred 1.7 2.1 2.4 3.0 3.3 Percentage of embryos transferred resulting in implantation (%) 45.5 35.4 16.4 1 / 9 0 / 13 Percentage of elective single embryo transfers (eSET) (%) 31.6 7.9 0.0 0 / 3 0 / 4
Outcomes per CyclePercentage of cycles resulting in term, normal weight & singleton live births
e (%) 29.5 28.6 18.9 1 / 6 0 / 5
Percentage of cycles resulting in singleton live births (%) 36.4 34.7 21.6 1 / 6 0 / 5 Percentage of cycles resulting in twin live births (%) 13.6 10.2 2.7 0 / 6 0 / 5 Percentage of cycles resulting in live births (%) 50.0 44.9 24.3 1 / 6 0 / 5 Percentage of cycles resulting in pregnancies (%) 53.4 51.0 27.0 1 / 6 0 / 5
Outcomes per TransferNumber of transfers 80 40 28 3 4 0Percentage of transfers resulting in term, normal weight & singleton live births
e (%) 32.5 35.0 25.0 1 / 3 0 / 4
Percentage of transfers resulting in singleton live births (%) 40.0 42.5 28.6 1 / 3 0 / 4 Percentage of transfers resulting in twin live births (%) 15.0 12.5 3.6 0 / 3 0 / 4 Percentage of transfers resulting in live births (%) 55.0 55.0 32.1 1 / 3 0 / 4 Percentage of transfers resulting in pregnancies (%) 58.8 62.5 35.7 1 / 3 0 / 4
Frozen Embryos from Nondonor EggsNumber of cycles 62 35 27 15 2 0Number of transfers 57 31 22 14 2 0Estimated average number of transfers per retrieval 1.8 1.4 1.1 1.3 0.0Average number of embryos transferred 1.7 1.7 1.8 1.8 2.0 Percentage of embryos transferred resulting in implantation (%) 40.7 36.2 25.7 13.0 1 / 4 Percentage of transfers resulting in term, normal weight & singleton live births
e (%) 28.1 25.8 9.1 1 / 14 1 / 2
Percentage of transfers resulting in singleton live births (%) 29.8 32.3 22.7 3 / 14 1 / 2 Percentage of transfers resulting in twin live births (%) 14.0 6.5 9.1 0 / 14 0 / 2 Percentage of transfers resulting in live births (%) 43.9 38.7 31.8 3 / 14 1 / 2 Percentage of transfers resulting in pregnancies (%) 56.1 58.1 40.9 4 / 14 1 / 2
Number of Egg/Embryo Banking Cycles 5 11 16 10 0 1
Donor Eggs Fresh Embryosf Frozen Embryosf
Number of cycles 8 17Number of transfers 7 17Average number of embryos transferred 1.7 1.6Percentage of embryos transferred resulting in implantation (%) 5 / 12 34.6Percentage of transfers resulting in term, normal weight & singleton live births
e (%) 1 / 7 4 / 17
Percentage of transfers resulting in singleton live births (%) 1 / 7 7 / 17Percentage of transfers resulting in twin live births (%) 2 / 7 1 / 17Percentage of transfers resulting in live births (%) 3 / 7 8 / 17Percentage of transfers resulting in pregnancies (%) 3 / 7 9 / 17
CURRENT SERVICES & PROFILE This clinic has reorganized since 2014. Contact the NASS Help Desk for further information.
Current Name: Wake Forest University Center for Reproductive Medicine
Donor eggs? YesDonor embryos? Yes
Gestational carriers? NoEmbryo cryopreservation? Yes
Single women? YesSART member? Yes
Verified lab accreditation? Yes(See Appendix C for details.)
a Reflects features of fresh nondonor cycles. If IVF is less than 100%, the remaining cycles are GIFT, ZIFT, or a combination of these procedures with IVF.
b Total patient diagnosis percentages may be greater than 100% because more than one diagnosis can be reported for each ART cycle.
c Fractions are used for rates with denominators less than 20. Multiple-infant births (for example, twins) with at least one live infant are counted as one live birth.
d Total cycle number includes those using frozen eggs. It excludes 0 cycle(s) evaluating new procedures. Both cycle types are excluded from ART success rates.
e In this report, births are defined as term if at least 37 full weeks gestation and normal birth weight if at least 2,500 grams (approximately 5 pounds, 8 ounces).
f All ages are reported together because previous data show that patient age does not materially affect success with donor eggs.

376
NO
RT
H D
AK
OTA
SANFORD HEALTH REPRODUCTIVE MEDICINE INSTITUTEFARGO, NORTH DAKOTA
Comparison of success rates across clinics may not be meaningful. Patient medical characteristics and treatment approaches vary (see pages 11–20).
Data verified by Steffen P. Christensen, MD2014 ART CYCLE PROFILE
Type of ART and Procedural Factors a
IVF 100%Unstimulated 0%Used gestational carrier <1%
With ICSI 76%PGD/PGS 3%
Patient Diagnosis b
Tubal factor 19%Ovulatory dysfunction 15%Diminished ovarian reserve 9%Endometriosis 11%
Uterine factor 2%Male factor 50%Other factor 12%Unknown factor 13%
Multiple Factors: Female factors only 9%Female & male factors 17%
2014 ART SUCCESS RATES c Total number of cyclesd: 256 (includes 1 cycle[s] using frozen eggs)
Type of CycleAge of Woman
<35 35–37 38–40 41–42 43–44 >44Fresh Embryos from Nondonor Eggs
Number of cycles 87 27 27 12 2 0Percentage of cancellations before retrieval (%) 10.3 18.5 22.2 2 / 12 0 / 2 Average number of embryos transferred 1.8 1.8 2.0 2.3 4.0 Percentage of embryos transferred resulting in implantation (%) 31.6 37.9 33.3 4.8 0 / 4 Percentage of elective single embryo transfers (eSET) (%) 17.5 1 / 14 1 / 17 0 / 9 0 / 1
Outcomes per CyclePercentage of cycles resulting in term, normal weight & singleton live births
e (%) 20.7 14.8 14.8 0 / 12 0 / 2
Percentage of cycles resulting in singleton live births (%) 21.8 22.2 22.2 1 / 12 0 / 2 Percentage of cycles resulting in twin live births (%) 4.6 3.7 3.7 0 / 12 0 / 2 Percentage of cycles resulting in live births (%) 26.4 25.9 25.9 1 / 12 0 / 2 Percentage of cycles resulting in pregnancies (%) 35.6 29.6 37.0 1 / 12 0 / 2
Outcomes per TransferNumber of transfers 63 16 18 9 1 0Percentage of transfers resulting in term, normal weight & singleton live births
e (%) 28.6 4 / 16 4 / 18 0 / 9 0 / 1
Percentage of transfers resulting in singleton live births (%) 30.2 6 / 16 6 / 18 1 / 9 0 / 1 Percentage of transfers resulting in twin live births (%) 6.3 1 / 16 1 / 18 0 / 9 0 / 1 Percentage of transfers resulting in live births (%) 36.5 7 / 16 7 / 18 1 / 9 0 / 1 Percentage of transfers resulting in pregnancies (%) 49.2 8 / 16 10 / 18 1 / 9 0 / 1
Frozen Embryos from Nondonor EggsNumber of cycles 52 21 12 1 0 0Number of transfers 52 20 10 1 0 0Estimated average number of transfers per retrieval 2.4 1.5 2.5 Average number of embryos transferred 1.8 1.7 1.8 1.0 Percentage of embryos transferred resulting in implantation (%) 41.1 22.6 3 / 18 0 / 1 Percentage of transfers resulting in term, normal weight & singleton live births
e (%) 36.5 20.0 3 / 10 0 / 1
Percentage of transfers resulting in singleton live births (%) 40.4 20.0 3 / 10 0 / 1 Percentage of transfers resulting in twin live births (%) 1.9 5.0 0 / 10 0 / 1 Percentage of transfers resulting in live births (%) 42.3 25.0 3 / 10 0 / 1 Percentage of transfers resulting in pregnancies (%) 61.5 35.0 3 / 10 0 / 1
Number of Egg/Embryo Banking Cycles 2 4 1 0 0 0
Donor Eggs Fresh Embryosf Frozen Embryosf
Number of cycles 4 3Number of transfers 2 3Average number of embryos transferred 2.0 1.7Percentage of embryos transferred resulting in implantation (%) 3 / 4 0 / 3Percentage of transfers resulting in term, normal weight & singleton live births
e (%) 1 / 2 0 / 3
Percentage of transfers resulting in singleton live births (%) 1 / 2 0 / 3Percentage of transfers resulting in twin live births (%) 1 / 2 0 / 3Percentage of transfers resulting in live births (%) 2 / 2 0 / 3Percentage of transfers resulting in pregnancies (%) 2 / 2 1 / 3
CURRENT SERVICES & PROFILE Current Name: Sanford Health Reproductive Medicine Institute
Donor eggs? YesDonor embryos? No
Gestational carriers? YesEmbryo cryopreservation? Yes
Single women? YesSART member? Yes
Verified lab accreditation? Yes(See Appendix C for details.)
a Reflects features of fresh nondonor cycles. If IVF is less than 100%, the remaining cycles are GIFT, ZIFT, or a combination of these procedures with IVF.
b Total patient diagnosis percentages may be greater than 100% because more than one diagnosis can be reported for each ART cycle.
c Fractions are used for rates with denominators less than 20. Multiple-infant births (for example, twins) with at least one live infant are counted as one live birth.
d Total cycle number includes those using frozen eggs. It excludes 0 cycle(s) evaluating new procedures. Both cycle types are excluded from ART success rates.
e In this report, births are defined as term if at least 37 full weeks gestation and normal birth weight if at least 2,500 grams (approximately 5 pounds, 8 ounces).
f All ages are reported together because previous data show that patient age does not materially affect success with donor eggs.

377
OH
IOFERTILITY UNLIMITED, INC.
NORTHEASTERN OHIO FERTILITY CENTERAKRON, OHIO
Comparison of success rates across clinics may not be meaningful. Patient medical characteristics and treatment approaches vary (see pages 11–20).
Data verified by Nicholas J. Spirtos, DO2014 ART CYCLE PROFILE
Type of ART and Procedural Factors a
IVF 100%Unstimulated 0%Used gestational carrier 0%
With ICSI 50%PGD/PGS 0%
Patient Diagnosis b
Tubal factor 30%Ovulatory dysfunction 5%Diminished ovarian reserve 50%Endometriosis 35%
Uterine factor 0%Male factor 35%Other factor 40%Unknown factor 0%
Multiple Factors: Female factors only 45%Female & male factors 25%
2014 ART SUCCESS RATES c Total number of cyclesd: 23 (includes 0 cycle[s] using frozen eggs)
Type of CycleAge of Woman
<35 35–37 38–40 41–42 43–44 >44Fresh Embryos from Nondonor Eggs
Number of cycles 3 4 2 1 0 0Percentage of cancellations before retrieval (%) 0 / 3 0 / 4 0 / 2 0 / 1 Average number of embryos transferred 2.0 2.3 3.0 Percentage of embryos transferred resulting in implantation (%) 3 / 6 3 / 9 0 / 3 Percentage of elective single embryo transfers (eSET) (%) 0 / 3 0 / 4 0 / 1
Outcomes per CyclePercentage of cycles resulting in term, normal weight & singleton live births
e (%) 1 / 3 2 / 4 0 / 2 0 / 1
Percentage of cycles resulting in singleton live births (%) 1 / 3 3 / 4 0 / 2 0 / 1 Percentage of cycles resulting in twin live births (%) 1 / 3 0 / 4 0 / 2 0 / 1 Percentage of cycles resulting in live births (%) 2 / 3 3 / 4 0 / 2 0 / 1 Percentage of cycles resulting in pregnancies (%) 2 / 3 3 / 4 0 / 2 0 / 1
Outcomes per TransferNumber of transfers 3 4 0 1 0 0Percentage of transfers resulting in term, normal weight & singleton live births
e (%) 1 / 3 2 / 4 0 / 1
Percentage of transfers resulting in singleton live births (%) 1 / 3 3 / 4 0 / 1 Percentage of transfers resulting in twin live births (%) 1 / 3 0 / 4 0 / 1 Percentage of transfers resulting in live births (%) 2 / 3 3 / 4 0 / 1 Percentage of transfers resulting in pregnancies (%) 2 / 3 3 / 4 0 / 1
Frozen Embryos from Nondonor EggsNumber of cycles 1 0 2 0 0 0Number of transfers 1 0 2 0 0 0Estimated average number of transfers per retrieval 1.0 0.7 Average number of embryos transferred 2.0 2.0 Percentage of embryos transferred resulting in implantation (%) 1 / 2 0 / 4 Percentage of transfers resulting in term, normal weight & singleton live births
e (%) 1 / 1 0 / 2
Percentage of transfers resulting in singleton live births (%) 1 / 1 0 / 2 Percentage of transfers resulting in twin live births (%) 0 / 1 0 / 2 Percentage of transfers resulting in live births (%) 1 / 1 0 / 2 Percentage of transfers resulting in pregnancies (%) 1 / 1 0 / 2
Number of Egg/Embryo Banking Cycles 1 0 2 0 0 0
Donor Eggs Fresh Embryosf Frozen Embryosf
Number of cycles 7 0Number of transfers 7 0Average number of embryos transferred 1.9 Percentage of embryos transferred resulting in implantation (%) 7 / 13 Percentage of transfers resulting in term, normal weight & singleton live births
e (%) 3 / 7
Percentage of transfers resulting in singleton live births (%) 3 / 7 Percentage of transfers resulting in twin live births (%) 1 / 7 Percentage of transfers resulting in live births (%) 4 / 7 Percentage of transfers resulting in pregnancies (%) 4 / 7
CURRENT SERVICES & PROFILE Current Name: Fertility Unlimited, Inc., Northeastern Ohio Fertility Center
Donor eggs? YesDonor embryos? Yes
Gestational carriers? YesEmbryo cryopreservation? Yes
Single women? YesSART member? Yes
Verified lab accreditation? Yes(See Appendix C for details.)
a Reflects features of fresh nondonor cycles. If IVF is less than 100%, the remaining cycles are GIFT, ZIFT, or a combination of these procedures with IVF.
b Total patient diagnosis percentages may be greater than 100% because more than one diagnosis can be reported for each ART cycle.
c Fractions are used for rates with denominators less than 20. Multiple-infant births (for example, twins) with at least one live infant are counted as one live birth.
d Total cycle number includes those using frozen eggs. It excludes 0 cycle(s) evaluating new procedures. Both cycle types are excluded from ART success rates.
e In this report, births are defined as term if at least 37 full weeks gestation and normal birth weight if at least 2,500 grams (approximately 5 pounds, 8 ounces).
f All ages are reported together because previous data show that patient age does not materially affect success with donor eggs.

378
OH
IOREPRODUCTIVE GYNECOLOGY, INC.-AKRON
AKRON, OHIOComparison of success rates across clinics may not be meaningful. Patient medical characteristics and treatment approaches vary (see pages 11–20).
Data verified by Richard W. Moretuzzo, MD2014 ART CYCLE PROFILE
Type of ART and Procedural Factors a
IVF 100%Unstimulated 0%Used gestational carrier 0%
With ICSI 77%PGD/PGS 3%
Patient Diagnosis b
Tubal factor 24%Ovulatory dysfunction 24%Diminished ovarian reserve 29%Endometriosis 24%
Uterine factor 11%Male factor 62%Other factor 8%Unknown factor 1%
Multiple Factors: Female factors only 17%Female & male factors 42%
2014 ART SUCCESS RATES c Total number of cyclesd: 419 (includes 0 cycle[s] using frozen eggs)
Type of CycleAge of Woman
<35 35–37 38–40 41–42 43–44 >44Fresh Embryos from Nondonor Eggs
Number of cycles 138 43 44 2 5 0Percentage of cancellations before retrieval (%) 2.9 9.3 11.4 0 / 2 0 / 5 Average number of embryos transferred 2.0 2.0 2.9 3.5 4.8 Percentage of embryos transferred resulting in implantation (%) 28.0 19.4 9.3 1 / 5 0 / 19 Percentage of elective single embryo transfers (eSET) (%) 4.4 6.9 0.0 0 / 2 0 / 4
Outcomes per CyclePercentage of cycles resulting in term, normal weight & singleton live births
e (%) 20.3 16.3 6.8 1 / 2 0 / 5
Percentage of cycles resulting in singleton live births (%) 23.2 18.6 11.4 1 / 2 0 / 5 Percentage of cycles resulting in twin live births (%) 10.1 4.7 2.3 0 / 2 0 / 5 Percentage of cycles resulting in live births (%) 33.3 23.3 13.6 1 / 2 0 / 5 Percentage of cycles resulting in pregnancies (%) 37.7 27.9 18.2 2 / 2 0 / 5
Outcomes per TransferNumber of transfers 119 36 34 2 4 0Percentage of transfers resulting in term, normal weight & singleton live births
e (%) 23.5 19.4 8.8 1 / 2 0 / 4
Percentage of transfers resulting in singleton live births (%) 26.9 22.2 14.7 1 / 2 0 / 4 Percentage of transfers resulting in twin live births (%) 11.8 5.6 2.9 0 / 2 0 / 4 Percentage of transfers resulting in live births (%) 38.7 27.8 17.6 1 / 2 0 / 4 Percentage of transfers resulting in pregnancies (%) 43.7 33.3 23.5 2 / 2 0 / 4
Frozen Embryos from Nondonor EggsNumber of cycles 96 17 9 1 1 1Number of transfers 92 16 8 1 1 1Estimated average number of transfers per retrieval 1.5 0.9 1.1 0.5 1.0 Average number of embryos transferred 1.9 1.6 2.3 2.0 3.0 1.0Percentage of embryos transferred resulting in implantation (%) 47.5 56.5 5 / 16 0 / 2 1 / 3 0 / 1Percentage of transfers resulting in term, normal weight & singleton live births
e (%) 30.4 6 / 16 1 / 8 0 / 1 0 / 1 0 / 1
Percentage of transfers resulting in singleton live births (%) 34.8 7 / 16 1 / 8 0 / 1 0 / 1 0 / 1Percentage of transfers resulting in twin live births (%) 17.4 2 / 16 1 / 8 0 / 1 0 / 1 0 / 1Percentage of transfers resulting in live births (%) 53.3 9 / 16 2 / 8 0 / 1 0 / 1 0 / 1Percentage of transfers resulting in pregnancies (%) 65.2 11 / 16 4 / 8 0 / 1 1 / 1 0 / 1
Number of Egg/Embryo Banking Cycles 16 6 3 1 0 0
Donor Eggs Fresh Embryosf Frozen Embryosf
Number of cycles 16 20Number of transfers 14 20Average number of embryos transferred 2.0 1.9Percentage of embryos transferred resulting in implantation (%) 28.6 37.5Percentage of transfers resulting in term, normal weight & singleton live births
e (%) 6 / 14 20.0
Percentage of transfers resulting in singleton live births (%) 6 / 14 30.0Percentage of transfers resulting in twin live births (%) 0 / 14 10.0Percentage of transfers resulting in live births (%) 6 / 14 40.0Percentage of transfers resulting in pregnancies (%) 6 / 14 55.0
CURRENT SERVICES & PROFILE Current Name: Reproductive Gynecology, Inc.-Akron
Donor eggs? YesDonor embryos? Yes
Gestational carriers? YesEmbryo cryopreservation? Yes
Single women? YesSART member? Yes
Verified lab accreditation? Yes(See Appendix C for details.)
a Reflects features of fresh nondonor cycles. If IVF is less than 100%, the remaining cycles are GIFT, ZIFT, or a combination of these procedures with IVF.
b Total patient diagnosis percentages may be greater than 100% because more than one diagnosis can be reported for each ART cycle.
c Fractions are used for rates with denominators less than 20. Multiple-infant births (for example, twins) with at least one live infant are counted as one live birth.
d Total cycle number includes those using frozen eggs. It excludes 0 cycle(s) evaluating new procedures. Both cycle types are excluded from ART success rates.
e In this report, births are defined as term if at least 37 full weeks gestation and normal birth weight if at least 2,500 grams (approximately 5 pounds, 8 ounces).
f All ages are reported together because previous data show that patient age does not materially affect success with donor eggs.

379
OH
IOCLEVELAND CLINIC FERTILITY CENTER
BEACHWOOD, OHIOComparison of success rates across clinics may not be meaningful. Patient medical characteristics and treatment approaches vary (see pages 11–20).
Data verified by Cynthia Austin, MD2014 ART CYCLE PROFILE
Type of ART and Procedural Factors a
IVF 100%Unstimulated 0%Used gestational carrier <1%
With ICSI 84%PGD/PGS 8%
Patient Diagnosis b
Tubal factor 11%Ovulatory dysfunction 15%Diminished ovarian reserve 30%Endometriosis 10%
Uterine factor 3%Male factor 55%Other factor 24%Unknown factor 9%
Multiple Factors: Female factors only 10%Female & male factors 34%
2014 ART SUCCESS RATES c Total number of cyclesd: 713 (includes 4 cycle[s] using frozen eggs)
Type of CycleAge of Woman
<35 35–37 38–40 41–42 43–44 >44Fresh Embryos from Nondonor Eggs
Number of cycles 197 89 77 37 7 0Percentage of cancellations before retrieval (%) 11.2 15.7 22.1 18.9 3 / 7 Average number of embryos transferred 1.8 1.9 2.2 2.4 2.3 Percentage of embryos transferred resulting in implantation (%) 44.3 45.7 29.1 4.9 0 / 9 Percentage of elective single embryo transfers (eSET) (%) 18.7 11.9 6.0 8.7 1 / 3
Outcomes per CyclePercentage of cycles resulting in term, normal weight & singleton live births
e (%) 27.4 18.0 16.9 2.7 0 / 7
Percentage of cycles resulting in singleton live births (%) 34.0 22.5 23.4 5.4 0 / 7 Percentage of cycles resulting in twin live births (%) 15.2 16.9 3.9 0.0 0 / 7 Percentage of cycles resulting in live births (%) 49.2 39.3 28.6 5.4 0 / 7 Percentage of cycles resulting in pregnancies (%) 54.8 49.4 35.1 10.8 0 / 7
Outcomes per TransferNumber of transfers 171 73 54 27 4 0Percentage of transfers resulting in term, normal weight & singleton live births
e (%) 31.6 21.9 24.1 3.7 0 / 4
Percentage of transfers resulting in singleton live births (%) 39.2 27.4 33.3 7.4 0 / 4 Percentage of transfers resulting in twin live births (%) 17.5 20.5 5.6 0.0 0 / 4 Percentage of transfers resulting in live births (%) 56.7 47.9 40.7 7.4 0 / 4 Percentage of transfers resulting in pregnancies (%) 63.2 60.3 50.0 14.8 0 / 4
Frozen Embryos from Nondonor EggsNumber of cycles 98 57 48 9 6 2Number of transfers 98 53 44 9 6 2Estimated average number of transfers per retrieval 1.8 2.2 1.8 3.0 6.0 Average number of embryos transferred 1.7 1.7 1.8 1.4 1.7 2.5Percentage of embryos transferred resulting in implantation (%) 43.2 51.1 33.8 4 / 12 3 / 10 1 / 5Percentage of transfers resulting in term, normal weight & singleton live births
e (%) 32.7 22.6 18.2 2 / 9 2 / 6 1 / 2
Percentage of transfers resulting in singleton live births (%) 34.7 26.4 20.5 3 / 9 2 / 6 1 / 2Percentage of transfers resulting in twin live births (%) 13.3 24.5 9.1 0 / 9 0 / 6 0 / 2Percentage of transfers resulting in live births (%) 48.0 50.9 29.5 3 / 9 2 / 6 1 / 2Percentage of transfers resulting in pregnancies (%) 54.1 60.4 50.0 5 / 9 2 / 6 1 / 2
Number of Egg/Embryo Banking Cycles 16 8 13 2 0 0
Donor Eggs Fresh Embryosf Frozen Embryosf
Number of cycles 14 29Number of transfers 12 27Average number of embryos transferred 1.7 1.7Percentage of embryos transferred resulting in implantation (%) 60.0 30.2Percentage of transfers resulting in term, normal weight & singleton live births
e (%) 5 / 12 25.9
Percentage of transfers resulting in singleton live births (%) 5 / 12 29.6Percentage of transfers resulting in twin live births (%) 3 / 12 7.4Percentage of transfers resulting in live births (%) 8 / 12 37.0Percentage of transfers resulting in pregnancies (%) 8 / 12 40.7
CURRENT SERVICES & PROFILE Current Name: Cleveland Clinic Fertility Center
Donor eggs? YesDonor embryos? Yes
Gestational carriers? YesEmbryo cryopreservation? Yes
Single women? YesSART member? Yes
Verified lab accreditation? Yes(See Appendix C for details.)
a Reflects features of fresh nondonor cycles. If IVF is less than 100%, the remaining cycles are GIFT, ZIFT, or a combination of these procedures with IVF.
b Total patient diagnosis percentages may be greater than 100% because more than one diagnosis can be reported for each ART cycle.
c Fractions are used for rates with denominators less than 20. Multiple-infant births (for example, twins) with at least one live infant are counted as one live birth.
d Total cycle number includes those using frozen eggs. It excludes 0 cycle(s) evaluating new procedures. Both cycle types are excluded from ART success rates.
e In this report, births are defined as term if at least 37 full weeks gestation and normal birth weight if at least 2,500 grams (approximately 5 pounds, 8 ounces).
f All ages are reported together because previous data show that patient age does not materially affect success with donor eggs.

380
OH
IOUNIVERSITY HOSPITALS FERTILITY CENTER
BEACHWOOD, OHIOComparison of success rates across clinics may not be meaningful. Patient medical characteristics and treatment approaches vary (see pages 11–20).
Data verified by James Goldfarb, MD2014 ART CYCLE PROFILE
Type of ART and Procedural Factors a
IVF 100%Unstimulated 0%Used gestational carrier <1%
With ICSI 67%PGD/PGS 2%
Patient Diagnosis b
Tubal factor 15%Ovulatory dysfunction 11%Diminished ovarian reserve 19%Endometriosis 10%
Uterine factor 2%Male factor 31%Other factor 14%Unknown factor 19%
Multiple Factors: Female factors only 8%Female & male factors 12%
2014 ART SUCCESS RATES c Total number of cyclesd: 590 (includes 0 cycle[s] using frozen eggs)
Type of CycleAge of Woman
<35 35–37 38–40 41–42 43–44 >44Fresh Embryos from Nondonor Eggs
Number of cycles 164 85 50 20 11 0Percentage of cancellations before retrieval (%) 22.0 41.2 32.0 65.0 7 / 11 Average number of embryos transferred 2.0 2.1 2.3 2.6 3.5 Percentage of embryos transferred resulting in implantation (%) 36.0 31.6 22.5 3 / 11 2 / 14 Percentage of elective single embryo transfers (eSET) (%) 6.1 4.3 7.7 0 / 4 0 / 4
Outcomes per CyclePercentage of cycles resulting in term, normal weight & singleton live births
e (%) 20.1 9.4 10.0 0.0 1 / 11
Percentage of cycles resulting in singleton live births (%) 23.2 11.8 12.0 0.0 2 / 11 Percentage of cycles resulting in twin live births (%) 9.8 7.1 4.0 5.0 0 / 11 Percentage of cycles resulting in live births (%) 33.5 20.0 16.0 5.0 2 / 11 Percentage of cycles resulting in pregnancies (%) 37.8 24.7 20.0 15.0 2 / 11
Outcomes per TransferNumber of transfers 117 48 31 5 4 0Percentage of transfers resulting in term, normal weight & singleton live births
e (%) 28.2 16.7 16.1 0 / 5 1 / 4
Percentage of transfers resulting in singleton live births (%) 32.5 20.8 19.4 0 / 5 2 / 4 Percentage of transfers resulting in twin live births (%) 13.7 12.5 6.5 1 / 5 0 / 4 Percentage of transfers resulting in live births (%) 47.0 35.4 25.8 1 / 5 2 / 4 Percentage of transfers resulting in pregnancies (%) 53.0 43.8 32.3 3 / 5 2 / 4
Frozen Embryos from Nondonor EggsNumber of cycles 82 39 22 3 8 0Number of transfers 73 30 19 3 7 0Estimated average number of transfers per retrieval 1.1 1.2 1.6 1.0 1.4 0.0Average number of embryos transferred 1.9 1.8 1.8 2.0 2.0 Percentage of embryos transferred resulting in implantation (%) 25.4 13.2 18.8 1 / 6 3 / 14 Percentage of transfers resulting in term, normal weight & singleton live births
e (%) 26.0 10.0 4 / 19 0 / 3 2 / 7
Percentage of transfers resulting in singleton live births (%) 26.0 13.3 4 / 19 1 / 3 3 / 7 Percentage of transfers resulting in twin live births (%) 5.5 3.3 0 / 19 0 / 3 0 / 7 Percentage of transfers resulting in live births (%) 31.5 16.7 4 / 19 1 / 3 3 / 7 Percentage of transfers resulting in pregnancies (%) 50.7 23.3 6 / 19 1 / 3 3 / 7
Number of Egg/Embryo Banking Cycles 22 9 5 3 4 2
Donor Eggs Fresh Embryosf Frozen Embryosf
Number of cycles 23 38Number of transfers 15 34Average number of embryos transferred 1.9 1.9Percentage of embryos transferred resulting in implantation (%) 50.0 27.0Percentage of transfers resulting in term, normal weight & singleton live births
e (%) 5 / 15 14.7
Percentage of transfers resulting in singleton live births (%) 7 / 15 26.5Percentage of transfers resulting in twin live births (%) 2 / 15 2.9Percentage of transfers resulting in live births (%) 9 / 15 29.4Percentage of transfers resulting in pregnancies (%) 10 / 15 35.3
CURRENT SERVICES & PROFILE Current Name: University Hospitals Fertility Center
Donor eggs? YesDonor embryos? Yes
Gestational carriers? YesEmbryo cryopreservation? Yes
Single women? YesSART member? Yes
Verified lab accreditation? Yes(See Appendix C for details.)
a Reflects features of fresh nondonor cycles. If IVF is less than 100%, the remaining cycles are GIFT, ZIFT, or a combination of these procedures with IVF.
b Total patient diagnosis percentages may be greater than 100% because more than one diagnosis can be reported for each ART cycle.
c Fractions are used for rates with denominators less than 20. Multiple-infant births (for example, twins) with at least one live infant are counted as one live birth.
d Total cycle number includes those using frozen eggs. It excludes 0 cycle(s) evaluating new procedures. Both cycle types are excluded from ART success rates.
e In this report, births are defined as term if at least 37 full weeks gestation and normal birth weight if at least 2,500 grams (approximately 5 pounds, 8 ounces).
f All ages are reported together because previous data show that patient age does not materially affect success with donor eggs.

381
OH
IOBETHESDA FERTILITY CENTER
CINCINNATI, OHIOComparison of success rates across clinics may not be meaningful. Patient medical characteristics and treatment approaches vary (see pages 11–20).
Data verified by Glen E. Hofmann, MD, PhD2014 ART CYCLE PROFILE
Type of ART and Procedural Factors a
IVF 100%Unstimulated 0%Used gestational carrier 3%
With ICSI 70%PGD/PGS 0%
Patient Diagnosis b
Tubal factor 13%Ovulatory dysfunction 10%Diminished ovarian reserve 44%Endometriosis 6%
Uterine factor 3%Male factor 21%Other factor 7%Unknown factor 13%
Multiple Factors: Female factors only 7%Female & male factors 10%
2014 ART SUCCESS RATES c Total number of cyclesd: 271 (includes 2 cycle[s] using frozen eggs)
Type of CycleAge of Woman
<35 35–37 38–40 41–42 43–44 >44Fresh Embryos from Nondonor Eggs
Number of cycles 72 20 17 14 5 0Percentage of cancellations before retrieval (%) 13.9 15.0 3 / 17 2 / 14 1 / 5 Average number of embryos transferred 2.0 2.1 2.0 2.3 2.0 Percentage of embryos transferred resulting in implantation (%) 30.9 16.7 19.2 3.7 1 / 8 Percentage of elective single embryo transfers (eSET) (%) 5.4 0 / 17 0 / 13 0 / 11 0 / 3
Outcomes per CyclePercentage of cycles resulting in term, normal weight & singleton live births
e (%) 13.9 25.0 1 / 17 1 / 14 1 / 5
Percentage of cycles resulting in singleton live births (%) 15.3 25.0 1 / 17 1 / 14 1 / 5 Percentage of cycles resulting in twin live births (%) 13.9 0.0 1 / 17 0 / 14 0 / 5 Percentage of cycles resulting in live births (%) 29.2 25.0 2 / 17 1 / 14 1 / 5 Percentage of cycles resulting in pregnancies (%) 33.3 30.0 4 / 17 1 / 14 1 / 5
Outcomes per TransferNumber of transfers 57 17 14 12 4 0Percentage of transfers resulting in term, normal weight & singleton live births
e (%) 17.5 5 / 17 1 / 14 1 / 12 1 / 4
Percentage of transfers resulting in singleton live births (%) 19.3 5 / 17 1 / 14 1 / 12 1 / 4 Percentage of transfers resulting in twin live births (%) 17.5 0 / 17 1 / 14 0 / 12 0 / 4 Percentage of transfers resulting in live births (%) 36.8 5 / 17 2 / 14 1 / 12 1 / 4 Percentage of transfers resulting in pregnancies (%) 42.1 6 / 17 4 / 14 1 / 12 1 / 4
Frozen Embryos from Nondonor EggsNumber of cycles 43 17 8 3 2 0Number of transfers 43 17 8 3 2 0Estimated average number of transfers per retrieval 2.0 2.4 1.3 Average number of embryos transferred 1.8 1.8 1.8 1.3 1.0 Percentage of embryos transferred resulting in implantation (%) 27.0 6.7 5 / 14 0 / 4 0 / 2 Percentage of transfers resulting in term, normal weight & singleton live births
e (%) 23.3 2 / 17 0 / 8 0 / 3 0 / 2
Percentage of transfers resulting in singleton live births (%) 30.2 2 / 17 3 / 8 0 / 3 0 / 2 Percentage of transfers resulting in twin live births (%) 2.3 0 / 17 1 / 8 0 / 3 0 / 2 Percentage of transfers resulting in live births (%) 34.9 2 / 17 4 / 8 0 / 3 0 / 2 Percentage of transfers resulting in pregnancies (%) 44.2 2 / 17 4 / 8 0 / 3 0 / 2
Number of Egg/Embryo Banking Cycles 5 3 4 0 0 0
Donor Eggs Fresh Embryosf Frozen Embryosf
Number of cycles 22 34Number of transfers 21 34Average number of embryos transferred 2.0 1.5Percentage of embryos transferred resulting in implantation (%) 29.3 28.3Percentage of transfers resulting in term, normal weight & singleton live births
e (%) 33.3 14.7
Percentage of transfers resulting in singleton live births (%) 33.3 20.6Percentage of transfers resulting in twin live births (%) 9.5 5.9Percentage of transfers resulting in live births (%) 42.9 26.5Percentage of transfers resulting in pregnancies (%) 42.9 38.2
CURRENT SERVICES & PROFILE Current Name: Bethesda Fertility Center
Donor eggs? YesDonor embryos? Yes
Gestational carriers? YesEmbryo cryopreservation? Yes
Single women? YesSART member? Yes
Verified lab accreditation? Yes(See Appendix C for details.)
a Reflects features of fresh nondonor cycles. If IVF is less than 100%, the remaining cycles are GIFT, ZIFT, or a combination of these procedures with IVF.
b Total patient diagnosis percentages may be greater than 100% because more than one diagnosis can be reported for each ART cycle.
c Fractions are used for rates with denominators less than 20. Multiple-infant births (for example, twins) with at least one live infant are counted as one live birth.
d Total cycle number includes those using frozen eggs. It excludes 0 cycle(s) evaluating new procedures. Both cycle types are excluded from ART success rates.
e In this report, births are defined as term if at least 37 full weeks gestation and normal birth weight if at least 2,500 grams (approximately 5 pounds, 8 ounces).
f All ages are reported together because previous data show that patient age does not materially affect success with donor eggs.

382
OH
IOINSTITUTE FOR REPRODUCTIVE HEALTH
CINCINNATI, OHIOComparison of success rates across clinics may not be meaningful. Patient medical characteristics and treatment approaches vary (see pages 11–20).
Data verified by Sherif G. Awadalla, MD2014 ART CYCLE PROFILE
Type of ART and Procedural Factors a
IVF 100%Unstimulated 0%Used gestational carrier <1%
With ICSI 60%PGD/PGS 2%
Patient Diagnosis b
Tubal factor 14%Ovulatory dysfunction 29%Diminished ovarian reserve 21%Endometriosis 21%
Uterine factor 13%Male factor 37%Other factor 9%Unknown factor 7%
Multiple Factors: Female factors only 19%Female & male factors 22%
2014 ART SUCCESS RATES c Total number of cyclesd: 1,036 (includes 5 cycle[s] using frozen eggs)
Type of CycleAge of Woman
<35 35–37 38–40 41–42 43–44 >44Fresh Embryos from Nondonor Eggs
Number of cycles 394 161 78 33 15 2Percentage of cancellations before retrieval (%) 7.4 13.7 15.4 30.3 5 / 15 1 / 2Average number of embryos transferred 1.7 2.0 2.3 2.1 1.9 1.0Percentage of embryos transferred resulting in implantation (%) 40.9 30.0 26.8 4.8 1 / 15 0 / 1Percentage of elective single embryo transfers (eSET) (%) 29.3 8.2 0.0 1 / 14 0 / 5
Outcomes per CyclePercentage of cycles resulting in term, normal weight & singleton live births
e (%) 26.1 19.9 24.4 0.0 0 / 15 0 / 2
Percentage of cycles resulting in singleton live births (%) 30.2 24.2 26.9 0.0 1 / 15 0 / 2Percentage of cycles resulting in twin live births (%) 11.7 6.2 9.0 0.0 0 / 15 0 / 2Percentage of cycles resulting in live births (%) 42.4 31.7 35.9 0.0 1 / 15 0 / 2Percentage of cycles resulting in pregnancies (%) 49.2 38.5 41.0 6.1 1 / 15 0 / 2
Outcomes per TransferNumber of transfers 348 134 64 20 8 1Percentage of transfers resulting in term, normal weight & singleton live births
e (%) 29.6 23.9 29.7 0.0 0 / 8 0 / 1
Percentage of transfers resulting in singleton live births (%) 34.2 29.1 32.8 0.0 1 / 8 0 / 1Percentage of transfers resulting in twin live births (%) 13.2 7.5 10.9 0.0 0 / 8 0 / 1Percentage of transfers resulting in live births (%) 48.0 38.1 43.8 0.0 1 / 8 0 / 1Percentage of transfers resulting in pregnancies (%) 55.7 46.3 50.0 10.0 1 / 8 0 / 1
Frozen Embryos from Nondonor EggsNumber of cycles 150 60 24 6 0 0Number of transfers 146 55 21 6 0 0Estimated average number of transfers per retrieval 1.6 2.1 4.2 0.0 0.0Average number of embryos transferred 1.8 1.7 1.7 2.0 Percentage of embryos transferred resulting in implantation (%) 36.3 35.3 28.1 2 / 12 Percentage of transfers resulting in term, normal weight & singleton live births
e (%) 21.2 23.6 23.8 0 / 6
Percentage of transfers resulting in singleton live births (%) 25.3 27.3 33.3 0 / 6 Percentage of transfers resulting in twin live births (%) 15.8 10.9 4.8 0 / 6 Percentage of transfers resulting in live births (%) 41.1 38.2 38.1 0 / 6 Percentage of transfers resulting in pregnancies (%) 48.6 50.9 47.6 2 / 6
Number of Egg/Embryo Banking Cycles 11 3 3 0 2 1
Donor Eggs Fresh Embryosf Frozen Embryosf
Number of cycles 46 42Number of transfers 46 38Average number of embryos transferred 1.6 1.8Percentage of embryos transferred resulting in implantation (%) 47.9 38.5Percentage of transfers resulting in term, normal weight & singleton live births
e (%) 41.3 18.4
Percentage of transfers resulting in singleton live births (%) 45.7 21.1Percentage of transfers resulting in twin live births (%) 8.7 18.4Percentage of transfers resulting in live births (%) 54.3 39.5Percentage of transfers resulting in pregnancies (%) 65.2 52.6
CURRENT SERVICES & PROFILE Current Name: Institute for Reproductive Health
Donor eggs? YesDonor embryos? Yes
Gestational carriers? YesEmbryo cryopreservation? Yes
Single women? YesSART member? Yes
Verified lab accreditation? Yes(See Appendix C for details.)
a Reflects features of fresh nondonor cycles. If IVF is less than 100%, the remaining cycles are GIFT, ZIFT, or a combination of these procedures with IVF.
b Total patient diagnosis percentages may be greater than 100% because more than one diagnosis can be reported for each ART cycle.
c Fractions are used for rates with denominators less than 20. Multiple-infant births (for example, twins) with at least one live infant are counted as one live birth.
d Total cycle number includes those using frozen eggs. It excludes 0 cycle(s) evaluating new procedures. Both cycle types are excluded from ART success rates.
e In this report, births are defined as term if at least 37 full weeks gestation and normal birth weight if at least 2,500 grams (approximately 5 pounds, 8 ounces).
f All ages are reported together because previous data show that patient age does not materially affect success with donor eggs.

383
OH
IOMETROHEALTH MEDICAL CENTER
CLEVELAND, OHIOComparison of success rates across clinics may not be meaningful. Patient medical characteristics and treatment approaches vary (see pages 11–20).
Data verified by Brian M. Mercer, MD2014 ART CYCLE PROFILE
Type of ART and Procedural Factors a
IVF 100%Unstimulated 0%Used gestational carrier 0%
With ICSI 50%PGD/PGS 0%
Patient Diagnosis b
Tubal factor 0%Ovulatory dysfunction 0%Diminished ovarian reserve 0%Endometriosis 0%
Uterine factor 0%Male factor 0%Other factor 0%Unknown factor 100%
Multiple Factors: Female factors only 0%Female & male factors 0%
2014 ART SUCCESS RATES c Total number of cyclesd: 3 (includes 1 cycle[s] using frozen eggs)
Type of CycleAge of Woman
<35 35–37 38–40 41–42 43–44 >44Fresh Embryos from Nondonor Eggs
Number of cycles 1 1 0 0 0 0Percentage of cancellations before retrieval (%) 0 / 1 1 / 1 Average number of embryos transferred 2.0 Percentage of embryos transferred resulting in implantation (%) 0 / 2 Percentage of elective single embryo transfers (eSET) (%) 0 / 1
Outcomes per CyclePercentage of cycles resulting in term, normal weight & singleton live births
e (%) 0 / 1 0 / 1
Percentage of cycles resulting in singleton live births (%) 0 / 1 0 / 1 Percentage of cycles resulting in twin live births (%) 0 / 1 0 / 1 Percentage of cycles resulting in live births (%) 0 / 1 0 / 1 Percentage of cycles resulting in pregnancies (%) 0 / 1 0 / 1
Outcomes per TransferNumber of transfers 1 0 0 0 0 0Percentage of transfers resulting in term, normal weight & singleton live births
e (%) 0 / 1
Percentage of transfers resulting in singleton live births (%) 0 / 1 Percentage of transfers resulting in twin live births (%) 0 / 1 Percentage of transfers resulting in live births (%) 0 / 1 Percentage of transfers resulting in pregnancies (%) 0 / 1
Frozen Embryos from Nondonor EggsNumber of cycles 0 0 0 0 0 0Number of transfers 0 0 0 0 0 0Estimated average number of transfers per retrieval Average number of embryos transferred Percentage of embryos transferred resulting in implantation (%) Percentage of transfers resulting in term, normal weight & singleton live births
e (%)
Percentage of transfers resulting in singleton live births (%) Percentage of transfers resulting in twin live births (%) Percentage of transfers resulting in live births (%) Percentage of transfers resulting in pregnancies (%)
Number of Egg/Embryo Banking Cycles 0 0 0 0 0 0
Donor Eggs Fresh Embryosf Frozen Embryosf
Number of cycles 0 0Number of transfers 0 0Average number of embryos transferred Percentage of embryos transferred resulting in implantation (%) Percentage of transfers resulting in term, normal weight & singleton live births
e (%)
Percentage of transfers resulting in singleton live births (%) Percentage of transfers resulting in twin live births (%) Percentage of transfers resulting in live births (%) Percentage of transfers resulting in pregnancies (%)
CURRENT SERVICES & PROFILE This clinic has reorganized since 2014. Contact the NASS Help Desk for further information
Current Name: MetroHealth Medical Center
Donor eggs? NoDonor embryos? No
Gestational carriers? NoEmbryo cryopreservation? No
Single women? YesSART member? No
Verified lab accreditation? Yes(See Appendix C for details.)
a Reflects features of fresh nondonor cycles. If IVF is less than 100%, the remaining cycles are GIFT, ZIFT, or a combination of these procedures with IVF.
b Total patient diagnosis percentages may be greater than 100% because more than one diagnosis can be reported for each ART cycle.
c Fractions are used for rates with denominators less than 20. Multiple-infant births (for example, twins) with at least one live infant are counted as one live birth.
d Total cycle number includes those using frozen eggs. It excludes 0 cycle(s) evaluating new procedures. Both cycle types are excluded from ART success rates.
e In this report, births are defined as term if at least 37 full weeks gestation and normal birth weight if at least 2,500 grams (approximately 5 pounds, 8 ounces).
f All ages are reported together because previous data show that patient age does not materially affect success with donor eggs.

384
OH
IOOHIO REPRODUCTIVE MEDICINE
COLUMBUS, OHIOComparison of success rates across clinics may not be meaningful. Patient medical characteristics and treatment approaches vary (see pages 11–20).
Data verified by Grant Schmidt, MD, PhD2014 ART CYCLE PROFILE
Type of ART and Procedural Factors a
IVF >99%Unstimulated 0%Used gestational carrier 3%
With ICSI 34%PGD/PGS 3%
Patient Diagnosis b
Tubal factor 19%Ovulatory dysfunction 13%Diminished ovarian reserve 27%Endometriosis 7%
Uterine factor 4%Male factor 27%Other factor 12%Unknown factor 19%
Multiple Factors: Female factors only 16%Female & male factors 9%
2014 ART SUCCESS RATES c Total number of cyclesd: 672 (includes 0 cycle[s] using frozen eggs)
Type of CycleAge of Woman
<35 35–37 38–40 41–42 43–44 >44Fresh Embryos from Nondonor Eggs
Number of cycles 243 111 61 45 5 2Percentage of cancellations before retrieval (%) 3.7 11.7 4.9 8.9 2 / 5 0 / 2Average number of embryos transferred 1.7 2.0 2.2 2.9 3.0 3.5Percentage of embryos transferred resulting in implantation (%) 44.4 29.6 14.8 8.0 0 / 9 0 / 7Percentage of elective single embryo transfers (eSET) (%) 22.9 2.4 2.2 0.0 0 / 3 0 / 2
Outcomes per CyclePercentage of cycles resulting in term, normal weight & singleton live births
e (%) 26.7 20.7 18.0 11.1 0 / 5 0 / 2
Percentage of cycles resulting in singleton live births (%) 30.5 22.5 21.3 11.1 0 / 5 0 / 2Percentage of cycles resulting in twin live births (%) 13.6 5.4 1.6 0.0 0 / 5 0 / 2Percentage of cycles resulting in live births (%) 44.9 29.7 23.0 11.1 0 / 5 0 / 2Percentage of cycles resulting in pregnancies (%) 50.6 38.7 29.5 24.4 0 / 5 0 / 2
Outcomes per TransferNumber of transfers 222 93 53 38 3 2Percentage of transfers resulting in term, normal weight & singleton live births
e (%) 29.3 24.7 20.8 13.2 0 / 3 0 / 2
Percentage of transfers resulting in singleton live births (%) 33.3 26.9 24.5 13.2 0 / 3 0 / 2Percentage of transfers resulting in twin live births (%) 14.9 6.5 1.9 0.0 0 / 3 0 / 2Percentage of transfers resulting in live births (%) 49.1 35.5 26.4 13.2 0 / 3 0 / 2Percentage of transfers resulting in pregnancies (%) 55.4 46.2 34.0 28.9 0 / 3 0 / 2
Frozen Embryos from Nondonor EggsNumber of cycles 64 25 11 6 0 1Number of transfers 60 21 11 5 0 1Estimated average number of transfers per retrieval 1.4 1.6 1.0 0.6 0.0 Average number of embryos transferred 1.6 1.7 1.5 1.6 1.0Percentage of embryos transferred resulting in implantation (%) 44.6 25.7 4 / 12 1 / 8 1 / 1Percentage of transfers resulting in term, normal weight & singleton live births
e (%) 30.0 23.8 1 / 11 1 / 5 0 / 1
Percentage of transfers resulting in singleton live births (%) 40.0 28.6 1 / 11 1 / 5 1 / 1Percentage of transfers resulting in twin live births (%) 10.0 0.0 1 / 11 0 / 5 0 / 1Percentage of transfers resulting in live births (%) 51.7 28.6 2 / 11 1 / 5 1 / 1Percentage of transfers resulting in pregnancies (%) 58.3 42.9 5 / 11 1 / 5 1 / 1
Number of Egg/Embryo Banking Cycles 14 5 7 6 3 0
Donor Eggs Fresh Embryosf Frozen Embryosf
Number of cycles 30 33Number of transfers 29 31Average number of embryos transferred 1.7 1.7Percentage of embryos transferred resulting in implantation (%) 53.2 36.7Percentage of transfers resulting in term, normal weight & singleton live births
e (%) 41.4 12.9
Percentage of transfers resulting in singleton live births (%) 51.7 12.9Percentage of transfers resulting in twin live births (%) 13.8 16.1Percentage of transfers resulting in live births (%) 65.5 29.0Percentage of transfers resulting in pregnancies (%) 69.0 41.9
CURRENT SERVICES & PROFILE Current Name: Ohio Reproductive Medicine
Donor eggs? YesDonor embryos? Yes
Gestational carriers? YesEmbryo cryopreservation? Yes
Single women? YesSART member? Yes
Verified lab accreditation? Yes(See Appendix C for details.)
a Reflects features of fresh nondonor cycles. If IVF is less than 100%, the remaining cycles are GIFT, ZIFT, or a combination of these procedures with IVF.
b Total patient diagnosis percentages may be greater than 100% because more than one diagnosis can be reported for each ART cycle.
c Fractions are used for rates with denominators less than 20. Multiple-infant births (for example, twins) with at least one live infant are counted as one live birth.
d Total cycle number includes those using frozen eggs. It excludes 0 cycle(s) evaluating new procedures. Both cycle types are excluded from ART success rates.
e In this report, births are defined as term if at least 37 full weeks gestation and normal birth weight if at least 2,500 grams (approximately 5 pounds, 8 ounces).
f All ages are reported together because previous data show that patient age does not materially affect success with donor eggs.

385
OH
IOWRIGHT STATE PHYSICIANS, WOMEN’S HEALTH CARE
DAYTON, OHIO
This clinic provided ART services during 2014 and is therefore required to submit ART cycle data under the provisions of the Fertility Clinic Success Rate and Certification Act. This clinic either did not submit 2014 ART cycle data or the clinic’s Medical Director did not approve the clinic’s 2014 ART cycle data for inclusion in this report.

386
OH
IOKETTERING REPRODUCTIVE MEDICINE
KETTERING, OHIOComparison of success rates across clinics may not be meaningful. Patient medical characteristics and treatment approaches vary (see pages 11–20).
Data verified by Mark C. Bidwell, MD2014 ART CYCLE PROFILE
Type of ART and Procedural Factors a
IVF 100%Unstimulated 0%Used gestational carrier 0%
With ICSI 74%PGD/PGS 0%
Patient Diagnosis b
Tubal factor 10%Ovulatory dysfunction 14%Diminished ovarian reserve 25%Endometriosis 26%
Uterine factor 0%Male factor 48%Other factor 4%Unknown factor 3%
Multiple Factors: Female factors only 10%Female & male factors 16%
2014 ART SUCCESS RATES c Total number of cyclesd: 198 (includes 3 cycle[s] using frozen eggs)
Type of CycleAge of Woman
<35 35–37 38–40 41–42 43–44 >44Fresh Embryos from Nondonor Eggs
Number of cycles 75 26 14 2 0 0Percentage of cancellations before retrieval (%) 5.3 7.7 1 / 14 1 / 2 Average number of embryos transferred 1.9 2.0 2.2 2.0 Percentage of embryos transferred resulting in implantation (%) 42.4 37.8 21.4 0 / 2 Percentage of elective single embryo transfers (eSET) (%) 11.4 4.2 0 / 13 0 / 1
Outcomes per CyclePercentage of cycles resulting in term, normal weight & singleton live births
e (%) 40.0 26.9 2 / 14 0 / 2
Percentage of cycles resulting in singleton live births (%) 45.3 30.8 4 / 14 0 / 2 Percentage of cycles resulting in twin live births (%) 10.7 11.5 0 / 14 0 / 2 Percentage of cycles resulting in live births (%) 56.0 42.3 4 / 14 0 / 2 Percentage of cycles resulting in pregnancies (%) 61.3 53.8 6 / 14 0 / 2
Outcomes per TransferNumber of transfers 70 24 13 1 0 0Percentage of transfers resulting in term, normal weight & singleton live births
e (%) 42.9 29.2 2 / 13 0 / 1
Percentage of transfers resulting in singleton live births (%) 48.6 33.3 4 / 13 0 / 1 Percentage of transfers resulting in twin live births (%) 11.4 12.5 0 / 13 0 / 1 Percentage of transfers resulting in live births (%) 60.0 45.8 4 / 13 0 / 1 Percentage of transfers resulting in pregnancies (%) 65.7 58.3 6 / 13 0 / 1
Frozen Embryos from Nondonor EggsNumber of cycles 30 16 13 0 1 0Number of transfers 30 15 13 0 1 0Estimated average number of transfers per retrieval 2.5 2.5 3.3 Average number of embryos transferred 1.9 1.9 1.7 2.0 Percentage of embryos transferred resulting in implantation (%) 26.4 13.0 22.7 0 / 2 Percentage of transfers resulting in term, normal weight & singleton live births
e (%) 26.7 2 / 15 3 / 13 0 / 1
Percentage of transfers resulting in singleton live births (%) 30.0 2 / 15 4 / 13 0 / 1 Percentage of transfers resulting in twin live births (%) 3.3 0 / 15 0 / 13 0 / 1 Percentage of transfers resulting in live births (%) 33.3 2 / 15 4 / 13 0 / 1 Percentage of transfers resulting in pregnancies (%) 50.0 6 / 15 5 / 13 0 / 1
Number of Egg/Embryo Banking Cycles 2 0 0 0 0 0
Donor Eggs Fresh Embryosf Frozen Embryosf
Number of cycles 12 4Number of transfers 11 4Average number of embryos transferred 1.8 1.5Percentage of embryos transferred resulting in implantation (%) 70.0 2 / 6Percentage of transfers resulting in term, normal weight & singleton live births
e (%) 4 / 11 1 / 4
Percentage of transfers resulting in singleton live births (%) 4 / 11 1 / 4Percentage of transfers resulting in twin live births (%) 5 / 11 0 / 4Percentage of transfers resulting in live births (%) 9 / 11 1 / 4Percentage of transfers resulting in pregnancies (%) 9 / 11 2 / 4
CURRENT SERVICES & PROFILE This clinic has reorganized since 2014. Contact the NASS Help Desk for further information.
Current Name: Kettering Reproductive Medicine
Donor eggs? YesDonor embryos? Yes
Gestational carriers? YesEmbryo cryopreservation? Yes
Single women? YesSART member? Yes
Verified lab accreditation? Yes(See Appendix C for details.)
a Reflects features of fresh nondonor cycles. If IVF is less than 100%, the remaining cycles are GIFT, ZIFT, or a combination of these procedures with IVF.
b Total patient diagnosis percentages may be greater than 100% because more than one diagnosis can be reported for each ART cycle.
c Fractions are used for rates with denominators less than 20. Multiple-infant births (for example, twins) with at least one live infant are counted as one live birth.
d Total cycle number includes those using frozen eggs. It excludes 0 cycle(s) evaluating new procedures. Both cycle types are excluded from ART success rates.
e In this report, births are defined as term if at least 37 full weeks gestation and normal birth weight if at least 2,500 grams (approximately 5 pounds, 8 ounces).
f All ages are reported together because previous data show that patient age does not materially affect success with donor eggs.

387
OH
IOTHE FERTILITY WELLNESS INSTITUTE OF OHIO
MASON, OHIOComparison of success rates across clinics may not be meaningful. Patient medical characteristics and treatment approaches vary (see pages 11–20).
Data verified by Neeoo W. Chin, MD2014 ART CYCLE PROFILE
Type of ART and Procedural Factors a
IVF 100%Unstimulated 0%Used gestational carrier 0%
With ICSI 47%PGD/PGS 0%
Patient Diagnosis b
Tubal factor 20%Ovulatory dysfunction 24%Diminished ovarian reserve 2%Endometriosis 76%
Uterine factor 22%Male factor 22%Other factor 10%Unknown factor 2%
Multiple Factors: Female factors only 49%Female & male factors 17%
2014 ART SUCCESS RATES c Total number of cyclesd: 41 (includes 0 cycle[s] using frozen eggs)
Type of CycleAge of Woman
<35 35–37 38–40 41–42 43–44 >44Fresh Embryos from Nondonor Eggs
Number of cycles 19 14 3 0 0 0Percentage of cancellations before retrieval (%) 0 / 19 0 / 14 0 / 3 Average number of embryos transferred 2.2 2.0 2.3 Percentage of embryos transferred resulting in implantation (%) 43.3 29.2 3 / 7 Percentage of elective single embryo transfers (eSET) (%) 1 / 15 0 / 10 0 / 3
Outcomes per CyclePercentage of cycles resulting in term, normal weight & singleton live births
e (%) 6 / 19 2 / 14 0 / 3
Percentage of cycles resulting in singleton live births (%) 7 / 19 3 / 14 0 / 3 Percentage of cycles resulting in twin live births (%) 1 / 19 1 / 14 1 / 3 Percentage of cycles resulting in live births (%) 8 / 19 4 / 14 1 / 3 Percentage of cycles resulting in pregnancies (%) 11 / 19 6 / 14 2 / 3
Outcomes per TransferNumber of transfers 15 12 3 0 0 0Percentage of transfers resulting in term, normal weight & singleton live births
e (%) 6 / 15 2 / 12 0 / 3
Percentage of transfers resulting in singleton live births (%) 7 / 15 3 / 12 0 / 3 Percentage of transfers resulting in twin live births (%) 1 / 15 1 / 12 1 / 3 Percentage of transfers resulting in live births (%) 8 / 15 4 / 12 1 / 3 Percentage of transfers resulting in pregnancies (%) 11 / 15 6 / 12 2 / 3
Frozen Embryos from Nondonor EggsNumber of cycles 2 0 0 0 0 0Number of transfers 2 0 0 0 0 0Estimated average number of transfers per retrieval 1.0 Average number of embryos transferred 2.0 Percentage of embryos transferred resulting in implantation (%) 1 / 4 Percentage of transfers resulting in term, normal weight & singleton live births
e (%) 0 / 2
Percentage of transfers resulting in singleton live births (%) 1 / 2 Percentage of transfers resulting in twin live births (%) 0 / 2 Percentage of transfers resulting in live births (%) 1 / 2 Percentage of transfers resulting in pregnancies (%) 1 / 2
Number of Egg/Embryo Banking Cycles 0 0 0 0 0 0
Donor Eggs Fresh Embryosf Frozen Embryosf
Number of cycles 3 0Number of transfers 3 0Average number of embryos transferred 2.0 Percentage of embryos transferred resulting in implantation (%) 3 / 6 Percentage of transfers resulting in term, normal weight & singleton live births
e (%) 0 / 3
Percentage of transfers resulting in singleton live births (%) 1 / 3 Percentage of transfers resulting in twin live births (%) 1 / 3 Percentage of transfers resulting in live births (%) 2 / 3 Percentage of transfers resulting in pregnancies (%) 2 / 3
CURRENT SERVICES & PROFILE Current Name: The Fertility Wellness Institute of Ohio
Donor eggs? YesDonor embryos? No
Gestational carriers? NoEmbryo cryopreservation? Yes
Single women? YesSART member? No
Verified lab accreditation? Yes(See Appendix C for details.)
a Reflects features of fresh nondonor cycles. If IVF is less than 100%, the remaining cycles are GIFT, ZIFT, or a combination of these procedures with IVF.
b Total patient diagnosis percentages may be greater than 100% because more than one diagnosis can be reported for each ART cycle.
c Fractions are used for rates with denominators less than 20. Multiple-infant births (for example, twins) with at least one live infant are counted as one live birth.
d Total cycle number includes those using frozen eggs. It excludes 0 cycle(s) evaluating new procedures. Both cycle types are excluded from ART success rates.
e In this report, births are defined as term if at least 37 full weeks gestation and normal birth weight if at least 2,500 grams (approximately 5 pounds, 8 ounces).
f All ages are reported together because previous data show that patient age does not materially affect success with donor eggs.

388
OH
IOFERTILITY CENTER OF NORTHWEST OHIO
TOLEDO, OHIO
This clinic provided ART services during 2014 and is therefore required to submit ART cycle data under the provisions of the Fertility Clinic Success Rate and Certification Act. This clinic either did not submit 2014 ART cycle data or the clinic’s Medical Director did not approve the clinic’s 2014 ART cycle data for inclusion in this report.

389
OH
IOCENTER FOR REPRODUCTIVE HEALTH
WEST CHESTER, OHIOComparison of success rates across clinics may not be meaningful. Patient medical characteristics and treatment approaches vary (see pages 11–20).
Data verified by Krystene B. Dipaola, MD2014 ART CYCLE PROFILE
Type of ART and Procedural Factors a
IVF 100%Unstimulated 0%Used gestational carrier <1%
With ICSI 47%PGD/PGS 0%
Patient Diagnosis b
Tubal factor 10%Ovulatory dysfunction 24%Diminished ovarian reserve 27%Endometriosis 14%
Uterine factor 1%Male factor 34%Other factor 2%Unknown factor 7%
Multiple Factors: Female factors only 3%Female & male factors 14%
2014 ART SUCCESS RATES c Total number of cyclesd: 197 (includes 2 cycle[s] using frozen eggs)
Type of CycleAge of Woman
<35 35–37 38–40 41–42 43–44 >44Fresh Embryos from Nondonor Eggs
Number of cycles 73 33 16 4 0 3Percentage of cancellations before retrieval (%) 11.0 6.1 5 / 16 1 / 4 1 / 3Average number of embryos transferred 2.0 2.0 2.2 2.0 1.0Percentage of embryos transferred resulting in implantation (%) 37.9 25.0 45.0 0 / 2 1 / 2Percentage of elective single embryo transfers (eSET) (%) 1.7 0.0 0 / 9 0 / 1
Outcomes per CyclePercentage of cycles resulting in term, normal weight & singleton live births
e (%) 26.0 18.2 5 / 16 0 / 4 0 / 3
Percentage of cycles resulting in singleton live births (%) 27.4 24.2 5 / 16 0 / 4 0 / 3Percentage of cycles resulting in twin live births (%) 15.1 9.1 2 / 16 0 / 4 0 / 3Percentage of cycles resulting in live births (%) 42.5 33.3 7 / 16 0 / 4 0 / 3Percentage of cycles resulting in pregnancies (%) 43.8 36.4 7 / 16 0 / 4 1 / 3
Outcomes per TransferNumber of transfers 62 31 9 1 0 2Percentage of transfers resulting in term, normal weight & singleton live births
e (%) 30.6 19.4 5 / 9 0 / 1 0 / 2
Percentage of transfers resulting in singleton live births (%) 32.3 25.8 5 / 9 0 / 1 0 / 2Percentage of transfers resulting in twin live births (%) 17.7 9.7 2 / 9 0 / 1 0 / 2Percentage of transfers resulting in live births (%) 50.0 35.5 7 / 9 0 / 1 0 / 2Percentage of transfers resulting in pregnancies (%) 51.6 38.7 7 / 9 0 / 1 1 / 2
Frozen Embryos from Nondonor EggsNumber of cycles 26 5 2 1 0 0Number of transfers 24 5 2 1 0 0Estimated average number of transfers per retrieval 0.9 0.6 1.0 0.5 0.0 0.0Average number of embryos transferred 1.8 1.8 2.0 1.0 Percentage of embryos transferred resulting in implantation (%) 25.0 1 / 9 0 / 4 1 / 1 Percentage of transfers resulting in term, normal weight & singleton live births
e (%) 20.8 0 / 5 0 / 2 1 / 1
Percentage of transfers resulting in singleton live births (%) 20.8 1 / 5 0 / 2 1 / 1 Percentage of transfers resulting in twin live births (%) 4.2 0 / 5 0 / 2 0 / 1 Percentage of transfers resulting in live births (%) 29.2 1 / 5 0 / 2 1 / 1 Percentage of transfers resulting in pregnancies (%) 33.3 1 / 5 0 / 2 1 / 1
Number of Egg/Embryo Banking Cycles 10 5 1 2 1 1
Donor Eggs Fresh Embryosf Frozen Embryosf
Number of cycles 6 6Number of transfers 3 5Average number of embryos transferred 1.3 2.0Percentage of embryos transferred resulting in implantation (%) 3 / 4 1 / 10Percentage of transfers resulting in term, normal weight & singleton live births
e (%) 1 / 3 0 / 5
Percentage of transfers resulting in singleton live births (%) 1 / 3 1 / 5Percentage of transfers resulting in twin live births (%) 1 / 3 0 / 5Percentage of transfers resulting in live births (%) 2 / 3 1 / 5Percentage of transfers resulting in pregnancies (%) 2 / 3 1 / 5
CURRENT SERVICES & PROFILE Current Name: Center for Reproductive Health
Donor eggs? YesDonor embryos? Yes
Gestational carriers? YesEmbryo cryopreservation? Yes
Single women? YesSART member? Yes
Verified lab accreditation? Yes(See Appendix C for details.)
a Reflects features of fresh nondonor cycles. If IVF is less than 100%, the remaining cycles are GIFT, ZIFT, or a combination of these procedures with IVF.
b Total patient diagnosis percentages may be greater than 100% because more than one diagnosis can be reported for each ART cycle.
c Fractions are used for rates with denominators less than 20. Multiple-infant births (for example, twins) with at least one live infant are counted as one live birth.
d Total cycle number includes those using frozen eggs. It excludes 0 cycle(s) evaluating new procedures. Both cycle types are excluded from ART success rates.
e In this report, births are defined as term if at least 37 full weeks gestation and normal birth weight if at least 2,500 grams (approximately 5 pounds, 8 ounces).
f All ages are reported together because previous data show that patient age does not materially affect success with donor eggs.

390
OH
IOREPRODUCTIVE GYNECOLOGY, INC.-WESTERVILLE
WESTERVILLE, OHIOComparison of success rates across clinics may not be meaningful. Patient medical characteristics and treatment approaches vary (see pages 11–20).
Data verified by Richard Moretuzzo, MD2014 ART CYCLE PROFILE
Type of ART and Procedural Factors a
IVF 100%Unstimulated 0%Used gestational carrier 0%
With ICSI 64%PGD/PGS 0%
Patient Diagnosis b
Tubal factor 11%Ovulatory dysfunction 14%Diminished ovarian reserve 18%Endometriosis 15%
Uterine factor 4%Male factor 54%Other factor 5%Unknown factor 11%
Multiple Factors: Female factors only 8%Female & male factors 22%
2014 ART SUCCESS RATES c Total number of cyclesd: 202 (includes 1 cycle[s] using frozen eggs)
Type of CycleAge of Woman
<35 35–37 38–40 41–42 43–44 >44Fresh Embryos from Nondonor Eggs
Number of cycles 78 25 19 9 2 0Percentage of cancellations before retrieval (%) 3.8 8.0 1 / 19 2 / 9 1 / 2 Average number of embryos transferred 1.9 2.2 2.9 3.7 3.0 Percentage of embryos transferred resulting in implantation (%) 37.3 14.3 15.4 0.0 0 / 3 Percentage of elective single embryo transfers (eSET) (%) 5.6 9.5 0 / 16 0 / 7 0 / 1
Outcomes per CyclePercentage of cycles resulting in term, normal weight & singleton live births
e (%) 12.8 12.0 4 / 19 0 / 9 0 / 2
Percentage of cycles resulting in singleton live births (%) 15.4 16.0 4 / 19 0 / 9 0 / 2 Percentage of cycles resulting in twin live births (%) 19.2 4.0 1 / 19 0 / 9 0 / 2 Percentage of cycles resulting in live births (%) 35.9 20.0 5 / 19 0 / 9 0 / 2 Percentage of cycles resulting in pregnancies (%) 44.9 24.0 6 / 19 0 / 9 0 / 2
Outcomes per TransferNumber of transfers 73 22 18 7 1 0Percentage of transfers resulting in term, normal weight & singleton live births
e (%) 13.7 13.6 4 / 18 0 / 7 0 / 1
Percentage of transfers resulting in singleton live births (%) 16.4 18.2 4 / 18 0 / 7 0 / 1 Percentage of transfers resulting in twin live births (%) 20.5 4.5 1 / 18 0 / 7 0 / 1 Percentage of transfers resulting in live births (%) 38.4 22.7 5 / 18 0 / 7 0 / 1 Percentage of transfers resulting in pregnancies (%) 47.9 27.3 6 / 18 0 / 7 0 / 1
Frozen Embryos from Nondonor EggsNumber of cycles 30 16 5 2 0 0Number of transfers 29 13 5 1 0 0Estimated average number of transfers per retrieval 2.6 1.4 2.5 Average number of embryos transferred 1.7 1.7 1.8 2.0 Percentage of embryos transferred resulting in implantation (%) 26.7 40.9 0 / 9 2 / 2 Percentage of transfers resulting in term, normal weight & singleton live births
e (%) 20.7 8 / 13 0 / 5 0 / 1
Percentage of transfers resulting in singleton live births (%) 24.1 9 / 13 0 / 5 0 / 1 Percentage of transfers resulting in twin live births (%) 3.4 0 / 13 0 / 5 1 / 1 Percentage of transfers resulting in live births (%) 27.6 9 / 13 0 / 5 1 / 1 Percentage of transfers resulting in pregnancies (%) 41.4 9 / 13 0 / 5 1 / 1
Number of Egg/Embryo Banking Cycles 2 3 0 0 0 0
Donor Eggs Fresh Embryosf Frozen Embryosf
Number of cycles 4 6Number of transfers 4 5Average number of embryos transferred 2.0 2.0Percentage of embryos transferred resulting in implantation (%) 1 / 8 3 / 10Percentage of transfers resulting in term, normal weight & singleton live births
e (%) 0 / 4 2 / 5
Percentage of transfers resulting in singleton live births (%) 0 / 4 3 / 5Percentage of transfers resulting in twin live births (%) 0 / 4 0 / 5Percentage of transfers resulting in live births (%) 0 / 4 3 / 5Percentage of transfers resulting in pregnancies (%) 1 / 4 3 / 5
CURRENT SERVICES & PROFILE Current Name: Reproductive Gynecology, Inc.-Westerville
Donor eggs? YesDonor embryos? Yes
Gestational carriers? YesEmbryo cryopreservation? Yes
Single women? YesSART member? Yes
Verified lab accreditation? Yes(See Appendix C for details.)
a Reflects features of fresh nondonor cycles. If IVF is less than 100%, the remaining cycles are GIFT, ZIFT, or a combination of these procedures with IVF.
b Total patient diagnosis percentages may be greater than 100% because more than one diagnosis can be reported for each ART cycle.
c Fractions are used for rates with denominators less than 20. Multiple-infant births (for example, twins) with at least one live infant are counted as one live birth.
d Total cycle number includes those using frozen eggs. It excludes 0 cycle(s) evaluating new procedures. Both cycle types are excluded from ART success rates.
e In this report, births are defined as term if at least 37 full weeks gestation and normal birth weight if at least 2,500 grams (approximately 5 pounds, 8 ounces).
f All ages are reported together because previous data show that patient age does not materially affect success with donor eggs.

391
OK
LA
HO
MA
HENRY G. BENNETT, JR., FERTILITY INSTITUTEOKLAHOMA CITY, OKLAHOMA
Comparison of success rates across clinics may not be meaningful. Patient medical characteristics and treatment approaches vary (see pages 11–20).
Data verified by Eli Reshef, MD2014 ART CYCLE PROFILE
Type of ART and Procedural Factors a
IVF 100%Unstimulated 0%Used gestational carrier 0%
With ICSI 66%PGD/PGS 0%
Patient Diagnosis b
Tubal factor 17%Ovulatory dysfunction 18%Diminished ovarian reserve 7%Endometriosis 21%
Uterine factor 3%Male factor 55%Other factor 23%Unknown factor 5%
Multiple Factors: Female factors only 13%Female & male factors 27%
2014 ART SUCCESS RATES c Total number of cyclesd: 294 (includes 0 cycle[s] using frozen eggs)
Type of CycleAge of Woman
<35 35–37 38–40 41–42 43–44 >44Fresh Embryos from Nondonor Eggs
Number of cycles 138 41 20 2 6 1Percentage of cancellations before retrieval (%) 6.5 9.8 0.0 1 / 2 3 / 6 0 / 1Average number of embryos transferred 2.0 2.2 2.7 2.0 3.0 2.0Percentage of embryos transferred resulting in implantation (%) 38.2 44.9 21.6 1 / 2 0 / 6 2 / 2Percentage of elective single embryo transfers (eSET) (%) 0.8 3.0 0 / 19 0 / 1 0 / 2 0 / 1
Outcomes per CyclePercentage of cycles resulting in term, normal weight & singleton live births
e (%) 30.4 12.2 20.0 1 / 2 0 / 6 0 / 1
Percentage of cycles resulting in singleton live births (%) 31.9 12.2 30.0 1 / 2 0 / 6 0 / 1Percentage of cycles resulting in twin live births (%) 14.5 26.8 5.0 0 / 2 0 / 6 1 / 1Percentage of cycles resulting in live births (%) 47.1 41.5 35.0 1 / 2 0 / 6 1 / 1Percentage of cycles resulting in pregnancies (%) 52.2 51.2 45.0 1 / 2 0 / 6 1 / 1
Outcomes per TransferNumber of transfers 127 34 19 1 2 1Percentage of transfers resulting in term, normal weight & singleton live births
e (%) 33.1 14.7 4 / 19 1 / 1 0 / 2 0 / 1
Percentage of transfers resulting in singleton live births (%) 34.6 14.7 6 / 19 1 / 1 0 / 2 0 / 1Percentage of transfers resulting in twin live births (%) 15.7 32.4 1 / 19 0 / 1 0 / 2 1 / 1Percentage of transfers resulting in live births (%) 51.2 50.0 7 / 19 1 / 1 0 / 2 1 / 1Percentage of transfers resulting in pregnancies (%) 56.7 61.8 9 / 19 1 / 1 0 / 2 1 / 1
Frozen Embryos from Nondonor EggsNumber of cycles 40 17 8 1 0 0Number of transfers 37 13 8 1 0 0Estimated average number of transfers per retrieval 2.3 2.6 8.0 Average number of embryos transferred 1.9 1.9 2.0 1.0 Percentage of embryos transferred resulting in implantation (%) 21.7 44.0 4 / 16 0 / 1 Percentage of transfers resulting in term, normal weight & singleton live births
e (%) 24.3 3 / 13 4 / 8 0 / 1
Percentage of transfers resulting in singleton live births (%) 29.7 4 / 13 4 / 8 0 / 1 Percentage of transfers resulting in twin live births (%) 2.7 3 / 13 0 / 8 0 / 1 Percentage of transfers resulting in live births (%) 32.4 7 / 13 4 / 8 0 / 1 Percentage of transfers resulting in pregnancies (%) 37.8 7 / 13 4 / 8 0 / 1
Number of Egg/Embryo Banking Cycles 0 0 0 0 0 0
Donor Eggs Fresh Embryosf Frozen Embryosf
Number of cycles 11 9Number of transfers 10 8Average number of embryos transferred 2.2 1.9Percentage of embryos transferred resulting in implantation (%) 63.6 5 / 12Percentage of transfers resulting in term, normal weight & singleton live births
e (%) 5 / 10 1 / 8
Percentage of transfers resulting in singleton live births (%) 6 / 10 1 / 8Percentage of transfers resulting in twin live births (%) 3 / 10 2 / 8Percentage of transfers resulting in live births (%) 9 / 10 3 / 8Percentage of transfers resulting in pregnancies (%) 9 / 10 4 / 8
CURRENT SERVICES & PROFILE Current Name: Henry G. Bennett, Jr., Fertility Institute
Donor eggs? YesDonor embryos? Yes
Gestational carriers? NoEmbryo cryopreservation? Yes
Single women? NoSART member? Yes
Verified lab accreditation? Yes(See Appendix C for details.)
a Reflects features of fresh nondonor cycles. If IVF is less than 100%, the remaining cycles are GIFT, ZIFT, or a combination of these procedures with IVF.
b Total patient diagnosis percentages may be greater than 100% because more than one diagnosis can be reported for each ART cycle.
c Fractions are used for rates with denominators less than 20. Multiple-infant births (for example, twins) with at least one live infant are counted as one live birth.
d Total cycle number includes those using frozen eggs. It excludes 0 cycle(s) evaluating new procedures. Both cycle types are excluded from ART success rates.
e In this report, births are defined as term if at least 37 full weeks gestation and normal birth weight if at least 2,500 grams (approximately 5 pounds, 8 ounces).
f All ages are reported together because previous data show that patient age does not materially affect success with donor eggs.

392
OK
LA
HO
MA
OU PHYSICIANS REPRODUCTIVE MEDICINEOKLAHOMA CITY, OKLAHOMA
Comparison of success rates across clinics may not be meaningful. Patient medical characteristics and treatment approaches vary (see pages 11–20).
Data verified by Latasha B. Craig, MD2014 ART CYCLE PROFILE
Type of ART and Procedural Factors a
IVF 100%Unstimulated 0%Used gestational carrier 2%
With ICSI 82%PGD/PGS 0%
Patient Diagnosis b
Tubal factor 19%Ovulatory dysfunction 12%Diminished ovarian reserve 25%Endometriosis 12%
Uterine factor 2%Male factor 43%Other factor 25%Unknown factor 12%
Multiple Factors: Female factors only 14%Female & male factors 27%
2014 ART SUCCESS RATES c Total number of cyclesd: 232 (includes 0 cycle[s] using frozen eggs)
Type of CycleAge of Woman
<35 35–37 38–40 41–42 43–44 >44Fresh Embryos from Nondonor Eggs
Number of cycles 102 19 20 12 2 1Percentage of cancellations before retrieval (%) 3.9 1 / 19 10.0 4 / 12 0 / 2 1 / 1Average number of embryos transferred 1.9 1.8 2.6 2.7 3.5 Percentage of embryos transferred resulting in implantation (%) 37.9 29.0 14.0 1 / 19 0 / 7 Percentage of elective single embryo transfers (eSET) (%) 9.9 0 / 13 0 / 17 0 / 5 0 / 2
Outcomes per CyclePercentage of cycles resulting in term, normal weight & singleton live births
e (%) 17.6 5 / 19 10.0 0 / 12 0 / 2 0 / 1
Percentage of cycles resulting in singleton live births (%) 24.5 7 / 19 15.0 0 / 12 0 / 2 0 / 1Percentage of cycles resulting in twin live births (%) 18.6 1 / 19 5.0 0 / 12 0 / 2 0 / 1Percentage of cycles resulting in live births (%) 43.1 8 / 19 20.0 0 / 12 0 / 2 0 / 1Percentage of cycles resulting in pregnancies (%) 47.1 8 / 19 30.0 1 / 12 0 / 2 0 / 1
Outcomes per TransferNumber of transfers 97 17 18 7 2 0Percentage of transfers resulting in term, normal weight & singleton live births
e (%) 18.6 5 / 17 2 / 18 0 / 7 0 / 2
Percentage of transfers resulting in singleton live births (%) 25.8 7 / 17 3 / 18 0 / 7 0 / 2 Percentage of transfers resulting in twin live births (%) 19.6 1 / 17 1 / 18 0 / 7 0 / 2 Percentage of transfers resulting in live births (%) 45.4 8 / 17 4 / 18 0 / 7 0 / 2 Percentage of transfers resulting in pregnancies (%) 49.5 8 / 17 6 / 18 1 / 7 0 / 2
Frozen Embryos from Nondonor EggsNumber of cycles 28 8 7 0 0 0Number of transfers 27 8 7 0 0 0Estimated average number of transfers per retrieval 3.0 4.0 1.0 0.0Average number of embryos transferred 1.9 1.6 1.7 Percentage of embryos transferred resulting in implantation (%) 28.8 6 / 13 2 / 12 Percentage of transfers resulting in term, normal weight & singleton live births
e (%) 18.5 1 / 8 1 / 7
Percentage of transfers resulting in singleton live births (%) 33.3 1 / 8 1 / 7 Percentage of transfers resulting in twin live births (%) 3.7 2 / 8 0 / 7 Percentage of transfers resulting in live births (%) 37.0 3 / 8 1 / 7 Percentage of transfers resulting in pregnancies (%) 44.4 4 / 8 2 / 7
Number of Egg/Embryo Banking Cycles 0 0 0 0 0 1
Donor Eggs Fresh Embryosf Frozen Embryosf
Number of cycles 13 19Number of transfers 12 19Average number of embryos transferred 1.7 1.8Percentage of embryos transferred resulting in implantation (%) 11 / 19 26.5Percentage of transfers resulting in term, normal weight & singleton live births
e (%) 1 / 12 5 / 19
Percentage of transfers resulting in singleton live births (%) 1 / 12 7 / 19Percentage of transfers resulting in twin live births (%) 5 / 12 0 / 19Percentage of transfers resulting in live births (%) 6 / 12 7 / 19Percentage of transfers resulting in pregnancies (%) 7 / 12 8 / 19
CURRENT SERVICES & PROFILE Current Name: OU Physicians Reproductive Medicine
Donor eggs? YesDonor embryos? Yes
Gestational carriers? YesEmbryo cryopreservation? Yes
Single women? YesSART member? Yes
Verified lab accreditation? Yes(See Appendix C for details.)
a Reflects features of fresh nondonor cycles. If IVF is less than 100%, the remaining cycles are GIFT, ZIFT, or a combination of these procedures with IVF.
b Total patient diagnosis percentages may be greater than 100% because more than one diagnosis can be reported for each ART cycle.
c Fractions are used for rates with denominators less than 20. Multiple-infant births (for example, twins) with at least one live infant are counted as one live birth.
d Total cycle number includes those using frozen eggs. It excludes 0 cycle(s) evaluating new procedures. Both cycle types are excluded from ART success rates.
e In this report, births are defined as term if at least 37 full weeks gestation and normal birth weight if at least 2,500 grams (approximately 5 pounds, 8 ounces).
f All ages are reported together because previous data show that patient age does not materially affect success with donor eggs.

393
OK
LA
HO
MA
TULSA FERTILITY CENTERTULSA, OKLAHOMA
Comparison of success rates across clinics may not be meaningful. Patient medical characteristics and treatment approaches vary (see pages 11–20).
Data verified by Stanley G. Prough, MD2014 ART CYCLE PROFILE
Type of ART and Procedural Factors a
IVF 100%Unstimulated 0%Used gestational carrier 0%
With ICSI 83%PGD/PGS 9%
Patient Diagnosis b
Tubal factor 14%Ovulatory dysfunction 15%Diminished ovarian reserve 19%Endometriosis 8%
Uterine factor 0%Male factor 49%Other factor 27%Unknown factor 11%
Multiple Factors: Female factors only 10%Female & male factors 26%
2014 ART SUCCESS RATES c Total number of cyclesd: 314 (includes 0 cycle[s] using frozen eggs)
Type of CycleAge of Woman
<35 35–37 38–40 41–42 43–44 >44Fresh Embryos from Nondonor Eggs
Number of cycles 134 42 21 4 0 0Percentage of cancellations before retrieval (%) 5.2 4.8 14.3 2 / 4 Average number of embryos transferred 1.7 1.7 1.3 1.0 Percentage of embryos transferred resulting in implantation (%) 34.2 30.0 3 / 14 0 / 1 Percentage of elective single embryo transfers (eSET) (%) 7.0 5.0 0 / 3
Outcomes per CyclePercentage of cycles resulting in term, normal weight & singleton live births
e (%) 13.4 21.4 4.8 0 / 4
Percentage of cycles resulting in singleton live births (%) 16.4 23.8 4.8 0 / 4 Percentage of cycles resulting in twin live births (%) 7.5 4.8 4.8 0 / 4 Percentage of cycles resulting in live births (%) 25.4 28.6 9.5 0 / 4 Percentage of cycles resulting in pregnancies (%) 30.6 31.0 9.5 0 / 4
Outcomes per TransferNumber of transfers 94 30 11 1 0 0Percentage of transfers resulting in term, normal weight & singleton live births
e (%) 19.1 30.0 1 / 11 0 / 1
Percentage of transfers resulting in singleton live births (%) 23.4 33.3 1 / 11 0 / 1 Percentage of transfers resulting in twin live births (%) 10.6 6.7 1 / 11 0 / 1 Percentage of transfers resulting in live births (%) 36.2 40.0 2 / 11 0 / 1 Percentage of transfers resulting in pregnancies (%) 43.6 43.3 2 / 11 0 / 1
Frozen Embryos from Nondonor EggsNumber of cycles 47 9 5 1 1 0Number of transfers 45 9 5 1 1 0Estimated average number of transfers per retrieval 1.7 1.3 0.6 0.1 1.0 Average number of embryos transferred 1.6 1.4 1.2 2.0 1.0 Percentage of embryos transferred resulting in implantation (%) 48.6 8 / 13 2 / 6 0 / 2 0 / 1 Percentage of transfers resulting in term, normal weight & singleton live births
e (%) 26.7 3 / 9 2 / 5 0 / 1 0 / 1
Percentage of transfers resulting in singleton live births (%) 33.3 6 / 9 2 / 5 0 / 1 0 / 1 Percentage of transfers resulting in twin live births (%) 15.6 1 / 9 0 / 5 0 / 1 0 / 1 Percentage of transfers resulting in live births (%) 51.1 7 / 9 2 / 5 0 / 1 0 / 1 Percentage of transfers resulting in pregnancies (%) 55.6 7 / 9 2 / 5 0 / 1 0 / 1
Number of Egg/Embryo Banking Cycles 6 4 6 5 1 0
Donor Eggs Fresh Embryosf Frozen Embryosf
Number of cycles 13 15Number of transfers 8 15Average number of embryos transferred 1.9 1.7Percentage of embryos transferred resulting in implantation (%) 6 / 15 28.0Percentage of transfers resulting in term, normal weight & singleton live births
e (%) 2 / 8 6 / 15
Percentage of transfers resulting in singleton live births (%) 2 / 8 6 / 15Percentage of transfers resulting in twin live births (%) 2 / 8 0 / 15Percentage of transfers resulting in live births (%) 4 / 8 6 / 15Percentage of transfers resulting in pregnancies (%) 4 / 8 7 / 15
CURRENT SERVICES & PROFILE Current Name: Tulsa Fertility Center
Donor eggs? YesDonor embryos? Yes
Gestational carriers? NoEmbryo cryopreservation? Yes
Single women? YesSART member? Yes
Verified lab accreditation? Yes(See Appendix C for details.)
a Reflects features of fresh nondonor cycles. If IVF is less than 100%, the remaining cycles are GIFT, ZIFT, or a combination of these procedures with IVF.
b Total patient diagnosis percentages may be greater than 100% because more than one diagnosis can be reported for each ART cycle.
c Fractions are used for rates with denominators less than 20. Multiple-infant births (for example, twins) with at least one live infant are counted as one live birth.
d Total cycle number includes those using frozen eggs. It excludes 0 cycle(s) evaluating new procedures. Both cycle types are excluded from ART success rates.
e In this report, births are defined as term if at least 37 full weeks gestation and normal birth weight if at least 2,500 grams (approximately 5 pounds, 8 ounces).
f All ages are reported together because previous data show that patient age does not materially affect success with donor eggs.

394
OR
EG
ON
THE FERTILITY CENTER OF OREGONEUGENE, OREGON
Comparison of success rates across clinics may not be meaningful. Patient medical characteristics and treatment approaches vary (see pages 11–20).
Data verified by Douglas J. Austin, MD2014 ART CYCLE PROFILE
Type of ART and Procedural Factors a
IVF 100%Unstimulated 0%Used gestational carrier 1%
With ICSI 90%PGD/PGS 10%
Patient Diagnosis b
Tubal factor 10%Ovulatory dysfunction 29%Diminished ovarian reserve 33%Endometriosis 4%
Uterine factor 4%Male factor 46%Other factor 6%Unknown factor 6%
Multiple Factors: Female factors only 5%Female & male factors 30%
2014 ART SUCCESS RATES c Total number of cyclesd: 163 (includes 0 cycle[s] using frozen eggs)
Type of CycleAge of Woman
<35 35–37 38–40 41–42 43–44 >44Fresh Embryos from Nondonor Eggs
Number of cycles 57 18 7 4 1 1Percentage of cancellations before retrieval (%) 5.3 1 / 18 0 / 7 0 / 4 0 / 1 0 / 1Average number of embryos transferred 2.1 2.1 2.6 3.8 2.0 Percentage of embryos transferred resulting in implantation (%) 31.0 35.5 2 / 18 0 / 15 1 / 2 Percentage of elective single embryo transfers (eSET) (%) 5.7 1 / 15 0 / 7 0 / 4 0 / 1
Outcomes per CyclePercentage of cycles resulting in term, normal weight & singleton live births
e (%) 21.1 7 / 18 0 / 7 0 / 4 0 / 1 0 / 1
Percentage of cycles resulting in singleton live births (%) 26.3 8 / 18 1 / 7 0 / 4 0 / 1 0 / 1Percentage of cycles resulting in twin live births (%) 10.5 0 / 18 0 / 7 0 / 4 0 / 1 0 / 1Percentage of cycles resulting in live births (%) 36.8 8 / 18 1 / 7 0 / 4 0 / 1 0 / 1Percentage of cycles resulting in pregnancies (%) 47.4 9 / 18 2 / 7 0 / 4 1 / 1 0 / 1
Outcomes per TransferNumber of transfers 53 15 7 4 1 0Percentage of transfers resulting in term, normal weight & singleton live births
e (%) 22.6 7 / 15 0 / 7 0 / 4 0 / 1
Percentage of transfers resulting in singleton live births (%) 28.3 8 / 15 1 / 7 0 / 4 0 / 1 Percentage of transfers resulting in twin live births (%) 11.3 0 / 15 0 / 7 0 / 4 0 / 1 Percentage of transfers resulting in live births (%) 39.6 8 / 15 1 / 7 0 / 4 0 / 1 Percentage of transfers resulting in pregnancies (%) 50.9 9 / 15 2 / 7 0 / 4 1 / 1
Frozen Embryos from Nondonor EggsNumber of cycles 32 11 5 5 1 0Number of transfers 31 11 5 5 1 0Estimated average number of transfers per retrieval 2.2 2.8 5.0 5.0 Average number of embryos transferred 2.2 1.9 1.8 2.6 2.0 Percentage of embryos transferred resulting in implantation (%) 27.9 19.0 3 / 9 0 / 13 0 / 2 Percentage of transfers resulting in term, normal weight & singleton live births
e (%) 22.6 1 / 11 0 / 5 0 / 5 0 / 1
Percentage of transfers resulting in singleton live births (%) 25.8 1 / 11 0 / 5 0 / 5 0 / 1 Percentage of transfers resulting in twin live births (%) 12.9 1 / 11 0 / 5 0 / 5 0 / 1 Percentage of transfers resulting in live births (%) 38.7 2 / 11 0 / 5 0 / 5 0 / 1 Percentage of transfers resulting in pregnancies (%) 45.2 3 / 11 3 / 5 0 / 5 0 / 1
Number of Egg/Embryo Banking Cycles 1 1 0 0 0 0
Donor Eggs Fresh Embryosf Frozen Embryosf
Number of cycles 4 15Number of transfers 4 15Average number of embryos transferred 2.3 1.9Percentage of embryos transferred resulting in implantation (%) 8 / 9 17.9Percentage of transfers resulting in term, normal weight & singleton live births
e (%) 1 / 4 2 / 15
Percentage of transfers resulting in singleton live births (%) 1 / 4 2 / 15Percentage of transfers resulting in twin live births (%) 2 / 4 1 / 15Percentage of transfers resulting in live births (%) 4 / 4 3 / 15Percentage of transfers resulting in pregnancies (%) 4 / 4 4 / 15
CURRENT SERVICES & PROFILE Current Name: The Fertility Center of Oregon
Donor eggs? YesDonor embryos? Yes
Gestational carriers? YesEmbryo cryopreservation? Yes
Single women? YesSART member? No
Verified lab accreditation? No(See Appendix C for details.)
a Reflects features of fresh nondonor cycles. If IVF is less than 100%, the remaining cycles are GIFT, ZIFT, or a combination of these procedures with IVF.
b Total patient diagnosis percentages may be greater than 100% because more than one diagnosis can be reported for each ART cycle.
c Fractions are used for rates with denominators less than 20. Multiple-infant births (for example, twins) with at least one live infant are counted as one live birth.
d Total cycle number includes those using frozen eggs. It excludes 0 cycle(s) evaluating new procedures. Both cycle types are excluded from ART success rates.
e In this report, births are defined as term if at least 37 full weeks gestation and normal birth weight if at least 2,500 grams (approximately 5 pounds, 8 ounces).
f All ages are reported together because previous data show that patient age does not materially affect success with donor eggs.

395
OR
EG
ON
NORTHWEST FERTILITY CENTERPORTLAND, OREGON
Comparison of success rates across clinics may not be meaningful. Patient medical characteristics and treatment approaches vary (see pages 11–20).
Data verified by Eugene M. Stoelk, MD2014 ART CYCLE PROFILE
Type of ART and Procedural Factors a
IVF 100%Unstimulated 0%Used gestational carrier 3%
With ICSI 42%PGD/PGS 1%
Patient Diagnosis b
Tubal factor 30%Ovulatory dysfunction 9%Diminished ovarian reserve 27%Endometriosis 14%
Uterine factor <1%Male factor 37%Other factor 3%Unknown factor 6%
Multiple Factors: Female factors only 14%Female & male factors 12%
2014 ART SUCCESS RATES c Total number of cyclesd: 151 (includes 0 cycle[s] using frozen eggs)
Type of CycleAge of Woman
<35 35–37 38–40 41–42 43–44 >44Fresh Embryos from Nondonor Eggs
Number of cycles 42 15 15 4 2 0Percentage of cancellations before retrieval (%) 16.7 2 / 15 1 / 15 0 / 4 0 / 2 Average number of embryos transferred 1.8 1.8 2.6 3.0 3.5 Percentage of embryos transferred resulting in implantation (%) 40.4 43.5 35.3 1 / 12 2 / 7 Percentage of elective single embryo transfers (eSET) (%) 13.3 1 / 10 0 / 13 0 / 4 0 / 2
Outcomes per CyclePercentage of cycles resulting in term, normal weight & singleton live births
e (%) 19.0 3 / 15 2 / 15 1 / 4 1 / 2
Percentage of cycles resulting in singleton live births (%) 21.4 5 / 15 4 / 15 1 / 4 2 / 2 Percentage of cycles resulting in twin live births (%) 16.7 2 / 15 3 / 15 0 / 4 0 / 2 Percentage of cycles resulting in live births (%) 38.1 7 / 15 7 / 15 1 / 4 2 / 2 Percentage of cycles resulting in pregnancies (%) 38.1 7 / 15 9 / 15 1 / 4 2 / 2
Outcomes per TransferNumber of transfers 31 13 13 4 2 0Percentage of transfers resulting in term, normal weight & singleton live births
e (%) 25.8 3 / 13 2 / 13 1 / 4 1 / 2
Percentage of transfers resulting in singleton live births (%) 29.0 5 / 13 4 / 13 1 / 4 2 / 2 Percentage of transfers resulting in twin live births (%) 22.6 2 / 13 3 / 13 0 / 4 0 / 2 Percentage of transfers resulting in live births (%) 51.6 7 / 13 7 / 13 1 / 4 2 / 2 Percentage of transfers resulting in pregnancies (%) 51.6 7 / 13 9 / 13 1 / 4 2 / 2
Frozen Embryos from Nondonor EggsNumber of cycles 23 13 8 2 0 0Number of transfers 23 13 8 2 0 0Estimated average number of transfers per retrieval 2.1 4.3 1.1 2.0 Average number of embryos transferred 1.7 1.8 2.0 1.5 Percentage of embryos transferred resulting in implantation (%) 47.5 17.4 7 / 16 0 / 3 Percentage of transfers resulting in term, normal weight & singleton live births
e (%) 17.4 3 / 13 5 / 8 0 / 2
Percentage of transfers resulting in singleton live births (%) 21.7 4 / 13 5 / 8 0 / 2 Percentage of transfers resulting in twin live births (%) 21.7 0 / 13 1 / 8 0 / 2 Percentage of transfers resulting in live births (%) 47.8 4 / 13 6 / 8 0 / 2 Percentage of transfers resulting in pregnancies (%) 47.8 4 / 13 6 / 8 0 / 2
Number of Egg/Embryo Banking Cycles 1 2 1 0 0 0
Donor Eggs Fresh Embryosf Frozen Embryosf
Number of cycles 18 5Number of transfers 18 5Average number of embryos transferred 2.1 2.0Percentage of embryos transferred resulting in implantation (%) 59.5 2 / 10Percentage of transfers resulting in term, normal weight & singleton live births
e (%) 7 / 18 1 / 5
Percentage of transfers resulting in singleton live births (%) 7 / 18 2 / 5Percentage of transfers resulting in twin live births (%) 6 / 18 0 / 5Percentage of transfers resulting in live births (%) 14 / 18 2 / 5Percentage of transfers resulting in pregnancies (%) 14 / 18 2 / 5
CURRENT SERVICES & PROFILE Current Name: Northwest Fertility Center
Donor eggs? YesDonor embryos? Yes
Gestational carriers? YesEmbryo cryopreservation? Yes
Single women? YesSART member? Yes
Verified lab accreditation? Yes(See Appendix C for details.)
a Reflects features of fresh nondonor cycles. If IVF is less than 100%, the remaining cycles are GIFT, ZIFT, or a combination of these procedures with IVF.
b Total patient diagnosis percentages may be greater than 100% because more than one diagnosis can be reported for each ART cycle.
c Fractions are used for rates with denominators less than 20. Multiple-infant births (for example, twins) with at least one live infant are counted as one live birth.
d Total cycle number includes those using frozen eggs. It excludes 0 cycle(s) evaluating new procedures. Both cycle types are excluded from ART success rates.
e In this report, births are defined as term if at least 37 full weeks gestation and normal birth weight if at least 2,500 grams (approximately 5 pounds, 8 ounces).
f All ages are reported together because previous data show that patient age does not materially affect success with donor eggs.

396
OR
EG
ON
OREGON REPRODUCTIVE MEDICINEPORTLAND, OREGON
Comparison of success rates across clinics may not be meaningful. Patient medical characteristics and treatment approaches vary (see pages 11–20).
Data verified by John S. Hesla, MD2014 ART CYCLE PROFILE
Type of ART and Procedural Factors a
IVF 100%Unstimulated 7%Used gestational carrier 2%
With ICSI 77%PGD/PGS 15%
Patient Diagnosis b
Tubal factor 6%Ovulatory dysfunction 7%Diminished ovarian reserve 28%Endometriosis 7%
Uterine factor 2%Male factor 22%Other factor 30%Unknown factor 14%
Multiple Factors: Female factors only 7%Female & male factors 8%
2014 ART SUCCESS RATES c Total number of cyclesd: 1,393 (includes 1 cycle[s] using frozen eggs)
Type of CycleAge of Woman
<35 35–37 38–40 41–42 43–44 >44Fresh Embryos from Nondonor Eggs
Number of cycles 176 109 56 34 19 5Percentage of cancellations before retrieval (%) 2.3 11.9 25.0 14.7 3 / 19 1 / 5Average number of embryos transferred 1.8 1.8 1.6 1.7 2.0 2.0Percentage of embryos transferred resulting in implantation (%) 61.9 54.4 50.0 6 / 16 1 / 2 1 / 2Percentage of elective single embryo transfers (eSET) (%) 14.4 15.0 26.1 1 / 7 0 / 1 0 / 1
Outcomes per CyclePercentage of cycles resulting in term, normal weight & singleton live births
e (%) 31.3 22.9 21.4 8.8 1 / 19 1 / 5
Percentage of cycles resulting in singleton live births (%) 35.8 24.8 21.4 11.8 1 / 19 1 / 5Percentage of cycles resulting in twin live births (%) 21.6 20.2 5.4 2.9 0 / 19 0 / 5Percentage of cycles resulting in live births (%) 58.5 45.9 26.8 14.7 1 / 19 1 / 5Percentage of cycles resulting in pregnancies (%) 66.5 53.2 32.1 17.6 1 / 19 1 / 5
Outcomes per TransferNumber of transfers 157 87 28 10 1 1Percentage of transfers resulting in term, normal weight & singleton live births
e (%) 35.0 28.7 42.9 3 / 10 1 / 1 1 / 1
Percentage of transfers resulting in singleton live births (%) 40.1 31.0 42.9 4 / 10 1 / 1 1 / 1Percentage of transfers resulting in twin live births (%) 24.2 25.3 10.7 1 / 10 0 / 1 0 / 1Percentage of transfers resulting in live births (%) 65.6 57.5 53.6 5 / 10 1 / 1 1 / 1Percentage of transfers resulting in pregnancies (%) 74.5 66.7 64.3 6 / 10 1 / 1 1 / 1
Frozen Embryos from Nondonor EggsNumber of cycles 106 101 95 37 20 8Number of transfers 97 99 89 35 18 8Estimated average number of transfers per retrieval 0.8 0.9 0.8 0.6 0.7 0.2Average number of embryos transferred 1.5 1.6 1.4 1.3 1.3 1.3Percentage of embryos transferred resulting in implantation (%) 67.4 63.5 56.6 61.4 50.0 8 / 10Percentage of transfers resulting in term, normal weight & singleton live births
e (%) 38.1 47.5 40.4 42.9 8 / 18 3 / 8
Percentage of transfers resulting in singleton live births (%) 48.5 52.5 49.4 45.7 8 / 18 4 / 8Percentage of transfers resulting in twin live births (%) 19.6 16.2 6.7 11.4 1 / 18 0 / 8Percentage of transfers resulting in live births (%) 68.0 69.7 56.2 57.1 9 / 18 4 / 8Percentage of transfers resulting in pregnancies (%) 74.2 76.8 69.7 68.6 10 / 18 5 / 8
Number of Egg/Embryo Banking Cycles 101 90 108 52 25 34
Donor Eggs Fresh Embryosf Frozen Embryosf
Number of cycles 79 137Number of transfers 72 132Average number of embryos transferred 1.5 1.5Percentage of embryos transferred resulting in implantation (%) 85.0 70.7Percentage of transfers resulting in term, normal weight & singleton live births
e (%) 44.4 34.1
Percentage of transfers resulting in singleton live births (%) 50.0 43.2Percentage of transfers resulting in twin live births (%) 33.3 22.0Percentage of transfers resulting in live births (%) 83.3 65.2Percentage of transfers resulting in pregnancies (%) 87.5 79.5
CURRENT SERVICES & PROFILE Current Name: Oregon Reproductive Medicine
Donor eggs? YesDonor embryos? Yes
Gestational carriers? YesEmbryo cryopreservation? Yes
Single women? YesSART member? Yes
Verified lab accreditation? Pending(See Appendix C for details.)
a Reflects features of fresh nondonor cycles. If IVF is less than 100%, the remaining cycles are GIFT, ZIFT, or a combination of these procedures with IVF.
b Total patient diagnosis percentages may be greater than 100% because more than one diagnosis can be reported for each ART cycle.
c Fractions are used for rates with denominators less than 20. Multiple-infant births (for example, twins) with at least one live infant are counted as one live birth.
d Total cycle number includes those using frozen eggs. It excludes 0 cycle(s) evaluating new procedures. Both cycle types are excluded from ART success rates.
e In this report, births are defined as term if at least 37 full weeks gestation and normal birth weight if at least 2,500 grams (approximately 5 pounds, 8 ounces).
f All ages are reported together because previous data show that patient age does not materially affect success with donor eggs.

397
OR
EG
ON
UNIVERSITY FERTILITY CONSULTANTSOREGON HEALTH & SCIENCE UNIVERSITY
PORTLAND, OREGONComparison of success rates across clinics may not be meaningful. Patient medical characteristics and treatment approaches vary (see pages 11–20).
Data verified by David M. Lee, MD2014 ART CYCLE PROFILE
Type of ART and Procedural Factors a
IVF 100%Unstimulated 0%Used gestational carrier 5%
With ICSI 82%PGD/PGS 0%
Patient Diagnosis b
Tubal factor 14%Ovulatory dysfunction 10%Diminished ovarian reserve 41%Endometriosis 7%
Uterine factor 3%Male factor 45%Other factor 21%Unknown factor 6%
Multiple Factors: Female factors only 16%Female & male factors 27%
2014 ART SUCCESS RATES c Total number of cyclesd: 458 (includes 4 cycle[s] using frozen eggs)
Type of CycleAge of Woman
<35 35–37 38–40 41–42 43–44 >44Fresh Embryos from Nondonor Eggs
Number of cycles 78 47 31 13 4 1Percentage of cancellations before retrieval (%) 5.1 17.0 12.9 4 / 13 2 / 4 0 / 1Average number of embryos transferred 1.8 2.0 2.1 2.2 2.0 4.0Percentage of embryos transferred resulting in implantation (%) 50.0 35.6 12.2 2 / 11 0 / 4Percentage of elective single embryo transfers (eSET) (%) 26.9 13.6 0 / 18 0 / 4 0 / 1 0 / 1
Outcomes per CyclePercentage of cycles resulting in term, normal weight & singleton live births
e (%) 20.5 14.9 3.2 1 / 13 0 / 4 0 / 1
Percentage of cycles resulting in singleton live births (%) 23.1 14.9 3.2 1 / 13 0 / 4 0 / 1Percentage of cycles resulting in twin live births (%) 14.1 4.3 3.2 0 / 13 0 / 4 0 / 1Percentage of cycles resulting in live births (%) 37.2 19.1 6.5 1 / 13 0 / 4 0 / 1Percentage of cycles resulting in pregnancies (%) 39.7 27.7 12.9 2 / 13 1 / 4 0 / 1
Outcomes per TransferNumber of transfers 53 23 20 5 1 1Percentage of transfers resulting in term, normal weight & singleton live births
e (%) 30.2 30.4 5.0 1 / 5 0 / 1 0 / 1
Percentage of transfers resulting in singleton live births (%) 34.0 30.4 5.0 1 / 5 0 / 1 0 / 1Percentage of transfers resulting in twin live births (%) 20.8 8.7 5.0 0 / 5 0 / 1 0 / 1Percentage of transfers resulting in live births (%) 54.7 39.1 10.0 1 / 5 0 / 1 0 / 1Percentage of transfers resulting in pregnancies (%) 58.5 56.5 20.0 2 / 5 1 / 1 0 / 1
Frozen Embryos from Nondonor EggsNumber of cycles 65 30 30 10 3 2Number of transfers 63 28 27 8 3 2Estimated average number of transfers per retrieval 1.5 1.0 1.3 1.1 1.5 2.0Average number of embryos transferred 1.7 1.8 1.7 2.0 1.7 2.0Percentage of embryos transferred resulting in implantation (%) 42.7 52.0 29.5 8 / 16 2 / 5 0 / 4Percentage of transfers resulting in term, normal weight & singleton live births
e (%) 31.7 46.4 25.9 4 / 8 2 / 3 0 / 2
Percentage of transfers resulting in singleton live births (%) 36.5 57.1 33.3 4 / 8 2 / 3 0 / 2Percentage of transfers resulting in twin live births (%) 15.9 10.7 0.0 2 / 8 0 / 3 0 / 2Percentage of transfers resulting in live births (%) 52.4 67.9 37.0 6 / 8 2 / 3 0 / 2Percentage of transfers resulting in pregnancies (%) 55.6 67.9 44.4 6 / 8 2 / 3 0 / 2
Number of Egg/Embryo Banking Cycles 22 13 14 5 2 0
Donor Eggs Fresh Embryosf Frozen Embryosf
Number of cycles 47 37Number of transfers 41 35Average number of embryos transferred 1.6 1.7Percentage of embryos transferred resulting in implantation (%) 70.8 35.7Percentage of transfers resulting in term, normal weight & singleton live births
e (%) 34.1 25.7
Percentage of transfers resulting in singleton live births (%) 39.0 31.4Percentage of transfers resulting in twin live births (%) 29.3 5.7Percentage of transfers resulting in live births (%) 68.3 37.1Percentage of transfers resulting in pregnancies (%) 75.6 48.6
CURRENT SERVICES & PROFILE Current Name: University Fertility Consultants, Oregon Health & Science University
Donor eggs? YesDonor embryos? Yes
Gestational carriers? YesEmbryo cryopreservation? Yes
Single women? YesSART member? Yes
Verified lab accreditation? Yes(See Appendix C for details.)
a Reflects features of fresh nondonor cycles. If IVF is less than 100%, the remaining cycles are GIFT, ZIFT, or a combination of these procedures with IVF.
b Total patient diagnosis percentages may be greater than 100% because more than one diagnosis can be reported for each ART cycle.
c Fractions are used for rates with denominators less than 20. Multiple-infant births (for example, twins) with at least one live infant are counted as one live birth.
d Total cycle number includes those using frozen eggs. It excludes 0 cycle(s) evaluating new procedures. Both cycle types are excluded from ART success rates.
e In this report, births are defined as term if at least 37 full weeks gestation and normal birth weight if at least 2,500 grams (approximately 5 pounds, 8 ounces).
f All ages are reported together because previous data show that patient age does not materially affect success with donor eggs.

398
PE
NN
SY
LVA
NIA
ABINGTON REPRODUCTIVE MEDICINE, ABINGTON IVF AND GENETICSTOLL CENTER FOR REPRODUCTIVE SCIENCES
ABINGTON, PENNSYLVANIAComparison of success rates across clinics may not be meaningful. Patient medical characteristics and treatment approaches vary (see pages 11–20).
Data verified by Stephen G. Somkuti, MD, PhD2014 ART CYCLE PROFILE
Type of ART and Procedural Factors a
IVF 100%Unstimulated 0%Used gestational carrier <1%
With ICSI 80%PGD/PGS <1%
Patient Diagnosis b
Tubal factor 3%Ovulatory dysfunction 8%Diminished ovarian reserve 22%Endometriosis 3%
Uterine factor <1%Male factor 16%Other factor 49%Unknown factor 7%
Multiple Factors: Female factors only 2%Female & male factors 5%
2014 ART SUCCESS RATES c Total number of cyclesd: 523 (includes 2 cycle[s] using frozen eggs)
Type of CycleAge of Woman
<35 35–37 38–40 41–42 43–44 >44Fresh Embryos from Nondonor Eggs
Number of cycles 165 93 76 26 5 4Percentage of cancellations before retrieval (%) 6.1 8.6 10.5 19.2 0 / 5 0 / 4Average number of embryos transferred 2.0 2.3 2.6 2.6 1.7 2.8Percentage of embryos transferred resulting in implantation (%) 33.0 20.9 21.4 17.1 0 / 5 0 / 11Percentage of elective single embryo transfers (eSET) (%) 4.8 3.2 0.0 0 / 11 0 / 2 0 / 1
Outcomes per CyclePercentage of cycles resulting in term, normal weight & singleton live births
e (%) 17.6 14.0 11.8 11.5 0 / 5 0 / 4
Percentage of cycles resulting in singleton live births (%) 18.8 20.4 14.5 11.5 0 / 5 0 / 4Percentage of cycles resulting in twin live births (%) 15.2 2.2 5.3 0.0 0 / 5 0 / 4Percentage of cycles resulting in live births (%) 33.9 22.6 21.1 15.4 0 / 5 0 / 4Percentage of cycles resulting in pregnancies (%) 38.8 32.3 30.3 19.2 0 / 5 0 / 4
Outcomes per TransferNumber of transfers 144 71 56 16 3 4Percentage of transfers resulting in term, normal weight & singleton live births
e (%) 20.1 18.3 16.1 3 / 16 0 / 3 0 / 4
Percentage of transfers resulting in singleton live births (%) 21.5 26.8 19.6 3 / 16 0 / 3 0 / 4Percentage of transfers resulting in twin live births (%) 17.4 2.8 7.1 0 / 16 0 / 3 0 / 4Percentage of transfers resulting in live births (%) 38.9 29.6 28.6 4 / 16 0 / 3 0 / 4Percentage of transfers resulting in pregnancies (%) 44.4 42.3 41.1 5 / 16 0 / 3 0 / 4
Frozen Embryos from Nondonor EggsNumber of cycles 41 28 18 2 1 2Number of transfers 41 28 17 2 1 2Estimated average number of transfers per retrieval 2.0 2.8 1.4 1.0 1.0 Average number of embryos transferred 1.5 1.8 1.9 1.5 3.0 2.0Percentage of embryos transferred resulting in implantation (%) 23.3 27.7 9.1 0 / 2 0 / 3 1 / 4Percentage of transfers resulting in term, normal weight & singleton live births
e (%) 19.5 17.9 2 / 17 0 / 2 0 / 1 1 / 2
Percentage of transfers resulting in singleton live births (%) 26.8 17.9 2 / 17 0 / 2 0 / 1 1 / 2Percentage of transfers resulting in twin live births (%) 0.0 10.7 0 / 17 0 / 2 0 / 1 0 / 2Percentage of transfers resulting in live births (%) 26.8 28.6 2 / 17 0 / 2 0 / 1 1 / 2Percentage of transfers resulting in pregnancies (%) 34.1 39.3 3 / 17 1 / 2 0 / 1 1 / 2
Number of Egg/Embryo Banking Cycles 7 4 8 2 1 0
Donor Eggs Fresh Embryosf Frozen Embryosf
Number of cycles 15 23Number of transfers 15 23Average number of embryos transferred 1.8 1.9Percentage of embryos transferred resulting in implantation (%) 66.7 29.5Percentage of transfers resulting in term, normal weight & singleton live births
e (%) 3 / 15 13.0
Percentage of transfers resulting in singleton live births (%) 4 / 15 30.4Percentage of transfers resulting in twin live births (%) 6 / 15 8.7Percentage of transfers resulting in live births (%) 10 / 15 39.1Percentage of transfers resulting in pregnancies (%) 12 / 15 43.5
CURRENT SERVICES & PROFILECurrent Name: Abington Reproductive Medicine, Abington IVF and Genetics,
Toll Center for Reproductive Sciences
Donor eggs? YesDonor embryos? Yes
Gestational carriers? YesEmbryo cryopreservation? Yes
Single women? YesSART member? Yes
Verified lab accreditation? Yes(See Appendix C for details.)
a Reflects features of fresh nondonor cycles. If IVF is less than 100%, the remaining cycles are GIFT, ZIFT, or a combination of these procedures with IVF.
b Total patient diagnosis percentages may be greater than 100% because more than one diagnosis can be reported for each ART cycle.
c Fractions are used for rates with denominators less than 20. Multiple-infant births (for example, twins) with at least one live infant are counted as one live birth.
d Total cycle number includes those using frozen eggs. It excludes 0 cycle(s) evaluating new procedures. Both cycle types are excluded from ART success rates.
e In this report, births are defined as term if at least 37 full weeks gestation and normal birth weight if at least 2,500 grams (approximately 5 pounds, 8 ounces).
f All ages are reported together because previous data show that patient age does not materially affect success with donor eggs.

399
PE
NN
SY
LVA
NIA
INFERTILITY SOLUTIONS, PCALLENTOWN, PENNSYLVANIA
Comparison of success rates across clinics may not be meaningful. Patient medical characteristics and treatment approaches vary (see pages 11–20).
Data verified by Bruce I. Rose, MD, PhD2014 ART CYCLE PROFILE
Type of ART and Procedural Factors a
IVF 100%Unstimulated 0%Used gestational carrier 0%
With ICSI 88%PGD/PGS 0%
Patient Diagnosis b
Tubal factor 16%Ovulatory dysfunction 29%Diminished ovarian reserve 29%Endometriosis 18%
Uterine factor 6%Male factor 53%Other factor 4%Unknown factor 4%
Multiple Factors: Female factors only 18%Female & male factors 31%
2014 ART SUCCESS RATES c Total number of cyclesd: 51 (includes 0 cycle[s] using frozen eggs)
Type of CycleAge of Woman
<35 35–37 38–40 41–42 43–44 >44Fresh Embryos from Nondonor Eggs
Number of cycles 14 5 16 4 1 2Percentage of cancellations before retrieval (%) 0 / 14 1 / 5 2 / 16 0 / 4 0 / 1 0 / 2Average number of embryos transferred 2.4 2.3 2.3 3.7 2.0 1.0Percentage of embryos transferred resulting in implantation (%) 23.3 1 / 7 5.0 1 / 11 0 / 2 0 / 2Percentage of elective single embryo transfers (eSET) (%) 0 / 13 0 / 3 0 / 8 0 / 3 0 / 1
Outcomes per CyclePercentage of cycles resulting in term, normal weight & singleton live births
e (%) 5 / 14 1 / 5 1 / 16 1 / 4 0 / 1 0 / 2
Percentage of cycles resulting in singleton live births (%) 5 / 14 1 / 5 1 / 16 1 / 4 0 / 1 0 / 2Percentage of cycles resulting in twin live births (%) 1 / 14 0 / 5 0 / 16 0 / 4 0 / 1 0 / 2Percentage of cycles resulting in live births (%) 6 / 14 1 / 5 1 / 16 1 / 4 0 / 1 0 / 2Percentage of cycles resulting in pregnancies (%) 7 / 14 1 / 5 2 / 16 1 / 4 0 / 1 0 / 2
Outcomes per TransferNumber of transfers 14 3 10 3 1 2Percentage of transfers resulting in term, normal weight & singleton live births
e (%) 5 / 14 1 / 3 1 / 10 1 / 3 0 / 1 0 / 2
Percentage of transfers resulting in singleton live births (%) 5 / 14 1 / 3 1 / 10 1 / 3 0 / 1 0 / 2Percentage of transfers resulting in twin live births (%) 1 / 14 0 / 3 0 / 10 0 / 3 0 / 1 0 / 2Percentage of transfers resulting in live births (%) 6 / 14 1 / 3 1 / 10 1 / 3 0 / 1 0 / 2Percentage of transfers resulting in pregnancies (%) 7 / 14 1 / 3 2 / 10 1 / 3 0 / 1 0 / 2
Frozen Embryos from Nondonor EggsNumber of cycles 1 1 3 0 0 0Number of transfers 1 1 3 0 0 0Estimated average number of transfers per retrieval 1.0 Average number of embryos transferred 3.0 2.0 2.3 Percentage of embryos transferred resulting in implantation (%) 2 / 3 2 / 2 0 / 7 Percentage of transfers resulting in term, normal weight & singleton live births
e (%) 0 / 1 0 / 1 0 / 3
Percentage of transfers resulting in singleton live births (%) 0 / 1 0 / 1 0 / 3 Percentage of transfers resulting in twin live births (%) 1 / 1 1 / 1 0 / 3 Percentage of transfers resulting in live births (%) 1 / 1 1 / 1 0 / 3 Percentage of transfers resulting in pregnancies (%) 1 / 1 1 / 1 0 / 3
Number of Egg/Embryo Banking Cycles 0 0 0 0 0 0
Donor Eggs Fresh Embryosf Frozen Embryosf
Number of cycles 0 4Number of transfers 0 4Average number of embryos transferred 2.5Percentage of embryos transferred resulting in implantation (%) 3 / 10Percentage of transfers resulting in term, normal weight & singleton live births
e (%) 2 / 4
Percentage of transfers resulting in singleton live births (%) 2 / 4Percentage of transfers resulting in twin live births (%) 0 / 4Percentage of transfers resulting in live births (%) 2 / 4Percentage of transfers resulting in pregnancies (%) 3 / 4
CURRENT SERVICES & PROFILE Current Name: Infertility Solutions, PC
Donor eggs? YesDonor embryos? Yes
Gestational carriers? YesEmbryo cryopreservation? Yes
Single women? YesSART member? No
Verified lab accreditation? No(See Appendix C for details.)
a Reflects features of fresh nondonor cycles. If IVF is less than 100%, the remaining cycles are GIFT, ZIFT, or a combination of these procedures with IVF.
b Total patient diagnosis percentages may be greater than 100% because more than one diagnosis can be reported for each ART cycle.
c Fractions are used for rates with denominators less than 20. Multiple-infant births (for example, twins) with at least one live infant are counted as one live birth.
d Total cycle number includes those using frozen eggs. It excludes 21 cycle(s) evaluating new procedures. Both cycle types are excluded from ART success rates.
e In this report, births are defined as term if at least 37 full weeks gestation and normal birth weight if at least 2,500 grams (approximately 5 pounds, 8 ounces).
f All ages are reported together because previous data show that patient age does not materially affect success with donor eggs.

400
PE
NN
SY
LVA
NIA
REPRODUCTIVE MEDICINE ASSOCIATES OF PENNSYLVANIAALLENTOWN, PENNSYLVANIA
Comparison of success rates across clinics may not be meaningful. Patient medical characteristics and treatment approaches vary (see pages 11–20).
Data verified by Wendy J. Schillings, MD2014 ART CYCLE PROFILE
Type of ART and Procedural Factors a
IVF 100%Unstimulated 0%Used gestational carrier 0%
With ICSI 76%PGD/PGS 33%
Patient Diagnosis b
Tubal factor 9%Ovulatory dysfunction 23%Diminished ovarian reserve 14%Endometriosis 8%
Uterine factor 7%Male factor 50%Other factor 34%Unknown factor 0%
Multiple Factors: Female factors only 7%Female & male factors 33%
2014 ART SUCCESS RATES c Total number of cyclesd: 254 (includes 8 cycle[s] using frozen eggs)
Type of CycleAge of Woman
<35 35–37 38–40 41–42 43–44 >44Fresh Embryos from Nondonor Eggs
Number of cycles 62 18 10 3 0 0Percentage of cancellations before retrieval (%) 4.8 1 / 18 4 / 10 1 / 3 Average number of embryos transferred 1.7 1.5 1.5 Percentage of embryos transferred resulting in implantation (%) 76.7 9 / 18 0 / 3 Percentage of elective single embryo transfers (eSET) (%) 31.6 6 / 12 1 / 2
Outcomes per CyclePercentage of cycles resulting in term, normal weight & singleton live births
e (%) 22.6 4 / 18 0 / 10 0 / 3
Percentage of cycles resulting in singleton live births (%) 29.0 5 / 18 0 / 10 0 / 3 Percentage of cycles resulting in twin live births (%) 17.7 1 / 18 0 / 10 0 / 3 Percentage of cycles resulting in live births (%) 46.8 6 / 18 0 / 10 0 / 3 Percentage of cycles resulting in pregnancies (%) 56.5 9 / 18 0 / 10 0 / 3
Outcomes per TransferNumber of transfers 40 13 2 0 0 0Percentage of transfers resulting in term, normal weight & singleton live births
e (%) 35.0 4 / 13 0 / 2
Percentage of transfers resulting in singleton live births (%) 45.0 5 / 13 0 / 2 Percentage of transfers resulting in twin live births (%) 27.5 1 / 13 0 / 2 Percentage of transfers resulting in live births (%) 72.5 6 / 13 0 / 2 Percentage of transfers resulting in pregnancies (%) 87.5 9 / 13 0 / 2
Frozen Embryos from Nondonor EggsNumber of cycles 49 27 10 4 1 0Number of transfers 48 24 8 4 0 0Estimated average number of transfers per retrieval 1.5 1.2 0.6 1.0 0.0 Average number of embryos transferred 1.4 1.5 1.4 1.0 Percentage of embryos transferred resulting in implantation (%) 64.6 45.2 5 / 8 3 / 4 Percentage of transfers resulting in term, normal weight & singleton live births
e (%) 35.4 37.5 3 / 8 2 / 4
Percentage of transfers resulting in singleton live births (%) 43.8 41.7 4 / 8 3 / 4 Percentage of transfers resulting in twin live births (%) 20.8 4.2 0 / 8 0 / 4 Percentage of transfers resulting in live births (%) 64.6 45.8 4 / 8 3 / 4 Percentage of transfers resulting in pregnancies (%) 68.8 66.7 7 / 8 3 / 4
Number of Egg/Embryo Banking Cycles 19 14 13 4 1 0
Donor Eggs Fresh Embryosf Frozen Embryosf
Number of cycles 1 10Number of transfers 1 10Average number of embryos transferred 1.0 1.3Percentage of embryos transferred resulting in implantation (%) 1 / 1 6 / 13Percentage of transfers resulting in term, normal weight & singleton live births
e (%) 0 / 1 4 / 10
Percentage of transfers resulting in singleton live births (%) 1 / 1 4 / 10Percentage of transfers resulting in twin live births (%) 0 / 1 1 / 10Percentage of transfers resulting in live births (%) 1 / 1 5 / 10Percentage of transfers resulting in pregnancies (%) 1 / 1 5 / 10
CURRENT SERVICES & PROFILE Current Name: Reproductive Medicine Associates of Pennsylvania
Donor eggs? YesDonor embryos? Yes
Gestational carriers? YesEmbryo cryopreservation? Yes
Single women? YesSART member? Yes
Verified lab accreditation? Yes(See Appendix C for details.)
a Reflects features of fresh nondonor cycles. If IVF is less than 100%, the remaining cycles are GIFT, ZIFT, or a combination of these procedures with IVF.
b Total patient diagnosis percentages may be greater than 100% because more than one diagnosis can be reported for each ART cycle.
c Fractions are used for rates with denominators less than 20. Multiple-infant births (for example, twins) with at least one live infant are counted as one live birth.
d Total cycle number includes those using frozen eggs. It excludes 0 cycle(s) evaluating new procedures. Both cycle types are excluded from ART success rates.
e In this report, births are defined as term if at least 37 full weeks gestation and normal birth weight if at least 2,500 grams (approximately 5 pounds, 8 ounces).
f All ages are reported together because previous data show that patient age does not materially affect success with donor eggs.

401
PE
NN
SY
LVA
NIA
FAMILY FERTILITY CENTERBETHLEHEM, PENNSYLVANIA
Comparison of success rates across clinics may not be meaningful. Patient medical characteristics and treatment approaches vary (see pages 11–20).
Data verified by H. Christina Lee, MD2014 ART CYCLE PROFILE
Type of ART and Procedural Factors a
IVF 100%Unstimulated 0%Used gestational carrier 2%
With ICSI 80%PGD/PGS 2%
Patient Diagnosis b
Tubal factor 13%Ovulatory dysfunction 23%Diminished ovarian reserve 34%Endometriosis 11%
Uterine factor 0%Male factor 53%Other factor 22%Unknown factor 8%
Multiple Factors: Female factors only 14%Female & male factors 36%
2014 ART SUCCESS RATES c Total number of cyclesd: 69 (includes 1 cycle[s] using frozen eggs)
Type of CycleAge of Woman
<35 35–37 38–40 41–42 43–44 >44Fresh Embryos from Nondonor Eggs
Number of cycles 16 19 9 0 2 0Percentage of cancellations before retrieval (%) 0 / 16 0 / 19 2 / 9 0 / 2 Average number of embryos transferred 1.2 1.9 1.9 2.0 Percentage of embryos transferred resulting in implantation (%) 11 / 19 42.9 3 / 13 0 / 4 Percentage of elective single embryo transfers (eSET) (%) 10 / 13 2 / 15 0 / 5 0 / 1
Outcomes per CyclePercentage of cycles resulting in term, normal weight & singleton live births
e (%) 9 / 16 5 / 19 1 / 9 0 / 2
Percentage of cycles resulting in singleton live births (%) 10 / 16 5 / 19 2 / 9 0 / 2 Percentage of cycles resulting in twin live births (%) 0 / 16 3 / 19 0 / 9 0 / 2 Percentage of cycles resulting in live births (%) 10 / 16 8 / 19 2 / 9 0 / 2 Percentage of cycles resulting in pregnancies (%) 11 / 16 9 / 19 2 / 9 0 / 2
Outcomes per TransferNumber of transfers 16 18 7 0 2 0Percentage of transfers resulting in term, normal weight & singleton live births
e (%) 9 / 16 5 / 18 1 / 7 0 / 2
Percentage of transfers resulting in singleton live births (%) 10 / 16 5 / 18 2 / 7 0 / 2 Percentage of transfers resulting in twin live births (%) 0 / 16 3 / 18 0 / 7 0 / 2 Percentage of transfers resulting in live births (%) 10 / 16 8 / 18 2 / 7 0 / 2 Percentage of transfers resulting in pregnancies (%) 11 / 16 9 / 18 2 / 7 0 / 2
Frozen Embryos from Nondonor EggsNumber of cycles 4 3 1 2 0 0Number of transfers 3 3 1 2 0 0Estimated average number of transfers per retrieval 0.6 0.5 0.5 Average number of embryos transferred 1.3 1.7 3.0 1.0 Percentage of embryos transferred resulting in implantation (%) 2 / 4 1 / 5 1 / 3 0 / 2 Percentage of transfers resulting in term, normal weight & singleton live births
e (%) 0 / 3 1 / 3 0 / 1 0 / 2
Percentage of transfers resulting in singleton live births (%) 0 / 3 1 / 3 0 / 1 0 / 2 Percentage of transfers resulting in twin live births (%) 1 / 3 0 / 3 0 / 1 0 / 2 Percentage of transfers resulting in live births (%) 1 / 3 1 / 3 0 / 1 0 / 2 Percentage of transfers resulting in pregnancies (%) 1 / 3 1 / 3 1 / 1 0 / 2
Number of Egg/Embryo Banking Cycles 2 1 1 0 0 0
Donor Eggs Fresh Embryosf Frozen Embryosf
Number of cycles 3 5Number of transfers 3 5Average number of embryos transferred 1.3 1.2Percentage of embryos transferred resulting in implantation (%) 3 / 4 3 / 4Percentage of transfers resulting in term, normal weight & singleton live births
e (%) 1 / 3 3 / 5
Percentage of transfers resulting in singleton live births (%) 1 / 3 3 / 5Percentage of transfers resulting in twin live births (%) 1 / 3 0 / 5Percentage of transfers resulting in live births (%) 2 / 3 3 / 5Percentage of transfers resulting in pregnancies (%) 2 / 3 4 / 5
CURRENT SERVICES & PROFILE Current Name: Family Fertility Center
Donor eggs? YesDonor embryos? Yes
Gestational carriers? YesEmbryo cryopreservation? Yes
Single women? YesSART member? Yes
Verified lab accreditation? Yes(See Appendix C for details.)
a Reflects features of fresh nondonor cycles. If IVF is less than 100%, the remaining cycles are GIFT, ZIFT, or a combination of these procedures with IVF.
b Total patient diagnosis percentages may be greater than 100% because more than one diagnosis can be reported for each ART cycle.
c Fractions are used for rates with denominators less than 20. Multiple-infant births (for example, twins) with at least one live infant are counted as one live birth.
d Total cycle number includes those using frozen eggs. It excludes 0 cycle(s) evaluating new procedures. Both cycle types are excluded from ART success rates.
e In this report, births are defined as term if at least 37 full weeks gestation and normal birth weight if at least 2,500 grams (approximately 5 pounds, 8 ounces).
f All ages are reported together because previous data show that patient age does not materially affect success with donor eggs.

402
PE
NN
SY
LVA
NIA
MAIN LINE FERTILITY AND REPRODUCTIVE MEDICINEBRYN MAWR, PENNSYLVANIA
Comparison of success rates across clinics may not be meaningful. Patient medical characteristics and treatment approaches vary (see pages 11–20).
Data verified by Michael J. Glassner, MD2014 ART CYCLE PROFILE
Type of ART and Procedural Factors a
IVF 100%Unstimulated 0%Used gestational carrier <1%
With ICSI 33%PGD/PGS 6%
Patient Diagnosis b
Tubal factor 8%Ovulatory dysfunction 18%Diminished ovarian reserve 23%Endometriosis 5%
Uterine factor 2%Male factor 20%Other factor 11%Unknown factor 27%
Multiple Factors: Female factors only 7%Female & male factors 5%
2014 ART SUCCESS RATES c Total number of cyclesd: 1,263 (includes 99 cycle[s] using frozen eggs)
Type of CycleAge of Woman
<35 35–37 38–40 41–42 43–44 >44Fresh Embryos from Nondonor Eggs
Number of cycles 254 148 158 53 32 12Percentage of cancellations before retrieval (%) 5.5 2.7 12.0 22.6 12.5 0 / 12Average number of embryos transferred 2.0 2.2 2.5 2.4 3.5 2.8Percentage of embryos transferred resulting in implantation (%) 32.6 28.0 22.2 13.9 6.2 0 / 11Percentage of elective single embryo transfers (eSET) (%) 15.3 0.8 5.5 0.0 4.5 0 / 4
Outcomes per CyclePercentage of cycles resulting in term, normal weight & singleton live births
e (%) 18.1 22.3 19.0 7.5 9.4 0 / 12
Percentage of cycles resulting in singleton live births (%) 21.7 25.7 21.5 9.4 9.4 0 / 12Percentage of cycles resulting in twin live births (%) 9.4 8.1 3.8 1.9 0.0 0 / 12Percentage of cycles resulting in live births (%) 31.1 33.8 25.3 11.3 9.4 0 / 12Percentage of cycles resulting in pregnancies (%) 38.2 43.2 36.7 18.9 18.8 0 / 12
Outcomes per TransferNumber of transfers 202 127 126 32 24 4Percentage of transfers resulting in term, normal weight & singleton live births
e (%) 22.8 26.0 23.8 12.5 12.5 0 / 4
Percentage of transfers resulting in singleton live births (%) 27.2 29.9 27.0 15.6 12.5 0 / 4Percentage of transfers resulting in twin live births (%) 11.9 9.4 4.8 3.1 0.0 0 / 4Percentage of transfers resulting in live births (%) 39.1 39.4 31.7 18.8 12.5 0 / 4Percentage of transfers resulting in pregnancies (%) 48.0 50.4 46.0 31.3 25.0 0 / 4
Frozen Embryos from Nondonor EggsNumber of cycles 133 50 43 17 13 0Number of transfers 118 49 40 15 9 0Estimated average number of transfers per retrieval 1.0 0.9 0.6 0.5 1.0 0.0Average number of embryos transferred 1.6 1.6 1.6 1.9 2.2 Percentage of embryos transferred resulting in implantation (%) 36.4 32.9 29.7 34.5 3 / 19 Percentage of transfers resulting in term, normal weight & singleton live births
e (%) 28.0 28.6 22.5 5 / 15 1 / 9
Percentage of transfers resulting in singleton live births (%) 29.7 30.6 22.5 7 / 15 1 / 9 Percentage of transfers resulting in twin live births (%) 5.1 6.1 2.5 0 / 15 0 / 9 Percentage of transfers resulting in live births (%) 34.7 36.7 25.0 7 / 15 1 / 9 Percentage of transfers resulting in pregnancies (%) 50.8 49.0 42.5 9 / 15 3 / 9
Number of Egg/Embryo Banking Cycles 48 31 51 24 3 3
Donor Eggs Fresh Embryosf Frozen Embryosf
Number of cycles 16 75Number of transfers 12 70Average number of embryos transferred 1.8 1.5Percentage of embryos transferred resulting in implantation (%) 38.1 25.7Percentage of transfers resulting in term, normal weight & singleton live births
e (%) 7 / 12 22.9
Percentage of transfers resulting in singleton live births (%) 7 / 12 28.6Percentage of transfers resulting in twin live births (%) 0 / 12 2.9Percentage of transfers resulting in live births (%) 7 / 12 31.4Percentage of transfers resulting in pregnancies (%) 8 / 12 37.1
CURRENT SERVICES & PROFILE Current Name: Main Line Fertility and Reproductive Medicine
Donor eggs? YesDonor embryos? Yes
Gestational carriers? YesEmbryo cryopreservation? Yes
Single women? YesSART member? Yes
Verified lab accreditation? Yes(See Appendix C for details.)
a Reflects features of fresh nondonor cycles. If IVF is less than 100%, the remaining cycles are GIFT, ZIFT, or a combination of these procedures with IVF.
b Total patient diagnosis percentages may be greater than 100% because more than one diagnosis can be reported for each ART cycle.
c Fractions are used for rates with denominators less than 20. Multiple-infant births (for example, twins) with at least one live infant are counted as one live birth.
d Total cycle number includes those using frozen eggs. It excludes 0 cycle(s) evaluating new procedures. Both cycle types are excluded from ART success rates.
e In this report, births are defined as term if at least 37 full weeks gestation and normal birth weight if at least 2,500 grams (approximately 5 pounds, 8 ounces).
f All ages are reported together because previous data show that patient age does not materially affect success with donor eggs.

403
PE
NN
SY
LVA
NIA
GEISINGER MEDICAL CENTER FERTILITY PROGRAMDANVILLE, PENNSYLVANIA
Comparison of success rates across clinics may not be meaningful. Patient medical characteristics and treatment approaches vary (see pages 11–20).
Data verified by Jennifer Gell, MD2014 ART CYCLE PROFILE
Type of ART and Procedural Factors a
IVF 100%Unstimulated 0%Used gestational carrier 3%
With ICSI 90%PGD/PGS 0%
Patient Diagnosis b
Tubal factor 19%Ovulatory dysfunction 12%Diminished ovarian reserve 24%Endometriosis 6%
Uterine factor 11%Male factor 25%Other factor 6%Unknown factor 13%
Multiple Factors: Female factors only 7%Female & male factors 7%
2014 ART SUCCESS RATES c Total number of cyclesd: 123 (includes 0 cycle[s] using frozen eggs)
Type of CycleAge of Woman
<35 35–37 38–40 41–42 43–44 >44Fresh Embryos from Nondonor Eggs
Number of cycles 30 13 23 5 2 0Percentage of cancellations before retrieval (%) 0.0 1 / 13 8.7 0 / 5 1 / 2 Average number of embryos transferred 2.0 2.2 2.3 2.3 1.0 Percentage of embryos transferred resulting in implantation (%) 21.6 27.3 7.0 2 / 9 0 / 1 Percentage of elective single embryo transfers (eSET) (%) 0.0 0 / 10 0 / 15 0 / 3
Outcomes per CyclePercentage of cycles resulting in term, normal weight & singleton live births
e (%) 20.0 3 / 13 4.3 1 / 5 0 / 2
Percentage of cycles resulting in singleton live births (%) 20.0 3 / 13 4.3 1 / 5 0 / 2 Percentage of cycles resulting in twin live births (%) 6.7 1 / 13 4.3 0 / 5 0 / 2 Percentage of cycles resulting in live births (%) 26.7 4 / 13 8.7 1 / 5 0 / 2 Percentage of cycles resulting in pregnancies (%) 33.3 5 / 13 8.7 1 / 5 0 / 2
Outcomes per TransferNumber of transfers 26 10 19 4 1 0Percentage of transfers resulting in term, normal weight & singleton live births
e (%) 23.1 3 / 10 1 / 19 1 / 4 0 / 1
Percentage of transfers resulting in singleton live births (%) 23.1 3 / 10 1 / 19 1 / 4 0 / 1 Percentage of transfers resulting in twin live births (%) 7.7 1 / 10 1 / 19 0 / 4 0 / 1 Percentage of transfers resulting in live births (%) 30.8 4 / 10 2 / 19 1 / 4 0 / 1 Percentage of transfers resulting in pregnancies (%) 38.5 5 / 10 2 / 19 1 / 4 0 / 1
Frozen Embryos from Nondonor EggsNumber of cycles 17 12 7 2 0 1Number of transfers 17 11 7 2 0 1Estimated average number of transfers per retrieval 2.1 2.8 1.2 2.0 Average number of embryos transferred 1.8 1.5 2.3 2.0 1.0Percentage of embryos transferred resulting in implantation (%) 35.5 5 / 16 5 / 16 0 / 2 0 / 1Percentage of transfers resulting in term, normal weight & singleton live births
e (%) 7 / 17 3 / 11 0 / 7 0 / 2 0 / 1
Percentage of transfers resulting in singleton live births (%) 8 / 17 3 / 11 0 / 7 0 / 2 0 / 1Percentage of transfers resulting in twin live births (%) 1 / 17 1 / 11 2 / 7 0 / 2 0 / 1Percentage of transfers resulting in live births (%) 9 / 17 4 / 11 2 / 7 0 / 2 0 / 1Percentage of transfers resulting in pregnancies (%) 9 / 17 4 / 11 2 / 7 1 / 2 0 / 1
Number of Egg/Embryo Banking Cycles 0 0 0 0 0 0
Donor Eggs Fresh Embryosf Frozen Embryosf
Number of cycles 4 7Number of transfers 3 7Average number of embryos transferred 1.7 1.7Percentage of embryos transferred resulting in implantation (%) 1 / 5 4 / 12Percentage of transfers resulting in term, normal weight & singleton live births
e (%) 1 / 3 1 / 7
Percentage of transfers resulting in singleton live births (%) 1 / 3 2 / 7Percentage of transfers resulting in twin live births (%) 0 / 3 1 / 7Percentage of transfers resulting in live births (%) 1 / 3 3 / 7Percentage of transfers resulting in pregnancies (%) 1 / 3 3 / 7
CURRENT SERVICES & PROFILE Current Name: Geisinger Medical Center Fertility Program
Donor eggs? YesDonor embryos? Yes
Gestational carriers? YesEmbryo cryopreservation? Yes
Single women? YesSART member? Yes
Verified lab accreditation? Yes(See Appendix C for details.)
a Reflects features of fresh nondonor cycles. If IVF is less than 100%, the remaining cycles are GIFT, ZIFT, or a combination of these procedures with IVF.
b Total patient diagnosis percentages may be greater than 100% because more than one diagnosis can be reported for each ART cycle.
c Fractions are used for rates with denominators less than 20. Multiple-infant births (for example, twins) with at least one live infant are counted as one live birth.
d Total cycle number includes those using frozen eggs. It excludes 0 cycle(s) evaluating new procedures. Both cycle types are excluded from ART success rates.
e In this report, births are defined as term if at least 37 full weeks gestation and normal birth weight if at least 2,500 grams (approximately 5 pounds, 8 ounces).
f All ages are reported together because previous data show that patient age does not materially affect success with donor eggs.

404
PE
NN
SY
LVA
NIA
PENN STATE MILTON S. HERSHEY MEDICAL CENTERHERSHEY, PENNSYLVANIA
Comparison of success rates across clinics may not be meaningful. Patient medical characteristics and treatment approaches vary (see pages 11–20).
Data verified by William C. Dodson, MD2014 ART CYCLE PROFILE
Type of ART and Procedural Factors a
IVF 100%Unstimulated 0%Used gestational carrier 0%
With ICSI 95%PGD/PGS 0%
Patient Diagnosis b
Tubal factor 10%Ovulatory dysfunction 24%Diminished ovarian reserve 1%Endometriosis 18%
Uterine factor 0%Male factor 24%Other factor 3%Unknown factor 34%
Multiple Factors: Female factors only 5%Female & male factors 8%
2014 ART SUCCESS RATES c Total number of cyclesd: 86 (includes 2 cycle[s] using frozen eggs)
Type of CycleAge of Woman
<35 35–37 38–40 41–42 43–44 >44Fresh Embryos from Nondonor Eggs
Number of cycles 29 6 7 1 0 0Percentage of cancellations before retrieval (%) 0.0 1 / 6 0 / 7 0 / 1 Average number of embryos transferred 2.0 1.8 2.3 Percentage of embryos transferred resulting in implantation (%) 33.3 5 / 9 2 / 16 Percentage of elective single embryo transfers (eSET) (%) 0.0 1 / 5 0 / 6
Outcomes per CyclePercentage of cycles resulting in term, normal weight & singleton live births
e (%) 24.1 1 / 6 1 / 7 0 / 1
Percentage of cycles resulting in singleton live births (%) 34.5 1 / 6 1 / 7 0 / 1 Percentage of cycles resulting in twin live births (%) 3.4 1 / 6 0 / 7 0 / 1 Percentage of cycles resulting in live births (%) 37.9 2 / 6 1 / 7 0 / 1 Percentage of cycles resulting in pregnancies (%) 41.4 3 / 6 2 / 7 0 / 1
Outcomes per TransferNumber of transfers 23 5 7 0 0 0Percentage of transfers resulting in term, normal weight & singleton live births
e (%) 30.4 1 / 5 1 / 7
Percentage of transfers resulting in singleton live births (%) 43.5 1 / 5 1 / 7 Percentage of transfers resulting in twin live births (%) 4.3 1 / 5 0 / 7 Percentage of transfers resulting in live births (%) 47.8 2 / 5 1 / 7 Percentage of transfers resulting in pregnancies (%) 52.2 3 / 5 2 / 7
Frozen Embryos from Nondonor EggsNumber of cycles 18 3 5 1 0 0Number of transfers 17 3 5 1 0 0Estimated average number of transfers per retrieval 1.5 1.5 2.5 1.0 0.0 Average number of embryos transferred 1.9 1.7 2.4 3.0 Percentage of embryos transferred resulting in implantation (%) 28.1 0 / 5 4 / 12 0 / 3 Percentage of transfers resulting in term, normal weight & singleton live births
e (%) 1 / 17 0 / 3 1 / 5 0 / 1
Percentage of transfers resulting in singleton live births (%) 3 / 17 0 / 3 1 / 5 0 / 1 Percentage of transfers resulting in twin live births (%) 2 / 17 0 / 3 1 / 5 0 / 1 Percentage of transfers resulting in live births (%) 5 / 17 0 / 3 2 / 5 0 / 1 Percentage of transfers resulting in pregnancies (%) 7 / 17 0 / 3 3 / 5 0 / 1
Number of Egg/Embryo Banking Cycles 6 1 1 0 2 0
Donor Eggs Fresh Embryosf Frozen Embryosf
Number of cycles 0 4Number of transfers 0 3Average number of embryos transferred 2.0Percentage of embryos transferred resulting in implantation (%) 2 / 6Percentage of transfers resulting in term, normal weight & singleton live births
e (%) 1 / 3
Percentage of transfers resulting in singleton live births (%) 2 / 3Percentage of transfers resulting in twin live births (%) 0 / 3Percentage of transfers resulting in live births (%) 2 / 3Percentage of transfers resulting in pregnancies (%) 2 / 3
CURRENT SERVICES & PROFILE Current Name: Penn State Milton S. Hershey Medical Center
Donor eggs? YesDonor embryos? Yes
Gestational carriers? NoEmbryo cryopreservation? Yes
Single women? YesSART member? Yes
Verified lab accreditation? Yes(See Appendix C for details.)
a Reflects features of fresh nondonor cycles. If IVF is less than 100%, the remaining cycles are GIFT, ZIFT, or a combination of these procedures with IVF.
b Total patient diagnosis percentages may be greater than 100% because more than one diagnosis can be reported for each ART cycle.
c Fractions are used for rates with denominators less than 20. Multiple-infant births (for example, twins) with at least one live infant are counted as one live birth.
d Total cycle number includes those using frozen eggs. It excludes 0 cycle(s) evaluating new procedures. Both cycle types are excluded from ART success rates.
e In this report, births are defined as term if at least 37 full weeks gestation and normal birth weight if at least 2,500 grams (approximately 5 pounds, 8 ounces).
f All ages are reported together because previous data show that patient age does not materially affect success with donor eggs.

405
PE
NN
SY
LVA
NIA
REPRODUCTIVE MEDICINE ASSOCIATES OF PHILADELPHIAKING OF PRUSSIA, PENNSYLVANIA
Comparison of success rates across clinics may not be meaningful. Patient medical characteristics and treatment approaches vary (see pages 11–20).
Data verified by Arthur J. Castelbaum, MD2014 ART CYCLE PROFILE
Type of ART and Procedural Factors a
IVF 100%Unstimulated <1%Used gestational carrier 0%
With ICSI 60%PGD/PGS 9%
Patient Diagnosis b
Tubal factor 13%Ovulatory dysfunction 5%Diminished ovarian reserve 23%Endometriosis 7%
Uterine factor 5%Male factor 26%Other factor 24%Unknown factor 19%
Multiple Factors: Female factors only 10%Female & male factors 12%
2014 ART SUCCESS RATES c Total number of cyclesd: 755 (includes 16 cycle[s] using frozen eggs)
Type of CycleAge of Woman
<35 35–37 38–40 41–42 43–44 >44Fresh Embryos from Nondonor Eggs
Number of cycles 230 62 57 26 8 4Percentage of cancellations before retrieval (%) 6.1 9.7 8.8 15.4 2 / 8 0 / 4Average number of embryos transferred 1.4 1.6 1.9 1.9 2.0 2.5Percentage of embryos transferred resulting in implantation (%) 53.8 48.6 30.9 7 / 18 1 / 12 0 / 5Percentage of elective single embryo transfers (eSET) (%) 61.3 30.0 10.0 3 / 10 0 / 5 0 / 1
Outcomes per CyclePercentage of cycles resulting in term, normal weight & singleton live births
e (%) 23.9 17.7 12.3 7.7 1 / 8 0 / 4
Percentage of cycles resulting in singleton live births (%) 29.1 19.4 17.5 7.7 1 / 8 0 / 4Percentage of cycles resulting in twin live births (%) 8.7 9.7 3.5 0.0 0 / 8 0 / 4Percentage of cycles resulting in live births (%) 38.3 32.3 21.1 11.5 1 / 8 0 / 4Percentage of cycles resulting in pregnancies (%) 47.4 40.3 28.1 26.9 1 / 8 0 / 4
Outcomes per TransferNumber of transfers 187 46 36 12 6 2Percentage of transfers resulting in term, normal weight & singleton live births
e (%) 29.4 23.9 19.4 2 / 12 1 / 6 0 / 2
Percentage of transfers resulting in singleton live births (%) 35.8 26.1 27.8 2 / 12 1 / 6 0 / 2Percentage of transfers resulting in twin live births (%) 10.7 13.0 5.6 0 / 12 0 / 6 0 / 2Percentage of transfers resulting in live births (%) 47.1 43.5 33.3 3 / 12 1 / 6 0 / 2Percentage of transfers resulting in pregnancies (%) 58.3 54.3 44.4 7 / 12 1 / 6 0 / 2
Frozen Embryos from Nondonor EggsNumber of cycles 119 51 35 9 2 0Number of transfers 105 50 30 9 1 0Estimated average number of transfers per retrieval 1.0 1.6 0.9 0.8 0.3 Average number of embryos transferred 1.4 1.5 1.2 1.8 2.0 Percentage of embryos transferred resulting in implantation (%) 52.6 38.0 51.4 3 / 16 0 / 2 Percentage of transfers resulting in term, normal weight & singleton live births
e (%) 31.4 24.0 36.7 3 / 9 0 / 1
Percentage of transfers resulting in singleton live births (%) 40.0 34.0 46.7 3 / 9 0 / 1 Percentage of transfers resulting in twin live births (%) 8.6 8.0 3.3 0 / 9 0 / 1 Percentage of transfers resulting in live births (%) 48.6 42.0 50.0 3 / 9 0 / 1 Percentage of transfers resulting in pregnancies (%) 58.1 50.0 56.7 3 / 9 0 / 1
Number of Egg/Embryo Banking Cycles 25 12 21 8 4 0
Donor Eggs Fresh Embryosf Frozen Embryosf
Number of cycles 28 38Number of transfers 22 34Average number of embryos transferred 1.5 1.2Percentage of embryos transferred resulting in implantation (%) 56.7 52.5Percentage of transfers resulting in term, normal weight & singleton live births
e (%) 36.4 26.5
Percentage of transfers resulting in singleton live births (%) 45.5 35.3Percentage of transfers resulting in twin live births (%) 9.1 5.9Percentage of transfers resulting in live births (%) 54.5 41.2Percentage of transfers resulting in pregnancies (%) 72.7 55.9
CURRENT SERVICES & PROFILE Current Name: Reproductive Medicine Associates of Philadelphia
Donor eggs? YesDonor embryos? Yes
Gestational carriers? YesEmbryo cryopreservation? Yes
Single women? YesSART member? Yes
Verified lab accreditation? Yes(See Appendix C for details.)
a Reflects features of fresh nondonor cycles. If IVF is less than 100%, the remaining cycles are GIFT, ZIFT, or a combination of these procedures with IVF.
b Total patient diagnosis percentages may be greater than 100% because more than one diagnosis can be reported for each ART cycle.
c Fractions are used for rates with denominators less than 20. Multiple-infant births (for example, twins) with at least one live infant are counted as one live birth.
d Total cycle number includes those using frozen eggs. It excludes 0 cycle(s) evaluating new procedures. Both cycle types are excluded from ART success rates.
e In this report, births are defined as term if at least 37 full weeks gestation and normal birth weight if at least 2,500 grams (approximately 5 pounds, 8 ounces).
f All ages are reported together because previous data show that patient age does not materially affect success with donor eggs.

406
PE
NN
SY
LVA
NIA
FERTILITY AND GYNECOLOGY ASSOCIATESPHILADELPHIA, PENNSYLVANIA
Comparison of success rates across clinics may not be meaningful. Patient medical characteristics and treatment approaches vary (see pages 11–20).
Data verified by Leonore C. Huppert, MD2014 ART CYCLE PROFILE
Type of ART and Procedural Factors a
IVF 100%Unstimulated 0%Used gestational carrier 0%
With ICSI 44%PGD/PGS 0%
Patient Diagnosis b
Tubal factor 13%Ovulatory dysfunction 0%Diminished ovarian reserve 47%Endometriosis 7%
Uterine factor 13%Male factor 33%Other factor 13%Unknown factor 20%
Multiple Factors: Female factors only 20%Female & male factors 27%
2014 ART SUCCESS RATES c Total number of cyclesd: 27 (includes 6 cycle[s] using frozen eggs)
Type of CycleAge of Woman
<35 35–37 38–40 41–42 43–44 >44Fresh Embryos from Nondonor Eggs
Number of cycles 3 2 1 2 1 0Percentage of cancellations before retrieval (%) 1 / 3 0 / 2 0 / 1 1 / 2 0 / 1 Average number of embryos transferred 1.0 3.0 4.0 4.0 Percentage of embryos transferred resulting in implantation (%) 1 / 2 0 / 6 0 / 4 0 / 4 Percentage of elective single embryo transfers (eSET) (%) 2 / 2 0 / 2 0 / 1 0 / 1
Outcomes per CyclePercentage of cycles resulting in term, normal weight & singleton live births
e (%) 0 / 3 0 / 2 0 / 1 0 / 2 0 / 1
Percentage of cycles resulting in singleton live births (%) 0 / 3 0 / 2 0 / 1 0 / 2 0 / 1 Percentage of cycles resulting in twin live births (%) 0 / 3 0 / 2 0 / 1 0 / 2 0 / 1 Percentage of cycles resulting in live births (%) 0 / 3 0 / 2 0 / 1 0 / 2 0 / 1 Percentage of cycles resulting in pregnancies (%) 1 / 3 0 / 2 0 / 1 0 / 2 0 / 1
Outcomes per TransferNumber of transfers 2 2 1 0 1 0Percentage of transfers resulting in term, normal weight & singleton live births
e (%) 0 / 2 0 / 2 0 / 1 0 / 1
Percentage of transfers resulting in singleton live births (%) 0 / 2 0 / 2 0 / 1 0 / 1 Percentage of transfers resulting in twin live births (%) 0 / 2 0 / 2 0 / 1 0 / 1 Percentage of transfers resulting in live births (%) 0 / 2 0 / 2 0 / 1 0 / 1 Percentage of transfers resulting in pregnancies (%) 1 / 2 0 / 2 0 / 1 0 / 1
Frozen Embryos from Nondonor EggsNumber of cycles 0 1 1 2 0 0Number of transfers 0 1 1 2 0 0Estimated average number of transfers per retrieval 0.0 1.0 Average number of embryos transferred 2.0 2.0 2.0 Percentage of embryos transferred resulting in implantation (%) 0 / 2 2 / 2 1 / 4 Percentage of transfers resulting in term, normal weight & singleton live births
e (%) 0 / 1 0 / 1 1 / 2
Percentage of transfers resulting in singleton live births (%) 0 / 1 0 / 1 1 / 2 Percentage of transfers resulting in twin live births (%) 0 / 1 1 / 1 0 / 2 Percentage of transfers resulting in live births (%) 0 / 1 1 / 1 1 / 2 Percentage of transfers resulting in pregnancies (%) 0 / 1 1 / 1 1 / 2
Number of Egg/Embryo Banking Cycles 4 0 0 2 0 0
Donor Eggs Fresh Embryosf Frozen Embryosf
Number of cycles 0 2Number of transfers 0 2Average number of embryos transferred 2.0Percentage of embryos transferred resulting in implantation (%) 0 / 4Percentage of transfers resulting in term, normal weight & singleton live births
e (%) 0 / 2
Percentage of transfers resulting in singleton live births (%) 0 / 2Percentage of transfers resulting in twin live births (%) 0 / 2Percentage of transfers resulting in live births (%) 0 / 2Percentage of transfers resulting in pregnancies (%) 0 / 2
CURRENT SERVICES & PROFILE Current Name: Fertility and Gynecology Associates
Donor eggs? YesDonor embryos? Yes
Gestational carriers? YesEmbryo cryopreservation? Yes
Single women? YesSART member? Yes
Verified lab accreditation? Yes(See Appendix C for details.)
a Reflects features of fresh nondonor cycles. If IVF is less than 100%, the remaining cycles are GIFT, ZIFT, or a combination of these procedures with IVF.
b Total patient diagnosis percentages may be greater than 100% because more than one diagnosis can be reported for each ART cycle.
c Fractions are used for rates with denominators less than 20. Multiple-infant births (for example, twins) with at least one live infant are counted as one live birth.
d Total cycle number includes those using frozen eggs. It excludes 0 cycle(s) evaluating new procedures. Both cycle types are excluded from ART success rates.
e In this report, births are defined as term if at least 37 full weeks gestation and normal birth weight if at least 2,500 grams (approximately 5 pounds, 8 ounces).
f All ages are reported together because previous data show that patient age does not materially affect success with donor eggs.

407
PE
NN
SY
LVA
NIA
SOCIETY HILL REPRODUCTIVE MEDICINEPHILADELPHIA, PENNSYLVANIA
Comparison of success rates across clinics may not be meaningful. Patient medical characteristics and treatment approaches vary (see pages 11–20).
Data verified by Maureen P. Kelly, MD2014 ART CYCLE PROFILE
Type of ART and Procedural Factors a
IVF 100%Unstimulated 0%Used gestational carrier 4%
With ICSI 84%PGD/PGS 8%
Patient Diagnosis b
Tubal factor 14%Ovulatory dysfunction 7%Diminished ovarian reserve 24%Endometriosis 3%
Uterine factor 3%Male factor 16%Other factor 16%Unknown factor 23%
Multiple Factors: Female factors only 3%Female & male factors 3%
2014 ART SUCCESS RATES c Total number of cyclesd: 109 (includes 3 cycle[s] using frozen eggs)
Type of CycleAge of Woman
<35 35–37 38–40 41–42 43–44 >44Fresh Embryos from Nondonor Eggs
Number of cycles 11 7 7 0 0 0Percentage of cancellations before retrieval (%) 0 / 11 0 / 7 0 / 7 Average number of embryos transferred 1.9 1.9 1.8 Percentage of embryos transferred resulting in implantation (%) 6 / 13 3 / 13 2 / 9 Percentage of elective single embryo transfers (eSET) (%) 0 / 6 1 / 7 1 / 5
Outcomes per CyclePercentage of cycles resulting in term, normal weight & singleton live births
e (%) 2 / 11 0 / 7 0 / 7
Percentage of cycles resulting in singleton live births (%) 3 / 11 0 / 7 1 / 7 Percentage of cycles resulting in twin live births (%) 1 / 11 1 / 7 0 / 7 Percentage of cycles resulting in live births (%) 4 / 11 1 / 7 1 / 7 Percentage of cycles resulting in pregnancies (%) 4 / 11 2 / 7 2 / 7
Outcomes per TransferNumber of transfers 7 7 5 0 0 0Percentage of transfers resulting in term, normal weight & singleton live births
e (%) 2 / 7 0 / 7 0 / 5
Percentage of transfers resulting in singleton live births (%) 3 / 7 0 / 7 1 / 5 Percentage of transfers resulting in twin live births (%) 1 / 7 1 / 7 0 / 5 Percentage of transfers resulting in live births (%) 4 / 7 1 / 7 1 / 5 Percentage of transfers resulting in pregnancies (%) 4 / 7 2 / 7 2 / 5
Frozen Embryos from Nondonor EggsNumber of cycles 17 6 6 0 0 0Number of transfers 16 4 5 0 0 0Estimated average number of transfers per retrieval 0.8 0.4 0.5 0.0 Average number of embryos transferred 1.5 1.3 1.2 Percentage of embryos transferred resulting in implantation (%) 70.8 1 / 5 3 / 6 Percentage of transfers resulting in term, normal weight & singleton live births
e (%) 6 / 16 1 / 4 1 / 5
Percentage of transfers resulting in singleton live births (%) 9 / 16 1 / 4 2 / 5 Percentage of transfers resulting in twin live births (%) 2 / 16 0 / 4 0 / 5 Percentage of transfers resulting in live births (%) 11 / 16 1 / 4 2 / 5 Percentage of transfers resulting in pregnancies (%) 12 / 16 1 / 4 3 / 5
Number of Egg/Embryo Banking Cycles 16 7 8 5 0 0
Donor Eggs Fresh Embryosf Frozen Embryosf
Number of cycles 7 9Number of transfers 3 9Average number of embryos transferred 1.3 1.4Percentage of embryos transferred resulting in implantation (%) 1 / 4 6 / 13Percentage of transfers resulting in term, normal weight & singleton live births
e (%) 0 / 3 2 / 9
Percentage of transfers resulting in singleton live births (%) 0 / 3 4 / 9Percentage of transfers resulting in twin live births (%) 0 / 3 1 / 9Percentage of transfers resulting in live births (%) 0 / 3 5 / 9Percentage of transfers resulting in pregnancies (%) 1 / 3 5 / 9
CURRENT SERVICES & PROFILE Current Name: Society Hill Reproductive Medicine
Donor eggs? YesDonor embryos? Yes
Gestational carriers? YesEmbryo cryopreservation? Yes
Single women? YesSART member? Yes
Verified lab accreditation? Yes(See Appendix C for details.)
a Reflects features of fresh nondonor cycles. If IVF is less than 100%, the remaining cycles are GIFT, ZIFT, or a combination of these procedures with IVF.
b Total patient diagnosis percentages may be greater than 100% because more than one diagnosis can be reported for each ART cycle.
c Fractions are used for rates with denominators less than 20. Multiple-infant births (for example, twins) with at least one live infant are counted as one live birth.
d Total cycle number includes those using frozen eggs. It excludes 0 cycle(s) evaluating new procedures. Both cycle types are excluded from ART success rates.
e In this report, births are defined as term if at least 37 full weeks gestation and normal birth weight if at least 2,500 grams (approximately 5 pounds, 8 ounces).
f All ages are reported together because previous data show that patient age does not materially affect success with donor eggs.
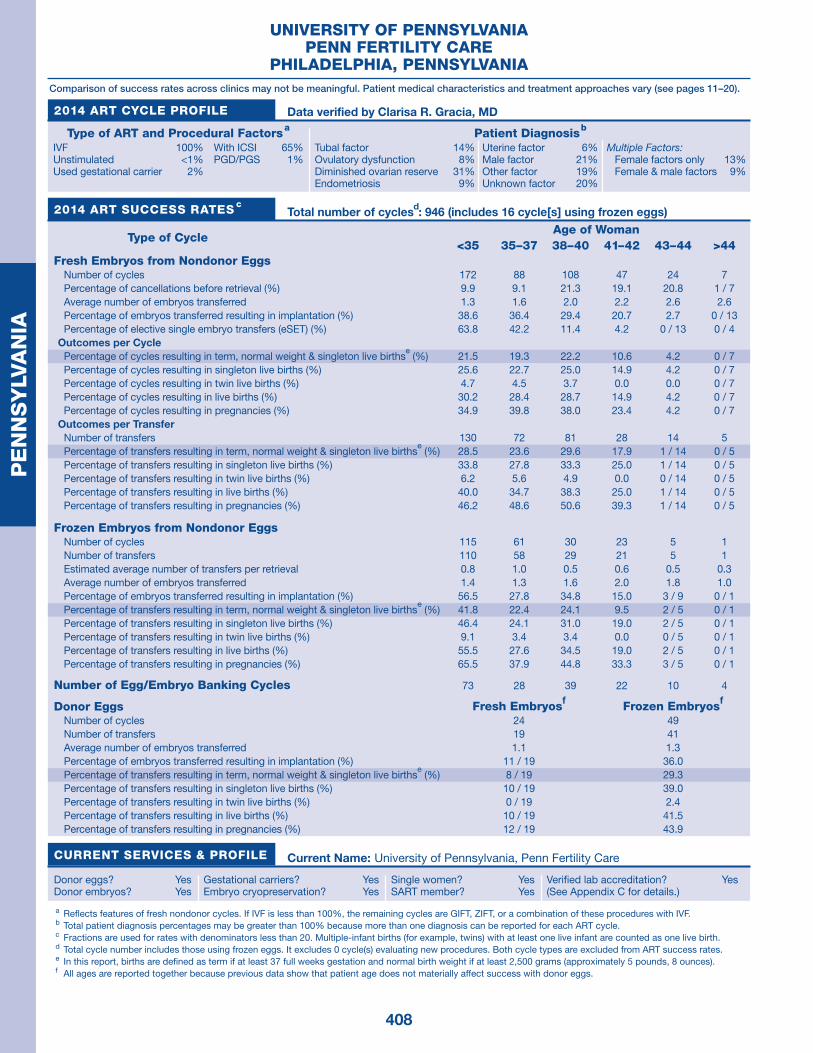
408
PE
NN
SY
LVA
NIA
UNIVERSITY OF PENNSYLVANIAPENN FERTILITY CARE
PHILADELPHIA, PENNSYLVANIAComparison of success rates across clinics may not be meaningful. Patient medical characteristics and treatment approaches vary (see pages 11–20).
Data verified by Clarisa R. Gracia, MD2014 ART CYCLE PROFILE
Type of ART and Procedural Factors a
IVF 100%Unstimulated <1%Used gestational carrier 2%
With ICSI 65%PGD/PGS 1%
Patient Diagnosis b
Tubal factor 14%Ovulatory dysfunction 8%Diminished ovarian reserve 31%Endometriosis 9%
Uterine factor 6%Male factor 21%Other factor 19%Unknown factor 20%
Multiple Factors: Female factors only 13%Female & male factors 9%
2014 ART SUCCESS RATES c Total number of cyclesd: 946 (includes 16 cycle[s] using frozen eggs)
Type of CycleAge of Woman
<35 35–37 38–40 41–42 43–44 >44Fresh Embryos from Nondonor Eggs
Number of cycles 172 88 108 47 24 7Percentage of cancellations before retrieval (%) 9.9 9.1 21.3 19.1 20.8 1 / 7Average number of embryos transferred 1.3 1.6 2.0 2.2 2.6 2.6Percentage of embryos transferred resulting in implantation (%) 38.6 36.4 29.4 20.7 2.7 0 / 13Percentage of elective single embryo transfers (eSET) (%) 63.8 42.2 11.4 4.2 0 / 13 0 / 4
Outcomes per CyclePercentage of cycles resulting in term, normal weight & singleton live births
e (%) 21.5 19.3 22.2 10.6 4.2 0 / 7
Percentage of cycles resulting in singleton live births (%) 25.6 22.7 25.0 14.9 4.2 0 / 7Percentage of cycles resulting in twin live births (%) 4.7 4.5 3.7 0.0 0.0 0 / 7Percentage of cycles resulting in live births (%) 30.2 28.4 28.7 14.9 4.2 0 / 7Percentage of cycles resulting in pregnancies (%) 34.9 39.8 38.0 23.4 4.2 0 / 7
Outcomes per TransferNumber of transfers 130 72 81 28 14 5Percentage of transfers resulting in term, normal weight & singleton live births
e (%) 28.5 23.6 29.6 17.9 1 / 14 0 / 5
Percentage of transfers resulting in singleton live births (%) 33.8 27.8 33.3 25.0 1 / 14 0 / 5Percentage of transfers resulting in twin live births (%) 6.2 5.6 4.9 0.0 0 / 14 0 / 5Percentage of transfers resulting in live births (%) 40.0 34.7 38.3 25.0 1 / 14 0 / 5Percentage of transfers resulting in pregnancies (%) 46.2 48.6 50.6 39.3 1 / 14 0 / 5
Frozen Embryos from Nondonor EggsNumber of cycles 115 61 30 23 5 1Number of transfers 110 58 29 21 5 1Estimated average number of transfers per retrieval 0.8 1.0 0.5 0.6 0.5 0.3Average number of embryos transferred 1.4 1.3 1.6 2.0 1.8 1.0Percentage of embryos transferred resulting in implantation (%) 56.5 27.8 34.8 15.0 3 / 9 0 / 1Percentage of transfers resulting in term, normal weight & singleton live births
e (%) 41.8 22.4 24.1 9.5 2 / 5 0 / 1
Percentage of transfers resulting in singleton live births (%) 46.4 24.1 31.0 19.0 2 / 5 0 / 1Percentage of transfers resulting in twin live births (%) 9.1 3.4 3.4 0.0 0 / 5 0 / 1Percentage of transfers resulting in live births (%) 55.5 27.6 34.5 19.0 2 / 5 0 / 1Percentage of transfers resulting in pregnancies (%) 65.5 37.9 44.8 33.3 3 / 5 0 / 1
Number of Egg/Embryo Banking Cycles 73 28 39 22 10 4
Donor Eggs Fresh Embryosf Frozen Embryosf
Number of cycles 24 49Number of transfers 19 41Average number of embryos transferred 1.1 1.3Percentage of embryos transferred resulting in implantation (%) 11 / 19 36.0Percentage of transfers resulting in term, normal weight & singleton live births
e (%) 8 / 19 29.3
Percentage of transfers resulting in singleton live births (%) 10 / 19 39.0Percentage of transfers resulting in twin live births (%) 0 / 19 2.4Percentage of transfers resulting in live births (%) 10 / 19 41.5Percentage of transfers resulting in pregnancies (%) 12 / 19 43.9
CURRENT SERVICES & PROFILE Current Name: University of Pennsylvania, Penn Fertility Care
Donor eggs? YesDonor embryos? Yes
Gestational carriers? YesEmbryo cryopreservation? Yes
Single women? YesSART member? Yes
Verified lab accreditation? Yes(See Appendix C for details.)
a Reflects features of fresh nondonor cycles. If IVF is less than 100%, the remaining cycles are GIFT, ZIFT, or a combination of these procedures with IVF.
b Total patient diagnosis percentages may be greater than 100% because more than one diagnosis can be reported for each ART cycle.
c Fractions are used for rates with denominators less than 20. Multiple-infant births (for example, twins) with at least one live infant are counted as one live birth.
d Total cycle number includes those using frozen eggs. It excludes 0 cycle(s) evaluating new procedures. Both cycle types are excluded from ART success rates.
e In this report, births are defined as term if at least 37 full weeks gestation and normal birth weight if at least 2,500 grams (approximately 5 pounds, 8 ounces).
f All ages are reported together because previous data show that patient age does not materially affect success with donor eggs.

409
PE
NN
SY
LVA
NIA
JONES INSTITUTE AT WEST PENN ALLEGHENY HEALTH SYSTEMPITTSBURGH, PENNSYLVANIA
Comparison of success rates across clinics may not be meaningful. Patient medical characteristics and treatment approaches vary (see pages 11–20).
Data verified by Bryan R. Hecht, MD2014 ART CYCLE PROFILE
Type of ART and Procedural Factors a
IVF 100%Unstimulated 0%Used gestational carrier 0%
With ICSI 87%PGD/PGS 0%
Patient Diagnosis b
Tubal factor 13%Ovulatory dysfunction 12%Diminished ovarian reserve 25%Endometriosis 12%
Uterine factor 0%Male factor 38%Other factor 13%Unknown factor 12%
Multiple Factors: Female factors only 5%Female & male factors 17%
2014 ART SUCCESS RATES c Total number of cyclesd: 60 (includes 0 cycle[s] using frozen eggs)
Type of CycleAge of Woman
<35 35–37 38–40 41–42 43–44 >44Fresh Embryos from Nondonor Eggs
Number of cycles 18 8 3 0 2 0Percentage of cancellations before retrieval (%) 2 / 18 0 / 8 0 / 3 0 / 2 Average number of embryos transferred 2.2 2.1 2.0 2.5 Percentage of embryos transferred resulting in implantation (%) 29.2 4 / 17 1 / 2 2 / 5 Percentage of elective single embryo transfers (eSET) (%) 0 / 11 0 / 8 0 / 1 0 / 2
Outcomes per CyclePercentage of cycles resulting in term, normal weight & singleton live births
e (%) 2 / 18 0 / 8 0 / 3 0 / 2
Percentage of cycles resulting in singleton live births (%) 2 / 18 1 / 8 0 / 3 0 / 2 Percentage of cycles resulting in twin live births (%) 0 / 18 1 / 8 0 / 3 0 / 2 Percentage of cycles resulting in live births (%) 2 / 18 2 / 8 0 / 3 0 / 2 Percentage of cycles resulting in pregnancies (%) 6 / 18 3 / 8 1 / 3 1 / 2
Outcomes per TransferNumber of transfers 12 8 1 0 2 0Percentage of transfers resulting in term, normal weight & singleton live births
e (%) 2 / 12 0 / 8 0 / 1 0 / 2
Percentage of transfers resulting in singleton live births (%) 2 / 12 1 / 8 0 / 1 0 / 2 Percentage of transfers resulting in twin live births (%) 0 / 12 1 / 8 0 / 1 0 / 2 Percentage of transfers resulting in live births (%) 2 / 12 2 / 8 0 / 1 0 / 2 Percentage of transfers resulting in pregnancies (%) 6 / 12 3 / 8 1 / 1 1 / 2
Frozen Embryos from Nondonor EggsNumber of cycles 10 5 3 0 1 0Number of transfers 10 5 3 0 1 0Estimated average number of transfers per retrieval 5.0 5.0 1.5 Average number of embryos transferred 1.9 1.8 2.7 2.0 Percentage of embryos transferred resulting in implantation (%) 1 / 19 1 / 5 2 / 8 0 / 2 Percentage of transfers resulting in term, normal weight & singleton live births
e (%) 0 / 10 0 / 5 2 / 3 0 / 1
Percentage of transfers resulting in singleton live births (%) 0 / 10 0 / 5 2 / 3 0 / 1 Percentage of transfers resulting in twin live births (%) 0 / 10 0 / 5 0 / 3 0 / 1 Percentage of transfers resulting in live births (%) 0 / 10 0 / 5 2 / 3 0 / 1 Percentage of transfers resulting in pregnancies (%) 1 / 10 3 / 5 2 / 3 0 / 1
Number of Egg/Embryo Banking Cycles 0 0 0 0 0 0
Donor Eggs Fresh Embryosf Frozen Embryosf
Number of cycles 3 7Number of transfers 3 6Average number of embryos transferred 2.0 1.8Percentage of embryos transferred resulting in implantation (%) 2 / 6 1 / 10Percentage of transfers resulting in term, normal weight & singleton live births
e (%) 1 / 3 1 / 6
Percentage of transfers resulting in singleton live births (%) 2 / 3 1 / 6Percentage of transfers resulting in twin live births (%) 0 / 3 0 / 6Percentage of transfers resulting in live births (%) 2 / 3 1 / 6Percentage of transfers resulting in pregnancies (%) 2 / 3 2 / 6
CURRENT SERVICES & PROFILE This clinic has reorganized since 2014. Contact the NASS Help Desk for further information.
Current Name: Jones Institute at West Penn Allegheny Health System
Donor eggs? YesDonor embryos? Yes
Gestational carriers? YesEmbryo cryopreservation? Yes
Single women? YesSART member? Yes
Verified lab accreditation? Yes(See Appendix C for details.)
a Reflects features of fresh nondonor cycles. If IVF is less than 100%, the remaining cycles are GIFT, ZIFT, or a combination of these procedures with IVF.
b Total patient diagnosis percentages may be greater than 100% because more than one diagnosis can be reported for each ART cycle.
c Fractions are used for rates with denominators less than 20. Multiple-infant births (for example, twins) with at least one live infant are counted as one live birth.
d Total cycle number includes those using frozen eggs. It excludes 0 cycle(s) evaluating new procedures. Both cycle types are excluded from ART success rates.
e In this report, births are defined as term if at least 37 full weeks gestation and normal birth weight if at least 2,500 grams (approximately 5 pounds, 8 ounces).
f All ages are reported together because previous data show that patient age does not materially affect success with donor eggs.

410
PE
NN
SY
LVA
NIA
REPRODUCTIVE HEALTH SPECIALISTS, INC.PITTSBURGH, PENNSYLVANIA
Comparison of success rates across clinics may not be meaningful. Patient medical characteristics and treatment approaches vary (see pages 11–20).
Data verified by Judith L. Albert, MD2014 ART CYCLE PROFILE
Type of ART and Procedural Factors a
IVF 100%Unstimulated 0%Used gestational carrier 1%
With ICSI 78%PGD/PGS 0%
Patient Diagnosis b
Tubal factor 14%Ovulatory dysfunction 16%Diminished ovarian reserve 15%Endometriosis 12%
Uterine factor 2%Male factor 46%Other factor 5%Unknown factor 16%
Multiple Factors: Female factors only 7%Female & male factors 15%
2014 ART SUCCESS RATES c Total number of cyclesd: 363 (includes 16 cycle[s] using frozen eggs)
Type of CycleAge of Woman
<35 35–37 38–40 41–42 43–44 >44Fresh Embryos from Nondonor Eggs
Number of cycles 100 52 25 9 3 0Percentage of cancellations before retrieval (%) 2.0 3.8 8.0 1 / 9 0 / 3 Average number of embryos transferred 1.3 1.7 1.7 2.0 2.5 Percentage of embryos transferred resulting in implantation (%) 53.3 41.9 34.2 0 / 12 1 / 5 Percentage of elective single embryo transfers (eSET) (%) 68.4 28.9 3 / 18 0 / 6 0 / 2
Outcomes per CyclePercentage of cycles resulting in term, normal weight & singleton live births
e (%) 38.0 26.9 32.0 0 / 9 0 / 3
Percentage of cycles resulting in singleton live births (%) 41.0 28.8 32.0 0 / 9 1 / 3 Percentage of cycles resulting in twin live births (%) 6.0 5.8 0.0 0 / 9 0 / 3 Percentage of cycles resulting in live births (%) 47.0 34.6 32.0 0 / 9 1 / 3 Percentage of cycles resulting in pregnancies (%) 51.0 50.0 48.0 0 / 9 1 / 3
Outcomes per TransferNumber of transfers 83 43 23 6 2 0Percentage of transfers resulting in term, normal weight & singleton live births
e (%) 45.8 32.6 34.8 0 / 6 0 / 2
Percentage of transfers resulting in singleton live births (%) 49.4 34.9 34.8 0 / 6 1 / 2 Percentage of transfers resulting in twin live births (%) 7.2 7.0 0.0 0 / 6 0 / 2 Percentage of transfers resulting in live births (%) 56.6 41.9 34.8 0 / 6 1 / 2 Percentage of transfers resulting in pregnancies (%) 61.4 60.5 52.2 0 / 6 1 / 2
Frozen Embryos from Nondonor EggsNumber of cycles 75 32 18 8 1 1Number of transfers 70 32 17 8 1 1Estimated average number of transfers per retrieval 2.1 1.8 1.5 2.7 Average number of embryos transferred 1.4 1.4 1.5 1.8 2.0 2.0Percentage of embryos transferred resulting in implantation (%) 36.6 39.0 30.4 2 / 14 0 / 2 1 / 2Percentage of transfers resulting in term, normal weight & singleton live births
e (%) 31.4 21.9 2 / 17 2 / 8 0 / 1 0 / 1
Percentage of transfers resulting in singleton live births (%) 37.1 28.1 4 / 17 2 / 8 0 / 1 1 / 1Percentage of transfers resulting in twin live births (%) 4.3 6.3 1 / 17 0 / 8 0 / 1 0 / 1Percentage of transfers resulting in live births (%) 41.4 34.4 5 / 17 2 / 8 0 / 1 1 / 1Percentage of transfers resulting in pregnancies (%) 50.0 53.1 8 / 17 2 / 8 0 / 1 1 / 1
Number of Egg/Embryo Banking Cycles 3 1 4 0 0 0
Donor Eggs Fresh Embryosf Frozen Embryosf
Number of cycles 5 10Number of transfers 4 9Average number of embryos transferred 1.5 1.3Percentage of embryos transferred resulting in implantation (%) 3 / 6 4 / 11Percentage of transfers resulting in term, normal weight & singleton live births
e (%) 1 / 4 1 / 9
Percentage of transfers resulting in singleton live births (%) 1 / 4 2 / 9Percentage of transfers resulting in twin live births (%) 0 / 4 1 / 9Percentage of transfers resulting in live births (%) 1 / 4 3 / 9Percentage of transfers resulting in pregnancies (%) 2 / 4 4 / 9
CURRENT SERVICES & PROFILE Current Name: Reproductive Health Specialists, Inc.
Donor eggs? YesDonor embryos? Yes
Gestational carriers? YesEmbryo cryopreservation? Yes
Single women? YesSART member? Yes
Verified lab accreditation? Yes(See Appendix C for details.)
a Reflects features of fresh nondonor cycles. If IVF is less than 100%, the remaining cycles are GIFT, ZIFT, or a combination of these procedures with IVF.
b Total patient diagnosis percentages may be greater than 100% because more than one diagnosis can be reported for each ART cycle.
c Fractions are used for rates with denominators less than 20. Multiple-infant births (for example, twins) with at least one live infant are counted as one live birth.
d Total cycle number includes those using frozen eggs. It excludes 0 cycle(s) evaluating new procedures. Both cycle types are excluded from ART success rates.
e In this report, births are defined as term if at least 37 full weeks gestation and normal birth weight if at least 2,500 grams (approximately 5 pounds, 8 ounces).
f All ages are reported together because previous data show that patient age does not materially affect success with donor eggs.

411
PE
NN
SY
LVA
NIA
UNIVERSITY OF PITTSBURGH PHYSICIANSCENTER FOR FERTILITY AND REPRODUCTIVE ENDOCRINOLOGY
PITTSBURGH, PENNSYLVANIAComparison of success rates across clinics may not be meaningful. Patient medical characteristics and treatment approaches vary (see pages 11–20).
Data verified by Anthony N. Wakim, MD2014 ART CYCLE PROFILE
Type of ART and Procedural Factors a
IVF 100%Unstimulated 0%Used gestational carrier 1%
With ICSI 70%PGD/PGS <1%
Patient Diagnosis b
Tubal factor 6%Ovulatory dysfunction 5%Diminished ovarian reserve 31%Endometriosis 7%
Uterine factor 4%Male factor 27%Other factor 20%Unknown factor 9%
Multiple Factors: Female factors only 3%Female & male factors 5%
2014 ART SUCCESS RATES c Total number of cyclesd: 789 (includes 8 cycle[s] using frozen eggs)
Type of CycleAge of Woman
<35 35–37 38–40 41–42 43–44 >44Fresh Embryos from Nondonor Eggs
Number of cycles 172 79 45 17 4 1Percentage of cancellations before retrieval (%) 2.3 12.7 11.1 4 / 17 0 / 4 0 / 1Average number of embryos transferred 1.6 2.0 2.4 2.8 2.7 4.0Percentage of embryos transferred resulting in implantation (%) 30.3 26.9 19.0 0.0 1 / 6 1 / 4Percentage of elective single embryo transfers (eSET) (%) 33.3 6.8 0.0 0 / 8 0 / 3 0 / 1
Outcomes per CyclePercentage of cycles resulting in term, normal weight & singleton live births
e (%) 17.4 15.2 6.7 0 / 17 1 / 4 1 / 1
Percentage of cycles resulting in singleton live births (%) 18.0 16.5 6.7 0 / 17 1 / 4 1 / 1Percentage of cycles resulting in twin live births (%) 3.5 5.1 8.9 0 / 17 0 / 4 0 / 1Percentage of cycles resulting in live births (%) 21.5 21.5 15.6 0 / 17 1 / 4 1 / 1Percentage of cycles resulting in pregnancies (%) 25.0 27.8 20.0 0 / 17 2 / 4 1 / 1
Outcomes per TransferNumber of transfers 104 47 26 8 3 1Percentage of transfers resulting in term, normal weight & singleton live births
e (%) 28.8 25.5 11.5 0 / 8 1 / 3 1 / 1
Percentage of transfers resulting in singleton live births (%) 29.8 27.7 11.5 0 / 8 1 / 3 1 / 1Percentage of transfers resulting in twin live births (%) 5.8 8.5 15.4 0 / 8 0 / 3 0 / 1Percentage of transfers resulting in live births (%) 35.6 36.2 26.9 0 / 8 1 / 3 1 / 1Percentage of transfers resulting in pregnancies (%) 41.3 46.8 34.6 0 / 8 2 / 3 1 / 1
Frozen Embryos from Nondonor EggsNumber of cycles 175 78 53 19 10 1Number of transfers 153 61 38 15 8 1Estimated average number of transfers per retrieval 1.6 1.9 2.0 3.8 4.0 Average number of embryos transferred 1.7 1.7 2.1 2.4 2.5 2.0Percentage of embryos transferred resulting in implantation (%) 22.6 18.4 15.0 5.7 10.0 0 / 2Percentage of transfers resulting in term, normal weight & singleton live births
e (%) 23.5 14.8 13.2 2 / 15 0 / 8 0 / 1
Percentage of transfers resulting in singleton live births (%) 28.1 14.8 18.4 2 / 15 0 / 8 0 / 1Percentage of transfers resulting in twin live births (%) 2.0 4.9 0.0 0 / 15 1 / 8 0 / 1Percentage of transfers resulting in live births (%) 30.1 19.7 21.1 2 / 15 1 / 8 0 / 1Percentage of transfers resulting in pregnancies (%) 37.9 27.9 26.3 3 / 15 1 / 8 0 / 1
Number of Egg/Embryo Banking Cycles 19 5 3 0 0 0
Donor Eggs Fresh Embryosf Frozen Embryosf
Number of cycles 35 65Number of transfers 29 56Average number of embryos transferred 1.4 1.6Percentage of embryos transferred resulting in implantation (%) 39.0 28.6Percentage of transfers resulting in term, normal weight & singleton live births
e (%) 24.1 19.6
Percentage of transfers resulting in singleton live births (%) 34.5 28.6Percentage of transfers resulting in twin live births (%) 6.9 7.1Percentage of transfers resulting in live births (%) 41.4 35.7Percentage of transfers resulting in pregnancies (%) 48.3 39.3
CURRENT SERVICES & PROFILECurrent Name: University of Pittsburgh Physicians,
Center for Fertility and Reproductive Endocrinology
Donor eggs? YesDonor embryos? Yes
Gestational carriers? YesEmbryo cryopreservation? Yes
Single women? YesSART member? Yes
Verified lab accreditation? Yes(See Appendix C for details.)
a Reflects features of fresh nondonor cycles. If IVF is less than 100%, the remaining cycles are GIFT, ZIFT, or a combination of these procedures with IVF.
b Total patient diagnosis percentages may be greater than 100% because more than one diagnosis can be reported for each ART cycle.
c Fractions are used for rates with denominators less than 20. Multiple-infant births (for example, twins) with at least one live infant are counted as one live birth.
d Total cycle number includes those using frozen eggs. It excludes 0 cycle(s) evaluating new procedures. Both cycle types are excluded from ART success rates.
e In this report, births are defined as term if at least 37 full weeks gestation and normal birth weight if at least 2,500 grams (approximately 5 pounds, 8 ounces).
f All ages are reported together because previous data show that patient age does not materially affect success with donor eggs.

412
PE
NN
SY
LVA
NIA
REPRODUCTIVE ENDOCRINOLOGY AND FERTILITY CENTERUPLAND, PENNSYLVANIA
Comparison of success rates across clinics may not be meaningful. Patient medical characteristics and treatment approaches vary (see pages 11–20).
Data verified by Albert El-Roeiy, MD2014 ART CYCLE PROFILE
Type of ART and Procedural Factors a
IVF 100%Unstimulated 0%Used gestational carrier 0%
With ICSI 54%PGD/PGS 2%
Patient Diagnosis b
Tubal factor 41%Ovulatory dysfunction 16%Diminished ovarian reserve 8%Endometriosis 25%
Uterine factor 10%Male factor 28%Other factor 33%Unknown factor 0%
Multiple Factors: Female factors only 33%Female & male factors 18%
2014 ART SUCCESS RATES c Total number of cyclesd: 147 (includes 1 cycle[s] using frozen eggs)
Type of CycleAge of Woman
<35 35–37 38–40 41–42 43–44 >44Fresh Embryos from Nondonor Eggs
Number of cycles 54 20 17 7 7 0Percentage of cancellations before retrieval (%) 24.1 25.0 4 / 17 5 / 7 5 / 7 Average number of embryos transferred 2.0 2.2 1.7 3.0 Percentage of embryos transferred resulting in implantation (%) 33.8 9.1 0 / 15 0 / 6 Percentage of elective single embryo transfers (eSET) (%) 6.5 0 / 9 0 / 4 0 / 2
Outcomes per CyclePercentage of cycles resulting in term, normal weight & singleton live births
e (%) 22.2 10.0 0 / 17 0 / 7 0 / 7
Percentage of cycles resulting in singleton live births (%) 22.2 10.0 0 / 17 0 / 7 0 / 7 Percentage of cycles resulting in twin live births (%) 9.3 0.0 0 / 17 0 / 7 0 / 7 Percentage of cycles resulting in live births (%) 31.5 10.0 0 / 17 0 / 7 0 / 7 Percentage of cycles resulting in pregnancies (%) 31.5 10.0 0 / 17 0 / 7 0 / 7
Outcomes per TransferNumber of transfers 34 10 9 0 2 0Percentage of transfers resulting in term, normal weight & singleton live births
e (%) 35.3 2 / 10 0 / 9 0 / 2
Percentage of transfers resulting in singleton live births (%) 35.3 2 / 10 0 / 9 0 / 2 Percentage of transfers resulting in twin live births (%) 14.7 0 / 10 0 / 9 0 / 2 Percentage of transfers resulting in live births (%) 50.0 2 / 10 0 / 9 0 / 2 Percentage of transfers resulting in pregnancies (%) 50.0 2 / 10 0 / 9 0 / 2
Frozen Embryos from Nondonor EggsNumber of cycles 11 11 6 0 0 0Number of transfers 10 10 6 0 0 0Estimated average number of transfers per retrieval 1.3 0.9 1.5 Average number of embryos transferred 2.0 1.8 2.2 Percentage of embryos transferred resulting in implantation (%) 40.0 4 / 18 2 / 13 Percentage of transfers resulting in term, normal weight & singleton live births
e (%) 1 / 10 2 / 10 2 / 6
Percentage of transfers resulting in singleton live births (%) 2 / 10 2 / 10 2 / 6 Percentage of transfers resulting in twin live births (%) 2 / 10 0 / 10 0 / 6 Percentage of transfers resulting in live births (%) 4 / 10 2 / 10 2 / 6 Percentage of transfers resulting in pregnancies (%) 5 / 10 3 / 10 2 / 6
Number of Egg/Embryo Banking Cycles 1 0 0 0 0 0
Donor Eggs Fresh Embryosf Frozen Embryosf
Number of cycles 6 6Number of transfers 4 5Average number of embryos transferred 2.0 1.8Percentage of embryos transferred resulting in implantation (%) 2 / 8 0 / 9Percentage of transfers resulting in term, normal weight & singleton live births
e (%) 0 / 4 0 / 5
Percentage of transfers resulting in singleton live births (%) 0 / 4 0 / 5Percentage of transfers resulting in twin live births (%) 1 / 4 0 / 5Percentage of transfers resulting in live births (%) 1 / 4 0 / 5Percentage of transfers resulting in pregnancies (%) 1 / 4 0 / 5
CURRENT SERVICES & PROFILE Current Name: Reproductive Endocrinology and Fertility Center
Donor eggs? YesDonor embryos? Yes
Gestational carriers? YesEmbryo cryopreservation? Yes
Single women? YesSART member? Yes
Verified lab accreditation? Yes(See Appendix C for details.)
a Reflects features of fresh nondonor cycles. If IVF is less than 100%, the remaining cycles are GIFT, ZIFT, or a combination of these procedures with IVF.
b Total patient diagnosis percentages may be greater than 100% because more than one diagnosis can be reported for each ART cycle.
c Fractions are used for rates with denominators less than 20. Multiple-infant births (for example, twins) with at least one live infant are counted as one live birth.
d Total cycle number includes those using frozen eggs. It excludes 0 cycle(s) evaluating new procedures. Both cycle types are excluded from ART success rates.
e In this report, births are defined as term if at least 37 full weeks gestation and normal birth weight if at least 2,500 grams (approximately 5 pounds, 8 ounces).
f All ages are reported together because previous data show that patient age does not materially affect success with donor eggs.

413
PE
NN
SY
LVA
NIA
SHADY GROVE FERTILITY RSC OF PENNSYLVANIAWAYNE, PENNSYLVANIA
Comparison of success rates across clinics may not be meaningful. Patient medical characteristics and treatment approaches vary (see pages 11–20).
Data verified by Isaac Sasson, MD, PhD2014 ART CYCLE PROFILE
Type of ART and Procedural Factors a
IVF 100%Unstimulated 0%Used gestational carrier 0%
With ICSI 76%PGD/PGS 1%
Patient Diagnosis b
Tubal factor 12%Ovulatory dysfunction 22%Diminished ovarian reserve 27%Endometriosis 6%
Uterine factor 2%Male factor 17%Other factor 4%Unknown factor 12%
Multiple Factors: Female factors only <1%Female & male factors 1%
2014 ART SUCCESS RATES c Total number of cyclesd: 493 (includes 17 cycle[s] using frozen eggs)
Type of CycleAge of Woman
<35 35–37 38–40 41–42 43–44 >44Fresh Embryos from Nondonor Eggs
Number of cycles 93 31 19 9 4 0Percentage of cancellations before retrieval (%) 6.5 9.7 5 / 19 4 / 9 2 / 4 Average number of embryos transferred 1.3 1.6 1.6 2.0 3.0 Percentage of embryos transferred resulting in implantation (%) 41.7 41.7 2 / 13 1 / 10 0 / 3 Percentage of elective single embryo transfers (eSET) (%) 64.2 40.9 1 / 5 0 / 4 0 / 1
Outcomes per CyclePercentage of cycles resulting in term, normal weight & singleton live births
e (%) 17.2 19.4 1 / 19 0 / 9 0 / 4
Percentage of cycles resulting in singleton live births (%) 19.4 22.6 1 / 19 0 / 9 0 / 4 Percentage of cycles resulting in twin live births (%) 4.3 9.7 0 / 19 0 / 9 0 / 4 Percentage of cycles resulting in live births (%) 23.7 32.3 1 / 19 0 / 9 0 / 4 Percentage of cycles resulting in pregnancies (%) 29.0 32.3 2 / 19 1 / 9 0 / 4
Outcomes per TransferNumber of transfers 56 23 8 5 1 0Percentage of transfers resulting in term, normal weight & singleton live births
e (%) 28.6 26.1 1 / 8 0 / 5 0 / 1
Percentage of transfers resulting in singleton live births (%) 32.1 30.4 1 / 8 0 / 5 0 / 1 Percentage of transfers resulting in twin live births (%) 7.1 13.0 0 / 8 0 / 5 0 / 1 Percentage of transfers resulting in live births (%) 39.3 43.5 1 / 8 0 / 5 0 / 1 Percentage of transfers resulting in pregnancies (%) 48.2 43.5 2 / 8 1 / 5 0 / 1
Frozen Embryos from Nondonor EggsNumber of cycles 107 35 31 2 1 0Number of transfers 102 35 30 2 1 0Estimated average number of transfers per retrieval 1.4 1.5 1.8 0.4 0.2 Average number of embryos transferred 1.4 1.4 1.5 1.0 1.0 Percentage of embryos transferred resulting in implantation (%) 51.6 33.3 27.3 1 / 2 0 / 1 Percentage of transfers resulting in term, normal weight & singleton live births
e (%) 32.4 34.3 13.3 0 / 2 0 / 1
Percentage of transfers resulting in singleton live births (%) 39.2 40.0 20.0 1 / 2 0 / 1 Percentage of transfers resulting in twin live births (%) 5.9 0.0 6.7 0 / 2 0 / 1 Percentage of transfers resulting in live births (%) 46.1 40.0 26.7 1 / 2 0 / 1 Percentage of transfers resulting in pregnancies (%) 60.8 42.9 33.3 1 / 2 0 / 1
Number of Egg/Embryo Banking Cycles 14 8 11 4 5 0
Donor Eggs Fresh Embryosf Frozen Embryosf
Number of cycles 48 54Number of transfers 42 48Average number of embryos transferred 1.3 1.3Percentage of embryos transferred resulting in implantation (%) 49.0 32.1Percentage of transfers resulting in term, normal weight & singleton live births
e (%) 31.0 18.8
Percentage of transfers resulting in singleton live births (%) 38.1 25.0Percentage of transfers resulting in twin live births (%) 9.5 0.0Percentage of transfers resulting in live births (%) 47.6 25.0Percentage of transfers resulting in pregnancies (%) 57.1 43.8
CURRENT SERVICES & PROFILE Current Name: Shady Grove Fertility RSC of Pennsylvania
Donor eggs? YesDonor embryos? Yes
Gestational carriers? YesEmbryo cryopreservation? Yes
Single women? YesSART member? Yes
Verified lab accreditation? Yes(See Appendix C for details.)
a Reflects features of fresh nondonor cycles. If IVF is less than 100%, the remaining cycles are GIFT, ZIFT, or a combination of these procedures with IVF.
b Total patient diagnosis percentages may be greater than 100% because more than one diagnosis can be reported for each ART cycle.
c Fractions are used for rates with denominators less than 20. Multiple-infant births (for example, twins) with at least one live infant are counted as one live birth.
d Total cycle number includes those using frozen eggs. It excludes 0 cycle(s) evaluating new procedures. Both cycle types are excluded from ART success rates.
e In this report, births are defined as term if at least 37 full weeks gestation and normal birth weight if at least 2,500 grams (approximately 5 pounds, 8 ounces).
f All ages are reported together because previous data show that patient age does not materially affect success with donor eggs.

414
PE
NN
SY
LVA
NIA
RHPN WOMEN’S CLINIC & IVF-FERTILITYWEST READING, PENNSYLVANIA
Comparison of success rates across clinics may not be meaningful. Patient medical characteristics and treatment approaches vary (see pages 11–20).
Data verified by Vincent A. Pellegrini, MD2014 ART CYCLE PROFILE
Type of ART and Procedural Factors a
IVF 100%Unstimulated 0%Used gestational carrier 0%
With ICSI 68%PGD/PGS 3%
Patient Diagnosis b
Tubal factor 22%Ovulatory dysfunction 43%Diminished ovarian reserve 46%Endometriosis 33%
Uterine factor 8%Male factor 55%Other factor 46%Unknown factor 0%
Multiple Factors: Female factors only 34%Female & male factors 53%
2014 ART SUCCESS RATES c Total number of cyclesd: 94 (includes 8 cycle[s] using frozen eggs)
Type of CycleAge of Woman
<35 35–37 38–40 41–42 43–44 >44Fresh Embryos from Nondonor Eggs
Number of cycles 37 14 8 4 3 0Percentage of cancellations before retrieval (%) 18.9 3 / 14 1 / 8 1 / 4 0 / 3 Average number of embryos transferred 2.2 2.4 2.8 3.0 5.0 Percentage of embryos transferred resulting in implantation (%) 30.6 13.6 4 / 14 0 / 9 1 / 10 Percentage of elective single embryo transfers (eSET) (%) 0.0 0 / 9 0 / 5 0 / 2 0 / 2
Outcomes per CyclePercentage of cycles resulting in term, normal weight & singleton live births
e (%) 32.4 1 / 14 2 / 8 0 / 4 0 / 3
Percentage of cycles resulting in singleton live births (%) 35.1 1 / 14 2 / 8 0 / 4 0 / 3 Percentage of cycles resulting in twin live births (%) 2.7 0 / 14 1 / 8 0 / 4 0 / 3 Percentage of cycles resulting in live births (%) 37.8 1 / 14 3 / 8 0 / 4 0 / 3 Percentage of cycles resulting in pregnancies (%) 43.2 3 / 14 3 / 8 0 / 4 1 / 3
Outcomes per TransferNumber of transfers 28 9 5 3 2 0Percentage of transfers resulting in term, normal weight & singleton live births
e (%) 42.9 1 / 9 2 / 5 0 / 3 0 / 2
Percentage of transfers resulting in singleton live births (%) 46.4 1 / 9 2 / 5 0 / 3 0 / 2 Percentage of transfers resulting in twin live births (%) 3.6 0 / 9 1 / 5 0 / 3 0 / 2 Percentage of transfers resulting in live births (%) 50.0 1 / 9 3 / 5 0 / 3 0 / 2 Percentage of transfers resulting in pregnancies (%) 57.1 3 / 9 3 / 5 0 / 3 1 / 2
Frozen Embryos from Nondonor EggsNumber of cycles 6 8 0 3 0 0Number of transfers 6 5 0 1 0 0Estimated average number of transfers per retrieval 1.5 2.5 0.0 Average number of embryos transferred 2.0 1.8 1.0 Percentage of embryos transferred resulting in implantation (%) 2 / 12 0 / 9 0 / 1 Percentage of transfers resulting in term, normal weight & singleton live births
e (%) 1 / 6 0 / 5 0 / 1
Percentage of transfers resulting in singleton live births (%) 1 / 6 0 / 5 0 / 1 Percentage of transfers resulting in twin live births (%) 0 / 6 0 / 5 0 / 1 Percentage of transfers resulting in live births (%) 1 / 6 0 / 5 0 / 1 Percentage of transfers resulting in pregnancies (%) 2 / 6 0 / 5 0 / 1
Number of Egg/Embryo Banking Cycles 2 0 0 0 1 0
Donor Eggs Fresh Embryosf Frozen Embryosf
Number of cycles 0 0Number of transfers 0 0Average number of embryos transferred Percentage of embryos transferred resulting in implantation (%) Percentage of transfers resulting in term, normal weight & singleton live births
e (%)
Percentage of transfers resulting in singleton live births (%) Percentage of transfers resulting in twin live births (%) Percentage of transfers resulting in live births (%) Percentage of transfers resulting in pregnancies (%)
CURRENT SERVICES & PROFILE Current Name: RHPN Women’s Clinic & IVF-Fertility
Donor eggs? NoDonor embryos? No
Gestational carriers? NoEmbryo cryopreservation? Yes
Single women? YesSART member? Yes
Verified lab accreditation? Yes(See Appendix C for details.)
a Reflects features of fresh nondonor cycles. If IVF is less than 100%, the remaining cycles are GIFT, ZIFT, or a combination of these procedures with IVF.
b Total patient diagnosis percentages may be greater than 100% because more than one diagnosis can be reported for each ART cycle.
c Fractions are used for rates with denominators less than 20. Multiple-infant births (for example, twins) with at least one live infant are counted as one live birth.
d Total cycle number includes those using frozen eggs. It excludes 0 cycle(s) evaluating new procedures. Both cycle types are excluded from ART success rates.
e In this report, births are defined as term if at least 37 full weeks gestation and normal birth weight if at least 2,500 grams (approximately 5 pounds, 8 ounces).
f All ages are reported together because previous data show that patient age does not materially affect success with donor eggs.

415
PE
NN
SY
LVA
NIA
THE FERTILITY CENTER, LLCYORK, PENNSYLVANIA
Comparison of success rates across clinics may not be meaningful. Patient medical characteristics and treatment approaches vary (see pages 11–20).
Data verified by Robert B. Filer, MD2014 ART CYCLE PROFILE
Type of ART and Procedural Factors a
IVF 100%Unstimulated 0%Used gestational carrier 0%
With ICSI 99%PGD/PGS 0%
Patient Diagnosis b
Tubal factor 15%Ovulatory dysfunction 26%Diminished ovarian reserve 24%Endometriosis 4%
Uterine factor 3%Male factor 20%Other factor 0%Unknown factor 15%
Multiple Factors: Female factors only 5%Female & male factors 2%
2014 ART SUCCESS RATES c Total number of cyclesd: 118 (includes 0 cycle[s] using frozen eggs)
Type of CycleAge of Woman
<35 35–37 38–40 41–42 43–44 >44Fresh Embryos from Nondonor Eggs
Number of cycles 40 12 11 2 3 3Percentage of cancellations before retrieval (%) 0.0 0 / 12 0 / 11 0 / 2 0 / 3 0 / 3Average number of embryos transferred 2.1 2.0 2.2 3.0 2.3 3.5Percentage of embryos transferred resulting in implantation (%) 31.1 40.9 13.6 0 / 6 1 / 7 0 / 7Percentage of elective single embryo transfers (eSET) (%) 5.9 0 / 10 0 / 8 0 / 2 0 / 2 0 / 2
Outcomes per CyclePercentage of cycles resulting in term, normal weight & singleton live births
e (%) 15.0 3 / 12 1 / 11 0 / 2 0 / 3 0 / 3
Percentage of cycles resulting in singleton live births (%) 20.0 3 / 12 1 / 11 0 / 2 0 / 3 0 / 3Percentage of cycles resulting in twin live births (%) 15.0 3 / 12 1 / 11 0 / 2 0 / 3 0 / 3Percentage of cycles resulting in live births (%) 35.0 6 / 12 2 / 11 0 / 2 0 / 3 0 / 3Percentage of cycles resulting in pregnancies (%) 45.0 6 / 12 2 / 11 0 / 2 1 / 3 0 / 3
Outcomes per TransferNumber of transfers 36 11 10 2 3 2Percentage of transfers resulting in term, normal weight & singleton live births
e (%) 16.7 3 / 11 1 / 10 0 / 2 0 / 3 0 / 2
Percentage of transfers resulting in singleton live births (%) 22.2 3 / 11 1 / 10 0 / 2 0 / 3 0 / 2Percentage of transfers resulting in twin live births (%) 16.7 3 / 11 1 / 10 0 / 2 0 / 3 0 / 2Percentage of transfers resulting in live births (%) 38.9 6 / 11 2 / 10 0 / 2 0 / 3 0 / 2Percentage of transfers resulting in pregnancies (%) 50.0 6 / 11 2 / 10 0 / 2 1 / 3 0 / 2
Frozen Embryos from Nondonor EggsNumber of cycles 15 1 1 0 0 1Number of transfers 15 1 1 0 0 1Estimated average number of transfers per retrieval 1.3 0.5 1.0 1.0Average number of embryos transferred 1.9 1.0 2.0 2.0Percentage of embryos transferred resulting in implantation (%) 35.7 1 / 1 0 / 2 0 / 2Percentage of transfers resulting in term, normal weight & singleton live births
e (%) 5 / 15 0 / 1 0 / 1 0 / 1
Percentage of transfers resulting in singleton live births (%) 6 / 15 1 / 1 0 / 1 0 / 1Percentage of transfers resulting in twin live births (%) 1 / 15 0 / 1 0 / 1 0 / 1Percentage of transfers resulting in live births (%) 7 / 15 1 / 1 0 / 1 0 / 1Percentage of transfers resulting in pregnancies (%) 9 / 15 1 / 1 0 / 1 0 / 1
Number of Egg/Embryo Banking Cycles 3 0 0 0 0 0
Donor Eggs Fresh Embryosf Frozen Embryosf
Number of cycles 14 12Number of transfers 14 12Average number of embryos transferred 2.1 1.8Percentage of embryos transferred resulting in implantation (%) 39.3 61.9Percentage of transfers resulting in term, normal weight & singleton live births
e (%) 2 / 14 2 / 12
Percentage of transfers resulting in singleton live births (%) 4 / 14 4 / 12Percentage of transfers resulting in twin live births (%) 3 / 14 3 / 12Percentage of transfers resulting in live births (%) 7 / 14 7 / 12Percentage of transfers resulting in pregnancies (%) 9 / 14 9 / 12
CURRENT SERVICES & PROFILE Current Name: The Fertility Center, LLC
Donor eggs? YesDonor embryos? Yes
Gestational carriers? YesEmbryo cryopreservation? Yes
Single women? YesSART member? No
Verified lab accreditation? No(See Appendix C for details.)
a Reflects features of fresh nondonor cycles. If IVF is less than 100%, the remaining cycles are GIFT, ZIFT, or a combination of these procedures with IVF.
b Total patient diagnosis percentages may be greater than 100% because more than one diagnosis can be reported for each ART cycle.
c Fractions are used for rates with denominators less than 20. Multiple-infant births (for example, twins) with at least one live infant are counted as one live birth.
d Total cycle number includes those using frozen eggs. It excludes 0 cycle(s) evaluating new procedures. Both cycle types are excluded from ART success rates.
e In this report, births are defined as term if at least 37 full weeks gestation and normal birth weight if at least 2,500 grams (approximately 5 pounds, 8 ounces).
f All ages are reported together because previous data show that patient age does not materially affect success with donor eggs.

416
PU
ER
TO
RIC
OPEDRO J. BEAUCHAMP, MD IVF PROGRAM
BAYAMON, PUERTO RICOComparison of success rates across clinics may not be meaningful. Patient medical characteristics and treatment approaches vary (see pages 11–20).
Data verified by Pedro J. Beauchamp, MD2014 ART CYCLE PROFILE
Type of ART and Procedural Factors a
IVF 100%Unstimulated 0%Used gestational carrier 0%
With ICSI 75%PGD/PGS 0%
Patient Diagnosis b
Tubal factor 44%Ovulatory dysfunction 23%Diminished ovarian reserve 6%Endometriosis 28%
Uterine factor 11%Male factor 60%Other factor 37%Unknown factor 2%
Multiple Factors: Female factors only 21%Female & male factors 48%
2014 ART SUCCESS RATES c Total number of cyclesd: 160 (includes 0 cycle[s] using frozen eggs)
Type of CycleAge of Woman
<35 35–37 38–40 41–42 43–44 >44Fresh Embryos from Nondonor Eggs
Number of cycles 50 28 36 18 6 1Percentage of cancellations before retrieval (%) 4.0 3.6 19.4 3 / 18 1 / 6 0 / 1Average number of embryos transferred 2.1 2.4 2.4 2.6 2.0 3.0Percentage of embryos transferred resulting in implantation (%) 51.6 37.1 19.0 11.1 1 / 7 0 / 3Percentage of elective single embryo transfers (eSET) (%) 0.0 0.0 0.0 0 / 13 0 / 3 0 / 1
Outcomes per CyclePercentage of cycles resulting in term, normal weight & singleton live births
e (%) 16.0 21.4 16.7 2 / 18 1 / 6 0 / 1
Percentage of cycles resulting in singleton live births (%) 18.0 25.0 22.2 2 / 18 1 / 6 0 / 1Percentage of cycles resulting in twin live births (%) 20.0 14.3 2.8 0 / 18 0 / 6 0 / 1Percentage of cycles resulting in live births (%) 40.0 42.9 25.0 2 / 18 1 / 6 0 / 1Percentage of cycles resulting in pregnancies (%) 66.0 53.6 36.1 6 / 18 2 / 6 0 / 1
Outcomes per TransferNumber of transfers 47 26 29 13 5 1Percentage of transfers resulting in term, normal weight & singleton live births
e (%) 17.0 23.1 20.7 2 / 13 1 / 5 0 / 1
Percentage of transfers resulting in singleton live births (%) 19.1 26.9 27.6 2 / 13 1 / 5 0 / 1Percentage of transfers resulting in twin live births (%) 21.3 15.4 3.4 0 / 13 0 / 5 0 / 1Percentage of transfers resulting in live births (%) 42.6 46.2 31.0 2 / 13 1 / 5 0 / 1Percentage of transfers resulting in pregnancies (%) 70.2 57.7 44.8 6 / 13 2 / 5 0 / 1
Frozen Embryos from Nondonor EggsNumber of cycles 6 1 1 1 1 0Number of transfers 6 1 1 1 1 0Estimated average number of transfers per retrieval 3.0 0.5 1.0 Average number of embryos transferred 2.5 3.0 3.0 1.0 4.0 Percentage of embryos transferred resulting in implantation (%) 1 / 12 0 / 3 0 / 3 0 / 1 0 / 4 Percentage of transfers resulting in term, normal weight & singleton live births
e (%) 0 / 6 0 / 1 0 / 1 0 / 1 0 / 1
Percentage of transfers resulting in singleton live births (%) 0 / 6 0 / 1 0 / 1 0 / 1 0 / 1 Percentage of transfers resulting in twin live births (%) 0 / 6 0 / 1 0 / 1 0 / 1 0 / 1 Percentage of transfers resulting in live births (%) 0 / 6 0 / 1 0 / 1 0 / 1 0 / 1 Percentage of transfers resulting in pregnancies (%) 2 / 6 0 / 1 0 / 1 0 / 1 0 / 1
Number of Egg/Embryo Banking Cycles 0 0 0 0 0 0
Donor Eggs Fresh Embryosf Frozen Embryosf
Number of cycles 9 2Number of transfers 9 2Average number of embryos transferred 2.3 2.5Percentage of embryos transferred resulting in implantation (%) 47.6 3 / 5Percentage of transfers resulting in term, normal weight & singleton live births
e (%) 2 / 9 0 / 2
Percentage of transfers resulting in singleton live births (%) 4 / 9 0 / 2Percentage of transfers resulting in twin live births (%) 2 / 9 1 / 2Percentage of transfers resulting in live births (%) 6 / 9 1 / 2Percentage of transfers resulting in pregnancies (%) 6 / 9 2 / 2
CURRENT SERVICES & PROFILE Current Name: Pedro J. Beauchamp, MD IVF Program
Donor eggs? YesDonor embryos? No
Gestational carriers? YesEmbryo cryopreservation? Yes
Single women? NoSART member? Yes
Verified lab accreditation? Yes(See Appendix C for details.)
a Reflects features of fresh nondonor cycles. If IVF is less than 100%, the remaining cycles are GIFT, ZIFT, or a combination of these procedures with IVF.
b Total patient diagnosis percentages may be greater than 100% because more than one diagnosis can be reported for each ART cycle.
c Fractions are used for rates with denominators less than 20. Multiple-infant births (for example, twins) with at least one live infant are counted as one live birth.
d Total cycle number includes those using frozen eggs. It excludes 0 cycle(s) evaluating new procedures. Both cycle types are excluded from ART success rates.
e In this report, births are defined as term if at least 37 full weeks gestation and normal birth weight if at least 2,500 grams (approximately 5 pounds, 8 ounces).
f All ages are reported together because previous data show that patient age does not materially affect success with donor eggs.

417
PU
ER
TO
RIC
OCLINICA DE FERTILIDAD HIMA-SAN PABLO CAGUAS
CAGUAS, PUERTO RICOComparison of success rates across clinics may not be meaningful. Patient medical characteristics and treatment approaches vary (see pages 11–20).
Data verified by Jose R. Cruz, MD2014 ART CYCLE PROFILE
Type of ART and Procedural Factors a
IVF 100%Unstimulated 0%Used gestational carrier 0%
With ICSI 66%PGD/PGS 0%
Patient Diagnosis b
Tubal factor 25%Ovulatory dysfunction 0%Diminished ovarian reserve 11%Endometriosis 19%
Uterine factor 2%Male factor 37%Other factor 3%Unknown factor 14%
Multiple Factors: Female factors only 2%Female & male factors 8%
2014 ART SUCCESS RATES c Total number of cyclesd: 63 (includes 0 cycle[s] using frozen eggs)
Type of CycleAge of Woman
<35 35–37 38–40 41–42 43–44 >44Fresh Embryos from Nondonor Eggs
Number of cycles 26 14 7 3 0 0Percentage of cancellations before retrieval (%) 3.8 1 / 14 0 / 7 0 / 3 Average number of embryos transferred 2.0 2.1 2.3 2.0 Percentage of embryos transferred resulting in implantation (%) 33.3 4.0 2 / 14 0 / 6 Percentage of elective single embryo transfers (eSET) (%) 14.3 1 / 12 0 / 5 0 / 2
Outcomes per CyclePercentage of cycles resulting in term, normal weight & singleton live births
e (%) 26.9 1 / 14 0 / 7 0 / 3
Percentage of cycles resulting in singleton live births (%) 30.8 1 / 14 0 / 7 0 / 3 Percentage of cycles resulting in twin live births (%) 7.7 0 / 14 1 / 7 0 / 3 Percentage of cycles resulting in live births (%) 38.5 1 / 14 1 / 7 0 / 3 Percentage of cycles resulting in pregnancies (%) 46.2 1 / 14 1 / 7 0 / 3
Outcomes per TransferNumber of transfers 22 12 6 3 0 0Percentage of transfers resulting in term, normal weight & singleton live births
e (%) 31.8 1 / 12 0 / 6 0 / 3
Percentage of transfers resulting in singleton live births (%) 36.4 1 / 12 0 / 6 0 / 3 Percentage of transfers resulting in twin live births (%) 9.1 0 / 12 1 / 6 0 / 3 Percentage of transfers resulting in live births (%) 45.5 1 / 12 1 / 6 0 / 3 Percentage of transfers resulting in pregnancies (%) 54.5 1 / 12 1 / 6 0 / 3
Frozen Embryos from Nondonor EggsNumber of cycles 3 4 2 0 0 0Number of transfers 3 4 2 0 0 0Estimated average number of transfers per retrieval 3.0 2.0 1.0 Average number of embryos transferred 1.7 2.3 2.5 Percentage of embryos transferred resulting in implantation (%) 1 / 5 0 / 9 1 / 5 Percentage of transfers resulting in term, normal weight & singleton live births
e (%) 1 / 3 0 / 4 0 / 2
Percentage of transfers resulting in singleton live births (%) 1 / 3 0 / 4 1 / 2 Percentage of transfers resulting in twin live births (%) 0 / 3 0 / 4 0 / 2 Percentage of transfers resulting in live births (%) 1 / 3 0 / 4 1 / 2 Percentage of transfers resulting in pregnancies (%) 1 / 3 0 / 4 1 / 2
Number of Egg/Embryo Banking Cycles 0 0 0 0 0 0
Donor Eggs Fresh Embryosf Frozen Embryosf
Number of cycles 2 2Number of transfers 1 2Average number of embryos transferred 2.0 2.0Percentage of embryos transferred resulting in implantation (%) 0 / 2 0 / 4Percentage of transfers resulting in term, normal weight & singleton live births
e (%) 0 / 1 0 / 2
Percentage of transfers resulting in singleton live births (%) 0 / 1 0 / 2Percentage of transfers resulting in twin live births (%) 0 / 1 0 / 2Percentage of transfers resulting in live births (%) 0 / 1 0 / 2Percentage of transfers resulting in pregnancies (%) 0 / 1 0 / 2
CURRENT SERVICES & PROFILE Current Name: Clinica de Fertilidad HIMA-San Pablo Caguas
Donor eggs? YesDonor embryos? Yes
Gestational carriers? YesEmbryo cryopreservation? Yes
Single women? YesSART member? No
Verified lab accreditation? No(See Appendix C for details.)
a Reflects features of fresh nondonor cycles. If IVF is less than 100%, the remaining cycles are GIFT, ZIFT, or a combination of these procedures with IVF.
b Total patient diagnosis percentages may be greater than 100% because more than one diagnosis can be reported for each ART cycle.
c Fractions are used for rates with denominators less than 20. Multiple-infant births (for example, twins) with at least one live infant are counted as one live birth.
d Total cycle number includes those using frozen eggs. It excludes 0 cycle(s) evaluating new procedures. Both cycle types are excluded from ART success rates.
e In this report, births are defined as term if at least 37 full weeks gestation and normal birth weight if at least 2,500 grams (approximately 5 pounds, 8 ounces).
f All ages are reported together because previous data show that patient age does not materially affect success with donor eggs.

418
PU
ER
TO
RIC
OGREFI
GYNECOLOGY, REPRODUCTIVE ENDOCRINOLOGY & FERTILITY INSTITUTESAN JUAN, PUERTO RICO
Comparison of success rates across clinics may not be meaningful. Patient medical characteristics and treatment approaches vary (see pages 11–20).
Data verified by Rosa Ileana Cruz, MD2014 ART CYCLE PROFILE
Type of ART and Procedural Factors a
IVF 100%Unstimulated 0%Used gestational carrier 8%
With ICSI 85%PGD/PGS 27%
Patient Diagnosis b
Tubal factor 22%Ovulatory dysfunction 2%Diminished ovarian reserve 13%Endometriosis 7%
Uterine factor 4%Male factor 39%Other factor 17%Unknown factor 7%
Multiple Factors: Female factors only 2%Female & male factors 9%
2014 ART SUCCESS RATES c Total number of cyclesd: 50 (includes 0 cycle[s] using frozen eggs)
Type of CycleAge of Woman
<35 35–37 38–40 41–42 43–44 >44Fresh Embryos from Nondonor Eggs
Number of cycles 7 11 5 3 0 0Percentage of cancellations before retrieval (%) 0 / 7 0 / 11 0 / 5 0 / 3 Average number of embryos transferred 2.1 2.0 2.6 1.0 Percentage of embryos transferred resulting in implantation (%) 2 / 15 10.0 2 / 13 0 / 2 Percentage of elective single embryo transfers (eSET) (%) 0 / 6 1 / 9 0 / 5
Outcomes per CyclePercentage of cycles resulting in term, normal weight & singleton live births
e (%) 1 / 7 2 / 11 1 / 5 0 / 3
Percentage of cycles resulting in singleton live births (%) 2 / 7 2 / 11 1 / 5 0 / 3 Percentage of cycles resulting in twin live births (%) 0 / 7 0 / 11 0 / 5 0 / 3 Percentage of cycles resulting in live births (%) 2 / 7 2 / 11 1 / 5 0 / 3 Percentage of cycles resulting in pregnancies (%) 2 / 7 2 / 11 2 / 5 0 / 3
Outcomes per TransferNumber of transfers 7 10 5 2 0 0Percentage of transfers resulting in term, normal weight & singleton live births
e (%) 1 / 7 2 / 10 1 / 5 0 / 2
Percentage of transfers resulting in singleton live births (%) 2 / 7 2 / 10 1 / 5 0 / 2 Percentage of transfers resulting in twin live births (%) 0 / 7 0 / 10 0 / 5 0 / 2 Percentage of transfers resulting in live births (%) 2 / 7 2 / 10 1 / 5 0 / 2 Percentage of transfers resulting in pregnancies (%) 2 / 7 2 / 10 2 / 5 0 / 2
Frozen Embryos from Nondonor EggsNumber of cycles 0 2 7 1 1 0Number of transfers 0 2 6 1 1 0Estimated average number of transfers per retrieval 2.0 1.0 0.0Average number of embryos transferred 3.0 1.7 1.0 1.0 Percentage of embryos transferred resulting in implantation (%) 0 / 6 1 / 10 0 / 1 0 / 1 Percentage of transfers resulting in term, normal weight & singleton live births
e (%) 0 / 2 1 / 6 0 / 1 0 / 1
Percentage of transfers resulting in singleton live births (%) 0 / 2 1 / 6 0 / 1 0 / 1 Percentage of transfers resulting in twin live births (%) 0 / 2 0 / 6 0 / 1 0 / 1 Percentage of transfers resulting in live births (%) 0 / 2 1 / 6 0 / 1 0 / 1 Percentage of transfers resulting in pregnancies (%) 0 / 2 1 / 6 0 / 1 0 / 1
Number of Egg/Embryo Banking Cycles 0 0 0 1 0 3
Donor Eggs Fresh Embryosf Frozen Embryosf
Number of cycles 7 2Number of transfers 7 2Average number of embryos transferred 2.1 1.5Percentage of embryos transferred resulting in implantation (%) 1 / 15 0 / 3Percentage of transfers resulting in term, normal weight & singleton live births
e (%) 0 / 7 0 / 2
Percentage of transfers resulting in singleton live births (%) 1 / 7 0 / 2Percentage of transfers resulting in twin live births (%) 0 / 7 0 / 2Percentage of transfers resulting in live births (%) 1 / 7 0 / 2Percentage of transfers resulting in pregnancies (%) 1 / 7 0 / 2
CURRENT SERVICES & PROFILE Current Name: GREFI, Gynecology, Reproductive Endocrinology & Fertility Institute
Donor eggs? YesDonor embryos? Yes
Gestational carriers? YesEmbryo cryopreservation? Yes
Single women? YesSART member? Yes
Verified lab accreditation? No(See Appendix C for details.)
a Reflects features of fresh nondonor cycles. If IVF is less than 100%, the remaining cycles are GIFT, ZIFT, or a combination of these procedures with IVF.
b Total patient diagnosis percentages may be greater than 100% because more than one diagnosis can be reported for each ART cycle.
c Fractions are used for rates with denominators less than 20. Multiple-infant births (for example, twins) with at least one live infant are counted as one live birth.
d Total cycle number includes those using frozen eggs. It excludes 0 cycle(s) evaluating new procedures. Both cycle types are excluded from ART success rates.
e In this report, births are defined as term if at least 37 full weeks gestation and normal birth weight if at least 2,500 grams (approximately 5 pounds, 8 ounces).
f All ages are reported together because previous data show that patient age does not materially affect success with donor eggs.

419
RH
OD
E IS
LA
ND
WOMEN AND INFANTS’ CENTER FOR REPRODUCTION AND INFERTILITYPROVIDENCE, RHODE ISLAND
Comparison of success rates across clinics may not be meaningful. Patient medical characteristics and treatment approaches vary (see pages 11–20).
Data verified by Ruben Alvero, MD2014 ART CYCLE PROFILE
Type of ART and Procedural Factors a
IVF 100%Unstimulated 0%Used gestational carrier <1%
With ICSI 51%PGD/PGS 2%
Patient Diagnosis b
Tubal factor 8%Ovulatory dysfunction 8%Diminished ovarian reserve 6%Endometriosis 3%
Uterine factor 3%Male factor 25%Other factor 9%Unknown factor 47%
Multiple Factors: Female factors only 3%Female & male factors 5%
2014 ART SUCCESS RATES c Total number of cyclesd: 602 (includes 1 cycle[s] using frozen eggs)
Type of CycleAge of Woman
<35 35–37 38–40 41–42 43–44 >44Fresh Embryos from Nondonor Eggs
Number of cycles 169 99 97 52 20 0Percentage of cancellations before retrieval (%) 3.6 4.0 9.3 9.6 10.0 Average number of embryos transferred 1.8 2.0 2.6 3.2 3.4 Percentage of embryos transferred resulting in implantation (%) 31.1 24.1 17.4 8.3 4.4 Percentage of elective single embryo transfers (eSET) (%) 19.9 6.2 0.0 0.0 0 / 11
Outcomes per CyclePercentage of cycles resulting in term, normal weight & singleton live births
e (%) 23.1 24.2 12.4 1.9 5.0
Percentage of cycles resulting in singleton live births (%) 25.4 26.3 12.4 1.9 5.0 Percentage of cycles resulting in twin live births (%) 9.5 5.1 8.2 5.8 0.0 Percentage of cycles resulting in live births (%) 34.9 31.3 20.6 7.7 5.0 Percentage of cycles resulting in pregnancies (%) 42.0 37.4 26.8 19.2 10.0
Outcomes per TransferNumber of transfers 153 90 79 41 14 0Percentage of transfers resulting in term, normal weight & singleton live births
e (%) 25.5 26.7 15.2 2.4 1 / 14
Percentage of transfers resulting in singleton live births (%) 28.1 28.9 15.2 2.4 1 / 14 Percentage of transfers resulting in twin live births (%) 10.5 5.6 10.1 7.3 0 / 14 Percentage of transfers resulting in live births (%) 38.6 34.4 25.3 9.8 1 / 14 Percentage of transfers resulting in pregnancies (%) 46.4 41.1 32.9 24.4 2 / 14
Frozen Embryos from Nondonor EggsNumber of cycles 70 32 23 7 3 0Number of transfers 69 31 23 7 3 0Estimated average number of transfers per retrieval 1.2 1.6 1.4 1.0 3.0 Average number of embryos transferred 1.9 1.8 1.9 2.3 3.3 Percentage of embryos transferred resulting in implantation (%) 18.7 15.1 16.7 2 / 16 0 / 7 Percentage of transfers resulting in term, normal weight & singleton live births
e (%) 18.8 25.8 21.7 0 / 7 0 / 3
Percentage of transfers resulting in singleton live births (%) 18.8 25.8 26.1 0 / 7 0 / 3 Percentage of transfers resulting in twin live births (%) 5.8 0.0 0.0 1 / 7 0 / 3 Percentage of transfers resulting in live births (%) 24.6 25.8 26.1 1 / 7 0 / 3 Percentage of transfers resulting in pregnancies (%) 31.9 29.0 34.8 1 / 7 1 / 3
Number of Egg/Embryo Banking Cycles 2 4 0 0 0 0
Donor Eggs Fresh Embryosf Frozen Embryosf
Number of cycles 18 5Number of transfers 17 5Average number of embryos transferred 1.9 1.6Percentage of embryos transferred resulting in implantation (%) 42.4 3 / 8Percentage of transfers resulting in term, normal weight & singleton live births
e (%) 3 / 17 2 / 5
Percentage of transfers resulting in singleton live births (%) 4 / 17 2 / 5Percentage of transfers resulting in twin live births (%) 4 / 17 0 / 5Percentage of transfers resulting in live births (%) 8 / 17 2 / 5Percentage of transfers resulting in pregnancies (%) 9 / 17 2 / 5
CURRENT SERVICES & PROFILE This clinic has reorganized since 2014. Contact the NASS Help Desk for further information.
Current Name: Women and Infants’ Center for Reproduction and Infertility
Donor eggs? YesDonor embryos? No
Gestational carriers? YesEmbryo cryopreservation? Yes
Single women? YesSART member? Yes
Verified lab accreditation? Yes(See Appendix C for details.)
a Reflects features of fresh nondonor cycles. If IVF is less than 100%, the remaining cycles are GIFT, ZIFT, or a combination of these procedures with IVF.
b Total patient diagnosis percentages may be greater than 100% because more than one diagnosis can be reported for each ART cycle.
c Fractions are used for rates with denominators less than 20. Multiple-infant births (for example, twins) with at least one live infant are counted as one live birth.
d Total cycle number includes those using frozen eggs. It excludes 0 cycle(s) evaluating new procedures. Both cycle types are excluded from ART success rates.
e In this report, births are defined as term if at least 37 full weeks gestation and normal birth weight if at least 2,500 grams (approximately 5 pounds, 8 ounces).
f All ages are reported together because previous data show that patient age does not materially affect success with donor eggs.
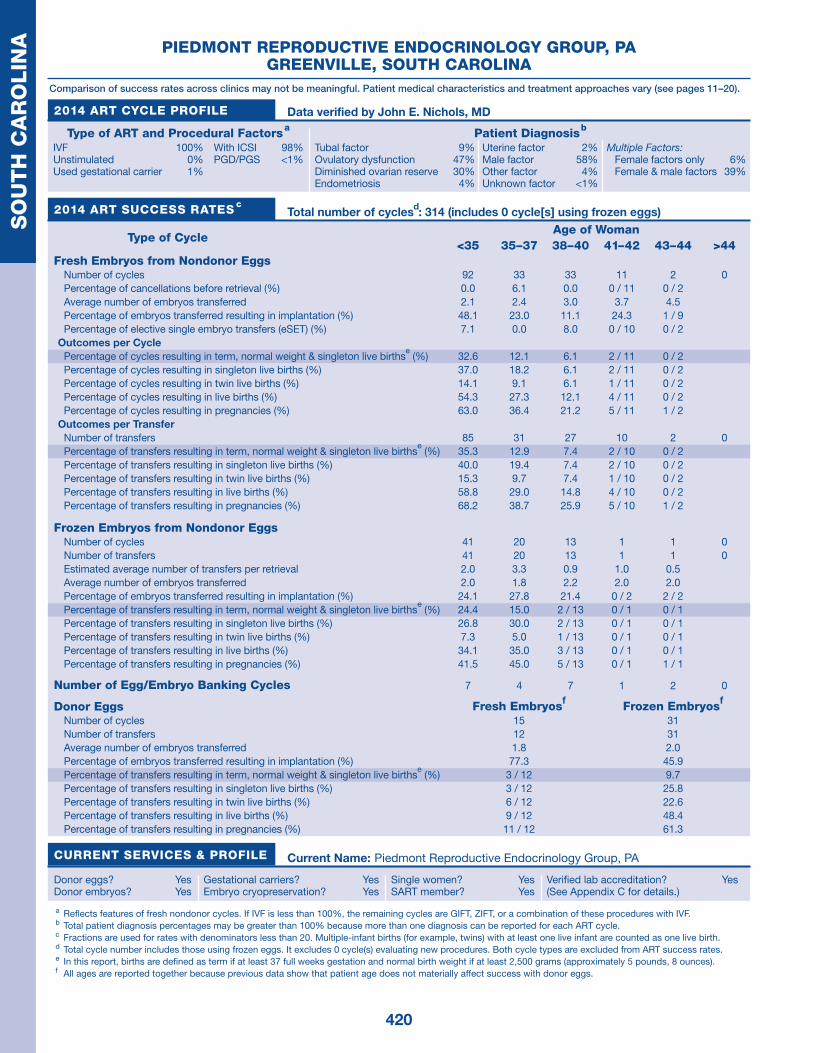
420
SO
UT
H C
AR
OLIN
A PIEDMONT REPRODUCTIVE ENDOCRINOLOGY GROUP, PAGREENVILLE, SOUTH CAROLINA
Comparison of success rates across clinics may not be meaningful. Patient medical characteristics and treatment approaches vary (see pages 11–20).
Data verified by John E. Nichols, MD2014 ART CYCLE PROFILE
Type of ART and Procedural Factors a
IVF 100%Unstimulated 0%Used gestational carrier 1%
With ICSI 98%PGD/PGS <1%
Patient Diagnosis b
Tubal factor 9%Ovulatory dysfunction 47%Diminished ovarian reserve 30%Endometriosis 4%
Uterine factor 2%Male factor 58%Other factor 4%Unknown factor <1%
Multiple Factors: Female factors only 6%Female & male factors 39%
2014 ART SUCCESS RATES c Total number of cyclesd: 314 (includes 0 cycle[s] using frozen eggs)
Type of CycleAge of Woman
<35 35–37 38–40 41–42 43–44 >44Fresh Embryos from Nondonor Eggs
Number of cycles 92 33 33 11 2 0Percentage of cancellations before retrieval (%) 0.0 6.1 0.0 0 / 11 0 / 2 Average number of embryos transferred 2.1 2.4 3.0 3.7 4.5 Percentage of embryos transferred resulting in implantation (%) 48.1 23.0 11.1 24.3 1 / 9 Percentage of elective single embryo transfers (eSET) (%) 7.1 0.0 8.0 0 / 10 0 / 2
Outcomes per CyclePercentage of cycles resulting in term, normal weight & singleton live births
e (%) 32.6 12.1 6.1 2 / 11 0 / 2
Percentage of cycles resulting in singleton live births (%) 37.0 18.2 6.1 2 / 11 0 / 2 Percentage of cycles resulting in twin live births (%) 14.1 9.1 6.1 1 / 11 0 / 2 Percentage of cycles resulting in live births (%) 54.3 27.3 12.1 4 / 11 0 / 2 Percentage of cycles resulting in pregnancies (%) 63.0 36.4 21.2 5 / 11 1 / 2
Outcomes per TransferNumber of transfers 85 31 27 10 2 0Percentage of transfers resulting in term, normal weight & singleton live births
e (%) 35.3 12.9 7.4 2 / 10 0 / 2
Percentage of transfers resulting in singleton live births (%) 40.0 19.4 7.4 2 / 10 0 / 2 Percentage of transfers resulting in twin live births (%) 15.3 9.7 7.4 1 / 10 0 / 2 Percentage of transfers resulting in live births (%) 58.8 29.0 14.8 4 / 10 0 / 2 Percentage of transfers resulting in pregnancies (%) 68.2 38.7 25.9 5 / 10 1 / 2
Frozen Embryos from Nondonor EggsNumber of cycles 41 20 13 1 1 0Number of transfers 41 20 13 1 1 0Estimated average number of transfers per retrieval 2.0 3.3 0.9 1.0 0.5 Average number of embryos transferred 2.0 1.8 2.2 2.0 2.0 Percentage of embryos transferred resulting in implantation (%) 24.1 27.8 21.4 0 / 2 2 / 2 Percentage of transfers resulting in term, normal weight & singleton live births
e (%) 24.4 15.0 2 / 13 0 / 1 0 / 1
Percentage of transfers resulting in singleton live births (%) 26.8 30.0 2 / 13 0 / 1 0 / 1 Percentage of transfers resulting in twin live births (%) 7.3 5.0 1 / 13 0 / 1 0 / 1 Percentage of transfers resulting in live births (%) 34.1 35.0 3 / 13 0 / 1 0 / 1 Percentage of transfers resulting in pregnancies (%) 41.5 45.0 5 / 13 0 / 1 1 / 1
Number of Egg/Embryo Banking Cycles 7 4 7 1 2 0
Donor Eggs Fresh Embryosf Frozen Embryosf
Number of cycles 15 31Number of transfers 12 31Average number of embryos transferred 1.8 2.0Percentage of embryos transferred resulting in implantation (%) 77.3 45.9Percentage of transfers resulting in term, normal weight & singleton live births
e (%) 3 / 12 9.7
Percentage of transfers resulting in singleton live births (%) 3 / 12 25.8Percentage of transfers resulting in twin live births (%) 6 / 12 22.6Percentage of transfers resulting in live births (%) 9 / 12 48.4Percentage of transfers resulting in pregnancies (%) 11 / 12 61.3
CURRENT SERVICES & PROFILE Current Name: Piedmont Reproductive Endocrinology Group, PA
Donor eggs? YesDonor embryos? Yes
Gestational carriers? YesEmbryo cryopreservation? Yes
Single women? YesSART member? Yes
Verified lab accreditation? Yes(See Appendix C for details.)
a Reflects features of fresh nondonor cycles. If IVF is less than 100%, the remaining cycles are GIFT, ZIFT, or a combination of these procedures with IVF.
b Total patient diagnosis percentages may be greater than 100% because more than one diagnosis can be reported for each ART cycle.
c Fractions are used for rates with denominators less than 20. Multiple-infant births (for example, twins) with at least one live infant are counted as one live birth.
d Total cycle number includes those using frozen eggs. It excludes 0 cycle(s) evaluating new procedures. Both cycle types are excluded from ART success rates.
e In this report, births are defined as term if at least 37 full weeks gestation and normal birth weight if at least 2,500 grams (approximately 5 pounds, 8 ounces).
f All ages are reported together because previous data show that patient age does not materially affect success with donor eggs.

421
SO
UT
H C
AR
OLIN
AUNIVERSITY MEDICAL GROUP, DEPARTMENT OF OBSTETRICS AND GYNECOLOGY
FERTILITY CENTER OF THE CAROLINASGREENVILLE, SOUTH CAROLINA
Comparison of success rates across clinics may not be meaningful. Patient medical characteristics and treatment approaches vary (see pages 11–20).
Data verified by Paul B. Miller, MD2014 ART CYCLE PROFILE
Type of ART and Procedural Factors a
IVF 100%Unstimulated 0%Used gestational carrier 0%
With ICSI 90%PGD/PGS 5%
Patient Diagnosis b
Tubal factor 12%Ovulatory dysfunction 30%Diminished ovarian reserve 3%Endometriosis 21%
Uterine factor <1%Male factor 41%Other factor 14%Unknown factor 5%
Multiple Factors: Female factors only 6%Female & male factors 20%
2014 ART SUCCESS RATES c Total number of cyclesd: 142 (includes 0 cycle[s] using frozen eggs)
Type of CycleAge of Woman
<35 35–37 38–40 41–42 43–44 >44Fresh Embryos from Nondonor Eggs
Number of cycles 34 20 6 5 2 0Percentage of cancellations before retrieval (%) 0.0 25.0 0 / 6 0 / 5 0 / 2 Average number of embryos transferred 1.9 2.1 2.0 2.7 3.5 Percentage of embryos transferred resulting in implantation (%) 43.1 33.3 4 / 12 1 / 8 1 / 7 Percentage of elective single embryo transfers (eSET) (%) 10.3 0 / 13 0 / 5 0 / 3 0 / 2
Outcomes per CyclePercentage of cycles resulting in term, normal weight & singleton live births
e (%) 29.4 20.0 2 / 6 1 / 5 0 / 2
Percentage of cycles resulting in singleton live births (%) 29.4 25.0 2 / 6 1 / 5 0 / 2 Percentage of cycles resulting in twin live births (%) 20.6 5.0 0 / 6 0 / 5 0 / 2 Percentage of cycles resulting in live births (%) 50.0 30.0 2 / 6 1 / 5 0 / 2 Percentage of cycles resulting in pregnancies (%) 50.0 45.0 3 / 6 1 / 5 1 / 2
Outcomes per TransferNumber of transfers 30 14 6 3 2 0Percentage of transfers resulting in term, normal weight & singleton live births
e (%) 33.3 4 / 14 2 / 6 1 / 3 0 / 2
Percentage of transfers resulting in singleton live births (%) 33.3 5 / 14 2 / 6 1 / 3 0 / 2 Percentage of transfers resulting in twin live births (%) 23.3 1 / 14 0 / 6 0 / 3 0 / 2 Percentage of transfers resulting in live births (%) 56.7 6 / 14 2 / 6 1 / 3 0 / 2 Percentage of transfers resulting in pregnancies (%) 56.7 9 / 14 3 / 6 1 / 3 1 / 2
Frozen Embryos from Nondonor EggsNumber of cycles 29 6 8 4 0 0Number of transfers 29 6 7 4 0 0Estimated average number of transfers per retrieval 1.8 3.0 1.2 4.0 Average number of embryos transferred 1.8 1.3 2.0 2.0 Percentage of embryos transferred resulting in implantation (%) 23.5 4 / 8 3 / 12 1 / 8 Percentage of transfers resulting in term, normal weight & singleton live births
e (%) 20.7 1 / 6 1 / 7 1 / 4
Percentage of transfers resulting in singleton live births (%) 24.1 2 / 6 3 / 7 1 / 4 Percentage of transfers resulting in twin live births (%) 6.9 1 / 6 0 / 7 0 / 4 Percentage of transfers resulting in live births (%) 31.0 3 / 6 3 / 7 1 / 4 Percentage of transfers resulting in pregnancies (%) 34.5 3 / 6 4 / 7 1 / 4
Number of Egg/Embryo Banking Cycles 9 1 5 1 0 0
Donor Eggs Fresh Embryosf Frozen Embryosf
Number of cycles 9 3Number of transfers 9 3Average number of embryos transferred 1.9 2.0Percentage of embryos transferred resulting in implantation (%) 8 / 17 1 / 6Percentage of transfers resulting in term, normal weight & singleton live births
e (%) 0 / 9 1 / 3
Percentage of transfers resulting in singleton live births (%) 1 / 9 1 / 3Percentage of transfers resulting in twin live births (%) 3 / 9 0 / 3Percentage of transfers resulting in live births (%) 4 / 9 1 / 3Percentage of transfers resulting in pregnancies (%) 5 / 9 1 / 3
CURRENT SERVICES & PROFILECurrent Name: University Medical Group, Department of Obstetrics and Gynecology,
Fertility Center of the Carolinas
Donor eggs? YesDonor embryos? No
Gestational carriers? YesEmbryo cryopreservation? Yes
Single women? YesSART member? Yes
Verified lab accreditation? Yes(See Appendix C for details.)
a Reflects features of fresh nondonor cycles. If IVF is less than 100%, the remaining cycles are GIFT, ZIFT, or a combination of these procedures with IVF.
b Total patient diagnosis percentages may be greater than 100% because more than one diagnosis can be reported for each ART cycle.
c Fractions are used for rates with denominators less than 20. Multiple-infant births (for example, twins) with at least one live infant are counted as one live birth.
d Total cycle number includes those using frozen eggs. It excludes 0 cycle(s) evaluating new procedures. Both cycle types are excluded from ART success rates.
e In this report, births are defined as term if at least 37 full weeks gestation and normal birth weight if at least 2,500 grams (approximately 5 pounds, 8 ounces).
f All ages are reported together because previous data show that patient age does not materially affect success with donor eggs.

422
SO
UT
H C
AR
OLIN
A COASTAL FERTILITY SPECIALISTSMOUNT PLEASANT, SOUTH CAROLINA
Comparison of success rates across clinics may not be meaningful. Patient medical characteristics and treatment approaches vary (see pages 11–20).
Data verified by John Schnorr, MD2014 ART CYCLE PROFILE
Type of ART and Procedural Factors a
IVF 100%Unstimulated 0%Used gestational carrier 1%
With ICSI 63%PGD/PGS 5%
Patient Diagnosis b
Tubal factor 15%Ovulatory dysfunction 9%Diminished ovarian reserve 30%Endometriosis 7%
Uterine factor 3%Male factor 24%Other factor 10%Unknown factor 17%
Multiple Factors: Female factors only 7%Female & male factors 6%
2014 ART SUCCESS RATES c Total number of cyclesd: 550 (includes 9 cycle[s] using frozen eggs)
Type of CycleAge of Woman
<35 35–37 38–40 41–42 43–44 >44Fresh Embryos from Nondonor Eggs
Number of cycles 132 60 29 12 6 0Percentage of cancellations before retrieval (%) 6.1 10.0 6.9 0 / 12 1 / 6 Average number of embryos transferred 1.8 1.8 2.1 2.5 2.0 Percentage of embryos transferred resulting in implantation (%) 40.4 28.1 27.3 10.7 0 / 10 Percentage of elective single embryo transfers (eSET) (%) 28.3 14.7 2 / 15 0 / 10 0 / 3
Outcomes per CyclePercentage of cycles resulting in term, normal weight & singleton live births
e (%) 18.9 8.3 10.3 0 / 12 0 / 6
Percentage of cycles resulting in singleton live births (%) 19.7 15.0 10.3 0 / 12 0 / 6 Percentage of cycles resulting in twin live births (%) 5.3 5.0 6.9 1 / 12 0 / 6 Percentage of cycles resulting in live births (%) 25.0 20.0 17.2 1 / 12 0 / 6 Percentage of cycles resulting in pregnancies (%) 27.3 25.0 24.1 2 / 12 0 / 6
Outcomes per TransferNumber of transfers 64 36 16 11 5 0Percentage of transfers resulting in term, normal weight & singleton live births
e (%) 39.1 13.9 3 / 16 0 / 11 0 / 5
Percentage of transfers resulting in singleton live births (%) 40.6 25.0 3 / 16 0 / 11 0 / 5 Percentage of transfers resulting in twin live births (%) 10.9 8.3 2 / 16 1 / 11 0 / 5 Percentage of transfers resulting in live births (%) 51.6 33.3 5 / 16 1 / 11 0 / 5 Percentage of transfers resulting in pregnancies (%) 56.3 41.7 7 / 16 2 / 11 0 / 5
Frozen Embryos from Nondonor EggsNumber of cycles 106 67 27 6 2 0Number of transfers 102 64 24 6 2 0Estimated average number of transfers per retrieval 1.2 1.8 1.6 1.5 Average number of embryos transferred 1.4 1.4 1.8 1.8 1.0 Percentage of embryos transferred resulting in implantation (%) 59.3 51.2 33.3 1 / 11 1 / 2 Percentage of transfers resulting in term, normal weight & singleton live births
e (%) 44.1 32.8 33.3 1 / 6 0 / 2
Percentage of transfers resulting in singleton live births (%) 48.0 39.1 37.5 1 / 6 1 / 2 Percentage of transfers resulting in twin live births (%) 12.7 9.4 8.3 0 / 6 0 / 2 Percentage of transfers resulting in live births (%) 60.8 48.4 45.8 1 / 6 1 / 2 Percentage of transfers resulting in pregnancies (%) 67.6 59.4 45.8 1 / 6 1 / 2
Number of Egg/Embryo Banking Cycles 16 10 4 2 0 0
Donor Eggs Fresh Embryosf Frozen Embryosf
Number of cycles 37 25Number of transfers 35 24Average number of embryos transferred 1.4 1.5Percentage of embryos transferred resulting in implantation (%) 67.3 52.9Percentage of transfers resulting in term, normal weight & singleton live births
e (%) 48.6 20.8
Percentage of transfers resulting in singleton live births (%) 48.6 29.2Percentage of transfers resulting in twin live births (%) 17.1 12.5Percentage of transfers resulting in live births (%) 65.7 41.7Percentage of transfers resulting in pregnancies (%) 71.4 58.3
CURRENT SERVICES & PROFILE Current Name: Coastal Fertility Specialists
Donor eggs? YesDonor embryos? Yes
Gestational carriers? YesEmbryo cryopreservation? Yes
Single women? YesSART member? Yes
Verified lab accreditation? Yes(See Appendix C for details.)
a Reflects features of fresh nondonor cycles. If IVF is less than 100%, the remaining cycles are GIFT, ZIFT, or a combination of these procedures with IVF.
b Total patient diagnosis percentages may be greater than 100% because more than one diagnosis can be reported for each ART cycle.
c Fractions are used for rates with denominators less than 20. Multiple-infant births (for example, twins) with at least one live infant are counted as one live birth.
d Total cycle number includes those using frozen eggs. It excludes 0 cycle(s) evaluating new procedures. Both cycle types are excluded from ART success rates.
e In this report, births are defined as term if at least 37 full weeks gestation and normal birth weight if at least 2,500 grams (approximately 5 pounds, 8 ounces).
f All ages are reported together because previous data show that patient age does not materially affect success with donor eggs.

423
SO
UT
H C
AR
OLIN
ATHE FERTILITY CENTER OF CHARLESTON
MOUNT PLEASANT, SOUTH CAROLINAComparison of success rates across clinics may not be meaningful. Patient medical characteristics and treatment approaches vary (see pages 11–20).
Data verified by Stephanie D. Singleton, MD2014 ART CYCLE PROFILE
Type of ART and Procedural Factors a
IVF 100%Unstimulated 0%Used gestational carrier 0%
With ICSI 59%PGD/PGS 0%
Patient Diagnosis b
Tubal factor 9%Ovulatory dysfunction 17%Diminished ovarian reserve 42%Endometriosis 6%
Uterine factor 3%Male factor 42%Other factor 4%Unknown factor 12%
Multiple Factors: Female factors only 7%Female & male factors 25%
2014 ART SUCCESS RATES c Total number of cyclesd: 238 (includes 25 cycle[s] using frozen eggs)
Type of CycleAge of Woman
<35 35–37 38–40 41–42 43–44 >44Fresh Embryos from Nondonor Eggs
Number of cycles 66 23 24 5 1 0Percentage of cancellations before retrieval (%) 3.0 13.0 16.7 0 / 5 0 / 1 Average number of embryos transferred 1.8 1.9 2.1 2.0 1.0 Percentage of embryos transferred resulting in implantation (%) 42.9 38.7 17.1 1 / 10 0 / 1 Percentage of elective single embryo transfers (eSET) (%) 21.7 0 / 16 0 / 17 0 / 4
Outcomes per CyclePercentage of cycles resulting in term, normal weight & singleton live births
e (%) 15.2 26.1 4.2 1 / 5 0 / 1
Percentage of cycles resulting in singleton live births (%) 19.7 26.1 8.3 1 / 5 0 / 1 Percentage of cycles resulting in twin live births (%) 12.1 4.3 8.3 0 / 5 0 / 1 Percentage of cycles resulting in live births (%) 31.8 30.4 16.7 1 / 5 0 / 1 Percentage of cycles resulting in pregnancies (%) 39.4 39.1 16.7 1 / 5 0 / 1
Outcomes per TransferNumber of transfers 48 17 17 5 1 0Percentage of transfers resulting in term, normal weight & singleton live births
e (%) 20.8 6 / 17 1 / 17 1 / 5 0 / 1
Percentage of transfers resulting in singleton live births (%) 27.1 6 / 17 2 / 17 1 / 5 0 / 1 Percentage of transfers resulting in twin live births (%) 16.7 1 / 17 2 / 17 0 / 5 0 / 1 Percentage of transfers resulting in live births (%) 43.8 7 / 17 4 / 17 1 / 5 0 / 1 Percentage of transfers resulting in pregnancies (%) 54.2 9 / 17 4 / 17 1 / 5 0 / 1
Frozen Embryos from Nondonor EggsNumber of cycles 42 13 10 1 0 0Number of transfers 42 13 10 1 0 0Estimated average number of transfers per retrieval 1.6 1.9 1.0 Average number of embryos transferred 1.5 1.5 1.6 2.0 Percentage of embryos transferred resulting in implantation (%) 53.6 3 / 17 2 / 11 Percentage of transfers resulting in term, normal weight & singleton live births
e (%) 33.3 2 / 13 2 / 10 0 / 1
Percentage of transfers resulting in singleton live births (%) 38.1 2 / 13 2 / 10 0 / 1 Percentage of transfers resulting in twin live births (%) 14.3 0 / 13 0 / 10 0 / 1 Percentage of transfers resulting in live births (%) 52.4 2 / 13 2 / 10 0 / 1 Percentage of transfers resulting in pregnancies (%) 64.3 4 / 13 5 / 10 1 / 1
Number of Egg/Embryo Banking Cycles 9 4 3 0 0 0
Donor Eggs Fresh Embryosf Frozen Embryosf
Number of cycles 0 12Number of transfers 0 12Average number of embryos transferred 1.7Percentage of embryos transferred resulting in implantation (%) 45.0Percentage of transfers resulting in term, normal weight & singleton live births
e (%) 3 / 12
Percentage of transfers resulting in singleton live births (%) 3 / 12Percentage of transfers resulting in twin live births (%) 3 / 12Percentage of transfers resulting in live births (%) 6 / 12Percentage of transfers resulting in pregnancies (%) 6 / 12
CURRENT SERVICES & PROFILE Current Name: The Fertility Center of Charleston
Donor eggs? YesDonor embryos? Yes
Gestational carriers? YesEmbryo cryopreservation? Yes
Single women? YesSART member? Yes
Verified lab accreditation? Yes(See Appendix C for details.)
a Reflects features of fresh nondonor cycles. If IVF is less than 100%, the remaining cycles are GIFT, ZIFT, or a combination of these procedures with IVF.
b Total patient diagnosis percentages may be greater than 100% because more than one diagnosis can be reported for each ART cycle.
c Fractions are used for rates with denominators less than 20. Multiple-infant births (for example, twins) with at least one live infant are counted as one live birth.
d Total cycle number includes those using frozen eggs. It excludes 0 cycle(s) evaluating new procedures. Both cycle types are excluded from ART success rates.
e In this report, births are defined as term if at least 37 full weeks gestation and normal birth weight if at least 2,500 grams (approximately 5 pounds, 8 ounces).
f All ages are reported together because previous data show that patient age does not materially affect success with donor eggs.
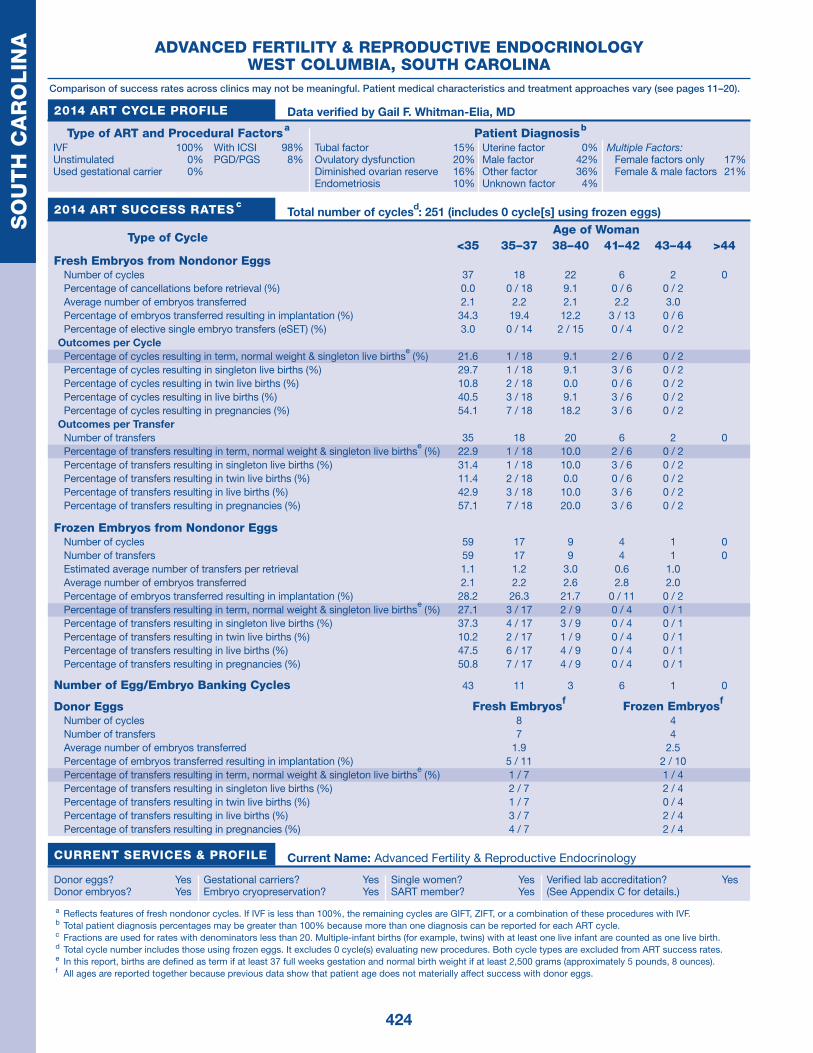
424
SO
UT
H C
AR
OLIN
A ADVANCED FERTILITY & REPRODUCTIVE ENDOCRINOLOGYWEST COLUMBIA, SOUTH CAROLINA
Comparison of success rates across clinics may not be meaningful. Patient medical characteristics and treatment approaches vary (see pages 11–20).
Data verified by Gail F. Whitman-Elia, MD2014 ART CYCLE PROFILE
Type of ART and Procedural Factors a
IVF 100%Unstimulated 0%Used gestational carrier 0%
With ICSI 98%PGD/PGS 8%
Patient Diagnosis b
Tubal factor 15%Ovulatory dysfunction 20%Diminished ovarian reserve 16%Endometriosis 10%
Uterine factor 0%Male factor 42%Other factor 36%Unknown factor 4%
Multiple Factors: Female factors only 17%Female & male factors 21%
2014 ART SUCCESS RATES c Total number of cyclesd: 251 (includes 0 cycle[s] using frozen eggs)
Type of CycleAge of Woman
<35 35–37 38–40 41–42 43–44 >44Fresh Embryos from Nondonor Eggs
Number of cycles 37 18 22 6 2 0Percentage of cancellations before retrieval (%) 0.0 0 / 18 9.1 0 / 6 0 / 2 Average number of embryos transferred 2.1 2.2 2.1 2.2 3.0 Percentage of embryos transferred resulting in implantation (%) 34.3 19.4 12.2 3 / 13 0 / 6 Percentage of elective single embryo transfers (eSET) (%) 3.0 0 / 14 2 / 15 0 / 4 0 / 2
Outcomes per CyclePercentage of cycles resulting in term, normal weight & singleton live births
e (%) 21.6 1 / 18 9.1 2 / 6 0 / 2
Percentage of cycles resulting in singleton live births (%) 29.7 1 / 18 9.1 3 / 6 0 / 2 Percentage of cycles resulting in twin live births (%) 10.8 2 / 18 0.0 0 / 6 0 / 2 Percentage of cycles resulting in live births (%) 40.5 3 / 18 9.1 3 / 6 0 / 2 Percentage of cycles resulting in pregnancies (%) 54.1 7 / 18 18.2 3 / 6 0 / 2
Outcomes per TransferNumber of transfers 35 18 20 6 2 0Percentage of transfers resulting in term, normal weight & singleton live births
e (%) 22.9 1 / 18 10.0 2 / 6 0 / 2
Percentage of transfers resulting in singleton live births (%) 31.4 1 / 18 10.0 3 / 6 0 / 2 Percentage of transfers resulting in twin live births (%) 11.4 2 / 18 0.0 0 / 6 0 / 2 Percentage of transfers resulting in live births (%) 42.9 3 / 18 10.0 3 / 6 0 / 2 Percentage of transfers resulting in pregnancies (%) 57.1 7 / 18 20.0 3 / 6 0 / 2
Frozen Embryos from Nondonor EggsNumber of cycles 59 17 9 4 1 0Number of transfers 59 17 9 4 1 0Estimated average number of transfers per retrieval 1.1 1.2 3.0 0.6 1.0 Average number of embryos transferred 2.1 2.2 2.6 2.8 2.0 Percentage of embryos transferred resulting in implantation (%) 28.2 26.3 21.7 0 / 11 0 / 2 Percentage of transfers resulting in term, normal weight & singleton live births
e (%) 27.1 3 / 17 2 / 9 0 / 4 0 / 1
Percentage of transfers resulting in singleton live births (%) 37.3 4 / 17 3 / 9 0 / 4 0 / 1 Percentage of transfers resulting in twin live births (%) 10.2 2 / 17 1 / 9 0 / 4 0 / 1 Percentage of transfers resulting in live births (%) 47.5 6 / 17 4 / 9 0 / 4 0 / 1 Percentage of transfers resulting in pregnancies (%) 50.8 7 / 17 4 / 9 0 / 4 0 / 1
Number of Egg/Embryo Banking Cycles 43 11 3 6 1 0
Donor Eggs Fresh Embryosf Frozen Embryosf
Number of cycles 8 4Number of transfers 7 4Average number of embryos transferred 1.9 2.5Percentage of embryos transferred resulting in implantation (%) 5 / 11 2 / 10Percentage of transfers resulting in term, normal weight & singleton live births
e (%) 1 / 7 1 / 4
Percentage of transfers resulting in singleton live births (%) 2 / 7 2 / 4Percentage of transfers resulting in twin live births (%) 1 / 7 0 / 4Percentage of transfers resulting in live births (%) 3 / 7 2 / 4Percentage of transfers resulting in pregnancies (%) 4 / 7 2 / 4
CURRENT SERVICES & PROFILE Current Name: Advanced Fertility & Reproductive Endocrinology
Donor eggs? YesDonor embryos? Yes
Gestational carriers? YesEmbryo cryopreservation? Yes
Single women? YesSART member? Yes
Verified lab accreditation? Yes(See Appendix C for details.)
a Reflects features of fresh nondonor cycles. If IVF is less than 100%, the remaining cycles are GIFT, ZIFT, or a combination of these procedures with IVF.
b Total patient diagnosis percentages may be greater than 100% because more than one diagnosis can be reported for each ART cycle.
c Fractions are used for rates with denominators less than 20. Multiple-infant births (for example, twins) with at least one live infant are counted as one live birth.
d Total cycle number includes those using frozen eggs. It excludes 0 cycle(s) evaluating new procedures. Both cycle types are excluded from ART success rates.
e In this report, births are defined as term if at least 37 full weeks gestation and normal birth weight if at least 2,500 grams (approximately 5 pounds, 8 ounces).
f All ages are reported together because previous data show that patient age does not materially affect success with donor eggs.

425
SO
UT
H D
AK
OTA
SANFORD WOMEN’S HEALTHSIOUX FALLS, SOUTH DAKOTA
Comparison of success rates across clinics may not be meaningful. Patient medical characteristics and treatment approaches vary (see pages 11–20).
Data verified by Keith A. Hansen, MD2014 ART CYCLE PROFILE
Type of ART and Procedural Factors a
IVF 100%Unstimulated 0%Used gestational carrier 1%
With ICSI 80%PGD/PGS 2%
Patient Diagnosis b
Tubal factor 12%Ovulatory dysfunction 15%Diminished ovarian reserve 24%Endometriosis 12%
Uterine factor 2%Male factor 49%Other factor 39%Unknown factor 4%
Multiple Factors: Female factors only 18%Female & male factors 28%
2014 ART SUCCESS RATES c Total number of cyclesd: 375 (includes 0 cycle[s] using frozen eggs)
Type of CycleAge of Woman
<35 35–37 38–40 41–42 43–44 >44Fresh Embryos from Nondonor Eggs
Number of cycles 88 24 18 4 7 1Percentage of cancellations before retrieval (%) 8.0 12.5 2 / 18 2 / 4 3 / 7 0 / 1Average number of embryos transferred 1.7 1.8 2.2 2.0 2.5 2.0Percentage of embryos transferred resulting in implantation (%) 39.7 27.8 16.7 1 / 4 1 / 5 0 / 2Percentage of elective single embryo transfers (eSET) (%) 32.4 1 / 16 0 / 10 0 / 1 0 / 2 0 / 1
Outcomes per CyclePercentage of cycles resulting in term, normal weight & singleton live births
e (%) 30.7 16.7 0 / 18 1 / 4 1 / 7 0 / 1
Percentage of cycles resulting in singleton live births (%) 33.0 16.7 1 / 18 1 / 4 1 / 7 0 / 1Percentage of cycles resulting in twin live births (%) 5.7 8.3 1 / 18 0 / 4 0 / 7 0 / 1Percentage of cycles resulting in live births (%) 39.8 25.0 2 / 18 1 / 4 1 / 7 0 / 1Percentage of cycles resulting in pregnancies (%) 44.3 33.3 3 / 18 1 / 4 1 / 7 0 / 1
Outcomes per TransferNumber of transfers 73 20 11 2 2 1Percentage of transfers resulting in term, normal weight & singleton live births
e (%) 37.0 20.0 0 / 11 1 / 2 1 / 2 0 / 1
Percentage of transfers resulting in singleton live births (%) 39.7 20.0 1 / 11 1 / 2 1 / 2 0 / 1Percentage of transfers resulting in twin live births (%) 6.8 10.0 1 / 11 0 / 2 0 / 2 0 / 1Percentage of transfers resulting in live births (%) 47.9 30.0 2 / 11 1 / 2 1 / 2 0 / 1Percentage of transfers resulting in pregnancies (%) 53.4 40.0 3 / 11 1 / 2 1 / 2 0 / 1
Frozen Embryos from Nondonor EggsNumber of cycles 85 40 9 1 1 0Number of transfers 74 28 7 1 1 0Estimated average number of transfers per retrieval 1.2 1.3 0.5 0.2 0.2 0.0Average number of embryos transferred 1.4 1.4 1.9 2.0 1.0 Percentage of embryos transferred resulting in implantation (%) 34.6 25.0 3 / 13 0 / 2 0 / 1 Percentage of transfers resulting in term, normal weight & singleton live births
e (%) 16.2 28.6 2 / 7 0 / 1 0 / 1
Percentage of transfers resulting in singleton live births (%) 21.6 32.1 3 / 7 0 / 1 0 / 1 Percentage of transfers resulting in twin live births (%) 5.4 0.0 0 / 7 0 / 1 0 / 1 Percentage of transfers resulting in live births (%) 27.0 32.1 3 / 7 0 / 1 0 / 1 Percentage of transfers resulting in pregnancies (%) 37.8 35.7 3 / 7 0 / 1 0 / 1
Number of Egg/Embryo Banking Cycles 46 18 12 5 5 1
Donor Eggs Fresh Embryosf Frozen Embryosf
Number of cycles 0 10Number of transfers 0 9Average number of embryos transferred 1.6Percentage of embryos transferred resulting in implantation (%) 5 / 14Percentage of transfers resulting in term, normal weight & singleton live births
e (%) 2 / 9
Percentage of transfers resulting in singleton live births (%) 4 / 9Percentage of transfers resulting in twin live births (%) 0 / 9Percentage of transfers resulting in live births (%) 4 / 9Percentage of transfers resulting in pregnancies (%) 4 / 9
CURRENT SERVICES & PROFILE Current Name: Sanford Women’s Health
Donor eggs? YesDonor embryos? Yes
Gestational carriers? YesEmbryo cryopreservation? Yes
Single women? YesSART member? Yes
Verified lab accreditation? Yes(See Appendix C for details.)
a Reflects features of fresh nondonor cycles. If IVF is less than 100%, the remaining cycles are GIFT, ZIFT, or a combination of these procedures with IVF.
b Total patient diagnosis percentages may be greater than 100% because more than one diagnosis can be reported for each ART cycle.
c Fractions are used for rates with denominators less than 20. Multiple-infant births (for example, twins) with at least one live infant are counted as one live birth.
d Total cycle number includes those using frozen eggs. It excludes 0 cycle(s) evaluating new procedures. Both cycle types are excluded from ART success rates.
e In this report, births are defined as term if at least 37 full weeks gestation and normal birth weight if at least 2,500 grams (approximately 5 pounds, 8 ounces).
f All ages are reported together because previous data show that patient age does not materially affect success with donor eggs.

426
TE
NN
ES
SE
EFERTILITY CENTER, LLC
CHATTANOOGA, TENNESSEEComparison of success rates across clinics may not be meaningful. Patient medical characteristics and treatment approaches vary (see pages 11–20).
Data verified by Barry W. Donesky, MD2014 ART CYCLE PROFILE
Type of ART and Procedural Factors a
IVF 100%Unstimulated 0%Used gestational carrier 5%
With ICSI 86%PGD/PGS 0%
Patient Diagnosis b
Tubal factor 12%Ovulatory dysfunction 11%Diminished ovarian reserve 20%Endometriosis 7%
Uterine factor 2%Male factor 37%Other factor 5%Unknown factor 12%
Multiple Factors: Female factors only 1%Female & male factors 5%
2014 ART SUCCESS RATES c Total number of cyclesd: 210 (includes 4 cycle[s] using frozen eggs)
Type of CycleAge of Woman
<35 35–37 38–40 41–42 43–44 >44Fresh Embryos from Nondonor Eggs
Number of cycles 34 12 5 4 2 1Percentage of cancellations before retrieval (%) 5.9 1 / 12 2 / 5 0 / 4 0 / 2 0 / 1Average number of embryos transferred 1.3 1.7 Percentage of embryos transferred resulting in implantation (%) 2 / 4 2 / 5 Percentage of elective single embryo transfers (eSET) (%) 2 / 3 1 / 3
Outcomes per CyclePercentage of cycles resulting in term, normal weight & singleton live births
e (%) 2.9 1 / 12 0 / 5 0 / 4 0 / 2 0 / 1
Percentage of cycles resulting in singleton live births (%) 5.9 1 / 12 0 / 5 0 / 4 0 / 2 0 / 1Percentage of cycles resulting in twin live births (%) 0.0 0 / 12 0 / 5 0 / 4 0 / 2 0 / 1Percentage of cycles resulting in live births (%) 5.9 1 / 12 0 / 5 0 / 4 0 / 2 0 / 1Percentage of cycles resulting in pregnancies (%) 5.9 2 / 12 0 / 5 0 / 4 0 / 2 0 / 1
Outcomes per TransferNumber of transfers 3 3 0 0 0 0Percentage of transfers resulting in term, normal weight & singleton live births
e (%) 1 / 3 1 / 3
Percentage of transfers resulting in singleton live births (%) 2 / 3 1 / 3 Percentage of transfers resulting in twin live births (%) 0 / 3 0 / 3 Percentage of transfers resulting in live births (%) 2 / 3 1 / 3 Percentage of transfers resulting in pregnancies (%) 2 / 3 2 / 3
Frozen Embryos from Nondonor EggsNumber of cycles 54 35 3 4 2 1Number of transfers 53 34 3 4 2 1Estimated average number of transfers per retrieval 1.4 2.1 1.5 1.0 0.5 1.0Average number of embryos transferred 1.4 1.6 1.7 1.8 2.0 1.0Percentage of embryos transferred resulting in implantation (%) 35.1 32.7 2 / 5 2 / 7 0 / 4 0 / 1Percentage of transfers resulting in term, normal weight & singleton live births
e (%) 32.1 23.5 2 / 3 2 / 4 0 / 2 0 / 1
Percentage of transfers resulting in singleton live births (%) 35.8 29.4 2 / 3 2 / 4 0 / 2 0 / 1Percentage of transfers resulting in twin live births (%) 3.8 5.9 0 / 3 0 / 4 0 / 2 0 / 1Percentage of transfers resulting in live births (%) 39.6 35.3 2 / 3 2 / 4 0 / 2 0 / 1Percentage of transfers resulting in pregnancies (%) 43.4 47.1 2 / 3 2 / 4 0 / 2 0 / 1
Number of Egg/Embryo Banking Cycles 9 5 0 2 2 1
Donor Eggs Fresh Embryosf Frozen Embryosf
Number of cycles 15 15Number of transfers 8 15Average number of embryos transferred 1.8 1.3Percentage of embryos transferred resulting in implantation (%) 7 / 14 45.0Percentage of transfers resulting in term, normal weight & singleton live births
e (%) 2 / 8 6 / 15
Percentage of transfers resulting in singleton live births (%) 3 / 8 7 / 15Percentage of transfers resulting in twin live births (%) 2 / 8 1 / 15Percentage of transfers resulting in live births (%) 5 / 8 8 / 15Percentage of transfers resulting in pregnancies (%) 5 / 8 8 / 15
CURRENT SERVICES & PROFILE Current Name: Fertility Center, LLC
Donor eggs? YesDonor embryos? Yes
Gestational carriers? YesEmbryo cryopreservation? Yes
Single women? YesSART member? Yes
Verified lab accreditation? Yes(See Appendix C for details.)
a Reflects features of fresh nondonor cycles. If IVF is less than 100%, the remaining cycles are GIFT, ZIFT, or a combination of these procedures with IVF.
b Total patient diagnosis percentages may be greater than 100% because more than one diagnosis can be reported for each ART cycle.
c Fractions are used for rates with denominators less than 20. Multiple-infant births (for example, twins) with at least one live infant are counted as one live birth.
d Total cycle number includes those using frozen eggs. It excludes 0 cycle(s) evaluating new procedures. Both cycle types are excluded from ART success rates.
e In this report, births are defined as term if at least 37 full weeks gestation and normal birth weight if at least 2,500 grams (approximately 5 pounds, 8 ounces).
f All ages are reported together because previous data show that patient age does not materially affect success with donor eggs.

427
TE
NN
ES
SE
ETENNESSEE REPRODUCTIVE MEDICINE
CHATTANOOGA, TENNESSEEComparison of success rates across clinics may not be meaningful. Patient medical characteristics and treatment approaches vary (see pages 11–20).
Data verified by Ringland S. Murray, MD2014 ART CYCLE PROFILE
Type of ART and Procedural Factors a
IVF 100%Unstimulated 5%Used gestational carrier <1%
With ICSI 83%PGD/PGS 5%
Patient Diagnosis b
Tubal factor 17%Ovulatory dysfunction 6%Diminished ovarian reserve 16%Endometriosis 22%
Uterine factor <1%Male factor 46%Other factor 45%Unknown factor 6%
Multiple Factors: Female factors only 20%Female & male factors 24%
2014 ART SUCCESS RATES c Total number of cyclesd: 189 (includes 1 cycle[s] using frozen eggs)
Type of CycleAge of Woman
<35 35–37 38–40 41–42 43–44 >44Fresh Embryos from Nondonor Eggs
Number of cycles 63 21 17 2 7 2Percentage of cancellations before retrieval (%) 0.0 0.0 1 / 17 0 / 2 1 / 7 0 / 2Average number of embryos transferred 1.7 2.1 1.9 2.5 2.7 2.5Percentage of embryos transferred resulting in implantation (%) 44.0 34.3 8.0 0 / 5 1 / 8 0 / 5Percentage of elective single embryo transfers (eSET) (%) 19.1 0 / 17 2 / 10 0 / 2 0 / 3 0 / 2
Outcomes per CyclePercentage of cycles resulting in term, normal weight & singleton live births
e (%) 27.0 33.3 1 / 17 0 / 2 0 / 7 0 / 2
Percentage of cycles resulting in singleton live births (%) 30.2 33.3 1 / 17 0 / 2 0 / 7 0 / 2Percentage of cycles resulting in twin live births (%) 14.3 0.0 0 / 17 0 / 2 0 / 7 0 / 2Percentage of cycles resulting in live births (%) 46.0 38.1 1 / 17 0 / 2 0 / 7 0 / 2Percentage of cycles resulting in pregnancies (%) 47.6 47.6 2 / 17 0 / 2 1 / 7 0 / 2
Outcomes per TransferNumber of transfers 54 18 13 2 3 2Percentage of transfers resulting in term, normal weight & singleton live births
e (%) 31.5 7 / 18 1 / 13 0 / 2 0 / 3 0 / 2
Percentage of transfers resulting in singleton live births (%) 35.2 7 / 18 1 / 13 0 / 2 0 / 3 0 / 2Percentage of transfers resulting in twin live births (%) 16.7 0 / 18 0 / 13 0 / 2 0 / 3 0 / 2Percentage of transfers resulting in live births (%) 53.7 8 / 18 1 / 13 0 / 2 0 / 3 0 / 2Percentage of transfers resulting in pregnancies (%) 55.6 10 / 18 2 / 13 0 / 2 1 / 3 0 / 2
Frozen Embryos from Nondonor EggsNumber of cycles 28 9 8 0 2 0Number of transfers 28 9 8 0 2 0Estimated average number of transfers per retrieval 1.2 1.3 1.6 0.0 2.0 Average number of embryos transferred 1.8 2.0 1.8 3.0 Percentage of embryos transferred resulting in implantation (%) 52.1 7 / 18 10 / 14 2 / 6 Percentage of transfers resulting in term, normal weight & singleton live births
e (%) 32.1 3 / 9 1 / 8 0 / 2
Percentage of transfers resulting in singleton live births (%) 35.7 3 / 9 1 / 8 0 / 2 Percentage of transfers resulting in twin live births (%) 17.9 1 / 9 3 / 8 1 / 2 Percentage of transfers resulting in live births (%) 53.6 4 / 9 4 / 8 1 / 2 Percentage of transfers resulting in pregnancies (%) 71.4 6 / 9 6 / 8 1 / 2
Number of Egg/Embryo Banking Cycles 3 2 3 2 1 0
Donor Eggs Fresh Embryosf Frozen Embryosf
Number of cycles 9 9Number of transfers 6 9Average number of embryos transferred 1.7 1.4Percentage of embryos transferred resulting in implantation (%) 8 / 10 6 / 13Percentage of transfers resulting in term, normal weight & singleton live births
e (%) 2 / 6 2 / 9
Percentage of transfers resulting in singleton live births (%) 3 / 6 4 / 9Percentage of transfers resulting in twin live births (%) 2 / 6 0 / 9Percentage of transfers resulting in live births (%) 5 / 6 4 / 9Percentage of transfers resulting in pregnancies (%) 5 / 6 5 / 9
CURRENT SERVICES & PROFILE Current Name: Tennessee Reproductive Medicine
Donor eggs? YesDonor embryos? Yes
Gestational carriers? YesEmbryo cryopreservation? Yes
Single women? YesSART member? Yes
Verified lab accreditation? Yes(See Appendix C for details.)
a Reflects features of fresh nondonor cycles. If IVF is less than 100%, the remaining cycles are GIFT, ZIFT, or a combination of these procedures with IVF.
b Total patient diagnosis percentages may be greater than 100% because more than one diagnosis can be reported for each ART cycle.
c Fractions are used for rates with denominators less than 20. Multiple-infant births (for example, twins) with at least one live infant are counted as one live birth.
d Total cycle number includes those using frozen eggs. It excludes 0 cycle(s) evaluating new procedures. Both cycle types are excluded from ART success rates.
e In this report, births are defined as term if at least 37 full weeks gestation and normal birth weight if at least 2,500 grams (approximately 5 pounds, 8 ounces).
f All ages are reported together because previous data show that patient age does not materially affect success with donor eggs.

428
TE
NN
ES
SE
EQUILLEN FERTILITY AND WOMEN’S SERVICES
JOHNSON CITY, TENNESSEEComparison of success rates across clinics may not be meaningful. Patient medical characteristics and treatment approaches vary (see pages 11–20).
Data verified by Norman A. Assad, MD2014 ART CYCLE PROFILE
Type of ART and Procedural Factors a
IVF 100%Unstimulated 0%Used gestational carrier 0%
With ICSI 78%PGD/PGS 0%
Patient Diagnosis b
Tubal factor 4%Ovulatory dysfunction 29%Diminished ovarian reserve 12%Endometriosis 18%
Uterine factor 3%Male factor 25%Other factor 13%Unknown factor 4%
Multiple Factors: Female factors only 9%Female & male factors 0%
2014 ART SUCCESS RATES c Total number of cyclesd: 71 (includes 0 cycle[s] using frozen eggs)
Type of CycleAge of Woman
<35 35–37 38–40 41–42 43–44 >44Fresh Embryos from Nondonor Eggs
Number of cycles 31 5 11 2 0 0Percentage of cancellations before retrieval (%) 12.9 1 / 5 1 / 11 0 / 2 Average number of embryos transferred 2.0 2.0 2.2 2.5 Percentage of embryos transferred resulting in implantation (%) 51.2 5 / 8 3 / 17 3 / 5 Percentage of elective single embryo transfers (eSET) (%) 0.0 0 / 4 0 / 8 0 / 2
Outcomes per CyclePercentage of cycles resulting in term, normal weight & singleton live births
e (%) 22.6 1 / 5 2 / 11 1 / 2
Percentage of cycles resulting in singleton live births (%) 35.5 2 / 5 3 / 11 1 / 2 Percentage of cycles resulting in twin live births (%) 12.9 1 / 5 0 / 11 0 / 2 Percentage of cycles resulting in live births (%) 48.4 3 / 5 3 / 11 1 / 2 Percentage of cycles resulting in pregnancies (%) 51.6 3 / 5 4 / 11 2 / 2
Outcomes per TransferNumber of transfers 21 4 9 2 0 0Percentage of transfers resulting in term, normal weight & singleton live births
e (%) 33.3 1 / 4 2 / 9 1 / 2
Percentage of transfers resulting in singleton live births (%) 52.4 2 / 4 3 / 9 1 / 2 Percentage of transfers resulting in twin live births (%) 19.0 1 / 4 0 / 9 0 / 2 Percentage of transfers resulting in live births (%) 71.4 3 / 4 3 / 9 1 / 2 Percentage of transfers resulting in pregnancies (%) 76.2 3 / 4 4 / 9 2 / 2
Frozen Embryos from Nondonor EggsNumber of cycles 8 4 3 0 0 0Number of transfers 5 3 2 0 0 0Estimated average number of transfers per retrieval 1.0 1.5 2.0 Average number of embryos transferred 2.0 1.3 1.0 Percentage of embryos transferred resulting in implantation (%) 5 / 10 0 / 4 0 / 2 Percentage of transfers resulting in term, normal weight & singleton live births
e (%) 3 / 5 0 / 3 0 / 2
Percentage of transfers resulting in singleton live births (%) 3 / 5 0 / 3 0 / 2 Percentage of transfers resulting in twin live births (%) 1 / 5 0 / 3 0 / 2 Percentage of transfers resulting in live births (%) 4 / 5 0 / 3 0 / 2 Percentage of transfers resulting in pregnancies (%) 4 / 5 0 / 3 0 / 2
Number of Egg/Embryo Banking Cycles 1 2 0 0 0 0
Donor Eggs Fresh Embryosf Frozen Embryosf
Number of cycles 2 2Number of transfers 1 2Average number of embryos transferred 2.0 2.0Percentage of embryos transferred resulting in implantation (%) 0 / 2 0 / 4Percentage of transfers resulting in term, normal weight & singleton live births
e (%) 0 / 1 0 / 2
Percentage of transfers resulting in singleton live births (%) 0 / 1 0 / 2Percentage of transfers resulting in twin live births (%) 0 / 1 0 / 2Percentage of transfers resulting in live births (%) 0 / 1 0 / 2Percentage of transfers resulting in pregnancies (%) 0 / 1 0 / 2
CURRENT SERVICES & PROFILE Current Name: Quillen Fertility and Women’s Services
Donor eggs? YesDonor embryos? No
Gestational carriers? YesEmbryo cryopreservation? Yes
Single women? YesSART member? Yes
Verified lab accreditation? Yes(See Appendix C for details.)
a Reflects features of fresh nondonor cycles. If IVF is less than 100%, the remaining cycles are GIFT, ZIFT, or a combination of these procedures with IVF.
b Total patient diagnosis percentages may be greater than 100% because more than one diagnosis can be reported for each ART cycle.
c Fractions are used for rates with denominators less than 20. Multiple-infant births (for example, twins) with at least one live infant are counted as one live birth.
d Total cycle number includes those using frozen eggs. It excludes 0 cycle(s) evaluating new procedures. Both cycle types are excluded from ART success rates.
e In this report, births are defined as term if at least 37 full weeks gestation and normal birth weight if at least 2,500 grams (approximately 5 pounds, 8 ounces).
f All ages are reported together because previous data show that patient age does not materially affect success with donor eggs.

429
TE
NN
ES
SE
EEAST TENNESSEE IVF AND ANDROLOGY CENTER
KNOXVILLE, TENNESSEEComparison of success rates across clinics may not be meaningful. Patient medical characteristics and treatment approaches vary (see pages 11–20).
Data verified by Gayla Harris, MD2014 ART CYCLE PROFILE
Type of ART and Procedural Factors a
IVF 100%Unstimulated 0%Used gestational carrier 0%
With ICSI 60%PGD/PGS 0%
Patient Diagnosis b
Tubal factor 19%Ovulatory dysfunction 25%Diminished ovarian reserve 44%Endometriosis 38%
Uterine factor 0%Male factor 50%Other factor 0%Unknown factor 0%
Multiple Factors: Female factors only 25%Female & male factors 44%
2014 ART SUCCESS RATES c Total number of cyclesd: 16 (includes 0 cycle[s] using frozen eggs)
Type of CycleAge of Woman
<35 35–37 38–40 41–42 43–44 >44Fresh Embryos from Nondonor Eggs
Number of cycles 8 5 2 0 0 0Percentage of cancellations before retrieval (%) 0 / 8 0 / 5 0 / 2 Average number of embryos transferred 1.5 1.6 1.5 Percentage of embryos transferred resulting in implantation (%) 4 / 12 2 / 8 0 / 3 Percentage of elective single embryo transfers (eSET) (%) 2 / 6 0 / 3 0 / 1
Outcomes per CyclePercentage of cycles resulting in term, normal weight & singleton live births
e (%) 2 / 8 1 / 5 0 / 2
Percentage of cycles resulting in singleton live births (%) 2 / 8 2 / 5 0 / 2 Percentage of cycles resulting in twin live births (%) 1 / 8 0 / 5 0 / 2 Percentage of cycles resulting in live births (%) 3 / 8 2 / 5 0 / 2 Percentage of cycles resulting in pregnancies (%) 3 / 8 2 / 5 0 / 2
Outcomes per TransferNumber of transfers 8 5 2 0 0 0Percentage of transfers resulting in term, normal weight & singleton live births
e (%) 2 / 8 1 / 5 0 / 2
Percentage of transfers resulting in singleton live births (%) 2 / 8 2 / 5 0 / 2 Percentage of transfers resulting in twin live births (%) 1 / 8 0 / 5 0 / 2 Percentage of transfers resulting in live births (%) 3 / 8 2 / 5 0 / 2 Percentage of transfers resulting in pregnancies (%) 3 / 8 2 / 5 0 / 2
Frozen Embryos from Nondonor EggsNumber of cycles 0 0 1 0 0 0Number of transfers 0 0 1 0 0 0Estimated average number of transfers per retrieval Average number of embryos transferred 1.0 Percentage of embryos transferred resulting in implantation (%) 0 / 1 Percentage of transfers resulting in term, normal weight & singleton live births
e (%) 0 / 1
Percentage of transfers resulting in singleton live births (%) 0 / 1 Percentage of transfers resulting in twin live births (%) 0 / 1 Percentage of transfers resulting in live births (%) 0 / 1 Percentage of transfers resulting in pregnancies (%) 0 / 1
Number of Egg/Embryo Banking Cycles 0 0 0 0 0 0
Donor Eggs Fresh Embryosf Frozen Embryosf
Number of cycles 0 0Number of transfers 0 0Average number of embryos transferred Percentage of embryos transferred resulting in implantation (%) Percentage of transfers resulting in term, normal weight & singleton live births
e (%)
Percentage of transfers resulting in singleton live births (%) Percentage of transfers resulting in twin live births (%) Percentage of transfers resulting in live births (%) Percentage of transfers resulting in pregnancies (%)
CURRENT SERVICES & PROFILE Current Name: East Tennessee IVF and Andrology Center
Donor eggs? YesDonor embryos? Yes
Gestational carriers? NoEmbryo cryopreservation? Yes
Single women? YesSART member? No
Verified lab accreditation? No(See Appendix C for details.)
a Reflects features of fresh nondonor cycles. If IVF is less than 100%, the remaining cycles are GIFT, ZIFT, or a combination of these procedures with IVF.
b Total patient diagnosis percentages may be greater than 100% because more than one diagnosis can be reported for each ART cycle.
c Fractions are used for rates with denominators less than 20. Multiple-infant births (for example, twins) with at least one live infant are counted as one live birth.
d Total cycle number includes those using frozen eggs. It excludes 0 cycle(s) evaluating new procedures. Both cycle types are excluded from ART success rates.
e In this report, births are defined as term if at least 37 full weeks gestation and normal birth weight if at least 2,500 grams (approximately 5 pounds, 8 ounces).
f All ages are reported together because previous data show that patient age does not materially affect success with donor eggs.

430
TE
NN
ES
SE
EJEFFREY A. KEENAN, MD DBA
SOUTHEASTERN CENTER FOR FERTILITY AND REPRODUCTIVE SURGERYKNOXVILLE, TENNESSEE
Comparison of success rates across clinics may not be meaningful. Patient medical characteristics and treatment approaches vary (see pages 11–20).
Data verified by Jeffrey A. Keenan, MD2014 ART CYCLE PROFILE
Type of ART and Procedural Factors a
IVF 100%Unstimulated 0%Used gestational carrier 0%
With ICSI 47%PGD/PGS 0%
Patient Diagnosis b
Tubal factor 6%Ovulatory dysfunction 10%Diminished ovarian reserve 18%Endometriosis 13%
Uterine factor 0%Male factor 50%Other factor 18%Unknown factor 12%
Multiple Factors: Female factors only 8%Female & male factors 16%
2014 ART SUCCESS RATES c Total number of cyclesd: 175 (includes 0 cycle[s] using frozen eggs)
Type of CycleAge of Woman
<35 35–37 38–40 41–42 43–44 >44Fresh Embryos from Nondonor Eggs
Number of cycles 14 12 4 2 0 0Percentage of cancellations before retrieval (%) 0 / 14 2 / 12 0 / 4 0 / 2 Average number of embryos transferred 2.2 2.2 3.0 3.5 Percentage of embryos transferred resulting in implantation (%) 15.4 22.7 1 / 12 0 / 7 Percentage of elective single embryo transfers (eSET) (%) 0 / 12 0 / 10 0 / 4 0 / 2
Outcomes per CyclePercentage of cycles resulting in term, normal weight & singleton live births
e (%) 0 / 14 2 / 12 0 / 4 0 / 2
Percentage of cycles resulting in singleton live births (%) 2 / 14 3 / 12 1 / 4 0 / 2 Percentage of cycles resulting in twin live births (%) 1 / 14 1 / 12 0 / 4 0 / 2 Percentage of cycles resulting in live births (%) 3 / 14 4 / 12 1 / 4 0 / 2 Percentage of cycles resulting in pregnancies (%) 3 / 14 4 / 12 1 / 4 0 / 2
Outcomes per TransferNumber of transfers 12 10 4 2 0 0Percentage of transfers resulting in term, normal weight & singleton live births
e (%) 0 / 12 2 / 10 0 / 4 0 / 2
Percentage of transfers resulting in singleton live births (%) 2 / 12 3 / 10 1 / 4 0 / 2 Percentage of transfers resulting in twin live births (%) 1 / 12 1 / 10 0 / 4 0 / 2 Percentage of transfers resulting in live births (%) 3 / 12 4 / 10 1 / 4 0 / 2 Percentage of transfers resulting in pregnancies (%) 3 / 12 4 / 10 1 / 4 0 / 2
Frozen Embryos from Nondonor EggsNumber of cycles 5 6 1 2 0 0Number of transfers 5 6 1 2 0 0Estimated average number of transfers per retrieval 1.3 2.0 1.0 1.0 Average number of embryos transferred 1.8 2.3 1.0 2.0 Percentage of embryos transferred resulting in implantation (%) 0 / 9 1 / 14 0 / 1 0 / 1 Percentage of transfers resulting in term, normal weight & singleton live births
e (%) 0 / 5 1 / 6 0 / 1 0 / 2
Percentage of transfers resulting in singleton live births (%) 0 / 5 1 / 6 0 / 1 0 / 2 Percentage of transfers resulting in twin live births (%) 0 / 5 0 / 6 0 / 1 0 / 2 Percentage of transfers resulting in live births (%) 0 / 5 1 / 6 0 / 1 0 / 2 Percentage of transfers resulting in pregnancies (%) 0 / 5 1 / 6 0 / 1 0 / 2
Number of Egg/Embryo Banking Cycles 0 1 0 0 0 0
Donor Eggs Fresh Embryosf Frozen Embryosf
Number of cycles 0 128Number of transfers 0 117Average number of embryos transferred 2.4Percentage of embryos transferred resulting in implantation (%) 34.6Percentage of transfers resulting in term, normal weight & singleton live births
e (%) 29.9
Percentage of transfers resulting in singleton live births (%) 35.9Percentage of transfers resulting in twin live births (%) 16.2Percentage of transfers resulting in live births (%) 53.8Percentage of transfers resulting in pregnancies (%) 61.5
CURRENT SERVICES & PROFILECurrent Name: Jeffrey A. Keenan, MD dba,
Southeastern Center for Fertility and Reproductive Surgery
Donor eggs? NoDonor embryos? Yes
Gestational carriers? NoEmbryo cryopreservation? Yes
Single women? NoSART member? No
Verified lab accreditation? No(See Appendix C for details.)
a Reflects features of fresh nondonor cycles. If IVF is less than 100%, the remaining cycles are GIFT, ZIFT, or a combination of these procedures with IVF.
b Total patient diagnosis percentages may be greater than 100% because more than one diagnosis can be reported for each ART cycle.
c Fractions are used for rates with denominators less than 20. Multiple-infant births (for example, twins) with at least one live infant are counted as one live birth.
d Total cycle number includes those using frozen eggs. It excludes 0 cycle(s) evaluating new procedures. Both cycle types are excluded from ART success rates.
e In this report, births are defined as term if at least 37 full weeks gestation and normal birth weight if at least 2,500 grams (approximately 5 pounds, 8 ounces).
f All ages are reported together because previous data show that patient age does not materially affect success with donor eggs.

431
TE
NN
ES
SE
EKUTTEH KE FERTILITY ASSOCIATES OF MEMPHIS, PLLC
MEMPHIS, TENNESSEEComparison of success rates across clinics may not be meaningful. Patient medical characteristics and treatment approaches vary (see pages 11–20).
Data verified by Raymond W. Ke, MD2014 ART CYCLE PROFILE
Type of ART and Procedural Factors a
IVF 100%Unstimulated 0%Used gestational carrier <1%
With ICSI 88%PGD/PGS 0%
Patient Diagnosis b
Tubal factor 19%Ovulatory dysfunction 19%Diminished ovarian reserve 20%Endometriosis 11%
Uterine factor 6%Male factor 38%Other factor 9%Unknown factor 10%
Multiple Factors: Female factors only 10%Female & male factors 18%
2014 ART SUCCESS RATES c Total number of cyclesd: 463 (includes 6 cycle[s] using frozen eggs)
Type of CycleAge of Woman
<35 35–37 38–40 41–42 43–44 >44Fresh Embryos from Nondonor Eggs
Number of cycles 85 36 28 3 4 0Percentage of cancellations before retrieval (%) 3.5 11.1 17.9 0 / 3 0 / 4 Average number of embryos transferred 1.9 1.9 2.0 2.3 2.0 Percentage of embryos transferred resulting in implantation (%) 52.4 24.5 36.4 1 / 7 0 / 8 Percentage of elective single embryo transfers (eSET) (%) 6.2 14.3 0.0 0 / 3 0 / 3
Outcomes per CyclePercentage of cycles resulting in term, normal weight & singleton live births
e (%) 15.3 11.1 35.7 0 / 3 0 / 4
Percentage of cycles resulting in singleton live births (%) 18.8 13.9 39.3 0 / 3 0 / 4 Percentage of cycles resulting in twin live births (%) 28.2 8.3 7.1 0 / 3 0 / 4 Percentage of cycles resulting in live births (%) 47.1 22.2 46.4 0 / 3 0 / 4 Percentage of cycles resulting in pregnancies (%) 47.1 25.0 53.6 1 / 3 0 / 4
Outcomes per TransferNumber of transfers 65 28 23 3 4 0Percentage of transfers resulting in term, normal weight & singleton live births
e (%) 20.0 14.3 43.5 0 / 3 0 / 4
Percentage of transfers resulting in singleton live births (%) 24.6 17.9 47.8 0 / 3 0 / 4 Percentage of transfers resulting in twin live births (%) 36.9 10.7 8.7 0 / 3 0 / 4 Percentage of transfers resulting in live births (%) 61.5 28.6 56.5 0 / 3 0 / 4 Percentage of transfers resulting in pregnancies (%) 61.5 32.1 65.2 1 / 3 0 / 4
Frozen Embryos from Nondonor EggsNumber of cycles 107 51 21 13 4 0Number of transfers 95 44 19 7 4 0Estimated average number of transfers per retrieval 1.3 1.3 1.3 1.8 4.0 0.0Average number of embryos transferred 1.8 1.9 1.6 1.6 1.8 Percentage of embryos transferred resulting in implantation (%) 55.2 52.6 54.8 1 / 10 1 / 7 Percentage of transfers resulting in term, normal weight & singleton live births
e (%) 36.8 38.6 9 / 19 1 / 7 1 / 4
Percentage of transfers resulting in singleton live births (%) 42.1 38.6 10 / 19 1 / 7 1 / 4 Percentage of transfers resulting in twin live births (%) 24.2 18.2 2 / 19 0 / 7 0 / 4 Percentage of transfers resulting in live births (%) 66.3 56.8 12 / 19 1 / 7 1 / 4 Percentage of transfers resulting in pregnancies (%) 70.5 72.7 13 / 19 2 / 7 1 / 4
Number of Egg/Embryo Banking Cycles 47 22 9 3 0 1
Donor Eggs Fresh Embryosf Frozen Embryosf
Number of cycles 8 15Number of transfers 5 14Average number of embryos transferred 2.0 1.9Percentage of embryos transferred resulting in implantation (%) 4 / 8 34.6Percentage of transfers resulting in term, normal weight & singleton live births
e (%) 2 / 5 6 / 14
Percentage of transfers resulting in singleton live births (%) 3 / 5 7 / 14Percentage of transfers resulting in twin live births (%) 0 / 5 1 / 14Percentage of transfers resulting in live births (%) 3 / 5 8 / 14Percentage of transfers resulting in pregnancies (%) 5 / 5 8 / 14
CURRENT SERVICES & PROFILE Current Name: Kutteh Ke Fertility Associates of Memphis, PLLC
Donor eggs? YesDonor embryos? Yes
Gestational carriers? YesEmbryo cryopreservation? Yes
Single women? NoSART member? Yes
Verified lab accreditation? Yes(See Appendix C for details.)
a Reflects features of fresh nondonor cycles. If IVF is less than 100%, the remaining cycles are GIFT, ZIFT, or a combination of these procedures with IVF.
b Total patient diagnosis percentages may be greater than 100% because more than one diagnosis can be reported for each ART cycle.
c Fractions are used for rates with denominators less than 20. Multiple-infant births (for example, twins) with at least one live infant are counted as one live birth.
d Total cycle number includes those using frozen eggs. It excludes 0 cycle(s) evaluating new procedures. Both cycle types are excluded from ART success rates.
e In this report, births are defined as term if at least 37 full weeks gestation and normal birth weight if at least 2,500 grams (approximately 5 pounds, 8 ounces).
f All ages are reported together because previous data show that patient age does not materially affect success with donor eggs.

432
TE
NN
ES
SE
EREGIONAL ONE HEALTH REPRODUCTIVE MEDICINE
MEMPHIS, TENNESSEEComparison of success rates across clinics may not be meaningful. Patient medical characteristics and treatment approaches vary (see pages 11–20).
Data verified by Laura Detti, MD2014 ART CYCLE PROFILE
Type of ART and Procedural Factors a
IVF 100%Unstimulated 0%Used gestational carrier 0%
With ICSI 83%PGD/PGS 0%
Patient Diagnosis b
Tubal factor 15%Ovulatory dysfunction 73%Diminished ovarian reserve 27%Endometriosis 21%
Uterine factor 30%Male factor 64%Other factor 33%Unknown factor 0%
Multiple Factors: Female factors only 21%Female & male factors 64%
2014 ART SUCCESS RATES c Total number of cyclesd: 41 (includes 1 cycle[s] using frozen eggs)
Type of CycleAge of Woman
<35 35–37 38–40 41–42 43–44 >44Fresh Embryos from Nondonor Eggs
Number of cycles 18 5 5 0 0 1Percentage of cancellations before retrieval (%) 1 / 18 0 / 5 1 / 5 1 / 1Average number of embryos transferred 1.8 1.8 2.0 Percentage of embryos transferred resulting in implantation (%) 64.5 3 / 8 2 / 6 Percentage of elective single embryo transfers (eSET) (%) 1 / 15 2 / 5 0 / 3
Outcomes per CyclePercentage of cycles resulting in term, normal weight & singleton live births
e (%) 7 / 18 0 / 5 0 / 5 0 / 1
Percentage of cycles resulting in singleton live births (%) 7 / 18 1 / 5 0 / 5 0 / 1Percentage of cycles resulting in twin live births (%) 5 / 18 1 / 5 1 / 5 0 / 1Percentage of cycles resulting in live births (%) 12 / 18 2 / 5 1 / 5 0 / 1Percentage of cycles resulting in pregnancies (%) 12 / 18 3 / 5 1 / 5 0 / 1
Outcomes per TransferNumber of transfers 17 5 3 0 0 0Percentage of transfers resulting in term, normal weight & singleton live births
e (%) 7 / 17 0 / 5 0 / 3
Percentage of transfers resulting in singleton live births (%) 7 / 17 1 / 5 0 / 3 Percentage of transfers resulting in twin live births (%) 5 / 17 1 / 5 1 / 3 Percentage of transfers resulting in live births (%) 12 / 17 2 / 5 1 / 3 Percentage of transfers resulting in pregnancies (%) 12 / 17 3 / 5 1 / 3
Frozen Embryos from Nondonor EggsNumber of cycles 1 1 0 0 0 0Number of transfers 1 1 0 0 0 0Estimated average number of transfers per retrieval 1.0 0.5 0.0 0.0 0.0Average number of embryos transferred 2.0 2.0 Percentage of embryos transferred resulting in implantation (%) 2 / 2 0 / 2 Percentage of transfers resulting in term, normal weight & singleton live births
e (%) 0 / 1 0 / 1
Percentage of transfers resulting in singleton live births (%) 0 / 1 0 / 1 Percentage of transfers resulting in twin live births (%) 1 / 1 0 / 1 Percentage of transfers resulting in live births (%) 1 / 1 0 / 1 Percentage of transfers resulting in pregnancies (%) 1 / 1 0 / 1
Number of Egg/Embryo Banking Cycles 0 2 0 3 1 1
Donor Eggs Fresh Embryosf Frozen Embryosf
Number of cycles 1 1Number of transfers 1 1Average number of embryos transferred 2.0 1.0Percentage of embryos transferred resulting in implantation (%) 2 / 2 0 / 1Percentage of transfers resulting in term, normal weight & singleton live births
e (%) 0 / 1 0 / 1
Percentage of transfers resulting in singleton live births (%) 0 / 1 0 / 1Percentage of transfers resulting in twin live births (%) 1 / 1 0 / 1Percentage of transfers resulting in live births (%) 1 / 1 0 / 1Percentage of transfers resulting in pregnancies (%) 1 / 1 0 / 1
CURRENT SERVICES & PROFILE Current Name: Regional One Health Reproductive Medicine
Donor eggs? YesDonor embryos? Yes
Gestational carriers? YesEmbryo cryopreservation? Yes
Single women? YesSART member? Yes
Verified lab accreditation? Pending(See Appendix C for details.)
a Reflects features of fresh nondonor cycles. If IVF is less than 100%, the remaining cycles are GIFT, ZIFT, or a combination of these procedures with IVF.
b Total patient diagnosis percentages may be greater than 100% because more than one diagnosis can be reported for each ART cycle.
c Fractions are used for rates with denominators less than 20. Multiple-infant births (for example, twins) with at least one live infant are counted as one live birth.
d Total cycle number includes those using frozen eggs. It excludes 0 cycle(s) evaluating new procedures. Both cycle types are excluded from ART success rates.
e In this report, births are defined as term if at least 37 full weeks gestation and normal birth weight if at least 2,500 grams (approximately 5 pounds, 8 ounces).
f All ages are reported together because previous data show that patient age does not materially affect success with donor eggs.

433
TE
NN
ES
SE
ETHE CENTER FOR REPRODUCTIVE HEALTH
NASHVILLE, TENNESSEEComparison of success rates across clinics may not be meaningful. Patient medical characteristics and treatment approaches vary (see pages 11–20).
Data verified by Jaime M. Vasquez, MD2014 ART CYCLE PROFILE
Type of ART and Procedural Factors a
IVF 100%Unstimulated 0%Used gestational carrier 0%
With ICSI 97%PGD/PGS 0%
Patient Diagnosis b
Tubal factor 16%Ovulatory dysfunction 45%Diminished ovarian reserve 38%Endometriosis 6%
Uterine factor <1%Male factor 70%Other factor 3%Unknown factor 3%
Multiple Factors: Female factors only 6%Female & male factors 57%
2014 ART SUCCESS RATES c Total number of cyclesd: 130 (includes 1 cycle[s] using frozen eggs)
Type of CycleAge of Woman
<35 35–37 38–40 41–42 43–44 >44Fresh Embryos from Nondonor Eggs
Number of cycles 45 9 1 2 2 0Percentage of cancellations before retrieval (%) 0.0 0 / 9 0 / 1 0 / 2 0 / 2 Average number of embryos transferred 2.0 2.1 2.5 Percentage of embryos transferred resulting in implantation (%) 24.6 2 / 12 0 / 5 Percentage of elective single embryo transfers (eSET) (%) 3.1 0 / 7 0 / 1
Outcomes per CyclePercentage of cycles resulting in term, normal weight & singleton live births
e (%) 11.1 1 / 9 0 / 1 0 / 2 0 / 2
Percentage of cycles resulting in singleton live births (%) 17.8 1 / 9 0 / 1 0 / 2 0 / 2 Percentage of cycles resulting in twin live births (%) 4.4 0 / 9 0 / 1 0 / 2 0 / 2 Percentage of cycles resulting in live births (%) 22.2 1 / 9 0 / 1 0 / 2 0 / 2 Percentage of cycles resulting in pregnancies (%) 26.7 3 / 9 0 / 1 0 / 2 0 / 2
Outcomes per TransferNumber of transfers 33 7 0 2 0 0Percentage of transfers resulting in term, normal weight & singleton live births
e (%) 15.2 1 / 7 0 / 2
Percentage of transfers resulting in singleton live births (%) 24.2 1 / 7 0 / 2 Percentage of transfers resulting in twin live births (%) 6.1 0 / 7 0 / 2 Percentage of transfers resulting in live births (%) 30.3 1 / 7 0 / 2 Percentage of transfers resulting in pregnancies (%) 36.4 3 / 7 0 / 2
Frozen Embryos from Nondonor EggsNumber of cycles 15 9 1 0 0 0Number of transfers 15 9 1 0 0 0Estimated average number of transfers per retrieval 1.7 3.0 0.0 Average number of embryos transferred 1.9 2.3 2.0 Percentage of embryos transferred resulting in implantation (%) 37.9 9.5 1 / 2 Percentage of transfers resulting in term, normal weight & singleton live births
e (%) 5 / 15 1 / 9 1 / 1
Percentage of transfers resulting in singleton live births (%) 6 / 15 1 / 9 1 / 1 Percentage of transfers resulting in twin live births (%) 2 / 15 0 / 9 0 / 1 Percentage of transfers resulting in live births (%) 8 / 15 1 / 9 1 / 1 Percentage of transfers resulting in pregnancies (%) 8 / 15 2 / 9 1 / 1
Number of Egg/Embryo Banking Cycles 0 0 0 0 1 0
Donor Eggs Fresh Embryosf Frozen Embryosf
Number of cycles 26 18Number of transfers 26 18Average number of embryos transferred 2.0 2.2Percentage of embryos transferred resulting in implantation (%) 44.7 21.2Percentage of transfers resulting in term, normal weight & singleton live births
e (%) 23.1 4 / 18
Percentage of transfers resulting in singleton live births (%) 26.9 4 / 18Percentage of transfers resulting in twin live births (%) 23.1 1 / 18Percentage of transfers resulting in live births (%) 50.0 5 / 18Percentage of transfers resulting in pregnancies (%) 61.5 9 / 18
CURRENT SERVICES & PROFILE Current Name: The Center for Reproductive Health
Donor eggs? YesDonor embryos? Yes
Gestational carriers? YesEmbryo cryopreservation? Yes
Single women? YesSART member? Yes
Verified lab accreditation? Yes(See Appendix C for details.)
a Reflects features of fresh nondonor cycles. If IVF is less than 100%, the remaining cycles are GIFT, ZIFT, or a combination of these procedures with IVF.
b Total patient diagnosis percentages may be greater than 100% because more than one diagnosis can be reported for each ART cycle.
c Fractions are used for rates with denominators less than 20. Multiple-infant births (for example, twins) with at least one live infant are counted as one live birth.
d Total cycle number includes those using frozen eggs. It excludes 0 cycle(s) evaluating new procedures. Both cycle types are excluded from ART success rates.
e In this report, births are defined as term if at least 37 full weeks gestation and normal birth weight if at least 2,500 grams (approximately 5 pounds, 8 ounces).
f All ages are reported together because previous data show that patient age does not materially affect success with donor eggs.

434
TE
NN
ES
SE
ENASHVILLE FERTILITY CENTER
NASHVILLE, TENNESSEEComparison of success rates across clinics may not be meaningful. Patient medical characteristics and treatment approaches vary (see pages 11–20).
Data verified by George A. Hill, MD2014 ART CYCLE PROFILE
Type of ART and Procedural Factors a
IVF 100%Unstimulated 0%Used gestational carrier 0%
With ICSI 76%PGD/PGS 20%
Patient Diagnosis b
Tubal factor 18%Ovulatory dysfunction 18%Diminished ovarian reserve 25%Endometriosis 22%
Uterine factor 7%Male factor 39%Other factor 31%Unknown factor 5%
Multiple Factors: Female factors only 29%Female & male factors 21%
2014 ART SUCCESS RATES c Total number of cyclesd: 680 (includes 38 cycle[s] using frozen eggs)
Type of CycleAge of Woman
<35 35–37 38–40 41–42 43–44 >44Fresh Embryos from Nondonor Eggs
Number of cycles 167 66 44 9 5 1Percentage of cancellations before retrieval (%) 13.2 22.7 18.2 3 / 9 4 / 5 0 / 1Average number of embryos transferred 1.6 2.1 2.7 1.8 1.0Percentage of embryos transferred resulting in implantation (%) 38.5 20.7 16.0 2 / 9 0 / 1Percentage of elective single embryo transfers (eSET) (%) 45.0 5.3 0.0 0 / 3
Outcomes per CyclePercentage of cycles resulting in term, normal weight & singleton live births
e (%) 21.6 12.1 6.8 0 / 9 0 / 5 0 / 1
Percentage of cycles resulting in singleton live births (%) 25.1 16.7 9.1 2 / 9 0 / 5 0 / 1Percentage of cycles resulting in twin live births (%) 8.4 3.0 0.0 0 / 9 0 / 5 0 / 1Percentage of cycles resulting in live births (%) 33.5 19.7 13.6 2 / 9 0 / 5 0 / 1Percentage of cycles resulting in pregnancies (%) 38.9 27.3 25.0 2 / 9 0 / 5 0 / 1
Outcomes per TransferNumber of transfers 129 45 32 5 0 1Percentage of transfers resulting in term, normal weight & singleton live births
e (%) 27.9 17.8 9.4 0 / 5 0 / 1
Percentage of transfers resulting in singleton live births (%) 32.6 24.4 12.5 2 / 5 0 / 1Percentage of transfers resulting in twin live births (%) 10.9 4.4 0.0 0 / 5 0 / 1Percentage of transfers resulting in live births (%) 43.4 28.9 18.8 2 / 5 0 / 1Percentage of transfers resulting in pregnancies (%) 50.4 40.0 34.4 2 / 5 0 / 1
Frozen Embryos from Nondonor EggsNumber of cycles 128 47 28 8 4 2Number of transfers 117 45 25 7 4 2Estimated average number of transfers per retrieval 1.5 1.6 1.2 1.4 2.0Average number of embryos transferred 1.6 1.6 1.6 1.9 1.5 1.5Percentage of embryos transferred resulting in implantation (%) 52.7 35.3 28.2 6 / 11 3 / 6 0 / 3Percentage of transfers resulting in term, normal weight & singleton live births
e (%) 35.0 26.7 40.0 1 / 7 1 / 4 0 / 2
Percentage of transfers resulting in singleton live births (%) 38.5 26.7 44.0 1 / 7 1 / 4 0 / 2Percentage of transfers resulting in twin live births (%) 18.8 13.3 0.0 1 / 7 1 / 4 0 / 2Percentage of transfers resulting in live births (%) 57.3 40.0 44.0 2 / 7 2 / 4 0 / 2Percentage of transfers resulting in pregnancies (%) 65.8 46.7 44.0 5 / 7 2 / 4 0 / 2
Number of Egg/Embryo Banking Cycles 31 21 18 4 0 1
Donor Eggs Fresh Embryosf Frozen Embryosf
Number of cycles 1 57Number of transfers 1 52Average number of embryos transferred 2.0 1.7Percentage of embryos transferred resulting in implantation (%) 1 / 2 35.8Percentage of transfers resulting in term, normal weight & singleton live births
e (%) 1 / 1 25.0
Percentage of transfers resulting in singleton live births (%) 1 / 1 34.6Percentage of transfers resulting in twin live births (%) 0 / 1 5.8Percentage of transfers resulting in live births (%) 1 / 1 40.4Percentage of transfers resulting in pregnancies (%) 1 / 1 51.9
CURRENT SERVICES & PROFILE Current Name: Nashville Fertility Center
Donor eggs? YesDonor embryos? Yes
Gestational carriers? YesEmbryo cryopreservation? Yes
Single women? YesSART member? Yes
Verified lab accreditation? Yes(See Appendix C for details.)
a Reflects features of fresh nondonor cycles. If IVF is less than 100%, the remaining cycles are GIFT, ZIFT, or a combination of these procedures with IVF.
b Total patient diagnosis percentages may be greater than 100% because more than one diagnosis can be reported for each ART cycle.
c Fractions are used for rates with denominators less than 20. Multiple-infant births (for example, twins) with at least one live infant are counted as one live birth.
d Total cycle number includes those using frozen eggs. It excludes 0 cycle(s) evaluating new procedures. Both cycle types are excluded from ART success rates.
e In this report, births are defined as term if at least 37 full weeks gestation and normal birth weight if at least 2,500 grams (approximately 5 pounds, 8 ounces).
f All ages are reported together because previous data show that patient age does not materially affect success with donor eggs.

435
TE
XA
SAUSTIN FERTILITY AND REPRODUCTIVE MEDICINE-WESTLAKE IVF
AUSTIN, TEXASComparison of success rates across clinics may not be meaningful. Patient medical characteristics and treatment approaches vary (see pages 11–20).
Data verified by Shahryar K. Kavoussi, MD2014 ART CYCLE PROFILE
Type of ART and Procedural Factors a
IVF 100%Unstimulated 0%Used gestational carrier 1%
With ICSI 79%PGD/PGS 0%
Patient Diagnosis b
Tubal factor 19%Ovulatory dysfunction 10%Diminished ovarian reserve 33%Endometriosis 10%
Uterine factor 8%Male factor 47%Other factor <1%Unknown factor 13%
Multiple Factors: Female factors only 11%Female & male factors 24%
2014 ART SUCCESS RATES c Total number of cyclesd: 143 (includes 0 cycle[s] using frozen eggs)
Type of CycleAge of Woman
<35 35–37 38–40 41–42 43–44 >44Fresh Embryos from Nondonor Eggs
Number of cycles 39 25 27 3 1 1Percentage of cancellations before retrieval (%) 5.1 4.0 3.7 1 / 3 0 / 1 0 / 1Average number of embryos transferred 2.0 2.1 2.5 3.5 1.0Percentage of embryos transferred resulting in implantation (%) 42.0 21.3 18.9 0 / 7 0 / 1Percentage of elective single embryo transfers (eSET) (%) 6.5 14.3 1 / 19 0 / 2
Outcomes per CyclePercentage of cycles resulting in term, normal weight & singleton live births
e (%) 25.6 28.0 22.2 0 / 3 0 / 1 0 / 1
Percentage of cycles resulting in singleton live births (%) 30.8 28.0 22.2 0 / 3 0 / 1 0 / 1Percentage of cycles resulting in twin live births (%) 10.3 0.0 0.0 0 / 3 0 / 1 0 / 1Percentage of cycles resulting in live births (%) 43.6 32.0 25.9 0 / 3 0 / 1 0 / 1Percentage of cycles resulting in pregnancies (%) 51.3 32.0 29.6 0 / 3 0 / 1 0 / 1
Outcomes per TransferNumber of transfers 34 22 21 2 0 1Percentage of transfers resulting in term, normal weight & singleton live births
e (%) 29.4 31.8 28.6 0 / 2 0 / 1
Percentage of transfers resulting in singleton live births (%) 35.3 31.8 28.6 0 / 2 0 / 1Percentage of transfers resulting in twin live births (%) 11.8 0.0 0.0 0 / 2 0 / 1Percentage of transfers resulting in live births (%) 50.0 36.4 33.3 0 / 2 0 / 1Percentage of transfers resulting in pregnancies (%) 58.8 36.4 38.1 0 / 2 0 / 1
Frozen Embryos from Nondonor EggsNumber of cycles 16 3 9 4 0 0Number of transfers 16 2 9 3 0 0Estimated average number of transfers per retrieval 2.7 0.3 2.3 Average number of embryos transferred 2.0 2.5 1.7 3.0 Percentage of embryos transferred resulting in implantation (%) 6.3 1 / 5 5 / 15 0 / 9 Percentage of transfers resulting in term, normal weight & singleton live births
e (%) 2 / 16 1 / 2 4 / 9 0 / 3
Percentage of transfers resulting in singleton live births (%) 2 / 16 1 / 2 5 / 9 0 / 3 Percentage of transfers resulting in twin live births (%) 0 / 16 0 / 2 0 / 9 0 / 3 Percentage of transfers resulting in live births (%) 2 / 16 1 / 2 5 / 9 0 / 3 Percentage of transfers resulting in pregnancies (%) 2 / 16 1 / 2 5 / 9 0 / 3
Number of Egg/Embryo Banking Cycles 3 4 0 0 0 0
Donor Eggs Fresh Embryosf Frozen Embryosf
Number of cycles 4 4Number of transfers 4 4Average number of embryos transferred 2.0 2.0Percentage of embryos transferred resulting in implantation (%) 3 / 8 2 / 8Percentage of transfers resulting in term, normal weight & singleton live births
e (%) 1 / 4 1 / 4
Percentage of transfers resulting in singleton live births (%) 1 / 4 2 / 4Percentage of transfers resulting in twin live births (%) 1 / 4 0 / 4Percentage of transfers resulting in live births (%) 2 / 4 2 / 4Percentage of transfers resulting in pregnancies (%) 2 / 4 2 / 4
CURRENT SERVICES & PROFILE Current Name: Austin Fertility and Reproductive Medicine-Westlake IVF
Donor eggs? YesDonor embryos? Yes
Gestational carriers? YesEmbryo cryopreservation? Yes
Single women? YesSART member? Yes
Verified lab accreditation? Yes(See Appendix C for details.)
a Reflects features of fresh nondonor cycles. If IVF is less than 100%, the remaining cycles are GIFT, ZIFT, or a combination of these procedures with IVF.
b Total patient diagnosis percentages may be greater than 100% because more than one diagnosis can be reported for each ART cycle.
c Fractions are used for rates with denominators less than 20. Multiple-infant births (for example, twins) with at least one live infant are counted as one live birth.
d Total cycle number includes those using frozen eggs. It excludes 0 cycle(s) evaluating new procedures. Both cycle types are excluded from ART success rates.
e In this report, births are defined as term if at least 37 full weeks gestation and normal birth weight if at least 2,500 grams (approximately 5 pounds, 8 ounces).
f All ages are reported together because previous data show that patient age does not materially affect success with donor eggs.

436
TE
XA
SAUSTIN FERTILITY INSTITUTE, PA
AUSTIN, TEXASComparison of success rates across clinics may not be meaningful. Patient medical characteristics and treatment approaches vary (see pages 11–20).
Data verified by Kenneth K. Moghadam, MD2014 ART CYCLE PROFILE
Type of ART and Procedural Factors a
IVF 100%Unstimulated 0%Used gestational carrier 0%
With ICSI 97%PGD/PGS 0%
Patient Diagnosis b
Tubal factor 14%Ovulatory dysfunction 24%Diminished ovarian reserve 12%Endometriosis 20%
Uterine factor 4%Male factor 39%Other factor 7%Unknown factor 5%
Multiple Factors: Female factors only 10%Female & male factors 13%
2014 ART SUCCESS RATES c Total number of cyclesd: 304 (includes 3 cycle[s] using frozen eggs)
Type of CycleAge of Woman
<35 35–37 38–40 41–42 43–44 >44Fresh Embryos from Nondonor Eggs
Number of cycles 46 27 25 7 0 0Percentage of cancellations before retrieval (%) 2.2 3.7 0.0 0 / 7 Average number of embryos transferred 1.8 2.1 2.3 2.3 Percentage of embryos transferred resulting in implantation (%) 24.1 23.8 25.0 2 / 14 Percentage of elective single embryo transfers (eSET) (%) 32.3 0 / 10 1 / 15 0 / 6
Outcomes per CyclePercentage of cycles resulting in term, normal weight & singleton live births
e (%) 13.0 7.4 12.0 0 / 7
Percentage of cycles resulting in singleton live births (%) 15.2 11.1 16.0 1 / 7 Percentage of cycles resulting in twin live births (%) 4.3 3.7 4.0 0 / 7 Percentage of cycles resulting in live births (%) 19.6 14.8 20.0 1 / 7 Percentage of cycles resulting in pregnancies (%) 26.1 14.8 32.0 2 / 7
Outcomes per TransferNumber of transfers 31 10 15 6 0 0Percentage of transfers resulting in term, normal weight & singleton live births
e (%) 19.4 2 / 10 3 / 15 0 / 6
Percentage of transfers resulting in singleton live births (%) 22.6 3 / 10 4 / 15 1 / 6 Percentage of transfers resulting in twin live births (%) 6.5 1 / 10 1 / 15 0 / 6 Percentage of transfers resulting in live births (%) 29.0 4 / 10 5 / 15 1 / 6 Percentage of transfers resulting in pregnancies (%) 38.7 4 / 10 8 / 15 2 / 6
Frozen Embryos from Nondonor EggsNumber of cycles 75 41 20 7 2 1Number of transfers 75 41 20 7 2 1Estimated average number of transfers per retrieval 2.1 1.7 1.3 1.2 1.0 1.0Average number of embryos transferred 1.7 1.8 2.1 1.9 3.0 3.0Percentage of embryos transferred resulting in implantation (%) 36.0 32.4 21.4 4 / 13 1 / 6 1 / 3Percentage of transfers resulting in term, normal weight & singleton live births
e (%) 24.0 29.3 10.0 2 / 7 0 / 2 0 / 1
Percentage of transfers resulting in singleton live births (%) 26.7 29.3 15.0 2 / 7 0 / 2 1 / 1Percentage of transfers resulting in twin live births (%) 14.7 7.3 10.0 1 / 7 0 / 2 0 / 1Percentage of transfers resulting in live births (%) 41.3 36.6 25.0 3 / 7 0 / 2 1 / 1Percentage of transfers resulting in pregnancies (%) 45.3 51.2 35.0 3 / 7 1 / 2 1 / 1
Number of Egg/Embryo Banking Cycles 11 4 5 5 1 1
Donor Eggs Fresh Embryosf Frozen Embryosf
Number of cycles 3 20Number of transfers 2 20Average number of embryos transferred 1.5 1.6Percentage of embryos transferred resulting in implantation (%) 2 / 2 37.5Percentage of transfers resulting in term, normal weight & singleton live births
e (%) 0 / 2 15.0
Percentage of transfers resulting in singleton live births (%) 0 / 2 30.0Percentage of transfers resulting in twin live births (%) 1 / 2 10.0Percentage of transfers resulting in live births (%) 1 / 2 40.0Percentage of transfers resulting in pregnancies (%) 2 / 2 50.0
CURRENT SERVICES & PROFILE Current Name: Austin Fertility Institute, PA
Donor eggs? YesDonor embryos? No
Gestational carriers? YesEmbryo cryopreservation? Yes
Single women? YesSART member? Yes
Verified lab accreditation? Yes(See Appendix C for details.)
a Reflects features of fresh nondonor cycles. If IVF is less than 100%, the remaining cycles are GIFT, ZIFT, or a combination of these procedures with IVF.
b Total patient diagnosis percentages may be greater than 100% because more than one diagnosis can be reported for each ART cycle.
c Fractions are used for rates with denominators less than 20. Multiple-infant births (for example, twins) with at least one live infant are counted as one live birth.
d Total cycle number includes those using frozen eggs. It excludes 0 cycle(s) evaluating new procedures. Both cycle types are excluded from ART success rates.
e In this report, births are defined as term if at least 37 full weeks gestation and normal birth weight if at least 2,500 grams (approximately 5 pounds, 8 ounces).
f All ages are reported together because previous data show that patient age does not materially affect success with donor eggs.

437
TE
XA
SRMATX.COM, PLLC
RMA OF TEXAS-AUSTINAUSTIN, TEXAS
Comparison of success rates across clinics may not be meaningful. Patient medical characteristics and treatment approaches vary (see pages 11–20).
Data verified by Francisco Arredondo, MD2014 ART CYCLE PROFILE
Type of ART and Procedural Factors a
IVF 100%Unstimulated 0%Used gestational carrier 0%
With ICSI 84%PGD/PGS 0%
Patient Diagnosis b
Tubal factor 14%Ovulatory dysfunction 12%Diminished ovarian reserve 30%Endometriosis 2%
Uterine factor <1%Male factor 32%Other factor 10%Unknown factor 13%
Multiple Factors: Female factors only <1%Female & male factors 14%
2014 ART SUCCESS RATES c Total number of cyclesd: 189 (includes 6 cycle[s] using frozen eggs)
Type of CycleAge of Woman
<35 35–37 38–40 41–42 43–44 >44Fresh Embryos from Nondonor Eggs
Number of cycles 29 17 10 5 2 0Percentage of cancellations before retrieval (%) 10.3 2 / 17 2 / 10 0 / 5 1 / 2 Average number of embryos transferred 1.0 1.7 2.3 3.0 2.0 Percentage of embryos transferred resulting in implantation (%) 9 / 15 5 / 19 2 / 9 2 / 6 0 / 2 Percentage of elective single embryo transfers (eSET) (%) 12 / 12 5 / 11 0 / 4 0 / 2 0 / 1
Outcomes per CyclePercentage of cycles resulting in term, normal weight & singleton live births
e (%) 24.1 4 / 17 2 / 10 0 / 5 0 / 2
Percentage of cycles resulting in singleton live births (%) 24.1 5 / 17 2 / 10 0 / 5 0 / 2 Percentage of cycles resulting in twin live births (%) 3.4 0 / 17 0 / 10 1 / 5 0 / 2 Percentage of cycles resulting in live births (%) 27.6 5 / 17 2 / 10 1 / 5 0 / 2 Percentage of cycles resulting in pregnancies (%) 27.6 5 / 17 2 / 10 1 / 5 0 / 2
Outcomes per TransferNumber of transfers 15 11 4 2 1 0Percentage of transfers resulting in term, normal weight & singleton live births
e (%) 7 / 15 4 / 11 2 / 4 0 / 2 0 / 1
Percentage of transfers resulting in singleton live births (%) 7 / 15 5 / 11 2 / 4 0 / 2 0 / 1 Percentage of transfers resulting in twin live births (%) 1 / 15 0 / 11 0 / 4 1 / 2 0 / 1 Percentage of transfers resulting in live births (%) 8 / 15 5 / 11 2 / 4 1 / 2 0 / 1 Percentage of transfers resulting in pregnancies (%) 8 / 15 5 / 11 2 / 4 1 / 2 0 / 1
Frozen Embryos from Nondonor EggsNumber of cycles 33 14 11 0 1 0Number of transfers 33 13 11 0 1 0Estimated average number of transfers per retrieval 1.0 0.8 0.7 0.0 Average number of embryos transferred 1.1 1.2 1.2 1.0 Percentage of embryos transferred resulting in implantation (%) 48.6 1 / 15 8 / 13 0 / 1 Percentage of transfers resulting in term, normal weight & singleton live births
e (%) 36.4 0 / 13 7 / 11 0 / 1
Percentage of transfers resulting in singleton live births (%) 39.4 1 / 13 7 / 11 0 / 1 Percentage of transfers resulting in twin live births (%) 3.0 0 / 13 0 / 11 0 / 1 Percentage of transfers resulting in live births (%) 42.4 1 / 13 7 / 11 0 / 1 Percentage of transfers resulting in pregnancies (%) 48.5 1 / 13 8 / 11 0 / 1
Number of Egg/Embryo Banking Cycles 19 15 14 2 0 0
Donor Eggs Fresh Embryosf Frozen Embryosf
Number of cycles 4 7Number of transfers 2 7Average number of embryos transferred 1.0 1.3Percentage of embryos transferred resulting in implantation (%) 1 / 2 8 / 9Percentage of transfers resulting in term, normal weight & singleton live births
e (%) 1 / 2 3 / 7
Percentage of transfers resulting in singleton live births (%) 1 / 2 4 / 7Percentage of transfers resulting in twin live births (%) 0 / 2 2 / 7Percentage of transfers resulting in live births (%) 1 / 2 6 / 7Percentage of transfers resulting in pregnancies (%) 1 / 2 6 / 7
CURRENT SERVICES & PROFILE Current Name: RMATX.COM, PLLC, RMA of Texas-Austin
Donor eggs? YesDonor embryos? Yes
Gestational carriers? YesEmbryo cryopreservation? Yes
Single women? YesSART member? Yes
Verified lab accreditation? Yes(See Appendix C for details.)
a Reflects features of fresh nondonor cycles. If IVF is less than 100%, the remaining cycles are GIFT, ZIFT, or a combination of these procedures with IVF.
b Total patient diagnosis percentages may be greater than 100% because more than one diagnosis can be reported for each ART cycle.
c Fractions are used for rates with denominators less than 20. Multiple-infant births (for example, twins) with at least one live infant are counted as one live birth.
d Total cycle number includes those using frozen eggs. It excludes 0 cycle(s) evaluating new procedures. Both cycle types are excluded from ART success rates.
e In this report, births are defined as term if at least 37 full weeks gestation and normal birth weight if at least 2,500 grams (approximately 5 pounds, 8 ounces).
f All ages are reported together because previous data show that patient age does not materially affect success with donor eggs.

438
TE
XA
STEXAS FERTILITY CENTER
VAUGHN, SILVERBERG & ASSOCIATESAUSTIN, TEXAS
Comparison of success rates across clinics may not be meaningful. Patient medical characteristics and treatment approaches vary (see pages 11–20).
Data verified by Kaylen Silverberg, MD2014 ART CYCLE PROFILE
Type of ART and Procedural Factors a
IVF 100%Unstimulated 0%Used gestational carrier 2%
With ICSI 59%PGD/PGS <1%
Patient Diagnosis b
Tubal factor 10%Ovulatory dysfunction 14%Diminished ovarian reserve 37%Endometriosis 22%
Uterine factor 19%Male factor 25%Other factor 9%Unknown factor 7%
Multiple Factors: Female factors only 21%Female & male factors 15%
2014 ART SUCCESS RATES c Total number of cyclesd: 1,520 (includes 16 cycle[s] using frozen eggs)
Type of CycleAge of Woman
<35 35–37 38–40 41–42 43–44 >44Fresh Embryos from Nondonor Eggs
Number of cycles 179 138 107 40 23 2Percentage of cancellations before retrieval (%) 3.9 14.5 7.5 15.0 8.7 1 / 2Average number of embryos transferred 1.5 2.0 2.3 2.3 3.0 Percentage of embryos transferred resulting in implantation (%) 35.6 32.8 20.6 17.9 0 / 9 Percentage of elective single embryo transfers (eSET) (%) 46.7 6.5 1.9 0 / 14 0 / 3
Outcomes per CyclePercentage of cycles resulting in term, normal weight & singleton live births
e (%) 12.8 9.4 8.4 5.0 0.0 0 / 2
Percentage of cycles resulting in singleton live births (%) 15.1 10.1 10.3 5.0 0.0 0 / 2Percentage of cycles resulting in twin live births (%) 3.9 6.5 2.8 5.0 0.0 0 / 2Percentage of cycles resulting in live births (%) 19.0 17.4 14.0 10.0 0.0 0 / 2Percentage of cycles resulting in pregnancies (%) 19.6 21.0 18.7 12.5 0.0 0 / 2
Outcomes per TransferNumber of transfers 79 64 58 17 3 0Percentage of transfers resulting in term, normal weight & singleton live births
e (%) 29.1 20.3 15.5 2 / 17 0 / 3
Percentage of transfers resulting in singleton live births (%) 34.2 21.9 19.0 2 / 17 0 / 3 Percentage of transfers resulting in twin live births (%) 8.9 14.1 5.2 2 / 17 0 / 3 Percentage of transfers resulting in live births (%) 43.0 37.5 25.9 4 / 17 0 / 3 Percentage of transfers resulting in pregnancies (%) 44.3 45.3 34.5 5 / 17 0 / 3
Frozen Embryos from Nondonor EggsNumber of cycles 266 148 114 47 23 5Number of transfers 246 135 100 40 20 5Estimated average number of transfers per retrieval 1.4 1.3 1.1 0.9 0.5 1.7Average number of embryos transferred 1.3 1.4 1.5 1.6 1.8 2.2Percentage of embryos transferred resulting in implantation (%) 54.3 50.0 36.0 27.6 30.6 1 / 11Percentage of transfers resulting in term, normal weight & singleton live births
e (%) 40.7 38.5 26.0 25.0 5.0 1 / 5
Percentage of transfers resulting in singleton live births (%) 47.6 45.9 34.0 25.0 15.0 1 / 5Percentage of transfers resulting in twin live births (%) 4.5 5.9 2.0 0.0 15.0 0 / 5Percentage of transfers resulting in live births (%) 52.4 51.9 36.0 27.5 30.0 1 / 5Percentage of transfers resulting in pregnancies (%) 63.8 62.2 49.0 45.0 40.0 1 / 5
Number of Egg/Embryo Banking Cycles 74 48 47 29 20 3
Donor Eggs Fresh Embryosf Frozen Embryosf
Number of cycles 64 127Number of transfers 53 118Average number of embryos transferred 1.2 1.4Percentage of embryos transferred resulting in implantation (%) 54.2 43.6Percentage of transfers resulting in term, normal weight & singleton live births
e (%) 35.8 21.2
Percentage of transfers resulting in singleton live births (%) 45.3 33.9Percentage of transfers resulting in twin live births (%) 5.7 7.6Percentage of transfers resulting in live births (%) 50.9 41.5Percentage of transfers resulting in pregnancies (%) 58.5 54.2
CURRENT SERVICES & PROFILE Current Name: Texas Fertility Center, Vaughn, Silverberg & Associates
Donor eggs? YesDonor embryos? Yes
Gestational carriers? YesEmbryo cryopreservation? Yes
Single women? YesSART member? Yes
Verified lab accreditation? Yes(See Appendix C for details.)
a Reflects features of fresh nondonor cycles. If IVF is less than 100%, the remaining cycles are GIFT, ZIFT, or a combination of these procedures with IVF.
b Total patient diagnosis percentages may be greater than 100% because more than one diagnosis can be reported for each ART cycle.
c Fractions are used for rates with denominators less than 20. Multiple-infant births (for example, twins) with at least one live infant are counted as one live birth.
d Total cycle number includes those using frozen eggs. It excludes 0 cycle(s) evaluating new procedures. Both cycle types are excluded from ART success rates.
e In this report, births are defined as term if at least 37 full weeks gestation and normal birth weight if at least 2,500 grams (approximately 5 pounds, 8 ounces).
f All ages are reported together because previous data show that patient age does not materially affect success with donor eggs.

439
TE
XA
SDR. JEFFREY YOUNGKIN
AUSTIN FERTILITY CENTERAUSTIN, TEXAS
Comparison of success rates across clinics may not be meaningful. Patient medical characteristics and treatment approaches vary (see pages 11–20).
Data verified by Jeffrey T. Youngkin, MD2014 ART CYCLE PROFILE
Type of ART and Procedural Factors a
IVF 100%Unstimulated 0%Used gestational carrier 0%
With ICSI 33%PGD/PGS 0%
Patient Diagnosis b
Tubal factor 14%Ovulatory dysfunction 29%Diminished ovarian reserve 0%Endometriosis 14%
Uterine factor 0%Male factor 57%Other factor 14%Unknown factor 14%
Multiple Factors: Female factors only 0%Female & male factors 43%
2014 ART SUCCESS RATES c Total number of cyclesd: 7 (includes 0 cycle[s] using frozen eggs)
Type of CycleAge of Woman
<35 35–37 38–40 41–42 43–44 >44Fresh Embryos from Nondonor Eggs
Number of cycles 1 2 0 0 0 0Percentage of cancellations before retrieval (%) 0 / 1 0 / 2 Average number of embryos transferred 2.0 2.5 Percentage of embryos transferred resulting in implantation (%) 2 / 2 1 / 5 Percentage of elective single embryo transfers (eSET) (%) 0 / 1 0 / 2
Outcomes per CyclePercentage of cycles resulting in term, normal weight & singleton live births
e (%) 0 / 1 1 / 2
Percentage of cycles resulting in singleton live births (%) 0 / 1 1 / 2 Percentage of cycles resulting in twin live births (%) 1 / 1 0 / 2 Percentage of cycles resulting in live births (%) 1 / 1 1 / 2 Percentage of cycles resulting in pregnancies (%) 1 / 1 1 / 2
Outcomes per TransferNumber of transfers 1 2 0 0 0 0Percentage of transfers resulting in term, normal weight & singleton live births
e (%) 0 / 1 1 / 2
Percentage of transfers resulting in singleton live births (%) 0 / 1 1 / 2 Percentage of transfers resulting in twin live births (%) 1 / 1 0 / 2 Percentage of transfers resulting in live births (%) 1 / 1 1 / 2 Percentage of transfers resulting in pregnancies (%) 1 / 1 1 / 2
Frozen Embryos from Nondonor EggsNumber of cycles 1 0 1 2 0 0Number of transfers 1 0 1 1 0 0Estimated average number of transfers per retrieval Average number of embryos transferred 1.0 2.0 2.0 Percentage of embryos transferred resulting in implantation (%) 1 / 1 0 / 2 0 / 2 Percentage of transfers resulting in term, normal weight & singleton live births
e (%) 1 / 1 0 / 1 0 / 1
Percentage of transfers resulting in singleton live births (%) 1 / 1 0 / 1 0 / 1 Percentage of transfers resulting in twin live births (%) 0 / 1 0 / 1 0 / 1 Percentage of transfers resulting in live births (%) 1 / 1 0 / 1 0 / 1 Percentage of transfers resulting in pregnancies (%) 1 / 1 0 / 1 0 / 1
Number of Egg/Embryo Banking Cycles 0 0 0 0 0 0
Donor Eggs Fresh Embryosf Frozen Embryosf
Number of cycles 0 0Number of transfers 0 0Average number of embryos transferred Percentage of embryos transferred resulting in implantation (%) Percentage of transfers resulting in term, normal weight & singleton live births
e (%)
Percentage of transfers resulting in singleton live births (%) Percentage of transfers resulting in twin live births (%) Percentage of transfers resulting in live births (%) Percentage of transfers resulting in pregnancies (%)
CURRENT SERVICES & PROFILE Current Name: Dr. Jeffrey Youngkin, Austin Fertility Center
Donor eggs? NoDonor embryos? No
Gestational carriers? NoEmbryo cryopreservation? Yes
Single women? NoSART member? Yes
Verified lab accreditation? Yes(See Appendix C for details.)
a Reflects features of fresh nondonor cycles. If IVF is less than 100%, the remaining cycles are GIFT, ZIFT, or a combination of these procedures with IVF.
b Total patient diagnosis percentages may be greater than 100% because more than one diagnosis can be reported for each ART cycle.
c Fractions are used for rates with denominators less than 20. Multiple-infant births (for example, twins) with at least one live infant are counted as one live birth.
d Total cycle number includes those using frozen eggs. It excludes 0 cycle(s) evaluating new procedures. Both cycle types are excluded from ART success rates.
e In this report, births are defined as term if at least 37 full weeks gestation and normal birth weight if at least 2,500 grams (approximately 5 pounds, 8 ounces).
f All ages are reported together because previous data show that patient age does not materially affect success with donor eggs.

440
TE
XA
SCENTER FOR ASSISTED REPRODUCTION
BEDFORD, TEXASComparison of success rates across clinics may not be meaningful. Patient medical characteristics and treatment approaches vary (see pages 11–20).
Data verified by Kevin J. Doody, MD2014 ART CYCLE PROFILE
Type of ART and Procedural Factors a
IVF 100%Unstimulated <1%Used gestational carrier <1%
With ICSI 63%PGD/PGS <1%
Patient Diagnosis b
Tubal factor 14%Ovulatory dysfunction 19%Diminished ovarian reserve 36%Endometriosis 8%
Uterine factor <1%Male factor 37%Other factor 11%Unknown factor 4%
Multiple Factors: Female factors only 11%Female & male factors 17%
2014 ART SUCCESS RATES c Total number of cyclesd: 542 (includes 9 cycle[s] using frozen eggs)
Type of CycleAge of Woman
<35 35–37 38–40 41–42 43–44 >44Fresh Embryos from Nondonor Eggs
Number of cycles 120 71 49 27 10 2Percentage of cancellations before retrieval (%) 0.8 7.0 8.2 14.8 3 / 10 0 / 2Average number of embryos transferred 1.6 1.8 1.8 1.9 2.0 1.5Percentage of embryos transferred resulting in implantation (%) 40.2 23.1 20.3 6.9 0 / 8 0 / 3Percentage of elective single embryo transfers (eSET) (%) 34.3 9.6 11.1 0 / 12 0 / 3 0 / 1
Outcomes per CyclePercentage of cycles resulting in term, normal weight & singleton live births
e (%) 21.7 14.1 6.1 7.4 0 / 10 0 / 2
Percentage of cycles resulting in singleton live births (%) 26.7 16.9 14.3 7.4 0 / 10 0 / 2Percentage of cycles resulting in twin live births (%) 7.5 5.6 4.1 0.0 0 / 10 0 / 2Percentage of cycles resulting in live births (%) 35.0 22.5 18.4 7.4 0 / 10 0 / 2Percentage of cycles resulting in pregnancies (%) 44.2 29.6 22.4 7.4 0 / 10 0 / 2
Outcomes per TransferNumber of transfers 108 61 37 15 4 2Percentage of transfers resulting in term, normal weight & singleton live births
e (%) 24.1 16.4 8.1 2 / 15 0 / 4 0 / 2
Percentage of transfers resulting in singleton live births (%) 29.6 19.7 18.9 2 / 15 0 / 4 0 / 2Percentage of transfers resulting in twin live births (%) 8.3 6.6 5.4 0 / 15 0 / 4 0 / 2Percentage of transfers resulting in live births (%) 38.9 26.2 24.3 2 / 15 0 / 4 0 / 2Percentage of transfers resulting in pregnancies (%) 49.1 34.4 29.7 2 / 15 0 / 4 0 / 2
Frozen Embryos from Nondonor EggsNumber of cycles 80 49 28 8 2 2Number of transfers 80 49 28 7 2 1Estimated average number of transfers per retrieval 1.8 2.3 1.8 1.4 0.5 Average number of embryos transferred 1.8 1.8 1.9 2.3 1.0 1.0Percentage of embryos transferred resulting in implantation (%) 47.5 37.0 18.9 0 / 12 1 / 1 1 / 1Percentage of transfers resulting in term, normal weight & singleton live births
e (%) 37.5 38.8 7.1 0 / 7 0 / 2 1 / 1
Percentage of transfers resulting in singleton live births (%) 45.0 42.9 17.9 0 / 7 1 / 2 1 / 1Percentage of transfers resulting in twin live births (%) 12.5 6.1 3.6 0 / 7 0 / 2 0 / 1Percentage of transfers resulting in live births (%) 58.8 49.0 21.4 0 / 7 1 / 2 1 / 1Percentage of transfers resulting in pregnancies (%) 66.3 61.2 28.6 2 / 7 2 / 2 1 / 1
Number of Egg/Embryo Banking Cycles 16 10 9 4 4 0
Donor Eggs Fresh Embryosf Frozen Embryosf
Number of cycles 18 24Number of transfers 18 24Average number of embryos transferred 1.7 1.5Percentage of embryos transferred resulting in implantation (%) 56.7 37.1Percentage of transfers resulting in term, normal weight & singleton live births
e (%) 9 / 18 12.5
Percentage of transfers resulting in singleton live births (%) 9 / 18 33.3Percentage of transfers resulting in twin live births (%) 3 / 18 8.3Percentage of transfers resulting in live births (%) 12 / 18 41.7Percentage of transfers resulting in pregnancies (%) 14 / 18 50.0
CURRENT SERVICES & PROFILE Current Name: Center for Assisted Reproduction
Donor eggs? YesDonor embryos? Yes
Gestational carriers? YesEmbryo cryopreservation? Yes
Single women? YesSART member? Yes
Verified lab accreditation? Yes(See Appendix C for details.)
a Reflects features of fresh nondonor cycles. If IVF is less than 100%, the remaining cycles are GIFT, ZIFT, or a combination of these procedures with IVF.
b Total patient diagnosis percentages may be greater than 100% because more than one diagnosis can be reported for each ART cycle.
c Fractions are used for rates with denominators less than 20. Multiple-infant births (for example, twins) with at least one live infant are counted as one live birth.
d Total cycle number includes those using frozen eggs. It excludes 0 cycle(s) evaluating new procedures. Both cycle types are excluded from ART success rates.
e In this report, births are defined as term if at least 37 full weeks gestation and normal birth weight if at least 2,500 grams (approximately 5 pounds, 8 ounces).
f All ages are reported together because previous data show that patient age does not materially affect success with donor eggs.

441
TE
XA
SDALLAS-FORT WORTH FERTILITY ASSOCIATES
DALLAS, TEXASComparison of success rates across clinics may not be meaningful. Patient medical characteristics and treatment approaches vary (see pages 11–20).
Data verified by Samuel J. Chantilis, MD2014 ART CYCLE PROFILE
Type of ART and Procedural Factors a
IVF 100%Unstimulated <1%Used gestational carrier <1%
With ICSI 43%PGD/PGS 0%
Patient Diagnosis b
Tubal factor 14%Ovulatory dysfunction 29%Diminished ovarian reserve 41%Endometriosis 12%
Uterine factor 14%Male factor 42%Other factor 9%Unknown factor 5%
Multiple Factors: Female factors only 23%Female & male factors 29%
2014 ART SUCCESS RATES c Total number of cyclesd: 906 (includes 1 cycle[s] using frozen eggs)
Type of CycleAge of Woman
<35 35–37 38–40 41–42 43–44 >44Fresh Embryos from Nondonor Eggs
Number of cycles 229 91 93 58 20 4Percentage of cancellations before retrieval (%) 8.3 18.7 19.4 27.6 20.0 3 / 4Average number of embryos transferred 1.8 1.9 2.5 2.6 2.5 1.0Percentage of embryos transferred resulting in implantation (%) 38.1 23.9 14.8 12.6 13.3 0 / 1Percentage of elective single embryo transfers (eSET) (%) 21.8 16.7 0.0 0.0 0 / 12
Outcomes per CyclePercentage of cycles resulting in term, normal weight & singleton live births
e (%) 19.2 18.7 10.8 8.6 10.0 0 / 4
Percentage of cycles resulting in singleton live births (%) 22.3 22.0 15.1 8.6 10.0 0 / 4Percentage of cycles resulting in twin live births (%) 10.0 1.1 2.2 1.7 0.0 0 / 4Percentage of cycles resulting in live births (%) 33.2 23.1 17.2 10.3 10.0 0 / 4Percentage of cycles resulting in pregnancies (%) 39.3 31.9 23.7 20.7 20.0 0 / 4
Outcomes per TransferNumber of transfers 182 65 66 36 13 1Percentage of transfers resulting in term, normal weight & singleton live births
e (%) 24.2 26.2 15.2 13.9 2 / 13 0 / 1
Percentage of transfers resulting in singleton live births (%) 28.0 30.8 21.2 13.9 2 / 13 0 / 1Percentage of transfers resulting in twin live births (%) 12.6 1.5 3.0 2.8 0 / 13 0 / 1Percentage of transfers resulting in live births (%) 41.8 32.3 24.2 16.7 2 / 13 0 / 1Percentage of transfers resulting in pregnancies (%) 49.5 44.6 33.3 33.3 4 / 13 0 / 1
Frozen Embryos from Nondonor EggsNumber of cycles 108 36 33 6 8 1Number of transfers 106 34 32 6 6 1Estimated average number of transfers per retrieval 1.4 0.9 0.7 0.3 0.8 0.5Average number of embryos transferred 1.4 1.6 1.4 1.5 1.0 2.0Percentage of embryos transferred resulting in implantation (%) 61.8 57.1 65.1 2 / 9 3 / 6 0 / 2Percentage of transfers resulting in term, normal weight & singleton live births
e (%) 34.9 38.2 40.6 2 / 6 3 / 6 0 / 1
Percentage of transfers resulting in singleton live births (%) 43.4 47.1 59.4 2 / 6 3 / 6 0 / 1Percentage of transfers resulting in twin live births (%) 14.2 11.8 9.4 0 / 6 0 / 6 0 / 1Percentage of transfers resulting in live births (%) 57.5 61.8 68.8 2 / 6 3 / 6 0 / 1Percentage of transfers resulting in pregnancies (%) 68.9 67.6 75.0 2 / 6 3 / 6 0 / 1
Number of Egg/Embryo Banking Cycles 28 23 41 15 7 2
Donor Eggs Fresh Embryosf Frozen Embryosf
Number of cycles 58 44Number of transfers 50 43Average number of embryos transferred 1.6 1.4Percentage of embryos transferred resulting in implantation (%) 67.1 40.7Percentage of transfers resulting in term, normal weight & singleton live births
e (%) 40.0 27.9
Percentage of transfers resulting in singleton live births (%) 50.0 30.2Percentage of transfers resulting in twin live births (%) 28.0 7.0Percentage of transfers resulting in live births (%) 78.0 39.5Percentage of transfers resulting in pregnancies (%) 80.0 48.8
CURRENT SERVICES & PROFILE Current Name: Dallas-Fort Worth Fertility Associates
Donor eggs? YesDonor embryos? Yes
Gestational carriers? YesEmbryo cryopreservation? Yes
Single women? YesSART member? Yes
Verified lab accreditation? Yes(See Appendix C for details.)
a Reflects features of fresh nondonor cycles. If IVF is less than 100%, the remaining cycles are GIFT, ZIFT, or a combination of these procedures with IVF.
b Total patient diagnosis percentages may be greater than 100% because more than one diagnosis can be reported for each ART cycle.
c Fractions are used for rates with denominators less than 20. Multiple-infant births (for example, twins) with at least one live infant are counted as one live birth.
d Total cycle number includes those using frozen eggs. It excludes 0 cycle(s) evaluating new procedures. Both cycle types are excluded from ART success rates.
e In this report, births are defined as term if at least 37 full weeks gestation and normal birth weight if at least 2,500 grams (approximately 5 pounds, 8 ounces).
f All ages are reported together because previous data show that patient age does not materially affect success with donor eggs.

442
TE
XA
SFERTILITY AND ADVANCED REPRODUCTIVE MEDICINE
DALLAS, TEXASComparison of success rates across clinics may not be meaningful. Patient medical characteristics and treatment approaches vary (see pages 11–20).
Data verified by Orhan Bukulmez, MD2014 ART CYCLE PROFILE
Type of ART and Procedural Factors a
IVF 100%Unstimulated 0%Used gestational carrier 0%
With ICSI 49%PGD/PGS 2%
Patient Diagnosis b
Tubal factor 14%Ovulatory dysfunction 20%Diminished ovarian reserve 39%Endometriosis 3%
Uterine factor 13%Male factor 22%Other factor 3%Unknown factor 13%
Multiple Factors: Female factors only 14%Female & male factors 11%
2014 ART SUCCESS RATES c Total number of cyclesd: 127 (includes 0 cycle[s] using frozen eggs)
Type of CycleAge of Woman
<35 35–37 38–40 41–42 43–44 >44Fresh Embryos from Nondonor Eggs
Number of cycles 19 11 13 9 2 1Percentage of cancellations before retrieval (%) 0 / 19 3 / 11 5 / 13 3 / 9 1 / 2 1 / 1Average number of embryos transferred 1.8 2.2 3.4 3.0 2.0 Percentage of embryos transferred resulting in implantation (%) 59.3 6 / 11 4 / 17 0 / 3 0 / 2 Percentage of elective single embryo transfers (eSET) (%) 3 / 15 0 / 5 0 / 5 0 / 1 0 / 1
Outcomes per CyclePercentage of cycles resulting in term, normal weight & singleton live births
e (%) 5 / 19 1 / 11 2 / 13 0 / 9 0 / 2 0 / 1
Percentage of cycles resulting in singleton live births (%) 6 / 19 2 / 11 2 / 13 0 / 9 0 / 2 0 / 1Percentage of cycles resulting in twin live births (%) 4 / 19 2 / 11 1 / 13 0 / 9 0 / 2 0 / 1Percentage of cycles resulting in live births (%) 10 / 19 4 / 11 3 / 13 0 / 9 0 / 2 0 / 1Percentage of cycles resulting in pregnancies (%) 11 / 19 4 / 11 3 / 13 0 / 9 0 / 2 0 / 1
Outcomes per TransferNumber of transfers 15 5 5 1 1 0Percentage of transfers resulting in term, normal weight & singleton live births
e (%) 5 / 15 1 / 5 2 / 5 0 / 1 0 / 1
Percentage of transfers resulting in singleton live births (%) 6 / 15 2 / 5 2 / 5 0 / 1 0 / 1 Percentage of transfers resulting in twin live births (%) 4 / 15 2 / 5 1 / 5 0 / 1 0 / 1 Percentage of transfers resulting in live births (%) 10 / 15 4 / 5 3 / 5 0 / 1 0 / 1 Percentage of transfers resulting in pregnancies (%) 11 / 15 4 / 5 3 / 5 0 / 1 0 / 1
Frozen Embryos from Nondonor EggsNumber of cycles 24 11 5 2 0 0Number of transfers 20 10 5 2 0 0Estimated average number of transfers per retrieval 1.1 0.6 1.0 0.5 0.0 0.0Average number of embryos transferred 1.8 1.7 1.6 2.5 Percentage of embryos transferred resulting in implantation (%) 31.4 14 / 17 4 / 8 2 / 5 Percentage of transfers resulting in term, normal weight & singleton live births
e (%) 40.0 5 / 10 1 / 5 0 / 2
Percentage of transfers resulting in singleton live births (%) 40.0 5 / 10 1 / 5 1 / 2 Percentage of transfers resulting in twin live births (%) 5.0 2 / 10 0 / 5 0 / 2 Percentage of transfers resulting in live births (%) 45.0 7 / 10 1 / 5 1 / 2 Percentage of transfers resulting in pregnancies (%) 50.0 9 / 10 3 / 5 1 / 2
Number of Egg/Embryo Banking Cycles 11 11 2 2 3 1
Donor Eggs Fresh Embryosf Frozen Embryosf
Number of cycles 0 0Number of transfers 0 0Average number of embryos transferred Percentage of embryos transferred resulting in implantation (%) Percentage of transfers resulting in term, normal weight & singleton live births
e (%)
Percentage of transfers resulting in singleton live births (%) Percentage of transfers resulting in twin live births (%) Percentage of transfers resulting in live births (%) Percentage of transfers resulting in pregnancies (%)
CURRENT SERVICES & PROFILE Current Name: Fertility and Advanced Reproductive Medicine
Donor eggs? NoDonor embryos? No
Gestational carriers? NoEmbryo cryopreservation? Yes
Single women? YesSART member? Yes
Verified lab accreditation? Yes(See Appendix C for details.)
a Reflects features of fresh nondonor cycles. If IVF is less than 100%, the remaining cycles are GIFT, ZIFT, or a combination of these procedures with IVF.
b Total patient diagnosis percentages may be greater than 100% because more than one diagnosis can be reported for each ART cycle.
c Fractions are used for rates with denominators less than 20. Multiple-infant births (for example, twins) with at least one live infant are counted as one live birth.
d Total cycle number includes those using frozen eggs. It excludes 0 cycle(s) evaluating new procedures. Both cycle types are excluded from ART success rates.
e In this report, births are defined as term if at least 37 full weeks gestation and normal birth weight if at least 2,500 grams (approximately 5 pounds, 8 ounces).
f All ages are reported together because previous data show that patient age does not materially affect success with donor eggs.

443
TE
XA
SFERTILITY CENTER OF DALLAS
DALLAS, TEXASComparison of success rates across clinics may not be meaningful. Patient medical characteristics and treatment approaches vary (see pages 11–20).
Data verified by J. Michael Putman, MD2014 ART CYCLE PROFILE
Type of ART and Procedural Factors a
IVF 100%Unstimulated 0%Used gestational carrier 0%
With ICSI 82%PGD/PGS 0%
Patient Diagnosis b
Tubal factor 16%Ovulatory dysfunction 14%Diminished ovarian reserve 19%Endometriosis 24%
Uterine factor 19%Male factor 63%Other factor 17%Unknown factor <1%
Multiple Factors: Female factors only 17%Female & male factors 40%
2014 ART SUCCESS RATES c Total number of cyclesd: 186 (includes 0 cycle[s] using frozen eggs)
Type of CycleAge of Woman
<35 35–37 38–40 41–42 43–44 >44Fresh Embryos from Nondonor Eggs
Number of cycles 33 8 3 0 0 0Percentage of cancellations before retrieval (%) 6.1 0 / 8 0 / 3 Average number of embryos transferred 2.0 2.0 2.7 Percentage of embryos transferred resulting in implantation (%) 50.8 4 / 16 2 / 8 Percentage of elective single embryo transfers (eSET) (%) 6.9 0 / 8 0 / 3
Outcomes per CyclePercentage of cycles resulting in term, normal weight & singleton live births
e (%) 27.3 3 / 8 0 / 3
Percentage of cycles resulting in singleton live births (%) 30.3 4 / 8 0 / 3 Percentage of cycles resulting in twin live births (%) 30.3 0 / 8 1 / 3 Percentage of cycles resulting in live births (%) 60.6 4 / 8 1 / 3 Percentage of cycles resulting in pregnancies (%) 60.6 4 / 8 1 / 3
Outcomes per TransferNumber of transfers 29 8 3 0 0 0Percentage of transfers resulting in term, normal weight & singleton live births
e (%) 31.0 3 / 8 0 / 3
Percentage of transfers resulting in singleton live births (%) 34.5 4 / 8 0 / 3 Percentage of transfers resulting in twin live births (%) 34.5 0 / 8 1 / 3 Percentage of transfers resulting in live births (%) 69.0 4 / 8 1 / 3 Percentage of transfers resulting in pregnancies (%) 69.0 4 / 8 1 / 3
Frozen Embryos from Nondonor EggsNumber of cycles 21 11 21 5 0 0Number of transfers 21 11 21 5 0 0Estimated average number of transfers per retrieval 1.1 0.7 1.0 0.3 0.0 0.0Average number of embryos transferred 1.7 1.6 1.9 2.4 Percentage of embryos transferred resulting in implantation (%) 54.5 8 / 17 43.2 0 / 10 Percentage of transfers resulting in term, normal weight & singleton live births
e (%) 33.3 6 / 11 23.8 0 / 5
Percentage of transfers resulting in singleton live births (%) 42.9 8 / 11 33.3 0 / 5 Percentage of transfers resulting in twin live births (%) 19.0 0 / 11 14.3 0 / 5 Percentage of transfers resulting in live births (%) 61.9 8 / 11 47.6 0 / 5 Percentage of transfers resulting in pregnancies (%) 71.4 9 / 11 57.1 1 / 5
Number of Egg/Embryo Banking Cycles 18 15 21 15 2 4
Donor Eggs Fresh Embryosf Frozen Embryosf
Number of cycles 4 5Number of transfers 4 5Average number of embryos transferred 1.8 2.0Percentage of embryos transferred resulting in implantation (%) 4 / 7 6 / 10Percentage of transfers resulting in term, normal weight & singleton live births
e (%) 2 / 4 2 / 5
Percentage of transfers resulting in singleton live births (%) 2 / 4 2 / 5Percentage of transfers resulting in twin live births (%) 1 / 4 2 / 5Percentage of transfers resulting in live births (%) 3 / 4 4 / 5Percentage of transfers resulting in pregnancies (%) 3 / 4 4 / 5
CURRENT SERVICES & PROFILE Current Name: Fertility Center of Dallas
Donor eggs? YesDonor embryos? Yes
Gestational carriers? YesEmbryo cryopreservation? Yes
Single women? YesSART member? Yes
Verified lab accreditation? Yes(See Appendix C for details.)
a Reflects features of fresh nondonor cycles. If IVF is less than 100%, the remaining cycles are GIFT, ZIFT, or a combination of these procedures with IVF.
b Total patient diagnosis percentages may be greater than 100% because more than one diagnosis can be reported for each ART cycle.
c Fractions are used for rates with denominators less than 20. Multiple-infant births (for example, twins) with at least one live infant are counted as one live birth.
d Total cycle number includes those using frozen eggs. It excludes 0 cycle(s) evaluating new procedures. Both cycle types are excluded from ART success rates.
e In this report, births are defined as term if at least 37 full weeks gestation and normal birth weight if at least 2,500 grams (approximately 5 pounds, 8 ounces).
f All ages are reported together because previous data show that patient age does not materially affect success with donor eggs.

444
TE
XA
SIVF INSTITUTE, PADALLAS, TEXAS
Comparison of success rates across clinics may not be meaningful. Patient medical characteristics and treatment approaches vary (see pages 11–20).
Data verified by Noel Peng, MD2014 ART CYCLE PROFILE
Type of ART and Procedural Factors a
IVF 100%Unstimulated 0%Used gestational carrier 0%
With ICSI 100%PGD/PGS 0%
Patient Diagnosis b
Tubal factor 32%Ovulatory dysfunction 18%Diminished ovarian reserve 79%Endometriosis 21%
Uterine factor 75%Male factor 61%Other factor 0%Unknown factor 0%
Multiple Factors: Female factors only 29%Female & male factors 61%
2014 ART SUCCESS RATES c Total number of cyclesd: 73 (includes 0 cycle[s] using frozen eggs)
Type of CycleAge of Woman
<35 35–37 38–40 41–42 43–44 >44Fresh Embryos from Nondonor Eggs
Number of cycles 3 0 0 0 0 0Percentage of cancellations before retrieval (%) 0 / 3 Average number of embryos transferred 1.7 Percentage of embryos transferred resulting in implantation (%) 3 / 5 Percentage of elective single embryo transfers (eSET) (%) 0 / 1
Outcomes per CyclePercentage of cycles resulting in term, normal weight & singleton live births
e (%) 1 / 3
Percentage of cycles resulting in singleton live births (%) 1 / 3 Percentage of cycles resulting in twin live births (%) 1 / 3 Percentage of cycles resulting in live births (%) 2 / 3 Percentage of cycles resulting in pregnancies (%) 2 / 3
Outcomes per TransferNumber of transfers 3 0 0 0 0 0Percentage of transfers resulting in term, normal weight & singleton live births
e (%) 1 / 3
Percentage of transfers resulting in singleton live births (%) 1 / 3 Percentage of transfers resulting in twin live births (%) 1 / 3 Percentage of transfers resulting in live births (%) 2 / 3 Percentage of transfers resulting in pregnancies (%) 2 / 3
Frozen Embryos from Nondonor EggsNumber of cycles 11 5 5 3 0 0Number of transfers 11 4 4 3 0 0Estimated average number of transfers per retrieval 0.9 0.4 0.4 0.4 0.0 0.0Average number of embryos transferred 1.8 1.5 2.0 1.3 Percentage of embryos transferred resulting in implantation (%) 55.0 5 / 6 4 / 8 2 / 4 Percentage of transfers resulting in term, normal weight & singleton live births
e (%) 7 / 11 3 / 4 2 / 4 1 / 3
Percentage of transfers resulting in singleton live births (%) 7 / 11 3 / 4 2 / 4 1 / 3 Percentage of transfers resulting in twin live births (%) 1 / 11 1 / 4 1 / 4 0 / 3 Percentage of transfers resulting in live births (%) 8 / 11 4 / 4 3 / 4 1 / 3 Percentage of transfers resulting in pregnancies (%) 9 / 11 4 / 4 3 / 4 2 / 3
Number of Egg/Embryo Banking Cycles 12 11 10 7 4 1
Donor Eggs Fresh Embryosf Frozen Embryosf
Number of cycles 0 1Number of transfers 0 1Average number of embryos transferred 3.0Percentage of embryos transferred resulting in implantation (%) 1 / 3Percentage of transfers resulting in term, normal weight & singleton live births
e (%) 1 / 1
Percentage of transfers resulting in singleton live births (%) 1 / 1Percentage of transfers resulting in twin live births (%) 0 / 1Percentage of transfers resulting in live births (%) 1 / 1Percentage of transfers resulting in pregnancies (%) 1 / 1
CURRENT SERVICES & PROFILE Current Name: IVF Institute, PA
Donor eggs? YesDonor embryos? No
Gestational carriers? YesEmbryo cryopreservation? Yes
Single women? YesSART member? No
Verified lab accreditation? Yes(See Appendix C for details.)
a Reflects features of fresh nondonor cycles. If IVF is less than 100%, the remaining cycles are GIFT, ZIFT, or a combination of these procedures with IVF.
b Total patient diagnosis percentages may be greater than 100% because more than one diagnosis can be reported for each ART cycle.
c Fractions are used for rates with denominators less than 20. Multiple-infant births (for example, twins) with at least one live infant are counted as one live birth.
d Total cycle number includes those using frozen eggs. It excludes 0 cycle(s) evaluating new procedures. Both cycle types are excluded from ART success rates.
e In this report, births are defined as term if at least 37 full weeks gestation and normal birth weight if at least 2,500 grams (approximately 5 pounds, 8 ounces).
f All ages are reported together because previous data show that patient age does not materially affect success with donor eggs.

445
TE
XA
SREPROMED FERTILITY CENTER
DALLAS, TEXASComparison of success rates across clinics may not be meaningful. Patient medical characteristics and treatment approaches vary (see pages 11–20).
Data verified by Anil B. Pinto, MD2014 ART CYCLE PROFILE
Type of ART and Procedural Factors a
IVF 100%Unstimulated 0%Used gestational carrier 2%
With ICSI 87%PGD/PGS 2%
Patient Diagnosis b
Tubal factor 9%Ovulatory dysfunction 19%Diminished ovarian reserve 39%Endometriosis <1%
Uterine factor 6%Male factor 14%Other factor 8%Unknown factor 12%
Multiple Factors: Female factors only 5%Female & male factors 3%
2014 ART SUCCESS RATES c Total number of cyclesd: 158 (includes 1 cycle[s] using frozen eggs)
Type of CycleAge of Woman
<35 35–37 38–40 41–42 43–44 >44Fresh Embryos from Nondonor Eggs
Number of cycles 36 12 9 3 0 0Percentage of cancellations before retrieval (%) 2.8 2 / 12 3 / 9 0 / 3 Average number of embryos transferred 1.8 1.7 1.8 2.0 Percentage of embryos transferred resulting in implantation (%) 56.4 6 / 12 3 / 9 1 / 4 Percentage of elective single embryo transfers (eSET) (%) 13.8 1 / 6 0 / 4 0 / 2
Outcomes per CyclePercentage of cycles resulting in term, normal weight & singleton live births
e (%) 16.7 2 / 12 2 / 9 1 / 3
Percentage of cycles resulting in singleton live births (%) 22.2 2 / 12 2 / 9 1 / 3 Percentage of cycles resulting in twin live births (%) 22.2 2 / 12 0 / 9 0 / 3 Percentage of cycles resulting in live births (%) 44.4 4 / 12 2 / 9 1 / 3 Percentage of cycles resulting in pregnancies (%) 55.6 4 / 12 3 / 9 1 / 3
Outcomes per TransferNumber of transfers 30 7 5 2 0 0Percentage of transfers resulting in term, normal weight & singleton live births
e (%) 20.0 2 / 7 2 / 5 1 / 2
Percentage of transfers resulting in singleton live births (%) 26.7 2 / 7 2 / 5 1 / 2 Percentage of transfers resulting in twin live births (%) 26.7 2 / 7 0 / 5 0 / 2 Percentage of transfers resulting in live births (%) 53.3 4 / 7 2 / 5 1 / 2 Percentage of transfers resulting in pregnancies (%) 66.7 4 / 7 3 / 5 1 / 2
Frozen Embryos from Nondonor EggsNumber of cycles 23 15 8 4 2 0Number of transfers 23 14 8 4 2 0Estimated average number of transfers per retrieval 1.6 1.4 0.7 0.6 2.0 Average number of embryos transferred 2.0 1.9 1.9 2.0 2.5 Percentage of embryos transferred resulting in implantation (%) 44.2 22.2 4 / 15 1 / 8 1 / 5 Percentage of transfers resulting in term, normal weight & singleton live births
e (%) 26.1 5 / 14 0 / 8 0 / 4 0 / 2
Percentage of transfers resulting in singleton live births (%) 39.1 6 / 14 3 / 8 1 / 4 1 / 2 Percentage of transfers resulting in twin live births (%) 21.7 0 / 14 0 / 8 0 / 4 0 / 2 Percentage of transfers resulting in live births (%) 60.9 6 / 14 3 / 8 1 / 4 1 / 2 Percentage of transfers resulting in pregnancies (%) 65.2 6 / 14 4 / 8 1 / 4 1 / 2
Number of Egg/Embryo Banking Cycles 5 5 11 6 1 0
Donor Eggs Fresh Embryosf Frozen Embryosf
Number of cycles 11 6Number of transfers 11 6Average number of embryos transferred 2.0 1.7Percentage of embryos transferred resulting in implantation (%) 68.2 5 / 10Percentage of transfers resulting in term, normal weight & singleton live births
e (%) 3 / 11 1 / 6
Percentage of transfers resulting in singleton live births (%) 3 / 11 1 / 6Percentage of transfers resulting in twin live births (%) 4 / 11 2 / 6Percentage of transfers resulting in live births (%) 7 / 11 3 / 6Percentage of transfers resulting in pregnancies (%) 9 / 11 3 / 6
CURRENT SERVICES & PROFILE Current Name: ReproMed Fertility Center
Donor eggs? YesDonor embryos? Yes
Gestational carriers? YesEmbryo cryopreservation? Yes
Single women? YesSART member? Yes
Verified lab accreditation? Yes(See Appendix C for details.)
a Reflects features of fresh nondonor cycles. If IVF is less than 100%, the remaining cycles are GIFT, ZIFT, or a combination of these procedures with IVF.
b Total patient diagnosis percentages may be greater than 100% because more than one diagnosis can be reported for each ART cycle.
c Fractions are used for rates with denominators less than 20. Multiple-infant births (for example, twins) with at least one live infant are counted as one live birth.
d Total cycle number includes those using frozen eggs. It excludes 0 cycle(s) evaluating new procedures. Both cycle types are excluded from ART success rates.
e In this report, births are defined as term if at least 37 full weeks gestation and normal birth weight if at least 2,500 grams (approximately 5 pounds, 8 ounces).
f All ages are reported together because previous data show that patient age does not materially affect success with donor eggs.

446
TE
XA
SSHER INSTITUTE FOR REPRODUCTIVE MEDICINE-DALLAS
DALLAS, TEXASComparison of success rates across clinics may not be meaningful. Patient medical characteristics and treatment approaches vary (see pages 11–20).
Data verified by Walid Saleh, MD2014 ART CYCLE PROFILE
Type of ART and Procedural Factors a
IVF 100%Unstimulated <1%Used gestational carrier <1%
With ICSI 87%PGD/PGS 24%
Patient Diagnosis b
Tubal factor 19%Ovulatory dysfunction 10%Diminished ovarian reserve 42%Endometriosis 0%
Uterine factor 11%Male factor 15%Other factor 17%Unknown factor 10%
Multiple Factors: Female factors only 9%Female & male factors 12%
2014 ART SUCCESS RATES c Total number of cyclesd: 245 (includes 2 cycle[s] using frozen eggs)
Type of CycleAge of Woman
<35 35–37 38–40 41–42 43–44 >44Fresh Embryos from Nondonor Eggs
Number of cycles 71 29 20 4 3 0Percentage of cancellations before retrieval (%) 8.5 6.9 10.0 0 / 4 0 / 3 Average number of embryos transferred 1.7 2.0 2.1 2.0 3.0 Percentage of embryos transferred resulting in implantation (%) 46.5 37.2 41.4 2 / 6 0 / 3 Percentage of elective single embryo transfers (eSET) (%) 21.3 1 / 18 0 / 15 0 / 2 0 / 1
Outcomes per CyclePercentage of cycles resulting in term, normal weight & singleton live births
e (%) 28.2 17.2 20.0 0 / 4 0 / 3
Percentage of cycles resulting in singleton live births (%) 35.2 17.2 35.0 0 / 4 0 / 3 Percentage of cycles resulting in twin live births (%) 9.9 13.8 10.0 1 / 4 0 / 3 Percentage of cycles resulting in live births (%) 45.1 31.0 45.0 1 / 4 0 / 3 Percentage of cycles resulting in pregnancies (%) 50.7 37.9 55.0 1 / 4 0 / 3
Outcomes per TransferNumber of transfers 57 22 15 3 1 0Percentage of transfers resulting in term, normal weight & singleton live births
e (%) 35.1 22.7 4 / 15 0 / 3 0 / 1
Percentage of transfers resulting in singleton live births (%) 43.9 22.7 7 / 15 0 / 3 0 / 1 Percentage of transfers resulting in twin live births (%) 12.3 18.2 2 / 15 1 / 3 0 / 1 Percentage of transfers resulting in live births (%) 56.1 40.9 9 / 15 1 / 3 0 / 1 Percentage of transfers resulting in pregnancies (%) 63.2 50.0 11 / 15 1 / 3 0 / 1
Frozen Embryos from Nondonor EggsNumber of cycles 27 9 11 2 0 0Number of transfers 25 9 11 1 0 0Estimated average number of transfers per retrieval 1.6 1.3 1.2 Average number of embryos transferred 2.0 2.0 1.6 2.0 Percentage of embryos transferred resulting in implantation (%) 34.0 5 / 18 3 / 18 0 / 2 Percentage of transfers resulting in term, normal weight & singleton live births
e (%) 20.0 4 / 9 1 / 11 0 / 1
Percentage of transfers resulting in singleton live births (%) 28.0 4 / 9 1 / 11 0 / 1 Percentage of transfers resulting in twin live births (%) 12.0 0 / 9 1 / 11 0 / 1 Percentage of transfers resulting in live births (%) 40.0 4 / 9 2 / 11 0 / 1 Percentage of transfers resulting in pregnancies (%) 52.0 5 / 9 2 / 11 0 / 1
Number of Egg/Embryo Banking Cycles 9 4 9 0 0 0
Donor Eggs Fresh Embryosf Frozen Embryosf
Number of cycles 25 20Number of transfers 18 20Average number of embryos transferred 2.1 2.0Percentage of embryos transferred resulting in implantation (%) 67.6 20.5Percentage of transfers resulting in term, normal weight & singleton live births
e (%) 4 / 18 5.0
Percentage of transfers resulting in singleton live births (%) 7 / 18 10.0Percentage of transfers resulting in twin live births (%) 5 / 18 10.0Percentage of transfers resulting in live births (%) 12 / 18 20.0Percentage of transfers resulting in pregnancies (%) 15 / 18 30.0
CURRENT SERVICES & PROFILE This clinic has reorganized since 2014. Contact the NASS Help Desk for further information.
Current Name: Sher Institute for Reproductive Medicine-Dallas
Donor eggs? YesDonor embryos? Yes
Gestational carriers? YesEmbryo cryopreservation? Yes
Single women? YesSART member? Yes
Verified lab accreditation? Yes(See Appendix C for details.)
a Reflects features of fresh nondonor cycles. If IVF is less than 100%, the remaining cycles are GIFT, ZIFT, or a combination of these procedures with IVF.
b Total patient diagnosis percentages may be greater than 100% because more than one diagnosis can be reported for each ART cycle.
c Fractions are used for rates with denominators less than 20. Multiple-infant births (for example, twins) with at least one live infant are counted as one live birth.
d Total cycle number includes those using frozen eggs. It excludes 0 cycle(s) evaluating new procedures. Both cycle types are excluded from ART success rates.
e In this report, births are defined as term if at least 37 full weeks gestation and normal birth weight if at least 2,500 grams (approximately 5 pounds, 8 ounces).
f All ages are reported together because previous data show that patient age does not materially affect success with donor eggs.

447
TE
XA
STEXAS CENTER FOR REPRODUCTIVE HEALTH
DALLAS, TEXASComparison of success rates across clinics may not be meaningful. Patient medical characteristics and treatment approaches vary (see pages 11–20).
Data verified by Samuel P. Marynick, MD2014 ART CYCLE PROFILE
Type of ART and Procedural Factors a
IVF 100%Unstimulated 0%Used gestational carrier 0%
With ICSI 97%PGD/PGS 32%
Patient Diagnosis b
Tubal factor 5%Ovulatory dysfunction 9%Diminished ovarian reserve 56%Endometriosis 7%
Uterine factor 9%Male factor 22%Other factor 34%Unknown factor 5%
Multiple Factors: Female factors only 20%Female & male factors 17%
2014 ART SUCCESS RATES c Total number of cyclesd: 74 (includes 0 cycle[s] using frozen eggs)
Type of CycleAge of Woman
<35 35–37 38–40 41–42 43–44 >44Fresh Embryos from Nondonor Eggs
Number of cycles 12 9 8 2 3 0Percentage of cancellations before retrieval (%) 0 / 12 1 / 9 0 / 8 0 / 2 0 / 3 Average number of embryos transferred 1.8 2.0 2.0 2.0 2.7 Percentage of embryos transferred resulting in implantation (%) 36.4 5 / 16 3 / 14 4 / 4 0 / 8 Percentage of elective single embryo transfers (eSET) (%) 1 / 11 0 / 7 0 / 5 0 / 2 0 / 3
Outcomes per CyclePercentage of cycles resulting in term, normal weight & singleton live births
e (%) 4 / 12 0 / 9 3 / 8 1 / 2 0 / 3
Percentage of cycles resulting in singleton live births (%) 6 / 12 1 / 9 3 / 8 1 / 2 0 / 3 Percentage of cycles resulting in twin live births (%) 1 / 12 2 / 9 0 / 8 0 / 2 0 / 3 Percentage of cycles resulting in live births (%) 7 / 12 3 / 9 3 / 8 2 / 2 0 / 3 Percentage of cycles resulting in pregnancies (%) 7 / 12 3 / 9 3 / 8 2 / 2 0 / 3
Outcomes per TransferNumber of transfers 12 8 7 2 3 0Percentage of transfers resulting in term, normal weight & singleton live births
e (%) 4 / 12 0 / 8 3 / 7 1 / 2 0 / 3
Percentage of transfers resulting in singleton live births (%) 6 / 12 1 / 8 3 / 7 1 / 2 0 / 3 Percentage of transfers resulting in twin live births (%) 1 / 12 2 / 8 0 / 7 0 / 2 0 / 3 Percentage of transfers resulting in live births (%) 7 / 12 3 / 8 3 / 7 2 / 2 0 / 3 Percentage of transfers resulting in pregnancies (%) 7 / 12 3 / 8 3 / 7 2 / 2 0 / 3
Frozen Embryos from Nondonor EggsNumber of cycles 5 3 3 0 0 2Number of transfers 5 3 3 0 0 2Estimated average number of transfers per retrieval 0.7 1.5 0.5 0.0 2.0Average number of embryos transferred 1.8 1.7 2.0 1.5Percentage of embryos transferred resulting in implantation (%) 3 / 9 4 / 5 1 / 6 1 / 3Percentage of transfers resulting in term, normal weight & singleton live births
e (%) 1 / 5 2 / 3 1 / 3 1 / 2
Percentage of transfers resulting in singleton live births (%) 1 / 5 2 / 3 1 / 3 1 / 2Percentage of transfers resulting in twin live births (%) 1 / 5 1 / 3 0 / 3 0 / 2Percentage of transfers resulting in live births (%) 2 / 5 3 / 3 1 / 3 1 / 2Percentage of transfers resulting in pregnancies (%) 2 / 5 3 / 3 1 / 3 1 / 2
Number of Egg/Embryo Banking Cycles 5 2 6 0 1 1
Donor Eggs Fresh Embryosf Frozen Embryosf
Number of cycles 3 9Number of transfers 2 9Average number of embryos transferred 2.0 1.8Percentage of embryos transferred resulting in implantation (%) 2 / 4 6 / 16Percentage of transfers resulting in term, normal weight & singleton live births
e (%) 1 / 2 3 / 9
Percentage of transfers resulting in singleton live births (%) 1 / 2 4 / 9Percentage of transfers resulting in twin live births (%) 0 / 2 1 / 9Percentage of transfers resulting in live births (%) 1 / 2 5 / 9Percentage of transfers resulting in pregnancies (%) 2 / 2 5 / 9
CURRENT SERVICES & PROFILE Current Name: Texas Center for Reproductive Health
Donor eggs? YesDonor embryos? Yes
Gestational carriers? YesEmbryo cryopreservation? Yes
Single women? YesSART member? Yes
Verified lab accreditation? Yes(See Appendix C for details.)
a Reflects features of fresh nondonor cycles. If IVF is less than 100%, the remaining cycles are GIFT, ZIFT, or a combination of these procedures with IVF.
b Total patient diagnosis percentages may be greater than 100% because more than one diagnosis can be reported for each ART cycle.
c Fractions are used for rates with denominators less than 20. Multiple-infant births (for example, twins) with at least one live infant are counted as one live birth.
d Total cycle number includes those using frozen eggs. It excludes 0 cycle(s) evaluating new procedures. Both cycle types are excluded from ART success rates.
e In this report, births are defined as term if at least 37 full weeks gestation and normal birth weight if at least 2,500 grams (approximately 5 pounds, 8 ounces).
f All ages are reported together because previous data show that patient age does not materially affect success with donor eggs.

448
TE
XA
SUNIVERSITY FERTILITY CENTER
DICKINSON, TEXAS
This clinic provided ART services during 2014 and is therefore required to submit ART cycle data under the provisions of the Fertility Clinic Success Rate and Certification Act. This clinic either did not submit 2014 ART cycle data or the clinic’s Medical Director did not approve the clinic’s 2014 ART cycle data for inclusion in this report.

449
TE
XA
SSOUTHWEST CENTER FOR REPRODUCTIVE HEALTH, PA
EL PASO, TEXASComparison of success rates across clinics may not be meaningful. Patient medical characteristics and treatment approaches vary (see pages 11–20).
Data verified by Luis S. Noble, MD2014 ART CYCLE PROFILE
Type of ART and Procedural Factors a
IVF 100%Unstimulated 0%Used gestational carrier 0%
With ICSI 92%PGD/PGS 0%
Patient Diagnosis b
Tubal factor 25%Ovulatory dysfunction 16%Diminished ovarian reserve 20%Endometriosis 36%
Uterine factor 3%Male factor 18%Other factor 23%Unknown factor <1%
Multiple Factors: Female factors only 26%Female & male factors 10%
2014 ART SUCCESS RATES c Total number of cyclesd: 103 (includes 0 cycle[s] using frozen eggs)
Type of CycleAge of Woman
<35 35–37 38–40 41–42 43–44 >44Fresh Embryos from Nondonor Eggs
Number of cycles 25 14 12 5 2 1Percentage of cancellations before retrieval (%) 8.0 2 / 14 1 / 12 0 / 5 0 / 2 0 / 1Average number of embryos transferred 1.9 2.4 2.5 3.0 3.0 4.0Percentage of embryos transferred resulting in implantation (%) 56.4 37.9 29.6 0 / 12 0 / 6 0 / 4Percentage of elective single embryo transfers (eSET) (%) 3 / 18 0 / 11 0 / 11 0 / 4 0 / 2 0 / 1
Outcomes per CyclePercentage of cycles resulting in term, normal weight & singleton live births
e (%) 32.0 5 / 14 1 / 12 0 / 5 0 / 2 0 / 1
Percentage of cycles resulting in singleton live births (%) 40.0 5 / 14 1 / 12 0 / 5 0 / 2 0 / 1Percentage of cycles resulting in twin live births (%) 20.0 1 / 14 2 / 12 0 / 5 0 / 2 0 / 1Percentage of cycles resulting in live births (%) 60.0 6 / 14 3 / 12 0 / 5 0 / 2 0 / 1Percentage of cycles resulting in pregnancies (%) 64.0 8 / 14 5 / 12 0 / 5 0 / 2 0 / 1
Outcomes per TransferNumber of transfers 21 12 11 4 2 1Percentage of transfers resulting in term, normal weight & singleton live births
e (%) 38.1 5 / 12 1 / 11 0 / 4 0 / 2 0 / 1
Percentage of transfers resulting in singleton live births (%) 47.6 5 / 12 1 / 11 0 / 4 0 / 2 0 / 1Percentage of transfers resulting in twin live births (%) 23.8 1 / 12 2 / 11 0 / 4 0 / 2 0 / 1Percentage of transfers resulting in live births (%) 71.4 6 / 12 3 / 11 0 / 4 0 / 2 0 / 1Percentage of transfers resulting in pregnancies (%) 76.2 8 / 12 5 / 11 0 / 4 0 / 2 0 / 1
Frozen Embryos from Nondonor EggsNumber of cycles 9 11 15 3 0 0Number of transfers 9 11 15 3 0 0Estimated average number of transfers per retrieval 2.3 5.0 Average number of embryos transferred 2.0 1.7 2.1 2.0 Percentage of embryos transferred resulting in implantation (%) 5 / 16 11 / 19 54.8 3 / 6 Percentage of transfers resulting in term, normal weight & singleton live births
e (%) 3 / 9 2 / 11 6 / 15 1 / 3
Percentage of transfers resulting in singleton live births (%) 3 / 9 3 / 11 6 / 15 1 / 3 Percentage of transfers resulting in twin live births (%) 1 / 9 3 / 11 3 / 15 0 / 3 Percentage of transfers resulting in live births (%) 4 / 9 6 / 11 9 / 15 1 / 3 Percentage of transfers resulting in pregnancies (%) 4 / 9 8 / 11 11 / 15 3 / 3
Number of Egg/Embryo Banking Cycles 0 0 0 0 0 0
Donor Eggs Fresh Embryosf Frozen Embryosf
Number of cycles 0 6Number of transfers 0 6Average number of embryos transferred 1.3Percentage of embryos transferred resulting in implantation (%) 1 / 6Percentage of transfers resulting in term, normal weight & singleton live births
e (%) 1 / 6
Percentage of transfers resulting in singleton live births (%) 1 / 6Percentage of transfers resulting in twin live births (%) 0 / 6Percentage of transfers resulting in live births (%) 1 / 6Percentage of transfers resulting in pregnancies (%) 1 / 6
CURRENT SERVICES & PROFILE Current Name: Southwest Center for Reproductive Health, PA
Donor eggs? YesDonor embryos? No
Gestational carriers? NoEmbryo cryopreservation? Yes
Single women? YesSART member? Yes
Verified lab accreditation? No(See Appendix C for details.)
a Reflects features of fresh nondonor cycles. If IVF is less than 100%, the remaining cycles are GIFT, ZIFT, or a combination of these procedures with IVF.
b Total patient diagnosis percentages may be greater than 100% because more than one diagnosis can be reported for each ART cycle.
c Fractions are used for rates with denominators less than 20. Multiple-infant births (for example, twins) with at least one live infant are counted as one live birth.
d Total cycle number includes those using frozen eggs. It excludes 0 cycle(s) evaluating new procedures. Both cycle types are excluded from ART success rates.
e In this report, births are defined as term if at least 37 full weeks gestation and normal birth weight if at least 2,500 grams (approximately 5 pounds, 8 ounces).
f All ages are reported together because previous data show that patient age does not materially affect success with donor eggs.

450
TE
XA
SBROOKE ARMY MEDICAL CENTER
FORT SAM HOUSTON, TEXASComparison of success rates across clinics may not be meaningful. Patient medical characteristics and treatment approaches vary (see pages 11–20).
Data verified by Jamie A. Massie, MD2014 ART CYCLE PROFILE
Type of ART and Procedural Factors a
IVF 100%Unstimulated 0%Used gestational carrier 0%
With ICSI 72%PGD/PGS 0%
Patient Diagnosis b
Tubal factor 33%Ovulatory dysfunction 8%Diminished ovarian reserve 16%Endometriosis 12%
Uterine factor 13%Male factor 60%Other factor 0%Unknown factor 5%
Multiple Factors: Female factors only 11%Female & male factors 26%
2014 ART SUCCESS RATES c Total number of cyclesd: 123 (includes 0 cycle[s] using frozen eggs)
Type of CycleAge of Woman
<35 35–37 38–40 41–42 43–44 >44Fresh Embryos from Nondonor Eggs
Number of cycles 65 35 22 1 0 0Percentage of cancellations before retrieval (%) 0.0 2.9 9.1 0 / 1 Average number of embryos transferred 2.0 2.1 2.4 3.0 Percentage of embryos transferred resulting in implantation (%) 42.7 15.4 20.9 0 / 3 Percentage of elective single embryo transfers (eSET) (%) 6.3 9.4 0 / 17 0 / 1
Outcomes per CyclePercentage of cycles resulting in term, normal weight & singleton live births
e (%) 30.8 17.1 13.6 0 / 1
Percentage of cycles resulting in singleton live births (%) 33.8 20.0 13.6 0 / 1 Percentage of cycles resulting in twin live births (%) 23.1 2.9 4.5 0 / 1 Percentage of cycles resulting in live births (%) 56.9 22.9 22.7 0 / 1 Percentage of cycles resulting in pregnancies (%) 58.5 28.6 27.3 0 / 1
Outcomes per TransferNumber of transfers 64 33 18 1 0 0Percentage of transfers resulting in term, normal weight & singleton live births
e (%) 31.3 18.2 3 / 18 0 / 1
Percentage of transfers resulting in singleton live births (%) 34.4 21.2 3 / 18 0 / 1 Percentage of transfers resulting in twin live births (%) 23.4 3.0 1 / 18 0 / 1 Percentage of transfers resulting in live births (%) 57.8 24.2 5 / 18 0 / 1 Percentage of transfers resulting in pregnancies (%) 59.4 30.3 6 / 18 0 / 1
Frozen Embryos from Nondonor EggsNumber of cycles 0 0 0 0 0 0Number of transfers 0 0 0 0 0 0Estimated average number of transfers per retrieval Average number of embryos transferred Percentage of embryos transferred resulting in implantation (%) Percentage of transfers resulting in term, normal weight & singleton live births
e (%)
Percentage of transfers resulting in singleton live births (%) Percentage of transfers resulting in twin live births (%) Percentage of transfers resulting in live births (%) Percentage of transfers resulting in pregnancies (%)
Number of Egg/Embryo Banking Cycles 0 0 0 0 0 0
Donor Eggs Fresh Embryosf Frozen Embryosf
Number of cycles 0 0Number of transfers 0 0Average number of embryos transferred Percentage of embryos transferred resulting in implantation (%) Percentage of transfers resulting in term, normal weight & singleton live births
e (%)
Percentage of transfers resulting in singleton live births (%) Percentage of transfers resulting in twin live births (%) Percentage of transfers resulting in live births (%) Percentage of transfers resulting in pregnancies (%)
CURRENT SERVICES & PROFILE Current Name: Brooke Army Medical Center
Donor eggs? NoDonor embryos? No
Gestational carriers? NoEmbryo cryopreservation? Yes
Single women? NoSART member? Yes
Verified lab accreditation? Yes(See Appendix C for details.)
a Reflects features of fresh nondonor cycles. If IVF is less than 100%, the remaining cycles are GIFT, ZIFT, or a combination of these procedures with IVF.
b Total patient diagnosis percentages may be greater than 100% because more than one diagnosis can be reported for each ART cycle.
c Fractions are used for rates with denominators less than 20. Multiple-infant births (for example, twins) with at least one live infant are counted as one live birth.
d Total cycle number includes those using frozen eggs. It excludes 0 cycle(s) evaluating new procedures. Both cycle types are excluded from ART success rates.
e In this report, births are defined as term if at least 37 full weeks gestation and normal birth weight if at least 2,500 grams (approximately 5 pounds, 8 ounces).
f All ages are reported together because previous data show that patient age does not materially affect success with donor eggs.

451
TE
XA
SFORT WORTH FERTILITY, PA
FORT WORTH, TEXASComparison of success rates across clinics may not be meaningful. Patient medical characteristics and treatment approaches vary (see pages 11–20).
Data verified by Robert Kaufmann, MD2014 ART CYCLE PROFILE
Type of ART and Procedural Factors a
IVF >99%Unstimulated <1%Used gestational carrier 7%
With ICSI 94%PGD/PGS 37%
Patient Diagnosis b
Tubal factor 9%Ovulatory dysfunction 8%Diminished ovarian reserve 26%Endometriosis 4%
Uterine factor 3%Male factor 32%Other factor 19%Unknown factor 19%
Multiple Factors: Female factors only 6%Female & male factors 13%
2014 ART SUCCESS RATES c Total number of cyclesd: 625 (includes 14 cycle[s] using frozen eggs)
Type of CycleAge of Woman
<35 35–37 38–40 41–42 43–44 >44Fresh Embryos from Nondonor Eggs
Number of cycles 124 40 28 19 3 2Percentage of cancellations before retrieval (%) 3.2 2.5 0.0 1 / 19 0 / 3 0 / 2Average number of embryos transferred 1.8 1.7 1.7 1.6 2.0 1.0Percentage of embryos transferred resulting in implantation (%) 36.6 28.8 9.4 4 / 14 0 / 2 0 / 1Percentage of elective single embryo transfers (eSET) (%) 14.9 12.0 2 / 15 0 / 5 0 / 1
Outcomes per CyclePercentage of cycles resulting in term, normal weight & singleton live births
e (%) 20.2 15.0 3.6 2 / 19 0 / 3 0 / 2
Percentage of cycles resulting in singleton live births (%) 21.0 17.5 7.1 2 / 19 0 / 3 0 / 2Percentage of cycles resulting in twin live births (%) 8.9 7.5 0.0 0 / 19 0 / 3 0 / 2Percentage of cycles resulting in live births (%) 29.8 25.0 7.1 2 / 19 0 / 3 0 / 2Percentage of cycles resulting in pregnancies (%) 33.1 30.0 10.7 2 / 19 0 / 3 0 / 2
Outcomes per TransferNumber of transfers 82 30 19 9 1 1Percentage of transfers resulting in term, normal weight & singleton live births
e (%) 30.5 20.0 1 / 19 2 / 9 0 / 1 0 / 1
Percentage of transfers resulting in singleton live births (%) 31.7 23.3 2 / 19 2 / 9 0 / 1 0 / 1Percentage of transfers resulting in twin live births (%) 13.4 10.0 0 / 19 0 / 9 0 / 1 0 / 1Percentage of transfers resulting in live births (%) 45.1 33.3 2 / 19 2 / 9 0 / 1 0 / 1Percentage of transfers resulting in pregnancies (%) 50.0 40.0 3 / 19 2 / 9 0 / 1 0 / 1
Frozen Embryos from Nondonor EggsNumber of cycles 138 35 19 6 5 0Number of transfers 127 30 17 4 4 0Estimated average number of transfers per retrieval 1.6 1.3 0.8 0.3 0.5 0.0Average number of embryos transferred 1.6 1.3 1.6 1.3 1.8 Percentage of embryos transferred resulting in implantation (%) 27.7 29.7 14.8 0 / 5 2 / 7 Percentage of transfers resulting in term, normal weight & singleton live births
e (%) 20.5 20.0 4 / 17 0 / 4 0 / 4
Percentage of transfers resulting in singleton live births (%) 23.6 23.3 4 / 17 0 / 4 0 / 4 Percentage of transfers resulting in twin live births (%) 7.9 0.0 0 / 17 0 / 4 0 / 4 Percentage of transfers resulting in live births (%) 31.5 23.3 4 / 17 0 / 4 0 / 4 Percentage of transfers resulting in pregnancies (%) 37.8 33.3 4 / 17 0 / 4 1 / 4
Number of Egg/Embryo Banking Cycles 25 11 11 8 6 5
Donor Eggs Fresh Embryosf Frozen Embryosf
Number of cycles 57 69Number of transfers 39 64Average number of embryos transferred 1.7 1.6Percentage of embryos transferred resulting in implantation (%) 55.4 29.7Percentage of transfers resulting in term, normal weight & singleton live births
e (%) 25.6 23.4
Percentage of transfers resulting in singleton live births (%) 30.8 26.6Percentage of transfers resulting in twin live births (%) 17.9 7.8Percentage of transfers resulting in live births (%) 48.7 34.4Percentage of transfers resulting in pregnancies (%) 66.7 37.5
CURRENT SERVICES & PROFILE Current Name: Fort Worth Fertility, PA
Donor eggs? YesDonor embryos? Yes
Gestational carriers? YesEmbryo cryopreservation? Yes
Single women? YesSART member? Yes
Verified lab accreditation? Yes(See Appendix C for details.)
a Reflects features of fresh nondonor cycles. If IVF is less than 100%, the remaining cycles are GIFT, ZIFT, or a combination of these procedures with IVF.
b Total patient diagnosis percentages may be greater than 100% because more than one diagnosis can be reported for each ART cycle.
c Fractions are used for rates with denominators less than 20. Multiple-infant births (for example, twins) with at least one live infant are counted as one live birth.
d Total cycle number includes those using frozen eggs. It excludes 0 cycle(s) evaluating new procedures. Both cycle types are excluded from ART success rates.
e In this report, births are defined as term if at least 37 full weeks gestation and normal birth weight if at least 2,500 grams (approximately 5 pounds, 8 ounces).
f All ages are reported together because previous data show that patient age does not materially affect success with donor eggs.

452
TE
XA
SOFFICE OF FRANK DeLEON, MD
FORT WORTH, TEXAS
This clinic provided ART services during 2014 and is therefore required to submit ART cycle data under the provisions of the Fertility Clinic Success Rate and Certification Act. This clinic either did not submit 2014 ART cycle data or the clinic’s Medical Director did not approve the clinic’s 2014 ART cycle data for inclusion in this report.

453
TE
XA
SDALLAS IVF
FRISCO, TEXASComparison of success rates across clinics may not be meaningful. Patient medical characteristics and treatment approaches vary (see pages 11–20).
Data verified by Brian D. Barnett, MD2014 ART CYCLE PROFILE
Type of ART and Procedural Factors a
IVF 100%Unstimulated 0%Used gestational carrier <1%
With ICSI 51%PGD/PGS 9%
Patient Diagnosis b
Tubal factor 8%Ovulatory dysfunction 9%Diminished ovarian reserve 8%Endometriosis 6%
Uterine factor <1%Male factor 18%Other factor 3%Unknown factor 59%
Multiple Factors: Female factors only 3%Female & male factors 6%
2014 ART SUCCESS RATES c Total number of cyclesd: 625 (includes 3 cycle[s] using frozen eggs)
Type of CycleAge of Woman
<35 35–37 38–40 41–42 43–44 >44Fresh Embryos from Nondonor Eggs
Number of cycles 141 61 52 11 9 4Percentage of cancellations before retrieval (%) 1.4 1.6 11.5 3 / 11 2 / 9 2 / 4Average number of embryos transferred 1.7 1.9 1.9 2.2 2.8 Percentage of embryos transferred resulting in implantation (%) 39.6 29.1 15.0 1 / 11 0 / 11 Percentage of elective single embryo transfers (eSET) (%) 27.9 9.8 0.0 0 / 5 0 / 4
Outcomes per CyclePercentage of cycles resulting in term, normal weight & singleton live births
e (%) 26.2 18.0 11.5 1 / 11 0 / 9 0 / 4
Percentage of cycles resulting in singleton live births (%) 28.4 24.6 15.4 1 / 11 0 / 9 0 / 4Percentage of cycles resulting in twin live births (%) 5.7 6.6 0.0 0 / 11 0 / 9 0 / 4Percentage of cycles resulting in live births (%) 34.0 31.1 15.4 1 / 11 0 / 9 0 / 4Percentage of cycles resulting in pregnancies (%) 36.9 32.8 21.2 2 / 11 0 / 9 0 / 4
Outcomes per TransferNumber of transfers 90 43 33 6 4 0Percentage of transfers resulting in term, normal weight & singleton live births
e (%) 41.1 25.6 18.2 1 / 6 0 / 4
Percentage of transfers resulting in singleton live births (%) 44.4 34.9 24.2 1 / 6 0 / 4 Percentage of transfers resulting in twin live births (%) 8.9 9.3 0.0 0 / 6 0 / 4 Percentage of transfers resulting in live births (%) 53.3 44.2 24.2 1 / 6 0 / 4 Percentage of transfers resulting in pregnancies (%) 57.8 46.5 33.3 2 / 6 0 / 4
Frozen Embryos from Nondonor EggsNumber of cycles 101 42 22 9 2 0Number of transfers 98 41 21 9 2 0Estimated average number of transfers per retrieval 1.1 1.0 0.6 0.5 0.4 Average number of embryos transferred 1.4 1.6 1.5 1.4 1.5 Percentage of embryos transferred resulting in implantation (%) 66.7 59.4 31.3 7 / 13 2 / 3 Percentage of transfers resulting in term, normal weight & singleton live births
e (%) 35.7 41.5 19.0 2 / 9 1 / 2
Percentage of transfers resulting in singleton live births (%) 53.1 51.2 28.6 3 / 9 2 / 2 Percentage of transfers resulting in twin live births (%) 16.3 19.5 4.8 2 / 9 0 / 2 Percentage of transfers resulting in live births (%) 69.4 70.7 33.3 5 / 9 2 / 2 Percentage of transfers resulting in pregnancies (%) 79.6 75.6 42.9 5 / 9 2 / 2
Number of Egg/Embryo Banking Cycles 49 26 28 16 5 0
Donor Eggs Fresh Embryosf Frozen Embryosf
Number of cycles 14 30Number of transfers 10 30Average number of embryos transferred 1.4 1.6Percentage of embryos transferred resulting in implantation (%) 6 / 12 55.0Percentage of transfers resulting in term, normal weight & singleton live births
e (%) 3 / 10 20.0
Percentage of transfers resulting in singleton live births (%) 4 / 10 23.3Percentage of transfers resulting in twin live births (%) 1 / 10 20.0Percentage of transfers resulting in live births (%) 5 / 10 46.7Percentage of transfers resulting in pregnancies (%) 6 / 10 63.3
CURRENT SERVICES & PROFILE Current Name: Dallas IVF
Donor eggs? YesDonor embryos? Yes
Gestational carriers? YesEmbryo cryopreservation? Yes
Single women? YesSART member? Yes
Verified lab accreditation? Yes(See Appendix C for details.)
a Reflects features of fresh nondonor cycles. If IVF is less than 100%, the remaining cycles are GIFT, ZIFT, or a combination of these procedures with IVF.
b Total patient diagnosis percentages may be greater than 100% because more than one diagnosis can be reported for each ART cycle.
c Fractions are used for rates with denominators less than 20. Multiple-infant births (for example, twins) with at least one live infant are counted as one live birth.
d Total cycle number includes those using frozen eggs. It excludes 0 cycle(s) evaluating new procedures. Both cycle types are excluded from ART success rates.
e In this report, births are defined as term if at least 37 full weeks gestation and normal birth weight if at least 2,500 grams (approximately 5 pounds, 8 ounces).
f All ages are reported together because previous data show that patient age does not materially affect success with donor eggs.

454
TE
XA
SFERTILITY SPECIALISTS OF TEXAS, PLLC
FRISCO, TEXASComparison of success rates across clinics may not be meaningful. Patient medical characteristics and treatment approaches vary (see pages 11–20).
Data verified by Jerald S. Goldstein, MD2014 ART CYCLE PROFILE
Type of ART and Procedural Factors a
IVF 100%Unstimulated 0%Used gestational carrier 0%
With ICSI 56%PGD/PGS 8%
Patient Diagnosis b
Tubal factor 16%Ovulatory dysfunction 21%Diminished ovarian reserve 16%Endometriosis 5%
Uterine factor <1%Male factor 35%Other factor 12%Unknown factor 12%
Multiple Factors: Female factors only 4%Female & male factors 12%
2014 ART SUCCESS RATES c Total number of cyclesd: 391 (includes 2 cycle[s] using frozen eggs)
Type of CycleAge of Woman
<35 35–37 38–40 41–42 43–44 >44Fresh Embryos from Nondonor Eggs
Number of cycles 131 56 61 19 3 0Percentage of cancellations before retrieval (%) 7.6 21.4 23.0 4 / 19 2 / 3 Average number of embryos transferred 1.9 1.9 2.1 3.3 1.0 Percentage of embryos transferred resulting in implantation (%) 53.5 41.3 22.9 14.0 1 / 1 Percentage of elective single embryo transfers (eSET) (%) 9.3 5.3 0.0 0 / 14
Outcomes per CyclePercentage of cycles resulting in term, normal weight & singleton live births
e (%) 29.0 25.0 16.4 2 / 19 1 / 3
Percentage of cycles resulting in singleton live births (%) 31.3 33.9 18.0 3 / 19 1 / 3 Percentage of cycles resulting in twin live births (%) 20.6 8.9 3.3 1 / 19 0 / 3 Percentage of cycles resulting in live births (%) 51.9 42.9 21.3 4 / 19 1 / 3 Percentage of cycles resulting in pregnancies (%) 53.4 46.4 31.1 7 / 19 1 / 3
Outcomes per TransferNumber of transfers 100 39 45 15 1 0Percentage of transfers resulting in term, normal weight & singleton live births
e (%) 38.0 35.9 22.2 2 / 15 1 / 1
Percentage of transfers resulting in singleton live births (%) 41.0 48.7 24.4 3 / 15 1 / 1 Percentage of transfers resulting in twin live births (%) 27.0 12.8 4.4 1 / 15 0 / 1 Percentage of transfers resulting in live births (%) 68.0 61.5 28.9 4 / 15 1 / 1 Percentage of transfers resulting in pregnancies (%) 70.0 66.7 42.2 7 / 15 1 / 1
Frozen Embryos from Nondonor EggsNumber of cycles 34 11 10 2 0 0Number of transfers 33 10 10 2 0 0Estimated average number of transfers per retrieval 1.1 0.7 2.0 1.0 0.0 Average number of embryos transferred 1.7 1.8 1.5 2.5 Percentage of embryos transferred resulting in implantation (%) 41.1 6 / 17 7 / 14 3 / 5 Percentage of transfers resulting in term, normal weight & singleton live births
e (%) 33.3 4 / 10 2 / 10 0 / 2
Percentage of transfers resulting in singleton live births (%) 33.3 5 / 10 2 / 10 0 / 2 Percentage of transfers resulting in twin live births (%) 9.1 0 / 10 2 / 10 1 / 2 Percentage of transfers resulting in live births (%) 42.4 5 / 10 4 / 10 1 / 2 Percentage of transfers resulting in pregnancies (%) 57.6 7 / 10 6 / 10 1 / 2
Number of Egg/Embryo Banking Cycles 12 7 2 1 2 0
Donor Eggs Fresh Embryosf Frozen Embryosf
Number of cycles 22 16Number of transfers 15 16Average number of embryos transferred 1.9 1.8Percentage of embryos transferred resulting in implantation (%) 71.4 56.0Percentage of transfers resulting in term, normal weight & singleton live births
e (%) 3 / 15 4 / 16
Percentage of transfers resulting in singleton live births (%) 4 / 15 5 / 16Percentage of transfers resulting in twin live births (%) 7 / 15 4 / 16Percentage of transfers resulting in live births (%) 11 / 15 9 / 16Percentage of transfers resulting in pregnancies (%) 13 / 15 12 / 16
CURRENT SERVICES & PROFILE Current Name: Fertility Specialists of Texas, PLLC
Donor eggs? YesDonor embryos? Yes
Gestational carriers? YesEmbryo cryopreservation? Yes
Single women? YesSART member? Yes
Verified lab accreditation? Yes(See Appendix C for details.)
a Reflects features of fresh nondonor cycles. If IVF is less than 100%, the remaining cycles are GIFT, ZIFT, or a combination of these procedures with IVF.
b Total patient diagnosis percentages may be greater than 100% because more than one diagnosis can be reported for each ART cycle.
c Fractions are used for rates with denominators less than 20. Multiple-infant births (for example, twins) with at least one live infant are counted as one live birth.
d Total cycle number includes those using frozen eggs. It excludes 0 cycle(s) evaluating new procedures. Both cycle types are excluded from ART success rates.
e In this report, births are defined as term if at least 37 full weeks gestation and normal birth weight if at least 2,500 grams (approximately 5 pounds, 8 ounces).
f All ages are reported together because previous data show that patient age does not materially affect success with donor eggs.

455
TE
XA
SFRISCO INSTITUTE FOR REPRODUCTIVE MEDICINE
FRISCO, TEXASComparison of success rates across clinics may not be meaningful. Patient medical characteristics and treatment approaches vary (see pages 11–20).
Data verified by Rinku V. Mehta, MD2014 ART CYCLE PROFILE
Type of ART and Procedural Factors a
IVF 100%Unstimulated 0%Used gestational carrier 0%
With ICSI 70%PGD/PGS 0%
Patient Diagnosis b
Tubal factor 10%Ovulatory dysfunction 15%Diminished ovarian reserve 28%Endometriosis 4%
Uterine factor <1%Male factor 61%Other factor 7%Unknown factor 8%
Multiple Factors: Female factors only 2%Female & male factors 30%
2014 ART SUCCESS RATES c Total number of cyclesd: 218 (includes 4 cycle[s] using frozen eggs)
Type of CycleAge of Woman
<35 35–37 38–40 41–42 43–44 >44Fresh Embryos from Nondonor Eggs
Number of cycles 65 32 20 9 5 0Percentage of cancellations before retrieval (%) 3.1 6.3 15.0 1 / 9 1 / 5 Average number of embryos transferred 1.6 1.8 2.1 3.0 3.3 Percentage of embryos transferred resulting in implantation (%) 41.9 32.6 22.7 15.0 0 / 6 Percentage of elective single embryo transfers (eSET) (%) 35.0 28.6 1 / 11 0 / 8 0 / 3
Outcomes per CyclePercentage of cycles resulting in term, normal weight & singleton live births
e (%) 27.7 21.9 0.0 2 / 9 0 / 5
Percentage of cycles resulting in singleton live births (%) 30.8 25.0 10.0 3 / 9 0 / 5 Percentage of cycles resulting in twin live births (%) 4.6 9.4 5.0 0 / 9 0 / 5 Percentage of cycles resulting in live births (%) 35.4 34.4 15.0 3 / 9 0 / 5 Percentage of cycles resulting in pregnancies (%) 40.0 34.4 30.0 4 / 9 1 / 5
Outcomes per TransferNumber of transfers 46 24 13 8 3 0Percentage of transfers resulting in term, normal weight & singleton live births
e (%) 39.1 29.2 0 / 13 2 / 8 0 / 3
Percentage of transfers resulting in singleton live births (%) 43.5 33.3 2 / 13 3 / 8 0 / 3 Percentage of transfers resulting in twin live births (%) 6.5 12.5 1 / 13 0 / 8 0 / 3 Percentage of transfers resulting in live births (%) 50.0 45.8 3 / 13 3 / 8 0 / 3 Percentage of transfers resulting in pregnancies (%) 56.5 45.8 6 / 13 4 / 8 1 / 3
Frozen Embryos from Nondonor EggsNumber of cycles 40 19 10 1 1 0Number of transfers 40 19 9 1 1 0Estimated average number of transfers per retrieval 1.5 1.2 2.3 1.0 0.3 0.0Average number of embryos transferred 1.7 1.7 2.0 2.0 3.0 Percentage of embryos transferred resulting in implantation (%) 49.2 37.5 10 / 17 1 / 2 0 / 3 Percentage of transfers resulting in term, normal weight & singleton live births
e (%) 37.5 2 / 19 2 / 9 0 / 1 0 / 1
Percentage of transfers resulting in singleton live births (%) 40.0 5 / 19 3 / 9 0 / 1 0 / 1 Percentage of transfers resulting in twin live births (%) 7.5 2 / 19 3 / 9 0 / 1 0 / 1 Percentage of transfers resulting in live births (%) 50.0 7 / 19 6 / 9 0 / 1 0 / 1 Percentage of transfers resulting in pregnancies (%) 65.0 9 / 19 7 / 9 1 / 1 0 / 1
Number of Egg/Embryo Banking Cycles 4 3 1 0 1 1
Donor Eggs Fresh Embryosf Frozen Embryosf
Number of cycles 1 1Number of transfers 1 1Average number of embryos transferred 1.0 2.0Percentage of embryos transferred resulting in implantation (%) 1 / 1 0 / 2Percentage of transfers resulting in term, normal weight & singleton live births
e (%) 1 / 1 0 / 1
Percentage of transfers resulting in singleton live births (%) 1 / 1 0 / 1Percentage of transfers resulting in twin live births (%) 0 / 1 0 / 1Percentage of transfers resulting in live births (%) 1 / 1 0 / 1Percentage of transfers resulting in pregnancies (%) 1 / 1 0 / 1
CURRENT SERVICES & PROFILE Current Name: Frisco Institute for Reproductive Medicine
Donor eggs? YesDonor embryos? Yes
Gestational carriers? YesEmbryo cryopreservation? Yes
Single women? NoSART member? Yes
Verified lab accreditation? Yes(See Appendix C for details.)
a Reflects features of fresh nondonor cycles. If IVF is less than 100%, the remaining cycles are GIFT, ZIFT, or a combination of these procedures with IVF.
b Total patient diagnosis percentages may be greater than 100% because more than one diagnosis can be reported for each ART cycle.
c Fractions are used for rates with denominators less than 20. Multiple-infant births (for example, twins) with at least one live infant are counted as one live birth.
d Total cycle number includes those using frozen eggs. It excludes 0 cycle(s) evaluating new procedures. Both cycle types are excluded from ART success rates.
e In this report, births are defined as term if at least 37 full weeks gestation and normal birth weight if at least 2,500 grams (approximately 5 pounds, 8 ounces).
f All ages are reported together because previous data show that patient age does not materially affect success with donor eggs.

456
TE
XA
SADVANCED FERTILITY CENTER OF TEXAS
HOUSTON, TEXASComparison of success rates across clinics may not be meaningful. Patient medical characteristics and treatment approaches vary (see pages 11–20).
Data verified by Michael A. Allon, MD2014 ART CYCLE PROFILE
Type of ART and Procedural Factors a
IVF 100%Unstimulated 0%Used gestational carrier 2%
With ICSI 94%PGD/PGS 1%
Patient Diagnosis b
Tubal factor 13%Ovulatory dysfunction 27%Diminished ovarian reserve 24%Endometriosis 16%
Uterine factor 4%Male factor 28%Other factor 29%Unknown factor 4%
Multiple Factors: Female factors only 22%Female & male factors 19%
2014 ART SUCCESS RATES c Total number of cyclesd: 369 (includes 3 cycle[s] using frozen eggs)
Type of CycleAge of Woman
<35 35–37 38–40 41–42 43–44 >44Fresh Embryos from Nondonor Eggs
Number of cycles 61 14 18 5 1 0Percentage of cancellations before retrieval (%) 0.0 0 / 14 0 / 18 0 / 5 0 / 1 Average number of embryos transferred 2.1 2.0 2.5 Percentage of embryos transferred resulting in implantation (%) 3 / 15 1 / 2 2 / 10 Percentage of elective single embryo transfers (eSET) (%) 0 / 7 0 / 1 0 / 4
Outcomes per CyclePercentage of cycles resulting in term, normal weight & singleton live births
e (%) 3.3 1 / 14 1 / 18 0 / 5 0 / 1
Percentage of cycles resulting in singleton live births (%) 3.3 1 / 14 1 / 18 0 / 5 0 / 1 Percentage of cycles resulting in twin live births (%) 0.0 0 / 14 0 / 18 0 / 5 0 / 1 Percentage of cycles resulting in live births (%) 3.3 1 / 14 1 / 18 0 / 5 0 / 1 Percentage of cycles resulting in pregnancies (%) 4.9 1 / 14 2 / 18 0 / 5 0 / 1
Outcomes per TransferNumber of transfers 7 1 4 0 0 0Percentage of transfers resulting in term, normal weight & singleton live births
e (%) 2 / 7 1 / 1 1 / 4
Percentage of transfers resulting in singleton live births (%) 2 / 7 1 / 1 1 / 4 Percentage of transfers resulting in twin live births (%) 0 / 7 0 / 1 0 / 4 Percentage of transfers resulting in live births (%) 2 / 7 1 / 1 1 / 4 Percentage of transfers resulting in pregnancies (%) 3 / 7 1 / 1 2 / 4
Frozen Embryos from Nondonor EggsNumber of cycles 85 28 31 8 3 4Number of transfers 84 28 31 8 3 4Estimated average number of transfers per retrieval 1.4 1.4 1.0 0.5 0.5 1.0Average number of embryos transferred 2.0 2.2 2.2 2.1 2.7 2.5Percentage of embryos transferred resulting in implantation (%) 51.9 40.0 33.3 5 / 17 0 / 8 0 / 8Percentage of transfers resulting in term, normal weight & singleton live births
e (%) 17.9 21.4 32.3 3 / 8 0 / 3 0 / 4
Percentage of transfers resulting in singleton live births (%) 27.4 28.6 45.2 4 / 8 0 / 3 0 / 4Percentage of transfers resulting in twin live births (%) 23.8 21.4 6.5 0 / 8 0 / 3 0 / 4Percentage of transfers resulting in live births (%) 53.6 50.0 51.6 4 / 8 0 / 3 0 / 4Percentage of transfers resulting in pregnancies (%) 69.0 60.7 64.5 5 / 8 0 / 3 1 / 4
Number of Egg/Embryo Banking Cycles 11 14 17 14 6 4
Donor Eggs Fresh Embryosf Frozen Embryosf
Number of cycles 21 21Number of transfers 16 21Average number of embryos transferred 2.1 2.0Percentage of embryos transferred resulting in implantation (%) 63.0 33.3Percentage of transfers resulting in term, normal weight & singleton live births
e (%) 2 / 16 14.3
Percentage of transfers resulting in singleton live births (%) 3 / 16 23.8Percentage of transfers resulting in twin live births (%) 7 / 16 14.3Percentage of transfers resulting in live births (%) 10 / 16 38.1Percentage of transfers resulting in pregnancies (%) 13 / 16 47.6
CURRENT SERVICES & PROFILE Current Name: Advanced Fertility Center of Texas
Donor eggs? YesDonor embryos? No
Gestational carriers? YesEmbryo cryopreservation? Yes
Single women? YesSART member? Yes
Verified lab accreditation? Yes(See Appendix C for details.)
a Reflects features of fresh nondonor cycles. If IVF is less than 100%, the remaining cycles are GIFT, ZIFT, or a combination of these procedures with IVF.
b Total patient diagnosis percentages may be greater than 100% because more than one diagnosis can be reported for each ART cycle.
c Fractions are used for rates with denominators less than 20. Multiple-infant births (for example, twins) with at least one live infant are counted as one live birth.
d Total cycle number includes those using frozen eggs. It excludes 0 cycle(s) evaluating new procedures. Both cycle types are excluded from ART success rates.
e In this report, births are defined as term if at least 37 full weeks gestation and normal birth weight if at least 2,500 grams (approximately 5 pounds, 8 ounces).
f All ages are reported together because previous data show that patient age does not materially affect success with donor eggs.

457
TE
XA
SBAYLOR FAMILY FERTILITY PROGRAM
HOUSTON, TEXASComparison of success rates across clinics may not be meaningful. Patient medical characteristics and treatment approaches vary (see pages 11–20).
Data verified by William E. Gibbons, MD2014 ART CYCLE PROFILE
Type of ART and Procedural Factors a
IVF 100%Unstimulated 2%Used gestational carrier <1%
With ICSI 66%PGD/PGS 0%
Patient Diagnosis b
Tubal factor 10%Ovulatory dysfunction 25%Diminished ovarian reserve 32%Endometriosis 2%
Uterine factor 3%Male factor 33%Other factor 12%Unknown factor 5%
Multiple Factors: Female factors only 6%Female & male factors 14%
2014 ART SUCCESS RATES c Total number of cyclesd: 284 (includes 2 cycle[s] using frozen eggs)
Type of CycleAge of Woman
<35 35–37 38–40 41–42 43–44 >44Fresh Embryos from Nondonor Eggs
Number of cycles 52 15 21 9 4 1Percentage of cancellations before retrieval (%) 13.5 2 / 15 38.1 3 / 9 0 / 4 0 / 1Average number of embryos transferred 1.3 2.0 2.5 3.3 2.8 3.0Percentage of embryos transferred resulting in implantation (%) 43.8 5 / 18 3.6 0 / 13 1 / 11 0 / 3Percentage of elective single embryo transfers (eSET) (%) 68.6 2 / 9 0 / 10 0 / 3 0 / 4 0 / 1
Outcomes per CyclePercentage of cycles resulting in term, normal weight & singleton live births
e (%) 21.2 2 / 15 0.0 0 / 9 0 / 4 0 / 1
Percentage of cycles resulting in singleton live births (%) 28.8 2 / 15 0.0 0 / 9 1 / 4 0 / 1Percentage of cycles resulting in twin live births (%) 3.8 1 / 15 0.0 0 / 9 0 / 4 0 / 1Percentage of cycles resulting in live births (%) 32.7 3 / 15 0.0 0 / 9 1 / 4 0 / 1Percentage of cycles resulting in pregnancies (%) 36.5 4 / 15 4.8 0 / 9 1 / 4 0 / 1
Outcomes per TransferNumber of transfers 37 9 11 4 4 1Percentage of transfers resulting in term, normal weight & singleton live births
e (%) 29.7 2 / 9 0 / 11 0 / 4 0 / 4 0 / 1
Percentage of transfers resulting in singleton live births (%) 40.5 2 / 9 0 / 11 0 / 4 1 / 4 0 / 1Percentage of transfers resulting in twin live births (%) 5.4 1 / 9 0 / 11 0 / 4 0 / 4 0 / 1Percentage of transfers resulting in live births (%) 45.9 3 / 9 0 / 11 0 / 4 1 / 4 0 / 1Percentage of transfers resulting in pregnancies (%) 51.4 4 / 9 1 / 11 0 / 4 1 / 4 0 / 1
Frozen Embryos from Nondonor EggsNumber of cycles 66 14 18 6 4 0Number of transfers 58 14 13 6 3 0Estimated average number of transfers per retrieval 1.2 1.2 0.9 1.0 1.5 0.0Average number of embryos transferred 1.5 1.8 1.8 2.5 2.7 Percentage of embryos transferred resulting in implantation (%) 32.9 28.0 31.8 4 / 15 1 / 8 Percentage of transfers resulting in term, normal weight & singleton live births
e (%) 25.9 4 / 14 2 / 13 3 / 6 0 / 3
Percentage of transfers resulting in singleton live births (%) 27.6 6 / 14 2 / 13 3 / 6 0 / 3 Percentage of transfers resulting in twin live births (%) 6.9 0 / 14 1 / 13 0 / 6 0 / 3 Percentage of transfers resulting in live births (%) 34.5 6 / 14 3 / 13 3 / 6 0 / 3 Percentage of transfers resulting in pregnancies (%) 41.4 7 / 14 6 / 13 4 / 6 1 / 3
Number of Egg/Embryo Banking Cycles 32 10 11 4 2 1
Donor Eggs Fresh Embryosf Frozen Embryosf
Number of cycles 3 9Number of transfers 2 9Average number of embryos transferred 1.0 1.7Percentage of embryos transferred resulting in implantation (%) 1 / 2 1 / 15Percentage of transfers resulting in term, normal weight & singleton live births
e (%) 1 / 2 0 / 9
Percentage of transfers resulting in singleton live births (%) 1 / 2 0 / 9Percentage of transfers resulting in twin live births (%) 0 / 2 0 / 9Percentage of transfers resulting in live births (%) 1 / 2 0 / 9Percentage of transfers resulting in pregnancies (%) 1 / 2 1 / 9
CURRENT SERVICES & PROFILE Current Name: Family Fertility Center
Donor eggs? YesDonor embryos? Yes
Gestational carriers? YesEmbryo cryopreservation? Yes
Single women? YesSART member? Yes
Verified lab accreditation? Yes(See Appendix C for details.)
a Reflects features of fresh nondonor cycles. If IVF is less than 100%, the remaining cycles are GIFT, ZIFT, or a combination of these procedures with IVF.
b Total patient diagnosis percentages may be greater than 100% because more than one diagnosis can be reported for each ART cycle.
c Fractions are used for rates with denominators less than 20. Multiple-infant births (for example, twins) with at least one live infant are counted as one live birth.
d Total cycle number includes those using frozen eggs. It excludes 0 cycle(s) evaluating new procedures. Both cycle types are excluded from ART success rates.
e In this report, births are defined as term if at least 37 full weeks gestation and normal birth weight if at least 2,500 grams (approximately 5 pounds, 8 ounces).
f All ages are reported together because previous data show that patient age does not materially affect success with donor eggs.

458
TE
XA
SCOOPER INSTITUTE FOR ADVANCED REPRODUCTIVE MEDICINE
HOUSTON, TEXASComparison of success rates across clinics may not be meaningful. Patient medical characteristics and treatment approaches vary (see pages 11–20).
Data verified by C. James Chuong, MD2014 ART CYCLE PROFILE
Type of ART and Procedural Factors a
IVF 100%Unstimulated 0%Used gestational carrier 1%
With ICSI 53%PGD/PGS 6%
Patient Diagnosis b
Tubal factor 27%Ovulatory dysfunction 11%Diminished ovarian reserve 35%Endometriosis 3%
Uterine factor 21%Male factor 45%Other factor 13%Unknown factor <1%
Multiple Factors: Female factors only 17%Female & male factors 31%
2014 ART SUCCESS RATES c Total number of cyclesd: 169 (includes 0 cycle[s] using frozen eggs)
Type of CycleAge of Woman
<35 35–37 38–40 41–42 43–44 >44Fresh Embryos from Nondonor Eggs
Number of cycles 39 16 22 9 6 4Percentage of cancellations before retrieval (%) 7.7 2 / 16 9.1 1 / 9 3 / 6 2 / 4Average number of embryos transferred 2.5 2.4 3.1 3.3 3.5 4.0Percentage of embryos transferred resulting in implantation (%) 49.2 26.9 21.2 5.0 0 / 7 0 / 4Percentage of elective single embryo transfers (eSET) (%) 0.0 0 / 8 0 / 17 0 / 6 0 / 2 0 / 1
Outcomes per CyclePercentage of cycles resulting in term, normal weight & singleton live births
e (%) 10.3 0 / 16 18.2 1 / 9 0 / 6 0 / 4
Percentage of cycles resulting in singleton live births (%) 12.8 3 / 16 22.7 1 / 9 0 / 6 0 / 4Percentage of cycles resulting in twin live births (%) 20.5 2 / 16 4.5 0 / 9 0 / 6 0 / 4Percentage of cycles resulting in live births (%) 35.9 5 / 16 27.3 1 / 9 0 / 6 0 / 4Percentage of cycles resulting in pregnancies (%) 41.0 5 / 16 36.4 1 / 9 0 / 6 0 / 4
Outcomes per TransferNumber of transfers 24 11 18 6 2 1Percentage of transfers resulting in term, normal weight & singleton live births
e (%) 16.7 0 / 11 4 / 18 1 / 6 0 / 2 0 / 1
Percentage of transfers resulting in singleton live births (%) 20.8 3 / 11 5 / 18 1 / 6 0 / 2 0 / 1Percentage of transfers resulting in twin live births (%) 33.3 2 / 11 1 / 18 0 / 6 0 / 2 0 / 1Percentage of transfers resulting in live births (%) 58.3 5 / 11 6 / 18 1 / 6 0 / 2 0 / 1Percentage of transfers resulting in pregnancies (%) 66.7 5 / 11 8 / 18 1 / 6 0 / 2 0 / 1
Frozen Embryos from Nondonor EggsNumber of cycles 18 8 2 3 1 1Number of transfers 18 7 2 3 1 1Estimated average number of transfers per retrieval 1.6 2.3 2.0 3.0 0.5Average number of embryos transferred 2.6 2.3 3.5 2.7 4.0 4.0Percentage of embryos transferred resulting in implantation (%) 54.3 4 / 16 1 / 4 1 / 8 1 / 4 0 / 4Percentage of transfers resulting in term, normal weight & singleton live births
e (%) 7 / 18 1 / 7 1 / 2 1 / 3 0 / 1 0 / 1
Percentage of transfers resulting in singleton live births (%) 8 / 18 1 / 7 1 / 2 1 / 3 1 / 1 0 / 1Percentage of transfers resulting in twin live births (%) 5 / 18 1 / 7 0 / 2 0 / 3 0 / 1 0 / 1Percentage of transfers resulting in live births (%) 13 / 18 2 / 7 1 / 2 1 / 3 1 / 1 0 / 1Percentage of transfers resulting in pregnancies (%) 15 / 18 2 / 7 2 / 2 1 / 3 1 / 1 0 / 1
Number of Egg/Embryo Banking Cycles 0 0 0 0 0 1
Donor Eggs Fresh Embryosf Frozen Embryosf
Number of cycles 19 20Number of transfers 14 17Average number of embryos transferred 2.3 2.7Percentage of embryos transferred resulting in implantation (%) 28.1 21.7Percentage of transfers resulting in term, normal weight & singleton live births
e (%) 6 / 14 3 / 17
Percentage of transfers resulting in singleton live births (%) 6 / 14 4 / 17Percentage of transfers resulting in twin live births (%) 1 / 14 1 / 17Percentage of transfers resulting in live births (%) 7 / 14 6 / 17Percentage of transfers resulting in pregnancies (%) 7 / 14 7 / 17
CURRENT SERVICES & PROFILE Current Name: Cooper Institute for Advanced Reproductive Medicine
Donor eggs? YesDonor embryos? Yes
Gestational carriers? YesEmbryo cryopreservation? Yes
Single women? YesSART member? No
Verified lab accreditation? No(See Appendix C for details.)
a Reflects features of fresh nondonor cycles. If IVF is less than 100%, the remaining cycles are GIFT, ZIFT, or a combination of these procedures with IVF.
b Total patient diagnosis percentages may be greater than 100% because more than one diagnosis can be reported for each ART cycle.
c Fractions are used for rates with denominators less than 20. Multiple-infant births (for example, twins) with at least one live infant are counted as one live birth.
d Total cycle number includes those using frozen eggs. It excludes 0 cycle(s) evaluating new procedures. Both cycle types are excluded from ART success rates.
e In this report, births are defined as term if at least 37 full weeks gestation and normal birth weight if at least 2,500 grams (approximately 5 pounds, 8 ounces).
f All ages are reported together because previous data show that patient age does not materially affect success with donor eggs.

459
TE
XA
SFERTILITY SPECIALISTS OF HOUSTON
HOUSTON, TEXASComparison of success rates across clinics may not be meaningful. Patient medical characteristics and treatment approaches vary (see pages 11–20).
Data verified by George M. Grunert, MD2014 ART CYCLE PROFILE
Type of ART and Procedural Factors a
IVF 100%Unstimulated 0%Used gestational carrier <1%
With ICSI 74%PGD/PGS 2%
Patient Diagnosis b
Tubal factor 16%Ovulatory dysfunction 22%Diminished ovarian reserve 37%Endometriosis 13%
Uterine factor 7%Male factor 32%Other factor 26%Unknown factor 14%
Multiple Factors: Female factors only 25%Female & male factors 24%
2014 ART SUCCESS RATES c Total number of cyclesd: 1,200 (includes 10 cycle[s] using frozen eggs)
Type of CycleAge of Woman
<35 35–37 38–40 41–42 43–44 >44Fresh Embryos from Nondonor Eggs
Number of cycles 104 54 36 20 13 2Percentage of cancellations before retrieval (%) 8.7 24.1 30.6 35.0 6 / 13 0 / 2Average number of embryos transferred 1.4 1.7 2.0 1.8 1.0 2.0Percentage of embryos transferred resulting in implantation (%) 38.9 18.6 2 / 16 0 / 11 0 / 1 0 / 2Percentage of elective single embryo transfers (eSET) (%) 59.4 18.2 0 / 8 0 / 4 1 / 1 0 / 1
Outcomes per CyclePercentage of cycles resulting in term, normal weight & singleton live births
e (%) 19.2 5.6 2.8 0.0 0 / 13 0 / 2
Percentage of cycles resulting in singleton live births (%) 23.1 7.4 5.6 0.0 0 / 13 0 / 2Percentage of cycles resulting in twin live births (%) 3.8 1.9 0.0 0.0 0 / 13 0 / 2Percentage of cycles resulting in live births (%) 27.9 9.3 5.6 0.0 0 / 13 0 / 2Percentage of cycles resulting in pregnancies (%) 31.7 13.0 5.6 0.0 0 / 13 0 / 2
Outcomes per TransferNumber of transfers 72 25 8 6 1 1Percentage of transfers resulting in term, normal weight & singleton live births
e (%) 27.8 12.0 1 / 8 0 / 6 0 / 1 0 / 1
Percentage of transfers resulting in singleton live births (%) 33.3 16.0 2 / 8 0 / 6 0 / 1 0 / 1Percentage of transfers resulting in twin live births (%) 5.6 4.0 0 / 8 0 / 6 0 / 1 0 / 1Percentage of transfers resulting in live births (%) 40.3 20.0 2 / 8 0 / 6 0 / 1 0 / 1Percentage of transfers resulting in pregnancies (%) 45.8 28.0 2 / 8 0 / 6 0 / 1 0 / 1
Frozen Embryos from Nondonor EggsNumber of cycles 218 123 75 36 8 3Number of transfers 197 101 67 31 6 2Estimated average number of transfers per retrieval 1.3 1.0 0.7 0.5 0.3 0.1Average number of embryos transferred 1.2 1.3 1.2 1.1 1.3 1.0Percentage of embryos transferred resulting in implantation (%) 44.6 41.5 34.3 40.0 1 / 6 0 / 2Percentage of transfers resulting in term, normal weight & singleton live births
e (%) 29.9 29.7 23.9 19.4 1 / 6 0 / 2
Percentage of transfers resulting in singleton live births (%) 37.1 38.6 29.9 29.0 1 / 6 0 / 2Percentage of transfers resulting in twin live births (%) 3.0 4.0 0.0 3.2 0 / 6 0 / 2Percentage of transfers resulting in live births (%) 40.1 42.6 29.9 32.3 1 / 6 0 / 2Percentage of transfers resulting in pregnancies (%) 51.8 54.5 43.3 41.9 2 / 6 0 / 2
Number of Egg/Embryo Banking Cycles 129 87 89 58 24 16
Donor Eggs Fresh Embryosf Frozen Embryosf
Number of cycles 23 72Number of transfers 21 63Average number of embryos transferred 1.3 1.4Percentage of embryos transferred resulting in implantation (%) 44.4 44.0Percentage of transfers resulting in term, normal weight & singleton live births
e (%) 33.3 23.8
Percentage of transfers resulting in singleton live births (%) 47.6 42.9Percentage of transfers resulting in twin live births (%) 4.8 1.6Percentage of transfers resulting in live births (%) 52.4 44.4Percentage of transfers resulting in pregnancies (%) 52.4 61.9
CURRENT SERVICES & PROFILE Current Name: Houston Fertility Specialists
Donor eggs? YesDonor embryos? Yes
Gestational carriers? YesEmbryo cryopreservation? Yes
Single women? YesSART member? Yes
Verified lab accreditation? Yes(See Appendix C for details.)
a Reflects features of fresh nondonor cycles. If IVF is less than 100%, the remaining cycles are GIFT, ZIFT, or a combination of these procedures with IVF.
b Total patient diagnosis percentages may be greater than 100% because more than one diagnosis can be reported for each ART cycle.
c Fractions are used for rates with denominators less than 20. Multiple-infant births (for example, twins) with at least one live infant are counted as one live birth.
d Total cycle number includes those using frozen eggs. It excludes 0 cycle(s) evaluating new procedures. Both cycle types are excluded from ART success rates.
e In this report, births are defined as term if at least 37 full weeks gestation and normal birth weight if at least 2,500 grams (approximately 5 pounds, 8 ounces).
f All ages are reported together because previous data show that patient age does not materially affect success with donor eggs.

460
TE
XA
STHE HEARD CLINICHOUSTON, TEXAS
Comparison of success rates across clinics may not be meaningful. Patient medical characteristics and treatment approaches vary (see pages 11–20).
Data verified by Michael Heard, MD2014 ART CYCLE PROFILE
Type of ART and Procedural Factors a
IVF 100%Unstimulated 0%Used gestational carrier 6%
With ICSI 83%PGD/PGS 22%
Patient Diagnosis b
Tubal factor 10%Ovulatory dysfunction 38%Diminished ovarian reserve 3%Endometriosis 10%
Uterine factor 13%Male factor 35%Other factor 15%Unknown factor 8%
Multiple Factors: Female factors only 3%Female & male factors 23%
2014 ART SUCCESS RATES c Total number of cyclesd: 47 (includes 0 cycle[s] using frozen eggs)
Type of CycleAge of Woman
<35 35–37 38–40 41–42 43–44 >44Fresh Embryos from Nondonor Eggs
Number of cycles 6 6 1 2 2 1Percentage of cancellations before retrieval (%) 0 / 6 0 / 6 0 / 1 0 / 2 0 / 2 1 / 1Average number of embryos transferred 3.2 2.4 2.0 3.0 Percentage of embryos transferred resulting in implantation (%) 2 / 16 0 / 10 0 / 2 0 / 3 Percentage of elective single embryo transfers (eSET) (%) 0 / 5 0 / 4 0 / 1 0 / 1
Outcomes per CyclePercentage of cycles resulting in term, normal weight & singleton live births
e (%) 0 / 6 0 / 6 0 / 1 0 / 2 0 / 2 0 / 1
Percentage of cycles resulting in singleton live births (%) 2 / 6 0 / 6 0 / 1 0 / 2 0 / 2 0 / 1Percentage of cycles resulting in twin live births (%) 0 / 6 0 / 6 0 / 1 0 / 2 0 / 2 0 / 1Percentage of cycles resulting in live births (%) 2 / 6 0 / 6 0 / 1 0 / 2 0 / 2 0 / 1Percentage of cycles resulting in pregnancies (%) 2 / 6 1 / 6 0 / 1 0 / 2 0 / 2 0 / 1
Outcomes per TransferNumber of transfers 5 5 1 1 0 0Percentage of transfers resulting in term, normal weight & singleton live births
e (%) 0 / 5 0 / 5 0 / 1 0 / 1
Percentage of transfers resulting in singleton live births (%) 2 / 5 0 / 5 0 / 1 0 / 1 Percentage of transfers resulting in twin live births (%) 0 / 5 0 / 5 0 / 1 0 / 1 Percentage of transfers resulting in live births (%) 2 / 5 0 / 5 0 / 1 0 / 1 Percentage of transfers resulting in pregnancies (%) 2 / 5 1 / 5 0 / 1 0 / 1
Frozen Embryos from Nondonor EggsNumber of cycles 7 4 2 1 1 0Number of transfers 7 4 2 1 1 0Estimated average number of transfers per retrieval 1.4 2.0 1.0 1.0 0.5 Average number of embryos transferred 1.9 1.5 2.0 3.0 1.0 Percentage of embryos transferred resulting in implantation (%) 4 / 13 0 / 6 1 / 4 0 / 3 Percentage of transfers resulting in term, normal weight & singleton live births
e (%) 2 / 7 0 / 4 0 / 2 0 / 1 0 / 1
Percentage of transfers resulting in singleton live births (%) 3 / 7 0 / 4 1 / 2 0 / 1 0 / 1 Percentage of transfers resulting in twin live births (%) 0 / 7 0 / 4 0 / 2 0 / 1 0 / 1 Percentage of transfers resulting in live births (%) 3 / 7 0 / 4 1 / 2 0 / 1 0 / 1 Percentage of transfers resulting in pregnancies (%) 3 / 7 0 / 4 1 / 2 0 / 1 0 / 1
Number of Egg/Embryo Banking Cycles 4 0 2 0 1 0
Donor Eggs Fresh Embryosf Frozen Embryosf
Number of cycles 2 5Number of transfers 2 5Average number of embryos transferred 2.0 1.4Percentage of embryos transferred resulting in implantation (%) 4 / 4 1 / 7Percentage of transfers resulting in term, normal weight & singleton live births
e (%) 1 / 2 0 / 5
Percentage of transfers resulting in singleton live births (%) 1 / 2 1 / 5Percentage of transfers resulting in twin live births (%) 1 / 2 0 / 5Percentage of transfers resulting in live births (%) 2 / 2 1 / 5Percentage of transfers resulting in pregnancies (%) 2 / 2 1 / 5
CURRENT SERVICES & PROFILE Current Name: The Heard Clinic
Donor eggs? YesDonor embryos? Yes
Gestational carriers? YesEmbryo cryopreservation? Yes
Single women? YesSART member? No
Verified lab accreditation? Yes(See Appendix C for details.)
a Reflects features of fresh nondonor cycles. If IVF is less than 100%, the remaining cycles are GIFT, ZIFT, or a combination of these procedures with IVF.
b Total patient diagnosis percentages may be greater than 100% because more than one diagnosis can be reported for each ART cycle.
c Fractions are used for rates with denominators less than 20. Multiple-infant births (for example, twins) with at least one live infant are counted as one live birth.
d Total cycle number includes those using frozen eggs. It excludes 0 cycle(s) evaluating new procedures. Both cycle types are excluded from ART success rates.
e In this report, births are defined as term if at least 37 full weeks gestation and normal birth weight if at least 2,500 grams (approximately 5 pounds, 8 ounces).
f All ages are reported together because previous data show that patient age does not materially affect success with donor eggs.
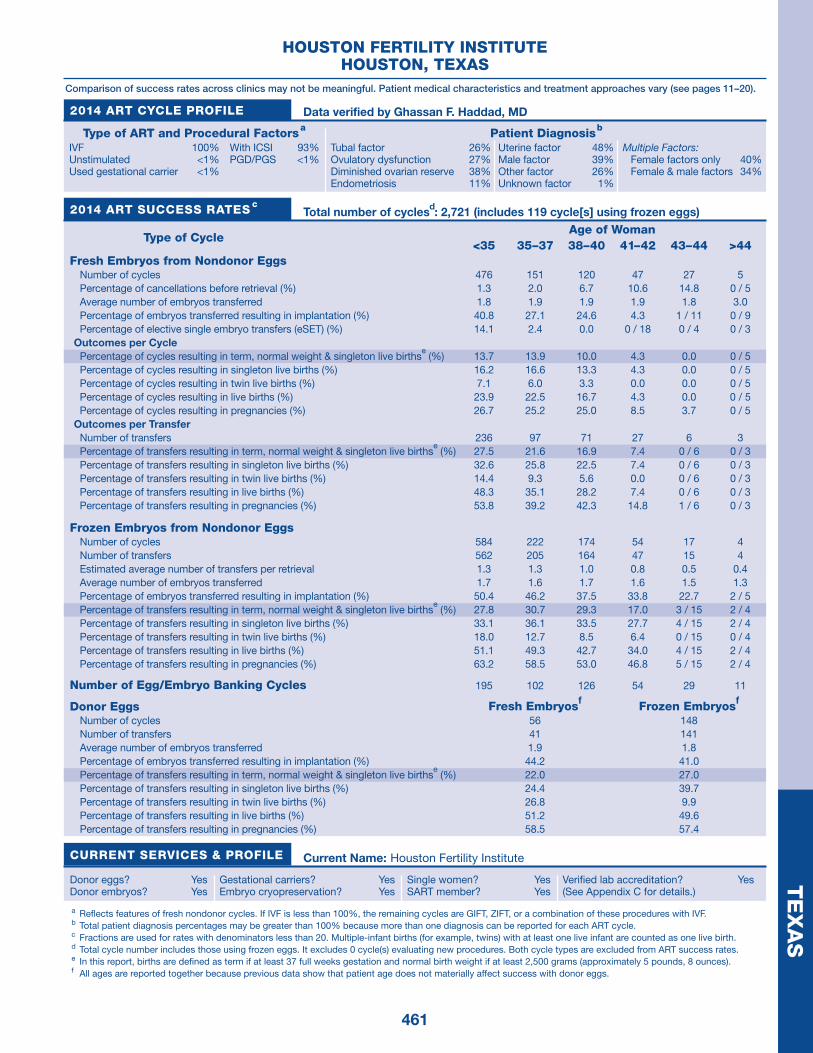
461
TE
XA
SHOUSTON FERTILITY INSTITUTE
HOUSTON, TEXASComparison of success rates across clinics may not be meaningful. Patient medical characteristics and treatment approaches vary (see pages 11–20).
Data verified by Ghassan F. Haddad, MD2014 ART CYCLE PROFILE
Type of ART and Procedural Factors a
IVF 100%Unstimulated <1%Used gestational carrier <1%
With ICSI 93%PGD/PGS <1%
Patient Diagnosis b
Tubal factor 26%Ovulatory dysfunction 27%Diminished ovarian reserve 38%Endometriosis 11%
Uterine factor 48%Male factor 39%Other factor 26%Unknown factor 1%
Multiple Factors: Female factors only 40%Female & male factors 34%
2014 ART SUCCESS RATES c Total number of cyclesd: 2,721 (includes 119 cycle[s] using frozen eggs)
Type of CycleAge of Woman
<35 35–37 38–40 41–42 43–44 >44Fresh Embryos from Nondonor Eggs
Number of cycles 476 151 120 47 27 5Percentage of cancellations before retrieval (%) 1.3 2.0 6.7 10.6 14.8 0 / 5Average number of embryos transferred 1.8 1.9 1.9 1.9 1.8 3.0Percentage of embryos transferred resulting in implantation (%) 40.8 27.1 24.6 4.3 1 / 11 0 / 9Percentage of elective single embryo transfers (eSET) (%) 14.1 2.4 0.0 0 / 18 0 / 4 0 / 3
Outcomes per CyclePercentage of cycles resulting in term, normal weight & singleton live births
e (%) 13.7 13.9 10.0 4.3 0.0 0 / 5
Percentage of cycles resulting in singleton live births (%) 16.2 16.6 13.3 4.3 0.0 0 / 5Percentage of cycles resulting in twin live births (%) 7.1 6.0 3.3 0.0 0.0 0 / 5Percentage of cycles resulting in live births (%) 23.9 22.5 16.7 4.3 0.0 0 / 5Percentage of cycles resulting in pregnancies (%) 26.7 25.2 25.0 8.5 3.7 0 / 5
Outcomes per TransferNumber of transfers 236 97 71 27 6 3Percentage of transfers resulting in term, normal weight & singleton live births
e (%) 27.5 21.6 16.9 7.4 0 / 6 0 / 3
Percentage of transfers resulting in singleton live births (%) 32.6 25.8 22.5 7.4 0 / 6 0 / 3Percentage of transfers resulting in twin live births (%) 14.4 9.3 5.6 0.0 0 / 6 0 / 3Percentage of transfers resulting in live births (%) 48.3 35.1 28.2 7.4 0 / 6 0 / 3Percentage of transfers resulting in pregnancies (%) 53.8 39.2 42.3 14.8 1 / 6 0 / 3
Frozen Embryos from Nondonor EggsNumber of cycles 584 222 174 54 17 4Number of transfers 562 205 164 47 15 4Estimated average number of transfers per retrieval 1.3 1.3 1.0 0.8 0.5 0.4Average number of embryos transferred 1.7 1.6 1.7 1.6 1.5 1.3Percentage of embryos transferred resulting in implantation (%) 50.4 46.2 37.5 33.8 22.7 2 / 5Percentage of transfers resulting in term, normal weight & singleton live births
e (%) 27.8 30.7 29.3 17.0 3 / 15 2 / 4
Percentage of transfers resulting in singleton live births (%) 33.1 36.1 33.5 27.7 4 / 15 2 / 4Percentage of transfers resulting in twin live births (%) 18.0 12.7 8.5 6.4 0 / 15 0 / 4Percentage of transfers resulting in live births (%) 51.1 49.3 42.7 34.0 4 / 15 2 / 4Percentage of transfers resulting in pregnancies (%) 63.2 58.5 53.0 46.8 5 / 15 2 / 4
Number of Egg/Embryo Banking Cycles 195 102 126 54 29 11
Donor Eggs Fresh Embryosf Frozen Embryosf
Number of cycles 56 148Number of transfers 41 141Average number of embryos transferred 1.9 1.8Percentage of embryos transferred resulting in implantation (%) 44.2 41.0Percentage of transfers resulting in term, normal weight & singleton live births
e (%) 22.0 27.0
Percentage of transfers resulting in singleton live births (%) 24.4 39.7Percentage of transfers resulting in twin live births (%) 26.8 9.9Percentage of transfers resulting in live births (%) 51.2 49.6Percentage of transfers resulting in pregnancies (%) 58.5 57.4
CURRENT SERVICES & PROFILE Current Name: Houston Fertility Institute
Donor eggs? YesDonor embryos? Yes
Gestational carriers? YesEmbryo cryopreservation? Yes
Single women? YesSART member? Yes
Verified lab accreditation? Yes(See Appendix C for details.)
a Reflects features of fresh nondonor cycles. If IVF is less than 100%, the remaining cycles are GIFT, ZIFT, or a combination of these procedures with IVF.
b Total patient diagnosis percentages may be greater than 100% because more than one diagnosis can be reported for each ART cycle.
c Fractions are used for rates with denominators less than 20. Multiple-infant births (for example, twins) with at least one live infant are counted as one live birth.
d Total cycle number includes those using frozen eggs. It excludes 0 cycle(s) evaluating new procedures. Both cycle types are excluded from ART success rates.
e In this report, births are defined as term if at least 37 full weeks gestation and normal birth weight if at least 2,500 grams (approximately 5 pounds, 8 ounces).
f All ages are reported together because previous data show that patient age does not materially affect success with donor eggs.

462
TE
XA
SHOUSTON INFERTILITY CLINIC
SONJA KRISTIANSEN, MDHOUSTON, TEXAS
Comparison of success rates across clinics may not be meaningful. Patient medical characteristics and treatment approaches vary (see pages 11–20).
Data verified by Sonja B. Kristiansen, MD2014 ART CYCLE PROFILE
Type of ART and Procedural Factors a
IVF 100%Unstimulated 0%Used gestational carrier 0%
With ICSI 82%PGD/PGS 6%
Patient Diagnosis b
Tubal factor 21%Ovulatory dysfunction <1%Diminished ovarian reserve 19%Endometriosis <1%
Uterine factor 0%Male factor 38%Other factor 12%Unknown factor 18%
Multiple Factors: Female factors only 2%Female & male factors 8%
2014 ART SUCCESS RATES c Total number of cyclesd: 119 (includes 0 cycle[s] using frozen eggs)
Type of CycleAge of Woman
<35 35–37 38–40 41–42 43–44 >44Fresh Embryos from Nondonor Eggs
Number of cycles 40 17 11 9 5 3Percentage of cancellations before retrieval (%) 0.0 0 / 17 1 / 11 1 / 9 1 / 5 1 / 3Average number of embryos transferred 2.4 2.6 2.8 2.3 2.5 3.0Percentage of embryos transferred resulting in implantation (%) 27.3 16.7 20.0 2 / 14 0 / 10 0 / 6Percentage of elective single embryo transfers (eSET) (%) 0.0 0 / 15 0 / 8 0 / 5 0 / 2 0 / 2
Outcomes per CyclePercentage of cycles resulting in term, normal weight & singleton live births
e (%) 40.0 7 / 17 2 / 11 2 / 9 0 / 5 0 / 3
Percentage of cycles resulting in singleton live births (%) 40.0 7 / 17 2 / 11 2 / 9 0 / 5 0 / 3Percentage of cycles resulting in twin live births (%) 10.0 0 / 17 0 / 11 0 / 9 0 / 5 0 / 3Percentage of cycles resulting in live births (%) 50.0 7 / 17 3 / 11 2 / 9 0 / 5 0 / 3Percentage of cycles resulting in pregnancies (%) 50.0 7 / 17 3 / 11 2 / 9 0 / 5 0 / 3
Outcomes per TransferNumber of transfers 37 16 9 6 4 2Percentage of transfers resulting in term, normal weight & singleton live births
e (%) 43.2 7 / 16 2 / 9 2 / 6 0 / 4 0 / 2
Percentage of transfers resulting in singleton live births (%) 43.2 7 / 16 2 / 9 2 / 6 0 / 4 0 / 2Percentage of transfers resulting in twin live births (%) 10.8 0 / 16 0 / 9 0 / 6 0 / 4 0 / 2Percentage of transfers resulting in live births (%) 54.1 7 / 16 3 / 9 2 / 6 0 / 4 0 / 2Percentage of transfers resulting in pregnancies (%) 54.1 7 / 16 3 / 9 2 / 6 0 / 4 0 / 2
Frozen Embryos from Nondonor EggsNumber of cycles 9 5 2 3 0 0Number of transfers 8 5 2 3 0 0Estimated average number of transfers per retrieval 1.6 1.0 3.0 0.0 Average number of embryos transferred 2.3 2.4 2.0 2.3 Percentage of embryos transferred resulting in implantation (%) 2 / 18 3 / 12 2 / 4 2 / 7 Percentage of transfers resulting in term, normal weight & singleton live births
e (%) 1 / 8 1 / 5 2 / 2 2 / 3
Percentage of transfers resulting in singleton live births (%) 1 / 8 1 / 5 2 / 2 2 / 3 Percentage of transfers resulting in twin live births (%) 0 / 8 1 / 5 0 / 2 0 / 3 Percentage of transfers resulting in live births (%) 1 / 8 2 / 5 2 / 2 2 / 3 Percentage of transfers resulting in pregnancies (%) 1 / 8 2 / 5 2 / 2 2 / 3
Number of Egg/Embryo Banking Cycles 1 3 0 1 1 0
Donor Eggs Fresh Embryosf Frozen Embryosf
Number of cycles 5 4Number of transfers 5 4Average number of embryos transferred 2.4 2.3Percentage of embryos transferred resulting in implantation (%) 6 / 12 2 / 7Percentage of transfers resulting in term, normal weight & singleton live births
e (%) 1 / 5 2 / 4
Percentage of transfers resulting in singleton live births (%) 2 / 5 2 / 4Percentage of transfers resulting in twin live births (%) 2 / 5 0 / 4Percentage of transfers resulting in live births (%) 4 / 5 2 / 4Percentage of transfers resulting in pregnancies (%) 4 / 5 3 / 4
CURRENT SERVICES & PROFILE Current Name: Houston Infertility Clinic, Sonja Kristiansen, MD
Donor eggs? YesDonor embryos? Yes
Gestational carriers? YesEmbryo cryopreservation? Yes
Single women? YesSART member? Yes
Verified lab accreditation? Yes(See Appendix C for details.)
a Reflects features of fresh nondonor cycles. If IVF is less than 100%, the remaining cycles are GIFT, ZIFT, or a combination of these procedures with IVF.
b Total patient diagnosis percentages may be greater than 100% because more than one diagnosis can be reported for each ART cycle.
c Fractions are used for rates with denominators less than 20. Multiple-infant births (for example, twins) with at least one live infant are counted as one live birth.
d Total cycle number includes those using frozen eggs. It excludes 0 cycle(s) evaluating new procedures. Both cycle types are excluded from ART success rates.
e In this report, births are defined as term if at least 37 full weeks gestation and normal birth weight if at least 2,500 grams (approximately 5 pounds, 8 ounces).
f All ages are reported together because previous data show that patient age does not materially affect success with donor eggs.

463
TE
XA
SHOUSTON IVF
HOUSTON, TEXASComparison of success rates across clinics may not be meaningful. Patient medical characteristics and treatment approaches vary (see pages 11–20).
Data verified by Timothy N. Hickman, MD2014 ART CYCLE PROFILE
Type of ART and Procedural Factors a
IVF 100%Unstimulated 0%Used gestational carrier 2%
With ICSI 92%PGD/PGS 1%
Patient Diagnosis b
Tubal factor 8%Ovulatory dysfunction 12%Diminished ovarian reserve 43%Endometriosis 5%
Uterine factor 5%Male factor 24%Other factor 11%Unknown factor 13%
Multiple Factors: Female factors only 11%Female & male factors 8%
2014 ART SUCCESS RATES c Total number of cyclesd: 730 (includes 7 cycle[s] using frozen eggs)
Type of CycleAge of Woman
<35 35–37 38–40 41–42 43–44 >44Fresh Embryos from Nondonor Eggs
Number of cycles 157 68 75 47 27 2Percentage of cancellations before retrieval (%) 3.2 0.0 5.3 10.6 22.2 0 / 2Average number of embryos transferred 2.0 2.0 2.7 3.0 2.6 2.0Percentage of embryos transferred resulting in implantation (%) 40.0 39.5 19.9 12.6 6.8 0 / 2Percentage of elective single embryo transfers (eSET) (%) 7.0 4.8 1.7 0.0 0 / 13 0 / 1
Outcomes per CyclePercentage of cycles resulting in term, normal weight & singleton live births
e (%) 26.8 22.1 18.7 6.4 3.7 0 / 2
Percentage of cycles resulting in singleton live births (%) 32.5 29.4 25.3 8.5 3.7 0 / 2Percentage of cycles resulting in twin live births (%) 15.3 17.6 6.7 4.3 0.0 0 / 2Percentage of cycles resulting in live births (%) 48.4 48.5 32.0 14.9 3.7 0 / 2Percentage of cycles resulting in pregnancies (%) 56.1 54.4 38.7 23.4 11.1 0 / 2
Outcomes per TransferNumber of transfers 148 67 65 35 17 1Percentage of transfers resulting in term, normal weight & singleton live births
e (%) 28.4 22.4 21.5 8.6 1 / 17 0 / 1
Percentage of transfers resulting in singleton live births (%) 34.5 29.9 29.2 11.4 1 / 17 0 / 1Percentage of transfers resulting in twin live births (%) 16.2 17.9 7.7 5.7 0 / 17 0 / 1Percentage of transfers resulting in live births (%) 51.4 49.3 36.9 20.0 1 / 17 0 / 1Percentage of transfers resulting in pregnancies (%) 59.5 55.2 44.6 31.4 3 / 17 0 / 1
Frozen Embryos from Nondonor EggsNumber of cycles 85 52 38 9 6 1Number of transfers 85 52 38 8 5 0Estimated average number of transfers per retrieval 1.3 1.9 1.1 0.5 0.6 0.0Average number of embryos transferred 1.8 1.6 1.8 1.6 1.4 Percentage of embryos transferred resulting in implantation (%) 41.9 43.5 30.8 4 / 13 1 / 7 Percentage of transfers resulting in term, normal weight & singleton live births
e (%) 22.4 21.2 23.7 2 / 8 1 / 5
Percentage of transfers resulting in singleton live births (%) 28.2 32.7 34.2 3 / 8 1 / 5 Percentage of transfers resulting in twin live births (%) 15.3 13.5 2.6 0 / 8 0 / 5 Percentage of transfers resulting in live births (%) 44.7 46.2 36.8 3 / 8 1 / 5 Percentage of transfers resulting in pregnancies (%) 57.6 53.8 47.4 4 / 8 1 / 5
Number of Egg/Embryo Banking Cycles 39 22 26 12 6 2
Donor Eggs Fresh Embryosf Frozen Embryosf
Number of cycles 32 17Number of transfers 32 16Average number of embryos transferred 1.8 1.9Percentage of embryos transferred resulting in implantation (%) 69.5 33.3Percentage of transfers resulting in term, normal weight & singleton live births
e (%) 28.1 3 / 16
Percentage of transfers resulting in singleton live births (%) 31.3 5 / 16Percentage of transfers resulting in twin live births (%) 46.9 0 / 16Percentage of transfers resulting in live births (%) 78.1 5 / 16Percentage of transfers resulting in pregnancies (%) 81.3 8 / 16
CURRENT SERVICES & PROFILE Current Name: Houston IVF
Donor eggs? YesDonor embryos? Yes
Gestational carriers? YesEmbryo cryopreservation? Yes
Single women? YesSART member? Yes
Verified lab accreditation? Yes(See Appendix C for details.)
a Reflects features of fresh nondonor cycles. If IVF is less than 100%, the remaining cycles are GIFT, ZIFT, or a combination of these procedures with IVF.
b Total patient diagnosis percentages may be greater than 100% because more than one diagnosis can be reported for each ART cycle.
c Fractions are used for rates with denominators less than 20. Multiple-infant births (for example, twins) with at least one live infant are counted as one live birth.
d Total cycle number includes those using frozen eggs. It excludes 0 cycle(s) evaluating new procedures. Both cycle types are excluded from ART success rates.
e In this report, births are defined as term if at least 37 full weeks gestation and normal birth weight if at least 2,500 grams (approximately 5 pounds, 8 ounces).
f All ages are reported together because previous data show that patient age does not materially affect success with donor eggs.
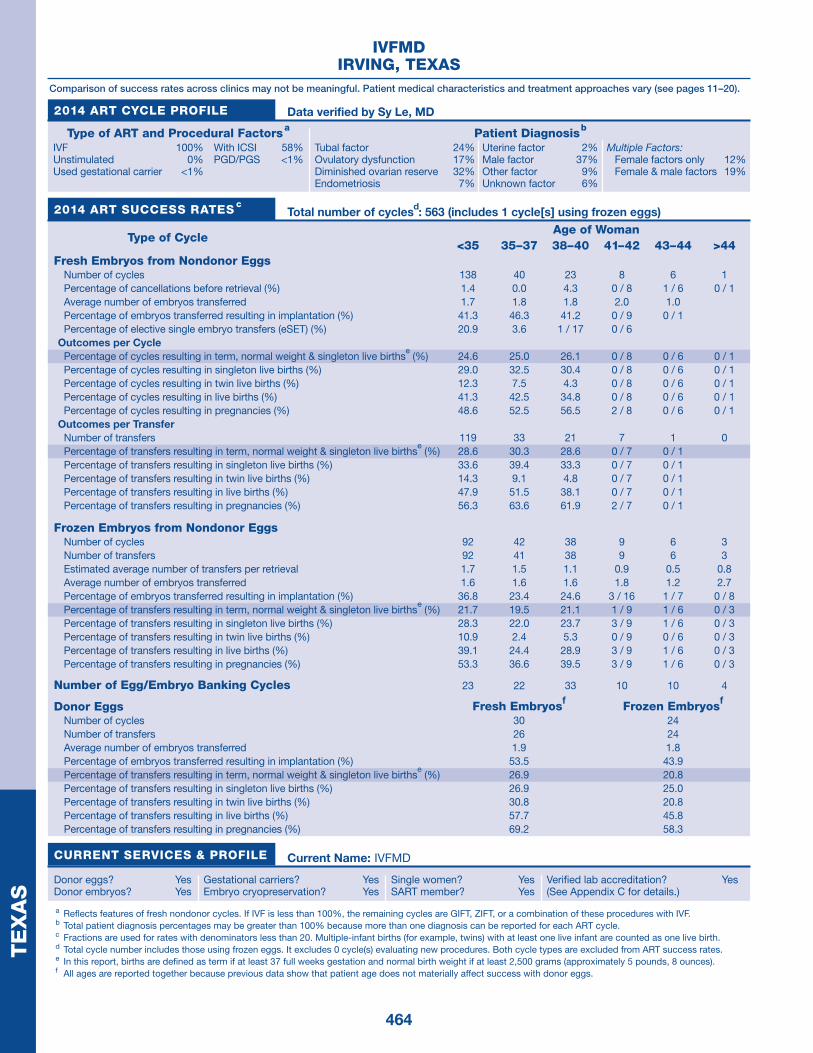
464
TE
XA
SIVFMD
IRVING, TEXASComparison of success rates across clinics may not be meaningful. Patient medical characteristics and treatment approaches vary (see pages 11–20).
Data verified by Sy Le, MD2014 ART CYCLE PROFILE
Type of ART and Procedural Factors a
IVF 100%Unstimulated 0%Used gestational carrier <1%
With ICSI 58%PGD/PGS <1%
Patient Diagnosis b
Tubal factor 24%Ovulatory dysfunction 17%Diminished ovarian reserve 32%Endometriosis 7%
Uterine factor 2%Male factor 37%Other factor 9%Unknown factor 6%
Multiple Factors: Female factors only 12%Female & male factors 19%
2014 ART SUCCESS RATES c Total number of cyclesd: 563 (includes 1 cycle[s] using frozen eggs)
Type of CycleAge of Woman
<35 35–37 38–40 41–42 43–44 >44Fresh Embryos from Nondonor Eggs
Number of cycles 138 40 23 8 6 1Percentage of cancellations before retrieval (%) 1.4 0.0 4.3 0 / 8 1 / 6 0 / 1Average number of embryos transferred 1.7 1.8 1.8 2.0 1.0 Percentage of embryos transferred resulting in implantation (%) 41.3 46.3 41.2 0 / 9 0 / 1 Percentage of elective single embryo transfers (eSET) (%) 20.9 3.6 1 / 17 0 / 6
Outcomes per CyclePercentage of cycles resulting in term, normal weight & singleton live births
e (%) 24.6 25.0 26.1 0 / 8 0 / 6 0 / 1
Percentage of cycles resulting in singleton live births (%) 29.0 32.5 30.4 0 / 8 0 / 6 0 / 1Percentage of cycles resulting in twin live births (%) 12.3 7.5 4.3 0 / 8 0 / 6 0 / 1Percentage of cycles resulting in live births (%) 41.3 42.5 34.8 0 / 8 0 / 6 0 / 1Percentage of cycles resulting in pregnancies (%) 48.6 52.5 56.5 2 / 8 0 / 6 0 / 1
Outcomes per TransferNumber of transfers 119 33 21 7 1 0Percentage of transfers resulting in term, normal weight & singleton live births
e (%) 28.6 30.3 28.6 0 / 7 0 / 1
Percentage of transfers resulting in singleton live births (%) 33.6 39.4 33.3 0 / 7 0 / 1 Percentage of transfers resulting in twin live births (%) 14.3 9.1 4.8 0 / 7 0 / 1 Percentage of transfers resulting in live births (%) 47.9 51.5 38.1 0 / 7 0 / 1 Percentage of transfers resulting in pregnancies (%) 56.3 63.6 61.9 2 / 7 0 / 1
Frozen Embryos from Nondonor EggsNumber of cycles 92 42 38 9 6 3Number of transfers 92 41 38 9 6 3Estimated average number of transfers per retrieval 1.7 1.5 1.1 0.9 0.5 0.8Average number of embryos transferred 1.6 1.6 1.6 1.8 1.2 2.7Percentage of embryos transferred resulting in implantation (%) 36.8 23.4 24.6 3 / 16 1 / 7 0 / 8Percentage of transfers resulting in term, normal weight & singleton live births
e (%) 21.7 19.5 21.1 1 / 9 1 / 6 0 / 3
Percentage of transfers resulting in singleton live births (%) 28.3 22.0 23.7 3 / 9 1 / 6 0 / 3Percentage of transfers resulting in twin live births (%) 10.9 2.4 5.3 0 / 9 0 / 6 0 / 3Percentage of transfers resulting in live births (%) 39.1 24.4 28.9 3 / 9 1 / 6 0 / 3Percentage of transfers resulting in pregnancies (%) 53.3 36.6 39.5 3 / 9 1 / 6 0 / 3
Number of Egg/Embryo Banking Cycles 23 22 33 10 10 4
Donor Eggs Fresh Embryosf Frozen Embryosf
Number of cycles 30 24Number of transfers 26 24Average number of embryos transferred 1.9 1.8Percentage of embryos transferred resulting in implantation (%) 53.5 43.9Percentage of transfers resulting in term, normal weight & singleton live births
e (%) 26.9 20.8
Percentage of transfers resulting in singleton live births (%) 26.9 25.0Percentage of transfers resulting in twin live births (%) 30.8 20.8Percentage of transfers resulting in live births (%) 57.7 45.8Percentage of transfers resulting in pregnancies (%) 69.2 58.3
CURRENT SERVICES & PROFILE Current Name: IVFMD
Donor eggs? YesDonor embryos? Yes
Gestational carriers? YesEmbryo cryopreservation? Yes
Single women? YesSART member? Yes
Verified lab accreditation? Yes(See Appendix C for details.)
a Reflects features of fresh nondonor cycles. If IVF is less than 100%, the remaining cycles are GIFT, ZIFT, or a combination of these procedures with IVF.
b Total patient diagnosis percentages may be greater than 100% because more than one diagnosis can be reported for each ART cycle.
c Fractions are used for rates with denominators less than 20. Multiple-infant births (for example, twins) with at least one live infant are counted as one live birth.
d Total cycle number includes those using frozen eggs. It excludes 0 cycle(s) evaluating new procedures. Both cycle types are excluded from ART success rates.
e In this report, births are defined as term if at least 37 full weeks gestation and normal birth weight if at least 2,500 grams (approximately 5 pounds, 8 ounces).
f All ages are reported together because previous data show that patient age does not materially affect success with donor eggs.

465
TE
XA
STHE CENTRE FOR REPRODUCTIVE MEDICINE
LUBBOCK, TEXASComparison of success rates across clinics may not be meaningful. Patient medical characteristics and treatment approaches vary (see pages 11–20).
Data verified by Janelle O. Dorsett, MD2014 ART CYCLE PROFILE
Type of ART and Procedural Factors a
IVF 100%Unstimulated 0%Used gestational carrier 2%
With ICSI 29%PGD/PGS 1%
Patient Diagnosis b
Tubal factor 27%Ovulatory dysfunction 24%Diminished ovarian reserve 25%Endometriosis 23%
Uterine factor 9%Male factor 40%Other factor 24%Unknown factor 4%
Multiple Factors: Female factors only 37%Female & male factors 26%
2014 ART SUCCESS RATES c Total number of cyclesd: 214 (includes 0 cycle[s] using frozen eggs)
Type of CycleAge of Woman
<35 35–37 38–40 41–42 43–44 >44Fresh Embryos from Nondonor Eggs
Number of cycles 64 12 14 6 0 2Percentage of cancellations before retrieval (%) 3.1 1 / 12 0 / 14 0 / 6 1 / 2Average number of embryos transferred 1.3 1.0 1.5 Percentage of embryos transferred resulting in implantation (%) 4 / 12 0 / 1 1 / 3 Percentage of elective single embryo transfers (eSET) (%) 0 / 3 0 / 1
Outcomes per CyclePercentage of cycles resulting in term, normal weight & singleton live births
e (%) 4.7 0 / 12 1 / 14 0 / 6 0 / 2
Percentage of cycles resulting in singleton live births (%) 6.3 0 / 12 1 / 14 0 / 6 0 / 2Percentage of cycles resulting in twin live births (%) 0.0 0 / 12 0 / 14 0 / 6 0 / 2Percentage of cycles resulting in live births (%) 6.3 0 / 12 1 / 14 0 / 6 0 / 2Percentage of cycles resulting in pregnancies (%) 6.3 0 / 12 1 / 14 0 / 6 0 / 2
Outcomes per TransferNumber of transfers 9 1 2 0 0 0Percentage of transfers resulting in term, normal weight & singleton live births
e (%) 3 / 9 0 / 1 1 / 2
Percentage of transfers resulting in singleton live births (%) 4 / 9 0 / 1 1 / 2 Percentage of transfers resulting in twin live births (%) 0 / 9 0 / 1 0 / 2 Percentage of transfers resulting in live births (%) 4 / 9 0 / 1 1 / 2 Percentage of transfers resulting in pregnancies (%) 4 / 9 0 / 1 1 / 2
Frozen Embryos from Nondonor EggsNumber of cycles 55 16 10 2 0 0Number of transfers 51 14 10 2 0 0Estimated average number of transfers per retrieval 1.1 1.3 1.4 2.0 Average number of embryos transferred 1.7 1.7 2.0 1.5 Percentage of embryos transferred resulting in implantation (%) 51.1 45.8 30.0 2 / 3 Percentage of transfers resulting in term, normal weight & singleton live births
e (%) 39.2 6 / 14 3 / 10 0 / 2
Percentage of transfers resulting in singleton live births (%) 45.1 6 / 14 3 / 10 0 / 2 Percentage of transfers resulting in twin live births (%) 17.6 2 / 14 1 / 10 1 / 2 Percentage of transfers resulting in live births (%) 62.7 8 / 14 4 / 10 1 / 2 Percentage of transfers resulting in pregnancies (%) 66.7 9 / 14 4 / 10 1 / 2
Number of Egg/Embryo Banking Cycles 4 1 0 0 0 0
Donor Eggs Fresh Embryosf Frozen Embryosf
Number of cycles 10 18Number of transfers 8 18Average number of embryos transferred 1.8 1.9Percentage of embryos transferred resulting in implantation (%) 2 / 14 58.8Percentage of transfers resulting in term, normal weight & singleton live births
e (%) 2 / 8 3 / 18
Percentage of transfers resulting in singleton live births (%) 2 / 8 6 / 18Percentage of transfers resulting in twin live births (%) 0 / 8 6 / 18Percentage of transfers resulting in live births (%) 2 / 8 12 / 18Percentage of transfers resulting in pregnancies (%) 2 / 8 13 / 18
CURRENT SERVICES & PROFILE Current Name: The Centre for Reproductive Medicine
Donor eggs? YesDonor embryos? Yes
Gestational carriers? YesEmbryo cryopreservation? Yes
Single women? YesSART member? Yes
Verified lab accreditation? Yes(See Appendix C for details.)
a Reflects features of fresh nondonor cycles. If IVF is less than 100%, the remaining cycles are GIFT, ZIFT, or a combination of these procedures with IVF.
b Total patient diagnosis percentages may be greater than 100% because more than one diagnosis can be reported for each ART cycle.
c Fractions are used for rates with denominators less than 20. Multiple-infant births (for example, twins) with at least one live infant are counted as one live birth.
d Total cycle number includes those using frozen eggs. It excludes 0 cycle(s) evaluating new procedures. Both cycle types are excluded from ART success rates.
e In this report, births are defined as term if at least 37 full weeks gestation and normal birth weight if at least 2,500 grams (approximately 5 pounds, 8 ounces).
f All ages are reported together because previous data show that patient age does not materially affect success with donor eggs.
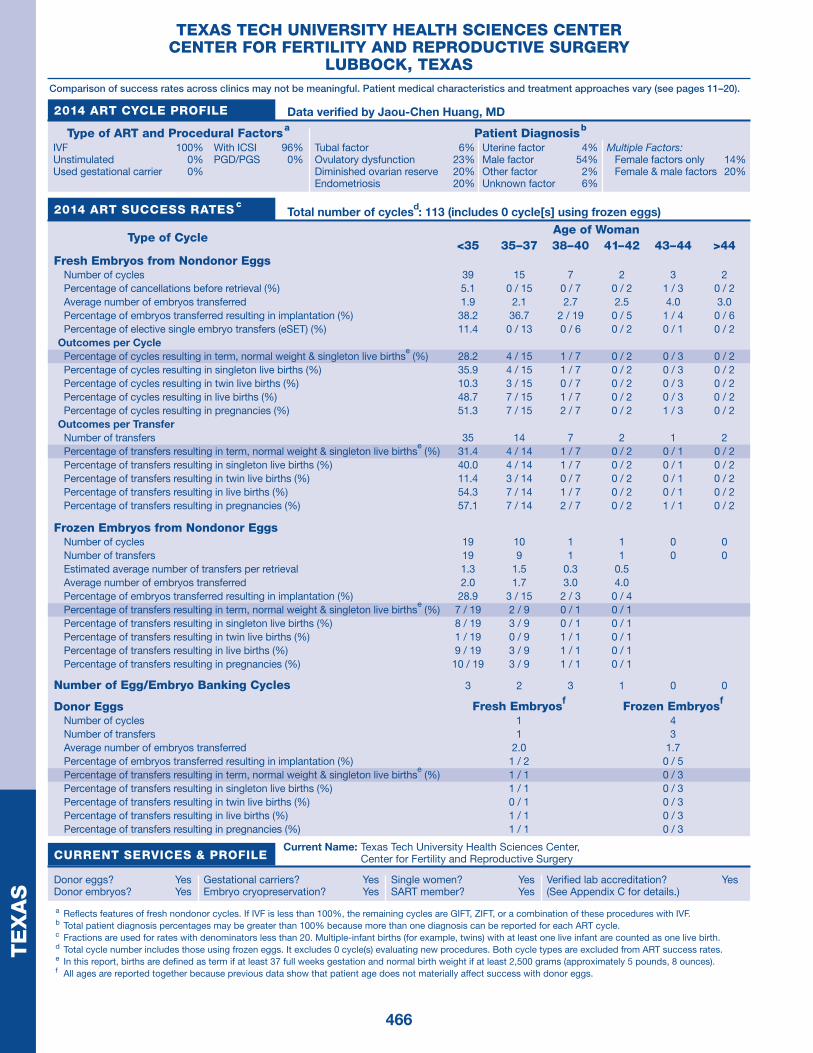
466
TE
XA
STEXAS TECH UNIVERSITY HEALTH SCIENCES CENTER
CENTER FOR FERTILITY AND REPRODUCTIVE SURGERYLUBBOCK, TEXAS
Comparison of success rates across clinics may not be meaningful. Patient medical characteristics and treatment approaches vary (see pages 11–20).
Data verified by Jaou-Chen Huang, MD2014 ART CYCLE PROFILE
Type of ART and Procedural Factors a
IVF 100%Unstimulated 0%Used gestational carrier 0%
With ICSI 96%PGD/PGS 0%
Patient Diagnosis b
Tubal factor 6%Ovulatory dysfunction 23%Diminished ovarian reserve 20%Endometriosis 20%
Uterine factor 4%Male factor 54%Other factor 2%Unknown factor 6%
Multiple Factors: Female factors only 14%Female & male factors 20%
2014 ART SUCCESS RATES c Total number of cyclesd: 113 (includes 0 cycle[s] using frozen eggs)
Type of CycleAge of Woman
<35 35–37 38–40 41–42 43–44 >44Fresh Embryos from Nondonor Eggs
Number of cycles 39 15 7 2 3 2Percentage of cancellations before retrieval (%) 5.1 0 / 15 0 / 7 0 / 2 1 / 3 0 / 2Average number of embryos transferred 1.9 2.1 2.7 2.5 4.0 3.0Percentage of embryos transferred resulting in implantation (%) 38.2 36.7 2 / 19 0 / 5 1 / 4 0 / 6Percentage of elective single embryo transfers (eSET) (%) 11.4 0 / 13 0 / 6 0 / 2 0 / 1 0 / 2
Outcomes per CyclePercentage of cycles resulting in term, normal weight & singleton live births
e (%) 28.2 4 / 15 1 / 7 0 / 2 0 / 3 0 / 2
Percentage of cycles resulting in singleton live births (%) 35.9 4 / 15 1 / 7 0 / 2 0 / 3 0 / 2Percentage of cycles resulting in twin live births (%) 10.3 3 / 15 0 / 7 0 / 2 0 / 3 0 / 2Percentage of cycles resulting in live births (%) 48.7 7 / 15 1 / 7 0 / 2 0 / 3 0 / 2Percentage of cycles resulting in pregnancies (%) 51.3 7 / 15 2 / 7 0 / 2 1 / 3 0 / 2
Outcomes per TransferNumber of transfers 35 14 7 2 1 2Percentage of transfers resulting in term, normal weight & singleton live births
e (%) 31.4 4 / 14 1 / 7 0 / 2 0 / 1 0 / 2
Percentage of transfers resulting in singleton live births (%) 40.0 4 / 14 1 / 7 0 / 2 0 / 1 0 / 2Percentage of transfers resulting in twin live births (%) 11.4 3 / 14 0 / 7 0 / 2 0 / 1 0 / 2Percentage of transfers resulting in live births (%) 54.3 7 / 14 1 / 7 0 / 2 0 / 1 0 / 2Percentage of transfers resulting in pregnancies (%) 57.1 7 / 14 2 / 7 0 / 2 1 / 1 0 / 2
Frozen Embryos from Nondonor EggsNumber of cycles 19 10 1 1 0 0Number of transfers 19 9 1 1 0 0Estimated average number of transfers per retrieval 1.3 1.5 0.3 0.5 Average number of embryos transferred 2.0 1.7 3.0 4.0 Percentage of embryos transferred resulting in implantation (%) 28.9 3 / 15 2 / 3 0 / 4 Percentage of transfers resulting in term, normal weight & singleton live births
e (%) 7 / 19 2 / 9 0 / 1 0 / 1
Percentage of transfers resulting in singleton live births (%) 8 / 19 3 / 9 0 / 1 0 / 1 Percentage of transfers resulting in twin live births (%) 1 / 19 0 / 9 1 / 1 0 / 1 Percentage of transfers resulting in live births (%) 9 / 19 3 / 9 1 / 1 0 / 1 Percentage of transfers resulting in pregnancies (%) 10 / 19 3 / 9 1 / 1 0 / 1
Number of Egg/Embryo Banking Cycles 3 2 3 1 0 0
Donor Eggs Fresh Embryosf Frozen Embryosf
Number of cycles 1 4Number of transfers 1 3Average number of embryos transferred 2.0 1.7Percentage of embryos transferred resulting in implantation (%) 1 / 2 0 / 5Percentage of transfers resulting in term, normal weight & singleton live births
e (%) 1 / 1 0 / 3
Percentage of transfers resulting in singleton live births (%) 1 / 1 0 / 3Percentage of transfers resulting in twin live births (%) 0 / 1 0 / 3Percentage of transfers resulting in live births (%) 1 / 1 0 / 3Percentage of transfers resulting in pregnancies (%) 1 / 1 0 / 3
CURRENT SERVICES & PROFILECurrent Name: Texas Tech University Health Sciences Center,
Center for Fertility and Reproductive Surgery
Donor eggs? YesDonor embryos? Yes
Gestational carriers? YesEmbryo cryopreservation? Yes
Single women? YesSART member? Yes
Verified lab accreditation? Yes(See Appendix C for details.)
a Reflects features of fresh nondonor cycles. If IVF is less than 100%, the remaining cycles are GIFT, ZIFT, or a combination of these procedures with IVF.
b Total patient diagnosis percentages may be greater than 100% because more than one diagnosis can be reported for each ART cycle.
c Fractions are used for rates with denominators less than 20. Multiple-infant births (for example, twins) with at least one live infant are counted as one live birth.
d Total cycle number includes those using frozen eggs. It excludes 0 cycle(s) evaluating new procedures. Both cycle types are excluded from ART success rates.
e In this report, births are defined as term if at least 37 full weeks gestation and normal birth weight if at least 2,500 grams (approximately 5 pounds, 8 ounces).
f All ages are reported together because previous data show that patient age does not materially affect success with donor eggs.

467
TE
XA
SREPRODUCTIVE INSTITUTE OF SOUTH TEXAS
McALLeN, TEXASComparison of success rates across clinics may not be meaningful. Patient medical characteristics and treatment approaches vary (see pages 11–20).
Data verified by Esteban O. Brown, MD2014 ART CYCLE PROFILE
Type of ART and Procedural Factors a
IVF 100%Unstimulated 0%Used gestational carrier 0%
With ICSI 94%PGD/PGS 7%
Patient Diagnosis b
Tubal factor 42%Ovulatory dysfunction 21%Diminished ovarian reserve 20%Endometriosis 4%
Uterine factor 23%Male factor 33%Other factor 42%Unknown factor 4%
Multiple Factors: Female factors only 34%Female & male factors 24%
2014 ART SUCCESS RATES c Total number of cyclesd: 159 (includes 0 cycle[s] using frozen eggs)
Type of CycleAge of Woman
<35 35–37 38–40 41–42 43–44 >44Fresh Embryos from Nondonor Eggs
Number of cycles 55 24 14 6 3 2Percentage of cancellations before retrieval (%) 3.6 0.0 1 / 14 1 / 6 1 / 3 1 / 2Average number of embryos transferred 1.9 2.1 2.0 1.6 1.5 1.0Percentage of embryos transferred resulting in implantation (%) 36.1 37.1 16.7 0 / 4 0 / 3 0 / 1Percentage of elective single embryo transfers (eSET) (%) 7.5 0 / 16 0 / 10 0 / 3 0 / 1
Outcomes per CyclePercentage of cycles resulting in term, normal weight & singleton live births
e (%) 10.9 8.3 4 / 14 0 / 6 0 / 3 0 / 2
Percentage of cycles resulting in singleton live births (%) 14.5 8.3 4 / 14 0 / 6 0 / 3 0 / 2Percentage of cycles resulting in twin live births (%) 7.3 8.3 0 / 14 0 / 6 0 / 3 0 / 2Percentage of cycles resulting in live births (%) 25.5 20.8 4 / 14 0 / 6 0 / 3 0 / 2Percentage of cycles resulting in pregnancies (%) 38.2 29.2 4 / 14 2 / 6 0 / 3 0 / 2
Outcomes per TransferNumber of transfers 42 17 12 5 2 1Percentage of transfers resulting in term, normal weight & singleton live births
e (%) 14.3 2 / 17 4 / 12 0 / 5 0 / 2 0 / 1
Percentage of transfers resulting in singleton live births (%) 19.0 2 / 17 4 / 12 0 / 5 0 / 2 0 / 1Percentage of transfers resulting in twin live births (%) 9.5 2 / 17 0 / 12 0 / 5 0 / 2 0 / 1Percentage of transfers resulting in live births (%) 33.3 5 / 17 4 / 12 0 / 5 0 / 2 0 / 1Percentage of transfers resulting in pregnancies (%) 50.0 7 / 17 4 / 12 2 / 5 0 / 2 0 / 1
Frozen Embryos from Nondonor EggsNumber of cycles 25 12 8 0 1 1Number of transfers 25 12 8 0 1 1Estimated average number of transfers per retrieval 2.3 2.0 2.7 1.0 Average number of embryos transferred 1.8 1.6 1.8 2.0 1.0Percentage of embryos transferred resulting in implantation (%) 57.5 12 / 17 8 / 14 0 / 2 1 / 1Percentage of transfers resulting in term, normal weight & singleton live births
e (%) 12.0 1 / 12 1 / 8 0 / 1 0 / 1
Percentage of transfers resulting in singleton live births (%) 36.0 2 / 12 2 / 8 0 / 1 1 / 1Percentage of transfers resulting in twin live births (%) 20.0 4 / 12 2 / 8 0 / 1 0 / 1Percentage of transfers resulting in live births (%) 56.0 6 / 12 4 / 8 0 / 1 1 / 1Percentage of transfers resulting in pregnancies (%) 76.0 9 / 12 5 / 8 0 / 1 1 / 1
Number of Egg/Embryo Banking Cycles 0 0 0 0 0 0
Donor Eggs Fresh Embryosf Frozen Embryosf
Number of cycles 8 0Number of transfers 8 0Average number of embryos transferred 1.8 Percentage of embryos transferred resulting in implantation (%) 7 / 12 Percentage of transfers resulting in term, normal weight & singleton live births
e (%) 3 / 8
Percentage of transfers resulting in singleton live births (%) 4 / 8 Percentage of transfers resulting in twin live births (%) 1 / 8 Percentage of transfers resulting in live births (%) 5 / 8 Percentage of transfers resulting in pregnancies (%) 7 / 8
CURRENT SERVICES & PROFILE Current Name: Reproductive Institute of South Texas
Donor eggs? YesDonor embryos? Yes
Gestational carriers? YesEmbryo cryopreservation? Yes
Single women? YesSART member? No
Verified lab accreditation? Yes(See Appendix C for details.)
a Reflects features of fresh nondonor cycles. If IVF is less than 100%, the remaining cycles are GIFT, ZIFT, or a combination of these procedures with IVF.
b Total patient diagnosis percentages may be greater than 100% because more than one diagnosis can be reported for each ART cycle.
c Fractions are used for rates with denominators less than 20. Multiple-infant births (for example, twins) with at least one live infant are counted as one live birth.
d Total cycle number includes those using frozen eggs. It excludes 0 cycle(s) evaluating new procedures. Both cycle types are excluded from ART success rates.
e In this report, births are defined as term if at least 37 full weeks gestation and normal birth weight if at least 2,500 grams (approximately 5 pounds, 8 ounces).
f All ages are reported together because previous data show that patient age does not materially affect success with donor eggs.

468
TE
XA
SIVF PLANO
PLANO, TEXASComparison of success rates across clinics may not be meaningful. Patient medical characteristics and treatment approaches vary (see pages 11–20).
Data verified by James Douglas, MD2014 ART CYCLE PROFILE
Type of ART and Procedural Factors a
IVF 100%Unstimulated <1%Used gestational carrier 1%
With ICSI 36%PGD/PGS <1%
Patient Diagnosis b
Tubal factor 14%Ovulatory dysfunction 56%Diminished ovarian reserve 32%Endometriosis 9%
Uterine factor 4%Male factor 46%Other factor 11%Unknown factor <1%
Multiple Factors: Female factors only 22%Female & male factors 39%
2014 ART SUCCESS RATES c Total number of cyclesd: 280 (includes 1 cycle[s] using frozen eggs)
Type of CycleAge of Woman
<35 35–37 38–40 41–42 43–44 >44Fresh Embryos from Nondonor Eggs
Number of cycles 62 37 29 15 11 2Percentage of cancellations before retrieval (%) 4.8 5.4 20.7 2 / 15 1 / 11 0 / 2Average number of embryos transferred 1.9 2.2 2.8 2.8 2.9 4.0Percentage of embryos transferred resulting in implantation (%) 35.9 40.4 19.1 15.6 8.7 0 / 4Percentage of elective single embryo transfers (eSET) (%) 14.7 12.0 1 / 17 0 / 10 0 / 6 0 / 1
Outcomes per CyclePercentage of cycles resulting in term, normal weight & singleton live births
e (%) 12.9 27.0 13.8 2 / 15 1 / 11 0 / 2
Percentage of cycles resulting in singleton live births (%) 16.1 32.4 17.2 2 / 15 1 / 11 0 / 2Percentage of cycles resulting in twin live births (%) 9.7 8.1 3.4 1 / 15 0 / 11 0 / 2Percentage of cycles resulting in live births (%) 25.8 40.5 20.7 3 / 15 1 / 11 0 / 2Percentage of cycles resulting in pregnancies (%) 30.6 51.4 27.6 5 / 15 2 / 11 0 / 2
Outcomes per TransferNumber of transfers 37 25 17 13 8 1Percentage of transfers resulting in term, normal weight & singleton live births
e (%) 21.6 40.0 4 / 17 2 / 13 1 / 8 0 / 1
Percentage of transfers resulting in singleton live births (%) 27.0 48.0 5 / 17 2 / 13 1 / 8 0 / 1Percentage of transfers resulting in twin live births (%) 16.2 12.0 1 / 17 1 / 13 0 / 8 0 / 1Percentage of transfers resulting in live births (%) 43.2 60.0 6 / 17 3 / 13 1 / 8 0 / 1Percentage of transfers resulting in pregnancies (%) 51.4 76.0 8 / 17 5 / 13 2 / 8 0 / 1
Frozen Embryos from Nondonor EggsNumber of cycles 36 22 15 3 0 0Number of transfers 36 22 14 2 0 0Estimated average number of transfers per retrieval 1.5 1.8 0.7 2.0 0.0 0.0Average number of embryos transferred 1.7 1.5 1.9 1.5 Percentage of embryos transferred resulting in implantation (%) 48.3 41.9 40.9 1 / 3 Percentage of transfers resulting in term, normal weight & singleton live births
e (%) 38.9 31.8 5 / 14 0 / 2
Percentage of transfers resulting in singleton live births (%) 47.2 36.4 5 / 14 0 / 2 Percentage of transfers resulting in twin live births (%) 8.3 4.5 0 / 14 0 / 2 Percentage of transfers resulting in live births (%) 55.6 45.5 6 / 14 0 / 2 Percentage of transfers resulting in pregnancies (%) 63.9 50.0 8 / 14 1 / 2
Number of Egg/Embryo Banking Cycles 7 3 7 1 4 1
Donor Eggs Fresh Embryosf Frozen Embryosf
Number of cycles 12 12Number of transfers 10 9Average number of embryos transferred 2.0 1.3Percentage of embryos transferred resulting in implantation (%) 65.0 6 / 10Percentage of transfers resulting in term, normal weight & singleton live births
e (%) 2 / 10 3 / 9
Percentage of transfers resulting in singleton live births (%) 3 / 10 3 / 9Percentage of transfers resulting in twin live births (%) 5 / 10 1 / 9Percentage of transfers resulting in live births (%) 8 / 10 4 / 9Percentage of transfers resulting in pregnancies (%) 8 / 10 7 / 9
CURRENT SERVICES & PROFILE Current Name: IVF Plano
Donor eggs? YesDonor embryos? Yes
Gestational carriers? YesEmbryo cryopreservation? Yes
Single women? YesSART member? Yes
Verified lab accreditation? Yes(See Appendix C for details.)
a Reflects features of fresh nondonor cycles. If IVF is less than 100%, the remaining cycles are GIFT, ZIFT, or a combination of these procedures with IVF.
b Total patient diagnosis percentages may be greater than 100% because more than one diagnosis can be reported for each ART cycle.
c Fractions are used for rates with denominators less than 20. Multiple-infant births (for example, twins) with at least one live infant are counted as one live birth.
d Total cycle number includes those using frozen eggs. It excludes 0 cycle(s) evaluating new procedures. Both cycle types are excluded from ART success rates.
e In this report, births are defined as term if at least 37 full weeks gestation and normal birth weight if at least 2,500 grams (approximately 5 pounds, 8 ounces).
f All ages are reported together because previous data show that patient age does not materially affect success with donor eggs.

469
TE
XA
SPRESBYTERIAN HOSPITAL PLANO ARTS
PLANO, TEXASComparison of success rates across clinics may not be meaningful. Patient medical characteristics and treatment approaches vary (see pages 11–20).
Data verified by Alfred J. Rodriguez, MD2014 ART CYCLE PROFILE
Type of ART and Procedural Factors a
IVF 100%Unstimulated 0%Used gestational carrier 0%
With ICSI 37%PGD/PGS 15%
Patient Diagnosis b
Tubal factor 16%Ovulatory dysfunction 54%Diminished ovarian reserve 29%Endometriosis 20%
Uterine factor 34%Male factor 39%Other factor 31%Unknown factor <1%
Multiple Factors: Female factors only 43%Female & male factors 34%
2014 ART SUCCESS RATES c Total number of cyclesd: 267 (includes 0 cycle[s] using frozen eggs)
Type of CycleAge of Woman
<35 35–37 38–40 41–42 43–44 >44Fresh Embryos from Nondonor Eggs
Number of cycles 33 11 20 3 6 0Percentage of cancellations before retrieval (%) 3.0 0 / 11 45.0 0 / 3 1 / 6 Average number of embryos transferred 3.0 2.0 Percentage of embryos transferred resulting in implantation (%) 1 / 3 2 / 2 Percentage of elective single embryo transfers (eSET) (%) 0 / 1 0 / 1
Outcomes per CyclePercentage of cycles resulting in term, normal weight & singleton live births
e (%) 3.0 1 / 11 0.0 0 / 3 0 / 6
Percentage of cycles resulting in singleton live births (%) 3.0 1 / 11 0.0 0 / 3 0 / 6 Percentage of cycles resulting in twin live births (%) 0.0 0 / 11 0.0 0 / 3 0 / 6 Percentage of cycles resulting in live births (%) 3.0 1 / 11 0.0 0 / 3 0 / 6 Percentage of cycles resulting in pregnancies (%) 3.0 1 / 11 0.0 0 / 3 0 / 6
Outcomes per TransferNumber of transfers 1 1 0 0 0 0Percentage of transfers resulting in term, normal weight & singleton live births
e (%) 1 / 1 1 / 1
Percentage of transfers resulting in singleton live births (%) 1 / 1 1 / 1 Percentage of transfers resulting in twin live births (%) 0 / 1 0 / 1 Percentage of transfers resulting in live births (%) 1 / 1 1 / 1 Percentage of transfers resulting in pregnancies (%) 1 / 1 1 / 1
Frozen Embryos from Nondonor EggsNumber of cycles 47 21 12 6 2 0Number of transfers 47 20 12 6 2 0Estimated average number of transfers per retrieval 1.0 0.9 0.4 0.5 0.3 0.0Average number of embryos transferred 1.4 1.9 2.0 2.3 3.5 Percentage of embryos transferred resulting in implantation (%) 61.8 35.1 59.1 4 / 14 0 / 7 Percentage of transfers resulting in term, normal weight & singleton live births
e (%) 46.8 35.0 4 / 12 2 / 6 0 / 2
Percentage of transfers resulting in singleton live births (%) 55.3 35.0 4 / 12 2 / 6 0 / 2 Percentage of transfers resulting in twin live births (%) 12.8 5.0 2 / 12 0 / 6 0 / 2 Percentage of transfers resulting in live births (%) 68.1 40.0 7 / 12 2 / 6 0 / 2 Percentage of transfers resulting in pregnancies (%) 76.6 50.0 10 / 12 3 / 6 0 / 2
Number of Egg/Embryo Banking Cycles 26 15 21 11 4 3
Donor Eggs Fresh Embryosf Frozen Embryosf
Number of cycles 6 20Number of transfers 3 20Average number of embryos transferred 1.3 1.6Percentage of embryos transferred resulting in implantation (%) 2 / 4 44.8Percentage of transfers resulting in term, normal weight & singleton live births
e (%) 1 / 3 25.0
Percentage of transfers resulting in singleton live births (%) 2 / 3 30.0Percentage of transfers resulting in twin live births (%) 0 / 3 10.0Percentage of transfers resulting in live births (%) 2 / 3 40.0Percentage of transfers resulting in pregnancies (%) 2 / 3 60.0
CURRENT SERVICES & PROFILE Current Name: Presbyterian Hospital Plano ARTS
Donor eggs? YesDonor embryos? Yes
Gestational carriers? YesEmbryo cryopreservation? Yes
Single women? YesSART member? Yes
Verified lab accreditation? Yes(See Appendix C for details.)
a Reflects features of fresh nondonor cycles. If IVF is less than 100%, the remaining cycles are GIFT, ZIFT, or a combination of these procedures with IVF.
b Total patient diagnosis percentages may be greater than 100% because more than one diagnosis can be reported for each ART cycle.
c Fractions are used for rates with denominators less than 20. Multiple-infant births (for example, twins) with at least one live infant are counted as one live birth.
d Total cycle number includes those using frozen eggs. It excludes 0 cycle(s) evaluating new procedures. Both cycle types are excluded from ART success rates.
e In this report, births are defined as term if at least 37 full weeks gestation and normal birth weight if at least 2,500 grams (approximately 5 pounds, 8 ounces).
f All ages are reported together because previous data show that patient age does not materially affect success with donor eggs.

470
TE
XA
SFERTILITY CENTER OF SAN ANTONIO
SAN ANTONIO, TEXASComparison of success rates across clinics may not be meaningful. Patient medical characteristics and treatment approaches vary (see pages 11–20).
Data verified by Joseph E. Martin, MD2014 ART CYCLE PROFILE
Type of ART and Procedural Factors a
IVF 100%Unstimulated 0%Used gestational carrier <1%
With ICSI 70%PGD/PGS 1%
Patient Diagnosis b
Tubal factor 26%Ovulatory dysfunction 18%Diminished ovarian reserve 25%Endometriosis 13%
Uterine factor 7%Male factor 35%Other factor 6%Unknown factor 12%
Multiple Factors: Female factors only 17%Female & male factors 16%
2014 ART SUCCESS RATES c Total number of cyclesd: 541 (includes 3 cycle[s] using frozen eggs)
Type of CycleAge of Woman
<35 35–37 38–40 41–42 43–44 >44Fresh Embryos from Nondonor Eggs
Number of cycles 135 62 41 19 7 2Percentage of cancellations before retrieval (%) 7.4 9.7 19.5 4 / 19 1 / 7 1 / 2Average number of embryos transferred 1.9 2.0 2.3 2.4 4.0 3.0Percentage of embryos transferred resulting in implantation (%) 52.3 41.5 19.7 8.3 0.0 0 / 3Percentage of elective single embryo transfers (eSET) (%) 15.0 7.7 3.6 0 / 10 0 / 6 0 / 1
Outcomes per CyclePercentage of cycles resulting in term, normal weight & singleton live births
e (%) 21.5 30.6 12.2 2 / 19 0 / 7 0 / 2
Percentage of cycles resulting in singleton live births (%) 25.2 38.7 12.2 2 / 19 0 / 7 0 / 2Percentage of cycles resulting in twin live births (%) 27.4 11.3 7.3 0 / 19 0 / 7 0 / 2Percentage of cycles resulting in live births (%) 52.6 51.6 19.5 2 / 19 0 / 7 0 / 2Percentage of cycles resulting in pregnancies (%) 56.3 54.8 26.8 4 / 19 0 / 7 0 / 2
Outcomes per TransferNumber of transfers 121 54 31 13 6 1Percentage of transfers resulting in term, normal weight & singleton live births
e (%) 24.0 35.2 16.1 2 / 13 0 / 6 0 / 1
Percentage of transfers resulting in singleton live births (%) 28.1 44.4 16.1 2 / 13 0 / 6 0 / 1Percentage of transfers resulting in twin live births (%) 30.6 13.0 9.7 0 / 13 0 / 6 0 / 1Percentage of transfers resulting in live births (%) 58.7 59.3 25.8 2 / 13 0 / 6 0 / 1Percentage of transfers resulting in pregnancies (%) 62.8 63.0 35.5 4 / 13 0 / 6 0 / 1
Frozen Embryos from Nondonor EggsNumber of cycles 72 51 30 7 2 0Number of transfers 70 50 27 7 2 0Estimated average number of transfers per retrieval 1.7 4.2 1.5 1.8 0.3 0.0Average number of embryos transferred 1.7 1.5 1.8 1.4 1.5 Percentage of embryos transferred resulting in implantation (%) 40.4 46.4 43.5 4 / 10 0 / 3 Percentage of transfers resulting in term, normal weight & singleton live births
e (%) 30.0 40.0 22.2 3 / 7 0 / 2
Percentage of transfers resulting in singleton live births (%) 34.3 46.0 29.6 3 / 7 0 / 2 Percentage of transfers resulting in twin live births (%) 8.6 4.0 14.8 0 / 7 0 / 2 Percentage of transfers resulting in live births (%) 44.3 50.0 44.4 3 / 7 0 / 2 Percentage of transfers resulting in pregnancies (%) 60.0 64.0 63.0 4 / 7 0 / 2
Number of Egg/Embryo Banking Cycles 19 9 14 4 6 2
Donor Eggs Fresh Embryosf Frozen Embryosf
Number of cycles 26 30Number of transfers 21 28Average number of embryos transferred 1.9 1.5Percentage of embryos transferred resulting in implantation (%) 37.5 40.0Percentage of transfers resulting in term, normal weight & singleton live births
e (%) 38.1 21.4
Percentage of transfers resulting in singleton live births (%) 38.1 32.1Percentage of transfers resulting in twin live births (%) 4.8 10.7Percentage of transfers resulting in live births (%) 42.9 42.9Percentage of transfers resulting in pregnancies (%) 61.9 50.0
CURRENT SERVICES & PROFILE Current Name: Fertility Center of San Antonio
Donor eggs? YesDonor embryos? Yes
Gestational carriers? YesEmbryo cryopreservation? Yes
Single women? YesSART member? Yes
Verified lab accreditation? Yes(See Appendix C for details.)
a Reflects features of fresh nondonor cycles. If IVF is less than 100%, the remaining cycles are GIFT, ZIFT, or a combination of these procedures with IVF.
b Total patient diagnosis percentages may be greater than 100% because more than one diagnosis can be reported for each ART cycle.
c Fractions are used for rates with denominators less than 20. Multiple-infant births (for example, twins) with at least one live infant are counted as one live birth.
d Total cycle number includes those using frozen eggs. It excludes 0 cycle(s) evaluating new procedures. Both cycle types are excluded from ART success rates.
e In this report, births are defined as term if at least 37 full weeks gestation and normal birth weight if at least 2,500 grams (approximately 5 pounds, 8 ounces).
f All ages are reported together because previous data show that patient age does not materially affect success with donor eggs.

471
TE
XA
SFERTILITY INSTITUTE OF TEXAS, PLLC
SAN ANTONIO, TEXASComparison of success rates across clinics may not be meaningful. Patient medical characteristics and treatment approaches vary (see pages 11–20).
Data verified by Susan Hudson, MD2014 ART CYCLE PROFILE
Type of ART and Procedural Factors a
IVF 100%Unstimulated 0%Used gestational carrier 0%
With ICSI 93%PGD/PGS 0%
Patient Diagnosis b
Tubal factor 17%Ovulatory dysfunction 2%Diminished ovarian reserve 48%Endometriosis 4%
Uterine factor 2%Male factor 25%Other factor 25%Unknown factor 4%
Multiple Factors: Female factors only 8%Female & male factors 17%
2014 ART SUCCESS RATES c Total number of cyclesd: 80 (includes 1 cycle[s] using frozen eggs)
Type of CycleAge of Woman
<35 35–37 38–40 41–42 43–44 >44Fresh Embryos from Nondonor Eggs
Number of cycles 7 3 5 0 0 0Percentage of cancellations before retrieval (%) 0 / 7 0 / 3 0 / 5 Average number of embryos transferred 1.7 2.0 2.0 Percentage of embryos transferred resulting in implantation (%) 5 / 5 1 / 2 0 / 2 Percentage of elective single embryo transfers (eSET) (%) 1 / 3 0 / 1 0 / 1
Outcomes per CyclePercentage of cycles resulting in term, normal weight & singleton live births
e (%) 0 / 7 1 / 3 0 / 5
Percentage of cycles resulting in singleton live births (%) 1 / 7 1 / 3 0 / 5 Percentage of cycles resulting in twin live births (%) 2 / 7 0 / 3 0 / 5 Percentage of cycles resulting in live births (%) 3 / 7 1 / 3 0 / 5 Percentage of cycles resulting in pregnancies (%) 3 / 7 1 / 3 0 / 5
Outcomes per TransferNumber of transfers 3 1 1 0 0 0Percentage of transfers resulting in term, normal weight & singleton live births
e (%) 0 / 3 1 / 1 0 / 1
Percentage of transfers resulting in singleton live births (%) 1 / 3 1 / 1 0 / 1 Percentage of transfers resulting in twin live births (%) 2 / 3 0 / 1 0 / 1 Percentage of transfers resulting in live births (%) 3 / 3 1 / 1 0 / 1 Percentage of transfers resulting in pregnancies (%) 3 / 3 1 / 1 0 / 1
Frozen Embryos from Nondonor EggsNumber of cycles 22 4 8 0 0 0Number of transfers 21 4 6 0 0 0Estimated average number of transfers per retrieval 0.9 1.3 0.9 0.0 0.0 Average number of embryos transferred 1.0 1.3 1.2 Percentage of embryos transferred resulting in implantation (%) 70.0 1 / 5 2 / 5 Percentage of transfers resulting in term, normal weight & singleton live births
e (%) 52.4 0 / 4 1 / 6
Percentage of transfers resulting in singleton live births (%) 61.9 0 / 4 2 / 6 Percentage of transfers resulting in twin live births (%) 0.0 0 / 4 0 / 6 Percentage of transfers resulting in live births (%) 61.9 0 / 4 2 / 6 Percentage of transfers resulting in pregnancies (%) 71.4 1 / 4 4 / 6
Number of Egg/Embryo Banking Cycles 20 1 4 1 1 0
Donor Eggs Fresh Embryosf Frozen Embryosf
Number of cycles 0 3Number of transfers 0 3Average number of embryos transferred 1.0Percentage of embryos transferred resulting in implantation (%) 1 / 3Percentage of transfers resulting in term, normal weight & singleton live births
e (%) 0 / 3
Percentage of transfers resulting in singleton live births (%) 0 / 3Percentage of transfers resulting in twin live births (%) 0 / 3Percentage of transfers resulting in live births (%) 0 / 3Percentage of transfers resulting in pregnancies (%) 1 / 3
CURRENT SERVICES & PROFILE Current Name: Fertility Institute of Texas, PLLC
Donor eggs? YesDonor embryos? Yes
Gestational carriers? YesEmbryo cryopreservation? Yes
Single women? YesSART member? Yes
Verified lab accreditation? Yes(See Appendix C for details.)
a Reflects features of fresh nondonor cycles. If IVF is less than 100%, the remaining cycles are GIFT, ZIFT, or a combination of these procedures with IVF.
b Total patient diagnosis percentages may be greater than 100% because more than one diagnosis can be reported for each ART cycle.
c Fractions are used for rates with denominators less than 20. Multiple-infant births (for example, twins) with at least one live infant are counted as one live birth.
d Total cycle number includes those using frozen eggs. It excludes 0 cycle(s) evaluating new procedures. Both cycle types are excluded from ART success rates.
e In this report, births are defined as term if at least 37 full weeks gestation and normal birth weight if at least 2,500 grams (approximately 5 pounds, 8 ounces).
f All ages are reported together because previous data show that patient age does not materially affect success with donor eggs.

472
TE
XA
SINSTITUTE FOR WOMEN’S HEALTH
ADVANCED FERTILITY CENTERSAN ANTONIO, TEXAS
Comparison of success rates across clinics may not be meaningful. Patient medical characteristics and treatment approaches vary (see pages 11–20).
Data verified by Joseph R. Garza, MD2014 ART CYCLE PROFILE
Type of ART and Procedural Factors a
IVF 100%Unstimulated 0%Used gestational carrier 0%
With ICSI 68%PGD/PGS 0%
Patient Diagnosis b
Tubal factor 13%Ovulatory dysfunction 32%Diminished ovarian reserve 53%Endometriosis 0%
Uterine factor 0%Male factor 25%Other factor 4%Unknown factor 0%
Multiple Factors: Female factors only 2%Female & male factors 19%
2014 ART SUCCESS RATES c Total number of cyclesd: 65 (includes 8 cycle[s] using frozen eggs)
Type of CycleAge of Woman
<35 35–37 38–40 41–42 43–44 >44Fresh Embryos from Nondonor Eggs
Number of cycles 6 5 5 3 6 3Percentage of cancellations before retrieval (%) 1 / 6 1 / 5 0 / 5 1 / 3 3 / 6 2 / 3Average number of embryos transferred 2.0 2.0 2.0 3.3 4.0Percentage of embryos transferred resulting in implantation (%) 2 / 4 2 / 4 0 / 6 0 / 4Percentage of elective single embryo transfers (eSET) (%) 0 / 2 0 / 2 0 / 3 0 / 3 0 / 1
Outcomes per CyclePercentage of cycles resulting in term, normal weight & singleton live births
e (%) 0 / 6 0 / 5 0 / 5 0 / 3 0 / 6 0 / 3
Percentage of cycles resulting in singleton live births (%) 0 / 6 0 / 5 0 / 5 0 / 3 0 / 6 0 / 3Percentage of cycles resulting in twin live births (%) 1 / 6 1 / 5 0 / 5 0 / 3 0 / 6 0 / 3Percentage of cycles resulting in live births (%) 1 / 6 1 / 5 0 / 5 0 / 3 0 / 6 0 / 3Percentage of cycles resulting in pregnancies (%) 1 / 6 1 / 5 0 / 5 0 / 3 3 / 6 0 / 3
Outcomes per TransferNumber of transfers 2 2 3 0 3 1Percentage of transfers resulting in term, normal weight & singleton live births
e (%) 0 / 2 0 / 2 0 / 3 0 / 3 0 / 1
Percentage of transfers resulting in singleton live births (%) 0 / 2 0 / 2 0 / 3 0 / 3 0 / 1Percentage of transfers resulting in twin live births (%) 1 / 2 1 / 2 0 / 3 0 / 3 0 / 1Percentage of transfers resulting in live births (%) 1 / 2 1 / 2 0 / 3 0 / 3 0 / 1Percentage of transfers resulting in pregnancies (%) 1 / 2 1 / 2 0 / 3 3 / 3 0 / 1
Frozen Embryos from Nondonor EggsNumber of cycles 12 0 7 3 1 0Number of transfers 10 0 7 3 0 0Estimated average number of transfers per retrieval 2.0 1.4 1.5 Average number of embryos transferred 2.1 1.7 2.0 Percentage of embryos transferred resulting in implantation (%) 47.6 0 / 12 0 / 6 Percentage of transfers resulting in term, normal weight & singleton live births
e (%) 2 / 10 0 / 7 0 / 3
Percentage of transfers resulting in singleton live births (%) 3 / 10 0 / 7 0 / 3 Percentage of transfers resulting in twin live births (%) 2 / 10 0 / 7 0 / 3 Percentage of transfers resulting in live births (%) 5 / 10 0 / 7 0 / 3 Percentage of transfers resulting in pregnancies (%) 7 / 10 0 / 7 0 / 3
Number of Egg/Embryo Banking Cycles 2 0 2 0 0 0
Donor Eggs Fresh Embryosf Frozen Embryosf
Number of cycles 0 2Number of transfers 0 2Average number of embryos transferred 1.5Percentage of embryos transferred resulting in implantation (%) 0 / 3Percentage of transfers resulting in term, normal weight & singleton live births
e (%) 0 / 2
Percentage of transfers resulting in singleton live births (%) 0 / 2Percentage of transfers resulting in twin live births (%) 0 / 2Percentage of transfers resulting in live births (%) 0 / 2Percentage of transfers resulting in pregnancies (%) 0 / 2
CURRENT SERVICES & PROFILE Current Name: Institute for Women’s Health, Advanced Fertility Center
Donor eggs? YesDonor embryos? Yes
Gestational carriers? YesEmbryo cryopreservation? Yes
Single women? YesSART member? Yes
Verified lab accreditation? Yes(See Appendix C for details.)
a Reflects features of fresh nondonor cycles. If IVF is less than 100%, the remaining cycles are GIFT, ZIFT, or a combination of these procedures with IVF.
b Total patient diagnosis percentages may be greater than 100% because more than one diagnosis can be reported for each ART cycle.
c Fractions are used for rates with denominators less than 20. Multiple-infant births (for example, twins) with at least one live infant are counted as one live birth.
d Total cycle number includes those using frozen eggs. It excludes 0 cycle(s) evaluating new procedures. Both cycle types are excluded from ART success rates.
e In this report, births are defined as term if at least 37 full weeks gestation and normal birth weight if at least 2,500 grams (approximately 5 pounds, 8 ounces).
f All ages are reported together because previous data show that patient age does not materially affect success with donor eggs.

473
TE
XA
SPERINATAL AND FERTILITY SPECIALISTS OF SAN ANTONIO
SAN ANTONIO, TEXASComparison of success rates across clinics may not be meaningful. Patient medical characteristics and treatment approaches vary (see pages 11–20).
Data verified by Gerard M. Honoré, MD, PhD2014 ART CYCLE PROFILE
Type of ART and Procedural Factors a
IVF 100%Unstimulated 0%Used gestational carrier 0%
With ICSI 67%PGD/PGS 0%
Patient Diagnosis b
Tubal factor 6%Ovulatory dysfunction 35%Diminished ovarian reserve 18%Endometriosis 29%
Uterine factor 0%Male factor 53%Other factor 0%Unknown factor 6%
Multiple Factors: Female factors only 6%Female & male factors 29%
2014 ART SUCCESS RATES c Total number of cyclesd: 19 (includes 0 cycle[s] using frozen eggs)
Type of CycleAge of Woman
<35 35–37 38–40 41–42 43–44 >44Fresh Embryos from Nondonor Eggs
Number of cycles 3 1 1 1 0 0Percentage of cancellations before retrieval (%) 0 / 3 0 / 1 1 / 1 0 / 1 Average number of embryos transferred 1.5 Percentage of embryos transferred resulting in implantation (%) 0 / 3 Percentage of elective single embryo transfers (eSET) (%) 0 / 1
Outcomes per CyclePercentage of cycles resulting in term, normal weight & singleton live births
e (%) 0 / 3 0 / 1 0 / 1 0 / 1
Percentage of cycles resulting in singleton live births (%) 0 / 3 0 / 1 0 / 1 0 / 1 Percentage of cycles resulting in twin live births (%) 0 / 3 0 / 1 0 / 1 0 / 1 Percentage of cycles resulting in live births (%) 0 / 3 0 / 1 0 / 1 0 / 1 Percentage of cycles resulting in pregnancies (%) 0 / 3 0 / 1 0 / 1 0 / 1
Outcomes per TransferNumber of transfers 2 0 0 0 0 0Percentage of transfers resulting in term, normal weight & singleton live births
e (%) 0 / 2
Percentage of transfers resulting in singleton live births (%) 0 / 2 Percentage of transfers resulting in twin live births (%) 0 / 2 Percentage of transfers resulting in live births (%) 0 / 2 Percentage of transfers resulting in pregnancies (%) 0 / 2
Frozen Embryos from Nondonor EggsNumber of cycles 4 1 2 1 0 0Number of transfers 4 1 2 1 0 0Estimated average number of transfers per retrieval 1.3 1.0 2.0 Average number of embryos transferred 1.5 2.0 1.5 2.0 Percentage of embryos transferred resulting in implantation (%) 1 / 6 1 / 2 1 / 3 0 / 2 Percentage of transfers resulting in term, normal weight & singleton live births
e (%) 0 / 4 1 / 1 0 / 2 0 / 1
Percentage of transfers resulting in singleton live births (%) 1 / 4 1 / 1 1 / 2 0 / 1 Percentage of transfers resulting in twin live births (%) 0 / 4 0 / 1 0 / 2 0 / 1 Percentage of transfers resulting in live births (%) 1 / 4 1 / 1 1 / 2 0 / 1 Percentage of transfers resulting in pregnancies (%) 1 / 4 1 / 1 1 / 2 0 / 1
Number of Egg/Embryo Banking Cycles 1 0 1 0 0 0
Donor Eggs Fresh Embryosf Frozen Embryosf
Number of cycles 1 2Number of transfers 0 2Average number of embryos transferred 2.0Percentage of embryos transferred resulting in implantation (%) 0 / 4Percentage of transfers resulting in term, normal weight & singleton live births
e (%) 0 / 2
Percentage of transfers resulting in singleton live births (%) 0 / 2Percentage of transfers resulting in twin live births (%) 0 / 2Percentage of transfers resulting in live births (%) 0 / 2Percentage of transfers resulting in pregnancies (%) 0 / 2
CURRENT SERVICES & PROFILE Current Name: Fertility Specialists of San Antonio
Donor eggs? YesDonor embryos? Yes
Gestational carriers? YesEmbryo cryopreservation? Yes
Single women? YesSART member? No
Verified lab accreditation? Yes(See Appendix C for details.)
a Reflects features of fresh nondonor cycles. If IVF is less than 100%, the remaining cycles are GIFT, ZIFT, or a combination of these procedures with IVF.
b Total patient diagnosis percentages may be greater than 100% because more than one diagnosis can be reported for each ART cycle.
c Fractions are used for rates with denominators less than 20. Multiple-infant births (for example, twins) with at least one live infant are counted as one live birth.
d Total cycle number includes those using frozen eggs. It excludes 0 cycle(s) evaluating new procedures. Both cycle types are excluded from ART success rates.
e In this report, births are defined as term if at least 37 full weeks gestation and normal birth weight if at least 2,500 grams (approximately 5 pounds, 8 ounces).
f All ages are reported together because previous data show that patient age does not materially affect success with donor eggs.

474
TE
XA
SREPRODUCTIVE MEDICINE ASSOCIATES OF TEXAS, PA
SAN ANTONIO, TEXASComparison of success rates across clinics may not be meaningful. Patient medical characteristics and treatment approaches vary (see pages 11–20).
Data verified by Francisco Arredondo, MD2014 ART CYCLE PROFILE
Type of ART and Procedural Factors a
IVF 100%Unstimulated 0%Used gestational carrier 0%
With ICSI 90%PGD/PGS 6%
Patient Diagnosis b
Tubal factor 11%Ovulatory dysfunction 24%Diminished ovarian reserve 25%Endometriosis 8%
Uterine factor 4%Male factor 37%Other factor 13%Unknown factor 8%
Multiple Factors: Female factors only 10%Female & male factors 17%
2014 ART SUCCESS RATES c Total number of cyclesd: 467 (includes 3 cycle[s] using frozen eggs)
Type of CycleAge of Woman
<35 35–37 38–40 41–42 43–44 >44Fresh Embryos from Nondonor Eggs
Number of cycles 94 29 19 9 10 1Percentage of cancellations before retrieval (%) 7.4 10.3 2 / 19 1 / 9 0 / 10 1 / 1Average number of embryos transferred 1.6 1.8 1.9 2.3 2.3 Percentage of embryos transferred resulting in implantation (%) 57.9 42.9 26.1 3 / 14 4.8 Percentage of elective single embryo transfers (eSET) (%) 38.4 0 / 17 0 / 9 0 / 5 0 / 6
Outcomes per CyclePercentage of cycles resulting in term, normal weight & singleton live births
e (%) 33.0 24.1 2 / 19 1 / 9 0 / 10 0 / 1
Percentage of cycles resulting in singleton live births (%) 40.4 27.6 3 / 19 2 / 9 1 / 10 0 / 1Percentage of cycles resulting in twin live births (%) 13.8 10.3 1 / 19 0 / 9 0 / 10 0 / 1Percentage of cycles resulting in live births (%) 54.3 37.9 4 / 19 2 / 9 1 / 10 0 / 1Percentage of cycles resulting in pregnancies (%) 60.6 48.3 5 / 19 2 / 9 1 / 10 0 / 1
Outcomes per TransferNumber of transfers 77 22 12 6 9 0Percentage of transfers resulting in term, normal weight & singleton live births
e (%) 40.3 31.8 2 / 12 1 / 6 0 / 9
Percentage of transfers resulting in singleton live births (%) 49.4 36.4 3 / 12 2 / 6 1 / 9 Percentage of transfers resulting in twin live births (%) 16.9 13.6 1 / 12 0 / 6 0 / 9 Percentage of transfers resulting in live births (%) 66.2 50.0 4 / 12 2 / 6 1 / 9 Percentage of transfers resulting in pregnancies (%) 74.0 63.6 5 / 12 2 / 6 1 / 9
Frozen Embryos from Nondonor EggsNumber of cycles 84 30 21 4 2 0Number of transfers 83 29 21 4 2 0Estimated average number of transfers per retrieval 1.1 1.6 0.8 0.3 0.4 0.0Average number of embryos transferred 1.3 1.3 1.3 1.5 1.0 Percentage of embryos transferred resulting in implantation (%) 45.0 51.4 35.7 2 / 6 0 / 2 Percentage of transfers resulting in term, normal weight & singleton live births
e (%) 36.1 48.3 9.5 2 / 4 0 / 2
Percentage of transfers resulting in singleton live births (%) 41.0 58.6 14.3 2 / 4 0 / 2 Percentage of transfers resulting in twin live births (%) 4.8 0.0 14.3 0 / 4 0 / 2 Percentage of transfers resulting in live births (%) 45.8 58.6 28.6 2 / 4 0 / 2 Percentage of transfers resulting in pregnancies (%) 54.2 65.5 33.3 2 / 4 0 / 2
Number of Egg/Embryo Banking Cycles 65 17 26 12 5 1
Donor Eggs Fresh Embryosf Frozen Embryosf
Number of cycles 14 21Number of transfers 8 21Average number of embryos transferred 1.3 1.3Percentage of embryos transferred resulting in implantation (%) 7 / 10 50.0Percentage of transfers resulting in term, normal weight & singleton live births
e (%) 3 / 8 33.3
Percentage of transfers resulting in singleton live births (%) 6 / 8 47.6Percentage of transfers resulting in twin live births (%) 0 / 8 4.8Percentage of transfers resulting in live births (%) 6 / 8 52.4Percentage of transfers resulting in pregnancies (%) 6 / 8 61.9
CURRENT SERVICES & PROFILE Current Name: Reproductive Medicine Associates of Texas, PA
Donor eggs? YesDonor embryos? Yes
Gestational carriers? YesEmbryo cryopreservation? Yes
Single women? YesSART member? Yes
Verified lab accreditation? Yes(See Appendix C for details.)
a Reflects features of fresh nondonor cycles. If IVF is less than 100%, the remaining cycles are GIFT, ZIFT, or a combination of these procedures with IVF.
b Total patient diagnosis percentages may be greater than 100% because more than one diagnosis can be reported for each ART cycle.
c Fractions are used for rates with denominators less than 20. Multiple-infant births (for example, twins) with at least one live infant are counted as one live birth.
d Total cycle number includes those using frozen eggs. It excludes 0 cycle(s) evaluating new procedures. Both cycle types are excluded from ART success rates.
e In this report, births are defined as term if at least 37 full weeks gestation and normal birth weight if at least 2,500 grams (approximately 5 pounds, 8 ounces).
f All ages are reported together because previous data show that patient age does not materially affect success with donor eggs.

475
TE
XA
SUT MEDICINE FERTILITY CENTER
SAN ANTONIO, TEXASComparison of success rates across clinics may not be meaningful. Patient medical characteristics and treatment approaches vary (see pages 11–20).
Data verified by Randal D. Robinson, MD2014 ART CYCLE PROFILE
Type of ART and Procedural Factors a
IVF 100%Unstimulated 0%Used gestational carrier 0%
With ICSI 47%PGD/PGS 6%
Patient Diagnosis b
Tubal factor 18%Ovulatory dysfunction 31%Diminished ovarian reserve 19%Endometriosis 15%
Uterine factor 8%Male factor 35%Other factor 5%Unknown factor 16%
Multiple Factors: Female factors only 18%Female & male factors 25%
2014 ART SUCCESS RATES c Total number of cyclesd: 108 (includes 0 cycle[s] using frozen eggs)
Type of CycleAge of Woman
<35 35–37 38–40 41–42 43–44 >44Fresh Embryos from Nondonor Eggs
Number of cycles 27 8 12 5 3 0Percentage of cancellations before retrieval (%) 3.7 0 / 8 0 / 12 0 / 5 1 / 3 Average number of embryos transferred 1.9 2.0 2.3 2.8 2.0 Percentage of embryos transferred resulting in implantation (%) 45.7 4 / 14 21.4 1 / 11 0 / 2 Percentage of elective single embryo transfers (eSET) (%) 3 / 18 1 / 7 1 / 12 0 / 4 0 / 1
Outcomes per CyclePercentage of cycles resulting in term, normal weight & singleton live births
e (%) 29.6 4 / 8 1 / 12 1 / 5 0 / 3
Percentage of cycles resulting in singleton live births (%) 33.3 4 / 8 2 / 12 1 / 5 0 / 3 Percentage of cycles resulting in twin live births (%) 3.7 0 / 8 2 / 12 0 / 5 0 / 3 Percentage of cycles resulting in live births (%) 37.0 4 / 8 4 / 12 1 / 5 0 / 3 Percentage of cycles resulting in pregnancies (%) 51.9 4 / 8 4 / 12 1 / 5 0 / 3
Outcomes per TransferNumber of transfers 20 7 12 4 1 0Percentage of transfers resulting in term, normal weight & singleton live births
e (%) 40.0 4 / 7 1 / 12 1 / 4 0 / 1
Percentage of transfers resulting in singleton live births (%) 45.0 4 / 7 2 / 12 1 / 4 0 / 1 Percentage of transfers resulting in twin live births (%) 5.0 0 / 7 2 / 12 0 / 4 0 / 1 Percentage of transfers resulting in live births (%) 50.0 4 / 7 4 / 12 1 / 4 0 / 1 Percentage of transfers resulting in pregnancies (%) 70.0 4 / 7 4 / 12 1 / 4 0 / 1
Frozen Embryos from Nondonor EggsNumber of cycles 24 9 11 2 0 0Number of transfers 23 9 11 2 0 0Estimated average number of transfers per retrieval 1.8 4.5 1.4 0.0 Average number of embryos transferred 1.8 1.4 1.5 2.0 Percentage of embryos transferred resulting in implantation (%) 23.8 7 / 12 3 / 16 0 / 4 Percentage of transfers resulting in term, normal weight & singleton live births
e (%) 26.1 3 / 9 2 / 11 0 / 2
Percentage of transfers resulting in singleton live births (%) 26.1 4 / 9 2 / 11 0 / 2 Percentage of transfers resulting in twin live births (%) 4.3 1 / 9 0 / 11 0 / 2 Percentage of transfers resulting in live births (%) 30.4 5 / 9 2 / 11 0 / 2 Percentage of transfers resulting in pregnancies (%) 34.8 6 / 9 3 / 11 0 / 2
Number of Egg/Embryo Banking Cycles 2 1 2 0 1 0
Donor Eggs Fresh Embryosf Frozen Embryosf
Number of cycles 1 0Number of transfers 1 0Average number of embryos transferred 2.0 Percentage of embryos transferred resulting in implantation (%) 1 / 2 Percentage of transfers resulting in term, normal weight & singleton live births
e (%) 1 / 1
Percentage of transfers resulting in singleton live births (%) 1 / 1 Percentage of transfers resulting in twin live births (%) 0 / 1 Percentage of transfers resulting in live births (%) 1 / 1 Percentage of transfers resulting in pregnancies (%) 1 / 1
CURRENT SERVICES & PROFILE Current Name: UT Medicine Fertility Center
Donor eggs? YesDonor embryos? Yes
Gestational carriers? YesEmbryo cryopreservation? Yes
Single women? YesSART member? Yes
Verified lab accreditation? Yes(See Appendix C for details.)
a Reflects features of fresh nondonor cycles. If IVF is less than 100%, the remaining cycles are GIFT, ZIFT, or a combination of these procedures with IVF.
b Total patient diagnosis percentages may be greater than 100% because more than one diagnosis can be reported for each ART cycle.
c Fractions are used for rates with denominators less than 20. Multiple-infant births (for example, twins) with at least one live infant are counted as one live birth.
d Total cycle number includes those using frozen eggs. It excludes 0 cycle(s) evaluating new procedures. Both cycle types are excluded from ART success rates.
e In this report, births are defined as term if at least 37 full weeks gestation and normal birth weight if at least 2,500 grams (approximately 5 pounds, 8 ounces).
f All ages are reported together because previous data show that patient age does not materially affect success with donor eggs.

476
TE
XA
SSCOTT & WHITETEMPLE, TEXAS
Comparison of success rates across clinics may not be meaningful. Patient medical characteristics and treatment approaches vary (see pages 11–20).
Data verified by Thomas J. Wincek, MD, PhD2014 ART CYCLE PROFILE
Type of ART and Procedural Factors a
IVF 100%Unstimulated 0%Used gestational carrier 0%
With ICSI 79%PGD/PGS 0%
Patient Diagnosis b
Tubal factor 15%Ovulatory dysfunction 9%Diminished ovarian reserve 0%Endometriosis 16%
Uterine factor 0%Male factor 35%Other factor 3%Unknown factor 30%
Multiple Factors: Female factors only 4%Female & male factors 3%
2014 ART SUCCESS RATES c Total number of cyclesd: 99 (includes 0 cycle[s] using frozen eggs)
Type of CycleAge of Woman
<35 35–37 38–40 41–42 43–44 >44Fresh Embryos from Nondonor Eggs
Number of cycles 41 11 8 6 0 0Percentage of cancellations before retrieval (%) 14.6 3 / 11 2 / 8 2 / 6 Average number of embryos transferred 2.1 1.9 2.2 2.3 Percentage of embryos transferred resulting in implantation (%) 36.4 6 / 15 3 / 13 1 / 7 Percentage of elective single embryo transfers (eSET) (%) 0.0 0 / 7 0 / 6 0 / 2
Outcomes per CyclePercentage of cycles resulting in term, normal weight & singleton live births
e (%) 14.6 1 / 11 2 / 8 0 / 6
Percentage of cycles resulting in singleton live births (%) 17.1 1 / 11 2 / 8 1 / 6 Percentage of cycles resulting in twin live births (%) 12.2 1 / 11 0 / 8 0 / 6 Percentage of cycles resulting in live births (%) 29.3 2 / 11 2 / 8 1 / 6 Percentage of cycles resulting in pregnancies (%) 46.3 4 / 11 3 / 8 1 / 6
Outcomes per TransferNumber of transfers 32 8 6 3 0 0Percentage of transfers resulting in term, normal weight & singleton live births
e (%) 18.8 1 / 8 2 / 6 0 / 3
Percentage of transfers resulting in singleton live births (%) 21.9 1 / 8 2 / 6 1 / 3 Percentage of transfers resulting in twin live births (%) 15.6 1 / 8 0 / 6 0 / 3 Percentage of transfers resulting in live births (%) 37.5 2 / 8 2 / 6 1 / 3 Percentage of transfers resulting in pregnancies (%) 59.4 4 / 8 3 / 6 1 / 3
Frozen Embryos from Nondonor EggsNumber of cycles 16 6 7 2 0 0Number of transfers 14 6 7 1 0 0Estimated average number of transfers per retrieval 1.8 3.5 Average number of embryos transferred 2.0 2.0 1.6 2.0 Percentage of embryos transferred resulting in implantation (%) 12.5 2 / 12 0 / 11 0 / 2 Percentage of transfers resulting in term, normal weight & singleton live births
e (%) 1 / 14 2 / 6 0 / 7 0 / 1
Percentage of transfers resulting in singleton live births (%) 2 / 14 2 / 6 0 / 7 0 / 1 Percentage of transfers resulting in twin live births (%) 0 / 14 0 / 6 0 / 7 0 / 1 Percentage of transfers resulting in live births (%) 2 / 14 2 / 6 0 / 7 0 / 1 Percentage of transfers resulting in pregnancies (%) 5 / 14 2 / 6 0 / 7 0 / 1
Number of Egg/Embryo Banking Cycles 1 0 0 0 0 0
Donor Eggs Fresh Embryosf Frozen Embryosf
Number of cycles 0 1Number of transfers 0 1Average number of embryos transferred 2.0Percentage of embryos transferred resulting in implantation (%) Percentage of transfers resulting in term, normal weight & singleton live births
e (%) 0 / 1
Percentage of transfers resulting in singleton live births (%) 0 / 1Percentage of transfers resulting in twin live births (%) 0 / 1Percentage of transfers resulting in live births (%) 0 / 1Percentage of transfers resulting in pregnancies (%) 0 / 1
CURRENT SERVICES & PROFILE Current Name: Scott & White
Donor eggs? NoDonor embryos? No
Gestational carriers? YesEmbryo cryopreservation? Yes
Single women? YesSART member? No
Verified lab accreditation? No(See Appendix C for details.)
a Reflects features of fresh nondonor cycles. If IVF is less than 100%, the remaining cycles are GIFT, ZIFT, or a combination of these procedures with IVF.
b Total patient diagnosis percentages may be greater than 100% because more than one diagnosis can be reported for each ART cycle.
c Fractions are used for rates with denominators less than 20. Multiple-infant births (for example, twins) with at least one live infant are counted as one live birth.
d Total cycle number includes those using frozen eggs. It excludes 0 cycle(s) evaluating new procedures. Both cycle types are excluded from ART success rates.
e In this report, births are defined as term if at least 37 full weeks gestation and normal birth weight if at least 2,500 grams (approximately 5 pounds, 8 ounces).
f All ages are reported together because previous data show that patient age does not materially affect success with donor eggs.

477
TE
XA
SNORTH HOUSTON CENTER FOR REPRODUCTIVE MEDICINE, PA
THE WOODLANDS, TEXASComparison of success rates across clinics may not be meaningful. Patient medical characteristics and treatment approaches vary (see pages 11–20).
Data verified by Dorothy J. Roach, MD2014 ART CYCLE PROFILE
Type of ART and Procedural Factors a
IVF 100%Unstimulated 0%Used gestational carrier 5%
With ICSI 93%PGD/PGS 0%
Patient Diagnosis b
Tubal factor 6%Ovulatory dysfunction 42%Diminished ovarian reserve 20%Endometriosis 15%
Uterine factor 3%Male factor 43%Other factor 25%Unknown factor 3%
Multiple Factors: Female factors only 20%Female & male factors 32%
2014 ART SUCCESS RATES c Total number of cyclesd: 96 (includes 0 cycle[s] using frozen eggs)
Type of CycleAge of Woman
<35 35–37 38–40 41–42 43–44 >44Fresh Embryos from Nondonor Eggs
Number of cycles 26 12 10 5 2 1Percentage of cancellations before retrieval (%) 0.0 0 / 12 0 / 10 0 / 5 0 / 2 0 / 1Average number of embryos transferred 1.8 2.2 2.7 3.0 1.0 4.0Percentage of embryos transferred resulting in implantation (%) 47.6 46.2 41.7 4 / 15 0 / 1 0 / 4Percentage of elective single embryo transfers (eSET) (%) 20.8 0 / 12 0 / 8 0 / 5 0 / 1
Outcomes per CyclePercentage of cycles resulting in term, normal weight & singleton live births
e (%) 38.5 6 / 12 0 / 10 1 / 5 0 / 2 0 / 1
Percentage of cycles resulting in singleton live births (%) 42.3 7 / 12 1 / 10 2 / 5 0 / 2 0 / 1Percentage of cycles resulting in twin live births (%) 11.5 2 / 12 3 / 10 0 / 5 0 / 2 0 / 1Percentage of cycles resulting in live births (%) 53.8 9 / 12 5 / 10 2 / 5 0 / 2 0 / 1Percentage of cycles resulting in pregnancies (%) 57.7 9 / 12 5 / 10 3 / 5 0 / 2 0 / 1
Outcomes per TransferNumber of transfers 25 12 9 5 1 1Percentage of transfers resulting in term, normal weight & singleton live births
e (%) 40.0 6 / 12 0 / 9 1 / 5 0 / 1 0 / 1
Percentage of transfers resulting in singleton live births (%) 44.0 7 / 12 1 / 9 2 / 5 0 / 1 0 / 1Percentage of transfers resulting in twin live births (%) 12.0 2 / 12 3 / 9 0 / 5 0 / 1 0 / 1Percentage of transfers resulting in live births (%) 56.0 9 / 12 5 / 9 2 / 5 0 / 1 0 / 1Percentage of transfers resulting in pregnancies (%) 60.0 9 / 12 5 / 9 3 / 5 0 / 1 0 / 1
Frozen Embryos from Nondonor EggsNumber of cycles 18 5 2 3 1 1Number of transfers 18 5 2 3 1 1Estimated average number of transfers per retrieval 6.0 5.0 2.0 1.5 Average number of embryos transferred 1.9 1.6 1.5 1.7 2.0 2.0Percentage of embryos transferred resulting in implantation (%) 34.3 3 / 8 0 / 3 0 / 5 1 / 2 0 / 2Percentage of transfers resulting in term, normal weight & singleton live births
e (%) 4 / 18 1 / 5 0 / 2 0 / 3 1 / 1 0 / 1
Percentage of transfers resulting in singleton live births (%) 6 / 18 1 / 5 0 / 2 0 / 3 1 / 1 0 / 1Percentage of transfers resulting in twin live births (%) 2 / 18 1 / 5 0 / 2 0 / 3 0 / 1 0 / 1Percentage of transfers resulting in live births (%) 8 / 18 2 / 5 0 / 2 0 / 3 1 / 1 0 / 1Percentage of transfers resulting in pregnancies (%) 9 / 18 2 / 5 0 / 2 0 / 3 1 / 1 0 / 1
Number of Egg/Embryo Banking Cycles 0 0 0 2 0 0
Donor Eggs Fresh Embryosf Frozen Embryosf
Number of cycles 7 1Number of transfers 5 1Average number of embryos transferred 2.2 2.0Percentage of embryos transferred resulting in implantation (%) 4 / 8 2 / 2Percentage of transfers resulting in term, normal weight & singleton live births
e (%) 0 / 5 0 / 1
Percentage of transfers resulting in singleton live births (%) 0 / 5 0 / 1Percentage of transfers resulting in twin live births (%) 1 / 5 1 / 1Percentage of transfers resulting in live births (%) 1 / 5 1 / 1Percentage of transfers resulting in pregnancies (%) 3 / 5 1 / 1
CURRENT SERVICES & PROFILE Current Name: North Houston Center for Reproductive Medicine, PA
Donor eggs? YesDonor embryos? No
Gestational carriers? YesEmbryo cryopreservation? Yes
Single women? YesSART member? Yes
Verified lab accreditation? Yes(See Appendix C for details.)
a Reflects features of fresh nondonor cycles. If IVF is less than 100%, the remaining cycles are GIFT, ZIFT, or a combination of these procedures with IVF.
b Total patient diagnosis percentages may be greater than 100% because more than one diagnosis can be reported for each ART cycle.
c Fractions are used for rates with denominators less than 20. Multiple-infant births (for example, twins) with at least one live infant are counted as one live birth.
d Total cycle number includes those using frozen eggs. It excludes 0 cycle(s) evaluating new procedures. Both cycle types are excluded from ART success rates.
e In this report, births are defined as term if at least 37 full weeks gestation and normal birth weight if at least 2,500 grams (approximately 5 pounds, 8 ounces).
f All ages are reported together because previous data show that patient age does not materially affect success with donor eggs.

478
TE
XA
SCENTER OF REPRODUCTIVE MEDICINE (CORM)
WEBSTER, TEXASComparison of success rates across clinics may not be meaningful. Patient medical characteristics and treatment approaches vary (see pages 11–20).
Data verified by Vicki L. Schnell, MD2014 ART CYCLE PROFILE
Type of ART and Procedural Factors a
IVF 100%Unstimulated 0%Used gestational carrier <1%
With ICSI 79%PGD/PGS 3%
Patient Diagnosis b
Tubal factor 8%Ovulatory dysfunction 39%Diminished ovarian reserve 22%Endometriosis 11%
Uterine factor 5%Male factor 8%Other factor 5%Unknown factor 2%
Multiple Factors: Female factors only 0%Female & male factors 0%
2014 ART SUCCESS RATES c Total number of cyclesd: 500 (includes 0 cycle[s] using frozen eggs)
Type of CycleAge of Woman
<35 35–37 38–40 41–42 43–44 >44Fresh Embryos from Nondonor Eggs
Number of cycles 125 71 46 17 4 2Percentage of cancellations before retrieval (%) 6.4 5.6 6.5 3 / 17 1 / 4 1 / 2Average number of embryos transferred 1.8 2.0 2.0 2.0 1.7 Percentage of embryos transferred resulting in implantation (%) 47.4 21.4 30.8 7.7 0 / 5 Percentage of elective single embryo transfers (eSET) (%) 18.3 1.8 2.8 0 / 12 0 / 2
Outcomes per CyclePercentage of cycles resulting in term, normal weight & singleton live births
e (%) 21.6 18.3 13.0 1 / 17 0 / 4 0 / 2
Percentage of cycles resulting in singleton live births (%) 25.6 18.3 17.4 1 / 17 0 / 4 0 / 2Percentage of cycles resulting in twin live births (%) 11.2 2.8 6.5 0 / 17 0 / 4 0 / 2Percentage of cycles resulting in live births (%) 39.2 21.1 26.1 1 / 17 0 / 4 0 / 2Percentage of cycles resulting in pregnancies (%) 44.0 28.2 37.0 2 / 17 0 / 4 0 / 2
Outcomes per TransferNumber of transfers 96 58 40 13 3 0Percentage of transfers resulting in term, normal weight & singleton live births
e (%) 28.1 22.4 15.0 1 / 13 0 / 3
Percentage of transfers resulting in singleton live births (%) 33.3 22.4 20.0 1 / 13 0 / 3 Percentage of transfers resulting in twin live births (%) 14.6 3.4 7.5 0 / 13 0 / 3 Percentage of transfers resulting in live births (%) 51.0 25.9 30.0 1 / 13 0 / 3 Percentage of transfers resulting in pregnancies (%) 57.3 34.5 42.5 2 / 13 0 / 3
Frozen Embryos from Nondonor EggsNumber of cycles 74 36 17 0 3 1Number of transfers 68 32 14 0 1 1Estimated average number of transfers per retrieval 2.1 1.3 1.3 0.0 0.3 0.5Average number of embryos transferred 1.8 1.7 1.7 2.0 1.0Percentage of embryos transferred resulting in implantation (%) 44.3 13.2 25.0 0 / 2 0 / 1Percentage of transfers resulting in term, normal weight & singleton live births
e (%) 36.8 6.3 4 / 14 0 / 1 0 / 1
Percentage of transfers resulting in singleton live births (%) 39.7 9.4 5 / 14 0 / 1 0 / 1Percentage of transfers resulting in twin live births (%) 11.8 6.3 0 / 14 0 / 1 0 / 1Percentage of transfers resulting in live births (%) 52.9 15.6 5 / 14 0 / 1 0 / 1Percentage of transfers resulting in pregnancies (%) 64.7 18.8 7 / 14 0 / 1 0 / 1
Number of Egg/Embryo Banking Cycles 6 6 4 6 3 2
Donor Eggs Fresh Embryosf Frozen Embryosf
Number of cycles 36 41Number of transfers 33 38Average number of embryos transferred 1.8 1.8Percentage of embryos transferred resulting in implantation (%) 59.3 50.0Percentage of transfers resulting in term, normal weight & singleton live births
e (%) 33.3 39.5
Percentage of transfers resulting in singleton live births (%) 48.5 44.7Percentage of transfers resulting in twin live births (%) 21.2 13.2Percentage of transfers resulting in live births (%) 69.7 57.9Percentage of transfers resulting in pregnancies (%) 72.7 71.1
CURRENT SERVICES & PROFILE Current Name: Center of Reproductive Medicine (CORM)
Donor eggs? YesDonor embryos? No
Gestational carriers? YesEmbryo cryopreservation? Yes
Single women? YesSART member? Yes
Verified lab accreditation? Yes(See Appendix C for details.)
a Reflects features of fresh nondonor cycles. If IVF is less than 100%, the remaining cycles are GIFT, ZIFT, or a combination of these procedures with IVF.
b Total patient diagnosis percentages may be greater than 100% because more than one diagnosis can be reported for each ART cycle.
c Fractions are used for rates with denominators less than 20. Multiple-infant births (for example, twins) with at least one live infant are counted as one live birth.
d Total cycle number includes those using frozen eggs. It excludes 0 cycle(s) evaluating new procedures. Both cycle types are excluded from ART success rates.
e In this report, births are defined as term if at least 37 full weeks gestation and normal birth weight if at least 2,500 grams (approximately 5 pounds, 8 ounces).
f All ages are reported together because previous data show that patient age does not materially affect success with donor eggs.

479
UTA
HUTAH FERTILITY CENTERPLEASANT GROVE, UTAH
Comparison of success rates across clinics may not be meaningful. Patient medical characteristics and treatment approaches vary (see pages 11–20).
Data verified by Russell Foulk, MD2014 ART CYCLE PROFILE
Type of ART and Procedural Factors a
IVF 100%Unstimulated 0%Used gestational carrier <1%
With ICSI 62%PGD/PGS <1%
Patient Diagnosis b
Tubal factor 18%Ovulatory dysfunction 21%Diminished ovarian reserve 17%Endometriosis 19%
Uterine factor 3%Male factor 35%Other factor 7%Unknown factor 7%
Multiple Factors: Female factors only 10%Female & male factors 16%
2014 ART SUCCESS RATES c Total number of cyclesd: 634 (includes 4 cycle[s] using frozen eggs)
Type of CycleAge of Woman
<35 35–37 38–40 41–42 43–44 >44Fresh Embryos from Nondonor Eggs
Number of cycles 241 56 32 11 6 2Percentage of cancellations before retrieval (%) 1.7 7.1 6.3 4 / 11 1 / 6 0 / 2Average number of embryos transferred 1.9 2.1 2.2 2.3 2.0 2.0Percentage of embryos transferred resulting in implantation (%) 47.4 40.0 24.6 3 / 9 0 / 8 0 / 4Percentage of elective single embryo transfers (eSET) (%) 12.8 2.3 0.0 0 / 3 0 / 3 0 / 1
Outcomes per CyclePercentage of cycles resulting in term, normal weight & singleton live births
e (%) 24.9 28.6 18.8 1 / 11 0 / 6 0 / 2
Percentage of cycles resulting in singleton live births (%) 32.4 33.9 18.8 1 / 11 0 / 6 0 / 2Percentage of cycles resulting in twin live births (%) 19.5 10.7 6.3 1 / 11 0 / 6 0 / 2Percentage of cycles resulting in live births (%) 52.7 44.6 25.0 2 / 11 0 / 6 0 / 2Percentage of cycles resulting in pregnancies (%) 60.2 51.8 37.5 2 / 11 0 / 6 0 / 2
Outcomes per TransferNumber of transfers 226 48 28 4 4 2Percentage of transfers resulting in term, normal weight & singleton live births
e (%) 26.5 33.3 21.4 1 / 4 0 / 4 0 / 2
Percentage of transfers resulting in singleton live births (%) 34.5 39.6 21.4 1 / 4 0 / 4 0 / 2Percentage of transfers resulting in twin live births (%) 20.8 12.5 7.1 1 / 4 0 / 4 0 / 2Percentage of transfers resulting in live births (%) 56.2 52.1 28.6 2 / 4 0 / 4 0 / 2Percentage of transfers resulting in pregnancies (%) 64.2 60.4 42.9 2 / 4 0 / 4 0 / 2
Frozen Embryos from Nondonor EggsNumber of cycles 131 23 15 5 0 3Number of transfers 130 22 15 5 0 3Estimated average number of transfers per retrieval 1.7 1.2 1.0 5.0 0.0 3.0Average number of embryos transferred 1.8 1.8 1.9 1.4 2.0Percentage of embryos transferred resulting in implantation (%) 59.8 54.3 63.6 0 / 5 2 / 6Percentage of transfers resulting in term, normal weight & singleton live births
e (%) 31.5 36.4 5 / 15 0 / 5 1 / 3
Percentage of transfers resulting in singleton live births (%) 39.2 59.1 5 / 15 0 / 5 1 / 3Percentage of transfers resulting in twin live births (%) 17.7 9.1 4 / 15 0 / 5 0 / 3Percentage of transfers resulting in live births (%) 57.7 68.2 9 / 15 0 / 5 1 / 3Percentage of transfers resulting in pregnancies (%) 80.0 81.8 12 / 15 1 / 5 2 / 3
Number of Egg/Embryo Banking Cycles 38 12 13 1 4 1
Donor Eggs Fresh Embryosf Frozen Embryosf
Number of cycles 26 10Number of transfers 26 10Average number of embryos transferred 1.8 1.3Percentage of embryos transferred resulting in implantation (%) 65.9 9 / 12Percentage of transfers resulting in term, normal weight & singleton live births
e (%) 38.5 4 / 10
Percentage of transfers resulting in singleton live births (%) 57.7 5 / 10Percentage of transfers resulting in twin live births (%) 15.4 2 / 10Percentage of transfers resulting in live births (%) 76.9 7 / 10Percentage of transfers resulting in pregnancies (%) 84.6 8 / 10
CURRENT SERVICES & PROFILE Current Name: Utah Fertility Center
Donor eggs? YesDonor embryos? Yes
Gestational carriers? YesEmbryo cryopreservation? Yes
Single women? YesSART member? Yes
Verified lab accreditation? Yes(See Appendix C for details.)
a Reflects features of fresh nondonor cycles. If IVF is less than 100%, the remaining cycles are GIFT, ZIFT, or a combination of these procedures with IVF.
b Total patient diagnosis percentages may be greater than 100% because more than one diagnosis can be reported for each ART cycle.
c Fractions are used for rates with denominators less than 20. Multiple-infant births (for example, twins) with at least one live infant are counted as one live birth.
d Total cycle number includes those using frozen eggs. It excludes 0 cycle(s) evaluating new procedures. Both cycle types are excluded from ART success rates.
e In this report, births are defined as term if at least 37 full weeks gestation and normal birth weight if at least 2,500 grams (approximately 5 pounds, 8 ounces).
f All ages are reported together because previous data show that patient age does not materially affect success with donor eggs.
480
UTA
HEAST BAY FERTILITY CENTER
PROVO, UTAH
This clinic provided ART services during 2014 and is therefore required to submit ART cycle data under the provisions of the Fertility Clinic Success Rate and Certification Act. This clinic either did not submit 2014 ART cycle data or the clinic’s Medical Director did not approve the clinic’s 2014 ART cycle data for inclusion in this report.

481
UTA
HUTAH CENTER FOR REPRODUCTIVE MEDICINE
SALT LAKE CITY, UTAHComparison of success rates across clinics may not be meaningful. Patient medical characteristics and treatment approaches vary (see pages 11–20).
Data verified by Erica B. Johnstone, MD2014 ART CYCLE PROFILE
Type of ART and Procedural Factors a
IVF 100%Unstimulated 0%Used gestational carrier <1%
With ICSI 50%PGD/PGS <1%
Patient Diagnosis b
Tubal factor 12%Ovulatory dysfunction 16%Diminished ovarian reserve 24%Endometriosis 11%
Uterine factor 2%Male factor 41%Other factor 16%Unknown factor 10%
Multiple Factors: Female factors only 12%Female & male factors 15%
2014 ART SUCCESS RATES c Total number of cyclesd: 638 (includes 2 cycle[s] using frozen eggs)
Type of CycleAge of Woman
<35 35–37 38–40 41–42 43–44 >44Fresh Embryos from Nondonor Eggs
Number of cycles 214 68 28 16 7 2Percentage of cancellations before retrieval (%) 1.9 7.4 10.7 3 / 16 2 / 7 0 / 2Average number of embryos transferred 1.7 1.9 2.2 2.1 3.0 Percentage of embryos transferred resulting in implantation (%) 60.1 46.2 37.5 2 / 14 0 / 3 Percentage of elective single embryo transfers (eSET) (%) 26.7 6.5 0 / 17 1 / 7 0 / 1
Outcomes per CyclePercentage of cycles resulting in term, normal weight & singleton live births
e (%) 28.0 26.5 17.9 1 / 16 0 / 7 0 / 2
Percentage of cycles resulting in singleton live births (%) 32.2 36.8 17.9 1 / 16 0 / 7 0 / 2Percentage of cycles resulting in twin live births (%) 17.8 7.4 10.7 0 / 16 0 / 7 0 / 2Percentage of cycles resulting in live births (%) 50.5 45.6 32.1 1 / 16 0 / 7 0 / 2Percentage of cycles resulting in pregnancies (%) 56.1 50.0 35.7 3 / 16 0 / 7 0 / 2
Outcomes per TransferNumber of transfers 165 50 19 8 1 0Percentage of transfers resulting in term, normal weight & singleton live births
e (%) 36.4 36.0 5 / 19 1 / 8 0 / 1
Percentage of transfers resulting in singleton live births (%) 41.8 50.0 5 / 19 1 / 8 0 / 1 Percentage of transfers resulting in twin live births (%) 23.0 10.0 3 / 19 0 / 8 0 / 1 Percentage of transfers resulting in live births (%) 65.5 62.0 9 / 19 1 / 8 0 / 1 Percentage of transfers resulting in pregnancies (%) 72.7 68.0 10 / 19 3 / 8 0 / 1
Frozen Embryos from Nondonor EggsNumber of cycles 119 29 15 8 7 2Number of transfers 115 29 15 8 7 1Estimated average number of transfers per retrieval 2.0 1.9 1.1 0.7 0.8 1.0Average number of embryos transferred 1.8 1.7 1.9 1.3 1.3 3.0Percentage of embryos transferred resulting in implantation (%) 44.2 47.8 34.5 1 / 8 3 / 7 0 / 3Percentage of transfers resulting in term, normal weight & singleton live births
e (%) 27.8 41.4 4 / 15 1 / 8 2 / 7 0 / 1
Percentage of transfers resulting in singleton live births (%) 34.8 44.8 7 / 15 1 / 8 2 / 7 0 / 1Percentage of transfers resulting in twin live births (%) 15.7 13.8 1 / 15 0 / 8 0 / 7 0 / 1Percentage of transfers resulting in live births (%) 50.4 58.6 8 / 15 1 / 8 2 / 7 0 / 1Percentage of transfers resulting in pregnancies (%) 59.1 65.5 9 / 15 3 / 8 4 / 7 0 / 1
Number of Egg/Embryo Banking Cycles 20 8 11 9 7 1
Donor Eggs Fresh Embryosf Frozen Embryosf
Number of cycles 46 19Number of transfers 41 18Average number of embryos transferred 1.6 1.7Percentage of embryos transferred resulting in implantation (%) 56.3 48.3Percentage of transfers resulting in term, normal weight & singleton live births
e (%) 19.5 4 / 18
Percentage of transfers resulting in singleton live births (%) 34.1 8 / 18Percentage of transfers resulting in twin live births (%) 19.5 2 / 18Percentage of transfers resulting in live births (%) 56.1 10 / 18Percentage of transfers resulting in pregnancies (%) 68.3 13 / 18
CURRENT SERVICES & PROFILE Current Name: Utah Center for Reproductive Medicine
Donor eggs? YesDonor embryos? No
Gestational carriers? YesEmbryo cryopreservation? Yes
Single women? YesSART member? Yes
Verified lab accreditation? Yes(See Appendix C for details.)
a Reflects features of fresh nondonor cycles. If IVF is less than 100%, the remaining cycles are GIFT, ZIFT, or a combination of these procedures with IVF.
b Total patient diagnosis percentages may be greater than 100% because more than one diagnosis can be reported for each ART cycle.
c Fractions are used for rates with denominators less than 20. Multiple-infant births (for example, twins) with at least one live infant are counted as one live birth.
d Total cycle number includes those using frozen eggs. It excludes 0 cycle(s) evaluating new procedures. Both cycle types are excluded from ART success rates.
e In this report, births are defined as term if at least 37 full weeks gestation and normal birth weight if at least 2,500 grams (approximately 5 pounds, 8 ounces).
f All ages are reported together because previous data show that patient age does not materially affect success with donor eggs.

482
UTA
HREPRODUCTIVE CARE CENTER
SANDY, UTAHComparison of success rates across clinics may not be meaningful. Patient medical characteristics and treatment approaches vary (see pages 11–20).
Data verified by Keith L. Blauer, MD2014 ART CYCLE PROFILE
Type of ART and Procedural Factors a
IVF 100%Unstimulated 0%Used gestational carrier <1%
With ICSI 65%PGD/PGS 3%
Patient Diagnosis b
Tubal factor 8%Ovulatory dysfunction 34%Diminished ovarian reserve 23%Endometriosis 16%
Uterine factor 3%Male factor 55%Other factor 8%Unknown factor 2%
Multiple Factors: Female factors only 10%Female & male factors 33%
2014 ART SUCCESS RATES c Total number of cyclesd: 558 (includes 47 cycle[s] using frozen eggs)
Type of CycleAge of Woman
<35 35–37 38–40 41–42 43–44 >44Fresh Embryos from Nondonor Eggs
Number of cycles 173 64 43 13 2 0Percentage of cancellations before retrieval (%) 0.6 3.1 0.0 0 / 13 0 / 2 Average number of embryos transferred 1.9 2.1 2.1 2.1 3.5 Percentage of embryos transferred resulting in implantation (%) 49.8 20.4 35.6 17.4 1 / 7 Percentage of elective single embryo transfers (eSET) (%) 13.0 11.8 9.4 0 / 9 0 / 2
Outcomes per CyclePercentage of cycles resulting in term, normal weight & singleton live births
e (%) 29.5 15.6 30.2 2 / 13 0 / 2
Percentage of cycles resulting in singleton live births (%) 31.8 20.3 32.6 2 / 13 0 / 2 Percentage of cycles resulting in twin live births (%) 22.0 4.7 2.3 0 / 13 0 / 2 Percentage of cycles resulting in live births (%) 53.8 25.0 37.2 2 / 13 0 / 2 Percentage of cycles resulting in pregnancies (%) 59.5 31.3 58.1 3 / 13 1 / 2
Outcomes per TransferNumber of transfers 156 55 38 11 2 0Percentage of transfers resulting in term, normal weight & singleton live births
e (%) 32.7 18.2 34.2 2 / 11 0 / 2
Percentage of transfers resulting in singleton live births (%) 35.3 23.6 36.8 2 / 11 0 / 2 Percentage of transfers resulting in twin live births (%) 24.4 5.5 2.6 0 / 11 0 / 2 Percentage of transfers resulting in live births (%) 59.6 29.1 42.1 2 / 11 0 / 2 Percentage of transfers resulting in pregnancies (%) 66.0 36.4 65.8 3 / 11 1 / 2
Frozen Embryos from Nondonor EggsNumber of cycles 92 38 20 4 0 0Number of transfers 90 33 18 4 0 0Estimated average number of transfers per retrieval 2.1 2.4 1.5 2.0 0.0Average number of embryos transferred 1.6 1.6 1.7 1.8 Percentage of embryos transferred resulting in implantation (%) 34.3 38.5 14.3 2 / 7 Percentage of transfers resulting in term, normal weight & singleton live births
e (%) 27.8 30.3 1 / 18 2 / 4
Percentage of transfers resulting in singleton live births (%) 33.3 36.4 1 / 18 2 / 4 Percentage of transfers resulting in twin live births (%) 6.7 6.1 1 / 18 0 / 4 Percentage of transfers resulting in live births (%) 40.0 42.4 2 / 18 2 / 4 Percentage of transfers resulting in pregnancies (%) 48.9 54.5 4 / 18 2 / 4
Number of Egg/Embryo Banking Cycles 3 4 6 1 0 2
Donor Eggs Fresh Embryosf Frozen Embryosf
Number of cycles 22 24Number of transfers 20 21Average number of embryos transferred 2.0 1.7Percentage of embryos transferred resulting in implantation (%) 27.0 22.2Percentage of transfers resulting in term, normal weight & singleton live births
e (%) 30.0 38.1
Percentage of transfers resulting in singleton live births (%) 30.0 38.1Percentage of transfers resulting in twin live births (%) 5.0 0.0Percentage of transfers resulting in live births (%) 35.0 38.1Percentage of transfers resulting in pregnancies (%) 40.0 38.1
CURRENT SERVICES & PROFILE Current Name: Reproductive Care Center
Donor eggs? YesDonor embryos? Yes
Gestational carriers? YesEmbryo cryopreservation? Yes
Single women? NoSART member? Yes
Verified lab accreditation? Yes(See Appendix C for details.)
a Reflects features of fresh nondonor cycles. If IVF is less than 100%, the remaining cycles are GIFT, ZIFT, or a combination of these procedures with IVF.
b Total patient diagnosis percentages may be greater than 100% because more than one diagnosis can be reported for each ART cycle.
c Fractions are used for rates with denominators less than 20. Multiple-infant births (for example, twins) with at least one live infant are counted as one live birth.
d Total cycle number includes those using frozen eggs. It excludes 0 cycle(s) evaluating new procedures. Both cycle types are excluded from ART success rates.
e In this report, births are defined as term if at least 37 full weeks gestation and normal birth weight if at least 2,500 grams (approximately 5 pounds, 8 ounces).
f All ages are reported together because previous data show that patient age does not materially affect success with donor eggs.

483
VE
RM
ON
TUNIVERSITY OF VERMONT MEDICAL CENTER
VERMONT CENTER FOR REPRODUCTIVE MEDICINEBURLINGTON, VERMONT
Comparison of success rates across clinics may not be meaningful. Patient medical characteristics and treatment approaches vary (see pages 11–20).
Data verified by Elizabeth McGee, MD2014 ART CYCLE PROFILE
Type of ART and Procedural Factors a
IVF 100%Unstimulated 0%Used gestational carrier 2%
With ICSI 36%PGD/PGS 2%
Patient Diagnosis b
Tubal factor 6%Ovulatory dysfunction 6%Diminished ovarian reserve 40%Endometriosis 1%
Uterine factor 6%Male factor 43%Other factor 17%Unknown factor 13%
Multiple Factors: Female factors only 14%Female & male factors 14%
2014 ART SUCCESS RATES c Total number of cyclesd: 73 (includes 0 cycle[s] using frozen eggs)
Type of CycleAge of Woman
<35 35–37 38–40 41–42 43–44 >44Fresh Embryos from Nondonor Eggs
Number of cycles 18 15 8 4 0 0Percentage of cancellations before retrieval (%) 5 / 18 6 / 15 1 / 8 1 / 4 Average number of embryos transferred 1.7 1.3 1.7 3.0 Percentage of embryos transferred resulting in implantation (%) 50.0 5 / 12 3 / 10 0 / 9 Percentage of elective single embryo transfers (eSET) (%) 3 / 10 5 / 8 1 / 5 0 / 3
Outcomes per CyclePercentage of cycles resulting in term, normal weight & singleton live births
e (%) 4 / 18 4 / 15 1 / 8 0 / 4
Percentage of cycles resulting in singleton live births (%) 5 / 18 5 / 15 2 / 8 0 / 4 Percentage of cycles resulting in twin live births (%) 2 / 18 0 / 15 0 / 8 0 / 4 Percentage of cycles resulting in live births (%) 7 / 18 5 / 15 2 / 8 0 / 4 Percentage of cycles resulting in pregnancies (%) 8 / 18 5 / 15 3 / 8 0 / 4
Outcomes per TransferNumber of transfers 12 9 6 3 0 0Percentage of transfers resulting in term, normal weight & singleton live births
e (%) 4 / 12 4 / 9 1 / 6 0 / 3
Percentage of transfers resulting in singleton live births (%) 5 / 12 5 / 9 2 / 6 0 / 3 Percentage of transfers resulting in twin live births (%) 2 / 12 0 / 9 0 / 6 0 / 3 Percentage of transfers resulting in live births (%) 7 / 12 5 / 9 2 / 6 0 / 3 Percentage of transfers resulting in pregnancies (%) 8 / 12 5 / 9 3 / 6 0 / 3
Frozen Embryos from Nondonor EggsNumber of cycles 2 7 4 1 1 0Number of transfers 2 7 4 1 1 0Estimated average number of transfers per retrieval 0.7 2.3 2.0 Average number of embryos transferred 1.0 1.1 1.3 1.0 1.0 Percentage of embryos transferred resulting in implantation (%) 1 / 2 3 / 7 0 / 4 0 / 1 0 / 1 Percentage of transfers resulting in term, normal weight & singleton live births
e (%) 1 / 2 1 / 7 0 / 4 0 / 1 0 / 1
Percentage of transfers resulting in singleton live births (%) 1 / 2 1 / 7 0 / 4 0 / 1 0 / 1 Percentage of transfers resulting in twin live births (%) 0 / 2 1 / 7 0 / 4 0 / 1 0 / 1 Percentage of transfers resulting in live births (%) 1 / 2 2 / 7 0 / 4 0 / 1 0 / 1 Percentage of transfers resulting in pregnancies (%) 1 / 2 3 / 7 1 / 4 0 / 1 0 / 1
Number of Egg/Embryo Banking Cycles 1 0 0 0 0 0
Donor Eggs Fresh Embryosf Frozen Embryosf
Number of cycles 6 6Number of transfers 4 6Average number of embryos transferred 1.5 1.0Percentage of embryos transferred resulting in implantation (%) 3 / 4 1 / 6Percentage of transfers resulting in term, normal weight & singleton live births
e (%) 3 / 4 1 / 6
Percentage of transfers resulting in singleton live births (%) 3 / 4 1 / 6Percentage of transfers resulting in twin live births (%) 0 / 4 0 / 6Percentage of transfers resulting in live births (%) 3 / 4 1 / 6Percentage of transfers resulting in pregnancies (%) 4 / 4 1 / 6
CURRENT SERVICES & PROFILE This clinic has reorganized since 2014. Contact the NASS Help Desk for further information.
Current Name: University of Vermont Medical Center, Vermont Center for Reproductive Medicine
Donor eggs? YesDonor embryos? No
Gestational carriers? YesEmbryo cryopreservation? Yes
Single women? YesSART member? Yes
Verified lab accreditation? Yes(See Appendix C for details.)
a Reflects features of fresh nondonor cycles. If IVF is less than 100%, the remaining cycles are GIFT, ZIFT, or a combination of these procedures with IVF.
b Total patient diagnosis percentages may be greater than 100% because more than one diagnosis can be reported for each ART cycle.
c Fractions are used for rates with denominators less than 20. Multiple-infant births (for example, twins) with at least one live infant are counted as one live birth.
d Total cycle number includes those using frozen eggs. It excludes 0 cycle(s) evaluating new procedures. Both cycle types are excluded from ART success rates.
e In this report, births are defined as term if at least 37 full weeks gestation and normal birth weight if at least 2,500 grams (approximately 5 pounds, 8 ounces).
f All ages are reported together because previous data show that patient age does not materially affect success with donor eggs.

484
VE
RM
ON
TNORTHEASTERN REPRODUCTIVE MEDICINE
COLCHESTER, VERMONTComparison of success rates across clinics may not be meaningful. Patient medical characteristics and treatment approaches vary (see pages 11–20).
Data verified by Peter R. Casson, MD2014 ART CYCLE PROFILE
Type of ART and Procedural Factors a
IVF 100%Unstimulated 0%Used gestational carrier 4%
With ICSI 52%PGD/PGS 0%
Patient Diagnosis b
Tubal factor 7%Ovulatory dysfunction 3%Diminished ovarian reserve 23%Endometriosis 13%
Uterine factor 0%Male factor 37%Other factor 3%Unknown factor 27%
Multiple Factors: Female factors only 0%Female & male factors 10%
2014 ART SUCCESS RATES c Total number of cyclesd: 31 (includes 0 cycle[s] using frozen eggs)
Type of CycleAge of Woman
<35 35–37 38–40 41–42 43–44 >44Fresh Embryos from Nondonor Eggs
Number of cycles 14 6 4 0 2 1Percentage of cancellations before retrieval (%) 0 / 14 1 / 6 1 / 4 0 / 2 0 / 1Average number of embryos transferred 1.7 1.8 2.0 1.5 3.0Percentage of embryos transferred resulting in implantation (%) 7 / 19 4 / 9 0 / 6 1 / 3 0 / 3Percentage of elective single embryo transfers (eSET) (%) 4 / 11 0 / 4 0 / 3 0 / 1 0 / 1
Outcomes per CyclePercentage of cycles resulting in term, normal weight & singleton live births
e (%) 6 / 14 2 / 6 0 / 4 0 / 2 0 / 1
Percentage of cycles resulting in singleton live births (%) 6 / 14 2 / 6 0 / 4 0 / 2 0 / 1Percentage of cycles resulting in twin live births (%) 0 / 14 1 / 6 0 / 4 0 / 2 0 / 1Percentage of cycles resulting in live births (%) 6 / 14 3 / 6 0 / 4 0 / 2 0 / 1Percentage of cycles resulting in pregnancies (%) 7 / 14 3 / 6 0 / 4 1 / 2 0 / 1
Outcomes per TransferNumber of transfers 12 5 3 0 2 1Percentage of transfers resulting in term, normal weight & singleton live births
e (%) 6 / 12 2 / 5 0 / 3 0 / 2 0 / 1
Percentage of transfers resulting in singleton live births (%) 6 / 12 2 / 5 0 / 3 0 / 2 0 / 1Percentage of transfers resulting in twin live births (%) 0 / 12 1 / 5 0 / 3 0 / 2 0 / 1Percentage of transfers resulting in live births (%) 6 / 12 3 / 5 0 / 3 0 / 2 0 / 1Percentage of transfers resulting in pregnancies (%) 7 / 12 3 / 5 0 / 3 1 / 2 0 / 1
Frozen Embryos from Nondonor EggsNumber of cycles 0 1 1 0 0 0Number of transfers 0 1 1 0 0 0Estimated average number of transfers per retrieval 1.0 Average number of embryos transferred 1.0 2.0 Percentage of embryos transferred resulting in implantation (%) 1 / 1 1 / 2 Percentage of transfers resulting in term, normal weight & singleton live births
e (%) 1 / 1 1 / 1
Percentage of transfers resulting in singleton live births (%) 1 / 1 1 / 1 Percentage of transfers resulting in twin live births (%) 0 / 1 0 / 1 Percentage of transfers resulting in live births (%) 1 / 1 1 / 1 Percentage of transfers resulting in pregnancies (%) 1 / 1 1 / 1
Number of Egg/Embryo Banking Cycles 0 1 0 0 0 0
Donor Eggs Fresh Embryosf Frozen Embryosf
Number of cycles 0 1Number of transfers 0 1Average number of embryos transferred 1.0Percentage of embryos transferred resulting in implantation (%) 0 / 1Percentage of transfers resulting in term, normal weight & singleton live births
e (%) 0 / 1
Percentage of transfers resulting in singleton live births (%) 0 / 1Percentage of transfers resulting in twin live births (%) 0 / 1Percentage of transfers resulting in live births (%) 0 / 1Percentage of transfers resulting in pregnancies (%) 0 / 1
CURRENT SERVICES & PROFILE Current Name: Northeastern Reproductive Medicine
Donor eggs? YesDonor embryos? Yes
Gestational carriers? YesEmbryo cryopreservation? Yes
Single women? YesSART member? Yes
Verified lab accreditation? Yes(See Appendix C for details.)
a Reflects features of fresh nondonor cycles. If IVF is less than 100%, the remaining cycles are GIFT, ZIFT, or a combination of these procedures with IVF.
b Total patient diagnosis percentages may be greater than 100% because more than one diagnosis can be reported for each ART cycle.
c Fractions are used for rates with denominators less than 20. Multiple-infant births (for example, twins) with at least one live infant are counted as one live birth.
d Total cycle number includes those using frozen eggs. It excludes 0 cycle(s) evaluating new procedures. Both cycle types are excluded from ART success rates.
e In this report, births are defined as term if at least 37 full weeks gestation and normal birth weight if at least 2,500 grams (approximately 5 pounds, 8 ounces).
f All ages are reported together because previous data show that patient age does not materially affect success with donor eggs.
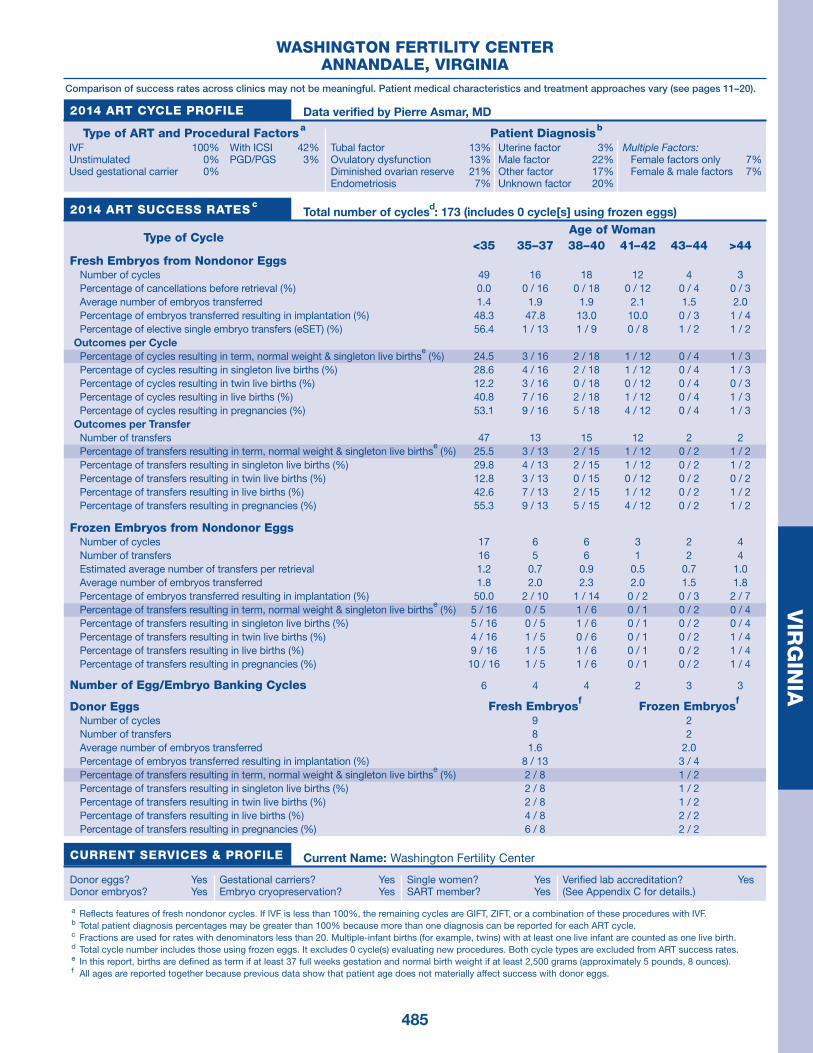
485
VIR
GIN
IAWASHINGTON FERTILITY CENTER
ANNANDALE, VIRGINIAComparison of success rates across clinics may not be meaningful. Patient medical characteristics and treatment approaches vary (see pages 11–20).
Data verified by Pierre Asmar, MD2014 ART CYCLE PROFILE
Type of ART and Procedural Factors a
IVF 100%Unstimulated 0%Used gestational carrier 0%
With ICSI 42%PGD/PGS 3%
Patient Diagnosis b
Tubal factor 13%Ovulatory dysfunction 13%Diminished ovarian reserve 21%Endometriosis 7%
Uterine factor 3%Male factor 22%Other factor 17%Unknown factor 20%
Multiple Factors: Female factors only 7%Female & male factors 7%
2014 ART SUCCESS RATES c Total number of cyclesd: 173 (includes 0 cycle[s] using frozen eggs)
Type of CycleAge of Woman
<35 35–37 38–40 41–42 43–44 >44Fresh Embryos from Nondonor Eggs
Number of cycles 49 16 18 12 4 3Percentage of cancellations before retrieval (%) 0.0 0 / 16 0 / 18 0 / 12 0 / 4 0 / 3Average number of embryos transferred 1.4 1.9 1.9 2.1 1.5 2.0Percentage of embryos transferred resulting in implantation (%) 48.3 47.8 13.0 10.0 0 / 3 1 / 4Percentage of elective single embryo transfers (eSET) (%) 56.4 1 / 13 1 / 9 0 / 8 1 / 2 1 / 2
Outcomes per CyclePercentage of cycles resulting in term, normal weight & singleton live births
e (%) 24.5 3 / 16 2 / 18 1 / 12 0 / 4 1 / 3
Percentage of cycles resulting in singleton live births (%) 28.6 4 / 16 2 / 18 1 / 12 0 / 4 1 / 3Percentage of cycles resulting in twin live births (%) 12.2 3 / 16 0 / 18 0 / 12 0 / 4 0 / 3Percentage of cycles resulting in live births (%) 40.8 7 / 16 2 / 18 1 / 12 0 / 4 1 / 3Percentage of cycles resulting in pregnancies (%) 53.1 9 / 16 5 / 18 4 / 12 0 / 4 1 / 3
Outcomes per TransferNumber of transfers 47 13 15 12 2 2Percentage of transfers resulting in term, normal weight & singleton live births
e (%) 25.5 3 / 13 2 / 15 1 / 12 0 / 2 1 / 2
Percentage of transfers resulting in singleton live births (%) 29.8 4 / 13 2 / 15 1 / 12 0 / 2 1 / 2Percentage of transfers resulting in twin live births (%) 12.8 3 / 13 0 / 15 0 / 12 0 / 2 0 / 2Percentage of transfers resulting in live births (%) 42.6 7 / 13 2 / 15 1 / 12 0 / 2 1 / 2Percentage of transfers resulting in pregnancies (%) 55.3 9 / 13 5 / 15 4 / 12 0 / 2 1 / 2
Frozen Embryos from Nondonor EggsNumber of cycles 17 6 6 3 2 4Number of transfers 16 5 6 1 2 4Estimated average number of transfers per retrieval 1.2 0.7 0.9 0.5 0.7 1.0Average number of embryos transferred 1.8 2.0 2.3 2.0 1.5 1.8Percentage of embryos transferred resulting in implantation (%) 50.0 2 / 10 1 / 14 0 / 2 0 / 3 2 / 7Percentage of transfers resulting in term, normal weight & singleton live births
e (%) 5 / 16 0 / 5 1 / 6 0 / 1 0 / 2 0 / 4
Percentage of transfers resulting in singleton live births (%) 5 / 16 0 / 5 1 / 6 0 / 1 0 / 2 0 / 4Percentage of transfers resulting in twin live births (%) 4 / 16 1 / 5 0 / 6 0 / 1 0 / 2 1 / 4Percentage of transfers resulting in live births (%) 9 / 16 1 / 5 1 / 6 0 / 1 0 / 2 1 / 4Percentage of transfers resulting in pregnancies (%) 10 / 16 1 / 5 1 / 6 0 / 1 0 / 2 1 / 4
Number of Egg/Embryo Banking Cycles 6 4 4 2 3 3
Donor Eggs Fresh Embryosf Frozen Embryosf
Number of cycles 9 2Number of transfers 8 2Average number of embryos transferred 1.6 2.0Percentage of embryos transferred resulting in implantation (%) 8 / 13 3 / 4Percentage of transfers resulting in term, normal weight & singleton live births
e (%) 2 / 8 1 / 2
Percentage of transfers resulting in singleton live births (%) 2 / 8 1 / 2Percentage of transfers resulting in twin live births (%) 2 / 8 1 / 2Percentage of transfers resulting in live births (%) 4 / 8 2 / 2Percentage of transfers resulting in pregnancies (%) 6 / 8 2 / 2
CURRENT SERVICES & PROFILE Current Name: Washington Fertility Center
Donor eggs? YesDonor embryos? Yes
Gestational carriers? YesEmbryo cryopreservation? Yes
Single women? YesSART member? Yes
Verified lab accreditation? Yes(See Appendix C for details.)
a Reflects features of fresh nondonor cycles. If IVF is less than 100%, the remaining cycles are GIFT, ZIFT, or a combination of these procedures with IVF.
b Total patient diagnosis percentages may be greater than 100% because more than one diagnosis can be reported for each ART cycle.
c Fractions are used for rates with denominators less than 20. Multiple-infant births (for example, twins) with at least one live infant are counted as one live birth.
d Total cycle number includes those using frozen eggs. It excludes 0 cycle(s) evaluating new procedures. Both cycle types are excluded from ART success rates.
e In this report, births are defined as term if at least 37 full weeks gestation and normal birth weight if at least 2,500 grams (approximately 5 pounds, 8 ounces).
f All ages are reported together because previous data show that patient age does not materially affect success with donor eggs.

486
VIR
GIN
IADOMINION FERTILITY AND ENDOCRINOLOGY
ARLINGTON, VIRGINIAComparison of success rates across clinics may not be meaningful. Patient medical characteristics and treatment approaches vary (see pages 11–20).
Data verified by Michael Dimattina, MD2014 ART CYCLE PROFILE
Type of ART and Procedural Factors a
IVF >99%Unstimulated 76%Used gestational carrier 0%
With ICSI 61%PGD/PGS <1%
Patient Diagnosis b
Tubal factor 14%Ovulatory dysfunction 6%Diminished ovarian reserve 40%Endometriosis 4%
Uterine factor 5%Male factor 33%Other factor 69%Unknown factor 7%
Multiple Factors: Female factors only 36%Female & male factors 25%
2014 ART SUCCESS RATES c Total number of cyclesd: 1,485 (includes 5 cycle[s] using frozen eggs)
Type of CycleAge of Woman
<35 35–37 38–40 41–42 43–44 >44Fresh Embryos from Nondonor Eggs
Number of cycles 167 109 185 106 103 146Percentage of cancellations before retrieval (%) 20.4 28.4 24.3 17.9 26.2 34.2Average number of embryos transferred 1.0 1.2 1.1 1.3 1.3 1.2Percentage of embryos transferred resulting in implantation (%) 26.4 28.6 17.4 19.0 0.0 2.4Percentage of elective single embryo transfers (eSET) (%) 7 / 11 2 / 11 2 / 12 0 / 11 0 / 7 0 / 5
Outcomes per CyclePercentage of cycles resulting in term, normal weight & singleton live births
e (%) 10.8 11.0 4.3 4.7 0.0 0.7
Percentage of cycles resulting in singleton live births (%) 11.4 12.8 5.9 5.7 0.0 0.7Percentage of cycles resulting in twin live births (%) 0.0 0.0 0.0 1.9 0.0 0.0Percentage of cycles resulting in live births (%) 11.4 12.8 5.9 7.5 0.0 0.7Percentage of cycles resulting in pregnancies (%) 15.6 14.7 9.7 10.4 1.0 0.7
Outcomes per TransferNumber of transfers 86 47 87 48 43 37Percentage of transfers resulting in term, normal weight & singleton live births
e (%) 20.9 25.5 9.2 10.4 0.0 2.7
Percentage of transfers resulting in singleton live births (%) 22.1 29.8 12.6 12.5 0.0 2.7Percentage of transfers resulting in twin live births (%) 0.0 0.0 0.0 4.2 0.0 0.0Percentage of transfers resulting in live births (%) 22.1 29.8 12.6 16.7 0.0 2.7Percentage of transfers resulting in pregnancies (%) 30.2 34.0 20.7 22.9 2.3 2.7
Frozen Embryos from Nondonor EggsNumber of cycles 127 78 58 19 3 4Number of transfers 122 72 49 15 3 2Estimated average number of transfers per retrieval 1.2 1.0 0.9 0.3 0.1 0.0Average number of embryos transferred 1.2 1.1 1.3 1.4 1.3 1.0Percentage of embryos transferred resulting in implantation (%) 48.3 43.6 32.2 19.0 2 / 4 1 / 2Percentage of transfers resulting in term, normal weight & singleton live births
e (%) 39.3 30.6 22.4 4 / 15 2 / 3 1 / 2
Percentage of transfers resulting in singleton live births (%) 43.4 41.7 28.6 4 / 15 2 / 3 1 / 2Percentage of transfers resulting in twin live births (%) 3.3 0.0 2.0 0 / 15 0 / 3 0 / 2Percentage of transfers resulting in live births (%) 46.7 41.7 30.6 4 / 15 2 / 3 1 / 2Percentage of transfers resulting in pregnancies (%) 51.6 48.6 38.8 4 / 15 2 / 3 1 / 2
Number of Egg/Embryo Banking Cycles 76 53 46 40 37 43
Donor Eggs Fresh Embryosf Frozen Embryosf
Number of cycles 22 58Number of transfers 17 53Average number of embryos transferred 1.2 1.0Percentage of embryos transferred resulting in implantation (%) 70.0 42.3Percentage of transfers resulting in term, normal weight & singleton live births
e (%) 9 / 17 28.3
Percentage of transfers resulting in singleton live births (%) 10 / 17 35.8Percentage of transfers resulting in twin live births (%) 2 / 17 1.9Percentage of transfers resulting in live births (%) 12 / 17 37.7Percentage of transfers resulting in pregnancies (%) 12 / 17 43.4
CURRENT SERVICES & PROFILE Current Name: Dominion Fertility and Endocrinology
Donor eggs? YesDonor embryos? Yes
Gestational carriers? YesEmbryo cryopreservation? Yes
Single women? YesSART member? Yes
Verified lab accreditation? Yes(See Appendix C for details.)
a Reflects features of fresh nondonor cycles. If IVF is less than 100%, the remaining cycles are GIFT, ZIFT, or a combination of these procedures with IVF.
b Total patient diagnosis percentages may be greater than 100% because more than one diagnosis can be reported for each ART cycle.
c Fractions are used for rates with denominators less than 20. Multiple-infant births (for example, twins) with at least one live infant are counted as one live birth.
d Total cycle number includes those using frozen eggs. It excludes 0 cycle(s) evaluating new procedures. Both cycle types are excluded from ART success rates.
e In this report, births are defined as term if at least 37 full weeks gestation and normal birth weight if at least 2,500 grams (approximately 5 pounds, 8 ounces).
f All ages are reported together because previous data show that patient age does not materially affect success with donor eggs.

487
VIR
GIN
IAREPRODUCTIVE MEDICINE AND SURGERY CENTER OF VIRGINIA, PLC
CHARLOTTESVILLE, VIRGINIAComparison of success rates across clinics may not be meaningful. Patient medical characteristics and treatment approaches vary (see pages 11–20).
Data verified by Christopher D. Williams, MD2014 ART CYCLE PROFILE
Type of ART and Procedural Factors a
IVF 100%Unstimulated 0%Used gestational carrier 2%
With ICSI 51%PGD/PGS 0%
Patient Diagnosis b
Tubal factor 20%Ovulatory dysfunction 12%Diminished ovarian reserve 27%Endometriosis 24%
Uterine factor 11%Male factor 39%Other factor 14%Unknown factor 8%
Multiple Factors: Female factors only 20%Female & male factors 22%
2014 ART SUCCESS RATES c Total number of cyclesd: 268 (includes 0 cycle[s] using frozen eggs)
Type of CycleAge of Woman
<35 35–37 38–40 41–42 43–44 >44Fresh Embryos from Nondonor Eggs
Number of cycles 85 27 23 3 0 0Percentage of cancellations before retrieval (%) 14.1 11.1 26.1 0 / 3 Average number of embryos transferred 1.8 2.2 2.7 3.0 Percentage of embryos transferred resulting in implantation (%) 49.5 28.0 7.9 1 / 9 Percentage of elective single embryo transfers (eSET) (%) 17.5 0.0 0 / 14 0 / 2
Outcomes per CyclePercentage of cycles resulting in term, normal weight & singleton live births
e (%) 25.9 33.3 8.7 1 / 3
Percentage of cycles resulting in singleton live births (%) 28.2 37.0 8.7 1 / 3 Percentage of cycles resulting in twin live births (%) 11.8 7.4 0.0 0 / 3 Percentage of cycles resulting in live births (%) 40.0 44.4 8.7 1 / 3 Percentage of cycles resulting in pregnancies (%) 47.1 48.1 17.4 1 / 3
Outcomes per TransferNumber of transfers 60 24 15 3 0 0Percentage of transfers resulting in term, normal weight & singleton live births
e (%) 36.7 37.5 2 / 15 1 / 3
Percentage of transfers resulting in singleton live births (%) 40.0 41.7 2 / 15 1 / 3 Percentage of transfers resulting in twin live births (%) 16.7 8.3 0 / 15 0 / 3 Percentage of transfers resulting in live births (%) 56.7 50.0 2 / 15 1 / 3 Percentage of transfers resulting in pregnancies (%) 66.7 54.2 4 / 15 1 / 3
Frozen Embryos from Nondonor EggsNumber of cycles 43 9 12 5 0 0Number of transfers 42 9 11 4 0 0Estimated average number of transfers per retrieval 1.0 1.3 1.2 0.4 Average number of embryos transferred 1.5 1.2 1.5 1.8 Percentage of embryos transferred resulting in implantation (%) 43.5 3 / 9 10 / 17 2 / 7 Percentage of transfers resulting in term, normal weight & singleton live births
e (%) 33.3 3 / 9 5 / 11 0 / 4
Percentage of transfers resulting in singleton live births (%) 40.5 3 / 9 5 / 11 0 / 4 Percentage of transfers resulting in twin live births (%) 7.1 0 / 9 2 / 11 1 / 4 Percentage of transfers resulting in live births (%) 47.6 3 / 9 7 / 11 1 / 4 Percentage of transfers resulting in pregnancies (%) 57.1 4 / 9 8 / 11 1 / 4
Number of Egg/Embryo Banking Cycles 16 3 3 8 0 0
Donor Eggs Fresh Embryosf Frozen Embryosf
Number of cycles 12 19Number of transfers 10 18Average number of embryos transferred 1.7 1.5Percentage of embryos transferred resulting in implantation (%) 7 / 17 29.6Percentage of transfers resulting in term, normal weight & singleton live births
e (%) 3 / 10 3 / 18
Percentage of transfers resulting in singleton live births (%) 3 / 10 4 / 18Percentage of transfers resulting in twin live births (%) 2 / 10 1 / 18Percentage of transfers resulting in live births (%) 5 / 10 5 / 18Percentage of transfers resulting in pregnancies (%) 5 / 10 7 / 18
CURRENT SERVICES & PROFILE Current Name: Reproductive Medicine and Surgery Center of Virginia, PLC
Donor eggs? YesDonor embryos? Yes
Gestational carriers? YesEmbryo cryopreservation? Yes
Single women? YesSART member? Yes
Verified lab accreditation? No(See Appendix C for details.)
a Reflects features of fresh nondonor cycles. If IVF is less than 100%, the remaining cycles are GIFT, ZIFT, or a combination of these procedures with IVF.
b Total patient diagnosis percentages may be greater than 100% because more than one diagnosis can be reported for each ART cycle.
c Fractions are used for rates with denominators less than 20. Multiple-infant births (for example, twins) with at least one live infant are counted as one live birth.
d Total cycle number includes those using frozen eggs. It excludes 0 cycle(s) evaluating new procedures. Both cycle types are excluded from ART success rates.
e In this report, births are defined as term if at least 37 full weeks gestation and normal birth weight if at least 2,500 grams (approximately 5 pounds, 8 ounces).
f All ages are reported together because previous data show that patient age does not materially affect success with donor eggs.

488
VIR
GIN
IAGENETICS & IVF INSTITUTE
FAIRFAX, VIRGINIAComparison of success rates across clinics may not be meaningful. Patient medical characteristics and treatment approaches vary (see pages 11–20).
Data verified by Laurence C. Udoff, MD2014 ART CYCLE PROFILE
Type of ART and Procedural Factors a
IVF 100%Unstimulated <1%Used gestational carrier <1%
With ICSI 84%PGD/PGS 10%
Patient Diagnosis b
Tubal factor 12%Ovulatory dysfunction 13%Diminished ovarian reserve 49%Endometriosis 7%
Uterine factor 7%Male factor 37%Other factor 29%Unknown factor 7%
Multiple Factors: Female factors only 18%Female & male factors 28%
2014 ART SUCCESS RATES c Total number of cyclesd: 547 (includes 64 cycle[s] using frozen eggs)
Type of CycleAge of Woman
<35 35–37 38–40 41–42 43–44 >44Fresh Embryos from Nondonor Eggs
Number of cycles 32 32 23 15 11 12Percentage of cancellations before retrieval (%) 0.0 3.1 4.3 2 / 15 2 / 11 0 / 12Average number of embryos transferred 1.5 1.8 2.1 1.9 2.0 3.3Percentage of embryos transferred resulting in implantation (%) 17.9 32.6 21.2 10.0 0 / 10 0.0Percentage of elective single embryo transfers (eSET) (%) 9 / 18 23.8 3 / 16 2 / 9 0 / 3 0 / 6
Outcomes per CyclePercentage of cycles resulting in term, normal weight & singleton live births
e (%) 15.6 15.6 21.7 2 / 15 0 / 11 0 / 12
Percentage of cycles resulting in singleton live births (%) 15.6 18.8 21.7 2 / 15 0 / 11 0 / 12Percentage of cycles resulting in twin live births (%) 0.0 9.4 4.3 0 / 15 0 / 11 0 / 12Percentage of cycles resulting in live births (%) 15.6 28.1 26.1 2 / 15 0 / 11 0 / 12Percentage of cycles resulting in pregnancies (%) 18.8 34.4 30.4 3 / 15 0 / 11 0 / 12
Outcomes per TransferNumber of transfers 20 24 17 12 5 7Percentage of transfers resulting in term, normal weight & singleton live births
e (%) 25.0 20.8 5 / 17 2 / 12 0 / 5 0 / 7
Percentage of transfers resulting in singleton live births (%) 25.0 25.0 5 / 17 2 / 12 0 / 5 0 / 7Percentage of transfers resulting in twin live births (%) 0.0 12.5 1 / 17 0 / 12 0 / 5 0 / 7Percentage of transfers resulting in live births (%) 25.0 37.5 6 / 17 2 / 12 0 / 5 0 / 7Percentage of transfers resulting in pregnancies (%) 30.0 45.8 7 / 17 3 / 12 0 / 5 0 / 7
Frozen Embryos from Nondonor EggsNumber of cycles 60 39 24 13 8 1Number of transfers 56 38 23 12 7 1Estimated average number of transfers per retrieval 1.1 1.2 1.2 1.2 0.8 0.2Average number of embryos transferred 1.3 1.4 1.5 1.7 1.6 1.0Percentage of embryos transferred resulting in implantation (%) 52.7 38.8 41.9 5 / 17 2 / 10 Percentage of transfers resulting in term, normal weight & singleton live births
e (%) 26.8 28.9 0.0 3 / 12 1 / 7 0 / 1
Percentage of transfers resulting in singleton live births (%) 39.3 42.1 4.3 3 / 12 1 / 7 0 / 1Percentage of transfers resulting in twin live births (%) 12.5 2.6 21.7 1 / 12 0 / 7 0 / 1Percentage of transfers resulting in live births (%) 51.8 44.7 26.1 4 / 12 1 / 7 0 / 1Percentage of transfers resulting in pregnancies (%) 58.9 55.3 43.5 6 / 12 3 / 7 1 / 1
Number of Egg/Embryo Banking Cycles 34 19 10 7 6 5
Donor Eggs Fresh Embryosf Frozen Embryosf
Number of cycles 27 105Number of transfers 27 97Average number of embryos transferred 1.4 1.4Percentage of embryos transferred resulting in implantation (%) 47.4 43.0Percentage of transfers resulting in term, normal weight & singleton live births
e (%) 29.6 19.6
Percentage of transfers resulting in singleton live births (%) 48.1 35.1Percentage of transfers resulting in twin live births (%) 7.4 7.2Percentage of transfers resulting in live births (%) 55.6 42.3Percentage of transfers resulting in pregnancies (%) 59.3 53.6
CURRENT SERVICES & PROFILE Current Name: Genetics & IVF Institute
Donor eggs? YesDonor embryos? Yes
Gestational carriers? YesEmbryo cryopreservation? Yes
Single women? YesSART member? Yes
Verified lab accreditation? Yes(See Appendix C for details.)
a Reflects features of fresh nondonor cycles. If IVF is less than 100%, the remaining cycles are GIFT, ZIFT, or a combination of these procedures with IVF.
b Total patient diagnosis percentages may be greater than 100% because more than one diagnosis can be reported for each ART cycle.
c Fractions are used for rates with denominators less than 20. Multiple-infant births (for example, twins) with at least one live infant are counted as one live birth.
d Total cycle number includes those using frozen eggs. It excludes 0 cycle(s) evaluating new procedures. Both cycle types are excluded from ART success rates.
e In this report, births are defined as term if at least 37 full weeks gestation and normal birth weight if at least 2,500 grams (approximately 5 pounds, 8 ounces).
f All ages are reported together because previous data show that patient age does not materially affect success with donor eggs.

489
VIR
GIN
IAPARTNERS FOR FERTILITY AND IVF
FAIRFAX, VIRGINIAComparison of success rates across clinics may not be meaningful. Patient medical characteristics and treatment approaches vary (see pages 11–20).
Data verified by Nancy Durso, MD2014 ART CYCLE PROFILE
Type of ART and Procedural Factors a
IVF 100%Unstimulated 0%Used gestational carrier 0%
With ICSI 82%PGD/PGS 3%
Patient Diagnosis b
Tubal factor 7%Ovulatory dysfunction 8%Diminished ovarian reserve 6%Endometriosis 5%
Uterine factor 0%Male factor 30%Other factor 6%Unknown factor 43%
Multiple Factors: Female factors only 1%Female & male factors 2%
2014 ART SUCCESS RATES c Total number of cyclesd: 94 (includes 2 cycle[s] using frozen eggs)
Type of CycleAge of Woman
<35 35–37 38–40 41–42 43–44 >44Fresh Embryos from Nondonor Eggs
Number of cycles 28 17 19 10 1 2Percentage of cancellations before retrieval (%) 0.0 0 / 17 0 / 19 1 / 10 0 / 1 1 / 2Average number of embryos transferred 2.0 1.9 2.0 2.0 2.0Percentage of embryos transferred resulting in implantation (%) 18.6 11.5 6.3 1 / 18 0 / 2Percentage of elective single embryo transfers (eSET) (%) 0.0 1 / 13 0 / 11 0 / 7 0 / 1
Outcomes per CyclePercentage of cycles resulting in term, normal weight & singleton live births
e (%) 17.9 2 / 17 2 / 19 0 / 10 0 / 1 0 / 2
Percentage of cycles resulting in singleton live births (%) 17.9 3 / 17 2 / 19 1 / 10 0 / 1 0 / 2Percentage of cycles resulting in twin live births (%) 3.6 0 / 17 0 / 19 0 / 10 0 / 1 0 / 2Percentage of cycles resulting in live births (%) 21.4 3 / 17 2 / 19 1 / 10 0 / 1 0 / 2Percentage of cycles resulting in pregnancies (%) 25.0 4 / 17 2 / 19 1 / 10 0 / 1 0 / 2
Outcomes per TransferNumber of transfers 22 15 16 9 0 1Percentage of transfers resulting in term, normal weight & singleton live births
e (%) 22.7 2 / 15 2 / 16 0 / 9 0 / 1
Percentage of transfers resulting in singleton live births (%) 22.7 3 / 15 2 / 16 1 / 9 0 / 1Percentage of transfers resulting in twin live births (%) 4.5 0 / 15 0 / 16 0 / 9 0 / 1Percentage of transfers resulting in live births (%) 27.3 3 / 15 2 / 16 1 / 9 0 / 1Percentage of transfers resulting in pregnancies (%) 31.8 4 / 15 2 / 16 1 / 9 0 / 1
Frozen Embryos from Nondonor EggsNumber of cycles 7 1 4 0 0 0Number of transfers 7 1 3 0 0 0Estimated average number of transfers per retrieval 3.5 1.0 1.0 0.0 Average number of embryos transferred 1.9 2.0 1.7 Percentage of embryos transferred resulting in implantation (%) 0 / 13 0 / 2 0 / 5 Percentage of transfers resulting in term, normal weight & singleton live births
e (%) 0 / 7 0 / 1 0 / 3
Percentage of transfers resulting in singleton live births (%) 0 / 7 0 / 1 0 / 3 Percentage of transfers resulting in twin live births (%) 0 / 7 0 / 1 0 / 3 Percentage of transfers resulting in live births (%) 0 / 7 0 / 1 0 / 3 Percentage of transfers resulting in pregnancies (%) 0 / 7 0 / 1 0 / 3
Number of Egg/Embryo Banking Cycles 0 0 2 1 0 0
Donor Eggs Fresh Embryosf Frozen Embryosf
Number of cycles 0 0Number of transfers 0 0Average number of embryos transferred Percentage of embryos transferred resulting in implantation (%) Percentage of transfers resulting in term, normal weight & singleton live births
e (%)
Percentage of transfers resulting in singleton live births (%) Percentage of transfers resulting in twin live births (%) Percentage of transfers resulting in live births (%) Percentage of transfers resulting in pregnancies (%)
CURRENT SERVICES & PROFILE Current Name: Partners for Fertility and IVF
Donor eggs? YesDonor embryos? No
Gestational carriers? YesEmbryo cryopreservation? Yes
Single women? YesSART member? Yes
Verified lab accreditation? Yes(See Appendix C for details.)
a Reflects features of fresh nondonor cycles. If IVF is less than 100%, the remaining cycles are GIFT, ZIFT, or a combination of these procedures with IVF.
b Total patient diagnosis percentages may be greater than 100% because more than one diagnosis can be reported for each ART cycle.
c Fractions are used for rates with denominators less than 20. Multiple-infant births (for example, twins) with at least one live infant are counted as one live birth.
d Total cycle number includes those using frozen eggs. It excludes 0 cycle(s) evaluating new procedures. Both cycle types are excluded from ART success rates.
e In this report, births are defined as term if at least 37 full weeks gestation and normal birth weight if at least 2,500 grams (approximately 5 pounds, 8 ounces).
f All ages are reported together because previous data show that patient age does not materially affect success with donor eggs.

490
VIR
GIN
IAJONES INSTITUTE FOR REPRODUCTIVE MEDICINE
NORFOLK, VIRGINIAComparison of success rates across clinics may not be meaningful. Patient medical characteristics and treatment approaches vary (see pages 11–20).
Data verified by Laurel A. Stadtmauer, MD2014 ART CYCLE PROFILE
Type of ART and Procedural Factors a
IVF 100%Unstimulated 0%Used gestational carrier <1%
With ICSI 75%PGD/PGS 3%
Patient Diagnosis b
Tubal factor 27%Ovulatory dysfunction 16%Diminished ovarian reserve 29%Endometriosis 11%
Uterine factor 4%Male factor 29%Other factor 9%Unknown factor 5%
Multiple Factors: Female factors only 11%Female & male factors 14%
2014 ART SUCCESS RATES c Total number of cyclesd: 411 (includes 4 cycle[s] using frozen eggs)
Type of CycleAge of Woman
<35 35–37 38–40 41–42 43–44 >44Fresh Embryos from Nondonor Eggs
Number of cycles 105 67 50 35 3 7Percentage of cancellations before retrieval (%) 19.0 9.0 12.0 34.3 3 / 3 5 / 7Average number of embryos transferred 1.9 1.9 2.0 2.2 1.0Percentage of embryos transferred resulting in implantation (%) 27.0 29.2 13.6 17.1 0 / 1Percentage of elective single embryo transfers (eSET) (%) 1.4 4.1 3.2 0 / 15
Outcomes per CyclePercentage of cycles resulting in term, normal weight & singleton live births
e (%) 18.1 17.9 8.0 2.9 0 / 3 0 / 7
Percentage of cycles resulting in singleton live births (%) 21.0 19.4 8.0 2.9 0 / 3 0 / 7Percentage of cycles resulting in twin live births (%) 4.8 10.4 2.0 5.7 0 / 3 0 / 7Percentage of cycles resulting in live births (%) 25.7 29.9 10.0 8.6 0 / 3 0 / 7Percentage of cycles resulting in pregnancies (%) 35.2 32.8 16.0 11.4 0 / 3 0 / 7
Outcomes per TransferNumber of transfers 80 55 34 16 0 1Percentage of transfers resulting in term, normal weight & singleton live births
e (%) 23.8 21.8 11.8 1 / 16 0 / 1
Percentage of transfers resulting in singleton live births (%) 27.5 23.6 11.8 1 / 16 0 / 1Percentage of transfers resulting in twin live births (%) 6.3 12.7 2.9 2 / 16 0 / 1Percentage of transfers resulting in live births (%) 33.8 36.4 14.7 3 / 16 0 / 1Percentage of transfers resulting in pregnancies (%) 46.3 40.0 23.5 4 / 16 0 / 1
Frozen Embryos from Nondonor EggsNumber of cycles 32 17 13 3 3 1Number of transfers 29 17 12 3 3 1Estimated average number of transfers per retrieval 1.8 1.1 2.4 1.5 0.3Average number of embryos transferred 2.0 1.9 1.9 2.0 2.0 3.0Percentage of embryos transferred resulting in implantation (%) 30.5 18.2 17.4 1 / 6 3 / 6 0 / 3Percentage of transfers resulting in term, normal weight & singleton live births
e (%) 24.1 3 / 17 2 / 12 0 / 3 0 / 3 0 / 1
Percentage of transfers resulting in singleton live births (%) 31.0 4 / 17 2 / 12 0 / 3 0 / 3 0 / 1Percentage of transfers resulting in twin live births (%) 10.3 0 / 17 0 / 12 0 / 3 1 / 3 0 / 1Percentage of transfers resulting in live births (%) 41.4 4 / 17 2 / 12 0 / 3 1 / 3 0 / 1Percentage of transfers resulting in pregnancies (%) 44.8 6 / 17 4 / 12 1 / 3 2 / 3 0 / 1
Number of Egg/Embryo Banking Cycles 5 5 2 1 0 4
Donor Eggs Fresh Embryosf Frozen Embryosf
Number of cycles 27 27Number of transfers 23 25Average number of embryos transferred 1.9 2.0Percentage of embryos transferred resulting in implantation (%) 38.6 13.7Percentage of transfers resulting in term, normal weight & singleton live births
e (%) 30.4 12.0
Percentage of transfers resulting in singleton live births (%) 43.5 16.0Percentage of transfers resulting in twin live births (%) 0.0 4.0Percentage of transfers resulting in live births (%) 43.5 20.0Percentage of transfers resulting in pregnancies (%) 56.5 24.0
CURRENT SERVICES & PROFILE Current Name: Jones Institute for Reproductive Medicine
Donor eggs? YesDonor embryos? Yes
Gestational carriers? YesEmbryo cryopreservation? Yes
Single women? YesSART member? Yes
Verified lab accreditation? Yes(See Appendix C for details.)
a Reflects features of fresh nondonor cycles. If IVF is less than 100%, the remaining cycles are GIFT, ZIFT, or a combination of these procedures with IVF.
b Total patient diagnosis percentages may be greater than 100% because more than one diagnosis can be reported for each ART cycle.
c Fractions are used for rates with denominators less than 20. Multiple-infant births (for example, twins) with at least one live infant are counted as one live birth.
d Total cycle number includes those using frozen eggs. It excludes 0 cycle(s) evaluating new procedures. Both cycle types are excluded from ART success rates.
e In this report, births are defined as term if at least 37 full weeks gestation and normal birth weight if at least 2,500 grams (approximately 5 pounds, 8 ounces).
f All ages are reported together because previous data show that patient age does not materially affect success with donor eggs.

491
VIR
GIN
IAVIRGINIA CENTER FOR REPRODUCTIVE MEDICINE
RESTON, VIRGINIAComparison of success rates across clinics may not be meaningful. Patient medical characteristics and treatment approaches vary (see pages 11–20).
Data verified by Fady I. Sharara, MD2014 ART CYCLE PROFILE
Type of ART and Procedural Factors a
IVF 100%Unstimulated 0%Used gestational carrier 0%
With ICSI 97%PGD/PGS 9%
Patient Diagnosis b
Tubal factor 20%Ovulatory dysfunction 33%Diminished ovarian reserve 35%Endometriosis 11%
Uterine factor 30%Male factor 55%Other factor 56%Unknown factor 0%
Multiple Factors: Female factors only 30%Female & male factors 53%
2014 ART SUCCESS RATES c Total number of cyclesd: 164 (includes 0 cycle[s] using frozen eggs)
Type of CycleAge of Woman
<35 35–37 38–40 41–42 43–44 >44Fresh Embryos from Nondonor Eggs
Number of cycles 37 21 8 2 2 1Percentage of cancellations before retrieval (%) 0.0 4.8 1 / 8 0 / 2 0 / 2 0 / 1Average number of embryos transferred 1.3 1.5 1.3 2.5 1.0 2.0Percentage of embryos transferred resulting in implantation (%) 47.8 34.6 3 / 6 1 / 5 0 / 1 3 / 2Percentage of elective single embryo transfers (eSET) (%) 62.5 7 / 16 1 / 3 0 / 1 0 / 1
Outcomes per CyclePercentage of cycles resulting in term, normal weight & singleton live births
e (%) 32.4 33.3 2 / 8 1 / 2 0 / 2 0 / 1
Percentage of cycles resulting in singleton live births (%) 35.1 33.3 2 / 8 1 / 2 0 / 2 0 / 1Percentage of cycles resulting in twin live births (%) 8.1 4.8 0 / 8 0 / 2 0 / 2 0 / 1Percentage of cycles resulting in live births (%) 43.2 38.1 2 / 8 1 / 2 0 / 2 1 / 1Percentage of cycles resulting in pregnancies (%) 56.8 42.9 4 / 8 1 / 2 0 / 2 1 / 1
Outcomes per TransferNumber of transfers 36 18 6 2 1 1Percentage of transfers resulting in term, normal weight & singleton live births
e (%) 33.3 7 / 18 2 / 6 1 / 2 0 / 1 0 / 1
Percentage of transfers resulting in singleton live births (%) 36.1 7 / 18 2 / 6 1 / 2 0 / 1 0 / 1Percentage of transfers resulting in twin live births (%) 8.3 1 / 18 0 / 6 0 / 2 0 / 1 0 / 1Percentage of transfers resulting in live births (%) 44.4 8 / 18 2 / 6 1 / 2 0 / 1 1 / 1Percentage of transfers resulting in pregnancies (%) 58.3 9 / 18 4 / 6 1 / 2 0 / 1 1 / 1
Frozen Embryos from Nondonor EggsNumber of cycles 15 13 10 1 0 0Number of transfers 15 13 8 1 0 0Estimated average number of transfers per retrieval 1.2 1.1 0.8 1.0 0.0 Average number of embryos transferred 1.5 1.5 1.5 1.0 Percentage of embryos transferred resulting in implantation (%) 27.3 50.0 2 / 12 0 / 1 Percentage of transfers resulting in term, normal weight & singleton live births
e (%) 3 / 15 6 / 13 2 / 8 0 / 1
Percentage of transfers resulting in singleton live births (%) 4 / 15 6 / 13 2 / 8 0 / 1 Percentage of transfers resulting in twin live births (%) 1 / 15 2 / 13 0 / 8 0 / 1 Percentage of transfers resulting in live births (%) 5 / 15 8 / 13 2 / 8 0 / 1 Percentage of transfers resulting in pregnancies (%) 5 / 15 8 / 13 2 / 8 0 / 1
Number of Egg/Embryo Banking Cycles 3 6 8 1 1 0
Donor Eggs Fresh Embryosf Frozen Embryosf
Number of cycles 22 13Number of transfers 19 13Average number of embryos transferred 1.4 1.5Percentage of embryos transferred resulting in implantation (%) 68.0 4 / 18Percentage of transfers resulting in term, normal weight & singleton live births
e (%) 7 / 19 2 / 13
Percentage of transfers resulting in singleton live births (%) 9 / 19 2 / 13Percentage of transfers resulting in twin live births (%) 3 / 19 0 / 13Percentage of transfers resulting in live births (%) 12 / 19 2 / 13Percentage of transfers resulting in pregnancies (%) 15 / 19 4 / 13
CURRENT SERVICES & PROFILE Current Name: Virginia Center for Reproductive Medicine
Donor eggs? YesDonor embryos? Yes
Gestational carriers? YesEmbryo cryopreservation? Yes
Single women? YesSART member? Yes
Verified lab accreditation? Yes(See Appendix C for details.)
a Reflects features of fresh nondonor cycles. If IVF is less than 100%, the remaining cycles are GIFT, ZIFT, or a combination of these procedures with IVF.
b Total patient diagnosis percentages may be greater than 100% because more than one diagnosis can be reported for each ART cycle.
c Fractions are used for rates with denominators less than 20. Multiple-infant births (for example, twins) with at least one live infant are counted as one live birth.
d Total cycle number includes those using frozen eggs. It excludes 0 cycle(s) evaluating new procedures. Both cycle types are excluded from ART success rates.
e In this report, births are defined as term if at least 37 full weeks gestation and normal birth weight if at least 2,500 grams (approximately 5 pounds, 8 ounces).
f All ages are reported together because previous data show that patient age does not materially affect success with donor eggs.

492
VIR
GIN
IAFERTILITY INSTITUTE OF VIRGINIA
RICHMOND, VIRGINIAComparison of success rates across clinics may not be meaningful. Patient medical characteristics and treatment approaches vary (see pages 11–20).
Data verified by Michael C. Edelstein, MD2014 ART CYCLE PROFILE
Type of ART and Procedural Factors a
IVF 100%Unstimulated 0%Used gestational carrier 2%
With ICSI 89%PGD/PGS 0%
Patient Diagnosis b
Tubal factor 17%Ovulatory dysfunction 13%Diminished ovarian reserve 16%Endometriosis 10%
Uterine factor 5%Male factor 39%Other factor 3%Unknown factor 13%
Multiple Factors: Female factors only 7%Female & male factors 8%
2014 ART SUCCESS RATES c Total number of cyclesd: 287 (includes 7 cycle[s] using frozen eggs)
Type of CycleAge of Woman
<35 35–37 38–40 41–42 43–44 >44Fresh Embryos from Nondonor Eggs
Number of cycles 66 33 16 7 3 0Percentage of cancellations before retrieval (%) 6.1 9.1 2 / 16 1 / 7 1 / 3 Average number of embryos transferred 1.7 2.0 2.0 2.8 3.0 Percentage of embryos transferred resulting in implantation (%) 36.5 27.9 59.1 1 / 14 0 / 4 Percentage of elective single embryo transfers (eSET) (%) 40.0 13.6 1 / 10 0 / 4 0 / 2
Outcomes per CyclePercentage of cycles resulting in term, normal weight & singleton live births
e (%) 18.2 15.2 4 / 16 1 / 7 0 / 3
Percentage of cycles resulting in singleton live births (%) 18.2 18.2 5 / 16 1 / 7 0 / 3 Percentage of cycles resulting in twin live births (%) 4.5 3.0 3 / 16 0 / 7 0 / 3 Percentage of cycles resulting in live births (%) 22.7 21.2 8 / 16 1 / 7 0 / 3 Percentage of cycles resulting in pregnancies (%) 30.3 33.3 10 / 16 1 / 7 1 / 3
Outcomes per TransferNumber of transfers 36 23 11 5 2 0Percentage of transfers resulting in term, normal weight & singleton live births
e (%) 33.3 21.7 4 / 11 1 / 5 0 / 2
Percentage of transfers resulting in singleton live births (%) 33.3 26.1 5 / 11 1 / 5 0 / 2 Percentage of transfers resulting in twin live births (%) 8.3 4.3 3 / 11 0 / 5 0 / 2 Percentage of transfers resulting in live births (%) 41.7 30.4 8 / 11 1 / 5 0 / 2 Percentage of transfers resulting in pregnancies (%) 55.6 47.8 10 / 11 1 / 5 1 / 2
Frozen Embryos from Nondonor EggsNumber of cycles 80 25 14 7 1 0Number of transfers 80 25 14 7 1 0Estimated average number of transfers per retrieval 2.2 1.8 1.8 Average number of embryos transferred 1.6 1.7 1.6 1.4 1.0 Percentage of embryos transferred resulting in implantation (%) 45.5 57.5 43.5 3 / 10 Percentage of transfers resulting in term, normal weight & singleton live births
e (%) 32.5 52.0 3 / 14 3 / 7 0 / 1
Percentage of transfers resulting in singleton live births (%) 38.8 56.0 3 / 14 3 / 7 0 / 1 Percentage of transfers resulting in twin live births (%) 11.3 4.0 2 / 14 0 / 7 0 / 1 Percentage of transfers resulting in live births (%) 51.3 60.0 5 / 14 3 / 7 0 / 1 Percentage of transfers resulting in pregnancies (%) 60.0 80.0 7 / 14 3 / 7 1 / 1
Number of Egg/Embryo Banking Cycles 1 0 1 0 0 0
Donor Eggs Fresh Embryosf Frozen Embryosf
Number of cycles 9 17Number of transfers 8 17Average number of embryos transferred 1.9 1.8Percentage of embryos transferred resulting in implantation (%) 9 / 12 26.9Percentage of transfers resulting in term, normal weight & singleton live births
e (%) 4 / 8 2 / 17
Percentage of transfers resulting in singleton live births (%) 4 / 8 5 / 17Percentage of transfers resulting in twin live births (%) 2 / 8 1 / 17Percentage of transfers resulting in live births (%) 6 / 8 6 / 17Percentage of transfers resulting in pregnancies (%) 7 / 8 8 / 17
CURRENT SERVICES & PROFILE Current Name: Fertility Institute of Virginia
Donor eggs? YesDonor embryos? Yes
Gestational carriers? YesEmbryo cryopreservation? Yes
Single women? YesSART member? Yes
Verified lab accreditation? Yes(See Appendix C for details.)
a Reflects features of fresh nondonor cycles. If IVF is less than 100%, the remaining cycles are GIFT, ZIFT, or a combination of these procedures with IVF.
b Total patient diagnosis percentages may be greater than 100% because more than one diagnosis can be reported for each ART cycle.
c Fractions are used for rates with denominators less than 20. Multiple-infant births (for example, twins) with at least one live infant are counted as one live birth.
d Total cycle number includes those using frozen eggs. It excludes 0 cycle(s) evaluating new procedures. Both cycle types are excluded from ART success rates.
e In this report, births are defined as term if at least 37 full weeks gestation and normal birth weight if at least 2,500 grams (approximately 5 pounds, 8 ounces).
f All ages are reported together because previous data show that patient age does not materially affect success with donor eggs.

493
VIR
GIN
IALIFESOURCE FERTILITY CENTER
RICHMOND, VIRGINIAComparison of success rates across clinics may not be meaningful. Patient medical characteristics and treatment approaches vary (see pages 11–20).
Data verified by Joseph G. Gianfortoni, MD2014 ART CYCLE PROFILE
Type of ART and Procedural Factors a
IVF 100%Unstimulated 0%Used gestational carrier 0%
With ICSI 89%PGD/PGS 0%
Patient Diagnosis b
Tubal factor 17%Ovulatory dysfunction 25%Diminished ovarian reserve 23%Endometriosis 13%
Uterine factor 12%Male factor 80%Other factor 6%Unknown factor 3%
Multiple Factors: Female factors only 5%Female & male factors 58%
2014 ART SUCCESS RATES c Total number of cyclesd: 131 (includes 5 cycle[s] using frozen eggs)
Type of CycleAge of Woman
<35 35–37 38–40 41–42 43–44 >44Fresh Embryos from Nondonor Eggs
Number of cycles 21 8 4 1 2 0Percentage of cancellations before retrieval (%) 0.0 1 / 8 0 / 4 0 / 1 0 / 2 Average number of embryos transferred 1.3 1.6 2.0 2.0 3.5 Percentage of embryos transferred resulting in implantation (%) 47.8 5 / 8 4 / 8 0 / 2 0 / 7 Percentage of elective single embryo transfers (eSET) (%) 13 / 17 1 / 4 0 / 4 0 / 1 0 / 2
Outcomes per CyclePercentage of cycles resulting in term, normal weight & singleton live births
e (%) 19.0 2 / 8 2 / 4 0 / 1 0 / 2
Percentage of cycles resulting in singleton live births (%) 23.8 2 / 8 2 / 4 0 / 1 0 / 2 Percentage of cycles resulting in twin live births (%) 9.5 1 / 8 1 / 4 0 / 1 0 / 2 Percentage of cycles resulting in live births (%) 33.3 3 / 8 3 / 4 0 / 1 0 / 2 Percentage of cycles resulting in pregnancies (%) 38.1 3 / 8 3 / 4 0 / 1 0 / 2
Outcomes per TransferNumber of transfers 18 5 4 1 2 0Percentage of transfers resulting in term, normal weight & singleton live births
e (%) 4 / 18 2 / 5 2 / 4 0 / 1 0 / 2
Percentage of transfers resulting in singleton live births (%) 5 / 18 2 / 5 2 / 4 0 / 1 0 / 2 Percentage of transfers resulting in twin live births (%) 2 / 18 1 / 5 1 / 4 0 / 1 0 / 2 Percentage of transfers resulting in live births (%) 7 / 18 3 / 5 3 / 4 0 / 1 0 / 2 Percentage of transfers resulting in pregnancies (%) 8 / 18 3 / 5 3 / 4 0 / 1 0 / 2
Frozen Embryos from Nondonor EggsNumber of cycles 32 21 7 3 1 0Number of transfers 31 21 7 2 1 0Estimated average number of transfers per retrieval 1.5 2.3 1.4 2.0 1.0 Average number of embryos transferred 1.4 1.7 1.4 1.5 1.0 Percentage of embryos transferred resulting in implantation (%) 60.5 31.4 4 / 10 0 / 3 0 / 1 Percentage of transfers resulting in term, normal weight & singleton live births
e (%) 41.9 23.8 1 / 7 0 / 2 0 / 1
Percentage of transfers resulting in singleton live births (%) 41.9 42.9 1 / 7 0 / 2 0 / 1 Percentage of transfers resulting in twin live births (%) 9.7 4.8 1 / 7 0 / 2 0 / 1 Percentage of transfers resulting in live births (%) 51.6 47.6 2 / 7 0 / 2 0 / 1 Percentage of transfers resulting in pregnancies (%) 64.5 47.6 3 / 7 0 / 2 0 / 1
Number of Egg/Embryo Banking Cycles 9 6 4 1 0 0
Donor Eggs Fresh Embryosf Frozen Embryosf
Number of cycles 0 6Number of transfers 0 6Average number of embryos transferred 1.2Percentage of embryos transferred resulting in implantation (%) 5 / 7Percentage of transfers resulting in term, normal weight & singleton live births
e (%) 2 / 6
Percentage of transfers resulting in singleton live births (%) 3 / 6Percentage of transfers resulting in twin live births (%) 1 / 6Percentage of transfers resulting in live births (%) 4 / 6Percentage of transfers resulting in pregnancies (%) 4 / 6
CURRENT SERVICES & PROFILE Current Name: LifeSource Fertility Center
Donor eggs? YesDonor embryos? Yes
Gestational carriers? YesEmbryo cryopreservation? Yes
Single women? YesSART member? Yes
Verified lab accreditation? Yes(See Appendix C for details.)
a Reflects features of fresh nondonor cycles. If IVF is less than 100%, the remaining cycles are GIFT, ZIFT, or a combination of these procedures with IVF.
b Total patient diagnosis percentages may be greater than 100% because more than one diagnosis can be reported for each ART cycle.
c Fractions are used for rates with denominators less than 20. Multiple-infant births (for example, twins) with at least one live infant are counted as one live birth.
d Total cycle number includes those using frozen eggs. It excludes 0 cycle(s) evaluating new procedures. Both cycle types are excluded from ART success rates.
e In this report, births are defined as term if at least 37 full weeks gestation and normal birth weight if at least 2,500 grams (approximately 5 pounds, 8 ounces).
f All ages are reported together because previous data show that patient age does not materially affect success with donor eggs.

494
VIR
GIN
IATHE RICHMOND CENTER FOR FERTILITY AND ENDOCRINOLOGY
RICHMOND, VIRGINIAComparison of success rates across clinics may not be meaningful. Patient medical characteristics and treatment approaches vary (see pages 11–20).
Data verified by George F. Tidey, MD2014 ART CYCLE PROFILE
Type of ART and Procedural Factors a
IVF 100%Unstimulated 0%Used gestational carrier 2%
With ICSI 83%PGD/PGS 1%
Patient Diagnosis b
Tubal factor 18%Ovulatory dysfunction 14%Diminished ovarian reserve 26%Endometriosis 4%
Uterine factor 7%Male factor 57%Other factor 13%Unknown factor 2%
Multiple Factors: Female factors only 7%Female & male factors 31%
2014 ART SUCCESS RATES c Total number of cyclesd: 243 (includes 8 cycle[s] using frozen eggs)
Type of CycleAge of Woman
<35 35–37 38–40 41–42 43–44 >44Fresh Embryos from Nondonor Eggs
Number of cycles 49 23 12 8 6 0Percentage of cancellations before retrieval (%) 4.1 17.4 2 / 12 3 / 8 0 / 6 Average number of embryos transferred 1.8 1.8 2.3 3.8 2.7 Percentage of embryos transferred resulting in implantation (%) 23.6 31.0 1 / 16 2 / 11 0 / 16 Percentage of elective single embryo transfers (eSET) (%) 23.3 3 / 14 1 / 7 0 / 4 0 / 6
Outcomes per CyclePercentage of cycles resulting in term, normal weight & singleton live births
e (%) 20.4 8.7 1 / 12 1 / 8 0 / 6
Percentage of cycles resulting in singleton live births (%) 22.4 13.0 1 / 12 1 / 8 0 / 6 Percentage of cycles resulting in twin live births (%) 2.0 13.0 0 / 12 0 / 8 0 / 6 Percentage of cycles resulting in live births (%) 24.5 26.1 1 / 12 1 / 8 0 / 6 Percentage of cycles resulting in pregnancies (%) 24.5 30.4 1 / 12 3 / 8 0 / 6
Outcomes per TransferNumber of transfers 31 17 7 4 6 0Percentage of transfers resulting in term, normal weight & singleton live births
e (%) 32.3 2 / 17 1 / 7 1 / 4 0 / 6
Percentage of transfers resulting in singleton live births (%) 35.5 3 / 17 1 / 7 1 / 4 0 / 6 Percentage of transfers resulting in twin live births (%) 3.2 3 / 17 0 / 7 0 / 4 0 / 6 Percentage of transfers resulting in live births (%) 38.7 6 / 17 1 / 7 1 / 4 0 / 6 Percentage of transfers resulting in pregnancies (%) 38.7 7 / 17 1 / 7 3 / 4 0 / 6
Frozen Embryos from Nondonor EggsNumber of cycles 60 18 14 1 1 0Number of transfers 59 15 14 1 1 0Estimated average number of transfers per retrieval 1.5 1.1 1.1 1.0 0.5 Average number of embryos transferred 1.5 1.5 1.8 2.0 4.0 Percentage of embryos transferred resulting in implantation (%) 54.7 4 / 16 32.0 1 / 2 0 / 4 Percentage of transfers resulting in term, normal weight & singleton live births
e (%) 37.3 4 / 15 2 / 14 1 / 1 0 / 1
Percentage of transfers resulting in singleton live births (%) 37.3 4 / 15 3 / 14 1 / 1 0 / 1 Percentage of transfers resulting in twin live births (%) 15.3 0 / 15 2 / 14 0 / 1 0 / 1 Percentage of transfers resulting in live births (%) 52.5 4 / 15 5 / 14 1 / 1 0 / 1 Percentage of transfers resulting in pregnancies (%) 67.8 6 / 15 5 / 14 1 / 1 0 / 1
Number of Egg/Embryo Banking Cycles 10 9 7 0 2 0
Donor Eggs Fresh Embryosf Frozen Embryosf
Number of cycles 5 10Number of transfers 5 9Average number of embryos transferred 1.2 1.4Percentage of embryos transferred resulting in implantation (%) 4 / 6 7 / 13Percentage of transfers resulting in term, normal weight & singleton live births
e (%) 3 / 5 2 / 9
Percentage of transfers resulting in singleton live births (%) 4 / 5 3 / 9Percentage of transfers resulting in twin live births (%) 0 / 5 2 / 9Percentage of transfers resulting in live births (%) 4 / 5 5 / 9Percentage of transfers resulting in pregnancies (%) 4 / 5 5 / 9
CURRENT SERVICES & PROFILE Current Name: The Richmond Center for Fertility and Endocrinology
Donor eggs? YesDonor embryos? Yes
Gestational carriers? YesEmbryo cryopreservation? Yes
Single women? YesSART member? Yes
Verified lab accreditation? Yes(See Appendix C for details.)
a Reflects features of fresh nondonor cycles. If IVF is less than 100%, the remaining cycles are GIFT, ZIFT, or a combination of these procedures with IVF.
b Total patient diagnosis percentages may be greater than 100% because more than one diagnosis can be reported for each ART cycle.
c Fractions are used for rates with denominators less than 20. Multiple-infant births (for example, twins) with at least one live infant are counted as one live birth.
d Total cycle number includes those using frozen eggs. It excludes 0 cycle(s) evaluating new procedures. Both cycle types are excluded from ART success rates.
e In this report, births are defined as term if at least 37 full weeks gestation and normal birth weight if at least 2,500 grams (approximately 5 pounds, 8 ounces).
f All ages are reported together because previous data show that patient age does not materially affect success with donor eggs.

495
VIR
GIN
IAUNIVERSITY CENTER FOR ADVANCED REPRODUCTIVE MEDICINE
RICHMOND, VIRGINIAComparison of success rates across clinics may not be meaningful. Patient medical characteristics and treatment approaches vary (see pages 11–20).
Data verified by Richard S. Lucidi, MD2014 ART CYCLE PROFILE
Type of ART and Procedural Factors a
IVF 100%Unstimulated 0%Used gestational carrier 0%
With ICSI 82%PGD/PGS 0%
Patient Diagnosis b
Tubal factor 14%Ovulatory dysfunction 14%Diminished ovarian reserve 15%Endometriosis 3%
Uterine factor 5%Male factor 14%Other factor 30%Unknown factor 33%
Multiple Factors: Female factors only 14%Female & male factors 8%
2014 ART SUCCESS RATES c Total number of cyclesd: 87 (includes 0 cycle[s] using frozen eggs)
Type of CycleAge of Woman
<35 35–37 38–40 41–42 43–44 >44Fresh Embryos from Nondonor Eggs
Number of cycles 17 9 5 1 1 0Percentage of cancellations before retrieval (%) 1 / 17 2 / 9 3 / 5 0 / 1 0 / 1 Average number of embryos transferred 1.9 1.7 2.5 3.0 5.0 Percentage of embryos transferred resulting in implantation (%) 25.0 3 / 10 1 / 3 0 / 3 2 / 5 Percentage of elective single embryo transfers (eSET) (%) 3 / 15 3 / 6 0 / 2 0 / 1 0 / 1
Outcomes per CyclePercentage of cycles resulting in term, normal weight & singleton live births
e (%) 4 / 17 2 / 9 1 / 5 0 / 1 0 / 1
Percentage of cycles resulting in singleton live births (%) 4 / 17 3 / 9 1 / 5 0 / 1 1 / 1 Percentage of cycles resulting in twin live births (%) 1 / 17 0 / 9 0 / 5 0 / 1 0 / 1 Percentage of cycles resulting in live births (%) 5 / 17 3 / 9 1 / 5 0 / 1 1 / 1 Percentage of cycles resulting in pregnancies (%) 6 / 17 3 / 9 2 / 5 0 / 1 1 / 1
Outcomes per TransferNumber of transfers 15 6 2 1 1 0Percentage of transfers resulting in term, normal weight & singleton live births
e (%) 4 / 15 2 / 6 1 / 2 0 / 1 0 / 1
Percentage of transfers resulting in singleton live births (%) 4 / 15 3 / 6 1 / 2 0 / 1 1 / 1 Percentage of transfers resulting in twin live births (%) 1 / 15 0 / 6 0 / 2 0 / 1 0 / 1 Percentage of transfers resulting in live births (%) 5 / 15 3 / 6 1 / 2 0 / 1 1 / 1 Percentage of transfers resulting in pregnancies (%) 6 / 15 3 / 6 2 / 2 0 / 1 1 / 1
Frozen Embryos from Nondonor EggsNumber of cycles 15 9 8 1 2 0Number of transfers 13 7 5 1 1 0Estimated average number of transfers per retrieval 0.9 1.8 5.0 Average number of embryos transferred 1.6 1.4 1.4 3.0 2.0 Percentage of embryos transferred resulting in implantation (%) 52.4 3 / 10 0 / 7 2 / 3 0 / 2 Percentage of transfers resulting in term, normal weight & singleton live births
e (%) 4 / 13 2 / 7 0 / 5 0 / 1 0 / 1
Percentage of transfers resulting in singleton live births (%) 4 / 13 3 / 7 0 / 5 1 / 1 0 / 1 Percentage of transfers resulting in twin live births (%) 3 / 13 0 / 7 0 / 5 0 / 1 0 / 1 Percentage of transfers resulting in live births (%) 7 / 13 3 / 7 0 / 5 1 / 1 0 / 1 Percentage of transfers resulting in pregnancies (%) 8 / 13 3 / 7 0 / 5 1 / 1 0 / 1
Number of Egg/Embryo Banking Cycles 6 1 1 0 0 0
Donor Eggs Fresh Embryosf Frozen Embryosf
Number of cycles 4 7Number of transfers 4 6Average number of embryos transferred 1.5 2.7Percentage of embryos transferred resulting in implantation (%) 4 / 6 1 / 16Percentage of transfers resulting in term, normal weight & singleton live births
e (%) 2 / 4 0 / 6
Percentage of transfers resulting in singleton live births (%) 2 / 4 0 / 6Percentage of transfers resulting in twin live births (%) 1 / 4 0 / 6Percentage of transfers resulting in live births (%) 3 / 4 0 / 6Percentage of transfers resulting in pregnancies (%) 3 / 4 1 / 6
CURRENT SERVICES & PROFILE Current Name: University Center for Advanced Reproductive Medicine
Donor eggs? YesDonor embryos? Yes
Gestational carriers? YesEmbryo cryopreservation? Yes
Single women? YesSART member? Yes
Verified lab accreditation? Yes(See Appendix C for details.)
a Reflects features of fresh nondonor cycles. If IVF is less than 100%, the remaining cycles are GIFT, ZIFT, or a combination of these procedures with IVF.
b Total patient diagnosis percentages may be greater than 100% because more than one diagnosis can be reported for each ART cycle.
c Fractions are used for rates with denominators less than 20. Multiple-infant births (for example, twins) with at least one live infant are counted as one live birth.
d Total cycle number includes those using frozen eggs. It excludes 0 cycle(s) evaluating new procedures. Both cycle types are excluded from ART success rates.
e In this report, births are defined as term if at least 37 full weeks gestation and normal birth weight if at least 2,500 grams (approximately 5 pounds, 8 ounces).
f All ages are reported together because previous data show that patient age does not materially affect success with donor eggs.

496
VIR
GIN
IATHE BEACH CENTER FOR INFERTILITY, ENDOCRINOLOGY AND IVF
VIRGINIA BEACH, VIRGINIA
This clinic provided ART services during 2014 and is therefore required to submit ART cycle data under the provisions of the Fertility Clinic Success Rate and Certification Act. This clinic either did not submit 2014 ART cycle data or the clinic’s Medical Director did not approve the clinic’s 2014 ART cycle data for inclusion in this report.

497
VIR
GIN
IATHE NEW HOPE CENTER FOR REPRODUCTIVE MEDICINE
VIRGINIA BEACH, VIRGINIAComparison of success rates across clinics may not be meaningful. Patient medical characteristics and treatment approaches vary (see pages 11–20).
Data verified by Robin L. Poe-Zeigler, MD2014 ART CYCLE PROFILE
Type of ART and Procedural Factors a
IVF 100%Unstimulated 0%Used gestational carrier 2%
With ICSI 95%PGD/PGS 12%
Patient Diagnosis b
Tubal factor 14%Ovulatory dysfunction 28%Diminished ovarian reserve 35%Endometriosis 12%
Uterine factor 10%Male factor 44%Other factor 5%Unknown factor 5%
Multiple Factors: Female factors only 14%Female & male factors 30%
2014 ART SUCCESS RATES c Total number of cyclesd: 281 (includes 5 cycle[s] using frozen eggs)
Type of CycleAge of Woman
<35 35–37 38–40 41–42 43–44 >44Fresh Embryos from Nondonor Eggs
Number of cycles 60 25 21 11 2 0Percentage of cancellations before retrieval (%) 3.3 0.0 0.0 0 / 11 0 / 2 Average number of embryos transferred 1.8 2.0 2.6 2.8 4.0 Percentage of embryos transferred resulting in implantation (%) 33.8 13.9 22.6 24.0 0 / 4 Percentage of elective single embryo transfers (eSET) (%) 7.9 0 / 17 0 / 9 0 / 8 0 / 1
Outcomes per CyclePercentage of cycles resulting in term, normal weight & singleton live births
e (%) 13.3 12.0 14.3 1 / 11 0 / 2
Percentage of cycles resulting in singleton live births (%) 16.7 16.0 23.8 1 / 11 0 / 2 Percentage of cycles resulting in twin live births (%) 11.7 0.0 0.0 0 / 11 0 / 2 Percentage of cycles resulting in live births (%) 28.3 16.0 23.8 2 / 11 0 / 2 Percentage of cycles resulting in pregnancies (%) 33.3 24.0 23.8 4 / 11 0 / 2
Outcomes per TransferNumber of transfers 45 20 12 9 1 0Percentage of transfers resulting in term, normal weight & singleton live births
e (%) 17.8 15.0 3 / 12 1 / 9 0 / 1
Percentage of transfers resulting in singleton live births (%) 22.2 20.0 5 / 12 1 / 9 0 / 1 Percentage of transfers resulting in twin live births (%) 15.6 0.0 0 / 12 0 / 9 0 / 1 Percentage of transfers resulting in live births (%) 37.8 20.0 5 / 12 2 / 9 0 / 1 Percentage of transfers resulting in pregnancies (%) 44.4 30.0 5 / 12 4 / 9 0 / 1
Frozen Embryos from Nondonor EggsNumber of cycles 40 12 8 5 5 1Number of transfers 39 11 6 5 4 1Estimated average number of transfers per retrieval 1.3 0.9 0.3 0.6 4.0 Average number of embryos transferred 2.0 1.8 1.7 3.2 3.3 1.0Percentage of embryos transferred resulting in implantation (%) 26.7 3 / 17 2 / 10 4 / 16 1 / 13 0 / 1Percentage of transfers resulting in term, normal weight & singleton live births
e (%) 17.9 2 / 11 1 / 6 0 / 5 0 / 4 0 / 1
Percentage of transfers resulting in singleton live births (%) 23.1 3 / 11 2 / 6 0 / 5 0 / 4 0 / 1Percentage of transfers resulting in twin live births (%) 7.7 0 / 11 0 / 6 2 / 5 0 / 4 0 / 1Percentage of transfers resulting in live births (%) 33.3 3 / 11 2 / 6 2 / 5 0 / 4 0 / 1Percentage of transfers resulting in pregnancies (%) 41.0 5 / 11 2 / 6 2 / 5 1 / 4 0 / 1
Number of Egg/Embryo Banking Cycles 10 8 19 6 1 0
Donor Eggs Fresh Embryosf Frozen Embryosf
Number of cycles 15 27Number of transfers 15 25Average number of embryos transferred 1.9 1.9Percentage of embryos transferred resulting in implantation (%) 50.0 32.6Percentage of transfers resulting in term, normal weight & singleton live births
e (%) 3 / 15 0.0
Percentage of transfers resulting in singleton live births (%) 4 / 15 0.0Percentage of transfers resulting in twin live births (%) 1 / 15 24.0Percentage of transfers resulting in live births (%) 5 / 15 24.0Percentage of transfers resulting in pregnancies (%) 10 / 15 40.0
CURRENT SERVICES & PROFILE Current Name: The New Hope Center for Reproductive Medicine
Donor eggs? YesDonor embryos? Yes
Gestational carriers? YesEmbryo cryopreservation? Yes
Single women? YesSART member? Yes
Verified lab accreditation? Yes(See Appendix C for details.)
a Reflects features of fresh nondonor cycles. If IVF is less than 100%, the remaining cycles are GIFT, ZIFT, or a combination of these procedures with IVF.
b Total patient diagnosis percentages may be greater than 100% because more than one diagnosis can be reported for each ART cycle.
c Fractions are used for rates with denominators less than 20. Multiple-infant births (for example, twins) with at least one live infant are counted as one live birth.
d Total cycle number includes those using frozen eggs. It excludes 0 cycle(s) evaluating new procedures. Both cycle types are excluded from ART success rates.
e In this report, births are defined as term if at least 37 full weeks gestation and normal birth weight if at least 2,500 grams (approximately 5 pounds, 8 ounces).
f All ages are reported together because previous data show that patient age does not materially affect success with donor eggs.

498
VIR
GIN
IAFRANCISCO M. IRIANNI, MD
WINCHESTER, VIRGINIAComparison of success rates across clinics may not be meaningful. Patient medical characteristics and treatment approaches vary (see pages 11–20).
Data verified by Francisco M. Irianni, MD2014 ART CYCLE PROFILE
Type of ART and Procedural Factors a
IVF 100%Unstimulated 0%Used gestational carrier 11%
With ICSI 80%PGD/PGS 0%
Patient Diagnosis b
Tubal factor 15%Ovulatory dysfunction 29%Diminished ovarian reserve 33%Endometriosis 8%
Uterine factor 2%Male factor 58%Other factor 6%Unknown factor 4%
Multiple Factors: Female factors only 2%Female & male factors 42%
2014 ART SUCCESS RATES c Total number of cyclesd: 48 (includes 0 cycle[s] using frozen eggs)
Type of CycleAge of Woman
<35 35–37 38–40 41–42 43–44 >44Fresh Embryos from Nondonor Eggs
Number of cycles 25 2 7 1 0 0Percentage of cancellations before retrieval (%) 8.0 0 / 2 0 / 7 0 / 1 Average number of embryos transferred 2.0 2.5 3.0 Percentage of embryos transferred resulting in implantation (%) 24.3 1 / 5 19.0 Percentage of elective single embryo transfers (eSET) (%) 20.0 0 / 2 1 / 7
Outcomes per CyclePercentage of cycles resulting in term, normal weight & singleton live births
e (%) 4.0 1 / 2 0 / 7 0 / 1
Percentage of cycles resulting in singleton live births (%) 12.0 1 / 2 2 / 7 0 / 1 Percentage of cycles resulting in twin live births (%) 4.0 0 / 2 0 / 7 0 / 1 Percentage of cycles resulting in live births (%) 16.0 1 / 2 2 / 7 0 / 1 Percentage of cycles resulting in pregnancies (%) 36.0 1 / 2 3 / 7 0 / 1
Outcomes per TransferNumber of transfers 20 2 7 0 0 0Percentage of transfers resulting in term, normal weight & singleton live births
e (%) 5.0 1 / 2 0 / 7
Percentage of transfers resulting in singleton live births (%) 15.0 1 / 2 2 / 7 Percentage of transfers resulting in twin live births (%) 5.0 0 / 2 0 / 7 Percentage of transfers resulting in live births (%) 20.0 1 / 2 2 / 7 Percentage of transfers resulting in pregnancies (%) 45.0 1 / 2 3 / 7
Frozen Embryos from Nondonor EggsNumber of cycles 7 2 2 0 0 0Number of transfers 7 2 1 0 0 0Estimated average number of transfers per retrieval 1.8 0.5 Average number of embryos transferred 1.9 1.5 2.0 Percentage of embryos transferred resulting in implantation (%) 4 / 13 0 / 3 0 / 2 Percentage of transfers resulting in term, normal weight & singleton live births
e (%) 1 / 7 0 / 2 0 / 1
Percentage of transfers resulting in singleton live births (%) 1 / 7 0 / 2 0 / 1 Percentage of transfers resulting in twin live births (%) 1 / 7 0 / 2 0 / 1 Percentage of transfers resulting in live births (%) 2 / 7 0 / 2 0 / 1 Percentage of transfers resulting in pregnancies (%) 3 / 7 0 / 2 0 / 1
Number of Egg/Embryo Banking Cycles 0 0 0 0 0 0
Donor Eggs Fresh Embryosf Frozen Embryosf
Number of cycles 1 1Number of transfers 1 1Average number of embryos transferred 2.0 1.0Percentage of embryos transferred resulting in implantation (%) 0 / 2 0 / 1Percentage of transfers resulting in term, normal weight & singleton live births
e (%) 0 / 1 0 / 1
Percentage of transfers resulting in singleton live births (%) 0 / 1 0 / 1Percentage of transfers resulting in twin live births (%) 0 / 1 0 / 1Percentage of transfers resulting in live births (%) 0 / 1 0 / 1Percentage of transfers resulting in pregnancies (%) 0 / 1 0 / 1
CURRENT SERVICES & PROFILE Current Name: Francisco M. Irianni, MD
Donor eggs? YesDonor embryos? No
Gestational carriers? YesEmbryo cryopreservation? Yes
Single women? YesSART member? No
Verified lab accreditation? Yes(See Appendix C for details.)
a Reflects features of fresh nondonor cycles. If IVF is less than 100%, the remaining cycles are GIFT, ZIFT, or a combination of these procedures with IVF.
b Total patient diagnosis percentages may be greater than 100% because more than one diagnosis can be reported for each ART cycle.
c Fractions are used for rates with denominators less than 20. Multiple-infant births (for example, twins) with at least one live infant are counted as one live birth.
d Total cycle number includes those using frozen eggs. It excludes 0 cycle(s) evaluating new procedures. Both cycle types are excluded from ART success rates.
e In this report, births are defined as term if at least 37 full weeks gestation and normal birth weight if at least 2,500 grams (approximately 5 pounds, 8 ounces).
f All ages are reported together because previous data show that patient age does not materially affect success with donor eggs.

499
WA
SH
ING
TO
NOVERLAKE REPRODUCTIVE HEALTH, INC., PS
BELLEVUE, WASHINGTONComparison of success rates across clinics may not be meaningful. Patient medical characteristics and treatment approaches vary (see pages 11–20).
Data verified by Kevin M. Johnson, MD2014 ART CYCLE PROFILE
Type of ART and Procedural Factors a
IVF 100%Unstimulated 1%Used gestational carrier 2%
With ICSI 58%PGD/PGS 6%
Patient Diagnosis b
Tubal factor 52%Ovulatory dysfunction 41%Diminished ovarian reserve 81%Endometriosis 14%
Uterine factor 5%Male factor 54%Other factor 3%Unknown factor 0%
Multiple Factors: Female factors only 28%Female & male factors 53%
2014 ART SUCCESS RATES c Total number of cyclesd: 234 (includes 0 cycle[s] using frozen eggs)
Type of CycleAge of Woman
<35 35–37 38–40 41–42 43–44 >44Fresh Embryos from Nondonor Eggs
Number of cycles 27 19 20 13 3 1Percentage of cancellations before retrieval (%) 3.7 6 / 19 40.0 4 / 13 0 / 3 0 / 1Average number of embryos transferred 1.8 2.0 2.3 2.2 3.0Percentage of embryos transferred resulting in implantation (%) 42.9 1 / 8 0 / 9 2 / 11 0 / 3Percentage of elective single embryo transfers (eSET) (%) 1 / 16 0 / 4 0 / 3 0 / 3 0 / 1
Outcomes per CyclePercentage of cycles resulting in term, normal weight & singleton live births
e (%) 11.1 1 / 19 0.0 1 / 13 0 / 3 0 / 1
Percentage of cycles resulting in singleton live births (%) 11.1 1 / 19 0.0 1 / 13 0 / 3 0 / 1Percentage of cycles resulting in twin live births (%) 14.8 0 / 19 0.0 0 / 13 0 / 3 0 / 1Percentage of cycles resulting in live births (%) 25.9 1 / 19 0.0 1 / 13 0 / 3 0 / 1Percentage of cycles resulting in pregnancies (%) 40.7 1 / 19 0.0 2 / 13 0 / 3 0 / 1
Outcomes per TransferNumber of transfers 20 4 4 5 0 1Percentage of transfers resulting in term, normal weight & singleton live births
e (%) 15.0 1 / 4 0 / 4 1 / 5 0 / 1
Percentage of transfers resulting in singleton live births (%) 15.0 1 / 4 0 / 4 1 / 5 0 / 1Percentage of transfers resulting in twin live births (%) 20.0 0 / 4 0 / 4 0 / 5 0 / 1Percentage of transfers resulting in live births (%) 35.0 1 / 4 0 / 4 1 / 5 0 / 1Percentage of transfers resulting in pregnancies (%) 55.0 1 / 4 0 / 4 2 / 5 0 / 1
Frozen Embryos from Nondonor EggsNumber of cycles 28 6 9 3 1 0Number of transfers 27 5 6 3 0 0Estimated average number of transfers per retrieval 0.6 0.3 0.4 0.3 0.0 Average number of embryos transferred 1.8 1.2 1.3 2.3 Percentage of embryos transferred resulting in implantation (%) 50.0 4 / 6 2 / 7 1 / 7 Percentage of transfers resulting in term, normal weight & singleton live births
e (%) 48.1 3 / 5 1 / 6 1 / 3
Percentage of transfers resulting in singleton live births (%) 51.9 4 / 5 1 / 6 1 / 3 Percentage of transfers resulting in twin live births (%) 11.1 0 / 5 0 / 6 0 / 3 Percentage of transfers resulting in live births (%) 63.0 4 / 5 1 / 6 1 / 3 Percentage of transfers resulting in pregnancies (%) 70.4 4 / 5 2 / 6 1 / 3
Number of Egg/Embryo Banking Cycles 38 16 13 7 2 0
Donor Eggs Fresh Embryosf Frozen Embryosf
Number of cycles 19 9Number of transfers 18 8Average number of embryos transferred 1.8 1.9Percentage of embryos transferred resulting in implantation (%) 66.7 7 / 15Percentage of transfers resulting in term, normal weight & singleton live births
e (%) 7 / 18 1 / 8
Percentage of transfers resulting in singleton live births (%) 8 / 18 2 / 8Percentage of transfers resulting in twin live births (%) 5 / 18 2 / 8Percentage of transfers resulting in live births (%) 13 / 18 4 / 8Percentage of transfers resulting in pregnancies (%) 15 / 18 4 / 8
CURRENT SERVICES & PROFILE Current Name: Overlake Reproductive Health, Inc., PS
Donor eggs? YesDonor embryos? Yes
Gestational carriers? YesEmbryo cryopreservation? Yes
Single women? YesSART member? Yes
Verified lab accreditation? Yes(See Appendix C for details.)
a Reflects features of fresh nondonor cycles. If IVF is less than 100%, the remaining cycles are GIFT, ZIFT, or a combination of these procedures with IVF.
b Total patient diagnosis percentages may be greater than 100% because more than one diagnosis can be reported for each ART cycle.
c Fractions are used for rates with denominators less than 20. Multiple-infant births (for example, twins) with at least one live infant are counted as one live birth.
d Total cycle number includes those using frozen eggs. It excludes 0 cycle(s) evaluating new procedures. Both cycle types are excluded from ART success rates.
e In this report, births are defined as term if at least 37 full weeks gestation and normal birth weight if at least 2,500 grams (approximately 5 pounds, 8 ounces).
f All ages are reported together because previous data show that patient age does not materially affect success with donor eggs.
500
WA
SH
ING
TO
NWASHINGTON CENTER FOR REPRODUCTIVE MEDICINE
BELLEVUE, WASHINGTON
This clinic provided ART services during 2014 and is therefore required to submit ART cycle data under the provisions of the Fertility Clinic Success Rate and Certification Act. This clinic either did not submit 2014 ART cycle data or the clinic’s Medical Director did not approve the clinic’s 2014 ART cycle data for inclusion in this report.

501
WA
SH
ING
TO
NBELLINGHAM IVF & FERTILITY CARE
BELLINGHAM, WASHINGTONComparison of success rates across clinics may not be meaningful. Patient medical characteristics and treatment approaches vary (see pages 11–20).
Data verified by Emmett Branigan, MD2014 ART CYCLE PROFILE
Type of ART and Procedural Factors a
IVF 100%Unstimulated 0%Used gestational carrier 0%
With ICSI 85%PGD/PGS 0%
Patient Diagnosis b
Tubal factor 5%Ovulatory dysfunction 19%Diminished ovarian reserve 54%Endometriosis 8%
Uterine factor 5%Male factor 82%Other factor 3%Unknown factor 0%
Multiple Factors: Female factors only 3%Female & male factors 64%
2014 ART SUCCESS RATES c Total number of cyclesd: 67 (includes 0 cycle[s] using frozen eggs)
Type of CycleAge of Woman
<35 35–37 38–40 41–42 43–44 >44Fresh Embryos from Nondonor Eggs
Number of cycles 16 4 8 3 1 1Percentage of cancellations before retrieval (%) 0 / 16 0 / 4 1 / 8 0 / 3 1 / 1 0 / 1Average number of embryos transferred 2.0 2.0 1.8 1.5 Percentage of embryos transferred resulting in implantation (%) 43.8 2 / 8 2 / 9 0 / 3 Percentage of elective single embryo transfers (eSET) (%) 0 / 16 0 / 4 0 / 5 0 / 1
Outcomes per CyclePercentage of cycles resulting in term, normal weight & singleton live births
e (%) 8 / 16 1 / 4 1 / 8 0 / 3 0 / 1 0 / 1
Percentage of cycles resulting in singleton live births (%) 9 / 16 2 / 4 1 / 8 0 / 3 0 / 1 0 / 1Percentage of cycles resulting in twin live births (%) 2 / 16 0 / 4 0 / 8 0 / 3 0 / 1 0 / 1Percentage of cycles resulting in live births (%) 11 / 16 2 / 4 1 / 8 0 / 3 0 / 1 0 / 1Percentage of cycles resulting in pregnancies (%) 12 / 16 2 / 4 3 / 8 0 / 3 0 / 1 0 / 1
Outcomes per TransferNumber of transfers 16 4 6 2 0 0Percentage of transfers resulting in term, normal weight & singleton live births
e (%) 8 / 16 1 / 4 1 / 6 0 / 2
Percentage of transfers resulting in singleton live births (%) 9 / 16 2 / 4 1 / 6 0 / 2 Percentage of transfers resulting in twin live births (%) 2 / 16 0 / 4 0 / 6 0 / 2 Percentage of transfers resulting in live births (%) 11 / 16 2 / 4 1 / 6 0 / 2 Percentage of transfers resulting in pregnancies (%) 12 / 16 2 / 4 3 / 6 0 / 2
Frozen Embryos from Nondonor EggsNumber of cycles 8 3 6 1 0 1Number of transfers 8 3 6 1 0 1Estimated average number of transfers per retrieval 8.0 3.0 1.0 Average number of embryos transferred 2.1 2.0 2.2 2.0 2.0Percentage of embryos transferred resulting in implantation (%) 4 / 17 2 / 6 1 / 13 0 / 2 1 / 2Percentage of transfers resulting in term, normal weight & singleton live births
e (%) 3 / 8 1 / 3 0 / 6 0 / 1 0 / 1
Percentage of transfers resulting in singleton live births (%) 4 / 8 2 / 3 1 / 6 0 / 1 1 / 1Percentage of transfers resulting in twin live births (%) 0 / 8 0 / 3 0 / 6 0 / 1 0 / 1Percentage of transfers resulting in live births (%) 4 / 8 2 / 3 1 / 6 0 / 1 1 / 1Percentage of transfers resulting in pregnancies (%) 4 / 8 2 / 3 1 / 6 0 / 1 1 / 1
Number of Egg/Embryo Banking Cycles 0 0 0 0 0 0
Donor Eggs Fresh Embryosf Frozen Embryosf
Number of cycles 8 7Number of transfers 8 7Average number of embryos transferred 2.0 2.0Percentage of embryos transferred resulting in implantation (%) 7 / 16 4 / 8Percentage of transfers resulting in term, normal weight & singleton live births
e (%) 5 / 8 0 / 7
Percentage of transfers resulting in singleton live births (%) 6 / 8 2 / 7Percentage of transfers resulting in twin live births (%) 0 / 8 1 / 7Percentage of transfers resulting in live births (%) 6 / 8 3 / 7Percentage of transfers resulting in pregnancies (%) 7 / 8 6 / 7
CURRENT SERVICES & PROFILE Current Name: Bellingham IVF & Fertility Care
Donor eggs? YesDonor embryos? No
Gestational carriers? NoEmbryo cryopreservation? Yes
Single women? YesSART member? No
Verified lab accreditation? No(See Appendix C for details.)
a Reflects features of fresh nondonor cycles. If IVF is less than 100%, the remaining cycles are GIFT, ZIFT, or a combination of these procedures with IVF.
b Total patient diagnosis percentages may be greater than 100% because more than one diagnosis can be reported for each ART cycle.
c Fractions are used for rates with denominators less than 20. Multiple-infant births (for example, twins) with at least one live infant are counted as one live birth.
d Total cycle number includes those using frozen eggs. It excludes 0 cycle(s) evaluating new procedures. Both cycle types are excluded from ART success rates.
e In this report, births are defined as term if at least 37 full weeks gestation and normal birth weight if at least 2,500 grams (approximately 5 pounds, 8 ounces).
f All ages are reported together because previous data show that patient age does not materially affect success with donor eggs.

502
WA
SH
ING
TO
NPOMA FERTILITY
KIRKLAND, WASHINGTONComparison of success rates across clinics may not be meaningful. Patient medical characteristics and treatment approaches vary (see pages 11–20).
Data verified by Michael S. Opsahl, MD2014 ART CYCLE PROFILE
Type of ART and Procedural Factors a
IVF 100%Unstimulated 0%Used gestational carrier <1%
With ICSI 41%PGD/PGS 5%
Patient Diagnosis b
Tubal factor 10%Ovulatory dysfunction 8%Diminished ovarian reserve 36%Endometriosis 9%
Uterine factor 7%Male factor 26%Other factor 16%Unknown factor 15%
Multiple Factors: Female factors only 10%Female & male factors 13%
2014 ART SUCCESS RATES c Total number of cyclesd: 330 (includes 6 cycle[s] using frozen eggs)
Type of CycleAge of Woman
<35 35–37 38–40 41–42 43–44 >44Fresh Embryos from Nondonor Eggs
Number of cycles 72 55 32 11 4 0Percentage of cancellations before retrieval (%) 5.6 9.1 9.4 1 / 11 0 / 4 Average number of embryos transferred 1.4 1.8 2.6 3.0 3.5 Percentage of embryos transferred resulting in implantation (%) 47.7 40.6 23.8 18.5 0 / 4 Percentage of elective single embryo transfers (eSET) (%) 58.9 35.3 4.2 0 / 9 0 / 2
Outcomes per CyclePercentage of cycles resulting in term, normal weight & singleton live births
e (%) 44.4 29.1 25.0 1 / 11 0 / 4
Percentage of cycles resulting in singleton live births (%) 47.2 34.5 25.0 1 / 11 0 / 4 Percentage of cycles resulting in twin live births (%) 1.4 3.6 9.4 0 / 11 0 / 4 Percentage of cycles resulting in live births (%) 48.6 38.2 34.4 1 / 11 0 / 4 Percentage of cycles resulting in pregnancies (%) 54.2 45.5 43.8 5 / 11 1 / 4
Outcomes per TransferNumber of transfers 61 40 26 9 2 0Percentage of transfers resulting in term, normal weight & singleton live births
e (%) 52.5 40.0 30.8 1 / 9 0 / 2
Percentage of transfers resulting in singleton live births (%) 55.7 47.5 30.8 1 / 9 0 / 2 Percentage of transfers resulting in twin live births (%) 1.6 5.0 11.5 0 / 9 0 / 2 Percentage of transfers resulting in live births (%) 57.4 52.5 42.3 1 / 9 0 / 2 Percentage of transfers resulting in pregnancies (%) 63.9 62.5 53.8 5 / 9 1 / 2
Frozen Embryos from Nondonor EggsNumber of cycles 30 18 13 7 1 0Number of transfers 29 17 10 5 1 0Estimated average number of transfers per retrieval 1.0 0.7 0.7 1.0 0.5 0.0Average number of embryos transferred 1.2 1.3 1.2 1.4 2.0 Percentage of embryos transferred resulting in implantation (%) 50.0 50.0 7 / 12 6 / 7 1 / 2 Percentage of transfers resulting in term, normal weight & singleton live births
e (%) 31.0 4 / 17 4 / 10 1 / 5 0 / 1
Percentage of transfers resulting in singleton live births (%) 41.4 5 / 17 5 / 10 1 / 5 0 / 1 Percentage of transfers resulting in twin live births (%) 3.4 2 / 17 1 / 10 1 / 5 0 / 1 Percentage of transfers resulting in live births (%) 44.8 7 / 17 6 / 10 2 / 5 0 / 1 Percentage of transfers resulting in pregnancies (%) 58.6 10 / 17 6 / 10 4 / 5 1 / 1
Number of Egg/Embryo Banking Cycles 17 12 11 5 2 1
Donor Eggs Fresh Embryosf Frozen Embryosf
Number of cycles 22 11Number of transfers 19 7Average number of embryos transferred 1.4 1.3Percentage of embryos transferred resulting in implantation (%) 78.3 4 / 9Percentage of transfers resulting in term, normal weight & singleton live births
e (%) 7 / 19 2 / 7
Percentage of transfers resulting in singleton live births (%) 8 / 19 2 / 7Percentage of transfers resulting in twin live births (%) 3 / 19 0 / 7Percentage of transfers resulting in live births (%) 12 / 19 2 / 7Percentage of transfers resulting in pregnancies (%) 15 / 19 4 / 7
CURRENT SERVICES & PROFILE Current Name: Poma Fertility
Donor eggs? YesDonor embryos? Yes
Gestational carriers? YesEmbryo cryopreservation? Yes
Single women? YesSART member? Yes
Verified lab accreditation? Yes(See Appendix C for details.)
a Reflects features of fresh nondonor cycles. If IVF is less than 100%, the remaining cycles are GIFT, ZIFT, or a combination of these procedures with IVF.
b Total patient diagnosis percentages may be greater than 100% because more than one diagnosis can be reported for each ART cycle.
c Fractions are used for rates with denominators less than 20. Multiple-infant births (for example, twins) with at least one live infant are counted as one live birth.
d Total cycle number includes those using frozen eggs. It excludes 0 cycle(s) evaluating new procedures. Both cycle types are excluded from ART success rates.
e In this report, births are defined as term if at least 37 full weeks gestation and normal birth weight if at least 2,500 grams (approximately 5 pounds, 8 ounces).
f All ages are reported together because previous data show that patient age does not materially affect success with donor eggs.

503
WA
SH
ING
TO
NOLYMPIA WOMEN’S HEALTH
OLYMPIA, WASHINGTONComparison of success rates across clinics may not be meaningful. Patient medical characteristics and treatment approaches vary (see pages 11–20).
Data verified by James F. Moruzzi, MD, PhD2014 ART CYCLE PROFILE
Type of ART and Procedural Factors a
IVF 100%Unstimulated 0%Used gestational carrier 0%
With ICSI 0%PGD/PGS 0%
Patient Diagnosis b
Tubal factor 20%Ovulatory dysfunction 24%Diminished ovarian reserve 22%Endometriosis 15%
Uterine factor 0%Male factor 0%Other factor 0%Unknown factor 22%
Multiple Factors: Female factors only 2%Female & male factors 0%
2014 ART SUCCESS RATES c Total number of cyclesd: 42 (includes 0 cycle[s] using frozen eggs)
Type of CycleAge of Woman
<35 35–37 38–40 41–42 43–44 >44Fresh Embryos from Nondonor Eggs
Number of cycles 14 8 3 3 0 1Percentage of cancellations before retrieval (%) 0 / 14 0 / 8 0 / 3 0 / 3 0 / 1Average number of embryos transferred 2.1 2.1 2.0 2.0 1.0Percentage of embryos transferred resulting in implantation (%) 26.7 0 / 17 0 / 6 0 / 6 0 / 1Percentage of elective single embryo transfers (eSET) (%) 1 / 14 0 / 7 0 / 2 0 / 2
Outcomes per CyclePercentage of cycles resulting in term, normal weight & singleton live births
e (%) 1 / 14 0 / 8 0 / 3 0 / 3 0 / 1
Percentage of cycles resulting in singleton live births (%) 2 / 14 0 / 8 0 / 3 0 / 3 0 / 1Percentage of cycles resulting in twin live births (%) 2 / 14 0 / 8 0 / 3 0 / 3 0 / 1Percentage of cycles resulting in live births (%) 4 / 14 0 / 8 0 / 3 0 / 3 0 / 1Percentage of cycles resulting in pregnancies (%) 6 / 14 0 / 8 0 / 3 0 / 3 0 / 1
Outcomes per TransferNumber of transfers 14 8 3 3 0 1Percentage of transfers resulting in term, normal weight & singleton live births
e (%) 1 / 14 0 / 8 0 / 3 0 / 3 0 / 1
Percentage of transfers resulting in singleton live births (%) 2 / 14 0 / 8 0 / 3 0 / 3 0 / 1Percentage of transfers resulting in twin live births (%) 2 / 14 0 / 8 0 / 3 0 / 3 0 / 1Percentage of transfers resulting in live births (%) 4 / 14 0 / 8 0 / 3 0 / 3 0 / 1Percentage of transfers resulting in pregnancies (%) 6 / 14 0 / 8 0 / 3 0 / 3 0 / 1
Frozen Embryos from Nondonor EggsNumber of cycles 6 1 0 0 0 0Number of transfers 6 1 0 0 0 0Estimated average number of transfers per retrieval 3.0 0.5 Average number of embryos transferred 2.5 3.0 Percentage of embryos transferred resulting in implantation (%) 1 / 15 0 / 3 Percentage of transfers resulting in term, normal weight & singleton live births
e (%) 1 / 6 0 / 1
Percentage of transfers resulting in singleton live births (%) 1 / 6 0 / 1 Percentage of transfers resulting in twin live births (%) 0 / 6 0 / 1 Percentage of transfers resulting in live births (%) 1 / 6 0 / 1 Percentage of transfers resulting in pregnancies (%) 1 / 6 0 / 1
Number of Egg/Embryo Banking Cycles 0 1 0 0 0 0
Donor Eggs Fresh Embryosf Frozen Embryosf
Number of cycles 3 2Number of transfers 3 2Average number of embryos transferred 2.0 2.0Percentage of embryos transferred resulting in implantation (%) 2 / 6 1 / 4Percentage of transfers resulting in term, normal weight & singleton live births
e (%) 0 / 3 1 / 2
Percentage of transfers resulting in singleton live births (%) 0 / 3 1 / 2Percentage of transfers resulting in twin live births (%) 1 / 3 0 / 2Percentage of transfers resulting in live births (%) 1 / 3 1 / 2Percentage of transfers resulting in pregnancies (%) 1 / 3 1 / 2
CURRENT SERVICES & PROFILE Current Name: Olympia Women’s Health
Donor eggs? YesDonor embryos? Yes
Gestational carriers? YesEmbryo cryopreservation? Yes
Single women? YesSART member? Yes
Verified lab accreditation? Yes(See Appendix C for details.)
a Reflects features of fresh nondonor cycles. If IVF is less than 100%, the remaining cycles are GIFT, ZIFT, or a combination of these procedures with IVF.
b Total patient diagnosis percentages may be greater than 100% because more than one diagnosis can be reported for each ART cycle.
c Fractions are used for rates with denominators less than 20. Multiple-infant births (for example, twins) with at least one live infant are counted as one live birth.
d Total cycle number includes those using frozen eggs. It excludes 0 cycle(s) evaluating new procedures. Both cycle types are excluded from ART success rates.
e In this report, births are defined as term if at least 37 full weeks gestation and normal birth weight if at least 2,500 grams (approximately 5 pounds, 8 ounces).
f All ages are reported together because previous data show that patient age does not materially affect success with donor eggs.

504
WA
SH
ING
TO
NPACIFIC NORTHWEST FERTILITY AND IVF SPECIALISTS
SEATTLE, WASHINGTONComparison of success rates across clinics may not be meaningful. Patient medical characteristics and treatment approaches vary (see pages 11–20).
Data verified by Lorna A. Marshall, MD2014 ART CYCLE PROFILE
Type of ART and Procedural Factors a
IVF 100%Unstimulated 0%Used gestational carrier 0%
With ICSI 86%PGD/PGS 7%
Patient Diagnosis b
Tubal factor 5%Ovulatory dysfunction 5%Diminished ovarian reserve 62%Endometriosis 6%
Uterine factor 2%Male factor 19%Other factor 8%Unknown factor 8%
Multiple Factors: Female factors only 8%Female & male factors 6%
2014 ART SUCCESS RATES c Total number of cyclesd: 1,062 (includes 0 cycle[s] using frozen eggs)
Type of CycleAge of Woman
<35 35–37 38–40 41–42 43–44 >44Fresh Embryos from Nondonor Eggs
Number of cycles 66 31 45 24 9 2Percentage of cancellations before retrieval (%) 3.0 9.7 2.2 20.8 6 / 9 1 / 2Average number of embryos transferred 1.5 1.7 2.0 1.7 3.0 3.0Percentage of embryos transferred resulting in implantation (%) 34.0 30.6 20.0 3 / 19 1 / 6 0 / 3Percentage of elective single embryo transfers (eSET) (%) 52.8 3 / 18 4.0 1 / 8 0 / 2 0 / 1
Outcomes per CyclePercentage of cycles resulting in term, normal weight & singleton live births
e (%) 16.7 12.9 8.9 8.3 0 / 9 0 / 2
Percentage of cycles resulting in singleton live births (%) 18.2 19.4 13.3 12.5 0 / 9 0 / 2Percentage of cycles resulting in twin live births (%) 3.0 3.2 2.2 0.0 0 / 9 0 / 2Percentage of cycles resulting in live births (%) 21.2 22.6 15.6 12.5 0 / 9 0 / 2Percentage of cycles resulting in pregnancies (%) 24.2 29.0 22.2 12.5 1 / 9 0 / 2
Outcomes per TransferNumber of transfers 36 21 30 11 2 1Percentage of transfers resulting in term, normal weight & singleton live births
e (%) 30.6 19.0 13.3 2 / 11 0 / 2 0 / 1
Percentage of transfers resulting in singleton live births (%) 33.3 28.6 20.0 3 / 11 0 / 2 0 / 1Percentage of transfers resulting in twin live births (%) 5.6 4.8 3.3 0 / 11 0 / 2 0 / 1Percentage of transfers resulting in live births (%) 38.9 33.3 23.3 3 / 11 0 / 2 0 / 1Percentage of transfers resulting in pregnancies (%) 44.4 42.9 33.3 3 / 11 1 / 2 0 / 1
Frozen Embryos from Nondonor EggsNumber of cycles 138 78 73 32 16 1Number of transfers 127 76 71 31 16 0Estimated average number of transfers per retrieval 1.3 1.3 0.7 0.9 1.0 0.0Average number of embryos transferred 1.2 1.3 1.2 1.4 1.3 Percentage of embryos transferred resulting in implantation (%) 59.6 57.3 52.3 43.2 8 / 18 Percentage of transfers resulting in term, normal weight & singleton live births
e (%) 38.6 40.8 39.4 32.3 4 / 16
Percentage of transfers resulting in singleton live births (%) 45.7 47.4 47.9 32.3 4 / 16 Percentage of transfers resulting in twin live births (%) 9.4 6.6 2.8 9.7 1 / 16 Percentage of transfers resulting in live births (%) 55.1 53.9 50.7 41.9 5 / 16 Percentage of transfers resulting in pregnancies (%) 63.8 64.5 60.6 51.6 8 / 16
Number of Egg/Embryo Banking Cycles 66 48 88 30 16 2
Donor Eggs Fresh Embryosf Frozen Embryosf
Number of cycles 47 250Number of transfers 2 243Average number of embryos transferred 1.0 1.2Percentage of embryos transferred resulting in implantation (%) 1 / 2 49.6Percentage of transfers resulting in term, normal weight & singleton live births
e (%) 1 / 2 38.3
Percentage of transfers resulting in singleton live births (%) 1 / 2 48.1Percentage of transfers resulting in twin live births (%) 0 / 2 2.5Percentage of transfers resulting in live births (%) 1 / 2 50.6Percentage of transfers resulting in pregnancies (%) 1 / 2 56.8
CURRENT SERVICES & PROFILE Current Name: Pacific Northwest Fertility and IVF Specialists
Donor eggs? YesDonor embryos? Yes
Gestational carriers? YesEmbryo cryopreservation? Yes
Single women? YesSART member? Yes
Verified lab accreditation? Yes(See Appendix C for details.)
a Reflects features of fresh nondonor cycles. If IVF is less than 100%, the remaining cycles are GIFT, ZIFT, or a combination of these procedures with IVF.
b Total patient diagnosis percentages may be greater than 100% because more than one diagnosis can be reported for each ART cycle.
c Fractions are used for rates with denominators less than 20. Multiple-infant births (for example, twins) with at least one live infant are counted as one live birth.
d Total cycle number includes those using frozen eggs. It excludes 0 cycle(s) evaluating new procedures. Both cycle types are excluded from ART success rates.
e In this report, births are defined as term if at least 37 full weeks gestation and normal birth weight if at least 2,500 grams (approximately 5 pounds, 8 ounces).
f All ages are reported together because previous data show that patient age does not materially affect success with donor eggs.

505
WA
SH
ING
TO
NSEATTLE REPRODUCTIVE MEDICINE
INTEGRAMED AMERICASEATTLE, WASHINGTON
Comparison of success rates across clinics may not be meaningful. Patient medical characteristics and treatment approaches vary (see pages 11–20).
Data verified by Paul S. Dudley, MD2014 ART CYCLE PROFILE
Type of ART and Procedural Factors a
IVF 100%Unstimulated 0%Used gestational carrier <1%
With ICSI 67%PGD/PGS <1%
Patient Diagnosis b
Tubal factor 11%Ovulatory dysfunction 18%Diminished ovarian reserve 27%Endometriosis 8%
Uterine factor 4%Male factor 37%Other factor 10%Unknown factor 11%
Multiple Factors: Female factors only 8%Female & male factors 13%
2014 ART SUCCESS RATES c Total number of cyclesd: 2,051 (includes 189 cycle[s] using frozen eggs)
Type of CycleAge of Woman
<35 35–37 38–40 41–42 43–44 >44Fresh Embryos from Nondonor Eggs
Number of cycles 325 157 137 85 36 1Percentage of cancellations before retrieval (%) 4.6 7.0 18.2 27.1 27.8 0 / 1Average number of embryos transferred 1.4 1.6 1.9 2.0 2.5 1.0Percentage of embryos transferred resulting in implantation (%) 46.5 35.1 23.2 12.8 5.3 0 / 1Percentage of elective single embryo transfers (eSET) (%) 51.5 30.0 10.5 8.3 0.0
Outcomes per CyclePercentage of cycles resulting in term, normal weight & singleton live births
e (%) 28.3 25.5 13.9 9.4 8.3 0 / 1
Percentage of cycles resulting in singleton live births (%) 33.5 28.0 18.2 10.6 8.3 0 / 1Percentage of cycles resulting in twin live births (%) 6.2 6.4 2.2 0.0 0.0 0 / 1Percentage of cycles resulting in live births (%) 40.0 34.4 21.2 10.6 8.3 0 / 1Percentage of cycles resulting in pregnancies (%) 44.6 38.9 29.2 14.1 8.3 0 / 1
Outcomes per TransferNumber of transfers 262 127 100 45 23 1Percentage of transfers resulting in term, normal weight & singleton live births
e (%) 35.1 31.5 19.0 17.8 13.0 0 / 1
Percentage of transfers resulting in singleton live births (%) 41.6 34.6 25.0 20.0 13.0 0 / 1Percentage of transfers resulting in twin live births (%) 7.6 7.9 3.0 0.0 0.0 0 / 1Percentage of transfers resulting in live births (%) 49.6 42.5 29.0 20.0 13.0 0 / 1Percentage of transfers resulting in pregnancies (%) 55.3 48.0 40.0 26.7 13.0 0 / 1
Frozen Embryos from Nondonor EggsNumber of cycles 297 136 112 42 23 6Number of transfers 270 117 100 34 17 5Estimated average number of transfers per retrieval 1.5 1.1 1.1 0.7 0.7 1.7Average number of embryos transferred 1.3 1.3 1.4 1.4 1.5 1.4Percentage of embryos transferred resulting in implantation (%) 48.2 44.5 35.3 39.0 39.1 1 / 7Percentage of transfers resulting in term, normal weight & singleton live births
e (%) 32.6 29.1 23.0 35.3 6 / 17 0 / 5
Percentage of transfers resulting in singleton live births (%) 37.8 35.9 29.0 38.2 6 / 17 0 / 5Percentage of transfers resulting in twin live births (%) 5.6 8.5 5.0 0.0 0 / 17 0 / 5Percentage of transfers resulting in live births (%) 43.7 44.4 34.0 38.2 6 / 17 0 / 5Percentage of transfers resulting in pregnancies (%) 57.0 51.3 45.0 58.8 10 / 17 1 / 5
Number of Egg/Embryo Banking Cycles 96 65 68 35 21 3
Donor Eggs Fresh Embryosf Frozen Embryosf
Number of cycles 36 181Number of transfers 32 156Average number of embryos transferred 1.5 1.3Percentage of embryos transferred resulting in implantation (%) 46.7 31.6Percentage of transfers resulting in term, normal weight & singleton live births
e (%) 34.4 23.7
Percentage of transfers resulting in singleton live births (%) 34.4 25.0Percentage of transfers resulting in twin live births (%) 12.5 3.2Percentage of transfers resulting in live births (%) 46.9 28.2Percentage of transfers resulting in pregnancies (%) 59.4 39.7
CURRENT SERVICES & PROFILE Current Name: Seattle Reproductive Medicine, Integramed America
Donor eggs? YesDonor embryos? Yes
Gestational carriers? YesEmbryo cryopreservation? Yes
Single women? YesSART member? Yes
Verified lab accreditation? Yes(See Appendix C for details.)
a Reflects features of fresh nondonor cycles. If IVF is less than 100%, the remaining cycles are GIFT, ZIFT, or a combination of these procedures with IVF.
b Total patient diagnosis percentages may be greater than 100% because more than one diagnosis can be reported for each ART cycle.
c Fractions are used for rates with denominators less than 20. Multiple-infant births (for example, twins) with at least one live infant are counted as one live birth.
d Total cycle number includes those using frozen eggs. It excludes 0 cycle(s) evaluating new procedures. Both cycle types are excluded from ART success rates.
e In this report, births are defined as term if at least 37 full weeks gestation and normal birth weight if at least 2,500 grams (approximately 5 pounds, 8 ounces).
f All ages are reported together because previous data show that patient age does not materially affect success with donor eggs.

506
WA
SH
ING
TO
NUNIVERSITY REPRODUCTIVE CARE
UNIVERSITY OF WASHINGTONSEATTLE, WASHINGTON
Comparison of success rates across clinics may not be meaningful. Patient medical characteristics and treatment approaches vary (see pages 11–20).
Data verified by Diane Woodford, MD2014 ART CYCLE PROFILE
Type of ART and Procedural Factors a
IVF 100%Unstimulated 0%Used gestational carrier 2%
With ICSI 81%PGD/PGS 0%
Patient Diagnosis b
Tubal factor 14%Ovulatory dysfunction 22%Diminished ovarian reserve 44%Endometriosis 7%
Uterine factor 1%Male factor 53%Other factor 13%Unknown factor 6%
Multiple Factors: Female factors only 11%Female & male factors 36%
2014 ART SUCCESS RATES c Total number of cyclesd: 78 (includes 0 cycle[s] using frozen eggs)
Type of CycleAge of Woman
<35 35–37 38–40 41–42 43–44 >44Fresh Embryos from Nondonor Eggs
Number of cycles 18 12 10 6 2 0Percentage of cancellations before retrieval (%) 1 / 18 3 / 12 3 / 10 2 / 6 0 / 2 Average number of embryos transferred 2.1 1.6 1.8 2.5 3.0 Percentage of embryos transferred resulting in implantation (%) 32.0 5 / 11 3 / 10 1 / 10 0 / 3 Percentage of elective single embryo transfers (eSET) (%) 0 / 11 1 / 5 1 / 4 0 / 4 0 / 1
Outcomes per CyclePercentage of cycles resulting in term, normal weight & singleton live births
e (%) 4 / 18 2 / 12 0 / 10 1 / 6 0 / 2
Percentage of cycles resulting in singleton live births (%) 4 / 18 2 / 12 2 / 10 1 / 6 0 / 2 Percentage of cycles resulting in twin live births (%) 2 / 18 1 / 12 0 / 10 0 / 6 0 / 2 Percentage of cycles resulting in live births (%) 6 / 18 3 / 12 2 / 10 1 / 6 0 / 2 Percentage of cycles resulting in pregnancies (%) 6 / 18 4 / 12 4 / 10 1 / 6 0 / 2
Outcomes per TransferNumber of transfers 12 7 6 4 1 0Percentage of transfers resulting in term, normal weight & singleton live births
e (%) 4 / 12 2 / 7 0 / 6 1 / 4 0 / 1
Percentage of transfers resulting in singleton live births (%) 4 / 12 2 / 7 2 / 6 1 / 4 0 / 1 Percentage of transfers resulting in twin live births (%) 2 / 12 1 / 7 0 / 6 0 / 4 0 / 1 Percentage of transfers resulting in live births (%) 6 / 12 3 / 7 2 / 6 1 / 4 0 / 1 Percentage of transfers resulting in pregnancies (%) 6 / 12 4 / 7 4 / 6 1 / 4 0 / 1
Frozen Embryos from Nondonor EggsNumber of cycles 14 7 1 0 1 0Number of transfers 13 6 1 0 1 0Estimated average number of transfers per retrieval 1.4 2.0 1.0 0.0 1.0 Average number of embryos transferred 1.3 1.2 1.0 1.0 Percentage of embryos transferred resulting in implantation (%) 6 / 16 4 / 7 0 / 1 0 / 1 Percentage of transfers resulting in term, normal weight & singleton live births
e (%) 3 / 13 4 / 6 0 / 1 0 / 1
Percentage of transfers resulting in singleton live births (%) 3 / 13 4 / 6 0 / 1 0 / 1 Percentage of transfers resulting in twin live births (%) 1 / 13 0 / 6 0 / 1 0 / 1 Percentage of transfers resulting in live births (%) 4 / 13 4 / 6 0 / 1 0 / 1 Percentage of transfers resulting in pregnancies (%) 6 / 13 4 / 6 0 / 1 0 / 1
Number of Egg/Embryo Banking Cycles 2 3 0 1 0 0
Donor Eggs Fresh Embryosf Frozen Embryosf
Number of cycles 0 1Number of transfers 0 1Average number of embryos transferred 1.0Percentage of embryos transferred resulting in implantation (%) 1 / 1Percentage of transfers resulting in term, normal weight & singleton live births
e (%) 1 / 1
Percentage of transfers resulting in singleton live births (%) 1 / 1Percentage of transfers resulting in twin live births (%) 0 / 1Percentage of transfers resulting in live births (%) 1 / 1Percentage of transfers resulting in pregnancies (%) 1 / 1
CURRENT SERVICES & PROFILE Current Name: University Reproductive Care, University of Washington
Donor eggs? YesDonor embryos? Yes
Gestational carriers? NoEmbryo cryopreservation? Yes
Single women? YesSART member? Yes
Verified lab accreditation? Yes(See Appendix C for details.)
a Reflects features of fresh nondonor cycles. If IVF is less than 100%, the remaining cycles are GIFT, ZIFT, or a combination of these procedures with IVF.
b Total patient diagnosis percentages may be greater than 100% because more than one diagnosis can be reported for each ART cycle.
c Fractions are used for rates with denominators less than 20. Multiple-infant births (for example, twins) with at least one live infant are counted as one live birth.
d Total cycle number includes those using frozen eggs. It excludes 0 cycle(s) evaluating new procedures. Both cycle types are excluded from ART success rates.
e In this report, births are defined as term if at least 37 full weeks gestation and normal birth weight if at least 2,500 grams (approximately 5 pounds, 8 ounces).
f All ages are reported together because previous data show that patient age does not materially affect success with donor eggs.
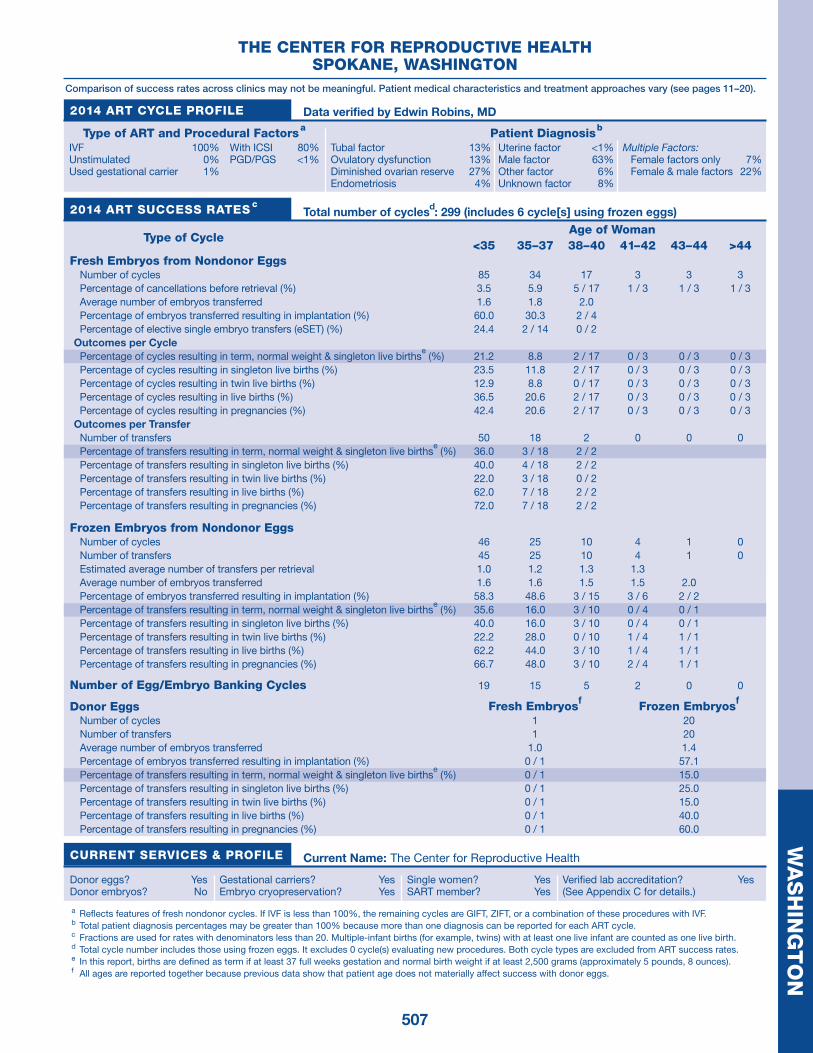
507
WA
SH
ING
TO
NTHE CENTER FOR REPRODUCTIVE HEALTH
SPOKANE, WASHINGTONComparison of success rates across clinics may not be meaningful. Patient medical characteristics and treatment approaches vary (see pages 11–20).
Data verified by Edwin Robins, MD2014 ART CYCLE PROFILE
Type of ART and Procedural Factors a
IVF 100%Unstimulated 0%Used gestational carrier 1%
With ICSI 80%PGD/PGS <1%
Patient Diagnosis b
Tubal factor 13%Ovulatory dysfunction 13%Diminished ovarian reserve 27%Endometriosis 4%
Uterine factor <1%Male factor 63%Other factor 6%Unknown factor 8%
Multiple Factors: Female factors only 7%Female & male factors 22%
2014 ART SUCCESS RATES c Total number of cyclesd: 299 (includes 6 cycle[s] using frozen eggs)
Type of CycleAge of Woman
<35 35–37 38–40 41–42 43–44 >44Fresh Embryos from Nondonor Eggs
Number of cycles 85 34 17 3 3 3Percentage of cancellations before retrieval (%) 3.5 5.9 5 / 17 1 / 3 1 / 3 1 / 3Average number of embryos transferred 1.6 1.8 2.0 Percentage of embryos transferred resulting in implantation (%) 60.0 30.3 2 / 4 Percentage of elective single embryo transfers (eSET) (%) 24.4 2 / 14 0 / 2
Outcomes per CyclePercentage of cycles resulting in term, normal weight & singleton live births
e (%) 21.2 8.8 2 / 17 0 / 3 0 / 3 0 / 3
Percentage of cycles resulting in singleton live births (%) 23.5 11.8 2 / 17 0 / 3 0 / 3 0 / 3Percentage of cycles resulting in twin live births (%) 12.9 8.8 0 / 17 0 / 3 0 / 3 0 / 3Percentage of cycles resulting in live births (%) 36.5 20.6 2 / 17 0 / 3 0 / 3 0 / 3Percentage of cycles resulting in pregnancies (%) 42.4 20.6 2 / 17 0 / 3 0 / 3 0 / 3
Outcomes per TransferNumber of transfers 50 18 2 0 0 0Percentage of transfers resulting in term, normal weight & singleton live births
e (%) 36.0 3 / 18 2 / 2
Percentage of transfers resulting in singleton live births (%) 40.0 4 / 18 2 / 2 Percentage of transfers resulting in twin live births (%) 22.0 3 / 18 0 / 2 Percentage of transfers resulting in live births (%) 62.0 7 / 18 2 / 2 Percentage of transfers resulting in pregnancies (%) 72.0 7 / 18 2 / 2
Frozen Embryos from Nondonor EggsNumber of cycles 46 25 10 4 1 0Number of transfers 45 25 10 4 1 0Estimated average number of transfers per retrieval 1.0 1.2 1.3 1.3 Average number of embryos transferred 1.6 1.6 1.5 1.5 2.0 Percentage of embryos transferred resulting in implantation (%) 58.3 48.6 3 / 15 3 / 6 2 / 2 Percentage of transfers resulting in term, normal weight & singleton live births
e (%) 35.6 16.0 3 / 10 0 / 4 0 / 1
Percentage of transfers resulting in singleton live births (%) 40.0 16.0 3 / 10 0 / 4 0 / 1 Percentage of transfers resulting in twin live births (%) 22.2 28.0 0 / 10 1 / 4 1 / 1 Percentage of transfers resulting in live births (%) 62.2 44.0 3 / 10 1 / 4 1 / 1 Percentage of transfers resulting in pregnancies (%) 66.7 48.0 3 / 10 2 / 4 1 / 1
Number of Egg/Embryo Banking Cycles 19 15 5 2 0 0
Donor Eggs Fresh Embryosf Frozen Embryosf
Number of cycles 1 20Number of transfers 1 20Average number of embryos transferred 1.0 1.4Percentage of embryos transferred resulting in implantation (%) 0 / 1 57.1Percentage of transfers resulting in term, normal weight & singleton live births
e (%) 0 / 1 15.0
Percentage of transfers resulting in singleton live births (%) 0 / 1 25.0Percentage of transfers resulting in twin live births (%) 0 / 1 15.0Percentage of transfers resulting in live births (%) 0 / 1 40.0Percentage of transfers resulting in pregnancies (%) 0 / 1 60.0
CURRENT SERVICES & PROFILE Current Name: The Center for Reproductive Health
Donor eggs? YesDonor embryos? No
Gestational carriers? YesEmbryo cryopreservation? Yes
Single women? YesSART member? Yes
Verified lab accreditation? Yes(See Appendix C for details.)
a Reflects features of fresh nondonor cycles. If IVF is less than 100%, the remaining cycles are GIFT, ZIFT, or a combination of these procedures with IVF.
b Total patient diagnosis percentages may be greater than 100% because more than one diagnosis can be reported for each ART cycle.
c Fractions are used for rates with denominators less than 20. Multiple-infant births (for example, twins) with at least one live infant are counted as one live birth.
d Total cycle number includes those using frozen eggs. It excludes 0 cycle(s) evaluating new procedures. Both cycle types are excluded from ART success rates.
e In this report, births are defined as term if at least 37 full weeks gestation and normal birth weight if at least 2,500 grams (approximately 5 pounds, 8 ounces).
f All ages are reported together because previous data show that patient age does not materially affect success with donor eggs.

508
WA
SH
ING
TO
NSRM SPOKANE
SPOKANE VALLEY, WASHINGTONComparison of success rates across clinics may not be meaningful. Patient medical characteristics and treatment approaches vary (see pages 11–20).
Data verified by Brenda Houmard, MD2014 ART CYCLE PROFILE
Type of ART and Procedural Factors a
IVF 100%Unstimulated 0%Used gestational carrier 0%
With ICSI 57%PGD/PGS 0%
Patient Diagnosis b
Tubal factor 12%Ovulatory dysfunction 31%Diminished ovarian reserve 15%Endometriosis 12%
Uterine factor 3%Male factor 45%Other factor 3%Unknown factor 4%
Multiple Factors: Female factors only 8%Female & male factors 16%
2014 ART SUCCESS RATES c Total number of cyclesd: 93 (includes 16 cycle[s] using frozen eggs)
Type of CycleAge of Woman
<35 35–37 38–40 41–42 43–44 >44Fresh Embryos from Nondonor Eggs
Number of cycles 23 15 8 3 0 0Percentage of cancellations before retrieval (%) 8.7 2 / 15 3 / 8 2 / 3 Average number of embryos transferred 1.3 1.4 1.6 2.0 Percentage of embryos transferred resulting in implantation (%) 37.5 4 / 13 2 / 8 0 / 2 Percentage of elective single embryo transfers (eSET) (%) 11 / 17 1 / 5 2 / 5 0 / 1
Outcomes per CyclePercentage of cycles resulting in term, normal weight & singleton live births
e (%) 21.7 4 / 15 0 / 8 0 / 3
Percentage of cycles resulting in singleton live births (%) 26.1 4 / 15 0 / 8 0 / 3 Percentage of cycles resulting in twin live births (%) 4.3 0 / 15 1 / 8 0 / 3 Percentage of cycles resulting in live births (%) 30.4 4 / 15 1 / 8 0 / 3 Percentage of cycles resulting in pregnancies (%) 34.8 4 / 15 1 / 8 0 / 3
Outcomes per TransferNumber of transfers 18 9 5 1 0 0Percentage of transfers resulting in term, normal weight & singleton live births
e (%) 5 / 18 4 / 9 0 / 5 0 / 1
Percentage of transfers resulting in singleton live births (%) 6 / 18 4 / 9 0 / 5 0 / 1 Percentage of transfers resulting in twin live births (%) 1 / 18 0 / 9 1 / 5 0 / 1 Percentage of transfers resulting in live births (%) 7 / 18 4 / 9 1 / 5 0 / 1 Percentage of transfers resulting in pregnancies (%) 8 / 18 4 / 9 1 / 5 0 / 1
Frozen Embryos from Nondonor EggsNumber of cycles 13 5 4 1 0 0Number of transfers 12 5 3 1 0 0Estimated average number of transfers per retrieval 1.3 1.7 1.0 1.0 Average number of embryos transferred 1.8 1.6 1.0 1.0 Percentage of embryos transferred resulting in implantation (%) 31.8 2 / 8 0 / 2 1 / 1 Percentage of transfers resulting in term, normal weight & singleton live births
e (%) 3 / 12 2 / 5 0 / 3 1 / 1
Percentage of transfers resulting in singleton live births (%) 3 / 12 2 / 5 0 / 3 1 / 1 Percentage of transfers resulting in twin live births (%) 1 / 12 0 / 5 0 / 3 0 / 1 Percentage of transfers resulting in live births (%) 4 / 12 2 / 5 0 / 3 1 / 1 Percentage of transfers resulting in pregnancies (%) 5 / 12 2 / 5 1 / 3 1 / 1
Number of Egg/Embryo Banking Cycles 2 1 0 0 0 0
Donor Eggs Fresh Embryosf Frozen Embryosf
Number of cycles 2 0Number of transfers 1 0Average number of embryos transferred 1.0 Percentage of embryos transferred resulting in implantation (%) 1 / 1 Percentage of transfers resulting in term, normal weight & singleton live births
e (%) 0 / 1
Percentage of transfers resulting in singleton live births (%) 1 / 1 Percentage of transfers resulting in twin live births (%) 0 / 1 Percentage of transfers resulting in live births (%) 1 / 1 Percentage of transfers resulting in pregnancies (%) 1 / 1
CURRENT SERVICES & PROFILE Current Name: SRM Spokane
Donor eggs? YesDonor embryos? Yes
Gestational carriers? YesEmbryo cryopreservation? Yes
Single women? YesSART member? Yes
Verified lab accreditation? Yes(See Appendix C for details.)
a Reflects features of fresh nondonor cycles. If IVF is less than 100%, the remaining cycles are GIFT, ZIFT, or a combination of these procedures with IVF.
b Total patient diagnosis percentages may be greater than 100% because more than one diagnosis can be reported for each ART cycle.
c Fractions are used for rates with denominators less than 20. Multiple-infant births (for example, twins) with at least one live infant are counted as one live birth.
d Total cycle number includes those using frozen eggs. It excludes 0 cycle(s) evaluating new procedures. Both cycle types are excluded from ART success rates.
e In this report, births are defined as term if at least 37 full weeks gestation and normal birth weight if at least 2,500 grams (approximately 5 pounds, 8 ounces).
f All ages are reported together because previous data show that patient age does not materially affect success with donor eggs.

509
WA
SH
ING
TO
NGYFT CLINIC, PLLC
TACOMA, WASHINGTONComparison of success rates across clinics may not be meaningful. Patient medical characteristics and treatment approaches vary (see pages 11–20).
Data verified by Luis A. Murrain, DO, MD2014 ART CYCLE PROFILE
Type of ART and Procedural Factors a
IVF 100%Unstimulated 0%Used gestational carrier 0%
With ICSI 74%PGD/PGS 3%
Patient Diagnosis b
Tubal factor 11%Ovulatory dysfunction 2%Diminished ovarian reserve 25%Endometriosis 5%
Uterine factor 2%Male factor 32%Other factor 0%Unknown factor 30%
Multiple Factors: Female factors only 5%Female & male factors 2%
2014 ART SUCCESS RATES c Total number of cyclesd: 46 (includes 0 cycle[s] using frozen eggs)
Type of CycleAge of Woman
<35 35–37 38–40 41–42 43–44 >44Fresh Embryos from Nondonor Eggs
Number of cycles 23 7 3 3 1 1Percentage of cancellations before retrieval (%) 4.3 1 / 7 0 / 3 2 / 3 1 / 1 1 / 1Average number of embryos transferred 2.3 3.0 2.0 Percentage of embryos transferred resulting in implantation (%) 36.7 4 / 15 0 / 4 Percentage of elective single embryo transfers (eSET) (%) 0.0 0 / 5 0 / 1
Outcomes per CyclePercentage of cycles resulting in term, normal weight & singleton live births
e (%) 17.4 3 / 7 0 / 3 0 / 3 0 / 1 0 / 1
Percentage of cycles resulting in singleton live births (%) 21.7 3 / 7 0 / 3 0 / 3 0 / 1 0 / 1Percentage of cycles resulting in twin live births (%) 17.4 0 / 7 0 / 3 0 / 3 0 / 1 0 / 1Percentage of cycles resulting in live births (%) 39.1 3 / 7 0 / 3 0 / 3 0 / 1 0 / 1Percentage of cycles resulting in pregnancies (%) 52.2 3 / 7 0 / 3 0 / 3 0 / 1 0 / 1
Outcomes per TransferNumber of transfers 22 5 2 0 0 0Percentage of transfers resulting in term, normal weight & singleton live births
e (%) 18.2 3 / 5 0 / 2
Percentage of transfers resulting in singleton live births (%) 22.7 3 / 5 0 / 2 Percentage of transfers resulting in twin live births (%) 18.2 0 / 5 0 / 2 Percentage of transfers resulting in live births (%) 40.9 3 / 5 0 / 2 Percentage of transfers resulting in pregnancies (%) 54.5 3 / 5 0 / 2
Frozen Embryos from Nondonor EggsNumber of cycles 2 1 0 0 0 0Number of transfers 2 1 0 0 0 0Estimated average number of transfers per retrieval 0.3 Average number of embryos transferred 2.5 3.0 Percentage of embryos transferred resulting in implantation (%) 1 / 5 0 / 3 Percentage of transfers resulting in term, normal weight & singleton live births
e (%) 1 / 2 0 / 1
Percentage of transfers resulting in singleton live births (%) 1 / 2 0 / 1 Percentage of transfers resulting in twin live births (%) 0 / 2 0 / 1 Percentage of transfers resulting in live births (%) 1 / 2 0 / 1 Percentage of transfers resulting in pregnancies (%) 1 / 2 0 / 1
Number of Egg/Embryo Banking Cycles 0 2 0 0 0 0
Donor Eggs Fresh Embryosf Frozen Embryosf
Number of cycles 2 1Number of transfers 2 1Average number of embryos transferred 2.5 2.0Percentage of embryos transferred resulting in implantation (%) 3 / 5 0 / 2Percentage of transfers resulting in term, normal weight & singleton live births
e (%) 2 / 2 0 / 1
Percentage of transfers resulting in singleton live births (%) 2 / 2 0 / 1Percentage of transfers resulting in twin live births (%) 0 / 2 0 / 1Percentage of transfers resulting in live births (%) 2 / 2 0 / 1Percentage of transfers resulting in pregnancies (%) 2 / 2 0 / 1
CURRENT SERVICES & PROFILE Current Name: GYFT Clinic, PLLC
Donor eggs? YesDonor embryos? No
Gestational carriers? YesEmbryo cryopreservation? Yes
Single women? YesSART member? Yes
Verified lab accreditation? Yes(See Appendix C for details.)
a Reflects features of fresh nondonor cycles. If IVF is less than 100%, the remaining cycles are GIFT, ZIFT, or a combination of these procedures with IVF.
b Total patient diagnosis percentages may be greater than 100% because more than one diagnosis can be reported for each ART cycle.
c Fractions are used for rates with denominators less than 20. Multiple-infant births (for example, twins) with at least one live infant are counted as one live birth.
d Total cycle number includes those using frozen eggs. It excludes 0 cycle(s) evaluating new procedures. Both cycle types are excluded from ART success rates.
e In this report, births are defined as term if at least 37 full weeks gestation and normal birth weight if at least 2,500 grams (approximately 5 pounds, 8 ounces).
f All ages are reported together because previous data show that patient age does not materially affect success with donor eggs.

510
WA
SH
ING
TO
NMADIGAN ARMY MEDICAL CENTER
TACOMA, WASHINGTONComparison of success rates across clinics may not be meaningful. Patient medical characteristics and treatment approaches vary (see pages 11–20).
Data verified by Gregory E. Chow, MD2014 ART CYCLE PROFILE
Type of ART and Procedural Factors a
IVF 100%Unstimulated 0%Used gestational carrier 0%
With ICSI 55%PGD/PGS 0%
Patient Diagnosis b
Tubal factor 31%Ovulatory dysfunction 18%Diminished ovarian reserve 16%Endometriosis 10%
Uterine factor 2%Male factor 46%Other factor 3%Unknown factor 5%
Multiple Factors: Female factors only 9%Female & male factors 17%
2014 ART SUCCESS RATES c Total number of cyclesd: 124 (includes 0 cycle[s] using frozen eggs)
Type of CycleAge of Woman
<35 35–37 38–40 41–42 43–44 >44Fresh Embryos from Nondonor Eggs
Number of cycles 44 22 17 3 0 0Percentage of cancellations before retrieval (%) 6.8 22.7 2 / 17 1 / 3 Average number of embryos transferred 1.6 1.7 2.2 2.0 Percentage of embryos transferred resulting in implantation (%) 40.3 33.3 15.2 0 / 4 Percentage of elective single embryo transfers (eSET) (%) 34.3 4 / 16 0 / 13 0 / 2
Outcomes per CyclePercentage of cycles resulting in term, normal weight & singleton live births
e (%) 27.3 13.6 4 / 17 0 / 3
Percentage of cycles resulting in singleton live births (%) 27.3 18.2 4 / 17 0 / 3 Percentage of cycles resulting in twin live births (%) 13.6 9.1 0 / 17 0 / 3 Percentage of cycles resulting in live births (%) 40.9 27.3 4 / 17 0 / 3 Percentage of cycles resulting in pregnancies (%) 40.9 31.8 4 / 17 0 / 3
Outcomes per TransferNumber of transfers 39 17 15 2 0 0Percentage of transfers resulting in term, normal weight & singleton live births
e (%) 30.8 3 / 17 4 / 15 0 / 2
Percentage of transfers resulting in singleton live births (%) 30.8 4 / 17 4 / 15 0 / 2 Percentage of transfers resulting in twin live births (%) 15.4 2 / 17 0 / 15 0 / 2 Percentage of transfers resulting in live births (%) 46.2 6 / 17 4 / 15 0 / 2 Percentage of transfers resulting in pregnancies (%) 46.2 7 / 17 4 / 15 0 / 2
Frozen Embryos from Nondonor EggsNumber of cycles 15 15 5 1 0 0Number of transfers 13 13 5 1 0 0Estimated average number of transfers per retrieval 1.9 2.6 1.7 1.0 Average number of embryos transferred 1.8 1.8 1.8 2.0 Percentage of embryos transferred resulting in implantation (%) 33.3 37.5 4 / 9 0 / 2 Percentage of transfers resulting in term, normal weight & singleton live births
e (%) 4 / 13 2 / 13 0 / 5 0 / 1
Percentage of transfers resulting in singleton live births (%) 4 / 13 3 / 13 2 / 5 0 / 1 Percentage of transfers resulting in twin live births (%) 2 / 13 3 / 13 0 / 5 0 / 1 Percentage of transfers resulting in live births (%) 6 / 13 6 / 13 2 / 5 0 / 1 Percentage of transfers resulting in pregnancies (%) 6 / 13 6 / 13 3 / 5 0 / 1
Number of Egg/Embryo Banking Cycles 1 0 0 1 0 0
Donor Eggs Fresh Embryosf Frozen Embryosf
Number of cycles 0 0Number of transfers 0 0Average number of embryos transferred Percentage of embryos transferred resulting in implantation (%) Percentage of transfers resulting in term, normal weight & singleton live births
e (%)
Percentage of transfers resulting in singleton live births (%) Percentage of transfers resulting in twin live births (%) Percentage of transfers resulting in live births (%) Percentage of transfers resulting in pregnancies (%)
CURRENT SERVICES & PROFILE This clinic has reorganized since 2014. Contact the NASS Help Desk for further information.
Current Name: Madigan Army Medical Center
Donor eggs? YesDonor embryos? No
Gestational carriers? NoEmbryo cryopreservation? Yes
Single women? NoSART member? Yes
Verified lab accreditation? Yes(See Appendix C for details.)
a Reflects features of fresh nondonor cycles. If IVF is less than 100%, the remaining cycles are GIFT, ZIFT, or a combination of these procedures with IVF.
b Total patient diagnosis percentages may be greater than 100% because more than one diagnosis can be reported for each ART cycle.
c Fractions are used for rates with denominators less than 20. Multiple-infant births (for example, twins) with at least one live infant are counted as one live birth.
d Total cycle number includes those using frozen eggs. It excludes 0 cycle(s) evaluating new procedures. Both cycle types are excluded from ART success rates.
e In this report, births are defined as term if at least 37 full weeks gestation and normal birth weight if at least 2,500 grams (approximately 5 pounds, 8 ounces).
f All ages are reported together because previous data show that patient age does not materially affect success with donor eggs.

511
WE
ST
VIR
GIN
IAWEST VIRGINIA UNIVERSITY FERTILITY CENTER
CHARLESTON, WEST VIRGINIAComparison of success rates across clinics may not be meaningful. Patient medical characteristics and treatment approaches vary (see pages 11–20).
Data verified by Pickens A. Gantt, MD2014 ART CYCLE PROFILE
Type of ART and Procedural Factors a
IVF 100%Unstimulated 0%Used gestational carrier 8%
With ICSI 96%PGD/PGS 4%
Patient Diagnosis b
Tubal factor 16%Ovulatory dysfunction 25%Diminished ovarian reserve 22%Endometriosis 6%
Uterine factor 3%Male factor 34%Other factor 6%Unknown factor 13%
Multiple Factors: Female factors only 9%Female & male factors 16%
2014 ART SUCCESS RATES c Total number of cyclesd: 32 (includes 0 cycle[s] using frozen eggs)
Type of CycleAge of Woman
<35 35–37 38–40 41–42 43–44 >44Fresh Embryos from Nondonor Eggs
Number of cycles 20 2 1 0 0 1Percentage of cancellations before retrieval (%) 5.0 0 / 2 0 / 1 0 / 1Average number of embryos transferred 1.9 2.5 2.0 Percentage of embryos transferred resulting in implantation (%) 34.3 1 / 5 1 / 2 Percentage of elective single embryo transfers (eSET) (%) 0 / 16 0 / 2 0 / 1
Outcomes per CyclePercentage of cycles resulting in term, normal weight & singleton live births
e (%) 45.0 1 / 2 1 / 1 0 / 1
Percentage of cycles resulting in singleton live births (%) 50.0 1 / 2 1 / 1 0 / 1Percentage of cycles resulting in twin live births (%) 5.0 0 / 2 0 / 1 0 / 1Percentage of cycles resulting in live births (%) 55.0 1 / 2 1 / 1 0 / 1Percentage of cycles resulting in pregnancies (%) 55.0 1 / 2 1 / 1 0 / 1
Outcomes per TransferNumber of transfers 18 2 1 0 0 0Percentage of transfers resulting in term, normal weight & singleton live births
e (%) 9 / 18 1 / 2 1 / 1
Percentage of transfers resulting in singleton live births (%) 10 / 18 1 / 2 1 / 1 Percentage of transfers resulting in twin live births (%) 1 / 18 0 / 2 0 / 1 Percentage of transfers resulting in live births (%) 11 / 18 1 / 2 1 / 1 Percentage of transfers resulting in pregnancies (%) 11 / 18 1 / 2 1 / 1
Frozen Embryos from Nondonor EggsNumber of cycles 5 0 0 0 0 0Number of transfers 5 0 0 0 0 0Estimated average number of transfers per retrieval Average number of embryos transferred 1.6 Percentage of embryos transferred resulting in implantation (%) 2 / 6 Percentage of transfers resulting in term, normal weight & singleton live births
e (%) 1 / 5
Percentage of transfers resulting in singleton live births (%) 2 / 5 Percentage of transfers resulting in twin live births (%) 0 / 5 Percentage of transfers resulting in live births (%) 2 / 5 Percentage of transfers resulting in pregnancies (%) 3 / 5
Number of Egg/Embryo Banking Cycles 0 0 0 0 0 0
Donor Eggs Fresh Embryosf Frozen Embryosf
Number of cycles 3 0Number of transfers 3 0Average number of embryos transferred 1.7 Percentage of embryos transferred resulting in implantation (%) 4 / 5 Percentage of transfers resulting in term, normal weight & singleton live births
e (%) 0 / 3
Percentage of transfers resulting in singleton live births (%) 0 / 3 Percentage of transfers resulting in twin live births (%) 2 / 3 Percentage of transfers resulting in live births (%) 2 / 3 Percentage of transfers resulting in pregnancies (%) 2 / 3
CURRENT SERVICES & PROFILE Current Name: West Virginia University Fertility Center
Donor eggs? YesDonor embryos? Yes
Gestational carriers? YesEmbryo cryopreservation? Yes
Single women? YesSART member? No
Verified lab accreditation? No(See Appendix C for details.)
a Reflects features of fresh nondonor cycles. If IVF is less than 100%, the remaining cycles are GIFT, ZIFT, or a combination of these procedures with IVF.
b Total patient diagnosis percentages may be greater than 100% because more than one diagnosis can be reported for each ART cycle.
c Fractions are used for rates with denominators less than 20. Multiple-infant births (for example, twins) with at least one live infant are counted as one live birth.
d Total cycle number includes those using frozen eggs. It excludes 0 cycle(s) evaluating new procedures. Both cycle types are excluded from ART success rates.
e In this report, births are defined as term if at least 37 full weeks gestation and normal birth weight if at least 2,500 grams (approximately 5 pounds, 8 ounces).
f All ages are reported together because previous data show that patient age does not materially affect success with donor eggs.

512
WE
ST
VIR
GIN
IACABELL HUNTINGTON HOSPITAL
CENTER FOR ADVANCED REPRODUCTIVE MEDICINEHUNTINGTON, WEST VIRGINIA
Comparison of success rates across clinics may not be meaningful. Patient medical characteristics and treatment approaches vary (see pages 11–20).
Data verified by William N. Burns, MD2014 ART CYCLE PROFILE
Type of ART and Procedural Factors a
IVF 100%Unstimulated 0%Used gestational carrier 0%
With ICSI 62%PGD/PGS 0%
Patient Diagnosis b
Tubal factor 13%Ovulatory dysfunction 20%Diminished ovarian reserve 10%Endometriosis 27%
Uterine factor 0%Male factor 17%Other factor 23%Unknown factor 0%
Multiple Factors: Female factors only 7%Female & male factors 3%
2014 ART SUCCESS RATES c Total number of cyclesd: 30 (includes 0 cycle[s] using frozen eggs)
Type of CycleAge of Woman
<35 35–37 38–40 41–42 43–44 >44Fresh Embryos from Nondonor Eggs
Number of cycles 13 8 1 4 0 0Percentage of cancellations before retrieval (%) 0 / 13 0 / 8 0 / 1 0 / 4 Average number of embryos transferred 2.3 1.9 4.0 2.3 Percentage of embryos transferred resulting in implantation (%) 29.6 8 / 15 1 / 4 0 / 7 Percentage of elective single embryo transfers (eSET) (%) 0 / 10 0 / 7 0 / 1 0 / 2
Outcomes per CyclePercentage of cycles resulting in term, normal weight & singleton live births
e (%) 2 / 13 2 / 8 0 / 1 0 / 4
Percentage of cycles resulting in singleton live births (%) 2 / 13 2 / 8 1 / 1 0 / 4 Percentage of cycles resulting in twin live births (%) 3 / 13 3 / 8 0 / 1 0 / 4 Percentage of cycles resulting in live births (%) 5 / 13 5 / 8 1 / 1 0 / 4 Percentage of cycles resulting in pregnancies (%) 5 / 13 5 / 8 1 / 1 0 / 4
Outcomes per TransferNumber of transfers 12 8 1 3 0 0Percentage of transfers resulting in term, normal weight & singleton live births
e (%) 2 / 12 2 / 8 0 / 1 0 / 3
Percentage of transfers resulting in singleton live births (%) 2 / 12 2 / 8 1 / 1 0 / 3 Percentage of transfers resulting in twin live births (%) 3 / 12 3 / 8 0 / 1 0 / 3 Percentage of transfers resulting in live births (%) 5 / 12 5 / 8 1 / 1 0 / 3 Percentage of transfers resulting in pregnancies (%) 5 / 12 5 / 8 1 / 1 0 / 3
Frozen Embryos from Nondonor EggsNumber of cycles 2 1 0 0 0 0Number of transfers 2 1 0 0 0 0Estimated average number of transfers per retrieval 1.0 Average number of embryos transferred 1.0 1.0 Percentage of embryos transferred resulting in implantation (%) 0 / 2 0 / 1 Percentage of transfers resulting in term, normal weight & singleton live births
e (%) 0 / 2 0 / 1
Percentage of transfers resulting in singleton live births (%) 0 / 2 0 / 1 Percentage of transfers resulting in twin live births (%) 0 / 2 0 / 1 Percentage of transfers resulting in live births (%) 0 / 2 0 / 1 Percentage of transfers resulting in pregnancies (%) 0 / 2 0 / 1
Number of Egg/Embryo Banking Cycles 0 0 0 0 0 0
Donor Eggs Fresh Embryosf Frozen Embryosf
Number of cycles 1 0Number of transfers 1 0Average number of embryos transferred 1.0 Percentage of embryos transferred resulting in implantation (%) 0 / 1 Percentage of transfers resulting in term, normal weight & singleton live births
e (%) 0 / 1
Percentage of transfers resulting in singleton live births (%) 0 / 1 Percentage of transfers resulting in twin live births (%) 0 / 1 Percentage of transfers resulting in live births (%) 0 / 1 Percentage of transfers resulting in pregnancies (%) 0 / 1
CURRENT SERVICES & PROFILE Current Name: Cabell Huntington Hospital, Center for Advanced Reproductive Medicine
Donor eggs? YesDonor embryos? No
Gestational carriers? NoEmbryo cryopreservation? Yes
Single women? YesSART member? No
Verified lab accreditation? Yes(See Appendix C for details.)
a Reflects features of fresh nondonor cycles. If IVF is less than 100%, the remaining cycles are GIFT, ZIFT, or a combination of these procedures with IVF.
b Total patient diagnosis percentages may be greater than 100% because more than one diagnosis can be reported for each ART cycle.
c Fractions are used for rates with denominators less than 20. Multiple-infant births (for example, twins) with at least one live infant are counted as one live birth.
d Total cycle number includes those using frozen eggs. It excludes 0 cycle(s) evaluating new procedures. Both cycle types are excluded from ART success rates.
e In this report, births are defined as term if at least 37 full weeks gestation and normal birth weight if at least 2,500 grams (approximately 5 pounds, 8 ounces).
f All ages are reported together because previous data show that patient age does not materially affect success with donor eggs.

513
WE
ST
VIR
GIN
IAWEST VIRGINIA UNIVERSITY CENTER FOR REPRODUCTIVE MEDICINE
MORGANTOWN, WEST VIRGINIAComparison of success rates across clinics may not be meaningful. Patient medical characteristics and treatment approaches vary (see pages 11–20).
Data verified by Roger C. Toffle, MD2014 ART CYCLE PROFILE
Type of ART and Procedural Factors a
IVF 100%Unstimulated 0%Used gestational carrier 0%
With ICSI 64%PGD/PGS 0%
Patient Diagnosis b
Tubal factor 30%Ovulatory dysfunction 12%Diminished ovarian reserve 16%Endometriosis 33%
Uterine factor 2%Male factor 60%Other factor 33%Unknown factor 7%
Multiple Factors: Female factors only 14%Female & male factors 51%
2014 ART SUCCESS RATES c Total number of cyclesd: 58 (includes 0 cycle[s] using frozen eggs)
Type of CycleAge of Woman
<35 35–37 38–40 41–42 43–44 >44Fresh Embryos from Nondonor Eggs
Number of cycles 29 14 1 1 0 0Percentage of cancellations before retrieval (%) 6.9 4 / 14 0 / 1 1 / 1 Average number of embryos transferred 2.0 1.9 3.0 Percentage of embryos transferred resulting in implantation (%) 38.0 4 / 15 0 / 3 Percentage of elective single embryo transfers (eSET) (%) 9.5 0 / 6 0 / 1
Outcomes per CyclePercentage of cycles resulting in term, normal weight & singleton live births
e (%) 13.8 3 / 14 0 / 1 0 / 1
Percentage of cycles resulting in singleton live births (%) 13.8 3 / 14 0 / 1 0 / 1 Percentage of cycles resulting in twin live births (%) 13.8 0 / 14 0 / 1 0 / 1 Percentage of cycles resulting in live births (%) 31.0 3 / 14 0 / 1 0 / 1 Percentage of cycles resulting in pregnancies (%) 34.5 4 / 14 0 / 1 0 / 1
Outcomes per TransferNumber of transfers 25 8 1 0 0 0Percentage of transfers resulting in term, normal weight & singleton live births
e (%) 16.0 3 / 8 0 / 1
Percentage of transfers resulting in singleton live births (%) 16.0 3 / 8 0 / 1 Percentage of transfers resulting in twin live births (%) 16.0 0 / 8 0 / 1 Percentage of transfers resulting in live births (%) 36.0 3 / 8 0 / 1 Percentage of transfers resulting in pregnancies (%) 40.0 4 / 8 0 / 1
Frozen Embryos from Nondonor EggsNumber of cycles 9 3 0 0 0 0Number of transfers 7 2 0 0 0 0Estimated average number of transfers per retrieval 1.2 Average number of embryos transferred 1.4 1.5 Percentage of embryos transferred resulting in implantation (%) 0 / 8 0 / 3 Percentage of transfers resulting in term, normal weight & singleton live births
e (%) 0 / 7 0 / 2
Percentage of transfers resulting in singleton live births (%) 0 / 7 0 / 2 Percentage of transfers resulting in twin live births (%) 0 / 7 0 / 2 Percentage of transfers resulting in live births (%) 0 / 7 0 / 2 Percentage of transfers resulting in pregnancies (%) 1 / 7 0 / 2
Number of Egg/Embryo Banking Cycles 1 0 0 0 0 0
Donor Eggs Fresh Embryosf Frozen Embryosf
Number of cycles 0 0Number of transfers 0 0Average number of embryos transferred Percentage of embryos transferred resulting in implantation (%) Percentage of transfers resulting in term, normal weight & singleton live births
e (%)
Percentage of transfers resulting in singleton live births (%) Percentage of transfers resulting in twin live births (%) Percentage of transfers resulting in live births (%) Percentage of transfers resulting in pregnancies (%)
CURRENT SERVICES & PROFILE Current Name: West Virginia University Center for Reproductive Medicine
Donor eggs? NoDonor embryos? No
Gestational carriers? NoEmbryo cryopreservation? Yes
Single women? YesSART member? Yes
Verified lab accreditation? Yes(See Appendix C for details.)
a Reflects features of fresh nondonor cycles. If IVF is less than 100%, the remaining cycles are GIFT, ZIFT, or a combination of these procedures with IVF.
b Total patient diagnosis percentages may be greater than 100% because more than one diagnosis can be reported for each ART cycle.
c Fractions are used for rates with denominators less than 20. Multiple-infant births (for example, twins) with at least one live infant are counted as one live birth.
d Total cycle number includes those using frozen eggs. It excludes 0 cycle(s) evaluating new procedures. Both cycle types are excluded from ART success rates.
e In this report, births are defined as term if at least 37 full weeks gestation and normal birth weight if at least 2,500 grams (approximately 5 pounds, 8 ounces).
f All ages are reported together because previous data show that patient age does not materially affect success with donor eggs.

514
WIS
CO
NS
INAURORA HEALTH CARE-AURORA FERTILITY SERVICES
THE WOMEN’S CENTER AT AURORA BAYCARE MEDICAL CENTERGREEN BAY, WISCONSIN
Comparison of success rates across clinics may not be meaningful. Patient medical characteristics and treatment approaches vary (see pages 11–20).
Data verified by Aida Shanti, MD2014 ART CYCLE PROFILE
Type of ART and Procedural Factors a
IVF 100%Unstimulated 0%Used gestational carrier 0%
With ICSI 98%PGD/PGS 0%
Patient Diagnosis b
Tubal factor 17%Ovulatory dysfunction 28%Diminished ovarian reserve 12%Endometriosis 16%
Uterine factor 3%Male factor 73%Other factor 19%Unknown factor 2%
Multiple Factors: Female factors only 12%Female & male factors 44%
2014 ART SUCCESS RATES c Total number of cyclesd: 129 (includes 0 cycle[s] using frozen eggs)
Type of CycleAge of Woman
<35 35–37 38–40 41–42 43–44 >44Fresh Embryos from Nondonor Eggs
Number of cycles 39 13 3 0 0 0Percentage of cancellations before retrieval (%) 2.6 0 / 13 0 / 3 Average number of embryos transferred 2.0 1.6 2.0 Percentage of embryos transferred resulting in implantation (%) 47.5 3 / 13 2 / 4 Percentage of elective single embryo transfers (eSET) (%) 3.2 0 / 5 0 / 3
Outcomes per CyclePercentage of cycles resulting in term, normal weight & singleton live births
e (%) 7.7 1 / 13 1 / 3
Percentage of cycles resulting in singleton live births (%) 15.4 2 / 13 1 / 3 Percentage of cycles resulting in twin live births (%) 23.1 0 / 13 0 / 3 Percentage of cycles resulting in live births (%) 38.5 2 / 13 1 / 3 Percentage of cycles resulting in pregnancies (%) 43.6 3 / 13 2 / 3
Outcomes per TransferNumber of transfers 31 8 3 0 0 0Percentage of transfers resulting in term, normal weight & singleton live births
e (%) 9.7 1 / 8 1 / 3
Percentage of transfers resulting in singleton live births (%) 19.4 2 / 8 1 / 3 Percentage of transfers resulting in twin live births (%) 29.0 0 / 8 0 / 3 Percentage of transfers resulting in live births (%) 48.4 2 / 8 1 / 3 Percentage of transfers resulting in pregnancies (%) 54.8 3 / 8 2 / 3
Frozen Embryos from Nondonor EggsNumber of cycles 32 17 2 0 0 0Number of transfers 31 17 1 0 0 0Estimated average number of transfers per retrieval 1.9 2.8 0.5 Average number of embryos transferred 1.7 1.7 2.0 Percentage of embryos transferred resulting in implantation (%) 57.1 51.7 1 / 2 Percentage of transfers resulting in term, normal weight & singleton live births
e (%) 32.3 5 / 17 1 / 1
Percentage of transfers resulting in singleton live births (%) 41.9 7 / 17 1 / 1 Percentage of transfers resulting in twin live births (%) 19.4 2 / 17 0 / 1 Percentage of transfers resulting in live births (%) 61.3 9 / 17 1 / 1 Percentage of transfers resulting in pregnancies (%) 67.7 11 / 17 1 / 1
Number of Egg/Embryo Banking Cycles 5 2 2 0 0 0
Donor Eggs Fresh Embryosf Frozen Embryosf
Number of cycles 13 1Number of transfers 11 1Average number of embryos transferred 1.9 2.0Percentage of embryos transferred resulting in implantation (%) 47.6 1 / 2Percentage of transfers resulting in term, normal weight & singleton live births
e (%) 5 / 11 1 / 1
Percentage of transfers resulting in singleton live births (%) 6 / 11 1 / 1Percentage of transfers resulting in twin live births (%) 1 / 11 0 / 1Percentage of transfers resulting in live births (%) 7 / 11 1 / 1Percentage of transfers resulting in pregnancies (%) 9 / 11 1 / 1
CURRENT SERVICES & PROFILECurrent Name: Aurora Health Care-Aurora Fertility Services,
The Women’s Center at Aurora BayCare Medical Center
Donor eggs? YesDonor embryos? Yes
Gestational carriers? YesEmbryo cryopreservation? Yes
Single women? YesSART member? Yes
Verified lab accreditation? Yes(See Appendix C for details.)
a Reflects features of fresh nondonor cycles. If IVF is less than 100%, the remaining cycles are GIFT, ZIFT, or a combination of these procedures with IVF.
b Total patient diagnosis percentages may be greater than 100% because more than one diagnosis can be reported for each ART cycle.
c Fractions are used for rates with denominators less than 20. Multiple-infant births (for example, twins) with at least one live infant are counted as one live birth.
d Total cycle number includes those using frozen eggs. It excludes 0 cycle(s) evaluating new procedures. Both cycle types are excluded from ART success rates.
e In this report, births are defined as term if at least 37 full weeks gestation and normal birth weight if at least 2,500 grams (approximately 5 pounds, 8 ounces).
f All ages are reported together because previous data show that patient age does not materially affect success with donor eggs.

515
WIS
CO
NS
INFROEDTERT & MEDICAL COLLEGE OF WISCONSIN
REPRODUCTIVE MEDICINE CENTERMENOMONEE FALLS, WISCONSIN
Comparison of success rates across clinics may not be meaningful. Patient medical characteristics and treatment approaches vary (see pages 11–20).
Data verified by Estil Strawn, Jr., MD2014 ART CYCLE PROFILE
Type of ART and Procedural Factors a
IVF 100%Unstimulated 0%Used gestational carrier 0%
With ICSI 91%PGD/PGS <1%
Patient Diagnosis b
Tubal factor 10%Ovulatory dysfunction 21%Diminished ovarian reserve 26%Endometriosis 5%
Uterine factor 1%Male factor 41%Other factor 3%Unknown factor 15%
Multiple Factors: Female factors only 6%Female & male factors 14%
2014 ART SUCCESS RATES c Total number of cyclesd: 483 (includes 13 cycle[s] using frozen eggs)
Type of CycleAge of Woman
<35 35–37 38–40 41–42 43–44 >44Fresh Embryos from Nondonor Eggs
Number of cycles 125 54 28 14 0 0Percentage of cancellations before retrieval (%) 4.0 13.0 17.9 0 / 14 Average number of embryos transferred 1.4 1.8 2.1 2.2 Percentage of embryos transferred resulting in implantation (%) 35.6 24.0 24.4 11.5 Percentage of elective single embryo transfers (eSET) (%) 58.4 22.0 0 / 19 1 / 11
Outcomes per CyclePercentage of cycles resulting in term, normal weight & singleton live births
e (%) 27.2 9.3 10.7 1 / 14
Percentage of cycles resulting in singleton live births (%) 28.8 13.0 17.9 1 / 14 Percentage of cycles resulting in twin live births (%) 3.2 7.4 7.1 0 / 14 Percentage of cycles resulting in live births (%) 32.0 20.4 25.0 1 / 14 Percentage of cycles resulting in pregnancies (%) 34.4 25.9 25.0 3 / 14
Outcomes per TransferNumber of transfers 95 42 20 12 0 0Percentage of transfers resulting in term, normal weight & singleton live births
e (%) 35.8 11.9 15.0 1 / 12
Percentage of transfers resulting in singleton live births (%) 37.9 16.7 25.0 1 / 12 Percentage of transfers resulting in twin live births (%) 4.2 9.5 10.0 0 / 12 Percentage of transfers resulting in live births (%) 42.1 26.2 35.0 1 / 12 Percentage of transfers resulting in pregnancies (%) 45.3 33.3 35.0 3 / 12
Frozen Embryos from Nondonor EggsNumber of cycles 104 34 23 7 2 0Number of transfers 96 33 22 7 2 0Estimated average number of transfers per retrieval 1.2 1.9 1.8 0.8 Average number of embryos transferred 1.3 1.5 1.4 1.9 1.0 Percentage of embryos transferred resulting in implantation (%) 35.2 31.3 22.6 0 / 13 0 / 2 Percentage of transfers resulting in term, normal weight & singleton live births
e (%) 25.0 18.2 18.2 0 / 7 0 / 2
Percentage of transfers resulting in singleton live births (%) 29.2 21.2 22.7 0 / 7 0 / 2 Percentage of transfers resulting in twin live births (%) 4.2 9.1 4.5 0 / 7 0 / 2 Percentage of transfers resulting in live births (%) 33.3 30.3 27.3 0 / 7 0 / 2 Percentage of transfers resulting in pregnancies (%) 40.6 33.3 27.3 0 / 7 0 / 2
Number of Egg/Embryo Banking Cycles 20 4 6 6 0 0
Donor Eggs Fresh Embryosf Frozen Embryosf
Number of cycles 7 36Number of transfers 7 26Average number of embryos transferred 1.0 1.3Percentage of embryos transferred resulting in implantation (%) 2 / 7 32.4Percentage of transfers resulting in term, normal weight & singleton live births
e (%) 1 / 7 15.4
Percentage of transfers resulting in singleton live births (%) 1 / 7 19.2Percentage of transfers resulting in twin live births (%) 0 / 7 3.8Percentage of transfers resulting in live births (%) 1 / 7 23.1Percentage of transfers resulting in pregnancies (%) 1 / 7 38.5
CURRENT SERVICES & PROFILE Current Name: Froedtert & Medical College of Wisconsin, Reproductive Medicine Center
Donor eggs? YesDonor embryos? Yes
Gestational carriers? YesEmbryo cryopreservation? Yes
Single women? YesSART member? Yes
Verified lab accreditation? Yes(See Appendix C for details.)
a Reflects features of fresh nondonor cycles. If IVF is less than 100%, the remaining cycles are GIFT, ZIFT, or a combination of these procedures with IVF.
b Total patient diagnosis percentages may be greater than 100% because more than one diagnosis can be reported for each ART cycle.
c Fractions are used for rates with denominators less than 20. Multiple-infant births (for example, twins) with at least one live infant are counted as one live birth.
d Total cycle number includes those using frozen eggs. It excludes 0 cycle(s) evaluating new procedures. Both cycle types are excluded from ART success rates.
e In this report, births are defined as term if at least 37 full weeks gestation and normal birth weight if at least 2,500 grams (approximately 5 pounds, 8 ounces).
f All ages are reported together because previous data show that patient age does not materially affect success with donor eggs.

516
WIS
CO
NS
INUNIVERSITY OF WISCONSIN-GENERATIONS FERTILITY CARE
MIDDLETON, WISCONSINComparison of success rates across clinics may not be meaningful. Patient medical characteristics and treatment approaches vary (see pages 11–20).
Data verified by Dan I. Lebovic, MD2014 ART CYCLE PROFILE
Type of ART and Procedural Factors a
IVF 100%Unstimulated 0%Used gestational carrier 0%
With ICSI 73%PGD/PGS 0%
Patient Diagnosis b
Tubal factor 11%Ovulatory dysfunction 26%Diminished ovarian reserve 25%Endometriosis 10%
Uterine factor 4%Male factor 46%Other factor 4%Unknown factor 14%
Multiple Factors: Female factors only 9%Female & male factors 24%
2014 ART SUCCESS RATES c Total number of cyclesd: 193 (includes 20 cycle[s] using frozen eggs)
Type of CycleAge of Woman
<35 35–37 38–40 41–42 43–44 >44Fresh Embryos from Nondonor Eggs
Number of cycles 63 21 14 1 2 0Percentage of cancellations before retrieval (%) 6.3 0.0 2 / 14 0 / 1 0 / 2 Average number of embryos transferred 1.5 1.5 1.6 1.0 2.0 Percentage of embryos transferred resulting in implantation (%) 50.0 42.9 7 / 19 0 / 1 0 / 4 Percentage of elective single embryo transfers (eSET) (%) 49.0 8 / 18 3 / 10 0 / 2
Outcomes per CyclePercentage of cycles resulting in term, normal weight & singleton live births
e (%) 39.7 14.3 3 / 14 0 / 1 0 / 2
Percentage of cycles resulting in singleton live births (%) 42.9 23.8 4 / 14 0 / 1 0 / 2 Percentage of cycles resulting in twin live births (%) 6.3 14.3 1 / 14 0 / 1 0 / 2 Percentage of cycles resulting in live births (%) 49.2 38.1 5 / 14 0 / 1 0 / 2 Percentage of cycles resulting in pregnancies (%) 54.0 47.6 5 / 14 0 / 1 0 / 2
Outcomes per TransferNumber of transfers 51 19 12 1 2 0Percentage of transfers resulting in term, normal weight & singleton live births
e (%) 49.0 3 / 19 3 / 12 0 / 1 0 / 2
Percentage of transfers resulting in singleton live births (%) 52.9 5 / 19 4 / 12 0 / 1 0 / 2 Percentage of transfers resulting in twin live births (%) 7.8 3 / 19 1 / 12 0 / 1 0 / 2 Percentage of transfers resulting in live births (%) 60.8 8 / 19 5 / 12 0 / 1 0 / 2 Percentage of transfers resulting in pregnancies (%) 66.7 10 / 19 5 / 12 0 / 1 0 / 2
Frozen Embryos from Nondonor EggsNumber of cycles 32 9 12 1 0 0Number of transfers 31 9 12 1 0 0Estimated average number of transfers per retrieval 1.8 1.8 4.0 Average number of embryos transferred 1.4 1.6 1.5 1.0 Percentage of embryos transferred resulting in implantation (%) 47.6 3 / 11 5 / 18 0 / 1 Percentage of transfers resulting in term, normal weight & singleton live births
e (%) 54.8 3 / 9 4 / 12 0 / 1
Percentage of transfers resulting in singleton live births (%) 54.8 3 / 9 4 / 12 0 / 1 Percentage of transfers resulting in twin live births (%) 3.2 0 / 9 0 / 12 0 / 1 Percentage of transfers resulting in live births (%) 58.1 3 / 9 4 / 12 0 / 1 Percentage of transfers resulting in pregnancies (%) 64.5 5 / 9 5 / 12 0 / 1
Number of Egg/Embryo Banking Cycles 7 3 2 0 0 0
Donor Eggs Fresh Embryosf Frozen Embryosf
Number of cycles 3 3Number of transfers 3 3Average number of embryos transferred 1.3 2.0Percentage of embryos transferred resulting in implantation (%) 3 / 4 1 / 4Percentage of transfers resulting in term, normal weight & singleton live births
e (%) 3 / 3 0 / 3
Percentage of transfers resulting in singleton live births (%) 3 / 3 1 / 3Percentage of transfers resulting in twin live births (%) 0 / 3 0 / 3Percentage of transfers resulting in live births (%) 3 / 3 1 / 3Percentage of transfers resulting in pregnancies (%) 3 / 3 2 / 3
CURRENT SERVICES & PROFILE Current Name: University of Wisconsin-Generations Fertility Care
Donor eggs? YesDonor embryos? No
Gestational carriers? NoEmbryo cryopreservation? Yes
Single women? YesSART member? Yes
Verified lab accreditation? Yes(See Appendix C for details.)
a Reflects features of fresh nondonor cycles. If IVF is less than 100%, the remaining cycles are GIFT, ZIFT, or a combination of these procedures with IVF.
b Total patient diagnosis percentages may be greater than 100% because more than one diagnosis can be reported for each ART cycle.
c Fractions are used for rates with denominators less than 20. Multiple-infant births (for example, twins) with at least one live infant are counted as one live birth.
d Total cycle number includes those using frozen eggs. It excludes 0 cycle(s) evaluating new procedures. Both cycle types are excluded from ART success rates.
e In this report, births are defined as term if at least 37 full weeks gestation and normal birth weight if at least 2,500 grams (approximately 5 pounds, 8 ounces).
f All ages are reported together because previous data show that patient age does not materially affect success with donor eggs.

517
WIS
CO
NS
INWISCONSIN FERTILITY INSTITUTE
MIDDLETON, WISCONSINComparison of success rates across clinics may not be meaningful. Patient medical characteristics and treatment approaches vary (see pages 11–20).
Data verified by David L. Olive, MD2014 ART CYCLE PROFILE
Type of ART and Procedural Factors a
IVF 100%Unstimulated 0%Used gestational carrier 3%
With ICSI 85%PGD/PGS 0%
Patient Diagnosis b
Tubal factor 8%Ovulatory dysfunction 9%Diminished ovarian reserve 38%Endometriosis 4%
Uterine factor 6%Male factor 12%Other factor 15%Unknown factor 23%
Multiple Factors: Female factors only 9%Female & male factors 6%
2014 ART SUCCESS RATES c Total number of cyclesd: 295 (includes 0 cycle[s] using frozen eggs)
Type of CycleAge of Woman
<35 35–37 38–40 41–42 43–44 >44Fresh Embryos from Nondonor Eggs
Number of cycles 48 13 23 6 0 1Percentage of cancellations before retrieval (%) 6.3 1 / 13 13.0 0 / 6 1 / 1Average number of embryos transferred 2.2 1.8 2.1 1.5 Percentage of embryos transferred resulting in implantation (%) 29.5 5 / 11 8.7 0 / 3 Percentage of elective single embryo transfers (eSET) (%) 0.0 1 / 6 0 / 9 0 / 1
Outcomes per CyclePercentage of cycles resulting in term, normal weight & singleton live births
e (%) 14.6 2 / 13 4.3 0 / 6 0 / 1
Percentage of cycles resulting in singleton live births (%) 14.6 3 / 13 8.7 0 / 6 0 / 1Percentage of cycles resulting in twin live births (%) 2.1 0 / 13 0.0 0 / 6 0 / 1Percentage of cycles resulting in live births (%) 18.8 3 / 13 8.7 0 / 6 0 / 1Percentage of cycles resulting in pregnancies (%) 22.9 4 / 13 8.7 0 / 6 0 / 1
Outcomes per TransferNumber of transfers 22 6 12 2 0 0Percentage of transfers resulting in term, normal weight & singleton live births
e (%) 31.8 2 / 6 1 / 12 0 / 2
Percentage of transfers resulting in singleton live births (%) 31.8 3 / 6 2 / 12 0 / 2 Percentage of transfers resulting in twin live births (%) 4.5 0 / 6 0 / 12 0 / 2 Percentage of transfers resulting in live births (%) 40.9 3 / 6 2 / 12 0 / 2 Percentage of transfers resulting in pregnancies (%) 50.0 4 / 6 2 / 12 0 / 2
Frozen Embryos from Nondonor EggsNumber of cycles 75 21 16 9 1 0Number of transfers 63 20 14 9 1 0Estimated average number of transfers per retrieval 2.0 1.7 1.4 2.3 Average number of embryos transferred 1.8 2.0 1.8 2.6 1.0 Percentage of embryos transferred resulting in implantation (%) 22.1 30.6 14.3 8.7 0 / 1 Percentage of transfers resulting in term, normal weight & singleton live births
e (%) 14.3 25.0 2 / 14 1 / 9 0 / 1
Percentage of transfers resulting in singleton live births (%) 19.0 35.0 3 / 14 1 / 9 0 / 1 Percentage of transfers resulting in twin live births (%) 4.8 0.0 0 / 14 0 / 9 0 / 1 Percentage of transfers resulting in live births (%) 25.4 40.0 3 / 14 1 / 9 0 / 1 Percentage of transfers resulting in pregnancies (%) 33.3 50.0 5 / 14 2 / 9 0 / 1
Number of Egg/Embryo Banking Cycles 5 4 3 1 0 0
Donor Eggs Fresh Embryosf Frozen Embryosf
Number of cycles 19 50Number of transfers 10 39Average number of embryos transferred 1.9 1.9Percentage of embryos transferred resulting in implantation (%) 7 / 18 23.6Percentage of transfers resulting in term, normal weight & singleton live births
e (%) 2 / 10 20.5
Percentage of transfers resulting in singleton live births (%) 3 / 10 23.1Percentage of transfers resulting in twin live births (%) 2 / 10 7.7Percentage of transfers resulting in live births (%) 5 / 10 30.8Percentage of transfers resulting in pregnancies (%) 6 / 10 33.3
CURRENT SERVICES & PROFILE Current Name: Wisconsin Fertility Institute
Donor eggs? YesDonor embryos? Yes
Gestational carriers? YesEmbryo cryopreservation? Yes
Single women? YesSART member? Yes
Verified lab accreditation? Yes(See Appendix C for details.)
a Reflects features of fresh nondonor cycles. If IVF is less than 100%, the remaining cycles are GIFT, ZIFT, or a combination of these procedures with IVF.
b Total patient diagnosis percentages may be greater than 100% because more than one diagnosis can be reported for each ART cycle.
c Fractions are used for rates with denominators less than 20. Multiple-infant births (for example, twins) with at least one live infant are counted as one live birth.
d Total cycle number includes those using frozen eggs. It excludes 0 cycle(s) evaluating new procedures. Both cycle types are excluded from ART success rates.
e In this report, births are defined as term if at least 37 full weeks gestation and normal birth weight if at least 2,500 grams (approximately 5 pounds, 8 ounces).
f All ages are reported together because previous data show that patient age does not materially affect success with donor eggs.

518
WIS
CO
NS
INREPRODUCTIVE SPECIALTY CENTER
MILWAUKEE, WISCONSINComparison of success rates across clinics may not be meaningful. Patient medical characteristics and treatment approaches vary (see pages 11–20).
Data verified by Grace M. Janik, MD2014 ART CYCLE PROFILE
Type of ART and Procedural Factors a
IVF 100%Unstimulated 0%Used gestational carrier 0%
With ICSI 57%PGD/PGS 0%
Patient Diagnosis b
Tubal factor 11%Ovulatory dysfunction 11%Diminished ovarian reserve 22%Endometriosis 33%
Uterine factor 6%Male factor 64%Other factor 3%Unknown factor 11%
Multiple Factors: Female factors only 11%Female & male factors 39%
2014 ART SUCCESS RATES c Total number of cyclesd: 38 (includes 0 cycle[s] using frozen eggs)
Type of CycleAge of Woman
<35 35–37 38–40 41–42 43–44 >44Fresh Embryos from Nondonor Eggs
Number of cycles 12 5 4 0 0 0Percentage of cancellations before retrieval (%) 0 / 12 0 / 5 0 / 4 Average number of embryos transferred 2.0 2.2 2.8 Percentage of embryos transferred resulting in implantation (%) 16.7 1 / 11 1 / 11 Percentage of elective single embryo transfers (eSET) (%) 0 / 11 0 / 5 0 / 4
Outcomes per CyclePercentage of cycles resulting in term, normal weight & singleton live births
e (%) 4 / 12 1 / 5 1 / 4
Percentage of cycles resulting in singleton live births (%) 4 / 12 1 / 5 1 / 4 Percentage of cycles resulting in twin live births (%) 0 / 12 0 / 5 0 / 4 Percentage of cycles resulting in live births (%) 4 / 12 1 / 5 1 / 4 Percentage of cycles resulting in pregnancies (%) 4 / 12 1 / 5 1 / 4
Outcomes per TransferNumber of transfers 12 5 4 0 0 0Percentage of transfers resulting in term, normal weight & singleton live births
e (%) 4 / 12 1 / 5 1 / 4
Percentage of transfers resulting in singleton live births (%) 4 / 12 1 / 5 1 / 4 Percentage of transfers resulting in twin live births (%) 0 / 12 0 / 5 0 / 4 Percentage of transfers resulting in live births (%) 4 / 12 1 / 5 1 / 4 Percentage of transfers resulting in pregnancies (%) 4 / 12 1 / 5 1 / 4
Frozen Embryos from Nondonor EggsNumber of cycles 5 5 5 0 0 0Number of transfers 4 5 5 0 0 0Estimated average number of transfers per retrieval 0.8 5.0 5.0 Average number of embryos transferred 2.0 1.6 1.6 Percentage of embryos transferred resulting in implantation (%) 1 / 8 2 / 8 1 / 8 Percentage of transfers resulting in term, normal weight & singleton live births
e (%) 1 / 4 0 / 5 1 / 5
Percentage of transfers resulting in singleton live births (%) 1 / 4 0 / 5 1 / 5 Percentage of transfers resulting in twin live births (%) 0 / 4 0 / 5 0 / 5 Percentage of transfers resulting in live births (%) 1 / 4 0 / 5 1 / 5 Percentage of transfers resulting in pregnancies (%) 1 / 4 2 / 5 1 / 5
Number of Egg/Embryo Banking Cycles 2 0 0 0 0 0
Donor Eggs Fresh Embryosf Frozen Embryosf
Number of cycles 0 0Number of transfers 0 0Average number of embryos transferred Percentage of embryos transferred resulting in implantation (%) Percentage of transfers resulting in term, normal weight & singleton live births
e (%)
Percentage of transfers resulting in singleton live births (%) Percentage of transfers resulting in twin live births (%) Percentage of transfers resulting in live births (%) Percentage of transfers resulting in pregnancies (%)
CURRENT SERVICES & PROFILE Current Name: Reproductive Specialty Center
Donor eggs? YesDonor embryos? No
Gestational carriers? YesEmbryo cryopreservation? Yes
Single women? YesSART member? Yes
Verified lab accreditation? Yes(See Appendix C for details.)
a Reflects features of fresh nondonor cycles. If IVF is less than 100%, the remaining cycles are GIFT, ZIFT, or a combination of these procedures with IVF.
b Total patient diagnosis percentages may be greater than 100% because more than one diagnosis can be reported for each ART cycle.
c Fractions are used for rates with denominators less than 20. Multiple-infant births (for example, twins) with at least one live infant are counted as one live birth.
d Total cycle number includes those using frozen eggs. It excludes 0 cycle(s) evaluating new procedures. Both cycle types are excluded from ART success rates.
e In this report, births are defined as term if at least 37 full weeks gestation and normal birth weight if at least 2,500 grams (approximately 5 pounds, 8 ounces).
f All ages are reported together because previous data show that patient age does not materially affect success with donor eggs.

519
WIS
CO
NS
INGUNDERSEN FERTILITY CENTER
ONALASKA, WISCONSINComparison of success rates across clinics may not be meaningful. Patient medical characteristics and treatment approaches vary (see pages 11–20).
Data verified by Sana Salih, MD2014 ART CYCLE PROFILE
Type of ART and Procedural Factors a
IVF 100%Unstimulated 0%Used gestational carrier 0%
With ICSI 94%PGD/PGS 3%
Patient Diagnosis b
Tubal factor 14%Ovulatory dysfunction 34%Diminished ovarian reserve 17%Endometriosis 29%
Uterine factor 3%Male factor 49%Other factor 25%Unknown factor 0%
Multiple Factors: Female factors only 22%Female & male factors 34%
2014 ART SUCCESS RATES c Total number of cyclesd: 62 (includes 3 cycle[s] using frozen eggs)
Type of CycleAge of Woman
<35 35–37 38–40 41–42 43–44 >44Fresh Embryos from Nondonor Eggs
Number of cycles 27 5 2 0 0 0Percentage of cancellations before retrieval (%) 3.7 1 / 5 0 / 2 Average number of embryos transferred 1.3 1.7 2.5 Percentage of embryos transferred resulting in implantation (%) 55.2 2 / 5 2 / 5 Percentage of elective single embryo transfers (eSET) (%) 66.7 1 / 3 0 / 2
Outcomes per CyclePercentage of cycles resulting in term, normal weight & singleton live births
e (%) 40.7 2 / 5 0 / 2
Percentage of cycles resulting in singleton live births (%) 48.1 2 / 5 0 / 2 Percentage of cycles resulting in twin live births (%) 3.7 0 / 5 1 / 2 Percentage of cycles resulting in live births (%) 51.9 2 / 5 1 / 2 Percentage of cycles resulting in pregnancies (%) 51.9 2 / 5 1 / 2
Outcomes per TransferNumber of transfers 22 3 2 0 0 0Percentage of transfers resulting in term, normal weight & singleton live births
e (%) 50.0 2 / 3 0 / 2
Percentage of transfers resulting in singleton live births (%) 59.1 2 / 3 0 / 2 Percentage of transfers resulting in twin live births (%) 4.5 0 / 3 1 / 2 Percentage of transfers resulting in live births (%) 63.6 2 / 3 1 / 2 Percentage of transfers resulting in pregnancies (%) 63.6 2 / 3 1 / 2
Frozen Embryos from Nondonor EggsNumber of cycles 13 6 2 0 0 0Number of transfers 13 5 2 0 0 0Estimated average number of transfers per retrieval 3.3 5.0 Average number of embryos transferred 1.5 2.0 2.0 Percentage of embryos transferred resulting in implantation (%) 6 / 18 3 / 10 1 / 4 Percentage of transfers resulting in term, normal weight & singleton live births
e (%) 2 / 13 1 / 5 1 / 2
Percentage of transfers resulting in singleton live births (%) 3 / 13 1 / 5 1 / 2 Percentage of transfers resulting in twin live births (%) 0 / 13 1 / 5 0 / 2 Percentage of transfers resulting in live births (%) 3 / 13 2 / 5 1 / 2 Percentage of transfers resulting in pregnancies (%) 6 / 13 2 / 5 1 / 2
Number of Egg/Embryo Banking Cycles 0 0 0 0 0 0
Donor Eggs Fresh Embryosf Frozen Embryosf
Number of cycles 0 4Number of transfers 0 4Average number of embryos transferred 1.0Percentage of embryos transferred resulting in implantation (%) 3 / 4Percentage of transfers resulting in term, normal weight & singleton live births
e (%) 3 / 4
Percentage of transfers resulting in singleton live births (%) 3 / 4Percentage of transfers resulting in twin live births (%) 0 / 4Percentage of transfers resulting in live births (%) 3 / 4Percentage of transfers resulting in pregnancies (%) 3 / 4
CURRENT SERVICES & PROFILE Current Name: Gundersen Fertility Center
Donor eggs? YesDonor embryos? No
Gestational carriers? YesEmbryo cryopreservation? Yes
Single women? YesSART member? Yes
Verified lab accreditation? Yes(See Appendix C for details.)
a Reflects features of fresh nondonor cycles. If IVF is less than 100%, the remaining cycles are GIFT, ZIFT, or a combination of these procedures with IVF.
b Total patient diagnosis percentages may be greater than 100% because more than one diagnosis can be reported for each ART cycle.
c Fractions are used for rates with denominators less than 20. Multiple-infant births (for example, twins) with at least one live infant are counted as one live birth.
d Total cycle number includes those using frozen eggs. It excludes 0 cycle(s) evaluating new procedures. Both cycle types are excluded from ART success rates.
e In this report, births are defined as term if at least 37 full weeks gestation and normal birth weight if at least 2,500 grams (approximately 5 pounds, 8 ounces).
f All ages are reported together because previous data show that patient age does not materially affect success with donor eggs.

520
WIS
CO
NS
INAURORA HEALTH CARE-AURORA FERTILITY SERVICES, WEST ALLIS
WEST ALLIS, WISCONSINComparison of success rates across clinics may not be meaningful. Patient medical characteristics and treatment approaches vary (see pages 11–20).
Data verified by Aida Shanti, MD2014 ART CYCLE PROFILE
Type of ART and Procedural Factors a
IVF 100%Unstimulated 0%Used gestational carrier 0%
With ICSI 94%PGD/PGS 9%
Patient Diagnosis b
Tubal factor 11%Ovulatory dysfunction 20%Diminished ovarian reserve 42%Endometriosis 5%
Uterine factor 11%Male factor 76%Other factor 29%Unknown factor 3%
Multiple Factors: Female factors only 11%Female & male factors 58%
2014 ART SUCCESS RATES c Total number of cyclesd: 185 (includes 0 cycle[s] using frozen eggs)
Type of CycleAge of Woman
<35 35–37 38–40 41–42 43–44 >44Fresh Embryos from Nondonor Eggs
Number of cycles 57 21 8 3 3 0Percentage of cancellations before retrieval (%) 5.3 0.0 3 / 8 0 / 3 0 / 3 Average number of embryos transferred 1.9 1.9 2.0 1.5 2.0 Percentage of embryos transferred resulting in implantation (%) 52.1 47.8 3 / 8 0 / 3 0 / 4 Percentage of elective single embryo transfers (eSET) (%) 10.5 0 / 10 0 / 5 0 / 1 0 / 1
Outcomes per CyclePercentage of cycles resulting in term, normal weight & singleton live births
e (%) 15.8 14.3 0 / 8 0 / 3 0 / 3
Percentage of cycles resulting in singleton live births (%) 19.3 19.0 1 / 8 0 / 3 0 / 3 Percentage of cycles resulting in twin live births (%) 14.0 4.8 1 / 8 0 / 3 0 / 3 Percentage of cycles resulting in live births (%) 36.8 28.6 2 / 8 0 / 3 0 / 3 Percentage of cycles resulting in pregnancies (%) 42.1 38.1 3 / 8 0 / 3 0 / 3
Outcomes per TransferNumber of transfers 39 12 5 2 2 0Percentage of transfers resulting in term, normal weight & singleton live births
e (%) 23.1 3 / 12 0 / 5 0 / 2 0 / 2
Percentage of transfers resulting in singleton live births (%) 28.2 4 / 12 1 / 5 0 / 2 0 / 2 Percentage of transfers resulting in twin live births (%) 20.5 1 / 12 1 / 5 0 / 2 0 / 2 Percentage of transfers resulting in live births (%) 53.8 6 / 12 2 / 5 0 / 2 0 / 2 Percentage of transfers resulting in pregnancies (%) 61.5 8 / 12 3 / 5 0 / 2 0 / 2
Frozen Embryos from Nondonor EggsNumber of cycles 28 14 4 0 1 0Number of transfers 26 12 3 0 1 0Estimated average number of transfers per retrieval 1.0 1.1 0.4 0.0 1.0 Average number of embryos transferred 1.7 1.8 2.0 1.0 Percentage of embryos transferred resulting in implantation (%) 52.5 40.0 2 / 6 0 / 1 Percentage of transfers resulting in term, normal weight & singleton live births
e (%) 30.8 6 / 12 1 / 3 0 / 1
Percentage of transfers resulting in singleton live births (%) 34.6 6 / 12 1 / 3 0 / 1 Percentage of transfers resulting in twin live births (%) 19.2 0 / 12 0 / 3 0 / 1 Percentage of transfers resulting in live births (%) 53.8 6 / 12 1 / 3 0 / 1 Percentage of transfers resulting in pregnancies (%) 65.4 9 / 12 2 / 3 0 / 1
Number of Egg/Embryo Banking Cycles 12 4 6 2 0 0
Donor Eggs Fresh Embryosf Frozen Embryosf
Number of cycles 16 6Number of transfers 13 5Average number of embryos transferred 1.8 1.8Percentage of embryos transferred resulting in implantation (%) 58.3 4 / 9Percentage of transfers resulting in term, normal weight & singleton live births
e (%) 4 / 13 1 / 5
Percentage of transfers resulting in singleton live births (%) 4 / 13 1 / 5Percentage of transfers resulting in twin live births (%) 3 / 13 1 / 5Percentage of transfers resulting in live births (%) 7 / 13 2 / 5Percentage of transfers resulting in pregnancies (%) 9 / 13 3 / 5
CURRENT SERVICES & PROFILE Current Name: Aurora Health Care-Aurora Fertility Services, West Allis
Donor eggs? YesDonor embryos? Yes
Gestational carriers? YesEmbryo cryopreservation? Yes
Single women? YesSART member? Yes
Verified lab accreditation? Yes(See Appendix C for details.)
a Reflects features of fresh nondonor cycles. If IVF is less than 100%, the remaining cycles are GIFT, ZIFT, or a combination of these procedures with IVF.
b Total patient diagnosis percentages may be greater than 100% because more than one diagnosis can be reported for each ART cycle.
c Fractions are used for rates with denominators less than 20. Multiple-infant births (for example, twins) with at least one live infant are counted as one live birth.
d Total cycle number includes those using frozen eggs. It excludes 0 cycle(s) evaluating new procedures. Both cycle types are excluded from ART success rates.
e In this report, births are defined as term if at least 37 full weeks gestation and normal birth weight if at least 2,500 grams (approximately 5 pounds, 8 ounces).
f All ages are reported together because previous data show that patient age does not materially affect success with donor eggs.