2014 a year of delivery. - westpac - personal, business ... · annual review & sustainability...
TRANSCRIPT

2014A
yearof
delivery.Annual Report

Andwe’re just
getting started.
Westpac Banking Corporation ABN 33 007 457 141 Photo by Weeli Goh
The Westpac Group Annual Report and the Westpac Group Annual Review and Sustainability Report represent Westpac’s extended reporting framework.
This report to shareholders, which will be lodged with the Australian Securities Exchange and the Australian Securities and Investments Commission, is also available on our website
www.westpac.com.au/investorcentre
For more information about Westpac refer to Section 1 and the inside back cover, or visit www.westpac.com.au/investorcentre
This is
what we’ve
delivered.Annual Review &
Sustainability Report2014
2014A
year of
delivery.Annual Report

Table of contents
In this Annual Report a reference to ‘Westpac’, ‘Group’, ‘Westpac Group’, ‘we’, ‘us’ and ‘our’ is to Westpac Banking Corporation ABN 33 007 457 141 and its subsidiaries unless it clearly means just Westpac Banking Corporation.
For certain information about the basis of preparing the financial information in this Annual Report see ‘Reading this report’ in Section 2. In addition, this Annual Report contains statements that constitute ‘forward-looking statements’ within the meaning of section 21E of the US Securities Exchange Act of 1934. For an explanation of forward-looking statements and the risks, uncertainties and assumptions to which they are subject, see ‘Reading this report’ in Section 2.
Information contained in or accessible through the websites mentioned in this Annual Report does not form part of this report unless we specifically state that it is incorporated by reference and forms part of this report. All references in this report to websites are inactive textual references and are for information only.
Annual Report Performance highlights 2 Section 1 3 Chairman’s report 4 Chief Executive Officer’s report 6 Information on Westpac 8 Business strategy 8 Westpac’s approach to sustainability 11 Five year non-financial summary 14 Outlook 16 Significant developments 17 Corporate governance 24 Directors’ report 43 Remuneration report 55 Section 2 83 Five year summary 84 Reading this report 85 Review of Group operations 87 Income statement review 89 Balance sheet review 94 Capital resources 98 Divisional performance 100 Australian Financial Services 103 Westpac Retail & Business Banking 103 St.George Banking Group 104 BT Financial Group (Australia) 106 Westpac Institutional Bank 108 Westpac New Zealand 109 Other divisions 111 Risk and risk management 112 Risk factors 112 Risk management 117 Credit risk 118 Liquidity risk 119 Market risk 120 Operational and compliance risk 121 Other risks 121 Other Westpac business information 124 Section 3 125 Financial statements 126 Notes to the financial statements 131 Statutory statements 285 Section 4 291 Shareholding information 292 Additional information 301 Information for shareholders 305 Glossary of abbreviations and defined terms 307 Contact us Inside back cover
2014 Westpac Group Annual Report 1

Performance highlights
Net profit after tax $7,561 million, up 12% Dividends $1.82, up 5%2 2,
698
3,07
1
3,45
1
3,85
9
3,44
6
6,34
6
6,99
1
5,93
6 6,75
1 7,56
1
–1,0002,0003,0004,0005,0006,0007,0008,000
05 06 07 08 09 10 11 12 13 14
100 11
6 131 14
2
116 13
9 156 166
174
182
20
–20406080
100120140160180200
05 06 07 08 09 10 11 12 13 14
Cash earnings $7,628 million, up 8% Return on equity 16.4%
2,80
4
3,07
9
3,50
7 5,04
7
4,67
5 5,87
9
6,30
1
6,56
4
7,06
3
7,62
8
–1,0002,0003,0004,0005,0006,0007,0008,0009,000
05 06 07 08 09 10 11 12 13 14
22.2
23.0
23.8
22.3
14.0 16
.1
16.0
15.4
15.9
16.4
–
5
10
15
20
25
05 06 07 08 09 10 11 12 13 14
Cash earnings per ordinary share up 8% % change2014 2013 2014 / 2013
Reported earningsNet profit after tax1 ($m) 7,561 6,751 12Earnings per share (cents) 243.7 218.3 12Dividends per share (cents) 182 174 5Special dividend per share (cents) - 20 -Return on equity6 (%) 16.3 15.2 105bpsExpense to income ratio (%) 42.9 42.9 (2bps)Common Equity tier 1 capital ratio (%) 9.0 9.1 (20bps)Asset quality ratio7 (%) 2.5 4.1 160bpsCash basis3,5
Cash earnings ($m) 7,628 7,063 8Cash earnings per share (cents) 245.4 227.8 8Cash return on equity6 (%) 16.4 15.9 48bpsEconomic profit8 ($m) 4,491 4,068 10
151.
5
167.
2
189.
4
198.
3
163.
7 197.
8
209.
3
214.
8
227.
8
245.
4
–
50
100
150
200
250
300
05 06 07 08 09 10 11 12 13 14
1 Net profit attributable to ordinary equity holders. 2 Excluding special dividends. 3 The adjustments to our reported results to derive cash earnings are
described in Note 33 of our 2014 financial statements. 4 Figures for 2009 (and for cash earnings in 2008 only), are presented
on a ‘pro forma’ basis, that is, as if the merger between Westpac and St.George Bank Limited was completed on 1 October 2007. The basis of presentation of the pro forma results is explained in more detail in Section 2.1 of Westpac’s Full Year 2009 Results (incorporating the requirements of Appendix 4E) lodged with the ASX on 4 November 2009 and that section of the ASX Announcement is incorporated by reference into this Annual Report.
5 Cash earnings for 2009 has been restated to exclude the impact of fair value adjustments related to the St.George merger. For further information refer to Note 32 to the financial statements in Westpac’s Annual Report 2010.
6 Return on average ordinary equity. 7 Net impaired assets to equity and collectively assessed provisions. 8 Economic profit represents the excess of adjusted cash earnings
over a minimum required rate of return on equity invested. For this purpose, adjusted cash earnings is defined as cash earnings plus the estimated value of franking credits paid to shareholders. The calculation of economic profit is described in more detail in Section 9 of Westpac’s Full Year 2014 Results (incorporating the requirements of Appendix 4E) lodged with the ASX on 3 November 2014 (the ‘ASX Announcement’).
Net profit after tax1 ($m) Dividends per ordinary share (cents) Special dividends
Cash earnings3,4,5 ($m)
Cash earnings per ordinary share3,4,5 (cents)
Cash earnings to average ordinary equity3,4,5 (%)
2 2014 Westpac Group Annual Report

01
Performance highlights
Chairman’s report
Chief Executive Officer’s report
Information on Westpac
Corporate governance
Directors’ report
Remuneration report

Chairman’s report
Lindsay Maxsted Chairman
Remaining well positioned Westpac has continued to reward shareholders while ensuring the Group remains well positioned for the future.
It has been another year of significant change for the financial services sector and against this backdrop the Westpac Group has again delivered a strong performance.
For shareholders, we lifted our return on equity, improved our growth profile and further strengthened our businesses. This in turn has enabled the Board to maintain our consistent dividend profile, lifting ordinary dividends by at least 2 cents per share every half for the past five years.
As always, a key focus for the Board is to look forward and ensure the Group is well prepared for both emerging opportunities and challenges. With the rapid evolution of digital technologies, changing customer preferences and significant regulatory change, there has been much to consider.
Westpac has been actively addressing these developments. We have a strong management team and a clear strategy, and as a consequence the Board remains confident about our ability to respond and adapt to the environment, manage regulatory change and to innovate for customers. The Board is pleased with our progress in significantly improving the customer experience across the Group, and expects this progress to continue.
Strong financial result In 2014 Westpac generated cash earnings of $7,628 million1, an increase of 8% over the previous year. We believe that cash earnings is the most appropriate measure for assessing our financial performance and is the key profit measure used by the Board to determine dividends. In 2014, reported statutory net profit increased 12% to $7,561 million.
1 Results refer to cash earnings unless otherwise stated. For an explanation of cash earnings see footnote 3 of ‘Performance highlights’ section of this Annual Report.
A solid operating performance across all divisions contributed to a 5% rise in revenue, and a 5% lift in core earnings (net operating income less operating expenses). Asset quality has also continued to improve, which in turn led to lower impairment charges this year and to the 8% lift in cash earnings.
The Group’s key financial metrics also remain very healthy, with the cash return on equity increasing to 16.4% and the expense to income ratio remaining sector leading at 41.6%.
A hallmark of Westpac over recent years has been the strength of our balance sheet. This strength was maintained over the year with very strong asset quality, capital levels at the upper end of the sector and a strong funding position.
The improvement in asset quality was reflected across the portfolio, with a reduction in the proportion of business loans that are impaired or undergoing stress and lower levels of consumer delinquencies across mortgages and other consumer lending. The proportion of stressed assets to total committed exposures is a good indicator of this progress, with the ratio falling from 1.6% to 1.2%.
Capital was well managed with our common equity tier 1 ratio at a strong 9.0% at 30 September 2014, just 13 basis points lower than a year earlier. Through the year we used this capital strength to acquire an $8 billion portfolio from Lloyds Australia (mostly equipment finance and motor vehicle lending), we improved our growth profile, particularly in the important areas of housing lending and infrastructure and we returned over $5.8 billion in dividends to shareholders.
Importantly, Westpac’s capital ratios remain strong and at the upper end of banks globally.
4 2014 Westpac Group Annual Report

Chairman’s report The changing operating environment As you read this Report you will see we refer to many of the material changes that are occurring across the markets in which we operate. This includes the rapid digitisation of banking, the rise of Asia, changing demographics and regulatory change. We are actively responding and many of our plans, and our progress, are outlined within this Report.
Early in the year the Federal Government established a Financial System Inquiry (FSI) to recommend a blueprint for the financial system over the next decade. This is an important development, because a healthy, competitive and strong financial services industry is central to Australia’s continuing growth and prosperity.
At the time of writing, the final report of the FSI had not been released. We have been supportive of the FSI’s aims, noting that the financial services industry is open, competitive and dynamic, with strongly capitalised and well supervised banks. We look forward to responding to the final report to ensure that its recommendations achieve the desired outcome, namely positioning the financial system to best support Australia’s economic growth. In achieving this objective, it is important that growth and stability receive equal focus and that the FSI’s recommendations are principles-based so they stand the test of time.
In Asia we have made excellent progress. Our strategy is highly focused, specifically targeting key Asian growth corridors and companies and individuals that are active in the trade and financial flows between Asia and our core markets. We have continued to grow our capability in the region and revenues were up 43% over the year.
Changes to the Board We have continued our process of Board renewal with Alison Deans being appointed during the year. Alison’s experience in managing e-commerce and technology businesses adds a valuable skill set to your Board, particularly given the changes in our operating environment I mentioned earlier.
This year John Curtis and Ann Pickard announced their decisions to retire from the Board. John played an important role over a number of years, firstly as a Board Member and Chairman of St.George and then joining the Westpac Board as Deputy Chairman following the St.George merger. We thank John for his outstanding contribution and dedication to the company. Ann’s recent retirement reflects her executive relocation to the United States and the expectation that her commitments in North America will increase in 2015. Ann’s significant global experience was an asset to the Board and we thank her for her valued contribution.
Outlook Looking ahead, we expect the Australian economy to steadily improve its growth profile as consumer demand continues to respond to low interest rates, improving balance sheets and a sound employment market. We have already seen a response in the housing sector with strong demand and rising house prices, along with a pick-up in dwelling investment.
While the economy will encounter some headwinds from the easing in mining investment there are also improving prospects for non-mining investment consistent with the rise in household demand. This should also be assisted by improving growth from the major developed economies while activity in China stabilises.
For the financial services sector, we expect continued change, not just from digital but from the more macro demographic shifts, including an ageing population.
Given Westpac’s strong starting point, our improved momentum, and the strong state of all our divisions (and brands) we remain well positioned to continue generating consistent and high quality returns for shareholders.
Lindsay Maxsted Chairman
2014 Westpac Group Annual Report 5

Chief Executive Officer’s report
Gail Kelly Chief Executive Officer
Delivering for all stakeholders Our service revolution is creating a foundation for growth.
A year of delivery I am delighted to present another strong performance for the Westpac Group. It has been a year of delivery where we have produced stronger financial returns, delivered substantial service improvements for customers, invested more in our employees, and made a significant contribution to the communities in which we operate. At the same time our service revolution for customers is well underway, providing a step-up in our strategic agenda and real business momentum. This momentum, combined with the disciplined way we manage the business, sets us up well to continue delivering improved returns for shareholders.
A strong and consistent financial performance This year we increased cash earnings and cash earnings per share by 8%, the strongest increase in four years. The result was supported by a solid operating performance across all divisions and a further improvement in asset quality.
A key contributor to performance has been our service revolution which is fundamentally changing how we are supporting customers and enhancing their experience. We have made excellent progress in enabling customers to conduct their banking when and where they want. This includes the launch of our new digital platform in Westpac, increasing the number of locations available 24/7 and rolling out new payments technologies for businesses. At the same time we are working hard to simplify our processes, which is improving our responsiveness and reducing customer complaints.
These efforts contributed to the improvement in our customer satisfaction standing during the year. Westpac Retail & Business Banking is now number one in consumer satisfaction and business customer satisfaction amongst the major banks1. St.George also continues to lead the majors in both of these measures.
We have seen a further deepening of customer relationships and a pick-up in growth through the year. On lending we grew 8%, while total deposits were 9% higher than a year earlier. In the second half of the year we grew at or above the financial system in every major lending and deposit category. We also continued to grow above the industry in our wealth and insurance businesses, the result of our ongoing focus on supporting customers’ total financial service needs.
While supporting growth we have maintained our productivity disciplines, delivering $219 million in savings over the year. This contributed to us remaining the most efficient bank in the region with an expense to income ratio on a cash earnings basis of 41.6%.
Asset quality has continued to be a hallmark for Westpac. Almost every asset quality metric improved over the year with a lower proportion of stressed assets, lower impaired assets and a reduction in consumer (including mortgages) 90+ day delinquencies. These improvements contributed to a $197 million reduction (down 23%) in impairment charges over the year.
1 Refer to Glossary of abbreviations and defined terms for customer satisfaction metrics.
6 2014 Westpac Group Annual Report

Chief Executive Officer’s report Strong operating performance across divisions All our divisions generated solid operating performances with particularly strong returns from our retail and wealth operations.
Australian Financial Services (AFS) had an excellent year lifting cash earnings by 12%. Across AFS, all brands contributed, with Westpac Retail & Business Banking (Westpac RBB), BT Financial Group (BTFG) and the St.George Banking Group (St.George) all reporting double digit earnings growth.
BT Financial Group, our wealth and insurance division, continued to deliver superior returns with cash earnings rising 16%. A key element of our customer-centric strategy is that we seek to meet customers’ total financial needs, and do so in an integrated way. Our one team approach across our retail brands has continued to underpin BTFG’s success.
Westpac RBB and St.George also had a strong year with cash earnings growth of 10% and 14% respectively.
Our portfolio of brands is a competitive advantage for us, giving us greater flexibility in meeting customers’ specific needs. Our investment in Bank of Melbourne is an excellent example. Bank of Melbourne is providing a local alternative for Victorians, growing its mortgages more than twice as fast as the Victorian system and deposits at more than three times the rate of Victorian system growth.
Westpac Institutional Bank also performed well, with the business once again being awarded the Lead Transactional bank in Australia1, a position it has now held for 11 consecutive years. The division has continued to focus on deepening relationships and this has contributed to a 6% rise in customer-related revenues through the year. Despite this growth, strong gains associated with the exit of Hastings listed infrastructure funds in FY 2013 which were not repeated in FY 2014, combined with more challenging financial market conditions in FY 2014 contributed to a 7% reduction in cash earnings compared to FY 2013.
Westpac New Zealand has been at the forefront of evolving its distribution network, using digital technologies to better support customers while improving both convenience and access. These initiatives have contributed to above system growth and combined with improved asset quality led to the strong, 13% (in NZ$) improvement in cash earnings.
1 Peter Lee Associates Large Corporate and Institutional Transactional Banking Survey Australia 2014.
Operating sustainably 2014 has been a landmark year for our sustainability performance, meeting or exceeding the majority of our sustainability targets.
In particular, women in leadership roles in the Group increased from 42% to 44%, our lending to the CleanTech and environmental services sector exceeded our $6 billion target, and we completed our largest single affordable housing finance transaction. We also launched our most ambitious Reconciliation Action Plan yet. A highlight for the year was the establishment of the Westpac Bicentennial Foundation: this is a $100 million fund aiming to support 100 education scholarships a year, forever. We are particularly proud of this initiative.
Our performance received global recognition, including being ranked the most sustainable company in the Global 100 Most Sustainable Corporations in the World at the World Economic Forum in Davos, and being assessed as the most sustainable bank globally in the 2014 Dow Jones Sustainability Index.
Maintaining leadership Our achievements in 2014 reflect many years of development and work, from strengthening the organisation through the global financial crisis to reconfiguring our distribution network and, more recently, embarking on our customer service revolution.
While we have built strong foundations, we recognise the significant opportunities that are still available to us. We are ready for the challenge.
None of this would be possible without the support and dedication of an outstanding team, our 36,000 wonderful people who work tirelessly to build a better company and to create stronger communities. I thank them for their dedication and passion.
I would also like to thank our customers for their continuing support. We are totally focused on lifting the bar on the service customers can expect from the Group, and to make banking simpler and quicker to support their aspirations and businesses.
Finally, I would like to thank shareholders for their ongoing support. We will continue to work tirelessly to build the value of this Group – Australia’s first company.
Gail Kelly Chief Executive Officer
2014 Westpac Group Annual Report 7

Information on Westpac Westpac is one of the four major banking organisations in Australia and one of the largest banking organisations in New Zealand. We provide a broad range of banking and financial services in these markets, including consumer1, business and institutional banking and wealth management services.
We have branches, affiliates and controlled entities2 throughout Australia, New Zealand and the Pacific region, and maintain branches and offices in some of the key financial centres around the world3.
We were founded in 1817 and were the first bank established in Australia. In 1850 we were incorporated as the Bank of New South Wales by an Act of the New South Wales Parliament. In 1982 we changed our name to Westpac Banking Corporation following our merger with the Commercial Bank of Australia. On 23 August 2002, we were registered as a public company limited by shares under the Australian Corporations Act 2001 (Cth) (Corporations Act).
As at 30 September 2014, our market capitalisation was $100 billion4 and we had total assets of $771 billion.
Business strategy Westpac’s vision is ‘To be one of the world’s great companies, helping our customers, communities and people to prosper and grow’.
Our strategy seeks to deliver on this vision by providing superior returns for our shareholders, building deep and enduring customer relationships, being a leader in the community and being a place where the best people want to work.
In delivering on our strategy we are focused on our core markets including Australia and New Zealand, where we provide a comprehensive range of financial products and services that assist us in meeting all the financial services needs of our customers. With our strong position in these markets, and over 12 million customers, our focus is on organic growth, growing customer numbers in our chosen segments and building stronger and deeper customer relationships.
A key element of this approach is our portfolio of financial services brands, which enables us to appeal to a broader range of customers, and provides us with the strategic flexibility to offer solutions that better meet individual customer needs.
1 A consumer is defined as a person that uses our products and services, it does not include business entities.
2 Refer to Note 39 to the financial statements for a list of our controlled entities as at 30 September 2014.
3 Contact details for our head office, major businesses and offshore locations can be found on the inside back cover.
4 Based on the closing share price of our ordinary shares on the ASX as at 30 September 2014.
Asia is an important market for us and we are progressively building our presence and capability across the region to better support Australian and New Zealand customers operating, trading and transacting in the region, along with Asian customers seeking financial solutions and services in Australia and New Zealand.
While we continue to build the business, the financial services environment remains challenging and has required us to maintain focus on strengthening our financial position while at the same time improving efficiency. This strengthening has involved lifting the level and quality of our capital, improving our funding and liquidity position and maintaining a high level of asset quality and provisioning.
While we are currently one of the most efficient banks globally, as measured by a cost to income ratio, we continue to focus on ways to simplify our business to make it easier for customers to do business with us and to make work more enjoyable for our people. We believe that these improvement efforts also contribute to reducing unit costs that create capacity for further investment for growth.
As part of our customer-centric strategy, in 2014 we embarked on a service revolution for our customers. This program is a substantial step-up in our strategy seeking to: provide a truly personal service for customers while better anticipating their needs; putting customers in control of their finances; and innovating and simplifying to reinvent the customer experience.
We also recognise that digitisation is occurring at an accelerated pace and customer behaviours are changing. The service revolution responds to these trends with the support of digital technologies. This includes new services that make banking available 24/7 such as smart ATMs and our new digital platform in Westpac RBB. It extends to new banking apps that provide greater flexibility for customers to choose how to manage their finances, and it includes using digitisation to simplify our processes to provide a better customer experience.
Sustainability is part of our strategy where we seek to anticipate and shape the most pressing emerging social issues where we have the skills and experience to make a meaningful difference and drive business value. Our approach seeks to make sustainability part of the way we do business, embedded in our strategy, values, culture and processes.
Supporting our customer focused strategy is a strong set of company-wide values, which are embedded in our culture. These are:
delighting customers;
one team;
integrity;
courage; and
achievement.
8 2014 Westpac Group Annual Report

Information on Westpac Strategic priorities To meet the challenges of the current environment and deliver on our strategy, we have a set of strategic priorities that are reviewed and refreshed each year. We will continue to manage these priorities in a balanced way with an appropriate mix of strength, growth, return and productivity. Our strategic priorities are:
a) A strong company maintain strong levels of capital, to meet the needs of all
our stakeholders and regulators;
continue to enhance our funding and liquidity position, including ensuring a diversity of funding pools and optimising the composition of customer deposits. This includes preparation for new liquidity coverage ratio requirements from 1 January 2015; and
maintain a high quality portfolio of assets, coupled with strong provisioning.
b) Grow in a targeted way target investment in our wealth businesses, including
continuing the development of a new funds platform;
deepen the capabilities of our Asian presence; and
expand and develop our business banking capability to better meet customer needs.
c) Continue building deeper customer relationships through our customer service revolution put customers at
the centre of everything we do with a focus on meeting their total financial needs, throughout their lives;
further build the connectivity between wealth, insurance and banking, and ensure we leverage capabilities across all business units;
continue to strengthen our corporate and institutional lead bank position through customer focus and enhanced product capabilities; and
use digital innovation to better meet customer demands.
d) Materially simplify our products and processes continue to enhance our digital offers to support more
customers online and via mobile channels and assist the Group to move to smaller, more flexible and agile branch formats;
simplify our products and processes and continue to drive continuous improvement; and
focus on both revenue and cost productivity.
e) One team approach continue to focus on a customer centred, high
performance workforce and culture;
strengthen the skills of our people to better support customers and meet their complete financial services needs;
empower our people to drive innovation, deliver new and improved ways of working and be responsive to change;
continue to enhance the diversity of our workforce; and
maintain a strong reputation and sustainability leadership.
Organisational structure Our operations comprise the following key customer-facing business divisions operating under multiple brands serving around 12.8 million customers1.
Australian Financial Services (AFS) is responsible for the Westpac Group’s Australian retail banking, business banking and wealth operations. AFS also includes the product and risk responsibilities for Australian Banking. It incorporates the operations of Westpac Retail & Business Banking (Westpac RBB), St.George Banking Group (St.George) and BT Financial Group (Australia) (BTFG), as follows:
Westpac RBB is responsible for sales and service to consumer, small-to-medium enterprise (SME), commercial and agribusiness customers (with turnover of up to $100 million) in Australia under the Westpac brand. Activities are conducted through Westpac RBB’s network of branches, third party distributors, call centres, automatic teller machines (ATMs), EFTPOS terminals, internet and mobile banking services, business banking centres and specialised consumer and business relationship managers. Support is provided by cash flow, trade finance, transactional banking, financial markets, property finance and wealth specialists;
St.George is responsible for sales and service to consumer, SME and corporate customers (businesses with facilities up to $150 million) in Australia under the St.George, BankSA, Bank of Melbourne and RAMS brands. RAMS is a financial services group specialising in mortgages and online deposits. Activities are conducted through St.George’s network of branches, third-party distributors, call centres, ATMs, EFTPOS terminals, internet and mobile banking services, business banking centres and specialised consumer and business relationship managers. Support is provided by cash flow, trade finance, transactional banking, automotive and equipment finance, financial markets, property finance and wealth specialists; and
BTFG is Westpac’s Australian wealth division. BTFG’s funds management operations include the manufacturing and distribution of investment, superannuation and retirement products, investment platforms including BT Wrap and Asgard, private banking, financial planning as well as equity capability and broking. BTFG’s insurance solutions cover the manufacturing and distribution of life, general and lenders mortgage insurance. BTFG’s brands include Advance Asset Management, Ascalon, Asgard, BT, BT Investment Management (60.76% owned by the Westpac Group and consolidated in BTFG’s Funds Management business), BT Select, Licensee Select, Securitor and the Advice, Private Banking and Insurance operations of Bank of Melbourne, BankSA, St.George and Westpac.
1 All customers with an active relationship (excludes channel only and potential relationships) as at 30 September 2014.
2014 Westpac Group Annual Report 9

Westpac Institutional Bank (WIB) delivers a broad range of financial services to commercial, corporate, institutional and government customers with connections to Australia and New Zealand, this includes a growing customer base in Asia. WIB operates through dedicated industry relationship and specialist product teams, with expert knowledge in transactional banking, financial and debt capital markets, specialised capital, and alternative investment solutions. Customers are supported through branches and subsidiaries located in Australia, New Zealand, Asia, United States and United Kingdom.
Westpac New Zealand is responsible for the sales and service of banking, wealth and insurance products for consumers, business and institutional customers in New Zealand. Westpac conducts its New Zealand banking business through two banks in New Zealand:
Westpac New Zealand Limited, which is incorporated in New Zealand; and
Westpac Banking Corporation (NZ Division), a branch of Westpac, which is incorporated in Australia. The division operates via an extensive network of branches and ATMs across both the North and South Islands.
Business and institutional customers are also served through relationship and specialist product teams. Banking products are provided under the Westpac and WIB brands while insurance and wealth products are provided under Westpac Life and BT brands respectively.
Other divisions in the Group include:
Westpac Pacific, which provides banking services for retail and business customers in seven Pacific Island Nations. Branches, ATMs, telephone banking and internet banking channels are used to deliver business activities in Fiji, Papua New Guinea (PNG), Vanuatu, Cook Islands, Tonga, Solomon Islands and Samoa. Westpac Pacific’s financial products include personal savings, business transactional accounts, personal and business lending products, business services and a range of international products;
Group Services, encompassing technology, banking operations, compliance, legal and property services;
Treasury, which is primarily focused on the management of the Group’s interest rate risk and funding requirements; and
Core Support, which comprises those functions performed centrally, including finance, risk and human resources.
These businesses are described in more detail in Section 2, including a summary of net profit and total assets by business division, and management’s discussion and analysis of business division performance.
Institutional Westpac New Zealand
Group Services
WealthSt.George Banking GroupWestpac Retail & Business Banking
Australian Financial Services
Core Support
10 2014 Westpac Group Annual Report
Information on Westpac Westpac’s approach to sustainability Across the Westpac Group, we believe in establishing a sustainable future for our operations and our stakeholders. This view is embedded in our strategy, values, culture and processes.
In practice, this means we seek to focus on anticipating and responding to the most pressing emerging issues that we believe will have a material impact on our customers, employees, suppliers, shareholders and the communities in which we operate, where we have the skills and experience to make a meaningful difference.
Guiding our approach The Board has responsibility for considering the social, ethical and environmental impact of the Westpac Group’s activities, setting standards and monitoring compliance with Westpac’s sustainability policies and practices.
Our sustainability strategy is based upon the use of the widely accepted global standard for Corporate Responsibility and Sustainable Development, the AA1000 AccountAbility Principles Standard (2008).
Our sustainability principles In line with AA1000, we have adopted the standard’s three key principles:
involving all stakeholders in developing our strategy – Inclusivity;
evaluating all issues identified to determine the impact they may have on our stakeholders and our operations – Sustainability materiality; and
ensuring our decisions, actions and performance, as well as our communication with stakeholders, are responsive to the issues identified – Responsiveness.
Inclusivity Our approach to inclusivity during 2014 has included:
continuing work to understand and address customer concerns;
collaborating with key external stakeholders to inform our approach;
consulting with employees so as to better understand the drivers of strong employee engagement;
bringing together our General Managers with internal and external stakeholders to inform sustainability priorities and targets;
ongoing monitoring of our reputation across a wide range of mediums; and
working closely with numerous community organisations through employee volunteering, workplace giving and community support.
Sustainability materiality As part of our annual materiality review we identify, prioritise and define issues according to their impact on our stakeholders and our business. These issues are reviewed externally and internally and are assessed by Ernst & Young as part of their assurance. Material issues identified in 2014 include:
the need to respond to the rapid changes in the demographics of our society;
the effect of digitisation on the way customers and businesses interact and do business;
new regulatory requirements which are shaping the financial services industry; and
the importance of understanding and managing environmental, social and corporate governance risks within our lending and investment portfolios.
For further detail, please see our online Annual Review and Sustainability Report.
Responsiveness The issues identified during our materiality review directly inform the development of our responses, objectives and performance measures.
Updated five-year strategy In addition to the sustainable business practices embedded in our day to day activities (such as sustainable lending practices, community investment and evolving the way we interact with and service our customers), we continue to track our progress against the sustainability strategy, which guides our efforts for 2013–2017.
As part of the strategy, we have set 10 measurable objectives in three priority areas, which are to:
help improve the way people work and live, as our society changes;
help find solutions to environmental challenges; and
help our customers to have a better relationship with money, for a better life.
During 2014 we have updated our sustainability strategy, reflecting stakeholder feedback, to include:
a target for recruitment of Indigenous Australians, in line with our Reconciliation Action Plan, which was also relaunched this year; and
new metrics for measuring access to financial services in the Pacific, in line with our Everywhere Banking Strategy.
2014 Westpac Group Annual Report 11

Performance against sustainability objectives1
Priority Objectives Full year 2014 achievements
Help improve the way people work and live as our society changes
Ensure our workforce is representative of the community.
Increased women in leadership2 to 44%, in line with target and up from 42% in 2013.
Increased participation of mature aged workers (50+ years) to 20.9%, up from 20.5% in 2013 and in line with target, supported by an employee program called Prime of Life.
Launched the Group’s third Reconciliation Action Plan (2015-17), with almost 50 commitments to support Indigenous Australian customers, communities and employees.
Extend length and quality of working lives.
Mean employee retirement age increased to 61.6 years, up from 60.6 years in 2013, in line with target.
Introduced a new employee action group, FLEX, and rolled out a flexibility toolkit, capability training and facilitator guide, with the aim of embedding flexible working arrangements. 2,000 employees participated in training on flexibility and unconscious bias.
Anticipate the future product and service needs of ageing and culturally diverse customers.
Refreshed the Group’s multilingual, country-specific websites, created new digital banking forms for people relocating to Australia to open accounts prior to arrival and established an online relocation advice hub.
Established a dedicated team to support Indigenous customers. Established a dedicated team to support prime of life customers with
Self Managed Super Funds (SMSFs).
Help find solutions to environmental challenges
Provide products and services to help customers adapt to environmental challenges.
Partnered with the World Bank to bring the first green bond to the Australian market.
Introduced energy efficient equipment finance to AFS customers.
Increase lending and investment in CleanTech and environmental services.
$8.0 billion lent to the CleanTech and environmental services sector significantly exceeding our commitment to make available up to $6 billion by 2017.
59% of total energy financing is directed to renewable energy generation (including hydro, wind and solar).
Reduce our environmental footprint.
Maintained carbon neutrality. Achieved our power use effectiveness and energy efficiency targets of 1.7PUE
and 198kWh/m2 respectively. Recycling rates in Sydney head offices improved, but fell 5% short of target. Reached office paper reduction target three years ahead of schedule.
Help customers to have a better relationship with money, for a better life
Ensure all our customers have access to the right advice to achieve a secure retirement.
Completed development of our proprietary and market leading online wealth acumen curriculum.
Steps being taken to increase proportion of AFS employees completing wealth acumen curriculum.
Help our customers meet their financial goals in retirement.
Increased the proportion of Westpac Group customers with Westpac Group Superannuation to 8.1%3, up from 7.4% in 2013.
Launched Self Managed Super Connect, a specialist sales and service centre to assist customers with their SMSFs.
1 All results as at 30 September except environmental footprint which is at 30 June. Refer to www.westpac.com.au/sustainability for glossary of terms and metric definitions.
2 Women in leadership refers to the proportion of women (permanent and maximum term) in people leadership roles or senior roles of influence as a proportion of all leaders across the Group. It includes the CEO, Executive Team, General Managers, Senior Managers as direct reports to General Managers and the next two levels of management. Excludes Westpac Pacific.
3 Data based on Roy Morgan Research, respondents aged 14+ and 12 months to September 2014. Super penetration is defined as the proportion of Australians who have a Deposit or Transaction Account, Mortgage, Personal Lending or Major Card with the Westpac Group and also have Superannuation (incl. Pensions and Annuities) with the Westpac Group. Westpac Group includes Bank of Melbourne, BT, Challenge Bank, RAMS, Rothschild, Westpac, Advance Bank, Asgard, BankSA, Dragondirect, Sealcorp and St.George.
12 2014 Westpac Group Annual Report

Information on Westpac Priority Objectives Full year 2014 achievements
Increase access to financial services in the Pacific.
Opened 77,868 basic accounts across the Pacific, a 53% increase over the year. Increased in-store banking facilities by 47% to 264, and more than doubled the
volume of customer transactions to around 380,000. Launched a new mobile banking platform in the Solomon Islands and
Papua New Guinea. 23,756 people participated in our free financial education workshops, up from
20,575 last year.
Help people gain access to social and affordable housing and services.
$0.82 billion lent to the social and affordable housing sector at 30 September 2014, up from $0.65 billion at 30 September 2013.
Announced the Group’s largest single community housing finance transaction for construction of 275 new affordable houses.
2014 Westpac Group Annual Report 13

Five year non-financial summary Non-financial information as at 30 September unless indicated otherwise1 2014 2013 2012 2011 2010Customer Total customers (millions)2 12.8 12.2 11.8 11.5 11.3Total online customers – active registrations (millions)3 4.7 4.2 4.0 3.7 3.4Number of points of bank representation 1,534 1,544 1,538 1,532 1,517Number of ATMs 3,890 3,814 3,639 3,544 3,625Percentage of Talking ATMs (%)4 95 93 91 88Net Promoter Score5 – Westpac Australia – affluent6 (10) (9) (18) (17) (24)Net Promoter Score7 – Westpac Australia – commercial8 7 (1) (4) 3 (7)Net Promoter Score7 – Westpac Australia – SME9 (2) (5) (17) (10) (21)Net Promoter Score5 – St.George consumer10 8 4 - (2) (4)Net Promoter Score7 – St.George business11 4 (6) 1 (5) 3Social Sector Banking Footings ($m)12 13,726 12,819 11,490 8,210 7,101Responsible Investment Funds Under Management ($m)13 1,693 1,376 981 644 891
EmployeesTotal core full time equivalent staff (number at financial year end)14 33,586 33,045 33,418 33,898 35,055Employee Engagement (%)15 n/a 87 84 81 80Employee Voluntary Attrition (%)16 9.8 9.8 9.9 11.5 11.8New Starter Retention (%)17 88.0 86.7 84.8 83.8High Performer Retention (%)18 95.8 95.7 95.9 95.3 94.3Lost Time Injury Frequency Rate (LTIFR)19 1.1 1.5 1.9 2.5 2.6Women as a percentage of the total workforce (%) 59 60 61 61 61Women in Leadership (%)20 44 42 40 38 35
EnvironmentTotal Scope 1 and 2 emissions – Aust and NZ (tonnes CO2-e)21 175,855 180,862 183,937 184,124 189,425Total Scope 3 emissions – Aust and NZ (tonnes CO2-e)22 73,871 85,013 91,855 57,163 70,457Office paper – Aust and NZ (tonnes)23 1,415 1,523 1,579Proportion of infrastructure and utilities financing in renewablesand hydro – Aust and NZ (%)24 59 55 52 45 52Finance assessed under the Equator Principles – Group ($m)25 851 268 1,140 383 364
SocialCommunity investment – Group ($m)26 217 131 133 155 116Community investment as a percentage of pre-tax profits – Group (%) 2.02 1.33 1.50 1.82 1.44Community investment as a percentage of pre-tax operating profit (cash earnings basis) – Group (%) 1.99 1.28 1.41 1.72 1.37Financial education – Group (participants)27 49,812 32,577 36,182 42,109
Supply chainTotal supply chain spend – Aust ($bn)28 5.37 4.88 4.22 4.61 4.39Percentage of top 80 suppliers screened for sustainabililty – Aust (%)29 100 98 94 92 86All self assessed suppliers as percentage of total supply chain spend30 73 73 76 75 69
1 Dark grey shading indicates information was not collected in the relevant year. 2 All customers with an active relationship (excludes channel only and potential relationships). 3 Refers to the number of customers registered for online banking and that have signed in online within the last 90 days as at 30 September. 4 ATMs with an additional functionality to allow users to plug in an earpiece for oral instruction to provide additional assistance for visually
impaired users. 5 Net Promoter Score measures the net likelihood of recommendation to others of the customer’s main financial institution for retail banking.
Net Promoter ScoreSM is a trademark of Bain & Co Inc., Satmetrix Systems, Inc., and Mr Frederick Reichheld. For retail banking, using a scale of 1 to 10 (1 means ‘very unlikely’ and 10 means ‘very likely’), the 1-6 raters (detractors) are deducted from the 9-10 raters (promoters).
14 2014 Westpac Group Annual Report

Information on Westpac 6 Source: Roy Morgan Research, September 2010-2014, six month moving average (6MMA). Main Financial Institution (as defined by the customer).
Affluent segment includes Banking and Finance (excl. Work Based Superannuation) customers aged 25 or over with a Household Income above $100,000 or customers aged 60 or over with Household Income above $50,000 and/or customers with financial footings above $400,000 (anywhere or at institution).
7 Net Promoter Score measures the net likelihood of recommendation to others of the customer’s main financial institution for business banking. Net Promoter ScoreSM is a trademark of Bain & Co Inc., Satmetrix Systems, Inc., and Mr Frederick Reichheld. For business banking, using a scale of 0 to 10 (0 means ‘extremely unlikely’ and 10 means ‘extremely likely’), the 0-6 raters (detractors) are deducted from the 9-10 raters (promoters).
8 Source: DBM Consultants Business Financial Services Monitor, September 2010-2014, 6MMA. MFI customers, Commercial businesses. Commercial businesses are those organisations with annual turnover over $5 million and under $100 million (excluding Agricultural business).
9 Source: DBM Consultants Business Financial Services Monitor, September 2010-2014, 6MMA. MFI customers, SME businesses. SME businesses are those organisations with annual turnover under $5 million (excluding Agricultural business).
10 Source: Roy Morgan Research, September 2010-2014, 6MMA. Main Financial Institution (MFI) as defined by the customer. Consumers aged 14 or over.
11 Source: DBM Consultants Business Financial Services Monitor, September 2010-2014, 6MMA. MFI customers, all businesses. 12 Data refers to the total of assets (loans), liabilities (deposits) and funds under management (FUM) of the Westpac RBB business unit dedicated to
social sector customers. Social sector customers are categorised according to specific criteria, including organisation structure, account types held, key words and special condition groups.
13 Refers to FUM which are managed using sustainable and/or ethical investment processes. 14 Total core (permanent) full time equivalent staff (number at financial year end), excludes Implied FTE (overtime, temporary and contract). 15 Employee engagement survey was not conducted in for the year ended 30 September 2014. 16 Employee Voluntary Attrition refers to the total voluntary separation of permanent employees over the 12 month average total permanent headcount
for the period (includes full time, part time and maximum term employees). Excludes Westpac Pacific. 17 Voluntary New Starter retention over the 12 month rolling New Starter headcount for the period (includes full time and part time permanent
employees). Excludes Westpac Pacific. 18 Voluntary High Performer Retention over the 12 month rolling High Performer headcount for the period (includes full time, part time permanent and
maximum term employees). Excludes Westpac Pacific. 19 Lost Time Injury Frequency Rate (LTIFR) measures the number of Lost Time Injuries, defined as injuries or illnesses (based on workers
compensation claims accepted) resulting in an employee being unable to work for a full scheduled day (or shift) other than the day (or shift) on which the injury occurred where work was a significant contributing factor, per one million hours worked in the rolling 12 months reported. Excludes Westpac Pacific.
20 Women in Leadership refers to the proportion of women (permanent and maximum term employees) in people leadership roles or senior roles of influence as a proportion of all leaders across the Group. Includes CEO, Executive Team, General Managers, Senior Managers as direct reports to General Managers and the next two levels of management. Excludes Westpac Pacific.
21 Scope 1 greenhouse emissions are the release of greenhouse gases into the atmosphere as a direct result of Westpac’s Australian and New Zealand banking operations. Scope 2 emissions are indirect greenhouse gas emissions from consumption of purchased electricity from Westpac’s Australian and New Zealand banking operations. Australian data is prepared in accordance with the National Greenhouse and Energy Reporting Act 2007. New Zealand data is prepared in accordance with the Guidance for Voluntary Corporate Greenhouse Gas Reporting published by the New Zealand Ministry for the Environment. These definitions also align with the GHG protocol and ISO 14064‐1 standard and are reported for the period 1 July to 30 June.
22 Scope 3 emissions are greenhouse gases emitted as a consequence of Westpac’s Australian and New Zealand banking operations but by another facility. Australian data is prepared in accordance with the National Carbon Offset Standard. New Zealand data is prepared in accordance the New Zealand Ministry for the Environment for GHG reporting. These definitions also align with the GHG protocol and ISO 14064‐1 standard and are reported for the period 1 July to 30 June.
23 Total copy paper purchased (in tonnes) by the Westpac Group as reported by its suppliers. 24 Refers to total committed exposures, as per Westpac exposure measurement and as included in APRA reported exposure. 25 The Equator Principles are a voluntary set of standards for determining, assessing and managing social and environmental risk in project financing. 26 This amount includes monetary contributions, time contributions, management costs and in-kind contributions comprising of gifts and foregone
fee revenue. Also includes Westpac’s $100 million contribution to the Westpac Bicentennial Foundation. 27 Refers to the number of attendees (staff, customers and general public) at financial education and who access online courses offered by the Westpac
Group. Excludes keynote presentations offered by the Davidson Institute. 28 Refers to the total Australian dollars ($bn) with external suppliers. 29 Refers to the total number of top suppliers that have provided a self-assessment against the Sustainable Supply Chain Management (SSCM) Code of
Conduct and/or SSCM Questionnaire in the reporting period. Also includes suppliers who will be or are engaged in completing the SSCM Assessment (based on our new online tool that we are phasing in with new suppliers). Top suppliers defined as top 150 in 2010–2012, top 80 in 2013–2014.
30 Refers to suppliers in our top 700 by spend.
2014 Westpac Group Annual Report 15
Competition The Westpac Group operates in a highly competitive environment across the regions in which we do business.
We serve the banking, wealth and risk management needs of customer segments from consumers to small businesses through to large corporate and institutional clients. The Westpac Group competes with other financial services industry players for customers covering their needs of transacting, saving, investing, protecting and borrowing with a wide set of products and services. Our competitors range from large global organisations with broad offerings to entities more focused on specific regions or products. Our competitors include financial services and advisory companies such as banks, investment banks, credit unions, building societies, mortgage originators, credit card issuers, brokerage firms, fund and asset management companies, insurance companies and internet-based financial services providers. There are also new competitors emerging from other sectors including retail, technology and telecommunications.
Our competitive position across customer segments, products and geographies is determined by a variety of factors. These factors include:
the type of customer served;
customer service quality and convenience;
the effectiveness of, and access to, distribution channels;
brand reputation and preference;
the quality, range, innovation and pricing of products and services offered;
technology solutions; and
the talent and experience of our employees.
In Australia, we have seen competition for deposits continue to be driven in part by clearer global regulatory requirements for liquidity management and balance sheet composition. Banks and other financial institutions also seek to achieve a higher proportion of deposit funding as credit rating agencies and debt investors look for strong balance sheet positions in their assessment of quality institutions.
Competition for lending is also expected to remain high, with slower credit growth compared to the significant credit expansion Australia experienced over the majority of the last two decades. Businesses and consumers are cautious about the global outlook and continue to reduce debt. In mortgages, the desire of market participants to maintain or expand their market share using price has seen strong competition over the last year. This is expected to continue. Serving business customers’ transaction and trade financing needs has been at the centre of competitive activity as customer expectations increase.
In our wealth business, we expect competition to increase as financial institutions and industry funds move to capture a greater share of this fast growing market, particularly in superannuation (or pensions) and financial advice as the market responds to regulatory changes.
The New Zealand market is experiencing strong competition as banks vie for new customers. Competition for deposits remains intense and the home lending market is particularly competitive on price and switching incentives.
Outlook1 Australian economic conditions gradually improved over 2014 with steady growth in private consumption, a pick-up in housing activity and a rise in resource exports offsetting the mining-led reduction in business investment. GDP growth lifted from 2.6% in December quarter 2013 to 3.1% in June quarter 2014 and is expected to remain at this pace through to the end of 2014. In 2015, we expect a further lifting in GDP growth to 3.2%.
The international environment remains challenging with an 8% decline in Australia’s terms of trade over the past year, associated with a slowdown in China, which in turn affected national income. Looking ahead, we expect world growth to strengthen in 2015 to 3.7% from 2.9% this year as the major developed economies see some modest firming in growth and activity, and as China stabilises.
Domestically, we anticipate that the mining investment reduction will likely continue in 2015 but expect an offset from a lift in consumer spending and non-mining business investment, along with a continued rise in resource exports.
While consumers generally remain cautious, their balance sheets are strengthening with good growth in deposits and investments along with improving house prices. This is expected to translate to higher growth in the year ahead. Housing has already shown a clear response to record low interest rates with new dwelling investment showing its strongest growth since 2002. We expect building activity will remain at high levels in coming quarters, before moderating a little over 2015.
There are also improving prospects for a modest rise in non-mining business investment, particularly in the services sector in response to stronger household demand. Together, these trends suggest a modest but sustained increase in business activity in the year ahead.
Offsetting these improvements, we anticipate that the economy will continue to encounter some headwinds to growth. In addition to the ongoing mining investment downturn, lower public spending is also expected to be a restraint with governments at all levels focused on budget repair.
Near term, we expect the mix of controlled inflation, modest employment growth and below trend GDP growth to see the Reserve Bank maintain its current accommodative stance of monetary policy, holding the cash rate at 2.5%. However, as international conditions improve and domestic demand shows signs of firming, we expect the RBA to begin a gradual tightening of monetary policy in the second half of 2015.
1 All data and opinions under ‘Outlook’ are generated by our internal economists and management.
16 2014 Westpac Group Annual Report

Information on Westpac Price pressures are likely to remain benign with core CPI inflation easing back towards 2.5% in 2015 and wages growth subdued. Labour markets remain soft and we only expect to see a gradual improvement with the unemployment rate rising marginally to 6.2% in early 2015 and only declining slightly by the end of the year.
For the financial services sector, we expect demand for credit to rise modestly with credit growth lifting to around 7% in 2015, up from closer to 6% in 2014. Housing credit is likely to remain solid, while business credit growth is likely to continue rising off its relatively modest base. Growth in funds management is expected to be a little stronger as the population continues to direct more savings to superannuation and prepare for retirement.
The use of digital channels by customers to conduct their banking continued to rise over the year with the use of mobile channels accelerating quickly. These trends are expected to have a significant impact on financial services companies and we will need to continue adjusting our business model to meet these changing customer needs.
For Westpac, we have responded to changes in the operating environment and this has been reflected in our performance and in the execution of our customer centric strategy which has seen an improvement in customer satisfaction. In the year ahead we will continue to focus on our strategic priorities including:
remaining strong in our capital, funding and liquidity positions. This includes meeting the new Liquidity Coverage Ratio (LCR) requirements from 1 January 2015 and being well prepared to respond to further regulatory change;
further improving productivity through our simplification program that aims to materially reduce the complexity of our products and processes for customers;
continuing to enhance our customer focus, seeking to step-up how we support and serve customers. This includes further expanding our digital services and continuing to transform our branch network from transaction centres to service and support hubs;
increasing growth through further investment in wealth platforms, Bank of Melbourne and our expansion in Asia. We will also increase our focus on those sectors and segments of the economy likely to experience higher growth;
further building our one team culture focusing on delivering the best outcome for customers; and
ensuring we actively manage our business, and support customers for societal change and for changes in the environment. This includes improving the way we manage demographic change, the aging population, assisting customers manage to a more carbon constrained economy and lending to and investing in CleanTech and environmental services.
A key issue for the Australian banking sector over the coming year will be continued regulatory change both domestically and globally, including from the Financial System Inquiry. Given the strength of our business and balance sheet, in both absolute terms and relative to peers, we believe we are well placed to respond to any additional regulatory change.
Looking ahead, with our strong positioning, improved growth profile and solid operating performance across all divisions, combined with strong progress on our strategic priorities, Westpac believes it is well positioned to continue delivering sustainable outcomes to shareholders.
Significant developments Corporate significant developments Inquiry into Australia’s Financial System On 20 November 2013, the Federal Government formally announced the appointment of Mr David Murray AO to head an inquiry into Australia’s financial system (Inquiry).
The Inquiry’s terms of reference, announced on 20 December 2013, charge the Inquiry with examining how the financial system could be positioned to best meet Australia’s evolving needs and support Australia’s economic growth. Recommendations will be aimed at fostering an efficient, competitive and flexible financial system, consistent with financial stability, prudence, public confidence and capacity to meet the needs of users.
Following lodgement of initial submissions in March 2014, the Inquiry released its Interim Report on 15 July 2014. This Interim Report invited further comments and consisted of observations, potential policy options and requests for further information.
Westpac lodged its initial submission on 31 March 2014 and its response to the Inquiry’s Interim Report on 26 August 2014.
The Inquiry is expected to release its final report to the Treasurer in November 2014, following which the Government may further consult with industry in considering the Inquiry’s recommendations. Until the Government officially responds to the Inquiry’s recommendations, the final impact of this Inquiry is difficult to predict.
Acquisition of select Australian businesses of Lloyds Banking Group On 11 October 2013 Westpac announced it had entered into an agreement to acquire selected assets of Lloyds Banking Group’s Australian asset finance business, Capital Finance Australia Limited (CFAL), and its corporate loan portfolio, BOS International (Australia) Ltd (BOSI).
The transaction was completed on 31 December 2013, adding $7.9 billion in motor vehicle finance, equipment finance and corporate loans to Westpac’s lending and $8.5 billion in risk weighted assets. The acquisition cost was $1.45 billion and was funded from internal resources.
2014 Westpac Group Annual Report 17

Buy-back and cancellation of Westpac Stapled Preferred Securities II (Westpac SPS II) On 18 June 2014, approximately $529 million of Westpac SPS II were bought back on-market by Westpac and subsequently cancelled. All remaining Westpac SPS II were transferred to a nominated party on 30 September 2014 and subsequently bought back off-market by Westpac and cancelled.
Issue of Westpac Capital Notes 2 On 23 June 2014, Westpac issued approximately $1.31 billion of securities known as Westpac Capital Notes 2, which qualify as Additional Tier 1 capital of Westpac under APRA’s Basel III capital adequacy framework.
Litigation Exception fees – Westpac has been served with three
class action proceedings brought on behalf of customers seeking to recover exception fees paid by those customers. The first set of proceedings was commenced in December 2011 by certain named customers of the Westpac brand; the second was commenced in February 2012 by certain named customers of the St.George Bank and BankSA brands; the third was commenced in August 2014 on behalf of all other customers of Westpac Banking Group. Similar class actions have been commenced against several other Australian banks. Westpac has agreed with the plaintiffs to put the proceedings against Westpac on hold until at least December 2014, pending further developments in the litigation against one of those other banks.
Bell litigation – Westpac was one of 20 defendant banks named in proceedings concerning the Bell Group of companies. The proceedings were brought by the liquidators of several Bell Group companies who challenged the defendant banks’ entitlement to receive the proceeds of realisation of Bell Group assets in the early 1990s.
On 17 September 2013 the parties announced that the matter was settled. Prior to the settlement, Westpac was entitled to file a claim as an unsecured creditor in the liquidation of the Bell companies and stood to recover part of the funds available for distribution to creditors. As part of the settlement, Westpac has agreed to release its claim for the distribution. The terms of the settlement remain confidential. The settlement was subject to various approvals being obtained in local and overseas jurisdictions. Such approvals have been obtained. Settlement has completed and Westpac’s liabilities to the Bell companies have been satisfied in full.
Westpac Bicentennial Foundation On 2 April 2014, Westpac announced the launch of the Westpac Bicentennial Foundation. The charitable Foundation will have an exclusive focus on the education and advancement of Australians. A one-off contribution of $100 million is designed to fund 100 scholarships every year in perpetuity to Australians who have the potential to shape Australia’s future. The program commenced in 2014 so that the earnings from the fund will see the initial scholarships fully operational by the Group’s 200th anniversary in 2017.
Changes to accounting standards In a continuing response to the global financial crisis, governments, regulators and accounting standard setters are working to revise certain accounting standards. The specific areas that have been targeted include accounting for financial instruments, provisioning for loan impairment charges, off-balance sheet exposures, the impairment and valuation of financial assets, consolidation and lease accounting. New accounting standards dealing with consolidation and the measurement of fair value applied to the Group from 1 October 2013. These new standards did not have a material impact on the Group’s financial position or performance. The Group expects that there will be a number of new standards issued in coming years that will require further changes to the Group’s current accounting approaches.
Regulatory significant developments Basel Committee on Banking Supervision Regulatory reforms and significant developments arising in relation to changes initiated by the Basel Committee on Banking Supervision (BCBS) include:
Liquidity The Australian Prudential Regulation Authority (APRA) released a final liquidity standard (APS 210) in December 2013. Under APS 210 Westpac will need to meet the requirement of a minimum Liquidity Coverage Ratio (LCR) of 100% when it comes into effect from 1 January 2015.
The LCR requires banks to hold sufficient high-quality liquid assets, as defined, to withstand 30 days under a regulator-defined acute stress scenario. Given the limited amount of government debt in Australia, the Reserve Bank of Australia (RBA) jointly with APRA, will make available to Australian institutions a Committed Liquidity Facility (CLF) that, subject to satisfaction of qualifying conditions, can be accessed to help meet the LCR requirement. In order to have access to the CLF, Australian banks are required to pay a fee of 15 basis points (0.15%) per annum to the RBA on the approved CLF from 1 January 2015. On 30 September 2014, APRA approved Westpac’s access to the CLF for the 2015 calendar year for $66 billion.
The BCBS endorsed the final details of the Net Stable Funding Ratio (NSFR) at its meeting in September 2014, and a final standard was released on 31 October 2014. APRA are yet to release its prudential standard on NSFR applicable to Australian banks. The NSFR requirement, designed to encourage longer-term funding resilience, has been excluded from APS 210 however APRA has previously indicated an intention to implement this measure from 1 January 2018.
18 2014 Westpac Group Annual Report

Information on Westpac Global Systemically Important Financial Institutions (G-SIFIs) In July 2013, the BCBS published an updated methodology for determining Global Systemically Important Banks (G-SIBs). Each year in November the Financial Stability Board (FSB) publishes the list of identified G-SIBs and specifies the higher capital requirements proposed for each. These increased capital requirements will be phased in from January 2016. Westpac has not been named as a G-SIB. However the BCBS has issued a framework for extending the SIFIs requirements to domestic systemically important banks (D-SIBs).
Capital In 2010, the BCBS outlined the revised capital framework for banks globally as follows:
an increase in the minimum common equity requirement from 2.0% to 4.5%;
an increase in the minimum Tier 1 capital requirement from 4.0% to 6.0%;
a capital conservation buffer at 2.5%, to be met with common equity; and
a countercyclical buffer of between 0% to 2.5% to be met with common equity or other fully loss absorbing capital.
APRA’s adoption of the framework has required Australian Authorised Deposit-taking Institutions (ADIs) such as Westpac to meet the new minimum capital requirements from 1 January 2013 and the capital conservation buffer in full from its introduction date of 1 January 2016. In December 2013 APRA released its approach for implementing a D-SIB framework in Australia. Westpac is one of four Australian banks which APRA has identified as a D-SIB. APRA has proposed that each D-SIB, including Westpac, will have to meet a higher loss absorbency requirement of 1% to be met by common equity. The 1% requirement will be added to the capital conservation buffer effectively increasing the buffer from 2.5% to 3.5%. The countercyclical buffer is not currently required.
Westpac’s current capital levels are already above the regulatory requirement that will apply from 1 January 2016 (including the expanded capital conservation buffer).
Further details of Westpac’s regulatory capital disclosures can be accessed at www.westpac.com.au/about-westpac/investor-centre/financial-information/basel-iii-risk-reports.
Increased loss absorbency In September 2014, the FSB stated that it would table proposals at the G20 Leaders’ Summit in Brisbane in November 2014 for enhancing the Total Loss Absorbing Capacity (TLAC) for G-SIBs to operate alongside the Basel III capital requirements. These proposals form part of the G20’s initiatives aimed at ‘Ending too-big-to-fail’ and ensuring that the resolution of a failing G-SIFI can be carried out without causing systemic disruption or resorting to taxpayer support. Should the TLAC proposals be endorsed by the G20 they will be subject to industry consultation throughout 2015. The FSB has stated that the TLAC requirement would not be introduced before 2019 and it is not known at this stage whether there is any intention to extend the requirement beyond G-SIBs.
Other Basel Accord Reforms The Basel III capital framework also introduced a leverage ratio requirement. The BCBS proposes that introducing a simple, non-risk based leverage ratio requirement would act as a credible supplementary measure to the risk-based capital requirements. In January 2014, the BCBS published an amended leverage ratio framework. The proposed timetable for the leverage ratio provides for testing and recalibration of the framework to occur until 2017, with public disclosure to commence from January 2015 and migration of the final standard to a Pillar 1 requirement from January 2018.
The BCBS is also currently conducting analysis on risk-weighted assets, which forms the denominator of the capital ratios. The BCBS has indicated that this work is intended to examine the consistency in the determination of risk-weighted assets within and across jurisdictions and which will ultimately allow the BCBS to develop potential policy options.
Each of these measures is in different stages of development and, following release of the respective regulations by the BCBS, APRA will consult on and develop the regulations to apply in Australia.
Recovery and resolution planning A further component of the G20’s ‘Ending too-big-to-fail’ reforms is a requirement for a Recovery and Resolution Plan for any firm deemed by its home authority to have systemic importance to the domestic economy. APRA has undertaken a pilot Recovery Planning project applying to Australia’s largest banks, including Westpac, with final plans delivered to APRA in mid-2012. APRA has advised Westpac of its expectation that the Recovery Plan be maintained and Westpac reviews and updates its Recovery Plan where required.
In the US, Westpac is also required to satisfy the resolution plan requirements of the Dodd-Frank Wall Street Reform and Consumer Protection Act (Dodd-Frank Act). In December 2013, Westpac submitted a resolution plan in relation to our US operations to US bank regulatory authorities. This plan is maintained and updated as required, including in response to feedback from bank regulatory authorities.
OECD Common Reporting Standard The Organisation for Economic Cooperation and Development (OECD) has developed Common Reporting Standard (CRS) rules for the automatic exchange of financial account information amongst OECD member states.
CRS will require the Westpac Group to identify the tax residency of all customers and to report the tax residency and account details of non-resident customers to the relevant authorities in jurisdictions in which the CRS rules operate.
It is currently intended that Australian financial institutions can voluntarily implement the rules from 1 January 2017, but will have to be compliant from 1 January 2018. The rules could impose additional costs and operational burdens on Westpac.
2014 Westpac Group Annual Report 19

OTC derivatives reform The international regulatory reforms relating to over-the-counter (OTC) derivatives continue to be implemented by financial regulators across the globe.
In Australia, Westpac commenced reporting OTC derivatives transactions to a Prescribed Repository in accordance with the Derivative Transaction Rules (Reporting) 2013 on 1 October 2013. Westpac continues to work with ASIC and industry associations in relation to the implementation of these rules and the phase-in of requirements to other industry participants.
The Australian Treasury has issued two Proposal Papers on the Implementation of Australia’s G20 OTC derivatives commitments, in which they proposed a central clearing mandate for US dollar, Euro, British Pound, Yen (February 2014 Proposal Paper) and Australian dollar (July 2014 Proposal Paper) denominated interest rate derivatives traded between dealers with significant cross-border activities. It is expected that any such mandate would cover Westpac. The commencement of the central clearing mandates is expected to occur by early to mid-2015.
As a provisionally-registered Swap Dealer with the US Commodity Futures Trading Commission (CFTC), Westpac is subject to a range of entity-level and transaction-level requirements pursuant to the Dodd-Frank Act.
Pursuant to the European Market Infrastructure Regulations (EMIR) established by the European Securities and Markets Authority (ESMA), from October 2014, Westpac became subject to certain risk mitigation obligations in relation to OTC Derivatives traded with European counterparties or through its London Branch. Further, as of mid-2015, Westpac will be subject to a central clearing mandate for certain interest rate derivatives with European counterparties.
Westpac continues to monitor developments in response to requirements imposed by international regulators. These include regulations published by the CFTC and the Securities and Exchange Commission under the Dodd-Frank Act; by the ESMA and local European financial regulators under the EMIR and Markets in Financial Instruments Directive (MiFID II); and by various financial regulators in Asia and Canada. Westpac also continues to monitor the international response to the final policy framework for establishing margin requirements for uncleared OTC derivatives as published by the Basel Committee on Banking Supervision (BCBS) and the International Organisation of Securities Commission (IOSCO) on 2 September 2013.
Australia The Federal Government has embarked on a program of regulatory reform which will affect Westpac. In addition to the above, this includes:
Superannuation changes In December 2013, BT launched a number of MySuper products to allow employers to make their super guarantee contributions to their BT default super fund. A MySuper product is a default investment option where investment choice is not elected by the member and is generally a low cost, simple superannuation product. Other legislative changes include enhanced trustee and director obligations as well as ‘SuperStream’, a measure to improve the efficiency of processing superannuation transactions through the use of technology. Westpac continues to assess and implement changes to our existing superannuation products and governance to ensure compliance with the new requirements.
Financial advice changes The majority of the Future of Financial Advice (FOFA) reforms commenced for the Westpac Group on 1 July 2013. The Government announced proposed reforms to the FOFA laws on 20 December 2013 and a bill to amend FOFA (the Corporations Amendment (Streamlining of Future of Financial Advice) Bill 2014) was introduced into parliament on 19 March 2014. The Bill includes changes to remove the requirement to opt-in to ongoing adviser services every two years and also provides a general advice exemption from the ban on conflicted remuneration. Regulations which were effective on 1 July 2014 (the ‘Streamlining Regulations’) incorporated these changes as well as other changes including other exemptions from the ban on conflicted remuneration and an extension to grandfathering of conflicted benefits in certain circumstances. Uncertainty still exists as to whether the Bill will pass in its current form and some changes to sections including the best interests duty and the general advice exemption have been proposed in the Senate. Other new regulations, which become effective on 1 January 2015, provide for certain changes in relation to the receipt of client instructions and also in relation to the provision of financial product advice in Statements of Advice.
Privacy law reform Significant amendments to the Privacy Act 1988 (Cth) commenced on 12 March 2014. As a result the Westpac Group has amended a wide range of documents, systems and procedures in relation to the management of personal and credit information.
20 2014 Westpac Group Annual Report

Information on Westpac United States There are a number of significant regulatory reforms currently occurring in the United States (US). These include:
Dodd-Frank Act Legislation designed to reform the system for supervision and regulation of financial firms in the US was signed into law on 21 July 2010. The Dodd-Frank Act contains a wide range of provisions that will affect financial institutions operating in the US, including foreign banks like Westpac. Included among its provisions are reforms designed to:
reduce systemic risk presented by very large financial institutions;
promote enhanced supervision, regulation, and prudential standards for financial institutions;
establish comprehensive supervision of financial markets;
impose new limits on permissible financial institution activities and investments;
expand regulation of the derivatives markets, protect consumers and investors from financial abuse; and
provide the US Government with the tools needed to manage a financial crisis.
Many of the provisions of the Dodd-Frank Act require extensive rulemaking by US regulatory agencies before the provisions become effective. The issuance of final rules under the Dodd-Frank Act remains far from complete, with the process continuing. US regulatory agencies have released final rules to implement Section 619 of the Dodd-Frank Act (the Volcker rule) and to strengthen the regulation of the US operations of non-US banks. At this time, apart from investments in compliance activities, we do not expect these rules to have a significant impact on our business activities.
Foreign Account Tax Compliance Act (FATCA) Provisions commonly referred to as FATCA and related US Treasury regulations generally require Foreign Financial Institutions (FFIs), such as Westpac, to enter into an FFI agreement (if they are not subject to the provisions of a Model 1 Intergovernmental Agreement (IGA)) under which they agree to identify and provide the US Internal Revenue Service (IRS) with information on certain US connected accounts, or otherwise face 30% withholding tax on certain payments made to the FFI. In addition, FFIs that have entered into an FFI agreement will be required to withhold on certain payments made to FFIs that are neither party to an FFI agreement nor subject to an IGA and certain account holders that fail to provide prescribed information. The Australian Government signed an IGA with the United States on 28 April 2014, which came into force on 30 June 2014. The Australian IGA, and any IGAs that may be concluded between the US and other countries in which Westpac conducts business, will relieve Westpac of the requirement to withhold on payments to, or close, certain accounts, and will provide certain other benefits.
Westpac is implementing changes to its business operations to comply with the requirements of FATCA across all jurisdictions in which it operates. Westpac has entered into an FFI agreement with respect to its branches and affiliated FFIs not located in countries that have entered into an IGA. It is anticipated that compliance with FATCA will give rise to significant costs and operational burdens, but that IGAs will reduce those costs and burdens, where applicable.
New Zealand Regulatory reforms and significant developments in New Zealand include:
Basel III The RBNZ has adopted the core Basel III capital measures relating to new capital ratios and most of the recommendations relating to the definition of capital. From 1 January 2013, the requirements for WNZL’s Total Tier 1 capital increased to 6.0% and had to include common equity of 4.5%. The conservation buffer was implemented in full from 1 January 2014 at which time Total Tier 1 capital increased to 8.5% and had to include 7% common equity. The RBNZ has the discretion to also apply a countercyclical buffer of common equity and has not specified any formal upper limit on this buffer. The RBNZ has not adopted the leverage ratio.
Financial Markets Conduct Act (FMCA) The FMCA overhauls the existing securities law regime in New Zealand and will impact various aspects of the wider Westpac New Zealand business. It introduces changes to product disclosure and governance together with new licensing and registration requirements as well as new fair dealing provisions. The existing prospectus/investment statement dual disclosure model will no longer apply. A single product disclosure statement is being implemented, supported by an online register of other material documentation. The FMCA was enacted in September 2013, however, most of its provisions are expected to come into force on 1 December 2014, albeit subject to transitional provisions. The majority of the new fair dealing requirements came into force in April 2014.
Credit law reform / responsible lending The Credit Contracts and Consumer Finance Amendment Act 2014 received Royal Assent in June 2014 and will come into full effect in June 2015. The Act reforms the entire suite of legislation that governs consumer credit contracts. It creates new responsible lending principles and provides for a regulatory responsible lending code. Existing consumer protections are also being strengthened by changing the current provisions on disclosure, fees, hardship and ‘oppressive’ contracts. Consultation on the responsible lending code and new regulations commenced in June 2014. The code is expected to be finalised in March 2015.
2014 Westpac Group Annual Report 21

Covered bond legislation The Reserve Bank of New Zealand (Covered Bonds) Amendment Bill was passed in December 2013. It provides a legislative framework for the issuance of covered bonds by New Zealand registered banks. New Zealand registered banks were already permitted by the RBNZ to issue covered bonds and have a condition of registration that covered bond issuance cannot exceed 10% of total assets. However, the legislation provides certainty for investors that the cover pool assets will be disgorged from statutory management and liquidation regimes. Covered bond programmes must be registered with the RBNZ under the legislation. The Westpac NZ Global Covered Bond Programme was registered on 4 April 2014.
Consumer law reform The Consumer Law Reform Bill was passed in December 2013. The Bill amended six separate Acts, including the Fair Trading Act. Among the amendments being introduced into the Fair Trading Act are prohibitions on unfair contract terms and on making unsubstantiated representations about a product or service and new provisions regulating uninvited direct sales. The unfair contract terms provisions come into force in March 2015 while the unsubstantiated representations prohibitions and uninvited direct sales provisions came into effect in June 2014.
Supervision and regulation Australia Within Australia we are subject to supervision and regulation by six principal agencies: APRA; the Reserve Bank of Australia (RBA); the Australian Securities and Investments Commission (ASIC); the Australian Securities Exchange (ASX); the Australian Competition and Consumer Commission (ACCC); and the Australian Transaction Reports and Analysis Centre (AUSTRAC). APRA is the prudential regulator of the Australian financial services industry. It oversees banks, credit unions, building societies, general insurance and re-insurance companies, friendly societies and most of the superannuation (pension) industry. APRA’s role includes establishing and enforcing prudential standards and practices designed to ensure that, under all reasonable circumstances, financial promises made by the institutions it supervises are met within a stable, efficient and competitive financial system. As an ADI, we report prudential information to APRA including information in relation to capital adequacy, large exposures, credit quality and liquidity. Our controlled entities in Australia that are authorised insurers and trustees of superannuation funds are also subject to the APRA regulatory regime. Reporting is supplemented by consultations, on-site inspections and targeted reviews. Our external auditors also have an obligation to report on compliance with certain statutory and regulatory banking requirements and on any matters that in their opinion may have the potential to materially prejudice the interests of depositors and other stakeholders. Australia’s risk-based capital adequacy guidelines are based on the approach agreed upon by the Basel Committee on Banking Supervision. National discretion is then applied to that approach which results in Australia’s capital requirements being more stringent. Refer to ‘Capital resources – Basel Capital Accord’ in Section 2.
The RBA is responsible for monetary policy, maintaining financial system stability and promoting the safety and efficiency of the payments system. The RBA is an active participant in the financial markets, manages Australia’s foreign reserves, issues Australian currency notes and serves as banker to the Australian Government. ASIC is the national regulator of Australian companies. Its primary responsibility is to regulate and enforce company, consumer credit, financial markets and financial services laws that protect consumers, investors and creditors. With respect to financial services, it promotes honesty and fairness by providing consumer protection, using regulatory powers to enforce laws relating to deposit-taking activities, general insurance, life insurance, superannuation, retirement savings accounts, securities (such as shares, debentures and managed investments) and futures contracts and financial advice. ASIC has responsibility for supervising trading on Australia’s domestic licensed markets and of trading participants. The ASX operates Australia’s primary national market for trading of securities issued by listed companies. Some of our securities (including our ordinary shares) are listed on the ASX and we therefore have obligations to comply with the ASX Listing Rules, which have statutory backing under the Corporations Act 2001. The ASX has responsibility for the oversight of listed entities under the ASX Listing Rules and for monitoring and enforcing compliance with the ASX Operating Rules by its market, clearing and settlement participants. The ACCC is an independent statutory authority responsible for the regulation and prohibition of anti-competitive and unfair market practices and mergers and acquisitions in Australia. Its broad objective is to administer the Competition and Consumer Act 2010 and related legislation to bring greater competitiveness, fair trading, consumer protection and product safety to the Australian economy. The ACCC’s role in consumer protection complements that of Australian state and territory consumer affairs agencies that administer the unfair trading legislation of their jurisdictions. The Australian Government’s present policy, known as the ‘four pillars policy’, is that there should be no fewer than four major banks to maintain appropriate levels of competition in the banking sector. Under the Financial Sector (Shareholding) Act 1998, the Australian Government’s Treasurer must approve an entity acquiring a stake of more than 15% in a financial sector company.
Proposals for foreign acquisitions of a stake in Australian banks are subject to the Australian Government’s foreign investment policy and, where required, approval by the Australian Government under the Australian Foreign Acquisitions and Takeovers Act 1975. For further details refer to ‘Limitations affecting security holders’ in Section 4.
AUSTRAC oversees the compliance of Australian reporting entities including Westpac, within the requirements under the Anti-Money Laundering and Counter-Terrorism Financing Act 2006 and the Financial Transaction Reports Act 1988.
22 2014 Westpac Group Annual Report

Information on Westpac These requirements include:
implementing programs for identifying and monitoring customers, and for managing the risks of money laundering and terrorism financing;
reporting suspicious matters, threshold transactions and international funds transfer instructions; and
submitting an annual compliance report.
AUSTRAC provides financial information to state, territory and Australian federal law enforcement, security, social justice and revenue agencies, and certain international counterparts.
New Zealand The RBNZ is responsible for supervising New Zealand registered banks. The New Zealand prudential supervision regime requires that registered banks publish quarterly disclosure statements, which contain information on financial performance and risk positions as well as attestations by the directors about the bank’s compliance with its conditions of registration and certain other matters.
United States Our New York branch is a US federally licensed branch and therefore is subject to supervision, examination and regulation by the US Office of the Comptroller of the Currency, and the Board of Governors of the Federal Reserve System (the US Federal Reserve) under the US International Banking Act of 1978 (IBA) and related regulations.
A US federal branch must maintain, with a US Federal Reserve member bank, a capital equivalency deposit as prescribed by the US Comptroller of the Currency, which is at least equal to 5% of its total liabilities (including acceptances, but excluding accrued expenses, and amounts due and other liabilities to other branches, agencies, and subsidiaries of the foreign bank).
In addition, a US federal branch is subject to periodic onsite examination by the US Comptroller of the Currency. Such examination may address risk management, operations, asset quality, compliance with the record-keeping and reporting, and any additional requirements prescribed by the US Comptroller of the Currency from time to time.
A US federal branch of a foreign bank is, by virtue of the IBA, subject to the receivership powers exercisable by the US Comptroller of the Currency.
We are not a Financial Holding Company as defined in the Gramm-Leach-Bliley Act of 1999.
Westpac and some of its affiliates are engaged in various activities that are subject to regulation by other US federal regulatory agencies including the US Securities & Exchange Commission and the CFTC.
Anti-money laundering regulation and related requirements Australia Westpac has a Group-wide program to manage its obligations under the Anti-Money Laundering and Counter-Terrorism Financing Act 2006. We continue to actively engage with the regulator, AUSTRAC, on our activities.
United States The USA PATRIOT Act of 2001 requires US financial institutions, including the US branches of foreign banks, to take certain steps to prevent, detect and report individuals and entities involved in international money laundering and the financing of terrorism. The required actions include verifying the identity of financial institutions and other customers and counterparties, terminating correspondent accounts for foreign ‘shell banks’ and obtaining information about the owners of foreign bank clients and the identity of the foreign bank’s agent for service of process in the US. The anti-money laundering compliance requirements of the USA PATRIOT Act include requirements to adopt and implement an effective anti-money laundering program, report suspicious transactions or activities, and implement due diligence procedures for correspondent and other customer accounts. Westpac’s New York branch and its other US operations maintain an anti-money laundering compliance program designed to address US legal requirements.
US economic and trade sanctions, as administered by the Office of Foreign Assets Control (OFAC), prohibit or significantly restrict US financial institutions, including the US branches and operations of foreign banks, and other US persons from doing business with certain persons, entities and jurisdictions. Westpac’s New York branch and its other US operations maintain compliance programs designed to comply with OFAC sanctions programs, and Westpac has a Group-wide program to ensure adequate compliance.
Significant contracts Westpac’s significant long-term contracts are summarised in Note 35 to the financial statements.
Legal proceedings Our entities are defendants from time-to-time in legal proceedings arising from the conduct of our business and material legal proceedings, if any, are described in Note 37 to the financial statements and under ‘Significant Developments’ above. As appropriate, a provision has been raised in respect of these proceedings and disclosed in the financial statements.
Principal office Our principal office is located at 275 Kent Street, Sydney, New South Wales, 2000, Australia. Our telephone number for calls within Australia is 132 032 and our international telephone number is (+61) 2 9293 9270.
2014 Westpac Group Annual Report 23

Corporate governance
Introduction This corporate governance statement, which has been approved by the Board, describes our corporate governance framework, policies and practices as at 3 November 2014.
Framework and approach Our approach to corporate governance is based on a set of values and behaviours that underpin day-to-day activities, provide transparency and fair dealing, and seek to protect stakeholder interests.
This approach includes a commitment to excellence in governance standards, which Westpac sees as fundamental to the sustainability of our business and our performance. It includes monitoring local and global developments in corporate governance and assessing their implications.
We have equity securities listed on securities exchanges in Australia, New Zealand and the United States.
Australia We comply with the ASX Corporate Governance Principles and Recommendations with 2010 amendments (ASXCGC Recommendations) published by the ASX Limited’s Corporate Governance Council (ASXCGC). We must also comply with the Corporations Act and as an ADI must comply with governance requirements prescribed by APRA under Prudential Standard CPS 510 (Governance).
This statement addresses each of the eight ASXCGC Recommendations with an explanation of our corporate governance practices, demonstrating our compliance with each Recommendation. A checklist summarising our compliance is included at the end of this statement.
Further details about the ASXCGC Recommendations can be found on the ASX Limited (ASX) website www.asx.com.au.
New Zealand Westpac also has ordinary shares quoted on the NZSX, which is the main board equity security market operated by NZX Limited (NZX). As an overseas listed issuer in New Zealand, we are deemed to satisfy and comply with the NZSX Listing Rules, provided that we remain listed on the ASX and comply with the ASX Listing Rules.
The ASX, through the ASXCGC Recommendations, and NZX, through the NZX Corporate Governance Best Practice Code, have adopted similar ‘comply or explain’ approaches to corporate governance. However, the ASXCGC Recommendations may materially differ from the corporate governance rules and the principles of NZX’s Corporate Governance Best Practice Code.
United States Westpac has American Depositary Shares (ADS) representing its ordinary shares quoted on the New York Stock Exchange (NYSE). Under the NYSE Listing Rules, foreign private issuers are permitted to follow home country practice in respect of corporate governance in lieu of the NYSE Listing Rules. However, we are still required to
comply with certain audit committee and additional notification requirements.
We comply in all material respects with all NYSE Listing Rules applicable to us.
Under the NYSE Listing Rules, foreign private issuers are required to disclose any significant ways in which their corporate governance practices differ from those followed by domestic US companies. We have compared our corporate governance practices to the corporate governance requirements of the NYSE Listing Rules and note the significant differences below.
The NYSE Listing Rules require that, subject to limited exceptions, shareholders be given the opportunity to vote on equity compensation plans and material revisions to those plans.
In Australia there are no laws or securities exchange listing rules that require shareholder approval of equity based incentive plans or individual grants under those plans (other than for Directors, including the Chief Executive Officer (CEO)).
Westpac’s employee equity plans have been disclosed in the Remuneration report in Section 9 of the Directors’ report, which is subject to a non-binding shareholder vote at the Annual General Meeting (AGM) and grants to our CEO are approved by shareholders. The details of all grants under our equity-based incentive plans have been disclosed in Note 25 of our financial statements for the year ended 30 September 2014.
The NYSE Listing Rules provide that the Board Nominations Committee’s responsibilities should include selecting, or recommending that the Board select, the Director nominees for the next annual meeting for shareholders, and overseeing the evaluation of the Board. The Board, rather than the Board Nominations Committee, reviews and recommends the Director nominees for election at the AGM and undertakes an annual review of its performance.
Websites This statement and a range of documents referred to in it are available on our corporate governance website at www.westpac.com.au/corpgov. This website contains copies and summaries of charters, principles and policies referred to in this statement.
Investor communications and information, including the Westpac Group Annual Report 2014, Annual Review and Sustainability Report 2014, investor discussion packs and presentations, can be accessed at www.westpac.com.au/investorcentre.
Information on our corporate responsibility and sustainability policies, practices and outcomes, including additional sustainability reporting and performance in external sustainability assessments, is available at www.westpac.com.au/corporateresponsibility.
24 2014 Westpac Group Annual Report
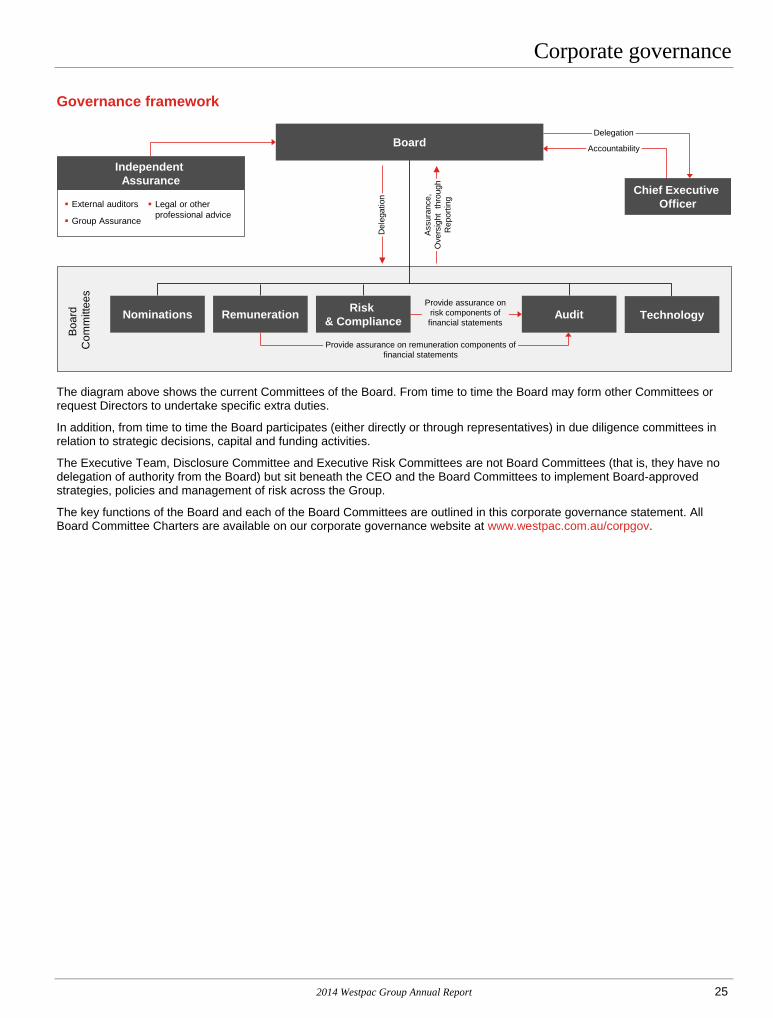
Corporate governance Governance framework
Boa
rd
Com
mitt
ees
Del
egat
ion
Ass
uran
ce,
Ove
rsig
ht t
hrou
ghR
epor
ting
Chief Executive Officer
Board
External auditors
Group Assurance
Independent Assurance
Legal or other professional advice
Accountability
Delegation
Provide assurance on risk components of financial statements
Nominations Risk & Compliance AuditRemuneration Technology
Provide assurance on remuneration components of financial statements
The diagram above shows the current Committees of the Board. From time to time the Board may form other Committees or request Directors to undertake specific extra duties.
In addition, from time to time the Board participates (either directly or through representatives) in due diligence committees in relation to strategic decisions, capital and funding activities.
The Executive Team, Disclosure Committee and Executive Risk Committees are not Board Committees (that is, they have no delegation of authority from the Board) but sit beneath the CEO and the Board Committees to implement Board-approved strategies, policies and management of risk across the Group.
The key functions of the Board and each of the Board Committees are outlined in this corporate governance statement. All Board Committee Charters are available on our corporate governance website at www.westpac.com.au/corpgov.
2014 Westpac Group Annual Report 25

Board, Committees and oversight of management Board of Directors Roles and responsibilities The Board Charter outlines the roles and responsibilities of the Board. Key responsibilities in summary are:
approving the strategic direction of Westpac Group;
evaluating Board performance and determining Board size and composition;
considering and approving the Westpac Board Renewal Policy;
appointing and determining the duration, remuneration and other terms of appointment of the CEO, Deputy CEO, Chief Financial Officer (CFO) and other Group Executives;
determining the remuneration of persons whose activities in the Board’s opinion affects the financial soundness of Westpac, any person specified by APRA, and any other person the Board determines;
evaluating the performance of the CEO;
succession planning for the Board, CEO and Group Executives;
approving the appointment of Group Executives, General Manager Group Assurance and Chief Compliance Officer & Group General Counsel and monitoring the performance of senior management;
approving the annual targets and financial statements and monitoring performance against forecast and prior periods;
determining our dividend policy;
determining our capital structure;
approving our risk management strategy and frameworks, and monitoring their effectiveness;
considering the social, ethical and environmental impact of our activities and monitoring compliance with our sustainability policies and practices;
monitoring Workplace Health and Safety (WHS) issues in Westpac Group and considering appropriate WHS reports and information;
maintaining an ongoing dialogue with Westpac’s auditors and, where appropriate, principal regulators; and
internal governance including delegated authorities, policies for appointments to our controlled entity Boards and monitoring resources available to senior executives.
Delegated authority The Constitution and the Board Charter enable the Board to delegate to Committees and management.
The roles and responsibilities delegated to the Board Committees are captured in the Charters of each of the five established Committees, namely:
Audit;
Risk & Compliance;
Nominations;
Remuneration; and
Technology.
The Board Charter, Board Committee Charters and the Constitution are available on our corporate governance website www.westpac.com.au/corpgov.
The Delegated Authority Policy Framework outlines principles to govern decision-making within the Westpac Group, including appropriate escalation and reporting to the Board. The Board has also delegated to the CEO, and through the CEO to other executives, responsibility for the day-to-day management of our business. The scope of, and limitations to, management delegated authority is clearly documented and covers areas such as operating and capital expenditure, funding and securitisation, and lending. These delegations balance effective oversight with appropriate empowerment and accountability of management.
Independence Together, the Board members have a broad range of relevant financial and other skills and knowledge, combined with the extensive experience necessary to guide our business. Details are set out in Section 1 of the Directors’ report.
All of our Non-executive Directors satisfy our criteria for independence, which align with the guidance provided in the ASXCGC Recommendations and the criteria applied by the NYSE and the US Securities and Exchange Commission (SEC).
The Board assesses the independence of our Directors on appointment and annually. Each Director provides an annual attestation of his or her interests and independence.
Directors are considered independent if they are independent of management and free from any business or other relationship that could materially interfere with, or reasonably be perceived to materially interfere with, the exercise of their unfettered and independent judgment. Materiality is assessed on a case by case basis by reference to each Director’s individual circumstances rather than by applying general materiality thresholds.
Each Director is expected to disclose any business or other relationship that he or she has directly, or as a partner, shareholder or officer of a company or other entity that has an interest in Westpac or a related entity. The Board considers information about any such interests or relationships, including any related financial or other details, when it assesses the Director’s independence.
26 2014 Westpac Group Annual Report

Corporate governance Size and membership of Board Committees as at 30 September 2014
Status
Board Audit Committee
Board Risk & Compliance Committee
Board Nominations Committee
Board Remuneration Committee
Board Technology Committee
Lindsay Maxsted
Chairman, Non-executive, Independent
Chair
Gail Kelly CEO, Executive
Elizabeth Bryan
Non-executive, Independent
Chair
Ewen Crouch Non-executive, Independent
Chair
Alison Deans Non-executive, Independent
Robert Elstone
Non-executive, Independent
Chair
Peter Hawkins
Non-executive, Independent
Chair
Peter Marriott Non-executive, Independent
Ann Pickard Non-executive, Independent
The charts below demonstrate that our Board comprises a majority of independent Directors and show the tenure of our current Non-executive Directors.
Length of tenure of Non-executive Directors Balance of Non-executive and Executive Directors
0–1 years11%
1–2 years22%
2–3 years22%
5–6 years11%
6–7 years22%
7–8 years11%
Independent Non-executive
Directors 78%
Independent Non-executive
Chairman 11%
Executive Director
11%
2014 Westpac Group Annual Report 27

Chairman The Board elects one of the independent Non-executive Directors as Chairman. Our current Chairman is Lindsay Maxsted, who became Chairman on 14 December 2011. The Chairman’s role includes:
providing effective leadership to the Board in relation to all Board matters;
guiding the agenda and conducting all Board meetings;
in conjunction with the Company Secretaries, arranging regular Board meetings throughout the year, confirming that minutes of meetings accurately record decisions taken and, where appropriate, the views of individual Directors;
overseeing the process for appraising Directors and the Board as a whole;
overseeing Board succession;
acting as a conduit between management and Board, and being the primary point of communication between the Board and CEO;
representing the views of the Board to the public; and
taking a leading role in creating and maintaining an effective corporate governance system.
CEO Our CEO is Gail Kelly. The CEO’s role includes:
leadership of the management team;
developing strategic objectives for the business; and
the day-to-day management of the Westpac Group’s operations.
Board meetings The Board had eight scheduled meetings for the financial year ended 30 September 2014, with additional meetings held as required. In July each year the Board discusses our strategic plan and approves our overall strategic direction. The Board also conducts a half year review of our strategy. The Board conducts workshops on specific subjects relevant to our business throughout the year. Board meetings are characterised by robust exchanges of views, with Directors bringing their experience and independent judgment to bear on the issues and decisions at hand.
Non-executive Directors regularly meet without management present, so that they can discuss issues appropriate to such a forum. In all other respects, senior executives are invited, where considered appropriate, to participate in Board meetings. They also are available to be contacted by Directors between meetings.
Meetings attended by Directors for the financial year ended 30 September 2014 are reported in Section 8 of the Directors’ report.
Nomination and appointment The Board Nominations Committee is responsible for:
developing and reviewing policies on Board composition, strategic function and size;
reviewing and making recommendations to the Board annually on diversity generally within the Westpac Group, measurable objectives for achieving diversity and progress in achieving those objectives;
planning succession of the Non-executive Directors; reviewing the process for the orientation and education of
new Directors and any continuing education for existing Directors;
reviewing eligibility criteria for the appointment of Directors;
recommending appointment of Directors to the Board; and
considering and recommending candidates for appointment to the Boards of relevant subsidiaries.
Westpac seeks to maintain a Board of Directors with a broad range of financial and other skills, experience and knowledge necessary to guide the business of the Westpac Group. Westpac seeks to maintain a diverse Board which at a minimum collectively has:
strategic capabilities and commercial acumen; an understanding of the financial services industry
(including wealth management) and global business perspectives;
accounting or related financial management qualifications and experience;
an understanding of risk management; an understanding the application of technology in large
complex businesses; a background in, or understanding of, customer insights
and customer strategy; knowledge of governance and compliance matters in
highly regulated listed entities; experience in people matters including workplace
cultures, morale, management development, succession and remuneration;
experience on the boards of other significant listed companies; and
an ability to contribute to gender diversity. The Board Nominations Committee considers and makes recommendations to the Board on candidates for appointment as Directors. Such recommendations pay particular attention to the mix of skills, experience, expertise, diversity and other qualities of existing Directors, and how the candidate’s attributes will balance and complement those qualities. External consultants are used to access a wide base of potential Directors.
Prior to a Director’s appointment or consideration for election or re-election by shareholders, Westpac conducts appropriate due diligence and provides shareholders with all material information relevant to a decision on whether or not to elect or re-elect a Director.
New Directors receive an induction pack which includes a letter of appointment setting out the expectations of the role, conditions of appointment including the expected term of appointment, and remuneration. This letter conforms to the ASXCGC Recommendations.
28 2014 Westpac Group Annual Report
Corporate governance Term of office The Board may appoint a new Director, either to fill a casual vacancy or as an addition to the existing Directors, provided the total number of Directors does not exceed fifteen Non-executive Directors and three Executive Directors. Except for the Managing Director, a Director appointed by the Board holds office only until the close of the next AGM but is eligible for election by shareholders at that meeting.
Our Constitution states that at each AGM, one-third of eligible Directors, and any other Director who has held office for three or more years since their last election, must retire. In determining the number of Directors to retire by rotation, no account is to be taken of Directors holding casual vacancy positions or of the CEO. The Directors to retire by rotation are those who have been the longest in office. A retiring Director holds office until the conclusion of the meeting at which he or she retires but is eligible for re-election by shareholders at that meeting.
The Board makes recommendations concerning the election or re-election of any Director by shareholders. In considering whether to support a candidate, the Board takes into account the results of the Board performance evaluation conducted during the year.
The Westpac Board Renewal Policy limits the maximum tenure of office that any Non-executive Director other than the Chairman may serve to nine years, from the date of first election by shareholders. The maximum tenure for the Chairman is twelve years (inclusive of any term as a Director prior to being elected as Chairman), from the date of first election by shareholders. The Board, on its initiative and on an exceptional basis, may exercise discretion to extend the maximum terms specified above where it considers that such an extension would benefit the Group. Such discretion will be exercised on an annual basis and the Director concerned will be required to stand for re-election annually.
Education On appointment, all Directors are offered an induction program appropriate to their experience to familiarise them with our business, strategy and any current issues before the Board. The induction program includes meetings with the Chairman, the CEO, the Board Committee Chairs and each Group Executive.
The Board encourages Directors to continue their education by participating in workshops held throughout the year, attending relevant site visits and undertaking relevant external education.
Access to information and advice All Directors have unrestricted access to company records and information, and receive regular detailed financial and operational reports from senior management. Each Director also enters into an access and indemnity agreement which, among other things, provides for access to documents for up to seven years after his or her retirement as a Director.
The Chairman and other Non-executive Directors regularly consult with the CEO, CFO and other senior executives, and may consult with, and request additional information from, any of our employees.
All Directors have access to advice from senior internal legal advisors including the Chief Compliance Officer & Group General Counsel.
In addition, the Board collectively, and all Directors individually, have the right to seek independent professional advice, at our expense, to help them carry out their responsibilities. While the Chairman’s prior approval is needed, it may not be unreasonably withheld.
Company Secretaries We have two Company Secretaries appointed by the Board. The Senior Company Secretary, who is also Legal Counsel to the Board, attends Board and Board Committee meetings and is responsible for providing Directors with advice on legal and corporate governance issues together with the Chief Compliance Officer & Group General Counsel. The Group Company Secretary attends Board and Board Committee meetings and is responsible for the operation of the secretariat function, including implementing our governance framework and, in conjunction with management, giving practical effect to the Board’s decisions. The Group Company Secretary is accountable to the Board through the Chairman, on all matters to do with the proper functioning of the Board.
Profiles of our Company Secretaries are set out in Section 1 of the Directors’ report.
Board Committees Composition and independence Board Committee members are chosen for the skills and experience they can contribute to the respective Board Committees and their qualifications are set out in Section 1 of the Directors’ report. The membership of each Board Committee is set out in the table entitled ‘Size and membership of Board Committees as at 30 September 2014’ in this Corporate Governance Statement. All of the Board Committees are comprised of independent Non-executive Directors. The CEO is also a member of the Board Technology Committee.
Operation and reporting Scheduled meetings of the Board Committees occur quarterly, with the exception of the Board Technology Committee which has scheduled meetings three times a year. Each member’s attendance at Board Committee meetings held during the financial year ended 30 September 2014 is reported in Section 8 of the Directors’ report. All Board Committees are able to meet more frequently as necessary. Each Board Committee is entitled to the resources and information it requires and has direct access to our employees and advisers. The CEO attends all Board Committee meetings, except where she has a material personal interest in a matter being considered. Senior executives and other selected employees are invited to attend Board Committee meetings as required. All Directors can receive all Board Committee papers and can attend any Board Committee meeting, provided there is no conflict of interest.
2014 Westpac Group Annual Report 29

Performance Board, Board Committees and Directors The Board undertakes ongoing self-assessment as well as commissioning an annual performance review by an independent consultant. The review process conducted in 2014 included an assessment of the performance of the Board, the Board Committees, and each Director with outputs collected, analysed and presented to the Board. The Board discussed the results and agreed follow up action on matters relating to Board composition, process and priorities. The Chairman also discusses the results with individual Directors and Board Committee Chairs. The full Board (excluding the Chairman) reviews the results of the performance review of the Chairman and results are then privately discussed by the Chairman of the Board Risk & Compliance Committee with the Chairman. Management The Board, in conjunction with its Board Remuneration Committee, is responsible for approving the performance objectives and measures for the CEO and other senior executives, and providing input into the evaluation of performance against these objectives. The Board Risk & Compliance Committee also refers to the Board Remuneration Committee any matters that come to its attention that are relevant with respect to remuneration policy or practices. Management performance evaluations for the financial year ended 30 September 2014 were conducted following the end of the financial year. There is a further discussion on performance objectives and performance achieved in the Remuneration report contained in the Directors’ report. All new senior executives are provided with extensive briefing on our strategies and operations, and the respective roles and responsibilities of the Board and senior management. Advisory Boards Westpac has established Advisory Boards for its operations in Asia and for each of BankSA and Bank of Melbourne, to advise management on the strategies and initiatives of those businesses within the overall Group strategy.
Responsibilities of the Advisory Boards include:
providing advice to management on management’s strategies and initiatives to continue to strengthen the position and identity of the business;
providing advice to management of the relevant business so as to promote and preserve its distinct position and identity and align business values with those of the relevant communities served;
considering and assessing reports provided by management on the health of the relevant business;
acting as ambassadors for the business, including through supporting community and major corporate promotional events to assist in building relationships with the bank’s customers, local communities and the business and government sector, and advising senior management on community matters relevant to the provision of financial services in the community it serves; and
alerting management to local market opportunities and issues of which Advisory Board members are aware that would enhance the provision of services to customers and potential customers and the position of the bank in its local communities.
Ethical and responsible decision-making Code of Conduct and Principles for Doing Business Our ‘Code of Conduct’ (Code) describes the standards of conduct expected of our people, both employees and contractors. The seven principles making up the Code are:
we act with honesty and integrity;
we comply with laws and with our policies;
we do the right thing by our customers;
we respect confidentiality and do not misuse information;
we value and maintain our professionalism;
we work as a team; and
we manage conflicts of interest responsibly.
The focus of each of the principles is to provide a set of guiding principles to help us make the right decisions ensuring we uphold the reputation of the Group. The Code has the full support of the Board and the Executive Team and we take compliance with the Code very seriously.
Our ‘Principles for Doing Business’ (Principles) underpin the Group’s commitment to sustainable business practice and community involvement. In summary:
we believe our success depends on the trust and confidence placed in us by our customers, people, shareholders, suppliers, advisers and the community;
we believe in maintaining the highest level of governance and ethical practice while protecting the interests of our stakeholders;
we believe in putting our customers at the centre of everything we do;
we believe our people are a crucial element of a successful service business;
we are committed to managing our direct and indirect impacts on the environment;
we believe being actively involved in our community is fundamental to the sustainability of our business; and
we believe our suppliers should be viewed as partners in our sustainability journey.
The Principles align with key global initiatives that promote responsible business practices. The Principles apply to all Directors, employees and contractors.
30 2014 Westpac Group Annual Report

Corporate governance We also have a range of internal guidelines, communications and training processes and tools, including an online learning module entitled ‘Doing the Right Thing’, which apply to and support both our Code and the Principles.
Key policies We have a number of key policies to manage our regulatory compliance and human resource requirements. We also voluntarily subscribe to a range of external industry codes, such as the Code of Banking Practice and the ePayments Code.
Code of Ethics for Senior Finance Officers The Code of Accounting Practice and Financial Reporting complements our own Code. The Code of Accounting Practice and Financial Reporting is designed to assist our CEO, CFO and other principal financial officers in applying the highest ethical standards to the performance of their duties and responsibilities with respect to accounting practice and financial reporting by requiring those officers to:
act honestly and ethically, particularly with respect to conflicts of interest;
provide full, fair, accurate and timely disclosure in reporting and other communications;
comply with applicable laws, rules and regulations;
promptly report violations of the Code; and
be accountable for adherence to the Code.
Conflicts of interest The Group has a detailed conflicts of interest framework, which includes a Group policy supported by specific divisional policies and guidelines aimed at identifying and managing actual, potential or apparent conflicts of interest.
The conflicts of interest framework includes a separate Westpac Group Gifts and Hospitality Policy. This Policy provides our employees with guidance to manage their obligations relating to the giving or receiving of gifts or hospitality.
The Board All Directors are required to disclose any actual, potential or apparent conflicts of interest upon appointment and are required to keep these disclosures to the Board up to date.
Any Director with a material personal interest in a matter being considered by the Board must declare their interest and, unless the Board resolves otherwise, may not be present during the boardroom discussions or vote on the relevant matter.
Our employees and contractors We expect our employees and contractors to:
have in place adequate arrangements for the management of actual, potential or apparent conflicts of interest;
obtain consent from senior management before accepting a directorship on the board of a non-Westpac Group company;
disclose any material interests they have with our customers or suppliers to their manager and not be involved with customer relationships where they have such an interest;
not participate in business activities outside their employment with us (whether as a principal, partner, director, agent, guarantor, investor or employee) without approval or when it could adversely affect their ability to carry out their duties and responsibilities; and
not solicit, provide facilitation payments, accept or offer money, gifts, favours or entertainment which might influence, or might appear to influence, their business judgment.
Fit and Proper Person assessments We have a Board approved Westpac Group Statutory Officers Fit and Proper Policy that meets the requirements of the related APRA Prudential Standards. In accordance with that Policy, we assess the fitness and propriety of our Directors and also of employees who perform specified statutory roles required by APRA Prudential Standards or ASIC licensing requirements. The Chairman of the Board (and in the case of the Chairman, the Board) is responsible for assessing the Board Directors, Non-executive Directors on subsidiary Boards, Group Executives, external auditors and actuaries. An executive Fit and Proper Committee is responsible under delegated authority of the Westpac Board for undertaking assessments of all other employees who hold statutory roles. In all cases the individual is asked to provide a detailed declaration, and background checks are completed.
Concern reporting and whistleblower protection Under the Westpac Group Whistleblower Protection Policy, our employees and contractors are encouraged to raise any concerns about activities or behaviour that may be unlawful or unethical. The Policy outlines all reporting channels, including our concern reporting system ‘Concern Online’, which enables reporting on an anonymous basis. Concerns may include suspected breaches of our Code, Westpac Policies or regulatory requirements.
Employees who raise concerns may choose to involve the Whistleblower Protection Officer, who is responsible for protecting the employee against victimisation as a result of making a report.
We investigate reported concerns in a manner that is fair and objective to all people involved. If the investigation shows that wrongdoing has occurred, we are committed to changing our processes and taking action in relation to employees or contractors who have behaved incorrectly. Outcomes may also involve reporting the matter to relevant authorities and regulators.
Statistics about concerns raised are reported quarterly to both the Board Risk & Compliance Committee and the Westpac Group Executive Risk Committee.
2014 Westpac Group Annual Report 31

Securities trading Under the Westpac Group Securities Trading Policy, Directors, employees and contractors are restricted from dealing in any securities and other financial products if they possess inside information. They are also prohibited from passing on inside information to others who may use that information to trade in securities. In addition, Directors and any employees or contractors who, because of their seniority or the nature of their position, may have access to material non-public information about Westpac (known as Prescribed Employees) are subject to further restrictions, including prohibitions on trading prior to and immediately following annual and half year results announcements.
We manage and monitor these obligations through:
the insider trading provisions of our Policy, which prohibit any dealing in any securities where a Director or employee has access to inside information that may affect the price of those securities;
placing limitations upon Directors, employees and contractors participating in a new product issue where their position puts them in an actual, potential or apparent position of conflict of interest;
restrictions limiting the periods in which the Directors and Prescribed Employees can trade in our shares or other company securities (Blackout Periods);
requiring Directors and Prescribed Employees to notify their intention to trade outside Blackout Periods and confirm that they have no inside information;
monitoring the trading of Westpac securities by Directors and Prescribed Employees;
maintaining a register of Prescribed Employees, which is regularly updated;
notifying ASX of trades by Directors of Westpac securities as required under the ASX Listing Rules; and
forbidding employees from entering into hedging arrangements in relation to their unvested employee shares or securities, whether directly or indirectly.
Diversity Westpac Group has a Group Diversity Policy that sets out the diversity initiatives for the Westpac Group. In this context, diversity covers gender, age, ethnicity, accessibility, flexibility, cultural background, sexual orientation and religious beliefs.
The objectives of the policy are to ensure that the Westpac Group:
has a workforce profile that delivers competitive advantage through the ability to garner a deep understanding of customer needs;
has a truly inclusive workplace where every individual can shine regardless of gender, cultural identity, age, work style or approach;
leverages the value of diversity for all our stakeholders to deliver the best customer experience, improved financial performance and a stronger corporate reputation; and
continues to take a leadership position on diversity practices and setting the agenda in the external community.
To achieve these objectives the Westpac Group:
has set Board determined, measurable objectives for achieving gender diversity. The Board assesses annually both the objectives and progress in achieving them;
assesses pay equity on an annual basis;
encourages and supports the application of flexibility policies into practice across the business;
is committed to proactively assisting Indigenous Australians to access employment across our brands;
implements our Accessibility Action Plan for employees and customers with a disability, including ensuring employment opportunities are accessible for people with disabilities; and
actively promotes an environment of inclusion for lesbian, gay, bisexual, transgender and intersex (LGBTI) employees.
The implementation of these objectives is overseen by the Westpac Group Diversity Council chaired by the CEO.
The Board, or an appropriate Board Committee, will receive regular updates from the Westpac Group Diversity Council on these diversity initiatives.
We will also continue to listen to the needs of our employees through the engagement of our employee action groups, our employee surveys and bi-annual diversity focused surveys. In October 2010, the Board set a measurable objective to increase the proportion of women in leadership roles (over 5,000 leaders from our Executive Team through to our bank managers) from 33% to 40% by 2014, which was achieved in September 2012, two years ahead of schedule.
At 30 September 2014, the proportion of women employed by Westpac Group was as follows:
Board of Directors: 44%;
leadership1 roles: 44%; and
total Westpac workforce: 59%.
1 Women in leadership refers to the proportion of women (permanent and maximum term) in people leadership roles or senior roles of influence as a proportion of all leaders across the Group. It includes the CEO, Executive Team, General Managers, Senior Managers as direct reports to General Managers and the next two levels of management. Excludes Westpac Pacific.
32 2014 Westpac Group Annual Report

Corporate governance Sustainability We view sustainable and responsible business practices as important for our business and shareholder value. This means conducting our business in a responsible, trustworthy and ethical manner, while accepting accountability for our impacts on society and the environment. We are committed to transparency and fair dealing, treating employees and customers responsibly, and having solid links with the community.
Our management and reporting of sustainability aim to address the issues that we believe are the most material for our business and stakeholders, now and in the future. We understand that this is an evolving agenda and seek to progressively embed the management of sustainability issues into business as usual practice, while also anticipating and shaping emerging social issues where we have the skills and experience to make a meaningful difference and drive business value.
Reporting We report on our performance against the objectives and targets in our public sustainability strategy in the Annual Review and Sustainability Report, the Annual Report and the full year and half year ASX results. We also provide additional detailed information on our website.
Our sustainability reporting is subject to independent limited assurance, performed in accordance with the Australian Standard on Assurance Engagements 3000 (revised) Assurance Engagements Other Than Audits or Reviews of Historical Financial Information (‘ASAE 3000’). The AA1000 Principles Standard and the Global Reporting Initiative G4 Guidelines are also used by the assurance provider as criteria against which to assess disclosures associated with alignment to the AA1000 Principles and GRI G4.
The assurance process not only tests the integrity of the data, but also tests the effectiveness of our underlying systems and processes, and the extent to which corporate responsibility and sustainability policies and processes are embedded across our organisation. In addition, we actively participate in independent external assessments by sustainability and governance rating organisations which benchmark us against global standards of governance.
Financial reporting Approach to financial reporting Our approach to financial reporting reflects three core principles:
that our financial reports present a true and fair view;
that our accounting methods comply with applicable accounting standards and policies; and
that our external auditor is independent and serves security holders’ interests.
The Board, through the Board Audit Committee, monitors Australian and international developments relevant to these principles, and reviews our practices accordingly.
The Board delegates oversight responsibility for risk management between the Board Audit Committee and the Board Risk & Compliance Committee. Similarly, the Board delegates oversight responsibility for the preparation of remuneration reports and disclosures to the Board Remuneration Committee.
Board Audit Committee As detailed in its charter, the Board Audit Committee has oversight of:
the integrity of the financial statements and financial reporting systems;
the external audit engagement, including the external auditor’s qualifications, performance, independence and fees;
performance of the internal audit function; financial reporting and compliance with prudential
regulatory reporting. With reference to the Board Risk & Compliance Committee, this includes an oversight of regulatory and statutory reporting requirements; and
procedures for the receipt, retention and treatment of financial complaints, including accounting, internal controls or auditing matters, and the confidential reporting by employees of concerns regarding accounting or auditing matters.
The Board Audit Committee reviews, discusses with management and the external auditor, and assesses:
any significant financial reporting issues and judgments made in connection with the preparation of the financial reports;
the processes used to monitor and comply with laws, regulations and other requirements relating to external reporting of financial and non-financial information;
the major financial risk exposures; and the process surrounding the disclosures made by the
CEO and CFO in connection with their personal certifications of the annual financial statements.
As part of its oversight responsibilities, the Board Audit Committee also conducts discussions with a wide range of internal and external stakeholders including:
the Board Risk & Compliance Committee, CFO, Chief Risk Officer (CRO), General Manager Group Assurance, management and the external auditor, about our major financial risk exposures and the steps management has taken to monitor and control such exposures;
the General Manager Group Assurance and external auditor concerning their audit and any significant findings, and the adequacy of management’s responses;
management and the external auditor concerning the half year and annual financial statements;
management and the external auditor regarding any correspondence with regulators or government agencies, and reports that raise issues of a material nature; and
the Chief Operating Officer and the Chief Compliance Officer & Group General Counsel regarding any legal matters that may have a material impact on, or require disclosure in, the financial statements.
2014 Westpac Group Annual Report 33

Periodically, the Board Audit Committee consults with the external auditor without the presence of management about internal controls over financial information, reporting and disclosure and the fullness and accuracy of Westpac’s financial statements. The Board Audit Committee also meets with the General Manager Group Assurance without management being present.
Financial knowledge The Board Audit Committee comprises four independent, Non-executive Directors and is chaired by Robert Elstone.
All Board Audit Committee members have appropriate financial experience, an understanding of the financial services industry and satisfy the independence requirements under the ASXCGC Recommendations, the United States Securities Exchange Act of 1934 (as amended) and its related rules, and the NYSE Listing Rules.
The Board has determined that Lindsay Maxsted, member of the Board Audit Committee, is an ‘audit committee financial expert’ and independent in accordance with US securities law.
The designation of Lindsay Maxsted as an audit committee financial expert does not impose duties, obligations or liability on him that are greater than those imposed on him as a Board Audit Committee member, and does not affect the duties, obligations or liability of any other Board Audit Committee member or Board member. Audit committee financial experts are not deemed as an ‘expert’ for any other purpose.
External auditor The role of the external auditor is to provide an independent opinion that our financial reports are true and fair, and comply with applicable regulations.
Our external auditor is PricewaterhouseCoopers (PwC), appointed by shareholders at the 2002 AGM. Our present PwC lead audit partner is Michael Codling and the review audit partner is Matthew Lunn. Michael Codling and Matthew Lunn assumed responsibility for these roles in December 2011 and December 2012 respectively.
The external auditor receives all Board Audit Committee and Board Risk & Compliance Committee papers, attends all meetings of both committees and is available to Committee members at any time. The external auditor also attends the Annual General Meeting (AGM) to answer questions from shareholders regarding the conduct of its audit, the audit report and financial statements and its independence.
As our external auditor, PwC is required to confirm its independence and compliance with specified independence standards on a quarterly basis.
The roles of lead audit partner and review audit partner must be rotated every five years and cannot be resumed by the same person for a minimum of five years.
We strictly govern our relationship with the external auditor, including restrictions on employment, business relationships, financial interests and use of our financial products by the external auditor.
Engagement of the external auditor To avoid possible independence or conflict issues, the external auditor is not permitted to carry out certain types of non-audit services for Westpac and may be limited as to the extent to which it can perform other non-audit services as specified in our ‘Pre-approval of engagement of PwC for audit and non-audit services’ (Guidelines). Use of the external audit firm for any non-audit services must be assessed and approved in accordance with the pre-approval process determined by the Board Audit Committee and set out in the Guidelines.
The breakdown of the aggregate fees billed by the external auditor in respect of each of the two most recent financial years for audit, audit-related, tax and other services is provided in Note 34 to our financial statements for the year ended 30 September 2014. A declaration regarding the Board’s satisfaction that the provision of non-audit services by PwC is compatible with the general standards of auditor independence is provided in Section 10 of the Directors’ report.
Group Assurance (internal audit) Group Assurance is Westpac’s internal audit function providing the Board and Executive Management with an independent and objective evaluation of the adequacy and effectiveness of management’s control over risk. Group Assurance covers the governance, risk management and internal control frameworks of Westpac and our wholly owned subsidiaries. It has access to all of our entities, and conducts audits and reviews following a risk-based planning approach, the outline for which has been approved by the Board Audit Committee.
Group Assurance provides regular reports to the Board Audit Committee and, as deemed appropriate, the Board Risk & Compliance Committee, and raises any significant issues with those Committees. The General Manager Group Assurance operates under a Group Assurance charter approved by the Board Audit Committee and has a direct reporting line to the Chairman of that Committee.
Market disclosure We maintain a level of disclosure that seeks to provide all investors with equal, timely, balanced and meaningful information. Consistent with these standards the Westpac Group maintains a Board approved Market Disclosure Policy, which governs how we communicate with our shareholders and the investment community.
The policy reflects the requirements of the ASX, NZX and other offshore stock exchanges where we have disclosure obligations, as well as relevant securities and corporations legislation. Under our policy, information that a reasonable person would expect to have a material effect on the price or value of our securities must first be disclosed via the ASX unless an exception applies under regulatory requirements.
34 2014 Westpac Group Annual Report

Corporate governance Our Disclosure Committee is responsible for determining what information should be disclosed publicly under the policy, and for assisting employees in understanding what information may require disclosure to the market on the basis that it is price sensitive. The Disclosure Committee is comprised of the CEO, the Executive Team, the Chief Compliance Officer & Group General Counsel and the General Manager, Corporate Affairs and Sustainability.
The Chief Operating Officer is the Disclosure Officer. The Disclosure Officer is ultimately responsible for all communication with relevant stock exchanges and notifying regulators in any jurisdiction as a result of market disclosure.
Once relevant information is disclosed to the market and available to investors, it is also published on our website. This includes investor discussion packs, presentations on and explanations about our financial results. Our website information also includes Annual Review and Sustainability Reports, Annual Reports, results announcements, CEO and executive briefings (including webcasts, recordings or transcripts of all major events), notices of meetings and key media releases.
Shareholder communication and participation We seek to keep our shareholders fully informed through a variety of communication mediums. These are regularly reviewed to improve our communications and utilise new technologies. These approaches include:
direct communications with shareholders via mail and email;
the publication of all relevant company information in the Investor Centre section of our website; and
access to all major market briefings and shareholder meetings via webcasts.
Shareholders are provided with advance notice of all major market briefings and shareholder meetings, through ASX announcements and/or the publication of an investor calendar of events on our website.
Shareholders are given the option to receive information in print or electronic format.
We regard the AGM as an important opportunity for engaging and communicating with shareholders. Shareholders are encouraged to attend and actively participate in our AGM, which is webcast and can also be viewed at a later time from our website. Shareholders who are unable to attend the AGM are able to lodge their proxies through a number of channels, including via the internet. At the time of receiving the Notice of Meeting, shareholders are also invited to put forward questions they would like addressed at the AGM.
CEO and CFO assurance The Board receives regular reports from management about our financial condition and operational results, as well as that of our controlled entities. The CEO and the CFO annually provide formal statements to the Board, and have done so for the financial year ended 30 September 2014, that state that in all material respects:
Westpac’s financial records for the financial year have been properly maintained in that they:
– correctly record and explain its transactions, and financial position and performance;
– enable true and fair financial statements to be prepared and audited; and
– are retained for seven years after the transactions covered by the records are completed;
the financial statements and notes required by the accounting standards for the financial year comply with the accounting standards;
the financial statements and notes for the financial year give a true and fair view of Westpac’s and its consolidated entities’ financial position and of their performance;
any other matters that are prescribed by the Corporations Act and regulations as they relate to the financial statements and notes for the financial year are satisfied; and
the declarations provided in accordance with section 295A of the Corporations Act are founded on a sound system of risk management and internal control, and that the system is operating effectively in all material respects in relation to financial reporting risks.
Risk management Roles and responsibilities The Board is responsible for reviewing and approving our overall risk management strategy, including determining our appetite for risk. The Board has delegated to the Board Risk & Compliance Committee responsibility for providing recommendations to the Board on Westpac Group’s risk-reward strategy, setting risk appetite, approving frameworks, policies and processes for managing risk, and determining whether to accept risks beyond management’s approval discretion.
The Board Risk & Compliance Committee conducts an annual review of the risk management strategy and this review was completed during the year ended 30 September 2014.
The Board Risk & Compliance Committee monitors the alignment of our risk profile with our risk appetite, which is defined in the Board Statement of Risk Appetite, and with our current and future capital requirements. The Board Risk & Compliance Committee receives regular reports from management on the effectiveness of our management of Westpac’s material business risks. More detail about the role of the Board Risk & Compliance Committee is set out later in this section under ‘Board Risk & Compliance Committee’.
2014 Westpac Group Annual Report 35
The CEO and Executive Team are responsible for implementing our risk management strategy and frameworks, and for developing policies, controls, processes and procedures for identifying and managing risk in all of Westpac’s activities.
Westpac manages the risks that affect our business as they influence our performance, reputation and future success. Effective risk management involves taking an integrated approach to risk and reward, and enables us to both increase financial growth opportunities and mitigate potential loss or damage. We adopt a Three Lines of Defence approach to risk management which reflects our culture of ‘risk is everyone’s business’ and that all employees are responsible for identifying and managing risk and operating within the Group’s desired risk profile. Westpac’s Risk Management Strategy identifies risk culture as an essential element of risk management. We embed risk culture and maintain an awareness of risk management responsibilities through regular communication, training and other targeted approaches that support our risk management framework.
The 1st Line of Defence – Risk identification, risk management and self-assurance Divisional business units are responsible for identifying, evaluating and managing the risks that they originate within approved risk appetite and policies. They are required to establish and maintain appropriate risk management controls, resources and self-assurance processes.
The 2nd Line of Defence – Establishment of risk management frameworks and policies and risk management oversight Our 2nd Line of Defence is a separate risk advisory, control and monitoring function which establishes frameworks, policies, limits and processes for the management, monitoring and reporting of risk. It also evaluates and opines on the adequacy and effectiveness of 1st Line controls and application of frameworks and policies and, where necessary, requires improvement and monitors the 1st Line’s progress toward remediation of identified deficiencies.
Our 2nd Line of Defence has three layers:
our executive risk committees lead the optimisation of risk-reward by overseeing the development of risk appetite statements, risk management frameworks, policies and risk concentration controls, and monitoring Westpac’s risk profile for alignment with approved appetites and strategies;
our Group Risk function is independent from the business divisions, reports to the CRO, and establishes and maintains the Group-wide risk management frameworks, policies and concentration limits that are approved by the Board Risk & Compliance Committee. It also reports on Westpac’s risk profile to executive risk committees and the Board Risk & Compliance Committee; and
divisional risk areas are responsible for developing division-specific risk appetite statements, policies, controls, procedures, monitoring and reporting capability, which align to the Board’s Statement of Risk Appetite and the risk management frameworks approved by the Board Risk & Compliance Committee. These risk areas are independent of the Divisions’ 1st Line business areas, with each divisional CRO having a direct reporting line to the CRO, as well as to their Division’s Group Executive.
The 3rd Line of Defence – Independent assurance Our Group Assurance function independently evaluates the adequacy and effectiveness of the Group’s overall risk management framework and controls.
Our overall risk management approach is summarised in the following diagram:
Group Risk
2nd LINE
Divisional Risk
Risk Committees
BOARD
Risk acceptanceand monitoring
Business units(Risk origination within risk appetite)
Group-widepolicies andstandards
Risk reporting
Risk identification, evaluation and management
Divisionalrisk appetiteand policies
Riskappetite andframeworks
1st LINE
3rd LINEIndependentassurance
Our overall risk management governance structure is set out in more detail in the table ‘Risk Management Governance Structure’ included in this statement.
We distinguish five main types of risk:
credit risk – the risk of financial loss where a customer or counterparty fails to meet their financial obligations to Westpac;
liquidity risk – the risk that the Group will be unable to fund assets and meet obligations as they become due;
market risk – the risk of an adverse impact on earnings resulting from changes in market factors, such as foreign exchange rates, interest rates, commodity prices and equity prices. This includes interest rate risk in the banking book – the risk to interest income from a mismatch between the duration of assets and liabilities that arises in the normal course of business activities;
operational risk – the risk of loss resulting from inadequate or failed internal processes, people and systems or from external events. The definition is aligned to the regulatory (Basel II) definition, including legal and regulatory risk but excluding strategic and reputation risk; and
compliance risk – the risk of legal or regulatory sanction, financial or reputation loss, arising from our failure to abide by the compliance obligations required of us.
36 2014 Westpac Group Annual Report

Corporate governance In addition to, and linked to, these five main types of risk, we also manage the following risks:
business risk – the risk associated with the vulnerability of a line of business to changes in the business environment;
environmental, social and governance risks – the risk that the Group damages its reputation or financial performance due to failure to recognise or address material existing or emerging sustainability related environmental, social or governance issues;
equity risk – the potential for financial loss arising from movements in equity values. Equity risk may be direct, indirect or contingent;
insurance risk – the risk of mis-estimation of the expected cost of insured events, volatility in the number or severity of insured events, and mis-estimation of the cost of incurred claims;
related entity (contagion) risk – the risk that problems arising in other Westpac Group members compromise the financial and operational position of the authorised deposit-taking institutions in the Westpac Group; and
reputation risk – the risk to earnings or capital arising from negative public opinion resulting from the loss of reputation or public trust and standing.
Westpac has received advanced accreditation from APRA and the RBNZ under the Basel II capital framework, and uses the Advanced Internal Ratings Based (AIRB) approach for credit risk and the Advanced Measurement Approach (AMA) for operational risk when calculating regulatory capital.
Board Risk & Compliance Committee The Board Risk & Compliance Committee comprises all of Westpac’s independent, Non-executive Directors and is chaired by Elizabeth Bryan.
As set out in its charter, the Board Risk & Compliance Committee:
provides recommendations to the Board on Westpac Group’s risk-reward strategy;
sets risk appetite;
reviews and approves the frameworks for managing risk, including capital, credit, liquidity, market, operational, compliance and reputation risk;
reviews and approves the limits and conditions that apply to credit risk approval authority delegated to the CEO, CFO and CRO and any other officers of the Westpac Group to whom the Board has delegated credit approval authority;
monitors the risk profile, performance, capital levels, exposures against limits and the management and control of our risks;
monitors changes anticipated in the economic and business environment and other factors considered relevant to our risk profile and risk appetite;
oversees the development and ongoing review of key policies that support our frameworks for managing risk; and
may approve accepting risks beyond management’s approval discretion.
From the perspective of specific types of risk, the Board Risk & Compliance Committee role includes:
credit risk – approving key policies and limits supporting the Credit Risk Management Framework, and monitoring the risk profile, performance and management of our credit portfolio;
liquidity risk – approving key policies and limits supporting the Liquidity Risk Management Framework, including our annual funding strategy and liquidity requirements, and recovery and resolutions plans and monitoring the liquidity risk profile;
market risk – approving key policies and limits supporting the Market Risk Management Framework, including, but not limited to, the Value at Risk and Net Interest Income at Risk limits, and monitoring the market risk profile;
operational risk – monitoring the operational risk profile, the performance of operational risk management and controls, and the development and ongoing review of operational risk policies supporting the Operational Risk Management Framework;
reputation risk – reviewing and approving the Reputation Risk Management Framework and reviewing the monitoring of the performance of reputation risk management and controls; and
compliance risk – reviewing compliance processes and our compliance with applicable laws, regulations and regulatory requirements, discussing with management and the external auditor any material correspondence with regulators or government agencies and any published reports that raise material issues, and reviewing complaints and whistleblower concerns.
The Board Risk & Compliance Committee also:
approves the Internal Capital Adequacy Assessment Process and in doing so reviews the outcomes of enterprise wide stress testing, sets the preferred capital ranges for regulatory capital having regard to Westpac internal economic capital measures, and reviews and monitors capital levels for consistency with the Westpac Group’s risk appetite;
provides relevant periodic assurances and disclosures to the Board Audit Committee regarding the operational integrity of the risk management framework; and
refers to other Board Committees any matters that come to the attention of the Board Risk & Compliance Committee that are relevant for those respective Board Committees.
2014 Westpac Group Annual Report 37

Compliance Management Framework The Group’s Compliance Management Framework sets out our approach to managing compliance and mitigating compliance risk, in order to achieve our compliance objectives. To proactively manage our compliance risks, we must:
comply with both the letter and ‘spirit’ of the law while being attentive to the needs of our clients;
embed the requirements of our regulators into how we do business, how we conduct ourselves and how our systems and processes are designed and operate; and
maintain a compliance culture where everyone in every part of the Westpac Group has responsibility for compliance.
The mechanisms we use to implement our approach include:
maintaining a strong governance environment;
identifying obligations, developing and maintaining Compliance Plans and implementing change;
developing, implementing and testing compliance controls; and
monitoring and reporting incidents, issues and risks.
As with other forms of risk, business line management is primarily responsible for managing compliance. This is supported by a dedicated Compliance function covering the Group and each area of the business. The Compliance function reports to the Chief Compliance Officer & Group General Counsel.
Regular reports are provided to the Westpac Group Executive Risk Committee and the Board Risk & Compliance Committee on the status of compliance across the Group.
Remuneration The Board Remuneration Committee assists the Board by ensuring that Westpac has coherent remuneration policies and practices that fairly and responsibly reward individuals having regard to performance, Westpac’s risk management framework, the law and the highest standards of governance.
The Board Remuneration Committee has been in place for the whole of the financial year and is comprised of four independent Non-executive Directors and is chaired by Ewen Crouch. All members of the Board Remuneration Committee are also members of the Board Risk & Compliance Committee, which assists in the integration of effective risk management into the remuneration framework.
As set out in its charter, the Board Remuneration Committee:
reviews and makes recommendations to the Board in relation to the Westpac Group Remuneration Policy (Group Remuneration Policy) and assesses the Group Remuneration Policy’s effectiveness and its compliance with prudential standards;
reviews and makes recommendations to the Board in relation to the individual remuneration levels of the CEO, Non-executive Directors, Group Executives, other Executives who report directly to the CEO, other persons whose activities in the Board’s opinion affect the financial soundness of Westpac, any person specified by APRA, and any other person the Board determines;
reviews and makes recommendations to the Board in relation to the remuneration structures for each category of persons covered by the Group Remuneration Policy;
reviews and makes recommendations to the Board on corporate goals and objectives relevant to the remuneration of the CEO, and the performance of the CEO in light of these objectives;
reviews and makes recommendations to the Board on the short-term and long-term incentive plans for Group Executives;
reviews and makes recommendations to the Board in relation to approving equity based remuneration plans; and
oversees general remuneration practices across the Group.
The Board Remuneration Committee reviews and recommends to the Board the size of variable reward pools each year based on consideration of pre-determined business performance indicators and the financial soundness of Westpac. The Board Remuneration Committee also approves remuneration arrangements outside of the Group Remuneration Policy relating to individuals or groups of individuals which are significant because of their sensitivity, precedent or disclosure implications. In addition, the Board Remuneration Committee considers and evaluates the performance of senior executives when making remuneration determinations and otherwise as required.
The Board Remuneration Committee also reviews and makes recommendations to the Board for the reduction or lapsing of incentive based equity grants to employees, where subsequent information or circumstances indicate that the grant was not justified.
Independent remuneration consultants are engaged by the Board Remuneration Committee to provide information across a range of issues including remuneration benchmarking, market practices and emerging trends and regulatory reforms.
Further details of our remuneration framework are included in the Remuneration report which is in Section 9 of the Directors’ report. The Board Remuneration Committee reviews and recommends the report for approval.
38 2014 Westpac Group Annual Report

Corporate governance Risk Management Governance Structure Westpac’s risk management governance structure is set out in the table below:
Board
reviews and approves our overall risk management strategy.
Board Risk & Compliance Committee (BRCC)
provides recommendations to the Board on the Westpac Group’s risk-reward strategy; sets risk appetite; approves frameworks and key policies for managing risk; monitors our risk profile, performance, capital levels, exposures against limits and management and control of our risks; monitors changes anticipated in the economic and business environment and other factors relevant to our risk profile; oversees the development and ongoing review of key policies that support our frameworks for managing risk; and determines whether to accept risks beyond the approval discretion provided to management.
Other Board Committees with a risk focus
Board Audit Committee oversees the integrity of financial statements and financial reporting systems, and matters relating to taxation risks. Board Remuneration Committee reviews any matters raised by the BRCC with respect to risk-adjusted remuneration. Board Technology Committee oversees the technology strategy, implementation, and risks associated with major technology programs.
Executive team
executes the Board-approved strategy; assists with the development of the Board Statement of Risk Appetite; delivers the Group’s various strategic and performance goals within the approved risk appetite; and monitors key risks within each business unit, capital adequacy and the Group’s reputation.
Executive risk committees
Westpac Group Executive Risk Committee leads the optimisation of credit, operational, compliance, and market risk-reward across the Group; oversees the embedding of the Risk Management Strategy in the Group’s approach to risk governance; oversees risk-related management frameworks and key supporting policies; oversees the Group’s credit, operational, compliance, and market risk profiles; oversees reputation risk and Environmental, Social and Governance (ESG) risk management frameworks and key
supporting policies; and identifies emerging credit, operational, compliance and market risks and allocates responsibility for assessing impacts and
implementing appropriate actions to address these. Westpac Group Asset & Liability Committee leads the optimisation of funding and liquidity risk-reward across the Group; reviews the level and quality of capital to ensure that it is commensurate with the Group’s risk profile, business strategy and
risk appetite; oversees the Liquidity Risk Management Framework and key policies; oversees the funding and liquidity risk profile and balance sheet risk profile; and identifies emerging funding and liquidity risks and appropriate actions to address these.
2014 Westpac Group Annual Report 39

Risk Management Governance Structure (continued)
Executive risk committees (continued)
Westpac Group Remuneration Oversight Committee provides assurance that the remuneration arrangements across the Group have been examined from a People, Risk and
Finance perspective; responsible for ensuring that risk is embedded in all key steps in our remuneration framework; reviews and makes recommendations to the CEO for recommendation to the Board Remuneration Committee on the
Group Remuneration Policy and provides assurance that remuneration arrangements across the Group encourage behaviour that supports Westpac’s long-term financial soundness and the risk management framework;
reviews and monitors the remuneration arrangements (other than for Group Executives) for Responsible Persons (as defined in the Group’s Statutory Officers Fit and Proper Policy), risk and financial control personnel, and all other employees for whom a significant portion of total remuneration is based on performance and whose activities, either individually or collectively, may affect the financial soundness of Westpac; and
reviews and recommends to the CEO for recommendation to the Board Remuneration Committee the criteria and rationale for determining the total quantum of the Group variable reward pool.
Group and divisional risk management
Group Risk develops the Group-level risk management frameworks for approval by the BRCC; directs the review and development of key policies supporting the risk management frameworks; establishes risk concentration limits and monitors risk concentrations; and monitors emerging risk issues. Compliance Function develops the Group-level compliance framework for approval by the BRCC; directs the review and development of compliance policies, compliance plans, controls and procedures; monitors compliance and regulatory obligations and emerging regulatory developments; and reports on compliance standards. Divisional risk management develops division-specific policies, risk appetite statements, controls, procedures, and monitoring and reporting capability
that align to the frameworks approved by the BRCC.
Independent internal review
Group Assurance reviews the adequacy and effectiveness of management controls for risk.
Divisional business units
Business Units responsible for identifying, evaluating and managing the risks that they originate within approved risk appetite policies; and establish and maintain appropriate risk management controls, resources and self-assurance processes.
40 2014 Westpac Group Annual Report

Corporate governance Checklist of Westpac’s compliance with ASXCGC Recommendations
ASXCGC recommendations (with 2010 amendments) Reference Compliance
Principle 1: Lay solid foundations for management and oversight
1.1 Establish the functions reserved to the Board and those delegated to senior executives and disclose those functions.
Page 26 Comply
1.2 Disclose the process for evaluating the performance of senior executives. Page 30 Comply
1.3 Provide the information indicated in Guide to reporting on Principle 1. Pages 25, 26, 30
Comply
Principle 2: Structure the Board to add value
2.1 A majority of the Board should be independent Directors. Pages 26, 27 Comply
2.2 The chair should be an independent Director. Page 28 Comply
2.3 The roles of chair and chief executive officer should not be exercised by the same individual.
Page 28 Comply
2.4 The Board should establish a nomination committee. Page 28 Comply
2.5 Disclose the process for evaluating the performance of the Board, its committees and individual Directors.
Page 30 Comply
2.6 Provide the information indicated in Guide to reporting on Principle 2. Pages 25–30 Comply
Principle 3: Promote ethical and responsible decision-making
3.1 Establish a code of conduct and disclose the code or a summary of the code as to: 3.1.1 the practices necessary to maintain confidence in the company’s
integrity 3.1.2 the practices necessary to take into account their legal obligations
and the reasonable expectations of their stakeholders 3.1.3 the responsibility and accountability of individuals for reporting and
investigating reports of unethical practices.
Pages 30, 31 Comply
3.2 Establish a policy concerning diversity and disclose the policy or a summary of that policy.
Page 32 Comply
3.3 Disclose the measurable objectives for achieving gender diversity set by the Board in accordance with the diversity policy and progress towards achieving them.
Page 32 Comply
3.4 Disclose the proportion of women employees in the whole organisation, women in senior executive positions and women on the Board.
Page 32 Comply
3.5 Provide the information indicated in Guide to reporting on Principle 3. Pages 30–32 Comply
Principle 4: Safeguard integrity in financial reporting
4.1 The Board should establish an audit committee. Pages 33, 34 Comply
4.2 Structure the audit committee so that it: consists only of Non-executive Directors; consists of a majority of independent Directors; is chaired by an independent chair, who is not chair of the Board; and has at least three members.
Page 27 Comply
4.3 The audit committee should have a formal charter. Page 33 Comply
4.4 Provide the information indicated in Guide to reporting on Principle 4. Pages 25, 27–34
Comply
2014 Westpac Group Annual Report 41

ASXCGC recommendations (with 2010 amendments) Reference Compliance
Principle 5: Make timely and balanced disclosure
5.1 Establish written policies designed to ensure compliance with ASX Listing Rule disclosure requirements and to ensure accountability at a senior executive level for that compliance and disclose those policies or a summary of those policies.
Pages 34, 35 Comply
5.2 Provide the information indicated in Guide to reporting on Principle 5. Pages 34, 35 Comply
Principle 6: Respect the rights of shareholders
6.1 Design a communications policy for promoting effective communication with shareholders and encouraging their participation at general meetings and disclose the policy or a summary of that policy.
Page 35 Comply
6.2 Provide the information indicated in Guide to reporting on Principle 6. Page 35 Comply
Principle 7: Recognise and manage risk
7.1 Establish policies for the oversight and management of material business risks and disclose a summary of those policies.
Pages 35–40 Comply
7.2 The Board should require management to design and implement the risk management and internal control system to manage the company’s material business risks and report to it on whether those risks are being managed effectively. The Board should disclose that management has reported to it as to the effectiveness of the company’s management of its material business risks.
Pages 35–40 Comply
7.3 The Board should disclose whether it has received assurance from the chief executive officer (or equivalent) and the chief financial officer (or equivalent) that the declaration provided in accordance with section 295A of the Corporations Act is founded on a sound system of risk management and internal control and that the system is operating effectively in all material respects in relation to financial reporting risks.
Page 35 Comply
7.4 Provide the information indicated in Guide to reporting on Principle 7. Pages 35–40 Comply
Principle 8: Remunerate fairly and responsibly
8.1 Establish a remuneration committee. Page 38 Comply
8.2 The remuneration committee should be structured so that it: consists of a majority of independent Directors; is chaired by an independent chair; and has at least three members.
Page 27 Comply
8.3 Clearly distinguish the structure of Non-executive Directors’ remuneration from that of executive Directors and senior executives.
Page 38 Comply
8.4 Provide the information indicated in Guide to reporting on Principle 8. Pages 25, 27, 29, 32, 38
Comply
42 2014 Westpac Group Annual Report

Directors’ report Our Directors present their report together with the financial statements of the Group for the financial year ended 30 September 2014.
1. Directors The names of the persons who have been Directors, or appointed as Directors, during the period since 1 October 2013 and up to the date of this report are: Lindsay Philip Maxsted, Gail Patricia Kelly, John Simon Curtis (retired as Director and Deputy Chairman on 25 April 2014), Elizabeth Blomfield Bryan, Gordon McKellar Cairns (retired as Director on 13 December 2013), Ewen Graham Wolseley Crouch, Catriona Alison Deans (Alison Deans) (Director from 1 April 2014), Robert George Elstone, Peter John Oswin Hawkins, Peter Ralph Marriott, and Ann Darlene Pickard.
Particulars of the skills, experience, expertise and responsibilities of the Directors at the date of this report, including all directorships of other listed companies held by a Director at any time in the past three years immediately before 30 September 2014 and the period for which each directorship has been held, are set out below.
Name: Lindsay Maxsted, DipBus (Gordon), FCA, FAICD Age: 60 Term of office: Director since March 2008 and Chairman since December 2011. Date of next scheduled re-election: December 2014. Independent: Yes. Current directorships of listed entities and dates of office: Director of Transurban Group (since March 2008, and Chairman since August 2010). Director of BHP Billiton Limited (since March 2011) and BHP Billiton plc (since March 2011).
Other principal directorships: Managing Director of Align Capital Pty Ltd and Director of Baker IDI Heart and Diabetes Institute Holdings Limited. Other interests: Nil. Other Westpac related entities directorships and period of office: Nil. Skills, experience and expertise: Lindsay was formerly a partner at KPMG and was the CEO of that firm from 1 January 2001 to 31 December 2007. His principal area of practice prior to his becoming CEO was in the corporate recovery field managing a number of Australia’s largest insolvency/workout/turnaround engagements including
Linter Textiles (companies associated with Abraham Goldberg), Bell Publishing Group, Bond Brewing, McEwans Hardware and Brashs. He is also a former Director and Chairman of the Victorian Public Transport Corporation. Lindsay is a member of the Advisory Board of Coolmore Australia and a Fellow of the Australian Institute of Company Directors. Westpac Board Committee membership: Chairman of the Board Nominations Committee. Member of each of the Board Audit and Board Risk & Compliance Committees. Directorships of other listed entities over the past three years and dates of office: Nil.
Name: Gail Kelly, HigherDipEd, BA, MBA with Distinction Age: 58 Term of office: Managing Director & Chief Executive Officer since February 2008. Date of next scheduled re-election: Not applicable. Independent: No. Current directorships of listed entities and dates of office: Nil. Other principal directorships: The Business Council of Australia and the Financial Markets Foundation for Children.
Other interests: Chairman of the Australian Bankers’ Association. Member of the Global Board of Advisers at the US Council on Foreign Relations and is a member of the Group of Thirty. Other Westpac related entities directorships and dates of office: Nil. Skills, experience and expertise: Gail began her banking career in 1980, and by 2001 Gail had held various senior management roles in a broad range of areas including retail and commercial banking, strategy, marketing and human resources. Gail has spent the last twelve years as CEO of two
Australian banks, St.George Bank from 2002 to 2007 and Westpac from 2008 to date. She serves on the Prime Minister’s Indigenous Advisory Council and is CARE Australia’s Ambassador for Women’s Empowerment. Internationally, Gail is Vice President of the International Monetary Conference, she sits on the Global Board of Advisers at the US Council on Foreign Relations and is a member of the Group of Thirty. Westpac Board Committee membership: Member of the Board Technology Committee. Directorships of other listed entities over the past three years and dates of office: Nil.
2014 Westpac Group Annual Report 43

Name: Elizabeth Bryan AM, BA (Econ.), MA (Econ.) Age: 68 Term of office: Director since November 2006. Date of next scheduled re-election: December 2015. Independent: Yes. Current directorships of listed entities and dates of office: Director of Caltex Australia Limited (since July 2002, and Chairman since October 2007). Other principal directorships: Nil.
Other interests: Member of the Takeovers Panel, Powerhouse Museum Trustee Board, Australian Treasury Advisory Council and Director Advisory Panel to ASIC. Other Westpac related entities directorships and dates of office: Nil. Skills, experience and expertise: Elizabeth has over 33 years experience in the financial services industry, government policy and administration, and on the boards of companies and statutory organisations. Prior to becoming a professional director she served for six years as
Managing Director of Deutsche Asset Management and its predecessor organisation, NSW State Superannuation Investment and Management Corporation. In March 2014, Elizabeth was appointed a member of the Australian Treasury Advisory Council. Westpac Board Committee membership: Chairman of the Board Risk & Compliance Committee. Member of each of the Board Nominations and Board Remuneration Committees. Directorships of other listed entities over the past three years and dates of office: Nil.
Name: Ewen Crouch AM, BEc (Hons.), LLB, FAICD Age: 58 Term of office: Director since February 2013. Date of next scheduled re-election: December 2016. Independent: Yes. Current directorships of listed entities and dates of office: Bluescope Steel Limited (since March 2013). Other principal directorships: Sydney Symphony Orchestra. Chairman of Mission Australia. Other interests: Member of the Takeovers Panel and the AICD’s Law Committee. Member of the Corporations Committee of the Law Council of Australia. Other Westpac related entities directorships and dates of office: Nil.
Skills, experience and expertise: Ewen is one of Australia’s most accomplished mergers and acquisitions (M&A) lawyers, having worked on some of Australia’s most significant M&A transactions during his career as a partner at Allens from 1988 to 2013. He served as a member of that firm’s board for 11 years including 4 years as Chairman of Partners as well as holding the following roles whilst a partner: Co-Head Mergers & Acquisitions and Equity Capital Markets, Executive Partner, Asian Offices and Deputy Managing Partner. In 2010, he was appointed as a member of the Takeovers Panel. Ewen is a Fellow of the Australian Institute of Company Directors and is a member of the AICD’s Law Committee.
Ewen is also a member of the Corporations Committee of the Law Council of Australia. He is admitted to practise law in New South Wales, Victoria, the Australian Capital Territory and Western Australia. In 2013, he was awarded an Order of Australia in recognition of his significant service to the law as a contributor to legal professional organisations and to the community. Westpac Board Committee membership: Chairman of the Board Remuneration Committee, Member of each of the Board Nominations and Board Risk & Compliance Committees. Directorships of other listed entities over the past three years and dates of office: Nil.
Name: Alison Deans, BA, MBA, GAICD Age: 46 Term of office: Director since April 2014. Date of next scheduled re-election: December 2014. Independent: Yes. Current directorships of listed entities and dates of office: Insurance Australia Group Limited (since 1 February 2013). Other principal directorships: kikki.K Holdings Pty Ltd. Other interests: Nil. Other Westpac related entities directorships and dates of office: Nil.
Skills, experience and expertise: Alison has more than 20 years experience in senior management and strategy consulting roles focused on e-commerce, media and financial services in Australia. During this time, Alison held a number of senior executive roles including as the CEO of eCorp Limited, Hoyts Cinemas and eBay, Australia and New Zealand. Most recently, she was the CEO of the technology-based investment company netus Pty Ltd, which was acquired by Fairfax Media Limited in 2012. Alison was appointed an Independent Non-executive Director of Insurance Australia Group
Limited in 2013 and was an Independent Director of Social Ventures Australia from 2007 to 2013. In December 2013, she was appointed by the Australian Government to a Panel of Experts conducting an independent cost-benefit analysis and a regulatory review of the regulatory arrangements for the National Broadband Network. Westpac Board Committee membership: Member of each of the Board Risk & Compliance and Board Technology Committees. Directorships of other listed entities over the past three years and dates of office: Nil.
44 2014 Westpac Group Annual Report

Directors’ report
Name: Robert Elstone, BA (Hons.), MA (Econ.), MCom Age: 61 Term of office: Director since February 2012. Date of next scheduled re-election: December 2014. Independent: Yes. Current directorships of listed entities and dates of office: Nil. Other principal directorships: University of Western Australia Business School. Other interests: Adjunct Professor in the Schools of Business at the Universities of Sydney and Western Australia. Other Westpac related entities directorships and dates of office: Nil.
Skills, experience and expertise: Robert has over 30 years experience in senior management roles spanning investment banking, corporate finance, wholesale financial markets and risk management. From 2006 to 2011, Robert was Managing Director and CEO of the Australian Securities Exchange. Previously, he was Managing Director and CEO of the Sydney Futures Exchange from 2000 to 2006 and, from 1995 to 2000 he was Finance Director of Pioneer International. Robert was a Non-executive Director of the National Australia Bank from 2004 to 2006, an inaugural member of the Board of Guardians of the Future Fund in 2006, and, during the years 2007 to 2009, he was Chairman
of the Financial Sector Advisory Council to the Federal Treasurer. Robert is an Adjunct Professor at the Business Schools of the Universities of Sydney and Western Australia. Robert was appointed to the University of Western Australia Business School Board at the start of 2013. Westpac Board Committee membership: Chairman of the Board Audit Committee. Member of each of the Board Nominations, Board Remuneration and Board Risk & Compliance Committees. Directorships of other listed entities over the past three years and dates of office: ASX Limited (July 2006 to October 2011).
Name: Peter Hawkins, BCA (Hons.), SF Fin, FAIM, ACA (NZ), FAICD Age: 60 Term of office: Director since December 2008. Date of next scheduled re-election: December 2016. Independent: Yes. Current directorships of listed entities and dates of office: Mirvac Group (since January 2006). Other principal directorships: Liberty Financial Pty Ltd, Treasury Corporation of Victoria, Murray Goulburn Co-operative Co. Limited and Clayton Utz.
Other interests: Nil. Other Westpac related entities directorships and dates of office: Member of the Bank of Melbourne Advisory Board since November 2010. Skills, experience and expertise: Peter’s career in the banking and financial services industry spans over 42 years in Australia and overseas at both the highest levels of management and directorship of major organisations. Peter has held various senior management and directorship positions with Australia and New Zealand Banking Group Limited from
1971 to 2005. He was also a Director of BHP (NZ) Steel Limited from 1990 to 1991, ING Australia Limited from 2002 to 2005, Esanda Finance Corporation from 2002 to 2005 and Visa Inc. from 2008 to 2011. Westpac Board Committee membership: Chairman of the Board Technology Committee. Member of each of the Board Audit, Board Nominations and Board Risk & Compliance Committees. Directorships of other listed entities over the past three years and dates of office: Nil.
Name: Peter Marriott, BEc (Hons.), FCA Age: 57 Term of office: Director since June 2013. Date of next scheduled re-election: December 2016. Independent: Yes. Current directorships of listed entities and dates of office: ASX Limited (since July 2009). Other principal directorships: ASX Clearing Corporation Limited and ASX Settlement Corporation Limited. Chairman of Austraclear Limited. Other interests: Nil.
Other Westpac related entities directorships and dates of office: Nil. Skills, experience and expertise: Peter has over 30 years experience in senior management roles in the finance industry encompassing international banking, finance and auditing. Peter joined Australia and New Zealand Banking Group Limited (ANZ) in 1993 and held the role of Chief Financial Officer from 1997 to May 2012. Prior to his career at ANZ, Peter was a banking and finance and audit and consulting partner at KPMG Peat Marwick. Peter has been a Non-executive Director of ASX Limited (and Chairman of its Board Audit &
Risk Committee) since 1 July 2009. This appointment has involved Peter acting as a Director on the ASX Group Clearing and Settlement Boards and as Chairman of Austraclear Limited. Peter was formerly a Director of ANZ National Bank Limited in New Zealand and various ANZ subsidiaries. Westpac Board Committee membership: Member of each of the Board Audit, Board Risk & Compliance and Board Technology Committees. Directorships of other listed entities over the past three years and dates of office: ANZ National Bank Limited (November 2004 to May 2012), New Zealand listed.
2014 Westpac Group Annual Report 45

Name: Ann Pickard, BA, MA Age: 59 Term of office: Director since December 2011. Date of next scheduled re-election: Not applicable. Ann Pickard will retire following the 2014 AGM. Independent: Yes. Current directorships of listed entities and dates of office: Nil. Other principal directorships: Nil. Other interests: Nil. Other Westpac related entities directorships and dates of office: Nil.
Skills, experience and expertise: Ann has 25 years of international experience as a senior manager in large organisations, with responsibility for major corporate transformations, maximising return on assets in challenging environments, complex negotiations, large scale development projects and strategic planning. In June 2013, Ann was appointed Royal Dutch Shell’s Executive Vice President Arctic, Upstream Americas. Before her current role, Ann was the Executive Vice President of Shell’s upstream business in Australia from March 2010, and later her role was expanded to Country Chair of Australia in August 2010.
Prior to this, Ann was Shell’s Regional Executive Vice President for Sub Sahara Africa, overseeing the company’s exploration and production, gas and LNG activities in the region. She has also held the position of Director – Global Businesses and Strategy and been a member of the Shell Gas & Power Executive Committee with responsibility for Global LNG, Power and Gas & Power Strategy. Westpac Board Committee membership: Member of each of the Board Remuneration and Board Risk & Compliance Committees. Directorships of other listed entities over the past three years and dates of office: Nil.
Company Secretary Our Company Secretaries as at 30 September 2014 are John Arthur and Tim Hartin.
John Arthur (LLB (Hons.)) was appointed Group Executive, Counsel & Secretariat and Company Secretary on 1 December 2008. On 24 November 2011, John was appointed Chief Operating Officer and continues to hold the position of Senior Company Secretary. Most recently prior to that appointment John was Managing Director & Chief Executive of Investa Property Group until 2007. Previously, John has been a partner at Freehills and Group General Counsel of Lend Lease Corporation Limited. He also served as Chairman of legal firm Gilbert + Tobin and has had a distinguished career as legal partner, corporate executive and non-executive director.
Tim Hartin (LLB (Hons.)) was appointed Group Company Secretary on 7 November 2011. Prior to his appointment, Tim was a transactional lawyer at Henderson Boyd Jackson W.S. in Scotland and in London in Herbert Smith's corporate and corporate finance division. Tim joined Gilbert + Tobin as a Consultant in 2004, where he provided corporate advisory services to ASX listed companies. Tim joined Westpac in 2006 as Counsel, Corporate Core and most recently was the Head of Legal - Risk Management & Workouts, Counsel & Secretariat.
2. Executive Team As at 30 September 2014 our Executive Team was:
Name Position Year Joined
Group Year Appointed
to Position
Gail Kelly Managing Director & Chief Executive Officer 2008 2008 Philip Coffey Deputy Chief Executive Officer 1996 2014 John Arthur Chief Operating Officer 2008 2011 Brad Cooper Chief Executive Officer, BT Financial Group 2007 2010 David Curran Chief Information Officer 2014 2014 George Frazis Chief Executive Officer, St.George Banking Group 2009 2012 Brian Hartzer Chief Executive, Australian Financial Services 2012 2012 Alexandra Holcomb Chief Risk Officer 1996 2014 Peter King Chief Financial Officer 1994 2014 David McLean Acting Chief Executive Officer, Westpac New Zealand Limited 1999 2014 Christine Parker Group Executive, Human Resources & Corporate Affairs 2007 2011 Rob Whitfield Group Executive, Westpac Institutional Bank 1986 2009 Jason Yetton Group Executive, Westpac Retail & Business Banking 1992 2011
There are no family relationships between or among any of our Directors or Executive Team members.
46 2014 Westpac Group Annual Report

Directors’ report
Gail Kelly HigherDipEd, BA, MBA with Distinction. Age 58 Managing Director & Chief Executive Officer Gail began her banking career in 1980, and by 2001 Gail had held various senior management roles in a broad range of areas including retail and commercial banking, strategy, marketing and human resources. Gail has spent the last twelve years as CEO of two Australian banks, St.George Bank from 2002 to 2007 and Westpac from 2008 to date. Gail holds a Bachelor of Arts degree and Higher Diploma of Education from Cape Town University and an MBA with Distinction from the University of Witwatersrand. Gail is Chairman of the Australian Bankers’ Association and a non-executive director of the Business Council of Australia and the Financial Markets Foundation for Children. She also serves on the Prime Minister’s Indigenous Advisory Council and is CARE Australia’s Ambassador for Women’s Empowerment. Internationally, Gail is Vice President of the International Monetary Conference, she sits on the Global Board of Advisers at the US Council on Foreign Relations and is a member of the Group of Thirty.
Philip Coffey BEc (Hons.). Age 57 Deputy Chief Executive Officer Philip was appointed Deputy Chief Executive Officer in April 2014 with responsibility for overseeing Westpac’s contribution to the Federal Government’s Financial System Inquiry and supporting relationships with key stakeholders including industry groups, regulators, customers and government. He is also responsible for the Group’s strategy, mergers and acquisitions function. Prior to this appointment, Philip held the role of Chief Financial Officer from December 2005. Previous to this he was Group Executive, Westpac Institutional Bank, having been appointed to that position in 2002. Philip first joined Westpac in 1996 as Head of Foreign Exchange. He has extensive experience in financial markets, funds management and finance. He began his career at the Reserve Bank of Australia before moving to Citicorp and AIDC Limited. He has also held roles in the United Kingdom and New Zealand. Philip has an honours degree in Economics from the University of Adelaide and has completed the Executive Programme at Stanford University Business School.
John Arthur LLB (Hons.). Age 59 Chief Operating Officer John was appointed Chief Operating Officer on 24 November 2011 with responsibility for Group Services, which encompasses technology, banking operations, property, compliance, legal and secretariat services. He joined Westpac as Group Executive, Counsel & Secretariat on 1 December 2008. Before that appointment John was Managing Director & CEO of Investa Property Group. Previously, John has been a partner at Freehills and Group General Counsel of Lend Lease Corporation Limited. He also served as Chairman of legal firm Gilbert + Tobin and has had a distinguished career as a legal partner, corporate executive and non-executive director.
Brad Cooper DipBM, MBA. Age 52 Chief Executive Officer, BT Financial Group Brad was appointed Chief Executive Officer, BT Financial Group on 1 February 2010. Brad initially joined Westpac in April 2007 as Chief Executive, Westpac New Zealand Limited and after successfully leading a change program in that market, moved to the role of Group Chief Transformation Officer leading the Westpac Group’s St.George merger implementation. Prior to joining Westpac, Brad was Chairman of GE Capital Bank and CEO of GE Consumer Finance UK & Ireland. He drove GE's UK Six Sigma program and was certified as a Quality Leader (Black Belt) in December 2002. He was promoted to CEO of GE Consumer Finance UK in January 2003 and appointed Chairman of GE Capital Bank in April 2004.
David Curran BCom. Age 49 Chief Information Officer David was appointed Chief Information Officer in September 2014. David joined Westpac in February 2014 as a consultant on the Group’s banking technology modernisation program. David has almost thirty years of experience with proven expertise in IT and financial services and the implementation of large, complex projects. Before joining Westpac, David spent ten years in senior roles at the Commonwealth Bank of Australia (CBA). Before joining CBA, he spent sixteen years at Accenture, where he was a partner, primarily consulting on financial services.
2014 Westpac Group Annual Report 47

George Frazis B Eng (Hons.), MBA (AGSM/Wharton). Age 50 Chief Executive Officer, St.George Banking Group George was appointed Chief Executive Officer, St.George Banking Group in April 2012. Prior to this appointment, George joined the Westpac Group in March 2009 as Chief Executive, Westpac New Zealand Limited. George is highly experienced in the financial services industry. He was formerly Group Executive General Manager at National Australia Bank. Prior to that, George was a senior executive in Commonwealth Bank of Australia's Institutional Banking Division and has also been a partner with the Boston Consulting Group and an officer in the Royal Australian Air Force.
Brian Hartzer BA European History, CFA. Age 47 Chief Executive, Australian Financial Services Brian joined Westpac as Chief Executive, Australian Financial Services on 25 June 2012. Australian Financial Services comprises Westpac Retail & Business Banking, St.George Banking Group and BT Financial Group. Prior to joining Westpac, Brian spent three years in the UK as CEO for Retail, Wealth and Ulster Bank at the Royal Bank of Scotland Group. Prior to that, he spent ten years with Australia and New Zealand Banking Group Limited (ANZ) in Australia in a variety of roles, including his final role as CEO, Australia and Global Segment Lead for Retail and Wealth. Before joining ANZ, Brian spent ten years as a financial services consultant in New York, San Francisco and Melbourne. Brian graduated from Princeton University with a degree in European History and is a Chartered Financial Analyst.
Alexandra Holcomb BA, MBA, MA. Age 53 Chief Risk Officer Alexandra was appointed Chief Risk Officer in August 2014. Since joining Westpac in 1996, Alexandra has held a number of senior positions including Group General Manager Group Strategy, M&A and Major Projects, Group Executive, Group Strategy, Head of Westpac Institutional Bank Strategy, and most recently, Group General Manager of Global Transactional Services. Prior to joining Westpac, Alexandra was a senior executive from 1992 to 1996 with Booz Allen & Hamilton International where she specialised in international credit, working in Singapore and Australia. Before that she worked with Barclays Bank and Chase Manhattan Bank in New York.
Peter King BEc, FCA. Age 44 Chief Financial Officer Peter was appointed Chief Financial Officer in April 2014, with responsibility for Westpac’s Finance, Assurance, Tax, Treasury and Investor Relations functions. Prior to this appointment Peter was the Deputy Chief Financial Officer for three years. Since joining Westpac in 1994, Peter has held senior finance positions across the Group, including in Group Finance, Business and Consumer Banking, Business and Technology Services, Treasury and Financial Markets. Peter commenced his career at Deloitte Touché Tohmatsu. He has a Bachelor of Economics from Sydney University and completed the Advanced Management Programme at INSEAD. He is a Fellow of the Institute of Chartered Accountants.
David McLean LLB (Hons). Age 56 Acting Chief Executive Officer, Westpac New Zealand Limited David was appointed Acting Chief Executive Officer, Westpac New Zealand Limited in June 2014. Since joining Westpac in February 1999, David has held a number of senior roles including Head of Debt Capital Markets New Zealand, General Manager, Private, Wealth and Insurance New Zealand and Head of Westpac Institutional Bank New Zealand, and most recently, Managing Director of the Westpac New York branch since October 2012. Before joining Westpac, David was Director, Capital Markets at Deutsche Morgan Grenfell since 1994, where he was responsible for starting and developing a new debt capital markets origination business. He also established the New Zealand branch of Deutsche Bank and was New Zealand Resident Branch Manager. In 1988, David joined Southpac/National Bank as a Capital Markets Executive. Prior to this, David worked as a lawyer in private practice and also served as in‐house counsel for Natwest from 1985. David is a Barrister & Solicitor of the High Court of New Zealand.
48 2014 Westpac Group Annual Report

Directors’ report
Christine Parker BGDipBus (HRM). Age 54 Group Executive, Human Resources & Corporate Affairs Christine was appointed Group Executive, Human Resources & Corporate Affairs on 1 October 2011, with responsibility for human resources strategy and management, including reward and recognition, safety, learning and development, careers and talent, employee relations and employment policy. She is also responsible for Corporate Affairs & Sustainability. Prior to this appointment, she was Group General Manager, Human Resources, from March 2010, with responsibilities across the entire Westpac Group. Prior to that, Christine was General Manager, Human Resources, Westpac New Zealand Limited, when she joined Westpac in 2007. Prior to joining Westpac, Christine was Group HR Director, Carter Holt Harvey, and from 1999 to 2004, she was Director of HR with Restaurant Brands New Zealand.
Rob Whitfield BCom, GradDipBanking, GradDipFin, AMP (Harvard). Age 50 Group Executive, Westpac Institutional Bank Rob was appointed Group Executive, Westpac Institutional Bank in July 2009. He has responsibility for Westpac’s global relationships with corporate, institutional and government clients, and core product offerings across financial and capital markets, transactional banking and working capital and payments. In addition, Rob has responsibility for Hastings Funds Management Limited and Westpac’s structured finance, global treasury, Asia and Pacific Island businesses. Rob joined Westpac as a graduate in 1986, where he gained broad financial markets experience. He joined Treasury in 1993 and was appointed Group Treasurer in 2000. In 2004, he became Chief Risk Officer and joined the Executive Team in December 2005. From April 2007, Rob undertook advisory work as a Group Executive for Westpac's CEO with responsibility for the oversight of the merger with St.George Bank Limited. He was appointed Group Executive, Risk Management in November 2008 prior to assuming his current role.
Jason Yetton BCom, GDAppFin, TGMP (Harvard). Age 43 Group Executive, Westpac Retail & Business Banking Jason was appointed Group Executive, Westpac Retail & Business Banking on 24 November 2011. Prior to this appointment, he was General Manager, Retail and Regional Banking, Westpac Retail & Business Banking from 2010. Before that, Jason was General Manager, Retail Banking from 2008. During 2008, he was a member of the Group’s 2017 strategy team. Prior to that role, Jason held a number of roles in BT Financial Group, including Head of Product, General Manager, Customer Solutions and CEO Commerce BT Unit Trust (based in Malaysia from 1997 to 1999). He joined BT as a graduate trainee in 1992.
3. Report on the business a) Principal activities The principal activities of the Group during the financial year ended 30 September 2014 were the provision of financial services including lending, deposit taking, payments services, investment portfolio management and advice, superannuation and funds management, insurance services, leasing finance, general finance and foreign exchange services.
There have been no significant changes in the nature of the principal activities of the Group during 2014.
b) Review of and results of operations and financial position The net profit attributable to equity holders of Westpac for the financial year ended 30 September 2014 was $7,561 million an increase of $810 million or 12% compared to 2013. Key features of this result are:
a 7% increase in net operating income before operating expenses and impairment charges with:
– net interest income of $13,542 million in 2014, an increase of $721 million or 6% compared to 2013, reflecting growth in customer deposits of 7%, loan growth of 8% and lower margins; and
– non-interest income of $6,395 million in 2014, an increase of $621 million or 11% compared to 2013, reflecting growth in wealth management, insurance and banking fees.
operating expenses were $8,547 million in 2014, an increase of $571 million compared to 2013, reflecting operating and integration costs associated with the Lloyds acquisition, foreign exchange translation impacts, higher software amortisation, personnel costs from investment in the business and the Westpac Bicentennial Foundation grant of $100 million; and
impairment charges were $650 million in 2014, a decrease of $197 million or 23% compared to 2013, reflecting continued improvements in asset quality including further reductions in stressed assets and new impaired assets.
A review of the operations of the Group and its divisions and their results for the financial year ended 30 September 2014 is set out in Section 2 of the Annual Report under the sections ‘Review of Group operations’ and ‘Divisional performance’, which form part of this report.
2014 Westpac Group Annual Report 49

Further information about our financial position and financial results is included in the financial statements in Section 3 of the Annual Report, which form part of this report.
c) Dividends Since 30 September 2014, Westpac has announced a final ordinary dividend of 92 cents per Westpac ordinary share, totalling approximately $2,860 million for the year ended 30 September 2014 (2013 final ordinary dividend of 88 cents per Westpac ordinary share and a special dividend of 10 cents per Westpac ordinary share, totalling approximately $3,046 million). The dividend will be fully franked and will be paid on 19 December 2014.
An interim ordinary dividend for the current financial year of 90 cents per Westpac ordinary share for the half year ended 31 March 2014, totalling $2,798 million, was paid as a fully franked dividend on 2 July 2014 (2013 interim ordinary dividend of 86 cents per Westpac ordinary share and a special dividend of 10 cents per Westpac ordinary share, totalling $2,980 million).
d) Significant changes in state of affairs and events during and since the end of the 2014 financial year Significant changes in the state of affairs of the Group during 2014 were:
the completion of the acquisition of selected assets of Lloyds Banking Group’s Australian asset finance business, Capital Finance Australia Limited and its corporate loan portfolio, BOS International (Australia) Ltd for $1.45 billion;
capital transactions including the issuance of approximately $1.31 billion of new Additional Tier 1 capital securities known as Westpac Capital Notes 2 and the buy-back and subsequent cancellation of Westpac Stapled Preferred Securities II;
the establishment of the Westpac Bicentennial Foundation, a charitable foundation to which Westpac contributed $100 million; and
ongoing regulatory changes and developments, which have included changes to liquidity, capital, financial services, taxation and other regulatory requirements.
For a discussion of these matters, please refer to ‘Significant developments’ in Section 1 of the Annual Report under ‘Information on Westpac’.
The Directors are not aware of any other matter or circumstance that has occurred since the end of the financial year that has significantly affected or may significantly affect the operations of the Group, the results of these operations or the state of affairs of the Group in subsequent financial years.
e) Business strategies, developments and expected results Our business strategies, prospects and likely major developments in the Group’s operations in future financial years and the expected results of those operations are discussed in Section 1 of the Annual Report under ‘Information on Westpac’, including under ‘Outlook’ and ‘Significant developments’.
Further information on our business strategies and prospects for future financial years and likely developments in our operations and the expected results of operations have not been included in this report because the Directors believe it would be likely to result in unreasonable prejudice to us.
4. Directors’ interests a) Directors’ interests in securities The following particulars for each Director are set out in the Remuneration report in Section 9 of the Directors’ report for the year ended 30 September 2014 and in the tables below:
their relevant interests in our shares or the shares of any of our related bodies corporate;
their relevant interests in debentures of, or interests in, any registered managed investment scheme made available by us or any of our related bodies corporate;
their rights or options over shares in, debentures of, or interests in, any registered managed investment scheme made available by us or any of our related bodies corporate; and
any contracts:
– to which the Director is a party or under which they are entitled to a benefit; and
– that confer a right to call for or deliver shares in, debentures of, or interests in, any registered managed investment scheme made available by us or any of our related bodies corporate.
50 2014 Westpac Group Annual Report
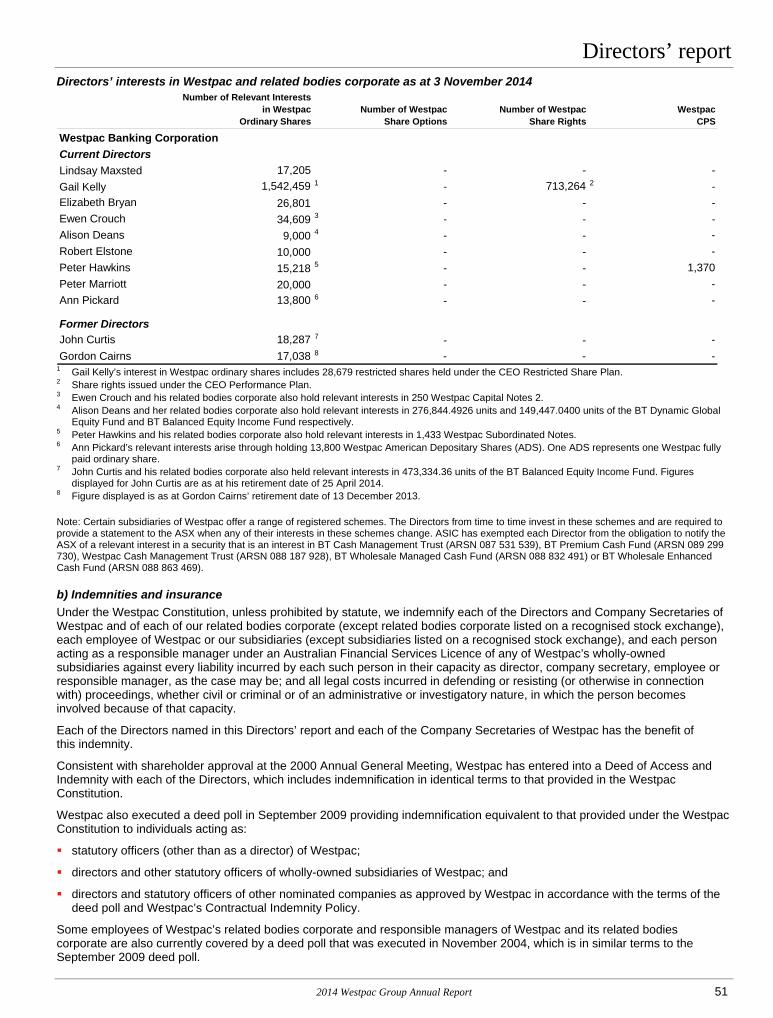
Directors’ report Directors’ interests in Westpac and related bodies corporate as at 3 November 2014
Number of Relevant Interests in Westpac
Ordinary SharesNumber of Westpac
Share OptionsNumber of Westpac
Share RightsWestpac
CPS
Westpac Banking Corporation Current DirectorsLindsay Maxsted 17,205 - - -Gail Kelly 1,542,459 1 - 713,264 2 -Elizabeth Bryan 26,801 - - -Ewen Crouch 34,609 3 - - -Alison Deans 9,000 4 - - -Robert Elstone 10,000 - - -Peter Hawkins 15,218 5 - - 1,370Peter Marriott 20,000 - - -Ann Pickard 13,800 6 - - -
Former DirectorsJohn Curtis 18,287 7 - - -Gordon Cairns 17,038 8 - - -
1 Gail Kelly’s interest in Westpac ordinary shares includes 28,679 restricted shares held under the CEO Restricted Share Plan. 2 Share rights issued under the CEO Performance Plan. 3 Ewen Crouch and his related bodies corporate also hold relevant interests in 250 Westpac Capital Notes 2. 4 Alison Deans and her related bodies corporate also hold relevant interests in 276,844.4926 units and 149,447.0400 units of the BT Dynamic Global
Equity Fund and BT Balanced Equity Income Fund respectively. 5 Peter Hawkins and his related bodies corporate also hold relevant interests in 1,433 Westpac Subordinated Notes. 6 Ann Pickard’s relevant interests arise through holding 13,800 Westpac American Depositary Shares (ADS). One ADS represents one Westpac fully
paid ordinary share. 7 John Curtis and his related bodies corporate also held relevant interests in 473,334.36 units of the BT Balanced Equity Income Fund. Figures
displayed for John Curtis are as at his retirement date of 25 April 2014. 8 Figure displayed is as at Gordon Cairns’ retirement date of 13 December 2013.
Note: Certain subsidiaries of Westpac offer a range of registered schemes. The Directors from time to time invest in these schemes and are required to provide a statement to the ASX when any of their interests in these schemes change. ASIC has exempted each Director from the obligation to notify the ASX of a relevant interest in a security that is an interest in BT Cash Management Trust (ARSN 087 531 539), BT Premium Cash Fund (ARSN 089 299 730), Westpac Cash Management Trust (ARSN 088 187 928), BT Wholesale Managed Cash Fund (ARSN 088 832 491) or BT Wholesale Enhanced Cash Fund (ARSN 088 863 469).
b) Indemnities and insurance Under the Westpac Constitution, unless prohibited by statute, we indemnify each of the Directors and Company Secretaries of Westpac and of each of our related bodies corporate (except related bodies corporate listed on a recognised stock exchange), each employee of Westpac or our subsidiaries (except subsidiaries listed on a recognised stock exchange), and each person acting as a responsible manager under an Australian Financial Services Licence of any of Westpac’s wholly-owned subsidiaries against every liability incurred by each such person in their capacity as director, company secretary, employee or responsible manager, as the case may be; and all legal costs incurred in defending or resisting (or otherwise in connection with) proceedings, whether civil or criminal or of an administrative or investigatory nature, in which the person becomes involved because of that capacity.
Each of the Directors named in this Directors’ report and each of the Company Secretaries of Westpac has the benefit of this indemnity.
Consistent with shareholder approval at the 2000 Annual General Meeting, Westpac has entered into a Deed of Access and Indemnity with each of the Directors, which includes indemnification in identical terms to that provided in the Westpac Constitution.
Westpac also executed a deed poll in September 2009 providing indemnification equivalent to that provided under the Westpac Constitution to individuals acting as:
statutory officers (other than as a director) of Westpac;
directors and other statutory officers of wholly-owned subsidiaries of Westpac; and
directors and statutory officers of other nominated companies as approved by Westpac in accordance with the terms of the deed poll and Westpac’s Contractual Indemnity Policy.
Some employees of Westpac’s related bodies corporate and responsible managers of Westpac and its related bodies corporate are also currently covered by a deed poll that was executed in November 2004, which is in similar terms to the September 2009 deed poll.
2014 Westpac Group Annual Report 51

The Westpac Constitution also permits us, to the extent permitted by law, to pay or agree to pay premiums for contracts insuring any person who is or has been a Director or Company Secretary of Westpac or any of its related bodies corporate against liability incurred by that person in that capacity, including a liability for legal costs, unless:
we are forbidden by statute to pay or agree to pay the premium; or
the contract would, if we paid the premium, be made void by statute.
Under the September 2009 deed poll, Westpac also agrees to provide directors’ and officers’ insurance to Directors of Westpac and Directors of Westpac’s wholly-owned subsidiaries.
For the year ended 30 September 2014, the Group has insurance cover in respect of the amounts which we may have to pay under the indemnities set out above. That cover is subject to the terms and conditions of the relevant insurance, including but not limited to the limit of indemnity provided by the insurance. The insurance policies prohibit disclosure of the premium payable and the nature of the liabilities covered.
c) Options and share rights outstanding As at the date of this report there are 1,352,221 share options outstanding and 4,033,959 share rights outstanding in relation to Westpac ordinary shares. The expiry date of the share options range between 20 January 2015 and 1 October 2018 and the weighted average exercise price is $26.27. The latest dates for exercise of the share rights range between 20 January 2015 and 1 May 2024.
Holders of outstanding share options and share rights in relation to Westpac ordinary shares do not have any rights under the share options and share rights to participate in any share issue or interest of Westpac or any other body corporate.
d) Proceedings on behalf of Westpac No application has been made and no proceedings have been brought or intervened in, on behalf of Westpac under section 237 of the Corporations Act.
5. Environmental disclosure As part of our 2017 Sustainability Strategy we have set targets for our environmental performance. The Westpac Group’s environmental framework starts with ‘Our Principles for Doing Business’, which outline our broad environmental principles. This framework includes:
our Westpac Group Environment Policy, which has been in place since 1992;
our Sustainable Supply Chain Management Framework;
our Sustainability Risk Management Framework (formerly our Environmental, Social and Governance Risk Management Framework); and
public reporting of our environmental performance. We also participate in a number of voluntary initiatives including the Dow Jones Sustainability Index, CDP1, the Equator Principles, the Principles for Responsible Investment, the United Nations Global Compact and the Banking Environment Initiative’s Soft Commodities Compact.
The National Greenhouse and Energy Reporting Act 2007 (Cth) (National Greenhouse Act) came into effect in July 2008. The Group reports on greenhouse gas emissions, energy consumption and production under the National Greenhouse Act for the period 1 July through 30 June each year.
The Group was previously subject to the reporting requirements of the Energy Efficiency Opportunities Act 2006 (Cth) (EEO Act). The Commonwealth Government repealed the EEO Act, effective from 29 June 2014. Accordingly, all obligations and activities under the EEO Program, including reporting requirements, have ceased.2
Our operations are not subject to any other particular and significant environmental regulation under any law of the Commonwealth of Australia or of any State or Territory of Australia. We may, however, become subject to environmental regulation as a result of our lending activities in the ordinary course of business and we have policies in place to ensure that this potential risk is addressed as part of our normal processes.
We have not incurred any liability (including for rectification costs) under any environmental legislation.
Further details on our environmental performance, including information on our climate change approach, details of our emissions profile and environmental footprint, and progress against our environmental targets and carbon neutral program are available on our website at www.westpac.com.au/about-westpac/sustainability-and-community.
1 Formerly known as the Carbon Disclosure Project. 2 Westpac implemented or is in the process of implementing energy
efficiency opportunities which are expected to result in estimated energy savings of 107,314GJ, carbon savings of 26,456tCO2e and cost savings of $4,685,561 per year. Westpac also participated in the voluntary NSW Energy Saving Scheme and earned over $28,071 through the sale of 4,014 Energy Savings Certificates.
52 2014 Westpac Group Annual Report

Directors’ report 6. Rounding of amounts Westpac is an entity to which ASIC Class Order 98/100 dated 10 July 1998, relating to the rounding of amounts in Directors’ report and financial reports, applies. Pursuant to this Class Order, amounts in this Directors’ report and the accompanying financial report have been rounded to the nearest million dollars, unless indicated to the contrary.
7. Political expenditure In line with Westpac policy, no cash donations were made to political parties during the financial year ended 30 September 2014. The expenditure reflected in the table below relates to payment for participation in legitimate political activities where they were assessed to be of direct business relevance to Westpac. Such activities include business observer programs attached to annual party conferences, policy dialogue forums and other political functions such as speeches and events with industry participants.
Political expenditure, year ended 30 September 2014 Australia
Amount$1
Australian Labor Party 73,000Liberal Party of Australia 81,904National Party of Australia -Total 154,904
1 Represents aggregate amount at both Federal and State/Territory levels.
New Zealand The total expenditure on political activities in New Zealand for the year ended 30 September 2014 was NZ$5,420. In line with Westpac policy, no cash donations were made to political parties in New Zealand during the year.
2014 Westpac Group Annual Report 53

8. Directors’ meetings Each Director attended the following meetings of the Board and Committees of the Board during the financial year ended 30 September 2014:
Notes
Director A B C A B A B A B A B A BLindsay Maxsted 1 8 8 - 4 4 4 4 4 4 - - - -Gail Kelly 2 8 8 - - - - - - - - - 4 4John Curtis 3 4 4 1 - - 2 2 2 2 2 2 - -Elizabeth Bryan 4 8 8 - - - 4 4 4 4 4 4 2 2Gordon Cairns 5 3 3 - - - 1 1 - - 1 1 - -Ewen Crouch 6 7 7 1 - - 4 4 2 2 4 4 - -Alison Deans 7 3 3 - - - 2 2 - - - - 2 2Robert Elstone 8 8 8 - 4 4 4 4 4 4 2 2 2 2Peter Hawkins 9 8 8 - 4 4 4 4 4 4 - - 4 4Peter Marriott 10 8 8 - 4 4 4 4 - - - - 2 2Ann Pickard 11 8 8 - - - 4 4 - - 4 4 - -
Nominations Committee
Remuneration Committee
Technology Committee
Number of meetingsheld during the year
Board Audit CommitteeRisk & Compliance
Committee
This table shows membership of standing Committees of the Board. From time to time the Board may form other committees or request Directors to undertake specific extra duties.
A - Meetings eligible to attend as a member B - Meetings attended as a member C - Leave of absence granted
Unless otherwise stated, each Director has been a member, or the Chairman, of the relevant Committee for the whole of the period from 1 October 2013.
1 Chairman of the Board Nominations Committee. Member of the Board Audit Committee and the Board Risk & Compliance Committee. 2 Member of the Board Technology Committee. 3 John Curtis retired from the Board and its Committees on 25 April 2014. 4 Chairman of the Board Risk & Compliance Committee. Member of the Board Nominations Committee and the Board Remuneration Committee.
Member of the Board Technology Committee until 31 March 2014. 5 Gordon Cairns retired from the Board and its Committees on 13 December 2013. 6 Chairman of the Board Remuneration Committee from 25 April 2014. Member of the Board Remuneration Committee until 24 April 2014. Member of
the Board Risk & Compliance Committee, and from 25 April 2014, a member of the Board Nominations Committee. A leave of absence was granted due to illness.
7 Alison Deans was appointed as a Director on 1 April 2014. Member of the Board Risk & Compliance Committee and the Board Technology Committee from 1 April 2014.
8 Chairman of the Board Audit Committee. Member of the Board Nominations Committee, the Board Risk & Compliance Committee, and from 1 April 2014, a member of the Board Remuneration Committee. Member of the Board Technology Committee until 31 March 2014.
9 Chairman of the Board Technology Committee. Member of the Board Audit Committee, the Board Nominations Committee and the Board Risk & Compliance Committee.
10 Member of the Board Audit Committee, the Board Risk & Compliance Committee, and from 1 April 2014, a member of the Board Technology Committee.
11 Member of the Board Risk & Compliance Committee and the Board Remuneration Committee.
54 2014 Westpac Group Annual Report

Directors’ report 9. Remuneration report Introduction from the Chairman of the Board Remuneration Committee
Dear Shareholder,
We are pleased to present Westpac’s 2014 Remuneration Report (Report).
In my first report as Chairman of the Board Remuneration Committee, I want to reaffirm the Board’s commitment to delivering remuneration strategy outcomes that both reflect our business performance and sustainability, and attracts and retains the highest quality executives.
2014 Remuneration outcomes The fixed remuneration and incentive targets for the CEO and most Group Executives were unchanged for the third consecutive year. Our financial and operating performance is recognised in the ‘at risk’ incentive outcomes for the CEO and individual executives.
The executive team has delivered the financial performance within our risk and governance principles including maintaining our balance sheet strength and the engagement of our staff. Each year, the Board assesses actual performance achieved and considers the circumstances as to how the performance was achieved as well as the operating environment. In exercising this oversight, the Board determines remuneration outcomes that are appropriate.
The 2011 Long-Term Incentive (LTI) grant qualified for 72% vesting this year reflecting our performance against the hurdles established in late 2011. In particular:
Westpac’s LTI plan Total Shareholder Return (TSR) over the last three years was 102%, which was at the 70th percentile of the defined comparator group. Accordingly, 90% of the 2011 TSR performance tranche vested;
Westpac’s Cash Earnings per Share (EPS) growth over the last three years totalled 17.1%, which was above the threshold of 15.8% (5% compound annual growth) but below the maximum of 33.1% (10% compound annual growth). Accordingly, 54% of the 2011 EPS performance tranche vested; and
as re-testing was removed from our LTI plans in 2011, the remaining portion (28%) has lapsed.
New executive appointments There have also been a number of Group Executive appointments during 2014, the majority drawing on our pool of internal talent. All new Group Executives have been appointed at remuneration levels set below prior incumbents. All new Group Executive appointments have had the Group’s target pay mix applied to their remuneration package.
Remuneration frameworks Last year, we indicated we would undertake a further review of our remuneration frameworks, recognising that broader market practices and expectations continue to evolve. The focus of the review was our equity based payments and the result is that a number of refinements will be implemented in 2015. The changes include:
the extension of the performance/vesting period for LTI grants from three to four years;
the introduction of a new weighted peer performance hurdle for the TSR grant. This new hurdle increases the relative weight applied to the performance of our three major bank peers as this is a key benchmark for shareholders; and
the increase from 40% to 50% of the proportion of the Short-Term Incentive (STI) outcome deferred into equity.
We have also strengthened our malus provisions, such that should circumstances arise where an equity allocation is no longer justified, we can reduce or cancel unvested allocations. These changes are explained in more detail in this Report.
We are confident that the changes will complement our existing focus on the alignment of individual Group Executive performance and remuneration with sustained Group performance and the interests of our shareholders.
Ewen Crouch Chairman – Board Remuneration Committee
2014 Westpac Group Annual Report 55

1. Governance and risk management This section details the Group’s approach to governance and risk management as they relate to remuneration.
1.1. Governance The Group’s remuneration policies and practices strive to fairly and responsibly reward employees, having regard to performance, the Group’s risk management framework, the law and high standards of governance.
The role of the Board is to provide strategic guidance for the Group and effective oversight of management. In this way, the Board is accountable to shareholders for performance. As part of this role, the Board has overall responsibility for remuneration.
The Remuneration Committee supports the Board. Its primary function is to assist the Board to fulfil its responsibilities to shareholders with regard to remuneration. The Remuneration Committee monitors the Group’s remuneration policies and practices, external remuneration practices, market expectations and regulatory requirements in Australia and internationally. The Committee’s purpose, responsibilities and duties are outlined in the Charter which is available on the Group’s website.
All Board Committee Charters are reviewed every two years. The Board Remuneration Committee Charter was last reviewed and amended in May 2014.
Members of the Remuneration Committee during 2014 All members of the Remuneration Committee are independent Non-executive Directors. During 2014, the members were:
John Curtis (Chairman retired 25 April 2014);
Ewen Crouch (Chairman from 25 April 2014);
Elizabeth Bryan;
Gordon Cairns (retired 13 December 2013);
Robert Elstone (member from 1 April 2014); and
Ann Pickard.
Independent remuneration consultant During 2014, the Board retained Guerdon Associates as its independent consultant to provide specialist information on executive remuneration and other Group remuneration matters. These services are provided directly to the Remuneration Committee and are independent of management. The Chairman of the Remuneration Committee oversees the engagement of, remuneration arrangements for, and payment of, the independent consultant.
Work undertaken by Guerdon Associates during 2014 included the provision of information relating to the benchmarking of Non-executive Director, CEO and Group Executive remuneration; market practice regarding the Group’s LTI plan and variable reward pool; and analysis regarding the Group’s Earnings per Share (EPS) LTI performance hurdle and the development of a new Total Shareholder Return (TSR) weighted peer group LTI performance hurdle. No remuneration recommendations, as prescribed under the Corporations Act, were made by Guerdon Associates in 2014.
Other internal governance structures The Westpac internal governance structure includes three levels of Remuneration Oversight Committees (ROCs) which focus on the appropriateness and consistency of remuneration arrangements and outcomes within individual functions and divisions and across the Group. The ROCs support the Board Remuneration Committee by ensuring that the Group-wide remuneration frameworks and outcomes are consistent with the Group’s approved policy.
1.2. Risk management We aim to integrate effective risk management into the remuneration framework throughout the organisation. The Chairman of the Board Risk and Compliance Committee is a member of the Remuneration Committee, and members of the Remuneration Committee are also members of the Board Risk and Compliance Committee. In carrying out its duties, the Remuneration Committee can access personnel from risk and financial control, and engage external advisors who are independent of management.
The Group’s remuneration strategy, executive remuneration framework, policies and practices all reflect the sound risk management that is fundamental to the way we operate. The performance of each division within the Group is reviewed and measured with reference to how risk is managed and the results influence remuneration outcomes.
The executive total reward framework specifically includes features to take account of risk.
Each year, the Board determines the size of the variable reward pool which funds variable reward outcomes across the Group. This is based on the Group’s performance for the year and an assessment of how profit should be shared among shareholders and employees and retained for growth. The primary financial indicator used is economic profit, which measures profitability adjusted for risk in the business. Cash earnings, return on equity (ROE), cash EPS and dividends are also taken into account.
STI outcomes are based on both financial and non-financial measures, with the latter reflecting risk management outcomes and progress on the implementation of the Group’s strategy. Group economic profit and Group return on equity accounted for 40% of the CEO’s scoreboard for 2014. Similarly, Group Executive scoreboards had 40% of their STI allocated based on Group economic profit, divisional economic profit and/or Group return on equity. A performance measure related to the Board’s Risk Appetite Statement accounted for a further 10% of the CEO’s and Group Executives’ scoreboards. In addition, the CEO and each Group Executive are assessed on specific risk measures that may influence any discretionary adjustment to the scoreboard. Ultimately, the Board has 100% discretion over the STI outcome. We believe this discretion is vital to balance a mechanistic approach in determining performance and reward outcomes and to enable previous decisions (either good or bad) to be taken into account. This discretion may be exercised both up and down.
56 2014 Westpac Group Annual Report

Directors’ report Approval of remuneration decisions We follow a strict process of ‘two-up’ approval for all remuneration decisions. This means that remuneration is approved by the next most senior person above the employee’s manager. This concept is also reflected in our requirement for the Board, based on recommendations from the Remuneration Committee, to approve performance outcomes and remuneration for:
the CEO and Group Executives; and
other executives who report directly to the CEO, other persons whose activities in the Board’s opinion affect the financial soundness of the Group and any other person specified by the Australian Prudential Regulation Authority (APRA).
Performance and remuneration outcomes for all General Managers (who report to Group Executives) are approved by the CEO on the recommendation of the Group Executive to whom they report.
Any significant remuneration arrangements that fall outside the Group Remuneration Policy are referred to the Remuneration Committee for review and approval.
Shareholding requirements and hedging policy To further align their interests with those of shareholders, the CEO and Group Executives are expected to build and maintain a substantial Westpac shareholding within five years of being appointed to their role. For the CEO, the value of that shareholding is expected to be no less than five times her annual fixed package. For Group Executives, the expected minimum is a value of $1.2 million.
Participants in the Group’s equity plans are forbidden from entering either directly or indirectly into hedging arrangements for unvested securities in their STI and LTI equity awards. No financial products of any kind may be used to mitigate the risk associated with these equity instruments. Any attempt to hedge these securities makes them subject to forfeiture. These restrictions have been in place for some time and satisfy the requirements of the Corporations Act which prohibit hedging of unvested securities.
2014 Westpac Group Annual Report 57

2. Key management personnel remuneration disclosed in this Report The remuneration of key management personnel (KMP) for the Group is disclosed in this Report. In 2014, KMP comprised Non-executive Directors, the CEO and Group Executives who reported to the CEO and/or led significant parts of the business.
CEO and Group Executives
Name Position Term as KMP
Gail Kelly Managing Director & Chief Executive Officer Full Year
Group Executives John Arthur Chief Operating Officer Full Year
Peter Clare1 Chief Executive Officer, Westpac New Zealand Limited Part Year
Philip Coffey 2 Deputy Chief Executive Officer Full Year
Brad Cooper Chief Executive Officer, BT Financial Group Full Year
David Curran3 Chief Information Officer Part Year
George Frazis Chief Executive Officer, St.George Banking Group Full Year
Brian Hartzer Chief Executive, Australian Financial Services Full Year
Alexandra Holcomb4 Chief Risk Officer Part Year
Peter King5 Chief Financial Officer Part Year
Christine Parker Group Executive, Human Resources & Corporate Affairs Full Year
Greg Targett6 Chief Risk Officer Part Year
Rob Whitfield Group Executive, Westpac Institutional Bank Full Year
Jason Yetton Group Executive, Westpac Retail & Business Banking Full Year
Non-executive Directors
Name Position Term as KMP
Lindsay Maxsted Chairman Full Year
John Curtis7 Deputy Chairman Part Year
Elizabeth Bryan Director Full Year
Gordon Cairns8 Director Part Year
Ewen Crouch Director Full Year
Alison Deans9 Director Part Year
Robert Elstone Director Full Year
Peter Hawkins Director Full Year
Peter Marriott Director Full Year
Ann Pickard Director Full Year 1 Peter Clare resigned effective 12 August 2014. 2 Philip Coffey was the Chief Financial Officer prior to his appointment as Deputy Chief Executive Officer on 1 April 2014. 3 David Curran was appointed Chief Information Officer effective 8 September 2014. 4 Alexandra Holcomb was General Manager, Global Transactional Services prior to her appointment as Chief Risk Officer on 1 August 2014. 5 Peter King was the Deputy Chief Financial Officer prior to his appointment as Chief Financial Officer on 1 April 2014. 6 Greg Targett stepped down from the role of Chief Risk Officer on 31 July 2014 and will retire from the Group on 14 November 2014. 7 John Curtis retired on 25 April 2014. 8 Gordon Cairns retired on 13 December 2013. 9 Alison Deans was appointed on 1 April 2014.
58 2014 Westpac Group Annual Report

Directors’ report 3. Remuneration snapshot 2014 This section provides an overview of the Group’s remuneration arrangements during the 2014 financial year.
3.1. Remuneration strategy, principles and framework Executive remuneration framework The CEO and Group Executives are remunerated based on a Total Reward framework:
Fixed Remuneration(34%)
At Risk Remuneration (Variable Reward)(66%)
Comprises: cash salary; salary sacrifice items; and employer superannuation
contributions in line with statutory obligations.
Short-term Incentive (STI)34%
Long-term Incentive (LTI)32%
Maximum opportunity = 150% of Target STI Comprise performance share rights which vest over a
three-year period if performance hurdles are achieved.
Cash STI60% of Total STI
Deferred STIRestricted shares or
share rights40% of Total STI
Link pay to shareholders’ interests
Attract and retain high performing executives
Motivate strong performance against short-term and long-term performance
measures
Manage risk appropriately
Executive Total Reward Framework
Westpac’s Remuneration Strategy
The target pay mix was adopted in 2012 and will be progressively implemented for existing Group Executives as their remuneration increases. In 2014, Christine Parker and Jason Yetton received increases as their remuneration was significantly below their peers and competitor organisations. The increase was applied in line with the target pay mix. In 2014, the remuneration of Brad Cooper was adjusted to better reflect the target pay mix, with a higher proportion of his total remuneration directed to the long-term incentive. He did not receive an increase.
The Total Reward framework has three components and, in aggregate, is benchmarked against relevant financial services competitors: Fixed remuneration – takes into account the size and complexity of the role, individual responsibilities, experience, skills and disclosed market-related pay levels within the financial services industry;
Short-term incentive (STI) – is determined based on an STI target set using similar principles to those used for fixed remuneration, and on individual, divisional and Group performance objectives for the year. Performance is measured against risk-adjusted financial targets and non-financial targets that support the Group’s strategy; and
Long-term incentive (LTI) – is designed to align the total remuneration of executives to the long-term performance of the Group and the interests of shareholders. The amount of the award takes into account market benchmarks, individual performance over time, succession potential and key skills.
3.2. Remuneration for all other employees The remuneration strategy for all other employees remains aligned with our approach for Group Executives. In particular:
fixed remuneration is aligned to the market and is reviewed annually; we provide superannuation for employees in Australia, New Zealand and some other countries in which we operate; employees have the opportunity to participate in an STI scheme designed to support the objectives of their division and the
Group, including risk management. All employees who receive an STI award above a certain threshold have a portion of the award deferred; and
eligible employees may receive an annual award of Westpac ordinary shares up to the value of $1,000 under the Employee Share Plan provided the Group meets at least one of two hurdles: an increase in share price or the achievement of a basket of strategic measures. The CEO, Group Executives and any other employee who received an STI award deferred into equity or an LTI award during the year are not eligible to receive an Employee Share Plan award for that year.
2014 Westpac Group Annual Report 59

4. Executive remuneration 4.1. Remuneration structure and policy a) Fixed remuneration Fixed remuneration comprises cash salary, salary sacrificed items and employer superannuation contributions.
The Group provides superannuation contributions in line with statutory obligations. Fixed remuneration is reviewed annually and is effective from 1 January each year taking into consideration: role and accountabilities;
relevant market benchmarks within the financial services industry; and
the attraction, motivation and retention of key executives.
The CEO’s fixed remuneration and incentive targets have been unchanged since January 2011.
b) Short-Term Incentive (STI) STI provides the opportunity for participants to earn cash and deferred equity incentives where specific outcomes have been achieved in the financial year. The CEO and each Group Executive are assessed using a balanced scoreboard, combining both annual financial and non-financial objectives which support the Group’s strategic goals.
STI targets The CEO’s STI target opportunity for 2014 remained at $3.6 million.
STI targets for Group Executives are set by the Remuneration Committee and approved by the Board at the beginning of each performance year based on a range of factors including market competitiveness and the nature of each role. The STI targets for the 2014 performance year did not increase for the CEO and those Group Executives whose fixed remuneration remained unchanged in 2014. The STI awards for Group Executives are managed within the Group-wide variable reward pool.
STI outcomes are subject to both a quantitative and qualitative assessment, including a risk management overlay, which is embedded in our scoreboard measurement process. The maximum STI opportunity is 150% of target. The Board has the capacity to adjust STI outcomes (and reduce STI outcomes to zero if appropriate) in the assessment process.
STI structure 2014 The table below details how and when STI outcomes are delivered, and for deferred payments, the type of equity and the instrument used:
STI Structure
Cash STI
60% of the 2014 STI
outcome will be paid as cash in
December 2014.
Deferred STI
40% of the 2014 STI outcome will be deferred in the form of restricted Westpac ordinaryshares or rights to ordinary
shares.
Vesting Details
Half ofdeferred STI will vest in
October 2015.
Half of deferred STI will vest in
October 2016.
Deferred STI Equity Delivered
Executive Type of Equity Equity Plan
CEO Westpac ordinary shares1
CEO RestrictedShare Plan
Group Executives in
Australia
RestrictedShare Plan
Group Executives
outside Australia
Westpac share rights2
WestpacPerformance
Plan
1 Shares granted under the CEO Restricted Share Plan and the Restricted Share Plan rank equally with Westpac ordinary shares for dividends and
voting rights from the date they are granted. The Board has the discretion to satisfy vested share right grants and the allocation of subsequent shares to participants, or the allocation of restricted shares under the deferred STI, by either the issue of new shares or on-market purchase of shares.
2 Rights to ordinary shares entitle the holder to Westpac ordinary shares at the time of vesting.
60 2014 Westpac Group Annual Report

Directors’ report By deferring a portion of the STI in the form of restricted equity, incentive payments are better aligned with the interests of shareholders as the ultimate value of the deferred portion is tied to movements in share price over the restriction period. The deferred STI awards are allocated as restricted shares and, as they recognise past performance and are not subject to further performance conditions, attract dividend distributions over the vesting period.
If an executive resigns or retires, or otherwise leaves the Group before his or her securities vest, the Board has discretion in relation to how those securities are treated. If the executive leaves the Group to join another organisation, or is terminated for cause, his or her securities are generally forfeited. In other circumstances, the Board may elect to allow the securities to remain on foot for the balance of the relevant restriction period and then vest.
Securities are also subject to forfeiture at the Board’s discretion in the event of a material issue or financial mis-statement.
Details of deferred STI allocations granted in prior years, which have been exercised during the year ended 30 September 2014, are included in Section 6.4 of this Report.
STI structure 2015 For 2015, we have reduced the proportion paid as cash to 50% and increased the deferred STI proportion to 50% of the outcome. The deferral arrangements remain unchanged.
STI Structure 2015 (Group Executives)
Cash STI
50% of the 2015 STI outcome will be paid as cash in December 2015.
Deferred STI
50% of the 2015 STI outcome will be deferred in the form of restricted Westpac ordinary shares or rights to ordinary shares.
Vesting Details
Half of deferred STI will vest in October 2016.
Half of deferred STI will vest in October 2017.
2014 Westpac Group Annual Report 61

c) Long-Term Incentive (LTI) The CEO and Group Executives are also eligible for an LTI award.
LTI structure 2014 and 2013 The following diagram and table sets out the key features of LTI awards made in December 2013 to the CEO under the CEO Performance Plan and to Group Executives under the Westpac Reward Plan. The LTI grants to be made for the 2014 remuneration period will follow the same format and subject to performance hurdles, will vest in 2017.
LTI Equity Delivery
Executive Type of Equity Equity Plan
CEO Westpac Performance Share Rights
CEO Performance Plan
Group Executives (All locations) Westpac Reward Plan
0
25
50
75
100
0 25 50 75 100
TSR Allocation to Vest
LTI Structure (Current)
Performance share rights granted
Relative Total Shareholder Return (TSR)50% of allocation subject to this hurdle.
Cash EPS Compound Annual Growth Rate (CAGR)50% of allocation subject to this hurdle.
Vesting FrameworkThe TSR component of the allocation will be measured at 30 September 2016 and will vest in line with the diagram below if the relative TSR Ranking is at the 50th percentile
or above. There is a single test and no re-testing.
WBC Relative TSR Ranking Percentile
% o
f Allo
catio
n Ve
stin
g
Vesting FrameworkThe EPS component of the allocation will be measured at 30 September 2016 and will vest in line with the diagram
below if performance is between the threshold and maximum targets or above.
There is a single test and no re-testing.
0
25
50
75
100
0 1 2 3 4 5 6
EPS Allocation to Vest
% o
f Allo
catio
n Ve
stin
g
BelowTarget
MaximumTarget
AtTarget
WBC EPS Target
LTI structure 2015 Two key changes have been made to the LTI plan and the grants to be awarded to Group Executives for the 2015 remuneration period.
(i) The performance vesting period will increase to four years. The LTI grant will continue to be divided into two equal tranches which will vest as follows:
TSR tranche – measured four years from the commencement date; and EPS tranche – measured three years from the commencement date (aligned with our business planning and forecasting
cycle) and a one year holding lock applied to any rights which qualify for vesting. The EPS rights which satisfy the EPS hurdle, will vest at the completion of the fourth year from the commencement date.
62 2014 Westpac Group Annual Report

Directors’ report The transition to a four year vesting cycle We currently allocate LTI grants at the end of the remuneration year, applying a three year performance vesting timeline. For 2015 and going forward, the LTI grant will be made at the beginning of the remuneration year and a four year vesting performance period applied. The 2015 grant will be made in December 2014 and will be eligible to vest in 2018.
(ii) A new weighted TSR performance hurdle will apply (50% of the allocation). A peer group of 10 financial services companies will be retained to create a peer TSR index. The performance of our three major bank peers will be weighted as 50% of the index with the remaining seven companies 50%. Weighting the peer group this way provides a more balanced perspective recognising that, as one of four major Australian banks, our performance is measured primarily against that of our three peers, being the Australia and New Zealand Banking Group, Commonwealth Bank of Australia and National Australia Bank Limited.
At the completion of the four year performance period, each company’s TSR outcome will be multiplied by their weighting (16.67% for each major bank and 7.14% for each other financial company) and the 10 numbers added together to determine the peer weighted index.
In order for 50% of the TSR tranche to vest, the Group’s TSR outcome must at least equal the peer weighted index.
For 100% to vest, the Group’s TSR outcome must exceed the growth of the peer weighted index by a margin determined with reference to the 75th percentile performance1.
The following diagram sets out the key changes to the 2015 LTI awards to Group Executives under the Westpac Reward Plan, now renamed the Westpac Long Term Incentive (LTI) Plan:
LTI Structure 2015
Performance share rights granted
Peer weighted TSR index (new)50% of allocation subject to a new hurdle.
Cash EPS CAGR (unchanged)50% of allocation subject to this hurdle.
Peer weighted TSR index and vesting profileAs at 30 September 2018, the 4 year TSR performance of each of the index companies will be multiplied by its index weighting, and the total of the 10 scores will comprise the weighted index performance measure. If the Group’s TSR outcome over the same period equals the weighted TSR index, 50% will vest. The Group’s TSR outcome must exceed the weighted index plus 21.55 for 100% to vest as illustrated below. There is a single test and no re-testing.The weighted indexCompany TSR weightingANZ Banking Group 16.67%Commonwealth Bank 16.67%National Australia Bank 16.67%Macquarie Group 7.14%Suncorp Group 7.14%AMP 7.14%Bendigo and Adelaide Bank 7.14%Bank of Queensland 7.14%Challenger 7.14%Perpetual 7.14%
4 year vesting periodWeighted TSR – measured over 4 year performance
period and will vest on 30 September 2018.
4 year vesting periodCash EPS CAGR – measured as at 30 September 2017
and any rights capable of vesting will vest on 30 September 2018.
0
25
50
75
100
Weighted TSR vesting
WBC TSR Outcome
% o
f Allo
catio
n Ve
stin
g
= Index Target Index Growth
1 21.55 (5% compound annual growth).
2014 Westpac Group Annual Report 63

LTI award opportunities The CEO was granted an LTI award of $2.7 million for 2014 under the CEO Performance Plan, unchanged from 2013.
The award was received in the form of share rights under arrangements approved by shareholders at the 2013 Annual General Meeting.
Group Executives receive annual LTI awards in the form of share rights under the Westpac LTI Plan. A share right is not a Westpac share and does not attract the payment of dividends.
At the beginning of each year, the Board, advised by the Remuneration Committee, sets the dollar value of the LTI award target for each Group Executive.
CEO Performance Plan and Westpac Reward Plan – Granted after 1 October 2013
Equity instrument
Share rights – the Board has the discretion to satisfy vested grants and the allocation of subsequent shares to participants by either the issue of new shares or the on-market purchase of shares.
Determining the number of securities
The number of share rights each individual receives is determined by dividing the dollar value of the LTI award by the value of the share rights at the beginning of the performance assessment period (performance period). The value of share rights is determined by an independent valuer taking as a starting point, the market price of Westpac shares at grant, and utilising a Monte Carlo simulation pricing model, applying assumptions based on expected life, volatility, risk-free interest rate and dividend yield associated with the securities and the risk of forfeiture attributed to each performance hurdle. The value of a share right may be different for TSR hurdled share rights than for EPS hurdled share rights.
Performance hurdles
The CEO and Group Executives only receive value from their LTI awards where the performance hurdles are achieved. The two hurdles for the December 2013 grants are Westpac’s relative TSR and Cash EPS CAGR. Relative TSR provides an external comparative measure of overall returns over a specified timeframe incorporating share price movements and assuming that dividends over the period have been reinvested. The TSR data is averaged over the three months preceding the measurement date. The Cash EPS CAGR over a three year period was introduced as an earnings measure for grants made from October 2011 in response to feedback from investors and a subsequent independent review of our LTI performance hurdles. Cash EPS CAGR provides a measure of Westpac’s financial performance. Together, the use of these two hurdles is intended to provide a balanced view of the Group’s overall performance and provide strong alignment with shareholder interests. The two hurdles operate independently.
TSR (50% of the allocation)
Cash EPS CAGR (50% of the allocation)
Westpac’s TSR percentile ranking must equal or exceed the 50th percentile of a defined group of comparator companies (peer group) over the performance period. The peer group is comprised of the top 10 selected Australian companies listed on the ASX in the financial services sector. This measure provides a link with the creation of value for shareholders over the long term (up to three years). The companies in the 2014 peer group for the CEO Performance Plan and the Westpac Reward Plan are: AMP Limited; ASX Limited; Australia and New Zealand Banking Group
Limited; Bendigo and Adelaide Bank Limited; Commonwealth Bank of Australia; Insurance Australia Group Limited; Lend Lease Group; Macquarie Group Limited; National Australia Bank Limited; and Suncorp Group Limited.
The Cash EPS CAGR measure focuses on growth in cash earnings over a three year performance period. A description of the process used to determine cash earnings is provided at Note 33 to the financial statements. Westpac has a policy of not providing guidance to the market. Accordingly, the Board will advise specific cash EPS targets and the Group’s performance against target following the test date. The cash EPS targets were developed with the assistance of an independent external advisor who was provided access to Westpac’s long-term business plan and analyst forecasts in regard to the long-term performance of Westpac and its peers.
64 2014 Westpac Group Annual Report

Directors’ report CEO Performance Plan and Westpac Reward Plan – Granted after 1 October 2013
Targets are set for stretch performance
The Board considers the vesting profile as being appropriate as 100% vesting will only occur where Westpac is ranked third or better out of the total of 11 companies (including Westpac). The TSR performance will be measured once at the completion of the three year performance period. Westpac shares will be allocated in satisfaction of vested share rights at no cost to participants.
The expensed value of the December 2012 and 2013 grants in Table 6.2 have been discounted to 50%, reflecting the Board’s current assessment of the probability of the threshold EPS hurdles being met and share rights vesting over time.
Who measures the performance hurdle outcomes?
To ensure objectivity and external validation, TSR results are calculated by an independent external consultant and are provided to the Board or its delegate to review and determine vesting outcomes.
The Cash EPS CAGR will be determined by the Board based on the cash EPS disclosed in our results for the 2015 financial year in respect of the December 2012 awards, and 2016 in respect of the December 2013 awards.
Early vesting is possible in limited cases
For awards made since 1 October 2009, unvested securities may vest before a test date if the executive is no longer employed by the Group due to death or disability. In general, any such vesting is not subject to performance hurdles being met. For the CEO, all unvested securities will vest if the CEO leaves the Group due to sickness or in certain circumstances, such as within 12 months of a change of control of Westpac.
No re-testing There is no re-testing on awards made since 2011. Any securities remaining unvested after the nominated measurement period and any post measurement holding lock period lapse immediately.
Treatment of securities
The Board has discretion in relation to performance share rights where the CEO or a senior executive resigns or retires, or otherwise leaves the Group before vesting occurs. This discretion enables the Board to vest the relevant securities or leave them on foot for the remainder of the performance period. In exercising its discretion, the Board will take into account all relevant circumstances including those surrounding the departure in question. The Board may also adjust the number of performance share rights downwards, or to zero (in which case they will lapse) where the circumstances of the departure warrant, or to respond to misconduct resulting in significant financial and/or reputational impact to Westpac. Where a holder acts fraudulently or dishonestly, or is in material breach of his or her obligations under the CEO Performance Plan, or the Westpac Reward Plan and/or to the Group, unexercised performance share rights (whether vested or unvested) will lapse unless the Board determines otherwise.
Other long-term awards The Restricted Share Plan and Westpac Performance Plan are used:
to grant deferred STI awards to certain employees; and
for one-off awards to attract Group Executives, executives or specialist employees to the Group or for retention in specific circumstances. Where awards are made on joining, these typically compensate for real value forfeited on leaving the previous employer which might otherwise deter that executive from joining the Group.
Awards to key employees below senior management level may also be made under the Restricted Share Plan and Westpac Performance Plan. Under these arrangements, employees receive awards of Westpac ordinary shares or share rights which are restricted for a period as determined by the Board. This allows the flexibility to tailor the restriction period to the circumstances of the award.
Other plans and awards We provide separate reward plans for small, specialised parts of the business. Payments under these plans are directly linked to growth of that part of the business and are capped at an appropriate proportion of the value and/or profitability of the relevant part of the business. These plans are designed to provide market competitive remuneration for the relevant employees.
2014 Westpac Group Annual Report 65
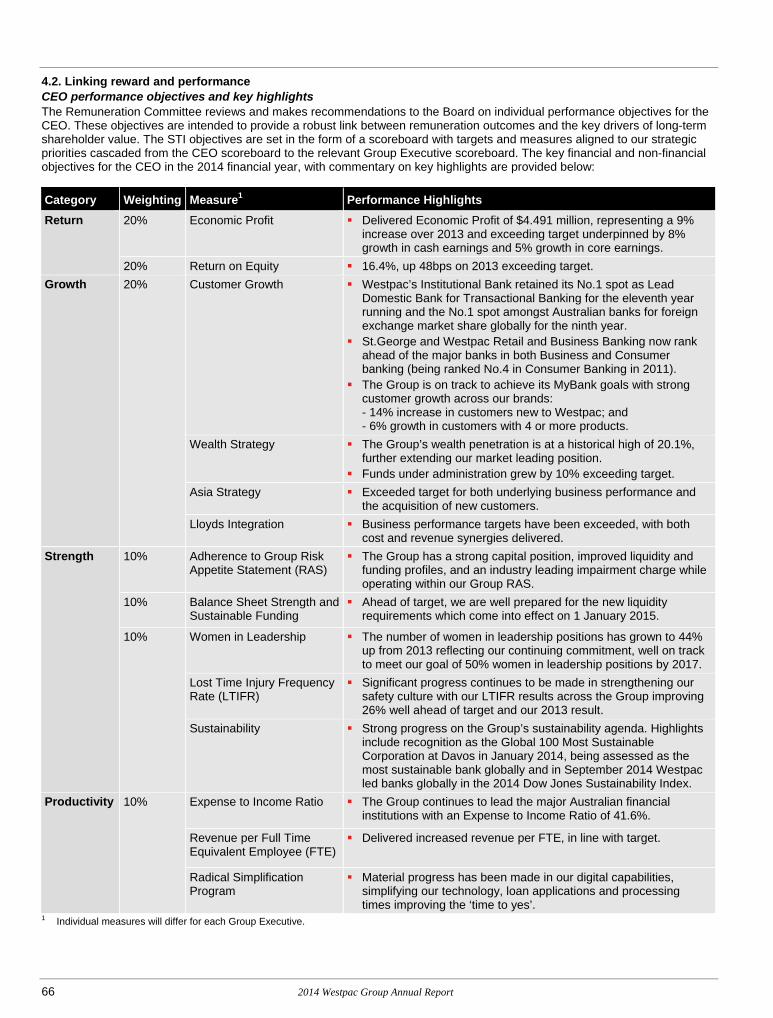
4.2. Linking reward and performance CEO performance objectives and key highlights The Remuneration Committee reviews and makes recommendations to the Board on individual performance objectives for the CEO. These objectives are intended to provide a robust link between remuneration outcomes and the key drivers of long-term shareholder value. The STI objectives are set in the form of a scoreboard with targets and measures aligned to our strategic priorities cascaded from the CEO scoreboard to the relevant Group Executive scoreboard. The key financial and non-financial objectives for the CEO in the 2014 financial year, with commentary on key highlights are provided below:
Category Weighting Measure1 Performance Highlights Return 20% Economic Profit Delivered Economic Profit of $4.491 million, representing a 9%
increase over 2013 and exceeding target underpinned by 8% growth in cash earnings and 5% growth in core earnings.
20% Return on Equity 16.4%, up 48bps on 2013 exceeding target. Growth 20% Customer Growth Westpac’s Institutional Bank retained its No.1 spot as Lead
Domestic Bank for Transactional Banking for the eleventh year running and the No.1 spot amongst Australian banks for foreign exchange market share globally for the ninth year.
St.George and Westpac Retail and Business Banking now rank ahead of the major banks in both Business and Consumer banking (being ranked No.4 in Consumer Banking in 2011).
The Group is on track to achieve its MyBank goals with strong customer growth across our brands: - 14% increase in customers new to Westpac; and - 6% growth in customers with 4 or more products.
Wealth Strategy The Group’s wealth penetration is at a historical high of 20.1%, further extending our market leading position.
Funds under administration grew by 10% exceeding target. Asia Strategy Exceeded target for both underlying business performance and
the acquisition of new customers. Lloyds Integration Business performance targets have been exceeded, with both
cost and revenue synergies delivered. Strength 10% Adherence to Group Risk
Appetite Statement (RAS) The Group has a strong capital position, improved liquidity and
funding profiles, and an industry leading impairment charge while operating within our Group RAS.
10% Balance Sheet Strength and Sustainable Funding
Ahead of target, we are well prepared for the new liquidity requirements which come into effect on 1 January 2015.
10% Women in Leadership The number of women in leadership positions has grown to 44% up from 2013 reflecting our continuing commitment, well on track to meet our goal of 50% women in leadership positions by 2017.
Lost Time Injury Frequency Rate (LTIFR)
Significant progress continues to be made in strengthening our safety culture with our LTIFR results across the Group improving 26% well ahead of target and our 2013 result.
Sustainability Strong progress on the Group’s sustainability agenda. Highlights include recognition as the Global 100 Most Sustainable Corporation at Davos in January 2014, being assessed as the most sustainable bank globally and in September 2014 Westpac led banks globally in the 2014 Dow Jones Sustainability Index.
Productivity 10% Expense to Income Ratio The Group continues to lead the major Australian financial institutions with an Expense to Income Ratio of 41.6%.
Revenue per Full Time Equivalent Employee (FTE)
Delivered increased revenue per FTE, in line with target.
Radical Simplification Program
Material progress has been made in our digital capabilities, simplifying our technology, loan applications and processing times improving the ‘time to yes’.
1 Individual measures will differ for each Group Executive.
66 2014 Westpac Group Annual Report

Directors’ report Our primary financial measure is economic profit which the Board believes, in combination with return on equity, is the best measure of risk-adjusted returns and of the value created for shareholders. The remaining measures focus on ensuring that we remain strong; deliver targeted growth; and drive simplification, innovation and productivity while helping our customers, communities and people to prosper and grow. The final STI outcome for 2014 reflects the Board’s view of performance across all balanced scoreboard measures relative to planned outcomes, and the value the Group has delivered for our shareholders.
Aligning pay with performance and shareholder return Graph 1 shows the CEO’s STI payment as a percentage of STI target and its relationship to our primary financial metric, economic profit, while Graph 2 shows the Group’s ROE performance being the other key financial metric. Graphs 3 and 4 show the Group’s TSR and EPS performance respectively, these being the LTI hurdles.
Graph 1: STI Award for CEO vs Economic Profit Graph 2: Return on Equity (ROE) 2011 to 2014
5060708090100110120130140150
1,700
2,200
2,700
3,200
3,700
4,200
4,700
5,200
2011 2012 2013 2014
STI A
ward
for C
EO (%
)
Econ
omic
Pro
fit ($
m)
Economic profit ($m) STI award for CEO
2,500
2,700
2,900
3,100
3,300
13
14
15
16
17
2011 2012 2013 2014
Aver
age
Shar
e Co
unt (
m)
Ret
urn
on E
quity
(%)
Return on Equity Average Share Count (m)
Graph 3: Total Shareholder Return (TSR) 2010 to 2014 Graph 4: Cash Earnings per Share (EPS) 2011 to 2014
(10)
10
30
50
70
90
110
Oct 10 Oct 11 Oct 12 Oct 13 Oct 14
Tota
l Sha
reho
lder
Ret
urn
(%)
209.
3 215.
9
227.
8
245.
4
190
200
210
220
230
240
250
2011 2012 2013 2014
Cen
ts p
er S
hare
Application of discretion The Board and the Remuneration Committee recognise that the scoreboard approach, while embracing a number of complementary performance objectives, will never entirely assess overall performance. The Remuneration Committee may therefore make discretionary adjustments, positive and negative, to the scoreboard outcomes for the CEO and Group Executives. The Remuneration Committee uses the following criteria to apply discretionary adjustments:
matters not known or not relevant at the beginning of the financial year, which are relevant to the under or over performance of the CEO and Group Executives during the financial year;
the degree of stretch implicit in the scoreboard measures and targets themselves and the context in which the targets were set;
whether the operating environment during the financial year has been materially better or worse than forecast;
comparison with the performance of the Group’s principal competitors;
any major positive or negative risk management or reputational issue that impacts the Group;
the quality of the financial result as shown by its composition and consistency;
whether there have been major positive or negative aspects regarding the quality of leadership and/or behaviours consistent with our values; and
any other relevant under or over performance or other matter not captured.
At the end of the year, the Remuneration Committee reviews performance against objectives and applies any adjustments it considers appropriate. The Remuneration Committee then recommends STI outcomes for the CEO and each Group Executive to the Board for approval, thereby ensuring the Board retains oversight of final awards.
2014 Westpac Group Annual Report 67

LTI performance outcomes The following table provides the Group’s TSR, dividend, cash earnings per share and share price performance each year from 2010 to 2014:
Years Ended 30 September2014 2013 2012 2011 2010
TSR – three years 102.03% 66.09% 25.61% 9.6% 3.7%TSR – five years 103.74% 90.91% 20.03% 18.5% 51.5%Dividends per Westpac share (cents)1 182 174 166 156 139Cash earnings per Westpac share2 $2.45 $2.29 $2.16 $2.09 $1.98Share price – high $35.99 $34.79 $24.99 $25.60 $28.43Share price – low $30.00 $24.23 $19.00 $17.84 $20.56Share price – close $32.14 $32.73 $24.85 $20.34 $23.24
1 Does not include 20 cent special dividend determined in 2013. 2 Cash earnings are not prepared in accordance with AAS and have not been subject to audit.
The vesting outcomes for awards made to the CEO and Group Executives under the CEO Performance Plan and Westpac Reward Plan that reached the completion of the performance period during the financial year, are set out below.
TSR hurdle vesting outcomes Remain
Commencement TSR Percentile in Vested Lapsed in PlanEquity Instrument Type of Equity Date1 Test Date Ranking Group % % %
CEO Performance Plan Performance share rights 21 December 2009 21 December 2013 2 60th percentile 70 - 301 October 2010 1 October 2014 2 50th percentile 90 - 101 October 2011 1 October 2014 70th percentile 90 10 -
Westpac Reward Plan Performance share rights 1 October 2009 1 October 2014 3 50th percentile 90 10 -1 October 2010 1 October 2014 2 50th percentile 90 - 101 October 2011 1 October 2014 70th percentile 90 10 -
1 Commencement date refers to the commencement of the performance period. 2 Second test date. There is no re-testing for awards granted since 2011. 3 Third test date. Unvested share rights lapsed.
Cash CAGR EPS hurdle vesting outcomes Commencement Cash EPS CAGR Vested Lapsed
Equity Instrument Type of Equity Date1 Test Date Performance % %
CEO Performance Plan Performance share rights 1 October 2011 1 October 2014 5.40% 54 46Westpac Reward Plan Performance share rights 1 October 2011 1 October 2014 5.40% 54 46
1 Commencement date refers to the commencement of the performance period.
2011 Cash EPS CAGR hurdle The Cash EPS CAGR hurdle for the 2011 LTI grant required the following conditions to be met over the three year vesting period:
a minimum of 5% CAGR for 50% to vest;
10% CAGR for 100% to vest; and
straight-line vesting between 5% and 10% CAGR.
The Cash EPS CAGR range was developed prior to the allocation in December 2011, and reflected stretch targets in the context of both consensus analyst forecasts and the Westpac strategic plan and business forecasting. The performance range also reflected the forecast market and operating conditions in late 2011.
68 2014 Westpac Group Annual Report

Directors’ report 4.3. Remuneration outcomes for the CEO and Group Executives – Linking reward and performance The following table has been prepared to provide shareholders with an outline of the remuneration which has been received for the 2014 performance year either as cash or in the case of prior equity awards, the value which has vested in 2014 (see note 4 below). Details in this table supplement the statutory requirements in Section 6.2. Unlike the statutory table, which represents remuneration outcomes prepared in accordance with Australian Accounting Standards (AAS), this table shows the actual remuneration value received by executives and is not prepared in accordance with AAS.
Fixed Remuneration1
2014 STI Cash Payment2
2014 Total Cash Payments3
Prior Year Equity Awards4
Vested during 2014Prior Year Equity Awards4
Forfeited during 2014$ $ $ $ $
Managing Director & Chief Executive OfficerGail Kelly 3,028,096 2,743,200 5,771,296 7,059,026 -
Group ExecutivesJohn Arthur 1,227,422 943,800 2,171,222 1,748,054 -Philip Coffey5 1,414,941 1,120,080 2,535,021 2,110,115 -Brad Cooper 1,084,752 1,123,200 2,207,952 2,390,267 -David Curran5 66,207 - 66,207 - -George Frazis 950,264 1,161,600 2,111,864 1,790,578 -Brian Hartzer6 2,258,792 1,162,500 3,421,292 5,995,138 -Alexandra Holcomb5 137,179 101,864 239,043 - -Peter King5 433,428 337,212 770,640 - -Christine Parker 779,747 702,000 1,481,747 611,353 -Rob Whitfield 1,811,809 1,152,000 2,963,809 2,113,287 -Jason Yetton 959,924 702,000 1,661,924 792,549 -
Former Group ExecutivesPeter Clare5 1,061,962 - 1,061,962 1,616,222 4,178,640Greg Targett5 1,115,262 690,000 1,805,262 1,755,951 -
1 Fixed remuneration includes cash salary, annual leave accrual and salary sacrificed items plus employer superannuation contributions. 2 The cash STI payment represents 60% of the 2014 STI outcome and will be paid in December 2014. The remaining 40% is deferred in the form of
equity and will vest in equal tranches in October 2015 and 2016. 3 This is the addition of the first and second columns. 4 Prior year equity awards include both deferred STI and LTI allocations subject to performance hurdles which have vested in 2014 (refer Brian Hartzer
below). The equity value has been calculated as the number of securities that vested during the year ended 30 September 2014, multiplied by the five day volume weighted average price of Westpac ordinary shares at the time they vested, less any exercise price payable.
5 Refer Section 2 of the Remuneration report for details. 6 Brian Hartzer, Chief Executive, Australian Financial Services (AFS), was recruited to the Group in late 2011 and commenced employment in
June 2012. The value shown as vested equity above relates to a specific allocation made in 2012, and reflects equity foregone with his previous employer.
5. Non-executive Director remuneration 5.1. Structure and policy Remuneration policy Westpac’s Non-executive Director remuneration strategy is designed to attract and retain experienced, qualified Board members and remunerate them appropriately for their time and expertise. As the Board’s focus is on strategic direction, long-term corporate performance and the creation of shareholder value, fees for Non-executive Directors are not directly related to the Group’s short-term results and Non-executive Directors do not receive performance-based remuneration. Non-executive Director remuneration consists of the following components:
Remuneration Component Paid as Detail Base fee Cash This fee is for service on the Westpac Banking Corporation Board.
The base fee for the Chairman covers all responsibilities, including all Board Committees.
Committee fees Cash Additional fees are paid to Non-executive Directors for chairing or participating in Board Committees.
Employer superannuation contributions
Superannuation Reflects statutory superannuation contributions which are capped at the superannuation maximum contributions base as prescribed under the Superannuation Guarantee legislation.
Subsidiary Board and Advisory Board fees
Cash Fees are for service on Subsidiary Boards and Advisory Boards. These fees are paid by the relevant subsidiary company.
2014 Westpac Group Annual Report 69

Non-executive Director remuneration in 2014 Non-executive Director fee review – effective 1 October 2013 The Board reviewed the Non-executive Director fee framework in late 2013. On the basis of market data provided by Guerdon Associates, the Board approved a 4.8% increase to Non-executive Director base fees effective 1 October 2013. The Chairman and Deputy Chairman fees increased by 2.63% and 4.81% respectively. Remuneration Committee fees for both the Chairman and members increased by 8.3%. No other committee fees were increased. Non-executive Director fees were last increased in 2011.
Changes to Board and Committee composition The following changes were made to Board and Committee composition:
Ewen Crouch was appointed Chairman of the Remuneration Committee, replacing John Curtis, effective 25 April 2014;
Alison Deans was appointed as a Non-executive Director to the Westpac Board effective 1 April 2014;
Robert Elstone was appointed to the Remuneration Committee effective 1 April 2014;
John Curtis retired effective 25 April 2014; and
Gordon Cairns retired effective 13 December 2013.
Fee pool At the 2008 Annual General Meeting, the current fee pool of $4.5 million per annum was approved by shareholders. For the year ended 30 September 2014, $3.14 million (70%) of this fee pool was used. The fee pool is inclusive of employer superannuation contributions.
Fee framework This section details the current Non-executive Director fee framework.
Base and committee fees The following table sets out the Board and standing Committee fees
Annual RateBase Fee $Chairman 780,000Deputy Chairman 283,000Non-executive Directors 220,000Committee Chairman FeesAudit Committee 60,000Risk & Compliance Committee 60,000Remuneration Committee 52,000Technology Committee 30,000Committee Membership FeesAudit Committee 30,000Risk & Compliance Committee 30,000Remuneration Committee 26,000Technology Committee 15,000
Committee fees are not payable to the Chairman of the Board and members of the Nominations Committee.
Employer superannuation contributions The Group pays superannuation contributions to Non-executive Directors of up to 9.50% of their fees (9.25% prior to 1 July 2014). The contributions are capped at the maximum compulsory superannuation contributions base prescribed under Superannuation Guarantee legislation. Employer contributions are paid into an eligible superannuation fund nominated by the Director.
Subsidiary Board and Advisory Board fees Throughout the reporting period, additional fees of $35,000 were paid to Peter Hawkins as a member of the Bank of Melbourne Advisory Board.
Equity participation Non-executive Directors have voluntarily resolved to build and maintain their individual holdings of Westpac ordinary shares to align their interests with the long-term interests of shareholders. Details of Non-executive Directors’ Westpac (and related bodies corporate) shareholdings are set out in Section 4(a) of the Directors’ report.
70 2014 Westpac Group Annual Report

Directors’ report 6. Required remuneration disclosures 6.1. Details of Non-executive Director remuneration Details of Non-executive Director remuneration are set out in the table below:
Short-term Benefits Post Employment Benefits
Westpac Banking Corporation Board Fees1
Subsidiary and Advisory Board Fees Superannuation Total
Name $ $ $ $
Lindsay Maxsted, Chairman2014 780,000 - 18,107 798,1072013 760,000 - 16,870 776,870
Elizabeth Bryan2014 314,677 - 18,107 332,7842013 309,000 - 16,870 325,870
Ewen Crouch2014 288,361 - 18,107 306,4682013 174,646 - 11,372 186,018
Alison Deans2
2014 133,519 - 9,297 142,816
Robert Elstone2
2014 331,792 - 18,107 349,8992013 310,096 - 16,870 326,966
Peter Hawkins2014 310,000 35,000 18,038 363,0382013 300,000 35,000 16,816 351,816
Peter Marriott2014 288,635 - 18,107 306,7422013 80,504 - 5,784 86,288
Ann Pickard2014 276,000 - 18,107 294,1072013 264,000 - 16,870 280,870
John Curtis2
2014 206,973 - 10,386 217,3592013 348,000 - 16,816 364,816
Gordon Cairns2
2014 57,323 - 3,722 61,0452013 264,000 - 16,870 280,870
Total fees2014 2,987,280 35,000 150,085 3,172,3652013
3 2,872,554 63,941 138,559 3,075,054
Former Non-executive Directors
1 Includes fees paid to the Chairman and members of Board Committees. 2 Refer Section 2 of the Remuneration report for details. 3 The total fees for 2013 reflect the prior year remuneration for the 2013 reported Non-executive Directors.
2014 Westpac Group Annual Report 71

6.2. Remuneration details – CEO and other Group Executives This section sets out details of remuneration for the CEO and Group Executives for the 2014 financial year, calculated in accordance with AAS.
Fixed Remu-neration1 STI (cash)2
Non-monetary Benefits3
Superann-uation
Benefits4
Long Service
LeaveRestricted
Shares5 Options6 Share Rights6 Total7
Name $ $ $ $ $ $ $ $ $
Managing Director & Chief Executive OfficerGail Kelly2014 3,001,511 2,743,200 9,853 26,585 51,170 1,957,830 - 3,192,579 10,982,728
2013 2,964,957 2,656,800 11,026 25,032 51,108 1,621,079 - 1,848,328 9,178,330
Group ExecutivesJohn Arthur, Chief Operating Officer2014 1,204,085 943,800 14,664 23,337 18,260 667,095 - 746,669 3,617,910
2013 1,175,117 951,600 14,293 23,727 18,260 484,297 - 441,316 3,108,610
Philip Coffey, Deputy Chief Executive Officer8
2014 1,387,582 1,120,080 3,169 27,359 21,079 931,706 - 876,119 4,367,094
2013 1,253,051 1,263,600 3,028 25,002 (254,682) 769,480 - 434,553 3,494,032
Brad Cooper, Chief Executive Officer, BT Financial Group2014 1,053,638 1,123,200 2,052 31,114 24,585 958,854 - 874,737 4,068,180
2013 1,009,555 1,320,000 3,028 24,896 15,217 763,815 - 449,082 3,585,593
David Curran, Chief Information Officer8
2014 60,827 - - 5,380 907 - - - 67,114
2013
George Frazis, Chief Executive Officer, St.George Banking Group2014 923,004 1,161,600 13,488 27,260 15,221 845,403 - 641,432 3,627,408
2013 925,231 1,171,200 22,505 24,931 15,221 660,204 - 316,218 3,135,510
Brian Hartzer, Chief Executive, Australian Financial Services9
2014 2,234,087 1,162,500 3,169 24,705 33,487 590,484 - 500,913 4,549,345
2013 2,145,092 1,088,100 3,028 18,927 33,487 72,161 - 114,447 3,475,242
Brian Hartzer, Remuneration impact relating to recruitment2014 - - 1,024,117 - - 978,087 - - 2,002,204
2013 - - 644,488 - - 3,373,875 - - 4,018,363
Alexandra Holcomb, Chief Risk Officer8
2014 132,303 101,864 214 4,876 463 86,361 - 38,656 364,737
Peter King, Chief Financial Officer8
2014 418,016 337,212 1,203 15,412 56,731 212,434 - 87,707 1,128,715
Christine Parker, Group Executive, Human Resources & Corporate Affairs2014 758,661 702,000 2,052 21,086 12,177 483,827 - 267,532 2,247,335
2013 782,964 691,200 223,677 19,891 12,177 374,529 - 137,885 2,242,323
Rob Whitfield, Group Executive, Westpac Institutional Bank2014 1,783,045 1,152,000 95,335 28,764 27,398 900,285 - 699,784 4,686,611
2013 1,744,159 1,171,200 299,326 24,678 27,373 827,911 - 359,415 4,454,062
Jason Yetton, Group Executive, Westpac Retail & Business Banking2014 938,553 702,000 3,169 21,371 45,038 485,976 - 470,082 2,666,189
2013 790,984 649,800 3,028 19,374 12,170 434,004 - 243,598 2,152,958
Share-based PaymentsPost Employment BenefitsShort-term Benefits
72 2014 Westpac Group Annual Report

Directors’ report
Fixed Remu-neration1 STI (cash)2
Non-monetary Benefits3
Superann-uation
Benefits4
Long Service
LeaveRestricted
Shares5 Options6 Share Rights6 Total7
Name $ $ $ $ $ $ $ $ $
Former Group ExecutivesPeter Clare, Chief Executive Officer, Westpac New Zealand Limited8
2014 1,058,461 - 121,213 3,501 - 73,169 - 305,078 1,561,4222013 1,008,654 900,000 18,293 3,466 - 183,193 - 682,595 2,796,201
Greg Targett, Chief Risk Officer8
2014 1,092,641 690,000 3,569 22,621 17,115 508,607 - 629,472 2,964,0252013 1,296,512 841,800 3,028 24,810 20,549 485,315 - 388,659 3,060,673
Short-term Benefits Post Employment Benefits Share-based Payments
1 Fixed remuneration is the total cost of salary, salary sacrificed benefits (including motor vehicles, parking, etc., and any associated fringe benefits tax
(FBT)) and an accrual for annual leave entitlements. 2 2014 STI figures reflect annual cash performance awards accrued but not yet paid in respect of the year ended 30 September 2014. 3 Non-monetary benefits are determined on the basis of the cost to the Group (including associated FBT, where applicable) and include annual health
checks, provision of taxation advice, relocation costs, living away from home expenses and allowances. 4 The CEO and Group Executives are provided with insurance cover under the Westpac Group Plan at no cost. Superannuation benefits have been
calculated consistent with AASB 119 Employee Benefits. 5 The value of restricted shares is amortised over the applicable vesting period, and the amount shown is the amortisation relating to the 2014
reporting year (and 2013 year as comparison). The equity granted to Brian Hartzer on his recruitment in 2012 relates to equity foregone with his previous employer and will be forfeited if Mr Hartzer resigns or is terminated for cause before the vesting dates.
6 Equity-settled remuneration is based on the amortisation over the vesting period (normally two or three years) of the ‘fair value’ at grant date of hurdled and unhurdled options and share rights that were granted during the four years ended 30 September 2014. Details of prior years’ grants have been disclosed in previous Annual Reports.
7 The percentage of the total remuneration which is performance related (i.e. STI cash plus share based payments) was: Gail Kelly 72%, John Arthur 65%, Peter Clare 24%, Philip Coffey 67%, Brad Cooper 73%, David Curran 0%, George Frazis 73%, Brian Hartzer 49%, Alexandra Holcomb 62%, Peter King 56%, Christine Parker 65%, Greg Targett 62%, Rob Whitfield 59% and Jason Yetton 62%. The percentage of total remuneration delivered in the form of options (including share rights) was: Gail Kelly 29%, John Arthur 21%, Peter Clare 20%, Philip Coffey 20%, Brad Cooper 22%, David Curran 0%, George Frazis 18%, Brian Hartzer 8%, Alexandra Holcomb 11%, Peter King 8%, Christine Parker 12%, Greg Targett 21%, Rob Whitfield 15% and Jason Yetton 18%.
8 Refer Section 2 of the Remuneration report for details. Remuneration details for newly appointed KMP are from the date of appointment. 9 Brian Hartzer’s remuneration for 2014 has been separated into two elements consistent with the approach adopted in 2013. The first line represents
his remuneration as the Chief Executive AFS for 2014 and the second line represents the elements which have been incurred as a result of the buy-out of equity forfeited on his resignation from his previous employer. The second line includes $542,834 in relocation benefits and $481,283 FBT expenses on his relocation from London.
2014 Westpac Group Annual Report 73

6.3. STI allocations for the CEO and Group Executives This section sets out details of STI awards for the CEO and Group Executives for the 2014 financial year.
STI Target Maximum STI1
$ % % $ % $
Managing Director & Chief Executive OfficerGail Kelly 3,600,000 150 60 2,743,200 40 1,828,800
Group ExecutivesJohn Arthur 1,300,000 150 60 943,800 40 629,200 Philip Coffey4 1,580,000 150 60 1,120,080 40 746,720 Brad Cooper 1,600,000 150 60 1,123,200 40 748,800 David Curran4 - 150 60 - 40 - George Frazis 1,600,000 150 60 1,161,600 40 774,400 Brian Hartzer 1,550,000 150 60 1,162,500 40 775,000 Alexandra Holcomb4 158,667 150 60 101,864 40 67,909 Peter King4 493,000 150 60 337,212 40 224,808 Christine Parker 900,000 150 60 702,000 40 468,000 Rob Whitfield 1,600,000 150 60 1,152,000 40 768,000 Jason Yetton 975,000 150 60 702,000 40 468,000
Former Group ExecutivesPeter Clare4 - 150 60 - 40 - Greg Targett4 958,333 150 60 690,000 40 460,000
STI Portion Paid in Cash2 STI Portion Deferred3
1 The maximum STI potential is 150% of the individual STI Target. 2 60% of the STI outcome for the year is paid as cash in December 2014. 3 40% of the actual STI outcome is deferred in the form of restricted shares or share rights, half vesting on 1 October 2015 and the remainder vesting
on 1 October 2016. 4 Refer Section 2 of the Remuneration report for details.
74 2014 Westpac Group Annual Report

Directors’ report 6.4. Movement in equity-settled instruments during the year This table shows the details of movements during 2014 in the number and value of equity instruments for the CEO and Group Executives under the relevant plans:
Name Type of Equity-based InstrumentNumber
Granted1Number Vested2
Number Exercised3
Value Granted4
$
Value Exercised5
$
Value Forfeited or Lapsed5,6
$
Gail Kelly CEO Performance share rights 159,821 158,513 158,513 3,303,309 5,456,732 -Shares under the CEO RestrictedShare Plan 57,358 55,133 - 1,767,339 - -
John Arthur Performance share rights 53,273 35,224 35,224 1,055,723 1,163,828 -Shares under Restricted Share Plan 20,544 17,682 - 633,010 - -
Philip Coffey7 Performance options - - 329,358 - 4,414,523 -Performance share rights 50,313 35,224 35,224 997,073 1,163,828 -Shares under Restricted Share Plan 27,279 28,640 - 840,532 - -
Brad Cooper Performance share rights 44,394 44,031 44,031 879,772 1,454,818 -Shares under Restricted Share Plan 28,497 28,312 - 878,062 - -
David Curran7 Performance share rights - - - - - -Shares under Restricted Share Plan - - - - - -
George Frazis Performance share rights 32,555 29,354 29,354 645,156 969,878 -Shares under Restricted Share Plan 25,284 24,839 - 779,061 - -
Brian Hartzer Performance share rights 85,828 - - 1,700,880 - -Shares under Restricted Share Plan 23,490 176,681 - 723,784 - -
Alexandra Holcomb7 Performance options - - - - - -Performance share rights - - - - - -Shares under Restricted Share Plan - - - - - -
Peter King7 Performance share rights - - - - - -Shares under Restricted Share Plan - - - - - -
Christine Parker Performance options - - 12,832 - 58,437 -Performance share rights 20,717 6,751 6,751 410,554 223,058 -Shares under Restricted Share Plan 14,922 11,752 - 459,783 - -
Rob Whitfield Performance options - - 156,232 - 2,110,786 -Performance share rights 35,515 35,224 35,224 703,806 1,163,828 -Shares under Restricted Share Plan 25,284 28,736 - 779,061 - -
Jason Yetton Performance options - - 196,989 - 2,162,819 -Performance share rights 38,475 9,393 9,393 762,471 310,352 -Shares under Restricted Share Plan 14,028 14,594 - 432,237 - -
Peter Clare7 Performance options - - 81,799 - 908,004 -Performance share rights 29,595 27,005 27,005 586,492 895,827 4,178,640Unhurdled share rights 20,995 11,106 11,106 631,819 366,577 -Shares under Restricted Share Plan - 10,805 - - - -
Greg Targett7 Performance share rights 41,434 35,224 35,224 821,108 1,163,828 -Shares under Restricted Share Plan 18,173 17,921 - 559,954 - -
Managing Director & Chief Executive Officer
Group Executives
Former Group Executives
1 No performance options were granted in 2014. 2 90% of unhurdled share rights granted in 2010 vested in October 2013 as assessed against the TSR performance hurdle. 3 Vested options and share rights that were granted prior to October 2009 can be exercised up to a maximum of 10 years from their commencement
date. For each share right and each performance option exercised during the year, the relevant executive received one fully paid Westpac ordinary share. The exercise price for share rights is nil.
4 For share rights, the value granted represents the number of securities granted multiplied by the fair value per instrument as set out in the table in the sub-section titled ‘Fair value of LTI grants made during the year’ below. For restricted shares, the value granted represents the number of ordinary shares granted multiplied by the five day volume weighted average price of a Westpac ordinary share on the date the shares were granted. These values, which represent the full value of the equity-based awards made to disclosed Group Executives in 2014, do not reconcile with the amount shown in the table in Section 6.2, which shows amortised totals of equity awards over their vesting period. The minimum total value of the grants for future financial years is nil and an estimate of the maximum possible total value in future financial years is the fair value, as shown above.
2014 Westpac Group Annual Report 75

5 The value of each option or share right exercised or lapsed is calculated based on the five day volume weighted average price of Westpac ordinary
shares on the ASX on the date of exercise (or lapse), less the relevant exercise price (if any). Where the exercise price is greater than the five day volume weighted average price of Westpac ordinary shares, the value has been calculated as nil.
6 Apart from equity instruments referred to in this section, no other equity instruments granted in prior years vested and none were forfeited during the financial year.
7 Refer Section 2 of the Remuneration report for details.
Fair value of LTI grants made during the year The table below provides a summary of the fair value of LTI awards granted to the CEO and Group Executives during 2014 calculated in accordance with Australian Accounting Standard AASB 2 Share-based Payment and is used for accounting purposes only. The LTI grants will vest on satisfaction of performance and/or service conditions tested in future financial years.
FairPerformance Commencement Value2 per
Equity Instrument Hurdle Granted to Grant Date Date1 Test Date Expiry Instrument
CEO Performance Plan Relative TSR Gail Kelly 11 November 2013 1 October 2013 1 October 2016 1 October 2023 $14.26share rights Cash EPS CAGR 11 November 2013 1 October 2013 1 October 2016 1 October 2023 $28.41
Westpac Reward Plan Relative TSR All Group 4 December 2013 1 October 2013 1 October 2016 1 October 2023 $13.25share rights Cash EPS CAGR Executives 4 December 2013 1 October 2013 1 October 2016 1 October 2023 $27.75
1 The commencement date is the start of the performance period. Awards to the CEO were approved by shareholders at the Annual General Meeting. 2 The fair values of share rights granted during the year included in the table above have been independently calculated at their respective grant dates
based on the requirements of Australian Accounting Standard AASB 2 Share-based Payment. The fair value of rights with Cash EPS CAGR hurdles has been assessed with reference to the share price at grant date and a discount rate reflecting the expected dividend yield over their vesting periods. For the purpose of allocating rights with Cash EPS CAGR hurdles, the valuation also takes into account the average Cash EPS CAGR outcome using a Monte Carlo simulation model. The fair value of rights with hurdles based on TSR performance relative to a group of comparator companies also takes into account the average TSR outcome determined using a Monte Carlo simulation pricing model.
7. Employment agreements The remuneration and other terms of employment for the CEO and Group Executives are formalised in their employment agreements. Each of these employment agreements provides for the payment of fixed and performance-based remuneration, employer superannuation contributions and other benefits such as death and disablement insurance cover.
The term and termination provisions of the employment agreements for the current KMP are summarised below.
Term Who Conditions
Duration of agreement CEO and all Group Executives Ongoing until notice given by either party
Notice to be provided by the executive or the Group to terminate the employment agreement
CEO and Group Executives 12 months1
Jason Yetton 6 months1
Termination payments to be made on termination without cause
CEO and all Group Executives Deferred STI and LTI awards vest according to the applicable equity plan rules
Termination for cause CEO, John Arthur, Brian Hartzer, Christine Parker, Greg Targett, Rob Whitfield and Jason Yetton
Immediately for misconduct 3 months’ notice for poor performance
All other Group Executives Immediately for misconduct Standard contractual notice period for
poor performance
Post-employment restraints CEO and all Group Executives 12 month non-solicitation restraint 1 Payment in lieu of notice may in certain circumstances be approved by the Board for some or all of the notice period.
76 2014 Westpac Group Annual Report

Directors’ report Certain individuals have provisions in their contracts for different terms due to grandfathered contractual benefits or individual circumstances:
Gail Kelly – In the event of death, sickness or disability or in certain circumstances within 12 months of change of control of Westpac, all unvested restricted shares and share rights will vest. On immediate termination for misconduct, all restricted shares and share rights will be forfeited. In other circumstances, the Board has discretion in relation to performance share rights and unvested restricted shares where the CEO resigns or retires, or otherwise leaves the Group before vesting occurs. This discretion enables the Board to vest performance share rights or leave them on foot for the remainder of the vesting period, subject to performance hurdles. In relation to restricted shares, the discretion enables the Board to leave unvested restricted shares on foot for the remainder of the vesting period. In exercising its discretion, the Board will take into account all relevant circumstances including those surrounding the departure;
Peter Clare – Provisions relating to his relocation from Sydney to Auckland;
Brian Hartzer – Provisions relating to his relocation from London to Sydney; and
Rob Whitfield – Provisions relating to accommodation in Sydney which ceased in January 2014.
8. Non-executive Directors, CEO and Group Executives – Additional disclosures 8.1. Details of Westpac ordinary shares held by Non-executive Directors Shareholdings The following table sets out details of relevant interests in Westpac ordinary shares held by Non-executive Directors (including their related parties) during the year ended 30 September 20141.
NameNumber Held at the
Start of YearOther Changes
During the YearNumber Held at the
End of Year
Lindsay Maxsted 16,732 551 17,283Elizabeth Bryan 25,353 1,448 26,801Ewen Crouch2 37,903 273 38,176Alison Deans3 n/a 9,000 9,000Robert Elstone 10,000 - 10,000Peter Hawkins4 15,218 - 15,218Peter Marriott 20,000 - 20,000Ann Pickard5 9,800 4,000 13,800
John Curtis3 18,460 4 n/aGordon Cairns3 17,038 - n/a
Current Directors
Former Non-executive Directors
1 None of these shares include non-beneficially held shares. 2 In addition to holdings of ordinary shares, Ewen Crouch and his related parties held interests in 250 Westpac Capital Notes 2 at year end. 3 The information relates to the period these individuals were Non-executive Directors. Refer Section 2 of the Remuneration report for details. 4 In addition to holdings of ordinary shares, Peter Hawkins and his related parties held interests in 1,370 Convertible Preference Shares at year end. 5 Ann Pickard’s relevant interests arise through holding 13,800 American Depositary Shares (ADS). One ADS represents one Westpac fully paid
ordinary share.
2014 Westpac Group Annual Report 77

8.2. Details of Westpac equity holdings of Key Management Personnel The following table sets out details of Westpac equity held by the CEO and Group Executives (including their related parties) for the year ended 30 September 20141:
NameType of Equity-based Instrument
Number Held at Start
of Year
Number Granted During
the Year as Remuneration
Received on Exercise
and/or Exercised During the
Year
Number Lapsed
During the Year
Other Changes
During the Year
Number Held at the End of the
Year
Number Vested and
Exercisable at the End of the
Year
Gail Kelly Ordinary shares 1,876,588 57,358 158,513 - (550,000) 1,542,459 - Performance options - - - - - - - Performance share rights 711,956 159,821 (158,513) - - 713,264 -
John Arthur2 Ordinary shares 140,752 20,544 35,224 - 10,530 207,050 - Performance share rights 152,521 53,273 (35,224) - - 170,570 -
Philip Coffey3 Ordinary shares 318,314 27,279 364,582 - (426,258) 283,917 - Performance options 329,358 - (329,358) - - - - Performance share rights 176,535 50,313 (35,224) - - 191,624 -
Brad Cooper Ordinary shares 56,623 28,497 44,031 - - 129,151 - Performance options 196,785 - - - - 196,785 196,785 Performance share rights 187,075 44,394 (44,031) - - 187,438 -
David Curran4,5 Ordinary shares n/a - - - - - - Performance share rights n/a - - - - - -
George Frazis Ordinary shares 100,640 25,284 29,354 - - 155,278 - Performance share rights 134,616 32,555 (29,354) - - 137,817 - Unhurdled share rights - - - - - - -
Brian Hartzer Ordinary shares 178,612 23,490 - - (176,681) 25,421 - Performance share rights 30,780 85,828 - - - 116,608 -
Alexandra Holcomb5 Ordinary shares n/a - 50,595 - (50,595) 60,601 - Performance options n/a - - - - 70,544 70,544 Performance share rights n/a - - - - 50,493 - ,
Peter King5 Ordinary shares n/a - - - (25,000) 51,956 - Performance share rights n/a - - - - 37,545 -
Christine Parker Ordinary shares 23,503 14,922 19,583 - (28,832) 29,176 - Performance options 12,832 - (12,832) - - - - Performance share rights 47,389 20,717 (6,751) - - 61,355 - Unhurdled share rights - - - - - - -
Rob Whitfield Ordinary shares 444,193 25,284 191,456 - (369,962) 290,971 - Performance options 156,232 - (156,232) - - - - Performance share rights 150,738 35,515 (35,224) - - 151,029 -
Jason Yetton Ordinary shares 136,788 14,028 206,382 - (196,989) 160,209 - Performance options 196,989 - (196,989) - - - - Performance share rights 80,386 38,475 (9,393) - - 109,468 -
Peter Clare5 Ordinary shares 96,589 - 119,910 - (71,250) n/a n/a Performance options 81,799 - (81,799) - - n/a n/a Performance share rights 122,586 29,595 (27,005) (125,176) - n/a n/a Unhurdled share rights 22,942 20,995 (11,106) - - n/a n/a
Greg Targett5 Ordinary shares 194,685 18,173 35,224 - 2,659 n/a n/a Performance share rights 157,911 41,434 (35,224) - - n/a n/a
Managing Director & Chief Executive Officer
Group Executives
Former Group Executives
1 The highest number of shares held by an individual in the above tables is 0.05% of total Westpac ordinary shares outstanding as at
30 September 2014. 2 In addition to holdings of ordinary shares, John Arthur and his related parties held interests in 1,000 Westpac Capital Notes and 885 Westpac Capital
Notes 2 at year end. 3 In addition to holdings of ordinary shares, Philip Coffey and his related parties held interests in 20,000 Westpac Capital Notes 2 at year end. 4 David Curran and his related parties held interests in 965 Westpac Convertible Preference Shares at year end. 5 This information relates to the period these individuals were Key Management Personnel. Refer Section 2 of the Remuneration report for details.
78 2014 Westpac Group Annual Report

Directors’ report 8.3. Loans to Directors and other Key Management Personnel disclosures All financial instrument transactions that have occurred during the financial year between Directors or other Key Management Personnel (KMP) and the Group are in the ordinary course of business on normal terms and conditions (including interest and collateral) as apply to other employees and certain customers. These transactions consisted principally of normal personal banking and financial investment services.
Details of loans to Directors and other KMP (including their related parties) of the Group are:
Balance at Start of Year
$
Interest Paid and Payable for the
Year$
Interest Not Charged
$
Balance at End of Year
$Number in Group at
End of Year
Directors 8,789,573 308,297 - 3,866,378 2Other KMP 6,048,376 576,334 - 14,575,662 8
14,837,949 884,631 - 18,442,040 10
Individuals (including their related parties) with loans above $100,000 during the 30 September 2014 financial year are:
Balance at Start of Year
$
Interest Paid and Payable for the
Year$
Interest Not Charged
$
Balance at End of Year
$
Highest Indebtedness
during the Year$
DirectorsLindsay Maxsted 1,170,000 73,249 - 2,341,735 2,396,109Gordon Cairns1 1,475,386 20,488 - n/a 1,916,088Ewen Crouch 1,665,458 87,419 - 1,524,643 1,697,498John Curtis1 4,478,729 127,141 - n/a 4,513,388
Other KMPPhilip Coffey 250,000 83,072 - 2,394,000 2,452,000Peter Clare1 814,208 15,103 - n/a 2,768,829Brad Cooper 2,237,554 130,511 - 3,996,192 3,996,192George Frazis 299,382 17,233 - 228,225 299,382Alexandra Holcomb1 n/a 30,328 - 2,918,498 4,256,558Christine Parker 2,186,643 95,871 - 1,960,298 2,213,970Rob Whitfield - 188,282 - 2,750,454 9,741,532Jason Yetton 199,000 9,271 - 300,000 2,770,187
1 This information relates to the period these individuals were Key Management Personnel. Refer Section 2 of the Remuneration report for details.
2014 Westpac Group Annual Report 79

10. Auditor a) Auditor’s independence declaration A copy of the auditor’s independence declaration as required under section 307C of the Corporations Act is below:
b) Non-audit services We may decide to engage PwC on assignments additional to their statutory audit duties where their expertise or experience with Westpac or a controlled entity is important.
Details of the non-audit service amounts paid or payable to PwC for non-audit services provided during the 2013 and 2014 financial years are set out in Note 34 to the financial statements.
PwC also provides audit and non-audit services to non-consolidated entities, non-consolidated trusts of which a Westpac Group entity is trustee, manager or responsible entity and non-consolidated superannuation funds or pension funds. The fees in respect of these services were approximately $7.9 million in total (2013 $7.7 million). PwC may also provide audit and non-audit services to other entities in which Westpac holds a minority interest and which are not consolidated. Westpac is not aware of the amount of any fees paid to PwC by those entities.
Westpac has a policy on engaging PwC, details of which are set out in the ‘Corporate governance’ section, including the subsection entitled ‘Engagement of the external auditor’, which forms part of this Directors’ report.
The Board has considered the position and, in accordance with the advice received from the Board Audit Committee, is satisfied that the provision of the non-audit services during 2014 by PwC is compatible with the general standard of independence for auditors imposed by the Corporations Act. The Directors are satisfied that the provision of non-audit services by PwC, as set out above, did not compromise the auditor independence requirements of the Corporations Act for the following reasons:
all non-audit services have been reviewed by the Board Audit Committee, which is of the view that they do not impact the impartiality and objectivity of the auditor; and
none of the services undermine the general principles relating to auditor independence as set out in APES 110 Code of Ethics for Professional Accountants.
Auditor’s Independence Declaration As lead auditor for the audit of Westpac Banking Corporation for the year ended 30 September 2014, I declare that, to the best of my knowledge and belief, there have been:
a. no contraventions of the auditor independence requirements of the Corporations Act 2001 in relation to the audit; and
b. no contraventions of any applicable code of professional conduct in relation to the audit.
This declaration is in respect of Westpac Banking Corporation and the entities it controlled during the period.
Michael Codling Partner PricewaterhouseCoopers
Sydney 3 November 2014
PricewaterhouseCoopers, ABN 52 780 433 757 Darling Park Tower 2, 201 Sussex Street, GPO BOX 2650, SYDNEY NSW 1171 T +61 2 8266 0000, F +61 2 8266 9999, www.pwc.com.au Liability limited by a scheme approved under Professional Standards Legislation
80 2014 Westpac Group Annual Report
Directors’ report 11. Responsibility statement The Directors of Westpac Banking Corporation confirm that to the best of their knowledge:
the consolidated financial statements for the financial year ended 30 September 2014, which have been prepared in accordance with the accounting policies described in Note 1 to the consolidated financial statements, being in accordance with Australian Accounting Standards (AAS), give a true and fair view of the assets, liabilities, financial position and profit of the Group; and
the Annual Report from the section entitled ‘Information on Westpac’ to and including the section entitled ‘Other Westpac business information’ includes a fair review of the information required by the Disclosure and Transparency Rules 4.1.8R to 4.1.11R of the United Kingdom Financial Conduct Authority.
Signed in accordance with a resolution of the Board.
Lindsay Maxsted Chairman 3 November 2014
Gail Kelly Managing Director & Chief Executive Officer 3 November 2014
2014 Westpac Group Annual Report 81

This page is intentionally left blank
82 2014 Westpac Group Annual Report

02
Five year summary
Reading this report
Review of Group operations
Divisional performance
Risk and risk management
Other Westpac business information

Five year summary1
(in $millions unless otherwise indicated) 2014 2013 2012 2011 2010Income statements for the years ended 30 September2
Net interest income 13,542 12,821 12,502 11,996 11,842Non-interest income 6,395 5,774 5,481 4,917 5,068Net operating income before operating expenses and impairment charges 19,937 18,595 17,983 16,913 16,910Operating expenses (8,547) (7,976) (7,957) (7,406) (7,416)Impairment charges (650) (847) (1,212) (993) (1,456)Profit before income tax 10,740 9,772 8,814 8,514 8,038Income tax expense (3,115) (2,947) (2,812) (1,455) (1,626)Profit attributable to non-controlling interests (64) (74) (66) (68) (66)Net profit attributable to owners of Westpac Banking Corporation 7,561 6,751 5,936 6,991 6,346Balance sheet as at 30 September2
Loans 580,343 536,164 514,445 496,609 477,655Other assets 190,499 164,933 164,167 173,619 140,622Total assets 770,842 701,097 678,612 670,228 618,277Deposits and other borrowings 460,822 424,482 394,991 370,278 337,385Debt issues 152,251 144,133 147,847 165,931 150,971Loan capital 10,858 9,330 9,537 8,173 9,632Other liabilities 97,574 75,615 79,972 82,038 80,171Total liabilities 721,505 653,560 632,347 626,420 578,159Total shareholders’ equity and non-controlling interests 49,337 47,537 46,265 43,808 40,118Key financial ratiosShareholder valueDividends per ordinary share (cents) 182 174 166 156 139Special dividends per ordinary share (cents) - 20 - - -Dividend payout ratio (%)3 74.7 79.7 85.3 67.0 64.9Return on average ordinary equity (%) 16.3 15.2 13.9 17.8 17.4Basic earnings per share (cents) 243.7 218.3 194.7 233.0 214.2Net tangible assets per ordinary share ($)4 11.57 11.09 10.49 9.96 8.96Share price ($):
High 35.99 34.79 24.99 25.60 28.43Low 30.00 24.23 19.00 17.84 20.56Close 32.14 32.73 24.85 20.34 23.24
Business performanceOperating expenses to operating income ratio (%) 42.9 42.9 44.2 43.8 43.9Net interest margin (%) 2.09 2.14 2.16 2.19 2.21Capital adequacyTotal equity to total assets (%) 6.4 6.8 6.8 6.5 6.5Total equity to total average assets (%) 6.7 6.9 6.9 7.0 6.6APRA Basel III:
Common equity Tier 1 (%)5 9.0 9.1 8.2 n/a n/aTier 1 ratio (%)6 10.6 10.7 10.3 9.7 9.1Total capital ratio (%)6 12.3 12.3 11.7 11.0 11.0
Credit qualityNet impaired assets to equity and collectively assessed provisions (%) 2.5 4.1 5.6 6.3 6.2Total provisions for impairment on loans and credit commitments to total loans (basis points) 60 73 82 88 105Other informationFull-time equivalent staff (number at financial year end)7 33,586 33,045 33,418 33,898 35,055
1 Where accounting classifications have changed or where changes in accounting policy are adopted retrospectively, comparatives have been revised and may differ from results previously reported.
2 The above income statement extracts for 2014, 2013 and 2012 and balance sheet extracts for 2014 and 2013 are derived from the consolidated financial statements included in this Annual Report. The above income statement extracts for 2011 and 2010 and balance sheet extracts for 2012, 2011 and 2010 are derived from financial statements previously published.
3 Excludes special dividends. 4 Total equity attributable to owners of Westpac Banking Corporation, after deducting goodwill and other intangible assets divided by the number of
ordinary shares outstanding, less treasury shares held. 5 Basel III was not effective in Australia until 1 January 2013. The 2012 ratio has been presented on a pro forma Basel III basis. No comparatives are
presented for other years. For further information, refer to Note 31 to the financial statements. 6 Basel III was not effective in Australia until 1 January 2013. Comparatives are presented on a Basel II basis. For further information, refer to Note 31
to the financial statements. 7 Full-time equivalent employees includes full-time and pro-rata part-time staff. It excludes staff on unpaid absences (e.g. unpaid maternity leave),
overtime, temporary and contract staff.
84 2014 Westpac Group Annual Report

Reading this report Disclosure regarding forward-looking statements This Annual Report contains statements that constitute ‘forward-looking statements’ within the meaning of Section 21E of the US Securities Exchange Act of 1934.
Forward-looking statements are statements about matters that are not historical facts. Forward-looking statements appear in a number of places in this Annual Report and include statements regarding our intent, belief or current expectations with respect to our business and operations, market conditions, results of operations and financial condition, including, without limitation, future loan loss provisions and financial support to certain borrowers. We use words such as ‘will’, ‘may’, ‘expect’, ‘intend’, ‘seek’, ‘would’, ‘should’, ‘could’, ‘continue’, ‘plan’, ‘estimate’, ‘anticipate’, ‘believe’, ‘probability’, ‘risk’ or other similar words to identify forward-looking statements. These forward-looking statements reflect our current views with respect to future events and are subject to change, certain risks, uncertainties and assumptions which are, in many instances, beyond our control, and have been made based upon management’s expectations and beliefs concerning future developments and their potential effect upon us. There can be no assurance that future developments will be in accordance with our expectations or that the effect of future developments on us will be those anticipated. Actual results could differ materially from those which we expect, depending on the outcome of various factors, including, but not limited to:
the effect of, and changes in, laws, regulations, taxation or accounting standards or practices and government policy, particularly changes to liquidity, leverage and capital requirements;
the stability of Australian and international financial systems and disruptions to financial markets and any losses or business impacts Westpac or its customers or counterparties may experience as a result;
market volatility, including uncertain conditions in funding, equity and asset markets;
adverse asset, credit or capital market conditions; changes to our credit ratings; levels of inflation, interest rates, exchange rates and
market and monetary fluctuations; market liquidity and investor confidence; changes in economic conditions, consumer spending,
saving and borrowing habits in Australia, New Zealand and in other countries in which Westpac or its customers or counterparties conduct their operations and our ability to maintain or to increase market share and control expenses;
the effects of competition in the geographic and business areas in which Westpac conducts its operations;
information security breaches, including cyberattacks; reliability and security of Westpac’s technology and risks
associated with changes to technology systems; the timely development and acceptance of new products
and services and the perceived overall value of these products and services by customers;
the effectiveness of our risk management policies, including our internal processes, systems and employees;
the occurrence of environmental change or external events in countries in which Westpac or its customers or counterparties conduct their operations;
internal and external events which may adversely impact our reputation;
changes in political, social or economic conditions in any of the major markets in which Westpac or its customers or counterparties operate;
the success of strategic decisions involving business expansion and integration of new businesses; and
various other factors beyond Westpac’s control. The above list is not exhaustive. For certain other factors that may impact on forward-looking statements made by us, refer to ‘Risk factors’ under the section ‘Risk and risk management’. When relying on forward-looking statements to make decisions with respect to us, investors and others should carefully consider the foregoing factors and other uncertainties and events.
Westpac is under no obligation to update any forward-looking statements contained in this Annual Report, whether as a result of new information, future events or otherwise, after the date of this Annual Report.
Significant developments For a discussion of significant developments impacting the Group, refer to ‘Significant developments’ under ‘Information on Westpac’ in Section 1.
Currency of presentation, exchange rates and certain definitions In this Annual Report, ‘financial statements’ means our audited consolidated balance sheets as at 30 September 2014 and 30 September 2013 and income statements, statements of comprehensive income, changes in equity and cash flows for each of the years ended 30 September 2014, 2013 and 2012 together with accompanying notes which are included in this Annual Report.
Our financial year ends on 30 September. As used throughout this Annual Report, the financial year ended 30 September 2014 is referred to as 2014 and other financial years are referred to in a corresponding manner.
We publish our consolidated financial statements in Australian dollars. In this Annual Report, unless otherwise stated or the context otherwise requires, references to ‘dollars’, ‘dollar amounts’, ‘$’, ‘AUD’ or ‘A$’ are to Australian dollars, references to ‘US$’, ‘USD’ or ‘US dollars’ are to United States dollars and references to ‘NZ$’, ‘NZD’ or ‘NZ dollars’ are to New Zealand dollars. Solely for the convenience of the reader, certain Australian dollar amounts have been translated into US dollars at a specified rate. These translations should not be construed as representations that the Australian dollar amounts actually represent such US dollar amounts or have been or could be converted into US dollars at the rate indicated. Unless otherwise stated, the translations of Australian dollars into US dollars have been made at the rate of A$1.00 = US$0.8737, the noon buying rate in New York City for cable transfers in Australian dollars as certified for customs
2014 Westpac Group Annual Report 85

purposes by the Federal Reserve Bank of New York (the ‘noon buying rate’) as of Tuesday, 30 September 2014. The Australian dollar equivalent of New Zealand dollars at 30 September 2014 was A$1.00 = NZ$1.1195, being the closing spot exchange rate on that date. Refer to ‘Exchange rates’ in Section 4 for information regarding the rates of exchange between the Australian dollar and the US dollar for the financial years ended 30 September 2010 to 30 September 2014.
Any discrepancies between totals and sums of components in tables contained in this Annual Report are due to rounding.
86 2014 Westpac Group Annual Report

Review of Group operations Selected consolidated financial and operating data We have derived the following selected financial information as of, and for the financial years ended, 30 September 2014, 2013, 2012, 2011 and 2010 from our audited consolidated financial statements and related notes.
This information should be read together with our audited consolidated financial statements and the accompanying notes included elsewhere in this Annual Report.
Accounting standards The financial statements and other financial information included elsewhere in this Annual Report, unless otherwise indicated, have been prepared and presented in accordance with Australian Accounting Standards (AAS). Compliance with AAS ensures that the financial statements also comply with International Financial Reporting Standards (IFRS) as issued by the International Accounting Standards Board (IASB).
The financial statements have been prepared in accordance with the accounting policies described in Note 1 to the financial statements.
Recent accounting developments For a discussion of recent accounting developments refer to Note 1 to the financial statements.
Critical accounting estimates Our reported results are sensitive to the accounting policies, assumptions and estimates that underlie the preparation of the income statement and the balance sheet. Our principal accounting policies are disclosed in Note 1 to the financial statements. Note 1 also includes a description of our critical accounting assumptions and estimates. We have discussed each of the assumptions and estimates with our Board Audit Committee (BAC). The following is a summary of the areas we consider involve our most critical accounting estimates. For more detail refer to Note 1 to the financial statements.
Fair value of financial instruments Financial instruments classified as held-for-trading or designated at fair value through profit or loss and financial assets classified as available-for-sale are recognised in the financial statements at fair value. All derivatives are measured and recognised at fair value. As far as possible, financial instruments are valued with reference to quoted, observable market prices or by using models which employ observable valuation parameters. Where valuation models rely on parameters for which inputs are not observable, judgments and estimation may be required.
As at 30 September 2014, the fair value of trading securities, financial assets designated at fair value through profit or loss, loans designated at fair value, available-for-sale securities and life insurance assets was $102,254 million (2013: $103,113 million). The value of financial liabilities at fair value through income statement, deposits and other borrowings at fair value, debt issues at fair value and life insurance liabilities was $88,051 million (2013: $78,395 million). The fair value of outstanding derivatives was a net asset of $1,865 million (2013: $4,634 million net liability). The fair value of financial assets and financial liabilities determined by valuation models that use unobservable market prices was $1,815 million (2013: $1,332 million) and $48 million (2013: $37 million), respectively. The fair value of other
financial assets and financial liabilities, including derivatives, is largely determined based on valuation models using observable market prices and rates. Where observable market inputs are not available, day one profits or losses are not recognised.
We believe that the judgments and estimates used are reasonable in the current market. However, a change in these judgments and estimates would lead to different results as future market conditions can vary from those expected.
Provisions for impairment charges on loans Provisions for loan impairment charges represent management’s best estimate of the losses incurred in the loan portfolios as at the balance date. There are two components of our loan impairment provisions: individually assessed provisions (IAPs) and collectively assessed provisions (CAPs).
In determining IAPs, considerations that have a bearing on the expected future cash flows are taken into account. For example, the business prospects of the customer, the realisable value of collateral, our position relative to other claimants, the reliability of customer information and the likely cost and duration of the work-out process. These judgments and estimates can change with time as new information becomes available or as work-out strategies evolve, resulting in revisions to the impairment provision as individual decisions are made.
The CAPs are established on a portfolio basis taking into account the level of arrears, collateral and security, past loss experience and expected defaults based on portfolio trends. The most significant factors in establishing these provisions are estimated loss rates and related emergence periods. The future credit quality of these portfolios is subject to uncertainties that could cause actual credit losses to differ from reported loan impairment provisions. These uncertainties include the economic environment, notably interest rates, unemployment levels, payment behaviour and bankruptcy rates.
As at 30 September 2014, gross loans to customers were $583,516 million (2013: $539,806 million) and the provision for impairment on loans was $3,173 million (2013: $3,642 million).
Goodwill Goodwill represents the excess of purchase consideration, the amount of any non-controlling interest in the acquiree and the acquisition date fair value of any previous equity interest in the acquiree, over the fair value of the identified net assets of acquired businesses. The determination of the fair value of the assets and liabilities of acquired businesses requires the exercise of management judgment. Different fair values would result in changes to the goodwill and to the post-acquisition performance of the acquisitions.
2014 Westpac Group Annual Report 87

Goodwill is tested for impairment annually by determining if the carrying value of the cash-generating unit (CGU) that it has been allocated to is recoverable. The recoverable amount is the higher of the CGU’s fair value less costs to sell and its value in use. Determination of appropriate cash flows and discount rates for the calculation of the value in use is subjective. As at 30 September 2014, the carrying value of goodwill was $9,112 million (2013: $8,868 million). Refer to Note 15 to the financial statements for further information.
Superannuation obligations The actuarial valuation of our defined benefit plan obligations are dependent upon a series of assumptions, the key ones being discount rate, salary increase rate, mortality, morbidity and investment returns assumptions. Different assumptions could significantly alter the amount of the difference between plan assets and defined benefit obligations and the amount recognised directly in retained earnings.
The superannuation deficits across all our plans as at 30 September 2014 were in aggregate $315 million (2013: $245 million).
Provisions (other than loan impairment charges) Provisions are held in respect of a range of obligations such as employee entitlements, restructuring costs, litigation provisions and non-lending losses, impairment charges on credit commitments and surplus lease space. Some of the provisions involve significant judgment about the likely outcome of various events and estimated future cash flows.
Income taxes The Group is subject to income taxes in Australia and jurisdictions where it has foreign operations. All our businesses predominantly operate in jurisdictions with similar tax rates to the Australian corporate tax rate. Significant judgment is required in determining the worldwide provision for income taxes. There are many transactions and calculations undertaken during the ordinary course of business for which the ultimate tax determination is uncertain. Provisions for tax are held to reflect these tax uncertainties. Where the final outcome of these matters is different from the amounts that were initially recorded, such differences will impact the current and deferred tax provisions in the period where such determination is made.
Life insurance contract liabilities The actuarial valuation of life insurance contract liabilities and associated deferred policy acquisition costs are dependent upon a number of assumptions. The key factors impacting the valuation of these liabilities and related assets are the cost of providing benefits and administrating the contracts, mortality and morbidity experience, discontinuance experience and the rate at which projected future cash flows are discounted.
88 2014 Westpac Group Annual Report
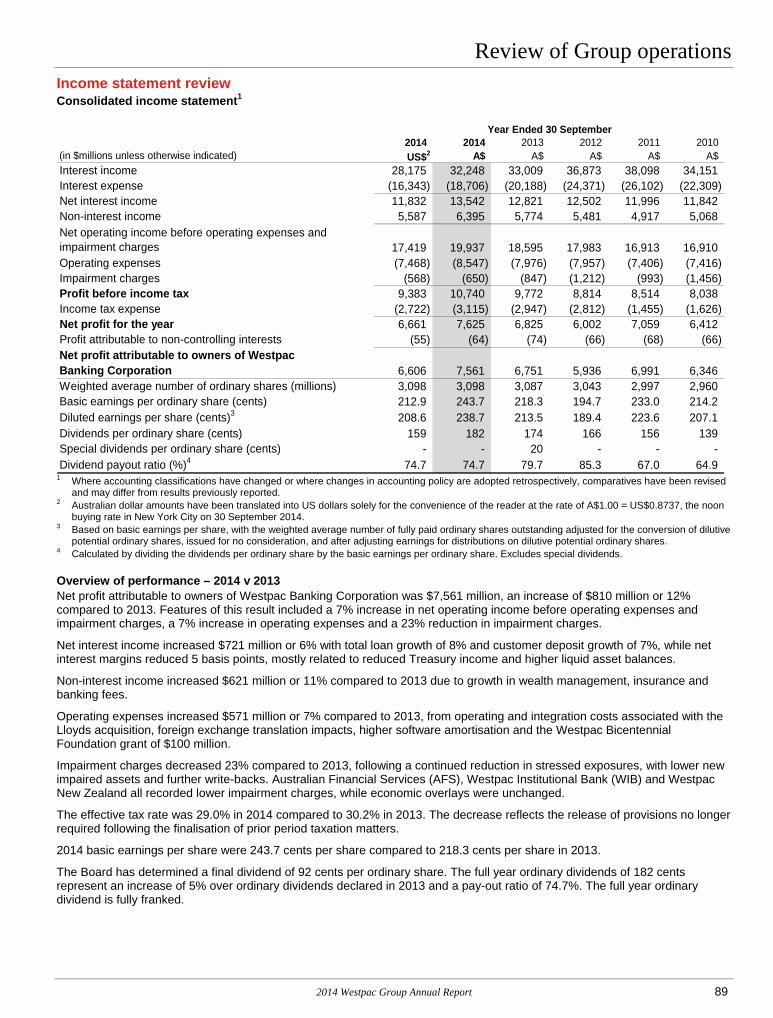
Review of Group operations Income statement review Consolidated income statement1
Year Ended 30 September2014 2014 2013 2012 2011 2010
(in $millions unless otherwise indicated) US$2 A$ A$ A$ A$ A$Interest income 28,175 32,248 33,009 36,873 38,098 34,151 Interest expense (16,343) (18,706) (20,188) (24,371) (26,102) (22,309) Net interest income 11,832 13,542 12,821 12,502 11,996 11,842 Non-interest income 5,587 6,395 5,774 5,481 4,917 5,068 Net operating income before operating expenses and impairment charges 17,419 19,937 18,595 17,983 16,913 16,910 Operating expenses (7,468) (8,547) (7,976) (7,957) (7,406) (7,416) Impairment charges (568) (650) (847) (1,212) (993) (1,456) Profit before income tax 9,383 10,740 9,772 8,814 8,514 8,038 Income tax expense (2,722) (3,115) (2,947) (2,812) (1,455) (1,626) Net profit for the year 6,661 7,625 6,825 6,002 7,059 6,412 Profit attributable to non-controlling interests (55) (64) (74) (66) (68) (66) Net profit attributable to owners of Westpac Banking Corporation 6,606 7,561 6,751 5,936 6,991 6,346 Weighted average number of ordinary shares (millions) 3,098 3,098 3,087 3,043 2,997 2,960 Basic earnings per ordinary share (cents) 212.9 243.7 218.3 194.7 233.0 214.2 Diluted earnings per share (cents)3 208.6 238.7 213.5 189.4 223.6 207.1 Dividends per ordinary share (cents) 159 182 174 166 156 139 Special dividends per ordinary share (cents) - - 20 - - - Dividend payout ratio (%)4 74.7 74.7 79.7 85.3 67.0 64.9
1 Where accounting classifications have changed or where changes in accounting policy are adopted retrospectively, comparatives have been revised and may differ from results previously reported.
2 Australian dollar amounts have been translated into US dollars solely for the convenience of the reader at the rate of A$1.00 = US$0.8737, the noon buying rate in New York City on 30 September 2014.
3 Based on basic earnings per share, with the weighted average number of fully paid ordinary shares outstanding adjusted for the conversion of dilutive potential ordinary shares, issued for no consideration, and after adjusting earnings for distributions on dilutive potential ordinary shares.
4 Calculated by dividing the dividends per ordinary share by the basic earnings per ordinary share. Excludes special dividends.
Overview of performance – 2014 v 2013 Net profit attributable to owners of Westpac Banking Corporation was $7,561 million, an increase of $810 million or 12% compared to 2013. Features of this result included a 7% increase in net operating income before operating expenses and impairment charges, a 7% increase in operating expenses and a 23% reduction in impairment charges.
Net interest income increased $721 million or 6% with total loan growth of 8% and customer deposit growth of 7%, while net interest margins reduced 5 basis points, mostly related to reduced Treasury income and higher liquid asset balances.
Non-interest income increased $621 million or 11% compared to 2013 due to growth in wealth management, insurance and banking fees.
Operating expenses increased $571 million or 7% compared to 2013, from operating and integration costs associated with the Lloyds acquisition, foreign exchange translation impacts, higher software amortisation and the Westpac Bicentennial Foundation grant of $100 million.
Impairment charges decreased 23% compared to 2013, following a continued reduction in stressed exposures, with lower new impaired assets and further write-backs. Australian Financial Services (AFS), Westpac Institutional Bank (WIB) and Westpac New Zealand all recorded lower impairment charges, while economic overlays were unchanged.
The effective tax rate was 29.0% in 2014 compared to 30.2% in 2013. The decrease reflects the release of provisions no longer required following the finalisation of prior period taxation matters.
2014 basic earnings per share were 243.7 cents per share compared to 218.3 cents per share in 2013.
The Board has determined a final dividend of 92 cents per ordinary share. The full year ordinary dividends of 182 cents represent an increase of 5% over ordinary dividends declared in 2013 and a pay-out ratio of 74.7%. The full year ordinary dividend is fully franked.
2014 Westpac Group Annual Report 89

Income statement review – 2014 v 2013 Net interest income – 2014 v 2013
2014 2013 2012$m $m $m
Interest income 32,248 33,009 36,873 Interest expense (18,706) (20,188) (24,371) Net interest income 13,542 12,821 12,502 Increase/(decrease) in net interest incomeDue to change in volume 802 430 556 Due to change in rate (81) (111) (50) Change in net interest income 721 319 506
Net interest income was $13,542 million in 2014, an increase of $721 million or 6% compared to 2013.
Net interest margins declined 5 basis points to 2.09% in 2014 from 2.14% in 2013. The lower net interest margin reflected increased competition in lending and lower Treasury revenue, which were partially offset by improved margins from retail and wholesale funding costs.
Total loans1 in 2014 were 8% higher compared to 2013, with the key feature being 7% growth in Australian housing loans. Loan growth had the following specific components:
Australian housing loans increased $22.5 billion or 7%. The growth through the year reflected the Group’s focus on improving growth relative to system2 with enhancements to all elements of the mortgage process from application through to settlement;
Australian business lending increased $10.6 billion or 8% driven by acquisition of Lloyds ($5.4 billion) and a rise in institutional lending mainly in property, infrastructure and natural resources. New lending was higher by 18% across Westpac RBB and St.George, with growth partially offset by business customers remaining cautious and paying down debt;
Australian personal loans and cards increased $4.1 billion or 24% due to the acquisition of the Lloyds auto finance portfolio ($2.5 billion) and credit card growth. Customer card numbers increased due to competitive offers, product upgrades and the launch of new products throughout the year;
other overseas loans increased $3.7 billion or 38% from growth in trade finance and term loans; and New Zealand lending increased $3.0 billion or 5%, driven primarily by mortgage growth. Total deposits and other borrowings (deposits)1 increased $36.3 billion or 9% in 2014 compared to 2013. The growth in customer deposits3 of $26.6 billion or 7% was weighted to household deposits. Business deposit growth was lower, as the Group focused on deposits which are more efficient for liquidity purposes.
Deposit growth had the following specific components:
Australian customer deposits increased $20.1 billion or 6%, with growth weighted to household deposits. AFS transaction account balances were 17% higher primarily in consumer;
other overseas customer deposits increased $3.9 billion, with growth in term deposits primarily in Asia; New Zealand customer deposits increased $2.7 billion or 7%, primarily reflecting growth in consumer online deposits; and certificates of deposits increased $9.7 billion, reflecting increased short term funding to support growth in trade finance.
1 For the purposes of this discussion on net interest income, loan and deposit growth has been determined by comparing balances at 30 September 2014 to balances at 30 September 2013.
2 Source: Reserve Bank of Australia (RBA). 3 Customer deposits are a subset of total deposits. Certificates of deposit are excluded from total deposits to calculate customer deposits.
90 2014 Westpac Group Annual Report

Review of Group operations Interest spread and margin – 2014 v 2013
2014 2013 2012$m $m $m
GroupNet interest income 13,542 12,821 12,502Average interest earning assets 647,362 599,869 577,745Average interest bearing liabilities 606,553 560,470 540,527Average net non-interest bearing assets, liabilities and equity 40,809 39,399 37,218Interest spread1 1.90% 1.90% 1.87%Benefit of net non-interest bearing assets, liabilities and equity2 0.19% 0.24% 0.29%Net interest margin3 2.09% 2.14% 2.16%
1 Interest spread is the difference between the average yield on all interest earning assets and the average yield on all interest bearing liabilities. 2 The benefit of net non-interest bearing assets, liabilities and equity is determined by applying the average yield paid on all interest bearing liabilities to
the average level of net non-interest bearing funds as a percentage of average interest earning assets. 3 Net interest margin is calculated by dividing net interest income by average interest earning assets.
Net interest margin was 2.09% in 2014, a decline of 5 basis points compared to 2013. Key drivers of the margin decrease were:
a 8 basis point decline from asset spreads. The primary driver was the increase in competition from institutional lending, with mortgages and business spreads also lower;
a 4 basis point decline from Treasury and Markets, reflecting lower returns from the management of the liquids portfolio and balance sheet management in Treasury;
a 2 basis point decline as average levels of liquid assets increased $11.9 billion; and a 2 basis point decline due to lower returns on capital balances as hedge rates reduced relative to 2013; partially offset by a 11 basis point increase from lower retail and wholesale funding costs. This included:
– a 6 basis point increase from lower wholesale funding costs as pricing for new long term senior issuance was lower than maturing deals, many of which were originated during the global financial crisis, and the non-recurrence of costs relating to the buyback of certain government guaranteed debt during 2013. This was partially offset by higher Additional Tier 1 capital costs as recent issuances are more expensive; and
– a 5 basis point increase from customer deposit impacts, primarily due to improved term deposit spreads. This was partially offset by a lower hedging benefit on low interest deposits and lower working capital deposit spreads.
Non-interest income – 2014 v 2013
2014 2013 2012 $m $m $m
Fees and commissions 2,926 2,723 2,630 Wealth management and insurance income 2,254 1,944 1,791 Trading income 1,017 1,069 850 Other income 198 38 210 Total non-interest income 6,395 5,774 5,481
Non-interest income was $6,395 million in 2014, an increase of $621 million or 11% compared to 2013. The increase was primarily driven by higher fees and commissions, wealth management and insurance income and other income, partially offset by a decline in trading income.
Fees and commissions income was $2,926 million in 2014, an increase of $203 million or 7% compared to 2013. This increase was primarily due to:
an increase in credit card fee income driven by higher interchange fees through greater customer spending in premium cards and growth in customer accounts (up 3%); and
an increase in business lending fee income due to the acquisition of Lloyds and increased line fees and growth in the term lending portfolio.
Wealth management and insurance income was $2,254 million in 2014, an increase of $310 million or 16% compared to 2013. This increase was primarily due to:
higher FUM/FUA related income of $172 million with the benefit from positive net flows and improved investment markets while margins remained stable;
an increase in life insurance income of $74 million with in-force premiums rising 16% following expansion of the distribution network. Loss ratios were stable;
2014 Westpac Group Annual Report 91

an increase in general insurance income of $58 million with gross written premiums rising 11% from new business growth
with more customers choosing to insure through BTFG, higher premiums and retention rate improvements and a favourable claims experience from a decline in catastrophe and working claims; and
an increase in performance fee income of $17 million from higher BTIM performance fees ($79 million), largely offset by reduction in Hastings performance fees ($62 million); partially offset by
a decrease in lenders mortgage insurance income from lower written risk volume partly offset by lower claims consistent with decrease in portfolio size.
Trading income decreased by $52 million or 5% compared to 2013. Markets trading income was lower with higher customer related income in WIB, AFS and New Zealand offset by a negative CVA movement and lower Westpac Pacific income following the introduction of exchange rate controls in PNG impacting foreign exchange income.
Other income was $198 million in 2014, an increase of $160 million compared to 2013. This increase was primarily driven by a reduction in the loss on derivatives held for risk management of $91 million reflecting unrealised movements in the AUD/NZD exchange rate, higher rental income from operating leases acquired with Lloyds of $32 million, and a rise in income from asset sales of $30 million.
Operating expenses – 2014 v 2013
2014 2013 2012 $m $m $m
Salaries and other staff expenses 4,667 4,336 4,306 Equipment and occupancy expenses 1,502 1,370 1,278 Other expenses 2,378 2,270 2,373 Total operating expenses 8,547 7,976 7,957 Total operating expenses to net operating income ratio 42.9% 42.9% 44.2%
Operating expenses were $8,547 million in 2014, an increase of $571 million or 7% compared to 2013. Excluding foreign exchange translation impacts ($98 million) and the impact of Lloyds ($163 million), operating expenses increased $310 million or 4%. The key factors of this result were:
the impact of investments which added $273 million or 3% to expense growth, including 1% from higher software amortisation and hardware depreciation; and
Westpac Bicentennial Foundation grant of $100 million; partially offset by delivery of productivity initiatives. Salaries and other staff expenses were $4,667 million in 2014, an increase of $331 million or 8% compared to 2013. Excluding the impact of Lloyds ($83 million) and foreign exchange translation impacts ($56 million) salaries and other staff expenses increased $192 million or 4%. This increase reflects:
annual salary increases and additional staff to support the Group's expansion in Bank of Melbourne and Asia; and higher performance related payments in the wealth business associated with higher performance fees earned; partially
offset by delivery of productivity savings including supplier and simplification programs. Equipment and occupancy expenses were $1,502 million in 2014, an increase of $132 million or 10% compared to 2013. This increase was driven by:
software amortisation increased $90 million and hardware depreciation increased $11 million related to the Group’s investment program, including the impact of regulatory change, Asia and digital investments;
impact of Lloyds; and an additional 16 Bank of Melbourne branches; partially offset by savings from property consolidation. Other expenses were $2,378 million in 2014, an increase of $108 million or 5% compared to 2013. This increase was driven by:
increased costs related to the Group’s investment program, including higher technology and professional services; and Westpac Bicentennial Foundation grant; partially offset by delivery of cost management initiatives including renegotiation with vendors and migration of customers from paper to
e-statements.
92 2014 Westpac Group Annual Report

Review of Group operations Impairment charges – 2014 v 2013
2014 2013 2012$m $m $m
Impairment charges 650 847 1,212Impairment charges to average gross loans (basis points) 12 16 24
The improvement in asset quality continued throughout 2014 with stressed assets and the emergence of new impaired assets continuing to reduce. This improvement contributed to a $197 million reduction in impairment charges compared to 2013. The improvement in impairment charges was most evident in the corporate and business lending portfolios. Economic overlays were stable over 2014 with a balance of $389 million at 30 September 2014.
Impairment charges of $650 million were down $197 million or 23% compared to 2013 and represented 12 basis points of average gross loans.
Key movements included:
new individually assessed provisions less write-backs and recoveries were $412 million lower than 2013, reflecting the continued reduction in new impaired assets across the Group; and
total new collectively assessed provisions (CAPs) were $215 million higher than 2013. Write-offs were similar to the prior year, while other changes in CAPs were a smaller positive. Stressed assets have continued to improve although the rate of improvement has slowed resulting in a lower benefit to CAPs.
Income tax expense – 2014 v 2013
2014 2013 2012 $m $m $m
Income tax expense 3,115 2,947 2,812 Tax as a percentage of profit before income tax expense (effective tax rate) 29.0% 30.2% 31.9%
Income tax expense was $3,115 million in 2014, an increase of $168 million or 6% compared to 2013. The effective tax rate decreased to 29.0% in 2014, from 30.2% in 2013. The decrease was largely due to the finalisation of prior period taxation matters.
2014 Westpac Group Annual Report 93

Balance sheet review Selected consolidated balance sheet data1 The detailed components of the balance sheet are set out in the notes to the financial statements.
As at 30 September 2014 2014 2013 2012 2011 2010
US$m2 A$m A$m A$m A$m A$mCash and balances with central banks 22,507 25,760 11,699 12,523 16,258 4,464Receivables due from other financial institutions 6,486 7,424 11,210 10,228 8,551 12,588Derivative financial instruments 36,175 41,404 28,356 35,489 49,145 36,102Trading securities and other financial assets designated at fair value and available-for-sale securities 71,585 81,933 79,100 71,739 69,006 55,599Loans 507,046 580,343 536,164 514,445 496,609 477,655Life insurance assets 9,617 11,007 13,149 11,907 7,916 12,310All other assets 20,070 22,971 21,419 22,281 22,743 19,559Total assets 673,486 770,842 701,097 678,612 670,228 618,277Payables due to other financial institutions 16,282 18,636 8,836 7,564 14,512 8,898Deposits and other borrowings 402,620 460,822 424,482 394,991 370,278 337,385Other financial liabilities at fair value through income statement 16,806 19,236 10,302 9,964 9,803 4,850Derivative financial instruments 34,545 39,539 32,990 38,935 39,405 44,039Debt issues 133,022 152,251 144,133 147,847 165,931 150,971Life insurance liabilities 8,420 9,637 11,938 10,875 7,002 11,560All other liabilities 9,197 10,526 11,549 12,634 11,316 10,824Total liabilities excluding loan capital 620,892 710,647 644,230 622,810 618,247 568,527Total loan capital3 9,487 10,858 9,330 9,537 8,173 9,632Total liabilities 630,379 721,505 653,560 632,347 626,420 578,159Net assets 43,107 49,337 47,537 46,265 43,808 40,118Total equity attributable to owners of WestpacBanking Corporation 42,337 48,456 46,674 44,295 41,826 38,189Non-controlling interests 770 881 863 1,970 1,982 1,929Total shareholders’ equity and non-controlling interests 43,107 49,337 47,537 46,265 43,808 40,118Average balancesTotal assets 644,025 737,124 688,295 665,804 628,428 607,677Loans and other receivables4 489,088 559,789 516,482 501,118 476,083 469,999Shareholders’ equity 40,607 46,477 44,350 42,605 39,378 36,434Non-controlling interests 753 862 1,972 1,964 1,921 1,914
1 Where accounting classifications have changed or where changes in accounting policy are adopted retrospectively, comparatives have been revised and may differ from results previously reported.
2 Australian dollar amounts have been translated into US dollars solely for the convenience of the reader at the rate of A$1.00 = US$0.8737, the noon buying rate in New York City on 30 September 2014.
3 This includes Westpac Capital Notes 2 (Westpac CN2) in 2014, Westpac Capital Notes (Westpac CN), Westpac Convertible Preference Shares (Westpac CPS) and 2004 Trust Preferred Securities (2004 TPS) in 2014 and 2013; Westpac Stapled Preferred Securities II (SPS II) in 2013; Westpac CPS, Westpac Stapled Preferred Securities (SPS), SPS II and 2004 TPS in 2012; and SPS, SPS II and 2004 TPS in 2011 and 2010.
4 Other receivables include other assets, cash and balances with central banks.
94 2014 Westpac Group Annual Report

Review of Group operations Summary of consolidated ratios
2014 2014 2013 2012 2011 2010(in $millions unless otherwise indicated) US$1 A$ A$ A$ A$ A$Profitability ratios (%)Net interest margin2 2.09 2.09 2.14 2.16 2.19 2.21 Return on average assets3 1.03 1.03 0.98 0.89 1.11 1.04 Return on average ordinary equity4 16.3 16.3 15.2 13.9 17.8 17.4 Return on average total equity5 16.0 16.0 14.6 13.3 16.9 16.5 Capital ratio (%)Average total equity to average total assets 6.4 6.4 6.7 6.7 6.6 6.3 Tier 1 ratio6 10.6 10.6 10.7 10.3 9.7 9.1 Total capital ratio6 12.3 12.3 12.3 11.7 11.0 11.0 Earnings ratiosBasic earnings per ordinary share (cents)7 212.9 243.7 218.3 194.7 233.0 214.2 Diluted earnings per ordinary share (cents)8 208.6 238.7 213.5 189.4 223.6 207.1 Dividends per ordinary share (cents) 159 182 174 166 156 139 Special dividends per ordinary share (cents) - - 20 - - - Dividend payout ratio (%)9 74.7 74.7 79.7 85.3 67.0 64.9 Credit quality ratiosImpairment charges on loans written off (net of recoveries) 1,138 1,302 1,323 1,604 1,867 1,300 Impairment charges on loans written off (net of recoveries) to average loans (bps) 23 23 25 32 38 27
Year Ended 30 September
1 Australian dollar amounts have been translated into US dollars solely for the convenience of the reader at the rate of A$1.00 = US$0.8737, the noon
buying rate in New York City on 30 September 2014. 2 Calculated by dividing net interest income by average interest earning assets. 3 Calculated by dividing net profit attributable to owners of Westpac Banking Corporation by average total assets. 4 Calculated by dividing net profit attributable to owners of Westpac Banking Corporation by average ordinary equity. 5 Calculated by dividing net profit attributable to owners of Westpac Banking Corporation by average ordinary equity and non-controlling interests. 6 Basel III was not effective in Australia until 1 January 2013. Comparatives are presented on a Basel II basis. For further information, refer to Note 31
to the financial statements. For details on this ratio refer to Note 31 to the financial statements. 7 Based on the weighted average number of fully paid ordinary shares. 8 Based on basic earnings per share, with the weighted average number of fully paid ordinary shares outstanding adjusted for the conversion of dilutive
potential ordinary shares, issued for no consideration, and after adjusting earnings for distributions on dilutive potential ordinary shares. 9 Calculated by dividing the dividends per ordinary share by the basic earnings per ordinary share. Excludes special dividends.
Balance sheet review Assets – 2014 v 2013 Total assets as at 30 September 2014 were $770.8 billion, an increase of $69.7 billion or 10% compared to 30 September 2013. Significant movements during the year included:
cash and balances with central banks increased $14.1 billion to facilitate same day settlements and additional liquid assets held in this form;
receivables due from other financial institutions decreased $3.8 billion, primarily due to higher placement of physical securities collateral in lieu of cash relating to derivate movements;
trading securities, other financial assets designated at fair value and available-for-sale securities increased $2.8 billion, reflecting higher holdings of liquid assets;
derivative assets increased $13.0 billion, driven by foreign currency translation impacts of the revaluation of cross currency swaps and forward contracts;
loans grew $44.2 billion or 8%, which included acquisition of the Lloyds book ($7.9 billion). Australian loans increased $37.5 billion, New Zealand loans increased $3.0 billion and other overseas loans increased $3.7 billion; and
life insurance assets decreased $2.1 billion as two managed funds were deconsolidated.
2014 Westpac Group Annual Report 95

Liabilities and equity – 2014 v 2013 Total liabilities as at 30 September 2014 were $721.5 billion, an increase of $67.9 billion compared to 30 September 2013. Significant movements during the year included:
payables due to other financial institutions increased $9.8 billion, primarily due to repurchase activities relating to central bank exchange settlement accounts and placements from offshore central banks;
deposits and other borrowings increased $36.3 billion. Australian deposits increased $20.1 billion, New Zealand deposits increased $2.7 billion, other overseas deposits increased $3.9 billion and certificates of deposits increased $9.7 billion;
financial liabilities at fair value through the income statement increased $8.9 billion through increased funding of securities using repurchase agreements for market inventory;
derivative liabilities increased $6.5 billion, driven by foreign currency translation impacts of the revaluation of cross currency swaps and forward contracts;
debt issues increased $8.1 billion, with an increase of covered bond outstandings of $8.0 billion. Levels of senior debt and securitisation remained stable with maturing debt replaced with issuance;
life insurance liabilities decreased $2.3 billion due to the deconsolidation of two managed funds and policyholder liability adjustments; and
equity increased $1.8 billion from increased retained profits. Loan quality 2014 v 2013
As at 30 September2014 2013 2012
$m $m $mTotal gross loans1 583,516 539,806 518,279 Average gross loansAustralia 492,670 467,835 455,753 New Zealand 58,428 50,112 45,911 Other overseas 13,125 8,807 6,930 Total average gross loans 564,223 526,754 508,594
1 Gross loans are stated before related provisions for impairment.
Total gross loans represented 76% of the total assets of the Group as at 30 September 2014, compared to 77% in 2013.
Australia and New Zealand average gross loans were $551.1 billion in 2014, an increase of $33.2 billion or 6% from $517.9 billion in 2013. This increase was primarily due to growth in Australian housing lending and institutional lending and the acquisition of the Lloyds portfolio.
Other overseas average loans were $13.1 billion in 2014, an increase of $4.3 billion or 49% from $8.8 billion in 2013. This was primarily due to growth in trade and term finance.
Approximately 14.5% of the loans at 30 September 2014 mature within one year and 23.3% mature between one year and five years. Retail lending comprises the majority of the loan portfolio maturing after five years.
96 2014 Westpac Group Annual Report

Review of Group operations
As at 30 September2014 2013 2012 2011 2010
$m $m $m $m $mImpaired loansNon-performing loans1:
Gross 2,030 3,249 4,034 4,287 4,240Impairment provisions (862) (1,363) (1,463) (1,487) (1,677)Net 1,168 1,886 2,571 2,800 2,563
Restructured loans:Gross 93 156 153 129 132Impairment provisions (44) (56) (44) (29) (32)Net 49 100 109 100 100
Overdrafts, personal loans and revolving credit greater than 90 days past due:
Gross 217 195 199 200 213Impairment provisions (141) (135) (134) (147) (155)Net 76 60 65 53 58
Net impaired loans 1,293 2,046 2,745 2,953 2,721Provisions for impairment on loans and credit commitmentsIndividually assessed provisions 867 1,364 1,470 1,461 1,622Collectively assessed provisions 2,614 2,585 2,771 2,953 3,439Total provisions for impairment on loans andcredit commitments 3,481 3,949 4,241 4,414 5,061Loan qualityTotal impairment provisions for impaired loans to totalimpaired loans2 44.8% 43.2% 37.4% 36.0% 40.7%Total impaired loans to total loans 0.40% 0.67% 0.85% 0.92% 0.95%Total provisions for impairment on loans and credit commitments to total loans 0.60% 0.73% 0.82% 0.88% 1.05%Total provisions for impairment on loans and credit commitments to total impaired loans 148.8% 109.7% 96.7% 95.6% 110.4%Collectively assessed provisions to non-housing performing loans 1.3% 1.4% 1.6% 1.7% 2.0%
1 Non-performing loans are loans with an impaired internal risk grade, excluding restructured assets. 2 Impairment provisions relating to impaired loans include individually assessed provisions plus the proportion of the collectively assessed provisions
that relate to impaired loans. The proportion of the collectively assessed provisions that relate to impaired loans was $180 million as at 30 September 2014 (2013: $190 million, 2012: $171 million, 2011: $202 million, 2010: $244 million). This sum is compared to the total gross impaired loans to determine this ratio.
The quality of our loan portfolio improved during 2014, with total impaired loans as a percentage of total gross loans of 0.40% at 30 September 2014, a decrease of 0.27% from 0.67% at 30 September 2013.
At 30 September 2014, we had 5 impaired counterparties with exposure greater than $50 million, collectively accounting for 22% of total impaired loans. This compares to 8 impaired counterparties with exposure greater than $50 million in 2013 accounting for 20% of total impaired loans. There were 9 impaired exposures at 30 September 2014 that were less than $50 million and greater than $20 million (2013: 16 impaired exposures).
At 30 September 2014, 77% of our exposure was to either investment grade or secured consumer mortgage segment (2013: 77%, 2012: 76%, 2011: 76%) and 95% of our exposure as at 30 September 2014 in our core markets of Australia, New Zealand and the Pacific region (2013: 97%, 2012: 97%, 2011: 98%).
We believe that Westpac remains appropriately provisioned with total impairment provisions for impaired loans to total impaired loans coverage at 44.8% at 30 September 2014 compared to 43.2% at 30 September 2013. Total provisions for impairment on loans and credit commitments to total impaired loans represented 148.8% of total impaired loans as at 30 September 2014, up from 109.7% at 30 September 2013. Total provisions for impairments on loans and credit commitments to total loans was 0.60% at 30 September 2014, down from 0.73% at 30 September 2013 (2012: 0.82%).
Consumer mortgage loans 90 days past due at 30 September 2014 were 0.45% of outstandings, down from 0.51% of outstandings at 30 September 2013 (2012: 0.51%).
Other consumer loan delinquencies (including credit card and personal loan products) were 0.99% of outstandings as at 30 September 2014, a decrease of 5 basis points from 1.04% of outstandings as at 30 September 2013 (2012: 1.11%).
2014 Westpac Group Annual Report 97

Potential problem loans as at 30 September 2014 amounted to $1,421 million, a decrease of 12% from $1,619 million at 30 September 2013. The reduction of potential problem loans is due mainly to the upgrade or repayment of some of these assets.
Potential problem loans are facilities that are performing and no loss is expected, but the customer demonstrates significant weakness in debt servicing or security cover that could jeopardise repayment of debt on current terms if not rectified. Potential problem loans are identified using established credit frameworks and policies, which include the ongoing monitoring of facilities through the use of watchlists.
Capital resources Capital management strategy Westpac’s approach seeks to balance the fact that capital is an expensive form of funding with the need to be adequately capitalised as an ADI. Westpac considers the need to balance efficiency, flexibility and adequacy when determining sufficiency of capital and when developing capital management plans.
Westpac evaluates these considerations through an Internal Capital Adequacy Assessment Process (ICAAP), the key features of which include:
the development of a capital management strategy, including preferred capital range, capital buffers and contingency plans; consideration of both economic and regulatory capital requirements; a process that challenges the capital measures, coverage and requirements which incorporates, amongst other things, the
impact of adverse economic scenarios; and consideration of the perspectives of external stakeholders including rating agencies and equity and debt investors. Westpac’s capital ratios are significantly above APRA minimum capital adequacy requirements.
Basel Capital Accord The regulatory limits applied to our capital ratios are consistent with A global regulatory framework for more resilient banks and banking systems, also known as Basel III, issued by the Bank of International Settlements. This framework reflects the advanced risk management practices that underpin the calculation of regulatory capital through a broad array of risk classes and advanced measurement processes.
As provided for in the Basel III accord, APRA has exercised discretions to make the framework applicable in the Australian market, and in particular has required that Australian banks use sophisticated models for credit risk, operational risk and interest rate risk taken in the banking book. In addition, APRA has applied discretion in the calculation of the components of regulatory capital. The new Basel III prudential standards became effective on 1 January 2013.
Westpac is accredited by APRA to apply advanced models permitted by the Basel III global capital adequacy regime to the measurement of its regulatory capital requirements. Westpac uses the Advanced Internal Ratings-Based approach for credit risk, the Advanced Measurement Approach (AMA) for operational risk and the internal model approach for Interest Rate Risk in the Banking Book (IRRBB). Effective risk management is regarded as a key activity performed at all levels of the Group. Achieving advanced accreditation from APRA has resulted in a broad array of changes to risk management practices that have been implemented across all risk classes. We recognise that embedding these principles and practices into day-to-day activities of the divisions to achieve the full benefits of these changes is an ongoing facet of risk management.
Australia’s risk-based capital adequacy guidelines are generally consistent but not completely aligned with the approach agreed upon by the Basel Committee on Banking Supervision (BCBS). APRA has exercised its discretion in applying the Basel framework to Australian ADIs, resulting in a more conservative approach than the minimum standards published by the BCBS. APRA also introduced the new standards from 1 January 2013 with no phasing in of higher capital requirements as allowed by the BCBS. The application of these discretions act to reduce reported capital ratios relative to those reported in other jurisdictions.
Under APRA’s implementation of Basel III, Australian banks are required to maintain a minimum Common Equity Tier 1 ratio of at least 4.5%, Tier 1 ratio of 6.0% and Total Regulatory Capital of 8.0%. Subject to certain limitations, Common Equity Tier 1 capital consists of paid-up share capital, retained profits and certain reserves, less the deduction of certain intangible assets, capitalised expenses and software, and investments and retained earnings in insurance and funds management subsidiaries that are not consolidated for capital adequacy purposes. The balance of eligible capital is defined as Additional Tier 1 or Tier 2 capital which includes, subject to limitations, mandatory convertible notes, perpetual floating rate notes and like instruments, and term subordinated debt less a deduction for holdings of Westpac’s own subordinated debt and that of other financial institutions.
98 2014 Westpac Group Annual Report

Review of Group operations Westpac’s regulatory capital ratios as at 30 September are summarised in the table below:
2014 2013$m $m
Common equity 47,137 45,361 Deductions from common equity (17,413) (17,392) Total common equity after deductions 29,724 27,969
Additional Tier 1 capital 5,273 4,769 Net Tier 1 regulatory capital 34,997 32,738
Tier 2 capital 5,902 4,968 Deductions from Tier 2 capital (198) (50) Total Tier 2 capital after deductions 5,704 4,918 Total regulatory capital 40,701 37,656
Credit risk:On-balance sheet assets 199,921 185,023 Off-balance sheet assets 81,538 75,245
Equity risk - - Market risk 8,975 9,059 Operational risk 29,340 27,299 Interest rate risk in the banking book 7,316 6,929 Other assets 4,297 3,817 Total risk weighted assets 331,387 307,372
Common Equity Tier 1 capital ratio 9.0% 9.1%Additional Tier 1 capital ratio 1.6% 1.6%Tier 1 capital ratio 10.6% 10.7%Tier 2 capital ratio 1.7% 1.6%Total regulatory capital ratio 12.3% 12.3%
Refer to ‘Significant developments’ in Section 1 for a discussion on future regulatory developments that may impact upon capital requirements.
2014 Westpac Group Annual Report 99
Divisional performance Divisional performance – 2014 v 2013Our operations comprise three primary customer-facing business divisions:
Australian Financial Services (AFS), which incorporates the operations of: – Westpac Retail & Business Banking, which we refer to as Westpac RBB; – St.George Banking Group, which we refer to as St.George; and – BT Financial Group (Australia), which we refer to as BTFG
Westpac Institutional Bank, which we refer to as WIB; and Westpac New Zealand. Other divisions in the Group include Westpac Pacific, Group Services, Treasury and Core Support.
The accounting standard AASB 8 Operating Segments requires segment results to be presented on a basis that is consistent with information provided internally to Westpac’s key decision makers. In assessing financial performance, including divisional results, Westpac uses a measure of performance referred to as ‘cash earnings’. Cash earnings is not a measure of cash flow or net profit determined on a cash accounting basis, as it includes non-cash items reflected in net profit determined in accordance with AAS. The specific adjustments outlined below include both cash and non-cash items. Cash earnings, as calculated by Westpac, is viewed as a measure of the level of profit that is generated by ongoing operations and is therefore available for distribution to shareholders.
A reconciliation of cash earnings to net profit attributable to owners of Westpac Banking Corporation for each business division is set out in Note 33 to the financial statements. To calculate cash earnings, Westpac adjusts net profit attributable to owners of Westpac Banking Corporation for the items outlined below. Management believes this allows the Group to more effectively assess performance for the current period against prior periods and to compare performance across business divisions and across peer companies.
Three categories of adjustments are made to statutory results to determine cash earnings:
material items that key decision makers at Westpac believe do not reflect ongoing operations; items that are not considered when dividends are recommended, such as the amortisation of intangibles, impact of Treasury
shares and economic hedging impacts; and accounting reclassifications between individual line items that do not impact statutory results, such as policyholder
tax recoveries1. The discussion of our divisional performance in this section is presented on a cash earnings basis unless otherwise stated. Cash earnings is not directly comparable to statutory results presented in other parts of this Annual Report.
Outlined below are the current cash earnings adjustments to the statutory results:
1. Trust Preferred Securities (TPS) revaluations – this adjustment related to TPS 2003 securities which were redeemed on 30 September 2013. Historically this adjusted for movements in economic hedges, including associated tax effects impacting the foreign currency translation reserve, relating to hybrid instruments classified as non-controlling interests. The adjustment was required as these hybrid instruments were not fair valued, however, the hedges were fair valued and therefore there was a mismatch in the timing of income recognition in the statutory results. The mismatch was added back to statutory results in deriving cash earnings as it did not affect the Group’s profits over time.
2. Treasury shares – under AAS, Westpac shares held by the Group in the managed funds and life businesses are deemed to be Treasury shares and the results of holding these shares are not permitted to be recognised as income in the statutory results. In deriving cash earnings, these results are included to ensure there is no asymmetrical impact on the Group’s profits because the Treasury shares support policyholder liabilities and equity derivative transactions which are re-valued in determining income.
3. Ineffective hedges – the (gain)/loss on ineffective hedges is reversed in deriving cash earnings for the period because the gain or loss arising from the fair value movement in these hedges reverses over time and does not affect the Group’s profits over time.
1 Policyholder tax recoveries – income and tax amounts that are grossed up to comply with the AAS covering life insurance business (policyholder tax recoveries) are reversed in deriving income and taxation expense on a cash earnings basis.
100 2014 Westpac Group Annual Report

Divisional performance 4. Fair value on economic hedges (which do not qualify for hedge accounting under AAS) comprises:
– the unrealised fair value gain/(loss) on foreign exchange hedges of future New Zealand earnings impacting non-interest income is reversed in deriving cash earnings as they may create a material timing difference on statutory results but do not affect the Group's cash earnings during the life of the hedge;
– the unrealised fair value gain/(loss) on foreign exchange hedges of fees payable for the use of the Government guarantee on foreign denominated wholesale funding is reversed in deriving cash earnings as they may create a material timing difference on statutory results but do not affect the Group's cash earnings during the life of the hedge; and
– the unrealised fair value gain/(loss) on hedges of accrual accounted term funding transactions are reversed in deriving cash earnings as they may create a material timing difference on statutory results but do not affect the Group's cash earnings during the life of the hedge.
5. Gain/(loss) on buyback of Government guaranteed debt – the Group has bought back certain Government guaranteed debt issues which reduces Government guarantee fees (70 basis points) paid. In undertaking the buybacks, a cost was incurred reflecting the difference between current interest rates and the rate at which the debt was initially issued. In the statutory result, the cost incurred is recognised at the time of the buyback. In cash earnings, the cost incurred is being amortised over the original term of the debt that was bought back consistent with a 70 basis point saving being effectively spread over the remaining life of the issue. The cash earnings adjustment gives effect to the timing difference between statutory results and cash earnings.
6. Fair value amortisation of financial instruments – the accounting for the merger with St.George resulted in the recognition of fair value adjustments on the St.George retail bank loans, deposits, wholesale funding and associated hedges, with these fair value adjustments being amortised over the life of the underlying transactions. The amortisation of these adjustments is considered to be a timing difference relating to non-cash flow items that do not affect cash distributions available to shareholders and therefore, have been treated as a cash earnings adjustment.
7. Amortisation of intangible assets – the merger with St.George and the acquisitions of J O Hambro Capital Management (JOHCM) and Lloyds resulted in the recognition of identifiable intangible assets. These assets include intangibles related to core deposits, customer relationships, management contracts and distribution relationships. These intangible items are amortised over their useful lives, ranging between four and twenty years. The amortisation of intangible assets (excluding capitalised software) is a cash earnings adjustment because it is a non-cash flow item and does not affect cash distributions available to shareholders.
8. Acquisition, transaction and integration expenses – costs associated with the acquisition of Lloyds have been treated as a cash earnings adjustment as they do not impact the earnings expected from the acquired businesses following the integration period.
9. Bell litigation provision – during the year ended 30 September 2012, the Group recognised additional provisions in respect of the long running Bell litigation. This was treated as a cash earnings adjustment at the time due to its size, historical nature and because it did not reflect ongoing operations. In the current year, the Bell litigation has been settled and the release of provisions no longer required has also been treated as a cash earnings adjustment. There are no matters outstanding with the Bell case.
10. Westpac Bicentennial Foundation grant – the Group provided a grant to establish the Westpac Bicentennial Foundation. The $100 million grant ($70 million after tax) has been treated as a cash earnings adjustment due to its size and because it does not reflect ongoing operations.
11. Prior period tax provisions – during the year ended 30 September 2011, the Group raised provisions in respect of certain tax positions for transactions previously undertaken by the Group. A number of these matters have now been resolved, resulting in a release of the provisions which are no longer required. As the provisions raised were treated as a cash earnings adjustment, the release has been treated in a consistent manner.
12. Supplier program – during the year ended 30 September 2012, the Group incurred and provisioned for expenses as part of its program to increase the use of global specialists in certain technology and back office operations. These expenses included costs associated with streamlining and better documenting systems and processes, technology costs to enable infrastructure and enhance interaction with suppliers, and costs associated with restructuring the workforce. Given these significant expenses were not considered in determining dividends they were treated as cash earnings adjustments.
13. Tax on Financial Arrangements (TOFA) tax consolidation adjustment – during the year ended 30 September 2012, taxation legislation was introduced that included retrospective amendments to the income tax law as it applies to TOFA and tax consolidated groups. The amendments had an adverse application to certain liabilities that were consolidated as part of the merger with St.George. This gave rise to an additional income tax expense of $165 million for the year ended 30 September 2012. Consistent with other tax adjustments relating to the merger with St.George, this adjustment was treated as a cash earnings adjustment due to its size and because it did not reflect ongoing operations.
2014 Westpac Group Annual Report 101

Cash earnings and assets by division The following tables present, for each of the key divisions of our business, the cash earnings and total assets at the end of the financial years ended 30 September 2014, 2013 and 2012. Refer to Note 33 to the financial statements for the disclosure of our geographic and business segments and the reconciliation to net profit attributable to owners of Westpac Banking Corporation.
Cash earnings by business division
Years Ended 30 September 2014 2013 2012
$m $m $mAustralian Financial Services
Westpac Retail & Business Banking 2,582 2,355 2,158 St.George Banking Group 1,580 1,392 1,189
BT Financial Group (Australia) 895 773 685 Westpac Institutional Bank 1,468 1,575 1,418 Westpac New Zealand 790 632 553 Other divisions 313 336 561 Total Cash Earnings 7,628 7,063 6,564
Total assets by business division
As at 30 September 2014 2013 2012$bn $bn $bn
Australian Financial Services Westpac Retail & Business Banking 276.5 261.9 255.3 St.George Banking Group 175.4 159.8 154.6 BT Financial Group (Australia) 31.8 32.2 30.5
Westpac Institutional Bank 118.9 97.2 97.8 Westpac New Zealand 65.9 61.5 48.6 Other divisions 102.3 88.5 91.8 Total assets 770.8 701.1 678.6
In presenting divisional results on a management reporting basis, internal charges and transfer pricing adjustments are included in the performance of each division reflecting the management structure rather than the legal entity (these results cannot be compared to results for individual legal entities). Where management reporting structures or accounting classifications have changed, financial results for comparative periods have been revised and may differ from results previously reported.
Our internal transfer pricing frameworks facilitate risk transfer, profitability measurement, capital allocation and business unit alignment, tailored to the jurisdictions in which we operate. Transfer pricing allows us to measure the relative contribution of our products and divisions to the Group’s interest margin, and other dimensions of performance. Key components of our transfer pricing frameworks are funds transfer pricing for interest rate and liquidity risk, and allocation of basis and contingent liquidity costs, including capital allocation.
Overhead costs are allocated to revenue generating businesses.
102 2014 Westpac Group Annual Report
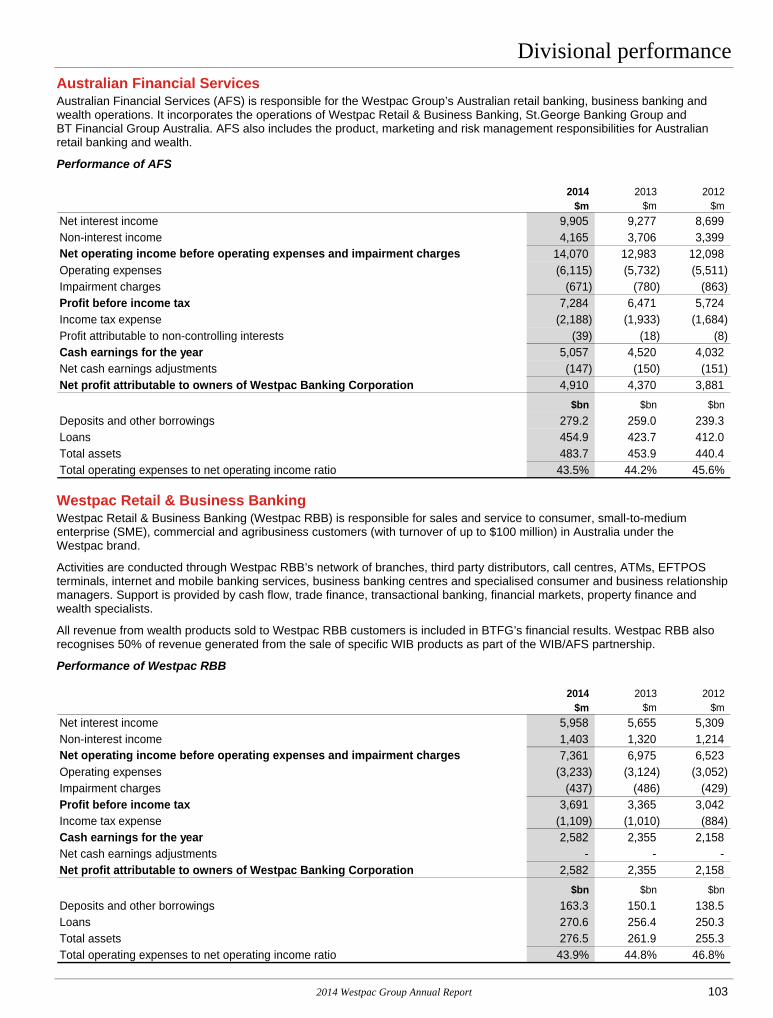
Divisional performance Australian Financial Services Australian Financial Services (AFS) is responsible for the Westpac Group’s Australian retail banking, business banking and wealth operations. It incorporates the operations of Westpac Retail & Business Banking, St.George Banking Group and BT Financial Group Australia. AFS also includes the product, marketing and risk management responsibilities for Australian retail banking and wealth.
Performance of AFS
2014 2013 2012$m $m $m
Net interest income 9,905 9,277 8,699Non-interest income 4,165 3,706 3,399Net operating income before operating expenses and impairment charges 14,070 12,983 12,098Operating expenses (6,115) (5,732) (5,511)Impairment charges (671) (780) (863)Profit before income tax 7,284 6,471 5,724Income tax expense (2,188) (1,933) (1,684)Profit attributable to non-controlling interests (39) (18) (8)Cash earnings for the year 5,057 4,520 4,032Net cash earnings adjustments (147) (150) (151)Net profit attributable to owners of Westpac Banking Corporation 4,910 4,370 3,881
$bn $bn $bnDeposits and other borrowings 279.2 259.0 239.3Loans 454.9 423.7 412.0Total assets 483.7 453.9 440.4Total operating expenses to net operating income ratio 43.5% 44.2% 45.6%
Westpac Retail & Business Banking Westpac Retail & Business Banking (Westpac RBB) is responsible for sales and service to consumer, small-to-medium enterprise (SME), commercial and agribusiness customers (with turnover of up to $100 million) in Australia under the Westpac brand.
Activities are conducted through Westpac RBB’s network of branches, third party distributors, call centres, ATMs, EFTPOS terminals, internet and mobile banking services, business banking centres and specialised consumer and business relationship managers. Support is provided by cash flow, trade finance, transactional banking, financial markets, property finance and wealth specialists.
All revenue from wealth products sold to Westpac RBB customers is included in BTFG’s financial results. Westpac RBB also recognises 50% of revenue generated from the sale of specific WIB products as part of the WIB/AFS partnership.
Performance of Westpac RBB
2014 2013 2012$m $m $m
Net interest income 5,958 5,655 5,309Non-interest income 1,403 1,320 1,214Net operating income before operating expenses and impairment charges 7,361 6,975 6,523Operating expenses (3,233) (3,124) (3,052)Impairment charges (437) (486) (429)Profit before income tax 3,691 3,365 3,042Income tax expense (1,109) (1,010) (884)Cash earnings for the year 2,582 2,355 2,158Net cash earnings adjustments - - -Net profit attributable to owners of Westpac Banking Corporation 2,582 2,355 2,158
$bn $bn $bnDeposits and other borrowings 163.3 150.1 138.5Loans 270.6 256.4 250.3Total assets 276.5 261.9 255.3Total operating expenses to net operating income ratio 43.9% 44.8% 46.8%
2014 Westpac Group Annual Report 103

2014 v 2013 Westpac RBB delivered cash earnings of $2,582 million, up $227 million, or 10%.
Net interest income increased 5% from a 3% rise in average interest-earning assets and a 6 basis point improvement in margins:
the 6 basis point rise in margins was due to improved deposit spreads, favourable deposit mix impacts and lower wholesale funding costs. Asset spreads were lower from competition for new lending, particularly in mortgages, along with an increase in fixed rate lending;
lending increased $14.2 billion or 6%, mostly in mortgages. A focus on improving all elements of the mortgage process has contributed to a 6% rise in mortgages with growth skewed to the second half of the year; and
deposits increased $13.2 billion or 9%, with most of the growth in higher quality, more stable balances particularly consumer savings and the transaction accounts of consumers and businesses.
Non-interest income was up 6%, with most of the rise due to a lift in cards income from higher customer activity. Business income was also higher from a rise in lending activity and from more businesses managing their financial markets risks, especially foreign exchange.
Operating expenses increased 3% with higher investment and regulatory change related spending and costs associated with increasing the number of customer facing employees. This was partially offset by productivity savings across the network.
There was a further improvement in asset quality over the year with business impaired assets as a percent of total committed exposure falling by one third and consumer delinquencies improved a further 3 basis points to 0.47%. As a result, impairment charges were 10% lower over the year.
St.George Banking Group St.George Banking Group (St.George) is responsible for sales and service to consumer, SME and corporate customers (businesses with facilities up to $150 million) in Australia under the St.George, BankSA, Bank of Melbourne and RAMS brands.
Activities are conducted through St.George’s network of branches, third party distributors, call centres, ATMs, EFTPOS terminals, internet and mobile banking services, business banking centres and specialised consumer and business relationship managers. Support is provided by cash flow, trade finance, transactional banking, automotive and equipment finance, financial markets, property finance, and wealth specialists.
All revenue from wealth products sold to St.George customers is included in BTFG’s financial results. St.George also recognises 50% of revenue generated from the sale of specific WIB products as part of the WIB/AFS partnership.
Performance of St.George
2014 2013 2012$m $m $m
Net interest income 3,537 3,216 2,966Non-interest income 518 469 492Net operating income before operating expenses and impairment charges 4,055 3,685 3,458Operating expenses (1,560) (1,402) (1,328)Impairment charges (236) (293) (433)Profit before income tax 2,259 1,990 1,697Income tax expense (679) (598) (508)Cash earnings for the year 1,580 1,392 1,189Net cash earnings adjustments (125) (128) (129)Net profit attributable to owners of Westpac Banking Corporation 1,455 1,264 1,060
$bn $bn $bnDeposits and other borrowings 93.5 88.6 80.9Loans 168.4 152.7 147.6Total assets 175.4 159.8 154.6Total operating expenses to net operating income ratio 38.5% 38.0% 38.4%
104 2014 Westpac Group Annual Report

Divisional performance 2014 v 2013 St.George delivered cash earnings of $1,580 million, up 14%. The Lloyds business contributed $47 million to full year cash earnings.
Net interest income was up $321 million or 10%, supported by a 7% rise in average interest-earning assets and a 7 basis point improvement in margins:
the rise in margins was mostly due to improved deposit spreads and lower wholesale funding costs. The inclusion of Lloyds was also positive for margins given the mix of its portfolio. These increases were partially offset by a reduction in spreads on new business and mortgage lending;
lending was up $15.7 billion or 10%, excluding Lloyds loans increased $9.2 billion or 6%: – mortgages increased $8.9 billion (up 8%). Growth was achieved across all brands and proprietary channels, particularly in
Bank of Melbourne; – business lending increased 12% over the period primarily due to the acquisition of Lloyds, excluding this, business
lending was $0.4 billion lower principally from a further reduction in gearing from property related companies along with the work-out or exit of stressed assets; and
– other lending increased 9% (excluding the impact of Lloyds) from good growth in auto loans, personal loans and credit cards.
deposits were up $4.9 billion or 6%, with most of the increase in at call savings and transaction accounts. Term deposits declined 7% driven largely by business term deposits, as these customers preferred to hold balances in at call accounts. Consumer term deposits were up 3%. Acquiring the Lloyds book resulted in a 2 percentage point decline in the deposit to loan ratio.
Non-interest income was up $49 million or 10%, with around half of the rise due to Lloyds. Business fees were also higher reflecting the cost of providing facilities, including for undrawn commitments.
Operating expenses increased $158 million or 11%, with Lloyds contributing $86 million to the rise. Excluding Lloyds, expenses increased 5%. Ongoing costs were largely offset with productivity benefits with most of the increase due to investment, including:
Bank of Melbourne expansion has added around $33 million to expenses over the year including new branches, increased employee numbers and a rise in depreciation and amortisation; and
improving the customer experience including via new branch formats (FreshStart), and the Business Connect model for serving SME customers.
Impairment charges were down $57 million or 19% across both consumer and business facilities as asset quality has materially improved across business and consumer portfolios.
2014 Westpac Group Annual Report 105

BT Financial Group (Australia) BT Financial Group (Australia) (BTFG) is Westpac’s Australian wealth division.
BTFG’s funds management operations include the manufacturing and distribution of investment, superannuation and retirement products, platforms including BT Wrap and Asgard, private banking, financial planning as well as equity capability and broking. BTFG’s insurance solutions cover the manufacturing and distribution of life, general and lenders mortgage insurance.
BTFG’s brands include Advance Asset Management, Ascalon, Asgard, BT Investment Management Limited (BTIM) (60.8% owned by the Westpac Group and consolidated in BTFG’s Funds Management business), Licensee Select, BT Select, Securitor and the Advice, Private Banking and Insurance operations of Bank of Melbourne, BankSA, St.George and Westpac.
Performance of BTFG
2014 2013 2012$m $m $m
Net interest income 410 406 424Non-interest income 2,244 1,917 1,693Net operating income before operating expenses and impairment charges 2,654 2,323 2,117Operating expenses (1,322) (1,206) (1,131)Impairment (charges)/benefits 2 (1) (1)Profit before income tax 1,334 1,116 985Income tax expense (400) (325) (292)Profit attributable to non-controlling interests (39) (18) (8)Cash earnings for the year 895 773 685Net cash earnings adjustments (22) (22) (22)Net profit attributable to owners of Westpac Banking Corporation 873 751 663
$bn $bn $bn Deposits and other borrowings 22.4 20.3 19.9Loans 15.9 14.6 14.1Total assets 31.8 32.2 30.5Funds under management 89.0 76.2 56.5Funds under administration 112.7 102.7 87.9Total operating expenses to net operating income ratio 49.8% 51.9% 53.4%
Cash earnings
2014 2013 2012$m $m $m
Funds management business 539 429 378Insurance 319 268 231Capital and other 37 76 76Total cash earnings 895 773 685
2014 v 2013 Cash earnings were $895 million, an increase of $122 million or 16%.
Funds Management cash earnings were up $110 million or 26%, driven by higher funds management performance fees (in BTIM), net flows onto Platforms and an increase in average FUM and FUA of 25% and 14% respectively. Advice income was up driven by an expanded planner network with continued focus on quality advice. The contribution from Private Wealth was also higher.
The Insurance contribution was up $51 million or 19%, supported by a rise in net earned premiums of 19% in Life Insurance and 14% in General Insurance. These increases were partially offset by a lower contribution from LMI.
Contribution from Capital and other was down significantly year on year mainly due to reduction in investment earnings from lower interest rates along with higher stamp duty costs.
106 2014 Westpac Group Annual Report

Divisional performance Funds management business
2014 2013 2012$m $m $m
Net interest income 365 339 339Non-interest income 1,692 1,426 1,239Net operating income before operating expenses and impairment charges 2,057 1,765 1,578Operating expenses (1,233) (1,127) (1,025)Impairment (charges)/benefits 2 (1) (1)Profit before income tax 826 637 552Income tax expense and non-controlling interests (287) (208) (174)Profit attributable to non-controlling interestsCash earnings for the year 539 429 378Net cash earnings adjustments (22) (22) (22)Net profit attributable to owners of Westpac Banking Corporation 517 407 356Total operating expenses to net operating income ratio 59.9% 63.9% 65.0%
Cash earnings of $539 million were up $110 million or 26%, driven by a 17% increase in net operating income before operating expenses and impairment charges.
Net interest income was up 8% from higher lending and deposit volumes and stronger margins in Private Wealth.
Non-interest income increased $266 million, or 19%:
FUM related revenue increased $105 million, up 23%, with a 25% rise in average FUM from inflows into Advance and Equity Income Funds, improved markets and positive foreign exchange movement impacts. FUM margins were little changed over the year;
outperformance against benchmarks in a number of portfolios has led to a significant rise in performance fees received in BTIM and JOHCM (up $79 million);
FUA revenue increased $47 million, up 11%, driven by good flows on platforms and improved markets. Average margins were flat over the year;
Advice income increased $38 million or 12% from new business revenue generated by an expanded planner network with continued focus on quality advice and increasing customer facing time; and
increased net flows into Advance, partially offset by lower equities income. Operating expenses increased $106 million or 9% from:
investment related costs, including the Panorama platform; an increase in performance fee related bonuses associated with BTIM and JOHCM; and other operating costs were up due to higher FTE costs associated with regulatory change and other volume related costs.
Insurance business
2014 2013 2012$m $m $m
Net interest income 6 6 3Non-interest income 525 437 387Net operating income before operating expenses and impairment charges 531 443 390Operating expenses (75) (59) (60)Profit before income tax 456 384 330Income tax expense and non-controlling interests (137) (116) (99)Cash earnings for the year 319 268 231Net cash earnings adjustments - - -Net profit attributable to owners of Westpac Banking Corporation 319 268 231Total operating expenses to net operating income ratio 14.1% 13.3% 15.4%
Cash earnings increased $51 million or 19%, due to higher revenue from the expanded distribution network, improved sales across the Group’s banking brands and lower General Insurance claims.
2014 Westpac Group Annual Report 107

Net operating income before operating expenses and impairment charges increased $88 million or 20%:
the Life and General Insurance businesses continue to offer a range of solutions to help our customers protect their wealth. Life Insurance revenue increased $40 million or 17%, with in-force premiums rising 16%. General Insurance revenue increased $58 million with gross written premiums rising 11% from growth in new business and pricing initiatives.
higher premiums in Life Insurance have been partially offset by a rise in net incurred claims consistent with the larger portfolio; while the value of lapses is higher, the lapse rates have remained flat and continue to be below industry averages;
enhancements to the claims management processes in General Insurance have contributed to lower claims in 2014; and LMI revenue was down $10 million with the continued impact of the decision to de-risk the portfolio in 2009 and lower claims
consistent with the decrease in portfolio size. Operating expenses increased $16 million or 27%, in-line with increased volumes and higher FTE costs in claims management to support the growth of the portfolio.
Westpac Institutional Bank Westpac Institutional Bank (WIB) delivers a broad range of financial services to commercial, corporate, institutional and government customers with connections to Australia and New Zealand.
WIB operates through dedicated industry relationship and specialist product teams, with expert knowledge in transactional banking, financial and debt capital markets, specialised capital, and alternative investment solutions.
Customers are supported through branches and subsidiaries located in Australia, New Zealand, US, UK and Asia.
Performance of WIB
2014 2013 2012$m $m $m
Net interest income 1,643 1,630 1,701Non-interest income 1,518 1,633 1,454Net operating income before operating expenses and impairment charges 3,161 3,263 3,155Operating expenses (1,207) (1,115) (1,030)Impairment (charges)/benefit 136 89 (127)Profit before income tax 2,090 2,237 1,998Income tax expense (622) (662) (580)Cash earnings for the year 1,468 1,575 1,418Net cash earnings adjustments - - -Net profit attributable to owners of Westpac Banking Corporation 1,468 1,575 1,418
$bn $bn $bnDeposits and other borrowings 77.3 72.8 64.5Loans 66.2 56.5 53.9Total assets 118.9 97.2 97.8Total operating expenses to net operating income ratio 38.2% 34.2% 32.6%
2014 v 2013 WIB delivered cash earnings of $1,468 million, down 7% ($107 million). The lower result was largely due to the impact of items that boosted 2013, in particular:
CVA was a charge of $23 million in 2014, compared to an $87 million benefit in 2013, largely due to currency movements; and
revenue associated with Hastings’ exit of listed infrastructure funds generated income of $115 million in 2013. This income was not repeated in 2014.
WIB’s cash earnings from all other activities increased $51 million or 4%. Customer revenue was up 6%. WIB has focused on meeting customer risk management needs and has delivered an uplift in lending and fee-related revenue.
Net interest income increased $13 million, or 1%, compared to 2013 with a 13% increase in average interest-earning assets partly offset by a 24 basis point decline in margins. While margin pressure was experienced on both assets and liabilities, competition was most intense for transactional deposits:
lending grew $9.7 billion, or 17%, primarily in corporate lending and trade finance, with growth from Asia and the addition of Lloyds; and
deposits increased $4.5 billion, or 6%, as WIB continued to build on its total relationship focus. Growth was particularly strong in term deposits.
108 2014 Westpac Group Annual Report

Divisional performance Non-interest income decreased $115 million or 7%. 2013 included significant revenue associated with Hastings’ exit of listed infrastructure funds, and an $87 million CVA benefit compared to a $23 million CVA charge in 2014.
Excluding the impact of these items, WIB’s non-interest income was up $110 million reflecting:
growth in markets income, from improved customer flows. Growth over the year was most prominent in FX and commodities, carbon and energy (FX&CCE);
Lloyds contribution; and increase in other fees from additional lending and transaction volumes. Operating expenses increased $92 million or 8%, mainly reflecting:
an increase in WIB’s investment in Asia ($60 million), including building product and technology capabilities along with additional FTE and branch premises costs;
Lloyds operating expenses ($15 million); and increased costs from regulatory change ($14 million). Asset quality improved in 2014 and, as a result, impairments contributed a $136 million benefit, compared to an $89 million benefit in 2013. Write-backs and collectively assessed provision benefits continued in 2014, albeit at a lower rate than 2013, and new individually assessed provisions were significantly lower than 2013.
Westpac New Zealand Westpac New Zealand is responsible for sales and service of banking, wealth and insurance products for consumers, business and institutional customers in New Zealand.
Westpac conducts its New Zealand banking business through two banks in New Zealand: Westpac New Zealand Limited, which is incorporated in New Zealand and Westpac Banking Corporation (NZ Division), a branch of Westpac, which is incorporated in Australia.
The division operates via an extensive network of branches and ATMs across both the North and South Islands. Business and institutional customers are also served through relationship and specialist product teams. Banking products are provided under the Westpac and WIB brands while insurance and wealth products are provided under Westpac Life and BT brands, respectively. New Zealand also has its own infrastructure, including technology, operations and treasury.
Performance of Westpac New Zealand
2014 2013 2012$m $m $m
Net interest income 1,455 1,281 1,201Non-interest income 438 389 367Net operating income before operating expenses and impairment charges 1,893 1,670 1,568Operating expenses (776) (697) (653)Impairment charges (24) (97) (148)Profit before income tax 1,093 876 767Income tax expense (300) (241) (211)Profit attributable to non-controlling interests (3) (3) (3)Cash earnings for the year 790 632 553Net cash earnings adjustments - - -Net profit attributable to owners of Westpac Banking Corporation 790 632 553
$bn $bn $bn Deposits and other borrowings1 44.1 41.4 33.5Loans 57.7 54.7 47.4Total assets2 65.9 61.5 48.6Funds under management 4.9 3.9 2.9Funds under administration 1.5 1.2 1.0Total operating expenses to net operating income ratio 41.0% 41.7% 41.6%
1 Refers to total customer deposits in this table. 2 In 2014, total assets impacted by the transfer of $1.0 billion of assets to Westpac New Zealand from Group Businesses (Treasury).
2014 Westpac Group Annual Report 109

2014 v 2013 Westpac New Zealand delivered cash earnings of $790 million, up $158 million or 25%.
Net interest income increased $174 million or 14%, of which foreign exchange translation impacts contributed $146 million. Excluding foreign exchange impacts, net interest income increased $28 million due to average interest-earning assets increasing 5% and margins declining 6 basis points. Margins and average interest-earning assets were impacted by the inclusion of Treasury assets (transfer from Group Businesses) in Westpac New Zealand’s result in the second half of 2014. Adjusting for these assets, margins were 4 basis points lower and average interest-earning assets were 4% higher:
drivers of the 4 basis point contraction in margin were: – reduced lending spreads as customers switched to lower spread fixed rate mortgages, continued intense competition and
business stressed assets run-off; and – improved deposit spreads from active rate management, further portfolio optimisation and a reduction in wholesale
funding costs. total lending increased $3.0 billion or 5%:
– mortgages increased $2.1 billion or 6%, achieving 1.2 times system1 driven by good growth in mortgages with an LVR less than 80%; and
– business lending increased $0.8 billion or 4%, with growth in targeted areas in particular agriculture lending 2.2 times system1.
deposits increased $2.7 billion, up 7% with the deposit to loan ratio up 82 basis points to 76.5%. The majority of the growth was in at call and transaction accounts which increased $2.3 billion or 12%, primarily in online deposits, up $1.7 billion.
Non-interest income increased $49 million or 13%, driven by:
foreign exchange impacts of $44 million; and increased insurance income and an uplift in fees earned from FUM/FUA growth, with balances up $1.3 billion or 25%, to
$6.4 billion; partially offset by insurance recoveries associated with the Christchurch earthquake received in 2013, which were not repeated in 2014. Operating expenses increased $79 million or 11%, of which foreign exchange translation impacts contributed $78 million.
A continued focus on disciplined cost management has supported investment in strategic priorities which are contributing to both an enhanced customer experience and productivity benefits. As a result the expense to income ratio was down 75 basis points in 2014 to 41.0%.
Impairment charges decreased $73 million or 75%, as asset quality continued to improve, with lower consumer delinquencies and the run-off and management of business stressed assets.
1 Source: Reserve Bank of New Zealand (RBNZ).
110 2014 Westpac Group Annual Report

Divisional performance Other divisions Other divisions comprise:
Westpac Pacific Westpac Pacific provides banking services for retail and business customers in seven Pacific Island Nations. Branches, ATMs, telephone banking and internet banking channels are used to deliver business activities in Fiji, Papua New Guinea (PNG), Vanuatu, Cook Islands, Tonga, Solomon Islands and Samoa. Westpac Pacific’s financial products include personal savings accounts, business transactional accounts, personal and business lending products, business services and a range of international products.
Group Services1 Group Services encompasses technology, banking operations, compliance, legal and property services.
Treasury Treasury is primarily focused on the management of the Group’s interest rate risk and funding requirements by managing the mismatch between Group assets and liabilities. Treasury’s earnings are primarily impacted by the hedging decisions taken on behalf of the Group to manage net interest income outcomes and assist net interest income growth.
Core Support1 Core Support comprises those functions performed centrally, including finance, risk and human resources.
Group Items Group Items includes earnings on capital not allocated to divisions, accounting entries for certain intra-group transactions that facilitate the presentation of the performance of our operating segments, earnings from non-core asset sales and certain other head office items such as centrally raised provisions.
Performance of other divisions
2014 2013 2012$m $m $m
Net interest income 493 724 962Non-interest income 203 193 293Net operating income before operating expenses and impairment charges 696 917 1,255Operating expenses (148) (215) (233)Impairment charges (91) (59) (74)Profit before income tax 457 643 948Income tax expense (120) (252) (329)Profit attributable to non-controlling interests (24) (55) (58)Cash earnings for the year 313 336 561Net cash earnings adjustments 80 (162) (477)Net profit attributable to owners of Westpac Banking Corporation 393 174 84
2014 v 2013 Other divisions’ cash earnings were $313 million in 2014, down $23 million.
Net operating income before operating expenses and impairment charges decreased $221 million with Treasury income impacted by low market volatility, contributing to lower returns from the liquids portfolio and balance sheet management. The impact of exchange controls in PNG, and hedging of New Zealand earnings and offshore capital also reduced income. This was partially offset by an increase in profit from asset sales, with remaining shares in Visa sold in 2014.
Operating expenses were $67 million lower due to a reduction in defined benefits superannuation expense, employee provisions raised in 2013 that were not repeated and a decrease in centrally managed program costs.
Impairment charges of $91 million reflect an increase in centrally held economic overlay impairment provisions related to sectors in the economy undergoing structural change.
The effective tax rate reduced with the release of tax provisions no longer required, following the finalisation of prior period taxation matters. Non-controlling interests were lower by $29 million following the maturity of the 2003 TPS in 2013.
1 Costs are allocated to other divisions, largely AFS and WIB.
2014 Westpac Group Annual Report 111

Risk and risk management Risk factorsOur business is subject to risks that can adversely impact our business, financial performance, financial condition and future performance. If any of the following risks occur, our business, financial performance, financial condition or future performance could be materially adversely affected, with the result that the trading price of our securities could decline and as a security holder you could lose all, or part, of your investment. You should carefully consider the risks described and the other information in this Annual Report before investing in our securities. The risks and uncertainties described below are not the only ones we may face. Additional risks and uncertainties that we are unaware of, or that we currently deem to be immaterial, may also become important factors that affect us.
Risks relating to our business Our businesses are highly regulated and we could be adversely affected by failing to comply with existing laws and regulations or by changes in laws, regulations or regulatory policy As a financial institution, we are subject to detailed laws and regulations in each of the jurisdictions in which we operate or obtain funding, including Australia, New Zealand and the United States. We are also supervised by a number of different regulatory and supervisory authorities which have broad administrative power over our businesses. In Australia, the relevant regulatory authorities include the Australian Prudential Regulation Authority (APRA), Reserve Bank of Australia (RBA), Australian Securities and Investments Commission (ASIC), Australian Securities Exchange (ASX), Australian Competition and Consumer Commission (ACCC), the Australian Transaction Reports and Analysis Centre (AUSTRAC) and the Australian Taxation Office (ATO). The Reserve Bank of New Zealand (RBNZ) and the Financial Markets Authority (FMA) have supervisory oversight of our New Zealand operations. In the United States we are subject to supervision and regulation by the US Office of the Comptroller of the Currency (OCC), the Board of Governors of the Federal Reserve System, the Commodity Futures Trading Commission (CFTC) and the U.S. Securities and Exchange Commission (SEC). In other jurisdictions in which we operate, including the United Kingdom, Asia and various Pacific countries, we are also required to comply with relevant requirements of the local regulatory bodies.
We are responsible for ensuring that we comply with all applicable legal and regulatory requirements (including accounting standards) and industry codes of practice in the jurisdictions in which we operate or obtain funding, as well as meeting our ethical standards.
Compliance risk arises from these legal and regulatory requirements. If we fail to comply, we may be subject to fines, penalties or restrictions on our ability to do business. At a domestic level, an example of the broad administrative power available to regulatory authorities is the power available to APRA under the Banking Act 1959 in certain circumstances to investigate our affairs and/or issue a direction to us (such as a direction to comply with a prudential requirement, to conduct an audit, to remove a Director, executive officer or employee or not to undertake transactions). In recent years, there have been significant increases in the quantum of fines issued by global
regulators. Any such fines, costs and restrictions could adversely affect our business, reputation, prospects, financial performance or financial condition.
As with other financial services providers, we face increasing supervision and regulation in most of the jurisdictions in which we operate or obtain funding, particularly in the areas of funding, liquidity, capital adequacy, conduct and prudential regulation, anti-bribery and corruption, anti-money laundering and counter-terrorism financing and trade sanctions. In December 2010 the Basel Committee on Banking Supervision (BCBS) announced a revised global regulatory framework known as Basel III. Basel III, among other things, increases the required quality and quantity of capital held by banks and introduces new standards for the management of liquidity risk. APRA has now incorporated much of the framework into its prudential standards. Further details on the Basel III framework are set out in Section 1 under ‘Information on Westpac’ and ‘Significant developments’.
During the year ended 30 September 2014 there were also a series of other regulatory releases from authorities in the various jurisdictions in which we operate or obtain funding proposing significant regulatory change for financial institutions. This includes new accounting and reporting standards which have been finalised, global OTC derivatives reform and the US Dodd-Frank legislation, including the Volcker Rule promulgated thereunder. The latter is designed to reform the entire system for the supervision and regulation of financial firms that operate in or have a connection with the US, including non-US banks like Westpac. Other areas of proposed or potential change that could impact us include changes to tax legislation, regulation relating to remuneration, consumer protection and competition legislation, privacy and data protection, anti-bribery and corruption, anti-money laundering and counter-terrorism financing laws and trade sanctions. In addition, further changes may occur driven by policy, prudential or political factors. The Australian Government has commissioned a Financial System Inquiry with broad terms of reference. While a preliminary report has been released the final outcomes of this Inquiry are difficult to predict but may result in substantial regulatory changes, including additional capital requirements which could have a material impact on our business, prospects, financial performance or financial condition. Further details on the Inquiry are set out in Section 1 under ‘Significant developments’.
Regulation is becoming increasingly extensive and complex. Some areas of potential regulatory change involve multiple jurisdictions seeking to adopt a coordinated approach. This may result in conflicts with specific requirements of the jurisdictions in which we operate and, in addition, such changes may be inconsistently introduced across jurisdictions.
Changes may also occur in the oversight approach of regulators. It is possible that governments in jurisdictions in which we operate or obtain funding might revise their application of existing regulatory policies that apply to, or impact, Westpac’s business, including for reasons relating to national interest and/or systemic stability.
112 2014 Westpac Group Annual Report

Risk and risk management Regulatory changes and the timing of their introduction continue to evolve and we currently manage our businesses in the context of regulatory uncertainty. The nature and impact of future changes are not predictable and are beyond our control. Regulatory compliance and the management of regulatory change is an increasingly important part of our strategic planning. We expect that we will be required to continue to invest significantly in compliance and the management and implementation of regulatory change and, at the same time, significant management attention and resources will be required to update existing or implement new processes to comply with the new regulations.
Regulatory change may also impact our operations by requiring us to have increased levels of liquidity and higher levels of, and better quality, capital as well as place restrictions on the businesses we conduct, require us to amend our corporate structure or require us to alter our product or service offerings. If regulatory change has any such effect, it could adversely affect one or more of our businesses, restrict our flexibility, require us to incur substantial costs and impact the profitability of one or more of our business lines. Any such costs or restrictions could adversely affect our business, prospects, financial performance or financial condition.
For further information refer to ‘Significant developments’ in Section 1 and the sections ‘Critical accounting assumptions and estimates’ and ‘Future developments in accounting standards’ in Note 1 to the financial statements.
Adverse credit and capital market conditions may significantly affect our ability to meet funding and liquidity needs and may increase our cost of funding We rely on credit and capital markets to fund our business and as a source of liquidity. Our liquidity and costs of obtaining funding are related to credit and capital market conditions.
Global credit and capital markets can experience periods of extreme volatility, disruption and decreased liquidity as was demonstrated during the Global Financial Crisis. While there have now been extended periods of stability in these markets, the environment has become more volatile and unpredictable. The main risks we face are damage to market confidence, changes to the access and cost of funding and a slowing in global activity or through other impacts on entities with whom we do business.
As of 30 September 2014, approximately 33% of our total funding originated from domestic and international wholesale markets, of this around 59% was sourced outside Australia and New Zealand.
A shift in investment preferences of businesses and consumers away from bank deposits towards other asset or investment classes could increase our need for funding from other, potentially less stable or more expensive forms of funding.
If market conditions deteriorate due to economic, financial, political or other reasons, our funding costs may be adversely affected and our liquidity and our funding and lending activities may be constrained.
If our current sources of funding prove to be insufficient, we may be forced to seek alternative financing. The availability
of such alternative financing, and the terms on which it may be available, will depend on a variety of factors, including prevailing market conditions, the availability of credit, our credit ratings and credit market capacity. Even if available, the cost of these alternatives may be more expensive or on unfavourable terms, which could adversely affect our financial performance, liquidity, capital resources and financial condition. There is no assurance that we will be able to obtain adequate funding and do so at acceptable prices, nor that we will be able to recover any additional costs.
If Westpac is unable to source appropriate funding, we may also be forced to reduce our lending or begin selling liquid securities. Such actions may adversely impact our business, prospects, liquidity, capital resources, financial performance or financial condition.
Westpac enters into collateralised derivative obligations, which may require Westpac to post additional collateral based on movements in market rates, which have the potential to adversely affect Westpac’s liquidity.
For a more detailed description of liquidity risk, refer to ‘Liquidity risk’ in this section and Note 27 to the financial statements.
Sovereign risk may destabilise financial markets adversely Sovereign risk is the risk that foreign governments will default on their debt obligations, will be unable to refinance their debts as they fall due, or will nationalise parts of their economy. Should one sovereign default, there could be a cascading effect to other markets and countries, the consequences of which, while difficult to predict, may be similar to or worse than those experienced during the global financial crisis. Such an event could destabilise global financial markets adversely affecting our liquidity, financial performance or financial condition.
Failure to maintain credit ratings could adversely affect our cost of funds, liquidity, competitive position and access to capital markets Credit ratings are independent opinions on our creditworthiness. Our credit ratings affect the cost and availability of our funding from capital markets and other funding sources and they may be important to customers or counterparties when evaluating our products and services. Therefore, maintaining high quality credit ratings is important.
The credit ratings assigned to us by rating agencies are based on an evaluation of a number of factors, including our financial strength, structural considerations regarding the Australian financial system and the credit rating of the Australian Government. A credit rating downgrade could be driven by the occurrence of one or more of the other risks identified in this section or by other events including changes to the methodologies used by the rating agencies to determine ratings.
Failure to maintain our current credit ratings could adversely affect our cost of funds and related margins, collateral requirements, liquidity, competitive position and our access to capital markets. The extent and nature of these impacts would depend on various factors, including the extent of any ratings change, whether our ratings differ among agencies
2014 Westpac Group Annual Report 113

(split ratings) and whether any ratings changes also impact our peers or the sector.
A systemic shock in relation to the Australian, New Zealand or other financial systems could have adverse consequences for Westpac or its customers or counterparties that would be difficult to predict and respond to There is a risk that a major systemic shock could occur that causes an adverse impact on the Australian, New Zealand or other financial systems.
As outlined above, during the past decade the financial services industry and capital markets have been, and may continue to be, adversely affected by market volatility and the negative outlook for global economic conditions. A shock to one of the major global economies could again result in currency and interest rate fluctuations and operational disruptions that negatively impact the Group.
Any such market and economic disruptions could adversely affect financial institutions such as Westpac because consumer and business spending may decrease, unemployment may rise and demand for the products and services we provide may decline, thereby reducing our earnings. These conditions may also affect the ability of our borrowers to repay their loans or our counterparties to meet their obligations, causing us to incur higher credit losses. These events could also result in the undermining of confidence in the financial system, reducing liquidity, impairing our access to funding and impairing our customers and counterparties and their businesses. If this were to occur, our business, prospects, financial performance or financial condition could be adversely affected.
The nature and consequences of any such event are difficult to predict and there can be no certainty that we could respond effectively to any such event.
Declines in asset markets could adversely affect our operations or profitability Declines in Australian, New Zealand or other asset markets, including equity, residential and commercial property and other asset markets, could adversely affect our operations and profitability.
Declining asset prices also impact our wealth management business. Earnings in our wealth management business are, in part, dependent on asset values because we typically receive fees based on the value of securities and/or assets held or managed. A decline in asset prices could negatively impact the earnings of this business.
Declining asset prices could also impact customers and counterparties and the value of security (including residential and commercial property) we hold against loans and derivatives which may impact our ability to recover amounts owing to us if customers or counterparties were to default. It may also affect our level of provisioning which in turn impacts profitability.
Our business is substantially dependent on the Australian and New Zealand economies Our revenues and earnings are dependent on economic activity and the level of financial services our customers require. In particular, lending is dependent on various factors including economic growth, business investment, business
and consumer sentiment, levels of employment, interest rates and trade flows in the countries in which we operate.
We conduct the majority of our business in Australia and New Zealand and, consequently, our performance is influenced by the level and cyclical nature of lending in these countries. These factors are in turn impacted by both domestic and international economic conditions, natural disasters and political events. A significant decrease in Australian and New Zealand housing valuations could adversely impact our home lending activities because borrowers with loans in excess of their property value may show a higher propensity to default and in the event of defaults our security would be eroded, causing us to incur higher credit losses. The demand for our home lending products may also decline due to buyer concerns about decreases in values.
Adverse changes to the economic and business conditions in Australia and New Zealand and other countries such as China, India and Japan, could also adversely affect the Australian economy and our customers. In particular, due to the current relationship between Australia and China, particularly in the mining and resources sectors, a slowdown in China’s economic growth could negatively impact the Australian economy. Changes in economic conditions could in turn result in reduced demand for our products and services and affect the ability of our borrowers to repay their loans. If this were to occur, it could negatively impact our business, prospects, financial performance or financial condition.
An increase in defaults in credit exposures could adversely affect our liquidity, capital resources, financial performance or financial condition Credit risk is a significant risk and arises primarily from our lending and derivatives activities. The risk arises from the possibility that some customers and counterparties will be unable to honour their obligations to us, including the repayment of loan principal and interest.
We establish provisions for credit impairment based on current information. If economic conditions deteriorate, some customers and/or counterparties could experience higher levels of financial stress and we may experience a significant increase in defaults and write-offs, and be required to increase our provisioning. Such events would diminish available capital and could adversely affect our liquidity, capital resources, financial performance or financial condition.
Credit risk also arises from certain derivative contracts we enter into and from our dealings with, and holdings of, debt securities issued by other banks, financial institutions, companies, governments and government bodies the financial conditions of which may be affected to varying degrees by economic conditions in global financial markets.
For a discussion of our risk management procedures, including the management of credit risk, refer to the ‘Risk management’ section and Note 27 to the financial statements.
114 2014 Westpac Group Annual Report

Risk and risk management We face intense competition in all aspects of our business The financial services industry is highly competitive. We compete, both domestically and internationally, with retail and commercial banks, asset managers, investment banking firms, brokerage firms, other financial service firms and businesses in other industries with emerging financial services aspirations. This includes specialist competitors that may not be subject to the same capital and regulatory requirements and therefore may be able to operate more efficiently. Emerging competitors are increasingly utilising new technologies and seek to disrupt existing business models, including in relation to digital payment services.
If we are unable to compete effectively in our various businesses and markets, our market share may decline. Increased competition may also adversely affect us by diverting business to our competitors or creating pressure to lower margins.
Increased competition for deposits could also increase our cost of funding and lead us to access other types of funding. We rely on bank deposits to fund a significant portion of our balance sheet and deposits have been a relatively stable source of funding. We compete with banks and other financial services firms for such deposits. To the extent that we are not able to successfully compete for deposits, we would be forced to rely more heavily on other, potentially less stable or more expensive forms of funding, or reduce lending.
We are also dependent on our ability to offer products and services that match evolving customer preferences. If we are not successful in developing or introducing new products and services or responding or adapting to changes in customer preferences and habits, we may lose customers to our competitors. This could adversely affect our business, prospects, financial performance or financial condition.
For more detail on how we address competitive pressures refer to ‘Competition’ in Section 1.
We could suffer losses due to market volatility We are exposed to market risk as a consequence of our trading activities in financial markets and through the asset and liability management of our financial position. In our financial markets trading business, we are exposed to losses arising from adverse movements in levels and volatility of interest rates, foreign exchange rates, commodity prices, credit prices and equity prices. If we were to suffer substantial losses due to any market volatility it may adversely affect our business, prospects, liquidity, capital resources, financial performance or financial condition. For a discussion of our risk management procedures, including the management of market risk, refer to the ‘Risk management’ section.
We could suffer losses due to operational risks Operational risk is the risk of loss resulting from inadequate or failed internal processes, people and systems or from external events. It also includes, among other things, technology risk, model risk and outsourcing risk.
We are also highly dependent on the conduct of our employees, contractors and external service providers. We could, for example, be adversely affected in the event of human error, inadequate or failed processes or if an
employee, contractor or external service provider engages in fraudulent conduct. We could incur losses from incorrect or fraudulent payments and settlements, particularly real-time payments. We could also incur losses from an unintentional or negligent failure to meet a professional obligation to specific clients, including fiduciary and suitability requirements, or from the nature or design of a product. These may include client, product and business practice risks such as product defects and unsuitability, market manipulation, insider trading, misleading or deceptive conduct, and inadequate or defective financial advice. While we have policies and processes to manage the risk of human error and employee, contractor or external service provider misconduct, these policies and processes may not always be effective.
Fraudulent conduct can also emerge from external parties seeking to access the bank’s systems and customers’ accounts. If systems, procedures and protocols for managing fraud fail, or are ineffective, they could lead to loss which could adversely affect our business, prospects, reputation, financial performance, or financial condition.
Entities within the Group may be involved from time to time in legal proceedings arising from the conduct of their business. The Group’s material contingent liabilities are described in Note 37 to the financial statements. There is a risk that these contingent liabilities may be larger than anticipated or that additional litigation or other contingent liabilities may arise.
As a financial services organisation, Westpac is heavily reliant on the use of data and models in the conduct of its business. We are therefore exposed to model risk, being the risk of loss arising because of errors or inadequacies in data or a model, or in the control and use of the model.
Westpac relies on a number of suppliers, both in Australia and overseas, to provide services to it and its customers. Failure by these suppliers to deliver services as required could disrupt services and adversely impact Westpac’s operations, profitability or reputation.
Operational risks could impact on our operations or adversely affect demand for our products and services. Operational risks can directly impact our reputation and result in financial losses which would adversely affect our financial performance or financial condition.
For a discussion of our risk management procedures, including the management of operational risk, refer to the ‘Risk management’ section.
We could suffer information security risks, including cyberattacks The proliferation of new technologies, the increasing use of the internet and telecommunications to conduct financial transactions and the growing sophistication and activities of organised crime have resulted in increased information security risks for major financial institutions such as Westpac and our external service providers.
While Westpac has systems in place to detect and respond to cyberattacks, there can be no assurance that we will not suffer losses from cyberattacks or other information security breaches in the future.
2014 Westpac Group Annual Report 115
Our operations rely on the secure processing, storage and transmission of information on our computer systems and networks, and the systems and networks of external suppliers. Although we implement significant measures to protect the security, integrity and confidentiality of our information, there is a risk that the computer systems, software and networks on which we rely may be subject to security breaches, unauthorised access, malicious software, external attacks or internal breaches that could have an adverse impact on our confidential information or that of our customers and counterparties.
Major banks in other jurisdictions have recently suffered security breaches from sophisticated cyberattacks. Our external service providers or other parties that facilitate our business activities (e.g. vendors, exchanges, clearing houses, central depositories and financial intermediaries) are also subject to the risk of cyberattacks. Any such security breach could result in the loss of customers and business opportunities, significant disruption to Westpac’s operations, misappropriation of Westpac’s confidential information and/or that of our customers and damage to Westpac’s computers or systems and/or those of our customers. Such a security breach could also result in reputational damage, claims for compensation and regulatory investigations and penalties, which could adversely affect our business, prospects, financial performance, or financial condition.
Our risk and exposure to such threats remains heightened because of the evolving nature of technology, Westpac’s prominence within the financial services industry and our plans to continue to improve and expand our internet and mobile banking infrastructure.
We continue to seek to strengthen and enhance our cybersecurity systems and investigate or remediate any information security vulnerabilities, investing additional resources as required to counter new and emerging threats as they continue to evolve.
We could suffer losses due to technology failures The reliability and security of our information and technology infrastructure are crucial in maintaining our banking applications and processes. There is a risk that our information and technology systems might fail to operate properly or become disabled as a result of events that are wholly or partially beyond our control.
Further, our ability to develop and deliver products and services to customers is dependent upon technology that requires periodic renewal. We are constantly managing technology projects including projects to consolidate technology platforms, simplify and enhance our technology and operations environment, improve productivity and provide for a better customer experience. Failure to implement these projects or manage associated change effectively could result in cost overruns, a failure to achieve anticipated productivity, operational instability or reputational damage. In turn, this could place us at a competitive disadvantage and adversely affect our financial performance.
We could suffer losses due to failures in risk management strategies We have implemented risk management strategies and internal controls involving processes and procedures intended to identify, monitor and manage the risks to which we are subject, including liquidity risk, credit risk, market risk (such as interest rate, foreign exchange and equity risk), compliance risk, conduct risk and operational risk; all of which may impact the Group’s reputation.
However, there are inherent limitations with any risk management framework as there may exist, or emerge in the future, risks that we have not anticipated or identified.
If any of our risk management processes and procedures prove ineffective or inadequate or are otherwise not appropriately implemented, we could suffer unexpected losses and reputational damage which could adversely affect our business, prospects, financial performance or financial condition.
For a discussion of our risk management procedures, refer to the ‘Risk management’ section.
We could suffer losses due to insurance risk We have exposure to insurance risk in our life insurance and general insurance businesses, which may adversely affect our business, operations and financial condition.
Insurance risk is the risk of loss due to increases in policy benefits paid to customers arising from variations in the incidence or severity of insured events.
In the life insurance business, insurance risk arises primarily through mortality (death) and morbidity (illness and injury) risks being greater than expected.
In the general insurance business, insurance risk arises mainly through environmental factors (including floods and bushfires) and other calamities, such as earthquakes, tsunamis and volcanic activity, as well as general variability in home, contents, motor, travel and other insurance claim amounts. Further details on environmental risk factors are discussed below.
We could suffer losses due to environmental factors We and our customers operate businesses and hold assets in a diverse range of geographic locations. Any significant environmental change or external event (including fire, storm, flood, earthquake or pandemic) in any of these locations has the potential to disrupt business activities, impact on our operations, damage property and otherwise affect the value of assets held in the affected locations and our ability to recover amounts owing to us. In addition, such an event could have an adverse impact on economic activity, consumer and investor confidence, or the levels of volatility in financial markets.
The risk of loss due to environmental factors is also relevant to our insurance business. The frequency and severity of external events such as natural disasters is difficult to predict and it is possible that the amounts we reserve for such events may not be adequate to cover actual claims that may arise, which could adversely affect our business, prospects, financial performance or financial condition.
116 2014 Westpac Group Annual Report

Risk and risk management Reputational damage could harm our business and prospects Our ability to attract and retain customers and our prospects could be adversely affected if our reputation is damaged.
Reputation risk arises where there are differences between stakeholders’ current and emerging perceptions, beliefs and expectations and our current and planned activities, performance and behaviours.
There are various potential sources of reputational damage, including failure to effectively manage risks in accordance with our risk management frameworks, potential conflicts of interest, pricing policies, failure to comply with legal and regulatory requirements, making inaccurate public statements, environmental, social and ethical issues, engagement and conduct of external suppliers, failure to comply with anti-money laundering and anti-bribery and corruption laws, trade sanctions and counter-terrorism finance legislation or privacy laws, litigation, failure of information security systems, improper sales and trading practices, failure to comply with personnel and supplier policies, improper conduct of companies in which we hold strategic investments, technology failures and security breaches. Our reputation could also be adversely affected by the actions of the financial services industry in general or from the actions of customers, suppliers and other counterparties.
Failure to appropriately address issues that could or do give rise to reputational risk could also impact the regulatory change agenda, give rise to additional legal risk, subject us to regulatory enforcement actions, fines and penalties, or remediation costs, or harm our reputation among customers, investors and the marketplace. This could lead to loss of business which could adversely affect our business, prospects, financial performance or financial condition.
We could suffer losses due to impairment to capitalised software, goodwill and other intangible assets that may adversely affect our business, operations and financial condition In certain circumstances Westpac may be exposed to a reduction in the value of intangible assets. As at 30 September 2014, Westpac carried goodwill principally related to its investments in Australia, other intangible assets principally relating to assets recognised on acquisition of subsidiaries and capitalised software balances.
Westpac is required to assess the recoverability of the goodwill balances on at least an annual basis. For this purpose Westpac uses either a discounted cash flow or a multiple of earnings calculation. Changes in the assumptions upon which the calculation is based, together with expected changes in future cash flows, could materially impact this assessment, resulting in the potential write-off of part or all of the goodwill balances.
Capitalised software and other intangible assets are assessed for indicators of impairment at least annually or on indication of impairment. In the event that an asset is no longer in use, or that the cash flows generated by the asset do not support the carrying value, an impairment will be recorded, adversely impacting the Group’s financial condition.
We could suffer losses if we fail to syndicate or sell down underwritten securities As a financial intermediary we underwrite listed and unlisted debt and equity securities. Underwriting activities include the development of solutions for corporate and institutional customers who need capital and investor customers who have an appetite for certain investment products. We may guarantee the pricing and placement of these facilities. We could suffer losses if we fail to syndicate or sell down our risk to other market participants. This risk is more pronounced in times of heightened market volatility.
Certain strategic decisions may have adverse effects on our business Westpac, at times, evaluates and may undertake strategic decisions which may include business expansion, including acquisitions of businesses. The expansion or integration of a new business can be complex and costly and may require Westpac to comply with additional local or foreign regulatory requirements which may carry additional risks. These decisions may, for a variety of reasons, not deliver the anticipated positive business results and could have a negative impact on our business, prospects, engagement with regulators, financial performance or financial condition.
Risk management Westpac’s vision is to be one of the world’s great companies, helping our customers, communities and people to prosper and grow.
Effective risk management is one of the keys to achieving this goal. It influences our customer experiences and public perceptions, our financial performance, reputation and shareholder expectations, and thus our future success. We regard managing risk as a fundamental activity, performed at all levels of the Group.
The Risk Management Strategy is approved by the Board and reviewed by the Board Risk and Compliance Committee (BRCC) on an annual basis or more frequently where required by a material business or strategy change or a material change to the Group’s risk profile. It is owned by the Chief Executive Officer.
For further information regarding the role and responsibilities of the BRCC and other Board committees in managing risk, refer to ‘Corporate governance – Risk management’ in Section 1.
The CEO and Executive Team are responsible for implementing our Risk Management Strategy and frameworks, and for developing policies, controls, processes and procedures for identifying and managing risk in all of Westpac’s activities.
As outlined in the ‘Corporate governance’ section, we adopt a Three Lines of Defence approach to risk management which reflects our culture of ‘risk is everyone’s business’ and that all employees are responsible for identifying and managing risk and operating within the Group’s desired risk profile. We embed risk culture and maintain an awareness of risk management responsibilities through regular communication, training and other targeted approaches that support our risk management framework.
For a comprehensive discussion of the risks to which Westpac is exposed, and its policies to manage these risks,
2014 Westpac Group Annual Report 117

refer to ‘Corporate governance – Risk management’ in Section 1 and Note 27 to the financial statements.
Credit risk Credit risk is the risk of financial loss where a customer or counterparty fails to meet their financial obligations to Westpac.
We have a framework and supporting policies for managing the credit risk associated with lending across our business divisions. The framework and policies encompass all stages of the credit cycle – origination, evaluation, approval, documentation, settlement, ongoing administration and problem management. For example, we have established product-based standards for lending to individuals, with key controls including minimum serviceability standards and maximum loan to security value ratios. We offer residential property loans to both owner-occupiers and investors at both fixed and variable rates, secured by a mortgage over the property or other acceptable collateral. Where we lend to higher loan to value ratios we typically also require lenders mortgage insurance. Similarly, we have established criteria for business, commercial, corporate and institutional lending, which can vary by industry segment. In this area we focus on the performance of key financial risk ratios, including interest coverage, debt serviceability and balance sheet structure. When providing finance to smaller business, commercial and corporate borrowers we typically obtain security, such as a mortgage over property and/or a general security agreement over business assets. For larger corporates and institutions we typically also require compliance with selected financial ratios and undertakings and may hold security. In respect of commercial property lending we maintain loan origination and ongoing risk management standards, including specialised management for higher value loans. We consider factors such as the nature, location, quality and expected demand for the asset, tenancy profile and experience and quality of management. We actively monitor the Australian and New Zealand property markets and the composition of our commercial property loan book across the Group.
The extension of credit is underpinned by the Group’s Principles of Responsible Lending. This is reflected in our commitment to comply with all local legislation, codes of practice and relevant guidelines and obligations to market our products responsibly and stay in touch with the expectations of customers and the community.
Refer to Note 27 to the financial statements for details of our credit risk management policies.
Provisions for impairment charges on loans For information on the basis for determining the provision for impairment charges on loans refer to ‘Critical accounting assumptions and estimates’ in Note 1 to the financial statements.
Credit risk concentrations We monitor our credit portfolio to manage risk concentrations. At 30 September 2014, our exposure to consumers comprised 71% (2013: 71%, 2012: 71%) of our on-balance sheet loans and 57% (2013: 57%, 2012: 57%) of total credit commitments. At 30 September 2014, 90% (2013: 90%, 2012: 91%) of our exposure to consumers was supported by residential real estate mortgages. The
consumer category includes investment property loans to individuals, credit cards, personal loans, overdrafts and lines of credit. Our consumer credit risks are diversified, with substantial consumer market share in every state and territory in Australia, New Zealand and the Pacific region. Moreover, these customers service their debts with incomes derived from a wide range of occupations, in city as well as country areas.
Exposures to businesses, government and other financial institutions are classified into a number of industry clusters based on groupings of related Australian and New Zealand Standard Industrial Classification (ANZSIC) codes and are monitored against industry risk limits. The level of industry risk is measured and monitored on a dynamic basis. We also control the concentration risks that can arise from large exposures to individual borrowers.
118 2014 Westpac Group Annual Report

Risk and risk management Liquidity risk Liquidity risk is the risk that the Group will be unable to fund assets and meet obligations as they become due. This risk could potentially arise as a result of:
an inability to meet both expected and unexpected current and future cashflows and collateral needs without affecting either daily operations or the financial condition of the bank; and/or
inadequate market depth or market disruption impacting the ability to offset or eliminate a position at the market price. Liquidity risk is managed through our BRCC-approved Liquidity Risk Management Framework.
Refer to Note 27 to the financial statements for a more detailed discussion of our liquidity risk management policies.
Westpac debt programs and issuing shelves Access in a timely and flexible manner to a diverse range of debt markets and investors is provided by the following programs and issuing shelves as at 30 September 2014:
Program Limit Issuer(s) Program/Issuing Shelf Type Australia
No limit WBC Debt Issuance Program
Euro Market USD 2.5 billion WBC Euro Transferable Certificate of Deposit Program
USD 20 billion WBC/WSNZL1 Euro Commercial Paper and Certificate of Deposit Program
USD 70 billion WBC Euro Medium Term Note Program
USD 7.5 billion WSNZL1 Euro Medium Term Note Program
USD 40 billion WBC2 Global Covered Bond Program
EUR 5 billion WSNZL3 Global Covered Bond Program
Japan JPY 750 billion WBC Samurai shelf
JPY 750 billion WBC Uridashi shelf
United States USD 45 billion WBC US Commercial Paper Program
USD 10 billion WSNZL1 US Commercial Paper Program
USD 35 billion WBC US MTN Program
No limit WBC (NY Branch) Certificate of Deposit Program
No limit WBC US Securities and Exchange Commission registered shelf
New Zealand No limit WNZL Medium Term Note and Registered Certificate of Deposit Program
1 Notes issued under this program by Westpac Securities NZ Limited, London branch are guaranteed by Westpac New Zealand Limited, its parent company.
2 Notes issued under this program are guaranteed by BNY Trust Company of Australia Limited as trustee of the Westpac Covered Bond Trust. 3 Notes issued under this program by Westpac Securities NZ Limited, London branch are guaranteed by Westpac New Zealand Limited, its parent
company, and Westpac NZ Covered Bond Limited.
2014 Westpac Group Annual Report 119

Market risk Market risk is the risk of an adverse impact on earnings resulting from changes in market factors, such as foreign exchange rates, interest rates, commodity prices and equity prices. Market risk arises in both trading and banking book activities.
Our trading activities are conducted in our Financial Markets and Treasury businesses. Financial Market’s trading book activity represents dealings that encompass book running and distribution activity. Treasury’s trading activity represents dealings that include the management of interest rate, foreign exchange (FX) and credit spread risk associated with wholesale funding, liquid asset portfolios and hedging of foreign currency earnings and capital deployed offshore.
Refer to Note 27 to the financial statements for a more detailed discussion of our market risk management policies.
The table below depicts the aggregate Value at Risk (VaR), by risk type, for the year ended 30 September:
Consolidated and Parent Entity
High Low Average High Low Average High Low Average $m $m $m $m $m $m $m $m $m
Interest rate risk 30.7 6.3 15.6 30.8 9.1 16.7 29.0 10.5 18.4 Foreign exchange risk 7.6 1.2 3.0 5.7 0.5 2.1 8.0 0.8 3.3 Equity risk 0.7 0.1 0.3 0.8 0.1 0.3 1.8 0.2 0.5 Commodity risk1 2.9 1.3 2.0 6.1 1.2 2.9 5.1 1.0 2.5 Other market risks2 11.3 5.4 9.2 13.0 5.8 7.9 21.6 7.8 16.6 Diversification effect n/a n/a (8.2) n/a n/a (10.7) n/a n/a (12.5) Net market risk 40.2 9.5 22.0 35.4 12.5 19.2 41.2 16.8 28.8
2014 2013 2012
1 Includes electricity risk. 2 Includes prepayment risk and credit spread risk (exposure to movements in generic credit rating bands).
The graph below compares the actual profit and loss from trading activities on a daily basis to VaR over the reporting period:
(40)
(30)
(20)
(10)
-
10
20
30
5 10 15 20 25 30 35 40 45
Act
ual D
aily
Pro
fit a
nd L
oss
($m
)
Daily Value at Risk ($m)
Each point on the graph represents one day’s profit or loss from trading activities. The result is placed on the graph relative to the associated VaR utilisation. The downward sloping line represents the point where a loss is equal to VaR utilisation. Therefore any point below the line represents a back-test exception (i.e. where the loss is greater than VaR).
120 2014 Westpac Group Annual Report

Risk and risk management Operational risk and compliance risk Operational risk is the risk of loss resulting from inadequate or failed internal processes, people and systems, or from external events including legal risk but excluding strategic and reputation risk. It also includes, among other things, technology risk, model risk and outsourcing risk.
The way operational risk is managed has the potential to positively or negatively impact our customers, our employees, our financial performance and our reputation.
Compliance risk is the risk of legal or regulatory sanction, financial or reputational loss, arising from our failure to abide by the compliance obligations required of us.
Compliance is focused on meeting our legal and regulatory obligations in each of the jurisdictions in which we operate by proactively managing compliance risk. Refer to ‘Corporate governance’ in Section 1 for information on our management of operational and compliance risk.
The Group’s Operational Risk Management Framework and Compliance Management Framework assist all divisions to achieve their objectives through the effective identification, assessment, measurement, management, monitoring, reporting, control and mitigation of their risks. The Operational Risk Management Framework defines the organisational and governance structures, roles and responsibilities, principles, policies, processes and systems that we use to manage operational risk. The Compliance Management Framework defines the principles, policies and processes, systems, and roles and responsibilities that we use to meet our obligations under the law, based on the letter and spirit of the regulatory standards that apply to the Group. The Frameworks are underpinned by a culture of individual accountability and responsibility, based on a Three Lines of Defence model. This is discussed in further detail in Note 27 to the financial statements.
Other risks Business risk and risks arising from our strategic objectives and business plans The risk associated with the vulnerability of a line of business to changes in the business environment, strategic risk and risks specific to our business plans and objectives.
Sustainability risks The risk of damage to Westpac’s reputation or financial performance due to failure to recognise or address material existing or emerging sustainability-related environmental, social or governance issues.
The Group has in place a Sustainability Risk Management Framework that is supported by a suite of key supporting policies and position statements. These include the Principles for Doing Business, Principles for Responsible Lending, ESG Credit Risk Policy, Climate Change and Environment Position Statement and Action Plan and sensitive sector position statements, and Sustainable Supply Chain Management Code of Conduct and Framework, many of which are publicly available. The Sustainability Risk Management Framework was reviewed and updated in 2014.
Westpac is also a signatory to a number of voluntary principles-based frameworks that guide the integration of ESG-related issues into investment analysis. These include the Equator Principles covering project finance activities and the Principles for Responsible Investment covering investment analysis.
Equity risk The potential for financial loss arising from adverse movements in equity values. Equity risk can be direct, indirect or contingent.
The Group’s direct equity risk arises from principal investments or net trading or underwriting positions in listed or unlisted equities. It also includes seed funding, debt for equity swaps, equity derivatives and other situations where the value of Westpac’s investment is directly affected by the change in value of the equity instrument to the full extent of that change. Our indirect equity risk is primarily related to the potential for equity market volatility to impact on fee income that is based on the size of funds under management and administration. Our contingent equity risk arises from normal lending activities secured by or with recourse to listed and/or unlisted equities and the borrower, or to another equity like source of risk protection. Contingent risk materialises when there is a default, and a subsequent shortfall from the realisation of equity related assets that is not covered from other sources of recourse.
The Group has in place various policies, limits and controls to manage these risks and the conflicts of interest that can potentially arise.
Insurance risk The risk of misestimation of the expected cost of insured events, volatility in the number or severity of insured events, and misestimation of the cost of incurred claims.
Subsidiaries within the Group’s BT Financial Group undertake life insurance, general insurance and lenders mortgage insurance. They are governed by independent boards and are subject to separate regulatory oversight and controls. These subsidiaries have comprehensive reinsurance arrangements in place to transfer risk and protect against catastrophic events. They are capitalised to a level that exceeds the minimum required by the relevant regulator.
2014 Westpac Group Annual Report 121

Related entity (contagion) risk The risk that problems arising in other Westpac Group members compromise the financial and operational position of the ADI in the Westpac Group.
The Group has in place a Risk Management Framework and a suite of supporting policies and procedures governing the control of dealings with, and activities that may be undertaken by, Group members. Controls include the measurement, approval and monitoring of, and limitations on, the extent of intra-group credit exposures and other forms of parent entity support, plus requirements related to control of Group badging, product distribution, promotional material, service-level agreements and managing potential conflicts of interest.
Reputation risk The risk to earnings or capital arising from negative public opinion resulting from the loss of reputation or public trust and standing.
Reputation risk can arise from gaps between current and/or emerging stakeholder perceptions and expectations relative to our current or planned activities, performance or behaviours. It can affect the Group’s brands and businesses positively or negatively. Stakeholder perceptions can include (but are not limited to) views on financial performance, quality of products or services, quality of management, leadership and governance, history and heritage and our approach to sustainability, social responsibility and ethical behaviour.
We have a Reputation Risk Management Framework and key supporting policies in place covering the way we manage reputation risk as one of our key risks across the Group, including the setting of risk appetite and roles and responsibilities for risk identification, measurement and management, monitoring and reporting.
Structured entities We are associated with a number of structured entities in the ordinary course of business, primarily to provide funding and financial services products to our customers.
Structured entities are typically set up for a single, pre-defined purpose, have a limited life and generally are not operating entities nor do they have employees. The most common form of structured entity involves the acquisition of financial assets by the structured entity that are funded by the issuance of securities to external investors (securitisation). Repayment of the securities is determined by the performance of the assets acquired by the structured entity.
Under AAS, a structured entity is consolidated and reported as part of the Group if it is controlled by the parent entity in line with AASB 10 Consolidated Financial Statements. The definition of control is based on the substance rather than the legal form. Refer to Note 1 to the financial statements for a description of how we apply the requirements to evaluate whether to consolidate structured entities. Refer to Note 41 to the financial statements for further information.
In the ordinary course of business, we have established or sponsored the establishment of structured entities in relation to securitisation, as detailed below. Capital is held, as appropriate, against all structured entity-related transactions and exposures.
Covered bond guarantors Through our covered bond programs we assign our equitable interests in residential mortgage loans to a structured entity covered bond guarantor which guarantees the obligations of our covered bonds. We provide arm’s length swaps to the covered bond guarantor in accordance with relevant prudential guidelines. We have no obligation to repurchase any assets from the covered bond guarantor, other than in certain circumstances where there is a breach of representation or warranty. We may repurchase loans from the covered bond guarantor at our discretion, subject to the conditions set out in the transaction documents.
As at 30 September 2014, the carrying value of assets pledged for the covered bond programs for the Group was $39.3 billion (2013: $34.2 billion).
Refer to Note 32 to the financial statements for further details.
Securitisation structured entities Through our securitisation programs we assign our equitable interests in assets (in respect of RMBS, principally residential mortgage loans, and in respect of ABS, principally auto receivables) to structured entities which issue securities to investors. We provide arm’s length interest rate swaps and liquidity facilities to the structured entities in accordance with relevant prudential guidelines. We have no obligation to repurchase any securitisation securities, other than in certain circumstances (excluding impaired assets) where there is a breach of representation or warranty within 120 days of the initial sale (except in respect of our program in New Zealand which imposes no such time limitation). We may remove assets from the program where they cease to conform with the terms and conditions of the securitisation programs or through a program’s clean-up features.
As at 30 September 2014, own assets securitised through a combination of privately or publicly placed issues to Australian, New Zealand, European and United States investors was $11.6 billion (2013: $10.8 billion).
122 2014 Westpac Group Annual Report

Risk and risk management Under AAS substantially all of the structured entities involved in our loan securitisation programs are consolidated by the Group.
Refer to Note 32 to the financial statements for further details.
Customer funding conduits We arrange financing for certain customer transactions through a commercial paper conduit that provides customers with access to the commercial paper market. As at 30 September 2014, we administered one significant conduit (2013: one), that was created prior to 1 February 2003, with commercial paper outstanding of $1.4 billion (2013: $1.8 billion). We provide a letter of credit facility as credit support to the commercial paper issued by the conduit. This facility is a variable interest in the conduit that we administer and represents a maximum exposure to loss of $147 million as at 30 September 2014 (2013: $186 million). The conduit is consolidated by the Group.
Refer to Note 32 to the financial statements for further details.
Structured finance transactions We have entered into transactions with structured entities to provide financing to customers or to provide financing to the Group. Any financing arrangements to customers are entered into under normal lending criteria and are subject to our normal credit approval processes. The assets arising from these financing activities are generally included in receivables due from other financial institutions or available-for-sale securities. The liabilities arising from these financing activities are generally included in payables due to other financial institutions, debt issues or financial liabilities designated at fair value. Exposures in the form of guarantees or undrawn credit lines are included within contingent liabilities and credit-related commitments.
Off-balance sheet arrangements Wealth management activity Refer to Note 38 to the financial statements for details of our wealth management activities.
Other off-balance sheet arrangements Refer to Note 36 to the financial statements for details of our superannuation plans and Note 37 for details of our contingent liabilities, contingent assets and credit commitments.
Financial reporting Internal control over financial reporting The US Congress passed the Public Company Accounting Reform and Investor Protection Act in July 2002, which is commonly known as the Sarbanes-Oxley Act of 2002 (SOX). SOX is a wide ranging piece of US legislation concerned largely with financial reporting and corporate governance. We are obligated to comply with SOX by virtue of being a foreign registrant with the SEC and we have established procedures designed to comply with all applicable requirements of SOX.
Disclosure controls and procedures Our management, with the participation of our CEO and CFO, evaluated the effectiveness of the design and operation of our disclosure controls and procedures (as defined in Rule 13a-15(e) under the US Securities Exchange Act of 1934) as of 30 September 2014.
Based upon this evaluation, our CEO and CFO have concluded that the design and operation of our disclosure controls and procedures were effective as of 30 September 2014.
Management’s Report on internal control over financial reporting Rule 13a-15(a) under the US Securities Exchange Act of 1934 requires us to maintain an effective system of internal control over financial reporting. Refer to the sections headed ‘Management’s report on internal control over financial reporting’ and ‘Report of independent registered public accounting firm’ in Section 3 for those reports.
Changes in our internal control over financial reporting There has been no change in our internal control over financial reporting (as defined in Rule 13a-15(f) of the US Securities Exchange Act of 1934) for the year ended 30 September 2014 that has been identified that has materially affected, or is reasonably likely to materially affect, our internal control over financial reporting.
2014 Westpac Group Annual Report 123

Other Westpac business information Employees The number of employees in each area of business as at 30 September1:
2014 2013 2012AFS
Westpac RBB 9,882 9,847 10,171 St.George 5,629 5,149 5,106 BTFG 4,169 4,164 3,898
WIB 1,872 1,793 1,751 Westpac New Zealand 4,342 4,481 4,691 Other 10,479 10,163 10,058 Total employees 36,373 35,597 35,675
1 Total employees includes full-time, pro-rata part-time, overtime, temporary and contract staff.
2014 v 2013 Total FTE increased by 776 compared to 30 September 2013. This increase was driven by the acquisition of Lloyds (554 FTE) and investment in Bank of Melbourne (149 FTE), further expansion in Asia (91 FTE) and simplification programs (61 FTE). These were partly offset by productivity program benefits.
Property We occupy premises primarily in Australia, New Zealand and the Pacific Islands including 1,534 branches, (2013: 1,544) as at 30 September 2014. As at 30 September 2014, we owned approximately 2.0% (2013: 2.0%) of the premises we occupied in Australia, none (2013: none) in New Zealand and 54% (2013: 53%) in the Pacific Islands. The remainder of premises are held under commercial lease with the terms generally averaging five years. As at 30 September 2014, the carrying value of our directly owned premises and sites was approximately $228 million (2013: $182 million). Westpac Place in the Sydney CBD is the Group’s head office and has a 6,414 seat capacity. In 2008 we signed a 10 year 9 month lease, which commenced in November 2008 and contains three six-year options to extend. 60 Martin Place in the Sydney CBD is the next largest corporate site. The Martin Place office has a 2,379 seat capacity. A lease commitment at this site extends to 2015. We have retained a corporate presence in Kogarah, in the Sydney metro area, which is a key corporate office of St.George. The Kogarah head office has a 2,319 seat capacity. A lease commitment at this site extends to 2021 with five five-year options to extend. In July 2010, Westpac entered into a lease and services agreement for a purpose built data centre in Western Sydney. This agreement relates to the design, construction and operation of the data centre and is for a period of 15 years with two further five year option periods. The site was handed over on 28 September 2011. In November 2011, an Agreement for Lease for part of 150 Collins Street, Melbourne, was executed between the following parties: Westpac Banking Corporation (Tenant), APN (Lessor), and APN and Grocon (Developers). The term of the lease is 12 years. Construction is near completion, with occupancy expected to commence late-2014.
In June 2012, an Agreement for Lease between Westpac Banking Corporation and Lend Lease (Millers Point) Pty Ltd (Developer) was executed with Westpac as anchor tenant for the T2 Tower at the Barangaroo South development. The term of the lease is 15 years. Design and construction is progressing in line with project milestones, with occupancy on track for mid- to late-2015 In February 2014, Westpac exercised its contractual right to purchase 100% of the units in the North Ryde Office Trust. The assets acquired consist of a data centre and the land on which it resides. Prior to this acquisition, Westpac had a long term lease for the data centre. ‘Westpac on Takutai Square’ is Westpac New Zealand’s head office, located at the Eastern end of Britomart Precinct near Customs Street in Auckland, contains 24,510 square metres of office space across two buildings and has a capacity of approximately 2,110 seats. A lease commitment at this site extends to 2021, with two six-year options to extend.
Significant long term agreements Westpac’s significant long term agreements are summarised in Note 35 to the financial statements.
Related party disclosures Details of our related party disclosures are set out in Note 42 to the financial statements and details of Directors’ interests in securities are set out in the Remuneration Report included in the Directors’ Report. The related party disclosures relate principally to transactions with our Directors and Director-related parties as we do not have individually significant shareholders and our transactions with other related parties are not significant. Other than as disclosed in Note 42 to the financial statements and the Remuneration Report, if applicable, loans made to parties related to Directors and other key management personnel of Westpac are made in the ordinary course of business on normal terms and conditions (including interest rates and collateral). Loans are made on the same terms and conditions (including interest rates and collateral) as apply to other employees and certain customers in accordance with established policy. These loans do not involve more than the normal risk of collectability or present any other unfavourable features.
Auditor’s remuneration Auditor’s remuneration, including goods and services tax, to the external auditor for the years ended 30 September 2014 and 2013 is provided in Note 34 to the financial statements. Audit related services Westpac Group Secretariat monitors the application of the pre-approval process in respect of audit, audit-related and non-audit services provided by PricewaterhouseCoopers (PwC) and promptly brings to the attention of the BAC any exceptions that need to be approved pursuant to paragraph (c)(7)(i)(C) of Rule 2-01 of Regulation S-X. The pre-approval guidelines are communicated to Westpac’s divisions through publication on the Westpac intranet. During the year ended 30 September 2014, there were no fees paid by Westpac to PwC that required approval by the BAC pursuant to paragraph (c)(7)(i)(C) of Rule 2-01 of Regulation S-X.
124 2014 Westpac Group Annual Report

03 Financial statements Income statements Statements of comprehensive income Balance sheets Statements of changes in equity Cash flow statements
Notes to the financial statementsNote 1 Summary of significant accounting policies Note 2 Net interest income Note 3 Non-interest income Note 4 Operating expenses Note 5 Income tax Note 6 Dividends Note 7 Earnings per share Note 8 Receivables due from other financial
institutions Note 9 Trading securities and other financial
assets designated at fair value Note 10 Available-for-sale securities Note 11 Loans Note 12 Provisions for impairment charges Note 13 Property, plant and equipment Note 14 Deferred tax assets and deferred tax
liabilities Note 15 Goodwill and other intangible assets Note 16 Other assets Note 17 Payables due to other financial institutions Note 18 Deposits and other borrowings Note 19 Other financial liabilities at fair value
through income statement Note 20 Provisions Note 21 Other liabilities Note 22 Debt issues Note 23 Loan capital Note 24 Shareholders’ equity and non-controlling
interests
Note 25 Share-based payments Note 26 Average balance sheet and interest rates Note 27 Financial risk Note 27.1 Approach to risk management Note 27.2 Credit risk management Note 27.3 Funding and liquidity risk
management Note 27.4 Market risk Note 28 Fair values of financial assets and
liabilities Note 29 Derivative financial instruments Note 30 Offsetting financial assets and financial
liabilities Note 31 Capital adequacy Note 32 Securitisation and covered bonds Note 33 Group segment information Note 34 Auditor’s remuneration Note 35 Expenditure commitments Note 36 Superannuation commitments Note 37 Contingent liabilities, contingent assets
and credit commitments Note 38 Fiduciary activities Note 39 Group entities Note 40 Other group investments Note 41 Structured entities Note 42 Related party disclosures Note 43 Notes to the cash flow statements Note 44 Subsequent events
Statutory statements Directors’ declaration Management’s report on internal control over financial reporting Independent Auditor’s report to the members of Westpac Banking Corporation Report of independent registered public accounting firm

Financial statements Income statements for the years ended 30 September Westpac Banking Corporation
Consolidated2014 20131 20121 2014 20131
Note $m $m $m $m $mInterest income 2 32,248 33,009 36,873 32,076 32,942 Interest expense 2 (18,706) (20,188) (24,371) (21,012) (22,123) Net interest income 13,542 12,821 12,502 11,064 10,819 Non-interest income 3 6,395 5,774 5,481 5,905 5,375 Net operating income before operating expenses and impairment charges 19,937 18,595 17,983 16,969 16,194 Operating expenses 4 (8,547) (7,976) (7,957) (6,939) (6,499) Impairment charges 12 (650) (847) (1,212) (561) (662) Profit before income tax 10,740 9,772 8,814 9,469 9,033 Income tax expense 5 (3,115) (2,947) (2,812) (2,235) (2,228) Net profit for the year 7,625 6,825 6,002 7,234 6,805 Profit attributable to non-controlling interests (64) (74) (66) - - Net profit attributable to owners of Westpac Banking Corporation 7,561 6,751 5,936 7,234 6,805 Earnings per share (cents)Basic 7 243.7 218.3 194.7 Diluted 7 238.7 213.5 189.4
Parent Entity
1 Prior period comparatives have been restated for the effects of new and amended Accounting Standards that are effective this financial year. Refer to
‘Summary of quantitative impacts’ in Note 1 for further details.
The above income statements should be read in conjunction with the accompanying notes.
126 2014 Westpac Group Annual Report

Financial statements Statements of comprehensive income for the years ended 30 September Westpac Banking Corporation
2014 20131 20121 2014 20131
Note $m $m $m $m $mNet profit for the year 7,625 6,825 6,002 7,234 6,805Other comprehensive incomeItems that may be reclassified subsequently to profit or lossGains/(losses) on available-for-sale securities:
Recognised in equity 10 263 57 139 222 7Transferred to income statements (94) (104) (127) 9 (88)
Gains/(losses) on cash flow hedging instruments:Recognised in equity 41 (51) 519 90 (68)Transferred to income statements (197) (234) - (239) (260)
Exchange differences on translation of foreign operations 61 114 (64) 14 125Income tax on items taken directly to or transferred directly from equity:
Available-for-sale securities reserve (52) 15 (1) (48) 16Cash flow hedging reserve 47 85 (160) 45 98Foreign currency translation reserve - (11) 4 - (11)
Items that will not be reclassified subsequently to profit or lossOwn credit adjustment on financial liabilities designated at fair value 11 44 - 11 44Remeasurement of defined benefit obligation recognised in equity(net of tax) (47) 247 57 (49) 225
Other comprehensive income for the year (net of tax) 33 162 367 55 88Total comprehensive income for the year 7,658 6,987 6,369 7,289 6,893Attributable to:
Owners of Westpac Banking Corporation 7,594 6,913 6,303 7,289 6,893Non-controlling interests 64 74 66 - -
Total comprehensive income for the year 7,658 6,987 6,369 7,289 6,893
Parent EntityConsolidated
1 Prior period comparatives have been restated for the effects of new and amended Accounting Standards that are effective this financial year. Refer to
‘Summary of quantitative impacts’ in Note 1 for further details.
The above statements of comprehensive income should be read in conjunction with the accompanying notes.
2014 Westpac Group Annual Report 127

Balance sheets as at 30 September Westpac Banking Corporation
2014 20131 2014 20131
Note $m $m $m $mAssets Cash and balances with central banks 43 25,760 11,699 23,400 9,509Receivables due from other financial institutions 8 7,424 11,210 5,483 9,317Trading securities and other financial assets designated at fair value 9 45,909 49,089 44,324 47,018Derivative financial instruments 29 41,404 28,356 41,307 28,405Available-for-sale securities 10 36,024 30,011 32,009 26,394Loans 11 580,343 536,164 505,604 471,657Life insurance assets 11,007 13,149 - -Regulatory deposits with central banks overseas 1,528 1,571 1,389 1,463Due from subsidiaries - - 140,098 119,038Investments in subsidiaries - - 4,687 4,880Property, plant and equipment 13 1,452 1,174 1,113 971Deferred tax assets 14 1,397 1,773 1,322 1,632Goodwill and other intangible assets 15 12,606 12,341 9,715 9,725Other assets 16 5,988 4,560 5,017 3,697Total assets 770,842 701,097 815,468 733,706LiabilitiesPayables due to other financial institutions 17 18,636 8,836 18,411 8,738Deposits and other borrowings 18 460,822 424,482 414,183 380,208Other financial liabilities at fair value through income statement 19 19,236 10,302 19,155 10,302Derivative financial instruments 29 39,539 32,990 39,141 32,438Debt issues 22 152,251 144,133 127,846 121,555Current tax liabilities 662 895 614 840Life insurance liabilities 9,637 11,938 - -Due to subsidiaries - - 135,066 120,553Provisions 20 1,618 1,576 1,403 1,395Deferred tax liabilities 14 55 22 - -Other liabilities 21 8,191 9,056 6,409 7,395Total liabilities excluding loan capital 710,647 644,230 762,228 683,424Loan capital 23 10,858 9,330 10,858 9,330Total liabilities 721,505 653,560 773,086 692,754Net assets 49,337 47,537 42,382 40,952Shareholders’ equity Share capital:
Ordinary share capital 24 26,943 27,021 26,943 27,021Treasury shares and RSP treasury shares 24 (304) (253) (239) (181)
Reserves 1,176 953 921 691Retained profits 20,641 18,953 14,002 12,666Convertible debentures 24 - - 755 755Total equity attributable to owners of Westpac Banking Corporation 48,456 46,674 42,382 40,952Non-controlling interests 24 881 863 - -Total shareholders’ equity and non-controlling interests 49,337 47,537 42,382 40,952
Consolidated Parent Entity
1 Prior period comparatives have been restated for the effects of new and amended Accounting Standards that are effective this financial year. Refer to
‘Summary of quantitative impacts’ in Note 1 for further details.
The above balance sheets should be read in conjunction with the accompanying notes.
128 2014 Westpac Group Annual Report

Financial statements Statements of changes in equity as at 30 September Westpac Banking Corporation
Consolidated Parent Entity2014 20131 20121 2014 20131
$m $m $m $m $mShare capital Balance as at beginning of the year 26,768 26,163 25,269 26,840 26,241Shares issued:
Dividend reinvestment plan - 531 873 - 531Exercise of employee share options and rights 49 124 26 49 124Redemption of Westpac SPS - 173 - - 173
Shares purchased for delivery upon exercise of options and share rights (net of tax) (100) (162) - (100) (162)Shares purchased for delivery of employee share plan (27) - - (27) -Acquisition of RSP treasury shares (59) (68) (8) (59) (68)Disposal/(acquisition) of other treasury shares 8 7 3 1 1Balance as at end of the year 26,639 26,768 26,163 26,704 26,840Available-for-sale securities reserveBalance as at beginning of the year 12 44 31 (104) (39)Current period movement due to changes in other comprehensive income:
Net gains/(losses) from changes in fair value 263 57 139 222 7Exchange differences - - 2 - -Income tax effect (79) (17) (39) (69) (10)Transferred to income statements (94) (104) (127) 9 (88)Income tax effect 27 32 38 21 26
Balance as at end of the year 129 12 44 79 (104)Share-based payment reserveBalance as at beginning of the year 920 790 648 846 727Current period movement due to transactions with employees 156 130 142 137 119Balance as at end of the year 1,076 920 790 983 846Cash flow hedging reserveBalance as at beginning of the year 271 471 112 254 484Current period movement due to changes in other comprehensive income:
Net gains/(losses) from changes in fair value 41 (51) 519 90 (68)Income tax effect (12) 14 (160) (27) 20Transferred to income statements (197) (234) - (239) (260)Income tax effect 59 71 - 72 78
Balance as at end of the year 162 271 471 150 254Foreign currency translation reserveBalance as at beginning of the year (251) (354) (294) (346) (460)Current period movement due to changes in other comprehensive income:
Exchange differences on translation of foreign operations 61 114 (64) 14 125Tax on foreign currency translation adjustment - (11) 4 - (11)
Balance as at end of the year (190) (251) (354) (332) (346)Other reservesBalance as at beginning of the year 1 7 1 41 41Transactions with owners (2) (6) 6 - -Balance as at end of the year (1) 1 7 41 41Total reserves 1,176 953 958 921 691Movements in retained profits were as followsBalance as at beginning of the year 18,953 17,174 16,105 12,666 10,911Current period movement due to changes in other comprehensive income:
Profit attributable to owners of Westpac Banking Corporation 7,561 6,751 5,936 7,234 6,805Own credit adjustment on financial liabilities designated at fair value 11 44 - 11 44Remeasurement of defined benefit obligation recognised in equity (net of tax) (47) 247 57 (49) 225
Transaction with owners:Ordinary dividends paid (5,527) (5,249) (4,924) (5,534) (5,258)Special dividends paid (310) (310) - (310) (310)Distributions on convertible debentures - - - (16) (47)Realised gain on redemption of 2003 TPS - 296 - - 296
Balance as at end of the year 20,641 18,953 17,174 14,002 12,666Total comprehensive income attributable to owners of Westpac Banking Corporation 7,594 6,913 6,303 7,289 6,893Total comprehensive income attributable to non-controlling interests 64 74 66 - -Total comprehensive income for the year 7,658 6,987 6,369 7,289 6,893
1 Prior period comparatives have been restated for the effects of new and amended Accounting Standards that are effective this financial year. Refer to ‘Summary of quantitative impacts’ in Note 1 for further details.
The above statements of changes in equity should be read in conjunction with the accompanying notes.
2014 Westpac Group Annual Report 129

Cash flow statements for the years ended 30 September Westpac Banking Corporation
Consolidated 2014 2013 2012 2014 2013
Note $m $m $m $m $mCash flows from operating activities Interest received 32,136 33,048 36,966 32,029 33,032 Interest paid (18,743) (20,520) (24,317) (21,051) (22,457) Dividends received excluding life business 11 10 12 1,651 1,820 Other non-interest income received 5,732 6,618 5,081 2,766 3,844 Operating expenses paid (7,588) (6,717) (6,514) (5,604) (4,975) Income tax paid excluding life business (2,660) (2,691) (1,897) (2,456) (2,437) Life business:
Receipts from policyholders and customers 1,694 1,759 1,789 - - Interest and other items of similar nature 48 45 41 - - Dividends received 297 301 387 - - Payments to policyholders and suppliers (1,723) (1,912) (1,898) - - Income tax paid (123) (109) (95) - -
Cash flows from operating activities before changes in operating assets and liabilities 9,081 9,832 9,555 7,335 8,827 Net (increase)/decrease in:
Trading and other financial assets designated at fair value 1,724 (319) 4,271 1,083 (811) Loans (35,734) (15,667) (18,893) (33,659) (13,372) Due from other financial institutions 3,932 (511) (2,418) 3,966 (1,544) Life insurance assets and liabilities (156) (154) (115) - - Regulatory deposits with central banks overseas 126 489 (263) 145 490 Derivative financial instruments (3,329) 9,126 3,679 (3,028) 8,972
Net increase/(decrease) in:Other financial liabilities at fair value through income statement 9,079 266 155 8,992 266 Deposits and other borrowings 34,229 22,155 26,381 32,244 17,646 Due to other financial institutions 9,419 363 (6,807) 9,280 345
Net cash provided by/(used in) operating activities 43 28,371 25,580 15,545 26,358 20,819 Cash flows from investing activitiesProceeds from available-for-sale securities 6,768 5,043 3,651 4,910 3,328 Purchase of available-for-sale securities (12,443) (11,802) (8,783) (10,299) (9,791) Net (increase)/decrease in investments in controlled entities - - - 173 (17) Net movement in amounts due to/from controlled entities - - - (5,341) 1,541 Purchase of intangible assets (664) (738) (603) (594) (644) Purchase of property, plant and equipment (515) (304) (252) (397) (251) Proceeds from disposal of property, plant and equipment 17 7 7 11 4 Purchase of controlled entity, net of cash acquired 43 (7,744) - (270) - - Net cash (used in)/provided by investing activities (14,581) (7,794) (6,250) (11,537) (5,830) Cash flows from financing activitiesIssue of loan capital (net of issue costs) 1,768 1,958 4,124 1,768 1,958 Redemption of loan capital (385) (2,244) (2,631) (385) (2,244) Net increase/(decrease) in debt issues 3,678 (14,005) (9,955) 2,519 (11,747) Proceeds from exercise of employee options 49 124 25 49 124 Purchase of shares on exercise of employee options and rights (113) (174) - (113) (174) Shares purchased for delivery of employee share plan (27) - - (27) - Purchase of RSP treasury shares (59) (68) (8) (59) (68) Net sale/(purchase) of other treasury shares 8 7 3 1 1 Payment of dividends (5,837) (5,028) (4,050) (5,860) (5,084) Payment of distributions to non-controlling interests (48) (50) (72) - - Redemption of 2003 Trust Preferred Securities - (805) - - (805) Net cash (used in)/provided by financing activities (966) (20,285) (12,564) (2,107) (18,039) Net increase/(decrease) in cash and cash equivalents 12,824 (2,499) (3,269) 12,714 (3,050) Effect of exchange rate changes on cash and cash equivalents 1,237 1,675 (466) 1,177 1,566 Cash and cash equivalents as at the beginning of the year 11,699 12,523 16,258 9,509 10,993 Cash and cash equivalents as at the end of the year 43 25,760 11,699 12,523 23,400 9,509
Parent Entity
The above cash flow statements should be read in conjunction with the accompanying notes. Details of the reconciliation of net cash provided by operating activities to net profit attributable to owners of Westpac Banking Corporation are provided in Note 43.
130 2014 Westpac Group Annual Report
Notes to the financial statements Note 1. Summary of significant accounting policies This financial report of Westpac Banking Corporation (the Parent Entity), together with its controlled entities (the Group or Westpac), for the year ended 30 September 2014 was authorised for issue by the Board of Directors on 3 November 2014. The Directors have the power to amend and reissue the financial report.
The principal accounting policies adopted in the preparation of the financial report are set out below. These policies have been consistently applied to all the financial years presented, unless otherwise stated.
a. Basis of preparation (i) Basis of accounting This financial report is a general purpose financial report prepared in accordance with the requirements for an authorised deposit-taking institution under the Banking Act 1959 (as amended), Australian Accounting Standards (AAS) and Interpretations as issued by the Australian Accounting Standards Board (AASB) and the Corporations Act 2001. Westpac Banking Corporation is a for-profit entity for the purposes of preparing this financial report.
Compliance with AAS ensures that this financial report also complies with International Financial Reporting Standards (IFRS) as issued by the International Accounting Standards Board (IASB) and Interpretations as issued by the IFRS Interpretations Committee (IFRIC). References to standards and interpretations under AAS in this financial report have similar references in the standards and interpretations of IFRS.
This financial report also includes additional disclosures required for foreign registrants by the United States Securities and Exchange Commission.
(ii) Historical cost convention The financial report has been prepared under the historical cost convention, as modified by applying fair value accounting to available-for-sale securities, and financial assets and liabilities (including derivative instruments) classified at fair value through income statement.
(iii) Comparative revisions Comparative information has been revised where appropriate to enhance comparability. Where necessary, comparative figures have been adjusted to conform to changes in presentation in the current year.
(iv) Rounding of amounts In accordance with ASIC Class Order 98/100, all amounts have been rounded to the nearest million dollars unless otherwise stated.
(v) Changes in accounting standards The following standards, interpretations and amendments have been adopted in the 2014 financial year as a result of the new and revised accounting standards which became operative for the annual reporting period commencing 1 October 2013:
a. AASB 9 Financial Instruments
AASB 9 was issued by the Australian Accounting Standards Board in December 2009. Unless early adopted the standard is effective for the 30 September 2019 financial year.
The Group has early adopted the recognition of the changes in the fair value of financial liabilities designated at fair value attributable to Westpac’s own credit risk in other comprehensive income except where it would create an accounting mismatch. Where an accounting mismatch occurs, all changes in fair value are recognised in the income statement.
The impact of the change on individual line items in the financial statements is summarised under ‘Summary of quantitative impacts’.
b. AASB 10 Consolidated Financial Statements, AASB 11 Joint Arrangements and AASB 12 Disclosure of Interests in Other Entities
AASB 10 was applied by the Group from 1 October 2013 and replaces the guidance on control and consolidation in AASB 127 Consolidated and Separate Financial Statements and in Interpretation 112 Consolidation - Special Purpose Entities. Under the new principles, the Parent Entity controls an entity when it is exposed to, or has rights to, variable returns from its involvement with the entity and has the ability to affect those returns through its power over the entity.
The Group has reviewed its investments in other entities to assess whether the consolidation conclusion in relation to these entities is different under AASB 10 than under AASB 127 and Interpretation 112.
In accordance with the transitional provisions of AASB 10, the Group has consolidated a number of funds managed by the Group for the first time. The impact on individual line items in the financial statements is summarised under ‘Summary of quantitative impacts’.
2014 Westpac Group Annual Report 131

Note 1. Summary of significant accounting policies (continued) Under AASB 11 investments in joint arrangements are classified as either joint operations or joint ventures depending on the contractual rights and obligations each investor has, rather than the legal structure of the joint arrangement. The initial application of AASB 11 has not resulted in any material impact to the Group.
AASB 12 sets out disclosures for interests in entities that are subsidiaries, associates, joint ventures and unconsolidated structured entities. The application of AASB 12 has not affected any of the amounts recognised in the financial statements but has resulted in additional disclosures as set out in note 41. The Group has applied the transitional relief from disclosing comparatives for interests in unconsolidated structured entities when AASB 12 is applied for the first time.
c. AASB 13 Fair Value
AASB 13 provides a single unified definition of fair value and a framework for measuring and disclosing fair value. In accordance with the transitional provisions, AASB 13 was applied prospectively from 1 October 2013 and the Group has not provided any comparative information for new disclosures. The application of AASB 13 in the current financial year has not had a material impact on the financial position nor performance of the Group, however has resulted in additional fair value disclosures provided in Note 28.
d. AASB 119 Employee Benefits
The amended AASB 119 was applied by the Group from 1 October 2013 and resulted in two changes to the Group’s accounting policy which affected items recognised in the financial statements:
the replacement of the expected return on plan assets and separate interest expense with a net interest amount. As a result the net defined benefit expense in the income statement is higher with an equal and opposite change to the amount that is recognised as remeasurement in other comprehensive income. The net impact on total comprehensive income is nil and there is no adjustment to the amounts recognised in the balance sheet from this change.
the discount rate used in calculating the defined benefit liability relating to active members no longer includes an investment tax adjustment. This resulted in a one-off decrease in defined benefit liability recognised through retained earnings.
The impact of these adjustments on individual line items in the financial statements is summarised under ‘Summary of quantitative impacts’.
e. AASB 2011-4 Amendments to Australian Accounting Standards to Remove Individual Key Management Personnel Disclosure Requirements
The amendments remove all the individual key management personnel (KMP) disclosures in AASB 124 Related Party Disclosures that were specific to Australian entities. These disclosures are included in the remuneration report for the year ended 30 September 2014.
f. AASB 2012-2 Amendments to Australian Accounting Standards – Disclosures – Offsetting Financial Assets and Financial Liabilities
AASB 2012-2 requires additional disclosure of the effect or potential effect of netting arrangements on the Group’s financial position. The amendment requires disclosure of recognised financial instruments that are subject to enforceable master netting agreements or similar arrangements, including associated cash and financial instrument collateral, even if assets and liabilities are not offset on the balance sheet.
The retrospective application of AASB 2012-2 has not affected any of the amounts recognised in the financial statements but has resulted in additional disclosure of certain netting arrangements as set out in Note 30.
132 2014 Westpac Group Annual Report

Notes to the financial statements Note 1. Summary of significant accounting policies (continued) Summary of quantitative impacts The following tables summarise the line items that have been impacted by the above changes to accounting policies on the Group’s financial statements. Line items that were not affected by the change are not disclosed. As a result, the sub-totals and totals disclosed cannot be recalculated from the numbers provided.
Consolidated income statement
30 Sep 30 Sep30 Sep Change 2013 30 Sep Change 2012
2013 AASB 9 AASB 119 Restated 2012 AASB 119 Restated$m $m $m $m $m $m $m
Interest expense (20,144) (44) - (20,188) (24,371) - (24,371)Net interest income 12,865 (44) - 12,821 12,502 - 12,502Net operating income before operating expenses and impairment charges 18,639 (44) - 18,595 17,983 - 17,983Operating expenses (7,927) - (49) (7,976) (7,909) (48) (7,957)Profit before income tax 9,865 (44) (49) 9,772 8,862 (48) 8,814Income tax expense (2,975) 13 15 (2,947) (2,826) 14 (2,812)Net profit for the year 6,890 (31) (34) 6,825 6,036 (34) 6,002Net profit attributable to owners of Westpac Banking Corporation 6,816 (31) (34) 6,751 5,970 (34) 5,936Earnings per share (cents)Basic 220.4 (1.0) (1.1) 218.3 195.8 (1.1) 194.7Diluted 215.5 (1.0) (1.1) 213.5 190.5 (1.1) 189.4
Consolidated statement of other comprehensive income
30 Sep 30 Sep30 Sep Change 2013 30 Sep Change 2012
2013 AASB 9 AASB 119 Restated 2012 AASB 119 Restated$m $m $m $m $m $m $m
Net profit for the year 6,890 (31) (34) 6,825 6,036 (34) 6,002Other comprehensive incomeItems that will not be reclassified subsequently to profit or lossOwn credit adjustment on financial liabilities designated at fair value - 44 - 44 - - -Remeasurement of defined benefit obligation recognised in equity (net of tax) 216 - 31 247 23 34 57Other comprehensive income for the year (net of tax) 87 44 31 162 333 34 367Total comprehensive income for the year 6,977 13 (3) 6,987 6,369 - 6,369Attributable to:
Owners of Westpac Banking Corporation 6,903 13 (3) 6,913 6,303 - 6,303Total comprehensive income for the year 6,977 13 (3) 6,987 6,369 - 6,369
2014 Westpac Group Annual Report 133

Note 1. Summary of significant accounting policies (continued) Consolidated balance sheet
30 Sep 30 Sep30 Sep Change 2013 30 Sep Change 2012
2013 AASB 9 AASB 10 AASB 119 Restated 2012 AASB 10 AASB 119 Restated$m $m $m $m $m $m $m $m $m
AssetsLife insurance assets 8,637 - 4,512 - 13,149 8,240 3,667 - 11,907Deferred tax assets 1,791 - - (18) 1,773 2,176 - (20) 2,156Total assets 696,603 - 4,512 (18) 701,097 674,965 3,667 (20) 678,612LiabilitiesCurrent tax liabilities 908 (13) - - 895 1,022 - - 1,022Life insurance liabilities 7,426 - 4,512 - 11,938 7,208 3,667 - 10,875Other liabilities 9,117 - - (61) 9,056 9,710 - (66) 9,644Total liabilities excluding loan capital 639,792 (13) 4,512 (61) 644,230 619,209 3,667 (66) 622,810
Total liabilities 649,122 (13) 4,512 (61) 653,560 628,746 3,667 (66) 632,347Net assets 47,481 13 - 43 47,537 46,219 - 46 46,265Shareholders’ equityShare capital:
Retained profits 18,897 13 - 43 18,953 17,128 - 46 17,174Total equity attributable to owners of Westpac Banking Corporation 46,618 13 - 43 46,674 44,249 - 46 44,295Total shareholders’ equity and non-controlling interests 47,481 13 - 43 47,537 46,219 - 46 46,265
Consolidated statement of changes in equity
30 Sep 30 Sep30 Sep Change 2013 30 Sep Change 2012
2013 AASB 9 AASB 119 Restated 2012 AASB 119 Restated$m $m $m $m $m $m $m
Share capitalMovements in retained profitsBalance as at beginning of the year 17,128 - 46 17,174 16,059 46 16,105Current year movement due to changes in other comprehensive income:
Profit attributable to owners of Westpac Banking Corporation 6,816 (31) (34) 6,751 5,970 (34) 5,936Own credit adjustment on financial liabilities designated at fair value - 44 - 44 - - -Remeasurement of defined benefit obligation recognised in equity (net of tax) 216 - 31 247 23 34 57
Balance as at end of the year 18,897 13 43 18,953 17,128 46 17,174Total comprehensive income attributable to owners of Westpac Banking Corporation 6,903 13 (3) 6,913 6,303 - 6,303Total comprehensive income for the year 6,977 13 (3) 6,987 6,369 - 6,369
134 2014 Westpac Group Annual Report

Notes to the financial statements Note 1. Summary of significant accounting policies (continued) Parent Entity income statement
30 Sep30 Sep Change 2013
2013 AASB 9 AASB 119 Restated$m $m $m $m
Interest expense (22,079) (44) - (22,123)Net interest income 10,863 (44) - 10,819Net operating income before operating expenses and impairment charges 16,238 (44) - 16,194Operating expenses (6,450) - (49) (6,499)Profit before income tax 9,126 (44) (49) 9,033Income tax expense (2,256) 13 15 (2,228)Net profit for the year 6,870 (31) (34) 6,805Net profit attributable to owners of Westpac Banking Corporation 6,870 (31) (34) 6,805Earnings per share (cents)Basic n/a n/a n/a n/aDiluted n/a n/a n/a n/a
Parent Entity statement of other comprehensive income
30 Sep30 Sep Change 2013
2013 AASB 9 AASB 119 Restated$m $m $m $m
Net profit for the year 6,870 (31) (34) 6,805Other comprehensive incomeItems that will not be reclassified subsequently to profit or loss
Own credit adjustment on financial liabilities designated at fair value - 44 - 44Remeasurement of defined benefit obligation recognised in equity (net of tax) 194 - 31 225
Other comprehensive income for the year (net of tax) 13 44 31 88Total comprehensive income for the year 6,883 13 (3) 6,893Attributable to owners of Westpac Banking Corporation 6,883 13 (3) 6,893Total comprehensive income for the year 6,883 13 (3) 6,893
2014 Westpac Group Annual Report 135

Note 1. Summary of significant accounting policies (continued) Parent Entity balance sheet
30 Sep 30 Sep30 Sep Change 2013 30 Sep Change 2012
2013 AASB 9 AASB 119 Restated 2012 AASB 119 Restated$m $m $m $m $m $m $m
AssetsDeferred tax assets 1,646 - (14) 1,632 2,032 (16) 2,016Total assets 733,720 - (14) 733,706 692,605 (16) 692,589LiabilitiesCurrent tax liabilities 853 (13) - 840 937 - 937Other liabilities 7,440 - (45) 7,395 7,940 (50) 7,890Total liabilities excluding loan capital 683,482 (13) (45) 683,424 643,305 (50) 643,255Total liabilities 692,812 (13) (45) 692,754 652,842 (50) 652,792Net assets 40,908 13 31 40,952 39,763 34 39,797Shareholders’ equityShare capital:
Retained profits 12,622 13 31 12,666 10,877 34 10,911Total equity attributable to owners of Westpac Banking Corporation 40,908 13 31 40,952 39,763 34 39,797Total shareholders’ equity and non-controlling interests 40,908 13 31 40,952 39,763 34 39,797
Parent Entity statement of changes in equity
30 Sep30 Sep Change 2013
2013 AASB 9 AASB 119 Restated$m $m $m $m
Share capitalMovements in retained profitsBalance as at beginning of the year 10,877 - 34 10,911Current year movement due to changes in other comprehensive income:
Profit attributable to owners of Westpac Banking Corporation 6,870 (31) (34) 6,805Own credit adjustment on financial liabilities designated at fair value - 44 - 44Remeasurement of defined benefit obligation recognised in equity (net of tax) 194 - 31 225
Balance as at end of the year 12,622 13 31 12,666
6,883 13 (3) 6,893Total comprehensive income for the year 6,883 13 (3) 6,893
Total comprehensive income attributable to owners of Westpac Banking Corporation
136 2014 Westpac Group Annual Report

Notes to the financial statements Note 1. Summary of significant accounting policies (continued) b. Principles of consolidation The consolidated financial statements of the Group comprise the financial statements of the Parent Entity and all its subsidiaries (including structured entities). Subsidiaries are those entities over which the Parent Entity has control. Control exists when the Parent Entity is exposed to, or has rights, to variable returns from its involvement with an entity, and has the ability to affect those returns through its power over that entity. The effects of all transactions between entities in the Group are eliminated. Non-controlling interests in the results and equity of non-wholly-owned subsidiaries are shown separately in the consolidated Income Statement, Statement of Comprehensive Income, Balance Sheet and Statement of Changes in Equity. Subsidiaries are fully consolidated from the date on which control commences and they are de-consolidated from the date that control ceases.
Changes in the Group’s ownership interest in a subsidiary after control is obtained which do not result in a loss of control are accounted for as transactions with equity holders in their capacity as equity holders. Any difference between the amount by which the non-controlling interest is adjusted and the fair value of the consideration paid or received is recognised directly in other reserves.
When the Group ceases to control a subsidiary any retained interest in the entity is remeasured to its fair value, with any resulting gain or loss recognised in the income statement.
In the Parent Entity’s financial statements, investments in subsidiaries are initially recorded at cost and are subsequently held at the lower of cost and recoverable amount.
(i) Business combinations The acquisition method of accounting is used for all business combinations (except common control transactions). Cost is measured as the aggregate of the fair value of the assets given, equity instruments issued or liabilities incurred or assumed at the date of acquisition. Acquisition-related costs are expensed as incurred. Where equity instruments are issued in an acquisition, the value of the instruments is their published market price as at the acquisition date. Transaction costs arising on the issue of equity instruments are recognised directly in equity.
Identifiable assets acquired and liabilities and contingent liabilities assumed in a business combination are measured initially at their fair value on acquisition date. For each business combination, the non-controlling interest is measured either at fair value or at the proportionate share of the acquiree’s identifiable net assets. The excess of the total consideration transferred, the amount of any non-controlling interest in the acquiree and the acquisition date fair value of any previous equity interest in the acquiree, over the fair value of the identifiable net assets acquired, is recorded as goodwill.
Where settlement of any part of cash consideration is deferred, amounts payable in the future are discounted to their present value as at the date of acquisition. The discount rate used is the Group’s incremental borrowing rate.
Common control transactions The predecessor method of accounting is used to account for business combinations between entities in the Group. Assets acquired and liabilities assumed in a common control transaction are measured initially at the acquisition date at the carrying value from the Group’s perspective. The excess of the cost of acquisition over the initial carrying values of the entity’s share of the net assets acquired is recorded as part of a common control reserve.
(ii) Foreign currency translation Functional and presentation currency Items included in the financial statements of each of the Group’s entities are measured using the currency of the primary economic environment in which the entity operates (the functional currency). The consolidated financial statements are presented in Australian dollars which is the Parent Entity’s functional and presentation currency. All amounts are expressed in Australian dollars except where otherwise indicated.
Transactions and balances Foreign currency transactions are translated into the functional currency using the exchange rates prevailing at the dates of the transactions. Foreign exchange gains and losses resulting from the settlement of such transactions and from the translation at year-end exchange rates of monetary assets and liabilities denominated in foreign currencies are recognised in the income statement, except when deferred in other comprehensive income for qualifying cash flow hedges and qualifying net investment hedges.
Foreign operations Assets and liabilities of overseas branches and subsidiaries that have a functional currency other than the Australian dollar are translated at exchange rates prevailing on the balance date. Income and expenses are translated at average exchange rates prevailing during the period. Other equity balances are translated at historical exchange rates. The resulting exchange differences are recognised in the foreign currency translation reserve.
2014 Westpac Group Annual Report 137

Note 1. Summary of significant accounting policies (continued) On consolidation, exchange differences arising from the translation of borrowings and other foreign currency instruments designated as hedges of the net investment in foreign operations are reflected in the foreign currency translation reserve. When all or part of a foreign operation is disposed or borrowings that are part of the net investments are repaid, a proportionate share of such exchange differences are recognised in the income statement as part of the gain or loss on disposal or repayment of borrowing.
c. Income Statement Revenue is measured at the fair value of the consideration received or receivable. Operating expenses are recognised as the relevant service is rendered or once a liability is incurred. Revenue and expenses are recognised for each major stream as follows:
(i) Net interest income Interest income and expense for all interest bearing financial assets and liabilities (including those instruments measured at fair value) is recognised using the effective interest rate method. Interest expense also includes the net result of treasury’s interest rate and liquidity management activities.
The effective interest rate method is a method of calculating the amortised cost of a financial asset or a financial liability and of allocating the interest income or interest expense over the relevant period. The effective interest rate is the rate that exactly discounts estimated future cash payments or receipts through the expected life of the financial instrument, or when appropriate, a shorter period, to the net carrying amount of the financial asset or financial liability. When calculating the effective interest rate, cash flows are estimated based upon all contractual terms of the financial instrument (for example, prepayment options) but do not consider future credit losses. The calculation includes all fees and other amounts paid or received between parties to the contract that are an integral part of the effective interest rate (e.g. loan establishment fees), transaction costs and all other premiums or discounts.
Interest relating to impaired loans is recognised using the loan’s original effective interest rate based on the net carrying value of the impaired loan after giving effect to impairment charges or for a variable rate loan, the current effective interest rate determined under the contract. This rate is also used to discount the future cash flows for the purpose of measuring impairment charges. For loans that have been impaired this method results in cash receipts being apportioned between interest and principal.
Interest income on finance leases is brought to account progressively over the life of the lease, consistent with the outstanding investment and unearned income balance.
(ii) Non-interest income Fee and commission income Fees and commissions (except where included as an adjustment to the effective interest calculation on a financial instrument) are generally recognised on an accrual basis over the period during which the service is performed. Portfolio and other management advisory and service fees are recognised based on the applicable service contracts, usually on a time proportionate basis. Asset management fees related to investment funds are recognised over the period the service is provided. The same principle is applied for wealth management, financial planning and custody services that are continuously provided over an extended period of time.
Trading income Realised and unrealised gains or losses arising from changes in the fair value of trading assets, liabilities and derivatives are recognised in the period in which they arise except day one profits or losses which are deferred where certain valuation inputs are unobservable. Dividend income on the trading portfolio is recorded as part of trading income. Net income related to treasury’s interest rate and liquidity management activities is included in net interest income.
Operating lease Operating lease rentals are recognised in the Income Statement on a straight line basis over the lease term.
Dividend income Dividends on quoted shares are recognised on the ex-dividend date. Dividends on unquoted shares are recognised when the company’s right to receive payment is established.
138 2014 Westpac Group Annual Report

Notes to the financial statements Note 1. Summary of significant accounting policies (continued) (iii) Operating expenses Share-based compensation expense Certain employees are entitled to participate in option and share ownership schemes.
Options and share rights The fair value of options and share rights provided to employees as share-based payments is recognised as an expense with a corresponding increase in equity. The fair value is measured at grant date and is recognised over the period the services are received which is the expected vesting period during which the employees would become entitled to exercise the option or share right.
The fair value of options and share rights is estimated at grant date using a Binomial/Monte Carlo simulation pricing model incorporating the vesting and market-related hurdle features of the grants. The fair value of the options and share rights excludes the impact of any non-market vesting conditions such as participants’ continued employment by the Group. The non-market vesting conditions are included in assumptions used when determining the number of options and share rights expected to become exercisable for which an expense is recognised. At each reporting date these assumptions are revised and the expense recognised each year takes into account the most recent estimates.
Employee share plan The value of shares expected to be issued to employees for nil consideration under the Employee Share Plan (ESP) is recognised as an expense over the financial year and provided for as other employee benefits. The fair value of any ordinary shares issued to satisfy the obligation to employees is recognised within equity, or if purchased on market, the obligation to employees is satisfied by delivering shares that have been purchased on market.
Restricted share plan The fair value of shares allocated to employees for nil consideration under the Restricted Share Plan (RSP) is recognised as an expense over the vesting period. The fair value of ordinary shares issued to satisfy the obligation to employees is measured at grant date and is recognised as a separate component of equity.
Westpac has formed a trust to hold any shares forfeited by employees until they are reallocated to employees in subsequent grants in the Group’s RSP. Shares allocated to employees under the RSP, which have not yet vested, are treated as treasury shares and deducted from shareholders’ equity.
Leasing Operating lease payments are recognised in the income statement as an expense on a straight-line basis over the lease term unless another systematic basis is more representative of the time pattern of the benefit received. Incentives received on entering into operating leases are recorded as liabilities and amortised as a reduction of rental expense on a straight-line basis over the lease term.
Wealth management acquisition costs Deferred acquisition costs are the variable costs that are directly related to and incremental to the acquisition of new business principally in relation to the Group’s life insurance and retail funds management business. These costs are recorded as an asset and are amortised in the income statement on the same basis as the recognition of related revenue.
d. Taxation (i) Income tax The tax expense for the period comprises current and deferred tax. Tax is recognised in the income statement, except to the extent that it relates to items recognised directly in other comprehensive income, in which case it is recognised in other comprehensive income.
Current tax is the expected tax payable on the taxable income for the financial year using tax rates that have been enacted or substantively enacted for each jurisdiction at the balance date, and any adjustment to tax payable in respect of previous years.
Deferred tax is accounted for using the balance sheet method, providing for temporary differences between the carrying amounts of assets and liabilities in the financial statements and the corresponding amounts used for taxation purposes. Except as noted below, deferred tax liabilities are recognised for all taxable temporary differences and deferred tax assets are recognised to the extent that it is probable that future taxable profits will be available against which the asset can be utilised.
Deferred tax assets and liabilities are not recognised if they arise from goodwill or other intangible assets with indefinite expected life, the initial recognition of assets and liabilities that affect neither accounting nor taxable profit (other than in a business combination), or differences relating to investments in subsidiaries to the extent that they will probably not reverse in the foreseeable future. The amount of deferred tax provided is based on the expected manner of realisation or settlement of the carrying amount of assets and liabilities, using tax rates that have been enacted or substantively enacted for each jurisdiction at the balance date that are expected to apply when the liability is settled or the asset is realised.
For presentation purposes deferred tax assets and liabilities have been offset where they relate to the same taxation authority on the same taxable entity or different entities in the same taxable group.
2014 Westpac Group Annual Report 139

Note 1. Summary of significant accounting policies (continued) (ii) Tax consolidated group For members of Westpac’s Australian tax consolidated group, tax expense/income, deferred tax liabilities and assets arising from temporary differences are recognised in the separate financial statements of the members of the tax-consolidated group using a ‘group allocation basis’ that removes the tax impact of certain transactions between members of the tax-consolidated group. Deferred tax liabilities and assets are recognised by reference to the carrying amounts in the separate financial statements of each entity and the tax values applying under tax consolidation. Current tax liabilities and assets and deferred tax assets arising from unused tax losses and relevant tax credits of the members of the tax-consolidated group are recognised by the Parent Entity (as head entity in the tax-consolidated group).
e. Assets (i) Cash and balances with central banks Cash and balances with central banks include cash at branches, Reserve Bank settlement account balances and nostro balances. They are brought to account at the face value or the gross value of the outstanding balance, where appropriate. These balances have a maturity of less than three months.
(ii) Financial assets The Group classifies its financial assets in the following categories: financial assets at fair value through income statement, derivatives financial instruments, loans and receivables and available-for-sale securities. Management determines the classification of its financial assets at initial recognition based on the purpose for which they were acquired. The Group has not classified any of its financial assets as held-to-maturity investments.
Purchases and sales of financial assets, except for loans and receivables, are recognised on trade-date, the date on which the Group commits to purchase or sell the asset. Loans and receivables are recognised on settlement date, when cash is advanced to the borrowers.
Financial assets at fair value through income statement are recognised initially at fair value. All other financial assets are recognised initially at fair value plus directly attributable transaction costs. The best evidence of fair value at initial recognition is the transaction price, unless the fair value of that instrument is evidenced by comparison with other observable current market transactions in the same instrument, or based on a valuation technique whose variables include only data from observable markets.
The Group has entered into transactions where fair value is determined using valuation models for which not all significant inputs are market observable. Such a financial instrument is initially recognised at the transaction price which is the best indicator of fair value. The difference between the transaction price and the model value, commonly referred to as ‘day one profit or loss’, is deferred and subsequently recognised in profit or loss over the life of the transaction or at the point when the instrument’s fair value can be determined using market observable inputs. Subsequent changes in fair value are recognised immediately in the income statement without reversal of deferred day one profits or losses.
Financial assets are derecognised when the rights to receive cash flows from the asset have expired, or when the Group has either transferred its rights to receive cash flows from the asset or has assumed an obligation to pay the received cash flows in full under a ‘pass through’ arrangement together with the transfer of substantially all the risks and rewards of ownership.
Where the Group has neither transferred nor retained substantially all the risks and rewards of ownership but has retained control, the asset continues to be recognised on the balance sheet to the extent of the Group’s continuing involvement in the asset.
Financial assets and liabilities are offset and the net amount reported in the balance sheet when there is a legally enforceable right to set off the recognised amounts and there is an intention to settle on a net basis, or to realise the asset and settle the liability simultaneously.
Repurchase and reverse repurchase agreements (including securities borrowed and lent) Where securities are sold subject to an agreement to repurchase at a predetermined price (‘repos’), they remain recognised on balance sheet in their original category (i.e. ‘Trading securities’ or ‘Available for sale’). A liability (‘Securities sold under agreement to repurchase’) is recognised in respect of the cash consideration received. Where the underlying securities are part of a trading portfolio, the associated liability is recognised as part of ‘Other financial liabilities at fair value through income statement’. Where the underlying securities are classified as Available for sale, the associated liability is recognised in either ‘Payables due to other financial institutions’, or ‘Deposits and other borrowings’, depending on the counterparty.
Securities purchased under agreements to resell (‘reverse repos’) are not recognised on the balance sheet and the cash consideration paid is recorded as part of ‘Trading securities and other financial assets designated at fair value’.
As part of its trading activities, the Group also lends and borrows securities on a collateralised basis. The securities subject to these arrangements are not reflected on the balance sheet, as the risks and rewards of ownership remain with the initial holder. Where cash is provided as collateral, the amount advanced to or received from third parties is recognised as a receivable or borrowing respectively.
140 2014 Westpac Group Annual Report

Notes to the financial statements Note 1. Summary of significant accounting policies (continued) Fees and interest relating to these transactions are recognised in interest income and interest expense using the effective interest rate method, over the expected life of the agreements. Any fair value movements are recorded in trading income.
Financial assets at fair value through income statement This category has two sub-categories: trading securities and other financial assets designated at fair value at inception.
Trading securities are those assets acquired principally for the purpose of selling in the near term or are part of a portfolio of financial instruments that are managed together and for which there is evidence of a recent pattern of short-term profit taking. It includes debt and equity instruments which are actively traded and securities purchased under agreement to resell that are part of a trading portfolio.
Other financial assets designated at fair value at inception include certain non-trading bonds, notes, loans with embedded derivatives and commercial bills. This designation is only made if the financial asset contains an embedded derivative, it is managed on a fair value basis in accordance with a documented strategy, or if designating it at fair value reduces or eliminates an accounting mismatch. A portfolio of retail fixed rate bills which have been designated at fair value to reduce an accounting mismatch have, due to their nature, been presented within the loans category in the Balance sheet although they are measured at fair value.
Subsequent to initial recognition, these financial assets are measured at fair value with changes in fair value recognised through the income statement in the period in which they arise.
Derivative financial instruments Derivative financial instruments including forwards, futures, swaps and options and are entered into by the Group for trading purposes (primarily customer-related activity) or for hedging purposes. In certain instances a derivative may be embedded in a host contract. If the host contract is not carried at fair value through income statement, the embedded derivative is separated from the host contract and accounted for as a standalone derivative instrument where the economic characteristics and risks of the embedded derivative are not closely related to the economic characteristics and risks of the host contract.
Derivatives are measured, subsequent to initial recognition, at fair value with gains or losses recognised through the income statement in the period in which they arise, unless the derivative is designated into a cashflow or net investment hedge relationship. Derivatives are presented as an asset where they have a positive fair value at balance date or as a liability where the fair value at balance date is negative.
The Group uses derivative instruments as part of its asset and liability management activities, mainly to hedge its exposures to interest rates, foreign currency and credit risk, including exposures arising from forecast transactions. Where certain criteria are met, the Group designates these derivatives into one of three hedge accounting relationships: fair value hedge, cash flow hedge or a hedge of a net investment in a foreign operation. These hedging designations and associated accounting are as follows:
Fair value hedges Changes in the fair value of derivatives that are designated and qualify as fair value hedges are recorded in the income statement, together with any changes in the fair value of the hedged asset or liability that are attributable to the hedged risk. The changes in the fair value of the hedged asset and liability are adjusted against their carrying value.
If the hedge no longer meets the criteria for hedge accounting, it is discontinued and any previous adjustment to the carrying value of a hedged item is amortised to the income statement over the period to maturity. If the hedged item is sold or repaid, the unamortised fair value adjustment is recognised immediately in the income statement.
Cash flow hedges The effective portion of changes in the fair value of derivatives that are designated and qualify as cash flow hedges are recognised in the cash flow hedge reserve through other comprehensive income. The gain or loss relating to any ineffective portion is recognised immediately in the income statement.
When a hedging instrument expires or is sold, terminated or exercised, or when the hedge no longer meets the criteria for hedge accounting, any cumulative gain or loss existing in other comprehensive income at that time remains in other comprehensive income and is recognised in profit or loss in the period in which the hedged item affects profit or loss. When a forecast transaction is no longer expected to occur, the cumulative gain or loss that was reported in other comprehensive income is immediately transferred to the income statement.
Hedges of a net investment in a foreign operation Hedges of net investments in overseas branches and subsidiaries are accounted for in a manner similar to cash flow hedges. Any gain or loss on the hedging instrument relating to the effective portion of the hedge is recognised in the foreign currency translation reserve through other comprehensive income and the gain or loss relating to the ineffective portion is recognised immediately in the income statement. Gains and losses accumulated in other comprehensive income are included in the income statement when the overseas branch or subsidiary is disposed.
2014 Westpac Group Annual Report 141

Note 1. Summary of significant accounting policies (continued) Loans and receivables Loans and receivables are non-derivative financial assets with fixed or determinable payments that are not quoted in an active market. The Group presents loans and receivables in the following categories on the balance sheet:
Loans Loans includes advances, overdrafts, home loans, credit card and other personal lending, term loans, leasing receivables, bill financing and acceptances.
Loan products that have both a mortgage and deposit facility are presented on a gross basis in the balance sheet, segregating the loan and deposit component into the respective balance sheet line items. Interest earned on this product is presented on a net basis in the income statement as this reflects how the customer is charged.
Receivables due from other financial institutions Receivables due from other financial institutions include conduit assets, collateral placed and interbank lending.
Regulatory deposits with central banks overseas In several countries in which the Group operates, the law requires that regulatory deposits be lodged with the local central bank at a rate of interest generally below that prevailing in the market. The amount of the deposit and the interest rate receivable is determined in accordance with the requirements of the local central bank. Regulatory deposits are required to be held to continue operating in those countries and thus are not available to meet other obligations of the Group.
Impairment of loans and receivables Subsequent to initial recognition, loans and receivables are measured at amortised cost using the effective interest rate method and are presented net of any provisions for impairment.
The Group assesses at each balance date whether there is any objective evidence of impairment. An impairment charge is incurred if there is objective evidence of impairment as a result of one or more loss events which have an impact on the estimated cash flows of the financial asset that can be reliably estimated. Objective evidence includes significant financial difficulties of an obligor, adverse changes in the payment status of borrowers or national, local economic conditions that correlate with defaults on a group of financial assets. The amount of the charge is measured as the difference between the asset’s carrying amount and the present value of estimated future cash flows (excluding future credit losses that have not been incurred) discounted at the financial asset’s original effective interest rate. The carrying amount of the asset is reduced through the use of a provision account and the amount of the loss is recognised in the income statement. If a loan or receivable has a variable interest rate, the discount rate for measuring any impairment is the current effective interest rate determined under the contract.
The Group has individually assessed provisions and collectively assessed provisions. Individually assessed provisions are made against financial assets that exceed specified thresholds or which have been individually assessed as impaired. If the Group determines that no objective evidence of impairment exists for an individually assessed financial asset, it includes that asset in a group of financial assets with similar credit risk characteristics and collectively assesses them for impairment. Assets that are individually assessed and for which an impairment loss is, or continues to be, recognised are not included in a collective assessment of impairment.
When a loan or a part of a loan is uncollectable, it is written off against the related provision for loan impairment. Such loans are written off after all the necessary procedures have been completed and the amount of the loss has been determined. Subsequent recoveries of amounts previously written off decrease the amount of the charge for loan impairment in the income statement. If, in a subsequent period, the amount of the impairment charge decreases and the decrease can be related objectively to an event occurring after the impairment was recognised (such as an improvement in the debtor’s credit rating), the previously recognised impairment charge is reversed by adjusting the provision account. The amount of the reversal is recognised in the income statement.
Available-for-sale securities Available-for-sale securities are those debt or equity securities that are designated as available-for-sale or that are not classified as financial assets at fair value through income statement, or loans and receivables.
Subsequent to initial recognition, available-for-sale investments are measured at fair value. Gains and losses arising from changes in fair value are recognised in the available-for-sale reserve in other comprehensive income until the financial asset is derecognised or impaired, at which time the cumulative gain or loss is recognised in the income statement. Dividends on available-for-sale equity instruments are recognised in the income statement when the right to receive payment is established. Foreign exchange gains or losses and interest, calculated using the effective interest rate method, on available-for-sale debt instruments are also recognised in the income statement.
Certain unlisted equity securities that do not have a quoted price in an active market and where fair value cannot be estimated within a reasonable range of probable outcomes are carried at cost.
142 2014 Westpac Group Annual Report

Notes to the financial statements Note 1. Summary of significant accounting policies (continued) The Group assesses at each reporting date whether there is objective evidence of impairment. Impairment exists if there is objective evidence of impairment as a result of one or more loss events which have an impact on the estimated cash flows of the available-for-sale security that can be reliably estimated. For debt instruments classified as available-for-sale, evidence of impairment includes significant financial difficulties or adverse changes in the payment status of an issuer or national, local economic conditions that correlate with defaults on a group of financial assets. For equity investments classified as available-for-sale, a significant or prolonged decline in the fair value of the security below its cost is also considered in determining whether the assets are impaired. If any such evidence exists for available-for-sale financial assets, the cumulative loss – measured as the difference between the acquisition cost and the current fair value, less any impairment charge previously recognised in profit or loss – is removed from other comprehensive income and recognised in the income statement. If, in a subsequent period, the fair value of an available-for-sale debt increases and the increase can be objectively related to an event occurring after the impairment event, the impairment charge is reversed through the income statement. Subsequent reversal of impairment charges on equity instruments are not recognised in the income statement until the instrument is disposed of.
(iii) Life insurance assets Assets held by the life insurance companies and their subsidiaries, including investments in funds managed by the Group, are designated at fair value through income statement as required by AASB 1038 Life Insurance Contracts. Changes in fair value are included in the income statement. Most assets are held in the life insurance statutory funds and can only be used within the restrictions imposed under the Life Insurance Act 1995. The main restrictions are that the assets in a fund can only be used to meet the liabilities and expenses of that fund, to acquire investments to further the business of the fund or as distribution when solvency and capital adequacy requirements are met. Therefore they are not as liquid as other financial assets.
(iv) Property, plant and equipment Property, plant and equipment are carried at cost less accumulated depreciation and impairment. Cost is the fair value of the consideration provided plus incidental costs directly attributable to the acquisition. Other subsequent expenditure is capitalised only when it increases the future economic benefits embodied in the item of property, plant and equipment. All other expenditure is expensed as incurred.
Computer software is capitalised at cost and classified as property, plant and equipment where it is integral to the operation of associated hardware.
Depreciation is calculated using the straight-line method to allocate the cost of assets less any residual value over their estimated useful lives, as follows:
Premises and sites Up to 50 years Leasehold improvements Up to 10 years Furniture and equipment 3 to 15 years Technology 3 to 5 years Assets under lease Up to 7 years
Property, plant and equipment are reviewed at each balance date to determine whether there is any indication of impairment. If such an indication exists, the asset’s recoverable amount, being the higher of fair value less cost to sell and value-in-use, is estimated. An impairment charge is recognised as part of operating expenses whenever the carrying amount of the asset exceeds its recoverable amount.
The gain or loss arising on the disposal or retirement of an asset is determined as the difference between the sale proceeds less costs of disposal, and the carrying amount of the asset, and is recognised as non-interest income.
(v) Goodwill and other intangible assets Goodwill Goodwill arises on the acquisition of businesses and represents the excess of the purchase consideration, the amount of any non-controlling interest in the acquiree and the acquisition date fair value of any previous equity interest in the acquiree, over the fair value of the net identifiable assets acquired.
All goodwill is considered to have an indefinite life. Goodwill is allocated to Cash Generating Units (CGUs) based on management’s analysis of where the synergies resulting from an acquisition are expected to arise. It is tested for impairment annually and whenever there is an indication of impairment, and is carried at cost or deemed cost less accumulated impairment. An impairment charge is recognised whenever the carrying amount of a CGU to which goodwill is allocated exceeds its recoverable amount, which is determined on a value-in-use basis (refer Note 15).
Gains or losses on the disposal of an entity include the carrying amount of goodwill relating to the entity sold.
2014 Westpac Group Annual Report 143

Note 1. Summary of significant accounting policies (continued) Computer software Internal and external costs directly incurred in the purchase or development of computer software, including subsequent upgrades and enhancements, are recognised as intangible assets when it is probable that they will generate future economic benefits attributable to the Group. These assets are amortised using the straight-line method over their estimated useful lives of between three and ten years.
Brands Brands are recognised on the acquisition of businesses and represent the value attributed to brand names associated with those businesses. The useful life of brands is estimated to be indefinite as there is no foreseeable limit to the period over which they are expected to generate net cash flows. Brands are not amortised but tested for impairment annually or more frequently when indicators of impairment are identified.
Core deposits intangibles Core deposits were recognised as part of the merger with St.George and represent the value, or avoided cost, of the deposit base acquired that provides a valuable source of funding. Core deposits are amortised using the straight-line method over a period of nine years and are stated at cost less accumulated amortisation and impairment. Core deposits are assessed for impairment at each reporting date and whenever there is an indicator of impairment.
Other intangibles Other intangibles primarily consist of financial planner distribution relationships, credit card customer relationships, dealer networks, value in force business and service contracts. They are stated at cost less accumulated amortisation (where relevant) and impairment. Other intangibles are assessed for impairment at each reporting date and whenever there is an indicator of impairment. An impairment charge is recognised whenever the carrying amount of the intangible exceeds its recoverable amount, which is determined on a value-in-use basis.
Financial planner distribution relationships, credit card customer relationships and dealer networks were recognised as part of business acquisitions and represent the value attributable to future revenue from these relationships. They are amortised using the straight-line method over their estimated useful lives of eight, five and three years respectively.
f. Liabilities (i) Financial liabilities The Group classifies significant financial liabilities in the following categories: payables due to other financial institutions, deposits and other borrowings, other financial liabilities at fair value through income statement, derivative financial instruments, debt issues and loan capital. Financial liabilities are recognised when an obligation arises.
Financial liabilities measured at fair value through income statement are recognised initially at fair value. All other financial liabilities are recognised initially at fair value plus directly attributable transaction costs.
Financial liabilities are derecognised when the obligation is discharged, cancelled or expires. Where an existing financial liability is replaced by another from the same lender on substantially different terms, or the terms of an existing liability are substantially modified, the exchange or modification is treated as a derecognition of the original liability and the recognition of a new liability, with the difference in the respective carrying amounts recognised in profit or loss.
a. Payables due to other financial institutions
Payables due to other financial institutions include interbank lending, securities sold under agreements to repurchase, cash collateral and deposits (including vostro, settlement and clearing account balances) due to central and other banks. Subsequent to initial recognition, they are measured at amortised cost using the effective interest rate method.
b. Deposits and other borrowings
Deposits and other borrowings include certificates of deposit, at-call and term deposits, and other related interest-bearing financial instruments. Subsequent to initial recognition, deposits and other borrowings are measured at either amortised cost using the effective interest rate method or at fair value through income statement where they are designated as such on initial recognition.
The Group designates certain deposits and other borrowings at fair value when those liabilities are managed on a fair value basis (as part of a trading portfolio), where an accounting mismatch is eliminated or reduced (which arises from associated derivatives executed for risk management purposes), or where the instrument contains an embedded derivative. These liabilities are measured at fair value with changes in fair value (except own credit) recognised through the income statement in the period in which they arise. The change in the portion of the fair value that is attributable to Westpac’s own credit risk is recognised in other comprehensive income except where it would create an accounting mismatch, in which case it is also recognised through the income statement.
Interest expense incurred is recorded within net interest income using the effective interest rate method.
144 2014 Westpac Group Annual Report

Notes to the financial statements Note 1. Summary of significant accounting policies (continued) c. Other financial liabilities at fair value through income statement
Other financial liabilities at fair value through income statement includes trading securities sold short, securities sold under repurchase agreements included as part of a trading portfolio and other financial liabilities designated at fair value on initial recognition. Subsequent to initial recognition, these liabilities are measured at fair value with changes in fair value (except as noted below) recognised through the income statement in the period in which they arise. For financial liabilities that have been designated at fair value, the change in the portion of the fair value that is attributable to Westpac’s own credit risk is recognised in other comprehensive income except where it would create an accounting mismatch, in which case it is recognised through the income statement.
Interest expense incurred is recorded within net interest income using the effective interest rate method.
d. Derivative financial instruments
Refer to previous discussion on derivative financial instruments in Note 1(e)(ii).
e. Debt issues
These are bonds, notes, commercial paper and debentures that have been issued by entities in the Westpac Group. Debt issues also include acceptances, which are bills of exchange initially accepted and discounted by Westpac that have been subsequently rediscounted into the market. Bill financing provided to customers by accepting and discounting of bills of exchanges is reported as part of loans.
Subsequent to initial recognition, debt issues are measured at either amortised cost using the effective interest rate method or at fair value through income statement where they are designated as such on initial recognition. The Group designates certain debt issues at fair value to reduce or eliminate an accounting mismatch which arises from associated derivatives executed for risk management purposes, or where the instrument contains an embedded derivative. These liabilities are measured at fair value with changes in fair value (except own credit) recognised through the income statement in the period in which they arise. The change in the fair value that is attributable to Westpac’s own credit risk is recognised in other comprehensive income except where it would create an accounting mismatch, in which case it is also recognised through the income statement.
Interest expense incurred is recorded within net interest income using the effective interest rate method.
f. Loan capital
Loan capital is debt issued by the Group recognised as a liability with terms and conditions that qualify for inclusion as regulatory capital under APRA Prudential Standards. Subsequent to initial recognition loan capital is measured at amortised cost using the effective interest rate method.
g. Financial guarantees
Financial guarantee contracts are recognised as financial liabilities (recorded in provisions) at the time the guarantee is issued. The liability is initially measured at fair value and subsequently at the higher of the amount determined in accordance with AASB 137 Provisions, Contingent Liabilities and Contingent Assets and the amount initially recognised less cumulative amortisation, where appropriate.
The fair value of a financial guarantee contract is determined as the present value of the difference in net cash flows between the contractual payments under the debt instrument and the payments that would be required without the guarantee, or the estimated amount that would be payable to a third party for assuming the obligation.
(ii) Provisions Employee benefits Provisions for wages and salaries, including non-monetary benefits, annual leave, accumulating sick leave and any associated on-costs (i.e. payroll tax) expected to be settled within 12 months of the balance date are recognised in respect of employees’ services up to the balance date and are measured at the amounts expected to be paid when the liabilities are settled.
Provisions for long service leave expected to be settled within 12 months of the balance date are measured at the amounts expected to be paid when the liabilities are settled. Provisions for long service leave expected to be settled more than 12 months from the balance date are measured at the present value of future payments expected to be made in respect of services provided by employees up to the balance date. Consideration is given to expected future wage and salary levels, experience of employee departure and periods of service. Expected future payments are discounted to their net present value using market yields at the balance date on government bonds with terms that match as closely as possible the estimated timing of future cash flows.
Provision for impairment on credit commitments A provision for impairment is recognised on undrawn contractually committed facilities and guarantees provided. The amount is calculated using the same methodology as the provision for impairment charges on loans (refer to Note 1(e)(ii)).
2014 Westpac Group Annual Report 145
Note 1. Summary of significant accounting policies (continued) Provision for restructuring A provision for restructuring (including termination benefits) is recognised where there is a demonstrable commitment and a detailed plan such that there is little or no discretion to avoid payments to other parties and the amount can be reliably estimated. The majority of restructuring provisions are expected to be settled within 12 months and are measured at amounts expected to be paid when they are settled. Amounts expected to be settled more than 12 months from the balance date are measured at the present value of the estimated cash outflows, where the effect of discounting is material.
Provision for dividends A provision for dividends is recognised when dividends are declared, determined or publicly recommended by the Directors but not distributed as at the balance date.
Provision for litigation and non-lending losses A provision for litigation is recognised where it is probable that there will be an outflow of economic resources. Non-lending losses are any losses that have not arisen as a consequence of an impaired credit decision. Those provisions include litigation and associated costs, frauds and the correction of operational issues.
Provision for leasehold premises The provision for leasehold premises covers unavoidable costs in relation to making good property to the same or similar state as when the lease was entered into at the end of the lease period or net outgoings on certain unoccupied leased premises or sub-let premises where projected rental income falls short of rental expense. The liability is determined on the basis of the present value of net future cash flows.
(iii) Life insurance liabilities Life insurance liabilities consist of life insurance contract liabilities, life investment contract liabilities and external liabilities of managed investment schemes controlled by statutory life funds.
Life insurance contract liabilities The value of life insurance contract liabilities is calculated using the margin on services methodology. The methodology takes into account the risks and uncertainties of the particular classes of the life insurance business written. Deferred policy acquisition costs are included in the measurement basis of life insurance contract liabilities and are therefore equally sensitive to the factors that are considered in the liabilities measurement. This methodology is in accordance with Prudential Standard LPS 340 Valuation of Policy Liabilities.
Under this methodology, planned profit margins and an estimate of future liabilities are calculated separately for each related product group using applied assumptions at each reporting date. Profit margins are released over each reporting period in line with the service that has been provided. The balance of the planned profit is deferred by including them in the value of policy liabilities.
Life investment contract liabilities Life investment contract liabilities are designated at fair value through income statement. Fair value is based on the higher of the valuation of linked assets, or the minimum current surrender value.
External liabilities of managed investment schemes controlled by statutory life funds External liabilities of managed investment schemes controlled by statutory life funds are designated at fair value through income statement.
g. Equity (i) Share capital Ordinary shares are recognised at the amount paid up per ordinary share net of directly attributable issue costs. Where the Parent Entity or other members of the consolidated Group purchases shares in the Parent Entity, the consideration paid is deducted from ordinary share capital and the shares are treated as treasury shares until they are subsequently sold, reissued or cancelled. Where such shares are sold or reissued, any consideration received is included in shareholders’ equity.
(ii) Other equity instruments Convertible debentures issued by the parent entity in respect of the 2006 Trust Preferred Securities (2006 TPS) are recognised in the balance sheet at the amount of consideration received net of issue costs. They are translated into Australian currency using the rate of exchange on issue date and distributions on them are recognised when entitlements are determined in accordance with the terms of the convertible debentures.
(iii) Non-controlling interests Non-controlling interests represents the share in the net assets of subsidiaries attributable to equity interests that are not owned directly or indirectly by the Parent Entity. The Group also has on issue 2006 TPS that are hybrid instruments and are classified as non-controlling interests.
146 2014 Westpac Group Annual Report

Notes to the financial statements Note 1. Summary of significant accounting policies (continued) (iv) Reserves Foreign currency translation reserve As noted in Note 1(b)(ii), exchange differences arising on translation of the Group’s foreign operations, any offsetting gains or losses on hedging the net investment and any associated tax effect are reflected in the foreign currency translation reserve. A cumulative credit balance in this reserve would not normally be regarded as being available for payment of dividends until such gains are realised on sale or disposal of the foreign operation.
Available-for-sale securities reserve This comprises the changes in the fair value of available-for-sale financial securities, net of tax. These changes are transferred to the income statement in non-interest income when the asset is either derecognised or impaired.
Cash flow hedging reserve This comprises the fair value gains and losses associated with the effective portion of designated cash flow hedging instruments.
Share-based payment reserve This comprises the fair value of share-based payments recognised as an expense.
Other reserves Other reserves for the Parent Entity consists of the common control reserve (refer Note 1(b)(i)). Other reserves for the Group consist of transactions relating to change in the parent entity’s ownership of a subsidiary that do not result in a loss of control.
The amount recorded in other reserves reflects the difference between the amount by which non-controlling interests are adjusted and the fair value of any consideration paid or received.
h. Other (i) Loan securitisation The Group, through its loan securitisation program, packages and sells loans (principally housing mortgage loans) as securities to investors. The program includes the securitisation of the Group’s own assets as well as assets from customer funding conduits. In such transactions, the Group provides an equitable interest in the loans to investors who provide funding to the Group. Securitised loans that do not qualify for derecognition and the associated funding are included in loans and debt issues respectively.
(ii) Fiduciary activities Certain controlled entities within the Group conduct investment management and other fiduciary activities as responsible entity or manager on behalf of individuals, trusts, retirement benefit plans and other institutions. These activities involve the management of assets in investment schemes and superannuation funds, and the holding or placing of assets on behalf of third parties.
Where controlled entities, as responsible entities, incur liabilities in respect of these activities, a right of indemnity exists against the assets of the applicable trusts. As these assets are sufficient to cover liabilities, and it is not probable that the controlled entities will be required to settle them, the assets and liabilities are not included in the consolidated financial statements.
The Group also manages life insurance statutory fund assets that are included in the consolidated financial statements.
(iii) Superannuation obligations Obligations for contributions to the defined contribution superannuation plan are recognised as an expense in the income statement as incurred.
The asset or liability recognised in the balance sheet in respect of the defined benefit superannuation plan is the present value of the defined benefit obligation as at the reporting date less the fair value of the plan’s assets. The present value of the defined benefit obligation is determined by discounting the estimated pre-tax future cash flows using blended interest rates of government bonds that have terms to maturity approximating to the terms of the related superannuation liability.
The superannuation expense relating to the defined benefit superannuation plan comprises of service cost (including current and past service cost and gains and losses on curtailments and settlements) and net interest expense (income). Remeasurements (including actuarial gains and losses and the difference between the interest income and the return on plan assets) is recognised in other comprehensive income.
(iv) Earnings per share Basic earnings per share (EPS) is determined by dividing the net profit after tax attributable to equity holders, excluding costs of servicing other equity instruments, by the weighted average number of ordinary shares outstanding during the financial year, excluding the number of ordinary shares purchased and held as treasury shares.
Diluted EPS is calculated by adjusting the earnings and number of shares used in the determination of the basic EPS for the effects of dilutive options, share rights and other dilutive potential ordinary shares.
2014 Westpac Group Annual Report 147

Note 1. Summary of significant accounting policies (continued) In relation to options, share rights and restricted shares, the weighted average number of shares is adjusted to take into account the weighted average number of shares assumed to have been issued for nil consideration in determining diluted EPS. The number of ordinary shares assumed to be issued for nil consideration represents the difference between the number that would have been issued at the exercise price and the number that would have been issued at the average market price over the reporting period.
In relation to instruments convertible into ordinary shares under certain conditions, the weighted average number of shares is adjusted to determine the number of ordinary shares that may arise on conversion, by dividing the face value of the instruments by the average market price over the reporting period, taking into account any applicable discount on conversion weighted by the number of instruments on issue.
(v) Leases Leases are classified as either finance leases or operating leases. Under a finance lease, substantially all the risks and rewards incidental to legal ownership are transferred to the lessee. In contrast, an operating lease exists where the leased assets are allocated to the lessor.
In its capacity as a lessor, the Group primarily offers finance leases. The Group recognises the assets held under finance lease in the balance sheet as loans at an amount equal to the net investment in the lease. The recognition of finance income is based on a pattern reflecting a constant periodic return on the Group’s net investment in the finance lease. Finance lease income is included within interest income in the income statement (refer to Note 1(c)(i)). Where the Group offers operating leases, the assets are recognised in the balance sheet as property, plant and equipment at cost, and depreciated to their residual value on a straight-line basis over their estimated useful life. Operating lease rentals are recognised in the income statement on a straight line basis over the lease term (refer to Note 1(c)(ii).
In its capacity as a lessee, the Group mainly uses property and equipment under operating leases. Payments due to the lessor under operating leases are charged to equipment and occupancy expense on a straight-line basis over the term of the lease (refer to Note 1(c)(iii)).
(vi) Segment reporting Operating segments are presented on a basis that is consistent with information provided internally to Westpac’s key decision makers. In assessing the financial performance of its divisions internally, Westpac uses a measure of performance it refers to as ‘cash earnings’. To calculate cash earnings, Westpac adjusts the statutory result for material items that key decision makers believe do not reflect ongoing operations, items that are not considered when dividends are recommended and accounting reclassifications between individual line items that do not impact statutory results, such as policyholder tax recoveries. Details of the specific adjustments made to the statutory result in arriving at cash earnings are included in Note 33.
(vii) Critical accounting assumptions and estimates The application of the Group’s accounting policies necessarily requires the use of judgment, estimates and assumptions. Should different assumptions or estimates be applied, the resulting values would change, impacting the net assets and income of the Group. The nature of significant assumptions and estimates used are noted below.
Fair value of financial instruments Financial instruments classified as held-for-trading (including derivatives) or designated at fair value through income statement and financial assets classified as available-for-sale are recognised in the financial statements at fair value.
The fair value of a financial instrument is the price that would be received to sell an asset or paid to transfer a liability in an orderly transaction between market participants on the measurement date.
Fair value is obtained from quoted market prices, independent dealer price quotations, discounted cash flow models and option pricing models, which incorporate current market and contractual prices for the underlying instrument, time to expiry, yield curves and volatility of the underlying. The calculation of fair value for any financial instrument may also require adjustment of the quoted price or model value to reflect the cost of credit risk (where not embedded in underlying models or prices used). The process of calculating fair value on illiquid instruments or from a valuation model may require estimation of certain pricing parameters, assumptions or model characteristics. These estimates are calibrated against industry standards, economic models and observed transaction prices.
The fair value of financial instruments is provided in Note 28 as well as the mechanism by which fair value has been derived.
Provisions for impairment charges on loans and credit commitments Provisions for credit impairment represent management’s estimate of the impairment charges incurred in the loan portfolios and on undrawn contractually committed credit facilities and guarantees provided as at the balance date. Changes to the provisions are reported in the income statement as part of impairment charges on loans. The methodology and assumptions used for estimating future cash flows are reviewed regularly by the Group to reduce any differences between loss estimates and actual loss experience.
148 2014 Westpac Group Annual Report

Notes to the financial statements Note 1. Summary of significant accounting policies (continued) Individual component All impaired loans that exceed specified thresholds are individually assessed for impairment. Individually assessed loans principally comprise the Group’s portfolio of commercial loans to medium and large businesses. Impairment is recognised as the difference between the carrying value of the loan and the discounted value of management’s best estimate of future cash repayments and proceeds from any security held (discounted at the loan’s original effective interest rate for fixed rate loans and the loan’s current effective interest rate for variable rate loans). Relevant considerations that have a bearing on the expected future cash flows are taken into account, including the business prospects for the customer, the realisable value of collateral, the Group’s position relative to other claimants, the reliability of customer information and the likely cost and duration of the work-out process. Subjective judgments are made in this process. Furthermore, judgments can change with time as new information becomes available or as work-out strategies evolve, resulting in revisions to the impairment provision as individual decisions are taken.
Collective component This is made up of two elements: loan impairment provisions for impaired loans that are below individual assessment thresholds (collective impaired loan provisions) and for loan impairments that have been incurred but have not been separately identified at the balance sheet date (incurred but not reported provisions). These are established on a portfolio basis taking into account the level of arrears, collateral, past loss experience and defaults based on portfolio trends. The most significant factors in establishing these provisions are the estimated loss rates and the related emergence periods. The emergence period for each loan product type is determined through studies of loss emergence patterns. Loan files where losses have emerged were reviewed to identify the average time period between observable loss indicator events and the loss becoming identifiable. The future credit quality of these portfolios is subject to uncertainties that could cause actual credit losses to differ materially from reported loan impairment provisions. These uncertainties include the economic environment, notably interest rates and their effect on customer spending, unemployment levels, payment behaviour and bankruptcy rates.
Details on the group’s impairment charges are provided in Note 12.
Goodwill The determination of the fair value of assets and liabilities of the acquired businesses requires the exercise of management judgment. Different fair values would result in changes to the goodwill balance and to the post-acquisition performance of the acquisition.
To determine if goodwill is impaired, the carrying value of the identified CGU to which the goodwill is allocated, is compared to its recoverable amount. Value in use is the present value of expected future cash flows from the CGU, and the determination of the appropriate cash flows and discount rates to use is subjective. The key assumptions applied to determine if any impairment exists are outlined in Note 15.
Superannuation obligations The Group operates a number of defined benefit plans as described in Note 36. For each of these plans, independent actuarial valuations of the plan’s obligations using the projected unit credit method and the fair value measurements of the plan’s assets are performed at least annually. The actuarial valuation of plan obligations is dependent upon a series of assumptions, the key ones being price inflation, salaries growth, mortality, morbidity, investment returns and discount rate assumptions. Different assumptions could significantly alter the amount of the difference between plan assets and obligations, and the superannuation cost charged to the income statement.
Provisions (other than loan impairment) Provisions are held in respect of a range of obligations such as employee entitlements, restructuring costs, litigation provisions and non-lending losses and onerous contracts (for example leases with surplus space). Provisions carried for long service leave are supported by an independent actuarial report. Some of the provisions involve significant judgment about the likely outcome of various events and estimated future cash flows. The deferral of these benefits involves the exercise of management judgments about the ultimate outcomes of the transactions. Payments that are expected to be incurred after more than one year are discounted at a rate which reflects both current interest rates and the risks specific to that provision.
Income taxes The Group is subject to income taxes in Australia and jurisdictions where it has foreign operations. Significant judgment is required in determining the worldwide provision for income taxes, based on the Group’s understanding of the relevant tax law. There are many transactions and calculations undertaken during the ordinary course of business for which the ultimate tax outcome is unclear. Provisions for tax are held to reflect these tax uncertainties. Where the final outcome of these matters is different from the amounts that were initially recorded, such differences will impact the current and deferred tax provisions in the period where such determination is made. Refer to Note 14 for details of the Group’s deferred tax balances.
2014 Westpac Group Annual Report 149

Note 1. Summary of significant accounting policies (continued) Life insurance contract liabilities Life insurance contract liabilities are computed using statistical or mathematical methods, which are expected to give approximately the same results as if an individual liability was calculated for each contract. These computations are made by suitably qualified personnel on the basis of recognised actuarial methods, with due regard to relevant actuarial principles. The methodology takes into account the risks and uncertainties of the particular classes of the life insurance business written. Deferred policy acquisition costs are connected with the measurement basis of life insurance contract liabilities and are equally sensitive to the factors that are considered in the liability measurement.
The key factors that affect the estimation of these liabilities and related assets are:
the cost of providing benefits and administrating the contracts; mortality and morbidity experience, including enhancements to policyholder benefits; discontinuance experience, which affects the Group’s ability to recover the cost of acquiring new business over the life of the
contracts; and the rate at which projected future cash flows are discounted. In addition, factors such as regulation, competition, interest rates, taxes, securities market conditions and general economic conditions affect the level of these liabilities. In some contracts, the Group shares experience on investment results with its customers, which can offset the impacts of these factors on the profitability of these products.
Consolidation of structured entities The Group assesses at inception and periodically whether an entity (particularly a structured entity) should be consolidated. The determination of control of structured entities will involve significant judgment as voting rights are often not the decisive factor in decisions over the relevant activities. Judgment may involve assessing the purpose and design of the entity, and consideration as to whether the Group, or another involved party with power over the relevant activities, is acting as a principal in its own right or as an agent on behalf of others. Refer to Note 41 for information about structured entities.
(viii) Future developments in accounting standards The following new standards and interpretations which may have a material impact on the Group have been issued, but are not yet effective and have not been early adopted by the Group:
AASB 9 Financial Instruments was issued by the Australian Accounting Standards Board in December 2009. Unless early adopted, the standard will be effective for the 30 September 2019 financial year. The major changes under the standard are:
the multiple classification and measurement models are replaced in AASB 139 Financial Instruments: Recognition and Measurement with a single model that has two classification categories: amortised cost and fair value;
a financial asset is measured at amortised cost if two criteria are met: a) the objective of the business model is to hold the financial asset for the collection of the contractual cash flows, and b) the contractual cash flows under the instrument solely represent the payment of principal and interest;
if a financial asset is eligible for amortised cost measurement, an entity can elect to measure it at fair value if it eliminates or significantly reduces an accounting mismatch;
an embedded derivative will not be separated where the instrument is a financial asset; equity instruments must be measured at fair value however, an entity can elect on initial recognition to present the fair value
changes on non-trading equity investments directly in other comprehensive income. There is no subsequent recycling of fair value gains and losses to profit or loss; however dividends from such investments will continue to be recognised in profit or loss;
if an entity holds an investment in asset-backed securities (ABS) it must determine the classification of that investment by looking through to the underlying assets and assess the credit quality of the investment compared with the underlying portfolio of assets. If an entity is unable to look through to the underlying assets, then the investment must be measured at fair value;
the portion of a change of fair value relating to the entity’s own credit risk for financial liabilities designated at fair value is presented in other comprehensive income, except when that would create an accounting mismatch. If such a mismatch would be created or enlarged, all changes in fair value (including the effects of changes in the credit risk) is recognised in profit or loss. The Group early adopted this amendment from 1 October 2013; and
hedge accounting is more closely aligned with risk management activities by increasing the eligibility of both hedged items and hedging instruments and introducing a more principles-based approach to assessing hedge effectiveness.
The IASB recently released a final version of IFRS 9 Financial Instruments. This final standard includes a new expected credit loss impairment model which will replace the current incurred loss impairment model. The Australian Accounting Standards Board is expected to release a final version of AASB 9 equivalent to IFRS 9 shortly. We are yet to determine the impact of this revised standard on the Group.
The IASB also has a separate active project on accounting for macro hedging which it continues to work on.
150 2014 Westpac Group Annual Report

Notes to the financial statements Note 1. Summary of significant accounting policies (continued) As a result of the issuance and reissuance of AASB 9, two further standards have been issued by the AASB which give effect to consequential changes to a number of Australian Accounting Standards and Interpretations. These standards are AASB 2009-11 Amendments to Australian Accounting Standards arising from AASB 9 which was issued in December 2009 and AASB 2010-7 Amendments to Australian Accounting Standards arising from AASB 9 (December 2010) which was issued in December 2010. These standards will be applicable when AASB 9 is adopted by the Group.
AASB 9 will impact the classification and measurement of the Group’s financial instruments when the remainder of the standard is adopted.
AASB 2012-3 Amendments to Australian Accounting Standards – Offsetting Financial Assets and Financial Liabilities was issued in June 2012 and will be effective for the 30 September 2015 financial year. The amendment provides application guidance to addressing inconsistencies applied to offsetting criteria provided in AASB 132 Financial Instruments: Presentation, including clarifying the meaning of current legal enforceable right of set-off is legally enforceable in all circumstances and that some gross settlement systems (such as through a clearing house) may be considered as the equivalent to net settlement. The amendment is not expected to have a material impact on the Group.
AASB 15 Revenue from Contracts with Customers was issued on 28 May 2014 and will be effective for the 30 September 2018 financial year. The standard provides a single comprehensive model for revenue recognition. It supersedes current recognition and related Interpretations. The application of AASB 15 is not expected to have a material impact on the Group.
Note 2. Net interest income
Consolidated Parent Entity2014 2013 2012 2014 2013
$m $m $m $m $mInterest incomeCash 225 102 99 182 67Receivables due from other financial institutions 84 113 188 35 38Net ineffectiveness on qualifying hedges (58) 31 8 (61) 29Trading securities 1,407 1,665 2,091 1,340 1,603Other financial assets designated at fair value 75 67 108 73 64Available-for-sale securities 1,386 1,226 1,116 1,231 1,085Loans 29,104 29,781 33,238 24,666 26,125Regulatory deposits with central banks overseas 18 23 24 18 23Due from subsidiaries - - - 4,585 3,907Other interest income 7 1 1 7 1Total interest income1 32,248 33,009 36,873 32,076 32,942Interest expensePayables due to other financial institutions (300) (190) (244) (299) (189)Certificates of deposit (921) (1,009) (1,619) (881) (978)At call and term deposits (10,578) (11,546) (12,983) (9,148) (10,352)Trading liabilities (2,523) (2,806) (4,500) (2,268) (2,569)Debt issues (3,813) (4,008) (4,388) (3,096) (3,407)Due to subsidiaries - - - (4,791) (4,064)Loan capital (490) (529) (454) (458) (494)Other interest expense (81) (100) (183) (71) (70)Total interest expense2 (18,706) (20,188) (24,371) (21,012) (22,123)Net interest income 13,542 12,821 12,502 11,064 10,819
1 Total interest income for financial assets that are not at fair value through income statement is $30,824 million (2013: $31,246 million, 2012: $34,666 million) for the Group and $30,724 million (2013: $31,246 million) for the Parent Entity.
2 Total interest expense for financial liabilities that are not at fair value through income statement is $14,996 million (2013: $16,116 million, 2012: $17,990 million) for the Group and $17,636 million (2013: $18,357 million) for the Parent Entity.
2014 Westpac Group Annual Report 151
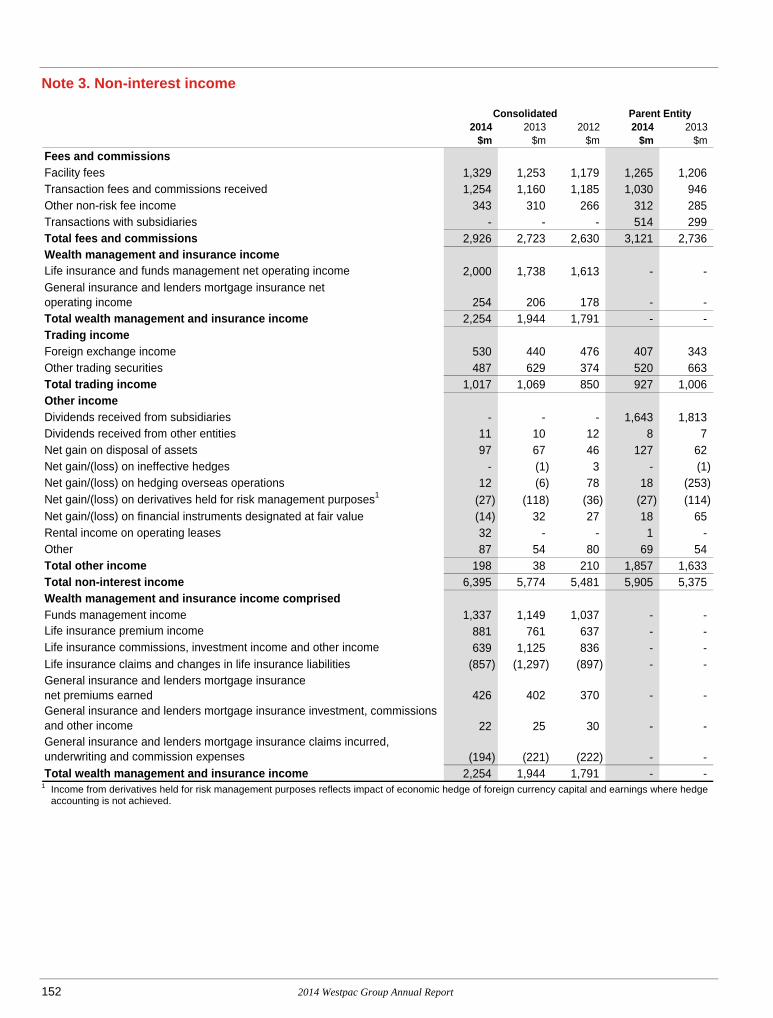
Note 3. Non-interest income
Consolidated Parent Entity2014 2013 2012 2014 2013
$m $m $m $m $mFees and commissionsFacility fees 1,329 1,253 1,179 1,265 1,206 Transaction fees and commissions received 1,254 1,160 1,185 1,030 946 Other non-risk fee income 343 310 266 312 285 Transactions with subsidiaries - - - 514 299 Total fees and commissions 2,926 2,723 2,630 3,121 2,736 Wealth management and insurance incomeLife insurance and funds management net operating income 2,000 1,738 1,613 - - General insurance and lenders mortgage insurance netoperating income 254 206 178 - - Total wealth management and insurance income 2,254 1,944 1,791 - - Trading incomeForeign exchange income 530 440 476 407 343 Other trading securities 487 629 374 520 663 Total trading income 1,017 1,069 850 927 1,006 Other incomeDividends received from subsidiaries - - - 1,643 1,813 Dividends received from other entities 11 10 12 8 7 Net gain on disposal of assets 97 67 46 127 62 Net gain/(loss) on ineffective hedges - (1) 3 - (1) Net gain/(loss) on hedging overseas operations 12 (6) 78 18 (253) Net gain/(loss) on derivatives held for risk management purposes1 (27) (118) (36) (27) (114) Net gain/(loss) on financial instruments designated at fair value (14) 32 27 18 65 Rental income on operating leases 32 - - 1 - Other 87 54 80 69 54 Total other income 198 38 210 1,857 1,633 Total non-interest income 6,395 5,774 5,481 5,905 5,375 Wealth management and insurance income comprisedFunds management income 1,337 1,149 1,037 - -
881 761 637 - - Life insurance commissions, investment income and other income 639 1,125 836 - - Life insurance claims and changes in life insurance liabilities (857) (1,297) (897) - - General insurance and lenders mortgage insurance net premiums earned 426 402 370 - -
22 25 30 - -
(194) (221) (222) - - Total wealth management and insurance income 2,254 1,944 1,791 - -
Life insurance premium income
General insurance and lenders mortgage insurance investment, commissions and other incomeGeneral insurance and lenders mortgage insurance claims incurred, underwriting and commission expenses
1 Income from derivatives held for risk management purposes reflects impact of economic hedge of foreign currency capital and earnings where hedge
accounting is not achieved.
152 2014 Westpac Group Annual Report

Notes to the financial statements Note 4. Operating expenses
Consolidated Parent Entity2014 2013 2012 2014 2013
$m $m $m $m $mSalaries and other staff expensesSalaries and wages 3,544 3,264 3,113 2,761 2,588 Employee entitlements 316 325 326 272 282 Employee related taxes 210 223 209 174 190 Superannuation expense:
Defined contribution plans 279 254 237 216 198 Defined benefit plans (Note 36) 57 70 87 56 70
Equity based compensation 184 155 155 133 113 Restructuring costs 61 28 159 57 18 Other 16 17 20 1 3 Total salaries and other staff expenses 4,667 4,336 4,306 3,670 3,462 Equipment and occupancy expensesOperating lease rentals 565 565 535 481 487 Depreciation, amortisation and impairment:
Premises 10 13 14 9 12 Leasehold improvements 109 108 106 92 94 Furniture and equipment 64 62 62 54 54 Technology 105 94 85 91 82 Software 493 403 352 413 336 Assets under lease 16 - - 1 -
Equipment repairs and maintenance 85 78 76 71 67 Electricity, water and rates 12 12 12 8 8 Land tax 8 8 8 7 8 Other 35 27 28 25 15 Total equipment and occupancy expenses 1,502 1,370 1,278 1,252 1,163 Other expensesAmortisation of deferred expenditure 6 3 6 16 17 Amortisation and impairment of intangible assets 217 221 225 191 208 Impairment on investments in subsidiaries - - - 22 - Non-lending losses (23) 43 172 (33) 30 Purchased services:
Technology and information services 392 350 278 291 245 Legal 33 26 29 25 15 Other professional services 423 380 402 293 284 Credit card loyalty programs 136 135 133 136 135
Stationery 75 76 78 57 57 Postage and freight 130 146 151 101 117 Outsourcing costs 610 587 620 488 478 Insurance 21 20 16 13 13 Advertising 159 164 147 114 110 Training 18 21 20 13 15 Travel 67 64 66 49 47 Westpac Bicentennial Foundation grant 100 - - 100 - Other expenses 14 34 30 141 103 Total other expenses 2,378 2,270 2,373 2,017 1,874 Operating expenses 8,547 7,976 7,957 6,939 6,499
2014 Westpac Group Annual Report 153

Note 5. Income tax
Consolidated Parent Entity2014 2013 2012 2014 2013
$m $m $m $m $mThe income tax expense for the year is reconciled to the profit before income tax as followsProfit before income tax 10,740 9,772 8,814 9,469 9,033Prima facie income tax based on the Australian company tax rate of 30% 3,222 2,932 2,644 2,841 2,710The effect of amounts which are not deductible (assessable) in calculating taxable incomeChange in tax rate1 1 (2) 1 1 -Dividend adjustments 7 (2) (1) (493) (544)Life insurance:
Tax adjustment on policyholders’ earnings2 3 24 8 - -Adjustment for life business tax rates (4) (8) (6) 1 1
Hybrid capital distributions3 36 26 10 36 26Other non-assessable items (22) (18) (29) (22) (16)Other non-deductible items 46 37 53 39 31Adjustment for overseas tax rates (22) - 3 10 16Income tax (over)/under provided in prior years (14) (7) (10) (15) (9)TOFA tax consolidation adjustment4 - - 165 - -Other items5 (138) (35) (26) (163) 13Total income tax expense in the income statement 3,115 2,947 2,812 2,235 2,228Income tax analysisIncome tax expense attributable to profit from ordinary activities comprised:Current income tax:
Australia 2,303 2,209 2,160 1,844 1,723Overseas 401 357 344 79 102
2,704 2,566 2,504 1,923 1,825Deferred income tax:
Australia 389 387 320 325 405Overseas 36 1 (2) 2 7
425 388 318 327 412Under/(over) provision in prior years:
Australia 2 (1) (8) 3 (2)Overseas (16) (6) (2) (18) (7)
(14) (7) (10) (15) (9)Total Australia 2,694 2,595 2,472 2,172 2,126Total overseas 421 352 340 63 102Total income tax expense attributable to profit from ordinary activities 3,115 2,947 2,812 2,235 2,228
1 During 2014 the company tax rate in the UK reduced from 23% to 21% (2013: from 24% to 23%, 2012 from 26% to 24%). The impact of this change has been taken to account in the measurement of deferred tax at the end of the reporting period. The impact of the change in the Fiji company tax rates from 28% to 20% was included in 2012.
2 In accordance with the requirements of AASB 1038, tax expense for 2014 includes a $4 million tax expense on policyholders’ investment earnings (2013: $35 million tax expense, 2012: $12 million tax expense) of which $1 million (2013: $11 million tax expense, 2012: $4 million tax expense) is included in the prima facie tax expense and the balance of $3 million tax expense (2013: $24 million tax expense, 2012: $8 million tax expense) is shown here.
3 Reflects distributions on Westpac Convertible Preference Shares, Westpac Capital Notes and Westpac Capital Notes 2 which are non-tax deductible. 4 New legislation that included retrospective amendments to the income tax law as it applies to TOFA and tax consolidated groups was introduced
during the 2012 financial year. The amendments had an adverse application to certain liabilities that were consolidated as part of the St.George merger. This gave rise to an additional income tax expense of $165 million for the 2012 financial year.
5 Includes the release of provisions no longer required following the finalisation of prior period taxation matters.
154 2014 Westpac Group Annual Report

Notes to the financial statements Note 5. Income tax (continued) Tax consolidation The Parent Entity and its wholly owned, Australian-controlled entities implemented the tax consolidation legislation as of 1 October 2002. All entities in the tax consolidated group have entered into a tax sharing agreement which, in the opinion of the Directors, limits the joint and several liabilities of the wholly owned entities in the case of a default by the head entity, Westpac Banking Corporation.
The entities have also entered into a tax funding agreement under which the wholly owned entities fully compensate the Parent Entity for any current tax payable assumed and are compensated by the Parent Entity for any current tax receivable and deferred tax assets relating to unused tax losses or unused tax credits that are transferred to the Parent Entity under the tax consolidation legislation. The funding amounts are determined by reference to the amounts recognised in the wholly owned entities’ financial statements.
The amounts receivable/payable under the tax funding agreement are settled on a quarterly basis in line with the Parent Entity’s obligations to pay tax instalments. Any unpaid amounts at balance date are recognised as current intercompany receivables or payables.
Taxation of financial arrangements (TOFA) TOFA applies to all entities in the Australian tax consolidation group from 1 October 2010. Subject to certain elections being made, TOFA improves the alignment of the tax treatment of gains and losses from financial arrangements with the accounting treatment adopted in the financial statements. The transitional rules require deferred tax balances impacted by TOFA to be amortised to taxable income over a four year period.
Note 6. Dividends Consolidated Parent Entity
2014 2013 2012 2014 2013$m $m $m $m $m
Recognised amountsOrdinary dividends2013 final dividend paid 88 cents per share (2012: 84 cents per share, 2011: 80 cents per share) all fully franked at 30% 2,733 2,584 2,423 2,736 2,588 2014 interim dividend paid 90 cents per share (2013: 86 cents per share, 2012: 82 cents per share) all fully franked at 30% 2,794 2,665 2,501 2,798 2,670 Total ordinary dividends 5,527 5,249 4,924 5,534 5,258 Special dividendsSpecial dividend paid 10 cents per share determined 4 November 2013(2013: 10 cents per share determined 3 May 2013, 2012: nil) fully franked at 30% 310 310 - 310 310 Total special dividends 310 310 - 310 310 Distributions on other equity instrumentsConvertible debentures - - - 16 47 Total distributions on other equity instruments - - - 16 47 Dividends not recognised at year endSince year end the Directors have recommended the payment of the following dividends on ordinary shares:
Ordinary shares 92 cents per share (2013: 88 cents per share, 2012: 84 cents per share) all fully franked at 30% 2,856 2,733 2,584 2,860 2,736 Special dividend nil (2013: 10 cents per share, 2012: nil) fully franked at 30% - 310 - - 310
Total dividends not recognised at year end 2,856 3,043 2,584 2,860 3,046
The Board has determined to satisfy the DRP for the 2014 final dividend by issuing Westpac ordinary shares. The DRP will not include a discount.
Dividend franking account Australian franking credits available to the Parent Entity for subsequent financial years is $565 million (2013: $585 million, 2012: $1,029 million). This is based on the franking account of the Parent Entity at 30 September 2014, adjusted for franking credits that will arise from the payment of income tax payable on Australian profits for the 2014 financial year, and franking debits of $1,226 million that will arise from the payment of proposed 2014 final dividends.
2014 Westpac Group Annual Report 155

Note 7. Earnings per share Basic earnings per share (EPS) is calculated by dividing the net profit attributable to equity holders of Westpac by the weighted average number of ordinary shares on issue during the year, excluding the number of ordinary shares purchased by the Group and held as Treasury shares. Diluted EPS is calculated by adjusting the earnings and the weighted average number of ordinary shares outstanding to assume conversion of all dilutive potential ordinary shares.
Refer to Note 23 Loan Capital and Note 25 Share-based Payments for further information on the potential dilutive instruments.
Consolidated2014 2013 2012
Basic Diluted Basic Diluted Basic DilutedReconciliation of earnings used in the calculation of earnings per ordinary share ($m)Net profit attributable to owners of Westpac Banking Corporation 7,561 7,561 6,751 6,751 5,936 5,936
Restricted Share Plan (RSP) treasury shares distributions1 (10) - (12) - (11) - 2004 TPS distributions - 22 - 21 - 18 2007 convertible notes distributions - - - - - 16 Westpac SPS distributions - - - 27 - 34 Westpac SPS II distributions - 24 - 30 - 36 Westpac CPS dividends - 49 - 53 - 34 Westpac CN distributions - 56 - 30 - - Westpac CN 2 distributions - 14 - - - -
Net profit attributable to owners of Westpac Banking Corporation adjusted for the effect of dilution 7,551 7,726 6,739 6,912 5,925 6,074
Weighted average number of ordinary shares (millions)Weighted average number of ordinary shares 3,109 3,109 3,100 3,100 3,056 3,056 Effect of own shares held (11) (11) (13) (13) (13) (13) Potential dilutive adjustment:
Exercise of options and share rights and vesting of restricted shares - 9 - 14 - 13 Conversion of 2004 TPS - 18 - 17 - 21 Conversion of 2007 convertible notes - - - - - 23 Conversion of Westpac SPS - - - 31 - 43 Conversion of Westpac SPS II - 23 - 28 - 38 Conversion of Westpac CPS - 36 - 37 - 26 Conversion of Westpac CN - 42 - 24 - - Conversion of Westpac CN 2 - 11 - - - -
Total weighted average number of ordinary shares 3,098 3,237 3,087 3,238 3,043 3,207 Earnings per ordinary share (cents) 243.7 238.7 218.3 213.5 194.7 189.4
1 While the equity granted to employees remains unvested, RSP treasury shares are deducted from ordinary shares on issue in arriving at the weighted average number of ordinary shares outstanding. Despite the shares being unvested, employees are entitled to dividends and to voting rights on the shares. Consequently, a portion of the profit for the period is allocated to RSP treasury shares to arrive at earnings attributed to ordinary shareholders.
Note 8. Receivables due from other financial institutions
Consolidated Parent Entity2014 2013 2014 2013
$m $m $m $mConduit assets1 1,417 1,710 - -Cash collateral 3,830 7,137 3,686 6,987Interbank lending 2,177 2,363 1,797 2,330Total receivables due from other financial institutions 7,424 11,210 5,483 9,317
1 Further information on conduit assets is disclosed in Note 32. Conduit assets are only available to meet associated conduit liabilities disclosed in Note 22.
156 2014 Westpac Group Annual Report

Notes to the financial statements Note 9. Trading securities and other financial assets designated at fair value
Consolidated Parent Entity2014 2013 2012 2014 2013
$m $m $m $m $mSecurities 36,881 39,448 34,455 35,794 38,046 Securities purchased under agreement to resell 6,275 6,882 10,148 6,275 6,882 Other financial assets designated at fair value 2,753 2,759 2,664 2,255 2,090 Total trading securities and other financial assets designated at fair value 45,909 49,089 47,267 44,324 47,018
Securities include the following:
Consolidated Parent Entity2014 2013 2012 2014 2013
$m $m $m $m $mAustralian public securities
Commonwealth securities 7,146 4,501 3,172 7,146 4,501 State government securities 12,521 9,865 6,249 12,490 9,740
Australian equity securities 44 22 44 44 22 Australian debt securities 8,033 14,647 20,952 8,032 14,645 Overseas public securities 5,608 6,152 826 5,608 6,151 Overseas debt securities 3,486 4,236 3,164 2,431 2,962 Other securities 43 25 48 43 25 Total securities 36,881 39,448 34,455 35,794 38,046
Other financial assets designated at fair value include:
Consolidated Parent Entity2014 2013 2012 2014 2013
$m $m $m $m $mAustralian debt securities 1,595 1,928 1,840 1,265 1,444 Overseas debt securities 852 543 545 852 543 Australian equity securities 306 288 279 138 103 Total other financial assets designated at fair value 2,753 2,759 2,664 2,255 2,090
The Group has total holdings of debt securities from the Australian Commonwealth Government of $7,146 million and three Australian State Governments (Queensland Treasury Corporation: $12,220 million; NSW Treasury Corporation: $7,881 million; Western Australian Treasury Corporation: $5,776 million), the aggregate book and market value, each of which exceeded 10% of the Group total shareholders’ equity at 30 September 2014.
The Group holds $4,559 million of US Government treasury notes (2013: $4,978 million, 2012: $573 million1).
Both of the above are recognised in the categories trading securities, other financial assets designated at fair value and available-for-sale securities (Note 10) at 30 September 2014.
1 The 2012 comparative has been restated from the $37 million previously reported.
2014 Westpac Group Annual Report 157

Note 10. Available-for-sale securities
Consolidated Parent Entity2014 2013 2012 2014 2013
$m $m $m $m $mAvailable-for-sale securities – at fair valueAustralian public securities (State Government securities) 19,490 17,464 18,342 19,490 17,464 Australian debt securities 12,062 9,071 2,667 11,712 8,692 Overseas public securities 3,083 2,477 2,427 368 5 Overseas debt securities 1,179 797 801 415 221 Australian equity securities 9 10 106 8 8 Overseas equity securities 185 180 122 - -
36,008 29,999 24,465 31,993 26,390 Available-for-sale securities – at cost1
Unlisted securities 16 12 7 16 4 Total available-for-sale securities 36,024 30,011 24,472 32,009 26,394
1 Investments in certain unlisted securities are measured at cost because the fair value cannot be reliably measured. These investments represent non-controlling interests in companies for which active markets do not exist and quoted prices are not available.
Available-for-sale securities change in fair value resulted in a gain of $263 million for the Group (2013: $57 million gain, 2012: $139 million gain) and a gain of $222 million for the Parent Entity (2013: $7 million gain) being recognised in other comprehensive income.
The following table shows the maturities of the Group’s available-for-sale securities and their weighted-average yield as at 30 September 2014. There are no tax-exempt securities.
2014No Specific Weighted
Maturity Total Average $m % $m % $m % $m % $m % $m %Carrying amountAustralian public securities 100 2.9 8,861 4.4 10,108 4.7 421 4.5 - - 19,490 4.6 Australian debt securities 567 3.2 9,645 3.6 1,850 3.9 - - - - 12,062 3.6 Overseas public securities 1,050 3.7 1,673 5.1 360 4.7 - - - - 3,083 4.6 Overseas debt securities 384 1.6 761 3.4 34 5.6 - - - - 1,179 2.8 Australian equity securities - - - - - - - - 9 - 9 - Overseas equity securities - - - - - - - - 185 - 185 - Unlisted securities at cost - - - - - - - - 16 - 16 - Total by maturity 2,101 20,940 12,352 421 210 36,024
Over10 Years
Within1 Year
Over 1 Yearto 5 Years
Over 5 Yearsto 10 Years
The maturity profile is determined based upon contractual terms for available-for-sale instruments.
158 2014 Westpac Group Annual Report

Notes to the financial statements Note 11. Loans The following table shows loans disaggregated by type of product. Loans are classified based on the location of the booking office:
Consolidated Parent Entity 2014 2013 2014 2013
$m $m $m $mAustralia Overdrafts 2,589 2,965 2,589 2,965Credit card outstandings 10,032 9,560 10,032 9,560Overnight and at call money market loans 26 112 26 112Acceptance of finance 33,137 36,191 33,137 36,191Term loans:1
Housing 323,940 298,967 323,912 298,931Housing – line of credit 27,097 29,565 27,097 29,565Total housing 351,037 328,532 351,009 328,496Non-housing 104,556 87,240 91,762 80,469
Finance leases1 5,458 4,976 2,428 3,011Margin lending 1,960 2,041 1,984 2,082Trade finance2 1,790 1,670 1,790 1,670Other 670 857 670 857Total Australia 511,255 474,144 495,427 465,413New ZealandOverdrafts 1,013 1,125 - -Credit card outstandings 1,255 1,201 - -Overnight and at call money market loans 1,400 1,230 - -Term loans:
Housing 35,465 33,389 - -Non-housing 18,888 18,242 - 21
Trade finance2 289 256 289 256Other 160 142 16 31Total New Zealand 58,470 55,585 305 308Other overseasOverdrafts 161 149 118 94Term loans:
Housing 881 885 335 357Non-housing 6,515 4,260 5,840 3,717
Trade finance2 6,147 4,706 6,146 4,706Other 87 77 22 18Total other overseas 13,791 10,077 12,461 8,892Total loans 583,516 539,806 508,193 474,613Provisions on loans (refer to Note 12) (3,173) (3,642) (2,589) (2,956)Total net loans3 580,343 536,164 505,604 471,657Net loans classification4
Loans – housing and personal 411,583 382,702 366,897 343,407Loans – business 168,760 153,462 138,707 128,250Total net loans3 580,343 536,164 505,604 471,657
1 Securitised loans are included in term loans and finance leases. Further detail on securitised assets is disclosed in Note 32. 2 Trade finance was previously presented as part of Other. Comparatives have been revised to conform to presentation with the current year. 3 Included in net loans is $9 billion (2013: $11 billion) of loans designated at fair value to reduce an accounting mismatch. The cumulative change in fair
value of the loans attributable to credit risk is a decrease of $62 million (2013: $98 million decrease) for the Group and Parent Entity. The change in fair value of loans attributable to credit risk recognised during the period is $36 million (2013: $27 million) for the Group and Parent Entity.
4 Loans – housing and personal include products of a retail nature including mortgages, personal loans, credit cards and customer overdrafts. Loans – business include corporate funding, working capital, trade and overdraft facilities.
2014 Westpac Group Annual Report 159

Note 11. Loans (continued) The following table shows loans presented based on their industry classification:
Consolidated2014 2013 2012 2011 2010
$m $m $m $m $mAustraliaAccommodation, cafes and restaurants 7,447 7,108 7,106 7,121 7,195Agriculture, forestry and fishing 7,224 7,304 7,549 7,790 7,797Construction 6,416 6,049 6,313 6,084 5,968Finance and insurance 14,644 13,259 13,101 15,925 13,643Government, administration and defence 784 881 930 781 806Manufacturing 9,269 9,415 10,663 11,339 10,958Mining 3,293 2,339 1,836 1,488 1,337Property, property services and business services 55,150 49,030 47,184 45,559 48,398Services1 10,874 9,715 9,467 8,936 9,408Trade2 15,616 14,619 15,868 16,094 16,240Transport and storage 9,330 8,868 9,351 6,677 7,351Utilities3 3,272 3,002 3,239 2,581 2,421Retail lending 365,822 340,139 328,109 316,777 301,150Other 2,114 2,416 2,298 1,330 1,282Total Australia 511,255 474,144 463,014 448,482 433,954OverseasAccommodation, cafes and restaurants 562 585 594 580 570Agriculture, forestry and fishing 6,938 6,506 5,345 4,975 4,699Construction 1,184 1,367 1,220 1,180 1,180Finance and insurance 3,880 2,960 2,406 1,998 1,886Government, administration and defence 389 639 533 464 474Manufacturing 4,026 3,319 3,682 2,925 2,143Mining 4,585 2,921 640 368 363Property, property services and business services 12,448 11,225 9,620 9,659 9,156Services1 2,486 2,651 2,174 2,149 2,026Trade2 4,617 5,014 4,411 4,047 3,289Transport and storage 1,730 1,528 1,589 1,928 1,800Utilities3 1,764 1,476 1,212 1,010 1,104Retail lending 27,462 25,363 21,766 20,723 19,574Other 190 108 73 166 148Total overseas 72,261 65,662 55,265 52,172 48,412Total loans 583,516 539,806 518,279 500,654 482,366Provisions on loans (3,173) (3,642) (3,834) (4,045) (4,711)Total net loans 580,343 536,164 514,445 496,609 477,655
1 Services includes education, health and community services, cultural and recreational services and personal and other services. 2 Trade includes wholesale trade and retail trade. 3 Utilities includes electricity, gas and water and communication services.
160 2014 Westpac Group Annual Report

Notes to the financial statements Note 11. Loans (continued) The following table shows the consolidated contractual maturity distribution of all loans by type of customer as at 30 September 2014:
2014Up to 1 Year 1 to 5 Years Over 5 Years Total
$m $m $m $mLoans by type of customer in AustraliaAccommodation, cafes and restaurants 2,501 4,174 772 7,447 Agriculture, forestry and fishing 2,718 3,638 868 7,224 Construction 1,431 3,483 1,502 6,416 Finance and insurance 4,581 6,313 3,750 14,644 Government, administration and defence 114 261 409 784 Manufacturing 3,556 4,438 1,275 9,269 Mining 451 1,823 1,019 3,293 Property, property services and business services 18,040 29,516 7,594 55,150 Services1 2,428 6,137 2,309 10,874 Trade2 5,876 7,645 2,095 15,616 Transport and storage 1,155 6,728 1,447 9,330 Utilities3 305 2,107 860 3,272 Retail lending 19,203 44,504 302,115 365,822 Other 955 799 360 2,114 Total Australia 63,314 121,566 326,375 511,255 Total overseas 21,271 14,131 36,859 72,261 Total loans 84,585 135,697 363,234 583,516
1 Services includes education, health and community services, cultural and recreational services and personal and other services. 2 Trade includes wholesale trade and retail trade. 3 Utilities includes electricity, gas and water and communication services.
Consolidated
Loans at Loans at Loans at Loans at Variable Fixed Variable Fixed
Interest Interest Interest Interest Rates Rates Total Rates Rates Total
$m $m $m $m $m $m Interest rate segmentation of Group loans maturing after one yearBy offices in Australia 353,625 94,316 447,941 332,738 75,804 408,542By offices overseas 16,244 34,746 50,990 18,079 29,130 47,209Total loans maturing after one year 369,869 129,062 498,931 350,817 104,934 455,751
2014 2013
2014 Westpac Group Annual Report 161

Note 11. Loans (continued) Loans include the following finance receivables:
Consolidated Parent Entity2014 2013 2014 2013
$m $m $m $mGross investment in finance leases, receivable:
Due within one year 904 737 416 409 Due after one year but not later than five years 5,039 4,742 2,059 2,739 Due after five years 689 647 312 358 Unearned future finance income on finance leases (958) (948) (327) (456)
Net investment in finance leases 5,674 5,178 2,460 3,050 Accumulated allowance for uncollectible minimum lease payments (26) (21) (9) (13) Net investment in finance leases after accumulated allowance 5,648 5,157 2,451 3,037 The net investment in finance leases may be analysed as follows:
Due within one year 868 705 402 395 Due after one year but not later than five years 4,305 4,026 1,822 2,393 Due after five years 501 447 236 262
Total net investment in finance leases 5,674 5,178 2,460 3,050
Note 12. Provisions for impairment charges
Consolidated Parent Entity2014 2013 2012 2014 2013
$m $m $m $m $mCollectively assessed provisionsBalance as at beginning of the year 2,585 2,771 2,953 2,107 2,336 Provisions raised/(released) 505 290 342 457 181 Write-offs (702) (708) (756) (585) (581) Interest adjustment 189 196 229 151 162 Exchange rate and other adjustments 37 36 3 18 9 Balance as at end of the year 2,614 2,585 2,771 2,148 2,107 Individually assessed provisionsBalance as at beginning of the year 1,364 1,470 1,461 1,123 1,227 Provisions raised 684 1,112 1,442 550 946 Write-backs (433) (479) (468) (373) (412) Write-offs (706) (691) (952) (532) (571) Interest adjustment (34) (75) (38) (36) (78) Exchange rate and other adjustments (8) 27 25 (13) 11 Balance as at end of the year 867 1,364 1,470 719 1,123 Total provisions for impairment charges on loans and credit commitments 3,481 3,949 4,241 2,867 3,230 Less provisions for credit commitments (refer to Note 20) (308) (307) (407) (278) (274) Total provisions for impairment charges on loans 3,173 3,642 3,834 2,589 2,956
Consolidated Parent Entity2014 2013 2012 2014 2013
$m $m $m $m $mReconciliation of impairment chargesIndividually assessed provisions raised 684 1,112 1,442 550 946 Write-backs (433) (479) (468) (373) (412) Recoveries (106) (76) (104) (73) (53) Collectively assessed provisions raised/(released) 505 290 342 457 181 Impairment charges 650 847 1,212 561 662
162 2014 Westpac Group Annual Report

Notes to the financial statements Note 12. Provisions for impairment charges (continued) The following table presents provisions for impairment charges on loans by industry classification for the past five years:
Consolidated2014 2013 2012 2011 2010
$m % $m % $m % $m % $m %Individually assessed provisions by industryAustraliaAccommodation, cafes and restaurants 47 1.4 59 1.5 53 1.2 45 1.0 44 0.9 Agriculture, forestry and fishing 47 1.4 80 2.0 46 1.1 28 0.6 27 0.5 Construction 61 1.8 66 1.7 73 1.7 63 1.4 32 0.6 Finance and insurance 24 0.7 24 0.6 38 0.9 58 1.3 60 1.2 Manufacturing 36 1.0 108 2.7 116 2.7 90 2.0 143 2.8 Mining 15 0.4 4 0.1 2 0.1 2 - 31 0.6 Property, property services and business services 283 8.1 428 10.9 518 12.2 559 12.7 595 11.8 Services1 32 0.9 48 1.2 121 2.9 96 2.2 51 1.0 Trade2 70 2.0 116 2.9 87 2.1 97 2.2 47 0.9 Transport and storage 12 0.3 45 1.1 47 1.1 38 0.9 80 1.6 Utilities3 2 0.1 29 0.8 22 0.5 23 0.5 27 0.5 Retail lending 60 1.7 76 1.9 67 1.6 74 1.7 137 2.7 Other 2 0.1 6 0.2 7 0.2 7 0.2 26 0.5 Total Australia 691 19.9 1,089 27.6 1,197 28.3 1,180 26.7 1,300 25.6 New ZealandAccommodation, cafes and restaurants - - 1 - 5 0.1 2 - 2 - Agriculture, forestry and fishing 6 0.2 17 0.4 20 0.5 20 0.5 46 0.9 Construction 1 - 6 0.2 2 0.1 4 0.1 2 - Finance and insurance - - 9 0.2 9 0.2 3 0.1 1 - Manufacturing 33 0.9 6 0.2 16 0.4 29 0.7 10 0.2 Mining 36 1.0 37 0.9 - - 1 - - - Property, property services and business services 38 1.1 71 1.8 116 2.7 112 2.5 143 2.9 Services1 1 - 40 1.0 35 0.8 6 0.1 5 0.1 Trade2 2 0.1 2 0.1 3 0.1 7 0.2 13 0.3 Transport and storage 1 - - - - - - - - - Utilities3 - - 1 - - - - - 12 0.2 Retail lending 10 0.3 17 0.4 14 0.3 27 0.6 36 0.8 Total New Zealand 128 3.6 207 5.2 220 5.2 211 4.8 270 5.4 Other overseasAccommodation, cafes and restaurants 7 0.2 4 0.1 2 0.1 2 - 1 - Agriculture, forestry and fishing 2 0.1 3 0.1 2 0.1 - - 1 - Construction 1 - 2 0.1 7 0.2 - - - - Finance and insurance 20 0.6 33 0.7 23 0.5 17 0.6 - - Manufacturing 1 - 2 0.1 2 - 2 - - - Mining 1 - - - - - - - - - Property, property services and business services 2 0.1 13 0.2 9 0.2 19 0.4 6 0.1 Services1 1 - 3 0.1 2 - 1 - 16 0.3 Trade2 4 0.1 4 0.1 1 - 2 - - - Transport and storage 6 0.2 2 0.1 1 - 17 0.4 19 0.4 Retail lending 3 0.1 2 0.1 4 0.1 10 0.2 9 0.2 Total other overseas 48 1.4 68 1.7 53 1.2 70 1.6 52 1.0 Total overseas 176 5.0 275 6.9 273 6.4 281 6.4 322 6.4 Total individually assessed provisions 867 24.9 1,364 34.5 1,470 34.7 1,461 33.1 1,622 32.0 Total collectively assessed provisions 2,614 75.1 2,585 65.5 2,771 65.3 2,953 66.9 3,439 68.0 Total provisions for impairment charges and credit commitments 3,481 100.0 3,949 100.0 4,241 100.0 4,414 100.0 5,061 100.0
1 Services includes education, health and community services, cultural and recreational services and personal and other services. 2 Trade includes wholesale trade and retail trade. 3 Utilities includes electricity, gas and water and communication services.
2014 Westpac Group Annual Report 163

Note 12. Provisions for impairment charges (continued) The following table shows details of loan write-offs by industry classifications for the past five years:
Consolidated2014 2013 2012 2011 2010
$m $m $m $m $mWrite-offsAustraliaAccommodation, cafes and restaurants (26) (31) (24) (34) (47) Agriculture, forestry and fishing (60) (30) (11) (23) (9) Construction (37) (46) (106) (27) (68) Finance and insurance (10) (14) (11) (5) (30) Manufacturing (85) (50) (45) (134) (45) Mining (4) (5) (1) (15) (14) Property, property services and business services (232) (340) (453) (507) (272) Services1 (22) (58) (41) (28) (32) Trade2 (70) (69) (53) (57) (51) Transport and storage (43) (18) (37) (60) (25) Utilities3 (3) (2) (33) (7) (4) Retail lending (603) (545) (597) (661) (566) Other (14) (9) (11) (21) (39) Total Australia (1,209) (1,217) (1,423) (1,579) (1,202) New ZealandAccommodation, cafes and restaurants (2) (1) (2) (3) (2) Agriculture, forestry and fishing (10) (7) (23) (59) (4) Construction (5) (4) (9) (24) (4) Finance and insurance (10) (13) (2) (1) (1) Manufacturing (1) (3) (17) (12) (15) Mining (10) - (1) - - Property, property services and business services (41) (94) (105) (126) (29) Services1 (37) (5) (5) (4) (4) Trade2 (3) (4) (3) (15) (3) Transport and storage - (1) (1) - (2) Utilities3 - - - (13) - Retail lending (49) (46) (59) (84) (79) Other - - (1) (1) (3) Total New Zealand (168) (178) (228) (342) (146) Other overseasAccommodation, cafes and restaurants (3) (1) (3) - - Agriculture, forestry and fishing - - (1) - - Construction - - (3) - - Finance and insurance (16) - (12) - - Manufacturing (1) (2) (1) (3) - Property, property services and business services - - (7) (1) (3) Services1 (3) (1) (2) - - Trade2 (3) - (2) - - Transport and storage (1) - (19) - - Utilities3 (2) - - - - Retail lending - - (7) - - Other (2) - - (2) - Total other overseas (31) (4) (57) (6) (3) Total write-offs (1,408) (1,399) (1,708) (1,927) (1,351) Write-offs in relation to:
Collectively assessed provisions (702) (708) (756) (739) (667) Individually assessed provisions (706) (691) (952) (1,188) (684)
Total write-offs (1,408) (1,399) (1,708) (1,927) (1,351) 1 Services includes education, health and community services, cultural and recreational services and personal and other services. 2 Trade includes wholesale trade and retail trade. 3 Utilities includes electricity, gas and water and communication services.
164 2014 Westpac Group Annual Report

Notes to the financial statements Note 12. Provisions for impairment charges (continued) The following table shows details of recoveries of loans by industry classifications for the past five years:
Consolidated2014 2013 2012 2011 2010
$m $m $m $m $mRecoveriesAustraliaAccommodation, cafes and restaurants - 1 - - 1 Agriculture, forestry and fishing - 1 - - - Construction 2 1 1 - 2 Finance and insurance 8 3 2 - - Manufacturing 3 8 5 - 2 Property, property services and business services 12 11 23 9 3 Services1 - - 1 - 1 Trade2 1 1 1 - 1 Transport and storage - 1 1 - 1 Utilities3 2 - - - - Retail lending 62 41 61 46 31 Other 2 - 1 - 2 Total Australia 92 68 96 55 44 Total New Zealand 14 8 8 5 4 Total other overseas - - - - 3 Total recoveries 106 76 104 60 51 Total write-offs (1,408) (1,399) (1,708) (1,927) (1,351) Net write-offs and recoveries (1,302) (1,323) (1,604) (1,867) (1,300)
1 Services includes education, health and community services, cultural and recreational services and personal and other services. 2 Trade includes wholesale trade and retail trade. 3 Utilities includes electricity, gas and water and communication services.
2014 Westpac Group Annual Report 165

Note 13. Property, plant and equipment
Consolidated Parent Entity2014 2013 2014 2013
$m $m $m $mPremises and sitesCost 381 320 212 208 Accumulated depreciation (153) (138) (64) (51) Net carrying amount 228 182 148 157 Leasehold improvementsCost 1,206 1,138 1,012 886 Accumulated amortisation (629) (586) (547) (456) Net carrying amount 577 552 465 430 Furniture and equipmentCost 748 737 591 521 Accumulated depreciation (558) (563) (438) (379) Net carrying amount 190 174 153 142 TechnologyCost 751 569 473 301 Accumulated depreciation (383) (303) (147) (59) Net carrying amount 368 266 326 242 Assets under leaseCost 129 - 22 - Accumulated depreciation (40) - (1) - Net carrying amount 89 - 21 - Total property, plant and equipment 1,452 1,174 1,113 971
166 2014 Westpac Group Annual Report

Notes to the financial statements Note 13. Property, plant and equipment (continued) Reconciliations of the carrying amount for each class of property, plant and equipment are set out below:
Consolidated Parent Entity2014 2013 2014 2013
$m $m $m $mPremises and sitesBalance as at beginning of the year 182 223 157 199 Additions 56 4 - 2 Disposals (1) (1) (1) (1) Depreciation (10) (13) (9) (12) Exchange rate adjustments 1 - - 1 Other1 - (31) 1 (32) Balance as at end of the year 228 182 148 157 Leasehold improvementsBalance as at beginning of the year 552 517 430 413 Additions 137 103 126 78 Disposals (1) (2) - (1) Amortisation (109) (108) (92) (94) Exchange rate adjustments 1 9 - 1 Other1 (3) 33 1 33 Balance as at end of the year 577 552 465 430 Furniture and equipmentBalance as at beginning of the year 174 182 142 155 Additions 82 53 67 41 Disposals (3) (1) (2) (1) Depreciation (64) (62) (54) (54) Exchange rate adjustments 1 2 - 1 Balance as at end of the year 190 174 153 142 TechnologyBalance as at beginning of the year 266 215 242 193 Additions 213 144 182 130 Disposals (7) (2) (7) (2) Depreciation (105) (90) (91) (78) Impairments - (4) - (4) Exchange rate adjustments 1 1 - 1 Other - 2 - 2 Balance as at end of the year 368 266 326 242 Assets under leaseAddition through business combinations2 80 - - - Additions 27 - 22 - Disposals (5) - - - Depreciation (16) - (1) - Other 3 - - - Balance as at end of the year 89 - 21 -
1 During the previous financial year, assets were reclassified from premises and sites to leasehold improvements. 2 Attributable to the acquisition of select businesses of Lloyds Banking Group.
2014 Westpac Group Annual Report 167

Note 14. Deferred tax assets and deferred tax liabilities Deferred tax assets
Consolidated Parent Entity2014 2013 2014 2013
$m $m $m $mThe balance comprises temporary differences attributable to:Amounts recognised in income statementsProvisions for impairment charges on loans 926 1,064 756 860 Provision for employee benefits 311 308 271 267 Treasury/financial market products 180 150 163 145 Property, plant and equipment 227 217 217 205 Provision for litigation and non-lending losses 5 8 4 7 Provision for credit commitments 78 79 78 79 Provision for restructuring 6 16 6 16 Provision for lease liabilities 34 31 27 26 Other provisions 61 50 54 44 Other liabilities 340 572 324 560
2,168 2,495 1,900 2,209 Amounts recognised directly in other comprehensive incomeAvailable-for-sale securities (55) (4) (35) 13 Retirement benefit deficit 113 93 113 93
58 89 78 106 Set-off of deferred tax liabilities pursuant to set-off provisions1 (829) (811) (656) (683) Net deferred tax assets 1,397 1,773 1,322 1,632 Net deferred tax assets to be recovered within 12 months 376 516 349 477 Net deferred tax assets to be recovered after more than 12 months 1,021 1,257 973 1,155 MovementOpening balance as at beginning of the year 1,773 2,176 1,632 2,032 Credited to income statements 484 499 374 369 Recognised in other comprehensive income (31) (91) (28) (86) Set-off of deferred tax liabilities pursuant to set-off provisions1 (829) (811) (656) (683) Closing balance as at end of the year 1,397 1,773 1,322 1,632
1 Deferred tax assets and liabilities are set-off where they relate to income tax levied by the same taxation authority on either the same taxable entity or different taxable entities within the same taxable group.
168 2014 Westpac Group Annual Report

Notes to the financial statements Note 14. Deferred tax assets and deferred tax liabilities (continued) Unrecognised deferred tax assets Deferred tax assets have not been recognised in respect of these items because it is not considered probable that future taxable profit will be available against which they can be realised.
Consolidated Parent Entity 2014 2013 2014 2013 $m $m $m $m
Tax losses on revenue account 82 81 73 76
Deferred tax liabilities
Consolidated Parent Entity2014 2013 2014 2013
$m $m $m $mThe balance comprises temporary differences attributable to:Amounts recognised in income statementsTreasury/financial market products 135 100 156 121 Finance lease transactions 142 117 34 20 Property, plant and equipment 223 166 217 168 Life insurance assets 53 19 - - Other assets 262 315 185 265
815 717 592 574 Amounts recognised directly in other comprehensive incomeCash flow hedges 69 116 64 109
69 116 64 109 Set-off of deferred tax liabilities pursuant to set-off provisions1 (829) (811) (656) (683) Net deferred tax liabilities 55 22 - - Net deferred tax liabilities to be recovered within 12 months 24 10 - - Net deferred tax liabilities to be recovered after more than 12 months 31 12 - - MovementsOpening balance as at beginning of the year 22 33 - - Charged to income statements 909 887 701 781 Recognised in other comprehensive income (47) (87) (45) (98) Set-off of deferred tax assets pursuant to set-off provisions1 (829) (811) (656) (683) Closing balance as at end of the year 55 22 - -
1 Deferred tax assets and liabilities are set-off where they relate to the same taxation authority on either the same taxable entity or different entities within the same taxable group.
Deferred tax liabilities relating to aggregate temporary differences of $44 million (2013: $35 million) associated with investments in subsidiaries have not been recognised because the Parent Entity controls whether the liability will be incurred and it is satisfied that the liability will not be incurred in the foreseeable future.
2014 Westpac Group Annual Report 169

Note 15. Goodwill and other intangible assets
2014 2013 2014 2013$m $m $m $m
GoodwillBalance as at beginning of the year 8,868 8,797 6,653 6,653 Additions through business combination1 225 - - - Exchange rate and other adjustments 19 71 - - Balance as at end of the year 9,112 8,868 6,653 6,653 Computer softwareBalance as at beginning of the year 1,897 1,551 1,675 1,351 Additions 664 738 594 643 Impairment (28) (15) (28) (15) Amortisation (465) (388) (385) (321) Exchange rate adjustments 2 14 - 1 Other - (3) - 16 Balance as at end of the year 2,070 1,897 1,856 1,675 Cost 3,671 3,033 2,733 2,168 Accumulated amortisation (1,601) (1,136) (877) (493) Carrying amount 2,070 1,897 1,856 1,675 Brand namesBalance as at beginning of the year 670 670 636 636 Balance as at end of the year 670 670 636 636 Carrying amount 670 670 636 636 Core deposit intangiblesBalance as at beginning of the year 685 851 685 851 Amortisation (166) (166) (166) (166) Balance as at end of the year 519 685 519 685 Cost 1,494 1,494 1,279 1,279 Accumulated amortisation (975) (809) (760) (594) Carrying amount 519 685 519 685 Other intangible assetsBalance as at beginning of the year 221 265 76 118 Additions through business combination1 56 - - - Impairment (2) (3) - - Amortisation (49) (52) (25) (42) Exchange rate and other adjustments 9 11 - - Balance as at end of the year 235 221 51 76 Cost 622 557 226 226 Accumulated amortisation (387) (336) (175) (150) Carrying amount 235 221 51 76 Total goodwill and other intangible assets 12,606 12,341 9,715 9,725
1 Attributable to the acquisition of select businesses of Lloyds Banking Group. Further information is disclosed in Note 43.
170 2014 Westpac Group Annual Report

Notes to the financial statements Note 15. Goodwill and other intangible assets (continued) Goodwill has been allocated to the following Cash Generating Units (CGUs):
Consolidated Parent Entity2014 2013 2014 2013
$m $m $m $mWestpac Retail & Business Banking 980 980 980 980 St.George Banking Group1 4,689 4,464 4,351 4,351 Westpac Institutional Bank 487 487 487 487 BT Financial Group (Australia) 2,103 2,103 835 835 Hambro 249 232 - - New Zealand Retail Banking 459 457 - - BT New Zealand 12 12 - - Hastings 120 120 - - Bank of Tonga 13 13 - - Total goodwill 9,112 8,868 6,653 6,653
1 During 2014, $225 million of goodwill from acquisition of selected Lloyds Australian business has been allocated to St.George Banking Group CGU.
Impairment tests for goodwill To assess whether goodwill is impaired, the carrying amount of each CGU is compared to their recoverable amount determined on a value in use basis.
Key assumptions used in recoverable amount calculations The recoverable amount of each significant CGU is determined based on the Group’s projections of future pre-tax cash flows discounted by the Group’s after tax return on equity rate of 11.0% (2013: 11.0%), adjusted to a pre-tax rate of 15.7% for Australia, 15.3% for New Zealand and 13.8% for the United Kingdom (2013: 15.7% for Australia, 15.3% for New Zealand, 14.5% for the United Kingdom). All future cash flows are based on approved two year forecasts (2013: two years). All cash flows beyond the two year period have an assumed growth rate of zero for all significant CGUs for the purpose of goodwill impairment testing. The strategic business plan assumes certain economic conditions and business performance, which are considered appropriate as they are consistent with observable historical information and current market expectations of the future. The forecasts applied by management are not reliant on any one particular assumption and no impairment would arise in significant CGUs even if zero growth is achieved over the two year forecast period.
Sensitivity to changes in assumptions Management consider alternative key assumptions including, for example, increasing the discount rate by 1% or reducing future cash flows by 10%. Under these scenarios the recoverable amount of each significant CGU would continue to exceed its carrying value. This is illustrated in the table below:
Excess of Recoverable Amount over the Carrying ValueIncrease Decrease
Base Case Discount Rate by 1% Cash Flows by 10%2014 2013 2014 2013 2014 2013
$m $m $m $m $m $mWestpac Retail & Business Banking 13,332 9,917 11,492 8,341 10,766 7,712St.George Banking Group 2,694 1,639 1,558 658 1,111 268BT Financial Group (Australia) 4,114 2,834 3,448 2,268 3,189 2,046
2014 Westpac Group Annual Report 171

Note 16. Other assets
Consolidated Parent Entity2014 2013 2014 2013
$m $m $m $mAccrued interest receivable 1,258 1,194 1,065 1,018 Securities sold not delivered 2,768 1,416 2,765 1,383 Deferred expenditure 11 24 - 1 Deferred acquisition costs 129 126 - - Trade debtors 716 533 363 205 Prepayments 177 135 146 116 Accrued fees and commissions 210 164 95 66 Other 719 968 583 908 Total other assets 5,988 4,560 5,017 3,697
Note 17. Payables due to other financial institutions
Consolidated Parent Entity2014 2013 2014 2013
$m $m $m $mCash collateral 3,876 1,285 3,842 1,285Offshore central bank deposits 3,039 2,936 3,039 2,936Interbank borrowing 5,478 4,615 5,287 4,517Securities sold under agreements to repurchase1 6,243 - 6,243 -Total payables due to other financial institutions 18,636 8,836 18,411 8,738
1 Securities sold under agreements to repurchase are not derecognised from the balance sheet, as set out in Note 1(e)(ii). The carrying value of securities pledged under repurchase agreements for the Group and the Parent Entity is $8,099 million (2013: nil).
172 2014 Westpac Group Annual Report

Notes to the financial statements Note 18. Deposits and other borrowings
2014 2013 2014 2013$m $m $m $m
AustraliaCertificates of deposit 35,481 29,286 35,538 29,286At call and term depositsNon-interest bearing, repayable at call 25,773 20,464 25,773 20,464Other interest bearing:
At call 187,904 175,102 187,876 175,106Term 133,972 132,028 133,972 132,028
Total at call and term deposits 347,649 327,594 347,621 327,598Total Australia 383,130 356,880 383,159 356,884New ZealandCertificates of deposit 1,031 1,362 - -At call and term depositsNon-interest bearing, repayable at call 3,217 2,905 - -Other interest bearing:
At call 18,418 16,419 - -Term 22,500 22,104 - -
Total at call and term deposits 44,135 41,428 - -Total New Zealand 45,166 42,790 - -Other overseasCertificates of deposit 15,065 11,202 15,065 11,202At call and term depositsNon-interest bearing, repayable at call 914 766 355 294Other interest bearing:
At call 1,694 1,914 1,204 1,437Term 14,853 10,930 14,400 10,391
Total at call and term deposits 17,461 13,610 15,959 12,122Total other overseas 32,526 24,812 31,024 23,324Total deposits and other borrowings 460,822 424,482 414,183 380,208Deposits and other borrowings at fair value1 49,636 42,015 48,661 40,653Deposits and other borrowings at amortised cost 411,186 382,467 365,522 339,555Total deposits and other borrowings 460,822 424,482 414,183 380,208
Consolidated Parent Entity
1 The amount that would be contractually required to be paid at maturity to the holders of the financial liabilities designated at fair value through income
statement for the Group is $49,614 million (2013: $42,157 million) and for the Parent Entity is $48,632 million (2013: $40,801 million).
2014 Westpac Group Annual Report 173

Note 18. Deposits and other borrowings (continued) The following table shows average balances and average rates in each of the past three years for major categories of deposits:
Average Average Average Average Average AverageBalance Rate Balance Rate Balance Rate
$m % $m % $m %AustraliaNon-interest bearing 23,082 18,399 15,101Certificates of deposit 31,793 2.7% 29,352 3.1% 34,401 4.4%Other interest bearing at call 182,046 2.5% 162,748 3.1% 143,130 3.8%Other interest bearing term 128,546 3.5% 133,534 3.9% 124,881 5.1%Total Australia 365,467 344,033 317,513OverseasNon-interest bearing 3,926 3,345 2,875Certificates of deposit 15,717 0.5% 15,259 0.6% 18,478 0.6%Other interest bearing at call 20,354 3.1% 16,483 2.9% 14,260 2.7%Other interest bearing term 35,720 2.6% 29,300 2.9% 24,953 3.2%Total overseas 75,717 64,387 60,566
2014 2013 2012Consolidated
Certificates of deposit and term deposits All certificates of deposit issued by foreign offices were greater than US$100,000.
The maturity profile of certificates of deposit and term deposits greater than US$100,000 issued by Australian operations is set out below:
Between BetweenLess Than 3 and 6 Months Over3 Months 6 Months and 1 Year 1 Year Total
$m $m $m $m $mCertificates of deposit greater than US$100,000 28,464 6,719 170 128 35,481Term deposits greater than US$100,000 63,008 27,408 16,053 8,759 115,228
Consolidated 2014
Note 19. Other financial liabilities at fair value through income statement
2014 2013 2014 2013$m $m $m $m
Securities sold under agreements to repurchase1 17,277 7,967 17,196 7,967 Securities sold short 1,959 2,335 1,959 2,335 Total other financial liabilities at fair value through income statement 19,236 10,302 19,155 10,302
Consolidated Parent Entity
1 Securities sold under agreements to repurchase are not derecognised from the balance sheet, as set out in Note 1(e)(ii). The carrying value of
securities pledged under repurchase agreements for the Group is $17,879 million and for the Parent Entity is $17,798 million (2013: both Group and Parent Entity were $8,101 million).
The amount that would be contractually required to be paid at maturity to the holders of other financial liabilities at fair value for the Group is $19,111 million (2013: $10,277 million) and for the Parent Entity is $19,030 million (2013: $10,277 million).
174 2014 Westpac Group Annual Report

Notes to the financial statements Note 20. Provisions
2014 2013 2014 2013 $m $m $m $mLong service leave 357 340 328 311 Annual leave and other employee benefits 852 802 699 687 Litigation and non-lending losses 18 28 15 24 Provision for impairment on credit commitments (refer to Note 12) 308 307 278 274 Leasehold premises 62 46 62 46 Restructuring provisions 21 53 21 53 Total provisions 1,618 1,576 1,403 1,395
Consolidated Parent Entity
Annual Leave Litigation Provision forLong and Other and Non- Impairment
Service Employee Lending on Credit Leasehold RestructuringLeave Benefits Losses Commitments Premises Provisions Total
$m $m $m $m $m $m $mConsolidatedBalance as at beginning of the year 340 802 28 307 46 53 1,576Additions through business combination1 5 12 - - - - 17Additions 61 1,034 17 - 20 39 1,171Utilised (36) (987) (16) - (4) (69) (1,112)Unutilised reversed (13) (12) (11) - - (2) (38)Exchange differences - 3 - - - - 3Increase on unwinding of discount - - - 11 - - 11Other - - - (10) - - (10)Balance as at end of the year 357 852 18 308 62 21 1,618Parent EntityBalance as at beginning of the year 311 687 24 274 46 53 1,395Additions 62 870 14 - 20 39 1,005Utilised (32) (846) (12) - (4) (69) (963)Unutilised reversed (13) (12) (11) - - (2) (38)Increase on unwinding of discount - - - 10 - - 10Other - - - (6) - - (6)Balance as at end of the year 328 699 15 278 62 21 1,403
1 Attributable to the acquisition of select businesses of Lloyds Banking Group.
2014 Westpac Group Annual Report 175

Note 21. Other liabilities
2014 2013 2014 2013$m $m $m $m
Unearned general insurance premiums 341 347 - -Outstanding general insurance claims 225 234 - -Defined benefit deficit1 315 245 306 233Accrued interest payable 2,917 2,970 2,602 2,657Credit card loyalty program 299 328 - -Securities purchased not delivered 1,164 1,714 1,057 1,714Trade creditors and other accrued expenses 1,030 1,019 761 776Other 1,900 2,199 1,683 2,015Total other liabilities 8,191 9,056 6,409 7,395
Consolidated Parent Entity
1 Refer to Note 36 for more details.
Note 22. Debt issues Presented below are the Group and Parent Entity’s debt issues at 30 September 2014 and 2013. The distinction between short-term and long-term debt is based on the maturity of the underlying security at origination.
2014 2013 2014 2013$m $m $m $m
Debt issuesShort-term debt:
Own issuances 30,302 29,350 27,562 26,842Customer conduits1 1,418 1,772 - -Acceptances 101 102 101 102
Total short-term debt 31,821 31,224 27,663 26,944Long-term debt:
Covered bonds 26,168 18,140 23,167 16,229Senior 82,377 83,860 77,016 78,382Securitisation 11,277 10,372 - -Convertible notes 27 30 - -Structured notes 581 507 - -
Total long-term debt 120,430 112,909 100,183 94,611Total debt issues 152,251 144,133 127,846 121,555Debt issues at fair value2 9,542 14,140 6,315 11,151Debt issues at amortised cost 142,709 129,993 121,531 110,404Total debt issues 152,251 144,133 127,846 121,555
Consolidated Parent Entity
1 Further information on customer conduits is disclosed in Note 32. 2 The amount that would be contractually required to be paid at maturity to the holders of the financial liabilities designated at fair value through profit or
loss for the Group is $9,529 million (2013: $14,400 million) and for the Parent Entity is $6,324 million (2013: $11,422 million). Included in the carrying value of debt issues at fair value is a decrease for change in own credit spreads of $58 million (2013: $44 million) for the Group and Parent Entity.
176 2014 Westpac Group Annual Report

Notes to the financial statements Note 22. Debt issues (continued)
2014 2013$m $m
Short-term debtUS commercial paper 30,259 28,867Euro commercial paper (by currency):
EUR - 29GBP - 358USD - 54
Total euro commercial paper - 441Asset backed commercial paper (by currency):
AUD 1,301 1,048USD 117 724
Total asset backed commercial paper 1,418 1,772NZD promissory notes 43 42Acceptances 101 102Total short-term debt 31,821 31,224Long-term debt (by currency):
AUD 39,356 36,099CAD 798 723CHF 2,130 2,048EUR 20,522 15,876GBP 3,785 3,609HKD 655 751JPY 7,557 11,619NOK 589 560NZD 2,969 3,353SGD 128 166TRY 133 -USD 41,808 38,105
Total long-term debt 120,430 112,909
Consolidated
Consolidated(in $millions unless otherwise stated) 2014 2013 2012Short-term borrowingsUS commercial paperMaximum amount outstanding at any month end 35,173 35,727 43,842Approximate average amount outstanding 31,130 30,158 35,969Approximate weighted average interest rate on: Average amount outstanding 0.3% 0.4% 0.5% Outstanding as at end of the year 0.3% 0.4% 0.7%
2014 Westpac Group Annual Report 177

Note 23. Loan capital
2014 2013 2014 2013$m $m $m $m
Loan capitalSubordinated notes 5,974 4,886 5,974 4,886Subordinated perpetual notes 402 378 402 378Convertible debentures and Trust preferred securities 633 616 633 616Stapled preferred securities - 906 - 906Convertible preference shares 1,180 1,177 1,180 1,177Capital notes 2,669 1,367 2,669 1,367Total loan capital 10,858 9,330 10,858 9,330
Consolidated Parent Entity
Details of loan capital are as follows:
2014 2013 2014 2013$m $m $m $m
Basel III transitional subordinated notesUSD 75 million subordinated notes due 2015 89 88 89 88USD 400 million subordinated notes due 2015 476 450 476 450USD 350 million subordinated notes due 2018 436 421 436 421AUD 500 million subordinated notes due 2022 500 499 500 499AUD 1,676 million subordinated notes due 2022 1,667 1,664 1,667 1,664USD 800 million subordinated notes due 2023 898 848 898 848
Basel III fully compliant subordinated notesAUD 925 million subordinated notes due 2023 916 916 916 916AUD 1,000 million subordinated notes due 2024 992 - 992 -Total subordinated notes 5,974 4,886 5,974 4,886
Consolidated Parent Entity
Basel III fully compliant subordinated notes Subordinated notes qualify as Tier 2 capital of Westpac under APRA’s Basel III capital adequacy framework. Westpac may be required to convert some or all subordinated notes into a variable number of Westpac ordinary shares upon the occurrence of a non-viability trigger event. A non-viability trigger event will occur if APRA determines Westpac is, or would become, non-viable. For each subordinated note, holders will receive a number of Westpac ordinary shares calculated using the formula described in the terms and conditions of the subordinated notes, but subject to a maximum conversion number. The maximum conversion number is set using a Westpac ordinary share price which is broadly equivalent to 20% of the Westpac ordinary share price at the time of issue of the subordinated notes. The price at which Westpac ordinary shares will be issued is based on the Westpac ordinary share price determined over the five business day period prior to the non-viability trigger event and includes a 1% discount.
If Westpac is unable to convert the subordinated notes for any reason, holder’s rights in relation to the notes will be terminated.
178 2014 Westpac Group Annual Report

Notes to the financial statements Note 23. Loan capital (continued) Further details regarding Basel III fully compliant subordinated notes which have been issued by Westpac are as follows:
AUD925 million Westpac SN II due 2023 Westpac issued 9,252,850 Westpac Subordinated Notes II (Westpac SN II) at a face value of $100 each on 22 August 2013. Westpac SN II are expected to pay non-discretionary, cumulative, floating rate quarterly interest payments (22 February, 22 May, 22 August and 22 November) subject to Westpac being solvent at the time of the interest payment and immediately following the interest payment. The interest rate is calculated as the Australian 90-day bank bill rate plus the margin of 2.30% per annum. If Westpac SN II are converted into Westpac ordinary shares upon the occurrence of a non-viability trigger event, the maximum conversion number is 16.1551 Westpac ordinary shares per Westpac SN II.
AUD1,000 million Westpac subordinated notes due 2024 Westpac issued 10,000 Westpac subordinated notes at a face value of $100,000 each on 14 March 2014. Westpac subordinated notes are expected to pay non-discretionary, cumulative, floating rate quarterly interest payments (14 March, 14 June, 14 September and 14 December) subject to Westpac being solvent at the time of the interest payment and immediately following the interest payment. The interest rate is calculated as the Australian 90-day bank bill rate plus the margin of 2.05% per annum. If Westpac subordinated notes are converted into Westpac ordinary shares upon the occurrence of a non-viability trigger event, the maximum conversion number is 14,938.75112 Westpac ordinary shares per Westpac subordinated note.
2014 2013 2014 2013$m $m $m $m
Subordinated perpetual notesUS$352.1million (2013: US$352.1 million) subordinated perpetualfloating rate notes 402 378 402 378
Convertible debentures and Trust preferred securitiesConvertible debentures issued on 5 April 2004 US$525,000,000 - - 633 616525,000 2004 TPS of US$1,000 each 633 616 - -Total convertible debentures and Trust preferred securities 633 616 633 616
Stapled preferred securities9,083,278 Westpac SPS II of A$100 each - 906 - 906
Convertible preference shares11,893,605 Westpac CPS of A$100 each 1,180 1,177 1,180 1,177
Convertible notes13,835,690 Westpac CN of A$100 each 1,369 1,367 1,369 1,36713,105,705 Westpac CN 2 of A$100 each 1,300 - 1,300 -Total convertible notes 2,669 1,367 2,669 1,367
Parent EntityConsolidated
Subordinated perpetual notes These notes have no final maturity but may, subject to the approval of APRA and subject to certain other conditions, be redeemed at par at the option of Westpac. Interest is cumulative and is payable on the notes semi-annually, subject to Westpac being solvent immediately after making the payment and having paid any dividend on any class of share capital of Westpac within the prior 12 month period. The notes qualify for transitional treatment as Tier 2 capital of Westpac under APRA’s Basel III capital adequacy framework.
The rights of the noteholders and coupon holders are subordinated to the claims of all creditors (including depositors) of Westpac other than those creditors whose claims against Westpac are expressed to rank equally with or after the claims of the noteholders and coupon holders.
Convertible debentures and 2004 TPS A wholly owned entity Westpac Capital Trust IV (Capital Trust IV) issued 525,000 2004 TPS in the United States of America at US$1,000 each on 5 April 2004, with non-cumulative semi-annual distributions (31 March and 30 September) in arrears at the annual rate of 5.256% up to but excluding 31 March 2016. From, and including 31 March 2016 the 2004 TPS will pay non-cumulative quarterly distributions (30 June, 30 September, 31 December and 31 March) in arrears at a floating rate equal to the London InterBank Offer Rate (LIBOR) plus 1.7675% per year. Capital Trust IV has also issued common securities with a total price of US$1,000 to Westpac Capital Holdings Inc. 2004 TPS qualify for transitional treatment as Additional Tier 1 capital of Westpac under APRA’s Basel III capital adequacy framework.
2014 Westpac Group Annual Report 179

Note 23. Loan capital (continued) The sole assets of the Capital Trust IV comprise 525,001 2004 Funding TPS issued by a wholly owned entity, Tavarua Funding Trust IV (Funding Trust IV) totalling US$525,001,000. The 2004 Funding TPS have an issue price of US$1,000 each with non-cumulative semi-annual distributions in arrears at the annual rate of 5.256% up to but excluding 31 March 2016. From and including 31 March 2016, the 2004 Funding TPS will pay non-cumulative quarterly distributions (30 June, 30 September, 31 December and 31 March) in arrears at a floating rate equal to LIBOR plus 1.7675% per year.
Funding Trust IV has issued common securities with a total price of US$1,000 to Westpac. The assets of Funding Trust IV comprise convertible debentures issued by Westpac in aggregate amount of US$525,001,000 and US Government securities purchased with the proceeds of the common securities.
The convertible debentures are unsecured, junior subordinated obligations of Westpac and will rank subordinate and junior in right of payment of principal and distributions to Westpac’s obligations to its depositors and creditors.
The convertible debentures will only pay distributions to the extent they are declared by the Board of Directors of Westpac, or an authorised committee of the Board. Any distribution is subject to the satisfaction that no deferral conditions exist. If certain deferral conditions exist a distribution is not permitted to be declared unless approved by APRA.
Westpac has guaranteed, on a subordinated basis, the payment in full of distributions or redemption amounts, the delivery of ADRs and other payments on the 2004 TPS and the 2004 Funding TPS to the extent that the Capital Trust IV and the Funding Trust IV have funds available.
Conversion The convertible debentures have no stated maturity, but will automatically convert into American Depositary Receipts (ADRs) each representing 40 Westpac preference shares (non-cumulative preference shares in Westpac with a liquidation amount of US$25) on 31 March 2053, or earlier in the event that a distribution is not made or certain other events occur. Upon issue the amount paid up on each Westpac preference share will be deemed to be US$25. The 2004 TPS will then be redeemed for ADRs. The dividend payment dates and distribution rates on Westpac preference shares will be the same as those otherwise applicable to 2004 TPS.
The holders of the ADRs will, in certain circumstances, have the right to convert their Westpac preference shares represented by ADRs into a variable number of Westpac ordinary shares on 31 March 2054 by giving notice to Westpac. For each preference share converted, holders will receive a number of Westpac ordinary shares calculated using the formula described in the preference share terms. The price at which Westpac ordinary shares will be issued is based on the Westpac ordinary share price determined over the 20 trading day period prior to the optional conversion date and includes a 5% discount.
Redemption With the prior written consent of APRA, if required, Westpac may elect to redeem the convertible debentures for cash before 31 March 2016 in whole upon the occurrence of certain specific events, and in whole or in part on 31 March 2016 or any distribution date thereafter. The proceeds received by Funding Trust IV from the redemption of the convertible debentures must be used to redeem the 2004 Funding TPS and ultimately the 2004 TPS. The redemption price of the 2004 TPS will equal US$1,000 per 2004 TPS plus the accrued and unpaid distribution for the then current semi-annual or quarterly period to the date of redemption or, if the date of redemption is a distribution date, the accrued and unpaid distribution for the most recent semi-annual or quarterly period.
The holders of the convertible debentures, 2004 Funding TPS and 2004 TPS do not have an option to require redemption of these instruments.
Westpac SPS II Westpac issued 9,083,278 Westpac SPS II at a face value of $100 each on 31 March 2009. Westpac SPS II were stapled securities, each consisting of a perpetual, unsecured, non-cumulative subordinated note issued by Westpac’s New York branch stapled to a preference share issued by Westpac.
On 18 June 2014, $529 million of Westpac SPS II were bought back on-market and subsequently cancelled. All remaining Westpac SPS II were transferred to a nominated third party on 30 September 2014 and were subsequently bought back off-market by Westpac and cancelled.
Westpac CPS Westpac issued 11,893,605 Westpac Convertible Preference Shares (Westpac CPS) at a face value of $100 each on 23 March 2012. Westpac CPS are fully paid, perpetual, non-cumulative, convertible, unguaranteed and unsecured preference shares which rank in priority to ordinary shares. Westpac CPS qualify for transitional treatment as Additional Tier 1 capital of Westpac under APRA’s Basel III capital adequacy framework.
180 2014 Westpac Group Annual Report

Notes to the financial statements Note 23. Loan capital (continued) Westpac CPS are expected to pay preferred, non-cumulative, floating rate semi-annual dividends (30 September and 31 March) which are expected to be fully franked. The dividend rate is calculated as the Australian 180-day bank bill rate per annum plus the margin of 3.25% per annum, together multiplied by one minus the Australian corporate tax rate (30% during the year ended 30 September 2014). Westpac CPS dividends are discretionary and only payable subject to a dividend payment test, being that dividends will not be paid if the Westpac directors determine not to pay a dividend, the dividend payment exceeds the distributable profits of Westpac (unless APRA otherwise gives its prior written approval), or APRA objects to the payment of the dividend.
Westpac CPS rank for payment in a winding up of Westpac ahead of ordinary shares and equally with equal ranking capital securities but are subordinated to claims of Westpac deposit holders and other senior creditors. Holders of Westpac CPS are entitled to vote at a general meeting of Westpac in limited circumstances only.
Scheduled conversion On the scheduled conversion date, it is expected that the Westpac CPS will either be converted into a variable number of Westpac ordinary shares provided certain conversion conditions are satisfied, or transferred to a nominated party at the election of Westpac for cash equal to their face value. The scheduled conversion date will be the earlier of 31 March 2020 and the first dividend payment date after 31 March 2020 on which the conversion conditions are satisfied. For each Westpac CPS converted, holders will receive a number of Westpac ordinary shares calculated using the formula described in the Westpac CPS terms. The price at which Westpac ordinary shares will be issued is based on the Westpac ordinary share price determined over the 20 business day period prior to the scheduled conversion date and includes a 1% discount. If Westpac CPS are not converted or transferred on the initial scheduled conversion date, they will remain on issue and may either be converted or transferred on the next dividend payment date, providing the conversion conditions are satisfied.
Early conversion The Westpac CPS will be converted earlier upon a capital trigger event. A capital trigger event will occur when Westpac’s Common Equity Tier 1 Capital ratio is equal to or less than 5.125% (on a level 2 basis1). Westpac must convert all Westpac CPS into a variable number of ordinary shares following a capital trigger event. No conversion conditions apply in these circumstances. For each Westpac CPS, holders will receive a number of Westpac ordinary shares calculated using the formula described in the Westpac CPS terms, but subject to a maximum conversion number, which is 24.0038 Westpac ordinary shares. The maximum conversion number is set using a Westpac ordinary share price which is broadly equivalent to 20% of the Westpac ordinary share price at the time of issue. For each Westpac CPS, holders will receive a number of Westpac ordinary shares as described above under ‘Scheduled conversion’, except that the price at which Westpac ordinary shares will be issued is based on the Westpac ordinary share price determined over a five business day period prior the capital trigger event.
Conversion may also occur early following an acquisition event, on broadly similar terms to scheduled conversion, described above.
In certain other limited circumstances (such as for tax, regulatory or change of control reasons) Westpac may elect to convert, transfer or redeem Westpac CPS. Conversion or redemption at Westpac’s election are subject to APRA’s prior written approval and, in respect of conversion, to satisfaction of the conversion conditions.
Westpac CN and Westpac CN 2 Westpac issued 13,835,690 Westpac Capital Notes (Westpac CN) at a face value of $100 each on 8 March 2013 and 13,105,705 Westpac Capital Notes 2 (Westpac CN 2) at a face value of $100 each on 23 June 2014. Westpac CN and Westpac CN 2 are fully paid, perpetual, non-cumulative, convertible, transferrable, redeemable, subordinated and unsecured notes which rank in priority to ordinary shares and equally with equal ranking capital securities but behind all senior creditors and depositors. Westpac CN and Westpac CN 2 qualify as Additional Tier 1 capital of Westpac under APRA’s Basel III capital adequacy framework.
Westpac CN are expected to pay non-cumulative, floating rate quarterly distributions (8 March, 8 June, 8 September and 8 December) which are expected to be fully franked. The distribution rate on Westpac CN is calculated as the Australian 90-day bank bill rate plus the margin of 3.20% per annum, together multiplied by one minus the Australian corporate tax rate (30% during the year ended 30 September 2014).
Westpac CN 2 are expected to pay non-cumulative, floating rate quarterly distributions (23 March, 23 June, 23 September and 23 December) which are expected to be fully franked. The distribution rate on Westpac CN 2 is calculated as the Australian 90-day bank bill rate plus the margin of 3.05% per annum, together multiplied by one minus the Australian corporate tax rate (30% during the year ended 30 September 2014).
1 Level 1 comprises Westpac Banking Corporation and its subsidiary entities that have been approved by APRA as being part of a single ‘Extended Licenced Entity’ for the purposes of measuring capital adequacy. Level 2 includes all subsidiary entities except those entities specifically excluded by APRA regulations for the purposes of measuring capital adequacy.
2014 Westpac Group Annual Report 181

Note 23. Loan capital (continued) Distributions on Westpac CN and Westpac CN 2 are discretionary, and are only payable subject to satisfaction of the distribution payment conditions, being Westpac’s absolute discretion; the distribution payment not resulting in a breach of Westpac’s capital requirements under APRA’s prudential standards; the distribution payment not resulting in Westpac becoming, or likely to become, insolvent; and APRA not otherwise objecting to the payment of the distribution.
In the event of a winding-up, and assuming Westpac CN and Westpac CN 2 remain on issue and have not been converted or otherwise had their rights terminated following a capital trigger event or non-viability trigger event, Westpac CN and Westpac CN 2 rank in priority to ordinary shares and equally with equal ranking capital securities but behind all senior creditors (including depositors and all holders of Westpac’s senior or less subordinated debt). If conversion occurs prior to a winding-up, Westpac CN and Westpac CN 2 holders will hold ordinary shares and rank equally with other holders of ordinary shares.
Westpac may redeem or transfer the Westpac CN on 8 March 2019 and Westpac CN 2 on 23 September 2022, being the optional redemption or transfer dates. In certain other limited circumstances (such as for tax and regulatory reasons) Westpac may elect to redeem Westpac CN or Westpac CN 2. Redemptions at Westpac’s election are subject to APRA’s prior written approval.
The Westpac CN and Westpac CN 2 convert into Westpac ordinary shares in the following circumstances:
Scheduled conversion On 8 March 2021 (in respect of Westpac CN) and 23 September 2024 (in respect of Westpac CN 2), it is expected Westpac CN and Westpac CN 2 will be converted into a variable number of Westpac ordinary shares, provided certain conversion conditions are satisfied. For each Westpac CN and Westpac CN 2, holders will receive a number of Westpac ordinary shares calculated using the formula described in the Westpac CN terms and Westpac CN 2 terms. The price at which Westpac ordinary shares will be issued is based on the share price determined over the 20 business day period prior to the scheduled conversion date and includes a 1% discount. If the Westpac CN and Westpac CN 2 conversion conditions are not satisfied conversion will not occur and conversion will occur on the next distribution payment date, provided the conversion conditions are satisfied.
Early conversion The Westpac CN and Westpac CN 2 will be converted earlier upon a capital trigger event or non-viability trigger event. A capital trigger event will occur when Westpac’s Common Equity Tier 1 Capital ratio is equal to or less than 5.125% (on a level 1 or level 2 basis1). A non-viability trigger event will occur if APRA determines Westpac is, or would become, non-viable. No conversion conditions apply in these circumstances. For each Westpac CN and Westpac CN 2, holders will receive a number of Westpac ordinary shares calculated using the formula described in the Westpac CN terms and Westpac CN 2 terms, but subject to a maximum conversion number, which is 16.7280 Westpac ordinary shares per Westpac CN and 14.5476 Westpac ordinary shares per Westpac CN 2. For each Westpac CN and Westpac CN 2, the maximum conversion number is set using the face value divided by 20% of the Westpac ordinary share price at the time of issue. The price at which Westpac ordinary shares will be issued is based on the share price determined over the five business day period prior to the capital trigger event or non-viability trigger event. Following the occurrence of a capital trigger event or non-viability trigger event, if Westpac is unable to convert the Westpac CN and Westpac CN 2 for any reason within five business days, holder’s rights in relation to Westpac CN and Westpac CN 2 will be terminated.
Conversion of Westpac CN or Westpac CN 2 may also occur early following an acquisition event, on broadly similar terms to scheduled conversion, described above.
Westpac may elect to convert Westpac CN 2 on 23 September 2022, being the optional conversion date or in certain other limited circumstances (such as for tax or regulatory reasons) on broadly similar terms to scheduled conversion, described above.
Holders of Westpac CN and Westpac CN 2 have no right to vote at a general meeting of Westpac before conversion. Holders have certain voting rights which can be exercised at a meeting of holders.
1 Level 1 comprises Westpac Banking Corporation and its subsidiary entities that have been approved by APRA as being part of a single ‘Extended Licenced Entity’ for the purposes of measuring capital adequacy. Level 2 includes all subsidiary entities except those entities specifically excluded by APRA regulations for the purposes of measuring capital adequacy
182 2014 Westpac Group Annual Report

Notes to the financial statements Note 24. Shareholders’ equity and non-controlling interests
2014 2013 2014 2013$m $m $m $m
Contributed equityOrdinary shares 3,109,048,309 (2013: 3,109,048,309) each fully paid 26,943 27,021 26,943 27,021Restricted Share Plan (RSP) treasury shares 6,327,116 (2013: 7,855,661) (235) (176) (235) (176)Other treasury shares 5,121,966 (2013: 5,422,506) (69) (77) (4) (5)
(304) (253) (239) (181)Share capital 26,639 26,768 26,704 26,840Other equity instrumentsConvertible notes issued on 21 June 2006 A$762,737,500 (with net issue costs of A$8 million) - - 755 755Non-controlling interests1
Trust preferred securities 7,627,375 2006 TPS of A$100 each (with net issue costs of A$8 million) 755 755 - -Other 126 108 - -Total non-controlling interests 881 863 - -
Consolidated Parent Entity
1 Total distributions to Non-controlling interests were $48 million (2013: $50 million).
Ordinary shares In accordance with the Corporations Act Westpac does not have authorised capital and all ordinary shares issued have no par value.
Ordinary shares entitle the holder to participate in dividends as declared and in the event of winding up of Westpac, to participate in the proceeds in proportion to the number of and amounts paid on the shares held.
Ordinary shares entitle the holder to one vote per share, either in person or by proxy, at a meeting of Westpac shareholders.
During the year ended 30 September 2014, 36,837,785 existing ordinary shares were purchased:
the Dividend Reinvestment Plan (DRP) for the 2013 final and special dividends and 2014 interim dividend had no impact on the number of ordinary shares on issue as Westpac arranged for the purchase of the necessary shares from the market and transfer to participants, 30,782,829 ordinary shares at an average price of $33.21;
806,310 ordinary shares at an average price of $32.93 and delivered to eligible staff under the Employee Share Plan (ESP); 1,879,686 ordinary shares at an average price of $31.13 and allocated to employees under the RSP for nil consideration; 1,434,941 ordinary shares at an average price of $33.67 and delivered to employees upon the exercise of options under the
WPP at an average exercise price of $20.86; 401,170 ordinary shares at an average price of $33.22 and delivered to employees upon the exercise of share rights and
performance share rights under the WPP for nil consideration; 707,446 ordinary shares at an average price of $33.66 and delivered to employees upon the exercise of options under the
WRP at an average exercise price of $27.35; 666,890 ordinary shares at an average price of $32.54 and delivered to employees upon the exercise of share rights under
the WRP for nil consideration; 158,513 ordinary shares at an average price of $34.28 and delivered to CEO upon exercise of share rights under the
CEOPP for nil consideration; and the purchase of existing ordinary shares in respect of employee share plans resulted in a tax benefit of $12.3 million being
recognised as contributed equity. Restricted Share Plan treasury shares Ordinary shares allocated to eligible employees under the RSP are classified as treasury shares until unconditional ownership of the shares vest at the end of the restriction period.
Other treasury shares Other treasury shares includes ordinary shares held by statutory life funds and managed investment schemes and ordinary shares held by Westpac in respect of equity derivatives sold to customers.
During the year 99,342 treasury shares were purchased at an average price of $33.38 and 399,882 treasury shares were sold at an average price of $33.24.
2014 Westpac Group Annual Report 183

Note 24. Shareholders’ equity and non-controlling interests (continued) Convertible notes and 2006 TPS A Westpac controlled entity, Westpac TPS Trust, issued 7,627,375 2006 TPS in Australia at $100 each on 21 June 2006. The 2006 TPS are preferred units in the Westpac TPS Trust, with non-cumulative floating rate distributions which are expected to be fully franked. Westpac TPS Trust also issued one ordinary unit with an issue price of $100 to Westpac. Westpac, as holder of the ordinary unit, is entitled to any residual income or assets of the Westpac TPS Trust not distributed to holders of 2006 TPS. The principal assets of Westpac TPS Trust are 7,627,375 convertible notes (the notes) issued by Westpac in an aggregate amount of $762,737,500. The notes qualify for transitional treatment as Additional Tier 1 capital of Westpac under APRA’s Basel III capital adequacy framework.
The 2006 TPS are scheduled to pay quarterly distributions (30 September, 31 December, 31 March and 30 June) in arrears, subject to certain conditions being satisfied. The distribution rate on 2006 TPS, until 30 June 2016 (the step-up date), is calculated as the Australian 90 day bank bill rate plus 1% per annum (the initial margin), together multiplied by one minus the Australian corporate tax rate (30% during the year ended 30 September 2014). After the step-up date, the initial margin will increase by a one time step-up of 1% per annum.
Distributions on the 2006 TPS will only be made if Westpac pays interest on the notes and certain other conditions (which broadly correspond to the interest payment conditions on the notes) are satisfied. Interest on the notes is subject to an interest payment test and interest will not be paid if Westpac directors have not resolved to make the interest payment, the payment of interest exceeds distributable profits (unless APRA gives its prior approval) and APRA does not otherwise object to the payment. The interest payments on the notes are expected to exceed the aggregate amount of the distributions to be made on 2006 TPS. The excess will be distributed to Westpac, as holder of the ordinary unit in the Westpac TPS Trust, on each distribution payment date.
The notes are unsecured obligations of Westpac and rank subordinate and junior in right of payment of principal and interest to Westpac’s obligations to depositors and creditors, other than subordinated creditors holding subordinated indebtedness that is stated to rank equally with, or junior to the notes.
Conversion, exchange and redemption Westpac can redeem 2006 TPS for cash with APRA approval or convert into a variable number of Westpac ordinary shares calculated in accordance with the Westpac TPS terms, on the step-up date or any distribution payment date after the step-up date, for certain tax, regulatory or change of control reasons and in certain other circumstances. If Westpac elects to redeem 2006 TPS, holders will receive cash equal to their face value. If Westpac elects to convert 2006 TPS, for each 2006 TPS, holders will receive a number of ordinary shares calculated using the formula described in the 2006 TPS terms subject to a maximum conversion number which is 50 Westpac ordinary shares. The price at which Westpac ordinary shares will be issued is based on the Westpac ordinary share price determined over the 20 business day period prior to the elected conversion date and includes a 2.5% discount. If Westpac redeems or converts 2006 TPS, Westpac must also redeem or convert the notes in a corresponding manner.
The 2006 TPS will automatically exchange into Westpac preference shares upon the occurrence of an automatic exchange event, that is, if the 2006 TPS are still on issue on 30 September 2055 or in certain other limited circumstances, including the occurrence of an event of default or an APRA event (unless APRA determines otherwise). On exchange, all 2006 TPS on issue will exchange into preference shares directly issued by Westpac and the notes and the 2006 TPS will be redeemed simultaneously. On exchange, 2006 TPS holders will receive one preference share for each 2006 TPS.
Note 25. Share-based payments Executive and Senior Officer equity plans Options, restricted shares and/or share rights are granted to the CEO, selected executives and key senior employees under the following schemes.
(i) Westpac Reward Plan1 The Westpac Reward Plan (WRP) was introduced in 2006. It provides a mechanism for rewarding superior long-term performance from the most senior management in Australia and overseas.
Under the WRP senior managers may be invited to receive an award of performance options or performance share rights. An option or share right under the WRP is the right to acquire a share in the future provided all conditions are met, with an exercise price for options set at the commencement of the performance period. The exercise price for options is based on the prevailing market price of Westpac ordinary shares at the commencement of the performance period. The exercise price for share rights is nil. No performance options have been awarded since October 2009.
1 The Westpac Reward Plan (WRP) has now been renamed the Westpac Long Term Incentive Plan (LTI Plan).
184 2014 Westpac Group Annual Report

Notes to the financial statements Note 25. Share-based payments (continued) Awards made from October 2011 are subject to two performance measures each applying to 50% of the value of the award. The two hurdles are Westpac’s relative Total Shareholder Return (TSR)1 and Compound Annual Growth Rate in Cash EPS (Cash EPS CAGR).
Full vesting of TSR hurdled performance share rights occurs when Westpac’s TSR is at (or exceeds) the 75th percentile relative to the comparator group, scaling down to 50% vesting on a straight-line basis for median performance. Below median performance, no vesting occurs. The comparator group for TSR comparisons focuses on the top 10 financial sector peers. Full vesting of Cash EPS CAGR hurdled share rights occurs when a maximum target Cash EPS CAGR is achieved, scaling down to 50% vesting at a threshold Cash EPS CAGR target. Below the threshold target Cash EPS CAGR, no vesting occurs. These awards are subject to a single test at the end of the three year performance period. Any securities remaining unvested after the performance period lapse immediately.
For awards made prior to October 2011 all awards were subject to a TSR hurdle and the initial TSR performance is tested at the third anniversary of the commencement of the performance period, with subsequent performance testing possible at the fourth and fifth anniversaries of the commencement of the performance period. At subsequent performance test dates (where they exist) further vesting may occur only if the TSR ranking has improved.
Upon exercising vested performance options and performance share rights, the executive has the right to take up his or her entitlement in whole or in part as fully paid ordinary shares. The exercise price is payable at that time. A performance option or performance share right lapses if it is not exercised prior to the end of its term.
WRP – outstanding performance options and performance share rights The following table sets out details of outstanding performance options and performance share rights under the WRP:
CommencementDate
Latest Date for Exercise
Exercise Price
Outstanding at 1 October
2013
Granted During
the Year
Exercised During
the Year
Lapsed During
the Year
Outstanding at
30 September 2014
Outstanding and
Exercisable at 30 September
2014 Performance options17 December 2007 17 December 2017 $30.10 1,036,773 - 417,452 - 619,321 619,321 1 October 2008 1 October 2018 $23.40 662,363 - 289,994 - 372,369 372,369 Total 2014 1,699,136 - 707,446 - 991,690 991,690Weighted average exercise price $27.49 - $27.35 - $27.58 $27.58Performance share rights1 October 2009 1 October 2019 nil 68,473 - 1,499 3,175 63,799 - 1 October 2010 1 October 2020 nil 740,209 - 665,391 3,653 71,165 802 1 October 2011 1 October 2021 nil 1,234,972 - - 66,511 1,168,461 - 1 October 2012 1 October 2022 nil 1,132,587 - - 65,608 1,066,979 - 1 October 2013 1 October 2023 nil - 1,004,234 - 55,888 948,346 - Total 2014 3,176,241 1,004,234 666,890 194,835 3,318,750 802Total 2013Performance options 2,992,750 - 1,293,614 - 1,699,136 1,699,136Weighted average exercise price $26.97 - $26.29 - $27.49 $27.49Performance share rights 2,701,908 1,132,587 606,053 52,201 3,176,241 1,499
The weighted average remaining contractual life of outstanding performance options at 30 September 2014 was 3.5 years (2013: 4.5 years). The weighted average remaining contractual life of outstanding performance share rights at 30 September 2014 was 7.8 years (2013: 8.1 years). The weighted average fair value at grant date of WRP performance share rights issued during the year was $19.82 (2013: $15.79).
1 TSR measures a company’s share price movement and assumes that dividends over the period have been reinvested (i.e. the change in value of an investment in that company’s shares) and excluding tax effects.
2014 Westpac Group Annual Report 185

Note 25. Share-based payments (continued) (ii) Westpac Performance Plan The Westpac Performance Plan (WPP) was introduced in 2002 and was used to provide awards of performance options and/or performance share rights to senior executives and other key employees. Currently the WPP is primarily used for employees based in New Zealand to provide long-term incentive awards or as a mechanism for the mandatory deferral of a portion of their short-term incentives.
An option or share right under the WPP is the right to acquire a share in the future provided all conditions are met, with an exercise price for options generally set at the time the invitation is made. The exercise price for options is equal to the average market price of Westpac ordinary shares traded on the ASX over the five trading days up to the time the invitation is made. The exercise price for share rights is nil.
Performance options and performance share rights Performance options and performance share rights under the WPP have all vested. Upon exercising vested performance options or performance share rights, the executive has the right to take up his or her entitlement in whole or in part as fully paid ordinary shares. The exercise price is payable at that time. A performance option or performance share right lapses if it is not exercised prior to the end of its term.
WPP – outstanding performance options No performance options were granted under the WPP during the year. The following table sets out details of outstanding performance options granted under the WPP in previous years:
CommencementDate
Latest Date for Exercise
Exercise Price
Outstanding at 1 October
2013
Granted During
the Year
Exercised During
the Year
Lapsed During
the Year
Outstanding at
30 September 2014
Outstanding and
Exercisable at 30 September
2014 21 January 2004 21 January 2014 $16.34 103,004 - 103,004 - - - 20 January 2005 20 January 2015 $18.98 453,112 - 444,123 - 8,989 8,989 20 December 2005 20 December 2015 $20.53 526,646 - 413,122 - 113,524 113,524 20 December 2005 20 December 2015 $22.53 56,592 - 29,834 - 26,758 26,758 15 December 2006 15 December 2016 $23.98 613,339 - 426,142 - 187,197 187,197 Total 2014 1,752,693 - 1,416,225 - 336,468 336,468 Weighted average exercise price $21.15 - $20.82 - $22.57 $22.57Total 2013 3,853,681 - 2,093,714 7,274 1,752,693 1,752,693Weighted average exercise price $20.90 - $20.71 $13.59 $21.15 $21.15
The weighted average remaining contractual life of outstanding performance options at 30 September 2014 was 1.7 years (2013: 2.2 years).
186 2014 Westpac Group Annual Report

Notes to the financial statements Note 25. Share-based payments (continued) WPP – outstanding performance share rights No performance share rights were granted under the WPP during the year. The following table sets out details of outstanding vested performance share rights granted under the WPP:
CommencementDates Latest Dates for Exercise
Outstanding at 1 October
2013
Granted During
the Year
Exercised During
the Year
Lapsed During
the Year
Outstanding at 30 September
2014
Outstanding and
Exercisable at 30 September
2014 Two-year initial testing period3 November 2003 to3 August 2004
3 November 2013 to3 August 2014 16,222 - 16,222 - - -
5 November 2004 to1 August 2005
5 November 2014 to1 August 2015 44,113 - 20,909 - 23,204 23,204
1 November 2005 to3 August 2006
1 November 2015 to3 August 2016 62,685 - 25,878 - 36,807 36,807
1 November 2006 to15 December 2006
1 November 2016 to15 December 2016 3,490 - - - 3,490 3,490
Three-year initial testing period3 November 2003 to3 August 2004
3 November 2013 to3 August 2014 22,154 - 22,154 - - -
5 November 2004 to1 August 2005
5 November 2014 to1 August 2015 48,535 - 24,317 - 24,218 24,218
1 November 2005 to3 August 2006
1 November 2015 to3 August 2016 111,466 - 29,804 - 81,662 81,662
Total 2014 308,665 - 139,284 - 169,381 169,381 Total 2013 650,696 - 342,031 - 308,665 308,665
The weighted average remaining contractual life of outstanding performance share rights at 30 September 2014 was 1.0 years (2013: 1.7 years).
Unhurdled options and unhurdled share rights The WPP is also used for key employees based outside Australia, who received unhurdled share rights restricted for one to three years. No unhurdled options were granted under the WPP during the year. After the restriction period applying to them has passed, vested unhurdled options and unhurdled share rights can be exercised to receive the underlying fully paid ordinary shares.
2014 Westpac Group Annual Report 187

Note 25. Share-based payments (continued) WPP – outstanding unhurdled options and unhurdled share rights The following table sets out details of outstanding unhurdled options and unhurdled share rights granted under the WPP:
CommencementDate
Latest Date forExercise
Exercise Price
Outstanding at1 October
2013
Granted During
the Year
Exercised During
the Year
Lapsed During
the Year
Outstanding at
30 September 2014
Outstanding and
Excercisable at30 September
2014 Options15 December 2006 15 December 2016 $23.98 42,779 - 18,716 - 24,063 24,063 Total 2014 42,779 - 18,716 - 24,063 24,063 Share rightsOne-year vesting period1 December 2008 to1 June 2009
1 December 2018 to1 June 2019 nil 5,681 - 5,681 - - -
1 November 2010 to1 April 2011
1 November 2020 to1 April 2021 nil 8,573 - 8,573 - - -
1 October 2011 to 1 August 2012
1 October 2021 to 1 August 2022 nil 16,789 - 5,596 - 11,193 11,193
1 September 2012 to 1 December 2012
1 September 2022 to 1 December 2022 nil 37,155 - 28,182 - 8,973 8,973
1 October 2013 to 1 May 2014
1 October 2023 to 1 May 2024 nil - 51,819 - - 51,819 -
Two-year vesting period1 November 2007 to1 September 2008
1 November 2017 to1 September 2018 nil 11,437 - 3,578 - 7,859 7,859
1 October 2008 to1 April 2009
1 October 2018 to1 April 2019 nil 3,328 - 759 - 2,569 2,569
1 October 2009 to1 April 2010
1 October 2019 to1 April 2020 nil 6,387 - 1,689 - 4,698 4,698
1 October 2010 to1 August 2011
1 October 2020 to1 August 2021 nil 19,470 - 12,919 - 6,551 6,551
1 October 2011 to 1 August 2012
1 October 2021 to 1 August 2022 nil 62,896 - 49,608 - 13,288 13,288
1 September 2012 to 1 October 2012
1 September 2022 to 1 October 2022 nil 73,337 - - 534 72,803 2,341
1 October 2013 to 1 May 2014
1 October 2023 to 1 May 2024 nil - 53,907 - - 53,907 -
Three-year vesting period15 December 2006 to1 June 2007
15 December 2016 to1 June 2017 nil 25,410 - 1,886 - 23,524 23,524
17 December 2007 to1 September 2008
17 December 2017 to1 September 2018 nil 15,063 - 3,129 - 11,934 11,934
1 October 2008 to1 April 2009
1 October 2018 to1 April 2019 nil 11,125 - 3,511 - 7,614 7,614
1 October 2009 to1 April 2010
1 October 2019 to1 April 2020 nil 26,217 - 7,797 - 18,420 18,420
1 October 2010 to1 August 2011
1 October 2020 to1 August 2021 nil 160,257 - 128,978 - 31,279 31,279
1 October 2011 to 1 June 2012
1 October 2021 to 1 June 2022 nil 148,879 - - 4,590 144,289 -
1 October 2012 to 1 September 2013
1 October 2022 to 1 September 2023 nil 124,107 - - 5,999 118,108 -
1 October 2013 to 1 May 2014
1 October 2023 to 1 May 2024 nil - 15,115 - - 15,115 -
Total 2014 756,111 120,841 261,886 11,123 603,943 150,243 Total 2013Options $23.98 42,779 - - - 42,779 42,779 Share rights nil 806,610 243,201 246,104 47,596 756,111 149,480
The weighted average fair value at grant date of unhurdled share rights issued during the year was $29.89 per right (2013: $21.88 per right). The weighted average remaining contractual life of outstanding unhurdled options and unhurdled share rights at 30 September 2014 was 7.1 years (2013: 7.4 years).
188 2014 Westpac Group Annual Report

Notes to the financial statements Note 25. Share-based payments (continued) (iii) Chief Executive Officer Performance Plan (Gail Kelly) Gail Kelly currently holds performance share rights under the Chief Executive Officer Performance Plan (CEOPP). Performance share rights have a nil exercise price. No performance options have been awarded since December 2008. Grants to Mrs Kelly under the CEOPP were approved by shareholders at Westpac’s AGM on 13 December 2007, 16 December 2009, 15 December 2010 and 13 December 2013.
Awards made from October 2011 are subject to two performance measures each applying to 50% of the value of the award. The two hurdles are Westpac’s relative TSR and Cash EPS CAGR. The vesting conditions for these awards are the same as set out above for awards made under the WRP from October 2011.
For awards made prior to October 2011, all awards were subject to a TSR hurdle. The vesting conditions for these awards are also the same as awards made under the WRP prior to October 2011.
CEOPP – outstanding performance share rights The following table sets out details of outstanding awards of performance share rights granted under the CEOPP:
CommencementDate
Latest Date forExercise
Exercise Price
Outstanding at1 October
2013
Granted During
the Year
Exercised During
the Year
Lapsed During
the Year
Outstanding at30 September
2014 Performance share rights21 December 2009 21 December 2019 nil 49,801 - - - 49,801 1 October 2010 1 October 2020 nil 176,125 - 158,513 - 17,612 1 October 2011 1 October 2021 nil 272,929 - - - 272,929 1 October 2012 1 October 2022 nil 213,101 - - - 213,101 1 October 2013 1 October 2023 nil - 159,821 - - 159,821 Total 2014 711,956 159,821 158,513 - 713,264 Total 2013Performance options 400,043 - 400,043 - -Weighted average exercise price $25.08 - $25.08 - -Performance share rights nil 627,029 213,101 128,174 - 711,956
The weighted average fair value at grant date of performance share rights granted during the year was $20.67 per right (2013: $16.29 per right). As at 30 September 2014, no outstanding share rights issued to Mrs Kelly were exercisable. The remaining weighted average contractual life of outstanding performance share rights was 7.6 years (2013: 7.9 years).
(iv) Fair value assumptions The fair values of share rights granted during the year included in the tables above have been independently calculated at their respective grant dates based on the requirements of Australian Accounting Standard AASB 2 Share-based Payments.
The fair values of rights without TSR based hurdles, including rights with Cash EPS CAGR hurdles, have been assessed with reference to the share price at grant date and a discount rate reflecting the expected dividend yield over their vesting periods.
The fair value of rights with hurdles based on TSR performance relative to a group of comparator companies also takes into account the average TSR outcome determined using a Monte Carlo simulation pricing model.
Other key assumptions include:
the assumptions included in the valuation of the awards of performance share rights to Gail Kelly include a risk free interest rate of 3.0%, a dividend yield on Westpac ordinary shares of 5.5% and a volatility in the Westpac share price of 20.4%;
the assumptions included in the valuation of the awards of share rights under the WRP and WPP include a risk free interest rate of 3.0%, a dividend yield on Westpac ordinary shares of 5.6% and a volatility in the Westpac share price of 20.4%;
volatility has been assessed by considering the historic volatility of the market price of Westpac shares; and other assumptions include volatilities of, and correlation factors between, share price movements of the comparator group
members and Westpac which are used to assess the impact of the TSR performance hurdles and have been derived from the historic volatilities and correlations.
2014 Westpac Group Annual Report 189

Note 25. Share-based payments (continued) (v) Chief Executive Officer Restricted Share Plan Gail Kelly received awards of Westpac ordinary shares under the Chief Executive Officer Restricted Share Plan (CEO RSP) in relation to her employment agreement. The awards were approved by Westpac shareholders at Westpac’s AGM on 13 December 2007, 16 December 2009, 15 December 2010 and 13 December 2013.
Like the general RSP, Westpac ordinary shares are allocated under the CEO RSP at no cost to Mrs Kelly, with vesting subject to remaining employed with Westpac for a set period. Shares in the CEO RSP are held in Mrs Kelly’s name and are restricted until satisfaction of the vesting conditions. Shares in the CEO RSP rank equally with Westpac ordinary shares for dividends and voting rights. For awards made from October 2009, shares are released from the CEO RSP on vesting.
The following table details outstanding awards of shares issued under the CEO RSP:
Allocation dateOutstanding at
1 October 2013Granted During
the Year Released Forfeited During
the Year Outstanding at
30 September 2014 22 December 2011 51,866 - 25,933 - 25,933 21 December 2012 58,400 - 29,200 - 29,200 18 December 2013 - 57,358 - - 57,358 Total 2014 110,266 57,358 55,133 - 112,491 Total 2013 118,850 58,400 66,984 - 110,266
190 2014 Westpac Group Annual Report

Notes to the financial statements Note 25. Share-based payments (continued) (vi) Restricted Share Plan The Restricted Share Plan (RSP) provides Westpac with an instrument for attracting and rewarding key employees. Under the RSP, Westpac shares may be allocated to eligible employees at no cost with vesting subject to remaining employed with Westpac for a period determined by the Board. The fair value of the shares allocated is the share price on the date of the grant. Shares in the RSP are held in the name of the employee and are restricted until satisfaction of the vesting conditions. Shares in the RSP rank equally with Westpac ordinary shares for dividends and voting rights. For awards made prior to October 2009, shares may be held in the RSP for up to 10 years from the date they are granted. For awards made from October 2009, shares are released from the RSP on vesting.
Outstanding RSP awards The following table details outstanding awards of shares issued under the RSP:
Allocation date Outstanding at
1 October 2013 Granted During
the Year ReleasedForfeited During
the Year Outstanding at
30 September 2014 October – December 2006 272,095 - 39,001 - 233,094
January – March 2007 598 - - - 598 April – June 2007 15,161 - 1,838 - 13,323
July – September 2007 2,453 - 1,867 - 586 October – December 2007 438,069 - 62,759 - 375,310
January – March 2008 8,263 - 1,782 - 6,481 April – June 2008 17,416 - 2,203 - 15,213
July – September 2008 8,412 - 1,705 - 6,707 October – December 2008 876,756 - 124,553 - 752,203
January – March 2009 75,955 - - - 75,955 April – June 2009 8,734 - 562 - 8,172
October – December 2010 1,747,662 - 1,747,662 - -January – March 2011 1,692 - 1,692 - -
April – June 2011 2,187 - 2,187 - -July – September 2011 21,612 - 21,612 - -
October – December 2011 3,002,817 - 921,188 67,032 2,014,597 January – March 2012 7,616 - 6,136 - 1,480
April – June 2012 30,781 - 14,228 - 16,553 July – September 2012 226,615 - 192,760 1,008 32,847
October – December 2012 2,490,359 - 421,395 47,048 2,021,916 January – March 2013 66,074 - 30,501 - 35,573
April – June 2013 76,497 - 25,894 2,332 48,271 July – September 2013 40,967 - 4,046 - 36,921
October – December 2013 - 1,949,492 22,093 65,858 1,861,541 January – March 2014 - 21,976 - - 21,976
April – June 2014 - 53,749 - - 53,749 July – September 2014 - 45,095 - - 45,095
Total 2014 9,438,791 2,070,312 3,647,664 183,278 7,678,161 Total 2013 10,583,524 2,742,017 3,666,622 220,128 9,438,791
(vii) Other Group share-based plans Westpac also provides plans for small, specialised parts of the Group. The benefits under these plans are directly linked to growth and performance of the relevant part of the business. The plans individually and in aggregate are not material to the Group.
2014 Westpac Group Annual Report 191
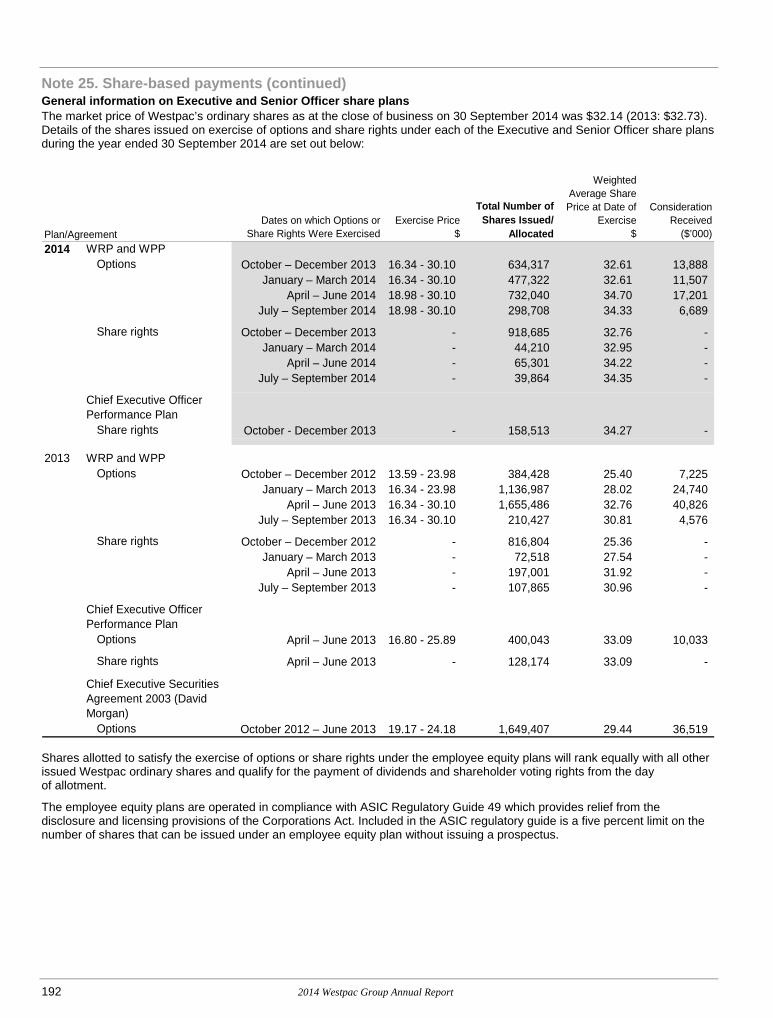
Note 25. Share-based payments (continued) General information on Executive and Senior Officer share plans The market price of Westpac’s ordinary shares as at the close of business on 30 September 2014 was $32.14 (2013: $32.73). Details of the shares issued on exercise of options and share rights under each of the Executive and Senior Officer share plans during the year ended 30 September 2014 are set out below:
Plan/AgreementDates on which Options or
Share Rights Were ExercisedExercise Price
$
Total Number of Shares Issued/
Allocated
Weighted Average Share Price at Date of
Exercise$
Consideration Received
($’000)2014 WRP and WPP
Options October – December 2013 16.34 - 30.10 634,317 32.61 13,888January – March 2014 16.34 - 30.10 477,322 32.61 11,507
April – June 2014 18.98 - 30.10 732,040 34.70 17,201July – September 2014 18.98 - 30.10 298,708 34.33 6,689
Share rights October – December 2013 - 918,685 32.76 -January – March 2014 - 44,210 32.95 -
April – June 2014 - 65,301 34.22 -July – September 2014 - 39,864 34.35 -
Chief Executive Officer Performance Plan
Share rights October - December 2013 - 158,513 34.27 -
2013 WRP and WPPOptions October – December 2012 13.59 - 23.98 384,428 25.40 7,225
January – March 2013 16.34 - 23.98 1,136,987 28.02 24,740April – June 2013 16.34 - 30.10 1,655,486 32.76 40,826
July – September 2013 16.34 - 30.10 210,427 30.81 4,576
Share rights October – December 2012 - 816,804 25.36 -January – March 2013 - 72,518 27.54 -
April – June 2013 - 197,001 31.92 -July – September 2013 - 107,865 30.96 -
Chief Executive Officer Performance Plan
Options April – June 2013 16.80 - 25.89 400,043 33.09 10,033
Share rights April – June 2013 - 128,174 33.09 -
Chief Executive Securities Agreement 2003 (David Morgan)
Options October 2012 – June 2013 19.17 - 24.18 1,649,407 29.44 36,519
Shares allotted to satisfy the exercise of options or share rights under the employee equity plans will rank equally with all other issued Westpac ordinary shares and qualify for the payment of dividends and shareholder voting rights from the day of allotment.
The employee equity plans are operated in compliance with ASIC Regulatory Guide 49 which provides relief from the disclosure and licensing provisions of the Corporations Act. Included in the ASIC regulatory guide is a five percent limit on the number of shares that can be issued under an employee equity plan without issuing a prospectus.
192 2014 Westpac Group Annual Report
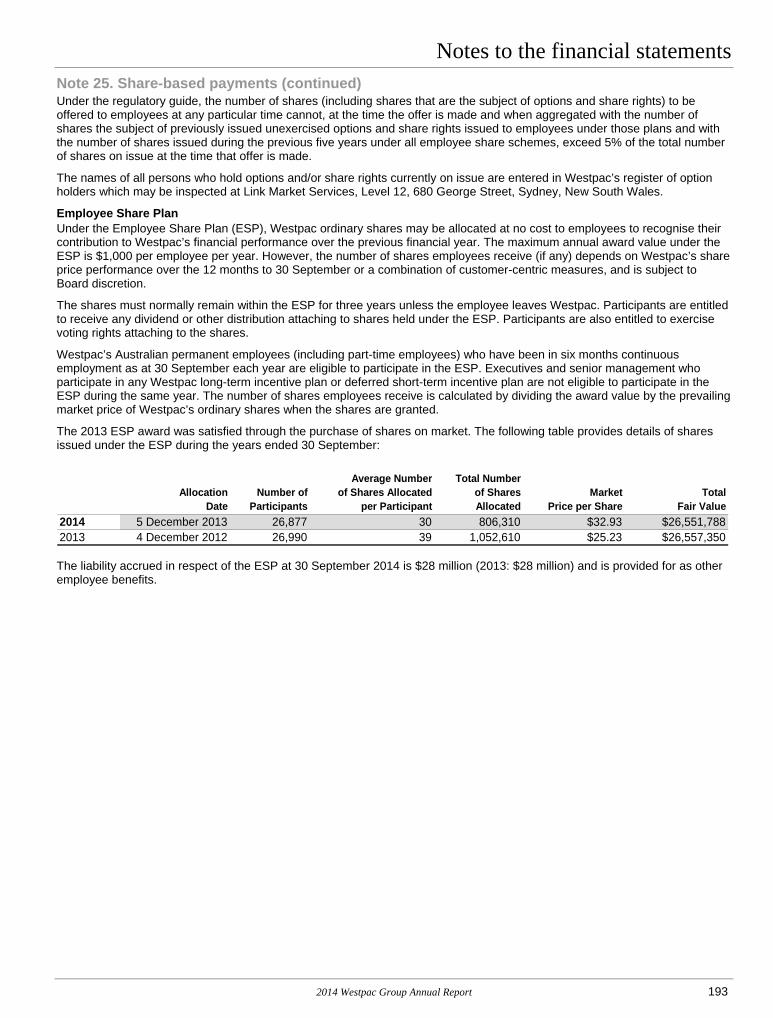
Notes to the financial statements Note 25. Share-based payments (continued) Under the regulatory guide, the number of shares (including shares that are the subject of options and share rights) to be offered to employees at any particular time cannot, at the time the offer is made and when aggregated with the number of shares the subject of previously issued unexercised options and share rights issued to employees under those plans and with the number of shares issued during the previous five years under all employee share schemes, exceed 5% of the total number of shares on issue at the time that offer is made.
The names of all persons who hold options and/or share rights currently on issue are entered in Westpac’s register of option holders which may be inspected at Link Market Services, Level 12, 680 George Street, Sydney, New South Wales.
Employee Share Plan Under the Employee Share Plan (ESP), Westpac ordinary shares may be allocated at no cost to employees to recognise their contribution to Westpac’s financial performance over the previous financial year. The maximum annual award value under the ESP is $1,000 per employee per year. However, the number of shares employees receive (if any) depends on Westpac’s share price performance over the 12 months to 30 September or a combination of customer-centric measures, and is subject to Board discretion.
The shares must normally remain within the ESP for three years unless the employee leaves Westpac. Participants are entitled to receive any dividend or other distribution attaching to shares held under the ESP. Participants are also entitled to exercise voting rights attaching to the shares.
Westpac’s Australian permanent employees (including part-time employees) who have been in six months continuous employment as at 30 September each year are eligible to participate in the ESP. Executives and senior management who participate in any Westpac long-term incentive plan or deferred short-term incentive plan are not eligible to participate in the ESP during the same year. The number of shares employees receive is calculated by dividing the award value by the prevailing market price of Westpac’s ordinary shares when the shares are granted.
The 2013 ESP award was satisfied through the purchase of shares on market. The following table provides details of shares issued under the ESP during the years ended 30 September:
AllocationDate
Number of Participants
Average Numberof Shares Allocated
per Participant
Total Numberof SharesAllocated
Market Price per Share
TotalFair Value
2014 5 December 2013 26,877 30 806,310 $32.93 $26,551,7882013 4 December 2012 26,990 39 1,052,610 $25.23 $26,557,350
The liability accrued in respect of the ESP at 30 September 2014 is $28 million (2013: $28 million) and is provided for as other employee benefits.
2014 Westpac Group Annual Report 193

Note 26. Average balance sheet and interest rates The following table lists the average balances and related interest for the major categories of the Group’s interest earning assets and interest bearing liabilities. Averages used are predominantly daily averages:
ConsolidatedYear Ended Year Ended Year Ended
30 September 2014 30 September 2013 30 September 2012 Average Interest Average Average Interest Average Average Interest Average Balance Income Rate Balance Income Rate Balance Income Rate $m $m % $m $m % $m $m %AssetsInterest earning assetsReceivables due from other financial institutions:
Australia 2,433 60 2.5% 2,852 86 3.0% 3,215 135 4.2%New Zealand 294 5 1.7% 338 5 1.5% 220 4 1.8%Other overseas 5,151 19 0.4% 5,959 22 0.4% 4,935 49 1.0%
Trading securities and other financial assets designated at fair value:
Australia 32,877 1,226 3.7% 38,506 1,560 4.1% 37,790 1,973 5.2%New Zealand 4,358 132 3.0% 3,309 88 2.7% 4,538 123 2.7%Other overseas 10,134 124 1.2% 6,262 84 1.3% 5,383 103 1.9%
Available-for-sale securities:Australia 27,222 1,230 4.5% 21,475 1,107 5.2% 16,240 1,006 6.2%New Zealand 2,384 107 4.5% 2,085 93 4.5% 1,784 80 4.5%Other overseas 1,351 49 3.6% 1,089 26 2.4% 1,062 30 2.8%
Regulatory deposits:Other overseas 1,369 18 1.3% 1,512 23 1.5% 1,460 24 1.6%
Loans and other receivables1:Australia 474,570 25,498 5.4% 449,405 26,712 5.9% 440,416 30,202 6.9%New Zealand 59,240 3,449 5.8% 50,801 2,924 5.8% 46,416 2,870 6.2%Other overseas 25,979 331 1.3% 16,276 279 1.7% 14,286 274 1.9%
Total interest earning assets and interest income 647,362 32,248 5.0% 599,869 33,009 5.5% 577,745 36,873 6.4%Non-interest earning assets Cash, receivables due from other financial institutions and regulatory deposits 1,513 723 2,745Derivative financial instruments 28,866 33,967 36,688Life insurance assets 13,687 12,713 11,694All other assets2 45,696 41,023 36,932Total non-interest earning assets 89,762 88,426 88,059Total assets 737,124 688,295 665,804
1 Loans and receivables are stated net of provisions for impairment charges on loans. Other receivables include other assets and cash with central banks that are interest earning.
2 Includes property, plant and equipment, goodwill and intangibles, other assets, deferred tax and non-interest bearing loans relating to mortgage offset accounts.
194 2014 Westpac Group Annual Report

Notes to the financial statements Note 26. Average balance sheet and interest rates (continued)
30 September 2014 30 September 2013 30 September 2012
Average Interest Average Average Interest Average Average Interest Average Balance Expense Rate Balance Expense Rate Balance Expense Rate $m $m % $m $m % $m $m %LiabilitiesInterest bearing liabilitiesPayables due to other financial institutions:
Australia 10,253 250 2.4% 4,218 131 3.1% 4,072 186 4.6%New Zealand 547 11 2.0% 458 7 1.5% 336 6 1.8%Other overseas 4,767 39 0.8% 4,648 52 1.1% 4,837 52 1.1%
Deposits and other borrowings:Australia 342,385 9,850 2.9% 325,634 11,141 3.4% 302,412 13,301 4.4%New Zealand 42,444 1,453 3.4% 35,674 1,214 3.4% 30,324 1,066 3.5%Other overseas 29,347 196 0.7% 25,368 200 0.8% 27,367 235 0.9%
Loan capital:Australia 8,729 424 4.9% 7,183 414 5.8% 5,129 327 6.4%Other overseas 1,358 66 4.9% 2,436 115 4.7% 2,455 127 5.2%
Other interest bearing liabilities1:Australia 151,742 5,824 n/a 144,777 6,353 n/a 151,204 8,426 n/aNew Zealand 12,364 552 n/a 10,073 561 n/a 11,841 616 n/aOther overseas 2,617 41 n/a 1 - n/a 550 29 n/a
Total interest bearing liabilities and interest expense 606,553 18,706 3.1% 560,470 20,188 3.6% 540,527 24,371 4.5%Non-interest bearing liabilitiesDeposits and payables due to other financial institutions:
Australia 23,826 19,173 15,920New Zealand 3,169 2,578 2,237Other overseas 812 783 657
Derivative financial instruments 31,172 35,542 37,788Life insurance policy liabilities 12,359 11,574 10,586All other liabilities2 11,894 11,853 13,520Total non-interest bearing liabilities 83,232 81,503 80,708Total liabilities 689,785 641,973 621,235Shareholders’ equity 46,477 44,350 42,605Non-controlling interests 862 1,972 1,964Total equity 47,339 46,322 44,569Total liabilities and equity 737,124 688,295 665,804
Year Ended Year Ended Year EndedConsolidated
1 Includes net impact of Treasury balance sheet management activities. 2 Includes other liabilities, provisions, current and deferred tax liabilities.
2014 Westpac Group Annual Report 195

Note 26. Average balance sheet and interest rates (continued) The following table allocates changes in net interest income between changes in volume and changes in rate for the last two fiscal years. Volume and rate variances have been calculated on the movement in average balances and the change in the interest rates on average interest earning assets and average interest bearing liabilities. The variance caused by change in both volume and rate has been allocated in proportion to the relationship of the absolute dollar amount of each change to the total.
Consolidated2014 2013
Change Due toVolume Rate Total Volume Rate Total
$m $m $m $m $m $mInterest earning assetsReceivables due from other financial institutions:
Australia (13) (13) (26) (15) (34) (49) New Zealand (1) 1 - 2 (1) 1 Other overseas (3) - (3) 10 (37) (27)
Trading securities and other financial assets designated at fair value:
Australia (229) (105) (334) 36 (449) (413) New Zealand 28 16 44 (33) (2) (35) Other overseas 54 (14) 40 16 (35) (19)
Available-for-sale securities:Australia 296 (173) 123 324 (223) 101 New Zealand 13 1 14 13 - 13 Other overseas 6 17 23 1 (5) (4)
Regulatory deposits:Other overseas (2) (3) (5) 1 (2) (1)
Loans and other receivables:Australia 1,496 (2,710) (1,214) 616 (4,106) (3,490) New Zealand 486 39 525 271 (217) 54 Other overseas 166 (114) 52 38 (33) 5
Total change in interest income 2,297 (3,058) (761) 1,280 (5,144) (3,864) Interest bearing liabilitiesPayables due to other financial institutions:
Australia 187 (68) 119 7 (62) (55) New Zealand 1 3 4 2 (1) 1 Other overseas 1 (14) (13) (2) 2 -
Deposits and other borrowings:Australia 573 (1,864) (1,291) 1,021 (3,181) (2,160) New Zealand 230 9 239 188 (40) 148 Other overseas 31 (35) (4) (17) (18) (35)
Loan capital:Australia 89 (79) 10 131 (44) 87 Other overseas (51) 2 (49) (1) (11) (12)
Other interest bearing liabilities:Australia 306 (835) (529) (358) (1,715) (2,073) New Zealand 128 (137) (9) (92) 37 (55) Other overseas - 41 41 (29) - (29)
Total change in interest expense 1,495 (2,977) (1,482) 850 (5,033) (4,183) Change in net interest income:
Australia 395 (155) 240 160 190 350 New Zealand 167 182 349 155 (216) (61) Other overseas 240 (108) 132 115 (85) 30
Total change in net interest income 802 (81) 721 430 (111) 319
Change Due to
196 2014 Westpac Group Annual Report
Notes to the financial statements Note 27. Financial risk Westpac’s risk appetite is set by the Board. The risk appetite cannot be defined by a single metric. It has many dimensions and is an amalgam of top-down requirements (including Westpac’s target debt rating and complying with regulatory requirements) and bottom-up aggregates (such as risk concentration limits). Westpac uses an economic capital model as the basis of risk measurement, calibrated to its target debt rating.
Westpac’s appetite for risk is influenced by a range of factors, including whether a risk is considered consistent with its strategy (core risk) and whether an appropriate return can be achieved from taking that risk. Westpac has a lower appetite for risks that are not part of its core strategy. Westpac seeks to achieve an appropriate return on risk and prices its products accordingly.
Westpac seeks to maximise total shareholder returns over the longer term by achieving an appropriate balance between growth and volatility of returns and by ultimately returning that value to shareholders.
Westpac distinguishes the following types of risk, and takes an integrated approach towards managing them. These risks are:
Type of risk Description
Key risks credit risk – the risk of financial loss where a customer or counterparty fails to meet their financial obligations to Westpac;
liquidity risk – the risk that the Group will be unable to fund assets and meet obligations as they become due;
market risk – the risk of an adverse impact on earnings resulting from changes in market factors, such as foreign exchange rates, interest rates, commodity prices and equity prices. This includes interest rate risk in the banking book – the risk to interest income from a mismatch between the duration of assets and liabilities that arises in the normal course of business activities;
operational risk – operational risk is the risk of loss resulting from inadequate or failed internal processes, people and systems or from external events. The definition is aligned to the regulatory (Basel II) definition, including legal and regulatory risk but excluding strategic and reputation risk; and
compliance risk – the risk of legal or regulatory sanction, financial or reputation loss, arising from our failure to abide by the compliance obligations required of us.
Other related risks business risk – the risk associated with the vulnerability of a line of business to changes in the business environment;
environmental, social and governance risks – the risk that the Group damages its reputation or financial performance due to failure to recognise or address material existing or emerging sustainability related environmental, social or governance issues;
equity risk – the potential for financial loss arising from movements in equity values. Equity risk may be direct, indirect or contingent;
insurance risk – the risk of mis-estimation of the expected cost of insured events, volatility in the number or severity of insured events, and mis-estimation of the cost of incurred claims;
related entity (contagion) risk – the risk that problems arising in other Westpac Group members compromise the financial and operational position of the authorised deposit-taking institutions in the Westpac Group; and
reputation risk – the risk to earnings or capital arising from negative public opinion resulting from the loss of reputation or public trust and standing.
2014 Westpac Group Annual Report 197

Note 27. Financial risk (continued) Note 27 provides a summary of Westpac’s risk management framework, as well as a discussion of Westpac’s financial risk management policies and practices and quantitative information on some of its principal financial risk exposures. The information contained in Note 27 comprises the following:
27.1 Approach to risk management 27.2 Credit risk management 27.2.1 Credit risk management policy 27.2.2 Provision and impairment policy 27.2.3 Internal credit risk ratings system 27.2.4 Credit risk mitigation, collateral and other credit enhancements 27.2.5 Credit risk concentrations 27.2.6 Credit quality of financial assets 27.2.7 Financial assets that are neither past due nor impaired 27.2.8 Financial assets that are past due, but not impaired 27.2.9 Items 90 days past due, or otherwise in default, but well secured and not impaired 27.2.10 Impaired loans 27.3 Funding and Liquidity Risk Management 27.3.1 Sources of liquidity 27.3.2 Liquidity reporting 27.3.3 Market developments 27.3.4 Contractual maturity of financial liabilities 27.3.5 Expected maturity 27.4 Market risk 27.4.1 Traded market risk 27.4.2 Non-traded market risk
27.1 Approach to risk management The Board is responsible for reviewing and approving our overall risk management strategy, including determining our appetite for risk. The Board has delegated to the BRCC responsibility for providing recommendations to the Board on the Westpac Group’s risk-reward strategy, setting risk appetite, approving frameworks, policies and processes for managing risk, and determining whether to accept risks beyond management’s approval discretion.
The BRCC monitors the alignment of our risk profile with our risk appetite, which is defined in the Board Statement of Risk Appetite, and with our current and future capital requirements. The BRCC receives regular reports from management on the effectiveness of our management of Westpac’s material business risks. More detail about the role of the BRCC is set out in the Westpac risk management governance structure table.
The CEO and Executive Team are responsible for implementing our risk management strategy and frameworks, and for developing policies, controls, processes and procedures for identifying and managing risk in all of Westpac’s activities.
Westpac manages the risks that affect our business as they influence our performance, reputation and future success. Effective risk management involves taking an integrated approach to risk and reward, and enables us to both increase financial growth opportunities and mitigate potential loss or damage. We adopt a Three Lines of Defence approach to risk management which reflects our culture of ‘risk is everyone’s business’ and that all employees are responsible for identifying and managing risk and operating within the Group’s desired risk profile. We embed risk culture and maintain an awareness of risk management responsibilities through regular communication, training and other targeted approaches that support our risk management framework.
The 1st Line of Defence – risk identification, risk management and self-assurance Divisional business units are responsible for identifying, evaluating and managing the risks that they originate within approved risk appetite and policies. They are required to establish and maintain appropriate risk management controls, resources and self-assurance processes.
The 2nd Line of Defence – establishment of risk management frameworks and policies and risk management oversight Our 2nd Line of Defence is a separate risk advisory, control and monitoring function which establishes frameworks, policies, limits and processes for the management, monitoring and reporting of risk. It also evaluates and opines on the adequacy and effectiveness of 1st Line controls and application of frameworks and policies and, where necessary, requires improvement and monitors the 1st Line’s progress toward remediation of identified deficiencies.
198 2014 Westpac Group Annual Report

Notes to the financial statements Note 27. Financial risk (continued) Our 2nd Line of Defence has three layers: our executive risk committees lead the optimisation of risk-reward by overseeing the development of risk appetite
statements, risk management frameworks, policies and risk concentration controls, and monitoring Westpac’s risk profile for alignment with approved appetites and strategies;
our Group Risk function is independent from the business divisions, reports to the CRO, and establishes and maintains the Group-wide risk management frameworks, policies and concentration limits that are approved by the BRCC. It also reports on Westpac’s risk profile to executive risk committees and the BRCC; and
divisional risk areas are responsible for developing division-specific risk appetite statements, policies, controls, procedures, monitoring and reporting capability, which align to the Board’s Statement of Risk Appetite and the risk management frameworks approved by the BRCC. These risk areas are independent of the Divisions’ 1st Line business areas, with each divisional CRO having a direct reporting line to the CRO, as well as to their Division’s Group Executive.
The 3rd Line of Defence – independent assurance Our Group Assurance function independently evaluates the adequacy and effectiveness of the Group’s overall risk management framework and controls. This approach allows risks within our risk appetite to be balanced against appropriate rewards. Westpac’s risk management governance structure is set out in more detail in the following table:
Board
reviews and approves our overall risk management strategy.
Board Risk & Compliance Committee (BRCC)
provides recommendations to the Board on the Westpac Group’s risk-reward strategy; sets risk appetite; approves frameworks and key policies for managing risk; monitors our risk profile, performance, capital levels, exposures against limits and management and control of our risks; monitors changes anticipated in the economic and business environment and other factors relevant to our risk profile; oversees the development and ongoing review of key policies that support our frameworks for managing risk; and determines whether to accept risks beyond the approval discretion provided to management.
Other Board Committees with a risk focus
Board Audit Committee oversees the integrity of financial statements and financial reporting systems, and matters relating to taxation risks.
Board Remuneration Committee reviews any matters raised by the BRCC with respect to risk-adjusted remuneration.
Board Technology Committee oversees the technology strategy, implementation, and risks associated with major technology programs.
Executive Team
executes the Board-approved strategy; assists with the development of the Board Statement of Risk Appetite; delivers the Group’s various strategic and performance goals within the approved risk appetite; and monitors key risks within each business unit, capital adequacy and the Group’s reputation.
Executive risk committees
Westpac Group Executive Risk Committee leads the optimisation of credit, operational, compliance, and market risk-reward across the Group; oversees the embedding of the Risk Management Strategy in the Group’s approach to risk governance; oversees risk-related management frameworks and key supporting policies; oversees the Group’s credit, operational, compliance, and market risk profiles; oversees reputation risk and Environmental, Social and Governance (ESG) risk management frameworks and key
supporting policies; and identifies emerging credit, operational, compliance and market risks and allocates responsibility for assessing impacts and
implementing appropriate actions to address these.
2014 Westpac Group Annual Report 199

Note 27. Financial risk (continued) Executive risk committees (continued)
Westpac Group Asset & Liability Committee leads the optimisation of funding and liquidity risk-reward across the Group; reviews the level and quality of capital to ensure that it is commensurate with the Group’s risk profile, business strategy and
risk appetite; oversees the Liquidity Risk Management Framework and key policies; oversees the funding and liquidity risk profile and balance sheet risk profile; and identifies emerging funding and liquidity risks and appropriate actions to address these.
Westpac Group Remuneration Oversight Committee provides assurance that the remuneration arrangements across the Group have been examined from a People, Risk and
Finance perspective; responsible for ensuring that risk is embedded in all key steps in our remuneration framework; reviews and makes recommendations to the CEO for recommendation to the Board Remuneration Committee on the
Group Remuneration Policy and provides assurance that remuneration arrangements across the Group encourage behaviour that supports Westpac’s long-term financial soundness and the risk management framework;
reviews and monitors the remuneration arrangements (other than for Group Executives) for Responsible Persons (as defined in the Group’s Statutory Officers Fit and Proper Policy), risk and financial control personnel, and all other employees for whom a significant portion of total remuneration is based on performance and whose activities, either individually or collectively, may affect the financial soundness of Westpac; and
reviews and recommends to the CEO for recommendation to the Board Remuneration Committee the criteria and rationale for determining the total quantum of the Group variable reward pool.
Group and divisional risk management
Group Risk develops the Group-level risk management frameworks for approval by the BRCC; directs the review and development of key policies supporting the risk management frameworks; establishes risk concentration limits and monitors risk concentrations; and monitors emerging risk issues.
Compliance Function develops the Group-level compliance framework for approval by the BRCC; directs the review and development of compliance policies, compliance plans, controls and procedures; monitors compliance and regulatory obligations and emerging regulatory developments; and reports on compliance standards.
Divisional risk management develops division-specific policies, risk appetite statements, controls, procedures, and monitoring and reporting capability
that align to the frameworks approved by the BRCC.
Independent internal review
Group Assurance reviews the adequacy and effectiveness of management controls for risk.
Divisional business units
Business Units responsible for identifying, evaluating and managing the risks that they originate within approved risk appetite policies; and establish and maintain appropriate risk management controls, resources and self-assurance processes.
200 2014 Westpac Group Annual Report
Notes to the financial statements Note 27. Financial risk (continued) 27.2 Credit risk management Credit risk is the potential for financial loss where a customer or counterparty fails to meet their financial obligations.
27.2.1 Credit risk management policy Westpac maintains a credit risk management framework and a number of supporting policies that define roles and responsibilities, acceptable practices, limits and key controls:
the Credit Risk Management Framework describes the principles, methodologies, systems, roles and responsibilities, reports and key controls that exist for managing credit risk in Westpac;
the Credit Risk Rating System policy describes the credit risk rating system philosophy, design, key features and uses of rating outcomes; and
Westpac has established policies governing the management of three key types of concentration risk: – individual customers or groups of related customers; – specific industries (e.g. property); and – individual countries.
Westpac has an established policy governing the delegation of credit approval authorities and a set of formal limits for the extension of credit. These limits represent the delegation of credit approval authority to responsible individuals throughout the organisation.
Credit manuals exist in each business unit to govern the extension of credit. These manuals include general policies covering the origination, evaluation, approval, documentation, settlement and ongoing management of credit risks including management of problem loans. These manuals are regularly updated by the business units, with significant changes approved by Enterprise Risk.
Sector policies exist to guide the extension of credit where industry-specific guidelines are considered necessary (e.g. acceptable financial ratios or types of collateral). These policies are maintained by the business unit risk management teams.
Westpac has a related entity risk management framework and supporting policies, which include governance of credit exposures to related entities, so as to minimise contagion risk for the extended licensed entity and to ensure compliance with the prudential requirements prescribed by APRA.
27.2.2 Provision and impairment policy Provisions for loan impairment represent management’s best estimate of the losses incurred in the loan portfolios as at the balance date. There are two components of Westpac’s loan impairment provisions: individually assessed provisions and collectively assessed provisions. In determining the individually assessed provisions, relevant considerations that have a bearing on the expected future cash flows are taken into account, for example, the business prospects of the customer, the realisable value of collateral, Westpac’s position relative to other claimants, the reliability of customer information and the likely cost and duration of the work-out process. These judgments and estimates can change with time as new information becomes available or as work-out strategies evolve, resulting in revisions to the impairment provision as individual decisions are made.
The collectively assessed provisions are established on a portfolio basis taking into account the level of arrears, collateral, past loss experience and expected defaults based on portfolio trends. The most significant factors in establishing these provisions are estimated loss rates and related emergence periods. The provisions also take into account management’s assessment of changes or events that have recently occurred in sectors of the economy or in the economy as a whole that are not yet reflected in underlying provisioning factors. The future credit quality of these portfolios is subject to uncertainties that could cause actual credit losses to differ from reported loan impairment provisions. These uncertainties include the economic environment, notably interest rates, unemployment levels, repayment behaviour and bankruptcy rates.
2014 Westpac Group Annual Report 201

Note 27. Financial risk (continued) 27.2.3 Internal credit risk ratings system The principal objective of the credit risk rating system is to produce a reliable assessment of the credit risk to which the Group is exposed.
Westpac’s internal credit risk rating system for transaction-managed customers assigns a Customer Risk Grade (CRG) to each customer, corresponding to their expected probability of default (PD). Each facility is assigned a loss given default (LGD). The Westpac risk rating system has a tiered scale of risk grades for both non-defaulted customers and defaulted customers. Non-defaulted CRGs are mapped to Moody’s and Standard & Poor’s (S&P) external senior ranking unsecured ratings.
Customers that are not transaction-managed (referred to as the program-managed portfolio) are segmented into pools of similar risk. Segments are created by analysing characteristics that have historically proven predictive in determining if an account is likely to go into default. Customers are then grouped according to these predictive characteristics and each segment assigned a PD and LGD.
The table below shows the current alignment between Westpac’s CRGs and the corresponding external rating. Note that only high-level CRG groupings are shown.
Financial Statement Disclosure Westpac CRG Moody’s Rating S&P Rating
Strong A Aaa – Aa3 AAA – AA–
B A1 – A3 A+ – A–
C Baa1 – Baa3 BBB+ – BBB–
Good/satisfactory D Ba1 – B1 BB+ – B+
Financial Statement Disclosure Westpac CRG Definitions
Weak E Watchlist
F Special Mention
Weak/default/non-performing G – H Substandard/Default
Control mechanisms for the credit risk rating system Westpac’s credit risk rating system is reviewed annually to confirm that the rating criteria and procedures are appropriate given the current portfolio and external conditions. The BRCC and RISKCO monitor the risk profile, performance and management of Westpac’s credit portfolio and development and review of key credit risk policies. All models materially impacting the risk rating process are periodically reviewed in accordance with Westpac’s model risk policies. Specific credit risk estimates (including PD, LGD and exposure at default (EAD) levels) are overseen, reviewed annually and approved by the Credit Risk Estimates Committee (a subcommittee of RISKCO).
202 2014 Westpac Group Annual Report
Notes to the financial statements Note 27. Financial risk (continued) 27.2.4 Credit risk mitigation, collateral and other credit enhancements Westpac uses a variety of techniques to reduce the credit risk arising from its lending activities. Enforceable legal documentation establishes Westpac’s direct, irrevocable and unconditional recourse to any collateral, security or other credit enhancements provided.
The table below describes the nature of collateral held for financial asset classes:
Cash and other balances held with central banks, including regulatory deposits
These exposures are generally considered to be low risk due to the nature of the counterparties. Collateral is generally not sought on these balances.
Receivables due from other financial institutions
These exposures are mainly to relatively low risk banks (Rated A+, AA– or better). Collateral is generally not sought on these balances.
Derivative financial instruments Master netting agreements are typically used to enable the effects of derivative assets and liabilities with the same counterparty to be offset when measuring these exposures. Additionally, collateralisation agreements are also typically entered into with major institutional counterparties to avoid the potential build up of excessive mark-to-market positions. Derivative transactions are increasingly being performed through clearing houses.
Trading securities and other financial assets designated at fair value
These exposures are carried at fair value which reflects the credit risk. No collateral is sought directly from the issuer or counterparty; however this may be implicit in the terms of the instrument (such as an asset-backed security). The terms of debt securities may include collateralisation.
Available-for-sale securities Collateral is not sought directly with respect to these exposures; however collateralisation may be implicit in the structure of the asset.
Loans – housing and personal1 Housing loans are secured by a mortgage over property, and additional security may take the form of guarantees and deposits. Personal lending (including credit cards and overdrafts) is predominantly unsecured. Where security is taken, it is restricted to eligible motor vehicles.
Loans – business1 Loans – business may be secured, partially secured or unsecured. Security is typically taken by way of a mortgage over property and/or a general security agreement over business assets, or other assets. Other forms of credit protection may also be sought or taken out if warranted.
Life insurance assets These assets are carried at fair value, which reflects the credit risk. Collateral is typically not held other than for investments in Australian mortgages where recourse to a charge over the underlying properties is held.
Due from subsidiaries These exposures are generally considered to be low risk due to the nature of the counterparties. Collateral is generally not sought on these balances.
1 This includes collateral held in relation to associated credit commitments.
Risk reduction Westpac recognises the following as eligible collateral for credit risk mitigation:
cash, primarily in Australian dollars (AUD), New Zealand dollars (NZD), US dollars (USD), Canadian dollars (CAD), British pounds (GBP) or European Union euro (EUR);
bonds issued by Australian Commonwealth, State and Territory governments or their Public Sector Enterprises, provided these attract a zero risk-weighting under Australian Prudential Standard (APS) 112;
securities issued by other specified AA– / Aa3 or better rated sovereign governments; and credit-linked notes (provided the proceeds are invested in cash or other eligible collateral described above).
2014 Westpac Group Annual Report 203

Note 27. Financial risk (continued) Risk transfer For mitigation by way of risk transfer, Westpac only recognises unconditional irrevocable guarantees or standby letters of credit issued by, or eligible credit derivative protection bought from, the following entities provided they are not related to the underlying obligor:
sovereign entities; public sector entities in Australia and New Zealand; ADIs and overseas banks; and other entities with a minimum risk grade equivalent of A3 / A–. Management of risk mitigation Westpac facilitates the management of these risks through controls covering:
collateral valuation and management; credit portfolio management; and netting. Collateral valuation and management Westpac revalues collateral related to financial markets positions on a daily basis to monitor the net risk position, and has formal processes in place so that calls for collateral top-up or exposure reduction are made promptly. An independent operational unit has responsibility for monitoring these positions. The collaterisation arrangements are documented via the Credit Support Annex of the International Swaps and Derivatives Association (ISDA) dealing agreements.
Credit Portfolio Management Credit Portfolio Management (CPM) is a division that manages the overall risk in Westpac’s corporate, sovereign and bank credit portfolios. CPM includes a dedicated portfolio trading desk with the specific mandate of actively monitoring the underlying exposure and any offsetting hedge positions. Specific reporting is maintained and monitored on the matching of hedges with underlying facilities, with any adjustments to hedges (including unwinds or extensions) managed dynamically. CPM purchases credit protection from entities meeting our acceptability criteria as described under the Risk reduction and Risk transfer sections above. CPM also sells protection to diversify risk.
Netting Risk reduction by way of current account set-off is recognised for exposures to creditworthy customers domiciled in Australia and New Zealand only. Customers are required to enter into formal agreements giving Westpac the unfettered right to set-off gross credit and debit balances in their nominated accounts to determine Westpac’s net exposure within each of these two jurisdictions. Cross-border set-offs are not permitted.
Close-out netting is undertaken for off balance sheet financial market transactions with counterparties with whom Westpac has entered into a single bilateral master netting agreement which allows such netting in specified jurisdictions, and is supported by a written and reasoned legal opinion on the enforceability of that agreement. Close-out netting effectively aggregates pre-settlement risk exposure at time of default, thus reducing overall exposure.
27.2.5 Credit risk concentrations A concentration of credit risk exists when a number of counterparties are engaged in similar activities and have similar economic characteristics that would cause their ability to meet contractual obligations to be similarly affected by changes in economic or other conditions.
Westpac monitors its credit portfolio to manage risk concentrations. Exposures are actively managed from a portfolio perspective, with risk mitigation techniques used to rebalance the portfolio.
Individual customers or groups of related customers Westpac has large exposure limits governing the aggregate size of credit exposure normally acceptable to individual customers and groups of related customers. These limits are tiered by customer risk grade.
Specific industries Exposures to businesses, governments and other financial institutions are classified into a number of industry clusters based on groupings of related Australian and New Zealand Standard Industrial Classification (ANZSIC) codes and are monitored against industry risk appetite limits. The level of industry risk is measured on a dynamic basis.
Individual countries Westpac has limits governing risks related to individual countries, such as political situations, government policies, economic conditions or other country-specific events, that may adversely affect either a customer’s ability to purchase or transfer currency to meet its obligations to Westpac, or Westpac’s ability to realise its assets in a particular country. Such risks include, but are not limited to, exchange control events, nationalisation, war, disaster, economic meltdown or government failure.
204 2014 Westpac Group Annual Report

Notes to the financial statements Note 27. Financial risk (continued) The table below sets out the maximum exposure to credit risk (excluding any collateral received) and the credit risk concentrations to which the Group and the Parent Entity are exposed. The total will not reconcile to the Group or Parent Entity’s total assets on the balance sheet as cash, non-financial assets and other financial assets have been excluded from the table below. Investments in subsidiaries and amounts due from subsidiaries have also been excluded from the Parent Entity’s disclosure.
Consolidated 2014
TradingSecurities and
Other Financial Assets
Designated at Fair Value
Available-For-Sale
Securities
Loans - Housing and
PersonalLoans -
Business Derivatives1
Life Insurance
Assets
Total (On Balance
Sheet)
Credit Commit-
ments $m $m $m $m $m $m $m $m AustraliaAccommodation, cafes and restaurants - - 185 7,262 11 69 7,527 1,081Agriculture, forestry and fishing - - 124 7,100 19 - 7,243 1,699Construction 3 - 474 5,942 31 31 6,481 3,648Finance and insurance 10,824 11,746 2,295 12,349 33,883 7,143 78,240 11,838Government, administration and defence 24,126 19,492 4 780 371 - 44,773 1,366Manufacturing 73 - 189 9,080 484 1,185 11,011 7,114Mining 81 - 39 3,254 168 599 4,141 2,948Property, property services and business services 54 2 4,178 50,972 477 703 56,386 17,149Services2 187 9 841 10,033 131 403 11,604 6,162Trade3 114 - 562 15,054 223 206 16,159 8,241Transport and storage 47 191 91 9,239 544 63 10,175 4,824Utilities4 427 125 36 3,236 867 389 5,080 3,744Retail lending 140 - 365,334 488 43 - 366,005 75,427Other - 8 - 2,114 115 6 2,243 1,077Total Australia 36,076 31,573 374,352 136,903 37,367 10,797 627,068 146,318New ZealandAccommodation, cafes and restaurants - - 275 160 - 1 436 80Agriculture, forestry and fishing 2 - 474 5,999 27 2 6,504 685Construction - - 702 362 2 1 1,067 452Finance and insurance 1,659 555 715 1,159 3,059 137 7,284 1,754Government, administration and defence 1,392 2,100 5 349 147 53 4,046 916Manufacturing 4 - 357 1,848 55 4 2,268 1,611Mining - - 18 484 - 1 503 60Property, property services and business services 3 - 6,034 5,984 163 - 12,184 2,340Services2 8 - 1,075 998 4 2 2,087 799Trade3 - - 1,001 1,878 10 - 2,889 1,363Transport and storage 12 - 173 868 26 - 1,079 415Utilities4 60 39 59 1,004 241 9 1,412 1,473Retail lending - - 26,300 51 - - 26,351 6,982Other 1 37 3 135 1 - 177 248Total New Zealand 3,141 2,731 37,191 21,279 3,735 210 68,287 19,178
1 Derivatives give rise to credit risk where there is a positive current fair value. Credit derivatives also expose the writer of the contract to the risk of default of the referenced entity. See Note 29 for further details regarding credit derivative exposures.
2 Services includes education, health and community services, cultural and recreational services and personal and other services. 3 Trade includes wholesale trade and retail trade. 4 Utilities includes electricity, gas and water and communication services.
2014 Westpac Group Annual Report 205

Note 27. Financial risk (continued)
TradingSecurities and
Other Financial Assets
Designated at Fair Value
Available-For-Sale
Securities
Loans - Housing and
PersonalLoans -
Business Derivatives1
Life Insurance
Assets
Total (On Balance
Sheet)
Credit Commit-
ments $m $m $m $m $m $m $m $m Other overseasAccommodation, cafes and restaurants - - 3 124 - - 127 32Agriculture, forestry and fishing - - 1 464 - - 465 179Construction - - 8 112 - - 120 157Finance and insurance 2,188 717 1 2,005 285 - 5,196 2,437Government, administration and defence 4,418 986 1 34 4 - 5,443 51Manufacturing 31 - 3 1,818 11 - 1,863 4,264Mining 43 - - 4,083 2 - 4,128 1,188Property, property services and business services - - 58 372 - - 430 368Services2 - - 6 407 - - 413 21Trade3 - - 8 1,730 - - 1,738 1,455Transport and storage - - 4 685 - - 689 187Utilities4 12 17 - 701 - - 730 203Retail lending - - 1,052 59 - - 1,111 38Other - - 12 40 - - 52 76Total other overseas 6,692 1,720 1,157 12,634 302 - 22,505 10,656Other risk concentrationsAmounts due from financial institutions 7,424Regulatory deposits 1,528Total gross credit risk 45,909 36,024 412,700 170,816 41,404 11,007 726,812 176,152
Consolidated 2014
1 Derivatives give rise to credit risk where there is a positive current fair value. Credit derivatives also expose the writer of the contract to the risk of
default of the referenced entity. See Note 29 for further details regarding credit derivative exposures. 2 Services includes education, health and community services, cultural and recreational services and personal and other services. 3 Trade includes wholesale trade and retail trade. 4 Utilities includes electricity, gas and water and communication services.
206 2014 Westpac Group Annual Report

Notes to the financial statements Note 27. Financial risk (continued)
Consolidated 2013
TradingSecurities and
Other Financial Assets
Designated at Fair Value
Available-For-Sale
Securities
Loans - Housing and
PersonalLoans -
Business Derivatives1
Life Insurance
Assets2
Total (On Balance
Sheet)
Credit Commit-
ments $m $m $m $m $m $m $m $m AustraliaAccommodation, cafes and restaurants - - 157 6,951 19 38 7,165 1,218Agriculture, forestry and fishing - - 115 7,189 29 - 7,333 1,615Construction - - 442 5,607 26 - 6,075 3,980Finance and insurance 15,043 8,725 1,944 11,315 21,568 10,771 69,366 16,151Government, administration and defence 20,513 17,464 3 878 192 - 39,050 1,483Manufacturing 51 - 198 9,217 423 159 10,048 8,005Mining 34 - 39 2,300 232 513 3,118 3,006Property, property services and business services 49 3 3,358 45,672 489 585 50,156 13,698Services3 327 9 777 8,938 121 283 10,455 5,291Trade4 53 - 524 14,095 255 361 15,288 7,078Transport and storage 46 188 94 8,774 593 46 9,741 3,186Utilities5 304 123 34 2,968 891 179 4,499 2,979Retail lending 106 - 340,139 - 33 - 340,278 70,435Other - - - 2,416 88 3 2,507 288Total Australia 36,526 26,512 347,824 126,320 24,959 12,938 575,079 138,413New ZealandAccommodation, cafes and restaurants - - 307 148 - 1 456 78Agriculture, forestry and fishing 16 1 528 5,602 30 4 6,181 635Construction - - 784 411 1 1 1,197 364Finance and insurance 2,624 590 681 1,033 2,564 162 7,654 1,496Government, administration and defence 1,169 1,863 6 602 119 28 3,787 917Manufacturing - - 405 1,661 48 4 2,118 1,369Mining - - 23 455 2 - 480 145Property, property services and business services 7 - 5,225 5,638 122 - 10,992 1,936Services3 - - 1,261 1,218 23 4 2,506 868Trade4 1 - 1,118 1,706 17 - 2,842 1,162Transport and storage 37 - 203 885 35 - 1,160 501Utilities5 39 - 74 1,103 299 7 1,522 1,324Retail lending - - 24,417 46 - - 24,463 6,376Other - - 1 44 - - 45 257Total New Zealand 3,893 2,454 35,033 20,552 3,260 211 65,403 17,428
1 Derivatives give rise to credit risk where there is a positive current fair value. Credit derivatives also expose the writer of the contract to the risk of default of the referenced entity. See Note 29 for further details regarding credit derivative exposures.
2 Comparative information has been revised to conform to presentation with the current year. 3 Services includes education, health and community services, cultural and recreational services and personal and other services. 4 Trade includes wholesale trade and retail trade. 5 Utilities includes electricity, gas and water and communication services.
2014 Westpac Group Annual Report 207

Note 27. Financial risk (continued)
TradingSecurities and
Other Financial Assets
Designated at Fair Value
Available-For-Sale
Securities
Loans - Housing and
PersonalLoans -
Business Derivatives1
Life Insurance
Assets2
Total (On Balance
Sheet)
Credit Commit-
ments $m $m $m $m $m $m $m $m Other overseasAccommodation, cafes and restaurants - - 6 124 - - 130 34Agriculture, forestry and fishing - - 1 375 - - 376 164Construction - - 6 166 - - 172 112Finance and insurance 3,857 428 1 1,245 128 - 5,659 1,297Government, administration and defence 4,813 608 1 30 9 - 5,461 3Manufacturing - - 4 1,249 - - 1,253 3,512Mining - - - 2,443 - - 2,443 1,817Property, property services and business services - - 52 310 - - 362 217Services3 - - 4 168 - - 172 20Trade4 - - 10 2,180 - - 2,190 1,544Transport and storage - - 4 436 - - 440 160Utilities5 - 9 - 299 - - 308 170Retail lending - - 848 52 - - 900 127Other - - 9 54 - - 63 -Total other overseas 8,670 1,045 946 9,131 137 - 19,929 9,177Other risk concentrationsAmounts due from financial institutions 11,210Regulatory deposits 1,571Total gross credit risk 49,089 30,011 383,803 156,003 28,356 13,149 673,192 165,018
Consolidated 2013
1 Derivatives give rise to credit risk where there is a positive current fair value. Credit derivatives also expose the writer of the contract to the risk of
default of the referenced entity. See Note 29 for further details regarding credit derivative exposures. 2 Comparative information has been revised to conform to presentation with the current year. 3 Services includes education, health and community services, cultural and recreational services and personal and other services. 4 Trade includes wholesale trade and retail trade. 5 Utilities includes electricity, gas and water and communication services.
208 2014 Westpac Group Annual Report

Notes to the financial statements Note 27. Financial risk (continued)
TradingSecurities and
Other Financial Assets
Designated at Fair Value
Available-For-Sale
Securities
Loans - Housing and
PersonalLoans -
Business Derivatives1
Life Insurance
Assets
Total (On Balance
Sheet)
Credit Commit-
ments $m $m $m $m $m $m $m $m AustraliaAccommodation, cafes and restaurants - - 185 6,855 11 - 7,051 1,080Agriculture, forestry and fishing - - 124 6,586 19 - 6,729 1,699Construction 3 - 474 4,966 31 - 5,474 3,647Finance and insurance 10,373 11,736 2,295 12,054 33,879 - 70,337 11,838Government, administration and defence 24,119 19,491 4 708 371 - 44,693 1,366Manufacturing 73 - 189 8,595 484 - 9,341 7,114Mining 65 - 40 3,113 168 - 3,386 2,947Property, property services and business services 54 2 4,177 48,605 477 - 53,315 17,144Services2 187 9 841 9,137 130 - 10,304 6,156Trade3 114 - 562 14,004 223 - 14,903 8,095Transport and storage 23 15 91 8,553 544 - 9,226 4,819Utilities4 427 - 37 3,199 867 - 4,530 3,744Retail Lending 140 - 358,167 462 43 - 358,812 75,427Other - 8 - 1,404 115 - 1,527 1,071Total Australia 35,578 31,261 367,186 128,241 37,362 - 599,628 146,147New ZealandAccommodation, cafes and restaurants - - - - - - - -Agriculture, forestry and fishing 2 - - 6 27 - 35 14Construction - - - 4 2 - 6 11Finance and insurance 873 - - 1 2,992 - 3,866 74Government, administration and defence 1,129 - - 4 147 - 1,280 113Manufacturing 4 - - 81 55 - 140 120Mining - - - - - - - -Property, property services and business services 3 - - 4 163 - 170 30Services2 8 - - 5 4 - 17 5Trade3 - - - 196 10 - 206 231Transport and storage 12 - - 4 26 - 42 43Utilities4 22 - - - 241 - 263 226Retail lending - - - - - - - 13Other 1 - - - 1 - 2 1Total New Zealand 2,054 - - 305 3,668 - 6,027 881
Parent Entity 2014
1 Derivatives give rise to credit risk where there is a positive current fair value. Credit derivatives also expose the writer of the contract to the risk of
default of the referenced entity. See Note 29 for further details regarding credit derivative exposures. 2 Services includes education, health and community services, cultural and recreational services and personal and other services. 3 Trade includes wholesale trade and retail trade. 4 Utilities includes electricity, gas and water and communication services.
2014 Westpac Group Annual Report 209

Note 27. Financial risk (continued)
TradingSecurities and
Other Financial Assets
Designated at Fair Value
Available-For-Sale
Securities
Loans - Housing and
PersonalLoans -
Business Derivatives1
Life Insurance
Assets
Total (On Balance
Sheet)
Credit Commit-
ments $m $m $m $m $m $m $m $m Other overseasAccommodation, cafes and restaurants - - 3 92 - - 95 32Agriculture, forestry and fishing - - 1 461 - - 462 178Construction - - 5 84 - - 89 150Finance and insurance 2,188 377 1 1,970 271 - 4,807 2,436Government, administration and defence 4,418 371 - 34 4 - 4,827 51Manufacturing 31 - 2 1,752 - - 1,785 4,147Mining 43 - - 4,076 2 - 4,121 1,173Property, property services and business services - - 25 178 - - 203 349Services2 - - 3 373 - - 376 20Trade3 - - 5 1,602 - - 1,607 1,325Transport and storage - - 3 509 - - 512 166Utilities4 12 - - 665 - - 677 202Retail lending - - 543 28 - - 571 30Other - - 9 37 - - 46 3Total other overseas 6,692 748 600 11,861 277 - 20,178 10,262Other risk concentrationsAmounts due from financial institutions 5,483Regulatory deposits 1,389Total gross credit risk 44,324 32,009 367,786 140,407 41,307 - 632,705 157,290
Parent Entity 2014
1 Derivatives give rise to credit risk where there is a positive current fair value. Credit derivatives also expose the writer of the contract to the risk of
default of the referenced entity. See Note 29 for further details regarding credit derivative exposures. 2 Services includes education, health and community services, cultural and recreational services and personal and other services. 3 Trade includes wholesale trade and retail trade. 4 Utilities includes electricity, gas and water and communication services.
210 2014 Westpac Group Annual Report

Notes to the financial statements Note 27. Financial risk (continued)
TradingSecurities and
Other Financial Assets
Designated at Fair Value
Available-For-Sale
Securities
Loans - Housing and
PersonalLoans -
Business Derivatives1
Life Insurance
Assets
Total (On Balance
Sheet)
Credit Commit-
ments $m $m $m $m $m $m $m $m AustraliaAccommodation, cafes and restaurants - - 155 6,857 19 - 7,031 1,218Agriculture, forestry and fishing - - 114 7,007 29 - 7,150 1,615Construction - - 437 4,877 26 - 5,340 3,978Finance and insurance 14,451 8,713 1,924 11,088 21,623 - 57,799 16,151Government, administration and defence 20,501 17,464 3 801 192 - 38,961 1,483Manufacturing 51 - 196 8,920 423 - 9,590 8,005Mining 4 - 38 2,175 232 - 2,449 3,005Property, property services and business services 39 2 3,328 44,801 489 - 48,659 13,697Services2 327 9 770 8,215 121 - 9,442 5,290Trade3 53 - 519 13,601 255 - 14,428 7,056Transport and storage 21 15 93 8,217 593 - 8,939 3,184Utilities4 304 - 34 2,944 891 - 4,173 2,980Retail Lending 106 - 336,253 - 33 - 336,392 70,434Other - - - 2,046 86 - 2,132 288Total Australia 35,857 26,203 343,864 121,549 25,012 - 552,485 138,384New ZealandAccommodation, cafes and restaurants - - - - - - - -Agriculture, forestry and fishing 16 - - 8 30 - 54 14Construction - - - 3 1 - 4 11Finance and insurance 1,468 - - 22 2,561 - 4,051 60Government, administration and defence 924 - - 73 119 - 1,116 118Manufacturing - - - 2 48 - 50 103Mining - - - - 2 - 2 -Property, property services and business services 7 - - 3 122 - 132 23Services2 - - - 186 23 - 209 11Trade3 1 - - - 17 - 18 202Transport and storage 37 - - 11 35 - 83 39Utilities4 39 - - - 299 - 338 253Retail lending - - - - - - - 1Other - - - - 2 - 2 -Total New Zealand 2,492 - - 308 3,259 - 6,059 835
Parent Entity 2013
1 Derivatives give rise to credit risk where there is a positive current fair value. Credit derivatives also expose the writer of the contract to the risk of
default of the referenced entity. See Note 29 for further details regarding credit derivative exposures. 2 Services includes education, health and community services, cultural and recreational services and personal and other services. 3 Trade includes wholesale trade and retail trade. 4 Utilities includes electricity, gas and water and communication services.
2014 Westpac Group Annual Report 211

Note 27. Financial risk (continued)
TradingSecurities and
Other Financial Assets
Designated at Fair Value
Available-For-Sale
Securities
Loans - Housing and
PersonalLoans -
Business Derivatives1
Life Insurance
Assets
Total (On Balance
Sheet)
Credit Commit-
ments $m $m $m $m $m $m $m $m Other overseasAccommodation, cafes and restaurants - - 6 99 - - 105 33Agriculture, forestry and fishing - - 1 370 - - 371 162Construction - - 3 146 - - 149 108Finance and insurance 3,857 186 1 1,241 125 - 5,410 1,297Government, administration and defence 4,812 5 - 30 9 - 4,856 3Manufacturing - - 3 1,184 - - 1,187 3,366Mining - - - 2,427 - - 2,427 1,803Property, property services and business services - - 20 166 - - 186 205Services2 - - 2 156 - - 158 19Trade3 - - 5 2,028 - - 2,033 1,493Transport and storage - - 3 283 - - 286 144Utilities4 - - - 271 - - 271 169Retail lending - - 358 34 - - 392 35Other - - 8 47 - - 55 -Total other overseas 8,669 191 410 8,482 134 - 17,886 8,837Other risk concentrationsAmounts due from financial institutions 9,317Regulatory deposits 1,463Total gross credit risk 47,018 26,394 344,274 130,339 28,405 - 587,210 148,056
Parent Entity 2013
1 Derivatives give rise to credit risk where there is a positive current fair value. Credit derivatives also expose the writer of the contract to the risk of
default of the referenced entity. See Note 29 for further details regarding credit derivative exposures. 2 Services includes education, health and community services, cultural and recreational services and personal and other services. 3 Trade includes wholesale trade and retail trade. 4 Utilities includes electricity, gas and water and communication services.
212 2014 Westpac Group Annual Report

Notes to the financial statements Note 27. Financial risk (continued) 27.2.6 Credit quality of financial assets The tables below segregate the financial assets of the Group and Parent Entity between financial assets that are neither past due nor impaired, past due but not impaired and impaired. Non-financial assets of the Group and Parent Entity are excluded from the tables below and therefore the total will not reconcile to total assets on the balance sheets.
An asset is considered to be past due when any payment under the contractual terms has been missed. The amount included as past due is the entire contractual balance, rather than the overdue portion. The breakdown in the tables below does not always align with the underlying basis by which credit risk is managed within Westpac.
Financial assets of the Group at 30 September can be disaggregated as follows:
Neither Past Past Due TotalDue Nor But Not Impairment CarryingImpaired Impaired Impaired Total Provision Value
$m $m $m $m $m $mCash and balances with central banks 25,760 - - 25,760 - 25,760Receivables due from other financial institutions 7,424 - - 7,424 - 7,424Trading securities and other financial assets designated at fair value 45,908 - 1 45,909 - 45,909Derivative financial instruments 41,404 - - 41,404 - 41,404Available-for-sale securities 36,024 - - 36,024 - 36,024Loans:
Loans – housing and personal 397,583 14,649 468 412,700 (1,117) 411,583Loans – business 165,458 3,486 1,872 170,816 (2,056) 168,760
Life insurance assets 11,002 5 - 11,007 - 11,007Regulatory deposits with central banks overseas 1,528 - - 1,528 - 1,528Other financial assets 5,049 39 5 5,093 - 5,093Total 737,140 18,179 2,346 757,665 (3,173) 754,492
Consolidated 2014
Neither Past Past Due TotalDue Nor But Not Impairment CarryingImpaired Impaired Impaired Total Provision Value
$m $m $m $m $m $mCash and balances with central banks 11,699 - - 11,699 - 11,699Receivables due from other financial institutions 11,210 - - 11,210 - 11,210Trading securities and other financial assets designated at fair value 49,087 - 2 49,089 - 49,089Derivative financial instruments 28,356 - - 28,356 - 28,356Available-for-sale securities 30,010 - 1 30,011 - 30,011Loans:
Loans – housing and personal 369,740 13,455 608 383,803 (1,101) 382,702Loans – business 149,272 3,739 2,992 156,003 (2,541) 153,462
Life insurance assets 13,144 5 - 13,149 - 13,149Regulatory deposits with central banks overseas 1,571 - - 1,571 - 1,571Other financial assets 3,697 44 9 3,750 - 3,750Total 667,786 17,243 3,612 688,641 (3,642) 684,999
Consolidated 2013
2014 Westpac Group Annual Report 213

Note 27. Financial risk (continued) Financial assets of the Parent Entity at 30 September can be disaggregated as follows:
Neither Past Past Due TotalDue Nor But Not Impairment CarryingImpaired Impaired Impaired Total Provision Value
$m $m $m $m $m $mCash and balances with central banks 23,400 - - 23,400 - 23,400Receivables due from other financial institutions 5,483 - - 5,483 - 5,483Trading securities and other financial assets designated at fair value 44,323 - 1 44,324 - 44,324Derivative financial instruments 41,307 - - 41,307 - 41,307Available-for-sale securities 32,009 - - 32,009 - 32,009Loans:
Loans – housing and personal 354,597 12,809 380 367,786 (889) 366,897Loans – business 135,897 2,994 1,516 140,407 (1,700) 138,707
Regulatory deposits with central banks overseas 1,389 - - 1,389 - 1,389Due from subsidiaries 140,098 - - 140,098 - 140,098Other financial assets 4,490 33 4 4,527 - 4,527Total 782,993 15,836 1,901 800,730 (2,589) 798,141
Parent Entity 2014
Neither Past Past Due TotalDue Nor But Not Impairment CarryingImpaired Impaired Impaired Total Provision Value
$m $m $m $m $m $mCash and balances with central banks 9,509 - - 9,509 - 9,509Receivables due from other financial institutions 9,317 - - 9,317 - 9,317Trading securities and other financial assets designated at fair value 47,016 - 2 47,018 - 47,018Derivative financial instruments 28,405 - - 28,405 - 28,405Available-for-sale securities 26,394 - - 26,394 - 26,394Loans:
Loans – housing and personal 332,173 11,649 452 344,274 (867) 343,407Loans – business 124,650 3,271 2,418 130,339 (2,089) 128,250
Regulatory deposits with central banks overseas 1,463 - - 1,463 - 1,463Due from subsidiaries 119,038 - - 119,038 - 119,038Other financial assets 3,179 38 7 3,224 - 3,224Total 701,144 14,958 2,879 718,981 (2,956) 716,025
Parent Entity 2013
214 2014 Westpac Group Annual Report

Notes to the financial statements Note 27. Financial risk (continued) 27.2.7 Financial assets that are neither past due nor impaired The credit quality of financial assets of the Group that are neither past due nor impaired have been assessed by reference to the credit risk rating system adopted internally:
StrongGood/
Satisfactory Weak Total StrongGood/
Satisfactory Weak Total $m $m $m $m $m $m $m $m
Cash and balances with central banks 25,760 - - 25,760 11,699 - - 11,699 Receivables due from other financial institutions 7,380 44 - 7,424 11,210 - - 11,210 Trading securities and other financial assets designated at fair value 45,684 222 2 45,908 48,941 145 1 49,087 Derivative financial instruments 40,105 1,253 46 41,404 27,246 1,060 50 28,356 Available-for-sale securities 35,355 652 17 36,024 29,403 606 1 30,010 Loans:
Loans – housing and personal 312,648 83,672 1,263 397,583 288,940 79,425 1,375 369,740 Loans – business 74,323 86,438 4,697 165,458 63,197 80,703 5,372 149,272
Life insurance assets1 10,934 68 - 11,002 13,072 72 - 13,144 Regulatory deposits with central banks overseas 1,303 142 83 1,528 1,378 116 77 1,571 Other financial assets2 4,665 371 13 5,049 3,270 410 17 3,697 Total financial assets 558,157 172,862 6,121 737,140 498,356 162,537 6,893 667,786
Consolidated2014 2013
1 Life insurance assets include $8,951 million (2013: $9,296 million) of unit linked investment contract assets and $170 million (2013: $183 million) of
unrated investments in managed schemes and mortgages. The Group has no direct exposure to unit linked investments as the liability to policy holders is directly linked to the performance of these assets. The investments in managed schemes and mortgages are predominantly managed by the BT Financial Group.
2 Other financial assets includes accrued interest of $1,214 million (2013: $1,325 million) which is allocated to the relevant credit quality classifications in proportion to the loan balances to which it relates. Securities sold not yet delivered of $2,768 million (2013: $1,416 million) is also included in this balance which is allocated proportionately based on the trading securities balance classifications.
2014 Westpac Group Annual Report 215

Note 27. Financial risk (continued)
StrongGood/
Satisfactory Weak Total StrongGood/
Satisfactory Weak Total $m $m $m $m $m $m $m $m
Cash and balances with central banks 23,400 - - 23,400 9,509 - - 9,509 Receivables due from other financial institutions 5,439 44 - 5,483 9,317 - - 9,317 Trading securities and other financial assets designated at fair value 44,134 187 2 44,323 46,912 103 1 47,016 Derivative financial instruments 40,008 1,253 46 41,307 27,295 1,060 50 28,405 Available-for-sale securities 31,974 18 17 32,009 26,377 16 1 26,394 Loans:
Loans – housing and personal 298,686 54,892 1,019 354,597 278,576 52,498 1,099 332,173 Loans – business 66,898 65,217 3,782 135,897 55,752 64,569 4,329 124,650
Regulatory deposits with central banks overseas 1,300 6 83 1,389 1,379 7 77 1,463 Due from subsidiaries 140,098 - - 140,098 119,038 - - 119,038 Other financial assets1 4,225 255 10 4,490 2,868 297 14 3,179 Total financial assets 656,162 121,872 4,959 782,993 577,023 118,550 5,571 701,144
Parent Entity20132014
1 Other financial assets includes accrued interest of $1,029 million (2013: $1,159 million) which is allocated to the relevant credit quality classifications
in proportionate to the loan balances to which it relates. Securities sold not yet delivered of $2,765 million (2013: $1,383 million) is also included in this balance which is allocated proportionately based on the trading securities balance classifications.
The following analysis shows our assessment of the coverage provided by collateral held in support of financial assets that are neither past due nor impaired. The estimated realisable value of collateral held is based on a combination of:
formal valuations currently held in respect of such collateral; and management’s assessment of the estimated realisable value of all collateral held given its experience with similar types of
assets in similar situations and the circumstances peculiar to the subject collateral. This analysis also takes into consideration any other relevant knowledge available to management at the time. It is our practice to obtain updated valuations when either management considers that it cannot satisfactorily estimate a realisable value or when it is determined to be necessary to move to a forced sale of the collateral.
In the table below, a financial asset that is neither past due nor impaired is deemed to be ‘fully secured’ where the ratio of the asset amount to our current estimated net present value of the realisable collateral is less than or equal to 100%. Such assets are deemed to be ‘partially secured’ when this ratio exceeds 100% but not more than 150%, and ‘unsecured’ when either no security is held (e.g. can include credit cards, personal loans, and exposure to highly rated corporate entities) or where the secured loan to estimated recoverable value exceeds 150%.
Consolidated2014 2013
Loans – Loans –Housing and Loans – Housing and Loans –
Personal Business Total Personal Business Total% % % % % %
Fully secured 95.5 52.3 82.8 95.8 54.3 83.8Partially secured 1.8 24.5 8.5 1.3 24.3 7.9Unsecured 2.7 23.2 8.7 2.9 21.4 8.3Total 100.0 100.0 100.0 100.0 100.0 100.0
216 2014 Westpac Group Annual Report

Notes to the financial statements Note 27. Financial risk (continued)
Parent Entity2014 2013
Loans – Loans –Housing and Loans – Housing and Loans –
Personal Business Total Personal Business Total% % % % % %
Fully secured 97.3 52.5 84.9 97.3 54.0 85.5Partially secured 0.4 23.5 6.8 0.4 25.2 7.2Unsecured 2.3 24.0 8.3 2.3 20.8 7.3Total 100.0 100.0 100.0 100.0 100.0 100.0
27.2.8 Financial assets that are past due, but not impaired An age analysis of financial assets that are past due, but not impaired is set out in the table below. For the purposes of this analysis an asset is considered to be past due when any payment under the contractual terms has been missed. The amount included is the entire contractual amount, rather than the overdue amount.
The Group expends considerable effort in monitoring overdue assets. Assets may be overdue for a number of reasons, including late payments or incomplete documentation. Late payment may be influenced by factors such as the holiday periods and the timing of weekends.
Financial assets that were past due, but not impaired can be disaggregated based on days overdue at 30 September as follows:
Consolidated2014 2013
1–5 days 6–89 days 90+ days Total 1–5 days 6–89 days 90+ days Total $m $m $m $m $m $m $m $m
Loans Loans – housing and personal 4,253 8,872 1,524 14,649 3,919 8,028 1,508 13,455Loans – business 780 2,274 432 3,486 760 2,289 690 3,739
Life insurance assets - 5 - 5 - 5 - 5Other financial assets 11 24 4 39 12 26 6 44Total 5,044 11,175 1,960 18,179 4,691 10,348 2,204 17,243
Parent Entity2014 2013
1–5 days 6–89 days 90+ days Total 1–5 days 6–89 days 90+ days Total $m $m $m $m $m $m $m $m
Loans Loans – housing and personal 3,797 7,557 1,455 12,809 3,403 6,811 1,435 11,649Loans – business 570 2,052 372 2,994 605 2,071 595 3,271
Other financial assets 9 20 4 33 10 23 5 38Total 4,376 9,629 1,831 15,836 4,018 8,905 2,035 14,958
The following analysis shows our assessment of the coverage provided by collateral held in support of financial assets that are past due but not impaired. The estimated realisable value of collateral held is based on a combination of:
formal valuations currently held in respect of such collateral; and management’s assessment of the estimated realisable value of all collateral held given its experience with similar types of
assets in similar situations and the circumstances peculiar to the subject collateral. This analysis also takes into consideration any other relevant knowledge available to management at the time. It is our practice to obtain updated valuations when either management considers that it cannot satisfactorily estimate a realisable value or when it is determined to be necessary to move to a forced sale of the collateral.
2014 Westpac Group Annual Report 217
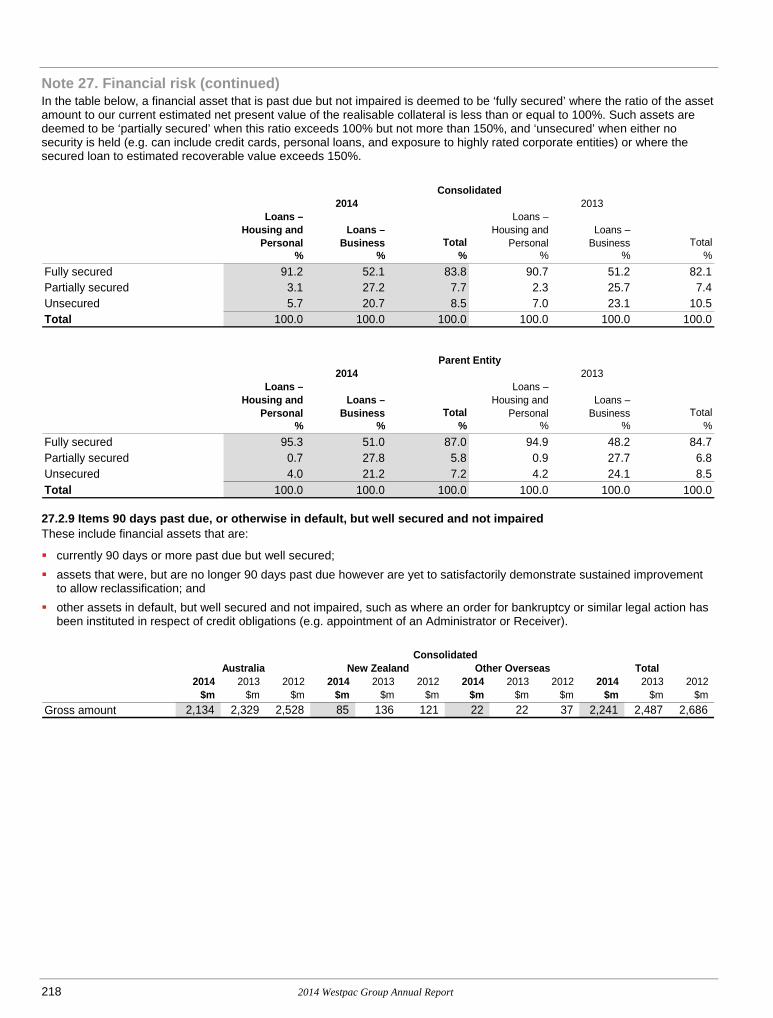
Note 27. Financial risk (continued) In the table below, a financial asset that is past due but not impaired is deemed to be ‘fully secured’ where the ratio of the asset amount to our current estimated net present value of the realisable collateral is less than or equal to 100%. Such assets are deemed to be ‘partially secured’ when this ratio exceeds 100% but not more than 150%, and ‘unsecured’ when either no security is held (e.g. can include credit cards, personal loans, and exposure to highly rated corporate entities) or where the secured loan to estimated recoverable value exceeds 150%.
Consolidated2014 2013
Loans – Loans –Housing and Loans – Housing and Loans –
Personal Business Total Personal Business Total% % % % % %
Fully secured 91.2 52.1 83.8 90.7 51.2 82.1Partially secured 3.1 27.2 7.7 2.3 25.7 7.4Unsecured 5.7 20.7 8.5 7.0 23.1 10.5Total 100.0 100.0 100.0 100.0 100.0 100.0
Parent Entity2014 2013
Loans – Loans –Housing and Loans – Housing and Loans –
Personal Business Total Personal Business Total% % % % % %
Fully secured 95.3 51.0 87.0 94.9 48.2 84.7Partially secured 0.7 27.8 5.8 0.9 27.7 6.8Unsecured 4.0 21.2 7.2 4.2 24.1 8.5Total 100.0 100.0 100.0 100.0 100.0 100.0
27.2.9 Items 90 days past due, or otherwise in default, but well secured and not impaired These include financial assets that are:
currently 90 days or more past due but well secured; assets that were, but are no longer 90 days past due however are yet to satisfactorily demonstrate sustained improvement
to allow reclassification; and other assets in default, but well secured and not impaired, such as where an order for bankruptcy or similar legal action has
been instituted in respect of credit obligations (e.g. appointment of an Administrator or Receiver).
2014 2013 2012 2014 2013 2012 2014 2013 2012 2014 2013 2012 $m $m $m $m $m $m $m $m $m $m $m $m
Gross amount 2,134 2,329 2,528 85 136 121 22 22 37 2,241 2,487 2,686
TotalAustralia New Zealand Other OverseasConsolidated
218 2014 Westpac Group Annual Report

Notes to the financial statements Note 27. Financial risk (continued) 27.2.10 Impaired loans Financial assets assessed as impaired The gross amount of impaired loans, along with the provision for impairment, by class of asset at 30 September, is summarised in the tables below:
Consolidated2014 2013
Loans – Loans –Housing and Loans – Housing and Loans –
Personal Business Total Personal Business Total$m $m $m $m $m $m
Individually impairedGross amount 202 1,785 1,987 266 2,887 3,153 Impairment provision (96) (771) (867) (124) (1,240) (1,364) Carrying amount 106 1,014 1,120 142 1,647 1,789 Collectively impairedGross amount 266 87 353 342 105 447 Impairment provision (150) (30) (180) (156) (34) (190) Carrying amount 116 57 173 186 71 257 Total gross amount 468 1,872 2,340 608 2,992 3,600 Total impairment provision (246) (801) (1,047) (280) (1,274) (1,554) Total carrying amount 222 1,071 1,293 328 1,718 2,046
Parent Entity2014 2013
Loans – Loans –Housing and Loans – Housing and Loans –
Personal Business Total Personal Business Total$m $m $m $m $m $m
Individually impairedGross amount 153 1,430 1,583 173 2,324 2,497 Impairment provision (72) (647) (719) (87) (1,036) (1,123) Carrying amount 81 783 864 86 1,288 1,374 Collectively impairedGross amount 227 86 313 279 94 373 Impairment provision (127) (24) (151) (127) (29) (156) Carrying amount 100 62 162 152 65 217 Total gross amount 380 1,516 1,896 452 2,418 2,870 Total impairment provision (199) (671) (870) (214) (1,065) (1,279) Total carrying amount 181 845 1,026 238 1,353 1,591
2014 Westpac Group Annual Report 219

Note 27. Financial risk (continued) The following analysis shows our assessment of the coverage provided by collateral held in support of impaired financial assets. The estimated realisable value of collateral held is based on a combination of:
formal valuations currently held in respect of such collateral; and management’s assessment of the estimated realisable value of all collateral held given its experience with similar types of
assets in similar situations and the circumstances peculiar to the subject collateral. This analysis also takes into consideration any other relevant knowledge available to management at the time. It is our practice to obtain updated valuations when either management considers that it cannot satisfactorily estimate a realisable value or when it is determined to be necessary to move to a forced sale of the collateral.
In the table below, an individually impaired financial asset is deemed to be ‘fully secured’ where the ratio of the impaired asset amount to our current estimated net present value of realisable collateral is less than or equal to 100%. Such assets are deemed to be ‘partially secured’ when this ratio exceeds 100% but not more than 150%, and ‘unsecured’ when either no security is held (e.g. can include credit cards, personal loans and exposure to corporate entities) or where the secured loan to recoverable value exceeds 150%.
Consolidated2014 2013
Loans – Loans –Housing and Loans – Housing and Loans –
Personal Business Total Personal Business Total% % % % % %
Fully secured 61.1 25.1 32.3 63.3 24.8 31.3Partially secured 10.9 24.8 22.0 11.2 24.4 22.2Unsecured 28.0 50.1 45.7 25.5 50.8 46.5Total 100.0 100.0 100.0 100.0 100.0 100.0
Parent Entity2014 2013
Loans – Loans –Housing and Loans – Housing and Loans –
Personal Business Total Personal Business Total% % % % % %
Fully secured 66.2 25.9 33.6 73.3 23.4 31.3Partially secured 8.6 23.3 20.5 7.1 23.9 21.3Unsecured 25.2 50.8 45.9 19.6 52.7 47.4Total 100.0 100.0 100.0 100.0 100.0 100.0
Impaired loans comprise non-performing loans, overdrafts, personal loans, revolving credit facilities greater than 90 days past due and restructured loans.
Non-performing loans Non-performing loans are loans with an impaired internal risk grade, excluding restructured assets. These were attributed to the following geographical segments:
Consolidated
2014 2013 2012 2014 2013 2012 2014 2013 2012 2014 2013 2012 $m $m $m $m $m $m $m $m $m $m $m $m
Gross amount 1,580 2,574 3,212 397 586 743 53 89 79 2,030 3,249 4,034 Impairment provision (697) (1,099) (1,199) (130) (210) (224) (35) (54) (40) (862) (1,363) (1,463) Net 883 1,475 2,013 267 376 519 18 35 39 1,168 1,886 2,571
TotalOther OverseasNew ZealandAustralia
220 2014 Westpac Group Annual Report

Notes to the financial statements Note 27. Financial risk (continued) Overdrafts, personal loans and revolving credit facilities greater than 90 days past due Overdrafts, personal loans and revolving credit facilities greater than 90 days past due for the Group were attributed to the following geographical segments:
Consolidated
2014 2013 2012 2014 2013 2012 2014 2013 2012 2014 2013 2012$m $m $m $m $m $m $m $m $m $m $m $m
Gross amount 203 181 186 13 14 12 1 - 1 217 195 199 Impairment provision (132) (126) (126) (9) (9) (7) - - (1) (141) (135) (134) Net 71 55 60 4 5 5 1 - - 76 60 65
TotalAustralia New Zealand Other Overseas
Restructured financial assets Assets are deemed to be restructured financial assets when the original contractual terms have been formally modified to provide for concessions of interest or principal for reasons related to the financial difficulties of the customer.
Restructured financial assets for the Group were attributed to the following geographical segments:
2014 2013 2012 2014 2013 2012 2014 2013 2012 2014 2013 2012$m $m $m $m $m $m $m $m $m $m $m $m
Gross amount 34 34 43 - - - 59 122 110 93 156 153Impairment provision (23) (23) (19) - - - (21) (33) (25) (44) (56) (44)Net 11 11 24 - - - 38 89 85 49 100 109
Other OverseasConsolidated
New ZealandAustralia Total
Restructured financial assets of the Parent Entity as at 30 September were:
2014 2013$m $m
Gross amount 92 153Impairment provision (44) (56)Net 48 97
The following table summarises the interest received and forgone on impaired and restructured financial assets:
Consolidated 2014Australia Overseas Total
$m $m $mInterest received 13 16 29 Interest forgone 165 5 170
27.3 Funding and liquidity risk management Liquidity risk is the risk that the Group will be unable to fund assets and meet obligations as they become due. This risk could potentially arise as a result of:
an inability to meet both expected and unexpected current and future cashflows and collateral needs without affecting either daily operations or the financial condition of the bank; and/or
inadequate market depth or market disruption impacting the ability to offset or eliminate a position at the market price. Liquidity risk is managed through our BRCC-approved Liquidity Risk Management Framework.
Responsibility for liquidity management is delegated to Treasury, under the oversight of ALCO. Daily liquidity risk reports are circulated to, and reviewed by, local and senior staff in both Treasury and the independent Liquidity Risk team. Summary liquidity reports are submitted to senior staff weekly, ALCO and APRA monthly, and to BRCC quarterly. Treasury is also responsible for monitoring and managing our funding base so that it is prudently maintained, stable and adequately diversified.
2014 Westpac Group Annual Report 221

Note 27. Financial risk (continued) We model our ability to fund under both normal conditions and during a crisis situation, with models run globally and for specific geographical regions. This approach is designed to ensure that our funding framework is sufficiently flexible to accommodate a wide range of market conditions. The annual review of the Liquidity Risk Management Framework encompasses the funding scenarios modelled, the modelling approach, wholesale funding capacity, limit determination and minimum holdings of liquid assets. The Liquidity Risk Management Framework is reviewed by ALCO prior to approval by the BRCC.
Treasury also undertakes an annual funding review that outlines the funding strategy for the coming year. This review encompasses trends in global markets, peer analysis, wholesale funding capacity, expected funding requirements and a funding risk analysis. This strategy is continuously reviewed to take account of changing market conditions, investor sentiment and estimations of asset and liability growth rates. The annual funding strategy is reviewed and supported by ALCO prior to approval by the BRCC.
We maintain a contingency funding plan that details the broad actions to be taken in response to severe disruptions in our ability to fund some or all of our activities in a timely manner and at a reasonable cost. This document is reviewed annually by the BRCC and defines a committee of senior executives to manage a crisis and allocates responsibility to individuals for key tasks.
27.3.1 Sources of liquidity Sources of liquidity are regularly reviewed to maintain a wide diversification by currency, geography, product and term. Sources include, but are not limited to:
deposits; debt issues; proceeds from sale of marketable securities; repurchase agreements with central banks; principal repayments on loans; interest income; fee income; and an interbank deposit agreement. The Group does not rely on committed funding lines as a source of liquidity.
Wholesale funding The Group monitors the composition and stability of its funding base so it is maintained within the Group’s funding and liquidity risk appetite. This includes a target of greater than 75% for the Stable Funding Ratio (SFR). Stable funding includes customer deposits, wholesale term funding with residual maturity greater than 12 months, equity and securitisation.
At 30 September 2014, the Group’s SFR was 83% (30 September 2013: 84%). Asset growth over the 12 month period, including the acquisition of the Lloyds business in December 2013, was funded primarily through customer deposits and new term wholesale funding. An increase in short term funding was used to fund an increase in short term assets, mainly trade finance in Asia.
The Group’s funding composition has remained relatively stable over recent periods. Customer deposits represented 60% of the Group’s total funding at 30 September 2014, little changed from 30 September 2013 (61%). A further 2% of total funding came from securitisation, 14% from long term funding with a residual maturity greater than one year and 7% from equity. The proportion of total funding from wholesale sources maturing within one year was 17%. These components were little changed over 2014.
In 2014, customer deposits increased by 7.0% or $26.6 billion. At the same time, net loans increased by 8.2% or $44.2 billion, with the acquisition of the Lloyds business adding $7.9 billion in lending but little in deposit balances. As a result, the Group’s customer deposit to loan ratio was 70.5% at 30 September 2014, 85bps lower than at 30 September 2013.
Maintaining a diverse funding base and ensuring the Group has capacity and flexibility to access a wide range of funding markets, debt investors and products is an important part of managing liquidity risk. Stronger loan growth during the year saw the Group more active in wholesale funding markets compared to 2013. The Group raised $33 billion in wholesale term funding in 2014, with a weighted average maturity of 4.7 years, excluding securitisation. This included $2.3 billion in Basel III compliant Additional Tier 1 and Tier 2 capital securities.
The Group continued to benefit from its broad wholesale funding capabilities which provide access to a range of debt instruments, currencies and investors. Westpac is the only major Australian bank with an active Auto ABS capability, the only Australian bank with access to the US SEC registered market and one of only two major Australian banks active in RMBS. The Group has taken advantage of these capabilities, issuing successful ABS, RMBS and SEC registered trades in 2014, as well as transactions in senior unsecured and covered bond format.
222 2014 Westpac Group Annual Report

Notes to the financial statements Note 27. Financial risk (continued) Borrowings and outstandings from existing debt programs and issuing shelves at 30 September 2014 can be found in various notes to the financial statements including Note 17, Note 18, Note 22 and Note 23.
Credit ratings As at 30 September 2014 the Parent Entity’s credit ratings were:
Short-term Long-term OutlookStandard & Poor’s A–1+ AA– StableMoody’s Investors Services P–1 Aa2 StableFitch Ratings F1+ AA– Stable
2014
As of 30 September 2014, approximately 33% of the Group’s total funding originated from wholesale funding markets, principally in Australia, the United States, Europe and Japan. Investors in these markets have historically relied significantly upon credit ratings issued by independent credit rating organisations in making their investment decisions. If Westpac’s credit ratings were to be lowered from current levels, the Group’s borrowing costs and capacity may be adversely affected. A downgrade in Westpac’s credit ratings from current levels is likely to require the Group to pay higher interest rates than we do currently on our wholesale borrowings. This would increase the Group’s funding costs and could reduce net interest margins. In addition, the Group’s borrowing capacity could be diminished, which may adversely affect the Group’s ability to fund the growth of our balance sheet or reduce our liquidity.
A credit rating is not a recommendation to buy, sell or hold Westpac securities. Such ratings are subject to revision or withdrawal at any time by the assigning rating agency. Investors are cautioned to evaluate each rating independently of any other rating.
Liquid assets Treasury holds a portfolio of high-quality liquid assets as a buffer against unforeseen funding requirements. These assets are 100% eligible for repurchase agreements with the Reserve Bank of Australia or another central bank and are held in cash, Government, State Government and highly rated investment grade paper. The level of liquid asset holdings is reviewed frequently and is consistent with both the requirements of the balance sheet and market conditions.
Liquid assets that qualify as eligible collateral for repurchase agreements with an applicable central bank (including internal securitisation) have increased by $8.8 billion to $134.4 billion over the last 12 months, as the Group prepares for the introduction of the Liquidity Coverage Ratio (LCR). The LCR requires banks to hold sufficient high-quality liquid assets, as defined, to withstand 30 days under a regulator-defined acute stress scenario. The Group is required to meet a LCR of at least 100% when it comes into effect from 1 January 2015. In preparation for the LCR, Westpac has received approval from APRA for a Committed Liquidity Facility (CLF) of $66 billion in 2015. At 30 September 2014, the Group’s pro-forma LCR, including the CLF of $66 billion for 2015, was 103%. As the Group transitions towards LCR implementation, it plans to implement further initiatives designed to deliver a suitable buffer above 100%.
WIB also has holdings of trading securities which arise from its daily business operations. These assets are typically high quality investment grade names and stock is generally very liquid. While these assets are excluded from the Group’s liquidity portfolio, we do consider them as a source of funds in our crisis scenario analysis.
A summary of liquid asset holdings is as follows:
Actual Average Actual Average$m $m $m $m
Cash 22,497 19,017 8,522 9,047Receivables due from other financial institutions 655 1,090 1,370 1,308
18,272 24,317 32,711 35,142Available-for-sale securities 34,205 31,097 27,845 24,947Loans1 58,448 55,650 54,536 45,542Regulatory deposits with central banks 368 449 663 627Total liquid assets 134,445 131,620 125,647 116,613
2014 2013
Trading securities and other financial assets designated at fair value
1 Loans are self-originated AAA rated mortgage backed securities which are eligible for repurchase with the Reserve Bank of Australia and Reserve
Bank of New Zealand.
2014 Westpac Group Annual Report 223

Note 27. Financial risk (continued) 27.3.2 Liquidity reporting Scenario analysis In fulfilling our obligations under APRA’s liquidity prudential standard, the Group performs scenario analysis on a daily basis. The ‘going concern’ and ‘crisis’ scenarios present the maturity profiles of cash flows, based on assumptions agreed with APRA.
The ‘going concern’ model measures our liquidity requirements under normal business conditions. Wholesale debt maturities are added to planned net asset growth to provide an estimate of the wholesale funding task across a range of time horizons. The cumulative liquidity mismatch is managed within a Board approved limit structure; with limits set at intervals from one week, to 15 months.
The ‘crisis’ scenario measures liquidity requirements during the first week of a name-specific crisis. The crisis model reflects normal model flows plus expected sources and applications of funds under crisis conditions. Under a crisis scenario Westpac is expected to experience large customer and wholesale outflows against which liquid assets are held to ensure continued solvency. In this scenario, the cumulative mismatch must be positive out to five business days.
Liquidity review The table below outlines the review performed in managing our liquidity:
Frequency Liquidity report
Daily Produced by WIB Finance
Reviewed by Group Risk
Monitored within Treasury
Monthly Submitted to ALCO
Submitted to APRA
Quarterly Submitted to the BRCC
27.3.3 Market developments APRA released a revised liquidity standard in December 2013 which includes the Liquidity Coverage Ratio (LCR) requirement. The LCR requires banks to hold sufficient high-quality liquid assets, as defined, to withstand 30 days under a regulator-defined acute stress scenario. Given the limited amount of government debt in Australia, the Reserve Bank of Australia (RBA) has announced, jointly with the Australian Prudential Regulation Authority (APRA), that it will make available to Australian institutions a Committed Liquidity Facility (CLF) that subject to satisfaction of qualifying conditions, can be accessed to help meet the LCR requirement. In order to access the CLF, Australian banks are required to pay a fee of 15 basis points (0.15%) per annum to the RBA on the approved facility from 1 January 2015. On 30 September 2014, APRA approved Westpac’s access to the CLF for the 2015 calendar year for $66 billion.
224 2014 Westpac Group Annual Report

Notes to the financial statements Note 27. Financial risk (continued) 27.3.4 Contractual maturity of financial liabilities The tables below present cash flows associated with financial liabilities including derivative liabilities, payable at the balance sheet date, by remaining contractual maturity. The amounts disclosed in the table are the contractual undiscounted cash flows, whereas the Group manages inherent liquidity risk based on expected cash flows.
Cash flows associated with liabilities include both principal payments as well as fixed or variable interest payments incorporated into the relevant coupon period. Principal payments reflect the earliest contractual maturity date. Derivative liabilities designed for hedging purposes are expected to be held for their remaining contractual lives, and reflect gross cash flows derived as the fixed rate and/or the expected variable rate applied to the notional principal over the remaining contractual term and where relevant includes the receipt and payment of the notional amount under the contract.
Foreign exchange obligations have been translated to Australian dollars using the closing spot rates at the end of the financial year.
The balances in the tables below will not necessarily agree to amounts presented on the face of the balance sheet as amounts in the table incorporate cash flows on an undiscounted basis and include both principal and associated future interest payments.
Other financial liabilities at fair value through income statement are not all managed for liquidity purposes on the basis of their contractual maturity. The liabilities that we manage based on their contractual maturity are presented on a contractual undiscounted basis in the tables below:
Consolidated 2014Over Over Over
Up to 1 Month to 3 Months to 1 Year to Over1 Month 3 Months 1 Year 5 Years 5 Years Total
$m $m $m $m $m $mLiabilitiesPayables due to other financial institutions 14,716 2,865 859 242 - 18,682 Deposits and other borrowings 290,569 79,225 79,770 15,145 377 465,086 Other financial liabilities at fair value through income statement 17,811 1,436 - - - 19,247 Derivative financial instruments:
Held for trading 33,928 - - - - 33,928 Held for hedging purposes (net settled) 103 154 456 1,945 316 2,974 Held for hedging purposes (gross settled):
Cash outflow 113 4,601 3,853 19,926 2,103 30,596 Cash inflow (80) (3,899) (3,314) (17,405) (1,888) (26,586)
Debt issues 2,751 10,710 47,730 81,488 20,758 163,437 Other financial liabilities 1,395 462 2,078 - - 3,935 Total liabilities excluding loan capital 361,306 95,554 131,432 101,341 21,666 711,299 Loan capital1 3,897 64 218 7,087 599 11,865 Total undiscounted financial liabilities 365,203 95,618 131,650 108,428 22,265 723,164 Total contingent liabilities and commitmentsCommitments to extend credit 159,131 - - - - 159,131 Other commitments 763 - - - - 763 Total undiscounted contingent liabilities and commitments 159,894 - - - - 159,894
1 Where the terms of loan capital instruments include contingent settlement clauses, amounts due have been disclosed as up to one month.
2014 Westpac Group Annual Report 225

Note 27. Financial risk (continued)
Consolidated 2013Over Over Over
Up to 1 Month to 3 Months to 1 Year to Over1 Month 3 Months 1 Year 5 Years 5 Years Total
$m $m $m $m $m $mLiabilitiesPayables due to other financial institutions 6,176 1,642 554 491 - 8,863 Deposits and other borrowings 271,597 67,642 73,161 16,870 367 429,637 Other financial liabilities at fair value through income statement 10,302 - - - - 10,302 Derivative financial instruments:
Held for trading 26,029 - - - - 26,029 Held for hedging purposes (net settled) 99 238 699 1,599 247 2,882 Held for hedging purposes (gross settled):
Cash outflow 1,602 5,175 7,508 21,103 146 35,534 Cash inflow (1,488) (4,793) (5,457) (17,812) (115) (29,665)
Debt issues 6,167 10,013 43,540 82,639 12,065 154,424 Other financial liabilities 1,972 516 2,321 - - 4,809 Total liabilities excluding loan capital 322,456 80,433 122,326 104,890 12,710 642,815 Loan capital1 3,450 63 175 6,073 616 10,377 Total undiscounted financial liabilities 325,906 80,496 122,501 110,963 13,326 653,192 Total contingent liabilities and commitmentsCommitments to extend credit 148,368 - - - - 148,368 Other commitments 44 - - - - 44 Total undiscounted contingent liabilities and commitments 148,412 - - - - 148,412
1 Where the terms of loan capital instruments include contingent settlement clauses, amounts due have been disclosed as up to one month. Comparative information has been revised to conform to presentation with the current year.
226 2014 Westpac Group Annual Report

Notes to the financial statements Note 27. Financial risk (continued)
Parent Entity 2014Over Over Over
Up to 1 Month to 3 Months to 1 Year to Over1 Month 3 Months 1 Year 5 Years 5 Years Total
$m $m $m $m $m $mLiabilitiesPayables due to other financial institutions 14,526 2,865 859 207 - 18,457 Deposits and other borrowings 263,657 71,248 69,240 13,222 377 417,744 Other financial liabilities at fair value through income statement 17,811 1,436 - - - 19,247 Derivative financial instruments:
Held for trading 34,392 - - - - 34,392 Held for hedging purposes (net settled) 86 132 426 1,862 308 2,814 Held for hedging purposes (gross settled):
Cash outflow 49 4,424 2,467 10,746 1,796 19,482 Cash inflow (28) (3,748) (1,958) (8,950) (1,600) (16,284)
Debt issues 1,676 8,669 44,071 67,528 14,440 136,384 Due to subsidiaries 135,066 - - - - 135,066 Other financial liabilities 1,248 381 1,715 - - 3,344 Total liabilities excluding loan capital 468,483 85,407 116,820 84,615 15,321 770,646 Loan capital1 3,897 64 218 7,087 599 11,865 Total undiscounted financial liabilities 472,380 85,471 117,038 91,702 15,920 782,511 Total contingent liabilities and commitmentsCommitments to extend credit 140,909 - - - - 140,909 Other commitments 763 - - - - 763 Total undiscounted contingent liabilities and commitments 141,672 - - - - 141,672
1 Where the terms of loan capital instruments include contingent settlement clauses, amounts due have been disclosed as up to one month.
2014 Westpac Group Annual Report 227

Note 27. Financial risk (continued)
Parent Entity 2013Over Over Over
Up to 1 Month to 3 Months to 1 Year to Over1 Month 3 Months 1 Year 5 Years 5 Years Total
$m $m $m $m $m $mLiabilitiesPayables due to other financial institutions 6,078 1,642 554 491 - 8,765 Deposits and other borrowings 246,524 59,694 62,747 15,408 367 384,740 Other financial liabilities at fair value through income statement 10,302 - - - - 10,302 Derivative financial instruments:
Held for trading 26,180 - - - - 26,180 Held for hedging purposes (net settled) 74 227 656 1,543 241 2,741 Held for hedging purposes (gross settled):
Cash outflow 1,525 4,025 7,078 15,742 146 28,516 Cash inflow (1,431) (3,760) (5,122) (13,281) (115) (23,709)
Debt issues 4,695 7,111 37,867 69,771 10,745 130,189 Due to subsidiaries 120,553 - - - - 120,553 Other financial liabilities 1,937 445 2,006 - - 4,388 Total liabilities excluding loan capital 416,437 69,384 105,786 89,674 11,384 692,665 Loan capital1 3,450 63 175 6,073 616 10,377 Total undiscounted financial liabilities 419,887 69,447 105,961 95,747 12,000 703,042 Total contingent liabilities and commitmentsCommitments to extend credit 132,271 - - - - 132,271 Other commitments 44 - - - - 44 Total undiscounted contingent liabilities and commitments 132,315 - - - - 132,315
1 Where the terms of loan capital instruments include contingent settlement clauses, amounts due have been disclosed as up to one month. Comparative information has been revised to conform to presentation with the current year.
228 2014 Westpac Group Annual Report

Notes to the financial statements Note 27. Financial risk (continued) 27.3.5 Expected maturity The tables below present the balance sheet based on expected maturity dates. The liability balances in the following tables will not agree to the contractual maturity tables (27.3.4 Contractual maturity of financial liabilities) due to the analysis below being based on expected rather than contractual maturities, the impact of discounting and the exclusion of interest accruals beyond the reporting period. Included in the tables below are equity securities classified as trading securities, available-for-sale investments and life insurance assets that have no specific maturity. These assets have been classified based on the expected period of disposal. Deposits are presented in the table below on a contractual basis, however as part of our normal banking operations we would expect a large proportion of these balances to be retained.
Due within Greater than 12 Months 12 Months Total $m $m $mAssets Cash and balances with central banks 25,760 - 25,760 Receivables due from other financial institutions 7,424 - 7,424 Trading securities and other financial assets designated at fair value 31,234 14,675 45,909 Derivative financial instruments 32,248 9,156 41,404 Available-for-sale securities 2,101 33,923 36,024 Loans (net of provisions) 83,089 497,254 580,343 Life insurance assets 2,518 8,489 11,007 Regulatory deposits with central banks overseas 529 999 1,528 All other assets 6,278 15,165 21,443 Total assets 191,181 579,661 770,842 LiabilitiesPayables due to other financial institutions 18,394 242 18,636 Deposits and other borrowings 446,099 14,723 460,822 Other financial liabilities at fair value through income statement 19,236 - 19,236 Derivative financial instruments 29,514 10,025 39,539 Debt issues 59,203 93,048 152,251 Life insurance policy liabilities 8 9,629 9,637 All other liabilities 9,480 1,046 10,526 Total liabilities excluding loan capital 581,934 128,713 710,647 Loan capital - 10,858 10,858 Total liabilities 581,934 139,571 721,505 Net assets/(net liabilities) (390,753) 440,090 49,337
Consolidated 2014
2014 Westpac Group Annual Report 229

Note 27. Financial risk (continued)
Due within Greater than 12 Months 12 Months Total $m $m $mAssets Cash and balances with central banks 11,699 - 11,699 Receivables due from other financial institutions 11,210 - 11,210 Trading securities and other financial assets designated at fair value 25,847 23,242 49,089 Derivative financial instruments 21,026 7,330 28,356 Available-for-sale securities 1,434 28,577 30,011 Loans (net of provisions) 82,247 453,917 536,164 Life insurance assets 4,576 8,573 13,149 Regulatory deposits with central banks overseas 975 596 1,571 All other assets 4,999 14,849 19,848 Total assets 164,013 537,084 701,097 LiabilitiesPayables due to other financial institutions 8,347 489 8,836 Deposits and other borrowings 408,651 15,831 424,482 Other financial liabilities at fair value through income statement 10,288 14 10,302 Derivative financial instruments 22,278 10,712 32,990 Debt issues 54,479 89,654 144,133 Life insurance policy liabilities - 11,938 11,938 All other liabilities 10,306 1,243 11,549 Total liabilities excluding loan capital 514,349 129,881 644,230 Loan capital - 9,330 9,330 Total liabilities 514,349 139,211 653,560 Net assets/(net liabilities) (350,336) 397,873 47,537
Consolidated 2013
230 2014 Westpac Group Annual Report

Notes to the financial statements Note 27. Financial risk (continued) Due within Greater than 12 Months 12 Months Total $m $m $mAssets Cash and balances with central banks 23,400 - 23,400 Receivables due from other financial institutions 5,483 - 5,483 Trading securities and other financial assets designated at fair value 29,989 14,335 44,324 Derivative financial instruments 32,219 9,088 41,307 Available-for-sale securities 743 31,266 32,009 Loans (net of provisions) 67,949 437,655 505,604 Regulatory deposits with central banks overseas 389 1,000 1,389 Due from subsidiaries 140,098 - 140,098 Investments in subsidiaries - 4,687 4,687 All other assets 5,349 11,818 17,167 Total assets 305,619 509,849 815,468 LiabilitiesPayables due to other financial institutions 18,204 207 18,411 Deposits and other borrowings 401,236 12,947 414,183 Other financial liabilities at fair value through income statement 19,155 - 19,155 Derivative financial instruments 29,451 9,690 39,141 Debt issues 52,802 75,044 127,846 Due to subsidiaries 135,066 - 135,066 All other liabilities 7,478 948 8,426 Total liabilities excluding loan capital 663,392 98,836 762,228 Loan capital - 10,858 10,858 Total liabilities 663,392 109,694 773,086 Net assets/(net liabilities) (357,773) 400,155 42,382
Parent Entity 2014
2014 Westpac Group Annual Report 231

Note 27. Financial risk (continued)
Due within Greater than 12 Months 12 Months Total $m $m $mAssets Cash and balances with central banks 9,509 - 9,509 Receivables due from other financial institutions 9,317 - 9,317 Trading securities and other financial assets designated at fair value 24,435 22,583 47,018 Derivative financial instruments 21,029 7,376 28,405 Available-for-sale securities 503 25,891 26,394 Loans (net of provisions) 68,475 403,182 471,657 Regulatory deposits with central banks overseas 867 596 1,463 Due from subsidiaries 119,038 - 119,038 Investments in subsidiaries - 4,880 4,880 All other assets 4,173 11,852 16,025 Total assets 257,346 476,360 733,706 LiabilitiesPayables due to other financial institutions 8,250 488 8,738 Deposits and other borrowings 365,728 14,480 380,208 Other financial liabilities at fair value through income statement 10,288 14 10,302 Derivative financial instruments 22,202 10,236 32,438 Debt issues 47,544 74,011 121,555 Due to subsidiaries 120,553 - 120,553 All other liabilities 8,796 834 9,630 Total liabilities excluding loan capital 583,361 100,063 683,424 Loan capital - 9,330 9,330 Total liabilities 583,361 109,393 692,754 Net assets/(net liabilities) (326,015) 366,967 40,952
Parent Entity 2013
27.4 Market risk Market risk is the risk of an adverse impact on earnings resulting from changes in market factors, such as foreign exchange rates, interest rates, commodity prices and equity prices. This includes interest rate risk in the banking book – the risk to interest income from a mismatch between the duration of assets and liabilities that arises in the normal course of business activities.
27.4.1 Traded market risk Approach Westpac’s exposure to traded market risk arises out of the trading activities of Financial Markets and Treasury. These activities are controlled by a Board-approved market risk framework that incorporates a Board-approved Value at Risk (VaR) limit. VaR is the primary mechanism for measuring and controlling market risk. Market risk is managed using VaR and structural risk limits (including volume limits and basis point value limits) in conjunction with scenario analysis and stress testing. Market risk limits are allocated to business managers based upon business strategies and experience, in addition to the consideration of market liquidity and concentration of risks. All trades are fair valued daily, using the appropriate fair value methodology as described in Note 28. Rates that have limited independent sources are reviewed at least on a monthly basis.
Financial Market’s trading book activity represents dealings that encompass book running and distribution activity. The types of market risk arising from these activities include interest rate, foreign exchange, commodity, equity price, credit spread and volatility risk.
Treasury’s trading activity represents dealings that include the management of interest rate, foreign exchange and credit spread risk associated with wholesale funding, liquid asset portfolios and foreign exchange repatriations.
232 2014 Westpac Group Annual Report

Notes to the financial statements Note 27. Financial risk (continued) VaR limits Market risk arising from trading book activities is primarily measured using VaR based on an historical simulation methodology. VaR is the potential loss in earnings from adverse market movements calculated over a one-day time horizon to a 99% confidence level using a minimum of one year of historical data. VaR seeks to take account of all material market variables that may cause a change in the value of the trading portfolio, including interest rates, foreign exchange rates, price changes, volatility and the correlations between these variables.
In addition to the Board approved market risk VaR limit for trading activities, RISKCO has approved separate VaR sub-limits for the trading activities of Financial Markets and Treasury.
Backtesting Daily backtesting of VaR results is performed to support model integrity. A review of both the potential profit or loss outcomes is also undertaken to monitor any skew created by the historical data.
Stress testing Daily stress testing against pre-determined scenarios is carried out to analyse potential losses arising from extreme or unexpected movements beyond the 99% confidence level. An escalation framework around selective stress tests has been approved by RISKCO. Stress and scenario tests include historical market movements, those defined by RISKCO or Financial Markets and Treasury Risk (FMTR) and independent scenarios developed by Westpac’s economics department.
Profit or loss notification framework The BRCC has approved a profit or loss notification framework. Included in this framework are levels of escalation in accordance with the size of the profit or loss. Triggers are applied to both a 1-day and a rolling 20-day cumulative total.
Risk reporting Daily monitoring of current exposure and limit utilisation is conducted independently by the FMTR unit, which monitors market risk exposures against VaR and structural limits. Daily VaR position reports are produced by risk type, by product lines and by geographic region. These are supplemented by structural risk reporting, advice of profit or loss trigger levels and stress testing escalation trigger points. Model accreditation has been granted by APRA to use the internal model for the determination of regulatory capital for the key classes of interest rate (general market), foreign exchange, commodity and equity risks (including specific risk). Under the model, regulatory capital is derived from both the current VaR window (market data is based upon the most recent 12 months of historical data) and a Stressed VaR window (12 months of market data that includes a period of significant financial stress), where these VaR measures are calculated as a 10-day, 99th percentile, one-tailed confidence interval. Specific risk refers to the variations in individual security prices that cannot be explained by general market movements and event and default risk. Interest rate specific risk capital (specific issuer risk) is calculated using the Standard method and is added to the VaR regulatory capital measure.
Risk mitigation Market risk positions are managed by the trading desks consistent with delegated trading and product authorities. Risks are consolidated into portfolios based on product and risk types. Risk management is carried out by suitably qualified personnel with varying levels of seniority commensurate with the nature and scale of market risks under management.
Determination of fair value Refer to Note 28 for the basis for determining fair value.
The following controls allow for continuous monitoring of market risk by management:
trading authorities and responsibilities are clearly delineated at all levels to provide accountability; a structured system of limits and reporting of exposures; all new products and significant product variations undergo an approval process to confirm business risks have been
identified prior to launch; models that are used to determine risk or profit or loss for Westpac’s financial statements are independently reviewed; duties are segregated so that employees involved in the origination, processing and valuation of transactions operate under
separate reporting lines, minimising the opportunity for collusion; legal counsel approves documentation for compliance with relevant laws and regulations; daily profit and loss reviews/attribution; and reconciliations.
2014 Westpac Group Annual Report 233

Note 27. Financial risk (continued) The table below depicts the aggregate VaR, by risk type, for the year ended 30 September:
Consolidated and Parent Entity
High Low Average High Low Average High Low Average $m $m $m $m $m $m $m $m $m
Interest rate risk 30.7 6.3 15.6 30.8 9.1 16.7 29.0 10.5 18.4 Foreign exchange risk 7.6 1.2 3.0 5.7 0.5 2.1 8.0 0.8 3.3 Equity risk 0.7 0.1 0.3 0.8 0.1 0.3 1.8 0.2 0.5 Commodity risk1 2.9 1.3 2.0 6.1 1.2 2.9 5.1 1.0 2.5 Other market risks2 11.3 5.4 9.2 13.0 5.8 7.9 21.6 7.8 16.6 Diversification effect n/a n/a (8.2) n/a n/a (10.7) n/a n/a (12.5) Net market risk 40.2 9.5 22.0 35.4 12.5 19.2 41.2 16.8 28.8
2014 2013 2012
1 Includes electricity risk. 2 Includes prepayment risk and credit spread risk (exposure to movements in generic credit rating bands).
Commodity, Carbon and Energy trading Commodity, Carbon and Energy trading (CCE) activity is part of our Financial Markets business. All trades are marked-to-market daily, using independently sourced or reviewed rates. Rates are compared to Australian Financial Market Association published prices, brokers’ quotes, and futures prices as appropriate. Rates that have limited independent sources are reviewed on a regular basis by the WIB Revaluation Committee. The CCE business is managed within market risk structural and VaR limits. Credit risk is controlled by pre-settlement risk limits by counterparty.
CCE trading activities include electricity, gas, oil, emission, agricultural products, base metals and precious metals. These activities involve dealings in swaps, options, swaptions, Asian options and futures. Energy trading also includes Settlement Residue Auctions (SRAs). Carbon trading activities includes Australian, New Zealand and European carbon units and Renewable Energy Certificates (RECs).
CCE also includes the Structured Commodities Finance (SCF) desk which facilitates financing for commodity clients.
The total fair value of commodity, carbon and energy contracts outstanding as at 30 September 2014 were $14 million (2013: $9 million).
27.4.2 Non-traded market risk Approach The banking book activities that give rise to market risk include lending activities, balance sheet funding and capital management. Interest rate risk, currency risk and funding and liquidity risk are inherent in these activities. Treasury’s Asset and Liability Management (ALM) unit is responsible for managing the interest rate risk arising from these activities.
All material regions, business lines and legal entities are included in Westpac’s IRRBB framework.
Asset and Liability Management ALM manages the structural interest rate mismatch associated with the transfer priced balance sheet, including the investment of Westpac’s capital to its agreed benchmark duration. A key risk management objective is to achieve reasonable stability of net interest income (NII) over time. These activities are overseen by the independent FMTR unit, reviewed by RISKCO and conducted within a risk framework and appetite set down by the BRCC.
Material non-traded interest rate risk is managed in five centres: Sydney manages risk associated with the Australian balance sheet, the Auckland office manages risk associated with the New Zealand balance sheet, the Singapore office manages risk associated with the Asian balance sheet, while New York and London centres manage risk associated with those locations respectively. The risk from these five centres is monitored both at a local and aggregate level.
NII sensitivity NII sensitivity is managed in terms of the net interest income-at-risk (NaR) modelled over a three year time horizon using a 99% confidence interval for movements in wholesale market interest rates. The position managed covers the Australian and New Zealand banking books, where the banking book is defined as the entire banking balance sheet less the trading book. A simulation model is used to calculate Westpac’s potential NaR. The NII simulation framework combines the underlying balance sheet data with assumptions about run off and new business, expected repricing behaviour and changes in wholesale market interest rates. Simulations using a range of interest rate scenarios are used to provide a series of potential future NII outcomes. The interest rate scenarios modelled include those projected using historical market interest rate volatility as well as 100 and 200 basis point shifts up and down from the current market yield curves in Australia and New Zealand. Additional stressed interest rate scenarios are also considered and modelled.
A comparison between the NII outcomes from these modelled scenarios indicates the sensitivity to interest rate changes.
234 2014 Westpac Group Annual Report

Notes to the financial statements Note 27. Financial risk (continued) NaR limit The BRCC has approved a NaR limit. This limit is managed by the Group Treasurer and is expressed as a deviation from benchmark hedge levels over a one-year rolling time frame, to a 99% confidence level. This limit is monitored by FMTR.
VaR limit The BRCC has also approved a VaR limit for ALM activities. This limit is managed by the Group Treasurer and monitored by FMTR. Additionally, FMTR sets structural risk limits to prevent undue concentration of risk.
Structural foreign exchange risk Structural foreign exchange rate risk results from the generation of foreign currency denominated earnings and from the foreign currency capital that we have deployed in offshore branches and subsidiaries with functional currencies other than Australian dollars.
As a result of the requirement to translate earnings and net assets of the foreign operations into our Australian dollar consolidated financial statements, movements in exchange rates could lead to changes in the Australian dollar equivalent of offshore earnings and capital which could introduce variability to our reported financial results. This is referred to as translation risk. In order to minimise this exposure, we manage the foreign exchange rate risk associated with offshore earnings and capital as follows:
foreign currency denominated earnings that are generated during the current financial year are hedged; capital that is defined to be permanently employed in an offshore jurisdiction (for example to meet regulatory or prudential
requirements) and which has no fixed term is hedged; capital or profits that are denominated in currencies to which we have an immaterial exposure are not hedged; and ALCO determines the appropriateness of the foreign exchange earnings hedges and associated limits. Risk reporting IRRBB risk measurement systems and personnel are centralised in Sydney. These include front office product systems, which capture all treasury funding and derivative transactions; the transfer pricing system, which captures all retail transactions in Australia and New Zealand; non-traded VaR systems; and the NII system, which calculates NII and NaR for the Australian and New Zealand balance sheets.
Daily monitoring of current exposure and limit utilisation is conducted independently by FMTR, which monitors market risk exposures against VaR and NaR limits. Reports detailing structural positions and VaR are produced and distributed daily for use by dealers and management across all stakeholder groups. Monthly and quarterly reports are produced for the senior management market risk forums of RISKCO and the BRCC respectively to provide transparency of material market risks and issues.
Risk mitigation IRRBB stems from the ordinary course of banking activities, including structural interest rate risk (the mismatch between the duration of assets and liabilities) and capital management. Hedging Westpac’s exposure to interest rate risk is undertaken using derivatives. The hedge accounting strategy adopted is to utilise a combination of cash flow, fair value and net investment hedge approaches. Some derivatives held for economic hedging purposes do not meet the criteria for hedge accounting as defined under AASB 139 Financial Instruments: Recognition and Measurement, and therefore are accounted for in the same way as derivatives held for trading.
The same controls as used to monitor traded market risk allow for the continuous monitoring by management of IRRBB.
Value at Risk – IRRBB The table below depicts VaR for IRRBB:
30 September 2014 30 September 2013As at High Low Average As at High Low Average
$m $m $m $m $m $m $m $mConsolidated 3.1 10.7 1.2 4.7 8.8 21.0 6.7 11.8
As at 30 September 2014 the Value at Risk – IRRBB for the Parent Entity was $25.1 million (2013: $7.6 million).
2014 Westpac Group Annual Report 235

Note 27. Financial risk (continued) Net interest income-at-risk (NaR) The table below depicts NaR assuming a 100 basis point shock (decrease) over the next 12 months as a percentage of reported net interest income:
30 September 2014 30 September 2013Maximum Minimum Average Maximum Minimum Average
As at Exposure Exposure Exposure As at Exposure Exposure Exposure% % % % % % % %
Consolidated 0.27 0.66 (0.12) 0.20 0.52 0.98 0.24 0.64 Parent Entity 0.10 0.82 (0.25) 0.17 0.54 1.03 0.20 0.68
Equity risk Financial assets classified as available-for-sale are subject to market risk which is not captured by the market risk VaR. Regular reviews are performed to substantiate the valuation of equity investments and are regularly reviewed by management. Whilst the fair value of individual equity securities classified as available-for-sale can fluctuate considerably, the overall impact to the Group is not material.
Note 28. Fair values of financial assets and liabilities Fair Valuation Control Framework The Group’s control environment uses a well-established Fair Valuation Control Framework to ensure that fair value is either determined or validated by a function independent of the party that undertakes the transaction. This framework formalises the policies and procedures used by the Group to achieve compliance with relevant accounting, industry and regulatory standards. The framework includes specific controls relating to the revaluation of financial instruments, independent price verification, fair value adjustments and financial reporting.
A key element of the Fair Valuation Control Framework is the WIB Revaluation Committee, comprising senior finance and risk valuation experts from within the Group. The WIB Revaluation Committee review the application of the agreed policies and procedures to ensure a fair value measurement basis is applied.
The method of determining fair value according to the Fair Valuation Control Framework differs depending on the information available.
Quoted price in an active market The best evidence of fair value is a quoted price in an active market. Wherever possible the Group determines the fair value of a financial instrument based on the quoted price.
Valuation techniques Where no direct quoted price in an active market is available, the Group applies present value estimates or other market accepted valuation techniques. The use of a market accepted valuation technique will typically involve the use of a valuation model and appropriate inputs to the model.
The majority of models used by the Group employ only observable market data as inputs. However, for certain financial instruments data may be employed which is not readily observable in current markets. Typically in these instances valuation inputs will be derived using alternative means (including extrapolation from other relevant market data) and tested against historic transactions. The use of these inputs will require a high degree of management judgment.
In order to determine a reliable fair value, where appropriate, management may apply adjustments to the techniques used above. These adjustments reflect the Group’s assessment of factors that market participants would consider in setting the fair value.
When determining the fair value of financial instruments, adjustments are made to the mid-market valuations to cover credit risk and bid-offer spreads.
Counterparty Valuation Adjustment Westpac uses a Monte Carlo simulation methodology to calculate the expected future credit exposure for all derivative exposures including inputs regarding probabilities of default (PDs) and loss given default (LGD). PDs are derived from market observed credit spreads by reference to credit default swap (CDS) for individual or sector curves for the relevant tenors to calculate the credit valuation adjustment (CVA), and Westpac’s CDS curve for the relevant tenors to calculate the debit valuation adjustment (DVA). PDs are then applied to the horizon of potential exposures to derive both the CVA and DVA.
236 2014 Westpac Group Annual Report

Notes to the financial statements Note 28. Fair values of financial assets and liabilities (continued) Bid-offer spreads
The fair value of financial assets and liabilities should reflect bid prices for assets and offer prices for liabilities. Prices are adjusted to reflect current bid-offer spreads.
The fair values of large holdings of financial instruments are based on a multiple of the estimated value of a single instrument, and do not include block adjustments for the size of the holding.
Fair value hierarchy The Group categorises all fair value instruments according to the following hierarchy:
Level 1 Financial instruments valued using recent unadjusted quoted prices in active markets for identical assets or liabilities. An active market is one in which prices are readily and regularly available and those prices represent actual and regularly occurring market transactions on an arm’s length basis.
Valuation of Level 1 instruments require little or no management judgment.
Financial instruments included in this class are Commonweath of Australia and New Zealand Government bonds, spot and exchange traded derivatives for equities, foreign exchange, commodities and interest rate products.
Level 2 Valuation techniques utilising observable market prices applied to these assets or liabilities include the use of market standard discounting methodologies, option pricing models and other valuation techniques widely used and accepted by market participants. The financial instruments included in this category are mainly over the counter (OTC) derivatives with observable market inputs and financial instruments with fair value derived from consensus pricing with sufficient contributors. Financial instruments included in the Level 2 category are: – trading securities – including government bonds (excluding Australian and New Zealand government bonds), Australian
state government bonds, corporate fixed rate bonds and floating rate bonds; and – derivatives – including interest rate swaps, credit default swaps, foreign exchange swaps, foreign exchange options and
equity options. Level 3
Financial instruments valued using at least one input that could have a significant effect on the instrument’s valuation which is not based on observable market data (unobservable input). Unobservable inputs are those not readily available in an active market due to illiquidity or complexity of the product. These inputs are generally derived and extrapolated from other relevant market data and calibrated against current market trends and historic transactions. These valuations are calculated using a high degree of management judgment. Financial instruments included in the Level 3 category include some asset-backed products and non-Australian dollar-denominated government securities issued by governments where there are no observable secondary markets.
A financial instrument’s categorisation within the valuation hierarchy is based on the lowest level input that is significant to the fair value measurement.
Valuation techniques The specific valuation techniques, the observability of the inputs used in valuation models and the subsequent classification for each significant product category are outlined below:
Interest rate derivative products These are products linked to interest rates (e.g. Bank Bills Swap Rate (BBSW) or London Interbank Offer Rate (LIBOR)) or inflation indices. This includes exchange traded interest rate futures, interest rate and inflation swaps, swaptions, caps, floors, exchange traded interest rate options on futures, inflation options, collars and other non-vanilla interest rate derivatives. Exchange traded interest rate futures and options on futures are traded in liquid, active markets where prices are readily observable. No modelling or assumptions are used in the valuation. Exchange traded interest rate futures and options on futures are classified as Level 1 instruments. Interest rate derivative cash flows are valued using interest rate curves whereby observable market data is used to construct the term structure of forward rates. This term structure is used to project and discount future cash flows based on the terms of the trade. Instruments with optionality are valued using market observable or consensus provided volatilities. Non-vanilla interest rate derivatives are valued using industry standard models based on market observable inputs which are determined separately for each parameter. Where unobservable, inputs will be set with reference to an observable proxy. In general, interest rate derivatives are classified as Level 2 instruments.
2014 Westpac Group Annual Report 237

Note 28. Fair values of financial assets and liabilities (continued) Foreign exchange products
These are products linked to the foreign exchange market. This includes FX spot and futures contracts, FX forward contracts, FX swaps, FX options and other non-vanilla FX derivatives.
There are observable markets for futures and spot contracts in major global currencies. No modelling or assumptions are used in valuation of these instruments. FX spot and future contracts are classified as Level 1 instruments.
FX swap and forward valuations are derived from market observable inputs or consensus pricing providers using industry standard models. FX swaps and forwards are classified as Level 2 instruments.
FX options and other FX derivatives are valued using industry standard models and market observable inputs. Where unobservable, inputs will be set with reference to an observable proxy. In general, FX options and other FX derivatives are classified as Level 2 instruments.
Asset backed products These are debt and derivative products that are linked to the cash flows of a pool of referenced assets via securitisation. This category includes residential mortgage backed securities (RMBS), collateralised debt obligations (CDOs), collateralised loan obligations (CLOs) and other asset backed securities (ABS).
Australian RMBS denominated in Australian dollars are valued using a market accepted model with observable inputs sourced from a consensus data provider. The main inputs to the model are the trading margin and the weighted average life of the security. They are classified as Level 2 instruments.
Despite the availability of an RMBS model in Westpac, input data for the trading margin on Australian issued RMBS, denominated in foreign currency, is considered unobservable. Trading volumes in these instruments are low. Proxy data from the Australian denominated RMBS market is used to derive the fair value for these instruments. Australian issued RMBS denominated in foreign currency are classified as Level 3 instruments.
The fair value of Offshore RMBS is determined using consensus data. These are classified as Level 2 instruments.
As synthetic CDO prices are not generally available, Synthetic CDOs are valued using a model. The model uses a combination of established analytic and numerical approaches. The model calculates fair value based on observable and unobservable parameters including credit spreads, recovery rates, correlations and interest rates. As some of the model inputs (e.g. correlations) are indirectly implied or unobservable, synthetic CDOs are classified as Level 3 instruments.
Where available, cash CDO, CLO and ABS products are valued using prices obtained from consensus data providers and classified as Level 2 instruments. Where consensus prices are not available, these products are valued using quotes provided by a third party broker or independent lead manager and classified as Level 3 instruments. The Group has no material exposure to CDOs.
Other credit products These products are linked to the credit spread of a referenced entity or index and include Single Name and Index CDS.
CDS are valued using an industry standard model that incorporates the credit spread as its principal input. Credit spreads are obtained from consensus market data providers. Single name and index CDS are classified as Level 2 instruments.
Non-asset backed debt instruments There are observable markets for Australian and New Zealand government bonds in which Westpac is a primary dealer. Australian government bonds are valued using unadjusted quoted market yields. New Zealand government bonds are valued using unadjusted quoted market prices. These products are classified as Level 1 instruments.
Other government bonds, state government bonds, corporate bonds and commercial paper are valued using observable market prices which are sourced from consensus pricing services, broker quotes or inter-dealer prices. These products are classified as Level 2 instruments, with the exception of government securities where there are no observable secondary markets which are classified as Level 3 instruments.
Equity products This category includes cash equities and equity indices, exchange traded equity options, OTC equity options and OTC equity warrants.
Cash equities and equity indices are traded on major global exchanges in liquid markets. No modelling or assumptions are used in valuation. These are categorised as Level 1 instruments.
Exchange traded equity options, OTC equity options and equity warrants are valued using industry standard models. The models calculate fair value based on input parameters such as stock prices, dividends, volatilities and interest rates. In general, input parameters are deemed observable. These are classified as Level 2 instruments.
238 2014 Westpac Group Annual Report

Notes to the financial statements Note 28. Fair values of financial assets and liabilities (continued) Commodity products
These products are exchange traded and OTC derivatives based on underlying commodities such as energy, carbon, agriculture, metals, crude oil and refined products, power and natural gas.
Commodity spot and futures, energy spot and futures together with carbon futures are traded on major global exchanges in liquid markets. No modelling or assumptions are used in the valuation of these instruments. These are classified as Level 1 instruments.
The valuation of commodity, carbon and energy derivatives are determined using industry standard models incorporating discounting of cash flows and other industry standard modelling techniques. Valuation inputs include forward curves, volatilities implied from market observable inputs, discount curves and underlying spot and futures prices. The significant inputs are market observable or available through a consensus data service. Where unobservable, inputs will be set with reference to an observable proxy.
In general, commodity, carbon and energy derivatives are classified as Level 2 instruments.
Certificates of deposit The fair value of certificates of deposit is determined using a discounted cash flow analysis using markets rates offered for deposits of similar remaining maturities. Certificates of deposit are classified as Level 2 instruments.
Debt issues at fair value Where a quoted price is not available the fair value of debt issues is determined using a discounted cash flow approach, using a discount rate which reflects the terms of the instrument and the timing of cash flows adjusted for market observable changes in the applicable credit rating of Westpac. These instruments are classified as Level 2 instruments.
Life insurance assets These assets represent investments which back life insurance policy liabilities. This includes listed equities, exchange traded and over the counter derivatives, investment grade corporate bonds and units in unlisted unit trusts.
Listed equities and exchange traded derivatives are traded in liquid, active markets where prices are readily observable. No modelling or assumptions are used in the valuation. They are classified as Level 1 instruments.
Investment grade corporate bonds, over the counter derivatives, units in unlisted unit trusts and certain listed equities subject to transfer restrictions are valued utilising observable market prices or other widely used and accepted valuation techniques utilising observable market inputs. They are classified as Level 2 instruments.
Life insurance liabilities Life insurance liabilities consist of life insurance contract liabilities, life investment contract liabilities and external liabilities of managed investment schemes controlled by statutory life funds. These are valued utilising observable market prices or other widely used and accepted valuation techniques utilising observable market inputs. They are classified as Level 2 instruments.
Loans at fair value Where a quoted price is not available the fair value of fixed rate bills is determined using a discounted cash flow approach, using a discount rate which reflects the terms of the instrument and the timing of cash flows, adjusted for creditworthiness based on market observable inputs. These are classified as Level 2 instruments.
2014 Westpac Group Annual Report 239

Note 28. Fair values of financial assets and liabilities (continued) The table below summarises the attribution of financial instruments to the fair value hierarchy based on the measurement basis after initial recognition:
Consolidated
Valuation Valuation Valuation ValuationQuoted Techniques Techniques Quoted Techniques TechniquesMarket (Market (Non-Market Market (Market (Non-Market
Prices Observable) Observable) Prices Observable) Observable)(Level 1) (Level 2) (Level 3) Total (Level 1) (Level 2) (Level 3) Total
$m $m $m $m $m $m $m $mFinancial assets measured at fair value on a recurring basis Trading securities and other financial assets designated at fair value 5,258 39,663 988 45,909 60 48,491 538 49,089 Derivative financial instruments 51 41,348 5 41,404 12 28,340 4 28,356 Available-for-sale securities 1,765 33,421 822 36,008 90 29,119 790 29,999 Loans - 9,330 - 9,330 - 10,876 - 10,876 Life insurance assets 4,472 6,535 - 11,007 5,567 7,582 - 13,149 Total assets carried at fair value 11,546 130,297 1,815 143,658 5,729 124,408 1,332 131,469 Financial liabilities measured at fair value on a recurring basisDeposits and other borrowings at fair value - 49,636 - 49,636 - 42,015 - 42,015 Other financial liabilities at fair value through income statement 1,134 18,102 - 19,236 44 10,258 - 10,302 Derivative financial instruments 37 39,472 30 39,539 14 32,952 24 32,990 Debt issues at fair value - 9,524 18 9,542 - 14,127 13 14,140 Life insurance liabilities - 9,637 - 9,637 - 11,938 - 11,938 Total liabilities carried at fair value 1,171 126,371 48 127,590 58 111,290 37 111,385
2014 2013
240 2014 Westpac Group Annual Report
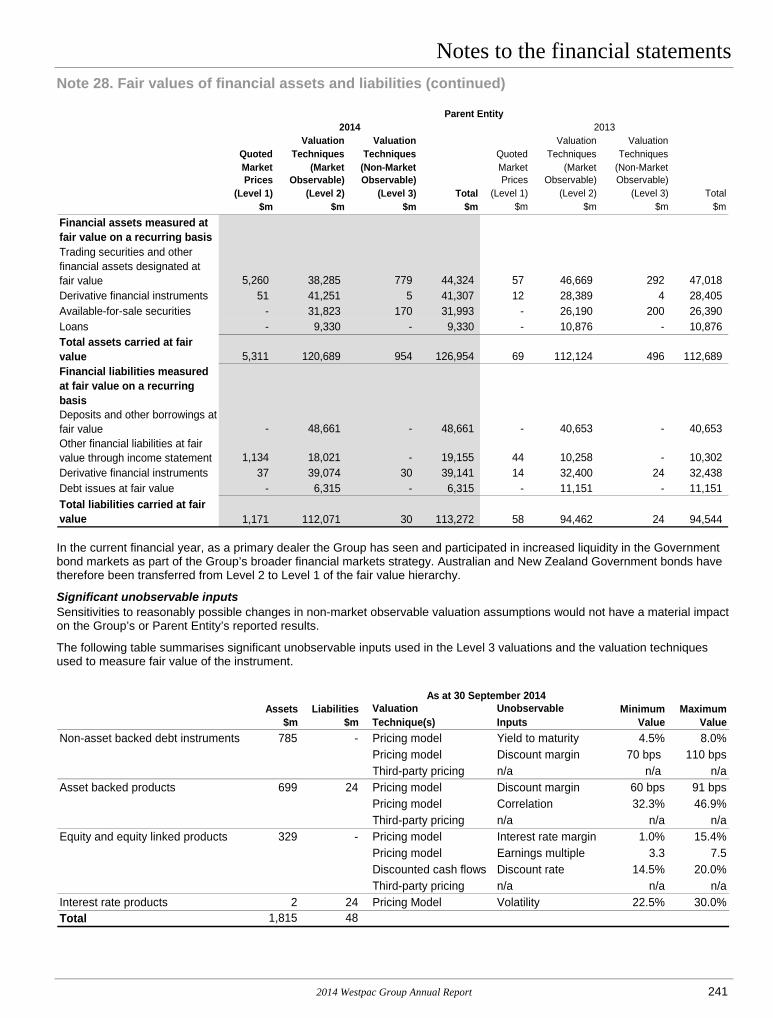
Notes to the financial statements Note 28. Fair values of financial assets and liabilities (continued)
Parent Entity
Valuation Valuation Valuation ValuationQuoted Techniques Techniques Quoted Techniques TechniquesMarket (Market (Non-Market Market (Market (Non-Market
Prices Observable) Observable) Prices Observable) Observable)(Level 1) (Level 2) (Level 3) Total (Level 1) (Level 2) (Level 3) Total
$m $m $m $m $m $m $m $mFinancial assets measured at fair value on a recurring basis Trading securities and other financial assets designated at fair value 5,260 38,285 779 44,324 57 46,669 292 47,018 Derivative financial instruments 51 41,251 5 41,307 12 28,389 4 28,405 Available-for-sale securities - 31,823 170 31,993 - 26,190 200 26,390 Loans - 9,330 - 9,330 - 10,876 - 10,876 Total assets carried at fair value 5,311 120,689 954 126,954 69 112,124 496 112,689 Financial liabilities measured at fair value on a recurring basisDeposits and other borrowings at fair value - 48,661 - 48,661 - 40,653 - 40,653 Other financial liabilities at fair value through income statement 1,134 18,021 - 19,155 44 10,258 - 10,302 Derivative financial instruments 37 39,074 30 39,141 14 32,400 24 32,438 Debt issues at fair value - 6,315 - 6,315 - 11,151 - 11,151 Total liabilities carried at fair value 1,171 112,071 30 113,272 58 94,462 24 94,544
2014 2013
In the current financial year, as a primary dealer the Group has seen and participated in increased liquidity in the Government bond markets as part of the Group’s broader financial markets strategy. Australian and New Zealand Government bonds have therefore been transferred from Level 2 to Level 1 of the fair value hierarchy.
Significant unobservable inputs Sensitivities to reasonably possible changes in non-market observable valuation assumptions would not have a material impact on the Group’s or Parent Entity’s reported results.
The following table summarises significant unobservable inputs used in the Level 3 valuations and the valuation techniques used to measure fair value of the instrument.
As at 30 September 2014 Assets Liabilities Valuation Unobservable Minimum Maximum $m $m Technique(s) Inputs Value ValueNon-asset backed debt instruments 785 - Pricing model Yield to maturity 4.5% 8.0%
Pricing model Discount margin 70 bps 110 bpsThird-party pricing n/a n/a n/a
Asset backed products 699 24 Pricing model Discount margin 60 bps 91 bpsPricing model Correlation 32.3% 46.9%Third-party pricing n/a n/a n/a
Equity and equity linked products 329 - Pricing model Interest rate margin 1.0% 15.4%Pricing model Earnings multiple 3.3 7.5Discounted cash flows Discount rate 14.5% 20.0%Third-party pricing n/a n/a n/a
Interest rate products 2 24 Pricing Model Volatility 22.5% 30.0%Total 1,815 48
2014 Westpac Group Annual Report 241

Note 28. Fair values of financial assets and liabilities (continued) Reconciliation of non-market observables The following tables summarise the changes in financial instruments carried at fair value derived from non-market observable valuation techniques (Level 3):
Trading Securities and Other
Financial Assets Designated at Fair
Value Derivatives
Available-for-Sale
Securities Total Assets DerivativesDebt Issues
at Fair ValueTotal
Liabilities$m $m $m $m $m $m $m
Balance as at beginning of year 538 4 790 1,332 24 13 37 Gains/(losses) on assets/(gains)/losses on liabilities recognised in:
Income statements (7) - - (7) (16) 6 (10) Available-for-sale reserve - - 18 18 - - -
Acquisitions 634 2 1,524 2,160 - - - Issues - - - - 24 - 24 Disposals (192) (1) (1,583) (1,776) (2) (1) (3) Settlements (12) - - (12) - - - Transfers into or out ofnon-market observables 24 - - 24 - - - Others1 3 - 73 76 - - - Balance as at end of year 988 5 822 1,815 30 18 48 Unrealised gains/(losses) recognised in the income statements for financial instruments held as at 30 September 2014 14 1 - 15 (8) 6 (2)
Consolidated 2014
1 Includes foreign currency translation impacts.
Trading Securities and Other
Financial Assets Designated at Fair
Value Derivatives
Available-for-Sale
Securities Total Assets DerivativesDebt Issues
at Fair ValueTotal
Liabilities$m $m $m $m $m $m $m
Balance as at beginning of year 438 12 826 1,276 73 27 100 Gains/(losses) on assets/(gains)/losses on liabilities recognised in:
Income statements 51 (2) - 49 (9) 6 (3) Available-for-sale reserve - 1 2 3 1 - 1
Acquisitions 41 1 1,642 1,684 8 - 8 Issues 20 - - 20 - - - Disposals (245) (1) (1,625) (1,871) (23) (20) (43) Settlements (28) (5) - (33) (10) - (10) Transfers into or out ofnon-market observables 251 (2) 10 259 (16) - (16) Others1 10 - (65) (55) - - - Balance as at end of year 538 4 790 1,332 24 13 37 Unrealised gains/(losses) recognised in the income statements for financial instruments held as at 30 September 2013 9 (2) - 7 2 11 13
Consolidated 2013
1 Includes foreign currency translation impacts.
242 2014 Westpac Group Annual Report

Notes to the financial statements Note 28. Fair values of financial assets and liabilities (continued)
Trading Securities and Other
Financial Assets Designated at Fair
Value Derivatives
Available-for-Sale
Securities Total Assets DerivativesDebt Issues
at Fair ValueTotal
Liabilities$m $m $m $m $m $m $m
Balance as at beginning of year 292 4 200 496 24 - 24 Gains/(losses) on assets/(gains)/losses on liabilities recognised in:
Income statements 5 - - 5 (16) - (16) Available-for-sale reserve - - (2) (2) - - -
Acquisitions 628 2 72 702 - - - Issues - - - - 24 - 24 Disposals (162) (1) (108) (271) (2) - (2) Settlements (12) - - (12) - - - Transfers into or out ofnon-market observables 24 - - 24 - - - Others1 4 - 8 12 - - - Balance as at end of year 779 5 170 954 30 - 30 Unrealised gains/(losses) recognised in the income statements for financial instruments held as at 30 September 2014 5 1 - 6 (8) - (8)
Parent Entity 2014
1 Includes foreign currency translation impacts.
Trading Securities and Other
Financial Assets Designated at Fair
Value Derivatives
Available-for-Sale
Securities Total Assets DerivativesDebt Issues
at Fair ValueTotal
Liabilities$m $m $m $m $m $m $m
Balance as at beginning of year 400 12 129 541 73 - 73 Gains/(losses) on assets/(gains)/losses on liabilities recognised in:
Income statements 42 (2) - 40 (9) - (9) Available-for-sale reserve - 1 2 3 1 - 1
Acquisitions 38 1 104 143 8 - 8 Issues 20 - - 20 - - - Disposals (199) (1) (63) (263) (23) - (23) Settlements (28) (5) - (33) (10) - (10) Transfers into or out ofnon-market observables 11 (2) 9 18 (16) - (16) Others1 8 - 19 27 - - - Balance as at end of year 292 4 200 496 24 - 24 Unrealised gains/(losses) recognised in the income statements for financial instruments held as at 30 September 2013 5 (2) - 3 2 - 2
Parent Entity 2013
1 Includes foreign currency translation impacts.
Transfers into and out of Level 3 have occurred due to changes in observability in the significant inputs into the valuation models used to determine the fair value of the related financial instruments. Transfers in and transfers out are reported using the end of period fair values.
2014 Westpac Group Annual Report 243

Note 28. Fair values of financial assets and liabilities (continued) Day one profit or loss For financial assets and financial liabilities measured at fair value through the profit or loss, when the transaction price is different to the fair value from other observable current market transactions in the same instrument or based on a valuation technique whose inputs include only data from observable markets, Westpac recognises the difference between the transaction price and the fair value (‘day one’ profit or loss) in the income statement as non-interest income. In cases where use is made of data which is not observable, day one profit or loss is only recognised in the income statement when the inputs become observable, or over the life of the instrument.
The following table summarises the deferral and recognition of day one profit or loss for the Group and the Parent Entity, where a valuation technique has been applied for which not all the inputs are observable in the market:
2014 2013 2014 2013$m $m $m $m
Balance at the beginning of the year 6 6 6 5 Deferral on new transactions 5 5 5 5 Recognised in the income statements during the year (5) (4) (5) (3) Subsequent to observability - (1) - (1) Balance at the end of the period 6 6 6 6
Consolidated Parent Entity
244 2014 Westpac Group Annual Report

Notes to the financial statements Note 28. Fair values of financial assets and liabilities (continued) Fair value of financial instruments Financial assets and financial liabilities are measured on an ongoing basis either at fair value or at amortised cost. AASB 7 Financial Instruments: Disclosures requires the disclosure of the fair value of those financial instruments not already carried at fair value in the balance sheet. The fair value is the amount for which an asset could be exchanged, or a liability settled, in an arm’s length transaction between knowledgeable, willing parties. The fair value disclosure does not cover those instruments that are not considered to be financial instruments from an accounting perspective, such as income tax and intangible assets.
The following table summarises the estimated fair values and fair value hierarchy of the Group and the Parent Entity financial instruments not measured at fair value as at 30 September 2014:
2014Fair Value
Valuation ValuationQuoted Techniques TechniquesMarket (Market (Non-Market 2013
Carrying Prices Observable) Observable) Carrying FairAmount (Level 1) (Level 2) (Level 3) Total Amount Value
$m $m $m $m $m $m $mFinancial assets not measured at fair value Cash and balances with central banks 25,760 25,760 - - 25,760 11,699 11,699 Receivables due from other financial institutions 7,424 3,830 2,177 1,417 7,424 11,210 11,210 Available for sale securities 16 - - 16 16 12 12 Loans 571,013 - - 571,273 571,273 525,288 525,947 Regulatory deposits with central banks overseas 1,528 - 1,528 - 1,528 1,571 1,571 Other financial assets 5,093 - 5,093 - 5,093 3,750 3,750 Total financial assets 610,834 29,590 8,798 572,706 611,094 553,530 554,189 Financial liabilities not measured at fair valuePayables due to other financial institutions 18,636 3,876 14,760 - 18,636 8,836 8,836 Deposits and other borrowings 411,186 - 408,398 3,434 411,832 382,467 383,669 Debt issues 142,709 - 144,337 - 144,337 129,993 132,058 Loan capital 10,858 - 10,858 - 10,858 9,330 9,374 Other financial liabilities 6,852 - 6,852 - 6,852 7,780 7,780 Total financial liabilities 590,241 3,876 585,205 3,434 592,515 538,406 541,717
Consolidated
2014 Westpac Group Annual Report 245

Note 28. Fair values of financial assets and liabilities (continued)
2014Fair Value
Valuation ValuationQuoted Techniques TechniquesMarket (Market (Non-Market 2013
Carrying Prices Observable) Observable) Carrying FairAmount (Level 1) (Level 2) (Level 3) Total Amount Value
$m $m $m $m $m $m $mFinancial assets not measured at fair value Cash and balances with central banks 23,400 23,400 - - 23,400 9,509 9,509 Receivables due from other financial institutions 5,483 3,686 1,797 - 5,483 9,317 9,317 Available for sale securities 16 - - 16 16 4 4 Loans 496,274 - - 496,485 496,485 460,781 461,376 Regulatory deposits with central banks overseas 1,389 - 1,389 - 1,389 1,463 1,463 Due from subsidiaries 140,098 - - 140,098 140,098 119,038 119,038 Other financial assets 4,527 - 4,527 - 4,527 3,224 3,224 Total financial assets 671,187 27,086 7,713 636,599 671,398 603,336 603,931 Financial liabilities not measured at fair valuePayables due to other financial institutions 18,411 3,842 14,569 - 18,411 8,738 8,738 Deposits and other borrowings 365,522 - 364,946 1,183 366,129 339,555 340,692 Debt issues 121,531 - 123,024 - 123,024 110,404 112,266 Due to subsidiaries 135,066 - - 135,066 135,066 120,553 120,553 Loan capital 10,858 - 10,858 - 10,858 9,330 9,374 Other financial liabilities 5,948 - 5,948 - 5,948 7,044 7,044 Total financial liabilities 657,336 3,842 519,345 136,249 659,436 595,624 598,667
Parent Entity
For financial instruments not measured at fair value on a recurring basis in the balance sheet, fair value has been derived as follows:
Loans The carrying value of loans is net of individually and collectively assessed provisions for impairment charges. The fair value of loans is based on observable market transactions, where available. In the absence of observable market transactions, fair value is estimated using discounted cash flow models. For variable rate loans, the discount rate used is the current effective interest rate. The discount rate applied for fixed rate loans reflects the market rate for the maturity of the loan and the credit worthiness of the borrower.
Deposits and other borrowings Deposits by customers’ accounts are grouped by maturity. Fair values of deposit liabilities payable on demand (interest free, interest bearing and savings deposits) approximate their carrying value. Fair values for term deposits are estimated using discounted cash flows, applying market rates offered for deposits of similar remaining maturities.
Debt issues and loan capital Fair values are calculated using a discounted cash flow model. The discount rates applied reflect the terms of the instruments, the timing of the estimated cash flows and are adjusted for any changes in Westpac’s credit spreads.
Other financial assets and liabilities For all other financial assets and liabilities, the carrying value approximates to the fair value. These items are either short-term in nature, re-price frequently or are of a high credit rating.
246 2014 Westpac Group Annual Report

Notes to the financial statements Note 29. Derivative financial instruments Derivative contracts include forwards, futures, swaps and options, whose values derive from the value of an underlying asset, reference rate or index. Derivatives are flexible and cost-effective tools for assisting in the management of interest rate, exchange rate, commodity, credit and equity exposures.
The Group uses derivatives in two distinct capacities: as a trader, and as an end-user as part of its asset and liability management activities.
Trading As a trader, the Group’s primary objective is to derive income as a market maker from the sale of derivatives to meet Westpac’s customers’ needs. The Group also undertakes risk management activities to manage risks arising from the balance sheet. The market making process provides liquidity in key markets in which the Group operates. The Group also trades on its own account to take advantage of market opportunities. These activities represent a limited part of the Group’s derivative activities.
The Group uses hedge accounting techniques where possible to eliminate the volatility which would otherwise arise due to accounting mismatches.
Hedging Hedging the Group’s exposures to interest rate, credit and foreign exchange rate risk is undertaken in the normal course of business by using derivatives. This activity is principally carried out by Treasury within the risk management framework of limits, practices and procedures set and overseen by RISKCO.
The hedge accounting strategy adopted by Westpac is to utilise a combination of cash flow, fair value and net investment hedge approaches. Some hedging relationships do not meet the criteria for hedge accounting as defined under AASB 139 Financial Instruments: Recognition and Measurement. Derivatives used in these relationships are accounted for in the same way as derivatives held for trading. This includes the management of risks associated with future New Zealand dollar earnings and the management of credit risk exposures in Westpac’s lending portfolio.
a. Fair value hedges
The Group hedges a proportion of its interest rate risk and foreign exchange risk from debt issuances using single currency and cross-currency interest rate derivatives. The Group also hedges part of its interest rate risk from fixed rate assets denominated both in local and foreign currencies using interest rate derivatives designated as fair value hedges.
For the Group, the change in the fair value of hedging instruments designated in fair value hedges was $287 million gain (2013: $249 million gain) while the change in the fair value of hedged items attributed to the hedge risk was a $323 million loss (2013: $244 million loss).
For the Parent Entity, the change in the fair value of hedging instruments designated in fair value hedges was $304 million gain (2013: $205 million gain) while the change in the fair value of hedged items attributed to the hedge risk was $342 million loss (2013: $202 million loss).
All gains or losses associated with the ineffective portion of fair value hedge relationships are recognised as ‘interest income’ in the income statement. The amount recognised for this period was $36 million loss (2013: $6 million gain) for the Group and $38 million loss (2013: $4 million gain) for the Parent Entity.
b. Cash flow hedges
Exposure to the volatility of interest cash flows from floating rate customer deposits, at call balances and loans is hedged through the use of interest rate derivatives.
Exposure to foreign currency principal and interest cash flows from floating rate debt issuances is hedged through the use of cross-currency derivatives.
Underlying cash flows from cash flow hedges are, as a proportion of total cash flows, expected to occur in the following periods:
Less Than 1 Month to 3 Months 1 Year to 2 Years to 3 Years to 4 Years to Over1 Month 3 Months to 1 Year 2 Years 3 Years 4 Years 5 Years 5 Years
2014Cash inflows (assets) 1.5% 14.9% 30.5% 19.0% 24.2% 4.7% 2.9% 2.2%Cash outflows (liabilities) 1.5% 16.9% 29.7% 18.9% 23.9% 4.6% 2.6% 1.9%2013Cash inflows (assets) 6.8% 6.5% 35.4% 29.8% 10.3% 5.8% 3.5% 1.8%Cash outflows (liabilities) 6.5% 6.8% 36.1% 30.2% 9.9% 5.7% 3.4% 1.4%
2014 Westpac Group Annual Report 247

Note 29. Derivative financial instruments (continued) For the Group, a loss on cashflow hedges of $22 million was recognised due to hedge ineffectiveness (2013: $25 million gain). For the Parent Entity, a loss on cashflow hedges of $23 million was recognised due to hedge ineffectiveness (2013: $25 million gain). Both were recognised immediately in interest income in the income statement.
c. Dual fair value and cash flow hedges
Fixed rate foreign currency denominated debt is hedged using cross-currency interest rate derivatives, designated as fair value hedges of foreign interest rates and cash flow hedges of foreign exchange rates.
d. Net investment hedges
For both the Group and Parent Entity, ineffectiveness arising from hedges of net investments in foreign operations and recognised in non-interest income in the income statement amounted to nil (2013: nil). The Group hedges the majority of the currency translation risk of net investments in foreign operations through foreign exchange forward contracts.
The notional amount and fair value of derivative instruments held for trading and designated in hedge relationships are set out in the following tables:
30 September 2014 30 September 2013Fair Value Fair Value Fair Value Fair Value
Notional Asset Liability Notional Asset Liability$m $m $m $m $m $m
Held for tradingInterest rate:
Futures1 94,187 - - 137,682 - -Forwards 159,695 15 (14) 175,276 35 (49)Swaps 1,845,234 14,722 (13,888) 1,290,282 13,313 (13,194)Options 106,950 311 (339) 78,677 152 (109)
Foreign exchange:Forwards 747,207 10,092 (8,873) 473,838 4,193 (4,889)Swaps 339,902 11,592 (9,964) 285,218 6,038 (6,938)Options 34,144 498 (486) 31,003 416 (440)
Commodities 3,426 133 (137) 3,466 117 (106)Equities 313 6 (4) 378 9 (8)Credit 32,684 205 (223) 50,741 266 (296)Total held for trading derivatives 3,363,742 37,574 (33,928) 2,526,561 24,539 (26,029)Fair value hedgesInterest rate:
Swaps2 46,933 402 (2,199) 40,704 606 (1,945)Foreign exchange:
Swaps2,3 34,534 2,279 (1,789) 27,821 1,586 (2,418)Total fair value hedging derivatives 81,467 2,681 (3,988) 68,525 2,192 (4,363)Cash flow hedgesInterest rate:
Swaps2 106,618 996 (591) 107,075 1,464 (829)Foreign exchange:
Swaps2,3 10,974 94 (980) 10,545 153 (1,692)Total cash flow hedging derivatives 117,592 1,090 (1,571) 117,620 1,617 (2,521)Net investment hedges 6,540 59 (52) 5,674 8 (77)Total derivatives 3,569,341 41,404 (39,539) 2,718,380 28,356 (32,990)
Consolidated
1 The fair value differential of futures contracts are settled daily with the exchange. The notional balance represents open contracts as at
30 September. 2 The unrealised foreign exchange gains or loss on derivatives in hedge relationships are substantially offset by the retranslation at spot exchange
rates of the foreign currency denominated debt being hedged, which affects profit and loss in the current year. 3 Included within foreign exchange swaps in fair value hedging derivatives are derivatives designated in both cash flow and fair value hedge
relationships under the dual designation strategy.
248 2014 Westpac Group Annual Report
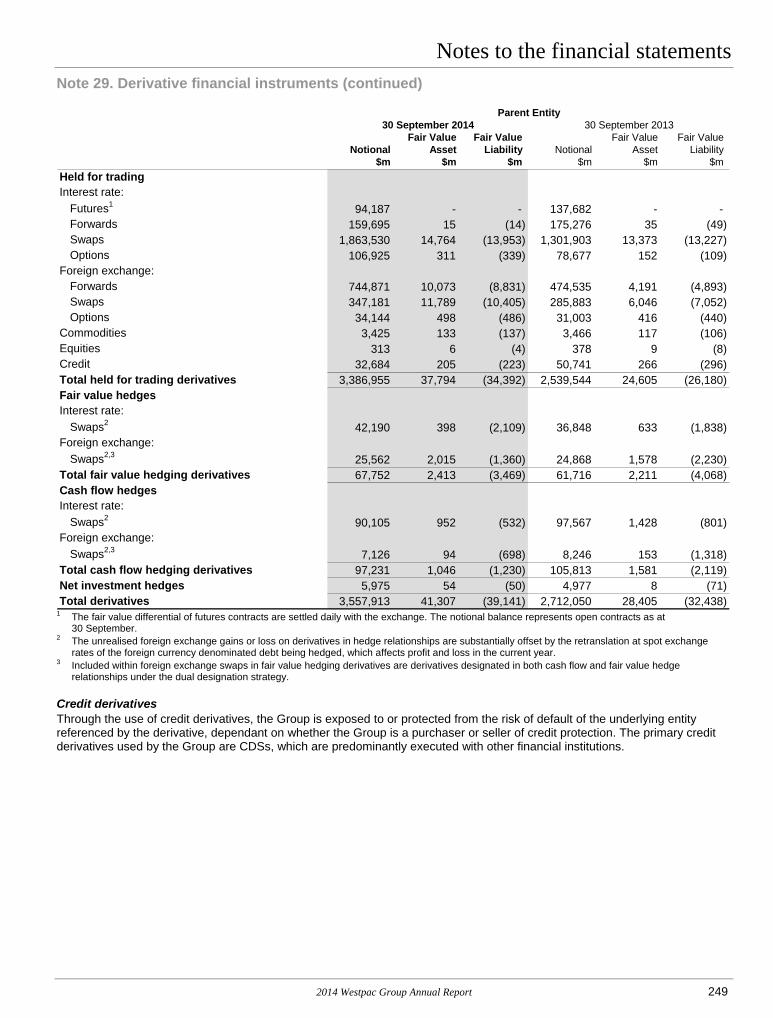
Notes to the financial statements Note 29. Derivative financial instruments (continued)
30 September 2014 30 September 2013Fair Value Fair Value Fair Value Fair Value
Notional Asset Liability Notional Asset Liability$m $m $m $m $m $m
Held for tradingInterest rate:
Futures1 94,187 - - 137,682 - -Forwards 159,695 15 (14) 175,276 35 (49)Swaps 1,863,530 14,764 (13,953) 1,301,903 13,373 (13,227)Options 106,925 311 (339) 78,677 152 (109)
Foreign exchange:Forwards 744,871 10,073 (8,831) 474,535 4,191 (4,893)Swaps 347,181 11,789 (10,405) 285,883 6,046 (7,052)Options 34,144 498 (486) 31,003 416 (440)
Commodities 3,425 133 (137) 3,466 117 (106)Equities 313 6 (4) 378 9 (8)Credit 32,684 205 (223) 50,741 266 (296)Total held for trading derivatives 3,386,955 37,794 (34,392) 2,539,544 24,605 (26,180) Fair value hedgesInterest rate:
Swaps2 42,190 398 (2,109) 36,848 633 (1,838)Foreign exchange:
Swaps2,3 25,562 2,015 (1,360) 24,868 1,578 (2,230)Total fair value hedging derivatives 67,752 2,413 (3,469) 61,716 2,211 (4,068) Cash flow hedgesInterest rate:
Swaps2 90,105 952 (532) 97,567 1,428 (801)Foreign exchange:
Swaps2,3 7,126 94 (698) 8,246 153 (1,318)Total cash flow hedging derivatives 97,231 1,046 (1,230) 105,813 1,581 (2,119) Net investment hedges 5,975 54 (50) 4,977 8 (71) Total derivatives 3,557,913 41,307 (39,141) 2,712,050 28,405 (32,438)
Parent Entity
1 The fair value differential of futures contracts are settled daily with the exchange. The notional balance represents open contracts as at
30 September. 2 The unrealised foreign exchange gains or loss on derivatives in hedge relationships are substantially offset by the retranslation at spot exchange
rates of the foreign currency denominated debt being hedged, which affects profit and loss in the current year. 3 Included within foreign exchange swaps in fair value hedging derivatives are derivatives designated in both cash flow and fair value hedge
relationships under the dual designation strategy.
Credit derivatives Through the use of credit derivatives, the Group is exposed to or protected from the risk of default of the underlying entity referenced by the derivative, dependant on whether the Group is a purchaser or seller of credit protection. The primary credit derivatives used by the Group are CDSs, which are predominantly executed with other financial institutions.
2014 Westpac Group Annual Report 249

Note 29. Derivative financial instruments (continued) Credit derivatives are primarily entered into to facilitate institutional customer transactions and to manage our credit risk exposures. The notional amount and fair value of credit derivatives are presented in the following tables:
Consolidated2014 2013
Fair Value Fair Value Fair Value Fair ValueNotional Asset Liability Notional Asset Liability
$m $m $m $m $m $mCredit protection bought1 16,703 6 (212) 25,576 22 (256)Credit protection sold 15,981 199 (11) 25,165 244 (40)Total2 32,684 205 (223) 50,741 266 (296)
1 Counterparties to derivatives relating to credit protection bought are predominantly financial institutions. 2 The table above does not include total return swaps included with credit derivatives in the previous table.
Parent Entity2014 2013
Fair Value Fair Value Fair Value Fair ValueNotional Asset Liability Notional Asset Liability
$m $m $m $m $m $mCredit protection bought1 16,703 6 (212) 25,576 22 (256)Credit protection sold 15,981 199 (11) 25,165 244 (40)Total2 32,684 205 (223) 50,741 266 (296)
1 Counterparties to derivatives relating to credit protection bought are predominantly financial institutions. 2 The table above does not include total return swaps included with credit derivatives in the previous table.
250 2014 Westpac Group Annual Report

Notes to the financial statements Note 30. Offsetting financial assets and financial liabilities Financial assets and financial liabilities are presented on a net basis on the balance sheet when they meet the offsetting criteria described in Note 1(e)(ii).
The following tables provide information on the impact of offsetting, as well as amounts subject to enforceable master netting agreements or similar arrangements that do not qualify for offsetting in the balance sheets. The tables exclude amounts not subject to offsetting or enforceable netting arrangements and therefore may not tie back to the balance sheet.
The amounts presented in this note do not represent the credit risk exposure of the Consolidated or Parent Entity. Refer to Note 27.2 for information on credit risk management.
Consolidated
Effects of Offsetting on Balance Sheet
Amounts Subject to Enforceable Netting Arrangements But Not Offset
Gross Amounts
Amounts Offset
Net Amounts
Reported on the Balance
Sheet
Other Recognised
Financial Instruments
Cash Collateral
Financial Instrument Collateral Net Amount
$m $m $m $m $m $m $m2014
AssetsReceivables due from other financial institutions1 28 - 28 - - (26) 2Derivative financial instruments 41,404 - 41,404 (27,241) (3,866) (92) 10,205Securities purchased under agreement to resell2 6,275 - 6,275 - (22) (6,253) -Loans3 11,898 (11,801) 97 - - - 97Total assets 59,605 (11,801) 47,804 (27,241) (3,888) (6,371) 10,304LiabilitiesDerivative financial instruments 39,539 - 39,539 (27,241) (3,861) (1,638) 6,799Securities sold under agreement to repurchase4 23,520 - 23,520 - (33) (23,487) -Deposits and other borrowings3 18,031 (11,801) 6,230 - - - 6,230Total liabilities 81,090 (11,801) 69,289 (27,241) (3,894) (25,125) 13,029
2013AssetsReceivables due from other financial institutions1 46 - 46 - - (44) 2Derivative financial instruments 28,356 - 28,356 (20,453) (1,136) (36) 6,731Securities purchased under agreement to resell2 6,882 - 6,882 - (81) (6,801) -Loans3 14,096 (13,920) 176 - - - 176Total assets 49,380 (13,920) 35,460 (20,453) (1,217) (6,881) 6,909LiabilitiesDerivative financial instruments 32,990 - 32,990 (20,453) (7,001) (177) 5,359Securities sold under agreement to repurchase4 7,966 - 7,966 - (9) (7,957) -Deposits and other borrowings3 19,090 (13,920) 5,170 - - - 5,170Total liabilities 60,046 (13,920) 46,126 (20,453) (7,010) (8,134) 10,529
1 Consists of stock borrowing arrangements, reported as part of cash collateral in Receivables due from other financial institutions (Note 8). 2 Securities purchased under agreement to resell forms part of trading securities and other financial assets designated at fair value (Note 9). 3 Consists of debt and interest set-off accounts which meet the requirements for offsetting as described in Note 1(e)(ii). These accounts form part of
overdrafts in Loans (Note 11) and deposits and other borrowings at amortised costs in Deposits and other borrowings (Note 18). 4 Securities sold under agreement to repurchase forms part of Payables due to other financial institutions, recognised at amortised cost (Note 17) and
Other financial liabilities at fair value through income statement (Note 19).
2014 Westpac Group Annual Report 251

Note 30. Offsetting financial assets and financial liabilities (continued) Parent Entity
Effects of Offsetting on Balance Sheet
Amounts Subject to Enforceable Netting Arrangements But Not Offset
Gross Amounts
Amounts Offset
Net Amounts
Reported on the Balance
Sheet
Other Recognised
Financial Instruments
Cash Collateral
Financial Instrument Collateral Net Amount
$m $m $m $m $m $m $m2014
AssetsReceivables due from other financial institutions1 28 - 28 - - (26) 2Derivative financial instruments 41,307 - 41,307 (27,086) (3,831) (92) 10,298Securities purchased under agreement to resell2 6,275 - 6,275 - (22) (6,253) -Loans3 11,898 (11,801) 97 - - - 97Total assets 59,508 (11,801) 47,707 (27,086) (3,853) (6,371) 10,397LiabilitiesDerivative financial instruments 39,141 - 39,141 (27,086) (3,717) (1,638) 6,700Securities sold under agreement to repurchase4 23,439 - 23,439 - (33) (23,406) -Deposits and other borrowings3 18,031 (11,801) 6,230 - - - 6,230Total liabilities 80,611 (11,801) 68,810 (27,086) (3,750) (25,044) 12,930
2013AssetsReceivables due from other financial institutions1 46 - 46 - - (44) 2Derivative financial instruments 28,405 - 28,405 (20,448) (1,136) (36) 6,785Securities purchased under agreement to resell2 6,882 - 6,882 - (81) (6,801) -Loans3 14,096 (13,920) 176 - - - 176Total assets 49,429 (13,920) 35,509 (20,448) (1,217) (6,881) 6,963LiabilitiesDerivative financial instruments 32,438 - 32,438 (20,448) (6,850) (177) 4,963Securities sold under agreement to repurchase4 7,966 - 7,966 - (9) (7,957) -Deposits and other borrowings3 19,090 (13,920) 5,170 - - - 5,170Total liabilities 59,494 (13,920) 45,574 (20,448) (6,859) (8,134) 10,133
1 Consists of stock borrowing arrangements, reported as part of cash collateral in Receivables due from other financial institutions (Note 8). 2 Securities purchased under agreement to resell forms part of trading securities and other financial assets designated at fair value (Note 9). 3 Consists of debt and interest set-off accounts which meet the requirements for offsetting as described in Note 1(e)(ii). These accounts form part of
overdrafts in Loans (Note 11) and deposits and other borrowings at amortised costs in Deposits and other borrowings (Note 18). 4 Securities sold under agreement to repurchase forms part of Payables due to other financial institutions, recognised at amortised cost (Note 17) and
Other financial liabilities at fair value through income statement (Note 19).
Effects of offsetting on balance sheet Amounts are offset in accordance with the criteria described in Note 1(e)(ii) and are limited to the gross carrying values of the financial instrument.
252 2014 Westpac Group Annual Report

Notes to the financial statements Note 30. Offsetting financial assets and financial liabilities (continued) Amounts subject to enforceable netting arrangements but not offset Other recognised financial instruments discloses financial assets and liabilities recognised on balance sheet that are not offset but are subject to enforceable master netting agreements whereby the rights of set-off and close-out netting can be applied in the event of default, or if other predetermined events occur.
Cash collateral and financial instrument collateral discloses amounts received or pledged in relation to the gross amount of assets and liabilities. Financial instrument collateral is reflected at its fair value. These forms of collateral are also subject to enforceable netting arrangements but are not offset due to the collateral being realised only in the event of default or if other predetermined events occur.
For the purposes of disclosure, the amounts subject to enforceable netting arrangements but not offset has been limited to the net amounts of financial assets/(liabilities) presented on the balance sheet so to not include over-collateralisation. As a result, the amounts for cash collateral and financial instruments collateral may not equal the tables disclosed in the ‘Assets pledged’ and ‘Collateral received’ sections under Note 37.
The offsetting and collateral arrangements and other credit risk mitigation strategies used by the Group are further explained in the ‘Management of risk mitigation’ section under Note 27.
Note 31. Capital adequacy APRA has responsibility for the prudential supervision of ADIs, life and general insurance companies and superannuation funds in Australia. Westpac is an ADI.
Australia’s risk-based capital adequacy guidelines are generally consistent but not completely aligned with the approach agreed upon by the Basel Committee on Banking Supervision (BCBS). APRA has exercised its discretion in applying the Basel framework to Australian ADIs, resulting in a more conservative approach than the minimum standards published by the BCBS. APRA also introduced the new standards from 1 January 2013 with no phasing in of higher capital requirements as allowed by BCBS. The application of these discretions act to reduce reported capital ratios relative to those reported in other jurisdictions.
Under APRA’s implementation of Basel III, Australian banks are required to maintain a minimum Common Equity Tier 1 Capital ratio of at least 4.5%, Tier 1 Capital ratio of 6.0% and Total Regulatory Capital ratio of 8.0%. Subject to certain limitations, Common Equity Tier 1 capital consists of paid-up share capital, retained profits and certain reserves, less the deduction of certain intangible assets, capitalised expenses and software, and investments and retained earnings in insurance and funds management subsidiaries that are not consolidated for capital adequacy purposes. Tier 1 Capital is the sum of Common Equity Tier 1 Capital and Additional Tier 1 Capital. Additional Tier 1 Capital comprises high quality components of capital that consists of securities not included in Common Equity Tier 1 Capital but which include loss absorbing characteristics. Total Regulatory Capital is the sum of Tier 1 and Tier 2 Capital. Tier 2 Capital includes other components of capital that, to varying degrees, fall short of the quality of Tier 1 Capital, but nonetheless contribute to the overall strength of an ADI and its capacity to absorb losses.
Westpac’s capital ratios are significantly above APRA minimum capital adequacy requirements. Westpac is required to inform APRA immediately of any breach or potential breach of its minimum prudential capital adequacy requirements, including details of remedial action taken or planned to be taken.
Capital management strategy Westpac’s approach seeks to balance the fact that capital is an expensive form of funding with the need to be adequately capitalised as an ADI. Westpac considers the need to balance efficiency, flexibility and adequacy when determining sufficiency of capital and when developing capital management plans.
Westpac evaluates these considerations through an Internal Capital Adequacy Assessment Process (ICAAP), the key features of which include:
the development of a capital management strategy, including preferred capital range, capital buffers and contingency plans; consideration of both economic and regulatory capital requirements; a process that challenges the capital measures, coverage and requirements which incorporates amongst other things, the
impact of adverse economic scenarios; and consideration of the perspectives of external stakeholders including rating agencies and equity and debt investors.
2014 Westpac Group Annual Report 253

Note 32. Securitisation and covered bonds Westpac derives rewards and has exposure to risks from various forms of securitisation structures:
own asset securitisation; and customer funding conduits. Own assets securitised Securitisation is a funding, liquidity and capital management tool. Securitisation provides Westpac the option to liquefy a pool of assets and increase the Group’s wholesale funding capacity. Westpac may provide arm’s length facilities to the securitisation vehicles. The facilities entered into typically include the provision of liquidity, funding and derivative contracts.
Where the Parent Entity and the Group have continuing involvement with the securitisation vehicle, through ongoing exposure to the risks and rewards associated with the assets, the provision of derivatives, liquidity facilities and trust management and operational services, the originated assets remain recognised on the balance sheet for accounting purposes. These securitisation vehicles are consolidated as Westpac is exposed or has the right to variable returns and has the ability to effect its returns through its power over these securitisation vehicles.
Customer funding conduits The Group arranges funding for certain customer transactions through a securitisation conduit (Waratah Receivables Corporation Limited and other related structured entities) that provides customers with access to funding from commercial paper markets. Given that Westpac provides liquidity, credit enhancements, foreign exchange facilities and management and operational services, it is deemed to have exposure to the associated risks and rewards. The conduits are consolidated as the Group is exposed or has the right to variable returns and has the ability to effect its returns through its power over the conduits.
Revenue from securitisation structures Fee income Westpac receives a market-based fee or margin in return for its services as trust manager, servicer, foreign exchange counterparty and facilities provider.
Securitisation risk management Credit exposure Where relevant, counterparty exposure arising from funding, liquidity, credit support and funding facilities, foreign exchange and swap arrangements for both own asset securitisation and customer funding conduits are approved within the Group’s normal credit process and are captured and monitored in key source systems along with other facilities and derivatives entered into by Westpac.
Market risk Exposures arising from transactions with securitisation conduits and other counterparties are captured as part of Westpac’s traded and non-traded market risk reporting and limit management framework.
The interest rate and basis risk generated by Westpac’s provision of hedge arrangements to securitisation vehicles are captured and managed in Westpac’s ALM framework. The risk generated by Westpac’s provision of liquidity and redraw facilities to own asset vehicles is captured and managed within Treasury’s liquidity risk policies along with all other contingent liquidity facilities.
Funding and liquidity management Exposure to and the impact of securitisation transactions are managed under the Market and Liquidity Risk Management Framework and are integrated into routine reporting for capital and liquidity positions, net interest margin analysis, balance sheet forecasting and funding scenario testing. The Group’s funding plan incorporates consideration of overall liquidity risk limits and the level of securitisation of Westpac originated assets. Westpac provided undrawn liquidity facilities to the customer funding conduit of $1,416 million at 30 September 2014 (30 September 2013: $1,784 million). Similarly undrawn funding and liquidity facilities of $371 million were provided by Westpac (30 September 2013: $532 million) for the securitisation of its own assets.
254 2014 Westpac Group Annual Report

Notes to the financial statements Note 32. Securitisation and covered bonds (continued) The table below presents assets securitised by the Group:
Consolidated2014 2013Customer Customer
Own Assets Conduits Total Own Assets Conduits Total$m $m $m $m $m $m
Residential mortgage 9,572 1,417 10,989 9,483 1,710 11,193Auto and equipment finance 1,348 - 1,348 925 - 925Other assets securitised - - - - 75 75Other1 665 - 665 412 - 412Total 11,585 1,417 13,002 10,820 1,785 12,605
1 This reflects cash held by the own asset securitisation vehicles.
The table below presents assets securitised by the Parent Entity:
Parent Entity2014 2013Customer Customer
Own Assets1 Conduits Total Own Assets1 Conduits Total$m $m $m $m $m $m
Residential mortgage 83,090 - 83,090 71,658 - 71,658Other2 7,326 - 7,326 5,532 - 5,532Total 90,416 - 90,416 77,190 - 77,190
1 Own assets securitised by the Parent Entity include internal mortgage backed securitisation of $79,500 million (2013: $66,535 million) which are available for external issuance and $73,950 million (2013: $61,845 million) qualifies for repurchase with the RBA.
2 This reflects cash held by the own asset securitisation vehicles.
The table below presents the underlying liabilities of the Group as a result of the securitisation of assets:
Consolidated2014 2013Customer Customer
Own Assets Conduits Total Own Assets Conduits Total$m $m $m $m $m $m
Notes issued 11,276 1,418 12,694 10,372 1,772 12,144
The table below presents the underlying liabilities of the Parent Entity as a result of the securitisation of assets:
Parent Entity2014 2013Customer Customer
Own Assets Conduits Total Own Assets Conduits Total$m $m $m $m $m $m
Due to subsidiaries 89,135 - 89,135 76,741 - 76,741
Certain own asset securitisation and customer funding conduit notes have been issued in foreign currencies and have been translated to Australian dollars using the spot foreign exchange rate on the balance sheet date. These foreign exchange exposures are fully hedged with foreign exchange derivatives. Associated derivatives are not presented in the tables above and explain the mismatch between assets securitised and notes issued.
2014 Westpac Group Annual Report 255

Note 32. Securitisation and covered bonds (continued) The table below presents the fair value of own assets securitised and underlying liabilities as a result of the securitisation of assets for the Consolidated Group and Parent Entity:
Consolidated Parent Entity2014 2013 2014 2013
$m $m $m $mResidential mortgage 9,580 9,495 83,143 71,753Auto and equipment finance 1,374 943 - -Other 665 412 7,326 5,532
11,619 10,850 90,469 77,285Notes issued 11,295 10,353 90,232 76,159
11,295 10,353 90,232 76,159Net fair value 324 497 237 1,126
Fair value of assets securitised
Fair value of underlying liabilities
Covered bonds The Group has two covered bond programs: one utilises Australian residential mortgages (Australian Program) and one utilises New Zealand residential mortgages (New Zealand Program). Pursuant to these programs, selected pools of residential mortgages are assigned to bankruptcy remote structured entities. These provide unconditional and irrevocable guarantees of the related covered bonds that are issued by members of the Group. As such, the covered bondholders have recourse to the issuer of the covered bond and, in the event that the issuer fails to make a payment when due, to the covered bond structured entities.
The Group has continuing involvement with the covered bond structured entities as it is exposed to the risks and rewards associated with the pools of residential mortgages (including by way of the derivatives it has entered into with the structured entities). Accordingly, for accounting purposes, the structured entities are consolidated entities of the Group.
As at 30 September 2014, the carrying value of covered bonds on issue was $26,168 million (2013: $18,140 million) for the Group and $23,167 million (2013: $16,229 million) for the Parent Entity. The carrying value of assets pledged for the covered bond programs was $39,314 million (2013: $34,244 million) for the Group and $35,276 million (2013: $30,232 million) for the Parent Entity. The difference between the carrying value of covered bonds on issue and the carrying value of assets pledged for the covered bond programs includes the amount of over-collateralisation required to maintain the ratings of the covered bonds on issue and additional assets primarily to allow for future issuance of covered bonds without delay. The additional assets that allow for future issuance can be repurchased by Westpac at its discretion, subject to the conditions set out in the transaction documents.
256 2014 Westpac Group Annual Report

Notes to the financial statements Note 33. Group segment information The accounting standard AASB 8 Operating Segments requires segment results to be presented on a basis that is consistent with information provided internally to Westpac’s key decision makers. In assessing financial performance, including divisional results, Westpac uses a measure of performance referred to as ‘cash earnings’. Cash earnings is not a measure of cash flow or net profit determined on a cash accounting basis, as it includes non-cash items reflected in net profit determined in accordance with AAS. The specific adjustments include both cash and non-cash items. Cash earnings, as calculated by Westpac, is viewed as a measure of the level of profit that is generated by ongoing operations and is therefore available for distribution to shareholders. Management believes this allows the Group to more effectively assess performance for the current period against prior periods and to compare performance across business divisions and across peer companies. Three categories of adjustments are made to statutory results to determine cash earnings: material items that key decision makers at Westpac believe do not reflect ongoing operations; items that are not considered when dividends are recommended, such as the amortisation of intangibles, impact of Treasury
shares and economic hedging impacts; and accounting reclassifications between individual line items that do not impact statutory results, such as policyholder
tax recoveries1. The basis of segment reporting reflects the management of the business, rather than the legal structure of the Group. The operating segment results have been presented on a management reporting basis and consequently internal charges and transfer pricing adjustments have been reflected in the performance of each operating segment. Inter-segment pricing is determined on an arm’s length basis.
Reportable operating segments The operating segments are defined by the customers they service and the services they provide:
Australian Financial Services (AFS) is responsible for the Westpac Group’s Australian retail banking, business banking and wealth operations. It incorporates the operations of: – Westpac Retail & Business Banking (Westpac RBB), which is responsible for sales and service for consumer, small-to-
medium enterprise (SME), commercial and agribusiness customers (with turnover of up to $100 million) in Australia under the Westpac brand;
– St.George Banking Group (St.George), which is responsible for sales and service to consumer, SME and corporate customers (businesses with facilities up to $150 million) in Australia under the St.George, BankSA, Bank of Melbourne and RAMS2 brands;
– BT Financial Group (Australia) (BTFG), which is Westpac’s Australian wealth division. Its operations include funds management and insurance solutions. BTFG’s brands include Advance Asset Management, Ascalon, Asgard, BT, BT Investment Management (BTIM)3, Licensee Select, BT Select, Securitor, and the advice, private banking and insurance operations of Bank of Melbourne, BankSA, St.George and Westpac.
AFS also includes the product, marketing and risk management responsibilities for Australian retail banking and wealth.
Westpac Institutional Bank (WIB) delivers a broad range of financial services to commercial, corporate, institutional and government customers with connections to Australia and New Zealand. Customers are supported through branches and subsidiaries located in Australia, New Zealand, Asia, US and UK;
Westpac New Zealand is responsible for sales and service of banking, wealth and insurance products for consumers, business and institutional customers in New Zealand. Banking products are provided under the Westpac and WIB brands while insurance and wealth products are provided under Westpac Life and BT brands respectively.
Other divisions in the Group include:
Westpac Pacific, which provides banking services for retail and business customers in seven Pacific Island Nations; Group Services, which encompasses technology, banking operations, compliance, legal and property services; Treasury, which is primarily focused on the management of the Group’s interest rate risk and funding requirements by
managing the mismatch between Group assets and liabilities; Core Support, which comprises those functions performed centrally including finance, risk and human resources; and Group items, including earnings on capital not allocated to divisions, accounting entries for certain intra-group transactions
that facilitate the presentation of the performance of our operating segments, earnings from non core asset sales and certain other head office items such as centrally raised provisions.
1 Policyholder tax recoveries – income and tax amounts that are grossed up to comply with the Australian Accounting Standard covering Life Insurance Business (policyholder tax recoveries) are reversed in deriving income and taxation expense on a cash earnings basis.
2 RAMS is a financial services group specialising in mortgages and online deposits. 3 BTIM is 61% owned by the Westpac Group and consolidated in BTFG’s Funds Management business.
2014 Westpac Group Annual Report 257

Note 33. Group segment information (continued) Comparative changes Prior period comparatives were restated to reflect the following:
Updated revenue sharing arrangements – during the year the Group transferred responsibility for financial markets sales operations undertaken in St.George to
WIB. All financial markets operations in Australia are now managed in WIB. In conjunction with this change, the Group simplified the allocation of revenue and expenses from institutional partnership products across the Group; and
– during the year BTFG simplified revenue and expense allocation with St.George and Westpac RBB. Revenue and expense allocations for wealth partnership products sold to AFS customers are included in BTFG financial results.
Inter-company loan margin charge An update to funds transfer pricing within Westpac New Zealand Limited (WNZL) has seen a change in income recognised between Westpac New Zealand and other divisions.
Changes to accounting policies The transitional impacts arising from changes to accounting policies as a result of the adoption of new and amended Australian Accounting Standards. A summary of quantitative impacts arising from these changes are set out in Note 1 ‘Summary of quantitative impacts’.
The tables below present the segment results on a cash earnings basis:
Consolidated 2014Westpac
Retail & St.George BT Financial Westpac Westpac Business Banking Group Institutional New Other
Banking Group (Australia) AFS Bank Zealand Divisions Total $m $m $m $m $m $m $m $mNet interest income 5,958 3,537 410 9,905 1,643 1,455 493 13,496Non-interest income 1,403 518 2,244 4,165 1,518 438 203 6,324Net operating income before operating expenses and impairment charges 7,361 4,055 2,654 14,070 3,161 1,893 696 19,820Operating expenses (3,233) (1,560) (1,322) (6,115) (1,207) (776) (148) (8,246)Impairment charges (437) (236) 2 (671) 136 (24) (91) (650)Profit before income tax 3,691 2,259 1,334 7,284 2,090 1,093 457 10,924Income tax expense (1,109) (679) (400) (2,188) (622) (300) (120) (3,230)Profit attributable to non-controlling interests - - (39) (39) - (3) (24) (66)Cash earnings for the year 2,582 1,580 895 5,057 1,468 790 313 7,628Net cash earnings adjustments - (125) (22) (147) - - 80 (67)Net profit attributable to owners of Westpac Banking Corporation 2,582 1,455 873 4,910 1,468 790 393 7,561
Additional informationDepreciation, amortisation and impairments (76) (50) (45) (171) (84) (80) (468) (803)
Balance sheetTotal assets 276,496 175,424 31,803 483,723 118,922 65,874 102,323 770,842Total liabilities 177,006 94,818 34,288 306,112 129,453 57,568 228,372 721,505Acquisition of property, plant and equipment, goodwill and other intangible assets 68 325 72 465 196 80 799 1,540
258 2014 Westpac Group Annual Report

Notes to the financial statements Note 33. Group segment information (continued)
Consolidated 2013Westpac
Retail & St.George BT Financial Westpac Westpac Business Banking Group Institutional New Other
Banking Group (Australia) AFS Bank Zealand Divisions Total $m $m $m $m $m $m $m $mNet interest income 5,655 3,216 406 9,277 1,630 1,281 724 12,912Non-interest income 1,320 469 1,917 3,706 1,633 389 193 5,921Net operating income before operating expenses and impairment charges 6,975 3,685 2,323 12,983 3,263 1,670 917 18,833Operating expenses (3,124) (1,402) (1,206) (5,732) (1,115) (697) (215) (7,759)Impairment charges (486) (293) (1) (780) 89 (97) (59) (847)Profit before income tax 3,365 1,990 1,116 6,471 2,237 876 643 10,227Income tax expense (1,010) (598) (325) (1,933) (662) (241) (252) (3,088)Profit attributable to non-controlling interests - - (18) (18) - (3) (55) (76)Cash earnings for the year 2,355 1,392 773 4,520 1,575 632 336 7,063Net cash earnings adjustments - (128) (22) (150) - - (162) (312)Net profit attributable to owners of Westpac Banking Corporation 2,355 1,264 751 4,370 1,575 632 174 6,751Additional informationDepreciation, amortisation and impairments (68) (45) (44) (157) (48) (50) (428) (683)Balance sheetTotal assets 261,880 159,770 32,210 453,860 97,247 61,469 88,521 701,097Total liabilities 167,005 90,141 33,932 291,078 115,347 53,882 193,253 653,560Acquisition of property, plant and equipment, goodwill and other intangible assets 66 28 82 176 104 117 645 1,042
Consolidated 2012Westpac
Retail & St.George BT Financial Westpac Westpac Business Banking Group Institutional New Other
Banking Group (Australia) AFS Bank Zealand Divisions Total $m $m $m $m $m $m $m $mNet interest income 5,309 2,966 424 8,699 1,701 1,201 962 12,563Non-interest income 1,214 492 1,693 3,399 1,454 367 293 5,513Net operating income before operating expenses and impairment charges 6,523 3,458 2,117 12,098 3,155 1,568 1,255 18,076Operating expenses (3,052) (1,328) (1,131) (5,511) (1,030) (653) (233) (7,427)Impairment charges (429) (433) (1) (863) (127) (148) (74) (1,212)Profit before income tax 3,042 1,697 985 5,724 1,998 767 948 9,437Income tax expense (884) (508) (292) (1,684) (580) (211) (329) (2,804)Profit attributable to non-controlling interests - - (8) (8) - (3) (58) (69)Cash earnings for the year 2,158 1,189 685 4,032 1,418 553 561 6,564Net cash earnings adjustments - (129) (22) (151) - - (477) (628)Net profit attributable to owners of Westpac Banking Corporation 2,158 1,060 663 3,881 1,418 553 84 5,936Additional informationDepreciation, amortisation and impairments (70) (44) (41) (155) (37) (51) (382) (625)Balance sheetTotal assets 255,268 154,642 30,538 440,448 97,823 48,648 91,693 678,612Total liabilities 159,120 82,421 32,221 273,762 110,389 33,970 214,226 632,347Acquisition of property, plant and equipment, goodwill and other intangible assets 122 105 366 593 56 84 456 1,189
2014 Westpac Group Annual Report 259

Note 33. Group segment information (continued) Reconciliation of cash earnings to net profit Consolidated 2014
Cash Earnings for the Year
PolicyholderTax Recoveries
TreasuryShares2
Ineffective Hedges3
Fair Value Gain/(Loss) on
Economic Hedges4
Buyback of Government Guaranteed
Debt5
$m $m $m $m $m $mNet interest income 13,496 - - (67) 77 60Non-interest income 6,324 4 (6) - 73 -Net operating income before operating expenses and impairment charges 19,820 4 (6) (67) 150 60Operating expenses (8,246) - - - - -Impairment charges (650) - - - - -Profit before income tax 10,924 4 (6) (67) 150 60Income tax expense (3,230) (4) (1) 21 (45) (18)Profit attributable to non-controlling interests (66) - - - - -Cash earnings for the year 7,628 - (7) (46) 105 42
Consolidated 2013
Cash Earnings for the Year
PolicyholderTax Recoveries
TPSRevaluations1
TreasuryShares2 Ineffective Hedges3
$m $m $m $m $mNet interest income 12,912 - - - 29Non-interest income 5,921 35 (67) (49) (1)Net operating income before operating expenses and impairment charges 18,833 35 (67) (49) 28Operating expenses (7,759) - - - -Impairment charges (847) - - - -Profit before income tax 10,227 35 (67) (49) 28Income tax expense (3,088) (35) 58 7 (8)Profit attributable to non-controlling interests (76) - - - -Cash earnings for the year 7,063 - (9) (42) 20
Consolidated 2012
Cash Earnings for the Year
Policyholder Tax Recoveries
TPSRevaluations1
TreasuryShares2
Ineffective Hedges3
Fair Value Gain/(Loss) on
Economic Hedges4
$m $m $m $m $m $mNet interest income 12,563 - - - 8 (10)Non-interest income 5,513 12 (17) (30) 3 -Net operating income before operating expenses and impairment charges 18,076 12 (17) (30) 11 (10)Operating expenses (7,427) - - - - -Impairment charges (1,212) - - - - -Profit before income tax 9,437 12 (17) (30) 11 (10)Income tax expense (2,804) (12) (10) 3 (4) 3Profit attributable to non-controlling interests (69) - - - - -Cash earnings for the year 6,564 - (27) (27) 7 (7)
260 2014 Westpac Group Annual Report

Notes to the financial statements Note 33. Group segment information (continued)
Fair Value Amortisation of
Financial Instruments6
Amortisation of Intangible Assets7
Acquisition Transaction and
Integration Expenses8
Bell Litigation Provision9
Westpac Bicentennial Foundation
Grant10
Prior Period Tax
Provisions11
Total Cash Earnings
AdjustmentsNet Profit
for the Year$m $m $m $m $m $m $m $m
(24) - - - - - 46 13,542- - - - - - 71 6,395
(24) - - - - - 117 19,937- (212) (64) 75 (100) - (301) (8,547)- - - - - - - (650)
(24) (212) (64) 75 (100) - (184) 10,7407 63 13 (21) 30 70 115 (3,115)
- 2 - - - - 2 (64)(17) (147) (51) 54 (70) 70 (67) 7,561
Fair Value Gain/(Loss) on
Economic Hedges4Buyback of Government
Guaranteed Debt5Fair Value Amortisation of
Financial Instruments6Amortisation of
Intangible Assets7
Total CashEarnings
AdjustmentsNet Profit
for the Year$m $m $m $m $m $m37 (62) (95) - (91) 12,821
(65) - - - (147) 5,774
(28) (62) (95) - (238) 18,595- - - (217) (217) (7,976)- - - - - (847)
(28) (62) (95) (217) (455) 9,7727 19 28 65 141 (2,947)
- - - 2 2 (74)(21) (43) (67) (150) (312) 6,751
Buyback of Government
Guaranteed Debt5
Fair ValueAmortisation of
Financial Instruments6
Amortisationof Intangible
Assets7Bell Litigation
Provision9Supplier
Program12
TOFA Tax Consolidation Adjustment13
Total Cash Earnings
AdjustmentsNet Profit
for the Year$m $m $m $m $m $m $m $m7 (66) - - - - (61) 12,502- - - - - - (32) 5,481
7 (66) - - - - (93) 17,983- - (220) (111) (199) - (530) (7,957)- - - - - - - (1,212)7 (66) (220) (111) (199) - (623) 8,814
(2) 20 66 33 60 (165) (8) (2,812)
- - 3 - - - 3 (66)5 (46) (151) (78) (139) (165) (628) 5,936
2014 Westpac Group Annual Report 261

Note 33. Group segment information (continued)
Year Ended Year Ended Year Ended30 September 2014 30 September 2013 30 September 2012
$m $m $mCash earnings for the year 7,628 7,063 6,564Cash earnings adjustments:
TPS revaluations1 - (9) (27)Treasury shares2 (7) (42) (27)Ineffective hedges3 (46) 20 7Fair value gain/(loss) on economic hedges4 105 (21) (7)Buyback of government guaranteed debt5 42 (43) 5Fair value amortisation of financial instruments6 (17) (67) (46)Amortisation of intangible assets7 (147) (150) (151)Acquisition transaction and integration expenses8 (51) - -Bell litigation provision9 54 - (78)Westpac Bicentennial Foundation grant10 (70) - -Prior period tax provisions11 70 - -Supplier program12 - - (139)TOFA tax consolidation adjustment13 - - (165)
Total cash earnings adjustments (67) (312) (628)Net profit attributable to owners of Westpac Banking Corporation 7,561 6,751 5,936
1 This adjustment related to TPS 2003 securities which were redeemed on 30 September 2013. Historically this adjusted for movements in economic hedges, including associated tax effects impacting the foreign currency translation reserve, relating to hybrid instruments classified as non-controlling interests. The adjustment was required as these hybrid instruments were not fair valued, however, the hedges were fair valued and therefore there was a mismatch in the timing of income recognition in the statutory results. The mismatch was added back to statutory results in deriving cash earnings as it did not affect the Group’s profits over time.
2 Under AAS, Westpac shares held by the Group in the managed funds and life businesses are deemed to be Treasury shares and the results of holding these shares are not permitted to be recognised as income in the statutory results. In deriving cash earnings, these results are included to ensure there is no asymmetrical impact on the Group’s profits because the Treasury shares support policyholder liabilities and equity derivative transactions which are re-valued in determining income.
3 The (gain)/loss on ineffective hedges is reversed in deriving cash earnings for the period because the gain or loss arising from the fair value movement in these hedges reverses over time and does not affect the Group’s profits over time.
4 Fair value on economic hedges (which do not qualify for hedge accounting under AAS) comprise: the unrealised fair value gain/(loss) on foreign exchange hedges of future New Zealand earnings impacting non-interest income is reversed in
deriving cash earnings as they may create a material timing difference on statutory results but do not affect the Group’s cash earnings during the life of the hedge;
the unrealised fair value gain/(loss) on foreign exchange hedges of fees payable for the use of the Government guarantee on foreign denominated wholesale funding is reversed in deriving cash earnings as they may create a material timing difference on statutory results but do not affect the Group’s cash earnings during the life of the hedge; and
the unrealised fair value gain/(loss) on hedges of accrual accounted term funding transactions are reversed in deriving cash earnings as they may create a material timing difference on statutory results but do not affect the Group’s cash earnings during the life of the hedge.
5 The Group has bought back certain Government guaranteed debt issues which reduces Government guarantee fees (70 basis points) paid. In undertaking the buybacks, a cost was incurred reflecting the difference between current interest rates and the rate at which the debt was initially issued. In the statutory result, the cost incurred is recognised at the time of the buyback. In cash earnings, the cost incurred is being amortised over the original term of the debt that was bought back consistent with a 70 basis point saving being effectively spread over the remaining life of the issue. The cash earnings adjustment gives effect to the timing difference between statutory results and cash earnings.
6 The accounting for the merger with St.George resulted in the recognition of fair value adjustments on the St.George retail bank loans, deposits, wholesale funding and associated hedges, with these fair value adjustments being amortised over the life of the underlying transactions. The amortisation of these adjustments is considered to be a timing difference relating to non-cash flow items that do not affect cash distributions available to shareholders and therefore, have been treated as a cash earnings adjustment.
7 The merger with St.George and the acquisitions of J O Hambro Capital Management (JOHCM) and Lloyds resulted in the recognition of identifiable intangible assets. These assets include intangibles related to core deposits, customer relationships, management contracts and distribution relationships. These intangible items are amortised over their useful lives, ranging between four and twenty years. The amortisation of intangible assets (excluding capitalised software) is a cash earnings adjustment because it is a non-cash flow item and does not affect cash distributions available to shareholders.
8 Costs associated with the acquisition of Lloyds have been treated as a cash earnings adjustment as they do not impact the earnings expected from the acquired businesses following the integration period.
9 During the year ended 30 September 2012, the Group recognised additional provisions in respect of the long running Bell litigation. This was treated as a cash earnings adjustment at the time due to its size, historical nature and because it did not reflect ongoing operations. In the current year, the Bell litigation has been settled and the release of provisions no longer required has also been treated as a cash earnings adjustment. There are no matters outstanding with the Bell case.
10 The Group provided a grant to establish the Westpac Bicentennial Foundation. The $100 million grant ($70 million after tax) has been treated as a cash earnings adjustment due to its size and because it does not reflect ongoing operations.
262 2014 Westpac Group Annual Report

Notes to the financial statements Note 33. Group segment information (continued) 11 During the year ended 30 September 2011, the Group raised provisions in respect of certain tax positions for transactions previously undertaken by
the Group. A number of these matters have now been resolved, resulting in a release of the provisions which are no longer required. As the provisions raised were treated as a cash earnings adjustment, the release has been treated in a consistent manner.
12 During the year ended 30 September 2012, the Group incurred and provisioned for expenses as part of its program to increase the use of global specialists in certain technology and back office operations. These expenses included costs associated with streamlining and better documenting systems and processes, technology costs to enable infrastructure and enhance interaction with suppliers, and costs associated with restructuring the workforce. Given these significant expenses were not considered in determining dividends they were treated as cash earnings adjustments.
13 During the year ended 30 September 2012, taxation legislation was introduced that included retrospective amendments to the income tax law as it applies to the Taxation of Financial Arrangements (TOFA) and tax consolidated groups. The amendments had an adverse application to certain liabilities that were consolidated as part of the merger with St.George. This gave rise to an additional income tax expense of $165 million for the year ended 30 September 2012. Consistent with other tax adjustments relating to the merger with St.George, this adjustment was treated as a cash earnings adjustment due to its size and because it did not reflect ongoing operations.
Revenue from products and services Details of revenue from external customers by product or service are disclosed in Notes 2 and 3. No single customer amounts to greater than 10% of the Group’s revenue.
Geographic segments Geographic segments are based on the location of the office in which the following items are recognised:
$m % $m % $m %Revenue Australia 32,880 85.1 34,159 88.1 38,195 90.2New Zealand 4,738 12.3 3,885 10.0 3,676 8.7Other1 1,025 2.6 739 1.9 483 1.1Total 38,643 100.0 38,783 100.0 42,354 100.0Non-current assets2
Australia 12,828 91.2 12,324 91.2 12,250 92.3New Zealand 797 5.7 786 5.8 650 4.9Other1 433 3.1 405 3.0 371 2.8Total 14,058 100.0 13,515 100.0 13,271 100.0
2014 2013 2012
1 Other includes Pacific Islands, Asia, the Americas and Europe. 2 Non-current assets includes property, plant and equipment, goodwill and other intangible assets.
2014 Westpac Group Annual Report 263

Note 34. Auditor’s remuneration During the financial year, the auditor of the Group and Parent Entity, PricewaterhouseCoopers (PwC), and its related practices earned the following remuneration including goods and services tax:
2014 2013 2014 2013$’000 $’000 $’000 $’000
PwC – Australian firmAudit and review of financial reports of Westpac Banking Corporation or any entity in the Group 16,459 16,139 15,910 15,395Other audit-related work 917 669 877 669Total audit and other assurance services 17,376 16,808 16,787 16,064Taxation 600 141 600 141Other services 2,407 1,353 2,226 1,353Total remuneration paid to PwC – Australian firm 20,383 18,302 19,613 17,558
Related practices of PwCAudit and review of financial reports of Westpac Banking Corporation or any entity in the Group 3,446 2,709 444 355Other audit-related work 310 159 126 -Total audit and other assurance services 3,756 2,868 570 355Taxation 11 20 - -Other services 81 - 37 -Total remuneration paid to related practices of PwC 3,848 2,888 607 355Total remuneration paid to PwC 24,231 21,190 20,220 17,913
Consolidated Parent Entity
For compliance with SEC disclosure requirements, remuneration to the external auditor, including goods and services tax, for the years ended 30 September 2014 and 2013 is summarised from the table above as follows:
2014 2013$’000 $’000
Audit fees 19,905 18,848Non-audit fees:
Audit-related fees 1,227 828Tax fees 611 161All other fees 2,488 1,353
Total non-audit fees 4,326 2,342Total fees paid to PwC 24,231 21,190
It is Westpac’s policy to engage the external auditors on assignments additional to their statutory audit duties, only if their independence is not impaired or seen to be impaired, and where their expertise and experience with Westpac is important. All services were approved by the Audit Committee in accordance with the pre-approval policy and procedures.
In the tables above, audit services include the year end audit and review of the half year statutory reports and comfort letters associated with debt issues and capital raisings for the Parent Entity, its controlled entities and the consolidated Group.
Audit-related services include consultations regarding accounting standards and reporting requirements and regulatory compliance reviews.
Taxation services include tax compliance and tax advisory services.
Other services include assurance on the development of an upgraded wealth platform and mortgage product system, due diligence on the acquisition of select Australian businesses of Lloyds Banking Group, a review of the Enterprise Project Investments and Delivery model and a review of the Wealth Business.
The external auditor, PwC, also provides audit and non-audit services to non-consolidated entities sponsored by the Group, non-consolidated trusts of which a Westpac Group entity is trustee, manager or responsible entity and non-consolidated superannuation funds or pension funds. The fees in respect of their services were approximately $7.9 million in total (2013: $7.7 million). PwC may also provide audit and non-audit services to other entities in which Westpac holds a minority interest, and which are not consolidated. Westpac is not aware of the amount of any fees paid by those entities.
264 2014 Westpac Group Annual Report

Notes to the financial statements Note 35. Expenditure commitments
Consolidated Parent Entity 2014 2013 2014 2013 $m $m $m $mLease commitments (all leases are classified as operating leases) Premises and sites 3,480 3,883 3,112 3,513 Furniture and equipment 26 22 20 16 Total lease commitments 3,506 3,905 3,132 3,529 Due within one year 528 509 452 444 Due after one year but not later than five years 1,534 1,712 1,323 1,512 Due after five years 1,444 1,684 1,357 1,573 Total lease commitments 3,506 3,905 3,132 3,529 Other expenditure commitments1
Payable within one year 687 713 614 622 Payable later than one year but not later than five years 1,109 1,462 836 1,291 Payable after five years - 29 - 29 Total other expenditure commitments 1,796 2,204 1,450 1,942
1 Amounts presented for other expenditure commitments represent the estimated spend on Westpac’s significant contracts over their remaining term. This would differ from the contractually committed amount.
As at 30 September 2014, the total future minimum lease payments expected to be received by the Group and Parent Entity from non-cancellable sub-leases was $14 million (2013: $17 million) and $14 million (2013: $17 million) respectively.
Operating lease arrangements Operating leases are entered into to meet the business needs of entities in the Group. Leases are primarily over commercial and retail premises and plant and equipment. Lease rentals are determined in accordance with market conditions when leases are entered into or on rental review dates.
Leased premises that have become excess to the Group’s business needs have been sublet where possible and any expected rental shortfalls fully provided for. There are no restrictions imposed on the Group by lease arrangements other than in respect of the specific premises being leased.
The Group has lease commitments resulting from the sale and lease back of various premises. These leases are generally for a term of five years with an option to extend for another five years. In most instances, other than the lease arrangement, the Group has no ongoing interests in the premises.
Significant long term agreements On 15 August 2014, Westpac extended its agreement with IBM New Zealand Limited for a further two years, commencing 1 March 2015 to 28 February 2019. IBM is responsible for Westpac’s IT infrastructure services in New Zealand including mainframes and midrange systems, storage, security, data centre network services and workplace printing.
On 15 June 2014, Westpac renewed its agreement with Computer Associates (Pacific) Pty Limited for 4.5 years. The renewed agreement relates to mainframe software and it also incorporates a new enterprise licence for testing tools.
On 31 March 2014, Westpac entered into a five year contract with Telstra Corporation Limited for the provision of telecommunication services in Australia and the Pacific Islands.
On 31 March 2014, Westpac entered into a five year contract with Optus Network Pty Ltd for the provision of telecommunication services in Australia and Westpac offices internationally.
On 25 February 2014, the agreement between Westpac and IBM Australia Limited for the provision of business process outsourcing services was novated to Concentrix Services Pty Ltd following the sale of IBM’s customer care business (including business process outsourcing) to the Synnex Group.
On 1 January 2014, Westpac entered into a two year master service agreement with Unisys Mortgage Processing (No.1) Pty Ltd (UMP). Pursuant to this agreement UMP provides a range of credit and deposit services and sub-contract services, including administrative services and technology, to RAMS.
On 1 July 2013, Westpac renewed its agreement with Microsoft Australia Pty Limited for a further three years, to June 2016. The renewed agreement relates to the provision of software licences, software support and consulting services to all brands and divisions of Westpac in Australia and internationally, including the Pacific Islands, New Zealand, Asia and Europe.
On 30 June 2013, Westpac and IBM Australia Limited executed an Enterprise Licensing Agreement for five years. This agreement renews current IBM software licences held by Westpac and provides the flexibility for Westpac to substitute existing licences for alternative products of the same value.
2014 Westpac Group Annual Report 265

Note 35. Expenditure commitments (continued) On 30 July 2012, Westpac entered into a five year agreement with Linfox Armaguard Pty Limited for the provision of cash-in-transit services.
On 30 June 2012, Westpac entered into a 4.5 year agreement with Toll Transport Pty Ltd for the provision of freight and courier services.
On 25 June 2012, Westpac commenced a five year agreement with InfoSys Technologies Limited to provide maintenance and development support within the testing and corporate systems areas of technology. On 12 November 2012, Westpac commenced an additional five year agreement to provide maintenance and development support within the group customer master and customer assisted services areas of technology.
On 25 June 2012, Westpac commenced a five year agreement with Tata Consultancy Services to provide maintenance and development support within the information systems area of technology. On 12 November 2012, Westpac commenced an additional five year agreement to provide maintenance and development support within the customer self service area of technology.
On 18 May 2011, Westpac entered an agreement with HP Enterprise Services BPA Limited (HP) to amend and extend its loan processing service agreement for a further four years, with the option of extending for a further year. On 20 December 2012, the agreement was novated from HP Enterprise Services BPA Limited to HP Australia Pty Limited.
On 19 November 2010, Westpac entered into an agreement with IBM Australia Limited which relates to the core banking technology operations in Australia and has an initial term of five years.
Westpac entered into an agreement with Fujitsu Australia Limited to lease a purpose-built data centre from 21 September 2010 for 15 years with three further five year options and a services agreement for 15 years with two further five year options.
On 28 June 2010, Westpac extended its agreement with FD Australia Limited for cards processing until 2019. This involves managing the application within the Westpac/IBM environment. Westpac retains control of its cards sales, credit, collections and customer service functions.
On 3 November 2006, Westpac entered into a master relationship agreement with Genpact U.S. LLC (subsequently novated to Genpact International Inc) for the provision of back office administrative support services. On 2 May 2013, Westpac extended the term of the Genpact master relationship agreement by five years to May 2018.
On 4 February 2005, Westpac, in conjunction with the National Australia Bank and the Commonwealth Bank of Australia, entered into a 12 year agreement with Fiserv Solutions of Australia Pty Limited for the provision of voucher (cheque) processing services.
Commitments in relation to long-term contracts are included in other expenditure commitments above.
Note 36. Superannuation commitments Westpac had the following defined benefit plans at 30 September 2014:
Name of Plan Type Form of Benefit
Date of Last Actuarial Assessment of the
Funding Status
Westpac Group Plan (WGP) Defined benefit and accumulation
Indexed pension and lump sum
30 June 2012
Westpac New Zealand Superannuation Scheme (WNZS)
Defined benefit and accumulation
Indexed pension and lump sum
30 June 2014
Westpac Banking Corporation UK Staff Superannuation Scheme (UKSS)
Defined benefit Indexed pension and lump sum
5 April 2012
Westpac UK Medical Benefits Scheme Defined benefit Medical benefits Not applicable
All of the defined benefit sections of the schemes are closed to new members.
WGP is the Group’s principal defined benefit plan. The WGP is an employer sub-plan within BT Super for Life, which is itself a plan within retirement Wrap. The Trustee of WGP is BT Funds Management Limited.
Members of the WGP are either Accumulation Members or Defined Benefit Members depending on the nature of their entitlements. Defined Benefit Members include pensioners. The defined benefit liabilities are primarily influenced by member contribution rates, salary growth and length of membership in case of active members, and price inflation in the case of pensioners.
The WGP is managed and administered in accordance with the terms of its trust deed and relevant legislation in Australia.
266 2014 Westpac Group Annual Report
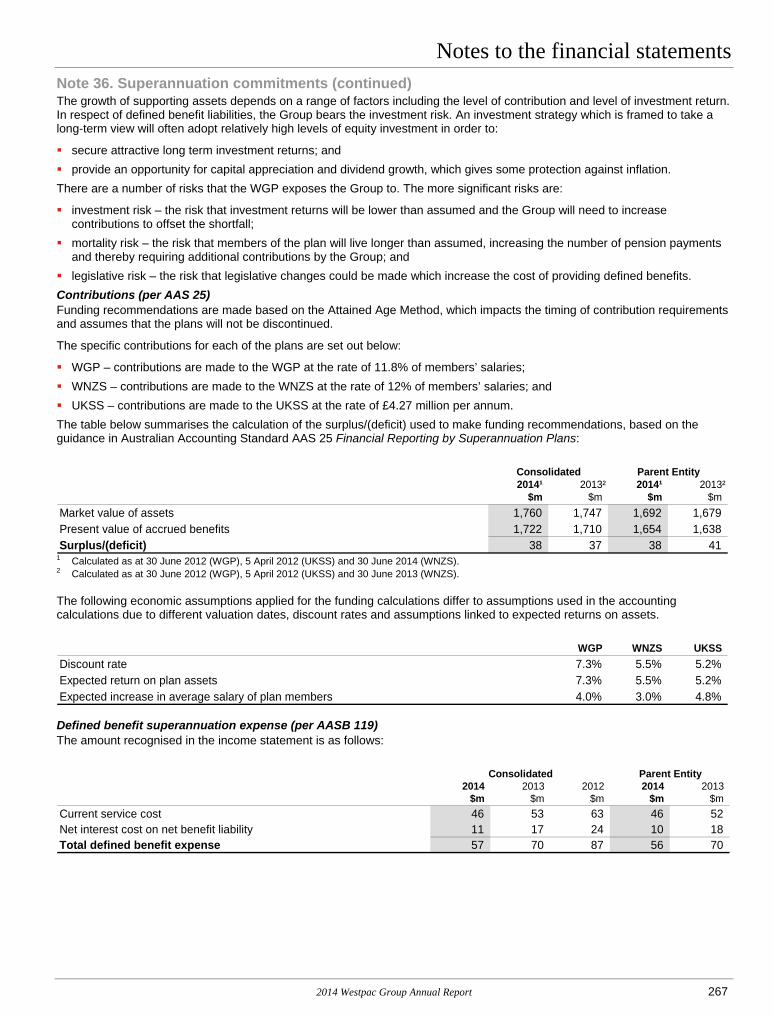
Notes to the financial statements Note 36. Superannuation commitments (continued) The growth of supporting assets depends on a range of factors including the level of contribution and level of investment return. In respect of defined benefit liabilities, the Group bears the investment risk. An investment strategy which is framed to take a long-term view will often adopt relatively high levels of equity investment in order to:
secure attractive long term investment returns; and provide an opportunity for capital appreciation and dividend growth, which gives some protection against inflation. There are a number of risks that the WGP exposes the Group to. The more significant risks are:
investment risk – the risk that investment returns will be lower than assumed and the Group will need to increase contributions to offset the shortfall;
mortality risk – the risk that members of the plan will live longer than assumed, increasing the number of pension payments and thereby requiring additional contributions by the Group; and
legislative risk – the risk that legislative changes could be made which increase the cost of providing defined benefits. Contributions (per AAS 25) Funding recommendations are made based on the Attained Age Method, which impacts the timing of contribution requirements and assumes that the plans will not be discontinued.
The specific contributions for each of the plans are set out below:
WGP – contributions are made to the WGP at the rate of 11.8% of members’ salaries; WNZS – contributions are made to the WNZS at the rate of 12% of members’ salaries; and UKSS – contributions are made to the UKSS at the rate of £4.27 million per annum. The table below summarises the calculation of the surplus/(deficit) used to make funding recommendations, based on the guidance in Australian Accounting Standard AAS 25 Financial Reporting by Superannuation Plans:
Consolidated Parent Entity2014¹ 2013² 2014¹ 2013²
$m $m $m $mMarket value of assets 1,760 1,747 1,692 1,679 Present value of accrued benefits 1,722 1,710 1,654 1,638 Surplus/(deficit) 38 37 38 41
1 Calculated as at 30 June 2012 (WGP), 5 April 2012 (UKSS) and 30 June 2014 (WNZS). 2 Calculated as at 30 June 2012 (WGP), 5 April 2012 (UKSS) and 30 June 2013 (WNZS).
The following economic assumptions applied for the funding calculations differ to assumptions used in the accounting calculations due to different valuation dates, discount rates and assumptions linked to expected returns on assets.
WGP WNZS UKSSDiscount rate 7.3% 5.5% 5.2%Expected return on plan assets 7.3% 5.5% 5.2%Expected increase in average salary of plan members 4.0% 3.0% 4.8%
Defined benefit superannuation expense (per AASB 119) The amount recognised in the income statement is as follows:
Consolidated Parent Entity2014 2013 2012 2014 2013
$m $m $m $m $mCurrent service cost 46 53 63 46 52 Net interest cost on net benefit liability 11 17 24 10 18 Total defined benefit expense 57 70 87 56 70
2014 Westpac Group Annual Report 267

Note 36. Superannuation commitments (continued) Change in benefit obligation (per AASB 119) The change in the present value of the defined benefit obligation is as follows:
Consolidated Parent Entity2014 2013 2014 2013
$m $m $m $mBenefit obligation at beginning of the period 2,216 2,293 2,134 2,205 Service cost 46 53 46 52 Interest cost 97 86 94 84 Member contributions 14 15 14 14 Actuarial losses/(gains) from changes in demographic assumptions - (1) - 1 Actuarial losses/(gains) from changes in financial assumptions 148 (129) 145 (118) Actuarial losses/(gains) from changes in experience 27 27 28 29 Benefits paid (158) (164) (149) (156) Exchange and other items 18 36 20 23 Benefit obligation at end of the period 2,408 2,216 2,332 2,134
Change in plan assets (per AASB 119) The change in the fair value of plan assets is as follows:
Consolidated Parent Entity2014 2013 2014 2013
$m $m $m $mFair value of plan assets at beginning of the period 1,971 1,736 1,901 1,677 Interest income 86 69 84 66 Return on plan assets excluding interest income 115 235 112 230 Employer contributions 49 53 48 49 Member contributions 14 15 14 14 Benefits paid (158) (164) (149) (156) Exchange and other items 16 27 16 21 Fair value of plan assets at end of the period 2,093 1,971 2,026 1,901
Net surplus/(obligation) (315) (245) (306) (233)
The asset ceiling has no impact on the net defined benefit surplus/(obligation).
Assumptions used in the AASB 119 accounting calculations
Consolidated and Parent Entity2014
Australian Overseas Australian OverseasFunds Funds Funds Funds
Discount rate 4.0% 4.2–4.6% 4.6% 3.4–4.4%Expected increase in average salary of plan members 3.4% 3.0–5.1% 3.5% 3.0–5.1%Rate of increase for pensions 2.4% 2.3–3.6% 2.5% 2.5–3.4%
2013
The sensitivity of the Group’s defined benefit obligation to the significant financial assumptions as at 30 September 2014 is shown in the table below. In the table, a negative percentage change represents a reduction in the defined benefit obligation.
Change in assumption0.5% (0.5%)
Change in obligationDiscount rate (6.3%) 7.1%Expected increase in average salary of plan members 1.4% (1.3%)Rate of increase for pensions 5.6% (5.1%)
268 2014 Westpac Group Annual Report

Notes to the financial statements Note 36. Superannuation commitments (continued) In addition to the financial assumptions presented above, the mortality assumptions for our principal fund the WGP for 2014 are that a 60-year-old male pensioner is assumed to have a remaining life expectancy of 30.7 and a 60-year-old female pensioner is assumed to have a remaining life expectancy of 33.8. These assumptions are age related and allowances are made for future mortality improvements.
Asset allocation Asset allocation at 30 September was:
Consolidated and Parent Entity
Australian Overseas Australian OverseasFunds Funds Funds Funds
Cash 2% 4% 5% -Equity instruments 51% 47% 50% 52%Debt instruments 21% 39% 20% 44%Property 8% 8% 7% 4%Other assets1 18% 2% 18% -
100% 100% 100% 100%
2014 2013
1 Other assets comprise alternative asset classes including investments in infrastructure funds and private equity funds.
Investments held in Westpac and related entities
Consolidated Parent Entity2014 2013 2014 2013
$m $m $m $mValue of plan assets invested in debt and equity securities of Westpac 11 9 - - Value of plan assets invested in related parties of Westpac 1 7 1 7 Total 12 16 1 7
Post-retirement health care The effect of a one percentage point change in assumed health care trend rates, assuming all other assumptions remain constant, would not be material on either the current service costs or the accumulated benefit obligation of the Westpac UK Medical Benefits Scheme at 30 September 2014.
Note 37. Contingent liabilities, contingent assets and credit commitments The Group is a party to financial instruments with off-balance sheet credit risk in the normal course of business to meet the financing needs of its customers and in managing its own risk profile. These financial instruments include commitments to extend credit, bill endorsements, financial guarantees, standby letters of credit and underwriting facilities.
The Group’s exposure to credit loss in the event of non-performance by the other party is represented by the contract or notional amount of those financial instruments. However, some commitments to extend credit and provide underwriting facilities can be cancelled or revoked at any time at the Group’s option.
The Group uses the same credit policies in making commitments and conditional obligations as it does for on-balance sheet instruments.
The Group takes collateral where it is considered necessary to support both on- and off-balance sheet financial instruments with credit risk. The Group evaluates each customer’s credit worthiness on a case-by-case basis. The amount of collateral taken, if deemed necessary, on the provision of a financial facility is based on management’s evaluation of the credit risk of the counterparty.
2014 Westpac Group Annual Report 269

Note 37. Contingent liabilities, contingent assets and credit commitments (continued) Off-balance sheet credit risk-related financial instruments excluding derivatives at 30 September are as follows:
Consolidated Parent Entity2014 2013 2014 2013
$m $m $m $mCredit risk-related instrumentsStandby letters of credit and financial guarantees1 4,092 4,334 4,005 4,252 Trade letters of credit2 2,961 3,218 2,914 3,172 Non-financial guarantees3 9,205 9,054 8,699 8,317 Commitments to extend credit4 159,131 148,368 140,909 132,271 Other commitments5 763 44 763 44 Total credit risk-related instruments 176,152 165,018 157,290 148,056
Contract or Notional Amount
1 Standby letters of credit are undertakings to pay, against presentation documents, an obligation in the event of a default by a customer. Guarantees
are unconditional undertakings given to support the obligations of a customer to third parties. The Group may hold cash as collateral for certain guarantees issued.
2 Trade letters of credit are undertakings by the Group to pay or accept drafts drawn by an overseas supplier of goods against presentation of documents in the event of default by a customer.
3 Non-financial guarantees include undertakings that oblige the Group to pay third parties should a customer fail to fulfil a contractual non-monetary obligation.
4 Commitments to extend credit include all obligations on the part of the Group to provide credit facilities. As facilities may expire without being drawn upon, the notional amounts do not necessarily reflect future cash requirements. In addition to the commercial commitments disclosed above at 30 September 2014, the Group offered $8.0 billion (2013: $12.4 billion) of facilities to customers, which had not yet been accepted.
5 Other commitments include underwriting facilities.
Up to Over 1 Over 3 Over1 Year to 3 Years to 5 Years 5 Years Total
$m $m $m $m $mStandby letters of credit and financial guarantees 1,645 1,517 209 721 4,092 Trade letters of credit 2,783 178 - - 2,961 Non-financial guarantees 5,221 1,718 357 1,909 9,205 Commitments to extend credit 60,719 33,309 17,003 48,100 159,131 Other commitments 513 134 - 116 763 Total commercial commitments 70,881 36,856 17,569 50,846 176,152
Consolidated 2014
Contingent assets The credit commitments shown in the table above also constitute assets. These commitments would be classified as loans and other assets in the balance sheet on the contingent event occurring.
270 2014 Westpac Group Annual Report

Notes to the financial statements Note 37. Contingent liabilities, contingent assets and credit commitments (continued) Additional liabilities and commitments Legislative liabilities The Group had the following assessed liabilities as at 30 September 2014:
$19 million (2013: $24 million) based on an actuarial assessment as a self-insurer under the Workers’ Compensation Act 1987 and the Workplace Injury Management and Workers’ Compensation Act 1998 (New South Wales);
$13 million (2013: $11 million) based on actuarial assessment as a self-insurer under the Accident Compensation Act 1985 (Victoria);
$7 million (2013: $6 million) based on actuarial assessment as a self-insurer under the Workers’ Rehabilitation and Compensation Act 1986 (South Australia);
$2 million (2013: $2 million) based on an actuarial assessment as a self-insurer under the Workers’ Compensation and Rehabilitation Act 2003 (Queensland); and
$2 million (2013: $1 million) based on an actuarial assessment as a self-insurer under the Workers’ Compensation Act 1951 (Australian Capital Territory).
$1 million (2013: nil) based on an actuarial assessment as a self-insurer under the Workers’ Compensation and Injury Management Act 1981 (Western Australia).
$1 million (2013: nil) based on an actuarial assessment as a self-insurer under the Workers’ Rehabilitation and Compensation Act 1988 (Tasmania).
Adequate provision has been made for these liabilities in the provision for annual leave and other employee benefits (refer to Note 20).
Litigation Contingent liabilities exist in respect of actual and potential claims and proceedings. An assessment of the Group’s likely loss has been made on a case-by-case basis for the purpose of the financial statements and specific provisions have been made where appropriate.
Westpac has been served with three class action proceedings brought on behalf of customers seeking to recover exception fees paid by those customers. The first set of proceedings was commenced in December 2011 by certain named customers of the Westpac brand; the second was commenced in February 2012 by certain named customers of the St.George Bank and BankSA brands; the third was commenced in August 2014 on behalf of all other customers of the Westpac Banking Group. Similar class actions have been commenced against several other Australian banks. Westpac has agreed with the plaintiffs to put the proceedings against Westpac on hold until at least December 2014, pending further developments in the litigation against one of those other banks.
Westpac has been served with a class action proceeding brought on behalf of Westpac customers who borrowed money to invest in Storm Financial-badged investments. Westpac intends to defend these proceedings. As the two named applicants have not quantified the damages that they seek, and given the preliminary nature of these proceedings, it is not possible to estimate any potential liability at this stage.
Liquidity support Westpac is a participant to the Interbank Deposit Agreement along with three other Australian banks. In accordance with the Interbank Deposit Agreement, a deposit notice may be served upon the other participants by a bank which is experiencing liquidity problems. The other participants are then required to deposit equal amounts of up to $2 billion each for a period of 30 days. At the end of 30 days the deposit holder has the option to repay the deposit in cash or by way of assignment of mortgages to the value of the deposit.
Financial Claims Scheme Under the Financial Claims Scheme (FCS) the Australian Government provides depositors a free guarantee of deposits in eligible ADIs up to and including $250,000. The FCS applies to an eligible ADI if APRA has applied for the winding up of the ADI and the responsible Australian Government minister has declared that the FCS applies to the ADI.
The Financial Claims Scheme (ADIs) Levy Act 2008 provides for the imposition of a levy to fund the excess of certain APRA FCS costs connected to an ADI. The levy would be imposed on liabilities of eligible ADIs to their depositors and cannot be more than 0.5% of the amount of those liabilities.
Service agreements The maximum contingent liability for termination benefits in respect of service agreements with the CEO and other Group Key Management Personnel at 30 September 2014 was $16 million (2013: $14.2 million).
2014 Westpac Group Annual Report 271

Note 37. Contingent liabilities, contingent assets and credit commitments (continued) Contingent tax risk The ATO is reviewing the taxation treatment of certain transactions undertaken by the Group in the course of normal business activities.
Risk reviews and audits are also being undertaken by revenue authorities in other jurisdictions, as part of normal revenue authority activity in those countries.
The Group has assessed these and other taxation claims arising in Australia and elsewhere, including seeking independent advice where appropriate, and considers it holds appropriate provisions.
Assets pledged In addition to assets supporting securitisation and covered bond programs disclosed in Note 32, the Group and Parent Entity have provided collateral to secure liabilities as part of standard terms of transaction with other financial institutions. The carrying value of financial assets pledged as collateral to secure liabilities is:
Consolidated Parent Entity2014 2013 2014 2013
$m $m $m $mCash 3,894 7,091 3,750 6,941 Cash deposit on stock borrowed 28 46 28 46 Securities (including certificates of deposit) 1,638 177 1,638 177 Securities pledged under repurchase agreements 25,978 8,101 25,897 8,101 Total amount pledged to secure liabilities 31,538 15,415 31,313 15,265
Collateral received All collateral received from counterparties to secure liabilities, besides residential mortgages, is received in the form of cash or securities. Cash held as collateral, recognised on the Group’s and Parent Entity’s balance sheets as at 30 September 2014 was $3,888 million (2013: $1,285 million). Securities received as collateral under reverse repurchase agreements as at 30 September 2014 was $6,463 million (2013: $6,882 million).
Parent Entity guarantees and undertakings The following guarantees and undertakings are extended to entities in the Group by the Parent Entity:
issue of letters of comfort in respect of certain subsidiaries in the normal course of business. The letters recognise that Westpac has a responsibility to ensure that those subsidiaries continue to meet their obligations;
guarantees to Westpac Bank Samoa Limited subsidiaries that support loans made to customers in this jurisdiction, to the extent that the loans exceed prescribed limits; and
guarantees to certain wholly owned subsidiaries that are Australian financial services or credit licensees to comply with legislative requirements. Each guarantee provided does not exceed $40 million per annum. The guarantees will only give rise to a liability where the entity concerned becomes legally obliged to pay on account of a claim under the relevant licence. The Parent Entity has a right of indemnity to recover funds payable under the guarantees.
Note 38. Fiduciary activities Certain controlled entities within the Group conduct investment management and other fiduciary activities as responsible entity or manager on behalf of individuals, trusts, retirement benefit plans and other institutions. These activities involve the management of assets in investment schemes and superannuation funds, and the holding or placing of assets on behalf of third parties.
Where controlled entities, as responsible entities, incur liabilities in respect of these activities, a right of indemnity exists against the assets of the applicable investment schemes or funds. As these assets are sufficient to cover liabilities, and it is not probable that the controlled entities will be required to settle them, the liabilities are not included in the consolidated financial statements.
The Group also manages life insurance statutory fund assets that are included in the consolidated financial statements.
272 2014 Westpac Group Annual Report

Notes to the financial statements Note 39. Group entities The consolidated Group as at 30 September 2014 includes the following controlled entities1:
Name Country of Incorporation Name Country of IncorporationWestpac Banking Corporation Australia Hastings Funds Management (USA) Inc. USA1925 Advances Pty Limited Australia Hastings Advisers, LLC USA
General Credits Holdings Pty Limited Australia Hastings Investments GP LLC USAGeneral Credits Pty Limited Australia Hastings Investment Capital, LP USA
G.C.L. Investments Pty Limited Australia Hastings Investment Management Pty Limited AustraliaAustralian Loan Processing Security Company Pty Limited Australia Hastings Korea Company Limited2 Korea
Australian Loan Processing Security Trust Australia Infrastructure Research and Advisory Services Private Limited2 IndiaBill Acceptance Corporation Pty Limited Australia Hickory Trust Australia
Mortgage Management Pty Limited Australia Nationwide Management Pty Limited AustraliaBLE Capital Limited Australia St.George Custodial Pty Limited Australia
BLE Capital Investments Pty Limited Australia North Ryde Office Trust2 AustraliaBLE Development Pty Limited Australia Partnership Pacific Pty Limited Australia
BT Short Term Income Fund Australia Partnership Pacific Securities Pty Limited AustraliaCapital Finance Australia Limited2 Australia Reinventure Fund, I.L.P.2,6 Australia
Bella Trust Australia RMS Warehouse Trust 2007-1 AustraliaBella Trust No. 2 Australia Series 2007-1G WST Trust AustraliaCapital Corporate Finance Limited Australia Series 2008-1M WST Trust AustraliaCapital Finance New Zealand Limited New Zealand Series 2009-1 WST Trust Australia
SIE-LEASE (New Zealand) Pty Limited New Zealand Series 2011-1 WST Trust AustraliaCapital Finance (NZ) Limited Australia Series 2011-2 WST Trust AustraliaCapital Fleetlease Limited Australia Series 2011-3 WST Trust AustraliaCapital Motor Finance Limited Australia Series 2012-1 WST Trust AustraliaCapital Rent Group Limited Australia Series 2013-1 WST Trust AustraliaSIE-LEASE (Australia) Limited Australia Series 2013-2 WST Trust2 Australia
Castlereagh Trust Australia Series 2014-1 WST Trust2 AustraliaCBA Limited Australia Sixty Martin Place (Holdings) Pty Limited Australia
Belliston Pty Limited Australia 1925 (Commercial) Pty Limited AustraliaChallenge Limited Australia 1925 (Industrial) Pty Limited AustraliaCrusade CP Management Pty Limited Australia Halcyon Securities Pty Limited5 AustraliaCrusade CP No.1 Pty Limited8 Australia Packaging Properties 1 Pty Limited AustraliaCrusade CP Trust No. 52 Australia Packaging Properties 2 Pty Limited AustraliaCrusade CP Trust No. 53 Australia Packaging Properties 3 Pty Limited AustraliaCrusade CP Trust No. 55 Australia Pashley Investments Pty Limited AustraliaCrusade CP Trust No. 56 Australia Westpac Investment Vehicle No.3 Pty Limited AustraliaCrusade CP Trust No. 57 Australia Sallmoor Pty Limited AustraliaCrusade CP Trust No. 58 Australia Teuton Pty Limited AustraliaCrusade Management Limited Australia Westpac Administration Pty Limited Australia
Crusade Euro Trust 1 E of 2006 Australia Westpac Asian Lending Pty Limited AustraliaCrusade Euro Trust 1 E of 2007 Australia Westpac Debt Securities Pty Limited AustraliaCrusade Global Trust 2 of 2005 Australia Westpac Direct Equity Investments Pty Limited AustraliaCrusade Global Trust 1 of 2006 Australia Westpac Equipment Finance Limited AustraliaCrusade Global Trust 2 of 2006 Australia Westpac Equipment Finance (No.1) Pty Limited AustraliaCrusade Global Trust 1 of 2007 Australia Westpac Global Capital Markets Pty Limited AustraliaCrusade Trust 1A of 2005 Australia Westpac Group Investments Australia Pty Limited Australia
Crusade Trust No.2P of 2008 Australia Westpac Investment Vehicle Pty Limited AustraliaDanaby Pty Limited Australia Westpac Funds Financing Holdco Pty Limited AustraliaHastings Management Pty Limited6 Australia Westpac Funds Financing Pty Limited Australia
Hastings Funds Management Asia Pte. Limited Singapore Westpac Investment Vehicle No.2 Pty Limited AustraliaHastings Funds Management Limited Australia Westpac Cook Cove Trust I Australia
Hastings Forestry Investments Limited New Zealand Westpac Cook Cove Trust II AustraliaHastings Forests Australia Pty Limited Australia Westpac Pacific Limited Partnership AustraliaHastings Private Equity Fund IIA Pty Limited Australia Westpac Syndications Management Pty Limited Australia
Hastings Funds Management (UK) Limited UK St.George Business Finance Pty Limited AustraliaHastings Investment Management (Europe) Limited2 UK St.George Equity Finance Limited AustraliaCore Infrastructure Income Feeder 1 L.P.2 Scotland St.George Finance Holdings Limited AustraliaCore Infrastructure Income Feeder 2 L.P.2 Scotland St.George Finance Limited AustraliaCore Infrastructure Income Master L.P.2 UK Crusade ABS Series 2012-1 Trust AustraliaEurope Infrastructure Debt LP UK Crusade ABS Series 2013 -1 Trust2 AustraliaHastings Infrastructure 1 Limited UK St.George Motor Finance Limited6 AustraliaHastings Infrastructure 2 Limited UK St.George Procurement Management Pty Limited AustraliaInfrastructure GP LLP UK St.George Security Holdings Pty Limited AustraliaInfrastructure GP2 LLP2 UK Tavarua Funding Trust IV USA
2014 Westpac Group Annual Report 273

Note 39. Group entities (continued)
Name Country of Incorporation Name Country of IncorporationThe Mortgage Company Pty Limited Australia BT Long Term Income Fund AustraliaValue Nominees Pty Limited Australia Westpac Equity Pty Limited AustraliaWaratah Securities Australia Limited8 Australia Westpac Lenders Mortgage Insurance Limited3 Australia
Sydney Capital Corporation Inc8 USA Westpac Life Insurance Services Limited AustraliaWaratah Receivables Corporation Pty Limited8 Australia Westpac RE Limited Australia
Westpac Administration 2 Limited2,5 Australia Westpac Securities Administration Limited AustraliaWestpac Administration 3 Limited5 Australia Westpac Financial Services Group-NZ-Limited3 New ZealandWestpac Administration 4 Pty Limited5 Australia Westpac Life-NZ-Limited New Zealand
Westpac Altitude Rewards Trust Australia Westpac Nominees-NZ-Limited New ZealandWestpac Bank of Tonga Tonga HLT Custodian Trust New ZealandWestpac Bank Samoa Limited6 Samoa MIF Custodian Trust New ZealandWestpac Bank-PNG-Limited6 Papua New Guinea Westpac Superannuation Nominees-NZ-Limited New ZealandWestpac Capital Holdings Inc. USA Westpac Securities Limited Australia
Westpac Capital Trust IV USA Net Nominees Limited AustraliaWestpac Covered Bond Trust Australia Westpac Securitisation Management Pty Limited AustraliaWestpac Delta LLC USA Westpac Europe Limited UKWestpac Equity Holdings Pty Limited Australia Westpac Financial Holdings Pty Limited Australia
Altitude Administration Pty Limited Australia BT Securities Limited AustraliaAltitude Rewards Pty Limited Australia BT (Queensland) Pty Limited AustraliaBT Financial Group (NZ) Limited3 New Zealand Westpac Funding Holdings Pty Limited Australia
BT Funds Management (NZ) Limited New Zealand Westpac Investments U.K. Limited UKHastings Group Pty Limited Australia Westpac Leasing Nominees-Vic.-Pty Limited AustraliaQvalent Pty Limited Australia Westpac Overseas Holdings No. 2 Pty Limited AustraliaRAMS Financial Group Pty Limited Australia Westpac New Zealand Group Limited New ZealandWestpac Financial Consultants Limited Australia Westpac New Zealand Limited New ZealandWestpac Financial Services Group Limited Australia Westpac Cash PIE Fund8 New Zealand
Advance Asset Management Limited Australia Westpac NZ Operations Limited New ZealandAscalon Capital Managers Limited3 Australia Aotearoa Financial Services Limited New Zealand
Ascalon Capital Managers (Asia) Limited Hong Kong Number 120 Limited New ZealandCanning Park Capital Pte Ltd Singapore The Home Mortgage Company Limited New Zealand
Ascalon Funds Seed Pool Trust3 Australia The Warehouse Financial Services Limited6 New ZealandAsgard Wealth Solutions Limited3 Australia Westpac (NZ) Investments Limited New Zealand
Asgard Capital Management Limited Australia Westpac NZ Securitisation Holdings Limited6 New ZealandHitton Pty Limited Australia Westpac NZ Securitisation Limited New ZealandeQR Securities Pty Limited Australia Westpac NZ Securitisation No.2 Limited New ZealandSecuritor Financial Group Limited Australia Westpac NZ Covered Bond Holdings Limited6 New Zealand
BT Financial Group Pty Limited Australia Westpac NZ Covered Bond Limited New ZealandBT Australia Pty Limited Australia Westpac Securities NZ Limited New Zealand
BT Funds Management Limited3 Australia Westpac Term PIE Fund8 New ZealandOniston Pty Limited Australia Westpac Overseas Holdings Pty Limited Australia
BT Funds Management No.2 Limited Australia A.G.C. (Pacific) Limited Papua New GuineaBT Investment Management Limited6 Australia Westpac Americas Inc. USA
BT Investment Management (Fund Services) Limited Australia Westpac Investment Capital Corporation USABT Investment Management (Institutional) Limited Australia Westpac USA Inc. USABTIM UK Limited UK Westpac Capital Markets Holding Corp USA
J O Hambro Capital Management Holdings Limited UK Westpac Capital Markets LLC USAJ O Hambro Capital Management Limited UK Westpac Finance (HK) Limited Hong Kong
JOHCM (Singapore) Pty Limited Singapore Westpac Group Investment-NZ-Limited New ZealandJOHCM (USA) Inc USA Westpac Holdings-NZ-Limited New Zealand
BT Portfolio Services Limited3 Australia Westpac Capital-NZ-Limited New ZealandBT Private Nominees Pty Limited Australia Westpac Equity Investments NZ Limited New ZealandMagnitude Group Pty Limited3 Australia Westpac Singapore Limited SingaporeSeed Pool Trust No 23 Australia Westpac Properties Limited AustraliaSt.George Life Limited3 Australia Westpac Securitisation Holdings Pty Limited AustraliaWestpac Custodian Nominees Pty Limited5 Australia Westpac Structured Products Limited AustraliaWestpac Financial Services Limited Australia Westpac TPS Trust AustraliaWestpac General Insurance Limited3 Australia Westpac Unit Trust AustraliaWestpac General Insurance Services Limited3 Australia
274 2014 Westpac Group Annual Report

Notes to the financial statements Note 39. Group entities (continued) Notes 1 Controlled entities shown in bold type are owned directly by Westpac Banking Corporation. Overseas companies predominantly carry on business in
the country of incorporation. For unincorporated entities, ‘Country of Incorporation’ refers to the country where business is carried on. The financial years of all controlled entities are the same as that of Westpac unless otherwise stated. From time to time, the Group consolidates a number of unit trusts where the group is exposed to, or has rights to, variable returns from its involvement with the trusts, and has the ability to affect those returns through its power over the trusts.
2 The following controlled entities were acquired, created, or incorporated during the financial year: Capital Finance Australia Limited and its controlled entities Acquired 31 December 2013 Core Infrastructure Income Feeder 1 L.P. Created 12 December 2013 Core Infrastructure Income Feeder 2 L.P. Created 12 December 2013 Core Infrastructure Income Master L.P. Created 16 December 2013 Crusade ABS Series 2013-1 Trust Created 12 December 2013 Hastings Korea Company Limited Incorporated 23 December 2013 Hastings Investment Management (Europe) Limited Incorporated 18 July 2014 Infrastructure GP2 LLP Created 10 December 2013 Infrastructure Research and Advisory Services Private Limited Incorporated 7 July 2014 North Ryde Office Trust Acquired 28 February 2014 Reinventure Fund, I.L.P. Created 15 January 2014 Series 2013-2 WST Trust Created 1 October 2013 Series 2014-1 WST Trust Created 2 June 2014 Westpac Administration 2 Limited and its controlled entities Acquired 31 December 2013
3 The following controlled entities changed their ownership during the financial year: Ascalon Capital Managers Limited 31 October 2013 Ascalon Funds Seed Pool Trust 31 October 2013 Asgard Wealth Solutions Limited 31 October 2013 BT Financial Group (NZ) Limited 31 October 2013 BT Funds Management Limited 31 October 2013 BT Portfolio Services Limited 31 October 2013 Magnitude Group Pty Limited 31 October 2013 Seed Pool Trust No. 2 31 October 2013 St.George Life Limited 31 October 2013 Westpac Financial Services Group-NZ-Limited 31 October 2013 Westpac General Insurance Limited 31 October 2013 Westpac General Insurance Services Limited 31 October 2013 Westpac Lenders Mortgage Insurance Limited 31 October 2013
4 The following controlled entities were deregistered, terminated or amalgamated during the financial year: BLE Holdings Pty Limited Deregistered 4 September 2014 BT Life Limited Deregistered 2 October 2013 Codrington S.a.r.l. Deregistered 16 August 2014 Crusade CP Trust No. 41 Terminated 17 September 2014 Crusade CP Trust No. 44 Terminated 17 September 2014 Crusade CP Trust No. 48 Terminated 17 September 2014 Crusade CP Trust No. 49 Terminated 17 September 2014 Crusade CP Trust No. 50 Terminated 17 September 2014 Crusade CP Trust No. 54 Terminated 17 September 2014 Crusade CP Trust No. 60 Terminated 17 September 2014 Crusade Global Trust No. 1 of 2005 Terminated 26 June 2014 Crusade Global Trust No. 2 of 2004 Terminated 3 April 2014 JOHCM (USA) General Partner Inc Terminated 1 December 2013 Southern Cross Inc Deregistered 3 January 2014 Tavarua Funding Trust III Terminated 24 April 2014 W1 Investments Pty Limited Deregistered 25 September 2014 Westpac Capital Trust III Terminated 24 April 2014 Westpac NZ Leasing Limited Amalgamated 15 September 2014
5 The following controlled entities changed their name during the financial year: BOS International (Australia) Limited to Westpac Administration 2 Limited 16 May 2014 BOS International (Securites) Pty Limited to Westpac Administration 4 Pty Limited 16 May 2014 BOSI Security Services Limited to Westpac Administration 3 Limited 16 May 2014 Halcyon Securities Limited to Halcyon Securities Pty Limited 8 August 2014 Westpac Custodian Nominees Limited to Westpac Custodian Nominees Pty Limited 8 August 2014
2014 Westpac Group Annual Report 275

Note 39. Group entities (continued) 6 The following controlled entities are not wholly owned:
Percentage Owned
2014 2013BT Investment Management Limited 60.8% 62.1%Hastings Management Pty Limited 97.2% 100.0%Reinventure Fund, I.L.P. 99.0% n/aSt.George Motor Finance Limited 75.0% 75.0%The Warehouse Financial Services Limited 51.0% 51.0%Westpac Bank-PNG-Limited 89.9% 89.9%Westpac Bank Samoa Limited 93.5% 93.5%Westpac NZ Covered Bond Holdings Limited7 19.0% 19.0%Westpac NZ Securitisation Holdings Limited7 19.0% 19.0%
7 9.5% of the equity in both Westpac NZ Securitisation Holdings Limited (WNZSHL) and Westpac NZ Covered Bond Holdings Limited (WNZCBHL) is
held directly by Westpac Holdings–NZ–Limited and another 9.5% is held directly by Westpac NZ Operations Limited. Although WBC and its controlled entities only own a total of 19%, due to contractual and structural arrangements, each of WNZSHL and WNZCBHL is considered to be a controlled entity within WBC.
8 The Group has funding agreements in place with these entities and is deemed to have exposure to the associated risks and rewards. These entities are consolidated where the Group is exposed to, or has rights to, variable returns from its involvement with the entity and has the ability to affect those returns through its power over the entity.
9 The following unit trusts, which are investment vehicles of Westpac Life Insurance Services Limited, are consolidated by the Group and not wholly owned where stated:
Percentage Owned2014 2013
1940's Lifestage Fund - B 100.0% n/a1950's Lifestage Fund - B 100.0% n/a1960's Lifestage Fund - B 100.0% n/a1970's Lifestage Fund - B 100.0% n/a1980's Lifestage Fund - B 100.0% n/a1990's Lifestage Fund - B 100.0% n/a2000's Lifestage Fund - B 100.0% n/aBT Defensive Equity Income Fund 87.9% 92.9%BT Enhanced Fixed Interest Sector Trust 91.0% 92.0%BT Global Emerging Markets Opportunities Fund-Institutional 50.9% n/aBT Institutional Enhanced Australian Shares Fund 97.8% 97.9%BT Institutional Enhanced Cash Fund 75.0% n/aBT Institutional Enhanced Global Fixed Interest Fund 46.9% 34.5%BT Institutional Enhanced Property Securities Fund 61.3% 67.5%BT Institutional Global Share Fund 98.0% 97.7%BT Institutional Liquidity Management Trust n/a 47.8%BT Institutional Managed Cash Fund n/a 75.6%BT Medium Term Income Fund 100.0% n/aBT Stable Cash Plus Fund 56.1% n/aBT Total Return Fund 56.9% 48.4%BT Wholesale Active Balanced Fund 75.5% 75.7%BT Wholesale Cash Plus Fund 52.0% n/aWestpac International Share Index Trust 57.0% n/a
276 2014 Westpac Group Annual Report

Notes to the financial statements Note 40. Other group investments The Group had a significant non-controlling shareholding in the following entities as at 30 September 2014:
Country Where BeneficialBusiness is InterestCarried On % Nature of Business
Above The Index Asset Management Pty Limited Australia 33.3 Funds managementAlleron Investment Management Limited Australia 39.7 Funds managementAngusknight Pty Limited Australia 50.0 Employment and trainingAthos Capital Limited Hong Kong 35.0 Funds managementBoyd Cook Cove Unit Trust Australia 50.0 Investment fundCardlink Services Limited Australia 25.0 Card clearing systemCards NZ Limited New Zealand 18.8 Credit card providerCash Services Australia Pty Limited Australia 25.0 Cash logisticsCook Cove Investment Pty Limited Australia 50.0 Investment companyCook Cove Investment Trust Australia 50.0 Investment fundCook Cove Pty Limited and its controlled entities Australia 50.0 Investment companyEpicfrog Pty Ltd Australia 40.0 TechnologyExact Mining Group Pty Limited Australia 25.5 Services to miningMorphic Asset Management Pty Limited Australia 35.0 Funds managementPaymark Limited New Zealand 25.0 Electronic payments processingPayments NZ Limited New Zealand 23.0 Electronic payments processingRegal Funds Management Asia Limited Singapore 30.0 Funds managementRegal Funds Management Pty Limited Australia 30.0 Funds managementRV Capital Pte Limited Singapore 30.0 Funds managementSocietyOne Holdings Pty Ltd Australia 16.7 Technology platformSydney Harbour Bridge Holdings Pty Limited Australia 49.0 Intellectual propertyVipro Pty Limited Australia 33.3 Voucher processingWestpac Employee Assistance Foundation Pty Limited Australia 50.0 Corporate trusteeWestpac Essential Services Trust I and II and their controlled and non-controlled entities Australia 36.8 Asset management
The total carrying amount of the Group’s significant non-controlling shareholding was $158 million (2013: $191 million).
In terms of the contribution to the results of the Group, the above investments are not material either individually or in aggregate.
2014 Westpac Group Annual Report 277

Note 41. Structured entities A structured entity is one which has been designed such that voting or similar rights are not the dominant factor in determining who controls the entity (for example, when voting rights relate to administrative tasks only and the relevant activities are directed by means of contractual arrangements). Structured entities are generally created to achieve a specific and well defined objective with restrictions over their ongoing activities. Where structured entities are used to facilitate the purchase of specific assets, they are commonly financed by issuing debt or equity securities that are collateralised by and/or indexed to those underlying assets. The debt and equity securities issued by structured entities may include tranches with varying levels of subordination.
The Group engages in various transactions with both consolidated and unconsolidated structured entities that are mainly involved in securitisations, asset-backed and other financing structures and managed investment funds.
Structured entities are assessed for consolidation in accordance with the accounting policy set out in Note 1(h)(vii).
Consolidated structured entities Securitisation and asset-backed conduit vehicles The Group uses structured entities as conduits for the purposes of providing its customers with access to funding from commercial paper markets and to undertake securitisation of its own pool of financial assets. For further details, refer to Note 32.
Covered bonds The Group has two covered bond programs whereby selected pools of residential mortgages it originates are assigned to bankruptcy remote structured entities. For further details, refer to Note 32.
Group managed funds The Group has established a number of investment management funds for which it acts as the responsible entity and/or fund manager. The Group consolidates those funds where it is deemed to be acting as a principal rather than agent in its role of investment manager. The principal vs. agent decision requires judgment to be exercised in concluding whether the Group has sufficient exposure to variable returns.
Unconsolidated structured entities The Group enters into transactions with unconsolidated structured entities in the normal course of business to facilitate customer transactions, for liquidity management purposes and for specific investment opportunities.
Its interests in structured entities comprise any form of contractual or non-contractual involvement which creates variability in returns arising from the performance of the entity for the Group. These include holdings of debt or equity instruments, guarantees, liquidity and other credit support arrangements, loan commitments, derivatives that transfer financial risks from the entity to the Group and investment management agreements.
Interests do not include plain vanilla derivatives (e.g. interest rate swaps and currency swaps), instruments that are deemed to create rather than absorb variability in the unconsolidated structured entity (e.g. purchase of credit protection under a credit default swap), and lending arrangements to a structured entity where recourse on default is to a wider operating entity rather than secured only on the underlying assets of the entity.
The main types of interests held by the Group in unconsolidated structured entities generally comprise the following:
trading securities: the Group buys and sells interests in structured entities as part of its normal trading activities and includes mortgage or other asset-backed securities. These securities are typically held as part of a larger trading portfolio and the Group would normally have no other involvement with the structured entity. The Group derives interest income on these securities, and also recognises realised and unrealised gains or losses arising from a change in fair value through trading income;
available-for-sale securities: the Group holds mortgage-backed securities as part of its liquidity portfolio which provides a buffer against unforseen funding requirements. These assets are highly rated investment grade paper and are 100% eligible for repurchase agreements with the Reserve Bank of Australia or another central bank. As with its securities held in trading portfolios, the Group would normally have no other involvement with the issuing structured entity. The Group recognises interest income on these securities and net gains or losses arising from the sale of these assets (recorded as part of non-interest income);
278 2014 Westpac Group Annual Report

Notes to the financial statements Note 41. Structured entities (continued) loans and other credit commitments: the Group provides lending facilities to unconsolidated structured entities in the normal
course of its lending business to earn income in the form of interest and lending fees. The structured entities mainly comprise property trusts, and those associated with project and property financing transactions where the primary source of debt service, security and repayment is derived from the underlying assets of the entity. Other structured entities include those unconsolidated securitisation trusts established as part of the Group’s customer securitisation program. All loans and credit commitments are subject to the Group’s credit approval process with collateral specific to the circumstances of each loan; and
investment management agreements: as part of its normal funds management activities, the Group establishes and manages a number of funds that provide customers with investment opportunities. The Group also manages superannuation funds established for its employees. As the fund manager, the Group is entitled to receive on-going management and performance fee income based on the value of the assets under management. The Group may also retain units in these funds, which are primarily held by its consolidated life insurance entities. The Group derives fund distribution income from these holdings and recognises fair value movements (through non-interest income) where the instruments are held at fair value through the income statement.
The table below shows the Group’s interests in unconsolidated structured entities and its maximum exposure to loss in relation to those interests. The maximum exposure to loss represents the maximum loss that the Group could incur as a result of its involvement in the structured entities regardless of the probability of the loss being incurred. The amount does not take into account the effects of any collateral or hedges undertaken to reduce the risk of loss. In this respect:
for debt and equity instruments in and loans to unconsolidated structured entities, the maximum exposure to loss is the carrying value of these interests at reporting date; and
for off-balance sheet instruments including liquidity facilities, loan and other credit commitments and guarantees, the maximum exposure to loss is reflected by the notional amounts.
Consolidated 2014Investment in
Third Party Mortgage and
Other Asset-Backed
Securities1
Financing to Securitisation
Vehicles
Group Managed
Funds2
Interests in Other
Structured Entities Total
$m $m $m $m $mAssetsReceivables due from other financial institutions - 1,417 - - 1,417 Trading securities 1,673 - - 2,865 4,538 Other financial assets designated at fair value 1,589 - 123 109 1,821 Available-for-sale securities 4,428 - 104 - 4,532 Loans 127 13,478 57 23,638 37,300 Life insurance assets - - 2,209 1,544 3,753 Other assets 11 - 39 4 54 Total on-balance sheet exposures 7,828 14,895 2,532 28,160 53,415 Total notional amounts of off-balance sheet exposures - 4,543 78 7,377 11,998 Maximum exposure to loss 7,828 19,438 2,610 35,537 65,413 Size of structured entities3 111,350 19,438 87,084 144,873 362,745
1 Of the Group’s total interests held in third party mortgage and other asset-backed securities, $7,809 million represents the senior tranche of notes issued and $19 million represents the subordinated tranche of notes issued. All notes are investment grade rated.
2 Includes unconsolidated trusts established and managed by the Group in New Zealand which hold securitised assets transferred from Westpac NZ Limited. The amount of assets transferred from the Group to these entities during the period was $103 million.
3 Represented either by the total assets or market capitalisation of the entity, or if not available the Group’s total committed exposure (for lending arrangements and external debt and equity holdings), funds under management (for Group managed funds) or the total value of notes on issue (for investments in third-party asset-backed securities).
Non-contractual financial support The Group has not provided any non-contractual financial support during the period to unconsolidated structured entities and does not anticipate providing such support in the future.
2014 Westpac Group Annual Report 279

Note 41. Structured entities (continued) Sponsored entities The Group would be deemed to sponsor an entity where it is involved in its creation or establishment and promotion (including use of the Group’s name in the name of the entity or on the products issued by the entity), and facilitates its on-going success through the transfer of assets (if any), or the provision of explicit or implicit financial, operational or other support.
In addition to the sponsored entities in which the Group has an interest, the Group also sponsors entities in which it has no interest. These primarily comprise the Group’s charitable trusts. No income is earned from these entities nor does the Group transfer any assets to them.
During the period, the Group established and launched the Westpac Bicentennial Foundation to which it made a one-off $100 million contribution. This charitable Foundation will have an exclusive focus on the education and advancement of Australians and the Group’s contribution will be used to fund 100 scholarships every year in perpetuity.
Note 42. Related party disclosures Ultimate parent Westpac Banking Corporation is the ultimate parent company of the Group.
Subsidiaries Transactions between the Parent Entity and its subsidiaries during 2014 have included the provision of a wide range of banking and other financial facilities, some of which have been on commercial terms and conditions; others have been on terms and conditions which represented a concession to the subsidiaries. Details of amounts paid to or received from related parties, in the form of dividends or interest, are set out in Note 2 and Note 3.
Other intragroup transactions, which may or may not be on commercial terms, include the provision of management and administration services, staff training, data processing facilities, transfer of tax losses, and the leasing of property, plant and equipment. Similar transactions between Group entities and other related parties have been almost invariably on commercial terms and conditions as agreed between the parties.
Director and other key management personnel Total compensation of all key management personnel, including Non-executive Directors, the CEO and other key management personnel:
Short-term Benefits
Post Employment Benefits
Termination Benefits
Share-based Payments Total
$ $ $ $ $Consolidated2014 32,629,048 433,456 - 19,010,878 52,073,382 2013 31,937,697 373,290 - 15,465,959 47,776,946
Parent Entity2014 31,449,374 429,955 - 18,632,631 50,511,960 2013 29,981,809 369,824 - 14,600,171 44,951,804
Detailed remuneration disclosures of Non-executive Directors, CEO and other key management personnel are included in the Remuneration report.
Loans to Directors and other key management personnel disclosures All financial instrument transactions that have occurred during the financial year between the Directors and the Group are in the ordinary course of business on normal terms and conditions (including interest and collateral) as apply to other employees and certain customers. These transactions consisted principally of normal personal banking and financial investment services.
Details of loans to Directors and other key management personnel (including their related parties) of the Group are:
Balance at Start of Year
$
Interest Paid and Payable for the Year
$
Interest Not Charged
$
Balance at End of Year
$
Number in Group at End of
Year2014 14,837,949 884,631 - 18,442,040 10 2013 15,800,908 778,689 - 14,837,949 11
280 2014 Westpac Group Annual Report
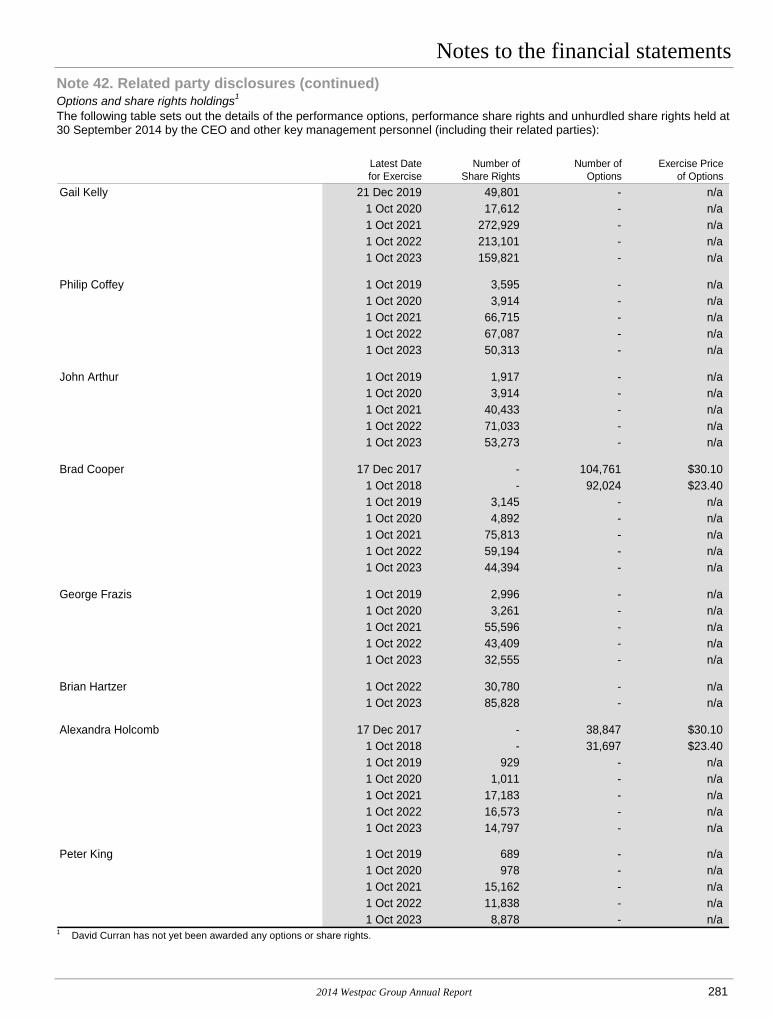
Notes to the financial statements Note 42. Related party disclosures (continued) Options and share rights holdings1 The following table sets out the details of the performance options, performance share rights and unhurdled share rights held at 30 September 2014 by the CEO and other key management personnel (including their related parties):
Latest Date Number of Number of Exercise Pricefor Exercise Share Rights Options of Options
Gail Kelly 21 Dec 2019 49,801 - n/a1 Oct 2020 17,612 - n/a1 Oct 2021 272,929 - n/a1 Oct 2022 213,101 - n/a1 Oct 2023 159,821 - n/a
Philip Coffey 1 Oct 2019 3,595 - n/a1 Oct 2020 3,914 - n/a1 Oct 2021 66,715 - n/a1 Oct 2022 67,087 - n/a1 Oct 2023 50,313 - n/a
John Arthur 1 Oct 2019 1,917 - n/a1 Oct 2020 3,914 - n/a1 Oct 2021 40,433 - n/a1 Oct 2022 71,033 - n/a1 Oct 2023 53,273 - n/a
Brad Cooper 17 Dec 2017 - 104,761 $30.101 Oct 2018 - 92,024 $23.401 Oct 2019 3,145 - n/a1 Oct 2020 4,892 - n/a1 Oct 2021 75,813 - n/a1 Oct 2022 59,194 - n/a1 Oct 2023 44,394 - n/a
George Frazis 1 Oct 2019 2,996 - n/a1 Oct 2020 3,261 - n/a1 Oct 2021 55,596 - n/a1 Oct 2022 43,409 - n/a1 Oct 2023 32,555 - n/a
Brian Hartzer 1 Oct 2022 30,780 - n/a1 Oct 2023 85,828 - n/a
Alexandra Holcomb 17 Dec 2017 - 38,847 $30.101 Oct 2018 - 31,697 $23.401 Oct 2019 929 - n/a1 Oct 2020 1,011 - n/a1 Oct 2021 17,183 - n/a1 Oct 2022 16,573 - n/a1 Oct 2023 14,797 - n/a
Peter King 1 Oct 2019 689 - n/a1 Oct 2020 978 - n/a1 Oct 2021 15,162 - n/a1 Oct 2022 11,838 - n/a1 Oct 2023 8,878 - n/a
1 David Curran has not yet been awarded any options or share rights.
2014 Westpac Group Annual Report 281

Note 42. Related party disclosures (continued)
Latest Date Number of Number of Exercise Pricefor Exercise Share Rights Options of Options
Christine Parker 1 Oct 2019 338 - n/a1 Oct 2020 750 - n/a1 Oct 2021 11,927 - n/a1 Oct 2022 27,623 - n/a1 Oct 2023 20,717 - n/a
Rob Whitfield 1 Oct 2019 3,595 - n/a1 Oct 2020 3,914 - n/a1 Oct 2021 60,650 - n/a1 Oct 2022 47,355 - n/a1 Oct 2023 35,515 - n/a
Jason Yetton 1 Oct 2019 959 - n/a1 Oct 2020 1,044 - n/a1 Oct 2021 17,689 - n/a1 Oct 2022 51,301 - n/a1 Oct 2023 38,475 - n/a
282 2014 Westpac Group Annual Report

Notes to the financial statements Note 43. Notes to the cash flow statements Cash and cash equivalents
Consolidated Parent Entity2014 2013 2012 2014 2013
$m $m $m $m $mCash on hand 19,582 9,862 11,138 18,952 9,270 Balances with central banks 6,178 1,837 1,385 4,448 239 Total cash and cash equivalents 25,760 11,699 12,523 23,400 9,509
Reconciliation of net cash (used in)/provided by operating activities to net profit attributable to equity holders of Westpac Banking Corporation is set out below:
Consolidated Parent Entity2014 2013 2012 2014 2013
$m $m $m $m $mReconciliation of net cash provided by/(used in) operating activities to net profitNet profit 7,625 6,825 6,002 7,234 6,805 Adjustments:
Depreciation, amortisation and impairment 1,020 904 850 867 803 (Decrease)/increase in sundry provisions and other non-cash items (565) 1,660 1 (932) 1,491 Impairment charges on loans 756 923 1,316 634 715 (Increase)/decrease in loans (35,734) (15,667) (18,893) (33,659) (13,372) Increase/(decrease) in deposits and other borrowings 34,229 22,155 26,381 32,244 17,646 (Increase)/decrease in receivables due from other financial institutions 3,932 (511) (2,418) 3,966 (1,544) (Decrease)/increase in payables due to other financial institutions 9,419 363 (6,807) 9,280 345 (Increase)/decrease in trading and fair value assets 1,724 (319) 4,271 1,083 (811) Increase/(decrease) in other financial liabilities at fair value through income statement 9,079 266 155 8,992 266 (Increase)/decrease in derivative financial instruments (3,329) 9,126 3,679 (3,028) 8,972 (Increase)/decrease in accrued interest receivable (64) 84 134 (47) 90 Increase/(decrease) in accrued interest payable (53) (376) 54 (55) (378) (Decrease)/increase in current and deferred tax 332 147 820 (221) (209)
Net cash provided by/(used in) operating activities 28,371 25,580 15,545 26,358 20,819
Business acquired Acquisition of selected business of Lloyds On 31 December 2013 the Group acquired 100% of the share capital in Capital Finance Australia Ltd (CFAL) and BOS International Australia Ltd (BOSI). The business acquired adds scale and geographic diversity to the Group’s motor vehicle finance business, expands the Group’s capability and reach within equipment finance and creates opportunities to deepen customer relationships with the opportunity to cross sell other Westpac Group products. The provisional goodwill recognised of $225 million primarily reflects the value of synergies expected to arise as a result of the acquisition.
Acquisition and integration related costs of $64 million have been charged to operating expenses for the year ended 30 September 2014.
The fair value of receivables acquired was $7,895 million. The gross contractual amount of receivables acquired was $7,977 million, of which $111 million is expected to be uncollectible. Other fair value adjustments amount to $29 million.
Since 31 December 2013 CFAL and BOSI have contributed revenue of $234 million and an after-tax profit of $64 million to the Group. If the acquisition had occurred on 1 October 2013, it is estimated that CFAL and BOSI would have contributed revenue of $310 million and profit of $84 million to the Group.
In addition to acquiring the shares in CFAL and BOSI the Group purchased certain derivative contracts from Lloyds International Australian branches for $9 million. These derivatives have been accounted for as transactions in the normal course of business and in aggregate have no material impact on the Group.
Acquisition of J O Hambro Capital Management Limited On 1 October 2011 BT Investment Management Limited (an entity controlled by Westpac) acquired 100% of the share capital of J O Hambro Capital Management Limited, a company incorporated in the United Kingdom.
2014 Westpac Group Annual Report 283

Note 43. Notes to the cash flow statements (continued) Details of assets and liabilities of controlled entities and business acquired
Consolidated2014 2013 2012
$m $m $mFair value of assets and liabilities of controlled entities and businesses acquired1
Assets acquired: Cash and cash equivalents 149 - 22 Trade and other receivables - - 24 Derivative assets 30 - - Available for sale financial assets - - 22 Loans and advances 7,895 - - Identifiable intangible assets 56 - 120 Operating lease assets 80 - - Other assets and prepayments 6 - 5 Total assets acquired 8,216 - 193 Liabilities acquired: Trade creditors and other accrued expenses 24 - 30 Provisions 11 - 12 Deferred tax liabilities 25 - 28 Debt securities on issue 488 - - Borrowings 6,368 - - Total liabilities acquired 6,916 - 70 Fair value of identifiable net assets acquired 1,300 - 123 Goodwill 225 - 214 Total 1,525 - 337 Cash considerationPurchase of shares 1,525 - 292 Replacement of intergroup funding 6,368 - - Debt and equity instruments issued - - 45 Total consideration transferred 7,893 - 337 Cash consideration 7,893 - 292 Less cash and cash equivalents acquired (149) - (22) Cash paid (net of cash acquired) 7,744 - 270
1 Fair value of assets and liabilities are provisional amounts.
Non-cash financing activities
Consolidated Parent Entity2014 2013 2012 2014 2013
$m $m $m $m $mShares issued under the dividend reinvestment plan1 - 531 873 - 531 Issuance of loan capital2 529 332 - 529 332 Shares issued on redemption of Westpac SPS - 173 - - 173
1 The dividend reinvestment plan in respect of the 2014 interim and 2013 final and special dividends ($1,022 million) (2013: interim dividend $543 million) was satisfied in full through purchase of existing shares and transfer of shares to participating shareholders.
2 In 2014, amounts relate to holders of Westpac SPS II who participated in the reinvestment offer to subscribe for Westpac Capital Notes 2. In 2013, amounts relate to holders of Westpac SPS who participated in the reinvestment offer to subscribe for Westpac Subordinated Notes II.
Restricted cash The amount of cash and cash equivalents not available for use at 30 September 2014 was $35 million (2013: nil) for the Group.
Note 44. Subsequent events No matter of circumstance has arisen since the year ended 30 September 2014 which is not otherwise dealt with in this report, that has significantly affected or may significantly affect the operations of the Group, the results of its operations or the state of affairs of the Group in subsequent periods.
284 2014 Westpac Group Annual Report

Statutory statements Directors’ declaration
In the Directors’ opinion:
a. the financial statements and notes set out in ‘Section 3 – Financial report for the year ended 30 September 2014’ are in accordance with the Corporations Act 2001, including:
(i) complying with Australian Accounting Standards, the Corporations Regulations 2001 and other mandatory professional reporting requirements; and
(ii) giving a true and fair view of Westpac Banking Corporation and the Group’s financial position as at 30 September 2014 and of their performance, as represented by the results of their operations, changes in equity and their cash flows, for the financial year ended on that date; and
b. there are reasonable grounds to believe that Westpac will be able to pay its debts as and when they become due and payable.
Note 1(a) confirms that the financial report also complies with International Financial Reporting Standards as issued by the International Accounting Standards Board.
The Directors have been given the declaration by the Chief Executive Officer and the Chief Financial Officer required by section 295A of the Corporations Act 2001.
This declaration is made in accordance with a resolution of the Directors.
For and on behalf of the Board.
Lindsay Maxsted Chairman
Gail Kelly Managing Director & Chief Executive Officer
Sydney 3 November 2014
2014 Westpac Group Annual Report 285

Management’s report on internal control over financial reporting
The following report is required by rules of the US Securities and Exchange Commission
The management of Westpac is responsible for establishing and maintaining adequate internal control over financial reporting for Westpac as defined in Rule 13a – 15 (f) under the Securities Exchange Act of 1934, as amended. Westpac’s internal control system is a process designed to provide reasonable assurance regarding the reliability of financial reporting and the preparation of financial statements for external purposes in accordance with applicable accounting standards.
Westpac’s internal control over financial reporting includes policies and procedures that: pertain to the maintenance of records that in reasonable detail accurately reflect the transactions and dispositions of the assets of Westpac and its consolidated entities; provide reasonable assurance that transactions are recorded as necessary to permit preparation of financial statements in accordance with applicable accounting standards, and that receipts and expenditures of Westpac are being made only in accordance with authorizations of management and directors of Westpac and its consolidated entities; and provide reasonable assurance regarding prevention or timely detection of unauthorized acquisition, use or disposition of the assets of Westpac and its consolidated entities that could have a material effect on the financial statements.
Because of its inherent limitations, internal control over financial reporting may not prevent or detect misstatements. Also, projections of any evaluation of effectiveness to future periods are subject to the risk that controls may become inadequate because of changes in conditions, or that the degree of compliance with the policies or procedures may deteriorate.
Westpac management, with the participation of the CEO and CFO, assessed the effectiveness of Westpac’s internal control over financial reporting as of 30 September 2014 based on the criteria set forth by the Committee of Sponsoring Organizations of the Treadway Commission (COSO) in Internal Control-Integrated Framework. Based on this assessment, management has concluded that Westpac’s internal control over financial reporting as of 30 September 2014 was effective.
The effectiveness of Westpac’s internal control over financial reporting as of 30 September 2014 has been audited by PricewaterhouseCoopers, an independent registered public accounting firm, as stated in their report which is included herein.
286 2014 Westpac Group Annual Report

Statutory statements
Independent auditor’s report to the members of Westpac Banking Corporation
Report on the financial report We have audited the accompanying financial report of Westpac Banking Corporation (the Corporation), which comprises the balance sheets as at 30 September 2014, the income statements, statements of comprehensive income, statements of changes in equity and cash flow statements for the year ended on that date, a summary of significant accounting policies, other explanatory notes and the directors’ declaration for both the Corporation and the Consolidated Entity. The Consolidated Entity comprises the Corporation and the entities it controlled at year’s end or from time to time during the financial year.
Directors’ responsibility for the financial report The directors of the Corporation are responsible for the preparation of the financial report that gives a true and fair view in accordance with Australian Accounting Standards and the Corporations Act 2001 and for such internal control as the directors determine is necessary to enable the preparation of the financial report that is free from material misstatement, whether due to fraud or error. In Note 1, the directors also state, in accordance with Accounting Standard AASB 101 Presentation of Financial Statements, that the financial statements comply with International Financial Reporting Standards as issued by the International Accounting Standards Board.
Auditor’s responsibility Our responsibility is to express an opinion on the financial report based on our audit. We conducted our audit in accordance with Australian Auditing Standards. Those standards require that we comply with relevant ethical requirements relating to audit engagements and plan and perform the audit to obtain reasonable assurance whether the financial report is free from material misstatement.
An audit involves performing procedures to obtain audit evidence about the amounts and disclosures in the financial report. The procedures selected depend on the auditor’s judgement, including the assessment of the risks of material misstatement of the financial report, whether due to fraud or error. In making those risk assessments, the auditor considers internal control relevant to the entity’s preparation and fair presentation of the financial report in order to design audit procedures that are appropriate in the circumstances, but not for the purpose of expressing an opinion on the effectiveness of the entity’s internal control. An audit also includes evaluating the appropriateness of accounting policies used and the reasonableness of accounting estimates made by the directors, as well as evaluating the overall presentation of the financial report.
Independence In conducting our audit, we have complied with the independence requirements of the Corporations Act 2001.
Auditor’s opinion In our opinion:
a. the financial report of Westpac Banking Corporation is in accordance with the Corporations Act 2001, including:
(i) giving a true and fair view of the Corporation’s and Consolidated Entity’s financial position as at 30 September 2014 and of their performance for the year ended on that date; and
(ii) complying with Australian Accounting Standards (including the Australian Accounting Interpretations) and the Corporations Regulations 2001
b. the financial report also complies with International Financial Reporting Standards as disclosed in Note 1.
PricewaterhouseCoopers, ABN 52 780 433 757 Darling Park Tower 2, 201 Sussex Street, GPO BOX 2650, SYDNEY NSW 1171 T +61 2 8266 0000, F +61 2 8266 9999, www.pwc.com.au Liability limited by a scheme approved under Professional Standards Legislation.
2014 Westpac Group Annual Report 287

Report on the Remuneration Report We have audited the Remuneration Report included in Section 1 of the Annual Report for the year ended 30 September 2014. The directors of the Corporation are responsible for the preparation and presentation of the Remuneration Report in accordance with section 300A of the Corporations Act 2001. Our responsibility is to express an opinion on the Remuneration Report, based on our audit conducted in accordance with Australian Auditing Standards.
Auditor’s opinion In our opinion, the Remuneration Report of Westpac Banking Corporation for the year ended 30 September 2014 complies with section 300A of the Corporations Act 2001.
PricewaterhouseCoopers
Michael Codling Partner
Craig Stafford Partner
Sydney 3 November 2014
PricewaterhouseCoopers, ABN 52 780 433 757 Darling Park Tower 2, 201 Sussex Street, GPO BOX 2650, SYDNEY NSW 1171 T +61 2 8266 0000, F +61 2 8266 9999, www.pwc.com.au Liability limited by a scheme approved under Professional Standards Legislation.
288 2014 Westpac Group Annual Report

Statutory statements
Report of independent registered public accounting firm
To the Board of Directors and Shareholders of Westpac Banking Corporation:
In our opinion, the accompanying consolidated balance sheets and the related consolidated income statements, consolidated statements of comprehensive income, consolidated statements of changes in equity and consolidated cash flow statements present fairly, in all material respects, the financial position of Westpac Banking Corporation (the ‘Corporation’) and its subsidiaries at 30 September 2014 and 30 September 2012, and the results of their operations and their cash flows for each of the three years in the period ended 30 September 2014 in conformity with International Financial Reporting Standards as issued by the International Accounting Standards Board. Also in our opinion, the Corporation maintained, in all material respects, effective internal control over financial reporting as of 30 September 2014, based on criteria established in Internal Control – Integrated Framework (1992) issued by the Committee of Sponsoring Organizations of the Treadway Commission (COSO). The Corporation’s management is responsible for these financial statements, for maintaining effective internal control over financial reporting and for its assessment of the effectiveness of internal control over financial reporting, included under the heading ‘Management’s Report on Internal Control over Financial Reporting’ in the accompanying financial statements. Our responsibility is to express opinions on these financial statements and on the Corporation’s internal control over financial reporting based on our integrated audits. We conducted our audits in accordance with the standards of the Public Company Accounting Oversight Board (United States) and International Standards on Auditing. Those standards require that we plan and perform the audits to obtain reasonable assurance about whether the financial statements are free of material misstatement and whether effective internal control over financial reporting was maintained in all material respects. Our audits of the financial statements included examining, on a test basis, evidence supporting the amounts and disclosures in the financial statements, assessing the accounting principles used and significant estimates made by management, and evaluating the overall financial statement presentation. Our audit of internal control over financial reporting included obtaining an understanding of internal control over financial reporting, assessing the risk that a material weakness exists, and testing and evaluating the design and operating effectiveness of internal control based on the assessed risk. Our audits also included performing such other procedures as we considered necessary in the circumstances. We believe that our audits provide a reasonable basis for our opinions.
Our audit of the consolidated financial statements of the Corporation and its subsidiaries was conducted for the purpose of forming an opinion on the consolidated financial statements taken as a whole. The Corporation has included parent entity only information on the face of the consolidated financial statements and other parent entity only disclosures in the notes to the financial statements. Such parent entity only information is presented for purposes of additional analysis and is not a required part of the consolidated financial statements presented in accordance with the International Financial Reporting Standards as issued by the International Accounting Standards Board. Such information has been subjected to the auditing procedures applied in the audit of the consolidated financial statements, and, in our opinion, is fairly stated in all material respects in relation to the consolidated financial statements taken as a whole.
A company’s internal control over financial reporting is a process designed to provide reasonable assurance regarding the reliability of financial reporting and the preparation of financial statements for external purposes in accordance with generally accepted accounting principles. A company’s internal control over financial reporting includes those policies and procedures that (i) pertain to the maintenance of records that, in reasonable detail, accurately and fairly reflect the transactions and dispositions of the assets of the company; (ii) provide reasonable assurance that transactions are recorded as necessary to permit preparation of financial statements in accordance with generally accepted accounting principles, and that receipts and expenditures of the company are being made only in accordance with authorizations of management and directors of the company; and (iii) provide reasonable assurance regarding prevention or timely detection of unauthorized acquisition, use, or disposition of the company’s assets that could have a material effect on the financial statements.
PricewaterhouseCoopers, ABN 52 780 433 757 Darling Park Tower 2, 201 Sussex Street, GPO BOX 2650, SYDNEY NSW 1171 T +61 2 8266 0000, F +61 2 8266 9999, www.pwc.com.au Liability limited by a scheme approved under Professional Standards Legislation.
2014 Westpac Group Annual Report 289

Limitation on Independent Registered Public Accounting Firm’s Liability The liability of PricewaterhouseCoopers (an Australian partnership which we refer to as PwC Australia), with respect to claims arising out of its audit reports included in this Annual Report, is subject to the limitations set forth in the Professional Standards Act 1994 of New South Wales, Australia, as amended (the Professional Standards Act) and The Institute of Chartered Accountants in Australia (NSW) Scheme adopted by The Institute of Chartered Accountants in Australia (ICAA) on 8 October 2013 and approved by the New South Wales Professional Standards Council pursuant to the Professional Standards Act (the NSW Accountants Scheme) or, in relation to matters occurring on or prior to 7 October 2013, the predecessor schemes. The Professional Standards Act and the NSW Accountants Scheme may limit the liability of PwC Australia for damages with respect to certain civil claims directly or vicariously from anything done or omitted by it in New South Wales in the performance of its professional services for us, including, without limitation, its audits of our financial statements, The maximum liability for audit work of $75 million or, in relation to matters occurring on or prior to 7 October 2007, $20 million. The limit does not apply to claims for breach of trust, fraud or dishonesty. The current NSW Accountants Scheme expires on 7 October 2019 unless further extended or replaced.
In addition, there is equivalent professional standards legislation in place in other states and territories in Australia and amendments have been made to a number of Australian federal statutes to limit liability under those statutes to the same extent as liability is limited under state and territory laws by professional standards legislation.
These limitations of liability may limit recovery upon the enforcement in Australian courts of any judgment under US or other foreign laws rendered against PwC Australia based on or related to its audit report on our financial statements. Substantially all of PwC Australia’s assets are located in Australia. However, the Professional Standards Act and the NSW Accountants Scheme have not been subject to judicial consideration and therefore how the limitation will be applied by the courts and the effect of the limitation on the enforcement of foreign judgments are untested.
Because of its inherent limitations, internal control over financial reporting may not prevent or detect misstatements. Also, projections of any evaluation of effectiveness to future periods are subject to the risk that controls may become inadequate because of changes in conditions, or that the degree of compliance with the policies or procedures may deteriorate.
PricewaterhouseCoopers
Sydney 3 November 2014
PricewaterhouseCoopers, ABN 52 780 433 757 Darling Park Tower 2, 201 Sussex Street, GPO BOX 2650, SYDNEY NSW 1171 T +61 2 8266 0000, F +61 2 8266 9999, www.pwc.com.au Liability limited by a scheme approved under Professional Standards Legislation.
290 2014 Westpac Group Annual Report

04
Shareholding information
Additional information
Information for shareholders
Glossary of abbreviations and defined terms
Contact us

Shareholding information Westpac ordinary shares Top 20 ordinary shareholders as at 3 October 2014
Number of Fully Paid Ordinary Shares % Held
HSBC Custody Nominees (Australia) Limited 551,140,214 17.73J P Morgan Nominees Australia Ltd 375,334,352 12.07National Nominees Limited 305,321,294 9.82Citicorp Nominees Pty Limited 145,208,026 4.67Cogent Nominees Pty Limited 65,041,583 2.09RBC Dexia Investor Services Australia Nominees Pty Limited 37,264,064 1.20AMP Life Limited 24,711,484 0.79Australian Foundation Investment Company Limited 18,236,232 0.59UBS Private Clients Australia Nominees Pty Ltd 14,977,769 0.48Bond Street Custodians Limited 12,826,099 0.41Milton Corporation Limited 10,451,306 0.34Argo Investments Limited 10,251,594 0.33BNP Paribas 10,225,951 0.33Navigator Australia Limited 7,329,618 0.24Questor Financial Services Limited 5,166,459 0.17Nulis Nominees (Australia) Limited 4,888,606 0.16Invia Custodian Pty Limited 4,559,441 0.15UBS Nominees Pty Ltd 4,175,899 0.13Share Direct Nominees Pty Limited 4,018,035 0.13ANZ Executors & Trustee Company Limited 2,704,975 0.09Total of Top 20 registered shareholders 1,613,833,001 51.92
As at 3 October 2014 there were 595,907 holders of our ordinary shares compared to 579,695 in 2013 and 563,072 in 2012. Ordinary shareholders with a registered address in Australia held approximately 98% of our fully paid share capital at 3 October 2014 (approximately 98% in 2013 and 98% in 2012).
Substantial shareholders as at 3 October 2014 As at 3 October 2014 there were no shareholders who had a ‘substantial holding’ of our shares within the meaning of the Corporations Act. A person has a substantial holding of our shares if the total votes attached to our voting shares in which they or their associates have relevant interests is 5% or more of the total number of votes attached to all our voting shares. The above table of the Top 20 ordinary shareholders includes shareholders that may hold shares for the benefit of third parties.
Significant changes in ordinary share ownership of substantial shareholders On 17 May 2012, National Australia Bank Limited became a substantial shareholder having relevant interest in 178,904,696 ordinary shares (5.86% of total votes outstanding). They ceased to be a substantial shareholder on 18 May 2012.
Control of registrant We are not directly or indirectly owned or controlled by any other corporation(s) or by any foreign government. Refer to the section ‘Exchange controls and other limitations affecting security holders’, which provides information on the Foreign Acquisitions and Takeovers Act 1975, Corporations Act 2001 and Financial Sector (Shareholdings) Act 1998, which impose limits on equity holdings.
At 30 September 2014, our Directors and Executive Officers owned beneficially, directly or indirectly, an aggregate of 3,086,467 (0.10%) of the fully paid ordinary shares outstanding.
292 2014 Westpac Group Annual Report

Shareholding information Analysis by range of holdings of ordinary shares as at 3 October 2014
Number of Holders Number of Number of Holders of Fully Paid Fully Paid of Share Options
Number of Shares Ordinary Shares % Ordinary Shares % and Rights1 – 1,000 332,207 55.75 137,239,855 4.41 721,001 – 5,000 203,485 34.15 466,527,073 15.01 1295,001 – 10,000 36,007 6.04 253,315,938 8.15 2910,001 – 100,000 23,544 3.95 495,634,194 15.94 83100,001 and over 664 0.11 1,756,331,249 56.49 14Totals 595,907 100.00 3,109,048,309 100.00 327
There were 10,159 shareholders holding less than a marketable parcel ($500) based on a market price of $32.28 at the close of trading on 3 October 2014.
Voting rights of ordinary shares Holders of our fully paid ordinary shares have, at general meetings (including special general meetings), one vote on a show of hands and, upon a poll, one vote for each fully paid ordinary share held by them.
Westpac Convertible Preference Shares (Westpac CPS) Top 20 holders of Westpac CPS as at 3 October 2014
Number ofWestpac CPS % Held
UBS Wealth Management Australia Nominees Pty Ltd 607,542 5.11BT Portfolio Services Limited 256,028 2.15Questor Financial Services Limited 213,450 1.79Navigator Australia Limited 204,952 1.72Nulis Nominees (Australia) Limited 197,268 1.66National Nominees Limited 186,489 1.57UCA Cash Management Fund Ltd 179,426 1.51HSBC Custody Nominees (Australia) Limited 137,934 1.16Netwealth Investments Limited 125,326 1.05J P Morgan Nominees Australia Ltd 120,278 1.01Austrust Limited 92,564 0.78Dimbulu Pty Ltd 70,000 0.59Mrs Linda Anne van Lieshout 60,000 0.50RBC Dexia Investor Services Australia Nominees Pty Limited 59,176 0.50Asgard Capital Management Ltd 50,400 0.42Eastcote Pty Ltd 50,000 0.42Finot Pty Ltd 50,000 0.42JMB Pty Ltd 50,000 0.42Randazzo C&G Developments P/L 50,000 0.42Citicorp Nominees Pty Limited 41,018 0.34Total of Top 20 registered holders 2,801,851 23.54
Analysis by range of holdings of Westpac CPS as at 3 October 2014
Number of Holders of Number ofNumber of Securities Westpac CPS % Westpac CPS %1 – 1,000 18,170 93.11 5,416,955 45.551,001 – 5,000 1,207 6.18 2,689,478 22.615,001 – 10,000 83 0.43 641,247 5.3910,001 – 100,000 47 0.24 1,334,283 11.22100,001 and over 8 0.04 1,811,642 15.23Totals 19,515 100.00 11,893,605 100.00
There were 9 security holders holding less than a marketable parcel ($500) of Westpac CPS based on a market price of $99.40 at the close of trading on 3 October 2014.
2014 Westpac Group Annual Report 293

Westpac Capital Notes Top 20 holders of Westpac Capital Notes as at 3 October 2014
Number ofWestpac Capital Notes % Held
UBS Wealth Management Australia Nominees Pty Ltd 1,063,432 7.69BT Portfolio Services Limited 263,624 1.91HSBC Custody Nominees (Australia) Limited 259,779 1.88National Nominees Limited 192,544 1.39Citicorp Nominees Pty Limited 175,501 1.27Zashvin Pty Ltd 150,000 1.08J P Morgan Nominees Australia Ltd 148,828 1.08Questor Financial Services Limited 106,237 0.77Austrust Limited 101,863 0.74Tandom Pty Ltd 100,000 0.72Willimbury Pty Ltd 100,000 0.72Vinsun Custodians Pty Ltd 90,000 0.65Cogent Nominees Pty Limited 74,350 0.54Netwealth Investments Limited 73,358 0.53Navigator Australia Limited 64,541 0.47Nulis Nominees (Australia) Limited 56,197 0.41Bond Street Custodians Limited 54,830 0.40Northern Metropolitan Cemeteries 50,000 0.36Royal Freemasons Benevolent Institution 50,000 0.36Kept Safe Pty Ltd 50,000 0.36Total of Top 20 registered holders 3,225,084 23.33
Analysis by range of holdings of Westpac Capital Notes as at 3 October 2014
Number of Holders of Number ofNumber of Securities Westpac Capital Notes % Westpac Capital Notes %1 – 1,000 16,025 90.29 5,328,895 38.511,001 – 5,000 1,536 8.65 3,427,316 24.775,001 – 10,000 120 0.68 994,734 7.1910,001 – 100,000 61 0.34 2,014,141 14.56100,001 and over 7 0.04 2,070,604 14.97Totals 17,749 100.00 13,835,690 100.00
There were 4 security holders holding less than a marketable parcel ($500) of Westpac Capital Notes based on a market price of $99.39 at the close of trading on 3 October 2014.
294 2014 Westpac Group Annual Report

Shareholding information Westpac Capital Notes 2 Top 20 holders of Westpac Capital Notes 2 as at 3 October 2014
Number ofWestpac Capital Notes 2 % Held
UBS Wealth Management Australia Nominees Pty Ltd 723,684 5.52BT Portfolio Services Limited 473,733 3.61Navigator Australia Limited 155,559 1.19HSBC Custody Nominees (Australia) Limited 149,390 1.14Invia Custodian Pty Limited 136,817 1.04Nulis Nominees (Australia) Limited 124,890 0.95Questor Financial Services Limited 113,984 0.87National Nominees Limited 96,177 0.73UCA Cash Management Fund Limited 80,969 0.62Netwealth Investments Limited 72,961 0.56J P Morgan Nominees Australia Ltd 72,554 0.55Bond Street Custodians Limited 71,812 0.55Rakio Pty Ltd 63,000 0.48Alsop Pty Ltd 60,000 0.46Dimbulu Pty Ltd 51,000 0.39Bayswater Car Rental Pty Ltd 50,000 0.38Domer Mining Co P/L 50,000 0.38Ms Sarah Louise Haddrick 50,000 0.38Royal Freemasons Benevolent Institution 50,000 0.38Randazzo C&G Developments P/L 50,000 0.38Total of Top 20 registered holders 2,696,530 20.56
Analysis by range of holdings of Westpac Capital Notes 2 as at 3 October 2014
Number of Holders of Number ofNumber of Securities Westpac Capital Notes 2 % Westpac Capital Notes 2 %1 – 1,000 14,419 88.85 4,866,458 37.131,001 – 5,000 1,595 9.83 3,627,575 27.685,001 – 10,000 125 0.77 995,991 7.6010,001 – 100,000 84 0.52 2,226,880 16.99100,001 and over 5 0.03 1,388,801 10.60Totals 16,228 100.00 13,105,705 100.00
There was 1 security holder holding less than a marketable parcel ($500) of Westpac Capital Notes 2 based on a market price of $98.15 at the close of trading on 3 October 2014.
2014 Westpac Group Annual Report 295

Voting rights of Westpac CPS, Westpac Capital Notes and Westpac Capital Notes 2 In accordance with the terms of issue, holders of Westpac CPS have no right to vote at any general meeting of Westpac except in the following circumstances: a. on a proposal:
– to reduce the share capital of Westpac; – that affects rights attached to Westpac CPS; – to wind up Westpac; or – for the disposal of the whole of the property, business
and undertaking of Westpac; b. on a resolution to approve the terms of a share buy back
agreement, other than a buy back agreement relating to Westpac CPS;
c. during a period in which a dividend (or part of a dividend) in respect of Westpac CPS is in arrears; or
d. during the winding up of Westpac.
When entitled to vote at a general meeting of Westpac in respect of the matters listed above, holders of Westpac CPS are entitled to exercise one vote on a show of hands and one vote for each Westpac CPS held on a poll. Holders of Westpac CPS have the same rights as the holders of Westpac’s ordinary shares in relation to receiving notices, reports and financial statements, and attending and being heard at all general meetings of Westpac.
In accordance with the terms of issue, holders of Westpac Capital Notes and Westpac Capital Notes 2 have no right to vote at any general meeting of Westpac before conversion into Westpac ordinary shares.
If conversion occurs (in accordance with the applicable terms of issue), holders of Westpac CPS, Westpac Capital Notes or Westpac Capital Notes 2 (as applicable) will become holders of Westpac ordinary shares and have the voting rights that attach to Westpac ordinary shares.
Westpac Subordinated Notes II Westpac has received confirmation from the ASX that the ASX considers Westpac Subordinated Notes II to be debt securities for the purposes of the ASX Listing Rules. Therefore, shareholding information regarding Westpac Subordinated Notes II has not been included in this section of the Annual Report.
Exchange controls and other limitations affecting security holders Australian exchange controls Australian laws control and regulate or permit the control and regulation of a broad range of payments and transactions involving non-residents of Australia. Pursuant to a number of exemptions, authorities and approvals, there are no general restrictions from transferring funds from Australia or placing funds to the credit of non-residents of Australia. However, Australian foreign exchange controls are implemented from time to time against prescribed countries, entities and persons. At the present time, these include:
a. withholding taxes in relation to remittances or dividends (to the extent they are unfranked) and interest payments;
b. the financial sanctions administered by the Department of Foreign Affairs and Trade (DFAT) in accordance with the Autonomous Sanctions Act 2011 and the Autonomous Sanctions Regulations 2011, specifically, in relation to transactions involving the transfer of funds or payments to, by the order of, or on behalf of:
– supporters of the former Federal Republic of Yugoslavia (the Milosevic regime) and certain persons identified by the International Criminal Tribunal for the former Yugoslavia;
– persons or entities associated with activities that seriously undermine democracy, respect for human rights and the rule of law in Zimbabwe;
– certain entities and individuals associated with the Democratic People’s Republic of Korea;
– persons or entities that have contributed to or are contributing to Iran’s nuclear or missile program;
– certain individuals and entities associated with the Burmese military;
– certain individuals and entities associated with the Republic of Fiji Military Forces and commodore Josaia Voreqe Bainimarama;
– certain individuals and entities associated with the former Qadhafi regime in Libya;
– certain individuals and entities associated with the Syrian regime; and
– persons who have been instrumental in the Russian threat to the sovereignty and territorial integrity of Ukraine,
without the prior approval of the Minister for Foreign Affairs.
296 2014 Westpac Group Annual Report

Shareholding information c. the United Nations Security Council (UNSC) financial
sanctions administered by DFAT including:
– Terrorist Asset Freezing Regime In accordance with the Charter of the United Nations Act 1945 and the Charter of the United Nations (Dealings with Assets) Regulations 2008, a person is prohibited from using or dealing with funds, financial assets or economic resources of persons or entities listed as terrorists by the Minister for Foreign Affairs in the Commonwealth of Australia Gazette. It is also a criminal offence to make assets available to such persons or entities.
– Country-based sanctions Under the Charter of the United Nations Act 1945 and associated regulations, UNSC financial sanctions have been implemented. It is an offence to use or deal with funds, financial assets or economic resources of persons or entities associated with certain countries designated by the UNSC. It is also a criminal offence to make assets available to such persons or entities.
Limitations affecting security holders The following Australian laws impose limitations on the right of non-residents or non-citizens of Australia to hold, own or vote Westpac shares. All these limitations apply to the holders of the American Depositary Receipts (ADRs) evidencing ADS, issued by our Depositary in the United States.
Foreign Acquisitions and Takeovers Act 1975 Acquisitions of interests in shares in Australian companies by foreign interests are subject to review and approval by the Treasurer of Australia under the Australian Government’s foreign investment policy, and where required, the Foreign Acquisitions and Takeovers Act 1975 (Cth). That legislation applies to any acquisition by a foreign person, including a corporation or group of associated foreign persons, which results in ownership of 15% or more of the issued shares of an Australian company or the ability to control 15% or more of the total voting power. In addition, the legislation applies to any acquisition by a foreign person that would result in non-associated foreign persons having, together with any associate or associates of any of them, in the aggregate, 40% or more of the total voting power or ownership of an Australian company. The legislation requires any persons proposing to make any such acquisition to first notify the Treasurer of their intention to do so. Where such an acquisition has already occurred, the Treasurer has the power to order divestment.
Financial Sector (Shareholdings) Act 1998 The Financial Sector (Shareholdings) Act 1998 (Cth) imposes restrictions on shareholdings in Australian financial sector companies (which includes Westpac). Under that legislation a person (including a corporation) may not hold more than a 15% ‘stake’ in a financial sector company without prior approval from the Treasurer of Australia. A person’s stake in a financial sector company is equal to the aggregate of the person’s voting power in the company and the voting power of the person’s associates. The concept of voting power is very broadly defined. The Treasurer may approve a higher percentage stake if the Treasurer is satisfied that it is in the national interest to do so.
In addition, even if a person’s stake in a financial sector company does not exceed the 15% limit, the Treasurer has the power to declare that a person has ‘practical control’ of a financial sector company and require the person to relinquish that control or reduce their stake in that company. Corporations Act 2001 The Corporations Act 2001 (Cth) prohibits any person (including a corporation) from acquiring a relevant interest in our voting shares if, after the acquisition, that person or any other person would be entitled to exercise more than 20% of the voting power in our shares. The prohibition is subject to certain limited exceptions. In addition, under the Corporations Act, a person is required to give a notice to us and to the ASX providing certain prescribed information, including their name, address and details of their relevant interests in our voting shares if they begin to have, or cease to have, a substantial holding in us, or if they already have a substantial holding and there is a movement of at least 1% in their holding. Such notice must, generally, be provided within two business days after the person becomes aware of that information.
A person will have a substantial holding if the total votes attached to our voting shares in which they or their associates have relevant interests is 5% or more of the total number of votes attached to all our voting shares. The concepts of ‘associate’ and ‘relevant interest’ are broadly defined in the Corporations Act and investors are advised to seek their own advice on their scope. In general terms, a person will have a relevant interest in a share if they:
a. are the holder of that share;
b. have power to exercise, or control the exercise of, a right to vote attached to that share; or
c. have power to dispose of, or control the exercise of a power to dispose of, that share.
It does not matter how remote the relevant interest is or how it arises. If two or more persons can jointly exercise any one of these powers, each of them is taken to have that power. Nor does it matter that the power or control is express or implied, formal or informal, exercisable either alone or jointly with someone else.
2014 Westpac Group Annual Report 297

The American Depositary Shares (ADSs) agreement There is a Deposit Agreement between The Bank of New York Mellon as Depositary, and us, and the record holders from time to time of all ADSs. Holders of our ADSs are subject to the foregoing limitations on the rights of non-residents or non-citizens of Australia to own or vote Westpac shares. Record holders of ADSs are required by the Deposit Agreement to comply with our requests for information as to the capacity in which such holders own ADSs and related ordinary shares as well as to the identity of any other person interested in such ADSs and related ordinary shares and the nature of such interest.
Enforceability of foreign judgments in Australia We are an Australian public corporation with limited liability. All of our Directors and Executive Officers reside outside the US. Substantially all or a substantial portion of the assets of all or many of such persons are located outside the US. As a result, it may not be possible for investors to effect service of process within the US upon such persons or to enforce against them judgments obtained in US courts predicated upon the civil liability provisions of the federal securities laws of the US. There may be doubt as to the enforceability in Australia, in original actions or in actions for enforcement of judgments of US courts, of civil liabilities predicated upon the federal securities laws of the US.
Taxation Australian taxation The following discussion is a summary of certain Australian taxation implications of the ownership and disposition of ordinary shares (including ADS) for shareholders holding their shares on capital account. This discussion is based on the laws in force at the date of the Annual Report and the Convention between the Government of Australia and the Government of the United States of America for the Avoidance of Double Taxation and The Prevention of Fiscal Evasion with respect to Taxes on Income (the Tax Treaty), and is subject to any changes in Australian law and any change in the Tax Treaty occurring after that date.
This discussion is intended only as a descriptive summary and does not purport to be a complete analysis of all the potential Australian tax implications of owning and disposing of ordinary shares. The specific tax position of each investor will determine the applicable Australian income tax implications for that investor and we recommend that investors consult their own tax advisers concerning the implications of owning and disposing of ordinary shares.
Taxation of dividends Under the Australian dividend imputation system, Australian tax paid at the company level is imputed (or allocated) to shareholders by means of imputation credits which attach to dividends paid by the company to the shareholder. Such dividends are termed ‘franked dividends’.
When an Australian resident individual shareholder receives a franked dividend, the shareholder receives a tax offset to the extent of the franking credits, which can be offset against the Australian income tax payable by the shareholder. An Australian resident shareholder may, in certain circumstances, be entitled to a refund of excess franking.
The extent to which a dividend is franked typically depends upon a company’s available franking credits at the time of payment of the dividend. Accordingly, a dividend paid to a shareholder may be wholly or partly franked or wholly unfranked.
Fully franked dividends paid to non-resident shareholders are exempt from Australian dividend withholding tax. Dividends paid to a non-resident shareholder which are not fully franked are subject to dividend withholding tax at the rate of 30% (unless reduced by a double tax treaty) to the extent they are unfranked. In the case of residents of the US who are entitled to the benefits of the Tax Treaty and are beneficially entitled to the dividends, the rate is reduced to 15% under the Tax Treaty, provided the shares are not effectively connected with a permanent establishment or a fixed base of the non-resident in Australia through which the non-resident carries on business in Australia or provides independent personal services. In the case of residents of the US that have a permanent establishment or fixed base in Australia where the shares in respect of which the dividends are paid are attributable to that permanent establishment or fixed base, there is no dividend withholding tax. Rather, such dividends will be taxed on a net assessment basis and, where the dividends are franked, entitlement to a tax offset may arise.
Fully franked dividends paid to non-resident shareholders and dividends that have been subject to dividend withholding tax should not be subject to any further Australian income tax.
There are circumstances where a shareholder may not be entitled to the benefit of franking credits. The application of these rules depend upon the shareholder’s own circumstances, including the period during which the shares are held and the extent to which the shareholder is ‘at risk’ in relation to their shareholding.
298 2014 Westpac Group Annual Report

Shareholding information Gain or loss on disposition of shares Generally, any profit made by a resident shareholder on disposal of shares will be subject to capital gains tax. However, if the shareholder is regarded as a trader or speculator, or carries on a business of investing for profit, any profits may be taxed as ordinary income.
A discount may be available on capital gains on shares held for 12 months or more by individuals, trusts or complying superannuation entities. The discount is one half for individuals and trusts, and one third for complying superannuation entities. Companies are not eligible for the capital gains tax discount. For shares acquired prior to 21 September 1999, an alternative basis of calculation of the capital gain may be available which allows the use of an indexation formula.
Normal rates of income tax would apply to capital gains so calculated. Any capital loss can only be offset against capital gains. Excess capital losses can be carried forward for offset against future capital gains.
Generally, subject to two exceptions, a non-resident disposing of shares in an Australian public company who holds those shares on capital account will be free from income tax in Australia. The main exceptions are: shares held as part of a trade or business conducted
through a permanent establishment in Australia. In such a case, any profit on disposal would be assessable to tax. Losses may give rise to capital losses or be otherwise deductible; and
shares held in public companies where the shareholder and its associates have held at the time of disposal (or at least 12 months in the 24 months prior to disposal) a holding of 10% or more in the company and more than 50% of the company’s assets are represented by interests in Australian real property (which is unlikely to be the case for Westpac). In such a case, capital gains tax would apply.
United States taxation The following discussion is a summary of certain US federal income tax implications of the ownership and disposition of ordinary shares (including ADS) by US holders (as defined below) that hold the ordinary shares as capital assets. This discussion is based on the US Internal Revenue Code of 1986, as amended, its legislative history, existing and proposed regulations, published rulings and court decisions, and the Tax Treaty, all as currently in effect and all of which are subject to change, possibly on a retroactive basis. This discussion is intended only as a descriptive summary. It does not purport to be a complete analysis of all the potential US federal income tax consequences of owning and disposing of ordinary shares and does not address US federal income tax considerations that may be relevant to US holders subject to special treatment under US federal income tax law (such as banks, insurance companies, real estate investment trusts, regulated investment companies, dealers in securities, tax-exempt entities, retirement plans, certain former citizens or residents of the US, persons holding ordinary shares as part of a straddle, hedge, conversion transaction or other integrated investment, persons that have a ‘functional currency’ other than the US dollar, persons that own 10% or more (by voting power) of our stock, persons that generally mark their securities to market for US federal income tax purposes or persons that receive ordinary shares as compensation). As this is a complex area, we recommend investors consult their own tax advisers concerning the US federal, state and/or local implications of owning and disposing of ordinary shares. For the purposes of this discussion you are a US holder if you are a beneficial owner of ordinary shares and you are for US federal income tax purposes:
an individual that is a citizen or resident of the US; a corporation created or organised in or under the laws of
the US or any state thereof or the District of Columbia; an estate, the income of which is subject to US federal
income taxation regardless of its source; or a trust, if a US court can exercise primary supervision
over the trust’s administration and one or more US persons are authorised to control all substantial decisions of the trust, or certain electing trusts that were in existence on 19 August 1996 and were treated as domestic trusts on that date.
If an entity treated as a partnership for US federal income tax purposes owns the ordinary shares, the US federal income tax implications of the ownership and disposition of ordinary shares will generally depend upon the status and activities of such partnership and its partners. Such an entity should consult its own tax adviser concerning the US federal income tax implications to it and its partners of owning and disposing of ordinary shares.
2014 Westpac Group Annual Report 299

Taxation of dividends If you are a US holder, you must include in your income as a dividend, the gross amount of any distributions paid by us out of our current or accumulated earnings and profits (as determined for US federal income tax purposes) without reduction for any Australian tax withheld from such distribution. If you are a non-corporate US holder, dividends paid to you that constitute qualified dividend income may be taxable to you at a preferential tax rate so long as certain holding period and other requirements are met. Dividends we pay with respect to the ordinary shares generally will be qualified dividend income. Each non-corporate US holder should consult their own tax advisor regarding the possible applicability of the reduced tax rate and the related restrictions and special rules.
Dividends paid by us constitute ordinary income that must generally be included in income when actually or constructively received. Such dividends will not be eligible for the dividends-received deduction generally allowed to corporate shareholders with respect to dividends received from US corporations. The amount of the dividend that you must include in your income as a US holder will be the US dollar value of the Australian dollar payments made, determined at the spot Australian dollar/US dollar rate on the date the dividend distribution is included in your income, regardless of whether the payment is in fact converted into US dollars. Generally, any gain or loss resulting from currency exchange fluctuations during the period from the date you include the dividend payment in income to the date you convert the payment into US dollars will be treated as ordinary income or loss and will not be eligible for the special tax rate applicable to qualified dividend income. This gain or loss generally will be income from sources within the US for foreign tax credit limitation purposes. Distributions on an ordinary share in excess of current and accumulated earnings and profits, as determined for US federal income tax purposes, will be treated as a non-taxable return of capital to the extent of your basis in such ordinary share and thereafter as capital gain.
Subject to certain limitations, Australian tax withheld in accordance with the Tax Treaty and paid over to Australia may be claimed as a foreign tax credit against your US federal income tax liability. Special rules apply in determining the foreign tax credit limitation with respect to dividends that are subject to a preferential tax rate. A US holder that does not elect to claim a US foreign tax credit for Australian income tax withheld may instead claim a deduction for such withheld tax, but only for a taxable year in which the US holder elects to do so with respect to all non-US income taxes paid or accrued in such taxable year.
Dividends paid by us generally will be income from sources outside the US for foreign tax credit limitation purposes. Under the foreign tax credit rules, dividends will, depending on your circumstances, be ‘passive category’ or ‘general category’ income for purposes of computing the foreign tax credit.
The rules relating to US foreign tax credits are very complex, and each US holder should consult its own tax adviser regarding the application of such rules.
Taxation of capital gains If you sell or otherwise dispose of your ordinary shares, you will generally recognise a capital gain or loss for US federal income tax purposes equal to the difference between the US dollar value of the amount that you realise and your tax basis, determined in US dollars, in your ordinary shares. A capital gain of a non-corporate US holder is generally taxed at a reduced rate if the holder has a holding period greater than one year. The deductibility of capital losses is subject to limitations. Such capital gain or loss generally will be income from sources within the US, for foreign tax credit limitation purposes.
Medicare tax In addition to regular US federal income tax, certain US holders that are individuals, estates or trusts are subject to a 3.8% tax on all or a portion of their ‘net investment income’, which may include all or a portion of their dividend income and net gain from the sale, exchange or other disposition of their ordinary shares.
Passive foreign investment company considerations We believe that we will not be treated as a passive foreign investment company (PFIC) for US federal income tax purposes, and this discussion assumes we are not a PFIC. However, the determination as to whether we are a PFIC is made annually at the end of each taxable year and therefore could change. If we were to be treated as a PFIC, a US holder of ordinary shares could be subject to certain adverse tax consequences.
Disclosure requirements for specified foreign financial assets Individual US holders (and certain US entities specified in US Internal Revenue Service (IRS) guidance) who, during any taxable year, hold any interest in any specified foreign financial asset, generally will be required to file with their US federal income tax returns certain information on IRS Form 8938 if the aggregate value of all such assets exceeds certain specified amounts. ‘Specified foreign financial asset’ generally includes any financial account maintained with a non-US financial institution and may also include the ordinary shares if they are not held in an account maintained with a financial institution. Substantial penalties may be imposed, and the period of limitations on assessment and collection of US federal income taxes may be extended, in the event of a failure to comply. US holders should consult their own tax advisers as to the possible application to them of this filing requirement.
Information reporting and backup withholding Under certain circumstances, information reporting and/or backup withholding may apply to US holders with respect to payments on or the proceeds from the sale, exchange or other disposition of the ordinary shares, unless an applicable exemption is satisfied.
Backup withholding is not an additional tax. Any amounts withheld under the backup withholding rules generally will be allowed as a refund or credit against a US holder’s US federal income tax liability if the required information is furnished by the US holder on a timely basis to the IRS.
300 2014 Westpac Group Annual Report

Additional information Our constitution Overview We were incorporated in 1850 under the Bank of New South Wales Act, a special piece of legislation passed by the New South Wales Parliament at a time when there was no general companies’ legislation in Australia. On 23 August 2002, Westpac became registered under the Corporations Act 2001 (Cth) as a public company limited by shares.
As part of the process of becoming a company regulated under the Corporations Act, shareholders adopted a new constitution at the AGM on 15 December 2000, which came into operation on 23 August 2002. Our constitution has been subsequently amended by shareholders on 15 December 2005, 13 December 2007 and 13 December 2012.
Our objects and purposes Our constitution does not contain a statement of our objects and purposes. As a company regulated by the Corporations Act, we have the legal capacity and powers of an individual both within and outside Australia, and all the powers of a body corporate, including the power to issue and cancel shares, to issue debentures, to distribute our property among our equity holders (either in kind or otherwise), to give security by charging our uncalled capital, to grant a floating charge over our property and to do any other act permitted by any law.
Directors’ voting powers Under clause 9.11(a) of our constitution, subject to complying with the Corporations Act regarding disclosure of and voting on matters involving material personal interests, our Directors may:
a. hold any office or place of profit in our company, except that of auditor;
b. hold any office or place of profit in any other company, body corporate, trust or entity promoted by our company or in which it has an interest of any kind;
c. enter into any contract or arrangement with our company;
d. participate in any association, institution, fund, trust or scheme for past or present employees or directors of our company or persons dependent on or connected with them;
e. act in a professional capacity (or be a member of a firm that acts in a professional capacity) for our company, except as auditor; and
f. participate in, vote on and be counted in a quorum for any meeting, resolution or decision of the Directors and be present at any meeting where any matter is being considered by the Directors.
Under clause 9.11(b) of our constitution, a Director may do any of the above despite the fiduciary relationship of the Director’s office:
a. without any liability to account to our company for any direct or indirect benefit accruing to the Director; and
b. without affecting the validity of any contract or arrangement.
Under the Corporations Act, however, a Director who has a material personal interest in any matter to be considered at any Board meeting must not be present while the matter is being considered or vote on the matter, unless the other Directors resolve to allow that Director to be present and vote or a declaration is made by ASIC permitting that Director to participate and vote. These restrictions do not apply to a limited range of matters set out in section 191(2) of the Corporations Act, where the Director’s interest:
a. arises because the Director is a shareholder of the company in common with other shareholders;
b. arises in relation to the Director’s remuneration as a Director of the company;
c. relates to a contract the company is proposing to enter into that is subject to shareholder approval and will not impose obligations on the company if not approved by shareholders;
d. arises merely because the Director is a guarantor or has given an indemnity or security for all or part of a loan (or proposed loan) to the company;
e. arises merely because the Director has a right of subrogation in relation to a guarantee or indemnity referred to in (d);
f. relates to a contract that insures, or would insure, the Director against liabilities the Director incurs as an officer of the company (but only if the contract does not make the company or related body corporate the insurer);
g. relates to any payment by the company or a related body corporate in respect of certain indemnities permitted by the Corporations Act or any contract relating to such an indemnity; or
h. is in a contract or proposed contract with, or for the benefit of, or on behalf of, a related body corporate and arises merely because the Director is a Director of that related body corporate.
If there are not enough Directors to form a quorum for the Board meeting because of Directors’ interests in a particular matter, a general meeting for shareholders may be called to consider the matter and interested Directors are entitled to vote on any proposal to requisition such a meeting.
Under clause 9.7 of our constitution, the maximum aggregate amount of annual remuneration to be paid to our Non-executive Directors must be approved by our shareholders. This aggregate amount is paid to the Non-executive Directors in such manner as the Board from time to time determines. Directors’ remuneration is one of the exceptions under section 191 of the Corporations Act to the prohibitions against being present and voting on any matter in which a Director has a material personal interest.
2014 Westpac Group Annual Report 301

Directors’ borrowing powers Clause 10.2 of our constitution empowers our Directors, as a Board, to exercise all the powers of Westpac to borrow or raise money, to charge any property or business of Westpac or all or any of its uncalled capital and to issue debentures or give any other security for a debt, liability or obligation of Westpac or of any other person. Such powers may only be changed by amending the constitution, which requires a special resolution (that is, a resolution passed by at least 75% of the votes cast by members entitled to vote on the resolution and for which notice has been given in accordance with the Corporations Act).
Minimum number of Directors Our constitution requires that the minimum number of Directors is determined in accordance with the Corporations Act or other regulations. Currently the Corporations Act prescribes three as a minimum number of Directors and APRA governance standards specify five as the minimum number of Directors for APRA regulated entities. Westpac’s current number of Directors is above these prescribed minimums.
Share rights The rights attaching to our ordinary shares are set out in the Corporations Act and in our constitution, and may be summarised as follows:
a) Profits and dividends Holders of ordinary shares are entitled to receive such dividends on those shares as may be determined by our Directors from time to time. Dividends that are paid but not claimed may be invested by our Directors for the benefit of Westpac until required to be dealt with in accordance with any law relating to unclaimed monies.
Our constitution requires that dividends be paid out of our profits. In addition, under the Corporations Act, Westpac must not pay a dividend unless our assets exceed our liabilities immediately before the dividend is declared and the excess is sufficient for payment of the dividend. In addition, the payment must be fair and reasonable to the company’s shareholders and must not materially prejudice our ability to pay our creditors.
Subject to the Corporations Act, the constitution, the rights of persons (if any) entitled to shares with special rights to dividend and any contrary terms of issue of or applying to any shares, our Directors may determine that a dividend is payable, fix the amount and the time for payment and authorise the payment or crediting by Westpac to, or at the direction of, each shareholder entitled to that dividend.
If any dividends are returned unclaimed, we are generally obliged, under the Banking Act 1959 (Cth), to hold those amounts as unclaimed monies for a period of three years. If at the end of that period the monies remain unclaimed by the shareholder concerned, we must submit an annual unclaimed money return to the Australian Securities and Investment Commission by 31 March each year containing the unclaimed money as at 31 December of the previous year. Upon such payment being made, we are discharged from further liability in respect of that amount.
Our Directors may, before paying any dividend, set aside out of our profits such sums as they think proper as reserves, to be applied, at the discretion of our Directors, for any purpose for which the profits may be properly applied. Our Directors may carry forward so much of the profits remaining as they consider ought not to be distributed as dividends without transferring those profits to a reserve.
The following restrictions apply to our ability to declare and/or pay dividends:
(i) if the payment of the dividend would breach or cause a breach by us of applicable capital adequacy or other supervisory requirements of APRA. Currently, one such requirement is that a dividend should not be paid without APRA’s prior consent if payment of that dividend, after taking into account all other dividends (if any) paid on our shares and payments on more senior capital instruments, in the preceding 12 consecutive months to which they relate, would cause the aggregate of such dividend payments to exceed our after tax earnings for the preceding 12 consecutive months, as reflected in our relevant audited consolidated financial statements; and
(ii) if, under the Banking Act 1959 (Cth), we are directed by APRA not to pay a dividend;
(iii) if the declaration or payment of the dividend would result in us becoming insolvent; or
(iv) if any interest payment, dividend, redemption payment or other distribution on certain Additional Tier 1 securities issued by the Group is not paid in accordance with the terms of those securities, we may be restricted from declaring and/or paying dividends on ordinary shares (and certain Additional Tier 1 securities). This restriction is subject to a number of exceptions.
b) Voting rights Holders of our fully paid ordinary shares have, at general meetings (including special general meetings), one vote on a show of hands and, upon a poll, one vote for each fully paid share held by them.
c) Voting and re-election of Directors Under our constitution, at each AGM one-third of eligible Directors (or if their number is not a multiple of three, the number nearest to one-third) and any other Director who has held office for three years or more since the Director’s last election, must retire from office. In determining the number of Directors to retire, no account is to be taken of a Director who holds office in order to fill a casual vacancy or the Managing Director. A retiring Director holds office until the conclusion of the meeting at which that Director retires but is eligible for re-election at the meeting.
Under the ASX Listing Rules, no Executive or Non-executive Director of a listed entity, apart from the Managing Director, may continue to hold office, without offering himself or herself for re-election, past the third AGM following their appointment or three years, whichever is the longer.
302 2014 Westpac Group Annual Report

Additional information Under the Corporations Act, the election or re-election of each Director by shareholders at a general meeting of a public company must proceed as a separate item, unless the shareholders first resolve that the elections or re-elections may be voted on collectively. A resolution to allow collective voting in relation to elections or re-elections is effective only if no votes are cast against that resolution. Any resolution electing or re-electing two or more Directors in contravention of this requirement is void.
d) Winding up Subject to any preferential entitlement of holders of preference shares on issue at the relevant time, holders of our ordinary shares are entitled to share equally in any surplus assets if we are wound up.
e) Sinking fund provisions We do not have any class of shares on issue that is subject to any sinking fund provisions.
Variation of rights attaching to our shares Under the Corporations Act, unless otherwise provided by the terms of issue of a class of shares, the terms of issue of a class of shares in Westpac can only be varied or cancelled in any way by a special resolution of Westpac and with either the written consent of our shareholders holding at least three quarters of the votes in that class of shares or with the sanction of a special resolution passed at a separate meeting of the holders of that class of shares.
Convening general meetings Under our constitution, our Directors may convene and arrange to hold a general meeting of Westpac whenever they think fit and must do so if required to do so under the Corporations Act and ASX Listing Rules. Under the Corporations Act, our Directors must call and arrange to hold a general meeting of Westpac if requested to do so by our shareholders who hold at least 5% of the votes that may be cast at the general meeting or 100 shareholders entitled to vote at the meeting. Shareholders who hold at least 5% of the votes that may be cast at a general meeting may also call and arrange to hold a general meeting of Westpac at their own expense.
At least 28 days notice must be given of a meeting of our shareholders. Written notice must be given to all shareholders entitled to attend and vote at the meeting. All ordinary shareholders are entitled to attend and, subject to the constitution and the Corporations Act, to vote at general meetings of Westpac.
Limitations on securities ownership A number of limitations apply in relation to the ownership of our shares, and these are more fully described in the section ‘Limitations affecting security holders’.
Change in control restrictions Restrictions apply under the Corporations Act, the Financial Sector (Shareholdings) Act 1998 (Cth) and the Foreign Acquisitions and Takeovers Act 1975 (Cth).
For more detailed descriptions of these restrictions, refer to the sections ‘Limitations affecting security holders’, Foreign Acquisitions and Takeovers Act 1975, Financial Sector (Shareholdings) Act 1998, and Corporations Act 2001.
Substantial shareholder disclosure There is no provision in our constitution that requires a shareholder to disclose the extent of their ownership of our shares.
Under the Corporations Act, however, any person who begins or ceases to have a substantial holding of our shares must notify us within two business days after they become aware of that information. A further notice must be given to us if there is an increase or decrease of 1% in a person’s substantial holding. Copies of these notices must also be given to the ASX. A person has a substantial holding of our shares if the total votes attached to our voting shares in which they or their associates have relevant interests is 5% or more of the total number of votes attached to all our voting shares. For more details, refer to the section ‘Corporations Act 2001’.
We also have a statutory right under the Corporations Act to trace the beneficial ownership of our shares by giving a direction to a shareholder, or certain other persons, requiring disclosure to us of, among other things, their own relevant interest in our shares and the name and address of each other person who has a relevant interest in those shares, the nature and extent of that interest and the circumstances that gave rise to that other person’s interest. Such disclosure must, except in certain limited circumstances, be provided within two business days after the direction is received.
Australian Company and Business Numbers All Australian companies have a unique nine-digit identifier, referred to as an Australian Company Number (ACN), which must be included on public documents, eligible negotiable instruments and the company’s common seal. In addition, entities can apply for registration on the Australian Business Register and be allocated a unique eleven-digit identifier known as an Australian Business Number (ABN). For Australian companies, the last nine digits of their ABN are identical to their ACN. The ABN may be quoted on documents in lieu of the ACN.
Our ACN is 007 457 141 and our ABN is 33 007 457 141.
Documents on display We are subject to the disclosure requirements of the US Securities Exchange Act of 1934, as amended. In accordance with these requirements, we file Annual Reports with, and furnish other information to, the United States SEC. These materials and other information furnished by us may be inspected and copied at the SEC's Conventional and Electronic Reading Room at 100 F Street, N.E., Room 1580, Washington, D.C. 20549 at prescribed rates. The public may obtain information on the operation of the SEC’s Conventional and Electronic Reading Room by calling the SEC in the United States at 1-800-SEC-0330. The SEC also maintains a website at www.sec.gov that contains reports, proxy statements and other information regarding registrants that file electronically with the SEC. Since April 2002, we have filed our reports on Form 20-F and have furnished other information to the SEC in electronic format which may be accessed through this website.
2014 Westpac Group Annual Report 303

Exchange rates For each of the years indicated, the high, low, average and year-end noon buying rates1 for Australian dollars were:
Year Ended 30 September2015² 2014 2013 2012 2011 2010
(US$ per A$1.00)High 0.8812 0.9705 1.0579 1.0806 1.1026 0.9714Low 0.8675 0.8715 0.8901 0.9453 0.9594 0.8172Average3 n/a 0.9155 0.9885 1.0371 1.0318 0.9003Close (on 30 September)4 n/a 0.8737 0.9342 1.0388 0.9744 0.9640
For each of the months indicated, the high and low noon buying rates for Australian dollars were:
MonthOctober September August July June May
2014² 2014 2014 2014 2014 2014(US$ per A$1.00)
High 0.8812 0.9376 0.9352 0.9488 0.9430 0.9382Low 0.8675 0.8737 0.9263 0.9301 0.9250 0.9215
1 The noon buying rate in New York City for cable transfers in Australian dollars as certified for customs purposes by the Federal Reserve Bank of New York.
2 Through to 24 October 2014. On 24 October 2014, the noon buying rate was A$1.00 = US$0.8812. 3 The average is calculated by using the average of the exchange rates on the last day of each month during the period. 4 The noon buying rate at such date may differ from the rate used in the preparation of our consolidated financial statements at such date. Refer to
Note 1(a)(vi) to the financial statements.
304 2014 Westpac Group Annual Report

Information for shareholders
Financial calendarWestpac Ordinary Shares (ASX code: WBC) Record date for final dividend 12 November 20141
Annual General Meeting 12 December 2014
Final dividend payable 19 December 2014
Financial Half Year end 31 March 2015
Interim results and dividend announcement 4 May 2015
Ex-dividend date for interim dividend 13 May 20153
Record date for interim dividend 15 May 20152,3
Interim dividend payable 2 July 20153
Financial Year end 30 September 2015
Final results and dividend announcement 2 November 2015
Ex-dividend date for final dividend 11 November 20154,7
Record date for final dividend 13 November 20155,7
Annual General Meeting 11 December 20156
Final dividend payable 21 December 20157 1 Record date for 2014 final dividend in New York – 10 November 2014. 2 Record date for 2015 interim dividend in New York – 14 May 2015. 3 Dates will be confirmed at the time of announcing the 2015 interim results. 4 Ex-dividend date for 2015 final dividend in New York –
10 November 2015. 5 Record date for 2015 final dividend in New York – 12 November 2015. 6 Details regarding the location of this meeting and the business to be dealt
with will be contained in the separate Notice of Meeting sent to shareholders in November 2015.
7 Dates will be confirmed at the time of announcing the 2015 final results.
Westpac Convertible Preference Shares (ASX Code: WBCPC) Record date for semi-annual dividend 23 March 2015
Payment date for semi-annual dividend 31 March 2015
Record date for semi-annual dividend 22 September 2015
Payment date for semi-annual dividend 30 September 2015
Westpac Capital Notes (ASX code: WBCPD) Record date for quarterly distribution 27 February 2015
Payment date for quarterly distribution 10 March 2015*
Record date for quarterly distribution 29 May 2015
Payment date for quarterly distribution 9 June 2015*
Record date for quarterly distribution 31 August 2015
Payment date for quarterly distribution 8 September 2015
Record date for quarterly distribution 30 November 2015
Payment date for quarterly distribution 8 December 2015
Westpac Capital Notes 2 (ASX Code: WBCPE) Record date for quarterly distribution 13 March 2015
Payment date for quarterly distribution 23 March 2015
Record date for quarterly distribution 15 June 2015
Payment date for quarterly distribution 23 June 2015
Record date for quarterly distribution 15 September 2015
Payment date for quarterly distribution 23 September 2015
Record date for quarterly distribution 15 December 2015
Payment date for quarterly distribution 23 December 2015
Westpac Subordinated Notes (ASX code: WBCHA) Record date for quarterly interest payment 13 February 2015
Payment date for quarterly interest payment
23 February 2015
Record date for quarterly interest payment 15 May 2015
Payment date for quarterly interest payment
25 May 2015*
Record date for quarterly interest payment 14 August 2015
Payment date for quarterly interest payment
24 August 2015*
Record date for quarterly interest payment 13 November 2015
Payment date for quarterly interest payment
23 November 2015
Westpac Subordinated Notes II (ASX code: WBCHB) Record date for quarterly interest payment 13 February 2015
Payment date for quarterly interest payment
23 February 2015*
Record date for quarterly interest payment 14 May 2015
Payment date for quarterly interest payment
22 May 2015
Record date for quarterly interest payment 14 August 2015
Payment date for quarterly interest payment
24 August 2015*
Record date for quarterly interest payment 13 November 2015
Payment date for quarterly interest payment
23 November 2015*
* Next business day when a payment date falls on a non-business day.
Annual General Meeting The Westpac Annual General Meeting (AGM) will be held in the Plaza Ballroom at the Brisbane Convention and Exhibition Centre, corner of Merivale Street and Glenelg Street, South Bank, Brisbane, on Friday, 12 December 2014, commencing at 10:00 am (Brisbane time). The AGM will be webcast live on the internet at www.westpac.com.au/investorcentre and an archived version of the webcast will be placed on the website to enable the AGM proceedings to be viewed at a later time.
2014 Westpac Group Annual Report 305

Useful information Key sources of information for shareholders We report our full year performance to shareholders, in late October or early November, in two forms: an Annual Review and Sustainability Report, and an Annual Report. We also report half-yearly to shareholders via a newsletter, in conjunction with the dividend payments in July and December.
Electronic communications Shareholders can elect to receive the following communications electronically: Annual Review and Annual Report; Dividend statements when paid by direct credit or via
Westpac’s Dividend Reinvestment Plan (DRP); Notices of Meetings and proxy forms; and Shareholder Newsletters and major company
announcements. Shareholders who wish to register their email address should go to www.westpac.com.au/investorcentre and click on ‘Register your email’ under ‘Shareholder News’, or contact the Westpac share Registrar. For Registrar contact details see opposite.
Online information
Australia Westpac’s internet site www.westpac.com.au provides information for shareholders and customers, including: access to internet banking and online investing services; details on Westpac’s products and services; company history, results, economic updates, market
releases and news; and corporate responsibility and Westpac in the community
activities. Investors can short cut to the Investor Centre at www.westpac.com.au/investorcentre. The Centre includes the current Westpac share price and charting, and links to the latest ASX announcements and Westpac’s share Registrars’ websites. New Zealand Westpac’s New Zealand internet site www.westpac.co.nz provides: access to internet banking services; details on products and services, including a
comprehensive home buying guide; economic updates, news and information, key financial
results; and sponsorships and other community activities.
Stock exchange listings Westpac ordinary shares are listed on: Australian Securities Exchange, (code WBC); New York Stock Exchange (NYSE), as American
Depositary Shares, (code WBK); and New Zealand Exchange Limited, (code WBC).
Westpac Investor Relations Information other than that relating to your shareholding can be obtained from: Westpac Investor Relations Level 20, 275 Kent Street Sydney NSW 2000 Australia Telephone: +61 2 8253 3143 Facsimile: +61 2 8253 1207 Email: [email protected]
Share registrars For information about your shareholding or to notify a change of address etc., you should contact the appropriate share Registrar. Please note that, in Australia, broker sponsored holders are required to contact their broker to amend their address. Australia – Ordinary shares on the main register Link Market Services Limited Level 12, 680 George Street Sydney NSW 2000 Postal address: Locked Bag A6015, Sydney South NSW 1235 Website: www.linkmarketservices.com.au
Shareholder enquiries: Telephone: 1800 804 255 (toll free within Australia) International: +61 1800 804 255 Facsimile: +61 2 9287 0303 Email: [email protected]
New Zealand – Ordinary shares on the New Zealand branch register Link Market Services Limited Level 7, Zurich House 21 Queens Street Auckland 1010, New Zealand Postal address: P.O. Box 91976, Auckland 1142, New Zealand Website: www.linkmarketservices.co.nz
Shareholder enquiries: Telephone: 0800 002 727 (toll free within New Zealand) International: +64 9 375 5998 Facsimile: +64 9 375 5990 Email: [email protected]
Depositary in USA for American Depositary Shares (ADS) 1 Listed on New York Stock Exchange (code WBK - CUSIP 961214301) The Bank of New York Mellon PO Box 358516 Pittsburgh, PA 15252-8516, USA
ADS holder enquiries: Telephone: 1-888-BNY-ADRS (1-888-269-2377) (toll free number for domestic callers) International: +1 201 680 6825 Email: [email protected] Website: www.bnymellon.com/shareowner
1 Each ADS represents one fully paid ordinary share.
306 2014 Westpac Group Annual Report

Glossary of abbreviations and defined terms 6MMA Six month moving average AAS Australian Accounting Standards AASB Australian Accounting Standards Board ABN Australian Business Number ABS Asset-backed securities ACCC Australian Competition and Consumer
Commission ACN Australian Company Number ADI Authorised Deposit-taking Institution ADRs American Depositary Receipts ADS American Depositary Shares AFS Australian Financial Services AGAAP Australian Generally Accepted Accounting
Principles AGM Annual General Meeting AIRB Advanced Internal Ratings Based ALCO Westpac Group Asset & Liability Committee ALM Asset and Liability Management AMA Advanced Measurement Approach ANZSIC Australian and New Zealand Standard
Industrial Classification APRA Australian Prudential Regulation Authority APS Australian Prudential Standard ASIC Australian Securities and Investments
Commission ASX Australian Securities Exchange ASXCGC ASX Limited’s Corporate Governance Council ATMs Automatic teller machines ATO Australian Taxation Office AUSTRAC Australian Transaction Reports and Analysis
Centre AUD Australian dollar BAC Board Audit Committee BCBS Basel Committee on Banking Supervision BankSA Bank of South Australia BBSW Bank Bills Swap Rate BOSI BOS International Australia Limited bps Basis points BRCC Board Risk and Compliance Committee BTFG BT Financial Group Australia BTIM BT Investment Management Limited Business customer Source: DBM Consultants Business Financial satisfaction Services Monitor, September 2014, 6MMA. MFI customers, all businesses. The Customer Satisfaction score is an average of customer satisfaction ratings of the customer’s MFI for business banking on a scale of 0 to 10 (0 means ‘extremely dissatisfied’ and 10 means ‘extremely satisfied’) CAD Canadian dollar CAPs Collectively assessed provisions Capital Trust III Westpac Capital Trust III Capital Trust IV Westpac Capital Trust IV Cash EPS Cash earnings per share Cash EPS CAGR Compound Annual Growth in Cash EPS CCCFA Credit Contracts and Consumer Finance
Act 2003 CCE Commodity, Carbon and Energy trading CDO Collateralised debt obligations
CDS Credit default swap CEO Chief Executive Officer CEOPP Chief Executive Officer Performance Plan CEO RSP Chief Executive Officer Restricted Share Plan CFAL Capital Finance Australia Limited CFO Chief Financial Officer CFTC Commodity Futures Trading Commission CGU Cash-Generating Unit CHF Swiss franc CLF Committed Liquidity Facility CLO Collateralised loan obligations Corporations Act Australian Corporations Act 2001 COSO Committee of Sponsoring Organizations of the
Treadway Commission CPM Credit Portfolio Management CRG Customer Risk Grade CRO Chief Risk Officer Customer satisfaction Source: Roy Morgan Research, September
2014. 6MMA. MFI as defined by the customer. Satisfaction ratings are based on the relationship with the financial institution. Customers must have at least a Deposit/Transaction account relationship with the institution and are aged 14 or over. Satisfaction is the percentage of customers who answered ‘Very’ or ‘Fairly satisfied’ with their overall relationship with their MFI
CVA Credit valuation adjustment DFAT Department of Foreign Affairs and Trade Dodd-Frank Act Dodd-Frank Wall Street Reform and
Consumer Protection Act DRP Dividend Reinvestment Plan D-SIBS Domestic Systemically Important Banks DVA Debit valuation adjustment EAD Exposure at default EEO Act Energy Efficiency Opportunities Act 2006 (Cth) EFTPOS Electronic Funds Transfer Point Of Sale EMIR European Market Infrastructure Regulations EPS Earnings per share ESC Energy Saving Certificate ESG Environmental, social and governance ESP Employee Share Plan ESS Energy Savings Scheme EUR European Union euro FATCA Foreign Account Tax Compliance Act FCS Financial Claims Scheme FFIs Foreign Financial Institutions FMCA Financial Markets Conduct Act FMTR Financial Markets and Treasury Risk FOFA Future of Financial Advice FSB Financial Stability Board FTE Full time equivalent employees FUA Funds under administration FUM Funds under management Funding Trust III Tavarua Funding Trust III Funding Trust IV Tavarua Funding Trust IV FX Foreign Exchange GBP British pound
2014 Westpac Group Annual Report 307

GHG Greenhouse gas G-SIBS Global Systemically Important Banks Hastings Hastings Funds Management Limited HKD Hong Kong dollar IAPs Individually Assessed Provisions IASB International Accounting Standards Board IBA US International Banking Act of 1978 ICAA Institute of Chartered Accountants in Australia ICAAP Internal Capital Adequacy Assessment
Process IFRS International Financial Reporting Standards IGA Intergovernmental Agreement IRS Internal Revenue Service IOSCO International Organization of Securities
Commission IRRBB Interest Rate Risk in the Banking Book IRS Internal Revenue Service ISDA International Swaps and Derivatives
Association JPY Japanese Yen JOHCM J O Hambro Capital Management KMP Key management personnel LCR Liquidity Coverage Ratio LGD Loss given default LIASB Life Insurance Actuarial Standards Board LIBOR London InterBank Offer Rate LMI Lenders mortgage insurance LTI Long-term incentive LTI Plan Westpac Long Term Incentive Plan LTIFR Lost time injury frequency rate LVR Loan to value ratio MFI Main Financial Institution MiFID II Markets in Financial Instruments Directive Moody’s Moody’s Investors Service NaR Net interest income-at-risk NCOS National Carbon Offset Standard NII Net interest income NOK Norwegian krone NPS Net Promoter Score NSFR Net Stable Funding Ratio NYSE New York Stock Exchange NZ New Zealand NZD New Zealand dollar NZSX New Zealand Stock Exchange NZX New Zealand Exchange OBR Open Bank Resolution OCC Office of the Comptroller of the Currency OFAC Office of Foreign Assets Control OTC Over the counter PD Probability of default PFIC Passive foreign investment company PNG Papua New Guinea PwC PricewaterhouseCoopers RAMS RAMS Home Loans RBA Reserve Bank of Australia RBNZ Reserve Bank of New Zealand
RECs Renewable Energy Certificates RISKCO Westpac Group Executive Risk Committee RMBS Residential Mortgage Backed Securities ROC Westpac Group Remuneration Oversight
Committee RSP Restricted Share Plan S&P Standard & Poor’s SCF Structured Commodities Finance SEC US Securities and Exchange Commission SFR Stable Funding Ratio SGD Singapore dollar SIFIs Systemically Important Financial Institutions SME Small to medium enterprises SMSF Self Managed Super Fund SOSPS Senior Officers’ Share Purchase Scheme SOX Sarbanes Oxley Act of 2002 SPS Stapled Preferred Securities SRAs Settlement Residue Auctions SSCM Sustainable Supply Chain Management St.George St.George Banking Group STI Short-term incentive The Group Westpac Banking Corporation Group TOFA Taxation of financial arrangements rules
contained in the Tax Laws Amendment (Taxation of Financial Arrangements) Act 2009
2003 TPS Trust Preferred Securities 2003 2004 TPS Trust Preferred Securities 2004 2006 TPS Trust Preferred Securities 2006 TSR Total Shareholder Return UKSS UK Staff Superannuation Scheme UNSC United Nations Security Council US United States USD American dollar US Federal Reserve US Federal Reserve System VaR Value at Risk WBC Westpac Banking Corporation Westpac CN Westpac Capital Notes Westpac CPS Westpac Convertible Preference Shares Westpac ranking Refers to Westpac RBB’s position relative to
the other three major Australian banks (CBA, NAB, and ANZ). SBG ranking: refers to St.George Banking Group’s position relative to the four major Australian banks (Westpac, CBA, NAB and ANZ)
WGP Westpac Group Plan Westpac RBB Westpac Retail & Business Banking Westpac SN II Westpac Subordinated Notes II WHS Workplace Health and Safety WIB Westpac Institutional Bank WNZL Westpac New Zealand Limited WNZS Westpac New Zealand Superannuation
Scheme WPP Westpac Performance Plan WRP Westpac Reward Plan WSNZL Westpac Securities NZ Limited WNZSHL Westpac NZ Securitisation Holdings Limited ZAR South African rand
308 2014 Westpac Group Annual Report

Notes
2014 Westpac Group Annual Report 309

Notes
310 2014 Westpac Group Annual Report

Notes
2014 Westpac Group Annual Report 311

Notes
312 2014 Westpac Group Annual Report

Westpac Pacifi c Telephone 132 032From outside Australia�+61 2 9293 9270Facsimile +61 2 8253 1193Email�[email protected] www.westpac.com.au/pacifi c
PACIFIC BANKING LOCATIONSCook Islands — Rarotonga Fiji — Suva Papua New Guinea — Port Moresby Samoa — Apia Solomon Islands — Honiara Tonga — Nuku’alofa Vanuatu — Port Vila
GLOBAL LOCATIONSSpecifi c contact details for the many locations globally can be located on our website at www.westpac.com.au Select About Westpac from the top menu bar, then Global Locations from the Explore menu.
SHARE REGISTRARLink Market Services Limited680 George StreetSydney NSW 2000 Australia
Mail Locked Bag A6015 Sydney South NSW 1235
Telephone 1800 804 255Facsimile +61 2 9287 0303Email�[email protected] www.linkmarketservices.com.au
WESTPAC GROUP SUSTAINABILITYFor further information on the Westpac Group’s sustainability policies and performance:
Email�[email protected]/sustainability Telephone +61 2 8254 8488
For information on our compliance with International Agreements, including the United Nations Global Compact and Declaration on Human Rights, contact the General Manager of Group Corporate Aff airs & Sustainability via the above details.
WESTPAC GROUP
HEAD OFFICE275 Kent StreetSydney NSW 2000 Australia
Telephone +61 2 9374 7113Facsimile +61 2 8253 4128International payments +61 2 9806 4032Email�[email protected]/westpacgroup
AUSTRALIAN FINANCIAL SERVICES
Westpac Retail & Business Banking Telephone — Consumer 132 032Telephone — Business 132 142From outside Australia +61 2 9293 9270Email�[email protected]
St.George Bank St.George House 4-16 Montgomery Street Kogarah NSW 2217 Australia
Mail Locked Bag 1 Kogarah NSW 1485 Australia
Telephone +61 2 9236 1111Facsimile +61 2 9952 1000Email�[email protected] www.stgeorge.com.au
Bank of Melbourne Level 8, 530 Collins Street Melbourne VIC 3000 Australia
Telephone 13 22 66From outside Australia�+61 3 9982 4186Facsimile +61 3 9296 4371Email�[email protected]
BankSA 97 King William Street Adelaide SA 5000 Australia
Mail GPO Box 399 Adelaide SA 5001 Australia
Telephone 131 376From outside Australia�+61 2 9553 5233Email�[email protected] www.banksa.com.au
RAMSRAMS Financial Group Pty LtdLevel 7, 17 York Street Sydney NSW 2000 Australia
Mail GPO Box 4008 Sydney NSW 2001 Australia
Telephone +61 2 8218 7000Facsimile +61 2 8218 7171Email�[email protected] www.rams.com.au
BT Financial Group 275 Kent Street Sydney NSW 2000 Australia
Telephone 132 135From outside Australia�+61 2 8222 7154Email�customer.relations@btfi nancialgroup.com www.bt.com.au
Westpac Institutional Bank Telephone 132 032Facsimile +61 2 8254 6938Email�[email protected]
INSTITUTIONAL BANK LOCATIONSHong Kong India — Mumbai People’s Republic of China — Beijing, Shanghai Republic of Indonesia — Jakarta Republic of Singapore — Singapore United States of America — New York United Kingdom — London
EST. 1861
Westpac New Zealand16 Takutai Square Auckland 1010 New Zealand
Telephone +64 9 912 8000Email�[email protected]
The Westpac Group Annual Review and Sustainability Report 2014 is printed on PEFC certifi ed paper. Compliance with the certifi cation criteria set out by the Programme for the Endorsement of the Forest Certifi cation (PEFC) means that the paper fi bre is sourced from sustainable forests.

www.westpac.com.au