2013 m&a activity in the asset management industry asset... · the rising tide 2013 m&a...
TRANSCRIPT
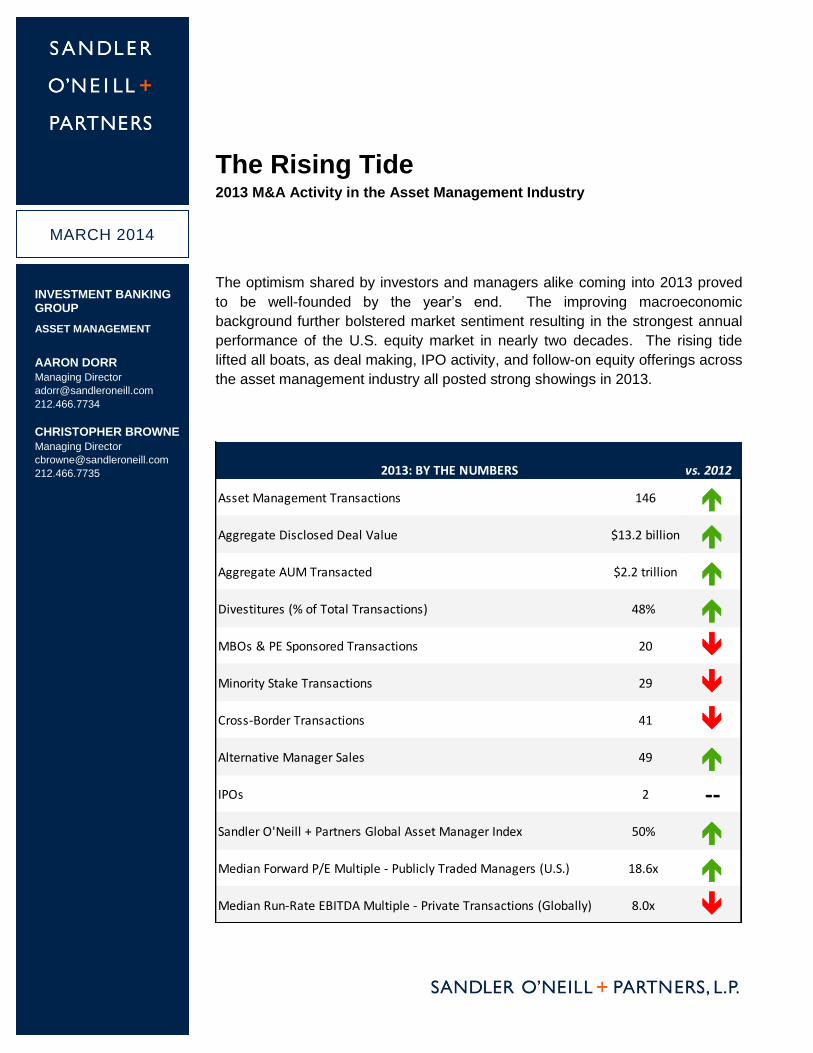
The Rising Tide 2013 M&A Activity in the Asset Management Industry
The optimism shared by investors and managers alike coming into 2013 proved
to be well-founded by the year’s end. The improving macroeconomic
background further bolstered market sentiment resulting in the strongest annual
performance of the U.S. equity market in nearly two decades. The rising tide
lifted all boats, as deal making, IPO activity, and follow-on equity offerings across
the asset management industry all posted strong showings in 2013.
2013: BY THE NUMBERS vs. 2012
Asset Management Transactions 146
Aggregate Disclosed Deal Value $13.2 billion
Aggregate AUM Transacted $2.2 trillion
Divestitures (% of Total Transactions) 48%
MBOs & PE Sponsored Transactions 20
Minority Stake Transactions 29
Cross-Border Transactions 41
Alternative Manager Sales 49
IPOs 2 --
Sandler O'Neill + Partners Global Asset Manager Index 50%
Median Forward P/E Multiple - Publicly Traded Managers (U.S.) 18.6x
Median Run-Rate EBITDA Multiple - Private Transactions (Globally) 8.0x
MARCH 2014
INVESTMENT BANKING GROUP
ASSET MANAGEMENT
AARON DORR
Managing Director
212.466.7734
CHRISTOPHER BROWNE
Managing Director
212.466.7735
page 2 The Ris ing Tide | March 2014
Table of Contents
OVERVIEW .........................................................................................................................4
SELLERS: The Beat Goes On ...........................................................................................9
BUYERS: Seize the Day ................................................................................................. 15
IPOs: Second Time’s a Charm ........................................................................................ 22
PRICING: Running of the Bulls ....................................................................................... 25
CONCLUSIONS: Rowing Downstream ........................................................................... 28
Appendix ........................................................................................................................... 30
General Information and Disclaimers ............................................................................... 33

page 3
Table of Exhibits
EXHIBIT 1: Performance of Major Capital Markets Benchmarks and Financial Sector
Indices, 2013 .......................................................................................................................4
EXHIBIT 2: U.S., European, and Global Mutual Fund Net Flows .......................................5
EXHIBIT 3: Total Number of Transactions and Acquired AUM ...........................................6
EXHIBIT 4: Disclosed Deal Values in Asset Management Deals Worldwide .....................6
EXHIBIT 5: Largest Asset Management Deals by Transacted AUM, 2013 ........................7
EXHIBIT 6: Transaction Activity Involving Independent Sellers ..........................................8
EXHIBIT 7: Geographical Breakdown of Transactions by Acquirer Domicile, 2013 ...........8
EXHIBIT 8: Percentage of Divestitures and Independent Sales .........................................9
EXHIBIT 9: Historical Target Breakdown by Region ........................................................ 11
EXHIBIT 10: Transacted AUM by Target Type ................................................................ 12
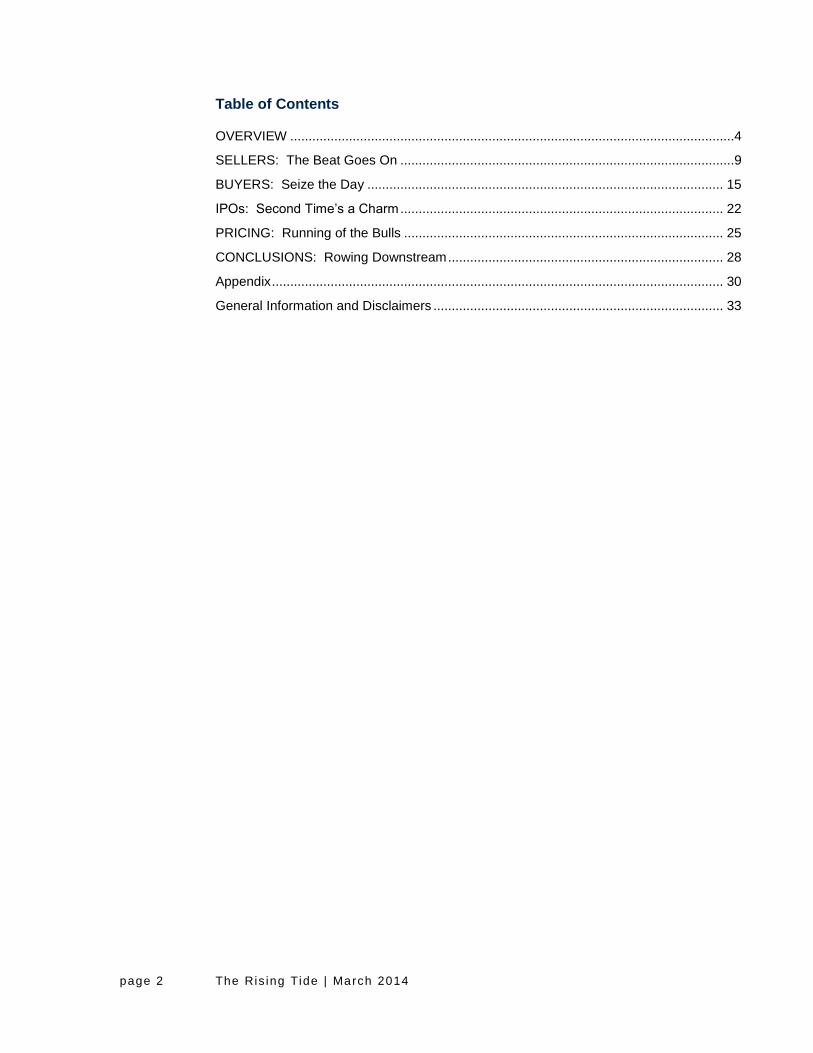
EXHIBIT 11: Historical Transaction Activity Involving Alternative Asset Management
Firms ................................................................................................................................. 13
EXHIBIT 12: Historical Minority Transaction Activity ........................................................ 14
EXHIBIT 13: Number of Asset Management Transactions by AUM Size ........................ 15
EXHIBIT 14: Number of Asset Management Transactions by Acquirer Type ................. 16
EXHIBIT 15: Financial Sponsor Acquisition Activity ......................................................... 18
EXHIBIT 16: Geographical Breakdown of AUM Transacted and of Number of
Transactions by Acquirer Domicile, 2013 ......................................................................... 20
EXHIBIT 17: Historical Cross-Border Transaction Activity ............................................... 21
EXHIBIT 18: U.S. IPO Activity Over Last Two Years ....................................................... 22
EXHIBIT 19: Global Asset Management IPO Activity ...................................................... 23
EXHIBIT 20: U.S. Asset Manager Follow-on Offerings in 2013 ....................................... 24
EXHIBIT 21: Sandler O’Neill’s Global Asset Management Index Performance ............... 25
EXHIBIT 22: Forward Price to Earnings Ratios for U.S. and U.K. Traditional Managers 26
EXHIBIT 23: Median Trading Multiples of Quoted Fund Managers ................................. 26
EXHIBIT 24: Run-Rate EBITDA Multiples of Global Asset Management Trade Sales.... 27
EXHIBIT 25: Stock Performance of the Largest Quoted Fund Managers Worldwide, 2013
.......................................................................................................................................... 30
EXHIBIT 26: Largest Asset Management Deals by Transacted AUM, 2013 ................... 31
EXHIBIT 27: All-Time Largest Asset Management Deals by Transacted AUM ............... 31
EXHIBIT 28: Largest Asset Management Deals by Disclosed Deal Value, 2013 ............ 32
EXHIBIT 29: All-Time Largest Asset Management Deals by Disclosed Deal Value........ 32

page 4 The Ris ing Tide | March 2014
OVERVIEW
Following the positive tone set in 2012, investors found much to be happy about in 2013
as equity markets continued their climb to all-time highs. Global headlines were first
dominated by Ben Bernanke’s introduction of the long-feared tapering of the Fed’s
Quantitative Easing program, only to be displaced in the spotlight by an unprecedented
16-day government shutdown and protracted political battle over the U.S. debt ceiling.
Despite the political drama, global equity markets in the developed nations marched on,
while the Emerging Markets felt the pinch of anticipated tapering of global monetary
stimulus. Following a formidable 16% return in 2012, the S&P 500 Total Return index
posted a 32% return in 2013, the largest annual gain in 16 years. European markets
posted their best showing since 2009 with the Euro STOXX 50 index returning nearly
18%, while emerging markets suffered, with the MSCI Emerging Market Index falling just
over 2% for the year.
The rising tide in the global equity markets and an increased appetite for risk among
investors propelled U.S. financial services stocks to a staggering 51% return in 2013 with
asset managers around the world registering a similar return and U.S. asset managers
besting them both. The Sandler O’Neill U.S. Asset Manager Index1 returned just over
55% in 2013, and the Sandler O’Neill Global Asset Manager Index2 came in just over
50%. While investor flows in 2012 were characterized by a lingering preference for
safety, flows in 2013 showed a return of confidence and the “risk-on” trade, particularly in
the U.S., which saw equity allocations grow significantly.
EXHIBIT 1: Performance of Major Capital Markets Benchmarks and Financial
Sector Indices, 2013
Source: Bloomberg, Capital IQ, Hedge Fund Research, Sandler O’Neill
1 Market capitalization-weighted non-investable index that seeks to reflect the performance of U.S. publicly
traded asset management companies. The index was developed by Sandler O’Neill and currently consists of 31 companies. 2 Market capitalization-weighted non-investable index that seeks to reflect the performance of publicly traded
asset management companies. The index was developed by Sandler O’Neill and currently consists of 63 companies.
55.1%
50.8% 50.4%
32.4% 30.5% 29.6%
17.9% 14.6%
(2.0%)
(10.0%)
0.0%
10.0%
20.0%
30.0%
40.0%
50.0%
60.0%
SOP U.S.Asset Mngr
Index
BloombergU.S. Div
Fin
SOPGlobal
Asset MngrIndex
S&P 500(TR Gross)
Wilshire5000 Total
Market(Full Cap)
MSCIWorld (TR
Gross)Local Cur
EuroSTOXX 50
HFRIComposite
BarclaysCapital
Global Agg
% A
pp
recia
tio
n

page 5
While European investors were less aggressive in 2013 than their U.S. counterparts, their
appetite for money market products decreased and flows were redirected into a mix of
equity products and asset allocation products with equity components.
EXHIBIT 2: U.S., European, and Global Mutual Fund Net Flows
Source: Morningstar Direct
The volume of asset management M&A activity stepped up marginally from the prior
year, with 146 transactions announced in 2013, compared to 142 in 2012. Transacted
AUM was up meaningfully – increasing by 53% over 2012 levels – driven by both capital
markets transactions by larger market players and a handful of large marquee deals.
The latter harkens the return of the transformational transaction and shows a willingness
among buyers to engage in larger and potentially riskier transactions, including cross-
border deals, to levels not seen since before the financial crisis.
$(22)
$261 $292
$(46)
$365 $291
$(62)
$606 $703
$(400)
$(200)
$-
$200
$400
$600
$800
$1,000
2011 2012 2013 2011 2012 2013 2011 2012 2013
Ne
t Flo
ws
($M
illi
on
s)
Equity Fixed Income Allocation Alternative Money Market Unclassified
U.S. Europe Global

page 6 The Ris ing Tide | March 2014
EXHIBIT 3: Total Number of Transactions and Acquired AUM
Note: Includes minority transactions, recapitalizations, IPOs, and follow-ons involving a passive seller.
Source: Sandler O’Neill
The marquee deals in 2013 helped to push disclosed deal value to its highest level in
three years, as buyers of asset management firms spent $13.2 billion of disclosed deal
value, a striking 53% increase from $8.6 billion in 2012.
EXHIBIT 4: Disclosed Deal Values in Asset Management Deals Worldwide
Note: Includes minority transactions, recapitalizations, IPOs, and follow-ons involving a passive seller.
Source: Sandler O’Neill
$570 $477
$770
$1,156
$2,650
$2,004 $1,953
$4,011
$992
$1,288 $1,414
$2,162
119
145 159
144
193
243
219
148
128 132 142
146
0
50
100
150
200
250
300
$-
$500
$1,000
$1,500
$2,000
$2,500
$3,000
$3,500
$4,000
$4,500
2002 2003 2004 2005 2006 2007 2008 2009 2010 2011 2012 2013
# o
f Tra
nsa
ctio
ns
Tran
sact
ed
AU
M (
$Bil
lio
ns)
Transacted AUM # of Transactions
$-
$10
$20
$30
$40
$50
$60
2002 2003 2004 2005 2006 2007 2008 2009 2010 2011 2012 2013
Dis
clo
sed
De
al V
alu
e ($
Bil
lio
ns)
M&A IPOs

page 7
The largest deals of the year as measured by AUM showed a healthy mix of cross-border
expansion, in-market consolidation, and equity capital markets activity. The year’s
biggest transaction, ORIX Corporation’s acquisition of Robeco Groep, was the largest
and highest profile foray into asset management for the Japan-based buyer, which
secured a platform with meaningful beachheads in both Europe and the U.S. The
second-largest deal was Aberdeen Asset Management’s announced acquisition of
Scottish Widows Investment Partnership Group, a primarily consolidating transaction
for U.K.-based Aberdeen in its home market. Both transactions also landed in the ranks
of the all-time top 10 largest asset management deals by transacted AUM. The third
largest deal by AUM in 2013 was Banco Santander’s sale of a 50% stake in Santander
Asset Management to funds managed by Warburg Pincus and General Atlantic.
Follow-on public equity sales by The Carlyle Group and Apollo Global Management
rounded out the top five.
EXHIBIT 5: Largest Asset Management Deals by Transacted AUM, 2013
Note: Data converted to U.S. currency at time of announcement. Announced transactions only.
Source: Sandler O’Neill
Transaction activity involving independent sellers dropped to its lowest level since 2009,
representing 52% of overall deal volume. The notable drop was due to a scarcity of
independent sellers transacting during the year and an upswing in divestiture activity, as
diversified financial institutions continued their post-crisis trend of shedding non-core
businesses, encouraged by a healthier market backdrop with more active buyers.
Date Target Country Type Acquirer Country AUM ($MM) % Acquired
Feb-13 Robeco Groep, N.V. Netherlands Div ORIX Corporation Japan 244,230$ 90%
Nov-13 Scottish Widows Investment
Partnership Group Limited
U.K. Div Aberdeen Asset Management
PlcU.K. 219,154 100%
May-13 Santander Asset Management Spain Div Warburg Pincus, General
Atlantic
U.S. 197,250 50%
Jun-13 The Carlyle Group U.S. Alt Follow-on Offering U.S. 176,313 4%
May-13 Apollo Global Management, LLC U.S. Alt Follow-on Offering U.S. 114,000 17%

page 8 The Ris ing Tide | March 2014
EXHIBIT 6: Transaction Activity Involving Independent Sellers
Source: Sandler O’Neill
True to historical form, U.S.-based firms remained the most active acquirers of asset
management businesses in 2013. Consistent with 2012 levels, U.S. buyers represented
55% of deal volume. Asian buyers represented a surprising 14% of deal activity during
2013, up from 8% in 2012, as a combination of cross-border and in-market deal activity
propelled them to the second spot, followed by European (ex-U.K.) buyers at 11%. U.K.-
based buyers, the typical runner-up to the U.S., came in a distant fourth at 9% of deal
volume followed by the Canadian and Australian buyers, at 3% and 1%, respectively.
EXHIBIT 7: Geographical Breakdown of Transactions by Acquirer Domicile, 2013
Source: Sandler O’Neill
64%
72%
65%
45%
58%61% 62%
52%
0%
10%
20%
30%
40%
50%
60%
70%
80%
2006 2007 2008 2009 2010 2011 2012 2013
Ind
ep
en
de
nt S
ell
ers
(% o
f To
tal T
ran
sact
ion
s)
U.S.55%
Canada10%
U.K.9%
Europe (ex-U.K.)
11%
Asia6%
Australia2%

page 9
SELLERS: The Beat Goes On
The healthy transaction momentum of 2012 accelerated slightly in 2013 on the back of
strong global equity markets and a gradually improving global economic landscape.
Sellers – both institutional and independent alike – were drawn to the bargaining table
and were met by a group of eager buyers whose enthusiasm grew as the year
progressed. Despite the uptick in overall deal activity in 2013, the composition of sellers
interestingly shifted a bit from the prior year and a few large transactions grabbed the
spotlight.
Corporate owners of asset management businesses were particularly active in 2013, as
divestiture activity increased year-over-year by nearly 30% to 70 transactions.
Divestitures represented approximately 48% of total activity in 2013, the highest level
since 2009, the peak of divestiture activity in the wake of the financial crisis. The theme
behind the divestiture activity has remained consistent since the crisis: diversified
financial institutions focusing their business models and disposing of non-core
businesses. The largest transaction in 2013 by transacted AUM was Rabobank’s sale of
Robeco Groep, with nearly $245 billion in AUM, to ORIX Corporation. The divestiture
activity was spread across the industry into the alternatives sector as well, with Credit
Suisse divesting both its primary and secondary private equity fund-of-fund businesses.
EXHIBIT 8: Percentage of Divestitures and Independent Sales
Note: Includes minority transactions, recapitalizations, IPOs, and follow-ons involving a passive seller.
Source: Sandler O’Neill
Transactions involving management teams either buying their businesses back from
parent companies altogether or acquiring stakes in their businesses, returned to a
normalized level of six deals in 2013, down from 10 transactions in 2012. While only a
minority stake transaction, the largest of the MBO transactions in 2013 by transacted
AUM involved London-based Investec Asset Management, whose management team
acquired a 15% stake in the business from its South African parent, Investec. After
0%
10%
20%
30%
40%
50%
60%
70%
80%
90%
100%
2002 2003 2004 2005 2006 2007 2008 2009 2010 2011 2012 2013
% o
f To
tal D
eal
Vo
lum
e
% Divestitures % Independent Sales

page 10 The Ris ing Tide | March 2014
exploring the sale of its private equity division for 18 months, France’s AXA Investment
Managers agreed to the management-led buyout of a majority interest in AXA
Investment Managers Private Equity, which values the firm at over $650 million. The
remaining MBO transactions were primarily sales of affiliates that had been acquired by
their parents and subsequently identified as a non-core business better left to
independent ownership. Piper Jaffray Companies sold Fiduciary Asset Management,
a business it originally acquired in 2007, back to its management team, and Affiliated
Managers Group did the same with Friess Associates, the mid-cap equity manager
that Affiliated Managers Group initially acquired in 2001.
Private equity sponsors contributed little to 2013 selling activity, completing only four
transactions, as sponsors continued to be more active buyers than sellers. However,
compared to the two transactions that sponsors completed in 2012, 2013 marked a
meaningful relative increase year-over-year. The largest sale by a financial sponsor in
2013 was not to a strategic or financial buyer but to the public market, as Hellman &
Friedman sold a portion of its ownership stake in Artisan Partners Asset Management.
The most notable divestiture by a sponsor to a single buyer was Rosemont Investment
Partners’ sale of its stake in SouthernSun Asset Management as part of Affiliated
Managers Group’s acquisition of a majority stake in the small- and mid-cap equity
manager.
Just looking at the numbers, 76 sale transactions of independently owned firms occurred
in 2013, representing 52% of overall transactions, the lowest level since 2009 and a
meaningful drop from 62% in 2012. Despite the steep decline, sales of independently
owned businesses remain a staple of asset management deal activity, particularly given
the somewhat distinct confluence of factors that contributed to the relative decline in
2013. As mentioned earlier, divestiture activity posted a material relative increase during
2013 and the volume of sales of independents in 2012 received a boost from owners
looking to reach deals before highly anticipated tax increases. The independently owned
firms that struck deals in 2013 pursued historical ”bread and butter” transactions to
achieve liquidity for passive owners and to secure strategic partners to expand product
distribution and accelerate business growth. Segall Bryant & Hamill’s sale of a majority
stake to a fund managed by private equity sponsor Thoma Bravo was primarily to buy
out Dougherty Financial Group’s long-held ownership stake. The sale of Smith
Breeden Associates to the Amundi Group brought together Smith Breeden’s U.S. fixed
income capabilities with Amundi’s global institutional client base.
The longstanding status of the U.S. as home to the lion’s share of investment
management transactions (based on the domicile of the seller) slipped slightly in 2013,
reaching its lowest level since 2009. Due to the relative decline in sales by independently
owned firms in the U.S. in 2013 and strong showings by sellers in other countries, only
50% of transactions involved a U.S.-based seller in 2013, down from 58% in the prior
year. As the second-largest market for transactions for yet another year, the U.K.
represented 16% of global investment management seller activity, an uptick from 2012
levels. Canadian sellers were the biggest movers of the year, posting a 63% increase in
transaction activity in 2013 over the prior year. The jump in activity was due primarily to
in-market transactions, most notably Richardson GMP Limited’s acquisition of
Macquarie Group Limited’s Canadian retail and private client business, Macquarie
Private Wealth. An equally impressive relative jump in 2013 transaction activity

page 11
occurred in Europe (ex-U.K.), with a 62% increase in the number of sellers that
transacted in 2013 over the prior year. The strengthening macroeconomic backdrop
supported both the volume and size of European transaction activity, most notably the
sale by Banco Santander of a 50% stake in Santander Asset Management to funds
managed by Warburg Pincus and General Atlantic. This transaction was a key step
toward Banco Santander’s stated goal of doubling Santander Asset Management’s AUM
in five years by securing capital partners to create a globally-competitive asset
management platform and to fuel future growth beyond the bank’s home markets.
Looking further east, transaction activity involving sellers in Asia and Australia was
mixed. Deals by Asia-domiciled sellers dropped to 4% of total transaction activity, its
lowest level in more than a decade, driven by an increasing lack of active sellers and
actionable opportunities. Of the six deals involving target businesses in Asia, the largest
was ING Group’s divestiture of its South Korean investment management business to
Macquarie Group Limited. As relative deal activity in Asia in 2013 slowed considerably,
sellers in Australia completed five transactions, a strong surge in comparison to 2012, a
year in which no single notable Australian seller transacted. The bulk of transactions in
Australia in 2013 were smaller divestitures, with the only large exception being Macquarie
Group Limited’s divestiture of its real estate investment management subsidiary, MGPA
Limited, to BlackRock.
EXHIBIT 9: Historical Target Breakdown by Region
Note: Includes minority transactions, recapitalizations, IPOs, and follow-ons involving a passive seller.
Source: Sandler O’Neill
The types of businesses involved in transactions in 2013 were comparable to the mix
seen in 2012, with the notable exception being diversified asset managers, which saw a
tripling of AUM change hands in 2013 relative to 2012 at a price of four times last year’s
deal value. These outsized increases in 2013 were driven by the few large marquee
deals announced during the year, with three transactions involving targets with
approximately $200 billion in AUM or greater. Deal activity involving private client
119
145 159
144
193
243
219
148
128 132 142 146
0
50
100
150
200
250
300
2002 2003 2004 2005 2006 2007 2008 2009 2010 2011 2012 2013
# o
f Tra
nsa
ctio
ns
U.S. Canada U.K. Europe (ex-U.K.) Asia Australia Other

page 12 The Ris ing Tide | March 2014
businesses continued its strong upswing with 47 transactions announced in 2013, an
increase of nearly 18% over the prior year. Despite the increase in private client deal
volume, the transacted AUM was essentially flat to 2012 levels, speaking to the smaller
average transaction size (in terms of AUM) in 2013. Mariner Wealth Advisors
continued its inorganic growth strategy in 2013 with the acquisition of a majority stake in
New York-based RR Advisory Group. Focus Financial Partners was on both sides of
the deal spectrum in 2013, acquiring four firms during the year and selling a minority
stake to a fund managed by Centerbridge Partners.
EXHIBIT 10: Transacted AUM by Target Type
Note: Includes minority transactions, recapitalizations, IPOs, and follow-ons involving a passive seller.
Source: Sandler O’Neill
Deal activity involving alternative asset managers remained on par with 2012 levels,
though the types of managers that transacted changed notably. Transaction volume
involving fund-of-hedge-fund targets dropped by over 40% from 2012, reflecting both (i) a
lack of targets of size in a market where size increasingly matters; and (ii) a limited
universe of interested strategic buyers, given the lingering questions about the future
growth prospects of the fund-of-hedge-funds industry. On the contrary, transaction
activity involving real estate investment management targets increased by over three
times, as buyers looked to more aggressively develop or enhance real asset businesses
with global capabilities. In addition to the BlackRock/MGPA deal, several strategic
transactions took place, including The Carlyle Group’s purchase of Metropolitan Real
Estate Equity Management, a real estate fund-of-funds manager.
$570 $477
$770
$1,156
$2,650
$2,004 $1,953
$4,011
$992
$1,288$1,414
$2,162
$-
$500
$1,000
$1,500
$2,000
$2,500
$3,000
$3,500
$4,000
$4,500
2002 2003 2004 2005 2006 2007 2008 2009 2010 2011 2012 2013
Tran
sact
ed
AU
M (
$Bil
lio
ns)
Institutional Diversified Mutual Fund Alternative Private Client
page 13
EXHIBIT 11: Historical Transaction Activity Involving Alternative Asset
Management Firms
Note: Includes minority transactions, recapitalizations, IPOs, and follow-ons involving a passive seller.
Source: Sandler O’Neill
Volume of transactions involving the sale of private equity managers also posted a strong
showing in 2013, increasing 50% over 2012 levels, and hitting its highest number of
transactions (10) since 2008. Nearly one-third of the transactions involving private equity
managers were due to Credit Suisse’s divestiture of all of its private equity businesses,
including the spin-out of DLJ Investment Partners, its middle market private equity
business, to Connecticut-based Portfolio Advisors. The U.K. notched its sole in-market
transaction involving a private equity manager in 2013 with the sale of Barclays
Infrastructure Funds Management Limited to 3i Group. Transaction activity involving
hedge fund managers dropped 14% in 2013 from the prior year, while the transacted
AUM for the year dropped by a staggering 90%. Hedge fund deals during the year were
typically smaller transactions in which the acquirer sought to add specific product
capabilities, such as Henderson Group’s acquisition of commodities specialist H3
Global Advisors.
After stepping up in 2012, only 29 minority transactions occurred in 2013, representing
20% of total deals, the lowest level since 2005. This meek level of minority deals was
driven by both (i) a focus in 2013 on strategic deal making with buyers taking controlling
stakes in underlying managers; and (ii) decreases in deals with private equity buyers and
transactions with hedge fund manager targets, both of which historically have been
predominantly minority transactions. Despite the decline in 2013, notable minority
transactions in 2013 spanned product types and geographies. Singapore-based
Straights Trading Company Limited acquired a 20% stake in real estate manager ARA
Asset Management, also based in Singapore. French asset manager, La Francaise,
acquired a 24.9% stake in independently owned real estate specialist Forum Partners,
22 19
31 31
63
78
71
38
56
49 48 49
18%
13%
19% 22%
33%
32% 32%
26%
44%
37% 34%34%
0%
5%
10%
15%
20%
25%
30%
35%
40%
45%
50%
0
10
20
30
40
50
60
70
80
90
100
2002 2003 2004 2005 2006 2007 2008 2009 2010 2011 2012 2013
% o
f To
tal D
eal
s
# o
f Tra
nsa
ctio
ns
Hedge Fund FOHF Private Equity Real Estate CDO/CLO % of Total Deals

page 14 The Ris ing Tide | March 2014
as the basis of a strategic partnership to launch a suite of European direct real estate
products.
EXHIBIT 12: Historical Minority Transaction Activity
Source: Sandler O’Neill
14 18 19
25
52
77
69
34
28 28
37
29 12% 12% 12%
17%
27%
32% 32%
23%22% 21%
26%
20%
0%
5%
10%
15%
20%
25%
30%
35%
0
10
20
30
40
50
60
70
80
90
2002 2003 2004 2005 2006 2007 2008 2009 2010 2011 2012 2013
% o
f To
tal D
eal
Vo
lum
e
# o
f Min
ori
ty D
eal
s
# of Minority Deals % of Total Deal Activity

page 15
BUYERS: Seize the Day
The strong market tailwinds that enticed sellers to the M&A market had a similar effect on
buyers in 2013 – spurring them to action. Buyers’ risk appetites increased alongside their
clients’, which led to healthy levels of deal activity in 2013. In total, buyers spent 53%
more in 2013 to achieve their acquisition ambitions as total disclosed deal value
exceeded $13.2 billion, up from the 10-year low of $8.6 billion in 2012. While some
buyers jumped in head first and others pursued more cautious approaches, a broader
group of buyers came off the sidelines in 2013 to survey the market for opportunities that
might meet their strategic and financial objectives. Underpinning deal activity overall was
the need for firms to expand the scope of their product offerings and the breadth of
distribution in anticipation of the expected large-scale rotation out of fixed income
investments into equity and alternative products.
The size of the largest transactions in 2013 reflected buyers’ growing confidence and
ambitions. Large marquee deals made a meaningful comeback globally in 2013 after
being relatively absent in 2012. Six deals involving sellers with AUM in excess of $100
billion were announced in 2013, the third consecutive annual increase. Just below that,
27 transactions involving managers with AUM between $10 billion and $100 billion
occurred during the year, compared to just 18 in 2012, a 50% increase. The middle
market, deals with transacted AUM between $1 billion and $10 billion, took a step back in
2013. While the middle market continues to represent the largest single market, only 66
deals in the category were announced in 2013, down from 85 in 2012. While we do not
believe that the volume at the larger end of the market indicates the advent of an
extended period of transformational deal making, it does reflect the growing comfort of
CEOs and their boards in putting idle cash and available credit to work more aggressively
when the right opportunities arise.
EXHIBIT 13: Number of Asset Management Transactions by AUM Size
Note: Includes minority transactions, recapitalizations, IPOs, and follow-ons involving a passive seller.
Source: Sandler O’Neill
0%
10%
20%
30%
40%
50%
60%
70%
80%
90%
100%
2002 2003 2004 2005 2006 2007 2008 2009 2010 2011 2012 2013
# o
f Tra
nsa
ctio
ns
Less than $1bn $1bn to $10 bn $10bn to $100bn Greater than $100 billion

page 16 The Ris ing Tide | March 2014
The mix of buyers in 2013 continued to be dominated by pure-play asset management
companies, with pure-play asset managers, insurance companies, and broker/dealers all
elevating their deal activity. Each announced more transactions in 2013 than in 2012,
though asset managers’ acquisition volume greatly eclipsed the combined buying
activities of insurance companies and broker/dealers. Going the opposite direction were
financial sponsors and banks, which saw declining deal volumes in 2013.
EXHIBIT 14: Number of Asset Management Transactions by Acquirer Type
Note: Includes minority transactions, recapitalizations, IPOs, and follow-ons involving a passive seller.
Source: Sandler O’Neill
Scooping up 85 targets, pure-play asset managers set an all-time high in 2013 for both
the most announced deals by this group and the highest percentage of overall
transactions (58% of total announced deals in 2013). It was the second consecutive year
that this group accounted for more than 50% of all announced deals, a trend that we
believe will continue as pure-play buyers benefit from diminished competition for
acquisitions. Size didn’t matter, as pure-play asset managers transacted with large and
small sellers alike, though the average AUM transacted per deal of $6 billion remained
relatively unchanged from 2012.
Alternative asset managers made a huge splash in 2013, announcing six of the 10
largest deals among the pure-play asset managers as measured by AUM. Nearly all of
the largest U.S.-listed publicly traded alternative managers got into the act, seeking to
press their advantage through the ongoing expansion of their product offerings.
Blackstone entered the private equity and real estate secondaries market by acquiring
Strategic Partners from Credit Suisse. Strategic Partners, which manages $10 billion in
assets, is recognized as one of the world’s leading investors in that space. The Carlyle
Group purchased $6.7 billion fund-of-hedge-fund manager Diversified Global Asset
Management to round out the Carlyle Solutions platform, thereby enabling investors to
0%
10%
20%
30%
40%
50%
60%
70%
80%
90%
100%
2002 2003 2004 2005 2006 2007 2008 2009 2010 2011 2012 2013
% o
f To
tal T
ran
sact
ion
s
Asset Manager Broker Dealer Insurance Company Bank or Trust
Initial Public Offering Financial Sponsor Other

page 17
allocate across alternatives in non-affiliated hedge funds, private equity, and real estate.
Not to be outdone, KKR announced three of the largest deals among its asset
management peers. At the outset of the year, it announced the acquisition of a minority
stake in Nephila Capital, which specializes in investing in reinsurance risk, including
insurance-linked securities, catastrophe bonds, and weather derivatives. KKR later
acquired $8 billion European-based CLO manager Avoca Capital Holdings to extend its
credit platform and fill a void in the sector left by banks facing a more onerous regulatory
environment. Just prior to year end, KKR announced its largest deal, acquiring KKR
Financial Holdings in a $2.6 billion transaction. The transaction, which increases KKR’s
book value to a massive $10 billion, is a differentiator to its competitors and will be used
to support growth initiatives, Lastly, privately-owned Grosvenor Capital Management,
one of the world’s largest fund-of-hedge-funds managers, acquired the Customized
Fund Investment Group, a leading fund of funds group specializing in private equity,
infrastructure and real estate, from Credit Suisse. The transaction marked Grosvenor’s
first-ever acquisition.
Traditional asset managers were no slouches either. Notably, a substantial number of
the highest profiles transactions were executed by pure-play asset managers that are
based outside of the U.S. The most active was U.K.-listed Aberdeen Asset Management,
which tallied three transactions during the course of 2013. Its most significant purchase
was Scottish Widows Investment Partnership Group, in a deal valued in excess of $1
billion, which it purchased from Lloyds Banking Group. The transaction makes
Aberdeen the largest publicly traded asset manager in Europe and is expected to yield
significant cost synergies and add scale to a number of key asset classes. Canadian-
listed Fiera Capital Corporation made three acquisitions in 2013, two of which, Bel Air
Investment Advisors and Wilkinson O’Grady & Co., were in the private wealth
management space. Another notable acquisition was U.K.-listed Schroders’ purchase
of Cazenove Capital Holdings. The roughly $650 million deal enabled Schroders to put
to work some of its $1.5 billion in cash reserves by bringing together two of the oldest and
most recognized names in the London market. The transaction significantly expanded
Schroders’ private wealth management business by adding assets of nearly $30 billion
under management to Schroders’ existing $15 billion of client assets.
The number of private equity-led acquisitions greatly lagged deals done by pure-play
buyers. Sponsors racked up 14 acquisitions in 2013, but for the first time in over a
decade, represented less than 10% of the buying activity. Sponsors were particularly
active buyers in the divestitures of traditional asset management platforms in 2013,
providing more attractive valuations to sellers and greater opportunities to the ongoing
business and its management than consolidating strategic buyers. Two such examples
were the up to $265 million acquisition of SunTrust Banks’ RidgeWorth Capital
Management by Lightyear Capital and Crestview Partners’ $246 million purchase of
KeyCorp’s Victory Capital Management. Liquidity and growth capital for independent
owners of asset management companies also played their usual role in facilitating
activity. Centerbridge Partners committed $216 million of investment capital to Focus
Financial Partners to support its ongoing acquisition strategy in the private wealth
management sector. FTV Capital, which was a successful early investor in a number of
notable ETF platforms, took a new tact in investing in the ETF space by leading a $75
million equity commitment to Good Harbor Financial, a tactical asset allocation manager
of portfolios largely comprised of exchange traded funds. Lastly, asset management

page 18 The Ris ing Tide | March 2014
specialist funds Estancia Capital and Rosemont Investment Partners stayed busy again,
each making further investments in the sector.
EXHIBIT 15: Financial Sponsor Acquisition Activity
Note: Includes minority transactions and recapitalizations.
Source: Sandler O’Neill
Banks slowed down their buying activity for the second consecutive year, with deal
volume falling substantially in 2013 to just nine transactions from the 20 deals announced
in 2012. Shockingly, no U.S. bank announced an asset management acquisition in 2013,
despite wide sentiment among a broad number of U.S. banks to acquire private wealth
management businesses. However, the competitive M&A environment for such
businesses has kept valuations strong, amplifying the negative effects of acquisition
goodwill on capital ratios, forcing U.S. banks to the sidelines. The focus among banks on
wealth management also extended outside of the U.S., as deal activity centered largely
on banks buying other financial institutions’ private wealth management businesses in
strategically important geographies. The largest purchase was Canadian Imperial Bank
of Commerce acquiring Atlantic Trust Private Wealth Management from Invesco in a
transaction valued at $210 million. The transaction marked the second time in three
years that CIBC has crossed the border to shop. In 2011, it acquired JP Morgan’s 41%
interest in American Century. Credit Suisse and Standard Chartered both benefitted
from Morgan Stanley’s decision to reconsider its non-U.S. wealth management
businesses. Credit Suisse picked up Morgan Stanley’s European, Middle Eastern, and
African operations while Standard Chartered landed the investment bank’s Indian wealth
management unit.
Insurers announced 10 transactions in 2013, putting them back in double-digit territory for
the first time since 2009. The acquisition activity among this group remains scattered
and less predictable in terms of the types of target businesses. Despite the small number
of announced deals by insurance companies, the acquisitions spanned institutional
4
16 16 17
20
36 33
15
19
16 18
14
3%
11%
10%
12%
10%
15%15%
10%
15%
12%13%
10%
0%
2%
4%
6%
8%
10%
12%
14%
16%
0
5
10
15
20
25
30
35
40
2002 2003 2004 2005 2006 2007 2008 2009 2010 2011 2012 2013
% o
f To
tal D
eal
Act
ivit
y
# o
f Tra
nsa
ctio
ns
# of Transactions % of Total Deal Activity

page 19
businesses, mutual fund operations, alternative asset managers, and private wealth
managers. Occasional buyers New York Life Insurance and TIAA-CREF were back in
action last year, each making moves in the European market to expand their global
operations. New York Life purchased Dexia Asset Management from its parent, Dexia
SA for $513 million, in a transaction that added nearly $100 billion of AUM to New York
Life. New York Life agreed to pay the same price that Dexia SA was set to receive in its
agreement with Hong Kong-based GCS Capital in December 2012, a transaction that fell
through in July 2013 when GCS Capital failed to meet its payment obligations. TIAA-
CREF purchased a controlling position in Henderson Group’s real estate business,
combining its $17 billion in AUM with TIAA-CREF’s smaller European operation.
Broker/dealers generally remained a liner note in the acquisition landscape. While there
were nine transactions announced by broker/dealers in total, Goldman Sachs
represented three of the group, two of which were small consolidation plays and the other
was a small minority investment. Goldman Sachs picked up a range of money market
funds from Royal Bank of Scotland as well as the stable value funds managed by
Deutsche Asset & Wealth Management, Deutsche Bank’s asset management
business. Our expectations remain modest for this group going forward and we expect
that any pickup in activity will be driven largely by smaller broker/dealers looking to
expand and diversify their businesses.
For the second consecutive year, U.S. buyers accounted for 55% of announced
transactions in 2013. As we expected, U.S. buyers spent more time shopping abroad in
2013 than in 2012, when only 20% of acquisitions by U.S. buyers were outside the U.S. In
total, U.S.-based companies acquired 16 asset managers beyond their borders in 2013,
doubling 2012 levels. Nearly one-third of the deals were U.K. based targets, echoing the
U.K. as the most frequent hunting ground for U.S. buyers, given the large number of asset
management companies relative to other markets where a relatively small number of
banks and other large financial institutions control market share. While U.S. managers
continue to seek opportunities to extend their businesses into Asia, a shortage of
actionable opportunities left U.S. buyers empty handed in those markets.
While U.K. buyers maintained their position as the second-most active buyer group, their
buying activity was down markedly from 2012, dropping by nearly 27% to 19 deals in
2013. The difference can largely be accounted for by fewer transatlantic transactions.
The vast majority of the deals executed by U.K. based businesses involved buying
divested assets in both the U.K. and Europe, as the price points were attractive and
frequently offered meaningful cost synergies.
European firms outside of the U.K. collectively matched the volume of U.K. buying activity
and increased their volume by over 25% in 2013. Not to break tradition, Swiss firms were
the most active followed by French buyers. The Swiss spent their asset management
acquisition budgets exclusively on private wealth management and alternative businesses
which follows the established position Switzerland holds as a leading market globally for
these sectors. For the second year running, German buyers stayed out of the market,
failing to make any acquisitions.
Canadian firms continued to step up the volume of their buying activity in 2013, more than
doubling levels from just two years ago. Canadian firms have largely utilized M&A as a
tool for diversification and growth rather than cost savings through integration. Of the 15

page 20 The Ris ing Tide | March 2014
announced deals, tastes tended to favor local buying, as most of the acquisitions were in-
market, including Industrial Alliance Insurance and Financial Services’ acquisition of
TSX-listed Jovian Capital Corporation, to further expand Industrial Alliance’s private
wealth product and service offerings.
Buying activity among Asian buyers decreased overall last year and was concentrated
among Japanese firms. Half of the transactions involved Japanese buyers with a focus on
acquiring businesses in the U.S. and Europe, including Nippon Life Insurance
Company’s acquisition of a minority stake in high-yield bond specialist, Post Advisory
Group, a subsidiary of Principal Global Investors, the asset management arm of
Principal Financial Group. Rounding out the global list of buyers, Australian firms
announced three deals in 2013 after a year of silence.
EXHIBIT 16: Geographical Breakdown of AUM Transacted and of Number of
Transactions by Acquirer Domicile, 2013
By AUM Transacted:
By Number of Transactions:
Note: Includes minority transactions, recapitalizations, IPOs, and follow-ons involving a passive seller.
Source: Sandler O’Neill
In total, 41 cross-border transactions were announced in 2013, down slightly from the
previous year. At 28% of the overall deal volume, cross-border deals were in line with
their 10-year average of 29%. However, 2013 represented a major reversal in the deal
flow between the U.S. and the rest of the world. In 2012, we saw U.S. acquirers steering
clear of Europe in light of the Continent’s ongoing financial woes. In 2013, on the back of
fast-improving U.S. markets and more positive expectations for Europe, U.S. firms nearly
tripled their buying activity, announcing 11 acquisitions of European-based managers.
Conversely, European and U.K.-based buyers halved their buying activity in the U.S., as
more positive sentiments about their home markets kept their focus locally. Asian firms
maintained a regional focus, only making two acquisitions outside of their home markets.
One of those deals, however, ORIX Corporation’s acquisition of Robeco Groep, was the
largest transaction of the year. We expect 2014 to bring a healthier balance of cross-
border acquisitions between geographies given the generally stable-to-positive outlooks
for the developed economies and markets for the year ahead.
U.S.62%
Canada3%
U.K.15%
Europe (ex-U.K.)
5%
Asia14%
Australia1%
U.S.55%
Canada10%
U.K.9%
Europe (ex-U.K.)
11%
Asia6%
Australia2%

page 21
EXHIBIT 17: Historical Cross-Border Transaction Activity
Note: Includes minority transactions and recapitalizations.
Source: Sandler O’Neill
34 32 36 34
60
92
74
33
39
45 43 41
29%
22% 23%24%
31%
38%
34%
22%
30%
34%
30%
28%
0%
5%
10%
15%
20%
25%
30%
35%
40%
0
10
20
30
40
50
60
70
80
90
100
2002 2003 2004 2005 2006 2007 2008 2009 2010 2011 2012 2013
% o
f To
tal D
eal
Vo
lum
e
# o
f Cro
ss-B
ord
er
De
als
# of Cross-Border Deals % of Total Deal Activity

page 22 The Ris ing Tide | March 2014
IPOs: Second Time’s a Charm
The improved global economy and rising investor confidence that characterized 2013 set
the stage for a rebound in global IPO issuance. Despite the suspension of IPO activity in
mainland China, which normally accounts for 20% of global volume, the global IPO
market produced 934 offerings across all regions and sectors in 2013, up 14% from
2012. Total capital raised in 2013 reached approximately $173 billion, up 39% from 2012
and represented the highest volume since 2010.
The U.S. IPO market in 2013 experienced its best year in issuance and proceeds since
2000. Unlike in previous years, the window for IPOs remained open throughout the year.
A total of 222 companies successfully went public, collectively raising $60 billion.
EXHIBIT 18: U.S. IPO Activity Over Last Two Years
Source: Dealogic
In the asset management sector, U.S.-based traditional asset managers Artisan Partners
Asset Management and Silvercrest Asset Management Group entered the public
domain in 2013, collectively raising over $400 million in gross proceeds. After publicly re-
filing its registration statement with the SEC in November 2012, Artisan Partners Asset
Management, a Milwaukee-based diversified equity investment manager with $79.5
billion in AUM as of February 2013, successfully floated 18% of its shares on the New
York Stock Exchange in March 2013. Unlike most traditional asset managers that
employ a more centralized investment model, Artisan’s twelve distinct U.S., non-U.S.,
and global equity investment strategies are managed by five autonomous investment
teams. The offering priced at $30 per share, above its initial $27-$29 pricing range,
which implied a market capitalization of $2.1 billion. Proceeds were used to pay down
the remaining revolving credit facility balance, repurchase common units from certain
initial outside investors, and make a distribution of retained profits to pre-offering
partners.
$7
$23
$8 $9 $9
$15 $13
$24
41
33
26
3332
62
60
68
-
10
20
30
40
50
60
70
$-
$5
$10
$15
$20
$25
$30
$35
1Q12 2Q12 3Q12 4Q12 1Q13 2Q13 3Q13 4Q13
# o
f IP
Os
Am
ou
nt
($B
ilio
ns)

page 23
EXHIBIT 19: Global Asset Management IPO Activity
Source: Sandler O’Neill
Subsequent to surpassing $100 billion in AUM and experiencing an 85+% run-up in its
stock price, Artisan expanded its public float in October 2013 by an incremental 8%,
attracting a broad base of institutional shareholders. Proceeds from this offering were
used to purchase a portion of preferred units and shares of convertible preferred stock
held by Hellman & Friedman. After the offering, Hellman & Friedman continues to hold a
minority position in Artisan.
After withdrawing its registration statement with the SEC in November 2012 due to
market conditions, New York-based Silvercrest Asset Management Group publicly refiled
with the SEC in April 2013 and subsequently priced its IPO in June. Founded in 2002 by
principals largely from DLJ Asset Management Group, Silvercrest is a premier, full-
service wealth manager focused on providing traditional and alternative investment
advisory and family office services to ultra-high net worth individuals and institutional
investors. With $13.6 billion in AUM as of March 2013 and with its 400-plus client
relationships averaging $32 million in size, Silvercrest ranks among the largest
independent wealth managers in the nation. Silvercrest became the only pure-play
publicly traded asset manager with a primary focus on the ultra-high net worth segment.
The IPO facilitated the full exit of Silvercrest’s passive minority owner, Paul Allen’s
Vulcan Wealth Management, and provided minimal partial liquidity for current employee
shareholders. The offering also augmented Silvercrest’s ability to execute on future
acquisitions via additional cash on the balance sheet. Throughout its history, Silvercrest
has demonstrated a proven ability to acquire talent and assets, having made five
acquisitions. As of December 31, 2013, Silvercrest’s share price increased 55% since
pricing its IPO at $11 per share.
As strong as IPO activity was, 2013 may go down as the year of the follow-on for U.S.
publicly traded asset managers. Strong equity markets encouraged a record number of
$88 $-
$885
$286
$2,138
$8,193
$200
$1,203
$381
$559 $1,051
$434
1
-
3
2
10
11
1
2
1
2 2 2
0
2
4
6
8
10
12
$-
$1,000
$2,000
$3,000
$4,000
$5,000
$6,000
$7,000
$8,000
$9,000
2002 2003 2004 2005 2006 2007 2008 2009 2010 2011 2012 2013
# o
f IP
Os
IPO
Pro
ceeds ($
Millions)
IPO Proceeds ($Millions) # of IPOs

page 24 The Ris ing Tide | March 2014
U.S. asset managers to sell incremental stock in the public markets. Uses of proceeds
from these offerings ranged from cashing out financial sponsor shareholders to
expanding seed capital programs for new investment strategies and funds. In total,
nearly $1.9 billion was raised in gross proceeds from five offerings, with the California
Public Employees’ Retirement System notably taking home $500 million from two
offerings.
EXHIBIT 20: U.S. Asset Manager Follow-on Offerings in 2013
Source: Company filings, Sandler O’Neill
After the strong run-up in equities, most asset managers enter 2014 at all-time valuation
highs. We expect to see more passive shareholders strongly consider selling shares of
companies in their portfolios given the strong equity markets and ongoing investor
demand. As a result, we expect capital raising activity from asset managers to keep
pace with 2013 levels.
Pricing Amount
Date Firm Name Seller Name(s) ($MM)
Oct-13 Artisan Partners Asset Management, Inc. Hellman & Friedman 309$
Sep-13 Virtus Investment Partners, Inc. n/a (Primary) 201
Jun-13 The Carlyle Group California Public Employees' Retirement
System
315
May-13 Oaktree Capital Group, LLC Existing owners 431
May-13 Apollo Global Management, LLC Abu Dhabi Investment Authority,
California Public Employees' Retirement
System, and existing owners
607
page 25
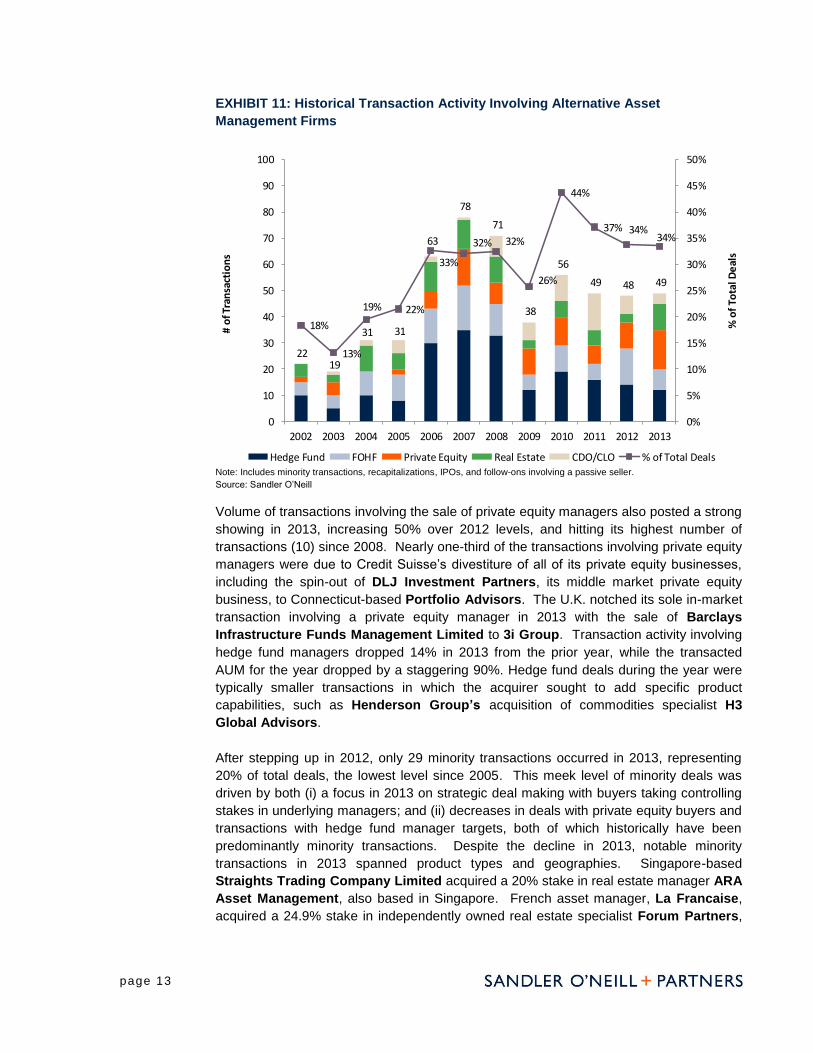
PRICING: Running of the Bulls
As stocks marched higher, investors poured billions into equity mutual funds and ETFs.
Asset managers rode the market waves, with the Sandler O’Neill Global Asset
Management Index surging 50.4%, reaching an all-time high.
EXHIBIT 21: Sandler O’Neill’s Global Asset Management Index Performance
Note: 100 = year-end 2007.
Source: Bloomberg, Sandler O’Neill
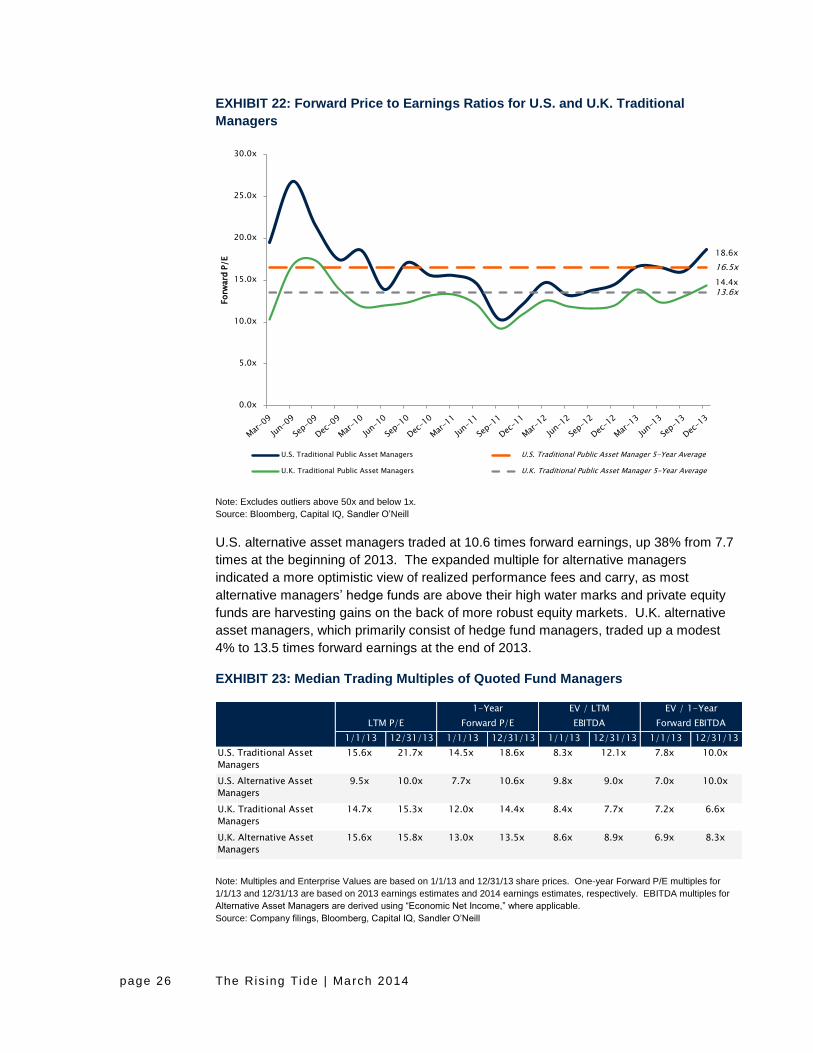
Publicly traded traditional asset managers in the U.S. were trading at 18.6 times price to
forward earnings at the end of 2013, nearly 13% above the historical five-year average of
16.5 times. Forward earnings multiples for U.K. traditional managers, which continue to
trail their U.S. counterparts, increased to 14.4 times, 6% above the five-year average of
13.6 times. For the first time in four years, publicly traded traditional asset managers in
the U.S. and U.K. each broke through their respective five-year averages, reflecting
strong organic growth and valuations hovering near all-time highs.
0
20
40
60
80
100
120
140
Index
Global (USD) Alternatives Traditional Bloomberg U.S. Div Fin Svcs
page 26 The Ris ing Tide | March 2014
EXHIBIT 22: Forward Price to Earnings Ratios for U.S. and U.K. Traditional
Managers
Note: Excludes outliers above 50x and below 1x.
Source: Bloomberg, Capital IQ, Sandler O’Neill
U.S. alternative asset managers traded at 10.6 times forward earnings, up 38% from 7.7
times at the beginning of 2013. The expanded multiple for alternative managers
indicated a more optimistic view of realized performance fees and carry, as most
alternative managers’ hedge funds are above their high water marks and private equity
funds are harvesting gains on the back of more robust equity markets. U.K. alternative
asset managers, which primarily consist of hedge fund managers, traded up a modest
4% to 13.5 times forward earnings at the end of 2013.
EXHIBIT 23: Median Trading Multiples of Quoted Fund Managers
Note: Multiples and Enterprise Values are based on 1/1/13 and 12/31/13 share prices. One-year Forward P/E multiples for
1/1/13 and 12/31/13 are based on 2013 earnings estimates and 2014 earnings estimates, respectively. EBITDA multiples for
Alternative Asset Managers are derived using “Economic Net Income,” where applicable.
Source: Company filings, Bloomberg, Capital IQ, Sandler O’Neill
18.6x
16.5x
14.4x 13.6x
0.0x
5.0x
10.0x
15.0x
20.0x
25.0x
30.0x
Forw
ard
P/E
U.S. Traditional Public Asset Managers U.S. Traditional Public Asset Manager 5-Year Average
U.K. Traditional Public Asset Managers U.K. Traditional Public Asset Manager 5-Year Average
1-Year EV / LTM EV / 1-Year
LTM P/E Forward P/E EBITDA Forward EBITDA
1/1/13 12/31/13 1/1/13 12/31/13 1/1/13 12/31/13 1/1/13 12/31/13
U.S. Traditional Asset
Managers
15.6x 21.7x 14.5x 18.6x 8.3x 12.1x 7.8x 10.0x
U.S. Alternative Asset
Managers
9.5x 10.0x 7.7x 10.6x 9.8x 9.0x 7.0x 10.0x
U.K. Traditional Asset
Managers
14.7x 15.3x 12.0x 14.4x 8.4x 7.7x 7.2x 6.6x
U.K. Alternative Asset
Managers
15.6x 15.8x 13.0x 13.5x 8.6x 8.9x 6.9x 8.3x

page 27
Despite the public valuation increase experienced by the public market, acquisition
multiples in the global asset management sector declined slightly in 2013. The median
acquisition multiple for 2013 of 8.0 times run-rate EBITDA reflected two primary factors:
(i) the uptick in divestiture activity, which we expect is temporary; and (ii) the likely
increase in pricing power among the largest buyer group, pure-play asset managers.
Divestitures, which typically involve consolidations of managers of mixed quality,
garnered lower deal multiples of around 6.0 to 8.0 times during 2013. Conversely,
strategically additive transactions attracted higher deal multiples, with pricing, on
average, 30% higher than divestitures. While the median transaction multiple is 11% off
of the five-year average of 9.0 times and 23% below the 10-year average of 10.4 times,
we believe that, with the increase in public company valuations and greater buyer
ambitions, global asset management trade sale pricing will materially strengthen in 2014.
EXHIBIT 24: Run-Rate EBITDA Multiples of Global Asset Management Trade Sales
Note: Multiples reflect four-quarter rolling medians and include all global trade sales for both traditional and alternative
managers.
Source: Sandler O’Neill
8.0x
0.0x
2.0x
4.0x
6.0x
8.0x
10.0x
12.0x
14.0x
16.0x
2002 2003 2004 2005 2006 2007 2008 2009 2010 2011 2012 2013
Ru
n-Rate
EBIT
DA
Mu
ltip
le (R
ollin
g 4
Qu
art
ers
)

page 28 The Ris ing Tide | March 2014
CONCLUSIONS: Rowing Downstream
The asset management industry largely celebrated the strength of the equity markets and
investors’ initial phase of reallocation toward higher risk and higher fee strategies in 2013.
Resulting revenue increases generated even greater profit growth due to the operating
leverage that asset management companies enjoy. The vast majority of the industry
concluded 2013 with businesses that were materially more valuable than they were at the
outset of the year due to market appreciation alone. This sets up a favorable
environment for deal making as potential sellers are more inclined to engage in M&A
discussions having seen solid gains in their businesses since 2011. Furthermore, buyers
are more confident in transacting now that markets have largely recovered from the
financial crisis, economic news is generally favorable, and there is greater visibility on
investor sentiment. With that as a backdrop, we expect the following to play out in the
year ahead:
An uptick in pricing – Pricing has, on average remained in the range of 8.0 to 9.0
times run-rate EBITDA in the past several years. Dispersion has been relatively high,
owing mostly to divestitures where corporate sellers were more concerned with
completing the sale than maximizing price. The multiples of publicly traded asset
managers have historically tended to be a good leading indicator for private market
pricing. As public multiples continued to improve in 2013, we expect that transaction
multiples for private sales will increase in the year ahead. While it is not likely to be a
massive increase, a little goes a long way creating a virtuous circle of better
valuations and increased deal activity.
Enlarged ambitions among buyers – Tactical deal making was de riguer during the
recovery as few buyers were willing to make large strategic bets in the face of
unstable markets, economies, and political environments. With an increase in the
number of larger deals, 2013 gave us a taste of things to come in the year ahead.
Capital remains cheap, CEOs and their boards are feeling bolder, and the relatively
moderate M&A spell of the last five years has left a larger number of big potential
buyers with thirsts that are looking to be quenched.
More independent sellers will come to market – There has been a general
reluctance among potential sellers to explore sale processes in recent years. We
attribute this to three factors: (i) earnings were still recovering relative to pre-crisis
levels; (ii) a view that there was limited buyer demand; and (iii) a desire not to be
distracted from rebuilding business momentum. As rising tides lift all boats, we
believe that independents, long the staple of the asset management M&A market, will
look to take advantage of their improved conditions and not just be open to buyer
inquiries, but increasingly pro-actively test the market to find attractive counterparties
to solve their strategic objectives and liquidity needs.
Focused competition for assets – With the expectation of another modest uptick in
deal volume in the year ahead, we anticipate that competition amongst buyers for
any particular target will also increase. While buyers remain disciplined and focused
in their acquisition strategies, a larger number are more inclined to make deals now
than at any time since the financial crisis, which leads to greater market demand for
acquisition targets.

page 29
A steady stream of divestitures – A large number of corporate owners of asset
managers have continued to relinquish the businesses whose recurring fee streams
and low capital requirements they so cherished not long ago. Capital needs, greater
regulatory demands and divergent business models continue to catalyze divestiture
activity well past the financial crisis. Surveying the market, we believe that the return
to normal divestiture levels still sits in the distance as owners of asset management
businesses large and small remained disciplined and undistracted in executing the
plans to exit or reshape their businesses, despite the natural temptation to enjoy the
cash flow expansions from improving markets.
Greater cross-border activity – As the industry continues to globalize, buyers and
sellers alike will seek opportunities to expand their footprints, either to tap new
markets or to leverage their distribution to deliver a broader array of products into
their existing markets. Given the cost and uncertainty of building, the economics of
buying into a new market are more compelling and will lead to increases in cross-
border activity. We expect intracontinental and transatlantic activity to represent the
majority of deal flow but as Asian markets evolve, we expect the participants in those
markets to play a greater role in cross-border activities in the coming years.

page 30 The Ris ing Tide | March 2014
Appendix
EXHIBIT 25: Stock Performance of the Largest Quoted Fund Managers Worldwide,
2013
Note: Artisan Partners Asset Management and Silvercrest Asset Management not included in price change ranking due to IPOs
during 2013.
Source: Company filings, Capital IQ, Sandler O’Neill
2013 % Change 12/31/2013
Market Cap % Price Change Since Stock Price as a %
Company Country US$(MM) (Native Currency) 52-Week Low of 52-Week High
WisdomTree Investments, Inc. U.S. 2,308$ 189% 186% 98%
Polar Capital Holdings plc U.K. 662 146% 144% 95%
Pzena Investment Management U.S. 143 126% 125% 99%
The Blackstone Group L.P. U.S. 17,466 114% 94% 97%
Apollo Global Management, LLC U.S. 4,543 112% 78% 91%
Fortress Investment Group LLC U.S. 2,051 101% 94% 94%
Fiera Capital Corporation Canada 906 97% 94% 91%
Waddell & Reed Financial, Inc. U.S. 5,534 92% 82% 98%
Azimut Holding Spa Italy 3,608 89% 81% 100%
Platinum Asset Management Ltd. Australia 3,566 80% 74% 99%
Henderson Group plc U.K. 3,989 80% 69% 100%
Och-Ziff Capital Management Group LLC U.S. 2,511 78% 70% 98%
Kohlberg Kravis Roberts & Co. U.S. 7,013 74% 58% 94%
Legg Mason, Inc. U.S. 5,179 72% 71% 99%
Affiliated Managers Group, Inc. U.S. 11,490 67% 63% 100%
GAMCO Investors, Inc. U.S. 2,219 66% 95% 98%
Virtus Investment Partners, Inc. U.S. 1,821 65% 65% 80%
Schroders plc U.K. 11,745 57% 53% 96%
BlackRock, Inc. U.S. 53,396 57% 52% 98%
SOP Global Asset Management Index 50% 50% 100%
Janus Capital Group, Inc. U.S. 2,324 48% 56% 96%
Federated Investors, Inc. U.S. 2,986 48% 38% 92%
AGF Management Ltd. Canada 1,054 47% 43% 88%
CI Financial Corp. Canada 9,456 47% 43% 99%
Manning & Napier, Inc. U.S. 237 46% 37% 85%
GAM Holding AG Switzerland 3,177 45% 40% 97%
Perpetual Limited Australia 1,870 44% 42% 99%
Invesco Ltd. U.S. 16,135 43% 43% 99%
The Carlyle Group LP U.S. 1,756 43% 49% 94%
Jupiter Fund Management plc U.K. 2,783 42% 42% 95%
Oaktree Capital Group, LLC U.S. 2,250 41% 30% 99%
Aberdeen Asset Management plc U.K. 9,518 41% 46% 100%
Franklin Resources, Inc. U.S. 36,419 39% 35% 100%
Cohen & Steers, Inc. U.S. 1,773 38% 37% 90%
Eaton Vance Corp. U.S. 5,175 36% 32% 95%
S&P 500 Index (Total Return Gross) 32% 32% 100%
T. Rowe Price Group, Inc. U.S. 21,967 31% 27% 100%
AllianceBernstein Holding L.P. U.S. 1,965 31% 21% 78%
Value Partners Group Ltd. Hong Kong 1,358 21% 57% 98%
Calamos Asset Management, Inc. U.S. 240 18% 24% 95%
Ashmore Group plc U.K. 4,468 16% 26% 92%
Partners Group Holding Switzerland 6,877 16% 14% 87%
Man Group plc U.K. 2,508 13% 11% 63%
F&C Asset Management plc U.K. 875 (7%) 4% 82%
Sprott Inc. Canada 611 (31%) 19% 61%
Artisan Partners Asset Management Inc. U.S. 1,294 N/A 81% 99%
Silvercrest Asset Management Group Inc. U.S. 204 N/A 52% 95%

page 31
EXHIBIT 26: Largest Asset Management Deals by Transacted AUM, 2013
Source: Sandler O’Neill
EXHIBIT 27: All-Time Largest Asset Management Deals by Transacted AUM
Source: Sandler O’Neill
Date Target Country Type Acquirer Country AUM ($MM) % Acquired
Feb-13 Robeco Groep, N.V. Netherlands Div ORIX Corporation Japan 244,230$ 90%
Nov-13 Scottish Widows Investment
Partnership Group Limited
U.K. Div Aberdeen Asset Management
Plc
U.K. 219,154 100%
May-13 Santander Asset Management Spain Div Warburg Pincus, General
Atlantic
U.S. 197,250 50%
Jun-13 The Carlyle Group U.S. Alt Follow-on Offering U.S. 176,313 4%
May-13 Apollo Global Management, LLC U.S. Alt Follow-on Offering U.S. 114,000 17%
Mar-13 Investec Asset Management South Africa Div MBO (senior management
team)
South Africa 103,009 15%
Sep-13 Dexia Asset Management Belgium Div New York Life Insurance Co. U.S. 99,819 100%
Mar-13 Artisan Partners Asset
Management Inc.
U.S. Div IPO U.S. 79,500 18%
May-13 Oaktree Capital Group, LLC U.S. Alt Follow-on Offering U.S. 78,801 5%
Jul-13 Ares Management LLC U.S. Alt Alleghany Corporation U.S. 66,000 6%
Date Target Country Type Acquirer Country AUM ($MM) % Acquired
Jun-09 Barclays Global Investors U.S. Div BlackRock Inc. U.S. 1,440,000$ 100%
Dec-06 Mellon Financial Corporation
Inc.
U.S. Div Bank of New York Company, Inc. U.S. 947,000 100%
Jan-09 Société Générale Asset
Management
France Div Crédit Agricole SA France 838,651 100%
Feb-06 Merrill Lynch Investment
Managers
U.S. Div BlackRock Inc. U.S. 544,000 100%
Jun-05 Citigroup Asset Management U.S. Div Legg Mason U.S. 437,000 100%
Sep-01 Zurich Scudder Investments U.S. Div Deutsche Bank AG Germany 278,000 100%
Nov-99 PIMCO Advisors L.P. U.S. Inst Allianz AG Germany 256,153 69%
Feb-13 Robeco Groep, N.V. Netherlands Div ORIX Corporation Japan 244,230 90%
Oct-08 Aberdeen Asset Management
plc
U.K. Div Mitsubishi UFJ Financial Group
Inc.
Japan 226,300 10%
Nov-13 Scottish Widows Investment
Partnership Group Limited
U.K. Div Aberdeen Asset Management
Plc
U.K. 219,154 100%

page 32 The Ris ing Tide | March 2014
EXHIBIT 28: Largest Asset Management Deals by Disclosed Deal Value, 2013
Source: Sandler O’Neill
EXHIBIT 29: All-Time Largest Asset Management Deals by Disclosed Deal Value
Source: Sandler O’Neill
Date Target Country Type Acquirer Country DDV ($MM) % Acquired
Feb-13 Robeco Groep, N.V. Netherlands Div ORIX Corporation Japan 2,582$ 90%
May-13 Santander Asset Management Spain Div Warburg Pincus, General
Atlantic
U.S. 1,152 50%
Nov-13 Scottish Widows Investment
Partnership Group Limited
U.K. Div Aberdeen Asset Management
Plc
U.K. 1,047 100%
Mar-13 Cazenove Capital Holdings Ltd. U.K. PvtCl Schroders Plc U.K. 646 100%
May-13 Apollo Global Management, LLC U.S. Alt Follow-on Offering U.S. 607 17%
Sep-13 Dexia Asset Management Belgium Div New York Life Insurance Co. U.S. 513 100%
Mar-13 AXA Investment Managers
Private Equity SA
France Alt Investor group (AXA PE senior
management and institutions)
France 454 69%
May-13 Oaktree Capital Group, LLC U.S. Alt Follow-on Offering U.S. 431 5%
Mar-13 Genworth Wealth Management U.S. PvtCl Aquiline Capital Partners and
Genstar Capital
U.S. 413 100%
Mar-13 Artisan Partners Asset
Management Inc.
U.S. Div IPO U.S. 381 18%
Date Target Country Type Acquirer Country DDV ($MM) % Acquired
Dec-06 Mellon Financial Corporation
Inc.
U.S. Div Bank of New York Company, Inc. U.S. 17,619$ 100%
Jun-09 Barclays Global Investors U.S. Div BlackRock Inc. U.S. 13,502 100%
Feb-06 Merrill Lynch Investment
Managers
U.S. Div BlackRock Inc. U.S. 9,602 100%
Jun-07 Nuveen Investments Inc. U.S. Div MBO (Madison Dearborn
Partners, LLC)
U.S. 5,750 100%
Sep-97 Mercury Asset Management U.K. Inst Merrill Lynch & Co. U.S. 5,326 100%
Sep-05 Global Asset Management & 3
private banks
Switzerland Alt Julius Baer Holding AG Switzerland 4,600 100%
Jun-07 The Blackstone Group U.S. Alt IPO U.S. 4,130 12%
Apr-00 Robert Fleming Holdings
Limited
U.K. Div Chase Manhattan Corp. U.S. 4,100 100%
Feb-07 Putnam Investments U.S. MuFu Power Financial Corporation Canada 3,900 100%
Jun-05 Citigroup Asset Management U.S. Div Legg Mason, Inc. U.S. 3,700 100%

page 33
* * *
General Information and Disclaimers
This report has been prepared and issued by the Asset Management Investment Banking
Group of Sandler O’Neill + Partners, L.P., a registered broker-dealer and a member of
the Financial Industry Regulatory Authority, Inc. The information contained in this report
(except information regarding Sandler O’Neill and its affiliates) was obtained from various
sources that we believe to be reliable, but we do not guarantee its accuracy or
completeness. Additional information is available upon request. The information and
opinions contained in this report speak only as of the date of this report and are subject to
change without notice. Contact information for Sandler O’Neill and the authors of this
report is available at www.sandleroneill.com.
This report has been prepared and circulated for general information only and presents
the author’s views of general market and economic conditions and specific industries
and/or sectors. This report is not intended to and does not provide a recommendation
with respect to any security. This report does not take into account the financial position
or particular needs or investment objectives of any individual or entity. The investment
strategies, if any, discussed in this report may not be suitable for all investors. Investors
must make their own determinations of the appropriateness of an investment strategy
and an investment in any particular securities based upon the legal, tax and accounting
considerations applicable to such investors and their own investment objective. Investors
are cautioned that statements regarding future prospects may not be realized and that
past performance is not necessarily indicative of future performance.
This report does not constitute an offer, or a solicitation of an offer, to buy or sell any
securities or other financial instruments, including any securities mentioned in this report.
Nothing in this report constitutes or should be construed to be accounting, tax,
investment or legal advice.
Neither this report, nor any portion thereof, may be reproduced or redistributed by any
person for any purpose without the written consent of Sandler O’Neill.
© 2014 Sandler O'Neill + Partners, L.P. All rights reserved.

page 34 The Ris ing Tide | March 2014
Sandler O’Neill is proud to have advised on or managed the following asset management
transactions in 2013:
November 2013
Placement Agent and Financial Advisor to Snowden Capital Advisors
has received a strategic growth capital investment from
SNOWDEN
March 2013
Financial Advisor to Principal Global Investors
has acquired a majority stake in
April 2013
Financial Advisor to Strategic Partners
has sold Strategic Partners to
December 2013
$2,600,000,000Financial Advisor to KKR Financial
Holdings
has been acquired by
March 2013
Initial Public Offering
$381,368,382
Co-Manager
March 2013
Initial Public Offering
$175,950,000
Bookrunner
HF2 FinancialManagement, Inc.
May 2013
Follow-on Offering
$430,675,000
Co-Manager
June 2013
Initial Public Offering
$60,602,157
Lead Bookrunner
September 2013
Follow-on Offering
$201,249,830
Co-Manager
October 2013
Follow-on Offering
$309,120,000
Co-Manager