asset management industry sector presentation -...
TRANSCRIPT

Asset Management Industry
Sector Presentation
Mar 2015
Overview Regional IndustryGlobal Industry Domestic Industry

Outline
Global Dynamics
Regional Industry Dynamics | India
Domestic Industry
Overview Regional IndustryGlobal Industry Domestic Industry

Asset Management –
Global Trends
Overview Regional IndustryGlobal Industry Domestic Industry
0%
7%
14%
21%
28%
35%
42%
49%
-
5,000
10,000
15,000
20,000
25,000
30,000
35,000
Dec-07 Dec-08 Dec-10 Dec-12 Sep-14
%age
US
$ b
lnGlobal AUMs as % of GDP
AUMs %age
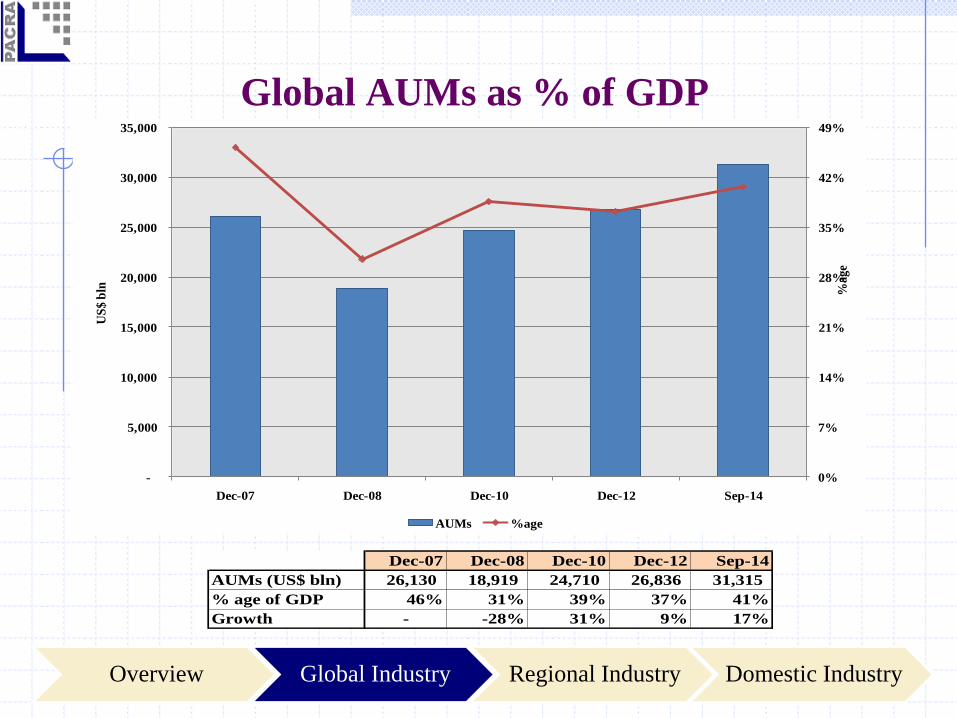
Global AUMs as % of GDP
Overview Regional IndustryGlobal Industry Domestic Industry
Dec-07 Dec-08 Dec-10 Dec-12 Sep-14
AUMs (US$ bln) 26,130 18,919 24,710 26,836 31,315
% age of GDP 46% 31% 39% 37% 41%
Growth - -28% 31% 9% 17%

AUMs Regional Mix
56% 55% 56% 57%
33% 32% 31% 31%
11% 12% 12% 12%
0
7,000
14,000
21,000
28,000
35,000
Dec-08 Dec-10 Dec-12 Sep-14
0%
20%
40%
60%
80%
100%
US
$ b
ln
%a
ge
AUMs -Regional Mix
Americas Europe Asia and Pacific Africa AUMs
Overview Regional IndustryGlobal Industry Domestic Industry

33%
15%16%
36%
Europe
Luxembourg France Ireland Others
Country Wise AUM Split –Sep 14
57%31%
12%0%
The World
Americas Europe Asia and Pacific Africa
87%
6%6%1%
Americas
USA Brazil Canada Others
US$ 17.8tln
US$ 31.3tln
US$ 9.7tln
US$ 3.6tln US$ 0.14tln
Overview Regional IndustryGlobal Industry Domestic Industry

19%
5%
31%
5%
20%
5%
18%
4%
14%
4%
16%
20%
18%
18%
22%
18%
26%
18%
24%
20%
47%
41%
34%
41%
42%
40%
40%
38%
44%
37%
17%
34%
17%
36%
16%
37%
16%
40%
18%
40%
0%
20%
40%
60%
80%
100%
Split No. Split No. Split No. Split No. Split No.
Dec-07 Dec-08 Dec-10 Dec-12 Sep-14
Money Market Income Equity Others AUMs
Categories & Number of Funds
Overview Regional IndustryGlobal Industry Domestic Industry

14% 15% 12% 12% 15%
24% 24% 29%
10% 3%
44%48%
37%
45%
24%
18% 12%22%
32%
58%
0%
20%
40%
60%
80%
100%
World Americas Europe Asia & Pacific Africa
Regional Categorical Split
Money Market Income Equity Others
Regional Category Wise Split –Sep14
Overview Regional IndustryGlobal Industry Domestic Industry

Best & Worst Capital Markets -2014
Overview Regional IndustryGlobal Industry Domestic Industry
Rank CountryBest
Returns
1 Argentina 55%
2 China 43%
3 India 30%
4 Pakistan 26%
5 Turkey 25%
Rank CountryWorst
Returns
1 Russia -45%
2 Greece -27%
3 Nigeria -21%
4 Portugal -19%
5 Kuwait -14%

Rank Name Region CY13 CY14 Change1 BlackRock U.S. 4.32 4.65 8%
2 Vanguard Group U.S. 2.75 3.00 9%
3 State Street Global U.S. 2.34 2.40 2%
4 Allianz Group Germany 2.39 1.91 -20%
5 Prudential Financial U.S. 1.11 1.76 59%
6 AXA Group France 1.53 1.75 14%
7 Fidelity Investments U.S. 1.71 1.74 2%
8 J.P. Morgan Chase U.S. 1.60 1.70 6%
9 Bank of New York Mellon U.S. 1.58 1.70 7%
10 BNP Paribas France 1.33 1.52 15%
World’s Largest Asset Managers
figures in US$ tln
*the AUMs of top10 AMC comprise ~70% of global AUMs
Overview Regional IndustryGlobal Industry Domestic Industry

Overview Regional IndustryGlobal Industry Domestic Industry
India –Asset Management Industry

AUMs v/s Deposits
Overview Regional IndustryGlobal Industry Domestic Industry
Figures in US$ bln^ Mar-08 Mar-10 Mar-12 Mar-14 Dec-14
GDP 782 1,016 1,414 1,782 *1,856
Deposits 521 745 1,013 1,339 1,298
AUMs 79 96 92 129 165
^Exchange rate as published on oanda.com for 31-Dec-2014 (US$ 1 = INR 0.01569)
*Based on World Bank's forecast of 2014

Overview Regional IndustryGlobal Industry Domestic Industry
Categories & Number of Funds
18%
6%13%
6%14%
4%
16%
3%
17%
3%
44%
56%
51%
46%
50%62%
56%
68%48%
70%
31% 28%28%
35%
27% 23%20% 19%
27%19%
7% 10% 8%13% 9% 10% 7% 9% 7% 8%
0%
20%
40%
60%
80%
100%
Split No. Split No. Split No. Split No. Split No.
Mar-08 Mar-10 Mar-12 Mar-14 Dec-14
Money Market Income Equity Others
Mar-07 Mar-08 Mar-10 Mar-14 Dec-14
AUMs (US$ bln)^ 79 96 92 129 165
No. of Funds 15 14 21 26 29
^Exchange rate as published on oanda.com for 31-Dec-2014 (US$ 1 = INR 0.01569)
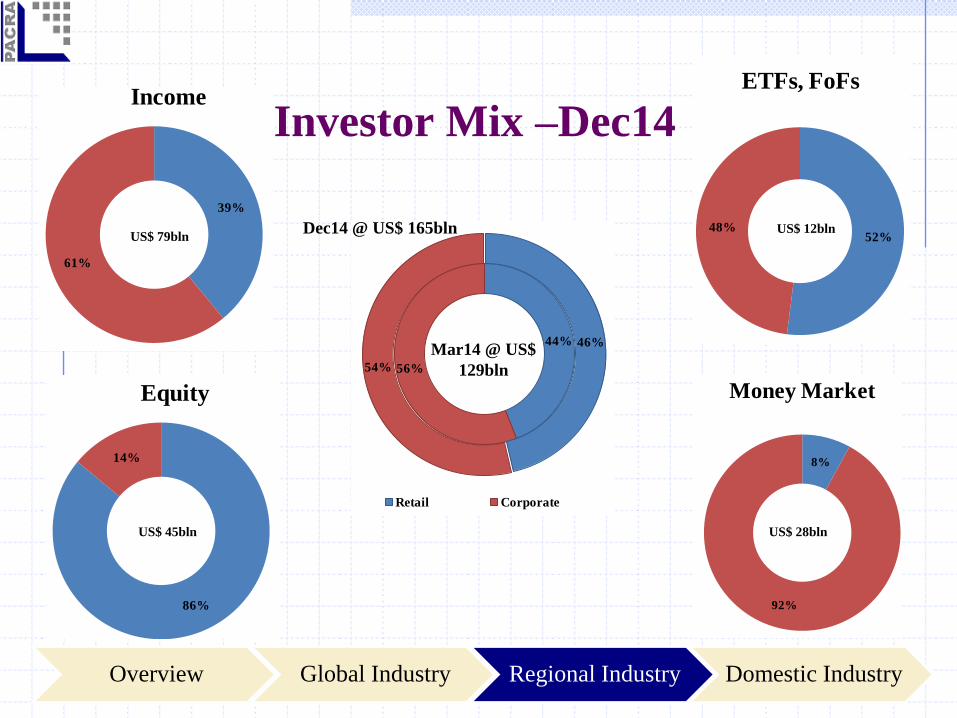
Investor Mix –Dec14
44%
56%
46%
54%
Retail Corporate
Mar14 @ US$
129bln
Dec14 @ US$ 165bln
86%
14%
Equity
52%48%
ETFs, FoFs
8%
92%
Money Market
39%
61%
Income
Overview Regional IndustryGlobal Industry Domestic Industry
US$ 79bln
US$ 45bln US$ 28bln
US$ 12bln

Largest Indian Asset Managers
Overview Regional IndustryGlobal Industry Domestic Industry
*As of Dec14, there are 45 AMCs functioning in India
AUMs Mkt. sh AUMs Mkt. sh AUMs Mkt. sh1 HDFC Mutual Fund 16 12% 18 12% 24 14%
2 ICICI Prudential Mutual Fund 14 11% 17 12% 21 12%
3 Reliance Mutual Fund 15 12% 17 12% 20 11%
4 Birla Sun Life Mutual Fund 12 9% 14 10% 17 10%
5 UTI Mutual Fund 11 8% 12 8% 14 8%
6 SBI Mutual Fund 9 7% 10 7% 11 7%
7 Franklin Templeton Mutual Fund 7 5% 7 5% 10 6%
8 IDFC Mutual Fund 5 4% 7 5% 8 4%
9 Kotak Mahindra Mutual Fund 6 4% 5 4% 6 4%
10 DSP BlackRock Mutual Fund 5 4% 5 4% 6 3%
Others 30 23% 32 22% 37 21%
Total (US$bln) 129 143 175
S/No. AMCMar-13 Mar-14 Dec-14

Overview Regional IndustryGlobal Industry Domestic Industry
Pakistan –Asset Management Industry

Overview Regional IndustryGlobal Industry Domestic Industry
Figures in PKR bln Jun-08 Jun-10 Jun-12 Jun-14 Dec-14
GDP 9,922 13,844 20,047 25,402 *26,088
Deposits 3,832 4,661 6,403 8,082 8,342
AUMs 341 234 409 428 471
*Based on the World Bank's forecast for 2014
3%2% 2% 2% 2%
39%
34%32% 32% 32%
0%
10%
20%
30%
40%
50%
-
100
200
300
400
500
Jun-08 Jun-10 Jun-12 Jun-14 Dec-14
%a
ge
PK
R b
ln
AUMs AUMs as % of GDP Deposits as % of GDP
AUMs v/s Deposits

Regulatory Environment
Overview Regional IndustryGlobal Industry Domestic Industry
FY14 FY15 FY14 FY15 FY14 FY15 FY14 FY15
Banks 35.0% 35.0% 35.0% 35.0% 12.5% 12.5% 12.5% 12.5%
Corporates 10.0% 12.5% 8.0% 12.5% - 10.0% - -
Individuals 10.0% 12.5% 8.0% 12.5% - 10.0% - -
Capital Gain Tax on Money Market & Income Funds
Investor0-6 months 6-12 months 1-2 years 2 years +
FY14 FY15 FY14 FY15
Banks 25% 25% 10% 10%
Corporates 10% 25% 10% 10% - 12.5%
Individuals 10% 10% 10% 10% - 12.5%
StockInvestor
Tax on Cash Dividend
Money Market &
Income
Asset Management Services PKR 200mln
Advisory Services PKR 30mln
Minimum Capital Requirement

Category Wise Split
Overview Regional IndustryGlobal Industry Domestic Industry
36%
19%
34%
19%
28%
19%
28%
19%25%
19%
13%
22%
13%
21%
15%
21%
15%
22%15%
21%
34%
26%
35%
26%
36%
25%
36%
24%
37%
23%
1%
5%
3%
5%
4%
5%
4%
5%
5%
5%
8%
6%
9%
7%
10%
7%
9%
8%
11%
10%
7%
24%
6%
23%
7%
24%
8%
22%
7%
22%
0%
20%
40%
60%
80%
100%
Split No. Split No. Split No. Split No. Split No.
Dec-13 Mar-14 Jun-14 Sep-14 Dec-14
Money Market Income Equity Capital Protected Government Bond Others
Dec-13 Mar-14 Jun-14 Sep-14 Dec-14
AUMs (PKR bln) 413 448 428 437 471
No. of Funds 195 200 203 209 215
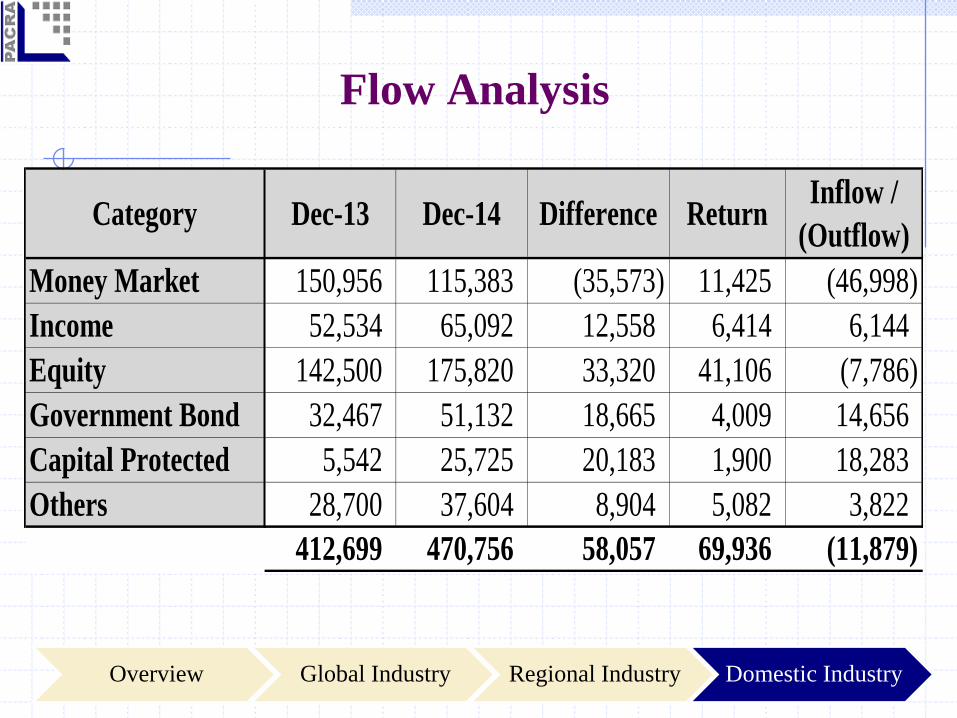
Flow Analysis
Overview Regional IndustryGlobal Industry Domestic Industry
Money Market 150,956 115,383 (35,573) 11,425 (46,998)
Income 52,534 65,092 12,558 6,414 6,144
Equity 142,500 175,820 33,320 41,106 (7,786)
Government Bond 32,467 51,132 18,665 4,009 14,656
Capital Protected 5,542 25,725 20,183 1,900 18,283
Others 28,700 37,604 8,904 5,082 3,822
412,699 470,756 58,057 69,936 (11,879)
Category Dec-13 Dec-14 Difference ReturnInflow /
(Outflow)

*As of Jan15, there are 23 AMCs functioning in Pakistan. The top 10 AMCs represent ~86% of
the total domestic AUMs.
Overview Regional IndustryGlobal Industry Domestic Industry
Total Mkt.sh
1 NIT 99 20%
2 Meezan 66 13%
3 UBL 60 12%
4 NAFA 53 11%
5 MCB-AH 48 9%
6 Allied 32 6%
7 PICIC 28 6%
8 HBL 20 4%
9 Atlas 17 3%
10 JS 11 2%
Others 69 14%
Total 505
Jan-15AMCS/No.
Pakistan’s Largest Asset Managers
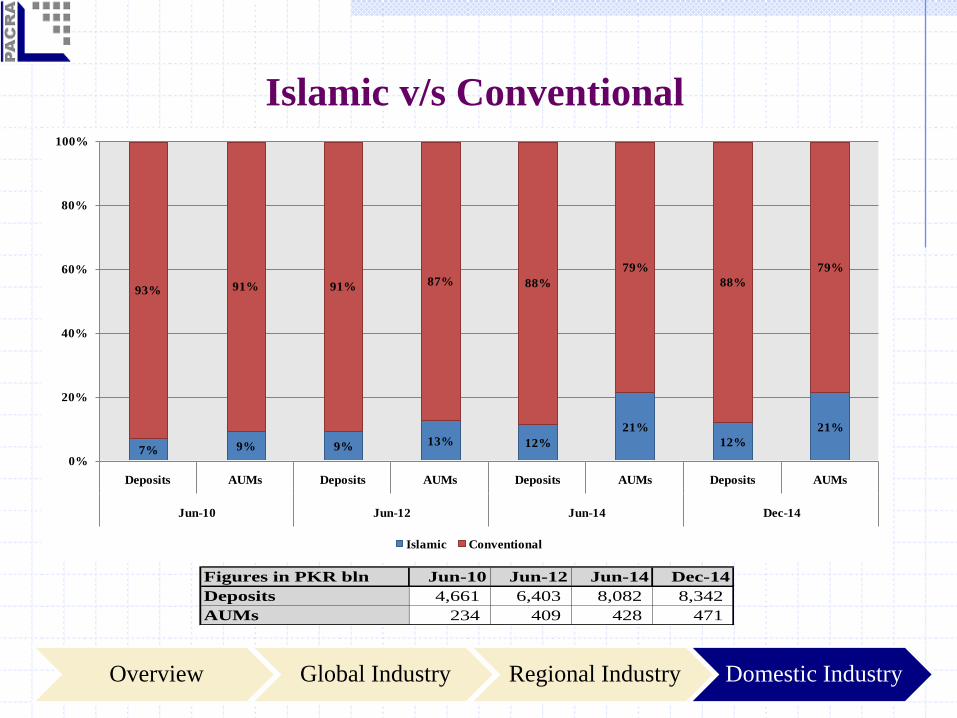
Islamic v/s Conventional
Overview Regional IndustryGlobal Industry Domestic Industry
7% 9% 9% 13% 12%
21%
12%
21%
93% 91% 91% 87% 88%
79%
88%
79%
0%
20%
40%
60%
80%
100%
Deposits AUMs Deposits AUMs Deposits AUMs Deposits AUMs
Jun-10 Jun-12 Jun-14 Dec-14
Islamic Conventional
Figures in PKR bln Jun-10 Jun-12 Jun-14 Dec-14
Deposits 4,661 6,403 8,082 8,342
AUMs 234 409 428 471

Separately Managed Accounts
Overview Regional IndustryGlobal Industry Domestic Industry
No. of Accounts Jun-11 Jun-12 Jun-13 Jun-14 Dec-14
Discretionary Portfolios 104 136 248 492 28
Non Discretionary Portfolios 19 21 28 26 539
123 157 276 518 567
10,793 14,255
23,267
35,857
44,048 24,199
30,148
33,217
36,258
37,781
-
17,000
34,000
51,000
68,000
85,000
Jun-11 Jun-12 Jun-13 Jun-14 Dec-14
PK
R m
ln
Discretionary Portfolios Non Discretionary Portfolios

Key Findings
Domestic AMC market comparative size reflecting gap with global and
regional markets.
AUMs concentrated with few large AMCs in line with the global and regional
trends.
Investors preference towards Fixed Income Funds as compared to equity funds
in contrast to the global trend.
Investor facilitation and technological advancement lacks quality in
comparison to banking sector resulting in reduced retail penetration.
Transition of AUMs towards longer duration funds from Money Market
Funds.
Islamic Funds & Separately Managed Accounts gaining momentum
Innovative products help in increasing AUM base.
Overview Regional IndustryGlobal Industry Domestic Industry

Bibliography
1. http://www.pionline.com
2. http://www.efama.org
3. http://www.ici.org
4. http://www.ipe.com
5. http://www.ey.com/
6. http://www.pwc.com/
7. https://www.deloitte.com
8. http://www.kpmg.com
9. http://money.cnn.com/interactive/investing/best-performing-global-markets/
10. https://www.amfiindia.com/
11. http://www.mufap.com.pk/
12. http://www.rbi.org.in
13. http://www.imf.org/
14. http://secp.gov.pk/
15. http://www.li.com.pk/
16. http://www.sbp.org.pk/
17. http://www.towerswatson.com/
18. http://www.worldbank.org/

DISCLAIMERPACRA has used due care in preparation of this document. Our information has been obtained
from sources we consider to be reliable but its accuracy or completeness is not guaranteed.
The information in this document may be copied or otherwise reproduced, in whole or in part,
provided the source is duly acknowledged. The presentation should not be relied upon as
professional advice.
Analysts Rai Umar Zafar
Manager Ratings
+92 42 3586 9504
Suffiyan Saleem
Senior Financial Analyst
+92 42 3586 9504
Saad Khan
Associate Analyst
+92 42 3586 9504