2013 annual report - cdn.northerntrust.com · annual report to shareholders northern trust...
TRANSCRIPT

A n n u A l r e p o r t to shAreholdersNorthern Trust Corporation
t W o t h o u s A n d t h I r t e e n
Northern Trust Corporation
5 0 s o u t h l A s A l l e s t r e e t
c h I c Ag o , I l l I n o I s 6 0 6 0 3
n o r t h e r n t r u s t . c o m
no
rthern
trust c
orpo
rAtIo
n 2013 A
nn
uA
l report to
shA
reho
lders
.75 Point in sPine Q1 VersionNorthern Trust Bank #1019102013 AR Cover Front 02.12.2014CYAN MAG YELL BLK pms343
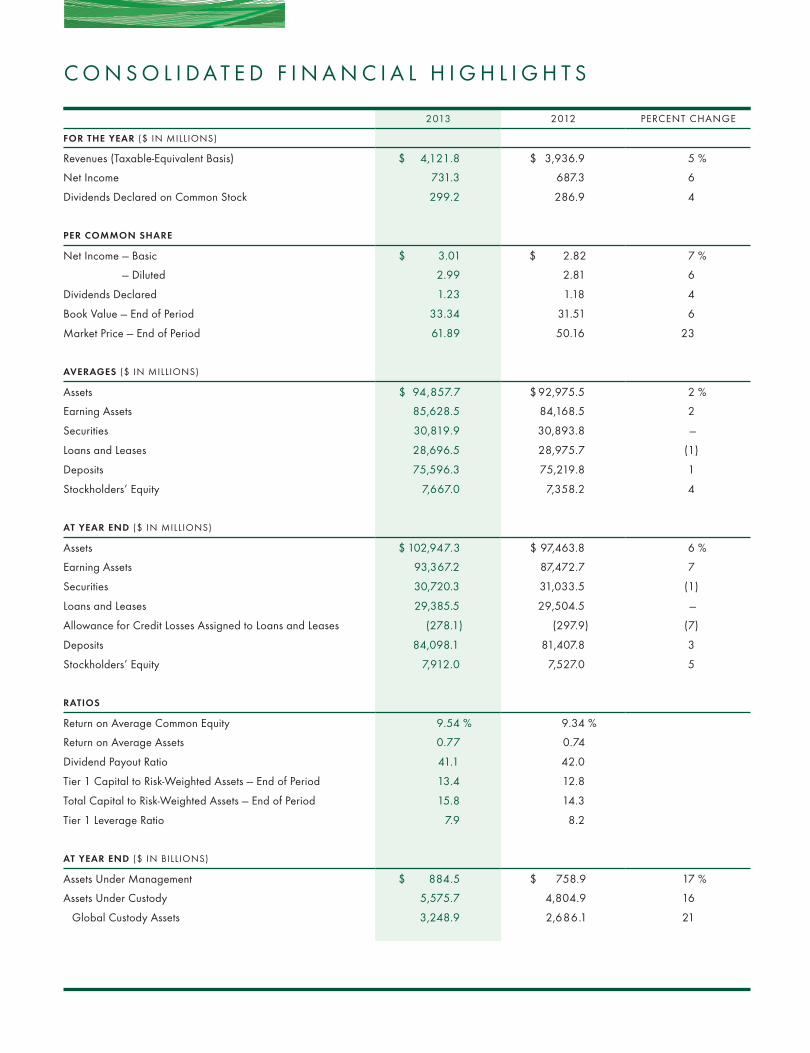
2013 2012 percent chAnge
For the year ($ In mIllIons)
revenues (taxable-equivalent Basis) $ 4,121.8 $ 3,936.9 5 %
net Income 731.3 687.3 6
dividends declared on common stock 299.2 286.9 4
Per Common Share
net Income — Basic $ 3.01 $ 2.82 7 %
— diluted 2.99 2.81 6
dividends declared 1.23 1.18 4
Book Value — end of period 33.34 31.51 6
market price — end of period 61.89 50.16 23
averageS ($ In mIllIons)
Assets $ 94,857.7 $ 92,975.5 2 %
earning Assets 85,628.5 84,168.5 2
securities 30,819.9 30,893.8 —
loans and leases 28,696.5 28,975.7 (1)
deposits 75,596.3 75,219.8 1
stockholders’ equity 7,667.0 7,358.2 4
at year end ($ In mIllIons)
Assets $ 102,947.3 $ 97,463.8 6 %
earning Assets 93,367.2 87,472.7 7
securities 30,720.3 31,033.5 (1)
loans and leases 29,385.5 29,504.5 —
Allowance for credit losses Assigned to loans and leases (278.1) (297.9) (7)
deposits 84,098.1 81,407.8 3
stockholders’ equity 7,912.0 7,527.0 5
ratioS
return on Average common equity 9.54 % 9.34 %
return on Average Assets 0.77 0.74
dividend payout ratio 41.1 42.0
tier 1 capital to risk-Weighted Assets — end of period 13.4 12.8
total capital to risk-Weighted Assets — end of period 15.8 14.3
tier 1 leverage ratio 7.9 8.2
at year end ($ In BIllIons)
Assets under management $ 884.5 $ 758.9 17 %
Assets under custody 5,575.7 4,804.9 16
global custody Assets 3,248.9 2,686.1 21
c o n s o l I d A t e d F I n A n c I A l h I g h l I g h t s
the 2013 northern trust corporation Annual report is printed on 20% recycled paper
made from fiber sourced from well-managed forests and is independently certified to the
Forest stewardship counciltm (Fsc®) standards.
© northern trust corporation
Q1 VersionNorthern Trust Bank #1019102013 AR Cover Back 02.14.2014CYAN MAG YELL BLK pms343

Northern Trust Corporation is a leading provider of asset servicing, fund administration,
asset management, fiduciary, and banking solutions for corporations, institutions, families,
and individuals worldwide. A financial holding company headquartered in Chicago,
Northern Trust serves clients in more than 40 countries from offices in 18 U.S. states,
Washington, D.C., and 18 international locations in North America, Europe, the Middle
East, and the Asia-Pacific region.
As of December 31, 2013, Northern Trust had assets under custody of $5.6 trillion, assets
under management of $884.5 billion, and banking assets of $102.9 billion. Founded in
1889, Northern Trust has earned distinction as an industry leader combining exceptional
service and expertise with innovative capabilities and technology.
A L E A D I N G P R O V I D E R

For Northern Trust, 2013 was a year
of continued growth and ongoing
investment in our business. We
cultivated many new relationships and
expanded existing relationships across our
wealth management, asset management, and
asset servicing businesses. We also enhanced
our capabilities, geographic presence, and
office network.
Trust, investment, and other servicing
fees, which represent the single largest
source of revenue to the company, rose
8 percent in 2013. Total revenues increased
5 percent, reflecting the effects of the
ongoing low interest-rate environment.
Our Driving Performance philosophy,
instituted two years ago, continued to deliver
meaningful value to our clients, shareholders,
and partners by improving productivity.
Due to those efforts, we were able to manage
expenses while also continuing to invest in
our business and respond to the demands of
the new regulatory environment.
By the end of 2013, Driving Performance
had surpassed our original goal of $250 million.
These efforts contributed to a net income
increase of 6 percent to $731 million, resulting
in a return on equity of 9.5 percent. We
continue to make steady progress toward our
return on equity target range of 10 percent to
15 percent. Further, we increased our quarterly
dividend to $0.31 per share and repurchased
5.5 million shares, returning $609 million
in capital to our shareholders – a 35 percent
increase from $450 million in 2012.
WEALTH MANAGEMENT
Northern Trust has provided asset
management, fiduciary, and banking services
for affluent individuals and families for
nearly 125 years. In 2013, our assets under
management and assets under custody for
Wealth Management clients increased
12 percent and 11 percent, respectively.
The continued rollout of our proprietary Goals
Driven Investing methodology contributed
greatly to these results. This unique approach
to discussing our Wealth Management
clients’ goals and aspirations relative to asset
productivity led to very strong new business
from both existing clients and those new to
Northern Trust. This type of innovation is
just one of many reasons we were named
Best Private Bank for the fifth consecutive
year by the Financial Times Group.
T O O U R S H A R E H O L D E R S
2 013 A N N U A L R E P O R T T O S H A R E H O L D E R S | N O R T H E R N T R U S T C O R P O R A T I O N 2
FREDERICK H. WADDELLchairman and
chief executive officer
WILLIAM L. MORRISONpresident and
chief operating officer
Northern Trust Bank #1019102013 AR pg 2 02.13.2014CYAN MAG YELL BLK pms343

letter to shareholders
2 013 A N N U A L R E P O R T T O S H A R E H O L D E R S | N O R T H E R N T R U S T C O R P O R A T I O N 3
Ongoing investments in multiple
capabilities continue to enhance the Wealth
Management client experience overall. In
2013 we expanded our fiduciary, wealth
education and planning, and business owner
consulting services to provide clients a
greater breadth and depth of expertise. We
also augmented our Global Family Office
offering, increasing resources in London and
the Middle East.
The daily experience each client has with
Northern Trust is critically important to us,
and in 2013 we continued to enhance our
interactions with them using new channels
and technology. We expanded our efforts to
engage clients via social media through the
use of Twitter®, YouTube®, and LinkedIn®.
Technology is part of our everyday client
experience, with our new smart phone and
tablet-based remote deposit capture and
WealthPath® applications, and redesigned
Private Passport® capabilities providing
more avenues of communication.
CORPORATE & INSTITUTIONAL SERVICES
Our Corporate & Institutional Services (C&IS)
business produced strong growth in our client
base as we continued expanding our global
footprint and developing broader and deeper
capabilities to help clients meet their needs.
New business success around the world,
coupled with strong financial markets, led
to an increase in C&IS assets under custody
of 17 percent to $5.1 trillion, while our C&IS
trust, investment, and other servicing fees
rose 8 percent.
We expanded into new geographies
in 2013, establishing offices in Frankfurt,
Germany, and Riyadh, Saudi Arabia. In early
2014, we opened a representative office in
Kuala Lumpur, Malaysia, and later in the year
will open a new operations center in Manila,
Philippines. Northern Trust’s expanding
footprint of 18 offices outside the United
States reflects our efforts to strategically
locate our expertise and talent to best serve
our clients.
In 2013, we worked to bring
creative business ideas to our clients
and the marketplace, delivering original
solutions for data analytics, regulatory
requirements, and shadow accounting.
Our collaborative approach of working
alongside clients to develop solutions to
their asset servicing needs gives us a strong
competitive advantage – helping us earn
new relationships such as Danish pension
fund Arbejdsmarkedets Tillægspension,
Emory University, and J O Hambro Capital
Management, and deepen our relationship
with Allianz Global Investors.
ASSET MANAGEMENT
Northern Trust’s asset management expertise
is deep, global, and growing. With $884.5
billion in assets under management, we
bring innovative solutions to our clients’
investment needs across numerous asset
classes and through a variety of vehicles. Our
strong investment culture leverages fiduciary,
asset allocation, advisory, and quantitative
expertise – including more than 300 partners
worldwide with the designation of Chartered
Financial Analyst.
FlexShares®, our successful family of
exchange traded funds (ETF) that launched
in September 2011, grew to more than
$6.7 billion in assets by the end of 2013.
FlexShares is now the 15th largest ETF
sponsor in the United States. We also
Northern Trust Bank #1019102013 AR pg 3 02.12.2014CYAN MAG YELL BLK pms343
letter to shareholders
grew our defined contribution business,
which exceeded $100 billion in assets
under management by year end, while
our target date funds exceeded $5 billion.
Internationally, our assets under
management exceeded $180 billion.
OUTLOOK
Northern Trust’s long-term outlook
continues to be very positive. The market
for our services continues to expand as the
wealth of our personal and institutional
clients is created and invested around
the world.
In the near term, however, we face
continued challenges from cyclical and
secular trends, such as the continued tepid
economic recovery and increasing risk and
compliance requirements.
Low interest rates dampened our
revenues by narrowing the spread we earned
in 2013 and reducing fees received on our
money market funds, an environment
we expect will persist through 2014 and
beyond. At the same time, increased
regulation is driving our expenses higher
due to the increased resources required
for compliance.
The combination of sustainable revenue
enhancements and expense reductions
resulting from our Driving Performance
efforts has created capacity essential to our
continued investment for the future. We have
developed strong management discipline in
this area and will continue to seek revenue
and expense management improvements
into 2014 and beyond.
THANKS
Every day, our partners put into practice the
values of Service, Expertise, and Integrity
that have distinguished Northern Trust for
more than a century. This past year was no
exception, as the nearly 15,000 Northern
Trust partners around the world worked
hard to achieve new milestones. For this, I
thank all of them for their incredible efforts.
Retiring Executive Vice President and
Chief Administrative Officer Tim Moen
deserves special thanks for the leadership,
work ethic, and friendship he provided to so
many of us. We wish him well as he enters
this new phase of life.
To our clients, our deepest thanks.
You provide us with the opportunity to
continually create solutions to meet your
financial needs. We are honored to serve
you and to receive your ongoing trust and
business. We take that responsibility seriously
and look forward to working with you in
2014 and the years ahead.
And to our shareholders, thank you
for your continued support. As we enter
Northern Trust’s 125th year, we remain
focused on consistently delivering superior
financial performance.
FREDERICK H. WADDELL
CHAIRMAN AND CHIEF EXECUTIVE OFFICER
FEBRUARY 25, 2014
2 013 A N N U A L R E P O R T T O S H A R E H O L D E R S | N O R T H E R N T R U S T C O R P O R A T I O N 4
Northern Trust Bank #1019102013 AR pg 4 02.12.2014CYAN MAG YELL BLK pms343
ONE OF THE “WORLD’S MOST ADMIRED COMPANIES” 7TH CONSECUTIVE YEAR
FORTUNE MAGAZINE
100 BEST CORPORATE CITIZENS
CORPORATE RESPONSIBILITY MAGAZINE
BEST PRIVATE BANK IN NORTH AMERICA 5TH CONSECUTIVE YEAR
FINANCIAL TIMES GROUP
ONE OF THE BEST PRIVATE WEALTH MANAGERS
PRIVATE ASSET MANAGEMENT
ONE OF THE BEST PLACES TO WORK IN MONEY MANAGEMENT
PENSIONS & INVESTMENTS
U.S. FIXED INCOME MUNICIPAL MANAGER OF THE YEAR
INSTITUTIONAL INVESTOR
HEDGE FUND ADMINISTRATOR OF THE YEAR – AMERICAS 2ND CONSECUTIVE YEAR
CUSTODY RISK
BEST CUSTODY SPECIALIST – INSTITUTIONAL 5TH CONSECUTIVE YEAR
THE ASSET
C O N S I S T E N T L E A D E R S H I P
Northern Trust Bank #1019102013 AR pg 5 02.12.2014CYAN MAG YELL BLK

Frederick H. Waddellchairman and
chief executive officer
William L. Morrisonpresident and
chief operating officer
Kelly R. Welshexecutive vice president
general counsel
Joyce M. St.Clairpresident
operations & technology
Jana R. Schreuderpresident
wealth management
Michael G. O’Gradyexecutive vice presidentchief financial officer
Stephen N. Potterpresident
asset management
S. Biff Bowmanexecutive vice president
human resources
Jeffrey D. Cohodesexecutive vice president
chief risk officer
Steven L. Fradkinpresident
corporate & institutional services
2 013 A N N U A L R E P O R T T O S H A R E H O L D E R S | N O R T H E R N T R U S T C O R P O R A T I O N 6
M A N A G E M E N T G R O U P
Northern Trust Bank #1019102013 AR pg 6 02.14.2014CYAN MAG YELL BLK pms343

2 013 A N N U A L R E P O R T T O S H A R E H O L D E R S | N O R T H E R N T R U S T C O R P O R A T I O N 7
B O A R D O F D I R E C T O R S
Frederick H. WaddellChairman and Chief Executive OfficerNorthern Trust Corporation and The Northern Trust Company (6)
Linda Walker BynoePresident and Chief Executive OfficerTelemat Ltd.Project management and consulting firm (1, 2, 6)
Nicholas D. ChabrajaRetired Chairman and Chief Executive OfficerGeneral Dynamics CorporationGlobal defense, aerospace, and other technology products manufacturer (1, 4, 6)
Susan CrownVice PresidentHenry Crown and CompanyGlobal company with diversified investments in banking, transportation, real estate, and other industries;Chief Executive OfficerOwl Creek Partners, LLPVenture capital investment vehicle;Chairman and FounderSusan Crown Exchange Inc.Social investment organization that connects talent and innovations with market forces to drive social change (4, 5)
Dipak C. JainChaired Professor of MarketingINSEADInternational graduate business school (3, 4, 6)
Robert W. LaneRetired Chairman and Chief Executive OfficerDeere & CompanyGlobal provider of agricultural, construction, and forestry equipment, and financial services (1, 5)
Edward J. MooneyRetired Délégué Général – North AmericaSuez Lyonnaise des EauxGlobal provider of energy, water, waste, and communications services;Retired Chairman and Chief Executive OfficerNalco Chemical CompanyManufacturer of specialized service chemicals (1, 2, 4, 6)
Jose Luis PradoPresidentQuaker Oats North America, a division of PepsiCo, Inc. Global food and beverage company (2, 3)
John W. RoweChairman EmeritusExelon CorporationProducer and wholesale marketer of energy (4, 5, 6)
Martin P. SlarkVice Chairman and Chief Executive OfficerMolex IncorporatedManufacturer of electronic, electrical, and fiber optic interconnection products and systems (2, 3)
David H.B. Smith Jr.Executive Vice President – Policy & Legal Affairs and General CounselMutual Fund Directors ForumNonprofit membership organization for investment company directors (1, 2)
Charles A. Tribbett IIIManaging DirectorRussell Reynolds AssociatesGlobal executive recruiting firm (3, 5)
advisory directorSir John R.H. Bond Former ChairmanXstrata plcGlobal diversified mining group (2, 3)
board committees1. Audit Committee2. Business Risk Committee3. Business Strategy Committee4. Compensation and Benefits Committee5. Corporate Governance Committee6. Executive Committee
Northern Trust Bank #1019102013 AR pg 7 02.12.2014CYAN MAG YELL BLK pms343

N O R T H E R N T R U S T . C O M
Northern Trust Bank #1019102013 AR pg 8 02.12.2014CYAN MAG YELL BLK pms343

F I N A N C I A L R E V I E W
10Consolidated Highlights of FinancialCondition and Results of Operations
11Management’s Discussion and Analysis of
Financial Condition and Results of Operations
54Management’s Report on Internal Control Over
Financial Reporting
55Report of Independent Registered Public Accounting Firm with
Respect to Internal Control over Financial Reporting
56Consolidated Financial Statements
60Notes to Consolidated Financial Statements
118Report of Independent Registered Public Accounting Firm
119Consolidated Financial Statistics
122Board of Directors
123Senior Officers
124Corporate Information

consolidated highlights of financial condition and results of operations
SUMMARY OF SELECTED CONSOLIDATED FINANCIAL DATA
($ In Millions Except Per Common Share Information) 2013 2012 2011 2010 2009
FOR THE YEAR ENDED DECEMBER 31,
Noninterest IncomeTrust, Investment and Other Servicing Fees $ 2,609.8 $ 2,405.5 $ 2,169.5 $ 2,081.9 $ 2,083.8Foreign Exchange Trading Income 244.4 206.1 324.5 382.2 445.7Treasury Management Fees 69.0 67.4 72.1 78.1 81.8Security Commissions and Trading Income 68.0 73.6 60.5 60.9 62.4Other Operating Income 166.5 154.9 158.1 146.3 136.8Investment Security Gains (Losses), net (1.5) (1.7) (23.9) (20.4) (23.4)
Total Noninterest Income 3,156.2 2,905.8 2,760.8 2,729.0 2,787.1
Net Interest Income 933.1 990.3 1,009.1 918.7 999.8
Total Revenue 4,089.3 3,896.1 3,769.9 3,647.7 3,786.9
Provision for Credit Losses 20.0 25.0 55.0 160.0 215.0Noninterest Expense
Compensation 1,306.6 1,267.4 1,267.2 1,108.0 1,099.7Employee Benefits 257.5 258.2 258.2 237.6 242.1Outside Services 564.1 529.2 552.8 460.4 424.5Equipment and Software 377.6 366.7 328.1 287.1 261.1Occupancy 173.8 174.4 180.9 167.8 170.8Visa Indemnification Benefit – – (23.1) (33.0) (17.8)Other Operating Expense 314.2 282.9 267.1 270.0 136.3
Total Noninterest Expense 2,993.8 2,878.8 2,831.2 2,497.9 2,316.7
Income before Income Taxes 1,075.5 992.3 883.7 989.8 1,255.2Provision for Income Taxes 344.2 305.0 280.1 320.3 391.0
Net Income $ 731.3 $ 687.3 $ 603.6 $ 669.5 $ 864.2Net Income Applicable to Common Stock $ 731.3 $ 687.3 $ 603.6 $ 669.5 $ 753.1
Average Total Assets $94,857.7 $92,975.5 $91,947.9 $76,008.2 $74,314.2
PER COMMON SHARE
Net Income – Basic $ 3.01 $ 2.82 $ 2.47 $ 2.74 $ 3.18– Diluted 2.99 2.81 2.47 2.74 3.16
Cash Dividends Declared Per Common Share 1.23 1.18 1.12 1.12 1.12Book Value – End of Period (EOP) 33.34 31.51 29.53 28.19 26.12Market Price – EOP 61.89 50.16 39.66 55.41 52.40
AT YEAR END
Senior Notes $ 1,996.6 $ 2,405.8 $ 2,126.7 $ 1,896.1 $ 1,551.8Long-Term Debt 1,709.2 1,421.6 2,133.3 2,729.3 2,837.8Floating Rate Capital Debt 277.1 277.0 276.9 276.9 276.8
RATIOS
Return on Average Common Equity 9.54% 9.34% 8.59% 10.09% 12.73%Return on Average Assets 0.77 0.74 0.66 0.88 1.16Dividend Payout Ratio 41.1 42.0 45.4 40.8 35.2Tier 1 Capital to Risk-Weighted Assets – EOP 13.4 12.8 12.5 13.6 13.4Total Capital to Risk-Weighted Assets – EOP 15.8 14.3 14.2 15.6 15.8Tier 1 Leverage Ratio 7.9 8.2 7.3 8.8 8.8Average Stockholders’ Equity to Average Assets 8.1 7.9 7.6 8.7 8.9
2 0 1 3 A N N U A L R E P O R T T O S H A R E H O L D E R S | N O R T H E R N T R U S T C O R P O R A T I O N 10

management’s discussion and analysis of financial condition and results of operations
BUSINESS OVERVIEW
Northern Trust Corporation (the Corporation), together with
its subsidiaries, is a leading provider of asset servicing, fund
administration, asset management, fiduciary and banking
solutions for corporations, institutions, families, and
individuals worldwide. Northern Trust focuses on servicing
and managing client assets through its two primary business
units, Wealth Management (WM) and Corporate &
Institutional Services (C&IS). Asset management and related
services are provided to Wealth Management and C&IS clients
primarily by a third business unit, Asset Management.
Northern Trust emphasizes a high level of client service
complemented by the effective use of technology delivered by
a fourth business unit, Operations & Technology (O&T).
Northern Trust conducts business through various United
States (U.S.) and non-U.S. subsidiaries, including The
Northern Trust Company (the Bank). The Corporation has a
network of offices in 18 U.S. states; Washington, D.C.; and 18
international locations in North America, Europe, the Middle
East and the Asia Pacific region. Except where the context
otherwise requires, the term “Northern Trust” refers to
Northern Trust Corporation and its subsidiaries on a
consolidated basis.
FINANCIAL OVERVIEW
Net income per diluted common share in 2013 was $2.99,
compared to $2.81 in 2012, while net income for 2013 was
$731.3 million, compared to $687.3 million in 2012. Net
income in 2013 was impacted by a $32.6 million pre-tax gain
on the sale of an office building property, partially offset by a
$19.2 million pre-tax charge in connection with an agreement
to resolve certain long-standing class action litigation related
to Northern Trust’s securities lending program. The prior year
included restructuring, acquisition and integration related
pre-tax charges of $18.6 million.
Throughout 2013, Northern Trust focused on serving our
clients and improving the profitability and returns of our
business. Our return on common equity in 2013 was 9.5%,
compared to 9.3% in 2012. Revenue increased 5% to $4.09
billion in 2013 from $3.90 billion in the prior year, driven by
an 8% increase in trust, investment and other servicing fees,
but was dampened by the challenging low interest rate
environment. Noninterest expense increased 4% from $2.88
billion in 2012 to $2.99 billion in 2013, reflecting growth in
our business and continued investment to support technology
initiatives and a growing set of regulatory and compliance
requirements. The full year benefit of our Driving
Performance initiatives surpassed our initial target of $250
million. The current year increase in revenue primarily reflects
higher trust, investment and other servicing fees and foreign
exchange trading income, partially offset by lower net interest
income. The increase in noninterest expense in 2013 reflects
higher compensation, outside services, equipment and
software and other operating expense as compared to 2012.
Trust, investment and other servicing fees, which
represent the largest component of consolidated revenue,
increased 8% to $2.61 billion, from $2.41 billion in 2012,
primarily reflecting new business and the favorable impact of
equity markets, partially offset by higher levels of waived fees
in money market mutual funds. Money market mutual fund
fee waivers, attributable to persistent low short-term interest
rates, totaled $108.2 million in 2013 compared to $74.5
million in 2012.
Foreign exchange trading income of $244.4 million
increased 19% from 2012, primarily as a result of higher
trading volumes.
New business and higher equity markets in 2013 drove client
assets under custody and under management up 16% and 17%,
respectively, as compared to the prior year-end levels. Client
assets under custody increased from $4.8 trillion in 2012 to $5.6
trillion, and included $3.2 trillion of global custody assets, up
21% from 2012. Client assets under management increased to
$884.5 billion from $758.9 billion in 2012.
Reported net interest income of $933.1 million decreased
6%, primarily due to a decline in the net interest margin,
partially offset by higher average earning assets.
The provision for credit losses totaled $20.0 million in
2013, down from $25.0 million in 2012. The lower provision
reflects improvement in the credit quality of commercial and
institutional and commercial real estate loans, while weakness
persists in residential real estate loans. Net charge-offs in 2013
increased to $39.7 million from $26.3 million in 2012, while
nonperforming assets were relatively unchanged at $274.7
million as of December 31, 2013. Loans and leases at year-end
totaled $29.4 billion, down slightly from $29.5 billion in 2012.
Total noninterest expense equaled $2.99 billion, up 4%
from 2012. The current year includes higher compensation
and outside services expense, the $19.2 million pre-tax charge
in connection with the legal settlement and higher charges
associated with other account servicing activities, higher
equipment and software expense, and increases in various
other miscellaneous categories of other operating expense.
The prior year included $18.6 million of pre-tax restructuring,
acquisition and integration related charges.
2 0 1 3 A N N U A L R E P O R T T O S H A R E H O L D E R S | N O R T H E R N T R U S T C O R P O R A T I O N 11

management’s discussion and analysis of financial condition and results of operations
Northern Trust continues to maintain a strong capital
position, exceeding “well-capitalized” levels under federal
bank regulatory capital requirements, with tier 1 capital and
tier 1 common ratios of 13.4% and 12.9%, respectively. At
year-end, total stockholders’ equity equaled $7.9 billion, up
5% from $7.5 billion a year earlier. Northern Trust declared
dividends of $299.2 million in 2013, representing a dividend
payout ratio of 41%, and repurchased 5.5 million shares in
2013 at a cost of $310.0 million. Dividends and share
repurchases combined, Northern Trust’s total payout ratio
was 83% in 2013.
CONSOLIDATED RESULTS OF OPERATIONS
REVENUE
Northern Trust generates the majority of its revenue from
noninterest income that primarily consists of trust, investment
and other servicing fees. Net interest income comprises the
remainder of revenue and consists of interest income
generated by earning assets, net of interest expense on deposits
and borrowed funds.
Revenue for 2013 was $4.09 billion, an increase of 5%
from $3.90 billion in 2012, which was up 3% from 2011
revenue of $3.77 billion. Noninterest income represented 77%
of total revenue in 2013 and totaled $3.16 billion, up 9% from
$2.91 billion in 2012. Noninterest income represented 75% of
total revenue in 2012 and was higher by 5% from $2.76 billion
in 2011.
The current year increase in noninterest income primarily
reflects increased trust, investment and other servicing fees
and higher foreign exchange trading income. Trust,
investment and other servicing fees – the largest component of
noninterest income – totaled $2.61 billion in 2013, up $204.3
million, or 8%, from $2.41 billion in 2012, primarily reflecting
new business and favorable equity markets, partially offset by
higher levels of waived fees in money market mutual funds.
Foreign exchange trading income in 2013 totaled $244.4
million, up $38.3 million, or 19%, compared with $206.1
million in 2012, primarily reflecting higher trading volumes
from 2012 levels.
Net interest income on a fully taxable equivalent (FTE)
basis in 2013 was $965.6 million, a decrease of $65.5 million,
or 6%, from $1.03 billion in 2012, which was down 2% from
$1.05 billion in 2011. The decrease in net interest income is
primarily attributable to a decline in the net interest margin,
partially offset by higher levels of average earning assets. The
net interest margin declined to 1.13% in 2013 from 1.22% in
2012, primarily reflecting lower yields on earning assets,
partially offset by a lower cost of interest-related funds.
Average earning assets increased $1.5 billion, or 2%, in 2013,
primarily reflecting higher levels of deposits with the Federal
Reserve.
Additional information regarding Northern Trust’s
revenue by type is provided below.
2013 TOTAL REVENUE OF $4.09 BILLION
64% Trust, Investment and OtherServicing Fees
23% Net Interest Income7% Other Noninterest Income6% Foreign Exchange Trading
Income
2 0 1 3 A N N U A L R E P O R T T O S H A R E H O L D E R S | N O R T H E R N T R U S T C O R P O R A T I O N 12

management’s discussion and analysis of financial condition and results of operations
Noninterest Income
The components of noninterest income, and a discussion of significant changes during 2013 and 2012, are provided below.
NONINTEREST INCOME CHANGE
($ In Millions) 2013 2012 2011 2013 / 2012 2012 / 2011
Trust, Investment and Other Servicing Fees $2,609.8 $2,405.5 $2,169.5 8% 11%Foreign Exchange Trading Income 244.4 206.1 324.5 19 (36)Treasury Management Fees 69.0 67.4 72.1 2 (6)Security Commissions and Trading Income 68.0 73.6 60.5 (8) 22Other Operating Income 166.5 154.9 158.1 8 (2)Investment Security Gains (Losses), net (1.5) (1.7) (23.9) (9) (93)
Total Noninterest Income $3,156.2 $2,905.8 $2,760.8 9% 5%
Trust, Investment and Other Servicing FeesTrust, investment and other servicing fees were $2.61 billion in 2013 compared with $2.41 billion in 2012. For a more detailed
discussion of 2013 trust, investment and other servicing fees, refer to the “Business Unit Reporting” section.
Trust, investment and other servicing fees are based generally on the market value of assets held in custody, managed and serviced;
the volume of transactions; securities lending volume and spreads; and fees for other services rendered. Certain market value calculations
on which fees are based are performed on a monthly or quarterly basis in arrears. Based on an analysis of historical trends and current
asset and product mix, management estimates that a 10% rise or fall in overall equity markets would cause a corresponding increase or
decrease in Northern Trust’s trust, investment and other servicing fees of approximately 3% and in total revenue of approximately 2%.
The following table presents selected equity market indices and the percentage changes year over year.
MARKET INDICES DAILY AVERAGES YEAR-END
2013 2012 CHANGE 2013 2012 CHANGE
S&P 500 ® 1,643 1,379 19% 1,848 1,426 30%MSCI EAFE ® (in U.S. dollars) 1,747 1,489 17 1,916 1,604 19
Assets under custody and assets under management form the primary basis of our trust, investment and other servicing fees. At
December 31, 2013, assets under custody were $5.6 trillion, up 16% from $4.8 trillion a year ago, and included $3.2 trillion of global
custody assets, compared to $2.7 trillion at December 31, 2012. Assets under management totaled $884.5 billion, up 17% from
$758.9 billion at the end of 2012.
ASSETS UNDER CUSTODY DECEMBER 31, CHANGE
FIVE-YEAR
COMPOUND
GROWTH
RATE
($ In Billions) 2013 2012 2011 2010 2009 2013 / 2012 2012 / 2011
Corporate & Institutional $5,079.7 $4,358.6 $3,877.6 $3,711.1 $3,325.9 17% 12% 13%Wealth Management 496.0 446.3 385.2 370.2 331.1 11 16 11
Total Assets Under Custody $5,575.7 $4,804.9 $4,262.8 $4,081.3 $3,657.0 16% 13% 13%
C&IS ASSETS UNDER CUSTODY( In Bi l l ions)
WEALTH MANAGEMENT ASSETS UNDER CUSTODY( In Bi l l ions)
2009 2010 2011 2012 2013
3,325.93,711.1 3,877.6
4,358.6
5,079.7
2009 2010 2011 2012 2013
331.1370.2 385.2
446.3
496.0
2 0 1 3 A N N U A L R E P O R T T O S H A R E H O L D E R S | N O R T H E R N T R U S T C O R P O R A T I O N 13
management’s discussion and analysis of financial condition and results of operations
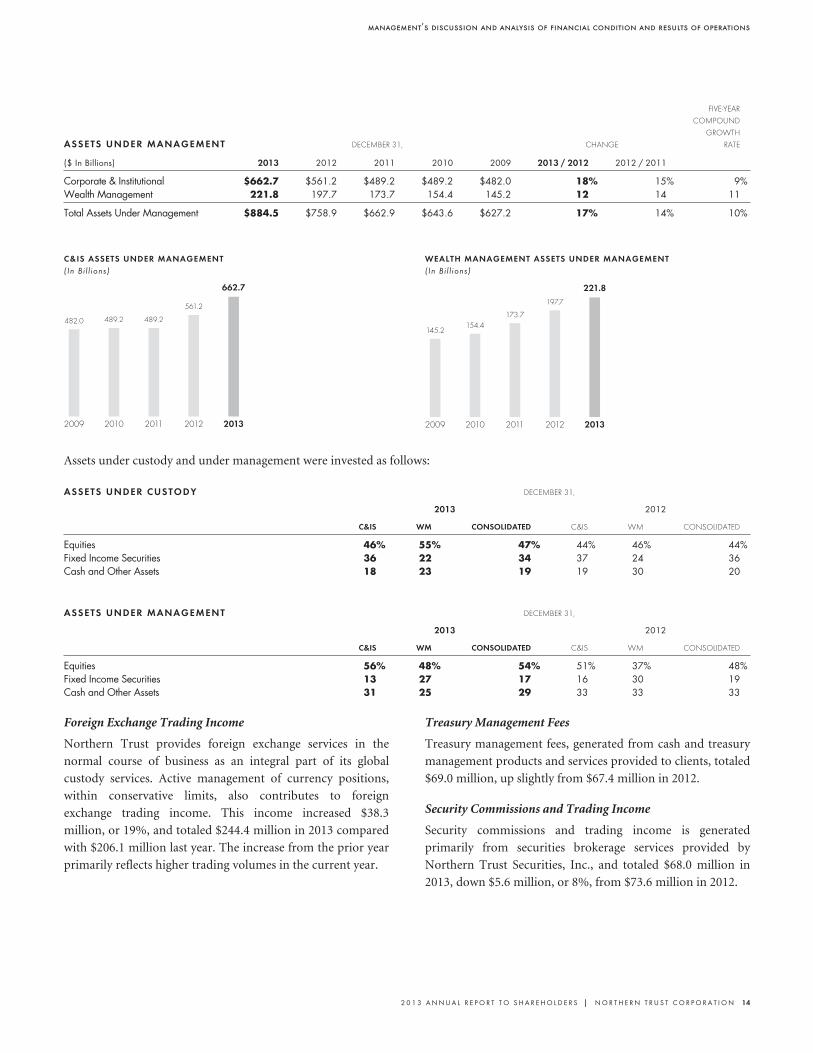
ASSETS UNDER MANAGEMENT DECEMBER 31, CHANGE
FIVE-YEAR
COMPOUND
GROWTH
RATE
($ In Billions) 2013 2012 2011 2010 2009 2013 / 2012 2012 / 2011
Corporate & Institutional $662.7 $561.2 $489.2 $489.2 $482.0 18% 15% 9%Wealth Management 221.8 197.7 173.7 154.4 145.2 12 14 11
Total Assets Under Management $884.5 $758.9 $662.9 $643.6 $627.2 17% 14% 10%
C&IS ASSETS UNDER MANAGEMENT( In Bi l l ions)
WEALTH MANAGEMENT ASSETS UNDER MANAGEMENT( In Bi l l ions)
2009 2010 2011 2012 2013
482.0 489.2 489.2
561.2
662.7
2009 2010 2011 2012 2013
145.2154.4
173.7
197.7
221.8
Assets under custody and under management were invested as follows:
ASSETS UNDER CUSTODY DECEMBER 31,
2013 2012
C&IS WM CONSOLIDATED C&IS WM CONSOLIDATED
Equities 46% 55% 47% 44% 46% 44%Fixed Income Securities 36 22 34 37 24 36Cash and Other Assets 18 23 19 19 30 20
ASSETS UNDER MANAGEMENT DECEMBER 31,
2013 2012
C&IS WM CONSOLIDATED C&IS WM CONSOLIDATED
Equities 56% 48% 54% 51% 37% 48%Fixed Income Securities 13 27 17 16 30 19Cash and Other Assets 31 25 29 33 33 33
Foreign Exchange Trading Income
Northern Trust provides foreign exchange services in the
normal course of business as an integral part of its global
custody services. Active management of currency positions,
within conservative limits, also contributes to foreign
exchange trading income. This income increased $38.3
million, or 19%, and totaled $244.4 million in 2013 compared
with $206.1 million last year. The increase from the prior year
primarily reflects higher trading volumes in the current year.
Treasury Management Fees
Treasury management fees, generated from cash and treasury
management products and services provided to clients, totaled
$69.0 million, up slightly from $67.4 million in 2012.
Security Commissions and Trading Income
Security commissions and trading income is generated
primarily from securities brokerage services provided by
Northern Trust Securities, Inc., and totaled $68.0 million in
2013, down $5.6 million, or 8%, from $73.6 million in 2012.
2 0 1 3 A N N U A L R E P O R T T O S H A R E H O L D E R S | N O R T H E R N T R U S T C O R P O R A T I O N 14

management’s discussion and analysis of financial condition and results of operations
Other Operating Income
The components of other operating income include:
CHANGE
($ In Millions) 2013 2012 2011 2013 / 2012 2012 / 2011
Loan Service Fees $ 61.9 $ 64.5 $ 68.9 (4)% (6)%Banking Service Fees 50.9 55.0 54.9 (7) –Other Income 53.7 35.4 34.3 52 3
Total Other Operating Income $166.5 $154.9 $158.1 8% (2)%
The decrease in loan service fees is primarily attributable
to lower loan-related commitment fees in the current year,
while the decline in banking service fees in 2013 primarily
reflects lower income from standby letters of credit. The
“other” component of other operating income in 2013
includes the $32.6 million gain on the sale of an office building
property, partially offset by a $12.4 million write-off of certain
fee receivables resulting from the correction of an accrual
methodology followed in prior years.
Investment Security Gains (Losses), Net
Net investment security losses totaled $1.5 million and $1.7
million in 2013 and 2012, respectively. The prior year
included $3.3 million of pre-tax charges for the credit-related
other-than-temporary impairment (OTTI) of residential
mortgage backed securities and auction rate securities held
within Northern Trust’s balance sheet investment securities
portfolio. There were no OTTI losses in 2013.
NONINTEREST INCOME – 2012 COMPARED WITH 2011
Trust, investment and other servicing fees were $2.41 billion
in 2012, up 11% from $2.17 billion in 2011. This increase
primarily reflected new business, including the full year
benefit in 2012 of two acquisitions completed in 2011, as well
as revised client fee structures and lower waived fees in money
market mutual funds. Foreign exchange trading income
decreased 36% in 2012 to $206.1 million from $324.5 million
in 2011, reflecting reduced currency market volatility and
client volumes from 2011 levels.
Treasury management fees were $67.4 million in 2012,
down 6% from $72.1 million in 2011, primarily due to lower
transaction volumes in 2012.
Other operating income totaled $154.9 million in 2012, a
decrease of 2% from $158.1 million in 2011, primarily
attributable to lower loan service fees in 2012 as compared to
2011.
Net investment security losses of $1.7 million in 2012 and
$23.9 million in 2011 included $3.3 million and $23.3 million,
respectively, of OTTI charges attributable to residential
mortgage backed securities.
2 0 1 3 A N N U A L R E P O R T T O S H A R E H O L D E R S | N O R T H E R N T R U S T C O R P O R A T I O N 15

management’s discussion and analysis of financial condition and results of operations
Net Interest Income
Net interest income stated on an FTE basis is a non-generally accepted accounting principle (GAAP) financial measure that
facilitates the analysis of asset yields. When adjusted to an FTE basis, yields on taxable, nontaxable, and partially taxable assets are
comparable; however, the adjustment to an FTE basis has no impact on net income. A reconciliation of net interest income on a
GAAP basis to net interest income on an FTE basis is provided on page 53. An analysis of net interest income on an FTE basis,
major balance sheet components impacting net interest income, and related ratios are provided below.
ANALYSIS OF NET INTEREST INCOME (FTE) CHANGE
($ In Millions) 2013 2012 2011 2013 / 2012 2012 / 2011
Interest Income – GAAP $ 1,155.5 $ 1,287.7 $ 1,408.6 (10)% (9)%FTE Adjustment 32.5 40.8 40.2 (20) 1
Interest Income – FTE 1,188.0 1,328.5 1,448.8 (11) (8)Interest Expense 222.4 297.4 399.5 (25) (26)
Net Interest Income – FTE Adjusted 965.6 1,031.1 1,049.3 (6) (2)
Net Interest Income – GAAP 933.1 990.3 1,009.1 (6) (2)
AVERAGE BALANCE
Earning Assets $85,628.3 $84,168.5 $82,748.8 2% 2%Interest-Related Funds 67,364.2 62,293.0 67,049.8 8 (7)Net Noninterest-Related Funds 18,264.1 21,875.5 15,699.0 (17) 39
CHANGE IN PERCENTAGE
AVERAGE RATE
Earning Assets 1.39% 1.58% 1.75% (0.19) (0.17)Interest-Related Funds 0.33 0.48 0.60 (0.15) (0.12)Interest Rate Spread 1.06 1.10 1.15 (0.04) (0.05)Total Source of Funds 0.26 0.35 0.48 (0.09) (0.13)
Net Interest Margin – FTE 1.13% 1.22% 1.27% (0.09) (0.05)
Refer to pages 120 and 121 for additional analysis of net interest income.
Net interest income is defined as the total of interest
income and amortized fees on earning assets, less interest
expense on deposits and borrowed funds, adjusted for the
impact of interest-related hedging activity. Earning assets –
federal funds sold; securities purchased under agreements to
resell; interest-bearing deposits with banks; Federal Reserve
deposits; other interest-bearing deposits; securities; and loans
and leases – are financed by a large base of interest-bearing
funds that include deposits; short-term borrowings; senior
notes and long-term debt. Earning assets also are funded by
net noninterest-related funds, which include demand deposits;
the allowance for credit losses; and stockholders’ equity,
reduced by nonearning assets such as cash and due from
banks; items in process of collection; and buildings and
equipment. Net interest income is subject to variations in the
level and mix of earning assets and interest-bearing funds and
their relative sensitivity to interest rates. In addition, the levels
of nonperforming assets and client compensating deposit
balances used to pay for services impact net interest income.
Net interest income in 2013 was $933.1 million, down
$57.2 million, or 6% from $990.3 million in 2012. Net interest
income on an FTE basis for 2013 was $965.6 million, a
decrease of $65.5 million, or 6% from $1.03 billion in 2012.
The decrease primarily reflects a decline in the net interest
margin, partially offset by higher levels of average earning
assets. The net interest margin was 1.13%, down from 1.22%
in 2012, primarily reflecting lower yields on earning assets,
partially offset by a lower cost of interest-related funds due to
lower short-term interest rates. Average earning assets
increased $1.5 billion, or 2%, to $85.6 billion from $84.2
billion in 2012. Growth in average earning assets primarily
reflects a $2.2 billion increase in Federal Reserve Deposits and
Other Interest-Bearing assets, partially offset by a $571.5
million, or 3%, decrease in interest-bearing deposits with
banks.
Loans and leases averaged $28.7 billion, 1% lower than the
$29.0 billion in 2012.
Securities, inclusive of Federal Reserve and Federal Home
Loan Bank stock and certain community development
investments which are classified in other assets in the
consolidated balance sheet, averaged $30.8 billion, relatively
unchanged from 2012 levels.
The $1.5 billion increase in average earning assets to $85.6
billion in 2013 from $84.2 billion in 2012 was funded by
2 0 1 3 A N N U A L R E P O R T T O S H A R E H O L D E R S | N O R T H E R N T R U S T C O R P O R A T I O N 16
management’s discussion and analysis of financial condition and results of operations
higher levels of interest-related funds, which increased $5.1
billion compared to the prior year, primarily attributable to
higher average levels of non-U.S. office interest-bearing
deposits and short-term borrowings. The increase in average
interest-related funds was partially offset by a $3.6 billion
decrease in average net noninterest-related funds in 2013,
primarily attributable to lower average demand and other
noninterest-bearing deposits as compared to the prior year.
Stockholders’ equity averaged $7.7 billion in 2013
compared with $7.4 billion in 2012. The increase of $308.8
million, or 4%, principally reflects the retention of earnings,
partially offset by dividends and the repurchase of common
stock pursuant to Northern Trust’s share buyback program. In
2013 the Corporation returned $609.2 million in capital to
shareholders, including dividend declarations totaling $299.2
million and share repurchases totaling $310.0 million. Under
our capital plan submitted in January 2013, which was
reviewed without objection by the Federal Reserve in March
2013, the Corporation may repurchase up to $164.5 million of
common stock after December 31, 2013 through March 2014.
In January 2014, the Corporation submitted its most recent
capital plan to the Federal Reserve Board. The Corporation is
authorized by its board of directors (Board) to purchase up to
7.9 million additional shares after December 31, 2013.
For additional analysis of average balances and interest
rate changes affecting net interest income, refer to the Average
Balance Sheet with Analysis of Net Interest Income on
pages 120 and 121.
NET INTEREST INCOME – 2012 COMPARED WITH 2011
Net interest income on an FTE basis was $1.03 billion in 2012,
down 2% from $1.05 billion in 2011. The decrease primarily
reflected a decline in the net interest margin, partially offset by
higher levels of average earning assets. The net interest margin
was 1.22%, down from 1.27% in 2011, primarily reflecting
lower yields on earning assets, partially offset by a lower cost
of funding, driven by lower interest rates and a higher level of
noninterest-related funds.
Average earning assets increased $1.5 billion, or 2%, to
$84.2 billion from $82.7 billion in 2011. The growth in
average earning assets was funded by higher levels of
noninterest-related funds. Average noninterest-related
funding sources in 2012 increased $5.6 billion from 2011,
primarily due to increases in average demand and other
noninterest-bearing deposits. Interest-related funds decreased
7%, primarily attributable to lower average balances in non-
U.S. office interest-bearing deposits, short-term borrowings
and long-term debt.
Stockholders’ equity averaged $7.4 billion in 2012 and
$7.0 billion in 2011. The increase reflected the retention of
earnings, partially offset by dividends and the repurchase of
common stock.
Provision for Credit Losses
The provision for credit losses was $20.0 million in 2013
compared with $25.0 million in 2012 and $55.0 million in
2011. The current year provision reflects improved credit
quality for the loan and lease portfolio relative to 2012. Within
the portfolio, residential real estate loans continue to reflect
weakness relative to the overall loan and lease portfolio,
accounting for 72% and 69% of total nonperforming loans at
December 31, 2013 and 2012, respectively. For a fuller
discussion of the allowance and provision for credit losses for
2013, 2012, and 2011, refer to pages 45 – 47.
2 0 1 3 A N N U A L R E P O R T T O S H A R E H O L D E R S | N O R T H E R N T R U S T C O R P O R A T I O N 17

management’s discussion and analysis of financial condition and results of operations
Noninterest Expense
Noninterest expense for 2013 totaled $2.99 billion, up $115.0 million, or 4%, from $2.88 billion in 2012, primarily reflecting higher
compensation, outside services and equipment and software expense, as well as the $19.2 million legal settlement charge in the
current year. Noninterest expense in 2012 included $18.6 million of charges associated with restructuring, acquisition and
integration related activities.
The components of noninterest expense and a discussion of significant changes during 2013 and 2012 are provided below.
NONINTEREST EXPENSE CHANGE
($ In Millions) 2013 2012 2011 2013 / 2012 2012 / 2011
Compensation $1,306.6 $1,267.4 $1,267.2 3% –%Employee Benefits 257.5 258.2 258.2 – –Outside Services 564.1 529.2 552.8 7 (4)Equipment and Software 377.6 366.7 328.1 3 12Occupancy 173.8 174.4 180.9 – (4)Visa Indemnification Benefit – – (23.1) – (100)Other Operating Expense 314.2 282.9 267.1 11 6
Total Noninterest Expense $2,993.8 $2,878.8 $2,831.2 4% 2%
CompensationCompensation expense, the largest component of noninterest
expense, totaled $1.31 billion and $1.27 billion in 2013 and
2012, respectively. The current year increase of $39.2 million,
or 3%, reflects base pay adjustments and higher staff levels.
Staff on a full-time equivalent basis totaled approximately
14,800 at December 31, 2013 compared with approximately
14,200 at December 31, 2012, and averaged 14,400 in 2013, up
2% compared with 14,100 in 2012.
Employee Benefits
Employee benefits expense totaled $257.5 million in 2013,
relatively unchanged from $258.2 million in 2012.
Outside Services
Outside services expense totaled $564.1 million in 2013, up
$34.9 million, or 7%, from $529.2 million in 2012. Outside
services expense in 2012 included restructuring and
integration related charges of $12.1 million. Excluding the
prior year charges, outside services expense increased $47.0
million, or 9%, from the prior year, primarily reflecting higher
consulting expense, including costs associated with a growing
set of regulatory and compliance requirements, as well as
increased technical services and sub-custodian expense in
2013. Technical services expense includes costs for systems
and application support; the provision of market and research
data; and outsourced check processing and lockbox services,
among other services.
Equipment and Software
Equipment and software expense, comprised of depreciation
and amortization; rental; and maintenance costs, increased
$10.9 million, or 3%, to $377.6 million in 2013 compared to
$366.7 million in 2012. The current year includes higher
software amortization and support costs from the continued
investment in technology related assets. The prior year
included software write-offs of $15.1 million.
Occupancy
Occupancy expense totaled $173.8 million in 2013, down
slightly from $174.4 million in 2012. Occupancy expense in
2012 included $3.6 million of restructuring charges related to
reductions in office space.
2 0 1 3 A N N U A L R E P O R T T O S H A R E H O L D E R S | N O R T H E R N T R U S T C O R P O R A T I O N 18

management’s discussion and analysis of financial condition and results of operations
Other Operating Expense
Other operating expense in 2013 totaled $314.2 million, up $31.3 million, or 11% from $282.9 million in 2012. The components of
other operating expense are as follows:
CHANGE
($ In Millions) 2013 2012 2011 2013 / 2012 2012 / 2011
Business Promotion $ 91.6 $ 87.8 $ 82.1 4% 7%FDIC Insurance Premiums 23.5 25.4 29.3 (7) (13)Staff Related 39.1 41.9 37.6 (7) 11Other Intangibles Amortization 21.1 20.3 17.5 4 16Legal Settlement Charge 19.2 – – N/M –Other Expenses 119.7 107.5 100.6 11 7
Total Other Operating Expense $314.2 $282.9 $267.1 11% 6%
Other operating expense in 2013 includes the $19.2 million
pre-tax charge in connection with an agreement to resolve
certain long-standing class action litigation related to the
Corporation’s securities lending program. The increase in the
“other” component of other operating expense primarily reflects
higher charges associated with other account servicing activities
and increases within other miscellaneous expense categories.
NONINTEREST EXPENSE – 2012 COMPARED WITH 2011
Noninterest expense in 2012 totaled $2.88 billion, up 2% from
$2.83 billion in 2011. Noninterest expense in 2012 and 2011
reflected charges of $18.6 million ($12.0 million after tax) and
$91.6 million ($59.8 million after tax), respectively, associated
with restructuring, acquisition and integration related
activities. Noninterest expense in 2011 also included Visa
indemnification related benefits of $23.1 million.
Compensation expense totaled $1.27 billion in both 2012
and 2011. Compensation expense in 2011 included severance
related accruals of $50.2 million related to restructuring,
acquisition and integration activities, while 2012 included net
reductions in severance accruals of $0.3 million.
Compensation expense in 2012 reflected higher annual salary
increases, the full year impact in 2012 of operating costs
attributable to acquisitions completed in 2011, and higher
performance-based compensation as compared to 2011. Staff
on a full-time equivalent basis averaged 14,100 in 2012, up 4%
compared with 13,500 in 2011.
Employee benefits expense totaled $258.2 million in both
2012 and 2011. Employee benefits expense in 2011 included
the reversal of an employee benefit related accrual of $9.7
million for which the 2010 goal was not met.
Outside services expense totaled $529.2 million and
$552.8 million in 2012 and 2011 and included restructuring,
acquisition and integration charges of $12.1 million and $16.8
million, respectively. Excluding these charges, outside services
expense decreased 4% in 2012 as compared to 2011, reflecting
lower investment manager sub-advisor fees, consulting fees,
and sub-custodian expense, partially offset by higher expense
associated with technical services, including the full year cost
in 2012 of services attributable to acquisitions completed in
2011.
Equipment and software expense included $15.1 million
and $10.9 million of restructuring charges related to software
write-offs in 2012 and 2011, respectively. Excluding these
software write-offs, equipment and software expense increased
11%, primarily reflecting higher software amortization and
support costs from the continued investment in technology
related assets.
Occupancy expense for 2012 was $174.4 million, down
4% from $180.9 million in 2011. Occupancy expense in 2012
and 2011 included $3.6 million and $6.4 million, respectively,
of restructuring charges related to reductions in office space.
Other operating expense totaled $282.9 million in 2012,
up from $267.1 million in 2011, primarily due to increases in
business promotion and staff related expense, as well as
increases within various miscellaneous categories of other
operating expense.
Provision for Income Taxes
Provisions for income tax and effective tax rates are impacted
by levels of pre-tax income, tax rates, and the impact of certain
non-U.S. subsidiaries whose earnings are indefinitely
reinvested, as well as non-recurring items such as the
resolution of tax matters. The 2013 provision for income taxes
was $344.2 million, representing an effective rate of 32.0%.
This compares with a provision for income taxes of $305.0
million and an effective rate of 30.7% in 2012. The provision
for income tax in 2012 included a $12.4 million tax benefit in
connection with the resolution of certain leveraged lease
related matters.
2 0 1 3 A N N U A L R E P O R T T O S H A R E H O L D E R S | N O R T H E R N T R U S T C O R P O R A T I O N 19

management’s discussion and analysis of financial condition and results of operations
The tax provisions for 2013 and 2012 reflect reductions totaling $27.6 million and $27.1 million, respectively, related to certain
non-U.S. subsidiaries whose earnings are being indefinitely reinvested. The 2011 income tax provision of $280.1 million represented
an effective tax rate of 31.7% and included a $21.3 million reduction related to non-U.S. subsidiaries whose earnings are being
indefinitely reinvested.
BUSINESS UNIT REPORTING
Northern Trust is organized around its two principal client-focused business units, Corporate & Institutional Services and Wealth
Management. Asset management and related services are provided to C&IS and Wealth Management clients primarily by the Asset
Management business unit. Operations support is provided to each of the business units by Operations & Technology.
C&IS and Wealth Management results are presented to promote a greater understanding of their financial performance. The
information, presented on an internal management-reporting basis, derives from internal accounting systems that support
Northern Trust’s strategic objectives and management structure. Management has developed accounting systems to allocate revenue
and expense related to each segment. These systems incorporate processes for allocating assets, liabilities and equity, and the
applicable interest income and expense. Equity is allocated based on the proportion of economic capital associated with the business
units. Allocations of capital and certain corporate expense may not be representative of levels that would be required if the segments
were independent entities. The accounting policies used for management reporting are consistent with those described in Note 1 to
the consolidated financial statements. Transfers of income and expense items are recorded at cost; there is no consolidated profit or
loss on sales or transfers between business units. Northern Trust’s presentations are not necessarily consistent with similar
information for other financial institutions.
CONSOLIDATED FINANCIAL INFORMATION CHANGE
($ In Millions) 2013 2012 2011 2013 / 2012 2012 / 2011
Noninterest IncomeTrust, Investment and Other Servicing Fees $ 2,609.8 $ 2,405.5 $ 2,169.5 8% 11%Foreign Exchange Trading Income 244.4 206.1 324.5 19 (36)Other Noninterest Income 302.0 294.2 266.8 3 10
Net Interest Income (FTE) (Note) 965.6 1,031.1 1,049.3 (6) (2)
Revenue (FTE) (Note) 4,121.8 3,936.9 3,810.1 5 3Provision for Credit Losses 20.0 25.0 55.0 (20) (55)Visa Indemnification Benefit – – (23.1) – (100)Noninterest Expense (Excluding Visa Indemnification
Benefit) 2,993.8 2,878.8 2,854.3 4 1
Income before Income Taxes (Note) 1,108.0 1,033.1 923.9 7 12Provision for Income Taxes (Note) 376.7 345.8 320.3 9 8
Net Income $ 731.3 $ 687.3 $ 603.6 6% 14%
Average Assets $94,857.7 $92,975.5 $91,947.9 2% 1%
Note: Stated on an FTE basis. The consolidated figures include $32.5 million, $40.8 million, and $40.2 million of FTE adjustments for 2013, 2012, and 2011, respectively.
Corporate & Institutional ServicesC&IS is a leading global provider of asset servicing, brokerage,
banking and related services to corporate and public
retirement funds, foundations, endowments, fund managers,
insurance companies, sovereign wealth funds, and other
institutional investors around the globe. Asset servicing and
related services encompass a full range of
capabilities including but not limited to: global master trust
and custody; fund administration; investment operations
outsourcing; investment risk and analytical services; securities
lending; foreign exchange; cash management; treasury
management; brokerage services; and transition management
services. Client relationships are managed through the Bank
and the Bank’s and the Corporation’s other subsidiaries,
including support from locations in North America, Europe,
the Middle East, and the Asia Pacific region.
2 0 1 3 A N N U A L R E P O R T T O S H A R E H O L D E R S | N O R T H E R N T R U S T C O R P O R A T I O N 20
management’s discussion and analysis of financial condition and results of operations
The following table summarizes the results of operations of C&IS for the years ended December 31, 2013, 2012, and 2011 on a
management-reporting basis.
CORPORATE & INSTITUTIONAL SERVICESRESULTS OF OPERATIONS CHANGE
($ In Millions) 2013 2012 2011 2013 / 2012 2012 / 2011
Noninterest IncomeTrust, Investment and Other Servicing Fees $ 1,443.8 $ 1,334.1 $ 1,196.4 8% 12%Foreign Exchange Trading Income 238.8 193.5 315.7 23 (39)Other Noninterest Income 177.3 193.6 169.7 (8) 14
Net Interest Income (FTE) (Note) 275.9 280.1 282.5 (1) (1)
Revenue (FTE) (Note) 2,135.8 2,001.3 1,964.3 7 2Provision for Credit Losses (3.4) (2.1) (20.5) 62 (90)Noninterest Expense 1,657.9 1,599.9 1,522.4 4 5
Income before Income Taxes (Note) 481.3 403.5 462.4 19 (13)Provision for Income Taxes (Note) 145.6 114.3 168.3 27 (32)
Net Income $ 335.7 $ 289.2 $ 294.1 16% (2)%
Percentage of Consolidated Net Income 46% 42% 49%Average Assets $53,308.2 $49,904.0 $47,533.7 7% 5%
Note: Stated on an FTE basis.
The 16% increase in C&IS net income in 2013 primarily
resulted from higher trust, investment and other servicing fees
and foreign exchange trading income, partially offset by
higher noninterest expense in the current year. The 2%
decrease in net income in 2012 compared to 2011 primarily
reflected lower foreign exchange trading income, as well as
higher noninterest expense attributable to the full year impact
in 2012 of acquisitions completed in 2011, partially offset by
increased trust, investment and other servicing fees.
C&IS Trust, Investment and Other Servicing Fees
C&IS trust, investment and other servicing fees are primarily
attributable to services related to custody, fund
administration, investment management, and securities
lending. Custody and fund administration fees are driven
primarily by asset values, transaction volumes, and number of
accounts. Custody fees related to asset values are priced based
on quarter-end or month-end values, values at the beginning
of each quarter, or average values for a month or quarter. The
fund administration fees that are asset value related are priced
using month-end, quarter-end, or average daily balances.
Investment management fees are based primarily on market
values throughout a period.
Securities lending revenue is affected by market values; the
demand for securities to be lent, which drives volumes; and
the interest rate spread earned on the investment of cash
deposited by investment firms as collateral for securities they
have borrowed. The other services fee category in C&IS
includes such products as benefit payment, investment risk
and analytical services, electronic delivery, and other services.
Revenue from these products is based generally on the volume
of services provided or a fixed fee.
Provided below are the components of C&IS trust,
investment and other servicing fees.
CORPORATE AND INSTITUTIONAL SERVICESTRUST, INVESTMENT AND OTHER SERVICING FEES
(In Millions) 2013 2012 2011
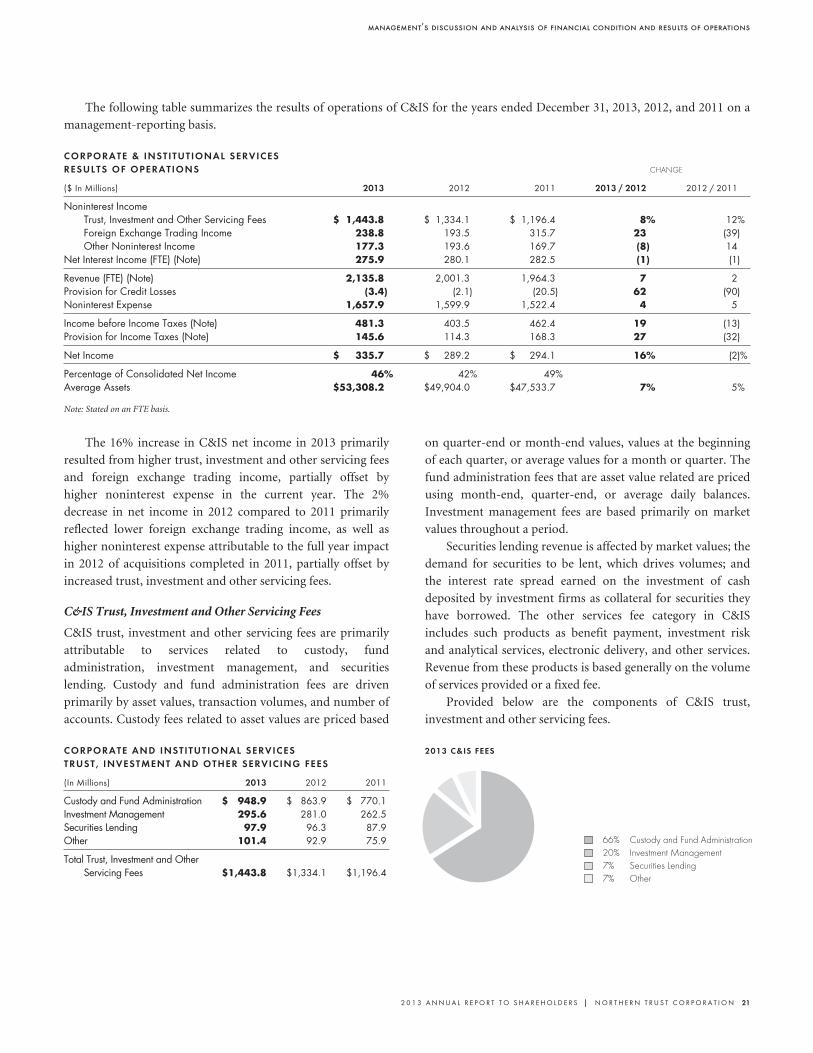
Custody and Fund Administration $ 948.9 $ 863.9 $ 770.1Investment Management 295.6 281.0 262.5Securities Lending 97.9 96.3 87.9Other 101.4 92.9 75.9
Total Trust, Investment and OtherServicing Fees $1,443.8 $1,334.1 $1,196.4
2013 C&IS FEES
66% Custody and Fund Administration20% Investment Management7% Securities Lending7% Other
2 0 1 3 A N N U A L R E P O R T T O S H A R E H O L D E R S | N O R T H E R N T R U S T C O R P O R A T I O N 21

management’s discussion and analysis of financial condition and results of operations
Custody and fund administration fees, the largest
component of trust, investment and other servicing fees,
increased $85.0 million, or 10%, primarily reflecting the
favorable impact of equity markets and new business. Fees from
investment management increased $14.6 million, or 5%, from
the prior year primarily due to new business and favorable equity
markets, partially offset by higher waived fees in money market
mutual funds. Money market mutual fund fee waivers in C&IS
totaled $48.6 million and $29.8 million in 2013 and 2012,
respectively. Securities lending revenue increased 2%, reflecting
higher loan volumes, partially offset by lower spreads in the
current year. C&IS other trust, investment and servicing fees
increased $8.5 million, or 9%, primarily reflecting higher income
from the investment risk and analytical services product.
Provided below is a breakdown of C&IS the assets under
custody and under management.
C&IS ASSETS UNDER CUSTODY
DECEMBER 31,
(In Billions) 2013 2012 2011
North America $2,705.4 $2,414.6 $2,112.1Europe, Middle East, and Africa 1,823.4 1,459.7 1,351.4Asia Pacific 448.6 396.4 319.4Securities Lending 102.3 87.9 94.7
Total Assets Under Custody $5,079.7 $4,358.6 $3,877.6
2013 C&IS ASSETS UNDER CUSTODY
53% North America36% Europe, Middle East, and Africa9% Asia Pacific2% Securities Lending
C&IS ASSETS UNDER MANAGEMENT
DECEMBER 31,
(In Billions) 2013 2012 2011
North America $382.2 $364.5 $304.0Europe, Middle East, and Africa 114.0 60.2 48.7Asia Pacific 64.2 48.6 41.8Securities Lending 102.3 87.9 94.7
Total Assets Under Management $662.7 $561.2 $489.2
2013 C&IS ASSETS UNDER MANAGEMENT
58% North America17%
Securities Lending15%Europe, Middle East, and Africa
10% Asia Pacific
C&IS assets under custody were $5.1 trillion at December 31,2013, 17% higher than $4.4 trillion at December 31, 2012. Assetsunder management totaled $662.7 billion and $561.2 billion atDecember 31, 2013 and 2012, respectively. Cash and other assetsdeposited by investment firms as collateral for securitiesborrowed from custody clients are managed by Northern Trustand are included in assets under custody and under management.This securities lending collateral totaled $102.3 billion and $87.9billion at December 31, 2013 and 2012, respectively.
C&IS Foreign Exchange Trading Income
Foreign exchange trading income totaled $238.8 million in2013, a $45.3 million, or 23%, increase from $193.5 million in2012. The increase primarily reflects higher trading volumes inthe current year. Foreign exchange trading income in 2012 of$193.5 million decreased $122.2 million, or 39%, from $315.7million in 2011, due to reduced currency market volatility andtrading volumes as compared to 2011.
C&IS Other Noninterest Income
Other noninterest income for 2013 decreased $16.3 million, or8%, to $177.3 million in 2013, from $193.6 million in 2012,
primarily reflecting current year decreases within variousmiscellaneous categories of other operating income. Othernoninterest income of $193.6 million in 2012 increased $23.9million, or 14%, from $169.7 million in 2011, primarilyreflecting increased other operating income attributable tohigher banking and credit related service fees.
C&IS Net Interest Income
Net interest income decreased 1% in 2013 to $275.9 million from$280.1 million in 2012. The decrease primarily reflects a declinein the net interest margin, partially offset by higher levels ofaverage earning assets. The C&IS net interest margin in 2013 was0.60% compared to 0.66% in 2012 and 0.70% in 2011. The netinterest margin decreases in 2013 and 2012 are primarilyattributable to lower yields on earning assets, partially offset bylower deposit rates, both the result of the persistent low interestrate environment. Average earning assets totaled $45.9 billion inthe current year, an increase of $3.4 billion, or 8%, from $42.5billion in the prior year. Average earning assets were primarilycomprised of interest-bearing deposits with banks as well as loansand leases. Funding sources were primarily comprised of non-U.S. office interest-bearing deposits.
2 0 1 3 A N N U A L R E P O R T T O S H A R E H O L D E R S | N O R T H E R N T R U S T C O R P O R A T I O N 22

management’s discussion and analysis of financial condition and results of operations
C&IS Provision for Credit Losses
The provision for credit losses was negative $3.4 million for 2013, primarily reflecting continued improvement in loan portfolio
credit quality, partially offset by allowances established as a result of higher commercial and institutional loan balances. The
provision for credit losses was negative $2.1 million for 2012 and negative $20.5 million in 2011, reflecting recoveries of previously
charged off exposures and improvement in underlying asset quality within the commercial and institutional loan class, partially
offset by allowances established as a result of higher commercial and institutional loan and lease financing receivable balances.
C&IS Noninterest Expense
Total C&IS noninterest expense, which includes the direct expense of the business unit, indirect expense allocations from Asset
Management and O&T for product and operating support, and indirect expense allocations for certain corporate support services,
totaled $1.66 billion in 2013, an increase of $58.0 million, or 4%, from $1.60 billion in 2012. The current year includes the $19.2
million legal settlement charge, higher indirect expense allocations, and increased compensation and outside services expense as
compared to 2012. Noninterest expense in 2012 increased $77.5 million, or 5%, from $1.52 billion in 2011, reflecting the full year
impact in 2012 of acquisitions completed in 2011, as well as higher indirect expense allocations for product and operating support.
Wealth Management
Wealth Management provides trust, investment management, custody, and philanthropic services; financial consulting;
guardianship and estate administration; family business consulting; family financial education; brokerage services; and private and
business banking. Wealth Management focuses on high-net-worth individuals and families, business owners, executives,
professionals, retirees, and established privately-held businesses in its target markets. Wealth Management also includes the Global
Family Office, which provides customized services to meet the complex financial needs of individuals and family offices in the
United States and throughout the world with assets typically exceeding $200 million. Wealth Management services are delivered by
multidisciplinary teams through a network of offices in 18 U.S. states and Washington, D.C., as well as offices in London, Guernsey,
and Abu Dhabi.
The following table summarizes the results of operations of Wealth Management for the years ended December 31, 2013, 2012,
and 2011 on a management-reporting basis.
WEALTH MANAGEMENTRESULTS OF OPERATIONS CHANGE
($ In Millions) 2013 2012 2011 2013 / 2012 2012 / 2011
Noninterest IncomeTrust, Investment and Other Servicing Fees $ 1,166.0 $ 1,071.4 $ 973.1 9% 10%Foreign Exchange Trading Income 5.6 12.6 8.8 (56) 43Other Noninterest Income 116.7 93.6 119.7 25 (22)
Net Interest Income (FTE) (Note) 557.7 629.9 613.7 (11) 3
Revenue (FTE) (Note) 1,846.0 1,807.5 1,715.3 2 5Provision for Credit Losses 23.4 27.1 75.5 (14) (64)Noninterest Expense 1,215.0 1,182.3 1,214.9 3 (3)
Income before Income Taxes (Note) 607.6 598.1 424.9 2 41Provision for Income Taxes (Note) 229.2 226.4 168.7 1 34
Net Income $ 378.4 $ 371.7 $ 256.2 2% 45%
Percentage of Consolidated Net Income 52% 54% 42%
Average Assets $22,887.6 $23,917.9 $23,861.5 (4)% –%
Note: Stated on an FTE basis.
Wealth Management net income increased 2% in 2013 as
a result of increased revenue, partially offset by higher
noninterest expense. The increase in Wealth Management
revenue of 2% in 2013 is primarily attributable to increases in
trust, investment and other servicing fees and higher other
noninterest income, partially offset by lower net interest
income. The 3% increase in noninterest expense in 2013 is
primarily due to increased indirect expense allocations and
compensation expense as compared to 2012. The 45%
increase in Wealth Management net income in 2012 from
2011 is primarily attributable to higher revenue, a lower
provision for credit losses, and decreased noninterest expense.
2 0 1 3 A N N U A L R E P O R T T O S H A R E H O L D E R S | N O R T H E R N T R U S T C O R P O R A T I O N 23

management’s discussion and analysis of financial condition and results of operations
Wealth Management Trust, Investment and Other Servicing Fees
Provided below is a summary of Wealth Management trust, investment and other servicing fees and assets under custody and under
management.
WEALTH MANAGEMENTTRUST, INVESTMENT ANDOTHER SERVICING FEES YEAR ENDED DECEMBER 31,
(In Millions) 2013 2012 2011
Central $ 470.0 $ 435.8 $399.2East 303.4 279.8 248.0West 241.5 228.1 208.5Global Family Office 151.1 127.7 117.4
Total Trust, Investment and OtherServicing Fees $1,166.0 $1,071.4 $973.1
2013 WEALTH MANAGEMENT FEES
40% Central26% East21% West13% Global Family Office
WEALTH MANAGEMENTASSETS UNDER CUSTODY DECEMBER 31,
(In Billions) 2013 2012 2011
Global Family Office $314.9 $270.4 $226.5Central 79.4 71.9 67.6East 57.3 63.9 54.6West 44.4 40.1 36.5
Total Assets Under Custody $496.0 $446.3 $385.2
2013 WEALTH MANAGEMENT ASSETS UNDER CUSTODY
63% Global Family Office16% Central12% East9% West
WEALTH MANAGEMENTASSETS UNDER MANAGEMENT DECEMBER 31,
(In Billions) 2013 2012 2011
Central $ 86.2 $ 75.0 $ 68.5Global Family Office 53.9 41.8 34.0East 47.2 49.5 42.1West 34.5 31.4 29.1
Total Assets Under Management $221.8 $197.7 $173.7
2013 WEALTH MANAGEMENT ASSETS UNDER MANAGEMENT
39% Central 24%
East21%Global Family Office
16% West
The Wealth Management regions shown above are
comprised of the following: Central includes Illinois, Michigan,
Minnesota, Missouri, Ohio and Wisconsin; East includes
Connecticut, Delaware, Florida, Georgia, Massachusetts, New
York and Washington, D.C.; West includes Arizona, California,
Colorado, Nevada, Texas and Washington. Global Family Office
provides specialized asset management, investment consulting,
global custody, fiduciary, and private banking services to ultra-
wealthy domestic and international clients.
Wealth Management fee income is calculated primarily
based on market values. Wealth Management trust,
investment and other servicing fees were $1.17 billion in 2013,
up 9% from $1.07 billion in 2012, which in turn was up 10%
from $973.1 million in 2011. The current year performance
benefitted from new business and the favorable impact of
equity markets, partially offset by higher waived fees in money
market mutual funds. Wealth Management waived fees in
money market mutual funds, attributable to the persistent low
level of short-term interest rates, totaled $59.6 million and
$44.7 million in 2013 and 2012, respectively. Trust,
investment and other servicing fees for 2012 were higher than
2011, reflecting new business, revised client fee structures,
lower waived fees in money market mutual funds, and the
favorable impact of markets on fees.
At December 31, 2013, assets under custody in Wealth
Management were $496.0 billion compared with $446.3
billion at December 31, 2012. Assets under management were
$221.8 billion at December 31, 2013 compared to $197.7
billion at the previous year end.
2 0 1 3 A N N U A L R E P O R T T O S H A R E H O L D E R S | N O R T H E R N T R U S T C O R P O R A T I O N 24
management’s discussion and analysis of financial condition and results of operations
Wealth Management Foreign Exchange Trading IncomeForeign exchange trading income totaled $5.6 million in 2013,
a decrease of $7.0 million, or 56%, from $12.6 million in 2012,
primarily due to decreased client activity in 2013. Foreign
exchange trading income of $12.6 million in 2012 was 43%
higher than $8.8 million in 2011.
Wealth Management Other Noninterest Income
Other noninterest income for 2013 totaled $116.7 million and
included the $32.6 million pre-tax gain on the sale of an office
building property. Excluding the gain, other noninterest
income in 2013 was $84.1 million, down $9.5 million, or 10%,
from $93.6 million in 2012. The other noninterest income
decrease of $26.1 million, or 22%, in 2012 compared to 2011
primarily resulted from a decrease in other operating income
related to lower banking and credit related service fees in 2012.
Wealth Management Net Interest Income
Net interest income was $557.7 million for the year, down
$72.2 million, or 11%, from $629.9 million in 2012. The
decrease primarily reflects a decline in the net interest margin
and lower levels of average earning assets. The Wealth
Management net interest margin in 2013 was 2.46% compared
to 2.67% in 2012. The decrease in the net interest margin is
primarily attributable to lower yields on earning assets,
partially offset by lower deposit rates, each reflecting the
persistent low interest rate environment. Average earning
assets totaled $22.6 billion in the current year, a decrease of
$912.7 million, or 4%, from $23.6 billion in the prior year.
Net interest income in 2012 was $16.2 million, or 3%, higher
than in 2011 and the net interest margin in 2012 of 2.67% was
up from the 2011 margin of 2.61%. The higher net interest
margin in 2012 as compared to 2011 primarily reflected higher
internal yields on certain deposit products, partially offset by
lower yields on loans. Earning assets and funding sources in
both 2012 and 2013 were primarily comprised of loans and
domestic interest-bearing deposits, respectively.
Wealth Management Provision for Credit Losses
The provision for credit losses totaled $23.4 million for 2013,
compared with $27.1 million in 2012, and $75.5 million in
2011. The current year provision reflects continued weakness
in the residential real estate loan class, partially offset by
improvement in the commercial and institutional and
commercial real estate loan classes. The 2012 provision
reflected reduced net charge-offs on commercial real estate
loans and residential real estate loans, partially offset by
continued weakness in these loan categories, while
commercial and institutional loans continued to evidence
improvement. For a fuller discussion of the allowance and
provision for credit losses refer to pages 45 – 47.
Wealth Management Noninterest Expense
Total noninterest expense, which includes the direct expense
of the business unit, indirect expense allocations from Asset
Management and O&T for product and operating support,
and indirect expense allocations for certain corporate support
services, totaled $1.22 billion, an increase of $32.7 million, or
3%, from the prior year. The current year increase primarily
reflects higher indirect expense allocations and compensation
expense in 2013. Noninterest expense for 2012 was 3% lower
than 2011, primarily attributable to lower restructuring
related charges recorded in 2012 as compared to 2011.
Asset Management
Asset Management, through the Corporation’s various
subsidiaries, provides a broad range of asset management and
related services and other products to clients around the world,
including clients of C&IS and Wealth Management. Clients
include institutional and individual separately managed
accounts, bank common and collective funds, registered
investment companies, exchange traded funds, non-U.S.
collective investment funds, and unregistered private
investment funds. Asset Management offers both active and
passive equity and fixed income portfolio management, as well
as alternative asset classes (such as private equity and hedge
funds of funds), and multi-manager advisory services and
products. Asset Management’s activities also include overlay
services and other risk management services. Asset
Management’s business operates internationally through
subsidiaries and distribution arrangements and its revenue and
expense are fully allocated to C&IS and Wealth Management.
At year-end 2013, Northern Trust managed $884.5 billion
in assets for personal and institutional clients compared with
$758.9 billion at year-end 2012. The increase in assets reflects
higher equity markets and new business in 2013.
2 0 1 3 A N N U A L R E P O R T T O S H A R E H O L D E R S | N O R T H E R N T R U S T C O R P O R A T I O N 25

management’s discussion and analysis of financial condition and results of operations
ASSET MANAGEMENT2013 ASSETS UNDER MANAGEMENT OF $884.5 BILL ION
ASSET CLASSES
54% Equities27% Short Duration17% Fixed Income2% Other
CLIENT SEGMENTS
75% Institutional25% Personal
MANAGEMENT STYLES
51% Index43% Active4% Multi-Manager2% Other
Treasury and Other
The Treasury and Other business unit includes income and expense associated with the wholesale funding activities and the
investment portfolios of the Corporation and the Bank. Treasury and Other also includes certain corporate-based expense, executive
level compensation and nonrecurring items not allocated to the business units.
The following table summarizes the results of operations of Treasury and Other for the years ended December 31, 2013, 2012,
and 2011 on a management-reporting basis.
TREASURY AND OTHERRESULTS OF OPERATIONS CHANGE
($ In Millions) 2013 2012 2011 2013 / 2012 2012 / 2011
Noninterest Income $ 8.0 $ 7.0 $ (22.6) 14% N/MNet Interest Income (FTE) (Note) 132.0 121.1 153.1 9 (21)%
Revenue (FTE) (Note) 140.0 128.1 130.5 9 (2)Visa Indemnification Benefit – – (23.1) — (100)Noninterest Expense (Excluding Visa
Indemnification Benefit) 120.9 96.6 117.0 25 (17)
Income before Income Taxes (Note) 19.1 31.5 36.6 (39) (14)Provision (Benefit) for Income Taxes (Note) 1.9 5.1 (16.7) (63) N/M
Net Income $ 17.2 $ 26.4 $ 53.3 (35)% (50)%
Percentage of Consolidated Net Income 2% 4% 9%
Average Assets $18,661.9 $19,153.6 $20,552.7 (3)% (7)%
Note: Stated on an FTE basis.
Treasury and Other noninterest income of $8.0 million in
2013 compares to $7.0 million in 2012. Noninterest income in
2012 included a $5.3 million hedge-related gain, as well as
credit-related OTTI losses of $3.3 million. Excluding the prior
year items, Treasury and Other noninterest income in the
current year would have increased 60% from 2012, primarily
reflecting higher security commissions and trading income,
partially offset by decreases within various miscellaneous
2 0 1 3 A N N U A L R E P O R T T O S H A R E H O L D E R S | N O R T H E R N T R U S T C O R P O R A T I O N 26

management’s discussion and analysis of financial condition and results of operations
noninterest income categories. Treasury and Other
noninterest income in 2011 included credit-related OTTI
losses of $23.3 million.
Treasury and Other net interest income in 2013 was
$132.0 million, compared to $121.1 million in 2012, an
increase of $10.9 million, or 9%. The increase is primarily due
to higher internal yields on funds provided to business units in
the current year.
Treasury and Other noninterest expense in 2013 equaled
$120.9 million, up $24.3 million, or 25%, from $96.6 million
in 2012. The increase is primarily attributable to higher
outside services and compensation expense, partially offset by
lower indirect expense allocated to C&IS and Wealth
Management in 2013.
CRITICAL ACCOUNTING ESTIMATES
The use of estimates and assumptions is required in the
preparation of financial statements in conformity with GAAP
and actual results could differ from those estimates. The U.S.
Securities and Exchange Commission has issued guidance
relating to the disclosure of critical accounting estimates.
Critical accounting estimates are those that require
management to make subjective or complex judgments about
the effect of matters that are inherently uncertain and may
change in subsequent periods. Changes that may be required
in the underlying assumptions or estimates in these areas
could have a material impact on Northern Trust’s future
financial condition and results of operations.
For Northern Trust, accounting estimates that are viewed
as critical are those relating to the allowance for credit losses,
pension plan accounting, and other-than-temporary
impairment (OTTI) of investment securities. Management has
discussed the development and selection of each critical
accounting estimate with the Audit Committee of the Board.
Allowance for Credit Losses
The allowance for credit losses represents management’s
estimate of probable losses which have occurred as of the date
of the consolidated financial statements. The loan and lease
portfolio and other lending related credit exposures are
regularly reviewed to evaluate the level of the allowance for
credit losses. In determining an appropriate allowance level,
Northern Trust evaluates the allowance necessary for impaired
loans and lending-related commitments and also estimates
losses inherent in other lending related credit exposures.
The allowance for credit losses consists of the
following components:
Specific Allowance: The amount of specific allowance is
determined through an individual evaluation of loans and
lending-related commitments considered impaired that is
based on expected future cash flows, the value of collateral,
and other factors that may impact the borrower’s ability
to pay. For impaired loans where the amount of specific
allowance, if any, is determined based on the value of the
underlying real estate collateral, third-party appraisals are
typically obtained and utilized by management. These
appraisals are generally less than twelve months old and are
subject to adjustments to reflect management’s judgment as to
the realizable value of the collateral.
Inherent Allowance: The amount of inherent allowance is
based on factors which incorporate management’s evaluation
of historical charge-off experience and various qualitative
factors such as management’s evaluation of economic and
business conditions and changes in the character and size of
the loan portfolio. Factors are applied to loan and lease credit
exposures aggregated by shared risk characteristics and are
reviewed quarterly by Northern Trust’s Loan Loss Reserve
Committee which includes representatives from Credit Policy,
business unit management, Corporate Financial Management,
and Economic Research.
The quarterly analysis of the specific and inherent
allowance components and the control process maintained by
Credit Policy and the lending staff, as described in the “Risk
Management – Loans and Other Extensions of Credit”
section, are the principal methods relied upon by management
for the timely identification of, and adjustment for, changes in
estimated credit loss levels. In addition to Northern Trust’s
own experience, management also considers regulatory
guidance. Control processes and analyses employed to
determine an appropriate level of allowance for credit losses
are reviewed on at least an annual basis and modified as
considered appropriate.
Loans, leases and other extensions of credit deemed
uncollectible are charged to the allowance for credit losses.
Subsequent recoveries, if any, are credited to the allowance.
Determinations as to whether loan balances for which the
collectability is in question are charged-off or a specific reserve
2 0 1 3 A N N U A L R E P O R T T O S H A R E H O L D E R S | N O R T H E R N T R U S T C O R P O R A T I O N 27

management’s discussion and analysis of financial condition and results of operations
is established are based on management’s assessment as to the
level of certainty regarding the amount of loss. The provision
for credit losses, which is charged to income, is the amount
necessary to adjust the allowance for credit losses to the level
deemed to be appropriate through the above process. Actual
losses may vary from current estimates and the amount of the
provision for credit losses may be either greater than or less
than actual net charge-offs.
Management’s estimates utilized in establishing an
appropriate level of allowance for credit losses are not
dependent on any single assumption. Management evaluates
numerous variables, many of which are interrelated or
dependent on other assumptions and estimates, in
determining an appropriate allowance level. Due to the
inherent imprecision in accounting estimates, other estimates
or assumptions could reasonably have been used in the
current period and changes in estimates are reasonably likely
to occur from period to period.
Additionally, as an integral part of their examination
process, various federal and state regulatory agencies also
review the allowance for credit losses. These agencies may
require that certain loan balances be classified differently or
charged off when their credit evaluations differ from those of
management, based on their judgments about information
available to them at the time of their examination. However,
management believes that the allowance for credit losses
adequately addresses these uncertainties and has been
established at an appropriate level to cover probable losses
which have occurred as of the date of the consolidated
financial statements.
Pension Plan Accounting
Northern Trust maintains a noncontributory defined benefit
pension plan covering substantially all U.S. employees (the
Qualified Plan) and a U.S. noncontributory supplemental
pension plan (the Nonqualified Plan). Certain European-
based employees also retain benefits in local defined benefit
pension plans which are closed to new employees and to
future benefit accruals. Measuring cost and reporting liabilities
resulting from defined benefit pension plans requires the use
of several assumptions regarding future interest rates, asset
returns, compensation increases and other actuarial-based
projections relating to the plans. Due to the long-term nature
of this obligation and the estimates that are required to be
made, the assumptions used in determining the periodic
pension expense and the projected pension obligation are
closely monitored and reviewed annually for adjustments that
may be required. Pension accounting guidance requires that
differences between estimates and actual experience be
recognized as other comprehensive income in the period in
which they occur. The differences are amortized into net
periodic pension expense from accumulated other
comprehensive income over the future working lifetime of
eligible participants. As a result, differences between the
estimates made in the calculation of periodic pension expense
and the projected pension obligation and actual experience
affect stockholders’ equity in the period in which they occur
but continue to be recognized as expense systematically and
gradually over subsequent periods.
Northern Trust recognizes the significant impact that
these pension-related assumptions have on the determination
of the pension obligations and related expense and has
established procedures for monitoring and setting these
assumptions each year. These procedures include an annual
review of actual demographic and investment experience with
the pension plans’ actuaries. In addition to actual experience,
adjustments to these assumptions consider observable yields
on fixed income securities, known compensation trends and
policies, as well as economic conditions and investment
strategies that may impact the estimated long-term rate of
return on plan assets.
In determining the pension expense for the U.S. plans in
2013, Northern Trust utilized a discount rate of 4.25% for
both the Qualified Plan and the Nonqualified Plan. The rate of
increase in the compensation level is based on a sliding scale
that averaged 4.02%. The expected long-term rate of return on
Qualified Plan assets was 7.75%.
In evaluating possible revisions to pension-related
assumptions for the U.S. plans as of Northern Trust’s
December 31, 2013 measurement date, the following were
considered:
‰ Discount Rate: Northern Trust estimates the discount rate
for its U.S. pension plans by applying the projected cash
flows for future benefit payments to several published
discount rate yield curves as of the measurement date.
These yield curves are composed of individual zero-
coupon interest rates for 60 different time periods over a
30-year time horizon. Zero-coupon rates utilized by the
yield curves are mathematically derived from observable
market yields for AA-rated corporate bonds. The yield
curve models referenced by Northern Trust in establishing
the discount rate supported a rate between 4.91% and
5.18%, with an average increase of 85 basis points over the
prior year. As such, Northern Trust increased the discount
rate for the Qualified and Nonqualified plans from 4.25%
for December 31, 2012 to 5.00% for December 31, 2013.
2 0 1 3 A N N U A L R E P O R T T O S H A R E H O L D E R S | N O R T H E R N T R U S T C O R P O R A T I O N 28
management’s discussion and analysis of financial condition and results of operations
‰ Compensation Level: Based on a review of actual and
anticipated salary experience, the compensation scale
assumption has been revised to a sliding scale that
averages 4.25%.
‰ Rate of Return on Plan Assets: The expected return on
plan assets is based on an estimate of the long-term (30
years) rate of return on plan assets, which is determined
using a building block approach that considers the current
asset mix and estimates of return by asset class based on
historical experience, giving proper consideration to
diversification and rebalancing. Current market factors
such as inflation and interest rates are also evaluated
before long-term capital market assumptions are
determined. Peer data and historical returns are reviewed
to check for reasonability and appropriateness. As a result
of these analyses, Northern Trust’s rate of return
assumption remained unchanged from the prior year at
7.75% for 2014.
‰ Mortality Table: Northern Trust uses the mortality table
proposed by the U.S. Treasury for use in accordance with
the provisions of the Pension Protection Act of 2006
(PPA) for both pre- and post-retirement mortality
assumptions. This table is based on the RP2000 mortality
table with projections of expected future mortality
improvements. Effective December 31, 2013, Northern
Trust adopted a fully generational projection of mortality
improvements using Scale AA.
In order to illustrate the sensitivity of these assumptions on
the expected Qualified Plan periodic pension expense in 2014
and the projected benefit obligation, the following table is
presented to show the effect of increasing or decreasing each
of these assumptions by 25 basis points.
(In Millions)
25 BASIS
POINT
INCREASE
25 BASIS
POINT
DECREASE
Increase (Decrease) in 2014 Pension ExpenseDiscount Rate Change (3.7) 3.9Compensation Level Change 1.1 (1.1)Rate of Return on Plan Assets Change (3.1) 3.1
Increase (Decrease) in 2013 Projected BenefitObligationDiscount Rate Change (38.1) 40.2Compensation Level Change 3.4 (3.3)
Pension Contributions: The deduction limits specified by
the Internal Revenue Code for contributions made by
sponsors of defined benefit pension plans are based on a
“Target Liability” under the provisions of the PPA. Northern
Trust contributed $100.0 million to the Qualified Plan in
2012. There were no contributions to the Qualified Plan in
2013. 2013 U.S. pension expense reflects the investment return
on the 2012 contributions. This benefit was partially offset by
the related forgone interest earnings on the funds contributed.
The minimum required contribution to the Qualified Plan is
expected to be zero in 2014 and for several years thereafter.
The maximum deductible contribution is estimated at $195
million for 2014.
Other-Than-Temporary Impairment ofInvestment Securities
Under GAAP, companies are required to perform periodic
reviews of securities with unrealized losses to determine
whether the declines in value are considered other-than-
temporary. For available-for-sale and held-to-maturity
securities that management has no intent to sell, and believes it
more-likely-than-not that it will not be required to sell, prior to
recovery, the consolidated statement of income reflects only
the credit loss component of an impairment, while the
remainder of the fair value loss is recognized in accumulated
other comprehensive income. The credit loss component
recognized in earnings is identified as the amount of principal
not expected to be received over the remaining term of the
security as projected. For debt securities that Northern Trust
intends to sell, or would more-likely-than-not be required to
sell, before the expected recovery of the amortized cost basis,
the full impairment (that is, the difference between the
security’s amortized cost basis and fair value) is recognized in
earnings. The application of significant judgment is required in
determining the assumptions used in assessing whether an
OTTI exists and, if so, in the calculation of the credit loss
component of the OTTI. Assumptions used in this process are
inherently subject to change in future periods. Different
judgments or subsequent changes in estimates could result in
materially different impairment loss recognition.
Northern Trust conducts security impairment reviews
quarterly to evaluate those securities within its investment
portfolio that have indications of possible OTTI. A
determination as to whether a security’s decline in market
value is other-than-temporary takes into consideration
numerous factors and the relative significance of any single
factor can vary by security. Factors considered in determining
whether impairment is other-than-temporary include, but are
not limited to, the length of time which the security has been
impaired; the severity of the impairment; the cause of the
impairment; the financial condition and near-term prospects
of the issuer; activity in the market of the issuer which may
indicate adverse credit conditions; Northern Trust’s intent
regarding the sale of the security as of the balance sheet date;
2 0 1 3 A N N U A L R E P O R T T O S H A R E H O L D E R S | N O R T H E R N T R U S T C O R P O R A T I O N 29

management’s discussion and analysis of financial condition and results of operations
and the likelihood that it will not be required to sell the
security for a period of time sufficient to allow for the recovery
of the security’s amortized cost basis. The Corporate Asset and
Liability Policy Committee reviews the results of impairment
analyses and concludes on whether OTTI exists.
Credit-related losses recognized in 2012 and 2011 in
connection with the write-down of securities totaled $3.3
million and $23.3 million, respectively. There were no credit-
related losses recognized in 2013. However, additional OTTI
may occur in future periods as a result of market and
economic conditions.
FAIR VALUE MEASUREMENTS
The preparation of financial statements in conformity with
GAAP requires certain assets and liabilities to be reported at
fair value. As of December 31, 2013, approximately 29% of
Northern Trust’s total assets and approximately 1% of its total
liabilities were carried on the consolidated balance sheet at fair
value. As discussed more fully in Note 3 to the consolidated
financial statements, GAAP requires entities to categorize
financial assets and liabilities carried at fair value according to
a three-level valuation hierarchy. The hierarchy gives the
highest priority to quoted, active market prices for identical
assets and liabilities (Level 1) and the lowest priority to
valuation techniques that require significant management
judgment because one or more of the significant inputs are
unobservable in the market place (Level 3). Approximately 6%
of Northern Trust’s assets carried at fair value are classified as
Level 1; Northern Trust typically does not hold equity
securities or other instruments that are actively traded on an
exchange.
Approximately 93% of Northern Trust’s assets and 95% of
its liabilities carried at fair value are categorized as Level 2, as
they are valued using models in which all significant inputs are
observable in active markets. Investment securities classified as
available for sale make up 93.8% of Level 2 assets with the
remaining 6.2% primarily consisting of derivative financial
instruments. Level 2 liabilities are comprised solely of
derivative financial instruments.
Northern Trust’s Level 2 assets include available for sale
and trading account securities, the fair values of which are
determined predominantly by external pricing vendors.
Northern Trust has a well-established process to validate
prices received from pricing vendors as discussed more fully in
Note 3 to the consolidated financial statements.
As of December 31, 2013, all derivative assets and
liabilities were classified in Level 2 and approximately 97%,
measured on a notional value basis, related to client-related
and trading activities, predominantly consisting of foreign
exchange contracts. Derivative instruments are valued
internally using widely accepted income-based models that
incorporate inputs readily observable in actively quoted
markets and reflect contractual terms of contracts. Northern
Trust evaluated the impact of counterparty credit risk and its
own credit risk on the valuation of derivative instruments.
Factors considered included the likelihood of default by
Northern Trust and its counterparties, the remaining
maturities of the instruments, net exposures after giving effect
to master netting agreements, available collateral, and other
credit enhancements in determining the appropriate fair value
of derivative instruments. The resulting valuation adjustments
are not considered material.
As of December 31, 2013, the fair value of Northern
Trust’s Level 3 assets and liabilities were $98.9 million and
$55.4 million, respectively, and represented approximately
0.3% of assets and 4.5% of liabilities carried at fair value,
respectively. Level 3 assets consist of auction rate securities
purchased from Northern Trust clients. To estimate the fair
value of auction rate securities, for which trading is limited
and market prices are generally unavailable, Northern Trust
developed and maintains a pricing model that discounts
estimated cash flows over their estimated remaining lives.
Significant inputs to the model include the contractual terms
of the securities, credit risk ratings, discount rates, forward
interest rates, credit/liquidity spreads, and Northern Trust’s
own assumptions about the estimated remaining lives of the
securities. As of December 31, 2013, Level 3 liabilities consist
of acquisition related contingent consideration liabilities. The
fair values of these contingent consideration liabilities have
been determined using an income-based (discounted cash
flow) model that incorporates Northern Trust’s own
assumptions about business growth rates and applicable
discount rates.
While Northern Trust believes its valuation methods for
its assets and liabilities carried at fair value are appropriate and
consistent with other market participants, the use of different
methodologies or assumptions, particularly as applied to
Level 3 assets and liabilities, could have a material effect on the
computation of their estimated fair values.
2 0 1 3 A N N U A L R E P O R T T O S H A R E H O L D E R S | N O R T H E R N T R U S T C O R P O R A T I O N 30

management’s discussion and analysis of financial condition and results of operations
IMPLEMENTATION OFACCOUNTING STANDARDS
Information related to recent accounting pronouncements is
contained in Note 2 to the consolidated financial statements.
CAPITAL EXPENDITURES
Proposed significant capital expenditures are reviewed and
approved by Northern Trust’s senior management and, where
appropriate, by the Board. This process is designed to assure
that the major projects to which Northern Trust commits its
resources produce benefits compatible with its strategic goals.
Capital expenditures in 2013 included ongoing
enhancements to Northern Trust’s software and hardware
capabilities, the opening of new offices, and the expansion and
renovation of several existing offices. Capital expenditures for
2013 totaled $384.9 million, of which $293.0 million was for
software, $53.0 million was for computer hardware, $30.5
million was for building and leasehold improvements, and
$8.4 million was for furnishings. These capital expenditures
principally support and enhance Northern Trust’s investment
management, asset servicing and asset management
capabilities, as well as relationship management and client
interaction. Additional capital expenditures planned for
systems technology will result in future expense for the
depreciation of hardware and amortization of software.
Software amortization and depreciation on computer
hardware and machinery are charged to equipment and
software expense. Depreciation on building and leasehold
improvements and on furnishings is charged to occupancy
expense and equipment expense, respectively. Capital
expenditures for 2012 totaled $312.5 million, of which $239.2
million was for software, $45.3 million was for computer
hardware and machinery, $25.7 million was for building and
leasehold improvements, and $2.3 million was for furnishings.
OFF-BALANCE SHEET ARRANGEMENTS
Assets Under Custody and Assets Under Management
Northern Trust, in the normal course of business, holds assets
under custody, management and servicing in a fiduciary or
agency capacity for its clients. In accordance with GAAP, these
assets are not assets of Northern Trust and are not included in
its consolidated balance sheet.
Financial Guarantees and Indemnifications
Northern Trust issues financial guarantees in the form of
standby letters of credit to meet the liquidity and credit
enhancement needs of its clients. Standby letters of credit
obligate Northern Trust to meet certain financial obligations
of its clients, if, under the contractual terms of the agreement,
the clients are unable to do so. These instruments are
primarily issued to support public and private financial
commitments, including commercial paper, bond financing,
initial margin requirements on futures exchanges and similar
transactions.
Credit risk is the principal risk associated with these
instruments. The contractual amounts of these instruments
represent the credit risk should the instrument be fully drawn
upon and the client default. To control the credit risk
associated with issuing letters of credit, Northern Trust
subjects such activities to the same credit quality and
monitoring controls as its lending activities. Northern Trust is
obligated to meet the entire financial obligation of these
agreements and in certain cases is able to recover the amounts
paid through recourse against collateral received or other
participants.
Standby letters of credit totaled $4.5 billion at
December 31, 2013 and $4.6 billion at 2012. These amounts
include $208.9 million and $557.7 million of standby letters of
credit secured by cash deposits or participated to others as of
December 31, 2013 and 2012, respectively. The weighted
average maturity of standby letters of credit was 25 months
and 27 months at December 31, 2013 and 2012, respectively.
As part of its securities custody activities and at the
direction of its clients, Northern Trust lends securities owned
by clients to borrowers who are reviewed and approved by the
Northern Trust Counterparty Risk Management Committee.
In connection with these activities, Northern Trust has issued
indemnifications to certain clients against certain losses that
are a direct result of a borrower’s failure to return securities
when due, should the value of such securities exceed the value
of the collateral required to be posted. Borrowers are required
to fully collateralize securities received with cash or
marketable securities. As securities are loaned, collateral is
maintained at a minimum of 100% of the fair value of the
securities plus accrued interest. The collateral is revalued on a
daily basis. The amount of securities loaned as of
December 31, 2013 and 2012 subject to indemnification was
$82.7 billion and $69.7 billion, respectively. Because of the
credit quality of the borrowers and the requirement to fully
collateralize securities borrowed, management believes that
the exposure to credit loss from this activity is not significant
and no liability was recorded related to these
indemnifications.
2 0 1 3 A N N U A L R E P O R T T O S H A R E H O L D E R S | N O R T H E R N T R U S T C O R P O R A T I O N 31

management’s discussion and analysis of financial condition and results of operations
Variable Interest EntitiesVariable Interest Entities (VIEs) are defined within GAAP as
entities which either have a total equity investment that is
insufficient to permit the entity to finance its activities without
additional subordinated financial support or whose equity
investors lack the characteristics of a controlling financial
interest. Investors that finance a VIE through debt or equity
interests, or other counterparties that provide other forms of
support, such as guarantees, subordinated fee arrangements,
or certain types of derivative contracts, are variable interest
holders in the entity and the variable interest holder, if any,
that has both the power to direct the activities that most
significantly impact the entity and a variable interest that
could potentially be significant to the entity is deemed
to be the VIE’s primary beneficiary and is required to
consolidate the VIE.
Leveraged Leases. In leveraged leasing transactions,
Northern Trust acts as lessor of the underlying asset subject to
the lease, and typically funds 20-30% of the asset’s cost via an
equity ownership in a trust with the remaining 70-80% provided
by third party non-recourse debt holders. In such transactions,
the trusts, which are VIEs, are created to provide the lessee use of
the property with substantially all of the rights and obligations of
ownership. The lessee’s maintenance and operation of the leased
property has a direct effect on the fair value of the underlying
property, and the lessee also has the ability to increase the
benefits it can receive and limit the losses it can suffer by the
manner in which it uses the property. As a result, Northern Trust
has determined that it is not the primary beneficiary of these
VIEs given it lacks the power to direct the activities that most
significantly impact the economic performance of the VIEs.
Tax Credit Structures. Northern Trust invests in
community development projects that are designed to
generate a return primarily through the realization of tax
credits. The community development projects are formed as
limited partnerships and LLCs, and Northern Trust typically
invests as a limited partner/investor member in the form of
equity contributions. The economic performance of the
community development projects, which are deemed to be
VIEs, is driven by the performance of their underlying
investment projects as well as the VIEs’ ability to operate in
compliance with the rules and regulations necessary for the
qualification of tax credits generated by equity investments.
Northern Trust has determined that it is not the primary
beneficiary of any community development projects as it lacks
the power to direct the activities that most significantly impact
the economic performance of the underlying project or to
affect the VIEs’ ability to operate in compliance with the rules
and regulations necessary for the qualification of tax credits
generated by equity investments. This power is held by the
general partners and managing members who exercise full and
exclusive control of the operations of the VIEs.
Trust Preferred Securities. As discussed in further detail
in Note 13 to the consolidated financial statements, in 1997,
Northern Trust issued Floating Rate Capital Securities, Series
A and Series B, through statutory business trusts wholly-
owned by the Corporation (“NTC Capital I” and “NTC
Capital II”, respectively). The sole assets of the trusts are
Subordinated Debentures of the Corporation that have the
same interest rates and maturity dates as the corresponding
distribution rates and redemption dates of the Floating Rate
Capital Securities. NTC Capital I and NTC Capital II are
considered VIEs; however, as the sole asset of each trust is a
receivable from the Corporation and proceeds to the
Corporation from the receivable exceed the Corporation’s
investment in the VIEs’ equity shares, the Corporation is not
permitted to consolidate the trusts, even though the
Corporation owns all of the voting equity shares of the trusts,
has fully guaranteed the trusts’ obligations, and has the right
to redeem the preferred securities in certain circumstances.
Investment Funds. Northern Trust acts as asset manager
for various funds in which clients of Northern Trust are
investors. As an asset manager of funds, the Corporation earns
a competitively priced fee that is based on assets managed and
varies with each fund’s investment objective. Based on its
analysis, Northern Trust has determined that it is not the
primary beneficiary of these VIEs under GAAP.
LIQUIDITY AND CAPITAL RESOURCES
Liquidity Risk Management
The objectives of liquidity risk management are to ensure that
Northern Trust can meet its cash flow obligations under both
normal and adverse economic conditions while maintaining
its ability to capitalize on business opportunities in a timely
and cost effective manner. The liquidity of the Corporation is
managed separately from that of the Bank which encompasses
all of Northern Trust’s U.S. and international banking
activities.
Governance and Risk Management Framework
Northern Trust manages its liquidity under a global risk
management framework, incorporating regional policies,
limits and management when appropriate. Corporate liquidity
2 0 1 3 A N N U A L R E P O R T T O S H A R E H O L D E R S | N O R T H E R N T R U S T C O R P O R A T I O N 32

management’s discussion and analysis of financial condition and results of operations
policies, risk appetite and limits are reviewed annually by the
Business Risk Committee of the Board and approved by the
Board. Management’s Corporate Asset and Liability Policy
Committee (ALCO) is responsible for recommending
liquidity policies to the Board, establishing internal guidelines,
approving contingency plans, assessing Northern Trust’s
overall liquidity status, and reviewing reports and analyses on
a regular basis. The Corporate Treasury department has the
day-to-day responsibility for measuring, analyzing and
managing liquidity risk within the guidelines and limits
established by ALCO and the Board.
Northern Trust’s Global Liquidity Management
framework focuses on five key areas: Position Management;
Modeling and Analysis; Contingency Planning; Peer Group
Comparisons and Management Reporting; while also
providing for the review and management of the liquidity of
the Corporation separate from that of the Bank. It is through
this framework that management monitors its sources and
uses of liquidity, evaluates their level of stability under various
circumstances, plans for adverse situations, benchmarks itself
against other banks, provides information to management,
and complies with various U.S. and international regulations.
Northern Trust Consolidated Liquidity Management
Position management includes daily monitoring of cash
positions and anticipating future funding requirements given
both internal and external events. As the Corporation’s
principal subsidiary encompassing all of Northern Trust’s
banking activities, the Bank centrally manages liquidity for all
U.S. and international banking operations. Liquidity is
provided by a variety of sources, including client deposits
(institutional and personal) from our C&IS and Wealth
Management businesses, wholesale funding from the capital
markets, maturities of short-term investments, Federal Home
Loan Bank advances, and unencumbered liquid assets that can
be sold or pledged to secure additional funds. While
management does not view the Federal Reserve’s discount
window as a primary source of liquidity, at December 31, 2013
the Bank had over $20.8 billion of securities and loans readily
available as collateral to support discount window borrowings.
The Bank is also very active in the U.S. interbank funding
market, providing an important source of additional liquidity
and low-cost funds. Liquidity is used by a variety of activities,
including client withdrawals, purchases of securities, net loan
growth, and draws on commitments to extend credit.
Northern Trust maintains a very liquid balance sheet with
loans and leases representing 29% of total assets as of
December 31, 2013. Further, at December 31, 2013 there were
significant sources of liquidity within the Bank’s consolidated
balance sheet in the form of central bank reserves, demand
balances held in various currencies, securities available for sale
and short-term money market assets. Unencumbered
securities at the Bank, which include those placed at the
Federal Reserve discount window, totaled $26.7 billion at
December 31, 2013.
Liquidity modeling and analysis evaluates a bank’s ability
to meet its cash flow obligations given a variety of possible
internal and external events and under different economic
conditions. Northern Trust uses liquidity modeling to support
its contingent liquidity plans, gain insight into its liquidity
position and strengthen its liquidity policies and practices.
Liquidity modeling is performed using multiple independent
scenarios, across major currencies, at a consolidated corporate
level and for various international banking subsidiaries. These
scenarios, which include both company specific and systemic
events, analyze potential impacts on our domestic and foreign
deposit balances, wholesale funding sources, financial market
access, external borrowing capacity and off-balance sheet
obligations. Results are reviewed by senior management and
ALCO on a regular basis.
Another important area of Northern Trust’s liquidity risk
management is the development and maintenance of its
contingent liquidity plans. A global contingent liquidity action
plan covering the Corporation, Bank and major subsidiaries is
approved by ALCO and regularly updated and tested. This
plan, which can be activated in the event of an actual liquidity
crisis, details organizational responsibilities and defines
specific actions designed to ensure the proper maintenance of
liquidity during periods of stress. In addition, international
banking subsidiaries have individual contingent liquidity
plans, which incorporate the global plan.
Northern Trust also analyzes its liquidity profile against a
peer group of large U.S. bank holding companies, including
other major custody banks. This analysis provides
management with benchmarking information, highlights
industry trends, and supports the establishment of new
policies and strategies.
Management regularly reviews various reports, analyses
and other information depicting changes in Northern Trust’s
liquidity mix and funding concentrations, overall financial
market conditions and other internal and external liquidity
metrics. Management uses this information to evaluate the
overall status of Northern Trust’s liquidity position and
anticipate potential events that could stress that position in the
future. An overall Liquidity Status Level for Northern Trust,
established and regularly reviewed by ALCO, is monitored on
an ongoing basis by the Corporate Treasury department.
Downgrades in liquidity status resulting from internal,
2 0 1 3 A N N U A L R E P O R T T O S H A R E H O L D E R S | N O R T H E R N T R U S T C O R P O R A T I O N 33

management’s discussion and analysis of financial condition and results of operations
external or industry-wide events, trigger specific pre-
determined actions and limits designed to position Northern
Trust to better respond to potential liquidity stresses.
Corporation Liquidity
The liquidity of the Corporation is managed separately from
that of the Bank. The primary sources of cash for the
Corporation are issuance of debt, dividend payments from its
subsidiaries, and interest and dividends earned on investment
securities and money market assets. The Corporation’s uses of
cash consist mainly of dividend payments to the Corporation’s
stockholders; the payment of principal and interest to note
holders; purchases of its common stock; investments in, or
loans, to its subsidiaries; and acquisitions. The most
significant uses of cash by the Corporation during 2013 were
$221.9 million of common dividends paid to stockholders,
$409.6 million of debt maturities, and $309.7 million of
common share repurchases. Debt maturities during 2013
include the maturity of 5.50% fixed-rate senior notes in
August of 2013.
On October 31, 2013, the Corporation issued $750 million
of 3.950% fixed-rate subordinated notes due October 30,
2025. These notes are non-callable, unsecured and were issued
at a discount to yield 3.962%.
During 2013, the Corporation received $880.0 million of
dividends from the Bank. Dividends from the Bank are subject
to certain restrictions, as discussed in further detail in Note 30
to the consolidated financial statements. During 2014, the
Bank has the ability to pay dividends equal to its 2014 eligible
net profits plus $103.1 million. As described in Note 20 to the
consolidated financial statements, Northern Trust has elected
to indefinitely reinvest undistributed earnings of certain non-
US subsidiaries of the Bank approximating $956.0 million at
December 31, 2013. This election, however, does not reduce
the Bank’s ability to pay dividends to the Corporation.
The Corporation’s liquidity, defined as the amount of
highly marketable assets, was $1.6 billion and $1.7 billion at
December 31, 2013 and 2012, respectively. During, and at
year-end, 2013 and 2012, these assets were comprised almost
entirely of cash in a demand deposit account at The Northern
Trust Company or overnight money market placements, both
of which were fully available to the Corporation to support its
own cash flow requirements or those of its subsidiary
companies, as needed. Average liquidity during 2013 and 2012
was $1.74 billion and $1.59 billion, respectively. The cash
flows of the Corporation are shown in Note 33 to the
consolidated financial statements.
A significant source of liquidity for both the Corporation
and the Bank is the ability to draw funding from capital
markets globally. The availability and cost of these funds are
influenced by our credit rating; as a result, a downgrade could
have an adverse impact on our liquidity. The credit ratings of
the Corporation and the Bank as of December 31, 2013,
provided below, allow Northern Trust to access capital
markets on favorable terms.
CREDIT RATING
STANDARD &
POOR’S MOODY’S FITCHRATINGS
Northern Trust Corporation:Commercial Paper A-1 P-1 F1+Senior Debt A+ A2 AA -Outlook Stable Stable Stable
The Northern Trust Company:Short-Term Deposit / Debt A-1+/A-1+ P-1/P-1 F1+/F1+Long-Term Deposit / Debt AA -/AA - A1 AA/AA -Outlook Stable Stable Stable
On November 14, 2013, Moody’s Investors Service
lowered the long-term credit rating of Northern Trust
Corporation by one notch, from A1 to A2. A significant
downgrade in one or more of these ratings could limit
Northern Trust’s access to capital markets and/or increase the
rates paid for short-term borrowings, including deposits, and
future long-term debt issuances. The size of these rate
increases would depend on multiple factors including, the
extent of the downgrade, Northern Trust’s relative debt rating
compared to other financial institutions, current market
conditions, and other factors. In addition, as discussed in
Note 25 to Consolidated Financial Statements, Northern Trust
enters into certain master netting agreements with derivative
counterparties that contain credit-risk-related contingent
features in which the counterparty has the option to declare
Northern Trust in default and accelerate cash settlement of
any net derivative liability in the event Northern Trust’s credit
rating falls below specified levels. The maximum amount of
these termination payments that Northern Trust could have
been required to pay at December 31, 2013 was $60.3 million.
Other than these credit-risk-related contingent derivative
counterparty payments, Northern Trust had no long term
debt covenants or other credit risk related payments at
December 31, 2013 that would be triggered by a significant
downgrade in its debt ratings.
2 0 1 3 A N N U A L R E P O R T T O S H A R E H O L D E R S | N O R T H E R N T R U S T C O R P O R A T I O N 34

management’s discussion and analysis of financial condition and results of operations
Regulatory EnvironmentIn recent years, U.S. and international regulatory agencies
have taken various actions to strengthen liquidity
requirements for global financial institutions in order to
reduce the potential impacts of future economic events. These
agencies have proposed certain new rules and finalized others
that address the management of liquidity risk. Northern Trust
actively follows regulatory developments and regularly
evaluates its liquidity risk management framework against
proposed rulemaking and industry best practices in order to
comply with applicable regulations and further enhance its
liquidity policies.
Statement of Cash Flows
For the year ended December 31, 2013, net cash provided by
operating activities was $839.3 million, primarily the result
of earnings and reflecting non-cash charges such as
amortization of computer software, partially offset by
increases in net collateral deposited with derivative
counterparties and in receivables. Net cash provided by
operations for the year ended December 31, 2012 was $814.4
million and was primarily the result of earnings and reflected
non-cash charges, partially offset by increased net collateral
deposited with derivative counterparties and pension plan
contributions.
Net cash used in investing activities of $5.7 billion for the
year ended December 31, 2013 is primarily attributable to an
increase in Federal Reserve deposits and other interest-bearing
assets, primarily reflecting increased levels of non-U.S. office
interest-bearing client deposits and short-term other
borrowings.
Net cash provided by investing activities of $1.6 billion for
the year ended December 31, 2012 primarily reflects decreases
in Federal Reserve deposits and other interest bearing assets,
partially offset by increased interest-bearing deposits with
banks. The decrease in Federal Reserve deposits and other
interest-bearing assets in the prior year period was primarily
the result of lower levels of U.S. office client deposits
denominated in U.S. dollars, short-term borrowings and long-
term debt, while the increased interest-bearing deposits with
banks was primarily attributable to an increase in time
deposits of certain non-U.S. dollar currencies due to an
increase in client deposits denominated in those currencies.
For the year ended December 31, 2013, net cash provided
by financing activities totaled $4.4 billion, primarily reflecting
increased levels of total deposits and short-term other
borrowings. The increase in the level of total deposits was
primarily due to an increase in non-U.S. office interest-
bearing client deposits, partially offset by decreased U.S. office
demand and other noninterest-bearing client deposits from
December 31, 2012 levels. The decrease in U.S. office
noninterest-bearing deposits was largely driven by the
expiration on December 31, 2012 of the Federal Deposit
Insurance Corporation’s Temporary Liquidity Guarantee
Program which had provided unlimited deposit insurance.
The increase in short-term other borrowings in 2013 reflects
additional short-term borrowings from the Federal Home
Loan Bank.
For the year ended December 31, 2012, net cash used in
financing activities totaled $3.1 billion, primarily reflecting a
decline in the level of deposits from temporarily elevated levels
at December 31, 2011, as well as decreased short-term
borrowings and long-term debt, both primarily the result of
maturities during 2012.
2 0 1 3 A N N U A L R E P O R T T O S H A R E H O L D E R S | N O R T H E R N T R U S T C O R P O R A T I O N 35

management’s discussion and analysis of financial condition and results of operations
Contractual Obligations
The following table shows Northern Trust’s contractual obligations at December 31, 2013.
PAYMENT DUE BY PERIOD
(In Millions) TOTAL
ONE YEAR
AND LESS
1-3
YEARS 4-5 YEARS
OVER 5
YEARS
Senior Notes(1) $1,996.6 $500.0 $ – $ – $1,496.6Subordinated Debt(1) 1,537.3 – 248.3 539.9 749.1Federal Home Loan Bank Borrowings(1) 135.0 135.0 – – –Floating Rate Capital Debt(1) 277.1 – – – 277.1Capital Lease Obligations(2) 48.3 8.4 16.3 16.6 7.0Operating Leases(2) 710.3 82.2 146.2 135.1 346.8Purchase Obligations(3) 317.1 102.8 151.2 57.6 5.5
Total Contractual Obligations $5,021.7 $828.4 $562.0 $749.2 $2,882.1
Note: Obligations as shown do not include deposit liabilities or interest requirements on funding sources.(1) Refer to Notes 12 and 13 to the consolidated financial statements for further details.(2) Refer to Note 10 to the consolidated financial statements for further details.(3) Purchase obligations consist primarily of ongoing operating costs related to outsourcing arrangements for certain cash management services and the support and maintenance of theCorporation’s technological requirements. Certain obligations are in the form of variable rate contracts and, in some instances, 2013 activity was used as a base to project future obligations.
Capital ManagementOne of Northern Trust’s primary objectives is to maintain a
strong capital position to merit and maintain the confidence
of clients, the investing public, bank regulators and
stockholders. A strong capital position helps Northern Trust
take advantage of profitable investment opportunities and
withstand unforeseen adverse developments.
Northern Trust manages its capital on a total Corporation
basis and on a legal entity basis. The Corporate Finance
department has the day-to-day responsibility for measuring
and managing capital levels within standards established by
the Capital Management Policy and the Board. The
management of capital also involves regional management
when appropriate. In establishing the standards for capital, a
variety of factors are taken into consideration, including the
overall risk of Northern Trust’s businesses, regulatory
requirements, capital levels relative to our peers, and the
impact on our credit ratings.
Capital levels were strengthened as average common
equity in 2013 increased $308.8 million, or 4%, reaching $7.7
billion. Total stockholders’ equity was $7.9 billion at
December 31, 2013, as compared to $7.5 billion at
December 31, 2012. The Corporation declared common
dividends totaling $299.2 million in 2013 and, in March 2013,
the Board increased the quarterly dividend by 3% to $0.31 per
common share. The Corporation’s share buyback program is
used for general corporate purposes, including management
of the Corporation’s capital level. During 2013, the
Corporation purchased 5,545,401 of its own common shares
at an average price per share of $55.90. The Corporation is
authorized by the Board to purchase up to 7.9 million
additional shares after December 31, 2013.
2 0 1 3 A N N U A L R E P O R T T O S H A R E H O L D E R S | N O R T H E R N T R U S T C O R P O R A T I O N 36

management’s discussion and analysis of financial condition and results of operations
CAPITAL ADEQUACY DECEMBER 31,
($ In Millions) 2013 2012
TIER 1 CAPITAL
Common Stockholders’ Equity $ 7,912.0 $ 7,527.0Floating Rate Capital Securities 268.8 268.7Net Unrealized Gains on Securities Available for Sale (6.0) (101.0)Net Unrealized (Gains) Losses on Cash Flow Hedges (2.9) 1.4Goodwill and Other Intangible Assets, net of deferred tax liability (578.5) (599.5)Pension and Other Postretirement Benefit Adjustments 260.3 393.1Other (0.5) (0.7)
Total Tier 1 Capital 7,853.2 7,489.0
TIER 2 CAPITAL
Qualifying Allowance for Credit Losses 283.0 295.1Qualifying Subordinated Debt 1,158.7 556.7
Total Tier 2 Capital 1,441.7 851.8
Total Risk-Based Capital $ 9,294.9 $ 8,340.8
Risk-Weighted Assets(1) $ 58,773.8 $58,316.1
Total Assets – End of Period (EOP) $102,947.3 $97,463.8Adjusted Average Fourth Quarter Assets(2) 99,074.9 90,873.7Total Loans and Leases – EOP 29,385.5 29,504.5
RATIOS
Risk-Based Capital RatiosTier 1 13.4% 12.8%Total (Tier 1 and Tier 2) 15.8 14.3Tier 1 Leverage 7.9 8.2Tier 1 Common Equity(3) 12.9 12.4
COMMON STOCKHOLDERS’ EQUITY TO
Total Loans and Leases EOP 26.92% 25.51%Total Assets EOP 7.69 7.72
(1) Assets exclude amounts related to goodwill, other intangible assets, and net unrealized gains or losses on securities and reflect adjustments for excess allowances for credit losses that havebeen excluded from tier 1 and tier 2 capital, if any.(2) Assets exclude amounts related to goodwill, other intangible assets, and net unrealized gains or losses on securities.(3) A reconciliation of tier 1 common equity to tier 1 capital calculated under GAAP is provided below.
The following table provides a reconciliation of tier
1common equity, a non-GAAP financial measure which
excludes floating rate capital securities, to tier 1 capital
calculated in accordance with applicable regulatory
requirements and GAAP.
DECEMBER 31,
($ In Millions) 2013 2012
Tier 1 Capital $7,853.2 $7,489.0Less: Floating Rate Capital Securities 268.8 268.7
Tier 1 Common Equity 7,584.4 7,220.3Tier 1 Capital Ratio 13.4% 12.8%Tier 1 Common Equity Ratio 12.9% 12.4%
In addition to its capital ratios prepared in accordance
with regulatory requirements and GAAP, Northern Trust is
providing the ratio of tier 1 common equity to risk-weighted
assets as it is a measure that the Corporation and investors use
to assess capital adequacy.
At December 31, 2013, the Corporation’s tier 1 capital
ratio was 13.4% and its total capital ratio was 15.8% of risk-
weighted assets, both well above the ratios that are a
requirement for regulatory classification as “well-capitalized”.
The “well-capitalized” minimum ratios are 6.0% and 10.0%,
respectively. The Corporation’s leverage ratio (tier 1 capital to
fourth quarter average assets) of 7.9% is also well above the
“well-capitalized” minimum requirement of 5.0%. In
addition, the Bank had a ratio of 11.5% for tier 1 capital,
14.3% for total risk-based capital, and 6.8% for leverage, and
each of the Corporation’s non-U.S. banking subsidiaries had
capital ratios above their specified minimum requirements.
The current risk-based capital guidelines that apply to the
Corporation and the Bank, commonly referred to as Basel I,
are based upon the 1988 capital accord of the Basel
Committee as implemented by the Federal Reserve Board.
The Corporation is also subject to the Basel II framework
for risk-based capital adequacy. The U.S. bank regulatory
2 0 1 3 A N N U A L R E P O R T T O S H A R E H O L D E R S | N O R T H E R N T R U S T C O R P O R A T I O N 37

management’s discussion and analysis of financial condition and results of operations
agencies have issued final rules with respect to
implementation of the Basel II framework. Under the final
Basel II rules, the Corporation is one of a small number of
“core” banking organizations. The rules require core banking
organizations to have rigorous processes for assessing overall
capital adequacy in relation to their total risk profiles, and to
publicly disclose certain information about their risk profiles
and capital adequacy.
On September 12, 2010, the Group of Governors and
Heads of Supervision, the oversight body of the Basel
Committee, announced agreement on the calibration and
phase-in arrangements for a strengthened set of capital
requirements, known as Basel III. On July 2, 2013, the Federal
Reserve Board issued final rules implementing Basel III in the
United States. Under these rules, when fully phased-in,
banking organizations will be required to satisfy four risk-
based capital ratios:
‰ A common equity tier 1 capital ratio of at least 4.5%;
‰ A tier 1 capital ratio of at least 6.0%;
‰ A total capital ratio of at least 8.0%; and
‰ A leverage ratio of at least 4.0%. Advanced approaches
institutions, such as the Corporation, will also be subject
to a minimum supplementary leverage ratio of 3.0%.
Under the Federal Reserve Board’s implementation in the
final Basel III rules of a provision of the Dodd-Frank Act, we
are subject to a capital floor that is based on the Basel III
standardized approach. We will therefore be required to
calculate our risk-based capital ratios under both the
standardized and advanced approaches, and will be subject to
the more stringent of the risk-based capital ratios as calculated
under the standardized approach and the advanced approach
in the assessment of our capital adequacy under the prompt
corrective action framework.
On February 21, 2014, the Corporation was notified by
the Federal Reserve Board that both the Corporation and the
Bank would be permitted to exit parallel run. Accordingly, the
Corporation and the Bank are required to use the advanced
approaches methodologies to calculate and publicly disclose
their risk-based capital ratios beginning with the second
quarter of 2014. Current results from the parallel run of the
risk-based capital framework have demonstrated that the use
of the advanced approaches methodologies, inclusive of
commitments we provided to the Federal Reserve regarding
our approach to the calculation of risk-weighted assets, has
not resulted in common equity tier 1 capital, tier 1 capital or
total risk-based capital ratios falling below the levels required
for categorization as “well-capitalized.” These results show
that, as of December 31, 2013, the Corporation’s common
equity tier 1 capital ratio as calculated under the advanced
approaches methodologies would have been 11.6% on a fully
phased-in basis, while the Corporation’s common equity tier 1
capital ratio under the standardized approach would have
been 11.1% on a fully phased-in basis.
Basel III also introduces a capital conservation buffer,
requiring banking organizations to hold a buffer of common
equity tier 1 capital above its minimum risk-based capital
requirements in an amount greater than 2.5% of its total risk-
weighted assets. The capital conservation buffer is designed to
absorb losses during periods of economic stress. Banking
organizations with a tier 1 common equity ratio above the
minimum but below the conservation buffer may face
constraints on dividends, equity repurchases and
compensation based on the amount of such shortfall. Basel III
also introduces a “countercyclical buffer” of 0% to 2.5% of a
banking organization’s total risk-weighted assets for advanced
approaches banking organizations, such as the Corporation,
which is intended to create a capital buffer for such banking
organizations during expansionary economic phases in order
to protect against declines in asset prices if credit conditions
weaken. In general, the amount of the countercyclical capital
buffer is a weighted average of the countercyclical capital
buffer established in the various jurisdictions in which the
banking organization has credit exposures.
The U.S.’s implementation of Basel III has increased the
minimum capital thresholds for banking organizations and
tightened the standards for what qualifies as capital. In
October 2013, the U.S. banking agencies proposed a rule that
would introduce quantitative liquidity requirements in the
U.S. for large banking organizations, such as the Corporation
and the Bank. The ultimate impact of the U.S. implementation
of the new capital and liquidity standards on the Corporation
and its bank subsidiaries is currently being reviewed. At this
point we cannot determine the ultimate effect these final and
proposed regulations would have upon our earnings or
financial position. However, we believe our capital strength,
balance sheet and business model leave us well positioned for
the U.S. implementation of Basel III.
2 0 1 3 A N N U A L R E P O R T T O S H A R E H O L D E R S | N O R T H E R N T R U S T C O R P O R A T I O N 38

management’s discussion and analysis of financial condition and results of operations
RISK MANAGEMENT
OverviewThe Board provides oversight of risk management directly as
well as through its Audit, Business Strategy, Compensation
and Benefits, and Business Risk Committees. The Audit
Committee provides oversight with respect to risks relating to
financial reporting and the legal component of compliance
risk. The Business Strategy Committee provides oversight with
respect to strategic risk for the Corporation and its
subsidiaries. The Compensation and Benefits Committee
reviews all compensation arrangements and practices and
assesses the extent to which such arrangements and practices
discourage inappropriate risk-taking behavior by participants
and are consistent with Northern Trust’s safety and
soundness. The Business Risk Committee provides oversight
with respect to the following risks inherent in Northern
Trust’s businesses: credit risk, market and liquidity risk,
fiduciary risk, operational risk, and the regulatory component
of compliance risk. The Chief Risk Officer oversees the
management of these risks, promotes risk awareness, and
fosters a proactive risk management environment wherein
risks inherent in business strategy are understood and
appropriately mitigated.
The Board has approved a Corporate Risk Appetite
Statement articulating Northern Trust’s expectation that risk
is consciously considered as part of strategic decisions and in
day-to-day activities. In addition, specific risk appetite
guidelines are detailed for strategic, credit, operational, market
and liquidity, fiduciary and compliance risk. Northern Trust
manages its business activities consistent with the Corporate
Risk Appetite Statement.
Northern Trust’s management of risk is built upon the
Enterprise Risk Management framework which includes the
risk universe representing the major risk categories and sub-
categories to which Northern Trust may be exposed through
its business activities.
A Business Unit chief risk officer is assigned to each of
Northern Trust’s business units and each chairs a risk
committee for their respective business unit on a regular basis
and reports directly to the Chief Risk Officer. Each business
unit risk committee rolls up to the Global Enterprise Risk
Committee (GERC). GERC is comprised of members of
Northern Trust’s senior management and rolls up to the
Business Risk Committee. Various corporate committees and
oversight entities have been established to review and approve
risk management strategies, standards, management practices
and tolerance levels. These committees and entities monitor
and provide periodic reporting to the respective committees of
the Board on risk performance and effectiveness of risk
management processes.
RISK CATEGORY RISK MEASUREMENT RISK TO EARNINGS AND/OR CAPITAL RESULTING FROM:
Credit Obligor and Counterparty Risk Failure of a borrower or counterparty to perform on an obligation.
Operational; Fiduciary; Compliance Operational Risk Inadequate or failed internal process, people and systems; or from externalevents.
Market and Liquidity Market Risk – Trading Book Changes in the value of trading positions.
Interest Rate Risk – Banking Book Changes in interest rates.
Liquidity Risk Funding needs during difficult markets.
Strategic Strategy Risk Adverse effects of business decisions, improper implementation of businessdecisions, unexpected external events.
Business Risk Adverse developments in the general business environment, which impact theentity’s results.
Reputation Risk Damage to the entity’s reputation.
2 0 1 3 A N N U A L R E P O R T T O S H A R E H O L D E R S | N O R T H E R N T R U S T C O R P O R A T I O N 39

management’s discussion and analysis of financial condition and results of operations
Asset Quality and Credit Risk Management
Securities Portfolio
Northern Trust maintains a high quality securities portfolio,
with 89% of the combined available for sale, held to maturity,
and trading account portfolios at December 31, 2013 composed
of U.S. Treasury and government sponsored agency securities
and triple-A rated corporate debt, asset-backed securities,
supranational, sovereign & non-U.S. agency bonds, auction rate
securities and obligations of states and political subdivisions. The
remaining portfolio was composed of corporate debt, asset-
backed securities, negotiable certificates of deposit, obligations of
states and political subdivisions, auction rate securities and other
securities, of which as a percentage of the total securities
portfolio, 4% were rated double-A, 3% were rated below double-
A, and 4% were not rated by Standard and Poor’s or Moody’s
Investors Service (primarily negotiable certificates of deposits of
banks whose long term ratings are at least A).
At December 31, 2013, 45% of corporate debt were rated
triple-A, 29% were rated double-A, and 26% were rated below
double-A. Residential mortgage-backed securities had a total
amortized cost and fair value of $52.4 million and $48.1
million, respectively, and were comprised primarily of
subprime, prime, and Alt-A securities. Securities classified as
“other asset-backed” at December 31, 2013 had average lives
of less than 5 years, and 99% were rated triple-A.
Unrealized losses within the investment securities portfolio
at December 31, 2013 were $180.4 million as compared to $30.2
million at December 31, 2012, primarily reflecting widened
credit spreads and higher market rates of government-sponsored
agency and corporate debt securities since purchase; 51% of the
corporate debt portfolio is backed by guarantees provided by
U.S. and non-U.S. governmental entities. There were no losses
recognized in 2013 in connection with the write-down of
securities determined to be other-than-temporarily impaired, as
compared to $3.3 million and $23.3 million recognized in 2012
and 2011, respectively.
Northern Trust is a participant in the repurchase
agreement market. This market provides a relatively low cost
alternative for short-term funding. Securities purchased under
agreements to resell and securities sold under agreements to
repurchase are accounted for as collateralized financings and
recorded at the amounts at which the securities were acquired
or sold plus accrued interest. To minimize any potential credit
risk associated with these transactions, the fair value of the
securities purchased or sold is monitored, limits are set on
exposure with counterparties, and the financial condition of
counterparties is regularly assessed. It is Northern Trust’s
policy to take possession of securities purchased under
agreements to resell. Securities sold under agreements to
repurchase are held by the counterparty until the repurchase.
Loans and Other Extensions of Credit
Credit risk is inherent in many of Northern Trust’s activities. A
significant component of credit risk relates to the loan portfolio.
In addition, credit risk is inherent in certain contractual
obligations such as legally binding commitments to extend
credit, commercial letters of credit, and standby letters of credit.
These contractual obligations and arrangements are discussed in
Note 27 to the consolidated financial statements and are
presented in tables that follow. Northern Trust focuses its
lending efforts on clients who are looking to utilize a full range of
financial services with Northern Trust.
Credit risk is managed through the Credit Policy function,
which is designed to assure adherence to a high level of credit
standards. Credit Policy reports to the Corporation’s Chief
Risk Officer. Credit Policy provides a system of checks and
balances for Northern Trust’s diverse credit-related activities
by establishing and monitoring all credit-related policies and
practices throughout Northern Trust and promoting their
uniform application. These activities are designed to diversify
credit exposure on an industry and client basis and reduce
overall credit risk. These credit management activities also
apply to Northern Trust’s use of derivative financial
instruments, including foreign exchange contracts and interest
risk management instruments.
Individual credit authority for commercial and personal
loans is limited to specified amounts and maturities. Credit
decisions involving commitment exposure in excess of the
specified individual limits are submitted to the appropriate
Credit Approval Committee (Committee). Each Committee is
chaired by the executive in charge of the area or their designee
and has a Credit Policy officer as a voting participant. Each
Committee’s credit approval authority is specified, based on
commitment levels, risk ratings and maturities. Credits
involving commitment exposure in excess of these limits
require the approval of the Senior Credit Committee. All
exposures approved by the Committees and the Senior Credit
Committee require unanimous approval of all voting
members.
2 0 1 3 A N N U A L R E P O R T T O S H A R E H O L D E R S | N O R T H E R N T R U S T C O R P O R A T I O N 40

management’s discussion and analysis of financial condition and results of operations
The Counterparty Risk Management Committee
established by Credit Policy manages counterparty risk. This
committee has sole credit authority for exposure to all non-
U.S. banks, certain U.S. banks which Credit Policy deems to
be counterparties and which do not have commercial credit
relationships within the Corporation, and certain other
exposures. Under the direction of Credit Policy, country
exposure limits are reviewed and approved by the
Counterparty Risk Management Committee on a country-by-
country basis.
As part of its credit process, Northern Trust utilizes an
internal borrower risk rating system to support identification,
approval, and monitoring of credit risk. Borrower risk ratings
are used in credit underwriting, management reporting, setting
of loss allowances, and economic capital calculations. Borrower
risk ratings are discussed further in Note 6 to the consolidated
financial statements.
Credit Policy oversees a range of portfolio reviews that
focus on significant and/or weaker-rated credits. This
approach allows management to take remedial action in an
effort to deal with potential problems. In addition,
independent from Credit Policy, the Credit Review Unit
undertakes both on-site and off-site file reviews that evaluate
effectiveness of management’s implementation of Credit
Policy’s requirements.
Northern Trust maintains a borrower loan watch list for
credits with borrower ratings of “6 to 9”. These credits, which
include all nonperforming credits, are expected to exhibit
minimally acceptable probabilities of default, elevated risk of
default, or are currently in default. Loans outstanding to
watch list borrowers associated with these risk profiles that are
not currently in default but have limited financial flexibility
totaled $546.7 million at December 31, 2013. Cash flows
and capital levels range from acceptable to potentially
insufficient to meet current requirements and borrowers
typically have minimal cushion in adverse down cycle
scenarios. An integral part of the Credit Policy function is a
formal review of past due and potential problem loans to
determine which credits, if any, need to be placed on
nonperforming status or charged off.
As more fully described in the “Provision and Allowance
for Credit Losses” section below, the provision for credit losses
has been determined, through a disciplined credit review
process, to be the amount needed to maintain the allowance
for credit losses at an appropriate level to absorb probable
credit losses that have been identified with specific borrower
relationships (specific loss component) and for probable losses
that are believed to be inherent in the loan and lease
portfolios, undrawn commitments, and standby letters of
credit (inherent loss component).
COMPOSITION OF LOAN PORTFOLIO DECEMBER 31,
(In Millions) 2013 2012 2011 2010 2009
CommercialCommercial and Institutional $ 7,375.8 $ 7,468.5 $ 6,918.7 $ 5,914.5 $ 6,312.1Commercial Real Estate 2,955.8 2,859.8 2,981.7 3,242.4 3,213.2Lease Financing, net 975.1 1,035.0 978.8 1,063.7 1,004.4Non-U.S. 954.7 1,192.3 1,057.5 1,046.2 728.5Other 358.6 341.6 417.6 346.6 457.5
Total Commercial $12,620.0 $12,897.2 $12,354.3 $11,613.4 $11,715.7
PersonalResidential Real Estate $10,271.3 $10,375.2 $10,708.9 $10,854.9 $10,807.7Private Client 6,445.6 6,130.1 5,651.4 5,423.7 5,004.4Other 48.6 102.0 349.3 240.0 277.9
Total Personal $16,765.5 $16,607.3 $16,709.6 $16,518.6 $16,090.0
Total Loans and Leases $29,385.5 $29,504.5 $29,063.9 $28,132.0 $27,805.7
SUMMARY OF OFF-BALANCE SHEET FINANCIAL INSTRUMENTS WITH CONTRACT AMOUNTS THAT REPRESENT CREDIT RISK
DECEMBER 31,
(In Millions) 2013 2012
Undrawn Commitments to Extend CreditOne Year and Less $ 9,336.1 $ 9,092.3Over One Year 22,838.7 20,953.4
Total $32,174.8 $30,045.7
Standby Letters of Credit $ 4,451.1 $ 4,573.7Commercial Letters of Credit 24.8 27.9Custody Securities Lent with Indemnification 82,673.9 69,739.2
2 0 1 3 A N N U A L R E P O R T T O S H A R E H O L D E R S | N O R T H E R N T R U S T C O R P O R A T I O N 41

management’s discussion and analysis of financial condition and results of operations
UNDRAWN COMMITMENTS TO EXTEND CREDIT AT DECEMBER 31, 2013 BY INDUSTRY SECTOR
COMMITMENT EXPIRATION
(In Millions)TOTAL
COMMITMENTS
ONE YEAR
AND LESS
OVER ONE
YEAR
OUTSTANDING
LOANS
CommercialCommercial and InstitutionalIndustry Sector
Finance and Insurance $ 3,505.4 $1,302.8 $ 2,202.6 $ 721.4Holding Companies 30.0 25.8 4.2 108.6Manufacturing 7,510.2 482.5 7,027.7 1,738.0Mining 612.1 141.8 470.3 122.7Public Administration 64.6 10.2 54.4 326.4Retail Trade 1,047.0 124.1 922.9 186.0Services 6,867.2 2,175.8 4,691.4 3,107.9Transportation and Warehousing 351.8 6.8 345.0 276.9Utilities 1,520.9 69.7 1,451.2 43.0Wholesale Trade 652.8 109.3 543.5 569.9Other Commercial 445.6 169.2 276.4 175.0
Commercial and Institutional (Note) $22,607.6 $4,618.0 $17,989.6 $ 7,375.8Commercial Real Estate 448.2 70.5 377.7 2,955.8Lease Financing, net – – – 975.1Non-U.S. 1,089.5 622.4 467.1 954.7Other 189.4 189.4 – 358.6
Total Commercial $24,334.7 $5,500.3 $18,834.4 $12,620.0
PersonalResidential Real Estate $ 1,744.1 $ 293.6 $ 1,450.5 $10,271.3Private Client 6,070.3 3,516.5 2,553.8 6,445.6Other 25.7 25.7 – 48.6
Total Personal $ 7,840.1 $3,835.8 $ 4,004.3 $16,765.5
Total $32,174.8 $9,336.1 $22,838.7 $29,385.5
Note: Commercial and institutional industry sector information is presented on the basis of the North American Industry Classification System (NAICS).
NON-U.S. OUTSTANDINGS
As used in this discussion, non-U.S. outstandings are cross-
border outstandings as defined by the U.S. Securities and
Exchange Commission. They consist of loans, acceptances,
interest-bearing deposits with financial institutions, accrued
interest and other monetary assets. Not included are letters of
credit, loan commitments, and non-U.S. office local currency
claims on residents funded by local liabilities. Non-U.S.
outstandings related to a country are net of guarantees given
by third parties resident outside the country and the value of
tangible, liquid collateral held outside the country. However,
transactions with branches of non-U.S. banks are included in
these outstandings and are classified according to the country
location of the non-U.S. bank’s head office.
Short-term interbank time deposits with non-U.S. banks
represent the largest category of non-U.S. outstandings.
Northern Trust actively participates in the interbank market
with U.S. and non-U.S. banks.
Northern Trust places deposits with non-U.S.
counterparties that have strong internal (Northern Trust) risk
ratings and external credit ratings. These non-U.S. banks are
approved and monitored by Northern Trust’s Counterparty
Risk Management Committee, which has credit authority for
exposure to all non-U.S. banks and approves credit limits.
This process includes financial analysis of the non-U.S. banks,
use of an internal risk rating system and consideration of
external market indicators. Each counterparty is reviewed at
least annually and potentially more frequently based on
deteriorating credit fundamentals or general market
conditions. Separate from the entity-specific review process,
the average life to maturity of deposits with non-U.S. banks is
deliberately maintained on a short-term basis in order to
respond quickly to changing credit conditions. Northern Trust
also utilizes certain risk mitigation tools and agreements that
may reduce exposures through use of collateral and/or balance
sheet netting.
2 0 1 3 A N N U A L R E P O R T T O S H A R E H O L D E R S | N O R T H E R N T R U S T C O R P O R A T I O N 42

management’s discussion and analysis of financial condition and results of operations
Additionally, the Counterparty Risk Management Committee oversees country-risk analyses and imposes limits to country
exposure. The following table provides information on non-U.S. outstandings by country that exceed 1.00% of Northern Trust’s
assets.
NON-U.S. OUTSTANDINGS
(In Millions) BANKSCOMMERCIAL
AND OTHER TOTAL
AT DECEMBER 31, 2013
Canada $2,779 $322 $3,101Australia 1,347 126 1,473Singapore 1,992 13 2,005
AT DECEMBER 31, 2012
Canada $ 2,447 $ 8 $ 2,455United Kingdom 1,814 156 1,970Australia 998 636 1,634Singapore 1,474 17 1,491Sweden 1,490 – 1,490France 1,311 125 1,436
AT DECEMBER 31, 2011
Australia $ 2,513 $ 667 $ 3,180United Kingdom 2,943 34 2,977Singapore 2,604 2 2,606Netherlands 1,466 63 1,529France 1,501 – 1,501Switzerland 1,225 26 1,251Canada 1,113 13 1,126Sweden 1,108 4 1,112
Countries whose aggregate outstandings totaled between 0.75% and 1.00% of total assets were as follows: France with aggregate outstandings of $820 million at December 31, 2013, Japan withaggregate outstandings of $914 million and Luxembourg with aggregate outstandings of $859 million at December 31, 2012, Finland with aggregate outstandings of $913 million, Hong Kongwith aggregate outstandings of $845 million and Norway with aggregate outstandings of $841 million at December 31, 2011.
Northern Trust continues to closely monitor economic
developments in the eurozone. Northern Trust considers
Ireland, Portugal, Italy, Greece, Slovenia, Spain and Cyprus to
be those eurozone countries experiencing significant
economic, fiscal and/or political strains. At December 31,
2013, Northern Trust’s aggregate gross exposure to obligors in
those countries totaled approximately $410 million, or less
than 1% of Northern Trust’s total consolidated assets, and
$407 million related to obligors in Ireland. There was minimal
exposure to obligors in Italy and no exposure to obligors in
Portugal, Greece, Slovenia, Spain or Cyprus at December 31,
2013. There was no exposure to sovereign debt securities in
any of these countries as of December 31, 2013. Of the total
exposure to obligors in Ireland, approximately $6 million was
to banks and the remainder was to commercial and other
borrowers, primarily funds domiciled in Ireland whose assets
and investment activities are broadly diversified by investment
strategy, issuer type, country of risk, and/or instrument type.
Exposures to these borrowers in Ireland may be secured or
unsecured, committed or uncommitted, but are typically for
short periods of a year or less for foreign exchange, overdraft
accommodations, and loans. Exposure levels at December 31,
2013 reflect Northern Trust’s risk management policies and
practices, which operate to limit exposures to higher risk
European financial and sovereign entities.
2 0 1 3 A N N U A L R E P O R T T O S H A R E H O L D E R S | N O R T H E R N T R U S T C O R P O R A T I O N 43

management’s discussion and analysis of financial condition and results of operations
NONPERFORMING ASSETS AND 90 DAY PAST DUE LOANS
Nonperforming assets consist of nonperforming loans and Other Real Estate Owned (OREO). OREO is comprised of commercial
and residential properties acquired in partial or total satisfaction of loans. Loans that are delinquent 90 days or more and still
accruing interest can fluctuate widely at any reporting period based on the timing of cash collections, renegotiations and renewals.
The following table presents nonperforming assets and loans that were delinquent 90 days or more and still accruing for the current
and prior four years.
NONPERFORMING ASSETS DECEMBER 31,
(In Millions) 2013 2012 2011 2010 2009
Nonperforming Loans and LeasesCommercial
Commercial and Institutional $ 23.1 $ 21.6 $ 31.3 $ 58.0 $ 48.5Commercial Real Estate 49.2 56.4 79.5 116.4 109.3
Total Commercial 72.3 78.0 110.8 174.4 157.8
PersonalResidential Real Estate $189.1 $174.6 $177.6 $153.3 $116.9Private Client 1.4 2.2 5.3 5.3 3.8
Total Personal 190.5 176.8 182.9 158.6 120.7
Total Nonperforming Loans and Leases 262.8 254.8 293.7 333.0 278.5Other Real Estate Owned 11.9 20.3 21.2 45.5 29.6
Total Nonperforming Assets $274.7 $275.1 $314.9 $378.5 $308.1
90 Day Past Due Loans Still Accruing $ 16.4 $ 19.0 $ 13.1 $ 13.0 $ 15.1
Nonperforming Loans and Leases to Total Loans and Leases 0.89% 0.86% 1.01% 1.18% 1.00%
Allowance for Credit Losses Assigned to Loans and Leases to NonperformingLoans and Leases 1.1x 1.2 x 1.0 x 1.0 x 1.1 x
Nonperforming assets as of December 31, 2013 remain
elevated from historical levels reflecting the effect of the
economic downturn in 2008 on residential property
valuations and general economic conditions. As a result,
residential real estate loans have exhibited persistent weakness.
Nonperforming loan levels continued to decline within the
commercial real estate loan class, while commercial and
institutional loans remained stable. Changes in credit quality,
including nonperforming loan balances, impact the level of
the allowance for credit losses through the resultant
adjustment of the specific allowance and of the qualitative
factors used in the determination of the inherent allowance
levels within the allowance for credit losses. Additional
information regarding residential real estate and commercial
real estate loans is provided below.
RESIDENTIAL REAL ESTATE
The residential real estate loan portfolio is primarily
composed of mortgages and home equity credit lines provided
as an accommodation to affluent clients and to facilitate the
establishment of a comprehensive financial services
relationship with Northern Trust. Residential real estate loans
totaled $10.3 billion at December 31, 2013, or 36% of total
U.S. loans, compared with $10.4 billion or 37% at
December 31, 2012. All residential real estate loans are
underwritten utilizing Northern Trust’s credit policies, which
do not support the origination of loan types generally
considered to be of high risk in nature, such as option ARM
loans, subprime loans, loans with initial “teaser” rates, and
loans with excessively high loan-to-value ratios. Residential
real estate loans consist of conventional home mortgages and
home equity credit lines, which generally require a loan to
collateral value of no more than 65% to 80% at inception.
Revaluations of supporting collateral for residential real estate
loans are obtained upon refinancing or default or when
otherwise considered warranted. Residential real estate
collateral revaluations are performed by independent third
parties.
Of the total $10.3 billion in residential real estate loans,
$3.1 billion were in the greater Chicago area, $2.5 billion were
in Florida, and $1.6 billion were in California, with the
remainder distributed throughout the other geographic
regions within the U.S. served by Northern Trust. Legally
binding commitments to extend residential real estate credit,
which are primarily home equity credit lines, totaled $1.7
billion and $1.2 billion at December 31, 2013 and 2012,
respectively.
2 0 1 3 A N N U A L R E P O R T T O S H A R E H O L D E R S | N O R T H E R N T R U S T C O R P O R A T I O N 44

management’s discussion and analysis of financial condition and results of operations
COMMERCIAL REAL ESTATE
In managing its credit exposure, management has defined a
commercial real estate loan as one where: (1) the borrower’s
principal business activity is the acquisition or the
development of real estate for commercial purposes; (2) the
principal collateral is real estate held for commercial purposes,
and loan repayment is expected to flow from the operation of
the property; or (3) the loan repayment is expected to flow
from the sale or refinance of real estate as a normal and
ongoing part of the business. Unsecured lines of credit to
firms or individuals engaged in commercial real estate
endeavors are included without regard to the use of loan
proceeds. The commercial real estate portfolio consists of
commercial mortgages and construction, acquisition and
development loans extended primarily to highly experienced
developers and/or investors well known to Northern Trust.
Underwriting standards generally reflect conservative loan-to-
value ratios and debt service coverage requirements. Recourse
to borrowers through guarantees is also commonly required.
Commercial mortgage financing is provided for the
acquisition or refinancing of income producing properties. Cash
flows from the properties generally are sufficient to amortize the
loan. These loans average approximately $1.8 million each and
are primarily located in the Illinois, Florida, California, Texas,
and Arizona markets. Construction, acquisition and
development loans provide financing for commercial real estate
prior to rental income stabilization. The intent is generally that
the borrower will sell the project or refinance the loan through a
commercial mortgage with Northern Trust or another financial
institution upon completion.
The table below provides additional detail regarding
commercial real estate loan types:
(In Millions) 2013 2012
Commercial Mortgages:Apartment/Multi-family $ 616.2 $ 652.9Office 686.0 621.4Retail 768.0 614.5Industrial/ Warehouse 318.6 312.5Other 110.6 148.7
Total Commercial Mortgages 2,499.4 2,350.0Construction, Acquisition and Development
Loans 254.2 289.4Single Family Investment 110.0 135.0Other Commercial Real Estate Related 92.2 85.4
Total Commercial Real Estate Loans $2,955.8 $2,859.8
At December 31, 2013, legally binding commitments to
extend credit and standby letters of credit to commercial real
estate borrowers totaled $448.2 million and $97.1 million,
respectively. At December 31, 2012 legally binding
commitments and standby letters of credit totaled $97.4
million and $103.7 million, respectively.
IMPAIRED LOANS
A loan is impaired when, based on current information and
events, it is probable that a creditor will be unable to collect all
amounts due according to the contractual terms of the loan
agreement or when its terms have been modified as a
concession resulting from the debtor’s financial difficulties,
referred to as a troubled debt restructuring. As of December 31,
2013, impaired loans totaled $293.4 million and included
$162.5 million of loans deemed troubled debt restructurings as
compared to total impaired loans of $269.8 million at
December 31, 2012 that included $124.5 million of loans
deemed troubled debt restructurings. Impaired loans had $10.4
million and $18.0 million of the allowance for credit losses
allocated to them at December 31, 2013 and December 31,
2012, respectively. Impaired loans are measured based upon
the loan’s market price, the present value of expected future
cash flows, discounted at the loan’s effective interest rate, or at
the fair value of the collateral if the loan is collateral dependent.
If the loan valuation is less than the recorded value of the loan,
dependent upon the level of certainty of loss, either a specific
allowance is established or a charge-off is recorded for the
difference. Smaller balance (individually less than $250,000)
homogeneous loans are collectively evaluated for impairment
and excluded from impaired loan disclosures as allowed under
applicable accounting standards.
Provision and Allowance for Credit Losses
Changes in the allowance for credit losses were as follows:
(In Millions) 2013 2012 2011
Balance at Beginning of Year $327.6 $328.9 $ 357.3Charge-Offs (59.3) (63.0) (116.3)Recoveries 19.6 36.7 32.9
Net Charge-Offs (39.7) (26.3) (83.4)Provision for Credit Losses 20.0 25.0 55.0
Balance at End of Year $307.9 $327.6 $ 328.9
The provision for credit losses is the charge to current
earnings that is determined by management, through a
disciplined credit review process, to be the amount needed to
maintain the allowance for credit losses at an appropriate level
to absorb probable credit losses that have been identified with
specific borrower relationships (specific loss component) and
for probable losses that are believed to be inherent in the loan
and lease portfolios, undrawn commitments, and standby
letters of credit (inherent loss component).
2 0 1 3 A N N U A L R E P O R T T O S H A R E H O L D E R S | N O R T H E R N T R U S T C O R P O R A T I O N 45

management’s discussion and analysis of financial condition and results of operations
The following table shows the specific portion of the allowance and the allocated inherent portion of the allowance and its
components by loan category at December 31, 2013 and at each of the prior four year-ends.
ALLOCATION OF THE ALLOWANCE FOR CREDIT LOSSES
DECEMBER 31,
2013 2012 2011 2010 2009
($ In Millions)ALLOWANCE
AMOUNT
PERCENT OFLOANS TO
TOTAL LOANSALLOWANCE
AMOUNT
PERCENT OF
LOANS TO
TOTAL LOANS
ALLOWANCE
AMOUNT
PERCENT OF
LOANS TO
TOTAL LOANS
ALLOWANCE
AMOUNT
PERCENT OF
LOANS TO
TOTAL LOANS
ALLOWANCE
AMOUNT
PERCENT OF
LOANS TO
TOTAL LOANS
Specific Allowance $ 24.9 –% $ 32.5 –% $ 47.3 –% $ 63.7 –% $ 43.8 –%
Allocated Inherent AllowanceCommercial
Commercial andInstitutional 67.5 25 79.2 25 90.0 24 113.6 21 137.6 23
Commercial Real Estate 71.5 10 80.6 10 77.1 10 76.7 11 65.6 11Lease Financing, net 4.2 3 5.5 4 1.8 3 1.3 4 1.4 4Non-U.S. 2.1 3 3.4 4 4.7 4 3.8 4 4.9 3Other – 2 – 1 – 1 – 1 – 1
Total Commercial 145.3 43 168.7 44 173.6 42 195.4 41 209.5 42
PersonalResidential Real Estate 118.7 35 110.9 35 92.0 37 81.6 39 66.8 39Private Client 19.0 22 15.5 21 16.0 20 16.6 19 20.5 18Other – – – – – 1 – 1 – 1
Total Personal 137.7 57 126.4 56 108.0 58 98.2 59 87.3 58
Total Allocated InherentAllowance $283.0 100% $295.1 100% $281.6 100% $293.6 100% $296.8 100%
Total Allowance for CreditLosses $307.9 100% $327.6 100% $328.9 100% $357.3 100% $340.6 100%
Allowance Assigned to:Loans and Leases $278.1 $297.9 $294.8 $319.6 $309.2Undrawn Commitments
and Standby Letters ofCredit 29.8 29.7 34.1 37.7 31.4
Total Allowance for CreditLosses $307.9 $327.6 $328.9 $357.3 $340.6
Allowance Assigned to Loansand Leases to Total Loansand Leases 0.95% 1.01% 1.01% 1.14% 1.11%
SPECIFIC COMPONENT OF THE ALLOWANCE
The amount of specific allowance is determined through an
individual evaluation of loans and lending-related
commitments considered impaired that is based on expected
future cash flows, collateral value, and other factors that may
impact the borrower’s ability to pay.
At December 31, 2013, the specific allowance component
amounted to $24.9 million compared with $32.5 million at
the end of 2012. The $7.6 million decrease is primarily
attributable to charge-offs and pay offs, partially offset by
additional allowances provided for new and existing
nonperforming loans.
The decrease in the specific component of the allowance
from $47.3 million in 2011 to $32.5 million in 2012 primarily
reflected a decrease in nonperforming loans attributable to
restructurings and pay offs as a result of improvement in
commercial and institutional and residential real estate loans,
partially offset by additional allowances provided for new and
existing nonperforming loans.
INHERENT COMPONENT OF THE ALLOWANCE
The inherent component of the allowance addresses exposure
relating to probable but unidentified credit-related losses. The
amount of the inherent loss allowance is based on factors
which incorporate management’s evaluation of historical
charge-off experience and various qualitative factors such as
management’s evaluation of economic and business conditions
and changes in the character and size of the loan portfolio.
2 0 1 3 A N N U A L R E P O R T T O S H A R E H O L D E R S | N O R T H E R N T R U S T C O R P O R A T I O N 46

management’s discussion and analysis of financial condition and results of operations
The historical charge-off experience for each loan category
is based on data from the current and preceding three years.
Qualitative factors reviewed by management include changes
in asset quality metrics, the nature and volume of the
portfolio, economic and business conditions, and in collateral
valuations such as property values, as well as other pertinent
information. Changes in collateral values, delinquency ratios,
portfolio volume and concentration, and other asset quality
metrics, including management’s subjective evaluation of
economic and business conditions, result in adjustments
of qualitative allowance factors that are applied in the
determination of inherent allowance requirements.
The inherent component of the allowance also covers the
credit exposure associated with undrawn loan commitments
and standby letters of credit. To estimate the allowance for
credit losses on these instruments, management uses
conversion rates to determine the estimated amount that will
be drawn and assigns an allowance factor determined in
accordance with the methodology utilized for outstanding
loans.
The inherent portion of the allowance decreased $12.0
million to $283.0 million at December 31, 2013, compared
with $295.1 million at December 31, 2012, which increased
$13.5 million from $281.6 million at December 31, 2011. The
current year decrease in the inherent allowance reflects
improvement in the commercial and institutional and
commercial real estate loans in certain markets. The increase
in 2012 reflected continued weakness in residential real estate
loans in certain markets.
OVERALL ALLOWANCE
The evaluation of the factors above resulted in a total
allowance for credit losses of $307.9 million at December 31,
2013, compared with $327.6 million at the end of 2012. The
allowance of $278.1 million assigned to loans and leases, as a
percentage of total loans and leases, was 0.95% at
December 31, 2013, down from 1.01% at December 31, 2012.
Allowances assigned to undrawn loan commitments and
standby letters of credit totaled $29.8 million and $29.7
million at December 31, 2013 and December 31, 2012,
respectively, and are included in other liabilities in the
consolidated balance sheet.
PROVISION
The provision for credit losses was $20.0 million for 2013 and
net charge-offs totaled $39.7 million. This compares with a
$25.0 million provision for credit losses and net charge-offs of
$26.3 million in 2012, and a $55.0 million provision for credit
losses and net charge-offs of $83.4 million in 2011.
Market Risk Management
Overview
To ensure adherence to Northern Trust’s interest rate
and foreign currency risk management policies, ALCO
establishes and monitors guidelines designed to control the
sensitivity of earnings to changes in interest rates and foreign
currency exchange rates. The guidelines apply to both on- and
off-balance sheet positions. The goal of the ALCO process is
to maximize earnings while maintaining a high quality
balance sheet and carefully controlling interest rate and
foreign currency risk.
Asset/Liability Management
Asset/liability management activities include lending,
accepting and placing deposits, investing in securities, issuing
debt, and hedging interest rate and foreign currency risk with
derivative financial instruments. The primary market risk
associated with asset/liability management activities is interest
rate risk and, to a lesser degree, foreign currency risk.
INTEREST RATE RISK MANAGEMENT
Interest rate risk is the risk to earnings or capital due to
changes in interest rates. Changes in interest rates can have a
positive or negative impact on earnings depending on the
positioning of assets, liabilities and off-balance sheet
instruments. The impact to earnings will primarily come
through net interest income, but it can also impact certain
types of fees. Changes in interest rates can also impact the
values of assets, liabilities, and off-balance sheet positions,
which indirectly impact the value of capital. There are four
commonly recognized types of interest rate risk: repricing,
which arises from differences in the maturity and repricing
terms of assets and liabilities; yield curve, which arises from
changes in the shape of the yield curve; basis, which arises from
the changing relationships between rates earned and paid on
different financial instruments with otherwise similar repricing
characteristics, and behavioral characteristics/embedded
optionality, which arises from client or counterparty behavior
in response to interest rate changes. To mitigate interest rate
risk, the structure of the balance sheet is managed so that
movements of interest rates on assets and liabilities (adjusted
for hedges) are highly correlated which allows Northern Trust’s
interest-bearing assets and liabilities to contribute to earnings
even in periods of volatile interest rates.
Northern Trust uses two primary measurement
techniques to manage interest rate risk: simulation of earnings
and simulation of economic value of equity. Simulation of
earnings provides management with an ongoing business view
2 0 1 3 A N N U A L R E P O R T T O S H A R E H O L D E R S | N O R T H E R N T R U S T C O R P O R A T I O N 47

management’s discussion and analysis of financial condition and results of operations
of the impact of interest rate risk on future earnings. Simulation
of economic value of equity provides management with a view of
the impact of interest rate risk on the economic value of equity
(defined as the cash flow present value of assets less the cash flow
present value of liabilities) without any changes from the period
end balance sheet. Both simulation models use the same initial
market interest rates and product balances. These two
techniques, which are performed monthly, are complementary
and are used in concert to provide a comprehensive interest rate
risk management capability.
The Asset & Liability Management Policy, which is reviewed
and approved by the Board annually, establishes limits for both
the sensitivity of earnings (SOE) measure and the sensitivity of
economic value of equity (SEVE) measure. Both interest rate risk
measures (SOE and SEVE) are informational and provide
context for understanding Northern Trust’s interest rate risk
profile. In the event that a limit is exceeded, management is
required to communicate the event to the Business Risk
Committee along with management’s plans.
Because these two measures are projections, they are not
directly comparable to actual results disclosed elsewhere, or
directly predictive of future values of other measures provided.
Simulation of earnings measures the sensitivity of earnings
under various interest rate scenarios. Management compares
the change in earnings resulting from a change in interest rates
to the established limit. Management also regularly reviews
the projected earnings from the SOE model against actual
earnings as a form of back testing.
The modeling of SOE incorporates on-balance sheet
positions, as well as derivative financial instruments
(principally interest rate swaps) that are used to manage
interest rate risk. Northern Trust uses market implied forward
interest rates as the base case and measures the sensitivity (i.e.
change) in earnings if future rates are 100 or 200 basis points
higher than base case forward rates. Each rate movement is
assumed to occur gradually over a one-year period. The 100
basis point increase, for example, consists of twelve
consecutive monthly increases of 8.3 basis points. The model
simulations also incorporate the following assumptions:
‰ the balance sheet size and mix generally remains constant
over the simulation horizon with maturing assets and
liabilities replaced with instruments with similar terms as
those that are maturing, with the exception of certain
products such as securities (the assumed reinvestment of
which is determined by management’s strategies);
nonmaturity deposits, of which some recent increases are
assumed to be temporary in nature; and long-term fixed
rate borrowings that upon maturity are replaced with
overnight wholesale instruments;
‰ prepayments on mortgage loans and securities collateralized
by mortgages are projected under each rate scenario using a
third-party mortgage analytics system that incorporates
market prepayment assumptions;
‰ non-maturity deposit rates are projected based on
Northern’s actual historical pattern of pricing these
products, or based on judgment when there is no
appropriate history or when current pricing strategies
differ from history;
‰ commercial demand deposits are treated as short-term
rate sensitive as these balances may receive an explicit
interest rate or an earnings credit rate that can be applied
to fees for services provided by Northern Trust;
‰ new business rates are based on current spreads to market
indices; and
‰ currency exchange rates and credit spreads are assumed to
remain the same in each interest rate scenario.
The following table shows the estimated impact on 2014 pre-
tax earnings of 100 and 200 basis point upward movements in
interest rates relative to forward rates. Given the low level of
interest rates and assumed interest rate floors as rates
approach zero, simulation of earnings for 100 or 200 basis
points lower rates would provide misleading results.
INTEREST RATE RISK SIMULATION OF EARNINGS AS OFDECEMBER 31, 2013
(In Millions)
ESTIMATED IMPACT ON2014 PRE-TAX EARNINGS:
INCREASE/(DECREASE)
INCREASE IN INTEREST RATES ABOVEMARKET IMPLIED FORWARD RATES
100 Basis Points $35200 Basis Points $24
Stress testing of interest rates is performed to include such
scenarios as immediate parallel shocks to rates, non-parallel
(i.e. twist) changes to yield curves that result in them
becoming steeper or flatter, and changes to the relationship
among the yield curves (i.e. basis risk).
The simulations of earnings do not incorporate any
management actions that may be used to mitigate negative
consequences of actual interest rate deviations. For that reason
and others, they do not reflect likely actual results but serve as
conservative estimates of interest rate risk. During the year
ended December 31, 2013, Northern Trust did not exceed its
SOE limits.
A second technique used to measure interest rate risk is
simulation of the economic value of equity, which measures
the SEVE to changes in interest rates. Management compares
the change in the economic value of equity resulting from a
2 0 1 3 A N N U A L R E P O R T T O S H A R E H O L D E R S | N O R T H E R N T R U S T C O R P O R A T I O N 48

management’s discussion and analysis of financial condition and results of operations
change in interest rates to the established limit. Economic
value of equity is defined as the present value of assets minus
the present value of liabilities net of the value of instruments
that are used to manage the interest rate risk of balance sheet
items. The potential effect of interest rate changes on
economic equity is derived from the impact of such changes
on projected future cash flows and the present value of these
cash flows. Northern Trust uses current market rates (and the
future rates implied by the market for path dependent items)
as the base case and measures SEVE if current rates are
immediately shocked up by 100 or 200 basis points. The
model simulations also incorporate the following
assumptions:
‰ prepayments on mortgage loans and securities
collateralized by mortgages are projected under each rate
scenario using a third-party mortgage analytics system
that incorporates market prepayment assumptions;
‰ non-maturity deposit rates are projected based on
Northern’s actual historical pattern of pricing. Projected
rates may also be based on judgment when there is no
appropriate history or when current pricing strategies
differ from history. The present values of these deposits
are based on estimated remaining lives that are based on
Northern’s actual historical runoff patterns with some
balances assumed to be temporary;
‰ currency exchange rates and credit spreads are assumed to
remain constant over the simulation horizon;
‰ the present values of most noninterest-related balances
(such as receivables, equipment, and payables) are the
same as their book values; and
‰ The initial shock to current rates assumes the relationship
among market curves (e.g. Treasury and Libor) remains
the same in each interest rate scenario.
The following table shows the estimated impact on economic
value of equity of 100 and 200 basis point shocks up from
current interest rates. Given the low level of interest rates and
assumed interest rate floors as rates approach zero simulation
of the economic value of equity for 100 or 200 basis points
lower rates would provide misleading results.
INTEREST RATE RISK SIMULATION OF ECONOMIC VALUE OFEQUITY AS OF DECEMBER 31, 2013
(In Millions)
ESTIMATED IMPACT ONECONOMIC VALUE OF EQUITY:
INCREASE/(DECREASE)
INCREASE IN INTEREST RATES ABOVE
MARKET IMPLIED FORWARD RATES
100 Basis Points ($191)200 Basis Points ($573)
Stress testing of interest rates is performed to include such
scenarios as immediate non-parallel (i.e. twist) shocks to yield
curves that result in them becoming steeper or flatter and basis
risk.
The simulations of economic value of equity do not
incorporate any management actions that might moderate the
negative consequences of actual interest rate deviations. For
that reason and others, they do not reflect likely actual results
but serve as conservative estimates of interest rate risk. During
the year ended December 31, 2013, Northern Trust did not
exceed its SEVE limits.
Northern Trust limits aggregate interest rate risk, as
measured by the above techniques, to an acceptable level
within the context of risk-return trade-offs. A variety of
actions may be used to implement risk management strategies
to modify interest rate risk including:
‰ purchases of securities;
‰ sales of securities that are classified as available for sale;
‰ issuance of senior notes and subordinated notes;
‰ collateralized borrowings from the Federal Home
Loan Bank;
‰ placing and taking Eurodollar time deposits; and
‰ hedges with various types of derivative financial
instruments.
Northern Trust strives to use the most effective instruments
for implementing its interest risk management strategies,
considering the costs, liquidity, collateral and capital
requirements of the various alternatives and the risk-return
tradeoffs.
FOREIGN CURRENCY RISK MANAGEMENT
Northern Trust is exposed to non-trading foreign currency
risk as a result of its holdings of non-U.S. dollar denominated
assets and liabilities, investment in non-U.S. subsidiaries, and
future non-U.S. dollar denominated revenue and expense. To
manage currency exposures on the balance sheet, Northern
Trust attempts to match its assets and liabilities by currency. If
those currency offsets do not exist on the balance sheet,
Northern Trust will use foreign exchange derivative contracts
to mitigate its currency exposure. Foreign exchange contracts
are also used to reduce Northern Trust’s currency exposure to
future non-U.S. dollar denominated revenue and expense.
Foreign Exchange Trading. Foreign exchange trading activities
consist principally of providing foreign exchange services to
clients. Most of those services are provided in connection with
Northern Trust’s growing global custody business. In the
normal course of business Northern Trust also engages in
2 0 1 3 A N N U A L R E P O R T T O S H A R E H O L D E R S | N O R T H E R N T R U S T C O R P O R A T I O N 49
management’s discussion and analysis of financial condition and results of operations
trading of non-U.S. currencies for its own account. The
market risks associated with these activities are foreign
currency and interest rate risk.
Foreign currency trading positions exist when aggregate
obligations to purchase and sell a currency other than the U.S.
dollar either do not offset each other in amount, or offset each
other over different time periods. Northern Trust mitigates
the risk related to its non-U.S. currency positions by
establishing limits on the amounts and durations of its
positions. The limits on overnight inventory positions are
generally lower than the limits established for intra-day
trading activity. All overnight positions are monitored by a
risk management function, which is separate from the trading
function, to ensure that the limits are not exceeded. Although
position limits are important in controlling foreign currency
risk, they are not a substitute for the experience or judgment
of Northern Trust’s senior management and its currency
traders, who have extensive knowledge of the currency
markets. Non-U.S. currency positions and strategies are
adjusted as needed in response to changing market conditions.
As part of its risk management activities, Northern Trust
measures daily the risk of loss associated with all non-U.S.
currency positions using a Value-at-Risk (VaR) model. This
statistical model provides estimates, at a variety of high
confidence levels, of the potential loss in value that might be
incurred if an adverse shift in non-U.S. currency exchange
rates were to occur over a small number of days. The model,
which is based on a variance/co-variance methodology and
daily historical data over at least the past year, incorporates
foreign currency and interest rate volatilities and correlations
in price movement among the currencies. VaR is computed
for each trading desk and for the global portfolio.
Northern Trust’s one-day VaR measure, at the 99%
confidence level, totaled $193 thousand and $301 thousand as
of December 31, 2013 and 2012, respectively. VaR totals
representing the average, high, and low for 2013 were $387
thousand, $811 thousand, and $79 thousand, respectively, with
the average, high, and low for 2012 being $421 thousand, $1.1
million, and $97 thousand, respectively. These totals indicate
the degree of risk inherent in non-U.S. currency dispositions as
of year-end and during the year; however, it is not a prediction
of an expected gain or loss. Actual future gains and losses will
vary depending on market conditions and the size and
duration of future non-U.S. currency positions. During 2013
and 2012, Northern Trust did not incur an actual trading loss
in excess of the daily value at risk estimate.
Other Trading Activities. Market risk associated with other
trading activities is negligible. Northern Trust is a party to
various derivative financial instruments, most of which consist
of interest rate swaps entered into to meet clients’ interest rate
risk management needs. When Northern Trust enters into
such derivatives, its practice is to mitigate the resulting market
risk with an exactly offsetting derivative. Northern Trust
carries in its trading portfolio a small inventory of securities
that are held for sale to its clients. The interest rate risk
associated with these securities is insignificant.
Operational Risk Management
In providing its services, Northern Trust is exposed to
operational risk which is the risk of loss from inadequate or
failed internal processes, people, and systems or from external
events. Operational risk reflects the potential for inadequate
information systems, operating problems, product design and
delivery difficulties, or catastrophes to result in losses.
Northern Trust’s success depends, in part, upon maintaining
its reputation as a well-managed institution with stockholders,
existing and prospective clients, creditors and regulators.
Operational risk includes compliance and fiduciary risks
which are governed and managed explicitly, and is mitigated
through a system of internal controls and risk management
practices that are designed to keep operational risk and
operational losses at levels appropriate to Northern Trust’s
overall risk appetite and the inherent risk within the markets it
operates. While operational risk controls are extensive,
operational losses have and will continue to occur.
The Operational Risk Committee of Northern Trust
provides independent oversight and is responsible for setting
the Corporate Operational Risk Management Policy and
developing the operational risk management framework and
programs that support the coordination of operational risk
activities to identify, monitor, manage and report on
operational risk.
The Corporate Operational Risk function is the focal
point for the operational risk management framework and
works closely with the business units to achieve the goal of
assuring proactive management of operational risk within
Northern Trust. To further limit operational risks, committee
structures have been established to draft, enforce, and monitor
adherence to corporate policies and established procedures.
Each business unit is responsible for complying with corporate
policies and external regulations applicable to the unit, and is
responsible for establishing specific procedures to do so.
The Global Compliance function guides and assists
Northern Trust’s business units in fulfilling their compliance
related responsibilities relative to legal requirements, sound
banking and fiduciary standards, and ethical conduct, through
the oversight of compliance processes, including compliance
2 0 1 3 A N N U A L R E P O R T T O S H A R E H O L D E R S | N O R T H E R N T R U S T C O R P O R A T I O N 50
management’s discussion and analysis of financial condition and results of operations
monitoring; interpretation of regulations; development and
evaluation of procedures; and oversight of regulatory
compliance training, in order to minimize exposure and loss
to Northern Trust and its clients. Northern Trust’s internal
auditors monitor the overall effectiveness of operational risk
internal controls on an ongoing basis.
FORWARD-LOOKING STATEMENTS
This report contains statements that are forward-looking, such
as statements relating to Northern Trust’s financial
goals, capital adequacy, dividend policy, risk management
policies, litigation-related matters and contingent liabilities,
accounting estimates and assumptions, industry trends,
strategic initiatives, credit quality including allowance levels,
planned capital expenditures and technology spending, future
pension plan contributions, anticipated tax benefits and
expenses, the impact of recent legislation and accounting
pronouncements, and all other statements that do not relate to
historical facts.
Forward-looking statements are typically identified by
words or phrases such as “believe”, “expect”, “anticipate”,
“intend”, “estimate”, “project”, “likely”, “may increase”,
“plan”, “goal”, “target”, “strategy”, and similar expressions or
future or conditional verbs such as “may”, “will”, “should”,
“would”, and “could.”
Forward-looking statements are Northern Trust’s current
estimates or expectations of future events or future results.
These statements are based on assumptions about many
important factors, including:
‰ the health of the U.S. and international economies and
particularly the continuing uncertainty in Europe;
‰ the downgrade of U.S. Government issued and other
securities;
‰ the health and soundness of the financial institutions and
other counterparties with which Northern Trust conducts
business;
‰ changes in financial markets, including debt and equity
markets, that impact the value, liquidity, or credit ratings
of financial assets in general, or financial assets in
particular investment funds, client portfolios, or securities
lending collateral pools, including those funds, portfolios,
collateral pools, and other financial assets with respect to
which Northern Trust has taken, or may in the future
take, actions to provide asset value stability or additional
liquidity;
‰ the impact of stress in the financial markets, the
effectiveness of governmental actions taken in response,
and the effect of such governmental actions on Northern
Trust, its competitors and counterparties, financial
markets generally and availability of credit specifically,
and the U.S. and international economies, including
special deposit assessments or potentially higher FDIC
premiums;
‰ a significant downgrade of any of our debt ratings;
‰ changes in foreign exchange trading client volumes,
fluctuations and volatility in foreign currency exchange
rates, and Northern Trust’s success in assessing and
mitigating the risks arising from such changes,
fluctuations and volatility;
‰ a decline in the value of securities held in Northern Trust’s
investment portfolio, particularly asset-backed securities,
the liquidity and pricing of which may be negatively
impacted by periods of economic turmoil and financial
market disruptions;
‰ uncertainties inherent in the complex and subjective
judgments required to assess credit risk and establish
appropriate allowances therefor;
‰ difficulties in measuring, or determining whether there is
other-than-temporary impairment in, the value of
securities held in Northern Trust’s investment portfolio;
‰ Northern Trust’s success in managing various risks
inherent in its business, including credit risk, operational
risk, interest rate risk and liquidity risk, particularly
during times of economic uncertainty and volatility in the
credit and financial markets;
‰ geopolitical risks and the risks of extraordinary events
such as natural disasters, terrorist events, war and the U.S.
and other governments’ responses to those events;
‰ the pace and extent of continued globalization of
investment activity and growth in worldwide financial
assets; regulatory and monetary policy developments;
‰ failure to obtain regulatory approvals when required,
including for the use and distribution of capital;
‰ changes in tax laws, accounting requirements or
interpretations and other legislation in the U.S. or other
countries that could affect Northern Trust or its clients,
including changes in accounting rules for fair value
measurements and recognizing impairments;
‰ changes in the nature and activities of Northern Trust’s
competition, including increased consolidation within the
financial services industry;
‰ Northern Trust’s success in maintaining existing business
and continuing to generate new business in its existing
markets;
‰ the impact of equity markets on fee revenue;
‰ Northern Trust’s success in identifying and penetrating
targeted markets;
2 0 1 3 A N N U A L R E P O R T T O S H A R E H O L D E R S | N O R T H E R N T R U S T C O R P O R A T I O N 51
management’s discussion and analysis of financial condition and results of operations
‰ Northern Trust’s success in identifying and integrating
acquisitions and strategic alliances;
‰ Northern Trust’s success in addressing the complex needs
of a global client base and managing compliance with
legal, tax, regulatory and other requirements in areas of
faster growth in its businesses, especially in immature
markets;
‰ our ability to maintain a product mix that achieves
acceptable margins;
‰ our ability to continue to generate investment results that
satisfy clients and to develop an array of investment
products;
‰ our success in generating revenue in our securities lending
business, including for our clients, especially in periods of
economic and financial market uncertainty;
‰ Northern Trust’s success in recruiting and retaining the
necessary personnel to support business growth and
expansion and maintain sufficient expertise to support
increasingly complex products and services;
‰ Northern Trust’s success in controlling expenses and
implementing revenue enhancement initiatives;
‰ Northern Trust’s ability, as products, methods of delivery,
and client requirements change or become more complex,
to continue to fund and accomplish innovation, improve
risk management practices and controls, and address
operating risks, including human errors or omissions,
data security breach risks, pricing or valuation of
securities, fraud, systems performance or defects, systems
interruptions, and breakdowns in processes or internal
controls;
‰ uncertainties inherent in Northern Trust’s assumptions
concerning its pension plan, including discount rates and
expected contributions, returns and payouts;
‰ increased costs of compliance and other risks associated
with changes in regulation, the current regulatory
environment, and areas of increased regulatory emphasis
and oversight in the U.S. and other countries such as anti-
money laundering, anti-bribery, and client privacy;
‰ risks that evolving regulations, such as Basel III and those
promulgated under the Dodd-Frank Act, could affect
required regulatory capital for financial institutions,
including Northern Trust, potentially resulting in changes
to the cost and composition of capital for Northern Trust;
‰ the potential for substantial changes in the legal,
regulatory and enforcement framework and oversight
applicable to financial institutions in reaction to adverse
financial market events, including changes that may affect
leverage limits and risk-based capital and liquidity
requirements for certain financial institutions, require
financial institutions to pay higher assessments, expose
financial institutions to certain liabilities of their
subsidiary depository institutions, and restrict or increase
the regulation of certain activities, including foreign
exchange, carried on by financial institutions, including
Northern Trust;
‰ risks and uncertainties inherent in the litigation and
regulatory process, including the adequacy of contingent
liability, tax, and other accruals;
‰ the risk of events that could harm Northern Trust’s
reputation and so undermine the confidence of clients,
counterparties, rating agencies, and stockholders; and
‰ other factors identified in this Annual Report on Form
10-K, including those factors described in “Item 1A – Risk
Factors”, and other filings with the U.S. Securities and
Exchange Commission, all of which are available on our
website.
Actual results may differ materially from those projected in
the forward-looking statements. Northern Trust assumes no
obligation to update its forward-looking statements.
2 0 1 3 A N N U A L R E P O R T T O S H A R E H O L D E R S | N O R T H E R N T R U S T C O R P O R A T I O N 52

management’s discussion and analysis of financial condition and results of operations
RECONCILIATION OF REPORTED NET INTEREST INCOME TO FULLY TAXABLE EQUIVALENT
The table below presents a reconciliation of interest income and net interest income prepared in accordance with GAAP to interest
income and net interest income on a fully taxable equivalent (FTE) basis, which are non-GAAP financial measures. Management
believes this presentation provides a clearer indication of net interest margins for comparative purposes.
YEAR ENDED DECEMBER 31,
2013 2012 2011
(In Millions) REPORTED FTE ADJ. FTE* REPORTED FTE ADJ. FTE* REPORTED FTE ADJ. FTE*
Interest Income $1,155.5 $32.5 $1,188.0 $1,287.7 $40.8 $1,328.5 $1,408.6 $40.2 $1,448.8Interest Expense 222.4 – 222.4 297.4 – 297.4 399.5 – 399.5
Net Interest Income $ 933.1 $32.5 $ 965.6 $ 990.3 $40.8 $1,031.1 $1,009.1 $40.2 $1,049.3
Net Interest Margin 1.09% 1.13% 1.18% 1.22% 1.22% 1.27%
* Fully taxable equivalent (FTE)
2 0 1 3 A N N U A L R E P O R T T O S H A R E H O L D E R S | N O R T H E R N T R U S T C O R P O R A T I O N 53

MANAGEMENT’S REPORT ON INTERNAL CONTROL OVER FINANCIAL REPORTING
Management of Northern Trust Corporation (Northern Trust) is responsible for establishing and maintaining adequate internal
control over financial reporting. This internal control contains monitoring mechanisms, and actions are taken to correct deficiencies
identified.
Management assessed Northern Trust’s internal control over financial reporting as of December 31, 2013. This assessment was
based on criteria for effective internal control over financial reporting described in Internal Control – Integrated Framework
(1992) issued by the Committee of Sponsoring Organizations of the Treadway Commission. Based on this assessment, management
believes that, as of December 31, 2013, Northern Trust maintained effective internal control over financial reporting, including
maintenance of records that in reasonable detail accurately and fairly reflect the transactions and dispositions of the assets of
Northern Trust, and policies and procedures that provide reasonable assurance that (i) transactions are recorded as necessary to
permit preparation of consolidated financial statements in accordance with accounting principles generally accepted in the United
States; (ii) receipts and expenditures of Northern Trust are being made only in accordance with authorizations of management and
directors of Northern Trust; and (iii) unauthorized acquisition, use, or disposition of Northern Trust’s assets that could have a
material effect on the financial statements are prevented or timely detected. Additionally, KPMG LLP, the independent registered
public accounting firm that audited Northern Trust’s consolidated financial statements as of, and for the year ended, December 31,
2013, included in this Annual Report, has issued an attestation report (included herein on page 55) on the effectiveness of Northern
Trust’s internal control over financial reporting.
2 0 1 3 A N N U A L R E P O R T T O S H A R E H O L D E R S | N O R T H E R N T R U S T C O R P O R A T I O N 54
REPORT OF INDEPENDENT REGISTERED PUBLIC ACCOUNTING FIRM
THE BOARD OF DIRECTORS AND STOCKHOLDERS OF NORTHERN TRUST CORPORATION:
We have audited Northern Trust Corporation’s internal control over financial reporting as of December 31, 2013, based on criteria
established in Internal Control – Integrated Framework (1992) issued by the Committee of Sponsoring Organizations of the
Treadway Commission. Northern Trust Corporation’s management is responsible for maintaining effective internal control over
financial reporting and for its assessment of the effectiveness of internal control over financial reporting, included in the
accompanying Management’s Report on Internal Control Over Financial Reporting. Our responsibility is to express an opinion on
Northern Trust Corporation’s internal control over financial reporting based on our audit.
We conducted our audit in accordance with the standards of the Public Company Accounting Oversight Board (United States).
Those standards require that we plan and perform the audit to obtain reasonable assurance about whether effective internal control
over financial reporting was maintained in all material respects. Our audit included obtaining an understanding of internal control
over financial reporting, assessing the risk that a material weakness exists, and testing and evaluating the design and operating
effectiveness of internal control based on the assessed risk. Our audit also included performing such other procedures as we
considered necessary in the circumstances. We believe that our audit provides a reasonable basis for our opinion.
A company’s internal control over financial reporting is a process designed to provide reasonable assurance regarding the
reliability of financial reporting and the preparation of financial statements for external purposes in accordance with generally
accepted accounting principles. A company’s internal control over financial reporting includes those policies and procedures that
(1) pertain to the maintenance of records that, in reasonable detail, accurately and fairly reflect the transactions and dispositions of
the assets of the company; (2) provide reasonable assurance that transactions are recorded as necessary to permit preparation of
financial statements in accordance with generally accepted accounting principles, and that receipts and expenditures of the company
are being made only in accordance with authorizations of management and directors of the company; and (3) provide reasonable
assurance regarding prevention or timely detection of unauthorized acquisition, use, or disposition of the company’s assets that
could have a material effect on the financial statements.
Because of its inherent limitations, internal control over financial reporting may not prevent or detect misstatements. Also,
projections of any evaluation of effectiveness to future periods are subject to the risk that controls may become inadequate because
of changes in conditions, or that the degree of compliance with the policies or procedures may deteriorate.
In our opinion, Northern Trust Corporation maintained, in all material respects, effective internal control over financial
reporting as of December 31, 2013, based on criteria established in Internal Control – Integrated Framework (1992) issued by the
Committee of Sponsoring Organizations of the Treadway Commission.
We also have audited, in accordance with the standards of the Public Company Accounting Oversight Board (United States),
the consolidated balance sheets of Northern Trust Corporation and subsidiaries as of December 31, 2013 and 2012, and the related
consolidated statements of income, comprehensive income, changes in stockholders’ equity, and cash flows for each of the years in
the three-year period ended December 31, 2013, and our report dated February 26, 2014 expressed an unqualified opinion on those
consolidated financial statements.
chicago, illinois
february 26, 2014
2 0 1 3 A N N U A L R E P O R T T O S H A R E H O L D E R S | N O R T H E R N T R U S T C O R P O R A T I O N 55

consolidated financial statements
CONSOLIDATED BALANCE SHEET
DECEMBER 31,
(In Millions Except Share Information) 2013 2012
ASSETS
Cash and Due from Banks $ 3,162.4 $ 3,752.7Federal Funds Sold and Securities Purchased under Agreements to Resell 529.6 60.8Interest-Bearing Deposits with Banks 19,397.4 18,803.5Federal Reserve Deposits and Other Interest-Bearing 12,911.5 7,619.7Securities
Available for Sale 28,392.8 28,643.5Held to Maturity (Fair value of $2,321.4 and $2,394.8) 2,325.8 2,382.0Trading Account 1.7 8.0
Total Securities 30,720.3 31,033.5
Loans and LeasesCommercial 12,620.0 12,897.2Personal 16,765.5 16,607.3
Total Loans and Leases (Net of unearned income of $286.2 and $297.9) 29,385.5 29,504.5
Allowance for Credit Losses Assigned to Loans and Leases (278.1) (297.9)Buildings and Equipment 458.8 469.9Client Security Settlement Receivables 1,355.2 2,049.1Goodwill 540.7 537.8Other Assets 4,764.0 3,930.2
Total Assets $102,947.3 $97,463.8
LIABILITIES
DepositsDemand and Other Noninterest-Bearing $ 16,888.7 $20,519.0Savings and Money Market 14,991.5 15,189.7Savings Certificates and Other Time 1,874.4 2,466.1Non-U.S. Offices – Noninterest-Bearing 1,881.8 3,512.8
– Interest-Bearing 48,461.7 39,720.2
Total Deposits 84,098.1 81,407.8Federal Funds Purchased 965.1 780.2Securities Sold under Agreements to Repurchase 917.3 699.8Other Borrowings 1,558.6 367.4Senior Notes 1,996.6 2,405.8Long-Term Debt 1,709.2 1,421.6Floating Rate Capital Debt 277.1 277.0Other Liabilities 3,513.3 2,577.2
Total Liabilities 95,035.3 89,936.8
STOCKHOLDERS’ EQUITY
Common Stock, $1.662⁄3 Par Value; Authorized 560,000,000 shares; Outstanding shares of 237,322,035 and238,914,988 408.6 408.6
Additional Paid-in Capital 1,035.7 1,012.7Retained Earnings 7,134.8 6,702.7Accumulated Other Comprehensive Loss (244.3) (283.0)Treasury Stock (7,849,489 and 6,256,536 shares, at cost) (422.8) (314.0)
Total Stockholders’ Equity 7,912.0 7,527.0
Total Liabilities and Stockholders’ Equity $102,947.3 $97,463.8
See accompanying notes to consolidated financial statements on pages 60-117.
2 0 1 3 A N N U A L R E P O R T T O S H A R E H O L D E R S | N O R T H E R N T R U S T C O R P O R A T I O N 56

consolidated financial statements
CONSOLIDATED STATEMENT OF INCOME
FOR THE YEAR ENDED DECEMBER 31,
(In Millions Except Share Information) 2013 2012 2011
Noninterest IncomeTrust, Investment and Other Servicing Fees $ 2,609.8 $ 2,405.5 $ 2,169.5Foreign Exchange Trading Income 244.4 206.1 324.5Treasury Management Fees 69.0 67.4 72.1Security Commissions and Trading Income 68.0 73.6 60.5Other Operating Income 166.5 154.9 158.1Investment Security Gains (Losses), net (Note) (1.5) (1.7) (23.9)
Total Noninterest Income 3,156.2 2,905.8 2,760.8
Net Interest IncomeInterest Income 1,155.5 1,287.7 1,408.6Interest Expense 222.4 297.4 399.5
Net Interest Income 933.1 990.3 1,009.1Provision for Credit Losses 20.0 25.0 55.0
Net Interest Income after Provision for Credit Losses 913.1 965.3 954.1
Noninterest ExpenseCompensation 1,306.6 1,267.4 1,267.2Employee Benefits 257.5 258.2 258.2Outside Services 564.1 529.2 552.8Equipment and Software 377.6 366.7 328.1Occupancy 173.8 174.4 180.9Visa Indemnification Benefit – – (23.1)Other Operating Expense 314.2 282.9 267.1
Total Noninterest Expense 2,993.8 2,878.8 2,831.2
Income before Income Taxes 1,075.5 992.3 883.7Provision for Income Taxes 344.2 305.0 280.1
Net Income $ 731.3 $ 687.3 $ 603.6
Net Income Applicable to Common Stock $ 731.3 $ 687.3 $ 603.6
PER COMMON SHARE
Net Income – Basic $ 3.01 $ 2.82 $ 2.47– Diluted 2.99 2.81 2.47
Average Number of Common Shares Outstanding – Basic 239,265,313 240,417,805 241,401,310– Diluted 240,554,840 240,881,244 241,811,384
CONSOLIDATED STATEMENT OF COMPREHENSIVE INCOME
FOR THE YEAR ENDED DECEMBER 31,
(In Millions) 2013 2012 2011
Net Income $ 731.3 $ 687.3 $ 603.6Other Comprehensive Income (Loss) (Net of Tax and Reclassifications)
Net Unrealized Gains (Losses) on Securities Available for Sale (95.0) 61.2 53.3Net Unrealized Gains (Losses) on Cash Flow Hedges 4.3 5.6 (18.4)Foreign Currency Translation Adjustments (3.4) 20.0 (2.5)Pension and Other Postretirement Benefit Adjustments 132.8 (24.2) (72.7)
Other Comprehensive Income (Loss) 38.7 62.6 (40.3)
Comprehensive Income $ 770.0 $ 749.9 $ 563.3
Note: Changes in Other-Than-Temporary-Impairment (OTTI) Losses $ – $ (2.7) $ (1.1)Noncredit-related OTTI Losses Recorded in (Reclassified from) OCI – (0.6) (22.2)Other Security Gains (Losses), net (1.5) 1.6 (0.6)
Investment Security Gains (Losses), net $ (1.5) $ (1.7) $ (23.9)
See accompanying notes to consolidated financial statements on pages 60-117.
2 0 1 3 A N N U A L R E P O R T T O S H A R E H O L D E R S | N O R T H E R N T R U S T C O R P O R A T I O N 57
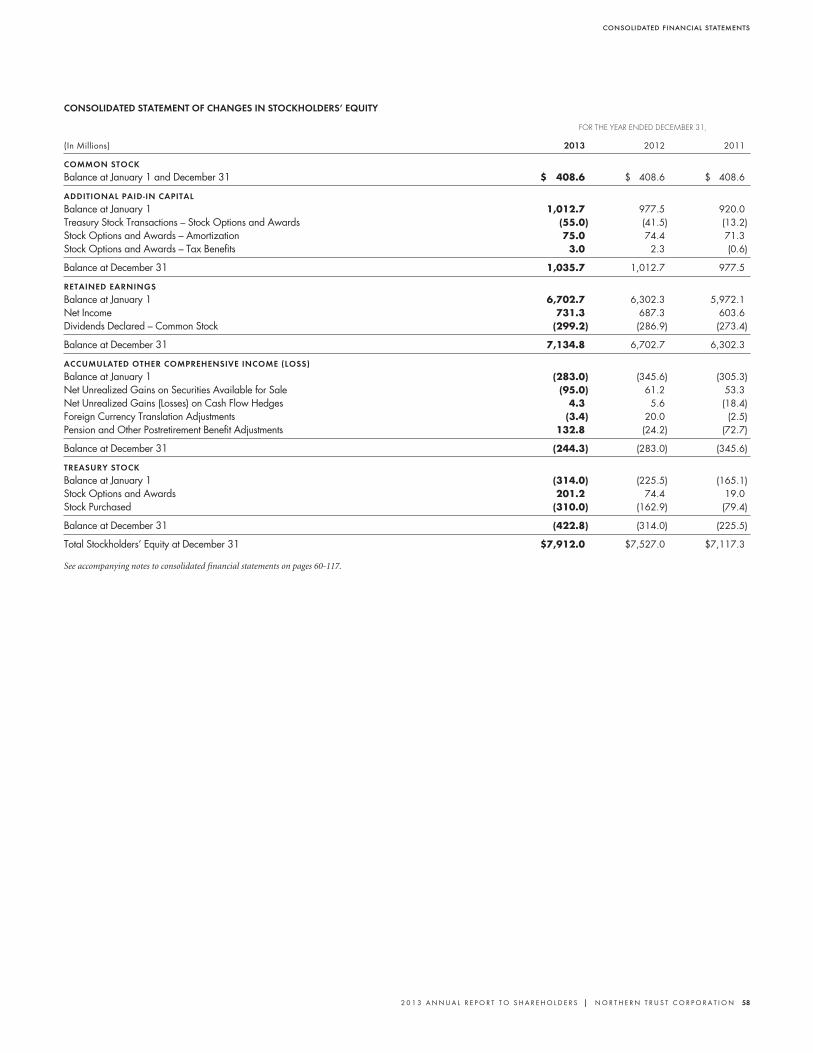
consolidated financial statements
CONSOLIDATED STATEMENT OF CHANGES IN STOCKHOLDERS’ EQUITY
FOR THE YEAR ENDED DECEMBER 31,
(In Millions) 2013 2012 2011
COMMON STOCK
Balance at January 1 and December 31 $ 408.6 $ 408.6 $ 408.6
ADDITIONAL PAID-IN CAPITAL
Balance at January 1 1,012.7 977.5 920.0Treasury Stock Transactions – Stock Options and Awards (55.0) (41.5) (13.2)Stock Options and Awards – Amortization 75.0 74.4 71.3Stock Options and Awards – Tax Benefits 3.0 2.3 (0.6)
Balance at December 31 1,035.7 1,012.7 977.5
RETAINED EARNINGS
Balance at January 1 6,702.7 6,302.3 5,972.1Net Income 731.3 687.3 603.6Dividends Declared – Common Stock (299.2) (286.9) (273.4)
Balance at December 31 7,134.8 6,702.7 6,302.3
ACCUMULATED OTHER COMPREHENSIVE INCOME (LOSS)
Balance at January 1 (283.0) (345.6) (305.3)Net Unrealized Gains on Securities Available for Sale (95.0) 61.2 53.3Net Unrealized Gains (Losses) on Cash Flow Hedges 4.3 5.6 (18.4)Foreign Currency Translation Adjustments (3.4) 20.0 (2.5)Pension and Other Postretirement Benefit Adjustments 132.8 (24.2) (72.7)
Balance at December 31 (244.3) (283.0) (345.6)
TREASURY STOCK
Balance at January 1 (314.0) (225.5) (165.1)Stock Options and Awards 201.2 74.4 19.0Stock Purchased (310.0) (162.9) (79.4)
Balance at December 31 (422.8) (314.0) (225.5)
Total Stockholders’ Equity at December 31 $7,912.0 $7,527.0 $7,117.3
See accompanying notes to consolidated financial statements on pages 60-117.
2 0 1 3 A N N U A L R E P O R T T O S H A R E H O L D E R S | N O R T H E R N T R U S T C O R P O R A T I O N 58

consolidated financial statements
CONSOLIDATED STATEMENT OF CASH FLOWS
FOR THE YEAR ENDED DECEMBER 31,
(In Millions) 2013 2012 2011
CASH FLOWS FROM OPERATING ACTIVITIES
Net Income $ 731.3 $ 687.3 $ 603.6Adjustments to Reconcile Net Income to Net Cash Provided by Operating ActivitiesInvestment Security Losses, net 1.5 1.7 23.9Amortization and Accretion of Securities and Unearned Income, net 44.7 (11.7) (34.2)Provision for Credit Losses 20.0 25.0 55.0Depreciation on Buildings and Equipment 92.3 88.3 89.2Gains on Sale of Buildings and Equipment (32.6) 1.2 (0.9)Amortization of Computer Software 205.1 180.8 158.4Amortization of Intangibles 21.1 20.3 17.5Change in Accrued Income Taxes (31.5) 18.5 (115.5)Pension Plan Contributions (20.7) (112.3) (110.6)Visa Indemnification Benefit – – (23.1)Deferred Income Tax Provision 66.6 79.7 97.2Change in Receivables (206.2) (41.9) (179.7)Change in Interest Payable (11.2) (10.0) 5.0Change in Collateral With Derivative Counterparties, net (250.6) (127.9) 172.1Other Operating Activities, net 209.5 15.4 496.4
Net Cash Provided by Operating Activities 839.3 814.4 1,254.3
CASH FLOWS FROM INVESTING ACTIVITIES
Net Change in Federal Funds Sold and Securities Purchased under Agreements to Resell (468.8) 60.5 38.8Change in Interest-Bearing Deposits with Banks (782.1) (2,107.1) (1,345.1)Net Change in Federal Reserve Deposits and Other Interest-Bearing Assets (5,292.1) 5,829.0 (2,512.4)Purchases of Securities – Held to Maturity (5,715.5) (3,798.5) (147.6)Proceeds from Maturity and Redemption of Securities – Held to Maturity 5,853.9 2,220.9 272.9Purchases of Securities – Available for Sale (8,168.0) (19,546.4) (33,302.1)Proceeds from Sale, Maturity and Redemption of Securities – Available for Sale 8,456.4 21,183.3 23,082.9Change in Loans and Leases 17.8 (469.6) (1,017.9)Purchases of Buildings and Equipment (91.9) (73.3) (96.9)Purchases and Development of Computer Software (293.0) (239.2) (274.2)Change in Client Security Settlement Receivables 690.6 (1,270.8) (77.0)Decrease in Cash Due to Acquisitions, net of Cash Acquired – – (172.6)Other Investing Activities, net 109.4 (161.2) 162.8
Net Cash Provided by (Used in) Investing Activities (5,683.3) 1,627.6 (15,388.4)
CASH FLOWS FROM FINANCING ACTIVITIES
Change in Deposits 2,938.9 (1,269.7) 18,481.8Change in Federal Funds Purchased 184.9 (35.1) (2,876.3)Change in Securities Sold under Agreements to Repurchase 217.5 (499.0) 244.4Change in Short-Term Other Borrowings 1,258.8 (435.5) 630.5Proceeds from Term Federal Funds Purchased – – 7,962.3Repayments of Term Federal Funds Purchased – – (7,981.3)Proceeds from Senior Notes and Long-Term Debt 750.0 500.0 500.0Repayments of Senior Notes and Long-Term Debt (804.4) (923.7) (880.7)Treasury Stock Purchased (309.7) (162.4) (79.0)Net Proceeds from Stock Options 146.2 106.8 75.6Cash Dividends Paid on Common Stock (220.6) (354.3) (273.7)Other Financing Activities, net 226.7 – –
Net Cash Provided by (Used in) Financing Activities 4,388.3 (3,072.9) 15,803.6
Effect of Foreign Currency Exchange Rates on Cash (134.6) 68.3 (172.2)
Increase (Decrease) in Cash and Due from Banks (590.3) (562.6) 1,497.3Cash and Due from Banks at Beginning of Year 3,752.7 4,315.3 2,818.0
Cash and Due from Banks at End of Year $ 3,162.4 $ 3,752.7 $ 4,315.3
SUPPLEMENTAL DISCLOSURES OF CASH FLOW INFORMATION
Interest Paid $ 231.9 $ 307.4 $ 394.5Income Taxes Paid 262.6 188.5 153.3Transfers from Loans to OREO 24.7 48.5 68.8
See accompanying notes to consolidated financial statements on pages 60-117.
2 0 1 3 A N N U A L R E P O R T T O S H A R E H O L D E R S | N O R T H E R N T R U S T C O R P O R A T I O N 59
notes to consolidated financial statements
Note 1 – Summary of Significant Accounting Policies
The consolidated financial statements have been prepared in
conformity with U.S. generally accepted accounting principles
(GAAP) and reporting practices prescribed for the banking
industry. A description of the more significant accounting
policies follows.
A. Basis of Presentation. The consolidated financial
statements include the accounts of Northern Trust Corporation
(Corporation) and its wholly-owned subsidiary, The Northern
Trust Company (Bank), and various other wholly-owned
subsidiaries of the Corporation and Bank. Throughout the
notes, the term “Northern Trust” refers to the Corporation and
its subsidiaries. Intercompany balances and transactions have
been eliminated in consolidation. The consolidated statement
of income includes results of acquired subsidiaries from the
dates of their acquisition. Certain prior year balances have been
reclassified consistent with the current year’s presentation.
B. Nature of Operations. The Corporation is a bank
holding company that has elected to be a financial holding
company under the Bank Holding Company Act of 1956, as
amended. The Bank is an Illinois banking corporation
headquartered in Chicago and the Corporation’s principal
subsidiary. The Corporation conducts business in the United
States (U.S.) and internationally through various U.S. and
non-U.S. subsidiaries, including the Bank.
Northern Trust generates the majority of its revenue from
its two primary business units: Corporate & Institutional
Services (C&IS) and Wealth Management. Asset management
and related services are provided to C&IS and Wealth
Management clients primarily by a third business unit, Asset
Management. Northern Trust emphasizes quality through a
high level of service complemented by the effective use of
technology, delivered by a fourth business unit, Operations &
Technology (O&T).
C&IS is a leading global provider of asset servicing,
brokerage, banking and related services to corporate and
public retirement funds, foundations, endowments, fund
managers, insurance companies, sovereign wealth funds, and
other institutional investors around the globe. Asset servicing
and related services encompass a full range of capabilities
including but not limited to: global master trust and custody;
fund administration; investment operations outsourcing;
investment risk and analytical services; securities lending;
foreign exchange; cash management; treasury management;
brokerage services; and transition management services. Client
relationships are managed through the Bank and the Bank’s
and the Corporation’s other subsidiaries, including support
from locations in North America, Europe, the Middle East,
and the Asia Pacific region.
Wealth Management provides trust, investment
management, custody, and philanthropic services; financial
consulting; guardianship and estate administration; family
business consulting; family financial education; brokerage
services; and private and business banking. Wealth
Management focuses on high-net-worth individuals and
families, business owners, executives, professionals, retirees,
and established privately-held businesses in its target markets.
Wealth Management also includes the Global Family Office,
which provides customized services to meet the complex
financial needs of individuals and family offices in the United
States and throughout the world with assets typically
exceeding $200 million. Wealth Management services are
delivered by multidisciplinary teams through a network of
offices in 18 U.S. states and Washington, D.C., as well as
offices in London, Guernsey, and Abu Dhabi.
C. Use of Estimates in the Preparation of FinancialStatements. The preparation of financial statements in
conformity with GAAP requires management to make
estimates and assumptions that affect the reported amounts of
assets and liabilities and disclosure of contingent assets and
liabilities at the date of the consolidated financial statements
and the reported amounts of revenue and expense during the
reporting period. Actual results could differ from those
estimates.
D. Foreign Currency Remeasurement and Translation.Asset and liability accounts denominated in nonfunctional
currencies are remeasured into functional currencies at period
end rates of exchange, except for certain balance sheet items
including buildings and equipment, goodwill and other
intangible assets, which are remeasured at historical exchange
rates. Results from remeasurement of asset and liability accounts
are reported in other operating income as currency translation
gains (losses), net. Income and expense accounts are remeasured
at period average rates of exchange.
Asset and liability accounts of entities with functional
currencies that are not the U.S. dollar are translated at period
end rates of exchange. Income and expense accounts are
translated at period average rates of exchange. Translation
adjustments, net of applicable taxes, are reported directly to
2 0 1 3 A N N U A L R E P O R T T O S H A R E H O L D E R S | N O R T H E R N T R U S T C O R P O R A T I O N 60

notes to consolidated financial statements
accumulated other comprehensive income (AOCI), a
component of stockholders’ equity.
E. Securities. Securities Available for Sale are reported at
fair value, with unrealized gains and losses credited or charged,
net of the tax effect, to AOCI. Realized gains and losses on
securities available for sale are determined on a specific
identification basis and are reported within other security gains
(losses), net, in the consolidated statement of income. Interest
income is recorded on the accrual basis, adjusted for the
amortization of premium and accretion of discount.
Securities Held to Maturity consist of debt securities that
management intends to, and Northern Trust has the ability to,
hold until maturity. Such securities are reported at cost,
adjusted for amortization of premium and accretion of
discount. Interest income is recorded on the accrual basis
adjusted for the amortization of premium and accretion of
discount.
Securities Held for Trading are stated at fair value. Realized
and unrealized gains and losses on securities held for trading
are reported in the consolidated statement of income within
security commissions and trading income.
Nonmarketable Securities primarily consist of Federal
Reserve and Federal Home Loan Bank stock and community
development investments, each of which are recorded in other
assets on the consolidated balance sheet. Federal Reserve and
Federal Home Loan Bank stock are reported at cost, which
represents redemption value. Community development
investments, which are discussed in further detail in Note 28,
are reported at amortized cost using the effective yield method
and amortized over the lives of the related tax credits.
Other-Than-Temporary Impairment (OTTI). A security is
considered to be other-than-temporarily impaired if the
present value of cash flows expected to be collected are less
than the security’s amortized cost basis (the difference being
defined as the credit loss) or if the fair value of the security is
less than the security’s amortized cost basis and the investor
intends, or more-likely-than-not will be required, to sell the
security before recovery of the security’s amortized cost basis.
If OTTI exists, the charge to earnings is limited to the amount
of credit loss if the investor does not intend to sell the security,
and it is more-likely-than-not that it will not be required to sell
the security, before recovery of the security’s amortized cost
basis. Any remaining difference between fair value and
amortized cost is recognized in AOCI, net of applicable taxes.
Otherwise, the entire difference between fair value and
amortized cost is charged to earnings.
F. Securities Purchased Under Agreements to Resell andSecurities Sold Under Agreements to Repurchase. Securities
purchased under agreements to resell and securities sold under
agreements to repurchase are accounted for as collateralized
financings and recorded at the amounts at which the securities
were acquired or sold plus accrued interest. To minimize any
potential credit risk associated with these transactions, the fair
value of the securities purchased or sold is monitored, limits
are set on exposure with counterparties, and the financial
condition of counterparties is regularly assessed. It is Northern
Trust’s policy to take possession, either directly or via third
party custodians, of securities purchased under agreements to
resell.
G. Derivative Financial Instruments. Northern Trust is a
party to various derivative instruments that are used in the
normal course of business to meet the needs of its clients; as part
of its trading activity for its own account; and as part of its risk
management activities. These instruments include
foreign exchange contracts, interest rate contracts, and credit
default swap contracts. Derivative financial instruments are
recorded on the consolidated balance sheet at fair value within
other assets and other liabilities. Derivative asset and liability
positions with the same counterparty are reflected on a net basis
on the consolidated balance sheet in cases where legally
enforceable master netting arrangements or similar agreements
exist. Derivative assets and liabilities are further reduced by cash
collateral received from, and deposited with, derivative
counterparties. The accounting for changes in the fair value of a
derivative in the consolidated statement of income depends on
whether or not the contract has been designated as a hedge and
qualifies for hedge accounting under GAAP. Derivative financial
instruments are recorded on the consolidated cash flow
statement within the line item, ‘other operating activities, net,’
except for net investment hedges which are recorded within
‘other investing activities, net’.
Changes in the fair value of client-related and trading
derivative instruments, which are not designated hedges under
GAAP, are recognized currently in either foreign exchange
trading income or security commissions and trading income.
Changes in the fair value of derivative instruments entered into
for risk management purposes but not designated as hedges are
recognized currently in other operating income. Certain
derivative instruments used by Northern Trust to manage risk
are formally designated and qualify for hedge accounting as fair
value, cash flow, or net investment hedges.
2 0 1 3 A N N U A L R E P O R T T O S H A R E H O L D E R S | N O R T H E R N T R U S T C O R P O R A T I O N 61

notes to consolidated financial statements
Derivatives designated as fair value hedges are used to
limit Northern Trust’s exposure to changes in the fair value of
assets and liabilities due to movements in interest rates.
Changes in the fair value of the derivative instrument and
changes in the fair value of the hedged asset or liability
attributable to the hedged risk are recognized currently in
income. For substantially all fair value hedges, Northern Trust
applies the “shortcut” method of accounting, available under
GAAP, which assumes there is no ineffectiveness in a hedge.
As a result, changes recorded in the fair value of the hedged
item are equal to the offsetting gain or loss on the derivative
and are reflected in the same line item. For fair value hedges
that do not qualify for the “shortcut” method of accounting,
Northern Trust utilizes regression analysis, a “long-haul”
method of accounting, in assessing whether these hedging
relationships are highly effective at inception and quarterly
thereafter. Ineffectiveness resulting from fair value hedges is
recorded in either interest income or interest expense.
Derivatives designated as cash flow hedges are used to
minimize the variability in cash flows of earning assets or
forecasted transactions caused by movements in interest or
foreign exchange rates. The effective portion of changes in the
fair value of such derivatives is recognized in AOCI, a
component of stockholders’ equity, and there is no change to
the accounting for the hedged item. Balances in AOCI are
reclassified to earnings when the hedged forecasted
transaction impacts earnings. Northern Trust assesses
effectiveness using regression analysis for cash flow hedges of
available for sale securities. Ineffectiveness is measured using
the hypothetical derivative method. For cash flow hedges of
forecasted foreign currency denominated revenue and
expenditure transactions, Northern Trust closely matches all
terms of the hedged item and the hedging derivative at
inception and on an ongoing basis which limits hedge
ineffectiveness. To the extent all terms are not perfectly
matched, effectiveness is assessed using the dollar-offset
method and any ineffectiveness is measured using the
hypothetical derivative method. Any ineffectiveness is
recognized currently in earnings.
Foreign exchange contracts and qualifying non-derivative
instruments designated as net investment hedges are used to
minimize Northern Trust’s exposure to variability in the
foreign currency translation of net investments in non-U.S.
branches and subsidiaries. The effective portion of changes in
the fair value of the hedging instrument is recognized in AOCI
consistent with the related translation gains and losses of the
hedged net investment. For net investment hedges, all critical
terms of the hedged item and the hedging instrument are
matched at inception and on an ongoing basis to minimize the
risk of hedge ineffectiveness. To the extent all terms are not
perfectly matched, any ineffectiveness is measured using the
hypothetical derivative method. Ineffectiveness resulting from
net investment hedges is recorded in other operating income.
Amounts recorded in AOCI are reclassified to earnings only
upon the sale or liquidation of an investment in a non-U.S.
branch or subsidiary.
Fair value, cash flow, and net investment hedges are
designated and formally documented as such contemporaneous
with the transaction. The formal documentation describes the
hedge relationship and identifies the hedging instruments and
hedged items. Included in the documentation is a discussion of
the risk management objectives and strategies for undertaking
such hedges, the nature of the risk being hedged, a description of
the method for assessing hedge effectiveness at inception and on
an ongoing basis, as well as the method that will be used to
measure hedge ineffectiveness. For hedges that do not qualify for
the “shortcut” or the critical terms match methods of
accounting, a formal assessment is performed on a calendar
quarter basis to verify that derivatives used in hedging
transactions continue to be highly effective in offsetting the
changes in fair value or cash flows of the hedged item. Hedge
accounting is discontinued if a derivative ceases to be highly
effective, matures, is terminated or sold, if a hedged forecasted
transaction is no longer expected to occur, or if Northern Trust
removes the derivative’s hedge designation. Subsequent gains
and losses on these derivatives are included in foreign exchange
trading income or security commissions and trading income.
For discontinued cash flow hedges, the accumulated gain or loss
on the derivative remains in AOCI and is reclassified to earnings
in the period in which the previously hedged forecasted
transaction impacts earnings or is no longer probable of
occurring. For discontinued fair value hedges, the previously
hedged asset or liability ceases to be adjusted for changes in its
fair value. Previous adjustments to the hedged item are
amortized over the remaining life of the hedged item.
H. Loans and Leases. Loans and leases are recognized
assets that represent a contractual right to receive money
either on demand or on fixed or determinable dates. Loans
and leases are disaggregated for disclosure purposes by
portfolio segment (segment) and by class. Segment is defined
as the level at which management develops and documents a
systematic methodology to determine the allowance for credit
losses. Northern Trust has defined its segments as commercial
and personal. A class of loans and leases is a subset of a
segment, the components of which have similar risk
characteristics, measurement attributes, or risk monitoring
methods. The classes within the commercial segment have
2 0 1 3 A N N U A L R E P O R T T O S H A R E H O L D E R S | N O R T H E R N T R U S T C O R P O R A T I O N 62

notes to consolidated financial statements
been defined as commercial and institutional, commercial real
estate, lease financing, non-US and other. The classes within
the personal segment have been defined as residential real
estate, private client and other.
Loan Classification. Loans that are held for investment are
reported at the principal amount outstanding, net of unearned
income. Loans classified as held for sale are reported at the
lower of aggregate cost or fair value. Loan commitments for
residential real estate loans that will be classified as held for
sale at the time of funding and which have an interest rate lock
are recorded on the balance sheet at fair value with subsequent
gains or losses recognized in other operating income.
Unrealized gains on these loan commitments are reported as
other assets, with unrealized losses reported as other liabilities.
Other undrawn commitments relating to loans that are not
held for sale are recorded in other liabilities and are carried at
the amount of unamortized fees with an allowance for credit
loss liability recognized for any estimated probable losses.
Recognition of Income. Interest income on loans is
recorded on an accrual basis unless, in the opinion of
management, there is a question as to the ability of the debtor
to meet the terms of the loan agreement, or interest or
principal is more than 90 days contractually past due and the
loan is not well-secured and in the process of collection. Loans
meeting such criteria are classified as nonperforming and
interest income is recorded on a cash basis. Past due status is
based on how long since the contractual due date a principal
or interest payment has been past due. For disclosure
purposes, loans that are 29 days past due or less are reported
as current. At the time a loan is determined to be
nonperforming, interest accrued but not collected is reversed
against interest income in the current period. Interest
collected on nonperforming loans is applied to principal
unless, in the opinion of management, collectability of
principal is not in doubt. Management’s assessment of
indicators of loan and lease collectability, and its policies
relative to the recognition of interest income, including the
suspension and subsequent resumption of income
recognition, do not meaningfully vary between loan and lease
classes. Nonperforming loans are returned to performing
status when factors indicating doubtful collectability no longer
exist. Factors considered in returning a loan to performing
status are consistent across all classes of loans and leases and,
in accordance with regulatory guidance, relate primarily to
expected payment performance. Loans are eligible to be
returned to performing status when: (i) no principal or
interest that is due is unpaid and repayment of the remaining
contractual principal and interest is expected or (ii) the loan
has otherwise become well-secured (possessing realizable
value sufficient to discharge the debt, including accrued
interest, in full) and is in the process of collection (through
action reasonably expected to result in debt repayment or
restoration to a current status in the near future). A loan that
has not been brought fully current may be restored to
performing status provided there has been a sustained period
of repayment performance (generally a minimum of six
months) by the borrower in accordance with the contractual
terms, and Northern Trust is reasonably assured of repayment
within a reasonable period of time. Additionally, a loan that
has been formally restructured so as to be reasonably assured
of repayment and performance according to its modified
terms may be returned to accrual status, provided there was a
well-documented credit evaluation of the borrower’s financial
condition and prospects of repayment under the revised
terms, and there has been a sustained period of repayment
performance (generally a minimum of six months) under the
revised terms.
Impaired Loans. A loan is considered to be impaired when,
based on current information and events, management
determines that it is probable that Northern Trust will be
unable to collect all amounts due according to the contractual
terms of the loan agreement. Impaired loans are identified
through ongoing credit management and risk rating processes,
including the formal review of past due and watch list credits.
Payment performance and delinquency status are critical
factors in identifying impairment for all loans and leases,
particularly those within the residential real estate, private
client and personal-other classes. Other key factors considered
in identifying impairment of loans and leases within the
commercial and institutional, non-U.S., lease financing, and
commercial-other classes relate to the borrower’s ability to
perform under the terms of the obligation as measured
through the assessment of future cash flows, including
consideration of collateral value, market value, and other
factors. A loan is also considered to be impaired if its terms
have been modified as a concession by Northern Trust or a
bankruptcy court resulting from the debtor’s financial
difficulties, referred to as a troubled debt restructuring (TDR).
All TDRs are reported as impaired loans in the calendar year
of their restructuring. In subsequent years, a TDR may cease
being reported as impaired if the loan was modified at a
market rate and has performed according to the modified
terms for at least six months. A loan that has been modified at
a below market rate will return to performing status if it
satisfies the six month performance requirement; however, it
will remain reported as impaired. Impairment is measured
based upon the loan’s market price, the present value of
expected future cash flows, discounted at the loan’s effective
2 0 1 3 A N N U A L R E P O R T T O S H A R E H O L D E R S | N O R T H E R N T R U S T C O R P O R A T I O N 63

notes to consolidated financial statements
interest rate, or at the fair value of the collateral if the loan is
collateral dependent. If the loan valuation is less than the
recorded value of the loan, based on the certainty of loss,
either a specific allowance is established, or a charge-off is
recorded, for the difference. Smaller balance (individually less
than $250,000) homogeneous loans are collectively evaluated
for impairment and excluded from impaired loan disclosures
as allowed under applicable accounting standards. Northern
Trust’s accounting policies for impaired loans is consistent
across all classes of loans and leases.
Premiums and Discounts. Premiums and discounts on
loans are recognized as an adjustment of yield using the
interest method based on the contractual terms of the loan.
Certain direct origination costs and fees are netted, deferred
and amortized over the life of the related loan as an
adjustment to the loan’s yield.
Direct Financing and Leverage Leases. Unearned lease
income from direct financing and leveraged leases is recognized
using the interest method. This method provides a constant
rate of return on the unrecovered investment over the life of
the lease. The rate of return and the allocation of income over
the lease term are recalculated from the inception of the lease if
during the lease term assumptions regarding the amount or
timing of estimated cash flows change. Lease residual values are
established at the inception of the lease based on in-house
valuations and market analyses provided by outside parties.
Lease residual values are reviewed at least annually for other-
than-temporary impairment. A decline in the estimated
residual value of a leased asset determined to be other-than-
temporary would be recorded in the period in which the
decline is identified as a reduction of interest income.
I. Allowance for Credit Losses. The allowance for credit
losses represents management’s estimate of probable losses
which have occurred as of the date of the consolidated
financial statements. The loan and lease portfolio and other
lending related credit exposures are regularly reviewed to
evaluate the adequacy of the allowance for credit losses. In
determining the level of the allowance, Northern Trust
evaluates the allowance necessary for impaired loans and also
estimates losses inherent in other credit exposures. The result
is an allowance with the following components:
Specific Allowance. The amount of specific allowance is
determined through an individual evaluation of loans and
lending-related commitments considered impaired that is
based on expected future cash flows, the value of collateral,
and other factors that may impact the borrower’s ability
to pay. For impaired loans where the amount of specific
allowance, if any, is determined based on the value of the
underlying real estate collateral, third-party appraisals are
generally obtained and utilized by management. These
appraisals are generally less than twelve months old and are
subject to adjustments to reflect management’s judgment as to
the realizable value of the collateral.
Inherent Allowance. The amount of inherent allowance is
based on factors which incorporate management’s evaluation
of historical charge-off experience and various qualitative
factors such as management’s evaluation of economic and
business conditions and changes in the character and size of
the loan portfolio. Factors are applied to loan and lease credit
exposures aggregated by shared risk characteristics and are
reviewed quarterly by Northern Trust’s Loan Loss Reserve
Committee which includes representatives from Credit Policy,
business unit management, and Corporate Financial
Management.
Loans, leases and other extensions of credit deemed
uncollectible are charged to the allowance for credit losses.
Subsequent recoveries, if any, are debited to the allowance.
Northern Trust’s policies relative to the charging-off of
uncollectible loans and leases are consistent across both loan and
lease segments. Determinations as to whether an uncollectible
loan is charged-off or a specific reserve is established are based on
management’s assessment as to the level of certainty regarding the
amount of loss. The provision for credit losses, which is charged to
income, is the amount necessary to adjust the allowance for credit
losses to the level determined to be appropriate through the above
process. Actual losses may vary from current estimates and the
amount of the provision for credit losses may be either greater
than or less than actual net charge-offs.
Northern Trust analyzes its exposure to credit losses from
both on-balance sheet and off-balance sheet activity using a
consistent methodology. In estimating the allowance for credit
losses for undrawn loan commitments and standby letters of
credit, management uses conversion rates to determine the
estimated amount that will be funded. Factors based on
historical loss experience and specific risk characteristics of the
loan product are utilized to calculate inherent losses related to
undrawn commitments and standby letters of credit as of the
reporting date. The portion of the allowance assigned to loans
and leases is reported as a contra asset, directly following loans
and leases in the consolidated balance sheet.
The portion of the allowance assigned to undrawn loan
commitments and standby letters of credit is reported in other
liabilities in the consolidated balance sheet.
J. Standby Letters of Credit. Fees on standby letters of credit
are recognized in other operating income using the straight-line
method over the lives of the underlying agreements. Northern
2 0 1 3 A N N U A L R E P O R T T O S H A R E H O L D E R S | N O R T H E R N T R U S T C O R P O R A T I O N 64
notes to consolidated financial statements
Trust’s recorded liability for standby letters of credit, reflecting
the obligation it has undertaken, is measured as the amount of
unamortized fees on these instruments.
K. Buildings and Equipment. Buildings and equipment
owned are carried at original cost less accumulated depreciation.
The charge for depreciation is computed using the straight-line
method based on the following range of lives: buildings – 10
to 30 years; equipment – 3 to 10 years; and leasehold
improvements–the shorter of the lease term or 15 years. Leased
properties meeting certain criteria are capitalized and amortized
using the straight-line method over the lease period.
L. Other Real Estate Owned (OREO). OREO is comprised
of commercial and residential real estate properties acquired
in partial or total satisfaction of loans. OREO assets are carried
at the lower of cost or fair value less estimated costs to sell and
are recorded in other assets in the consolidated balance sheet.
Fair value is typically based on third-party appraisals.
Appraisals of OREO properties are updated on an annual basis
and are subject to adjustments to reflect management’s
judgment as to the realizable value of the properties. Losses
identified during the 90-day period after the acquisition of
such properties are charged against the allowance for credit
losses assigned to loans and leases. Subsequent write-downs
that may be required to the carrying value of these assets and
gains or losses realized from asset sales are recorded within
other operating expense.
M. Goodwill and Other Intangible Assets. Goodwill is not
subject to amortization. Separately identifiable acquired
intangible assets with finite lives are amortized over their
estimated useful lives, primarily on a straight-line basis.
Purchased software and allowable internal costs, including
compensation relating to software developed for internal use,
are capitalized. Software is amortized using the straight-line
method over the estimated useful lives of the assets, generally
ranging from 3 to 10 years.
Goodwill and other intangible assets are reviewed for
impairment on an annual basis or more frequently if events or
changes in circumstances indicate the carrying amounts may
not be recoverable.
N. Assets Under Custody and Assets Under Management.Assets held in fiduciary or agency capacities are not included
in the consolidated balance sheet, since such items are not
assets of Northern Trust.
O. Trust, Investment and Other Servicing Fees. Trust,
investment and other servicing fees are recorded on the
accrual basis, over the period in which the service is provided.
Fees are a function of the market value of assets custodied,
managed and serviced, the volume of transactions, securities
lending volume and spreads, and fees for other services
rendered, as set forth in the underlying client agreement. This
revenue recognition involves the use of estimates and
assumptions, including components that are calculated based
on estimated asset valuations and transaction volumes.
Client reimbursed out-of-pocket expenses that are an
extension of existing services that are being rendered are
recorded on a gross basis as revenue.
P. Client Security Settlement Receivables. These
receivables represent other collection items presented on
behalf of custody clients and settled through withdrawals from
short term investment funds on a next day basis.
Q. Income Taxes. Northern Trust follows an asset and
liability approach to account for income taxes. The objective is
to recognize the amount of taxes payable or refundable for the
current year, and to recognize deferred tax assets and liabilities
resulting from temporary differences between the amounts
reported in the financial statements and the tax bases of assets
and liabilities. The measurement of tax assets and liabilities is
based on enacted tax laws and applicable tax rates.
Tax positions taken or expected to be taken on a tax
return are evaluated based on their likelihood of being
sustained upon examination by tax authorities. Only tax
positions that are considered more-likely-than-not to be
sustained are recorded in the consolidated financial
statements. Northern Trust recognizes any interest and
penalties related to unrecognized tax benefits in the provision
for income taxes.
R. Cash Flow Statements. Cash and cash equivalents have
been defined as “Cash and Due from Banks”.
S. Pension and Other Postretirement Benefits. Northern
Trust records the funded status of its defined benefit pension
and other postretirement plans on the consolidated balance
sheet. Prepaid pension and postretirement benefits are
reported in other assets and unfunded pension and
postretirement benefits are reported in other liabilities. Plan
assets and benefit obligations are measured annually at
December 31. Pension costs are recognized ratably over the
estimated working lifetime of eligible participants.
2 0 1 3 A N N U A L R E P O R T T O S H A R E H O L D E R S | N O R T H E R N T R U S T C O R P O R A T I O N 65

notes to consolidated financial statements
T. Share-Based Compensation Plans. Northern Trust
recognizes as compensation expense the grant-date fair value
of stock and stock unit awards and other share-based
compensation granted to employees within the consolidated
income statement. The fair values of stock and stock unit
awards, including performance stock unit awards and director
awards, are based on the price of the Corporation’s stock on
the date of grant. The fair value of stock options is estimated
on the date of grant using the Black-Scholes option pricing
model. The model utilizes weighted-average assumptions
regarding the period of time that options granted are expected
to be outstanding (expected term) based primarily on the
historical exercise behavior attributable to previous option
grants, the estimated yield from dividends paid on the
Corporation’s stock over the expected term of the options, the
historical volatility of Northern Trust’s stock price and the
implied volatility of traded options on Northern Trust stock,
and a risk free interest rate based on the U.S. Treasury yield
curve at the time of grant for a period equal to the expected
term of the options granted.
Compensation expense for share-based award grants with
terms that provide for a graded vesting schedule, whereby
portions of the award vest in increments over the requisite
service period, are recognized on a straight-line basis over the
requisite service period for the entire award. Northern Trust
does not include an estimate of future forfeitures in its
recognition of share-based compensation expense as historical
forfeitures have not been significant. Share-based
compensation expense is adjusted based on forfeitures as they
occur. Dividend equivalents are paid on stock units that have
been granted but not yet vested. Cash flows resulting from the
realization of tax deductions from the exercise of stock
options in excess of the compensation cost recognized (excess
tax benefits) are classified as financing cash flows.
U. Net Income Per Common Share. Basic net income per
common share is computed by dividing net income/loss
applicable to common stock by the weighted average number
of common shares outstanding during each period. Diluted
net income per common share is computed by dividing net
income applicable to common stock and potential common
shares by the aggregate of the weighted average number of
common shares outstanding during the period and common
share equivalents calculated for stock options and restricted
stock outstanding using the treasury stock method. In a period
of a net loss, diluted net income per common share is
calculated in the same manner as basic net income per
common share.
Northern Trust has issued certain restricted stock awards,
which are unvested share-based payment awards that contain
nonforfeitable rights to dividends or dividend equivalents.
These restricted shares are considered participating securities.
Accordingly, Northern Trust calculates net income applicable
to common stock using the two-class method, whereby net
income is allocated between common stock and participating
securities.
Note 2 – Recent Accounting Pronouncements
In January 2014, the FASB issued Accounting Standards
Update (ASU) No. 2014-01, “Investments – Equity Method
and Joint Ventures (Topic 323): Accounting for Investments
in Qualified Affordable Housing Projects.” The ASU permits
reporting entities to elect to account for investments in
qualified affordable housing projects using the proportional
amortization method if certain conditions are met. The ASU is
effective for interim and annual reporting periods beginning
after December 15, 2014. Northern Trust is currently
evaluating the potential application of ASU No. 2014-01; an
election to utilize the proportional amortization method is not
expected to materially impact Northern Trust’s consolidated
financial position or results of operations.
In January 2014, the FASB issued ASU No. 2014-04,
“Receivables – Troubled Debt Restructurings by Creditors
(Subtopic 310-40): Reclassification of Residential Real Estate
Collateralized Consumer Mortgage Loans upon Foreclosure.”
This ASU clarifies that an insubstance repossession or
foreclosure of a residential real estate property occurs only
upon either the creditor obtaining legal title to the property
upon completion of a foreclosure or through completion of a
deed in lieu of foreclosure, rather than by simply taking
physical possession of the property. This ASU is effective for
interim and annual reporting periods beginning after
December 15, 2014. Northern Trust is currently assessing the
impact of the adoption of ASU No. 2014-04 and it is not
expected to materially impact Northern Trust’s consolidated
financial position and results of operations.
Note 3 – Fair Value Measurements
Fair value under GAAP is defined as the price that would be
received to sell an asset or paid to transfer a liability (an exit
price) in an orderly transaction between market participants
on the measurement date.
2 0 1 3 A N N U A L R E P O R T T O S H A R E H O L D E R S | N O R T H E R N T R U S T C O R P O R A T I O N 66

notes to consolidated financial statements
Fair Value Hierarchy. The following describes the
hierarchy of valuation inputs (Levels 1, 2, and 3) used to
measure fair value and the primary valuation methodologies
used by Northern Trust for financial instruments measured at
fair value on a recurring basis. Observable inputs reflect
market data obtained from sources independent of the
reporting entity; unobservable inputs reflect the entity’s own
assumptions about how market participants would value an
asset or liability based on the best information available.
GAAP requires an entity measuring fair value to maximize the
use of observable inputs and minimize the use of unobservable
inputs and establishes a fair value hierarchy of inputs.
Financial instruments are categorized within the hierarchy
based on the lowest level input that is significant to their
valuation. Northern Trust’s policy is to recognize transfers
into and transfers out of fair value levels as of the end of the
reporting period in which the transfer occurred. No transfers
between fair value levels occurred during the years ended
December 31, 2013 or 2012.
Level 1 – Quoted, active market prices for identical assets orliabilities. Northern Trust’s Level 1 assets are comprised of
available for sale investments in U.S. treasury securities.
Level 2 – Observable inputs other than Level 1 prices, such asquoted active market prices for similar assets or liabilities, quotedprices for identical or similar assets in inactive markets, andmodel-derived valuations in which all significant inputs areobservable in active markets. Northern Trust’s Level 2 assets
include available for sale and trading account securities, the
fair values of which are determined predominantly by external
pricing vendors. Prices received from vendors are compared
to other vendor and third-party prices. If a security price
obtained from a pricing vendor is determined to exceed pre-
determined tolerance levels that are assigned based on an asset
type’s characteristics, the exception is researched and, if the
price is not able to be validated, an alternate pricing vendor is
utilized, consistent with Northern Trust’s pricing source
hierarchy. As of December 31, 2013, Northern Trust’s
available for sale securities portfolio included 831 Level 2
securities with an aggregate market value of $26.4 billion. Of
those, 829 securities, with a market value of $26.3 billion, were
valued by external pricing vendors. The remaining 2 securities,
with an aggregate market value of $57.4 million, were valued
consistent with prices of similar securities as there were no
vended prices available for these securities. As of
December 31, 2012, Northern Trust’s available for sale
securities portfolio included 696 Level 2 securities with an
aggregate market value of $26.8 billion. Of those, 689
securities, with a market value of $26.5 billion, were valued by
external pricing vendors. The remaining 7 securities, with an
aggregate market value of $307.1 million, were valued
consistent with prices of similar securities as there were no
vended prices available for these securities. Trading account
securities, which totaled $1.7 million and $8.0 million as of
December 31, 2013 and December 31, 2012, respectively, were
all valued using external pricing vendors.
Northern Trust has established processes and procedures
to assess the suitability of valuation methodologies used by
external pricing vendors, including reviews of valuation
techniques and assumptions used for selected securities. On a
daily basis, periodic quality control reviews of prices received
from vendors are conducted which include comparisons to
prices on similar security types received from multiple pricing
vendors and to the previous day’s reported prices for each
security. Predetermined tolerance level exceptions are
researched and may result in additional validation through
available market information or the use of an alternate pricing
vendor. Quarterly, Northern Trust reviews documentation
from third-party pricing vendors regarding the valuation
processes and assumptions used in their valuations and
assesses whether the fair value levels assigned by Northern
Trust to each security classification are appropriate. Annually,
valuation inputs used within third-party pricing vendor
valuations are reviewed for propriety on a sample basis
through a comparison of inputs used to comparable market
data, including security classifications that are less actively
traded and security classifications comprising significant
portions of the portfolio.
Level 2 assets and liabilities also include derivative
contracts which are valued internally using widely accepted
income-based models that incorporate inputs readily
observable in actively quoted markets and reflect the
contractual terms of the contracts. Observable inputs include
foreign exchange rates and interest rates for foreign exchange
contracts; credit spreads, default probabilities, and recovery
rates for credit default swap contracts; interest rates for
interest rate swap contracts and forward contracts; and
interest rates and volatility inputs for interest rate option
contracts. Northern Trust evaluates the impact of
counterparty credit risk and its own credit risk on the
valuation of its derivative instruments. Factors considered
include the likelihood of default by Northern Trust and its
counterparties, the remaining maturities of the instruments,
net exposures after giving effect to master netting
arrangements or similar agreements, available collateral, and
other credit enhancements in determining the appropriate fair
value of derivative instruments. The resulting valuation
adjustments have not been considered material.
2 0 1 3 A N N U A L R E P O R T T O S H A R E H O L D E R S | N O R T H E R N T R U S T C O R P O R A T I O N 67

notes to consolidated financial statements
Level 3 – Valuation techniques in which one or moresignificant inputs are unobservable in the marketplace. Northern
Trust’s Level 3 assets consist of auction rate securities
purchased in 2008 from Northern Trust clients. To estimate
the fair value of auction rate securities, for which trading is
limited and market prices are generally unavailable, Northern
Trust developed and maintains a pricing model that discounts
estimated cash flows over their estimated remaining lives.
Significant inputs to the model include the contractual terms
of the securities, credit risk ratings, discount rates, forward
interest rates, credit/liquidity spreads, and Northern Trust’s
own assumptions about the estimated remaining lives of the
securities. The significant unobservable inputs used in the fair
value measurement are Northern Trust’s own assumptions
about the estimated remaining lives of the securities and the
applicable discount rates. Significant increases (decreases) in
the estimated remaining lives or the discount rates in isolation
would result in a significantly lower (higher) fair value
measurement. Level 3 liabilities consist of acquisition related
contingent consideration liabilities. The fair values of these
contingent consideration liabilities have been determined
using an income-based (discounted cash flow) model that
incorporates Northern Trust’s own assumptions about
business growth rates and applicable discount rates, which
represent unobservable inputs to the model. Significant
increases (decreases) in projected growth rates in isolation
would result in significantly higher (lower) fair value
measurements, while significant increases (decreases) in the
discount rate in isolation would result in significantly lower
(higher) fair value measurements.
Northern Trust believes its valuation methods for its assets
and liabilities carried at fair value are appropriate; however,
the use of different methodologies or assumptions,
particularly as applied to Level 3 assets and liabilities, could
have a material effect on the computation of their estimated
fair values.
Management of various businesses and departments of
Northern Trust (including Corporate Market Risk, Credit
Policy, Corporate Financial Management, and relevant
business unit personnel) determine the valuation policies and
procedures for Level 3 assets and liabilities. Each business and
department represents a component of Northern Trust’s
business units, and reports to management of their respective
business units. Generally, valuation policies are reviewed by
management of each business or department. Fair value
measurements are performed upon acquisitions of an asset or
liability. As necessary, the valuation models are reviewed by
management of the appropriate business or department, and
adjusted for changes in inputs. Management of each business
or department reviews the inputs in order to substantiate the
unobservable inputs used in each fair value measurement.
When appropriate, management reviews forecasts used in the
valuation process in light of other relevant financial
projections to understand any variances between current and
previous fair value measurements. In certain circumstances,
third party information is used to support the fair value
measurements. If certain third party information seems
inconsistent with consensus views, a review of the information
is performed by management of the respective business or
department to conclude as to the appropriate fair value of the
asset or liability.
2 0 1 3 A N N U A L R E P O R T T O S H A R E H O L D E R S | N O R T H E R N T R U S T C O R P O R A T I O N 68

notes to consolidated financial statements
The following presents the fair values of, and the valuation techniques, significant unobservable inputs, and quantitative
information used to develop significant unobservable inputs for, Northern Trust’s Level 3 assets and liabilities as of December 31,
2013.
FINANCIAL INSTRUMENT FAIR VALUE VALUATION TECHNIQUE UNOBSERVABLE INPUT RANGE OF LIVES AND RATES
Auction Rate Securities $98.9 million Discounted Cash Flow Remaining livesDiscount rates
2.4 – 8.6 years0.3% – 7.7%
Contingent Consideration $55.4 million Discounted Cash Flow Discount rateBusiness growth rates
10.5%19% – 21%
The following presents assets and liabilities measured at fair value on a recurring basis as of December 31, 2013 and 2012,
segregated by fair value hierarchy level.
DECEMBER 31, 2013
(In Millions) LEVEL 1 LEVEL 2 LEVEL 3 NETTING
ASSETS/LIABILITIES
AT FAIRVALUE
SecuritiesAvailable for Sale
U.S. Government $1,917.9 $ – $ – $ – $ 1,917.9Obligations of States and Political Subdivisions – 4.6 – – 4.6Government Sponsored Agency – 17,528.0 – – 17,528.0Corporate Debt – 3,524.5 – – 3,524.5Covered Bonds – 1,943.9 – – 1,943.9Supranational, Sovereign and Non-U.S. Agency Bonds – 720.6 – – 720.6Residential Mortgage-Backed – 48.1 – – 48.1Other Asset-Backed – 2,391.8 – – 2,391.8Auction Rate – – 98.9 – 98.9Other – 214.5 – – 214.5
Total Available for Sale 1,917.9 26,376.0 98.9 – 28,392.8
Trading Account – 1.7 – – 1.7
Total Available for Sale and Trading Securities 1,917.9 26,377.7 98.9 – 28,394.5
Other AssetsDerivative Assets
Foreign Exchange Contracts – 2,865.7 – – 2,865.7Interest Rate Swaps – 237.9 – – 237.9
Total Derivative Assets – 3,103.6 – (1,369.0) 1,734.6
Other LiabilitiesDerivative Liabilities
Foreign Exchange Contracts – 2,905.7 – – 2,905.7Interest Rate Swaps – 195.2 – – 195.2
Total Derivative Liabilities – 3,100.9 – (1,926.0) 1,174.9
Contingent Consideration $ – $ – $55.4 $ – $ 55.4
Note: Northern Trust has elected to net derivative assets and liabilities when legally enforceable master netting arrangements or similar agreements exist between Northern Trust and thecounterparty. As of December 31, 2013, derivative assets and liabilities shown above also include reductions of $210.7 million and $767.7 million, respectively, as a result of cash collateralreceived from and deposited with derivative counterparties.
2 0 1 3 A N N U A L R E P O R T T O S H A R E H O L D E R S | N O R T H E R N T R U S T C O R P O R A T I O N 69

notes to consolidated financial statements
DECEMBER 31, 2012
(In Millions) LEVEL 1 LEVEL 2 LEVEL 3 NETTING
ASSETS/
LIABILITIES
AT FAIR
VALUE
SecuritiesAvailable for Sale
U.S. Government $1,784.6 $ – $ – $ – $ 1,784.6Obligations of States and Political Subdivisions – 14.1 – – 14.1Government Sponsored Agency – 18,638.8 – – 18,638.8Corporate Debt – 2,618.4 – – 2,618.4Covered Bonds – 1,748.0 – – 1,748.0Supranational Bonds – 1,060.7 – – 1,060.7Residential Mortgage-Backed – 92.0 – – 92.0Other Asset-Backed – 2,283.9 – – 2,283.9Auction Rate – – 97.8 – 97.8Other – 305.2 – – 305.2
Total Available for Sale 1,784.6 26,761.1 97.8 – 28,643.5
Trading Account – 8.0 – – 8.0
Total Available for Sale and Trading Securities 1,784.6 26,769.1 97.8 – 28,651.5
Other AssetsDerivatives
Foreign Exchange Contracts – 1,756.6 – – 1,756.6Interest Rate Swaps – 310.3 – – 310.3
Total Derivatives Assets – 2,066.9 – (1,101.1) 965.8
Other LiabilitiesDerivatives
Foreign Exchange Contracts – 1,772.7 – – 1,772.7Interest Rate Swaps – 249.3 – – 249.3Credit Default Swaps – 1.0 – – 1.0
Total Derivatives Liabilities – 2,023.0 – (1,407.5) 615.5
Contingent Consideration – – 50.1 – 50.1
Note: Northern Trust has elected to net derivative assets and liabilities when legally enforceable master netting arrangements or similar agreements exist between Northern Trust and thecounterparty. As of December 31, 2012, derivative assets and liabilities shown above also include reductions of $118.6 million and $425.0 million, respectively, as a result of cash collateralreceived from and deposited with derivative counterparties.
2 0 1 3 A N N U A L R E P O R T T O S H A R E H O L D E R S | N O R T H E R N T R U S T C O R P O R A T I O N 70

notes to consolidated financial statements
The following tables present the changes in Level 3 assets
and liabilities for the years ended December 31, 2013 and
2012.
LEVEL 3 ASSETS AUCTION RATE SECURITIES
(In Millions) 2013 2012
Fair Value at January 1 $97.8 $178.3Total Gains and (Losses):
Included in Earnings(1) 0.1 (21.6)Included in Other Comprehensive Income(2) 3.8 6.4
Purchases, Issuances, Sales, and Settlements:Sales (0.6) (54.7)Settlements (2.2) (10.6)
Fair Value at December 31 $98.9 $ 97.8
(1) Realized gains for the year ended December 31, 2013 of $0.1 million represents gainsfrom redemptions by issuers. Realized losses for the year ended December 31, 2012 of $21.6million include $20.8 million of losses from sales of securities and $1.6 million ofimpairment losses, partially offset by $0.8 million of gains from redemptions by issuers.Gains on redemptions are recorded in interest income and sales and impairment losses arerecorded in investment security gains (losses), net, within the consolidated statement ofincome.(2) Unrealized losses related to auction rate securities are included in net unrealized gains(losses) on securities available for sale, within the consolidated statement of comprehensiveincome.
LEVEL 3 LIABIL IT IES CONTINGENT CONSIDERATION
(In Millions) 2013 2012
Fair Value at January 1 $50.1 $56.8Total (Gains) and Losses:
Included in Earnings(1) 5.3 2.0Included in Other Comprehensive Income(2) – (0.5)
Purchases, Issuances, Sales, and Settlements:Purchases – –Settlements – (8.2)
Fair Value at December 31 $55.4 $50.1Unrealized (Gains) Losses Included in Earnings
Related to Financial Instruments Held atDecember 31(1) $ 5.3 $ 4.8
(1) Gains (losses) are recorded in other operating income (expense) within the consolidatedstatement of income.(2) Unrealized foreign currency related losses on contingent consideration liabilities areincluded in foreign currency translation adjustments, within the consolidated statement ofcomprehensive income.
For the years ended December 31, 2013 and 2012, there
were no assets or liabilities transferred into or out of Level 3.
Carrying values of assets and liabilities that are not
measured at fair value on a recurring basis may be adjusted to
fair value in periods subsequent to their initial recognition, for
example, to record an impairment of an asset. GAAP requires
entities to separately disclose these subsequent fair value
measurements and to classify them under the fair value
hierarchy.
Assets measured at fair value on a nonrecurring basis at
December 31, 2013 and 2012, all of which were categorized as
Level 3 under the fair value hierarchy, were comprised of
impaired loans whose values were based on real-estate and
other available collateral, and of Other Real Estate Owned
(OREO) properties. Fair values of real-estate loan collateral
were estimated using a market approach typically supported
by third party valuations and property specific fees and taxes,
and were subject to adjustments to reflect management’s
judgment as to realizable value. Other loan collateral, which
typically consists of accounts receivable, inventory and
equipment, is valued using a market approach adjusted for
asset specific characteristics and in limited instances third
party valuations are used.
Collateral-based impaired loans that have been adjusted to
fair value totaled $34.0 million and $35.0 million at
December 31, 2013 and 2012, respectively, and the level of
specific allowances on these loans was decreased by $14.3
million during the year ended December 31, 2013 and by $8.5
million for the year ended December 31, 2012.
OREO properties that have been adjusted to fair value
totaled $1.4 million and $2.3 million at December 31, 2013
and 2012, respectively, and $1.0 million and $0.8 million were
charged through other operating expense during the years
ended December 31, 2013 and 2012, respectively, to reduce
the fair values of these OREO properties.
2 0 1 3 A N N U A L R E P O R T T O S H A R E H O L D E R S | N O R T H E R N T R U S T C O R P O R A T I O N 71

notes to consolidated financial statements
The following table provides the fair value of, and the valuation technique, significant unobservable inputs, and quantitative
information used to develop the significant unobservable inputs for, Northern Trust’s Level 3 assets that were measured at fair value
on a nonrecurring basis as of December 31, 2013.
FINANCIAL INSTRUMENT FAIR VALUE VALUATION TECHNIQUE UNOBSERVABLE INPUT RANGE OF DISCOUNTS APPLIED
Loans $34.0 million Market Approach Discount to reflectrealizable value
15% – 40%
OREO $1.4 million Market Approach Discount to reflectrealizable value
15% – 40%
Fair Value of Financial Instruments. GAAP requires
disclosure of the estimated fair value of certain financial
instruments and the methods and significant assumptions
used to estimate fair value. It excludes from this requirement
nonfinancial assets and liabilities, as well as a wide range of
franchise, relationship, and intangible values that add value to
Northern Trust. Accordingly, the required fair value
disclosures provide only a partial estimate of the fair value of
Northern Trust. Financial instruments recorded at fair value
on Northern Trust’s consolidated balance sheet are discussed
above. The following methods and assumptions were used in
estimating the fair values of financial instruments that are not
carried at fair value.
Held to Maturity Securities. The fair values of held to
maturity securities were modeled by external pricing vendors,
or in limited cases internally, using widely accepted models
which are based on an income approach that incorporates
current market yield curves.
Loans (excluding lease receivables). The fair value of the
loan portfolio was estimated using an income approach
(discounted cash flow) that incorporates current market rates
offered by Northern Trust as of the date of the consolidated
financial statements. The fair values of all loans were adjusted
to reflect current assessments of loan collectability.
Federal Reserve and Federal Home Loan Bank Stock. The
fair values of Federal Reserve and Federal Home Loan Bank
stock are equal to their carrying values which represent
redemption value.
Community Development Investments. The fair values of
these instruments were estimated using an income approach
(discounted cash flow) that incorporates current market rates.
Employee Benefit and Deferred Compensation. These assets
include U.S. treasury securities and investments in mutual and
collective trust funds held to fund certain supplemental
employee benefit obligations and deferred compensation plans.
Fair values of U.S. treasury securities were determined using
quoted, active market prices for identical securities. The fair
values of investments in mutual and collective trust funds were
valued at the funds’ net asset values based on a market approach.
Savings Certificates and Other Time Deposits. The fair
values of these instruments were estimated using an income
approach (discounted cash flow) that incorporates market
interest rates currently offered by Northern Trust for deposits
with similar maturities.
Senior Notes, Subordinated Debt, and Floating Rate CapitalDebt. Fair values were determined using a market approach
based on quoted market prices, when available. If quoted
market prices were not available, fair values were based on
quoted market prices for comparable instruments.
Federal Home Loan Bank Borrowings. The fair values of
these instruments were estimated using an income approach
(discounted cash flow) that incorporates market interest rates
available to Northern Trust.
Loan Commitments. The fair values of loan commitments
represent the estimated costs to terminate or otherwise settle
the obligations with a third party adjusted for any related
allowance for credit losses.
Standby Letters of Credit. The fair values of standby letters
of credit are measured as the amount of unamortized fees on
these instruments, inclusive of the related allowance for credit
losses. Fees are determined by applying basis points to the
principal amounts of the letters of credit.
Financial Instruments Valued at Carrying Value. Due to
their short maturity, the carrying values of certain financial
instruments approximated their fair values. These financial
instruments include cash and due from banks; federal funds
sold and securities purchased under agreements to resell,
interest-bearing deposits with banks, Federal Reserve deposits
and other interest-bearing assets; client security settlement
receivables; non-U.S. offices interest-bearing deposits; federal
funds purchased; securities sold under agreements to
repurchase; and other borrowings (includes term federal funds
purchased, and other short-term borrowings). As required by
GAAP, the fair values required to be disclosed for demand,
noninterest-bearing, savings, and money market deposits
must equal the amounts disclosed in the consolidated balance
sheet, even though such deposits are typically priced at a
premium in banking industry consolidations.
2 0 1 3 A N N U A L R E P O R T T O S H A R E H O L D E R S | N O R T H E R N T R U S T C O R P O R A T I O N 72

notes to consolidated financial statements
The following tables summarize the fair values of all financial instruments.
DECEMBER 31, 2013
(In Millions)
FAIR VALUE
BOOK VALUETOTAL
FAIR VALUE LEVEL 1 LEVEL 2 LEVEL 3
ASSETS
Cash and Due from Banks $ 3,162.4 $ 3,162.4 $ 3,162.4 $ – $ –Federal Funds Sold and Resell Agreements 529.6 529.6 – 529.6 –Interest-Bearing Deposits with Banks 19,397.4 19,397.4 – 19,397.4 –Federal Reserve Deposits and Other Interest-Bearing 12,911.5 12,911.5 – 12,911.5 –Securities
Available for Sale (Note) 28,392.8 28,392.8 1,917.9 26,376.0 98.9Held to Maturity 2,325.8 2,321.4 – 2,321.4 –Trading Account 1.7 1.7 – 1.7 –
Loans (excluding Leases)Held for Investment 28,136.5 28,147.2 – – 28,147.2Held for Sale – – – – –
Client Security Settlement Receivables 1,355.2 1,355.2 – 1,355.2 –Other Assets
Federal Reserve and Federal Home Loan Bank Stock 194.7 194.7 – 194.7 –Community Development Investments 228.1 227.8 – 227.8 –Employee Benefit and Deferred Compensation 132.7 126.9 79.3 47.6 –
LIABILITIES
DepositsDemand, Noninterest-Bearing, Savings and Money
Market $33,762.0 $33,762.0 $33,762.0 $ – $ –Savings Certificates and Other Time 1,874.4 1,877.1 – 1,877.1 –Non-U.S. Offices Interest-Bearing 48,461.7 48,461.7 – 48,461.7 –
Federal Funds Purchased 965.1 965.1 – 965.1 –Securities Sold under Agreements to Repurchase 917.3 917.3 – 917.3 –Other Borrowings 1,558.6 1,558.6 – 1,558.6 –Senior Notes 1,996.6 1,989.3 – 1,989.3 –Long Term Debt (excluding Leases)
Subordinated Debt 1,537.3 1,563.5 – 1,563.5 –Federal Home Loan Bank Borrowings 135.0 137.2 – 137.2 –
Floating Rate Capital Debt 277.1 230.2 – 230.2 –Other Liabilities
Standby Letters of Credit 59.6 59.6 – – 59.6Contingent Consideration 55.4 55.4 – – 55.4Loan Commitments 35.7 35.7 – – 35.7
DERIVATIVE INSTRUMENTS
Asset/Liability ManagementForeign Exchange Contracts
Assets $ 21.0 $ 21.0 $ – $ 21.0 $ –Liabilities 59.5 59.5 – 59.5 –
Interest Rate SwapsAssets 115.1 115.1 – 115.1 –Liabilities 78.2 78.2 – 78.2 –
Client-Related and TradingForeign Exchange Contracts
Assets 2,844.7 2,844.7 – 2,844.7 –Liabilities 2,846.2 2,846.2 – 2,846.2 –
Interest Rate ContractsAssets 122.8 122.8 – 122.8 –Liabilities 117.0 117.0 – 117.0 –
Note: Refer to the table located on page 69 for the disaggregation of available for sale securities.
2 0 1 3 A N N U A L R E P O R T T O S H A R E H O L D E R S | N O R T H E R N T R U S T C O R P O R A T I O N 73

notes to consolidated financial statements
DECEMBER 31, 2012
FAIR VALUE
(In Millions) BOOK VALUE
TOTAL
FAIR VALUE LEVEL 1 LEVEL 2 LEVEL 3
ASSETS
Cash and Due from Banks $ 3,752.7 $ 3,752.7 $ 3,752.7 $ – $ –Federal Funds Sold and Resell Agreements 60.8 60.8 – 60.8 –Interest-Bearing Deposits with Banks 18,803.5 18,803.5 – 18,803.5 –Federal Reserve Deposits and Other Interest-Bearing 7,619.7 7,619.7 – 7,619.7 –Securities
Available for Sale (Note) 28,643.5 28,643.5 1,784.6 26,761.1 97.8Held to Maturity 2,382.0 2,394.8 – 2,394.8 –Trading Account 8.0 8.0 – 8.0 –
Loans (excluding Leases)Held for Investment 28,165.4 28,220.2 – – 28,220.2Held for Sale 11.7 11.7 – – 11.7
Client Security Settlement Receivables 2,049.1 2,049.1 – 2,049.1 –Other Assets
Federal Reserve and Federal Home Loan Bank Stock 197.6 197.6 – 197.6 –Community Development Investments 253.2 275.1 – 275.1 –Employee Benefit and Deferred Compensation 121.3 126.1 86.7 39.4 –
LIABILITIES
DepositsDemand, Noninterest-Bearing, Savings and Money
Market $39,221.5 $39,221.5 $39,221.5 $ – $ –Savings Certificates and Other Time 2,466.1 2,476.7 – 2,476.7 –Non-U.S. Offices Interest-Bearing 39,720.2 39,720.2 – 39,720.2 –
Federal Funds Purchased 780.2 780.2 – 780.2 –Securities Sold under Agreements to Repurchase 699.8 699.8 – 699.8 –Other Borrowings 367.4 367.4 – 367.4 –Senior Notes 2,405.8 2,513.4 – 2,513.4 –Long Term Debt (excluding Leases)
Subordinated Debt 1,045.4 1,065.3 – 1,065.3 –Federal Home Loan Bank Borrowings 335.0 345.4 – 345.4 –
Floating Rate Capital Debt 277.0 228.0 – 228.0 –Other Liabilities
Standby Letters of Credit 60.5 60.5 – – 60.5Contingent Consideration 50.1 50.1 – – 50.1Loan Commitments 38.9 38.9 – – 38.9
DERIVATIVE INSTRUMENTS
Asset/Liability ManagementForeign Exchange Contracts
Assets $ 21.3 $ 21.3 $ – $ 21.3 $ –Liabilities 42.3 42.3 – 42.3 –
Interest Rate SwapsAssets 129.7 129.7 – 129.7 –Liabilities 75.3 75.3 – 75.3 –
Credit Default SwapsLiabilities 1.0 1.0 – 1.0 –
Client-Related and TradingForeign Exchange Contracts
Assets 1,735.3 1,735.3 – 1,735.3 –Liabilities 1,730.4 1,730.4 – 1,730.4 –
Interest Rate ContractsAssets 180.6 180.6 – 180.6 –Liabilities 174.0 174.0 – 174.0 –
Note: Refer to the table located on page 70 for the disaggregation of available for sale securities.
2 0 1 3 A N N U A L R E P O R T T O S H A R E H O L D E R S | N O R T H E R N T R U S T C O R P O R A T I O N 74

notes to consolidated financial statements
Note 4 – Securities
Securities Available for Sale. The following tables provide the amortized cost, fair values, and remaining maturities of securities
available for sale.
RECONCILIATION OF AMORTIZED COST TO FAIR VALUES OFSECURITIES AVAILABLE FOR SALE DECEMBER 31, 2013
(In Millions)AMORTIZED
COST
GROSSUNREALIZED
GAINS
GROSSUNREALIZED
LOSSESFAIR
VALUE
U.S. Government $ 1,896.7 $ 22.6 $ 1.4 $ 1,917.9Obligations of States and Political Subdivisions 4.5 0.1 – 4.6Government Sponsored Agency 17,495.2 80.7 47.9 17,528.0Corporate Debt 3,615.2 10.5 101.2 3,524.5Covered Bonds 1,898.9 50.9 5.9 1,943.9Supranational, Sovereign and Non-U.S. Agency Bonds 717.0 5.3 1.7 720.6Residential Mortgage-Backed 52.4 0.1 4.4 48.1Other Asset-Backed 2,390.8 1.4 0.4 2,391.8Auction Rate 97.5 2.2 0.8 98.9Other 214.1 0.4 – 214.5
Total $28,382.3 $174.2 $163.7 $28,392.8
DECEMBER 31, 2012
(In Millions)AMORTIZED
COST
GROSS
UNREALIZED
GAINS
GROSS
UNREALIZED
LOSSES
FAIR
VALUE
U.S. Government $ 1,747.9 $ 36.7 $ – $ 1,784.6Obligations of States and Political Subdivisions 13.9 0.2 – 14.1Government Sponsored Agency 18,520.6 122.2 4.0 18,638.8Corporate Debt 2,602.4 18.1 2.1 2,618.4Covered Bonds 1,697.1 51.0 0.1 1,748.0Supranational Bonds 1,053.9 7.0 0.2 1,060.7Residential Mortgage-Backed 102.4 0.4 10.8 92.0Other Asset-Backed 2,280.0 4.3 0.4 2,283.9Auction Rate 99.6 2.1 3.9 97.8Other 304.4 0.8 – 305.2
Total $ 28,422.2 $ 242.8 $ 21.5 $ 28,643.5
REMAINING MATURITY OF SECURITIES AVAILABLE FOR SALE DECEMBER 31, 2013 DECEMBER 31, 2012
(In Millions)AMORTIZED
COSTFAIR
VALUEAMORTIZED
COST
FAIR
VALUE
Due in One Year or Less $ 9,552.9 $ 9,565.7 $ 7,431.7 $ 7,451.2Due After One Year Through Five Years 15,011.4 15,067.2 18,663.4 18,840.4Due After Five Years Through Ten Years 2,545.9 2,494.1 1,724.0 1,738.0Due After Ten Years 1,272.1 1,265.8 603.1 613.9
Total $28,382.3 $28,392.8 $28,422.2 $28,643.5
Note: Mortgage-backed and asset-backed securities are included in the above table taking into account anticipated future prepayments.
2 0 1 3 A N N U A L R E P O R T T O S H A R E H O L D E R S | N O R T H E R N T R U S T C O R P O R A T I O N 75

notes to consolidated financial statements
Securities Held to Maturity. The following tables provide the amortized cost, fair values and remaining maturities of securities
held to maturity.
RECONCILIATION OF AMORTIZED COST TO FAIR VALUES OFSECURITIES HELD TO MATURITY DECEMBER 31, 2013
(In Millions)AMORTIZED
COST
GROSSUNREALIZED
GAINS
GROSSUNREALIZED
LOSSESFAIR
VALUE
Obligations of States and Political Subdivisions $ 225.2 $10.3 $ – $ 235.5Government Sponsored Agency 35.9 1.1 – 37.0Non-U.S. Government Debt 197.3 – – 197.3Certificates of Deposit 698.1 – 0.2 697.9Supranational, Sovereign and Non-U.S. Agency Bonds 1,109.4 0.8 4.3 1,105.9Other 59.9 0.1 12.2 47.8
Total $2,325.8 $12.3 $16.7 $2,321.4
DECEMBER 31, 2012
(In Millions)AMORTIZED
COST
GROSS
UNREALIZED
GAINS
GROSS
UNREALIZED
LOSSES
FAIR
VALUE
Obligations of States and Political Subdivisions $ 329.3 $ 17.2 $ – $ 346.5Government Sponsored Agency 112.9 3.8 – 116.7Non-U.S. Government Debt 205.0 – – 205.0Certificates of Deposit 1,667.6 0.2 0.6 1,667.2Other 67.2 0.3 8.1 59.4
Total $ 2,382.0 $ 21.5 $ 8.7 $ 2,394.8
REMAINING MATURITY OF SECURITIES HELD TO MATURITY DECEMBER 31, 2013 DECEMBER 31, 2012
(In Millions)AMORTIZED
COSTFAIR
VALUEAMORTIZED
COST
FAIR
VALUE
Due in One Year or Less $1,009.9 $1,011.2 $2,029.5 $2,030.6Due After One Year Through Five Years 1,254.9 1,257.0 268.1 280.2Due After Five Years Through Ten Years 26.1 27.1 45.4 49.8Due After Ten Years 34.9 26.1 39.0 34.2
Total $2,325.8 $2,321.4 $2,382.0 $2,394.8
Note: Mortgage-backed and asset-backed securities are included in the above table taking into account anticipated future prepayments.
Securities held to maturity consist of debt securities that
management intends to, and Northern Trust has the ability to,
hold until maturity.
Investment Security Gains and Losses. Net investment
security losses totaling $1.5 million, $1.7 million, and $23.9
million were recognized in 2013, 2012, and 2011, respectively.
Losses in 2012 and 2011 included $3.3 million, and $23.3
million of OTTI losses, respectively. There were no OTTI
losses in 2013. Gross proceeds of $0.5 billion from the sale of
securities in 2013 resulted in gross realized gains of $0.8
million and gross realized losses of $2.3 million. Gross
proceeds of $2.7 billion from the sale of securities in 2012
resulted in gross realized gains of $23.5 million and gross
realized losses of $21.9 million. There were $0.6 million of
other realized net security losses in 2011.
2 0 1 3 A N N U A L R E P O R T T O S H A R E H O L D E R S | N O R T H E R N T R U S T C O R P O R A T I O N 76

notes to consolidated financial statements
Securities with Unrealized Losses. The following tables provide information regarding securities that had been in a continuous
unrealized loss position for less than 12 months and for 12 months or longer as of December 31, 2013 and 2012.
SECURITIES WITH UNREALIZEDLOSSES AS OF DECEMBER 31, 2013 LESS THAN 12 MONTHS 12 MONTHS OR LONGER TOTAL
(In Millions)FAIR
VALUEUNREALIZED
LOSSESFAIR
VALUEUNREALIZED
LOSSESFAIR
VALUEUNREALIZED
LOSSES
U.S. Government $ 896.4 $ 1.4 $ – $ – $ 896.4 $ 1.4Government Sponsored Agency 4,340.8 42.6 413.7 5.3 4,754.5 47.9Corporate Debt 1,759.5 85.4 267.0 15.8 2,026.5 101.2Covered Bonds 278.8 5.7 9.9 0.2 288.7 5.9Supranational Sovereign and Non U.S.
Agency Bonds 789.4 6.0 – – 789.4 6.0Residential Mortgage-Backed – – 42.0 4.4 42.0 4.4Other Asset-Backed 677.0 0.4 – – 677.0 0.4Certificates of Deposit 684.2 0.2 – – 684.2 0.2Auction Rate 22.1 0.1 14.0 0.7 36.1 0.8Other 25.7 4.0 29.5 8.2 55.2 12.2
Total $9,473.9 $145.8 $ 776.1 $34.6 $10,250.0 $180.4
SECURITIES WITH UNREALIZEDLOSSES AS OF DECEMBER 31, 2012 LESS THAN 12 MONTHS 12 MONTHS OR LONGER TOTAL
(In Millions)FAIR
VALUE
UNREALIZED
LOSSES
FAIR
VALUE
UNREALIZED
LOSSES
FAIR
VALUE
UNREALIZED
LOSSES
Government Sponsored Agency $ 482.2 $ 1.0 $1,171.8 $ 3.0 $ 1,654.0 $ 4.0Corporate Debt 441.5 2.0 50.0 0.1 491.5 2.1Covered Bonds 20.1 0.1 – – 20.1 0.1Supranational Bonds 113.8 0.2 – – 113.8 0.2Residential Mortgage-Backed – – 84.7 10.8 84.7 10.8Other Asset-Backed 146.1 0.1 40.0 0.3 186.1 0.4Certificates of Deposit 1,178.8 0.6 – – 1,178.8 0.6Auction Rate 2.7 0.3 41.0 3.6 43.7 3.9Other 9.3 1.9 43.8 6.2 53.1 8.1
Total $ 2,394.5 $ 6.2 $1,431.3 $ 24.0 $ 3,825.8 $ 30.2
As of December 31, 2013, 444 securities with a combined
fair value of $10.3 billion were in an unrealized loss position,
with their unrealized losses totaling $180.4 million. Unrealized
losses of $101.2 million within corporate debt securities
primarily reflect widened credit spreads and higher market rates
since purchase; 51% of the corporate debt portfolio is backed by
guarantees provided by U.S. and non-U.S. governmental entities.
Unrealized losses of $47.9 million related to government
sponsored agency securities are primarily attributable to changes
in market rates since their purchase.
Unrealized losses on residential mortgage-backed
securities totaling $4.4 million reflect the impact of wider
credit and liquidity spreads on the valuations of 5 residential
mortgage-backed securities since purchase, with $42.0 million
having been in an unrealized loss position for more than 12
months. Residential mortgage-backed securities at
December 31, 2013 had a total amortized cost and fair value of
$52.4 million and $48.1 million, respectively. Securities
classified as “other asset-backed” at December 31, 2013 had
average lives of less than 5 years, and 99% were rated triple-A.
The majority of the $12.2 million of unrealized losses in
securities classified as “other” at December 31, 2013 relate to
securities which Northern Trust purchases for compliance
with the Community Reinvestment Act (CRA). Unrealized
losses on these CRA related other securities are attributable to
their purchase at below market rates for the purpose of
supporting institutions and programs that benefit low to
moderate income communities within Northern Trust’s
market area. Unrealized losses of $0.8 million related to
auction rate securities primarily reflect reduced market
liquidity as a majority of auctions continue to fail preventing
holders from liquidating their investments at par. The
remaining unrealized losses on Northern Trust’s securities
portfolio as of December 31, 2013 are attributable to changes
in overall market interest rates, increased credit spreads, or
reduced market liquidity. As of December 31, 2013, Northern
Trust does not intend to sell any investment in an unrealized
loss position and it is not more likely than not that Northern
Trust will be required to sell any such investment before the
recovery of its amortized cost basis, which may be maturity.
2 0 1 3 A N N U A L R E P O R T T O S H A R E H O L D E R S | N O R T H E R N T R U S T C O R P O R A T I O N 77

notes to consolidated financial statements
Security impairment reviews are conducted quarterly to identify and evaluate securities that have indications of possible OTTI.
A determination as to whether a security’s decline in market value is other-than-temporary takes into consideration numerous
factors and the relative significance of any single factor can vary by security. Factors Northern Trust considers in determining
whether impairment is other-than-temporary include, but are not limited to, the length of time the security has been impaired; the
severity of the impairment; the cause of the impairment and the financial condition and near-term prospects of the issuer; activity in
the market of the issuer which may indicate adverse credit conditions; Northern Trust’s intent regarding the sale of the security as of
the balance sheet date; and the likelihood that it will not be required to sell the security for a period of time sufficient to allow for the
recovery of the security’s amortized cost basis. For each security meeting the requirements of Northern Trust’s internal screening
process, an extensive review is conducted to determine if OTTI has occurred.
While all securities are considered, the following describes Northern Trust’s process for identifying credit impairment within
non-agency residential mortgage-backed securities, the security type for which Northern Trust has previously recognized the
majority of its OTTI. To determine if an unrealized loss on a non-agency residential mortgage-backed security is other-than-
temporary, economic models are used to perform cash flow analyses by developing multiple scenarios in order to create reasonable
forecasts of the security’s future performance using available data including servicers’ loan charge off patterns, prepayment speeds,
annualized default rates, each security’s current delinquency pipeline, the delinquency pipeline’s growth rate, the roll rate from
delinquency to default, loan loss severities and historical performance of like collateral, along with Northern Trust’s outlook for the
housing market and the overall economy. If the present value of future cash flows projected as a result of this analysis is less than the
current amortized cost of the security, a credit-related OTTI loss is recorded to earnings equal to the difference between the two
amounts.
Impairments of non-agency residential mortgage-backed securities are influenced by a number of factors, including but not
limited to, U.S. economic and housing market performance, security credit enhancement level, insurance coverage, year of
origination, and type of collateral. The factors used in estimating losses on non-agency residential mortgage-backed securities vary
by year of origination and type of collateral. As of December 31, 2013, loss estimates for subprime, Alt-A, prime and 2nd lien
collateral portfolios were developed using default roll rates, determined primarily by the stage of delinquency of the underlying
instrument, that generally assumed ultimate default rates approximating 5% to 30% for current loans; 30% for loans 30 to 60 days
delinquent; 80% for loans 60 to 90 days delinquent; 90% for loans delinquent greater than 90 days; and 100% for OREO properties
and loans that are in foreclosure.
December 31, 2013 amortized cost, weighted average ultimate default rates, and impairment severity rates for the non-agency
residential mortgage-backed securities portfolio, by security type, are provided in the following table.
DECEMBER 31, 2013
LOSS SEVERITY RATES
($ In Millions)AMORTIZED
COST
WEIGHTED AVERAGEULTIMATE DEFAULT
RATES LOW HIGHWEIGHTEDAVERAGE
Prime $ 7.2 21.5% 32.7% 45.0% 41.3%Alt-A 12.1 40.3 65.5 65.5 65.5Subprime 23.4 48.6 75.6 79.3 76.52nd Lien 9.7 32.8 98.9 99.0 99.0
Total Non-Agency Residential Mortgage-Backed Securities $52.4 39.5% 32.7% 99.0% 73.3%
Northern Trust’s processes for identifying credit
impairment within auction rate securities are largely
consistent with the processes utilized for non-agency
residential mortgage-backed securities and include analyses of
loss severities and default rates adjusted for the type of
underlying loan and the presence of government guarantees,
as applicable. There were no OTTI losses recognized during
the year ended December 31, 2013. There were $3.3 million of
OTTI losses in 2012, of which $1.7 million related to non-
agency residential mortgage-backed securities and $1.6 million
related to auction rate securities, and $23.3 million of OTTI
losses in 2011, all of which related to non-agency residential
mortgage-backed securities.
2 0 1 3 A N N U A L R E P O R T T O S H A R E H O L D E R S | N O R T H E R N T R U S T C O R P O R A T I O N 78

notes to consolidated financial statements
Credit Losses on Debt Securities. The table below provides information regarding total other-than-temporarily impaired
securities, including noncredit-related amounts recognized in other comprehensive income and net impairment losses recognized in
earnings, for the years ended December 31, 2013, 2012, and 2011.
DECEMBER 31,
(In Millions) 2013 2012 2011
Changes in Other-Than-Temporary Impairment Losses(1) $ – $(2.7) $ (1.1)Noncredit-related Losses Recorded in / (Reclassified from) OCI(2) – (0.6) (22.2)
Net Impairment Losses Recognized in Earnings $ – $(3.3) $(23.3)
(1) For initial other-than-temporary impairments in the respective period, the balance includes the excess of the amortized cost over the fair value of the impaired securities. For subsequentimpairments of the same security, the balance includes any additional changes in fair value of the security subsequent to its most recently recorded OTTI.(2) For initial other-than-temporary impairments in the respective period, the balance includes the portion of the excess of amortized cost over the fair value of the impaired securities that wasrecorded in OCI. For subsequent impairments of the same security, the balance includes additional changes in OCI for that security subsequent to its most recently recorded OTTI.
Provided in the table below are the cumulative credit-
related losses recognized in earnings on debt securities other-
than-temporarily impaired.
YEAR ENDED DECEMBER 31,
(In Millions) 2013 2012
Cumulative Credit-Related Losses on SecuritiesHeld – Beginning of Year $ 42.3 $ 68.2
Plus: Losses on Newly Identified Impairments – 1.6Additional Losses on Previously Identified
Impairments – 1.7Less: Current and Prior Period Losses on Securities
Sold During the Year (33.5) (29.2)
Cumulative Credit-Related Losses on SecuritiesHeld – End of Year $ 8.8 $ 42.3
The table below provides information regarding debt
securities held as of December 31, 2013 and 2012, for which an
OTTI loss has been recognized in the current year or previously.
DECEMBER 31,
(In Millions) 2013 2012
Fair Value $38.3 $51.5Amortized Cost Basis 42.8 59.0
Noncredit-related Losses Recognized in OCI (4.5) (7.5)Tax Effect 1.7 2.8
Amount Recognized in OCI $ (2.8) $ (4.7)
Note 5 – Securities Purchased Under Agreementsto Resell and Securities Sold Under Agreements toRepurchase
Securities purchased under agreements to resell and securitiessold under agreements to repurchase are recorded at theamounts at which the securities were acquired or sold plusaccrued interest. To minimize any potential credit risk associatedwith these transactions, the fair value of the securities purchasedor sold is monitored, limits are set on exposure withcounterparties, and the financial condition of counterparties isregularly assessed. It is Northern Trust’s policy to takepossession, either directly or via third party custodians, ofsecurities purchased under agreements to resell.
The following tables summarize information related tosecurities purchased under agreements to resell and securitiessold under agreements to repurchase.
SECURITIES PURCHASED UNDERAGREEMENTS TO RESELL
($ In Millions) 2013 2012
Balance at December 31 $500.0 $ 35.4Average Balance During the Year 396.3 241.5Average Interest Rate Earned During the Year 0.46% 0.16%Maximum Month-End Balance During the Year 571.5 537.4
SECURITIES SOLD UNDERAGREEMENTS TO REPURCHASE
($ In Millions) 2013 2012
Balance at December 31 $917.3 $699.8Average Balance During the Year 594.3 448.2Average Interest Rate Paid During the Year 0.07% 0.08%Maximum Month-End Balance During the Year 917.3 699.8
Note 6 – Loans and Leases
Amounts outstanding for loans and leases, by segment andclass, are shown below.
DECEMBER 31,
(In Millions) 2013 2012
CommercialCommercial and Institutional $ 7,375.8 $ 7,468.5Commercial Real Estate 2,955.8 2,859.8Lease Financing, net 975.1 1,035.0Non-U.S. 954.7 1,192.3Other 358.6 341.6
Total Commercial 12,620.0 12,897.2
PersonalResidential Real Estate 10,271.3 10,375.2Private Client 6,445.6 6,130.1Other 48.6 102.0
Total Personal 16,765.5 16,607.3
Total Loans and Leases $29,385.5 $29,504.5Allowance for Credit Losses Assigned to
Loans and Leases (278.1) (297.9)
Net Loans and Leases $29,107.4 $29,206.6
2 0 1 3 A N N U A L R E P O R T T O S H A R E H O L D E R S | N O R T H E R N T R U S T C O R P O R A T I O N 79

notes to consolidated financial statements
Residential real estate loans consist of conventional home
mortgages and equity credit lines that generally require a loan
to collateral value of no more than 65% to 80% at inception.
Northern Trust’s equity credit line products generally have
draw periods of up to 10 years and a balloon payment of any
outstanding balance is due at maturity. Payments are interest
only with variable interest rates. Northern Trust does not offer
equity credit lines that include an option to convert the
outstanding balance to an amortizing payment loan. As of
December 31, 2013 and 2012, equity credit lines totaled $2.0
billion and $2.3 billion, respectively, and equity credit lines for
which first liens were held by Northern Trust represented 87%
and 86%, respectively, of the total equity credit lines as of
those dates.
Included within the non-U.S., commercial-other, and
personal-other classes are short duration advances, primarily
related to the processing of custodied client investments, that
totaled $1.3 billion and $1.5 billion at December 31, 2013 and
2012, respectively. Demand deposits reclassified as loan
balances totaled $104.1 million and $224.7 million at
December 31, 2013 and 2012, respectively. There were no loans
classified as held for sale at December 31, 2013. Loans classified
as held for sale totaled $11.7 million at December 31, 2012.
The components of the net investment in direct finance
and leveraged leases are as follows:
DECEMBER 31,
(In Millions) 2013 2012
Direct Finance Leases:Lease Receivable $ 189.4 $ 239.2Residual Value 143.1 162.2Initial Direct Costs 2.5 3.5Unearned Income (31.1) (43.5)
Investment in Direct Finance Leases 303.9 361.4
Leveraged Leases:Net Rental Receivable 544.4 559.9Residual Value 295.6 297.9Unearned Income (168.8) (184.2)
Investment in Leveraged Leases 671.2 673.6
Lease Financing, net $ 975.1 $1,035.0
The following schedule reflects the future minimum lease
payments to be received over the next five years under direct
finance leases:
(In Millions)FUTURE MINIMUM
LEASE PAYMENTS
2014 $44.72015 40.52016 30.42017 27.02018 19.1
Credit Quality Indicators. Credit quality indicators are
statistics, measurements or other metrics that provide
information regarding the relative credit risk of loans and
leases. Northern Trust utilizes a variety of credit quality
indicators to assess the credit risk of loans and leases at the
segment, class, and individual credit exposure levels.
As part of its credit process, Northern Trust utilizes an
internal borrower risk rating system to support identification,
approval, and monitoring of credit risk. Borrower risk ratings
are used in credit underwriting, management reporting, and
the calculation of credit loss allowances and economic capital.
Risk ratings are used for ranking the credit risk of
borrowers and the probability of their default. Each borrower
is rated using one of a number of ratings models, which
consider both quantitative and qualitative factors. The ratings
models vary among classes of loans and leases in order to
capture the unique risk characteristics inherent within each
particular type of credit exposure. Provided below are the
more significant performance indicator attributes considered
within Northern Trust’s borrower rating models, by loan and
lease class.
‰ Commercial and Institutional: leverage, profit margin,
liquidity, return on assets, asset size, and capital levels;
‰ Commercial Real Estate: debt service coverage and leasing
status for income-producing properties; loan-to-value and
loan-to-cost ratios, leasing status, and guarantor support
for loans associated with construction and development
properties;
‰ Lease Financing and Commercial-Other: leverage and
profit margin levels;
‰ Non-U.S.: entity type, liquidity, size, and leverage;
‰ Residential Real Estate: payment history, credit bureau
scores, and cash flow-to-debt and net worth ratios;
‰ Private Client: cash flow-to-debt and net worth ratios,
leverage, and profit margin levels; and
‰ Personal-Other: cash flow-to-debt and net worth ratios.
While the criteria vary by model, the objective is for the
borrower ratings to be consistent in both the measurement
and ranking of risk. Each model is calibrated to a master
rating scale to support this consistency. Ratings for borrowers
not in default range from “1” for the strongest credits to “7”
for the weakest non-defaulted credits. Ratings of “8” or “9” are
used for defaulted borrowers. Borrower risk ratings are
monitored and are revised when events or circumstances
indicate a change is required. Risk ratings are validated at least
annually.
2 0 1 3 A N N U A L R E P O R T T O S H A R E H O L D E R S | N O R T H E R N T R U S T C O R P O R A T I O N 80

notes to consolidated financial statements
Loan and lease segment and class balances at December 31, 2013 and 2012 are provided below, segregated by borrower ratings
into “1 to 3”, “4 to 5”, and “6 to 9” (watch list), categories.
DECEMBER 31, 2013 DECEMBER 31, 2012
(In Millions)1 TO 3
CATEGORY4 TO 5
CATEGORY
6 TO 9CATEGORY
(WATCH LIST) TOTAL1 TO 3
CATEGORY
4 TO 5
CATEGORY
6 TO 9
CATEGORY
(WATCH LIST) TOTAL
CommercialCommercial and
Institutional $ 4,432.5 $ 2,801.5 $141.8 $ 7,375.8 $ 4,291.8 $ 3,040.6 $136.1 $ 7,468.5Commercial Real Estate 1,053.7 1,748.7 153.4 2,955.8 888.6 1,710.9 260.3 2,859.8Lease Financing, net 685.7 285.0 4.4 975.1 647.1 382.3 5.6 1,035.0Non-U.S. 442.8 511.9 – 954.7 542.7 646.6 3.0 1,192.3Other 157.7 200.9 – 358.6 167.2 174.4 – 341.6
Total Commercial 6,772.4 5,548.0 299.6 12,620.0 6,537.4 5,954.8 405.0 12,897.2
PersonalResidential Real Estate 3,204.6 6,563.6 503.1 10,271.3 3,003.3 6,868.2 503.7 10,375.2Private Client 3,957.6 2,481.2 6.8 6,445.6 3,741.3 2,365.4 23.4 6,130.1Other 21.2 27.4 – 48.6 50.0 52.0 – 102.0
Total Personal 7,183.4 9,072.2 509.9 16,765.5 6,794.6 9,285.6 527.1 16,607.3
Total Loans and Leases $13,955.8 $14,620.2 $809.5 $29,385.5 $13,332.0 $15,240.4 $932.1 $29,504.5
Loans and leases in the “1 to 3” category are expected to
exhibit minimal to modest probabilities of default and are
characterized by borrowers having the strongest financial
qualities, including above average financial flexibility, cash
flows and capital levels. Borrowers assigned these ratings are
anticipated to experience very little to moderate financial
pressure in adverse down cycle scenarios. As a result of these
characteristics, borrowers within this category exhibit a
minimal to modest likelihood of loss.
Loans and leases in the “4 to 5” category are expected to
exhibit moderate to acceptable probabilities of default and are
characterized by borrowers with less financial flexibility than
those in the “1 to 3” category. Cash flows and capital levels are
generally sufficient to allow for borrowers to meet current
requirements, but have reduced cushion in adverse down cycle
scenarios. As a result of these characteristics, borrowers within
this category exhibit a moderate likelihood of loss.
Loans and leases in the watch list category have elevated
credit risk profiles that are monitored through internal watch
lists, and consist of credits with borrower ratings of “6 to 9”.
These credits, which include all nonperforming credits, are
expected to exhibit minimally acceptable probabilities of
default, elevated risk of default, or are currently in default.
Borrowers associated with these risk profiles that are not
currently in default have limited financial flexibility. Cash
flows and capital levels range from acceptable to potentially
insufficient to meet current requirements, particularly in
adverse down cycle scenarios. As a result of these
characteristics, borrowers in this category exhibit an elevated
to probable likelihood of loss.
2 0 1 3 A N N U A L R E P O R T T O S H A R E H O L D E R S | N O R T H E R N T R U S T C O R P O R A T I O N 81

notes to consolidated financial statements
The following tables provide balances and delinquency status of performing and nonperforming loans and leases by segment
and class, as well as the other real estate owned and total nonperforming asset balances, as of December 31, 2013 and 2012.
(In Millions) CURRENT30 – 59 DAYS
PAST DUE60 – 89 DAYS
PAST DUE
90 DAYSOR MOREPAST DUE
TOTALPERFORMING NONPERFORMING
TOTAL LOANSAND LEASES
DECEMBER 31, 2013
CommercialCommercial and Institutional $ 7,332.3 $ 5.0 $12.1 $ 3.3 $ 7,352.7 $ 23.1 $ 7,375.8Commercial Real Estate 2,881.1 4.1 14.6 6.8 2,906.6 49.2 2,955.8Lease Financing, net 975.1 – – – 975.1 – 975.1Non-U.S. 954.7 – – – 954.7 – 954.7Other 358.6 – – – 358.6 – 358.6
Total Commercial 12,501.8 9.1 26.7 10.1 12,547.7 72.3 12,620.0
PersonalResidential Real Estate 9,934.4 129.3 15.6 2.9 10,082.2 189.1 10,271.3Private Client 6,404.2 29.1 7.5 3.4 6,444.2 1.4 6,445.6Other 48.6 – – – 48.6 – 48.6
Total Personal 16,387.2 158.4 23.1 6.3 16,575.0 190.5 16,765.5
Total Loans and Leases $28,889.0 $167.5 $49.8 $16.4 $29,122.7 $262.8 $29,385.5
Other Real Estate Owned $ 11.9
Total Nonperforming Assets $274.7
(In Millions) CURRENT30 – 59 DAYS
PAST DUE60 – 89 DAYS
PAST DUE
90 DAYSOR MOREPAST DUE
TOTALPERFORMING NONPERFORMING
TOTAL LOANSAND LEASES
DECEMBER 31, 2012
CommercialCommercial and Institutional $ 7,433.4 $ 6.4 $ 5.5 $ 1.6 $ 7,446.9 $ 21.6 $ 7,468.5Commercial Real Estate 2,782.0 6.9 13.1 1.4 2,803.4 56.4 2,859.8Lease Financing, net 1,035.0 – – – 1,035.0 – 1,035.0Non-U.S. 1,192.3 – – – 1,192.3 – 1,192.3Other 341.6 – – – 341.6 – 341.6
Total Commercial 12,784.3 13.3 18.6 3.0 12,819.2 78.0 12,897.2
PersonalResidential Real Estate 10,096.3 68.1 25.7 10.5 10,200.6 174.6 10,375.2Private Client 6,091.3 14.8 16.3 5.5 6,127.9 2.2 6,130.1Other 102.0 – – – 102.0 – 102.0
Total Personal 16,289.6 82.9 42.0 16.0 16,430.5 176.8 16,607.3
Total Loans and Leases $29,073.9 $96.2 $60.6 $19.0 $29,249.7 $254.8 $29,504.5
Other Real Estate Owned $ 20.3
Total Nonperforming Assets $275.1
2 0 1 3 A N N U A L R E P O R T T O S H A R E H O L D E R S | N O R T H E R N T R U S T C O R P O R A T I O N 82
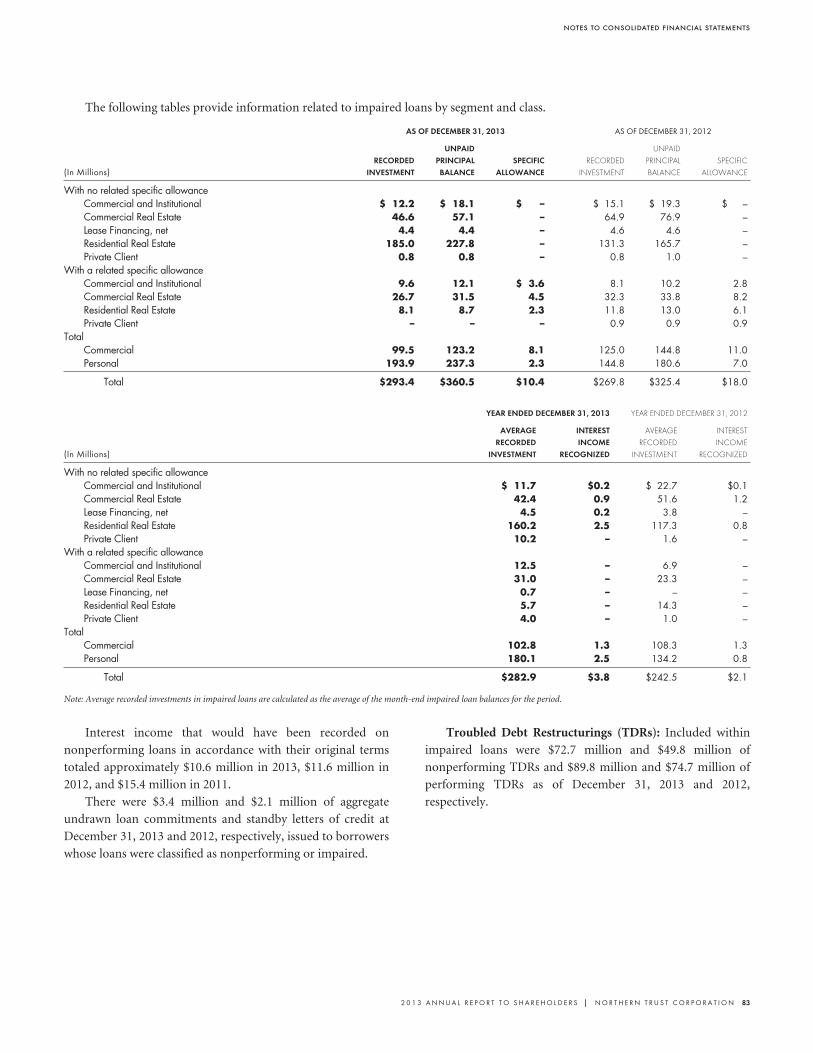
notes to consolidated financial statements
The following tables provide information related to impaired loans by segment and class.
AS OF DECEMBER 31, 2013 AS OF DECEMBER 31, 2012
(In Millions)RECORDED
INVESTMENT
UNPAIDPRINCIPALBALANCE
SPECIFICALLOWANCE
RECORDED
INVESTMENT
UNPAID
PRINCIPAL
BALANCE
SPECIFIC
ALLOWANCE
With no related specific allowanceCommercial and Institutional $ 12.2 $ 18.1 $ – $ 15.1 $ 19.3 $ –Commercial Real Estate 46.6 57.1 – 64.9 76.9 –Lease Financing, net 4.4 4.4 – 4.6 4.6 –Residential Real Estate 185.0 227.8 – 131.3 165.7 –Private Client 0.8 0.8 – 0.8 1.0 –
With a related specific allowanceCommercial and Institutional 9.6 12.1 $ 3.6 8.1 10.2 2.8Commercial Real Estate 26.7 31.5 4.5 32.3 33.8 8.2Residential Real Estate 8.1 8.7 2.3 11.8 13.0 6.1Private Client – – – 0.9 0.9 0.9
TotalCommercial 99.5 123.2 8.1 125.0 144.8 11.0Personal 193.9 237.3 2.3 144.8 180.6 7.0
Total $293.4 $360.5 $10.4 $269.8 $325.4 $18.0
YEAR ENDED DECEMBER 31, 2013 YEAR ENDED DECEMBER 31, 2012
(In Millions)
AVERAGERECORDED
INVESTMENT
INTERESTINCOME
RECOGNIZED
AVERAGE
RECORDED
INVESTMENT
INTEREST
INCOME
RECOGNIZED
With no related specific allowanceCommercial and Institutional $ 11.7 $0.2 $ 22.7 $0.1Commercial Real Estate 42.4 0.9 51.6 1.2Lease Financing, net 4.5 0.2 3.8 –Residential Real Estate 160.2 2.5 117.3 0.8Private Client 10.2 – 1.6 –
With a related specific allowanceCommercial and Institutional 12.5 – 6.9 –Commercial Real Estate 31.0 – 23.3 –Lease Financing, net 0.7 – – –Residential Real Estate 5.7 – 14.3 –Private Client 4.0 – 1.0 –
TotalCommercial 102.8 1.3 108.3 1.3Personal 180.1 2.5 134.2 0.8
Total $282.9 $3.8 $242.5 $2.1
Note: Average recorded investments in impaired loans are calculated as the average of the month-end impaired loan balances for the period.
Interest income that would have been recorded on
nonperforming loans in accordance with their original terms
totaled approximately $10.6 million in 2013, $11.6 million in
2012, and $15.4 million in 2011.
There were $3.4 million and $2.1 million of aggregate
undrawn loan commitments and standby letters of credit at
December 31, 2013 and 2012, respectively, issued to borrowers
whose loans were classified as nonperforming or impaired.
Troubled Debt Restructurings (TDRs): Included within
impaired loans were $72.7 million and $49.8 million of
nonperforming TDRs and $89.8 million and $74.7 million of
performing TDRs as of December 31, 2013 and 2012,
respectively.
2 0 1 3 A N N U A L R E P O R T T O S H A R E H O L D E R S | N O R T H E R N T R U S T C O R P O R A T I O N 83

notes to consolidated financial statements
The following tables provide, by segment and class, the
number of loans and leases modified in TDRs during the years
ended December 31, 2013 and 2012, and the recorded
investments and unpaid principal balances as of December 31,
2013 and 2012.
($ In Millions)
NUMBER OFLOANS AND
LEASESRECORDED
INVESTMENT
UNPAIDPRINCIPALBALANCE
December 31, 2013Commercial
Commercial and Institutional 14 $ 3.4 $ 4.7Commercial Real Estate 12 27.7 36.2
Total Commercial 26 31.1 40.9
PersonalResidential Real Estate 168 49.1 60.0Private Client 9 12.9 12.9
Total Personal 177 62.0 72.9
Total Loans and Leases 203 $93.1 $113.8
Note: Period end balances reflect all paydowns and charge-offs during the year.
($ In Millions)
NUMBER OF
LOANS AND
LEASES
RECORDED
INVESTMENT
UNPAID
PRINCIPAL
BALANCE
December 31, 2012Commercial
Commercial and Institutional 3 $ 0.6 $ 1.2Commercial Real Estate 13 36.6 39.2Lease Financing, net 1 4.7 4.7
Total Commercial 17 41.9 45.1
PersonalResidential Real Estate 116 15.9 22.0Private Client 1 0.8 0.8
Total Personal 117 16.7 22.8
Total Loans and Leases 134 $58.6 $67.9
Note: Period end balances reflect all paydowns and charge-offs during the year.
TDR modifications primarily involve interest rate
concessions, extensions of term, deferrals of principal, and
other modifications. Other modifications typically reflect
other nonstandard terms which Northern Trust would not
offer in non-troubled situations. During the year ended
December 31, 2013, TDR modifications of loans within the
commercial and institutional, commercial real estate and
private client classes were primarily deferrals of principal,
extensions of term and other modifications. During the year
ended December 31, 2013, TDR modifications of loans within
the residential real estate class were primarily deferrals of
principal, extensions of term, interest rate concessions and
other modifications. During the year ended December 31,
2012, TDR modifications of loans within the commercial and
institutional, commercial real estate, lease financing, and
private client classes were primarily extensions of term,
deferral of principal and other modifications; modifications of
residential real estate loans were primarily interest rate
concessions, extensions of term and deferrals of principal.
There were no loans or leases modified in troubled debt
restructurings during the previous 12 months which
subsequently became nonperforming during the year ended
December 31, 2013.
There were 3 residential real estate loans modified in
troubled debt restructurings during the previous 12 months
which subsequently became nonperforming during the year
ended December 31, 2012. The total recorded investment and
unpaid principal balance of these loans were $128.1 thousand
and $129.3 thousand, respectively.
All loans and leases modified in troubled debt
restructurings are evaluated for impairment. The nature and
extent of impairment of TDRs, including those which have
experienced a subsequent default, is considered in the
determination of an appropriate level of allowance for credit
losses.
Note 7 – Allowance for Credit Losses
The allowance for credit losses, which represents
management’s estimate of probable losses related to specific
borrower relationships and inherent in the various loan and
lease portfolios, undrawn commitments, and standby letters of
credit, is determined by management through a disciplined
credit review process. Northern Trust’s accounting policies
related to the estimation of the allowance for credit losses and
the charging off of loans, leases and other extensions of credit
deemed uncollectible are consistent across both loan and lease
segments.
In establishing the inherent portion of the allowance for
credit losses, Northern Trust’s Loan Loss Allowance
Committee assesses a common set of qualitative factors
applicable to both the commercial and personal loan
segments. The risk characteristics underlying these qualitative
factors, and management’s assessments as to the relative
importance of a qualitative factor, can vary between loan
segments and between classes within loan segments. Factors
evaluated include those related to external matters, such as
economic conditions and changes in collateral value, and
those related to internal matters, such as changes in asset
quality metrics and loan review activities. In addition to the
factors noted above, risk characteristics such as portfolio
delinquencies, percentage of portfolio on the watch list and on
nonperforming status, and average borrower ratings are
assessed in the determination of the inherent allowance.
2 0 1 3 A N N U A L R E P O R T T O S H A R E H O L D E R S | N O R T H E R N T R U S T C O R P O R A T I O N 84

notes to consolidated financial statements
Loan-to-value levels are considered for collateral-secured
loans and leases in both the personal and commercial
segments. Borrower debt service coverage is evaluated in the
personal segment, and cash flow coverage is analyzed in the
commercial segment.
Similar risk characteristics by type of exposure are
analyzed when determining the allowance for undrawn
commitments and standby letters of credit. These qualitative
factors, together with historical loss rates, serve as the basis for
the allowance for credit losses.
Loans, leases and other extensions of credit deemed
uncollectible are charged to the allowance for credit losses.
Subsequent recoveries, if any, are credited to the allowance.
Determinations as to whether an uncollectible loan is charged-
off or a specific allowance is established are based on
management’s assessment as to the level of certainty regarding
the amount of loss.
Changes in the allowance for credit losses by segment were
as follows:
2013 2012 2011
(In Millions) COMMERCIAL PERSONAL TOTAL COMMERCIAL PERSONAL TOTAL COMMERCIAL PERSONAL TOTAL
Balance at Beginning of Year $194.2 $133.4 $327.6 $211.0 $117.9 $328.9 $256.7 $100.6 $357.3Charge-Offs (16.7) (42.6) (59.3) (19.9) (43.1) (63.0) (56.3) (60.0) (116.3)Recoveries 8.6 11.0 19.6 20.3 16.4 36.7 21.5 11.4 32.9
Net (Charge-Offs) Recoveries (8.1) (31.6) (39.7) 0.4 (26.7) (26.3) (34.8) (48.6) (83.4)Provision for Credit Losses (18.1) 38.1 20.0 (17.2) 42.2 25.0 (10.9) 65.9 55.0Effect of Foreign Exchange Rates – – – – – – – – –
Balance at End of Year $168.0 $139.9 $307.9 $194.2 $133.4 $327.6 $211.0 $117.9 $328.9
Allowance for Credit Losses Assigned to:Loans and Leases $140.9 $137.2 $278.1 $166.1 $131.8 $297.9 $178.6 $116.2 $294.8Undrawn Commitments and Standby
Letters of Credit 27.1 2.7 29.8 28.1 1.6 29.7 32.4 1.7 34.1
Total Allowance for Credit Losses $168.0 $139.9 $307.9 $194.2 $133.4 $327.6 $211.0 $117.9 $328.9
The following tables provide information regarding the recorded investments in loans and leases and the allowance for credit
losses by segment as of December 31, 2013 and 2012.
(In Millions) COMMERCIAL PERSONAL TOTAL
DECEMBER 31, 2013Loans and Leases
Specifically Evaluated forImpairment $ 99.5 $ 193.9 $ 293.4
Evaluated for InherentImpairment 12,520.5 16,571.6 29,092.1
Total Loans and Leases 12,620.0 16,765.5 29,385.5Allowance for Credit Losses on
Credit ExposuresSpecifically Evaluated for
Impairment 8.1 2.3 10.4Evaluated for Inherent
Impairment 132.8 134.9 267.7
Allowance assigned to loans andleases 140.9 137.2 278.1
Allowance for UndrawnExposuresCommitments and Standby
Letters of Credit 27.1 2.7 29.8
Total Allowance for Credit Losses $ 168.0 $ 139.9 $ 307.9
(In Millions) COMMERCIAL PERSONAL TOTAL
DECEMBER 31, 2012
Loans and LeasesSpecifically Evaluated for
Impairment $ 125.0 $ 144.8 $ 269.8Evaluated for Inherent
Impairment 12,772.2 16,462.5 29,234.7
Total Loans and Leases 12,897.2 16,607.3 29,504.5Allowance for Credit Losses on
Credit ExposuresSpecifically Evaluated for
Impairment 11.0 7.0 18.0Evaluated for Inherent
Impairment 155.1 124.8 279.9
Allowance assigned to loans andleases 166.1 131.8 297.9
Allowance for UndrawnExposuresCommitments and Standby
Letters of Credit 28.1 1.6 29.7
Total Allowance for Credit Losses $ 194.2 $ 133.4 $ 327.6
2 0 1 3 A N N U A L R E P O R T T O S H A R E H O L D E R S | N O R T H E R N T R U S T C O R P O R A T I O N 85

notes to consolidated financial statements
Note 8 – Concentrations of Credit Risk
Concentrations of credit risk exist if a number of borrowers or
other counterparties are engaged in similar activities and have
similar economic characteristics that would cause their ability
to meet contractual obligations to be similarly affected by
changes in economic or other conditions. The fact that a
credit exposure falls into one of these groups does not
necessarily indicate that the credit has a higher than normal
degree of credit risk. These groups are: banks and bank
holding companies, residential real estate, and commercial
real estate.
Banks and Bank Holding Companies. On-balance sheet
credit risk to banks and bank holding companies, both U.S. and
non-U.S., consists primarily of interest bearing deposits with
banks, federal funds sold, and securities purchased under
agreements to resell, which totaled $19.9 billion and $18.9 billion
at December 31, 2013 and 2012, respectively, and noninterest-
bearing demand balances maintained at correspondent banks,
which totaled $3.0 billion and $3.7 billion at December 31, 2013
and 2012, respectively. Credit risk associated with U.S. and non-
U.S. banks and bank holding companies deemed to be
counterparties by Credit Policy is managed by the Counterparty
Risk Management Committee. Credit risk associated with other
U.S. banks and bank holding companies that maintain
commercial credit relationships with Northern Trust is managed
by the relevant Credit Approval Committee and/or the Senior
Credit Committee. Credit limits are established through a review
process that includes an internally prepared financial analysis,
use of an internal risk rating system and consideration of
external ratings from rating agencies. Northern Trust places
deposits with banks that have strong internal and external credit
ratings and the average life to maturity of deposits with banks is
maintained on a short-term basis in order to respond quickly to
changing credit conditions.
Residential Real Estate. At December 31, 2013, residential
real estate loans totaled $10.3 billion, or 36% of total U.S. loans
at December 31, 2013, compared with $10.4 billion or 37% at
December 31, 2012. Residential real estate loans consist of
conventional home mortgages and equity credit lines, which
generally require a loan to collateral value of no more than
65% to 80% at inception. Revaluations of supporting collateral
are obtained upon refinancing or default or when otherwise
considered warranted. Collateral revaluations for mortgages
are performed by independent third parties. Of the total $10.3
billion in residential real estate loans, $3.1 billion were in the
greater Chicago area, $2.5 billion were in Florida, and $1.6
billion were in California, with the remainder distributed
throughout the other geographic regions within the U.S. served
by Northern Trust. Legally binding undrawn commitments to
extend residential real estate credit, which are primarily equity
credit lines, totaled $1.7 billion and $1.2 billion at
December 31, 2013 and 2012, respectively.
Commercial Real Estate. The commercial real estate
portfolio consists of commercial mortgages and construction,
acquisition and development loans extended primarily to
highly experienced developers and/or investors well known to
Northern Trust. Underwriting standards generally reflect
conservative loan-to-value ratios and debt service coverage
requirements. Recourse to borrowers through guarantees is
also commonly required. Commercial mortgage financing is
provided for the acquisition or refinancing of income
producing properties. Cash flows from the properties
generally are sufficient to amortize the loan. These loans
average approximately $1.8 million each and are primarily
located in the Illinois, Florida, California, Texas and Arizona
markets. Construction, acquisition and development loans
provide financing for commercial real estate prior to rental
income stabilization. The intent is generally that the borrower
will sell the project or refinance the loan through a
commercial mortgage with Northern Trust or another
financial institution upon completion.
The table below provides additional detail regarding
commercial real estate loan types:
(In Millions) 2013 2012
Commercial MortgagesApartment/ Multi-family $ 616.2 $ 652.9Office 686.0 621.4Retail 768.0 614.5Industrial/ Warehouse 318.6 312.5Other 110.6 148.7
Total Commercial Mortgages 2,499.4 2,350.0Construction, Acquisition and Development
Loans 254.2 289.4Single Family Investment 110.0 135.0Other Commercial Real Estate Related 92.2 85.4
Total Commercial Real Estate Loans $2,955.8 $2,859.8
2 0 1 3 A N N U A L R E P O R T T O S H A R E H O L D E R S | N O R T H E R N T R U S T C O R P O R A T I O N 86

notes to consolidated financial statements
Note 9 – Buildings and Equipment
A summary of buildings and equipment is presented below.
DECEMBER 31, 2013
(In Millions)ORIGINAL
COSTACCUMULATEDDEPRECIATION
NET BOOKVALUE
Land and Improvements $ 27.1 $ 0.6 $ 26.5Buildings 255.6 134.1 121.5Equipment 488.7 320.8 167.9Leasehold Improvements 323.4 213.3 110.1Buildings Leased under Capital
Leases 82.5 49.7 32.8
Total Buildings and Equipment $1,177.3 $718.5 $458.8
The charge for depreciation, which includes depreciation of
assets recorded under capital leases and is included within
occupancy expense in the consolidated statement of income,
amounted to $92.3 million in 2013, $88.3 million in 2012, and
$89.2 million in 2011.
Note 10 – Lease Commitments
At December 31, 2013, Northern Trust was obligated under a
number of non-cancelable operating leases for buildings and
equipment. Certain leases contain rent escalation clauses
based on market indices or increases in real estate taxes and
other operating expenses and renewal option clauses calling
for increased rentals. There are no restrictions imposed by any
lease agreement regarding the payment of dividends, debt
financing or Northern Trust entering into further lease
agreements. Minimum annual lease commitments as of
December 31, 2013 for all non-cancelable operating leases
with a term of 1 year or more are as follows:
(In Millions)FUTURE MINIMUM
LEASE PAYMENTS
2014 $ 82.22015 75.82016 70.42017 68.82018 66.3Later Years 346.8
Total Minimum Lease Payments 710.3Less: Sublease Rentals (26.5)
Net Minimum Lease Payments $683.8
Operating lease rental expense, net of rental income, is
recorded in occupancy expense and amounted to $76.2
million in 2013, $77.9 million in 2012, and $84.2 million in
2011.
One of the buildings and related land utilized for Chicago
operations has been leased under an agreement that qualifies
as a capital lease. The original long-term financing for the
property was provided by Northern Trust. In the event of sale
or refinancing, Northern Trust would anticipate receiving full
repayment of any outstanding loans plus 42% of any proceeds
in excess of the original project costs.
The following table reflects the future minimum lease
payments required under capital leases, net of any payments
received on the long-term financing, and the present value of
net capital lease obligations at December 31, 2013.
(In Millions)FUTURE MINIMUM
LEASE PAYMENTS, NET
2014 $ 8.42015 8.32016 8.02017 8.22018 8.4Later Years 7.0
Total Minimum Lease Payments, net 48.3Less: Amount Representing Interest 11.4
Net Present Value under Capital Lease Obligations $36.9
Note 11 – Goodwill and Other Intangibles
Goodwill. Changes by business unit in the carrying
amount of goodwill for the years ended December 31, 2013
and 2012, including the effect of foreign exchange rates on
non-U.S. dollar denominated balances, were as follows:
(In Millions)
CORPORATE &
INSTITUTIONAL
SERVICES
WEALTH
MANAGEMENT TOTAL
Balance at December 31, 2011 $ 460.6 $ 71.4 $ 532.0Foreign Exchange Rates 5.7 0.1 5.8
Balance at December 31, 2012 $ 466.3 $ 71.5 $ 537.8Foreign Exchange Rates 2.9 – 2.9
Balance at December 31, 2013 $469.2 $71.5 $540.7
Other Intangible Assets Subject to Amortization. The
gross carrying amount and accumulated amortization of other
intangible assets subject to amortization as of December 31,
2013 and 2012 were as follows.
DECEMBER 31,
(In Millions) 2013 2012
Gross Carrying Amount $198.2 $252.1Accumulated Amortization 115.2 148.1
Net Book Value $ 83.0 $104.0
2 0 1 3 A N N U A L R E P O R T T O S H A R E H O L D E R S | N O R T H E R N T R U S T C O R P O R A T I O N 87

notes to consolidated financial statements
Other intangible assets consist primarily of the value of
acquired client relationships and are included within other
assets in the consolidated balance sheet. Amortization expense
related to other intangible assets was $21.1 million, $20.3
million, and $17.5 million for the years ended December 31,
2013, 2012, and 2011, respectively. Amortization for the years
2014, 2015, 2016, 2017, and 2018 is estimated to be $19.7
million, $11.9 million, $9.3 million, $9.3 million, and $8.6
million, respectively.
Note 12 – Senior Notes and Long-Term Debt
Senior Notes. A summary of senior notes outstanding at
December 31 is presented below.
($ In Millions) RATE 2013 2012
Corporation-Senior Notes(1)(4)
Fixed Rate Due Aug. 2013(5)(11) 5.50 $ – $ 409.6Fixed Rate Due May 2014 4.63 500.0 500.0Fixed Rate Due Nov. 2020(6) 3.45 499.5 499.5Fixed Rate Due Aug. 2021(7) 3.38 498.3 498.1Fixed Rate Due Aug. 2022(8) 2.38 498.8 498.6
Total Senior Notes $1,996.6 $2,405.8
Long-Term Debt. A summary of long-term debt
outstanding at December 31 is presented below.
($ In Millions) 2013 2012
Bank-Subordinated Debt(1)(4)
4.60% Notes due Feb. 2013(2) $ – $ 200.05.85% Notes due Nov. 2017(2)(12) 216.3 240.86.50% Notes due Aug. 2018(2)(9)(12) 323.6 362.35.375% Sterling Denominated Notes due
March 2015(10) 248.3 242.3
Total Bank-Subordinated Debt 788.2 1,045.4Corporation-Subordinated 3.95% Notes due
Oct. 2025(1)(4)(11) 749.1 –Federal Home Loan Bank Borrowings
One Year or Less (Average Rate at Year End– 4.40% in 2013; 3.86% in 2012) 135.0 200.0
One to Three Years (Average Rate at YearEnd – 4.40% in 2012) – 135.0
Total Federal Home Loan Bank Borrowings 135.0 335.0Capital Lease Obligations(3) 36.9 41.2
Total Long-Term Debt $1,709.2 $1,421.6
Long-Term Debt Qualifying as Risk-Based Capital $1,158.7 $ 556.7
(1) Not redeemable prior to maturity.(2) Under the terms of its current Offering Circular dated November 6, 2013, the Bank has theability to offer from time to time its senior bank notes in an aggregate principal amount of upto $4.5 billion at any one time outstanding and up to an additional $1.0 billion ofsubordinated notes. Each senior note will mature from 30 days to fifteen years, and eachsubordinated note will mature from five years to fifteen years, following its date of originalissuance. Each note will mature on such date as selected by the initial purchaser and agreed toby the Bank.
(3) Refer to Note 10.(4) Debt issue costs are recorded as an asset and amortized on a straight-line basis over thelife of the Note.(5) Notes issued at a discount of 0.09%.(6) Notes issued at a discount of 0.117%.(7) Notes issued at a discount of 0.437%(8) Notes issued at a discount of 0.283%(9) Notes issued at a discount of 0.02%(10) Notes issued at a discount of 0.484%(11) Notes issued at a discount of 0.114%(12) Interest rate swap contracts were entered into to modify the interest expense on thesesenior and subordinated notes from fixed rates to floating rates. The swaps are recorded asfair value hedges and at December 31, 2013, increases in the carrying values of the seniorand subordinated notes outstanding of none and $40.1 million, respectively, were recorded.As of December 31, 2012, increases in the carrying values of senior and subordinated notesoutstanding of $9.8 million and $103.3 million, respectively, were recorded.
Note 13 – Floating Rate Capital Debt
In January 1997, the Corporation issued $150 million of
Floating Rate Capital Securities, Series A, through a statutory
business trust wholly-owned by the Corporation (“NTC
Capital I”). In April 1997, the Corporation also issued,
through a separate wholly-owned statutory business trust
(“NTC Capital II”), $120 million of Floating Rate Capital
Securities, Series B. The sole assets of the trusts are
Subordinated Debentures of Northern Trust Corporation that
have the same interest rates and maturity dates as the
corresponding distribution rates and redemption dates of the
Floating Rate Capital Securities. The Series A Securities were
issued at a discount to yield 60.5 basis points above the three-
month London Interbank Offered Rate (LIBOR) and are due
January 15, 2027. The Series B Securities were issued at a
discount to yield 67.9 basis points above the three-month
LIBOR and are due April 15, 2027. Both Series A and B
Securities currently qualify as tier 1 capital for regulatory
purposes. Under the provisions of The Dodd-Frank Wall
Street Reform and Consumer Protection Act, the tier 1
regulatory capital treatment of these securities is required to
be phased out over a three-year period that began on
January 1, 2013. The phase-out of tier 1 capital treatment as
determined by bank regulators is 50% in 2014, 75% in 2015
and 100% thereafter. As these securities phase out of tier 1
capital, they will be eligible for inclusion in tier 2 capital,
beginning with 80% eligibility in 2014, and thereafter will
phase out of tier 2 at an incremental 10% a year until they are
fully phased out in 2022.
The Corporation has fully, irrevocably and
unconditionally guaranteed all payments due on the Series A
and B Securities. The holders of the Series A and B Securities
are entitled to receive preferential cumulative cash
distributions quarterly in arrears (based on the liquidation
amount of $1,000 per Security) at an interest rate equal to the
rate on the corresponding Subordinated Debentures. The
interest rate on the Series A and Series B securities is equal to
2 0 1 3 A N N U A L R E P O R T T O S H A R E H O L D E R S | N O R T H E R N T R U S T C O R P O R A T I O N 88
notes to consolidated financial statements
three-month LIBOR plus 0.52% and 0.59%, respectively.
Subject to certain exceptions, the Corporation has the right to
defer payment of interest on the Subordinated Debentures at
any time or from time to time for a period not exceeding 20
consecutive quarterly periods provided that no extension
period may extend beyond the stated maturity date. If interest
is deferred on the Subordinated Debentures, distributions on
the Series A and B Securities will also be deferred and the
Corporation will not be permitted, subject to certain
exceptions, to pay or declare any cash distributions with
respect to the Corporation’s capital stock or debt securities
that rank the same as or junior to the Subordinated
Debentures, until all past due distributions are paid. The
Subordinated Debentures are unsecured and subordinated to
substantially all of the Corporation’s existing indebtedness.
The Corporation has the right to redeem the Series A and
Series B Subordinated Debentures, in whole or in part, at a
price equal to the principal amount plus accrued and unpaid
interest. The following table summarizes the book values of
the outstanding Subordinated Debentures as of December 31,
2013 and 2012:
DECEMBER 31,
(In Millions) 2013 2012
NTC Capital I Subordinated Debentures dueJanuary 15, 2027 $154.0 $153.9
NTC Capital II Subordinated Debentures dueApril 15, 2027 123.1 123.1
Total Subordinated Debentures $277.1 $277.0
Note 14 – Stockholders’ Equity
Preferred Stock. The Corporation is authorized to issue
10.0 million shares of preferred stock without par value. The
Corporation’s board of directors (Board) is authorized to fix
the particular preferences, rights, qualifications and
restrictions for each series of preferred stock issued. There was
no preferred stock outstanding at December 31, 2013 or 2012.
Common Stock. The Corporation’s current common
stock repurchase authorization was approved by the Board in
April of 2013. The stock repurchase authorization remaining
after December 31, 2013 is 7.9 million shares. The
repurchased shares would be used for general purposes of the
Corporation, including management of the Corporation’s
capital level and the issuance of shares under stock option and
other incentive plans of the Corporation.
Under the Corporation’s capital plan submitted in
January 2013, which was reviewed without objection by the
Federal Reserve in March 2013, the Corporation may
repurchase up to $164.5 million of common stock after
December 31, 2013 through March 2014. In January 2014, the
Corporation submitted its most recent capital plan to the
Federal Reserve Board.
The average price paid per share for common stock
repurchased in 2013, 2012, and 2011 was $55.90, $46.32, and
$49.63, respectively.
An analysis of changes in the number of shares of
common stock outstanding follows:
2013 2012 2011
Balance atJanuary 1 238,914,988 241,008,509 242,268,903
Incentive Plan andAwards 863,958 449,463 189,793
Stock OptionsExercised 3,088,490 973,270 149,385
Treasury StockPurchased (5,545,401) (3,516,254) (1,599,572)
Balance atDecember 31 237,322,035 238,914,988 241,008,509
2 0 1 3 A N N U A L R E P O R T T O S H A R E H O L D E R S | N O R T H E R N T R U S T C O R P O R A T I O N 89

notes to consolidated financial statements
Note 15 – Accumulated Other Comprehensive Income (Loss)
The following tables summarize the components of accumulated other comprehensive income (loss) at December 31, 2013, 2012,
and 2011, and changes during the years then ended.
(In Millions)
BALANCE ATDECEMBER 31,
2013NET
CHANGE
BALANCE AT
DECEMBER 31,
2012
NET
CHANGE
BALANCE AT
DECEMBER 31,
2011
NET
CHANGE
BALANCE AT
DECEMBER 31,
2010
Net Unrealized Gains (Losses) on SecuritiesAvailable for Sale $ 6.0 $ (95.0) $ 101.0 $ 61.2 $ 39.8 $ 53.3 $ (13.5)
Net Unrealized Gains (Losses) on Cash FlowHedges 2.9 4.3 (1.4) 5.6 (7.0) (18.4) 11.4
Net Foreign Currency Adjustments 7.1 (3.4) 10.5 20.0 (9.5) (2.5) (7.0)Net Pension and Other Postretirement Benefit
Adjustments (260.3) 132.8 (393.1) (24.2) (368.9) (72.7) (296.2)
Total $(244.3) $ 38.7 $(283.0) $ 62.6 $(345.6) $(40.3) $(305.3)
YEAR ENDED DECEMBER 31,
2013 2012 2011
(In Millions)BEFORE
TAXTAX
EFFECTAFTER
TAXBEFORE
TAX
TAX
EFFECT
AFTER
TAX
BEFORE
TAX
TAX
EFFECT
AFTER
TAX
Unrealized Gains (Losses) on SecuritiesAvailable for SaleNoncredit-Related Unrealized Losses
on Securities OTTI $ 3.0 $ (1.1) $ 1.9 $ 15.7 $ (5.9) $ 9.8 $ 10.2 $ (3.6) $ 6.6Other Unrealized Gains (Losses) on
Securities Available for Sale (156.8) 59.0 (97.8) 96.2 (36.1) 60.1 61.6 (23.4) 38.2Reclassification Adjustment for
(Gains) Losses Included in NetIncome 1.6 (0.7) 0.9 (13.9) 5.2 (8.7) 13.5 (5.0) 8.5
Net Change $(152.2) $ 57.2 $ (95.0) $ 98.0 $(36.8) $ 61.2 $ 85.3 $(32.0) $ 53.3Unrealized Gains (Losses) on Cash Flow
HedgesUnrealized Gains (Losses) on Cash
Flow Hedges $ 2.1 $ (0.7) $ 1.4 $ 3.2 $ (0.6) $ 2.6 $ (23.6) $ 8.8 $(14.8)Reclassification Adjustment for
(Gains) Losses Included in NetIncome 4.7 (1.8) 2.9 4.8 (1.8) 3.0 (5.6) 2.0 (3.6)
Net Change $ 6.8 $ (2.5) $ 4.3 $ 8.0 $ (2.4) $ 5.6 $ (29.2) $ 10.8 $(18.4)Foreign Currency Adjustments
Foreign Currency TranslationAdjustments $ 91.9 $(29.7) $ 62.2 $ 37.9 $ 3.1 $ 41.0 $ (7.0) $ – $ (7.0)
Net Investment Hedge Gain (Losses) (107.3) 41.7 (65.6) (33.7) 12.7 (21.0) 25.7 (21.2) 4.5
Net Change $ (15.4) $ 12.0 $ (3.4) $ 4.2 $ 15.8 $ 20.0 $ 18.7 $(21.2) $ (2.5)Pension and Other Postretirement Benefit
AdjustmentsNet Actuarial Gain (Loss) $ 157.7 $(54.9) $102.8 $(62.8) $ 15.8 $(47.0) $(158.2) $ 61.3 $(96.9)Prior Service Benefit – – – – – – 7.7 (2.9) 4.8Reclassification Adjustment for Losses
Included in Net Income 46.1 (16.1) 30.0 33.9 (11.1) 22.8 30.2 (10.8) 19.4
Net Change $ 203.8 $(71.0) $132.8 $(28.9) $ 4.7 $(24.2) $(120.3) $ 47.6 $(72.7)
2 0 1 3 A N N U A L R E P O R T T O S H A R E H O L D E R S | N O R T H E R N T R U S T C O R P O R A T I O N 90

notes to consolidated financial statements
The following table provides the location and before-tax amounts of reclassifications out of accumulated other comprehensive
income (loss) during the years ended December 31, 2013, 2012 and 2011.
(In Millions)
LOCATION OF
RECLASSIFICATION ADJUSTMENTS
RECOGNIZED IN INCOME
AMOUNT OF RECLASSIFICATION
ADJUSTMENTS RECOGNIZED
IN INCOME
YEAR ENDED DECEMBER 31,
2013 2012 2011
Securities Available for SaleRealized (Gains) Losses on Securities Available for Sale Investment Security Gains (Losses), net $ 1.6 $(13.9) $13.5
Realized (Gains) Losses on Cash Flow HedgesForeign Exchange Contracts Other Operating Income/ Expense 4.7 4.8 (5.6)
Pension and Other Postretirement Benefit AdjustmentsAmortization of Net Actuarial (Gain) Loss Employee Benefits 49.0 38.8 33.4Amortization of Prior Service Cost Employee Benefits (2.9) (4.9) (3.2)
Gross Reclassification Adjustment $46.1 $ 33.9 $30.2
Note 16 – Net Income Per Common Share
The computations of net income per common share are presented below.
($ In Millions Except Per Common Share Information) 2013 2012 2011
BASIC NET INCOME PER COMMON SHAREAverage Number of Common Shares Outstanding 239,265,313 240,417,805 241,401,310Net Income Applicable to Common Stock $ 731.3 $ 687.3 $ 603.6Less: Earnings Allocated to Participating Securities 11.9 10.0 7.1
Earnings Allocated to Common Shares Outstanding 719.4 677.3 596.5Basic Net Income Per Common Share 3.01 2.82 2.47
DILUTED NET INCOME PER COMMON SHAREAverage Number of Common Shares Outstanding 239,265,313 240,417,805 241,401,310Plus Dilutive Effect of Share-based Compensation 1,289,527 463,439 410,074
Average Common and Potential Common Shares 240,554,840 240,881,244 241,811,384
Earnings Allocated to Common and Potential Common Shares $ 719.5 $ 677.3 $ 596.5Diluted Net Income Per Common Share 2.99 2.81 2.47
Note: Common stock equivalents totaling 3,498,894, 12,158,601, and 13,240,787 for the years ended December 31, 2013, 2012, and 2011, respectively, were not included in the computation ofdiluted net income per common share because their inclusion would have been antidilutive.
Note 17 – Net Interest Income
The components of net interest income were as follows:
(In Millions) 2013 2012 2011
Interest IncomeLoans and Leases $ 743.1 $ 828.6 $ 938.7Securities – Taxable 237.2 250.6 223.6
– Non-Taxable 11.6 17.7 25.0Interest-Bearing Deposits with Banks 142.1 176.4 192.8Federal Reserve Deposits and Other 21.5 14.4 28.5
Total Interest Income $1,155.5 $1,287.7 $1,408.6
Interest ExpenseDeposits $ 103.3 $ 156.7 $ 230.0Federal Funds Purchased 1.5 1.2 1.9Securities Sold under Agreements to Repurchase 0.4 0.4 0.7Other Borrowings 3.3 4.0 5.5Senior Notes 74.4 72.0 64.4Long-Term Debt 37.1 60.3 94.6Floating Rate Capital Debt 2.4 2.8 2.4
Total Interest Expense $ 222.4 $ 297.4 $ 399.5
Net Interest Income $ 933.1 $ 990.3 $1,009.1
2 0 1 3 A N N U A L R E P O R T T O S H A R E H O L D E R S | N O R T H E R N T R U S T C O R P O R A T I O N 91

notes to consolidated financial statements
Note 18 – Other Operating Income
The components of other operating income were as follows:
(In Millions) 2013 2012 2011
Loan Service Fees $ 61.9 $ 64.5 $ 68.9Banking Service Fees 50.9 55.0 54.9Other Income 53.7 35.4 34.3
Total Other Operating Income $166.5 $154.9 $158.1
Note 19 – Other Operating Expense
The components of other operating expense were as follows:
(In Millions) 2013 2012 2011
Business Promotion $ 91.6 $ 87.8 $ 82.1FDIC Insurance Premiums 23.5 25.4 29.3Staff Related 39.1 41.9 37.6Other Intangibles Amortization 21.1 20.3 17.5Legal Settlement Charge 19.2 – –Other Expenses 119.7 107.5 100.6
Total Other Operating Expense $314.2 $282.9 $267.1
Note 20 – Income Taxes
The following table reconciles the total provision for income
taxes recorded in the consolidated statement of income with
the amounts computed at the statutory federal tax rate
of 35%.
(In Millions) 2013 2012 2011
Tax at Statutory Rate $376.4 $347.3 $309.3Tax Exempt Income (6.2) (8.0) (9.9)Leveraged Lease Adjustments (2.3) (12.0) (4.7)Foreign Tax Rate Differential (27.6) (27.1) (21.3)State Taxes, net 26.3 20.4 22.8Other (22.4) (15.6) (16.1)
Provision for Income Taxes $344.2 $305.0 $280.1
The Corporation files income tax returns in the U.S.
federal, various state, and foreign jurisdictions. The
Corporation is no longer subject to income tax examinations
by U.S. federal tax authorities for years before 2009, or non-
U.S. tax authorities for years before 2007. The Corporation is
no longer subject to income tax examinations by state or local
tax authorities for years before 2007.
Included in other liabilities within the consolidated
balance sheet at December 31, 2013 and 2012 were $15.6
million and $19.4 million of unrecognized tax benefits,
respectively. If recognized, 2013 and 2012 net income would
have increased by $12.6 million and $16.3 million,
respectively, resulting in a decrease of those years’ effective
income tax rates. A reconciliation of the beginning and ending
amount of unrecognized tax benefits is as follows:
(In Millions) 2013 2012
Balance at January 1 $19.4 $17.8Additions for Tax Positions Taken in Prior Years 2.4 4.6Reductions for Tax Positions Taken in Prior Years (4.4) (1.2)Reductions Resulting from Expiration of Statutes (1.8) (1.8)
Balance at December 31 $15.6 $19.4
Unrecognized tax benefits had net decreases of $3.8
million, resulting in a remaining balance of $15.6 million at
December 31, 2013, compared to net increases of $1.6 million
resulting in a remaining balance of $19.4 million at
December 31, 2012. It is possible that changes in the amount
of unrecognized tax benefits could occur in the next 12
months due to changes in judgment related to recognition or
measurement, settlements with taxing authorities, or
expiration of statute of limitations. Management does not
believe that future changes, if any, would have a material effect
on the consolidated financial position or liquidity of Northern
Trust, although they could have a material effect on operating
results for a particular period.
The provision for income tax in 2012 included a $12.4
million tax benefit in connection with the resolution of certain
leveraged lease related matters.
A benefit for recoveries of interest and penalties of $1.7
million, net of tax, was included in the provision for income
taxes for the year ended December 31, 2013. This compares to
a provision for interest and penalties of $0.4 million, net of
tax, for the year ended December 31, 2012. As of
December 31, 2013 and 2012, the liability for the potential
payment of interest and penalties totaled $11.0 million and
$9.0 million, net of tax, respectively.
2 0 1 3 A N N U A L R E P O R T T O S H A R E H O L D E R S | N O R T H E R N T R U S T C O R P O R A T I O N 92

notes to consolidated financial statements
Pre-tax earnings of non-U.S. subsidiaries are subject to
U.S. taxation when effectively repatriated. Northern Trust
provides income taxes on the undistributed earnings of non-
U.S. subsidiaries, except to the extent that those earnings are
indefinitely reinvested outside the U.S. Northern Trust elected
to indefinitely reinvest $141.0 million, $137.4 million, and
$105.9 million of 2013, 2012, and 2011 earnings, respectively,
of certain non-U.S. subsidiaries and, therefore, no U.S.
deferred income taxes were recorded on those earnings. As of
December 31, 2013, the cumulative amount of undistributed
pre-tax earnings in these subsidiaries approximately $956.0
million. Based on the current U.S. federal income tax rate, an
additional deferred tax liability of approximately $212.0
million would have been required as of December 31, 2013 if
Northern Trust had not elected to indefinitely reinvest those
earnings.
The components of the consolidated provision for income
taxes for each of the three years ended December 31 are as
follows:
(In Millions) 2013 2012 2011
Current Tax Provision:Federal $185.6 $140.5 $113.6State 24.6 21.4 15.1Non-U.S. 67.4 63.4 54.2
Total 277.6 $225.3 $182.9
Deferred Tax Provision:Federal 53.9 $ 66.0 $ 84.0State 14.1 10.6 11.3Non-U.S. (1.4) 3.1 1.9
Total 66.6 79.7 97.2
Provision for Income Taxes $344.2 $305.0 $280.1
In addition to the amounts shown above, tax charges
(benefits) have been recorded directly to stockholders’ equity
for the following items:
(In Millions) 2013 2012 2011
Current Tax Benefit for EmployeeStock Options and Other Stock-Based Plans $3.0 $ 2.3 $ 0.6
Tax Effect of Other ComprehensiveIncome 4.3 18.7 (5.2)
Deferred taxes result from temporary differences between
the amounts reported in the consolidated financial statements
and the tax bases of assets and liabilities. Deferred tax
liabilities and assets have been computed as follows:
DECEMBER 31,
(In Millions) 2013 2012 2011
Deferred Tax Liabilities:Lease Financing $392.0 $409.1 $398.2Software Development 299.0 277.8 254.9Accumulated Depreciation 22.0 19.7 48.6Compensation and Benefits 112.2 29.7 7.1State Taxes, net 63.3 54.7 52.4Other Liabilities 104.0 170.9 137.6
Gross Deferred Tax Liabilities 992.5 961.9 898.8
Deferred Tax Assets:Allowance for Credit Losses 107.8 114.7 114.5Other Assets 81.1 114.5 150.0
Gross Deferred Tax Assets 188.9 229.2 264.5
Valuation Reserve – – –Deferred Tax Assets, net of Valuation
Reserve 188.9 229.2 264.5
Net Deferred Tax Liabilities $803.6 $732.7 $634.3
No valuation allowance related to deferred tax assets was
recorded at December 31, 2013, 2012, or 2011, as
management believes it is more likely that not that the
deferred tax assets will be fully realized. At December 31, 2013,
Northern Trust had no net operating loss carryforwards.
Note 21 – Employee Benefits
The Corporation and certain of its subsidiaries provide
various benefit programs, including defined benefit pension,
postretirement health care, and defined contribution plans. A
description of each major plan and related disclosures are
provided below.
Pension. A noncontributory qualified defined benefit
pension plan covers substantially all U.S. employees of
Northern Trust. Employees of various European subsidiaries
retain benefits in local defined benefit plans, although those
plans are closed to new participants and to future benefit
accruals.
2 0 1 3 A N N U A L R E P O R T T O S H A R E H O L D E R S | N O R T H E R N T R U S T C O R P O R A T I O N 93

notes to consolidated financial statements
Northern Trust also maintains a noncontributory
supplemental pension plan for participants whose retirement
benefit payments under the U.S. plan are expected to exceed
the limits imposed by federal tax law. Northern Trust has a
nonqualified trust, referred to as a “Rabbi” Trust, used to hold
assets designated for the funding of benefits in excess of those
permitted in certain of its qualified retirement plans. This
arrangement offers participants a degree of assurance for
payment of benefits in excess of those permitted in the related
qualified plans. As the “Rabbi” Trust assets remain subject to
the claims of creditors and are not the property of the
employees, they are accounted for as corporate assets and are
included in other assets in the consolidated balance sheet.
Total assets in the “Rabbi” Trust related to the nonqualified
pension plan at December 31, 2013 and 2012 amounted to
$85.1 million and $81.9 million, respectively. Contributions of
$16.4 million and $12.3 million were made to the “Rabbi”
Trust in 2013 and 2012, respectively.
Benefit levels under the U.S. qualified and supplemental
plans have been modified by Plan Amendments effective
April 1, 2012. U.S. qualified and supplemental plan expense in
2013 and 2012 reflect the modified benefit levels, as will future
periods.
The following tables set forth the status, amounts included
in AOCI, and net periodic pension expense of the U.S. plan,
non-U.S. plans, and supplemental plan for 2013, 2012, and
2011. Prior service costs are being amortized on a straight-line
basis over 11 years for the U.S. plan and 9 years for the
supplemental plan.
PLAN STATUSU.S. PLAN NON-U.S. PLANS SUPPLEMENTAL PLAN
($ In Millions) 2013 2012 2013 2012 2013 2012
Accumulated Benefit Obligation $ 827.9 $ 918.0 $164.7 $158.1 $ 89.8 $ 98.9
Projected Benefit Obligation 919.7 1,030.4 164.7 158.1 101.5 106.4Plan Assets at Fair Value 1,342.1 1,277.7 148.5 133.9 – –
Funded Status at December 31 $ 422.4 $ 247.3 $ (16.2) $ (24.2) $(101.5) $(106.4)
Weighted-Average Assumptions:Discount Rates 5.00% 4.25% 4.31% 4.42% 5.00% 4.25%Rate of Increase in Compensation Level 4.25 4.02 N/A N/A 4.25 4.02Expected Long-Term Rate of Return on Assets 7.75 7.75 4.84 4.76 N/A N/A
AMOUNTS INCLUDED IN ACCUMULATED OTHER COMPREHENSIVE INCOME
U.S. PLAN NON-U.S. PLANS SUPPLEMENTAL PLAN
(In Millions) 2013 2012 2013 2012 2013 2012
Net Actuarial Loss $310.7 $507.4 $40.9 $46.8 $64.2 $71.4Prior Service Cost (3.5) (4.0) – – 1.6 2.1
Gross Amount in Accumulated Other Comprehensive Income 307.2 503.4 40.9 46.8 65.8 73.5Income Tax Effect 119.5 189.6 4.8 5.8 25.6 27.7
Net Amount in Accumulated Other Comprehensive Income $187.7 $313.8 $36.1 $41.0 $40.2 $45.8
NET PERIODIC PENSION EXPENSE
U.S. PLAN NON-U.S. PLANS SUPPLEMENTAL PLAN
($ In Millions) 2013 2012 2011 2013 2012 2011 2013 2012 2011
Service Cost $ 30.3 $ 35.3 $ 42.8 $ – $ – $ – $ 1.6 $ 3.0 $ 3.2Interest Cost 42.1 41.4 40.8 6.6 6.2 6.5 4.4 4.5 4.4Expected Return on Plan Assets (93.3) (87.0) (78.8) (6.2) (6.8) (8.3) N/A N/A N/AAmortization:
Net Loss 42.5 34.3 26.0 1.0 0.7 0.2 6.7 6.1 5.6Prior Service Cost (0.4) (0.4) 1.6 – – – 0.5 0.6 0.4
Net Periodic Pension Expense(Benefit) $ 21.2 $ 23.6 $ 32.4 $ 1.4 $ 0.1 $ (1.6) $13.2 $14.2 $13.6
Weighted-Average Assumptions:Discount Rates 4.25% 4.75% 5.50% 4.42% 5.02% 5.58% 4.25% 4.75% 5.50%Rate of Increase in
Compensation Level 4.02 4.02 4.02 N/A N/A N/A 4.02 4.02 4.02Expected Long-Term Rate of
Return on Assets 7.75 8.00 8.00 4.76 5.28 6.27 N/A N/A N/A
2 0 1 3 A N N U A L R E P O R T T O S H A R E H O L D E R S | N O R T H E R N T R U S T C O R P O R A T I O N 94

notes to consolidated financial statements
Pension expense for 2014 is expected to include approximately $28.4 million and $0.1 million related to the amortization of net
loss and prior service cost balances, respectively, from AOCI.
CHANGE IN PROJECTED BENEFIT OBLIGATION
U.S. PLAN NON-U.S. PLANS SUPPLEMENTAL PLAN
(In Millions) 2013 2012 2013 2012 2013 2012
Beginning Balance $1,030.4 $ 904.6 $158.1 $127.1 $106.4 $100.3Service Cost 30.3 35.3 – – 1.6 3.0Interest Cost 42.1 41.4 6.6 6.2 4.4 4.5Actuarial (Gain) Loss (125.4) 96.6 0.4 24.8 (0.5) 10.9Benefits Paid (57.7) (47.5) (5.0) (6.1) (10.4) (12.3)Foreign Exchange Rate Changes – – 4.6 6.1 – –
Ending Balance $ 919.7 $1,030.4 $164.7 $158.1 $101.5 $106.4
ESTIMATED FUTURE BENEFIT PAYMENTS
(In Millions)U.S.
PLAN
NON-U.S.
PLANS
SUPPLEMENTAL
PLAN
2014 $ 62.7 $ 2.2 $ 9.02015 61.2 2.6 8.52016 66.0 2.8 9.32017 67.5 3.1 10.72018 70.7 3.2 9.42019-2023 377.2 21.2 50.9
CHANGE IN PLAN ASSETS
U.S. PLAN NON-U.S. PLANS
(In Millions) 2013 2012 2013 2012
Fair Value of Assets atBeginning of Period $1,277.7 $1,094.1 $133.9 $123.3
Actual Return on Assets 122.1 131.1 11.5 11.3Employer Contributions – 100.0 4.3 –Benefits Paid (57.7) (47.5) (5.0) (6.1)Foreign Exchange Rate
Changes – – 3.8 5.4
Fair Value of Assets atEnd of Period $1,342.1 $1,277.7 $148.5 $133.9
The minimum required and maximum deductible
contributions for the U.S. qualified plan in 2014 are estimated
to be zero and $195.0 million, respectively.
A total return investment strategy approach is employed
for Northern Trust’s U.S. pension plan whereby a mix of U.S.
and non-U.S. equities, fixed income and alternative asset
investments are used to maximize the long-term return of
plan assets for a prudent level of risk. This is accomplished by
diversifying the portfolio across various asset classes, with the
goal of reducing volatility of return, and among various
issuers of securities to reduce principal risk. Northern Trust
utilizes an asset/liability methodology to determine the
investment policies that will best meet its short and long-term
objectives. The process is performed by modeling current and
alternative strategies for asset allocation, funding policy and
actuarial methods and assumptions. The financial modeling
uses projections of expected capital market returns and
expected volatility of those returns to determine alternative
asset mixes having the greatest probability of meeting the
plan’s investment objectives. Risk tolerance is established
through careful consideration of plan liabilities, plan funded
status, and corporate financial condition. The intent of this
strategy is to minimize plan expenses by outperforming
growth in plan liabilities over the long run.
The target allocation of plan assets since May 2012, by
major asset category, is 26% U.S. stocks, 21% non-U.S. stocks,
35% long duration fixed income securities, and 18% alternative
investments, split between private equity funds (5%), hedge
funds (5%), global real estate (5%) and commodities (3%).
Equity investments include common stocks that are listed on
an exchange and investments in comingled funds that invest
primarily in publicly traded equities. Equity investments are
diversified across U.S. and non-U.S. stocks and divided by
investment style and market capitalization. Fixed income
securities held include U.S. treasury securities and investments
in commingled funds that invest in a diversified blend of
longer duration fixed income securities. Alternative
investments, including private equity, hedge funds, global real
estate, and commodities, are used judiciously to enhance long-
term returns while improving portfolio diversification. Private
equity assets consist primarily of investments in limited
partnerships that invest in individual companies in the form of
non-public equity or non-public debt positions. Direct or co-
investment in non-public stock by the plan is prohibited. The
plan’s private equity investments are limited to 20% of the total
limited partnership and the maximum allowable loss cannot
exceed the commitment amount. The plan holds two
investments in a hedge fund of funds, which invests, either
directly or indirectly, in a diversified portfolio of funds or other
pooled investment vehicles.
2 0 1 3 A N N U A L R E P O R T T O S H A R E H O L D E R S | N O R T H E R N T R U S T C O R P O R A T I O N 95
notes to consolidated financial statements
Investment in global real estate is designed to provide
stable income returns and added diversification based upon
the historical low correlation between real estate and equity or
fixed income investments. The plan’s global real estate assets
consist of one collective index fund that invests in a diversified
portfolio of global real estate investments, primarily equity
securities.
Commodities also improve portfolio diversification as
they tend to react to changing economic fundamentals
differently than traditional financial assets. Because
commodity prices typically rise with rising inflation,
investments in commodities are also likely to provide an offset
against inflation. Commodity assets include an investment in
one mutual fund that invests in commodity-linked derivative
instruments, backed by a portfolio of fixed income securities.
Though not a primary strategy for meeting the plan’s
objectives, derivatives may be used from time to time,
depending on the nature of the asset class to which they relate,
to gain market exposure in an efficient and timely manner, to
hedge foreign currency exposure or interest rate risk, or to
alter the duration of a portfolio. There were no derivatives
held by the plan at December 31, 2013 or 2012.
Investment risk is measured and monitored on an
ongoing basis through quarterly liability measurements,
periodic asset/liability studies, and quarterly investment
portfolio reviews. Standards used to evaluate the plan’s
investment manager performance include, but are not limited
to, the achievement of objectives, operation within guidelines
and policy, and comparison against a relative benchmark. In
addition, each manager of the investment funds held by the
plan is ranked against a universe of peers and compared to a
relative benchmark. Total plan performance analysis includes
an analysis of the market environment, asset allocation impact
on performance, risk and return relative to other ERISA plans,
and manager impacts upon plan performance.
The following describes the hierarchy of inputs used to
measure fair value and the primary valuation methodologies
used by Northern Trust for the U.S. qualified plan assets
measured at fair value.
Level 1 – Quoted, active market prices for identical assets orliabilities. The U.S. pension plan’s Level 1 investments include
foreign and domestic common stocks, a commodity return
strategy fund, and mutual funds. The U.S. pension plan’s
Level 1 investments are exchange traded and are valued at the
closing price reported by the respective exchanges on the day
of valuation. Share prices of the funds, referred to as a fund’s
Net Asset Value (NAV), are calculated daily based on the
closing market prices and accruals of securities in the fund’s
total portfolio (total value of the fund) divided by the number
of fund shares currently issued and outstanding. Redemptions
of the mutual and collective trust fund shares occur by
contract at the respective fund’s redemption date NAV.
Level 2 – Observable inputs other than Level 1 prices, such asquoted active market prices for similar assets or liabilities, quotedprices for identical or similar assets in inactive markets, andmodel-derived valuations in which all significant inputs areobservable in active markets. The U.S. pension plan’s Level 2
assets include foreign preferred stocks, U.S. government
securities, and collective trust funds. U.S. government
securities are valued by a third party pricing source that
incorporates market observable data such as reported sales of
similar securities, broker quotes and reference data. The
inputs used are based on observable data in active markets.
The NAVs of the funds are calculated monthly based on the
closing market prices and accruals of securities in the fund’s
total portfolio (total value of the fund) divided by the number
of fund shares currently issued and outstanding. Redemptions
of the mutual and collective trust fund shares occur by
contract at the respective fund’s redemption date NAV.
Level 3 inputs – Valuation techniques in which one or moresignificant inputs are unobservable in the marketplace. The U.S.
pension plan’s Level 3 assets are private equity and hedge
funds which invest in underlying groups of investment funds
or other pooled investment vehicles that are selected by the
respective funds’ investment managers. The investment funds
and the underlying investments held by these investment
funds are valued at fair value. In determining the fair value of
the underlying investments of each fund, the fund’s
investment manager or general partner takes into account the
estimated value reported by the underlying funds as well as
any other considerations that may, in their judgment, increase
or decrease such estimated value.
While Northern Trust believes its valuation methods for
plan assets are appropriate and consistent with other market
participants, the use of different methodologies or
assumptions, particularly as applied to Level 3 assets, could
have a material effect on the computation of their estimated
fair values.
2 0 1 3 A N N U A L R E P O R T T O S H A R E H O L D E R S | N O R T H E R N T R U S T C O R P O R A T I O N 96
notes to consolidated financial statements
The following table presents the fair values of Northern
Trust’s U.S. pension plan assets, by major asset category, and
their level within the fair value hierarchy defined by GAAP as
of December 31, 2013 and 2012.
DECEMBER 31, 2013
(In Millions) LEVEL 1 LEVEL 2 LEVEL 3 TOTAL
Preferred and Common StockU.S. $116.0 $ – $ – $ 116.0Non-U.S. 52.9 3.9 – 56.8
Fixed Income – U.S. Government – 131.7 – 131.7Other Investments
Mutual Funds 138.4 – – 138.4Commodity Linked Fund 39.7 – – 39.7Collective Trust Funds – 304.6 – 304.6Short-Term Investment Fund – 6.6 – 6.6Global Real Estate Fund – 65.4 – 65.4Government Agencies Fund – 333.7 – 333.7Emerging Market Fund – 40.9 – 40.9Private Equity Funds – – 47.7 47.7Hedge Fund – – 55.1 55.1
Cash and Other 5.5 – – 5.5
Total Assets at Fair Value $352.5 $886.8 $102.8 $1,342.1
DECEMBER 31, 2012
(In Millions) LEVEL 1 LEVEL 2 LEVEL 3 TOTAL
Preferred and CommonStock – U.S. $111.5 $ – $ – $ 111.5Stock – Non-U.S. 53.6 2.3 – 55.9
Fixed Income – U.S. Government – 142.4 – 142.4Other Investments
Mutual Funds 194.7 – – 194.7Commodity Linked Fund 37.5 – – 37.5Collective Trust Funds – 195.6 – 195.6Short-Term Investment Fund – 76.4 – 76.4Global Real Estate Fund – 49.4 – 49.4Government Agencies Fund – 294.2 – 294.2Emerging Market Fund – 37.2 – 37.2Private Equity Funds – – 47.4 47.4Hedge Fund – – 30.2 30.2
Cash and Other 5.3 – – 5.3
Total Assets at Fair Value $402.6 $797.5 $77.6 $1,277.7
The following table presents the changes in Level 3 assets
for the years ended December 31, 2013 and 2012.
PRIVATE EQUITY
FUNDS HEDGE FUND
(In Millions) 2013 2012 2013 2012
Fair Value at January 1 $ 47.4 $45.5 $30.2 $29.2Actual Return on Plan Assets 5.5 2.5 4.9 1.0Purchases 6.2 4.3 20.0 –Sales (11.4) (4.9) – –
Fair Value at December 31 $ 47.7 $47.4 $55.1 $30.2
Note: The return on plan assets represents the change in the unrealized gain (loss) on assetsstill held at December 31.
A building block approach is employed for Northern
Trust’s U.S. pension plan in determining the long-term rate of
return for plan assets. Historical markets and long-term
historical relationships between equities, fixed income and
other asset classes are studied using the widely-accepted capital
market principle that assets with higher volatility generate a
greater return over the long-run. Current market factors such
as inflation expectations and interest rates are evaluated before
long-term capital market assumptions are determined. The
long-term portfolio rate of return is established with
consideration given to diversification and rebalancing. The rate
is reviewed against peer data and historical returns to verify the
return is reasonable and appropriate. Based on this approach
and the plan’s target asset allocation, the expected long-term
rate of return on assets as of the plan’s December 31, 2013
measurement date was set at 7.75%.
Postretirement Health Care. Northern Trust maintains
an unfunded postretirement health care plan under which
those employees who retire at age 55 or older under the
provisions of the U.S. defined benefit plan and had attained 15
years of service as of December 31, 2011 may be eligible for
subsidized postretirement health care coverage. The
provisions of this plan may be changed further at the
discretion of Northern Trust, which also reserves the right to
terminate these benefits at any time.
Effective in January 2012 Northern Trust participates in
an Employee Group Waiver Plan which allows Northern Trust
to offer substantially the same postretirement prescription
benefits to eligible participants while increasing subsidy
reimbursements received by Northern Trust from the U.S.
government. This action served to reduce the January 31, 2012
postretirement health care plan liability by approximately
$26.7 million and increased amortization of the net actuarial
gain for the year ended December 31, 2012 by approximately
$3.3 million.
2 0 1 3 A N N U A L R E P O R T T O S H A R E H O L D E R S | N O R T H E R N T R U S T C O R P O R A T I O N 97

notes to consolidated financial statements
The following tables set forth the postretirement health
care plan status and amounts included in AOCI at
December 31, the net periodic postretirement benefit cost of
the plan for 2013 and 2012, and the change in the
accumulated postretirement benefit obligation during 2013
and 2012.
PLAN STATUS
(In Millions) 2013 2012
Accumulated Postretirement Benefit Obligation atMeasurement Date:Retirees and Dependents $22.5 $21.6Actives Eligible for Benefits 8.7 9.0
Net Postretirement Benefit Obligation $31.2 $30.6
AMOUNTS INCLUDED IN ACCUMULATED OTHERCOMPREHENSIVE INCOME
(In Millions) 2013 2012
Net Actuarial Gain $(6.0) $ (9.1)Prior Service Benefit – (2.9)
Gross Amount in Accumulated Other ComprehensiveIncome (6.0) (12.0)
Income Tax Effect (2.3) (4.5)
Net Amount in Accumulated OtherComprehensive Income $(3.7) $ (7.5)
NET PERIODIC POSTRETIREMENT (BENEFIT) EXPENSE
(In Millions) 2013 2012 2011
Service Cost $ 0.1 $ 0.2 $ 0.4Interest Cost 1.2 1.3 2.8Amortization
Net (Gain) Loss (1.2) (2.3) 1.6Prior Service Benefit (3.0) (5.1) (5.2)
Net Periodic Postretirement (Benefit) Expense $(2.9) $(5.9) $(0.4)
CHANGE IN ACCUMULATED POSTRETIREMENTBENEFIT OBLIGATION
(In Millions) 2013 2012
Beginning Balance $30.6 $ 54.5Service Cost 0.1 0.2Interest Cost 1.2 1.3Actuarial Loss 1.9 4.5Gross Benefits Paid (2.8) (4.1)Medicare Subsidy 0.2 0.9Plan Change – (26.7)
Ending Balance $31.2 $ 30.6
ESTIMATED FUTURE BENEFIT PAYMENTS
(In Millions)
TOTAL
POSTRETIREMENT
MEDICAL
BENEFITS
2014 $ 3.02015 3.22016 3.22017 3.22018 3.12019-2023 12.3
Net periodic postretirement (benefit) expense for 2014 is
expected to include gains of $0.6 million related to the
amortization from AOCI of the net actuarial gain.
The weighted average discount rate used in determining
the accumulated postretirement benefit obligation was 5.0% at
December 31, 2013 and 4.25% at December 31, 2012. For
measurement purposes, an 8.0% annual increase in the cost of
pre-age 65 medical and drug benefits and a 7.5% annual
increase in the cost of post-age 65 medical and drug benefits
were assumed for 2013. These rates are both assumed to
gradually decrease until they reach 5.0% in 2021. The health
care cost trend rate assumption has an effect on the amounts
reported. For example, increasing or decreasing the assumed
health care trend rate by one percentage point in each year
would have the following effect.
(In Millions)1–PERCENTAGE
POINT INCREASE
1–PERCENTAGE
POINT DECREASE
Effect on Postretirement BenefitObligation $0.8 $(0.7)
Effect on Total Service and InterestCost Components – –
Defined Contribution Plans. The Corporation and its
subsidiaries maintain various defined contribution plans
covering substantially all employees. The Corporation’s
contribution includes a matching component. The expense
associated with defined contribution plans is charged to
employee benefits and totaled $43.0 million in 2013, $41.0
million in 2012, and $39.3 million in 2011.
Note 22 – Share-Based Compensation Plans
Northern Trust recognizes expense for the grant-date fair
value of stock options and other share-based compensation
granted to employees and non-employee directors.
2 0 1 3 A N N U A L R E P O R T T O S H A R E H O L D E R S | N O R T H E R N T R U S T C O R P O R A T I O N 98
notes to consolidated financial statements
Total compensation expense for share-based payment
arrangements to employees and the associated tax impacts
were as follows for the periods presented:
FOR THE YEAR ENDED
DECEMBER 31,
(In Millions) 2013 2012 2011
Stock and Stock Unit Awards $48.0 $44.0 $36.2Stock Options 18.4 27.4 34.1Performance Stock Units 7.4 2.5 –
Total Share-Based Compensation Expense $73.8 $73.9 $70.3Tax Benefits Recognized $27.7 $27.7 $26.5
As of December 31, 2013, there was $112.0 million of
unrecognized compensation cost related to unvested share-
based compensation arrangements granted under the
Corporation’s share-based compensation plans. That cost is
expected to be recognized as expense over a weighted-average
period of approximately 2 years.
The Northern Trust Corporation 2012 Stock Plan (the
2012 Plan) is administered by the Compensation and Benefits
Committee (Committee) of the Board. All employees of the
Corporation and its subsidiaries and all directors of the
Corporation are eligible to receive awards under the 2012
Plan. The 2012 Plan provides for the grant of nonqualified
stock options, incentive stock options, stock appreciation
rights, stock awards, stock units and performance stock units.
Grants are outstanding under the 2012 Plan and The
Amended and Restated Northern Trust Corporation 2002
Stock Plan (2002 Plan), a predecessor plan. The total number
of shares of the Corporation’s common stock authorized for
issuance under the 2012 Plan is 30,000,000 plus shares
forfeited under the 2002 Plan. As of December 31, 2013,
shares available for future grant under the 2012 Plan,
including shares forfeited under the 2002 Plan, totaled
31,034,922.
The following describes Northern Trust’s share-based
payment arrangements and applies to awards under the 2012
Plan and the 2002 Plan, as applicable.
Stock Options. Stock options consist of options to
purchase common stock at prices not less than 100% of the
fair value thereof on the date the options are granted. Options
have a maximum ten-year life and generally vest and become
exercisable in one to four years after the date of grant. In
addition, all options may become exercisable either upon a
“change of control” as defined in the 2012 Plan and the 2002
Plan or, in the case of options issued after September 2012,
upon certain involuntary terminations of employment
following a change of control. All options terminate at such
time as determined by the Committee and as provided in the
terms and conditions of the respective option grants.
The weighted-average assumptions used for options
granted during the years ended December 31 are as follows:
2013 2012 2011
Expected Term (in Years) 7.6 7.5 7.7Dividend Yield 2.38% 2.79% 4.56%Expected Volatility 29.5 34.0 43.2Risk Free Interest Rate 1.43 1.42 2.94
The expected term of options represents the period of
time options granted are expected to be outstanding based
primarily on the historical exercise behavior attributable to
previous option grants. Dividend yield represents the
estimated yield from dividends paid on the Corporation’s
common stock over the expected term of the options.
Expected volatility is determined based on a combination of
the historical volatility of Northern Trust’s stock price and the
implied volatility of traded options on Northern Trust stock.
The risk free interest rate is based on the U.S. Treasury yield
curve at the time of grant for a period equal to the expected
term of the options granted.
The following table provides information about stock
options granted, vested, and exercised in the years ended
December 31, 2013, 2012 and 2011.
(In Millions, Except Per Share Information) 2013 2012 2011
Weighted Average Grant-Date Per ShareFair Value of Stock Options Granted $12.80 $11.54 $15.26
Grant-Date Fair Value of Stock OptionsVested 30.0 32.1 27.9
Stock Options ExercisedIntrinsic Value as of Exercise Date 26.9 12.8 1.5Cash Received 146.2 32.3 5.4Tax Deduction Benefits Realized 9.8 4.6 0.5
The following is a summary of changes in nonvested stock
options for the year ended December 31, 2013.
NONVESTED OPTIONS SHARES
WEIGHTED-AVERAGE
GRANT-DATE FAIR
VALUEPER SHARE
Nonvested as December 31, 2012 4,966,030 $14.00Granted 446,868 12.80Vested (2,038,108) 14.74Forfeited or Cancelled (70,964) 13.43
Nonvested at December 31, 2013 3,303,826 $13.40
2 0 1 3 A N N U A L R E P O R T T O S H A R E H O L D E R S | N O R T H E R N T R U S T C O R P O R A T I O N 99

notes to consolidated financial statements
A summary of the status of stock options under the 2012 Plan and the 2002 Plan at December 31, 2013, and changes during the
year then ended, are presented in the table below.
($ In Millions Except Per Share Information) SHARES
WEIGHTEDAVERAGEEXERCISE
PRICEPER SHARE
WEIGHTEDAVERAGE
REMAININGCONTRACTUAL
TERM (YEARS)
AGGREGATEINTRINSIC
VALUE
Options Outstanding, December 31, 2012 15,302,474 $52.53Granted 446,868 52.69Exercised (3,088,490) 47.43Forfeited, Expired or Cancelled (668,041) 56.30
Options Outstanding, December 31, 2013 11,992,811 $53.64 5.5 $110.5
Options Exercisable, December 31, 2013 8,688,985 $55.52 4.7 $ 66.9
Stock and Stock Unit Awards. Stock or stock unit awards
may be granted by the Committee to participants which
entitle them to receive a payment in the Corporation’s
common stock or cash under the terms of the 2012 Plan and
such other terms and conditions as the Committee deems
appropriate. Each stock unit provides the recipient the
opportunity to receive one share of stock for each stock unit
that vests. The stock units granted in 2013 predominately vest
at a rate equal to 50% on the third anniversary date of the
grant and 50% on the fourth anniversary date. Stock and stock
unit grants totaled 1,181,321, 988,421, and 995,176, with
weighted average grant-date fair values of $52.82, $43.72, and
$50.79 per share, for the years ended December 31, 2013,
2012, and 2011, respectively. The total fair value of stock and
stock units vested during the years ended December 31, 2013,
2012, and 2011, was $47.0 million, $21.6 million, and $7.1
million, respectively.
A summary of the status of outstanding stock and stock
unit awards under the 2012 Plan and the 2002 Plan at
December 31, 2013, and changes during the year then ended,
is presented in the table below.
($ In Millions) NUMBER
AGGREGATEINTRINSIC
VALUE
Stock and Stock Unit Awards Outstanding,December 31, 2012 3,306,444 $165.9
Granted 1,181,321Distributed (851,297)Forfeited (157,582)
Stock and Stock Unit Awards Outstanding,December 31, 2013 3,478,886 $215.3
Units Convertible, December 31, 2013 181,059 $ 11.2
The following is a summary of nonvested stock and stock
unit awards at December 31, 2013, and changes during the
year then ended.
NONVESTED STOCKAND STOCK UNITS NUMBER
WEIGHTEDAVERAGE
GRANT-DATE FAIR
VALUE PERUNIT
WEIGHTEDAVERAGE
REMAININGVESTING
TERM(YEARS)
Nonvested atDecember 31, 2012 3,136,496 $49.20 2.0
Granted 1,181,321 52.82Vested (862,408) 52.47Forfeited (157,582) 46.67
Nonvested atDecember 31, 2013 3,297,827 $49.76 2.0
Performance Stock Units. Each performance stock unit
provides the recipient the opportunity to receive one share of
stock for each stock unit that vests. The number of
performance stock units granted that may vest ranges from
0% to 125% of the original award granted based on the
attainment of a three-year average return on equity target.
Distribution of the award is then made after vesting.
During the years ended December 31, 2013 and 2012,
respectively, 296,650 and 198,552 performance stock units
were granted with weighted average grant-date fair values of
$49.07 and $43.65, respectively. Performance stock units
outstanding at December 31, 2013 and 2012, respectively, had
aggregate intrinsic values of $30.6 and $10.0 million and
weighted average remaining vesting terms of 2.7 and 3.1 years,
respectively.
2 0 1 3 A N N U A L R E P O R T T O S H A R E H O L D E R S | N O R T H E R N T R U S T C O R P O R A T I O N 100

notes to consolidated financial statements
Non-employee Director Stock Awards. Stock units with
total values of $1.1 million (20,599 units), $0.9 million (20,148
units), and $1.1 million (22,188 units) were granted to non-
employee directors in 2013, 2012 and 2011, respectively,
which vest or vested on the date of the annual meeting of the
Corporation’s stockholders in the following years. Total
expense recognized on these grants was $1.1 million, $0.9
million, and $1.1 million in 2013, 2012, and 2011,
respectively. Stock units granted to non-employee directors do
not have voting rights. Each stock unit entitles a director to
one share of common stock at vesting, unless a director elects
to defer receipt of the shares. Directors may elect to defer the
payment of their annual stock unit grant and cash-based
compensation until termination of services as director.
Deferred cash compensation is converted into stock units
representing shares of common stock of the Corporation.
Distributions of deferred stock units are made in stock.
Distributions of the stock unit accounts that relate to cash-
based compensation are made in cash based on the fair value
of the stock units at the time of distribution.
Note 23 – Cash-Based Compensation Plans
Various incentive plans provide for cash incentives and bonuses
to selected employees based upon accomplishment of corporate
net income objectives, business unit goals, and individual
performance. The estimated contributions to these plans are
charged to compensation expense and totaled $192.4 million in
2013, $186.8 million in 2012, and $176.7 million in 2011.
Note 24 – Contingent Liabilities
Legal Proceedings. In the normal course of business, the
Corporation and its subsidiaries are routinely defendants in or
parties to a number of pending and threatened legal actions,
including, but not limited to, actions brought on behalf of
various claimants or classes of claimants, regulatory matters,
employment matters, and challenges from tax authorities
regarding the amount of taxes due. In certain of these actions
and proceedings, claims for substantial monetary damages or
adjustments to recorded tax liabilities are asserted.
Based on current knowledge, after consultation with legal
counsel and after taking into account current accruals,
management does not believe that losses, if any, arising from
pending litigation or threatened legal actions or regulatory
matters will have a material adverse effect on the consolidated
financial position or liquidity of the Corporation, although
such matters could have a material adverse effect on the
Corporation’s operating results for a particular period.
Under GAAP, (i) an event is “probable” if the “future
event or events are likely to occur”; (ii) an event is “reasonably
possible” if “the chance of the future event or events occurring
is more than remote but less than likely”; and (iii) an event is
“remote” if “the chance of the future event or events occurring
is slight”. Thus, references to the upper end of the range of
reasonably possible loss for matters in which the Corporation
is able to estimate a range of reasonably possible loss mean the
upper end of the range of loss for matters for which the
Corporation believes the risk of loss is more than remote but
less than likely.
For the reasons set out in this paragraph, the outcome of
some matters is inherently difficult to predict and/or the range
of loss cannot be reasonably estimated. This may be the case in
matters that (i) will be decided by a jury, (ii) are in early
stages, (iii) involve uncertainty as to the likelihood of a class
being certified or the ultimate size of the class, (iv) are subject
to appeals or motions, (v) involve significant factual issues to
be resolved, including with respect to the amount of damages,
(vi) do not specify the amount of damages sought, or
(vii) seek very large damages based on novel and complex
damage and liability legal theories. Accordingly, the
Corporation cannot reasonably estimate the eventual outcome
of these pending matters, the timing of their ultimate
resolution, or what the eventual loss, fines or penalties, if any,
related to each pending matter will be.
In accordance with applicable accounting guidance, the
Corporation records accruals for litigation and regulatory
matters when those matters present loss contingencies that are
both probable and reasonably estimable. When loss
contingencies are not both probable and reasonably estimable,
the Corporation does not record accruals. No material
accruals have been recorded for pending litigation or
threatened legal actions or regulatory matters.
For a limited number of the matters for which a loss is
reasonably possible in future periods, whether in excess of an
accrued liability or where there is no accrued liability, the
Corporation is able to estimate a range of possible loss. As of
December 31, 2013, the Corporation has estimated the upper
end of the range of reasonably possible losses for these matters
to be approximately $115 million in the aggregate. This
aggregate amount of reasonably possible loss is based upon
currently available information and is subject to significant
judgment and a variety of assumptions, and known and
unknown uncertainties. The matters underlying the estimated
range will change from time to time, and actual results will
vary significantly from the current estimate.
In certain other pending matters, there may be a range of
reasonably possible losses (including reasonably possible losses
2 0 1 3 A N N U A L R E P O R T T O S H A R E H O L D E R S | N O R T H E R N T R U S T C O R P O R A T I O N 101

notes to consolidated financial statements
in excess of amounts accrued) that cannot be reasonably
estimated for the reasons described above. Such matters are
not included in the estimate of reasonably possible losses
identified above.
As previously disclosed, a number of participants in our
securities lending program, which is associated with the
Corporation’s asset servicing business, have commenced
either individual lawsuits or purported class actions in which
they claim, among other things, that we failed to exercise
prudence in the investment management of the collateral
received from the borrowers of the securities, resulting in
losses that they seek to recover. The cases assert various
contractual, statutory and common law claims, including
claims for breach of fiduciary duty under common law and
under the Employee Retirement Income Security Act (ERISA).
In the fourth quarter of 2013, Northern Trust recorded a
$19.2 million pre-tax charge in connection with an agreement
to resolve claims related to two of these lawsuits. The
settlement is not final as it requires further documentation,
signed agreements and court approval. Other lawsuits related
to securities lending are not part of the proposed settlement,
and remain pending.
Visa Membership. Northern Trust, as a member of Visa
U.S.A. Inc. (Visa U.S.A.) and in connection with the 2007
initial public offering of Visa, Inc. (Visa), received shares of
restricted stock in Visa, a portion of which was redeemed
pursuant to a mandatory redemption. The proceeds of the
redemption totaled $167.9 million and were recorded as a gain
in 2008. The remaining Visa shares held by Northern Trust are
recorded at their original cost basis of zero and as of
December 31, 2013 have restrictions as to their sale or
transfer.
Northern Trust is obligated to indemnify Visa for losses
resulting from certain indemnified litigation involving Visa
and has been required to recognize, at its estimated fair value
in accordance with GAAP, a guarantee liability arising from
such litigation that has not yet settled.
During 2007, Northern Trust recorded charges and
corresponding liabilities of $150 million relating to Visa
indemnified litigation. Subsequently, Visa established an
escrow account to cover the settlements of, or judgments in,
indemnified litigation. The fundings by Visa of its escrow
account have resulted in reductions of Northern Trust’s Visa
related indemnification liability and of the future realization
of the value of outstanding shares of Visa common stock held
by Northern Trust as a member bank of Visa U.S.A.
Reductions of Northern Trust’s indemnification liability
totaling $23.1 million, $33.0 million, and $17.8 million were
recorded in 2011, 2010, and 2009, respectively, which
combined with a $76.1 million reduction recorded in 2008,
fully eliminated the recorded indemnification liability as of
December 31, 2011.
On October 19, 2012, Visa signed a settlement agreement
with plaintiff representatives for binding settlement of the
indemnified litigation relating to interchange fees, which was
approved by a federal judge on December 13, 2013, and is
subject to appeals. While the final settlement and ultimate
resolution of outstanding Visa related litigation and the timing
for removal of selling restrictions on shares owned by
Northern Trust are highly uncertain, based upon the
settlement terms announced by Visa, Northern Trust
anticipates that the value of its remaining shares of Visa stock
will be adequate to offset any remaining indemnification
obligations related to Visa litigation.
Contingent Purchase Consideration. In connection with
acquisitions consummated in 2011, contingent consideration
was recorded relating to certain performance-related purchase
price adjustments. The fair value of the contingent
consideration at December 31, 2013 and 2012 totaled $55.4
million and $50.1 million, respectively.
Note 25 – Derivative Financial Instruments
Northern Trust is a party to various derivative financial
instruments that are used in the normal course of business to
meet the needs of its clients; as part of its trading activity for
its own account; and as part of its risk management activities.
These instruments include foreign exchange contracts, interest
rate contracts, and credit default swap contracts.
Northern Trust’s primary risks associated with these
instruments is the possibility that interest rates, foreign
exchange rates, or credit spreads could change in an
unanticipated manner, resulting in higher costs or a loss in the
underlying value of the instrument. These risks are mitigated
by establishing limits, monitoring the level of actual positions
taken against such established limits, and monitoring the level
of any interest rate sensitivity gaps created by such positions.
When establishing position limits, market liquidity and
volatility, as well as experience in each market, are taken into
account.
Credit risk associated with derivative instruments relates
to the failure of the counterparty and the failure of Northern
Trust to pay based on the contractual terms of the agreement,
and is generally limited to the unrealized fair value gains and
losses, respectively, on these instruments, net of any cash
collateral received or deposited. The amount of credit risk will
2 0 1 3 A N N U A L R E P O R T T O S H A R E H O L D E R S | N O R T H E R N T R U S T C O R P O R A T I O N 102

notes to consolidated financial statements
increase or decrease during the lives of the instruments as
interest rates, foreign exchange rates, or credit spreads
fluctuate. This risk is controlled by limiting such activity to an
approved list of counterparties and by subjecting such activity
to the same credit and quality controls as are followed in
lending and investment activities. Credit Support Annexes and
other similar agreements are currently in place with a number
of counterparties which mitigate the aforementioned credit
risk associated with derivative activity conducted with those
counterparties by requiring that significant net unrealized fair
value gains be supported by collateral placed with Northern
Trust.
Northern Trust has elected to net derivative assets and
liabilities when legally enforceable master netting
arrangements or similar agreements exist between Northern
Trust and the counterparty. Derivative assets and liabilities
recorded in the consolidated balance sheet were each reduced
by $1.2 billion and $982.5 million as of December 31, 2013
and 2012, respectively, as a result of master netting
arrangements and similar agreements in place. Derivative
assets and liabilities recorded at December 31, 2013 also reflect
reductions of $210.7 million and $767.7 million, respectively,
as a result of cash collateral received from and deposited with
derivative counterparties. This compares with reductions of
derivative assets and liabilities of $118.6 million and $425.0
million, respectively, at December 31, 2012. Additional cash
collateral received from and deposited with derivative
counterparties totaling $36.4 million and $39.3 million,
respectively, as of December 31, 2013, and $1.6 million and
$73.3 million, respectively, as of December 31, 2012, were not
offset against derivative assets and liabilities on the
consolidated balance sheet as the amounts exceeded the net
derivative positions with those counterparties. Effective in the
second quarter of 2013, Northern Trust centrally clears
interest rate derivative instruments that are addressed under
Title VII of the Dodd-Frank Wall Street Reform and
Consumer Protection Act. Securities posted as collateral for
these transactions totaled $27.6 million, are not offset against
derivative assets and liabilities on the consolidated balance
sheet, and the counterparty receiving the securities as
collateral does not have the right to repledge or sell the
securities.
Certain master netting arrangements Northern Trust
enters into with derivative counterparties contain credit risk-
related contingent features in which the counterparty has the
option to declare Northern Trust in default and accelerate
cash settlement of net derivative liabilities with the
counterparty in the event Northern Trust’s credit rating falls
below specified levels. The aggregate fair value of all derivative
instruments with credit risk-related contingent features that
were in a liability position was $257.3 million and $178.9
million at December 31, 2013 and 2012, respectively. Cash
collateral amounts deposited with derivative counterparties on
those dates included $197.0 million and $155.4 million,
respectively, posted against these liabilities, resulting in a net
maximum amount of termination payments that could have
been required at December 31, 2013 and 2012 of $60.3 million
and $23.5 million, respectively. Accelerated settlement of these
liabilities would not have a material effect on the consolidated
financial position or liquidity of Northern Trust.
Foreign exchange contracts are agreements to exchange
specific amounts of currencies at a future date, at a specified
rate of exchange. Foreign exchange contracts are entered into
primarily to meet the foreign exchange needs of clients.
Foreign exchange contracts are also used for trading purposes
and risk management. For risk management purposes,
Northern Trust uses foreign exchange contracts to reduce its
exposure to changes in foreign exchange rates relating to
certain forecasted non-functional currency denominated
revenue and expenditure transactions, foreign currency
denominated assets and liabilities, and net investments in
non-U.S. affiliates.
Interest rate contracts include swap and option contracts.
Interest rate swap contracts involve the exchange of fixed and
floating rate interest payment obligations without the
exchange of the underlying principal amounts. Northern
Trust enters into interest rate swap contracts on behalf of its
clients and also may utilize such contracts to reduce or
eliminate the exposure to changes in the cash flows or fair
value of hedged assets or liabilities due to changes in interest
rates. Interest rate option contracts may include caps, floors,
and swaptions, and provide for the transfer or reduction of
interest rate risk in exchange for a fee. Northern Trust enters
into option contracts primarily as a seller of interest rate
protection to clients. Northern Trust receives a fee at the
outset of the agreement for the assumption of the risk of an
unfavorable change in interest rates. This assumed interest
rate risk is then mitigated by entering into an offsetting
position with an outside counterparty. Northern Trust may
also purchase option contracts for risk management purposes.
2 0 1 3 A N N U A L R E P O R T T O S H A R E H O L D E R S | N O R T H E R N T R U S T C O R P O R A T I O N 103

notes to consolidated financial statements
Credit default swap contracts are agreements to transfer credit default risk from one party to another in exchange for a fee.
Northern Trust enters into credit default swaps with outside counterparties where the counterparty agrees to assume the underlying
credit exposure of a specific Northern Trust commercial loan or loan commitment.
Client-Related and Trading Derivative Instruments. Approximately 97% of Northern Trust’s derivatives outstanding at
December 31, 2013 and 2012, measured on a notional value basis, relate to client-related and trading activities. These activities
consist principally of providing foreign exchange services to clients in connection with Northern Trust’s global custody business.
However, in the normal course of business, Northern Trust also engages in trading of currencies for its own account.
The following table shows the notional and fair values of client-related and trading derivative financial instruments. Notional
amounts of derivative financial instruments do not represent credit risk, and are not recorded in the consolidated balance sheet.
They are used merely to express the volume of this activity. Northern Trust’s credit related risk of loss is limited to the positive fair
value of the derivative instrument, which is significantly less than the notional amount.
DECEMBER 31, 2013 DECEMBER 31, 2012
FAIR VALUE FAIR VALUE
(In Millions)NOTIONAL
VALUE ASSET LIABILITYNOTIONAL
VALUE ASSET LIABILITY
Foreign Exchange Contracts $243,135.0 $2,844.7 $2,846.2 $213,246.7 $1,735.3 $1,730.4Interest Rate Contracts 5,001.7 122.8 117.0 4,946.6 180.6 174.0
Total $248,136.7 $2,967.5 $2,963.2 $218,193.3 $1,915.9 $1,904.4
Changes in the fair value of client-related and trading derivative instruments are recognized currently in income. The following
table shows the location and amount of gains and losses recorded in the consolidated statement of income for the years ended
December 31, 2013, 2012, and 2011.
LOCATION OF DERIVATIVE
GAIN/(LOSS) RECOGNIZED
IN INCOME
AMOUNT OF DERIVATIVE GAIN/
(LOSS) RECOGNIZED IN INCOME
DECEMBER 31,
(In Millions) 2013 2012 2011
Foreign Exchange Contracts Foreign Exchange Trading Income $244.4 $206.1 $324.5Interest Rate Contracts Security Commissions and Trading Income 12.7 11.6 5.9
Total $257.1 $217.7 $330.4
2 0 1 3 A N N U A L R E P O R T T O S H A R E H O L D E R S | N O R T H E R N T R U S T C O R P O R A T I O N 104

notes to consolidated financial statements
Risk Management Instruments. Northern Trust uses derivative instruments to hedge its exposure to foreign currency, interest
rate, and credit risk.
The following table identifies the types and classifications of derivative instruments formally designated as hedges under GAAP
and used by Northern Trust to manage risk, their notional and fair values, and the respective risks addressed.
DECEMBER 31, 2013 DECEMBER 31, 2012
FAIR VALUE FAIR VALUE
(In Millions)DERIVATIVE
INSTRUMENT
RISK
CLASSIFICATION
NOTIONALVALUE ASSET LIABILITY
NOTIONAL
VALUE ASSET LIABILITY
FAIR VALUE HEDGESAvailable for Sale Investment Securities Interest Rate Swap Contracts Interest Rate $3,296.9 $ 31.5 $ 44.8 $3,617.0 $ 3.4 $ 75.1Senior Notes and Long-Term Subordinated
Debt Interest Rate Swap Contracts Interest Rate 1,250.0 83.6 33.4 900.0 126.3 0.2CASH FLOW HEDGESForecasted Foreign Currency Denominated
Transactions Foreign Exchange Contracts Foreign Currency 314.0 10.2 5.5 669.0 8.7 11.5NET INVESTMENT HEDGESNet Investments in Non-U.S. Affiliates Foreign Exchange Contracts Foreign Currency 1,684.9 9.8 52.8 1,451.4 2.3 27.8
Total $6,545.8 $135.1 $136.5 $6,637.4 $140.7 $114.6
In addition to the above, Sterling denominated debt, totaling $259.1 million and $242.3 million at December 31, 2013 and 2012,
respectively, was designated as a hedge of the foreign exchange risk associated with the net investment in certain non-U.S. affiliates.
Derivatives are designated as fair value hedges to limit Northern Trust’s exposure to changes in the fair value of assets and
liabilities due to movements in interest rates. The following table shows the location and amount of derivative gains and losses
recorded in the consolidated statement of income related to fair value hedges for the years ended December 31, 2013, 2012, and
2011.
DERIVATIVE
INSTRUMENT
LOCATION OF DERIVATIVE
GAIN/(LOSS) RECOGNIZED
IN INCOME
AMOUNT OF DERIVATIVE GAIN/
(LOSS) RECOGNIZED IN INCOME
DECEMBER 31,
(In Millions) 2013 2012 2011
Available for Sale Investment Securities Interest Rate Swap Contracts Interest Income $ 26.3 $(48.4) $ (56.6)Senior Notes and Long-Term Subordinated Debt Interest Rate Swap Contracts Interest Expense (44.9) 54.3 194.4
Total $(18.6) $ 5.9 $137.8
There was $0.9 million of losses, $0.4 million of gains, and
$0.3 million of gains recorded within the fair values of hedged
items for “long-haul” hedges during the years ended
December 31, 2013, 2012, and 2011, respectively, and $0.8
million of losses, $0.3 million of gains, and $0.9 million of
gains from ineffectiveness recorded during the years ended
December 31, 2013, 2012, and 2011, respectively.
Derivatives are also designated as cash flow hedges in
order to minimize the variability in cash flows of earning
assets or forecasted transactions caused by movements in
interest or foreign exchange rates. There was no ineffectiveness
recognized in earnings for cash flow hedges during the years
ended December 31, 2013, 2012, or 2011. As of December 31,
2013, twenty-three months is the maximum length of time
over which the exposure to variability in future cash flows of
forecasted foreign currency denominated transactions is being
hedged.
2 0 1 3 A N N U A L R E P O R T T O S H A R E H O L D E R S | N O R T H E R N T R U S T C O R P O R A T I O N 105

notes to consolidated financial statements
During the year ended December 31, 2012, there was $0.2 million of net cash flow hedge derivative losses relating to interest rate
swap contracts reclassified from AOCI to interest income; there were no gains or losses reclassified during the years ended
December 31, 2013 and 2011. The following table provides cash flow hedge derivative gains and losses relating to foreign exchange
contracts that were recognized in AOCI and the amounts reclassified to earnings during the years ended December 31, 2013, 2012
and 2011. Beginning in 2012, gains and losses associated with forecasted foreign currency denominated revenue and expenditure
transactions are classified in other operating income or other operating expense.
FOREIGN EXCHANGECONTRACTS(BEFORE TAX)
(In Millions) 2013 2012 2011
Net Gain/(Loss) Recognized in AOCI $2.1 $(3.2) $(23.6)
Net Gain/(Loss) Reclassified from AOCI to EarningsTrust, Investment and Other Servicing Fees – – 0.6Other Operating Income (2.1) (4.6) (0.1)Interest Income – – (1.2)Interest Expense – – –Compensation – – 3.0Employee Benefits – – 0.9Equipment and Software – – –Occupancy Expense – – 0.5Other Operating Expense (2.6) – 1.9
Total $ (4.7) $(4.6) $ 5.6
During the years ended December 31, 2012 and 2011,
there were $0.2 million of gains and $6.3 million of losses,
respectively, relating to net foreign exchange contract amounts
that were reclassified into earnings as a result of the
discontinuance of forecasted transactions that were no longer
probable of occurring; there were no gains or losses
reclassified during the year ended December 31, 2013. It is
estimated that a net gain of $3.1 million will be reclassified
into earnings within the next twelve months relating to cash
flow hedges.
Certain foreign exchange contracts and qualifying
nonderivative instruments are designated as net investment
hedges to minimize Northern Trust’s exposure to variability in
the foreign currency translation of net investments in non-
U.S. branches and subsidiaries. For net investment hedges,
there was $5.3 million of gains from ineffectiveness recorded
for these hedges during the year ended December 31, 2012,
and no ineffectiveness recorded for these hedges during the
years ended December 31, 2013 and 2011.
The following table provides net investment hedge gains
and losses recognized in AOCI during the years ended
December 31, 2013 and 2012.
(In Millions)
AMOUNT OF HEDGING
INSTRUMENT GAIN/(LOSS)
RECOGNIZED IN AOCI
(BEFORE TAX)
2013 2012
Foreign Exchange Contracts $(101.6) $(24.7)Sterling Denominated Subordinated Debt (5.7) (9.0)
Total $(107.3) $(33.7)
2 0 1 3 A N N U A L R E P O R T T O S H A R E H O L D E R S | N O R T H E R N T R U S T C O R P O R A T I O N 106

notes to consolidated financial statements
Derivatives that are not formally designated as hedges under GAAP are entered into for risk management purposes. Foreign
exchange contracts are entered into to manage the foreign currency risk of non-U.S. dollar denominated assets and liabilities, the
net investment in certain non-U.S. affiliates, commercial loans, and forecasted foreign currency denominated transactions. Credit
default swaps are entered into to manage the credit risk associated with certain loans and loan commitments. Forward contracts are
entered into to manage the interest rate risk associated with loan commitments. The following table identifies the types of risk
management derivative instruments not formally designated as hedges and their notional amounts and fair values.
DECEMBER 31, 2013 DECEMBER 31, 2012
FAIR VALUE FAIR VALUE
(In Millions)NOTIONAL
VALUE ASSET LIABILITYNOTIONAL
VALUE ASSET LIABILITY
Credit Default Swap Contracts $ – $ – $ – $ 42.5 $ – $1.0Foreign Exchange Contracts 168.8 1.0 1.2 1,189.8 10.3 3.0
Total $168.8 1.0 $1.2 $1,232.3 $10.3 $4.0
The following table provides the location and amount of gains and losses recorded in the consolidated statement of income for
the years ended December 31, 2013, 2012, and 2011 for derivative instruments not formally designated as hedges under GAAP.
AMOUNT RECOGNIZED IN INCOME
(In Millions)LOCATION OF DERIVATIVE GAIN/(LOSS)
RECOGNIZED IN INCOME 2013 2012 2011
Credit Default Swap Contracts Other Operating Income $(0.1) $ (2.6) $ 0.9Forward Contracts Other Operating Income – – 0.2Foreign Exchange Contracts Other Operating Income (4.0) 11.3 (7.0)
Total $(4.1) $ 8.7 $(5.9)
Note 26 – Offsetting of Assets and Liabilities
The following tables provide information regarding the offsetting of derivative assets and of securities purchased under agreements
to resell within the consolidated balance sheet as of December 31, 2013 and 2012.
DECEMBER 31, 2013
(In Millions)
GROSS
RECOGNIZED
ASSETS
GROSS
AMOUNTS
OFFSET
NET
AMOUNTS
PRESENTED
GROSS
AMOUNTS
NOT OFFSET
NET
AMOUNT(3)
Derivative Assets(1)
Foreign Exchange Contracts Over the Counter (OTC) $2,612.5 $1,073.3 $1,539.2 $ – $1,539.2Interest Rate Swaps OTC 228.8 47.5 181.3 – 181.3Interest Rate Swaps Exchange Cleared 9.1 9.1 – – –Cross Product Netting Adjustment – 28.4 – – –Cross Product Collateral Adjustment – 210.7 – – –
Total Derivatives Subject to a Master Netting Arrangement 2,850.4 1,369.0 1,481.4 – 1,481.4
Total Derivatives Not Subject to a Master Netting Arrangement 253.2 253.2 – 253.2
Total Derivatives 3,103.6 1,369.0 1,734.6 – 1,734.6
Securities Purchased under Agreements to Resell(2) $ 500.0 $ - $ 500.0 $500.0 $ –
2 0 1 3 A N N U A L R E P O R T T O S H A R E H O L D E R S | N O R T H E R N T R U S T C O R P O R A T I O N 107

notes to consolidated financial statements
DECEMBER 31, 2012
(In Millions)
GROSS
RECOGNIZED
ASSETS
GROSS
AMOUNTS
OFFSET
NET
AMOUNTS
PRESENTED
GROSS
AMOUNTS
NOT OFFSET
NET
AMOUNT(3)
Derivative Assets(1)
Foreign Exchange Contracts OTC $1,756.6 $ 877.1 $879.5 $ – $879.5Interest Rate Swaps OTC 310.3 68.3 242.0 – 242.0Cross Product Netting Adjustment – 37.1 – – –Cross Product Collateral Adjustment – 118.6 – – –
Total 2,066.9 1,101.1 965.8 – 965.8
Securities Purchased under Agreements to Resell(2) $ 35.4 $ – $ 35.4 $35.4 $ –
(1) Derivative assets are reported in other assets in the consolidated balance sheet. Other assets (excluding derivative assets) totaled $3,029.4 million and $2,964.4 million as of December 31,2013 and 2012, respectively.(2) Securities purchased under agreements to resell are reported in federal funds sold and securities purchased under agreements to resell in the consolidated balance sheet. Federal funds soldtotaled $29.6 million and $25.4 million as of December 31, 2013 and 2012, respectively.(3) Northern Trust did not possess any cash collateral that was not offset in the consolidated balance sheet that could have been used to offset the net amounts presented in the consolidatedbalance sheet as of December 31, 2013 and 2012.
The following tables provide information regarding the offsetting of derivative liabilities and of securities sold under agreementsto repurchase within the consolidated balance sheet as of December 31, 2013 and 2012.
DECEMBER 31, 2013
(In Millions)
GROSS
RECOGNIZED
LIABILITIES
GROSS
AMOUNTS
OFFSET
NET
AMOUNTS
PRESENTED
GROSS
AMOUNTS
NOT OFFSET
NET
AMOUNT(2)
Derivative Liabilities(1)
Foreign Exchange Contracts OTC $2,039.0 $1,073.3 $ 965.7 $ – $ 965.7Interest Rate Swaps OTC 163.7 47.5 116.2 – 116.2Interest Rate Swaps Exchange Cleared 31.5 9.1 22.4 – 22.4Cross Product Netting Adjustment – 28.4 – – –Cross Product Collateral Adjustment – 767.7 – – –
Total Derivatives Subject to a Master Netting Arrangement 2,234.2 1,926.0 308.2 – 308.2
Total Derivatives Not Subject to a Master Netting Arrangement 866.7 – 866.7 – 866.7
Total Derivatives 3,100.9 1,926.0 1,174.9 – 1,174.9
Securities Sold under Agreements to Repurchase $ 917.3 $ – $ 917.3 $917.3 $ –
DECEMBER 31, 2012
(In Millions)
GROSS
RECOGNIZED
LIABILITIES
GROSS
AMOUNTS
OFFSET
NET
AMOUNTS
PRESENTED
GROSS
AMOUNTS
NOT OFFSET
NET
AMOUNT(2)
Derivative Liabilities(1)
Foreign Exchange Contracts OTC $1,772.7 $ 877.1 $895.6 $ – $895.6Interest Rate Swaps OTC 249.3 68.3 181.0 – 181.0Credit Default Swaps OTC 1.0 – 1.0 – 1.0Cross Product Netting Adjustment – 37.1 – – –Cross Product Collateral Adjustment – 425.0 – – –
Total 2,023.0 1,407.5 615.5 – 615.5
Securities Sold under Agreements to Repurchase $ 699.8 $ – $699.8 $699.8 $ –
(1) Derivative liabilities are reported in other liabilities in the consolidated balance sheet. Other liabilities (excluding derivative liabilities) totaled $2,338.4 million and $1,961.7 million as ofDecember 31, 2013 and 2012, respectively.(2) Northern Trust did not place any cash collateral with counterparties that was not offset in the consolidated balance sheet that could have been used to offset the net amounts presented in theconsolidated balance sheet as of December 31, 2013 and 2012.
2 0 1 3 A N N U A L R E P O R T T O S H A R E H O L D E R S | N O R T H E R N T R U S T C O R P O R A T I O N 108
notes to consolidated financial statements
All of Northern Trust’s securities sold under agreements
to repurchase (repurchase agreements) and securities
purchased under agreements to resell (reverse repurchase
agreements) involve the transfer of financial assets in exchange
for cash subject to a right and obligation to repurchase those
assets for an agreed upon amount. In the event of a repurchase
failure, the cash or financial assets are available for offset. All
of Northern Trust’s repurchase agreements and reverse
repurchase agreements are subject to a master netting
arrangement, which sets forth the rights and obligations for
repurchase and offset. Under the master netting arrangement,
Northern Trust is entitled to set off receivables from and
collateral placed with a single counterparty against obligations
owed to that counterparty. In addition, collateral held by
Northern Trust can be offset against receivables from that
counterparty.
Derivative asset and liability positions with a single
counterparty can be offset against each other in cases where
legally enforceable master netting arrangements or similar
agreements exist. Derivative assets and liabilities can be
further offset by cash collateral received from, and deposited
with, the transacting counterparty. The basis for this view is
that, upon termination of transactions subject to a master
netting arrangement or similar agreement, the individual
derivative receivables do not represent resources to which
general creditors have rights and individual derivative
payables do not represent claims that are equivalent to the
claims of general creditors. Effective in the second quarter of
2013, Northern Trust centrally clears those interest rate
derivative instruments addressed under Title VII of the Dodd-
Frank Act. These transactions are subject to an agreement
similar to a master netting arrangement, which has the same
rights of offset as described above.
Note 27 – Off-Balance Sheet Financial Instruments
Commitments and Letters of Credit. Northern Trust, in
the normal course of business, enters into various types of
commitments and issues letters of credit to meet the liquidity
and credit enhancement needs of its clients. The contractual
amounts of these instruments represent the potential credit
exposure should the instrument be fully drawn upon and the
client default. To control the credit risk associated with
entering into commitments and issuing letters of credit,
Northern Trust subjects such activities to the same credit
quality and monitoring controls as its lending activities.
Commitments and letters of credit consist of
the following:
Legally Binding Commitments to Extend Credit generally
have fixed expiration dates or other termination clauses. Since
a significant portion of the commitments are expected to
expire without being drawn upon, the total commitment
amount does not necessarily represent future loans or liquidity
requirements.
Standby Letters of Credit obligate Northern Trust to meet
certain financial obligations of its clients, if, under the
contractual terms of the agreement, the clients are unable to
do so. These instruments are primarily issued to support
public and private financial commitments, including
commercial paper, bond financing, initial margin
requirements on futures exchanges, and similar transactions.
Northern Trust is obligated to meet the entire financial
obligation of these agreements and in certain cases is able to
recover the amounts paid through recourse against collateral
received or other participants.
Commercial Letters of Credit are instruments issued by
Northern Trust on behalf of its clients that authorize a third
party (the beneficiary) to draw drafts up to a stipulated
amount under the specified terms and conditions of the
agreement. Commercial letters of credit are issued primarily
to facilitate international trade.
The following table shows the contractual amounts of
commitments and letters of credit.
COMMITMENTS AND LETTERS OF CREDIT
DECEMBER 31,
(In Millions) 2013 2012
Legally Binding Commitments to ExtendCredit(1) $32,174.8 $30,045.7
Standby Letters of Credit(2) 4,451.1 4,573.7Commercial Letters of Credit 24.8 27.9
(1) These amounts exclude $418.5 million and $406.7 million of commitmentsparticipated to others at December 31, 2013 and 2012, respectively.(2) These amounts include $208.9 million and $557.7 million of standby letters of creditsecured by cash deposits or participated to others as of December 31, 2013 and 2012,respectively. The weighted average maturity of standby letters of credit was 25 months atDecember 31, 2013 and 27 months at December 31, 2012.
Other Off-Balance Sheet Financial Instruments. As part
of its securities custody activities and at the direction of its
clients, Northern Trust lends securities owned by clients to
borrowers who are reviewed and approved by the Northern
Trust Senior Credit Committee. In connection with these
activities, Northern Trust has issued indemnifications to
2 0 1 3 A N N U A L R E P O R T T O S H A R E H O L D E R S | N O R T H E R N T R U S T C O R P O R A T I O N 109
notes to consolidated financial statements
certain clients against certain losses that are a direct result of a
borrower’s failure to return securities when due, should the
value of such securities exceed the value of the collateral
required to be posted. Borrowers are required to fully
collateralize securities received with cash or marketable
securities. As securities are loaned, collateral is maintained at a
minimum of 100% of the fair value of the securities plus
accrued interest. The collateral is revalued on a daily basis. The
amount of securities loaned as of December 31, 2013 and 2012
subject to indemnification was $82.7 billion and $69.7 billion,
respectively. Because of the credit quality of the borrowers and
the requirement to fully collateralize securities borrowed,
management believes that the exposure to credit loss from this
activity is not significant and no liability was recorded related
to these indemnifications.
The Bank is a participating member of various cash,
securities, and foreign exchange clearing and settlement
organizations such as The Depository Trust Company in New
York. It participates in these organizations on behalf of its
clients and on its own behalf as a result of its own activities. A
wide variety of cash and securities transactions are settled
through these organizations, including those involving
obligations of states and political subdivisions, asset-backed
securities, commercial paper, dollar placements, and securities
issued by the Government National Mortgage Association.
As a result of its participation in cash, securities, and
foreign exchange clearing and settlement organizations, the
Bank could be responsible for a pro rata share of certain
credit-related losses arising out of the clearing activities. The
method in which such losses would be shared by the clearing
members is stipulated in each clearing organization’s
membership agreement. Credit exposure related to these
agreements varies from day to day, primarily as a result of
fluctuations in the volume of transactions cleared through the
organizations. The estimated credit exposure at December 31,
2013 and 2012 was approximately $73 million and $81
million, respectively, based on the membership agreements
and clearing volume for those days. Controls related to these
clearing transactions are closely monitored by management to
protect the assets of Northern Trust and its clients.
Note 28 – Variable Interest Entities
Variable Interest Entities (VIEs) are defined within GAAP as
entities which either have a total equity investment that is
insufficient to permit the entity to finance its activities without
additional subordinated financial support or whose equity
investors lack the characteristics of a controlling financial
interest. Investors that finance a VIE through debt or equity
interests, or other counterparties that provide other forms of
support, such as guarantees, subordinated fee arrangements,
or certain types of derivative contracts, are variable interest
holders in the entity and the variable interest holder, if any,
that has both the power to direct the activities that most
significantly impact the entity and a variable interest that
could potentially be significant to the entity is deemed to be
the VIE’s primary beneficiary and is required to consolidate
the VIE.
Leveraged Leases. In leveraged leasing transactions,
Northern Trust acts as lessor of the underlying asset subject to
the lease and typically funds 20-30% of the asset’s cost via an
equity ownership in a trust with the remaining 70-80%
provided by third party non-recourse debt holders. In such
transactions, the trusts, which are VIEs, are created to provide
the lessee use of the property with substantially all of the rights
and obligations of ownership. The lessee’s maintenance and
operation of the leased property has a direct effect on the fair
value of the underlying property, and the lessee also has the
ability to increase the benefits it can receive and limit the
losses it can suffer by the manner in which it uses the
property. As a result, Northern Trust has determined that it is
not the primary beneficiary of these VIEs given it lacks the
power to direct the activities that most significantly impact the
economic performance of the VIEs.
Northern Trust’s maximum exposure to loss as a result of
its involvement with the leveraged lease trust VIEs is limited to
the carrying amounts of its leveraged lease investments. As of
December 31, 2013 and 2012, the carrying amounts of these
investments, which are included in loans and leases in the
consolidated balance sheet, were $671.2 million and $673.6
million, respectively. Northern Trust’s funding requirements
relative to the VIEs are limited to its invested capital. Northern
Trust has no other liquidity arrangements or obligations to
purchase assets of the VIEs that would expose Northern Trust
to a loss.
Tax Credit Structures. Northern Trust invests in
community development projects that are designed to
generate a return primarily through the realization of tax
credits. The community development projects are formed as
limited partnerships and LLCs, and Northern Trust typically
invests as a limited partner/investor member in the form of
equity contributions. The economic performance of the
community development projects, which are deemed to be
VIEs, is driven by the performance of their underlying
investment projects as well as the VIEs’ ability to operate in
compliance with the rules and regulations necessary for the
2 0 1 3 A N N U A L R E P O R T T O S H A R E H O L D E R S | N O R T H E R N T R U S T C O R P O R A T I O N 110

notes to consolidated financial statements
qualification of tax credits generated by equity investments.
Northern Trust has determined that it is not the primary
beneficiary of any community development projects as it lacks
the power to direct the activities that most significantly impact
the economic performance of the underlying project or to
affect the VIEs’ ability to operate in compliance with the rules
and regulations necessary for the qualification of tax credits
generated by equity investments. This power is held by the
general partners and managing members who exercise full and
exclusive control of the operations of the VIEs.
Northern Trust’s maximum exposure to loss as a result of
its involvement with community development projects is
limited to the carrying amounts of its investments, including
any undrawn commitments. As of December 31, 2013 and
2012, the carrying amounts of these investments in
community development projects deemed to be VIEs, which
are included in other assets in the consolidated balance sheet,
were $222.3 million and $248.2 million, respectively.
As of December 31, 2013 and 2012, liabilities related to
undrawn commitments on investments in community
development projects, which are included in other liabilities in
the consolidated balance sheet, were $19.8 million and $33.1
million, respectively. Northern Trust’s funding requirements
are limited to its invested capital and any additional undrawn
commitments for future equity contributions. Northern Trust
has no other liquidity arrangements or obligations to purchase
assets of the community development projects that would
expose it to a loss.
Trust Preferred Securities. As discussed in further detail
in Note 13 – Floating Rate Capital Debt, in 1997, Northern
Trust issued Floating Rate Capital Securities, Series A and
Series B, through NTC Capital I and NTC Capital II,
respectively, statutory business trusts wholly-owned by the
Corporation. The sole assets of the trusts are Subordinated
Debentures of the Corporation that have the same interest
rates and maturity dates as the corresponding distribution
rates and redemption dates of the Floating Rate Capital
Securities. NTC Capital I and NTC Capital II are considered
VIEs; however, as the sole asset of each trust is a receivable
from the Corporation and proceeds to the Corporation from
the receivable exceed the Corporation’s investment in the
VIEs’ equity shares, the Corporation is not permitted to
consolidate the trusts, even though the Corporation owns all
of the voting equity shares of the trusts, has fully guaranteed
the trusts’ obligations, and has the right to redeem the
preferred securities in certain circumstances. Northern Trust
recognizes the subordinated debentures on its consolidated
balance sheet as long-term liabilities.
Investment Funds. Northern Trust acts as asset manager
for various funds in which clients of Northern Trust are
investors. As an asset manager of funds, the Corporation earns
a competitively priced fee that is based on assets managed and
varies with each fund’s investment objective. Based on its
analysis, Northern Trust has determined that it is not the
primary beneficiary of these VIEs under GAAP.
Note 29 – Pledged and Restricted Assets
Certain of Northern Trust’s subsidiaries, as required or
permitted by law, pledge assets to secure public and trust
deposits; repurchase agreements; Federal Home Loan Bank
borrowings; and for other purposes, including support for
securities settlement, primarily related to client activities, and
for potential Federal Reserve Bank discount window
borrowings. On December 31, 2013, securities and loans
totaling $32.4 billion ($22.6 billion of government sponsored
agency and other securities, $222.7 million of obligations of
states and political subdivisions, and $9.6 billion of loans),
were pledged. Collateral required for these purposes totaled
$5.0 billion. Included in the total pledged assets are available
for sale securities with a total fair value of $915.3 million
which were pledged as collateral for agreements to repurchase
securities sold transactions. The secured parties to these
transactions have the right to repledge or sell these securities.
Northern Trust is not permitted, by contract or custom,
to repledge or sell collateral from agreements to resell
securities purchased transactions. The total fair value of
accepted collateral as of December 31, 2013 was $500.0
million. There was no repledged or sold collateral as of
December 31, 2013.
Deposits maintained to meet Federal Reserve Bank reserve
requirements averaged $0.9 billion in 2013.
Note 30 – Restrictions on Subsidiary Dividends andLoans or Advances
Various federal and state statutory provisions limit the
amount of dividends the Bank can pay to the Corporation
without regulatory approval. Approval of the Federal Reserve
Board is required for payment of any dividend by a state
chartered bank that is a member of the Federal Reserve System
if the total of all dividends declared by the bank in any
calendar year would exceed the total of its retained net income
(as defined by regulatory agencies) for that year combined
with its retained net income for the preceding two years. In
addition, a state member bank may not pay a dividend in an
2 0 1 3 A N N U A L R E P O R T T O S H A R E H O L D E R S | N O R T H E R N T R U S T C O R P O R A T I O N 111

notes to consolidated financial statements
amount greater than its “undivided profits,” as defined,
without regulatory and stockholder approval.
Under Illinois law, an Illinois state bank, prior to paying a
dividend, must carry over to surplus at least one-tenth of its
net profits since the date of the declaration of the last
preceding dividend, until the bank’s surplus is equal to its
capital. In addition, an Illinois state bank may not pay any
dividend in an amount greater than its net profits then on
hand, after deduction of losses and bad debts (defined as debts
due to a state bank on which interest is past due and unpaid
for a period of 6 months or more, unless the same are well
secured and in the process of collection).
The Bank is also prohibited under federal law from paying
any dividends if the Bank is undercapitalized or if the payment
of the dividends would cause the Bank to become
undercapitalized. In addition, the federal regulatory agencies
are authorized to prohibit a bank or bank holding company
from engaging in an unsafe or unsound banking practice. The
payment of dividends could, depending on the financial
condition of the Bank, be deemed to constitute an unsafe or
unsound practice. The Dodd-Frank Act and Basel III, as
applied by the Federal Reserve Board to state member banks
and their holding companies by regulation or otherwise, may
impose additional restrictions on the ability of banking
institutions to pay dividends.
Under federal law, financial transactions by the Bank, the
Corporation’s insured banking subsidiary, with the
Corporation and its affiliates that are in the form of loans or
extensions of credit, investments, guarantees, derivative
transactions, repurchase agreements, securities lending
transactions or purchases of assets, are restricted. Transfers of
this kind to the Corporation or a nonbanking subsidiary by
the Bank are limited to 10% of the Bank’s capital and surplus
with respect to any single affiliate, and to 20% of the Bank’s
capital and surplus with all affiliates in the aggregate, and are
also subject to certain collateral requirements (in the case of
credit transactions) and other restrictions on covered
transactions. These transactions, as well as other transactions
between the Bank and the Corporation or its affiliates, also
must be on terms substantially the same as, or at least as
favorable as, those prevailing at the time for comparable
transactions with non-affiliated companies or, in the absence
of comparable transactions, on terms, or under circumstances,
including credit standards, that would be offered to, or would
apply to, non-affiliated companies. Other state and federal
laws may limit the transfer of funds by the Corporation’s
banking subsidiaries to the Corporation and certain of its
affiliates.
Note 31 – Business Units and Related Information
Northern Trust is organized around its two principal client-
focused business units, C&IS and Wealth Management. Asset
management and related services are provided to C&IS and
Wealth Management clients primarily by a third business unit,
Asset Management. Northern Trust emphasizes quality
through a high level of service complemented by the effective
use of technology, delivered by a fourth business unit, O&T.
The revenue and expenses of Asset Management are fully
allocated to C&IS and Wealth Management. The revenue and
expenses of O&T are fully allocated to C&IS, Wealth
Management, and Treasury and Other.
C&IS and Wealth Management results are presented to
promote a greater understanding of their financial
performance. The information, presented on an internal
management-reporting basis as opposed to GAAP which is
used for consolidated financial reporting purposes, derives
from internal accounting systems that support Northern
Trust’s strategic objectives and management structure. The
accounting policies used for management reporting are
consistent with those described in Note 1 – Summary of
Significant Accounting Policies.
2 0 1 3 A N N U A L R E P O R T T O S H A R E H O L D E R S | N O R T H E R N T R U S T C O R P O R A T I O N 112

notes to consolidated financial statements
The following tables show the earnings contribution of Northern Trust’s business units for the years ended December 31, 2013,
2012, and 2011.
CORPORATE & INSTITUTIONAL SERVICES RESULTS OF OPERATIONS
(In Millions) 2013 2012 2011
NONINTEREST INCOME
Trust, Investment and Other Servicing Fees $ 1,443.8 $ 1,334.1 $ 1,196.4Foreign Exchange Trading Income 238.8 193.5 315.7Other Noninterest Income 177.3 193.6 169.7
Net Interest Income (FTE) (Note) 275.9 280.1 282.5
Revenue (FTE) (Note) 2,135.8 2,001.3 1,964.3Provision for Credit Losses (3.4) (2.1) (20.5)Noninterest Expense 1,657.9 1,599.9 1,522.4
Income before Income Taxes (Note) 481.3 403.5 462.4Provision for Income Taxes (Note) 145.6 114.3 168.3
Net Income $ 335.7 $ 289.2 $ 294.1
Percentage of Consolidated Net Income 46% 42% 49%
Average Assets $53,308.2 $49,904.0 $47,533.7
WEALTH MANAGEMENT RESULTS OF OPERATIONS
(In Millions) 2013 2012 2011
NONINTEREST INCOME
Trust, Investment and Other Servicing Fees $ 1,166.0 $ 1,071.4 $ 973.1Foreign Exchange Trading Income 5.6 12.6 8.8Other Noninterest Income 116.7 93.6 119.7
Net Interest Income (FTE) (Note) 557.7 629.9 613.7
Revenue (FTE) (Note) 1,846.0 1,807.5 1,715.3Provision for Credit Losses 23.4 27.1 75.5Noninterest Expense 1,215.0 1,182.3 1,214.9
Income before Income Taxes (Note) 607.6 598.1 424.9Provision for Income Taxes (Note) 229.2 226.4 168.7
Net Income $ 378.4 $ 371.7 $ 256.2
Percentage of Consolidated Net Income 52% 54% 42%
Average Assets $22,887.6 $23,917.9 $23,861.5
TREASURY AND OTHER RESULTS OF OPERATIONS
(In Millions) 2013 2012 2011
Noninterest Income $ 8.0 $ 7.0 $ (22.6)Net Interest Income (FTE) (Note) 132.0 121.1 153.1
Revenue (FTE) (Note) 140.0 128.1 130.5Visa Indemnification Benefit – – (23.1)Noninterest Expense (Excluding Visa Indemnification Benefit) 120.9 96.6 117.0
Income before Income Taxes (Note) 19.1 31.5 36.6Provision (Benefit) for Income Taxes (Note) 1.9 5.1 (16.7)
Net Income $ 17.2 $ 26.4 $ 53.3
Percentage of Consolidated Net Income 2% 4% 9%
Average Assets $18,661.9 $19,153.6 $20,552.7
2 0 1 3 A N N U A L R E P O R T T O S H A R E H O L D E R S | N O R T H E R N T R U S T C O R P O R A T I O N 113

notes to consolidated financial statements
CONSOLIDATED FINANCIAL INFORMATION
(In Millions) 2013 2012 2011
NONINTEREST INCOME
Trust, Investment and Other Servicing Fees $ 2,609.8 $ 2,405.5 $ 2,169.5Foreign Exchange Trading Income 244.4 206.1 324.5Other Noninterest Income 302.0 294.2 266.8
Net Interest Income (FTE) (Note) 965.6 1,031.1 1,049.3
Revenue (FTE) (Note) 4,121.8 3,936.9 3,810.1Provision for Credit Losses 20.0 25.0 55.0Visa Indemnification Benefit – – (23.1)Noninterest Expense (Excluding Visa Indemnification Benefit) 2,993.8 2,878.8 2,854.3
Income before Income Taxes (Note) 1,108.0 1,033.1 923.9Provision for Income Taxes (Note) 376.7 345.8 320.3
Net Income $ 731.3 $ 687.3 $ 603.6
Average Assets $94,857.7 $92,975.5 $91,947.9
Note: Stated on an FTE basis. The consolidated figures include $32.5 million, $40.8 million, and $40.2 million, of FTE adjustments for 2013, 2012, and 2011, respectively.
Northern Trust’s international activities are centered within the asset servicing, asset management, foreign exchange, cash
management, and commercial banking businesses. The operations of Northern Trust are managed on a business unit basis and
include components of both U.S and non-U.S. source income and assets. Non-U.S. source income and assets are not separately
identified in Northern Trust’s internal management reporting system. However, Northern Trust is required to disclose non-U.S.
activities based on the domicile of the customer. Due to the complex and integrated nature of Northern Trust’s activities, it is
impossible to segregate with precision revenues, expenses and assets between U.S. and non-U.S. domiciled customers. Therefore,
certain subjective estimates and assumptions have been made to allocate revenues, expenses and assets between U.S. and non-U.S.
operations.
For purposes of this disclosure, all foreign exchange trading income has been allocated to non-U.S. operations. Interest expense
is allocated to non-U.S. operations based on specifically matched or pooled funding. Allocations of indirect noninterest expenses
related to non-U.S. activities are not significant, but when made, are based on various methods such as time, space, and number of
employees.
The table below summarizes international performance based on the allocation process described above without regard to
guarantors or the location of collateral. The U.S. performance includes the impacts of benefits totaling $23.1 million recorded in
2011 from reductions in the Visa indemnification liability. As the Visa indemnification liability was fully eliminated in 2011, there
was no benefit recognized in 2012 or 2013.
DISTRIBUTION OF TOTAL ASSETS AND OPERATING PERFORMANCE
(In Millions) TOTAL ASSETSTOTAL
REVENUEINCOME BEFORE
INCOME TAXES NET INCOME
2013
Non-U.S. $ 30,241.3 $1,101.0 $ 272.4 $201.3U.S. 72,706.0 2,988.3 803.1 530.0
Total $102,947.3 $4,089.3 $1,075.5 $731.3
2012
Non-U.S. $ 29,198.4 $ 992.5 $ 194.9 $ 147.6U.S. 68,265.4 2,903.6 797.4 539.7
Total $ 97,463.8 $ 3,896.1 $ 992.3 $ 687.3
2011
Non-U.S. $ 28,625.2 $ 1,084.8 $ 284.4 $ 199.3U.S. 71,598.5 2,685.1 599.3 404.3
Total $ 100,223.7 $ 3,769.9 $ 883.7 $ 603.6
Note: Total revenue is comprised of net interest income and noninterest income.
2 0 1 3 A N N U A L R E P O R T T O S H A R E H O L D E R S | N O R T H E R N T R U S T C O R P O R A T I O N 114

notes to consolidated financial statements
Note 32 – Regulatory Capital Requirements
Northern Trust and the Bank are subject to various regulatory capital requirements administered by the federal bank regulatory
authorities. Under these requirements, banks must maintain specific ratios of total and tier 1 capital to risk-weighted assets and of
tier 1 capital to adjusted average quarterly assets in order to be classified as “well-capitalized.” The regulatory capital requirements
impose certain restrictions upon banks that meet minimum capital requirements but are not “well-capitalized” and obligate the
federal bank regulatory authorities to take “prompt corrective action” with respect to banks that do not maintain such minimum
ratios. Such prompt corrective action could have a direct material effect on a bank’s financial statements.
As of December 31, 2013 and 2012, the Bank had capital ratios above the level required for classification as a “well-capitalized”
institution and had not received any regulatory notification of a lower classification. Additionally, Northern Trust’s subsidiary banks
located outside the U.S. are subject to regulatory capital requirements in the jurisdictions in which they operate. As of December 31,
2013 and 2012, Northern Trust’s non-U.S. banking subsidiaries had capital ratios above their specified minimum requirements.
There were no conditions or events since December 31, 2013 that management believes have adversely affected the capital
categorization of any Northern Trust subsidiary bank.
The table below summarizes the risk-based capital amounts and ratios for Northern Trust on a consolidated basis and for the
Bank.
ACTUAL
MINIMUM TOQUALIFY AS
WELL CAPITALIZED
($ In Millions) AMOUNT RATIO AMOUNT RATIO
AS OF DECEMBER 31, 2013
Total Capital to Risk-Weighted AssetsConsolidated $9,294.9 15.8% $5,877.4 10.0%The Northern Trust Company 8,366.2 14.3 5,858.8 10.0
Tier 1 Capital to Risk-Weighted AssetsConsolidated 7,853.2 13.4 3,526.4 6.0The Northern Trust Company 6,765.6 11.5 3,515.2 6.0
Tier 1 Capital to Adjusted Average Fourth Quarter AssetsConsolidated 7,853.2 7.9 4,953.7 5.0The Northern Trust Company 6,765.6 6.8 4,939.9 5.0
AS OF DECEMBER 31, 2012
Total Capital to Risk-Weighted AssetsConsolidated $ 8,340.8 14.3% $ 5,831.6 10.0%The Northern Trust Company 7,971.0 13.7 5,803.2 10.0
Tier 1 Capital to Risk-Weighted AssetsConsolidated 7,489.0 12.8 3,499.0 6.0The Northern Trust Company 6,904.2 11.9 3,481.9 6.0
Tier 1 Capital to Adjusted Average Fourth Quarter AssetsConsolidated 7,489.0 8.2 4,543.7 5.0The Northern Trust Company 6,904.2 7.6 4,533.9 5.0
The current risk-based capital guidelines that apply to the
Corporation and the Bank, commonly referred to as Basel I,
are based upon the 1988 capital accord of the International
Basel Committee on Banking Supervision (Basel Committee),
a committee of central banks and bank supervisors, as
implemented by the Federal Reserve Board.
The Corporation is also subject to the Basel II framework
for risk-based capital adequacy. The U.S. bank regulatory
agencies have issued final rules with respect to implementation
of the Basel II framework. Under the final Basel II rules, the
Corporation is one of a small number of “core” banking
organizations. The rules require core banking organizations to
have rigorous processes for assessing overall capital adequacy
in relation to their total risk profiles, and to publicly disclose
certain information about their risk profiles and capital
adequacy.
On September 12, 2010, the Group of Governors and Heads
of Supervision, the oversight body of the Basel Committee,
announced agreement on the calibration and phase-in
arrangements for a strengthened set of capital requirements,
known as Basel III. The U.S.’s implementation of Basel III has
increased the minimum capital thresholds for banking
organizations and tightened the standards for what qualifies as
capital. In October 2013, the U.S. banking agencies proposed a
rule that would introduce quantitative liquidity requirements in
the U.S. for large banking organizations, such as the Corporation
2 0 1 3 A N N U A L R E P O R T T O S H A R E H O L D E R S | N O R T H E R N T R U S T C O R P O R A T I O N 115

notes to consolidated financial statements
and the Bank. The ultimate impact of the U.S. implementation of the new capital and liquidity standards on the Corporation and its bank
subsidiaries is currently being reviewed. At this point we cannot determine the ultimate effect these final and proposed regulations would
have upon our earnings or financial position. However, we believe our capital strength, balance sheet and business model leave us well
positioned for the U.S. implementation of Basel III.
On February 21, 2014, the Corporation was notified by the Federal Reserve Board that both the Corporation and the Bank
would be permitted to exit parallel run. Accordingly, the Corporation and the Bank are required to use the advanced approaches
methodologies to calculate and publicly disclose their risk-based capital ratios beginning with the second quarter of 2014. Current
results from the parallel run of the risk-based capital framework have demonstrated that the use of the advanced approaches
methodologies, inclusive of commitments we provided to the Federal Reserve regarding our approach to the calculation of risk-
weighted assets, has not resulted in common equity tier 1 capital, tier 1 capital or total risk-based capital ratios falling below the
levels required for categorization as “well-capitalized.” These results show that, as of December 31, 2013, the Corporation’s
common equity tier 1 capital ratio as calculated under the advanced approaches methodologies would have been 11.6% on a fully
phased-in basis, while the Corporation’s common equity tier 1 capital ratio under the standardized approach would have been
11.1% on a fully phased-in basis.
Note 33 – Northern Trust Corporation (Corporation only)
Condensed financial information is presented below. Investments in wholly-owned subsidiaries are carried on the equity method
of accounting.
CONDENSED BALANCE SHEET DECEMBER 31,
(In Millions) 2013 2012
ASSETSCash on Deposit with Subsidiary Bank $ 1,566.4 $ 6.5Time Deposits with Subsidiary Banks – 1,691.4Securities 5.3 4.9Advances to Wholly-Owned Subsidiaries – Banks 2,035.0 1,035.0
– Nonbank 5.0 5.0Investments in Wholly-Owned Subsidiaries – Banks 7,101.7 7,225.6
– Nonbank 168.5 142.6Buildings and Equipment – 3.4Other Assets 608.8 377.7
Total Assets $11,490.7 $10,492.1
LIABILITIESSenior Notes $ 1,996.6 $ 2,405.8Long Term Debt 717.8 –Floating Rate Capital Debt 277.1 277.0Other Liabilities 587.2 282.3
Total Liabilities 3,578.7 2,965.1STOCKHOLDERS’ EQUITYCommon Stock 408.6 408.6Additional Paid-in Capital 1,035.7 1,012.7Retained Earnings 7,134.8 6,702.7Accumulated Other Comprehensive Loss (244.3) (283.0)Treasury Stock (422.8) (314.0)
Total Stockholders’ Equity 7,912.0 7,527.0
Total Liabilities and Stockholders’ Equity $11,490.7 $10,492.1
2 0 1 3 A N N U A L R E P O R T T O S H A R E H O L D E R S | N O R T H E R N T R U S T C O R P O R A T I O N 116

notes to consolidated financial statements
CONDENSED STATEMENT OF INCOMEFOR THE YEAR ENDED
DECEMBER 31,
(In Millions) 2013 2012 2011
OPERATING INCOMEDividends – Bank Subsidiaries $ 880.0 $440.0 $500.0
– Nonbank Subsidiaries 21.7 26.2 5.1Intercompany Interest and Other Charges 33.2 30.0 19.8Interest and Other Income 9.0 10.6 13.3
Total Operating Income 943.9 506.8 538.2OPERATING EXPENSES
Interest Expense 78.3 74.9 66.9Other Operating Expenses 20.8 13.0 12.6
Total Operating Expenses 99.1 87.9 79.5
Income before Income Taxes and Equity in Undistributed Net Income of Subsidiaries 844.8 418.9 458.7Benefit for Income Taxes 24.2 21.1 24.8
Income before Equity in Undistributed Net Income of Subsidiaries 869.0 440.0 483.5Equity in Undistributed Net Income of Subsidiaries – Banks (152.5) 266.9 71.0
– Nonbank 14.8 (19.6) 49.1
Net Income $ 731.3 $687.3 $603.6
Net Income Applicable to Common Stock $ 731.3 $687.3 $603.6
CONDENSED STATEMENT OF CASH FLOWSFOR THE YEAR ENDED
DECEMBER 31,
(In Millions) 2013 2012 2011
OPERATING ACTIVITIES:
Net Income $ 731.3 $ 687.3 $ 603.6Adjustments to Reconcile Net Income to Net Cash Provided by (Used in) Operating Activities:
Equity in Undistributed Net Income of Subsidiaries 131.0 (247.3) (120.1)Change in Prepaid Expenses (1.1) (0.9) 0.2Change in Accrued Income Taxes (18.1) 34.7 28.5Other, net 102.6 (36.0) (41.1)
Net Cash Provided by Operating Activities 945.7 437.8 471.1
INVESTING ACTIVITIES:
Change in Time Deposits with Banks 1,691.4 (422.2) 292.1Purchases of Securities – Available for Sale – (0.4) (91.4)Proceeds from Sale, Maturity and Redemption of Securities – Available for Sale 0.2 94.3 105.4Change in Capital Investments in Subsidiaries (13.0) 0.3 (0.5)Advances to Wholly-Owned Subsidiaries (1,000.0) – (750.0)Other, net 1.8 – –
Net Cash Used in Investing Activities 680.4 (328.0) (444.4)
FINANCING ACTIVITIES:
Change in Senior Notes and Long-Term Debt 317.9 300.0 250.0Treasury Stock Purchased (309.7) (162.4) (79.0)Net Proceeds from Stock Options 146.2 106.8 75.6Cash Dividends Paid on Common Stock (220.6) (354.3) (273.7)Other, net – 0.1 0.1
Net Cash Provided by (Used in) Financing Activities (66.2) (109.8) (27.0)
Net Change in Cash on Deposit with Subsidiary Bank 1,559.9 – (0.3)Cash on Deposit with Subsidiary Bank at Beginning of Year 6.5 6.5 6.8
Cash on Deposit with Subsidiary Bank at End of Year $ 1,566.4 $ 6.5 $ 6.5
2 0 1 3 A N N U A L R E P O R T T O S H A R E H O L D E R S | N O R T H E R N T R U S T C O R P O R A T I O N 117

report of independent registered public accounting firm
THE BOARD OF DIRECTORS AND STOCKHOLDERS OF NORTHERN TRUST CORPORATION:
We have audited the accompanying consolidated balance sheets of Northern Trust Corporation and subsidiaries (Northern Trust)
as of December 31, 2013 and 2012, and the related consolidated statements of income, comprehensive income, changes in
stockholders’ equity, and cash flows for each of the years in the three-year period ended December 31, 2013. These consolidated
financial statements are the responsibility of Northern Trust’s management. Our responsibility is to express an opinion on these
consolidated financial statements based on our audits.
We conducted our audits in accordance with the standards of the Public Company Accounting Oversight Board (United States).
Those standards require that we plan and perform the audit to obtain reasonable assurance about whether the financial statements
are free of material misstatement. An audit includes examining, on a test basis, evidence supporting the amounts and disclosures in
the financial statements. An audit also includes assessing the accounting principles used and significant estimates made by
management, as well as evaluating the overall financial statement presentation. We believe that our audits provide a reasonable basis
for our opinion.
In our opinion, the consolidated financial statements referred to above present fairly, in all material respects, the financial
position of Northern Trust Corporation and subsidiaries as of December 31, 2013 and 2012, and the results of their operations and
their cash flows for each of the years in the three-year period ended December 31, 2013, in conformity with U.S. generally accepted
accounting principles.
We also have audited, in accordance with the standards of the Public Company Accounting Oversight Board (United States),
Northern Trust Corporation’s internal control over financial reporting as of December 31, 2013, based on criteria established in
Internal Control – Integrated Framework (1992) issued by the Committee of Sponsoring Organizations of the Treadway
Commission, and our report dated February 26, 2014 expressed an unqualified opinion on the effectiveness of Northern Trust
Corporation’s internal control over financial reporting.
chicago, illinois
february 26, 2014
2 0 1 3 A N N U A L R E P O R T T O S H A R E H O L D E R S | N O R T H E R N T R U S T C O R P O R A T I O N 118

consolidated financial statistics
QUARTERLY FINANCIAL DATA (UNAUDITED)
STATEMENT OF INCOME 2013 2012
($ In Millions Except Per Share Information)FOURTH
QUARTERTHIRD
QUARTERSECOND
QUARTERFIRST
QUARTERFOURTH
QUARTER
THIRD
QUARTER
SECOND
QUARTER
FIRST
QUARTER
Trust, Investment and Other Servicing Fees $ 673.8 $ 648.0 $ 657.3 $ 630.7 $ 622.6 $ 601.9 $ 605.8 $ 575.2Other Noninterest Income 121.5 162.2 143.1 119.6 112.9 125.0 128.6 133.8Net Interest Income
Interest Income 302.4 291.1 275.3 286.7 302.1 323.1 321.5 341.0Interest Expense 52.5 54.1 55.2 60.6 67.9 77.5 67.4 84.6
Net Interest Income 249.9 237.0 220.1 226.1 234.2 245.6 254.1 256.4Provision for Credit Losses 5.0 5.0 5.0 5.0 5.0 10.0 5.0 5.0Noninterest Expense 794.5 740.7 729.7 728.9 741.5 696.4 717.3 723.6Provision for Income Taxes 76.0 95.0 94.7 78.5 55.5 87.3 86.6 75.6
Net Income $ 169.7 $ 206.5 $ 191.1 $ 164.0 $ 167.7 $ 178.8 $ 179.6 $ 161.2
Net Income Applicable to Common Stock $ 169.7 $ 206.5 $ 191.1 $ 164.0 $ 167.7 $ 178.8 $ 179.6 $ 161.2
PER COMMON SHARE
Net Income – Basic $ 0.70 $ 0.85 $ 0.78 $ 0.68 $ 0.69 $ 0.73 $ 0.73 $ 0.66– Diluted 0.70 0.84 0.78 0.67 0.69 0.73 0.73 0.66
AVERAGE BALANCE SHEET ASSETS
Cash and Due from Banks $ 2,676.5 $ 2,776.8 $ 2,964.6 $ 3,392.5 $ 4,059.3 $ 3,446.6 $ 3,860.7 $ 4,002.5Federal Funds Sold and Securities Purchased
under Agreements to Resell 549.7 548.2 309.8 249.5 239.3 285.6 260.3 246.6Interest-Bearing Deposits with Banks 18,264.9 17,767.6 18,192.6 18,099.5 18,355.2 19,215.4 18,788.9 18,246.4Federal Reserve Deposits and Other Interest-
Bearing 13,220.9 7,987.5 5,275.5 3,872.0 4,118.7 6,113.7 3,643.4 7,685.3Securities(1) 30,708.1 30,563.4 30,742.0 31,275.1 30,991.6 29,865.1 31,458.1 31,270.4Loans and Leases 28,858.1 28,662.4 28,601.8 28,661.9 29,180.8 29,046.0 29,057.5 $28,615.6Allowance for Credit Losses Assigned to Loans
and Leases (283.8) (289.6) (290.2) (296.1) (298.1) (297.8) (298.1) (293.0)Other Assets 5,712.3 7,196.2 7,053.5 6,314.9 5,023.7 5,035.3 5,639.8 5,354.3
Total Assets $99,706.7 $95,212.5 $92,849.6 $91,569.3 $91,670.5 $92,709.9 $92,410.6 $95,128.1LIABILITIES AND STOCKHOLDERS’ EQUITYDeposits
Demand and Other Noninterest-Bearing $16,004.8 $16,134.2 $17,468.1 $16,899.1 $21,280.4 $20,235.8 $19,720.1 $19,467.2Savings and Money Market 14,340.8 14,286.5 14,634.7 14,880.3 14,023.4 13,687.1 14,095.6 14,606.8Savings Certificates and Other Time 1,861.6 1,969.0 2,199.1 2,385.6 2,728.9 3,083.6 3,098.3 3,071.4Non-U.S. Offices – Interest-Bearing 47,920.3 43,064.7 39,043.3 39,221.1 37,461.3 38,896.8 36,431.2 38,980.8
Total Deposits 80,127.5 75,454.4 73,345.2 73,386.1 75,494.0 75,903.3 73,345.2 76,126.2Short-Term Borrowings 4,989.9 5,447.2 4,750.0 3,405.5 1,614.2 2,200.7 4,165.6 4,228.2Senior Notes 1,996.5 2,192.5 2,400.1 2,403.9 2,492.6 2,439.6 2,119.5 2,125.2Long-Term Debt 1,485.8 978.5 1,105.2 1,277.7 1,423.7 1,452.9 1,674.9 1,989.4Floating Rate Capital Debt 277.1 277.1 277.1 277.1 277.0 277.0 277.0 277.0Other Liabilities 3,054.2 3,165.0 3,323.7 3,275.8 2,817.0 3,014.5 3,539.6 3,214.8Stockholders’ Equity 7,775.7 7,697.8 7,648.3 7,543.2 7,552.0 7,421.9 7,288.8 7,167.3
Total Liabilities and Stockholders’ Equity $99,706.7 $95,212.5 $92,849.6 $91,569.3 $91,670.5 $92,709.9 $92,410.6 $95,128.1ANALYSIS OF NET INTEREST INCOME
Earning Assets $91,601.7 $85,529.1 $83,121.7 $82,158.0 $82,885.6 $84,525.8 $83,208.2 $86,064.3Interest-Related Funds 72,872.0 68,215.5 64,409.5 63,851.2 60,021.1 62,037.7 61,862.1 65,278.8Noninterest-Related Funds $18,729.7 $17,313.6 $18,712.2 $18,306.8 $22,864.5 $22,488.1 $21,346.1 $20,785.5Net Interest Income (Fully Taxable Equivalent) 259.1 244.8 228.0 233.7 243.6 256.9 264.3 266.3Net Interest Margin (Fully Taxable Equivalent) 1.12% 1.14% 1.10% 1.15% 1.17% 1.21% 1.28% 1.24%COMMON STOCK DIVIDEND AND MARKET
PRICE
Dividends(2) $ 0.31 $ 0.31 $ 0.31 $ 0.30 $ 0.30 $ 0.30 $ – $ 0.58Market Price Range – High 62.00 62.02 59.33 55.50 50.46 49.68 48.31 48.15
– Low 52.40 53.92 51.90 49.27 45.93 43.68 41.11 39.86
(1) Securities include Federal Reserve and Federal Home Loan Bank stock and certain community development investments which are classified in other assets in the consolidated balance sheetas of December 31, 2013 and 2012.(2) Cash dividends of $0.58 per common share were declared in the first quarter of 2012, comprised of a $0.28 per common share dividend declared January 17, 2012, paid April 2, 2012, and a$0.30 per common share dividend declared March 14, 2012, paid July 2, 2012.Note: The common stock of Northern Trust Corporation is traded on the NASDAQ Stock Market under the symbol NTRS.
2 0 1 3 A N N U A L R E P O R T T O S H A R E H O L D E R S | N O R T H E R N T R U S T C O R P O R A T I O N 119

consolidated financial statistics
AVERAGE BALANCE SHEET WITH ANALYSIS OF NET INTEREST INCOME
(INTEREST AND RATE ON A FULLY TAXABLE EQUIVALENT BASIS) 2013 2012
($ In Millions) INTERESTAVERAGEBALANCE RATE(3) INTEREST
AVERAGE
BALANCE RATE(3)
AVERAGE EARNING ASSETS
Federal Funds Sold and Resell Agreements $ 1.9 $ 415.5 0.46% $ 0.5 $ 258.0 0.17%Interest-Bearing Deposits with Banks 142.1 18,080.7 0.79 176.4 18,652.2 0.95Federal Reserve Deposits and Other Interest-Bearing 19.6 7,615.7 0.26 13.9 5,388.8 0.26
SecuritiesU.S. Government 18.3 1,625.8 1.12 23.8 2,269.4 1.05Obligations of States and Political Subdivisions 18.0 281.0 6.40 27.4 421.1 6.52Government Sponsored Agency 109.7 17,548.8 0.63 124.5 18,381.5 0.68Other(1) 129.0 11,364.3 1.14 127.7 9,821.8 1.30
Total Securities 275.0 30,819.9 0.89 303.4 30,893.8 0.98
Loans and Leases(2) 749.4 28,696.5 2.61 834.3 28,975.7 2.88
Total Earning Assets 1,188.0 85,628.3 1.39 1,328.5 84,168.5 1.58
Allowance for Credit Losses Assigned to Loans and Leases – (289.9) – – (296.7) –Cash and Due from Banks – 2,950.4 – – 3,841.8 –Buildings and Equipment – 459.0 – – 471.0 –Client Security Settlement Receivables – 785.8 – – 492.3 –Goodwill – 533.6 – – 535.2 –Other Assets – 4,790.5 – – 3,763.4 –
Total Assets $ – $94,857.7 –% $ – $92,975.5 –%
AVERAGE SOURCE OF FUNDS
DepositsSavings and Money Market $ 9.7 $14,533.4 0.07% $ 18.3 $14,101.9 0.13%Savings Certificates and Other Time 12.4 2,102.0 0.59 20.1 2,995.1 0.67Non-U.S. Offices – Interest-Bearing 81.2 42,338.3 0.19 118.3 37,943.8 0.31
Total Interest-Bearing Deposits 103.3 58,973.7 0.18 156.7 55,040.8 0.28Short-Term Borrowings 5.2 4,654.7 0.11 5.6 3,045.9 0.18Senior Notes 74.4 2,247.0 3.31 72.0 2,295.2 3.14Long-Term Debt 37.1 1,211.7 3.06 60.3 1,634.1 3.69Floating Rate Capital Debt 2.4 277.1 0.85 2.8 277.0 1.04
Total Interest-Related Funds 222.4 67,364.2 0.33 297.4 62,293.0 0.48%
Interest Rate Spread – – 1.06 – – 1.10Demand and Other Noninterest-Bearing Deposits – 16,622.6 – – 20,179.0 –Other Liabilities – 3,203.9 – – 3,145.3 –Stockholders’ Equity – 7,667.0 – – 7,358.2 –
Total Liabilities and Stockholders’ Equity $ – $94,857.7 –% $ – $92,975.5 –%
Net Interest Income/Margin (FTE Adjusted) $ 965.6 $ – 1.13% $1,031.1 $ – 1.22%
Net Interest Income/Margin (Unadjusted) $ 933.1 $ – 1.09% $ 990.3 $ – 1.18%
Net Interest Income/Margin ComponentsU.S. $ 814.9 $61,223.6 1.33% $ 889.3 $59,907.2 1.48%Non-U.S. 150.7 24,404.7 0.62 141.8 24,261.3 0.58
Consolidated $ 965.6 $85,628.3 1.13% $1,031.1 $84,168.5 1.22%
(1) Other securities include Federal Reserve and Federal Home Loan Bank stock and certain community development investments which are classified in other assets on the consolidated balancesheet as of December 31, 2013 and 2012.(2) Average balances include nonaccrual loans. Lease financing receivable balances are reduced by deferred income.(3) Rate calculations are based on actual balances rather than the rounded amounts presented in the Average Consolidated Balance Sheet with Analysis of Net Interest Income.Notes: Net Interest Income (FTE Adjusted) includes adjustments to a fully taxable equivalent basis for loans and securities. Such adjustments are based on a blended federal and state tax rate of
37.5%. Total taxable equivalent interest adjustments amounted to $32.5 million in 2103, $40.8 million in 2012, $40.2 million in 2011, $39.1 million in 2010, $40.2 million in 2009.Interest revenue on cash collateral positions is reported above within interest-bearing deposits with banks and within loans and leases. Interest expense on cash collateral positions isreported above within non-U.S. offices interest-bearing deposits. Related cash collateral received from and deposited with derivative counterparties is recorded net of the associatedderivative contract within other assets and other liabilities, respectively.
2 0 1 3 A N N U A L R E P O R T T O S H A R E H O L D E R S | N O R T H E R N T R U S T C O R P O R A T I O N 120

consolidated financial statistics
2011 2010 2009
INTEREST
AVERAGE
BALANCE RATE(3) INTEREST
AVERAGE
BALANCE RATE(3) INTEREST
AVERAGE
BALANCE RATE(3)
$ 0.2 $ 261.0 0.09% $ 0.5 $ 293.9 0.18% $ 0.7 $ 375.7 0.21%192.8 17,124.5 1.13 134.6 14,599.7 0.92 209.6 15,359.9 1.3628.3 10,610.2 0.27 13.5 5,598.2 0.24 11.6 4,880.2 0.24
23.4 1,766.5 1.32 1.1 162.0 0.67 0.2 41.8 0.5040.4 605.6 6.67 47.4 726.9 6.52 53.5 817.5 6.55
102.4 14,290.0 0.72 116.6 11,802.2 0.99 147.7 11,900.4 1.24117.8 9,744.3 1.21 84.7 7,168.1 1.18 76.0 4,598.1 1.65
284.0 26,406.4 1.08 249.8 19,859.2 1.26 277.4 17,357.8 1.60
943.5 28,346.7 3.33 937.4 27,514.4 3.41 946.9 28,697.2 3.30
1,448.8 82,748.8 1.75 1,335.8 67,865.4 1.97 1,446.2 66,670.8 2.17
– (305.3) – – (313.0) – – (275.0) –– 3,845.3 – – 2,788.4 – – 2,535.8 –– 500.7 – – 534.7 – – 537.3 –– 429.1 – – 399.7 – – 419.7 –– 466.0 – – 396.3 – – 398.4 –– 4,263.3 – – 4,336.7 – – 4,027.2 –
$ – $91,947.9 –% $ – $76,008.2 –% $ – $74,314.2 –%
$ 26.0 $14,297.6 0.18% $ 34.9 $13,049.5 0.27% $ 53.7 $11,162.4 0.48%27.8 3,605.4 0.77 40.4 3,704.6 1.09 73.2 3,879.1 1.89
176.1 39,973.5 0.44 125.7 29,968.4 0.42 80.1 27,157.6 0.29
229.9 57,876.5 0.40 201.0 46,722.5 0.43 207.0 42,199.1 0.498.2 4,466.8 0.18 11.2 5,849.5 0.19 11.0 6,748.7 0.16
64.4 1,983.3 3.25 48.6 1,509.0 3.22 44.0 1,388.6 3.1794.6 2,446.3 3.87 114.8 2,821.6 4.07 139.9 3,058.5 4.572.4 276.9 0.88 2.4 276.8 0.87 4.3 276.7 1.54
399.5 67,049.8 0.60% 378.0 57,179.4 0.66 406.2 53,671.6 0.76
– – 1.15 – – 1.31 – – 1.41– 14,569.9 – – 8,860.6 – – 11,026.9 –– 3,304.0 – – 3,333.8 – – 3,011.6 –– 7,024.2 – – 6,634.4 – – 6,604.1 –
$ – $91,947.9 –% $ – $76,008.2 –% $ – $74,314.2 –%
$1,049.3 $ – 1.27% $ 957.8 $ – 1.41% $1,040.0 $ – 1.56%
$1,009.1 $ – 1.22% $ 918.7 $ – 1.35% $ 999.8 $ – 1.50%
$ 911.2 $59,053.7 1.54% $ 863.6 $49,776.5 1.73% $ 859.8 $49,270.9 1.75%138.1 23,695.1 0.58 94.2 18,088.9 0.52 180.2 17,399.9 1.04
$1,049.3 $82,748.8 1.27% $ 957.8 $67,865.4 1.41% $1,040.0 $66,670.8 1.56%
2 0 1 3 A N N U A L R E P O R T T O S H A R E H O L D E R S | N O R T H E R N T R U S T C O R P O R A T I O N 121

board of directors
NORTHERN TRUST CORPORATION
Board of Directors
Frederick H. Waddell
Chairman and Chief Executive Officer
Northern Trust Corporation and
The Northern Trust Company (6)
Linda Walker Bynoe
President and Chief Executive Officer
Telemat Ltd.
Project management and consulting firm (1, 2, 6)
Nicholas D. Chabraja
Retired Chairman and Chief Executive Officer
General Dynamics Corporation
Global defense, aerospace, and other technology
products manufacturer (1, 4, 6)
Susan Crown
Vice President
Henry Crown and Company
Global company with diversified investments in banking,
transportation, real estate, and other industries;
Chief Executive Officer
Owl Creek Partners, LLP
Venture capital investment vehicle;
Chairman and Founder
Susan Crown Exchange Inc.
Social investment organization that connects talent and
innovations with market forces to drive social change (4, 5)
Dipak C. Jain
Chaired Professor of Marketing
INSEAD
International graduate business school (3, 4, 6)
Robert W. Lane
Retired Chairman and Chief Executive Officer
Deere & Company
Global provider of agricultural, construction, and
forestry equipment, and financial services (1, 5)
Edward J. Mooney
Retired Délégué Général – North America
Suez Lyonnaise des Eaux
Global provider of energy, water, waste, and
communications services;
Retired Chairman and Chief Executive Officer
Nalco Chemical Company
Manufacturer of specialized service chemicals (1, 2, 4, 6)
Jose Luis Prado
President
Quaker Oats North America, a division of PepsiCo, Inc.
Global food and beverage company (2, 3)
John W. Rowe
Chairman Emeritus
Exelon Corporation
Producer and wholesale marketer of energy (4, 5, 6)
Martin P. Slark
Vice Chairman and Chief Executive Officer
Molex Incorporated
Manufacturer of electronic, electrical, and fiber optic
interconnection products and systems (2, 3)
David H.B. Smith Jr.
Executive Vice President – Policy & Legal Affairs
and General Counsel
Mutual Fund Directors Forum
Nonprofit membership organization for investment
company directors (1, 2)
Charles A. Tribbett III
Managing Director
Russell Reynolds Associates
Global executive recruiting firm (3, 5)
Adv i so ry D i re c to r
Sir John R.H. Bond
Former Chairman
Xstrata plc
Global diversified mining group (2, 3)
Board Committees1. Audit Committee
2. Business Risk Committee
3. Business Strategy Committee
4. Compensation and Benefits Committee
5. Corporate Governance Committee
6. Executive Committee
2 0 1 3 A N N U A L R E P O R T T O S H A R E H O L D E R S | N O R T H E R N T R U S T C O R P O R A T I O N 122

senior officers
NORTHERN TRUST CORPORATIONTHE NORTHERN TRUST COMPANY
Management Group
Frederick H. WaddellChairman and Chief Executive Officer
S. Biff BowmanExecutive Vice PresidentHuman Resources
Jeffrey D. CohodesExecutive Vice PresidentChief Risk Officer
Steven L. FradkinPresident –Corporate & Institutional Services
William L. MorrisonPresident and Chief Operating Officer
Michael G. O’GradyExecutive Vice PresidentChief Financial Officer
Stephen N. PotterPresident –Asset Management
Jana R. SchreuderPresident –Wealth Management
Joyce M. St. ClairPresident –Operations & Technology
Kelly R. WelshExecutive Vice PresidentGeneral Counsel
THE NORTHERN TRUST COMPANY
Operating Group
Steven R. BellPresidentWealth Management – West
Aileen B. BlakeExecutive Vice PresidentEnterprise Productivity
David C. BlowersPresidentWealth Management – East
Robert P. BrowneExecutive Vice PresidentChief Investment Officer
Peter B. CherecwichExecutive Vice PresidentGlobal Fund ServicesCorporate & Institutional Services
David W. Fox, Jr.Executive Vice PresidentCorporate & Institutional Services –Americas
J. Jeffery KauffmanExecutive Vice PresidentGlobal Family OfficeWealth Management
Wilson LeechExecutive Vice PresidentCorporate & Institutional Services –Europe, Middle East, and Africa
Mac MacLellanExecutive Vice PresidentWealth Management – Central
Scott S. MurrayExecutive Vice PresidentChief Technology Officer
Teresa A. ParkerExecutive Vice PresidentCorporate & Institutional Services –Asia Pacific
Alan W. RobertsonExecutive Vice PresidentClient Solutions GroupAsset Management
Jason J. TylerSenior Vice PresidentCorporate Strategy
2 0 1 3 A N N U A L R E P O R T T O S H A R E H O L D E R S | N O R T H E R N T R U S T C O R P O R A T I O N 123

corporate information
COMPARISON OF FIVE-YEAR CUMULATIVE TOTAL RETURN
The graph below compares the cumulative total stockholder return on the Corporation’s common stock to the cumulative total
return of the S&P 500 Index and the KBW Bank Index for the five fiscal years which ended December 31, 2013. The cumulative total
stockholder return assumes the investment of $100 in the Corporation’s common stock and in each index on December 31, 2008
and assumes reinvestment of dividends. The KBW Bank Index is a modified-capitalization-weighted index made up of 24 of the
largest banking companies in the United States. The Corporation is included in the S&P 500 Index and the KBW Bank Index.
Tota l Return Assumes $100 Invested onDecember 31, 2008 with Reinvestment of Div idends
Five-Year Cumulative Total Return
2008 2009 2010 2011 2012 2013
$40
$100
$160
$280
$220
Northern Trust S&P 500 KBW Bank Index
DECEMBER 31,
2008 2009 2010 2011 2012 2013
Northern Trust 100 103 111 81 106 133S&P 500 100 126 146 149 172 228KBW Bank Index 100 98 121 93 124 170
2 0 1 3 A N N U A L R E P O R T T O S H A R E H O L D E R S | N O R T H E R N T R U S T C O R P O R A T I O N 124

corporate information
ANNUAL MEETING
The 2014 Annual Meeting of Stockholders will be held onTuesday, April 15, 2014, at 10:30 A.M. (Central Time) at 50South La Salle Street, Chicago, Illinois. If you plan to attendthe Annual Meeting, please review the information regardingattendance contained in the 2014 Proxy Statement.
STOCK LISTING
The common stock of Northern Trust Corporation is tradedon the NASDAQ Stock Market under the symbol NTRS.
STOCK TRANSFER AGENT, REGISTRAR,AND DIVIDEND DISBURSING AGENT
Wells Fargo Bank, N.A.Shareowner Services1110 Centre Pointe Curve, Suite 101Mendota Heights, MN 55120General Phone Number: 1-800-468-9716Internet Site: www.shareowneronline.com
AVAILABLE INFORMATION
Through our website at northerntrust.com, we make availablefree of charge our annual report on Form 10-K, quarterlyreports on Form 10-Q, current reports on Form 8-K, and allamendments to those reports filed or furnished pursuant toSection 13(a) or 15(d) of the Exchange Act as soon asreasonably practicable after we file such material with, orfurnish such material to, the Securities and ExchangeCommission.
FORM 10-K REPORT
Copies of the Corporation’s Form 10-K for the year endedDecember 31, 2013, will be mailed to stockholders and otherinterested persons upon written request to:
Stephanie S. GreischCorporate SecretaryNorthern Trust Corporation50 South La Salle Street, M-9Chicago, Illinois 60603
QUARTERLY EARNINGS RELEASES
Copies of the Corporation’s quarterly earnings releasesmay be obtained by accessing Northern Trust’s websiteat northerntrust.com or by calling the CorporateCommunications department at 312-444-4272.
INVESTOR RELATIONS
Please direct Investor Relations inquiries to:
Beverly J. Fleming, Director of Investor Relations,
at 312-444-7811 or [email protected].
NORTHERNTRUST.COM
Information about the Corporation, including financialperformance and products and services, is available onNorthern Trust’s website at northerntrust.com.
2 0 1 3 A N N U A L R E P O R T T O S H A R E H O L D E R S | N O R T H E R N T R U S T C O R P O R A T I O N 125

northerntrust .com

northerntrust .com

northerntrust .com

2013 2012 percent chAnge
For the year ($ In mIllIons)
revenues (taxable-equivalent Basis) $ 4,121.8 $ 3,936.9 5 %
net Income 731.3 687.3 6
dividends declared on common stock 299.2 286.9 4
Per Common Share
net Income — Basic $ 3.01 $ 2.82 7 %
— diluted 2.99 2.81 6
dividends declared 1.23 1.18 4
Book Value — end of period 33.34 31.51 6
market price — end of period 61.89 50.16 23
averageS ($ In mIllIons)
Assets $ 94,857.7 $ 92,975.5 2 %
earning Assets 85,628.5 84,168.5 2
securities 30,819.9 30,893.8 —
loans and leases 28,696.5 28,975.7 (1)
deposits 75,596.3 75,219.8 1
stockholders’ equity 7,667.0 7,358.2 4
at year end ($ In mIllIons)
Assets $ 102,947.3 $ 97,463.8 6 %
earning Assets 93,367.2 87,472.7 7
securities 30,720.3 31,033.5 (1)
loans and leases 29,385.5 29,504.5 —
Allowance for credit losses Assigned to loans and leases (278.1) (297.9) (7)
deposits 84,098.1 81,407.8 3
stockholders’ equity 7,912.0 7,527.0 5
ratioS
return on Average common equity 9.54 % 9.34 %
return on Average Assets 0.77 0.74
dividend payout ratio 41.1 42.0
tier 1 capital to risk-Weighted Assets — end of period 13.4 12.8
total capital to risk-Weighted Assets — end of period 15.8 14.3
tier 1 leverage ratio 7.9 8.2
at year end ($ In BIllIons)
Assets under management $ 884.5 $ 758.9 17 %
Assets under custody 5,575.7 4,804.9 16
global custody Assets 3,248.9 2,686.1 21
c o n s o l I d A t e d F I n A n c I A l h I g h l I g h t s
the 2013 northern trust corporation Annual report is printed on 20% recycled paper
made from fiber sourced from well-managed forests and is independently certified to the
Forest stewardship counciltm (Fsc®) standards.
© northern trust corporation
Q1 VersionNorthern Trust Bank #1019102013 AR Cover Back 02.14.2014CYAN MAG YELL BLK pms343

A n n u A l r e p o r t to shAreholdersNorthern Trust Corporation
t W o t h o u s A n d t h I r t e e n
Northern Trust Corporation
5 0 s o u t h l A s A l l e s t r e e t
c h I c Ag o , I l l I n o I s 6 0 6 0 3
n o r t h e r n t r u s t . c o m
no
rthern
trust c
orpo
rAtIo
n 2013 A
nn
uA
l report to
shA
reho
lders
.75 Point in sPine Q1 VersionNorthern Trust Bank #1019102013 AR Cover Front 02.12.2014CYAN MAG YELL BLK pms343