20120122 ch 0 ex summary...70 80 90 100 percent 14.7 18 35.2 28.7 14.9 20 49.1 44.7 55.3 42.4 40.5...
TRANSCRIPT

A. Definitions:
The total population size of a province or other defined area.
B. Significance/Use:
A population’s size and age/sex composition im-pact the health status of a region and its need for health services.
Population data also pro-vide the “denominators” used to calculate rates for most health and social indicators.
Useful to target sub-populations and to deter-mine required services in planning preventive and promotional interven-tions.
C. Limitations:
Considered more as a descriptor than an indi-cator.
Certain subgroups are less well counted than others, e.g., young adults (18 to under 35 years).
Does not include home-less people, or people living on Reserves that have chosen not to par-ticipate in the Census.
D. Source:
2006 Canadian Census, Statistics Canada.
SUMMARY OF FINDINGS:
Saskatchewan had the sixth largest population in Canada.
Of the three western prairie provinces, Saskatchewan had the smallest population. Alberta has the largest population, followed by Manitoba.
Saskatchewan had the seventh largest land mass in Canada.
Of the three western prairie provinces, Saskatchewan had the second largest lass mass. Alberta had the largest land mass and Manitoba had the smallest.
���� � � � �� � � � � � � � � �
������������������������������������������ !�� �� ���" !�#$$%
0
5
10
15
20
25
30
35
40
� �� �
�
13.0 10.4 3.1 3.6 38.5 23.9 2.3 2.9 0.4 1.6 0.1 0.1 0.1
4,113,487 3,290,350 968,157 1,148,401 12,160,282 7,546,131 729,997 913,462 135,851 505,469 30,372 41,464 29,474BC AB SK MB ON QC NB NS PE NF YT NW NU
��������������������������&�''����������� !�� �� ��!�#$$%
0
5
10
15
20
25
� ��
��
10.3 7.1 6.5 6.1 10.1 15.0 0.8 0.6 0.1 4.1 5.3 12.7 21.4
BC AB SK MB ON QC NB NS PE NF YT NW NU

Population: Saskatchewan population by health region, percent, 2006
0
5
10
15
20
25
30
Perc
ent
5.3 5.4 4.3 24.4 5.5 29.0 4.2 4.1 7.6 6.8 2.0 1.1 0.2
51,316 51,868 41,785 236,357 53,600 281,227 40,960 39,866 73,487 65,364 19,569 10,512 2,246
SCRHA FHRHA CRHA RQRHA SRRHA SRHA HRHA KTRHA PAPRHA PNRHA MCRRHA KYRHA AHA
A. Definitions:
The total population size of a province or other defined area.
B. Significance/Use:
A population’s size and age/sex composition im-pact the health status of a region and its need for health services.
Population data also pro-vide the “denominators” used to calculate rates for most health and social indicators.
Useful to target sub-populations and to deter-mine required services in planning preventive and promotional interven-tions.
C. Limitations:
Considered more as a descriptor than an indi-cator.
Certain subgroups are less well counted than others, e.g., young adults (18 to under 35 years).
Does not include home-less people, or people living on Reserves that have chosen not to par-ticipate in the Census.
D. Source:
2006 Canadian Census, Statistics Canada.
SUMMARY OF FINDINGS:
Of Saskatchewan’s 13 regions, Saskatoon (SRHA) and Regina Qu’Appelle (RQRHA) contained the largest population percentages at 29 percent and 24.4 percent, respectively.
Saskatchewan’s 15 cities comprised 56.1 percent of Saskatchewan’s population (the city of Lloydminster crosses the Saskatchewan - Alberta border and only the population that resided in Saskatchewan were included in these percentages).
Regina and Saskatoon, with populations well-over 150,000 residents, contained almost 40 percent of the total Saskatchewan population.
C H A R T 3 - 2 P O P U L A T I O N
Population: Saskatchewan city populations, 2006
0
50,000
100,000
150,000
200,000
250,000
Pop
ulat
ion
10,084 4,998 8,118 4,968 4,771 5,192 4,149 32,132 13,190 34,138 179,246 202,340 14,946 9,433 15,038
Estevan HumboldtLloyd-minster (Part)
Martens-ville
Meadow Lake Melfort Melville
Moose Jaw
North Battleford
Prince Albert Regina
Saska-toon
Sw ift Current Weyburn Yorkton

A. Definitions:
The total population size of a province or other defined area.
B. Significance/Use:
A population’s size and age/sex composition im-pact the health status of a region and its need for health services.
Population data also pro-vide the “denominators” used to calculate rates for most health and social indicators.
Useful to target sub-populations and to deter-mine required services in planning preventive and promotional interven-tions.
C. Limitations:
Considered more as a descriptor than an indi-cator.
Certain subgroups are less well counted than others, e.g., young adults (18 to under 35 years).
Does not include home-less people, or people living on Reserves that have chosen not to par-ticipate in the Census.
D. Source:
2006 Canadian Census, Statistics Canada.
SUMMARY OF FINDINGS:
Saskatchewan had the eighth highest largest rural population percentage in Canada. Of the three western prairie provinces, Saskatchewan had the largest rural population percentage. Manitoba had the next largest rural population percentage and Alberta had the smallest percentage.
Amongst the Saskatchewan RHAs, Keewatin Yatthé RHA (KYRHA) and Athabasca HA (AHA) had the largest rural population percentage. Amongst the non-northern RHAs, Kelsey Trail (KYRHA) and Heartland (HRHA) had the largest rural population percentages and Saskatoon RHA (SRHA) and Regina Qu’Appelle RHA (RQRHA) had the smallest percentage.
C H A R T 3 - 3 P O P U L A T I O N : R U R A L P O P U L A T I O N
Population: Rural population by provinces, percent, 2006
0
10
20
30
40
50
60
70
80
90
100
Perc
ent
14.7 18 35.2 28.7 14.9 20 49.1 44.7 55.3 42.4 40.5 41.8 56.8 19.9
BC AB SK MB ON QC NB NS PE NF YT NW NU CAN
Population: Rural population by RHA, percent, 2006
0
10
20
30
40
50
60
70
80
90
100
Per
cent
55.6 31.4 55.1 18.2 47.2 19.3 62.9 65.4 51.5 55.2 60.4 100 100 35.2
SCRHA FHRHA CRHA RQRHA SRRHA SRHA HRHA KTRHA PAPHA PNRHA MCR RHA KYRHA AHA SK
������������������������ �'����� ��'(�)&����������� *� �������!�#$$%
0
5
10
15
20
25
����
�����
���
�'���
�� ��'(�)&
Density 4.4 5.1 1.6 2.1 13.4 5.6 10.2 17.3 23.9 1.4 0.1 0.0 0.0 3.5
BC AB SK MB ON QC NB NS PE NF YT NW NU CAN
A. Definitions:
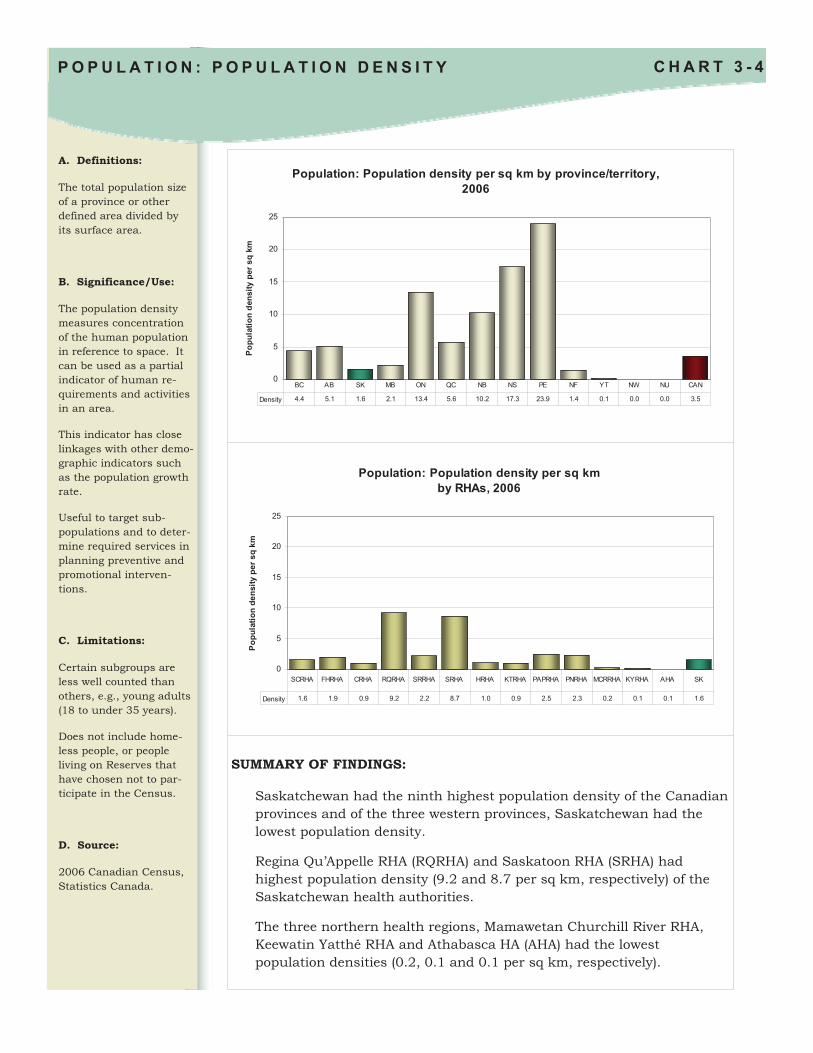
The total population size of a province or other defined area divided by its surface area.
B. Significance/Use:
The population density measures concentration of the human population in reference to space. It can be used as a partial indicator of human re-quirements and activities in an area.
This indicator has close linkages with other demo-graphic indicators such as the population growth rate.
Useful to target sub-populations and to deter-mine required services in planning preventive and promotional interven-tions.
C. Limitations:
Certain subgroups are less well counted than others, e.g., young adults (18 to under 35 years).
Does not include home-less people, or people living on Reserves that have chosen not to par-ticipate in the Census.
D. Source:
2006 Canadian Census, Statistics Canada.
SUMMARY OF FINDINGS:
Saskatchewan had the ninth highest population density of the Canadian provinces and of the three western provinces, Saskatchewan had the lowest population density.
Regina Qu’Appelle RHA (RQRHA) and Saskatoon RHA (SRHA) had highest population density (9.2 and 8.7 per sq km, respectively) of the Saskatchewan health authorities.
The three northern health regions, Mamawetan Churchill River RHA, Keewatin Yatthé RHA and Athabasca HA (AHA) had the lowest population densities (0.2, 0.1 and 0.1 per sq km, respectively).
���� � � � + �� � � � � � � � � � � � � � � � � � � � � , - � . � � / �
������������������������ �'����� ��'(�)&������'!�#$$%
0
5
10
15
20
25
����
�����
���
�'���
�� ��'(�)&
Density 1.6 1.9 0.9 9.2 2.2 8.7 1.0 0.9 2.5 2.3 0.2 0.1 0.1 1.6
SCRHA FHRHA CRHA RQRHA SRRHA SRHA HRHA KTRHA PAPRHA PNRHA MCRRHA KYRHA AHA SK

������������.�')���0 1������������������'!�#$$%
0
50,000
100,000
150,000
200,000
250,000
���
�������
10,084 4,998 8,118 4,968 4,771 5,192 4,149 32,132 13,190 34,138 179,246 202,340 14,946 9,433 15,038
Estevan HumboldtLloyd-minster (Part)
Martens-ville
Meadow Lake Melfort Melville
Moose Jaw
North Battleford
Prince Albert Regina
Saska-toon
Sw ift Current Weyburn Yorkton
A. Definitions:
The total population size of a province or other defined area divided by its surface area.
B. Significance/Use:
The population density measures concentration of the human population in reference to space. It can be used as a partial indicator of human re-quirements and activities in an area.
This indicator has close linkages with other demo-graphic indicators such as the population growth rate.
Useful to target sub-populations and to deter-mine required services in planning preventive and promotional interven-tions.
C. Limitations:
Certain subgroups are less well counted than others, e.g., young adults (18 to under 35 years).
Does not include home-less people, or people living on Reserves that have chosen not to par-ticipate in the Census.
D. Source:
2006 Canadian Census, Statistics Canada.
SUMMARY OF FINDINGS:
Saskatchewan’s 15 cities varied in 2006 populations from a low of 4,149 for Melville to a high of 202,340 for Saskatoon.
Regina and Saskatoon were the two largest cities in Saskatchewan with populations of 179,246 and 202,304 respectively.
Of the cities found in Saskatchewan, Regina had the highest population density (1507.9 people per square kilometre) and Melville had the lowest population density (280 people per square kilometre).
���� � � � 2 �� � � � � � � � � � � � � � � � � � � � � , - � . � � / �
������������.�')���0 1������� '������������� �'���!�#$$%
0
200
400
600
800
1,000
1,200
1,400
1,600
����
�����
��,
�'���
�� ��'(�)&
574.4 426.4 468.2 1040 599.8 351.3 280 686.3 393.2 519.7 1507.9 1184.4 621.8 597.7 612.2
Estevan HumboldtLloyd-
minster (Part)
Martens-ville
Meadow Lake
Melfort Melvil leMoose
JawNorth
BattlefordPrince Albert
ReginaSaska-toon
Swift Current
Weyburn Yorkton
� ��/ ��������������3��1�0�44%#$$%!����'�����.5
-15
-13
-11
-9
-7
-5
-3
-1
1
3
5
� �� �
���0�
�"
-11.1 -9.6 -8.5 -0.9 -11.8 4.0 -13.0 -7.1 -0.1 0.3 4.0 -2.2
SCRHA FHRHA CRHA RQRHA SRRHA SRHA HRHA KTRHA PAPRHA PNRHA MCR/KY/AHA
SK
A. Definitions:
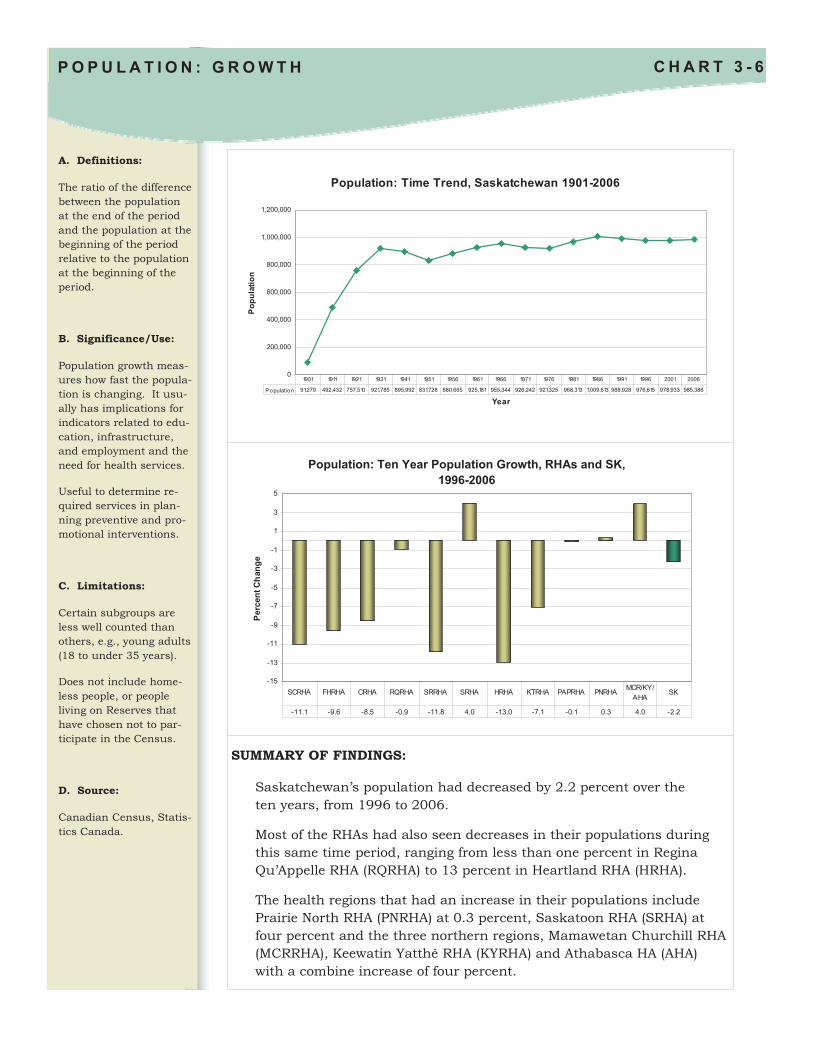
The ratio of the difference between the population at the end of the period and the population at the beginning of the period relative to the population at the beginning of the period.
B. Significance/Use:
Population growth meas-ures how fast the popula-tion is changing. It usu-ally has implications for indicators related to edu-cation, infrastructure, and employment and the need for health services.
Useful to determine re-quired services in plan-ning preventive and pro-motional interventions.
C. Limitations:
Certain subgroups are less well counted than others, e.g., young adults (18 to under 35 years).
Does not include home-less people, or people living on Reserves that have chosen not to par-ticipate in the Census.
D. Source:
Canadian Census, Statis-tics Canada.
������������� ��/ ��������������3��1�0!����'�����.5!��44%#$$%�
SUMMARY OF FINDINGS:
Saskatchewan’s population had decreased by 2.2 percent over the ten years, from 1996 to 2006.
Most of the RHAs had also seen decreases in their populations during this same time period, ranging from less than one percent in Regina Qu’Appelle RHA (RQRHA) to 13 percent in Heartland RHA (HRHA).
The health regions that had an increase in their populations include Prairie North RHA (PNRHA) at 0.3 percent, Saskatoon RHA (SRHA) at four percent and the three northern regions, Mamawetan Churchill RHA (MCRRHA), Keewatin Yatthé RHA (KYRHA) and Athabasca HA (AHA) with a combine increase of four percent.
���� � � � % �� � � � � � � � � � � 3 ��6�� �
��������������& ��� ��!�.�')���0 1���4$#$$%
0
200,000
400,000
600,000
800,000
1,000,000
1,200,000
/ ��
���
�������
Population 91,279 492,432 757,510 921,785 895,992 831,728 880,665 925,181 955,344 926,242 921,325 968,313 1,009,613 988,928 976,615 978,933 985,386
1901 1911 1921 1931 1941 1951 1956 1961 1966 1971 1976 1981 1986 1991 1996 2001 2006

�����������3��1�0!������������.�')���0 1��
-4
-2
0
2
4
6
8
10
12
14
16
� �� ����0�
�"
CAN 14.79 13.42 9.74 7.76 6.60 5.87 3.97 7.85 5.68 4.02 5.35
SK 5.88 5.05 3.26 -3.05 -0.53 5.10 4.26 -2.05 0.13 -1.14 -1.10
1956 1961 1966 1971 1976 1981 1986 1991 1996 2001 2006
A. Definitions:
The ratio of the difference between the population at the end of the period and the population at the beginning of the period relative to the population at the beginning of the period.
B. Significance/Use:
Population growth meas-ures how fast the popula-tion is changing. It usu-ally has implications for indicators related to edu-cation, infrastructure, and employment and the need for health services.
Useful to determine re-quired services in plan-ning preventive and pro-motional interventions.
C. Limitations:
Certain subgroups are less well counted than others, e.g., young adults (18 to under 35 years).
Does not include home-less people, or people living on Reserves that have chosen not to par-ticipate in the Census.
D. Source:
Canadian Census, Statis-tics Canada.
SUMMARY OF FINDINGS:
Canada’s population has been steadily increasing with one of the largest increases the population numbers occurring between 1986 and 1991.
In 1986 the Saskatchewan population climbed to over 1 million residents (1,009,610), but had since decreased to 968,157 in 2006.
Saskatchewan population fluctuated over the past several decades and as a result, the population growth between 1956 and 2006 had also fluctuated, showing both positive and negative growth.
�����������������������3��1�0!������������.�')���0 1��!�42%#$$%�
� � �� � � � 7 �� � � � � � � � � � � 3 ��6�� �
��������������& ��� ��!�.�')���0 1���4$#$$%
0
200,000
400,000
600,000
800,000
1,000,000
1,200,000
/ ��
���
�������
Population 91,279 492,432 757,510 921,785 895,992 831,728 880,665 925,181 955,344 926,242 921,325 968,313 1,009,613 988,928 976,615 978,933 985,386
1901 1911 1921 1931 1941 1951 1956 1961 1966 1971 1976 1981 1986 1991 1996 2001 2006
��������������" ����8�� ��8�.�')���0 1��!�#$$%
7929�999�92979
85+80-8475-7970-7465-6960-6455-5950-5445-4940-4435-3930-3425-2920-2415-1910-14
5-90-4 Male Female
��������������" ����8�� ��8�������!�#$$%
7929�999�92979
85+80-8475-7970-7465-6960-6455-5950-5445-4940-4435-3930-3425-2920-2415-1910-14
5-90-4 Male
A. Definitions:
The total population size of a province or other defined area.
B. Significance/Use:
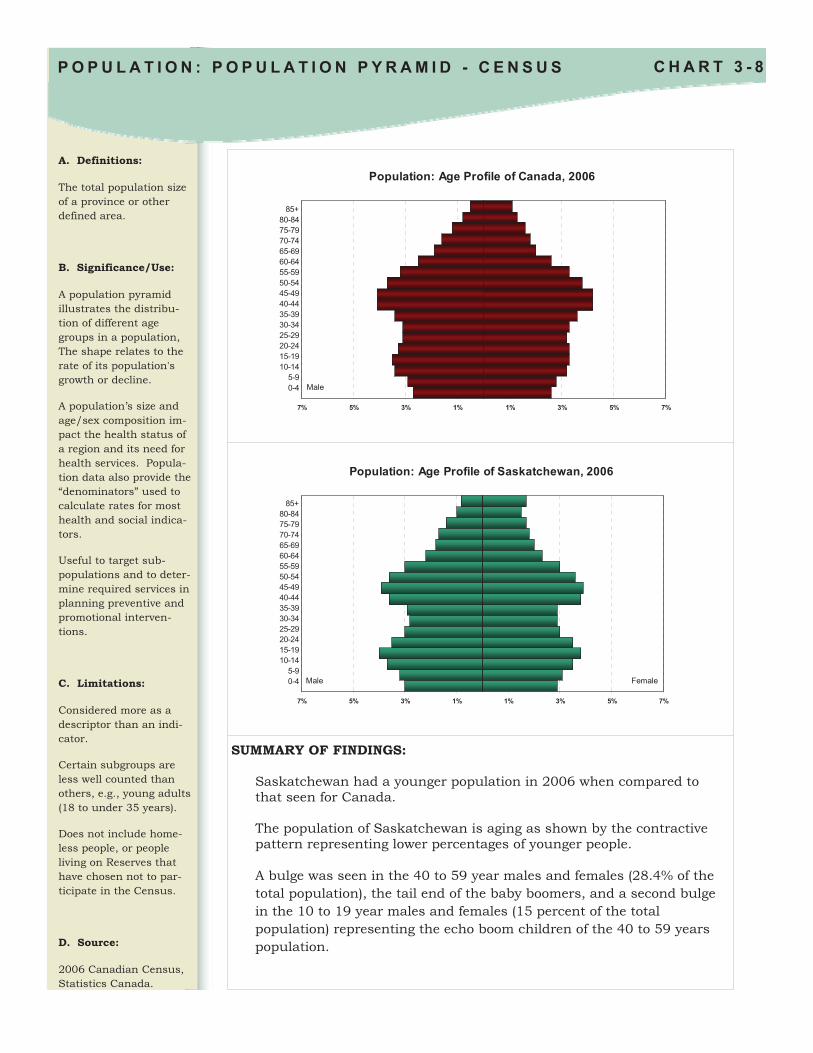
A population pyramid illustrates the distribu-tion of different age groups in a population, The shape relates to the rate of its population's growth or decline.
A population’s size and age/sex composition im-pact the health status of a region and its need for health services. Popula-tion data also provide the “denominators” used to calculate rates for most health and social indica-tors.
Useful to target sub-populations and to deter-mine required services in planning preventive and promotional interven-tions.
C. Limitations:
Considered more as a descriptor than an indi-cator.
Certain subgroups are less well counted than others, e.g., young adults (18 to under 35 years).
Does not include home-less people, or people living on Reserves that have chosen not to par-ticipate in the Census.
D. Source:
2006 Canadian Census, Statistics Canada.
SUMMARY OF FINDINGS:
Saskatchewan had a younger population in 2006 when compared to that seen for Canada. The population of Saskatchewan is aging as shown by the contractive pattern representing lower percentages of younger people. A bulge was seen in the 40 to 59 year males and females (28.4% of the total population), the tail end of the baby boomers, and a second bulge in the 10 to 19 year males and females (15 percent of the total population) representing the echo boom children of the 40 to 59 years population.
���� � � � : �� � � � � � � � � � � � � � � � � � � � � � / ��; � , � � � - � . . �

��������������" ����8�� ��8�<����!�#$$%
7929�999�92979
SK 2006
FHRHA2006
85+80-8475-7970-7465-6960-6455-5950-5445-4940-4435-3930-3425-2920-2415-1910-14
5-90-4 Male Female
��������������" ����8�� ��8�.����!�#$$%
7929�999�92979
SK 2006
SCRHA2006
85+80-8475-7970-7465-6960-6455-5950-5445-4940-4435-3930-3425-2920-2415-1910-14
5-90-4 Male Female
A. Definitions:
The total population size of a province or other defined area.
B. Significance/Use:
A population pyramid illustrates the distribu-tion of different age groups in a population, The shape relates to the rate of its population's growth or decline.
A population’s size and age/sex composition im-pact the health status of a region and its need for health services. Popula-tion data also provide the “denominators” used to calculate rates for most health and social indica-tors.
Useful to target sub-populations and to deter-mine required services in planning preventive and promotional interven-tions.
C. Limitations:
Considered more as a descriptor than an indi-cator.
Certain subgroups are less well counted than others, e.g., young adults (18 to under 35 years).
Does not include home-less people, or people living on Reserves that have chosen not to par-ticipate in the Census.
D. Source:
2006 Canadian Census, Statistics Canada.
SUMMARY OF FINDINGS:
Both Sun Country RHA (SCRHA) and Five Hills RHA (FHRHA) had older populations than that found for Saskatchewan as a whole. For both SCRHA and FHRHA and as for Saskatchewan as a whole, a bulge was seen in the 40 to 59 year males and females, the tail end of the baby boomers, and a second bulge was found in the 10 to 19 year males and females representing the echo boom children of the 40 to 59 years population.
���� � � � 4 �� � � � � � � � � � � � � � � � � � � � � � / ��; � , � � � - � . . �

��������������" ����8�� ��8��=���!�#$$%
7929�999�92979
SK 2006
RQRHA2006
85+80-8475-7970-7465-6960-6455-5950-5445-4940-4435-3930-3425-2920-2415-1910-14
5-90-4 Male Female
��������������" ����8�� ��8�����!�#$$%
7929�999�92979
SK 2006
CRHA 2006
85+80-8475-7970-7465-6960-6455-5950-5445-4940-4435-3930-3425-2920-2415-1910-14
5-90-4 Male Female
A. Definitions:
The total population size of a province or other defined area.
B. Significance/Use:
A population pyramid illustrates the distribu-tion of different age groups in a population, The shape relates to the rate of its population's growth or decline.
A population’s size and age/sex composition im-pact the health status of a region and its need for health services. Popula-tion data also provide the “denominators” used to calculate rates for most health and social indica-tors.
Useful to target sub-populations and to deter-mine required services in planning preventive and promotional interven-tions.
C. Limitations:
Considered more as a descriptor than an indi-cator.
Certain subgroups are less well counted than others, e.g., young adults (18 to under 35 years).
Does not include home-less people, or people living on Reserves that have chosen not to par-ticipate in the Census.
D. Source:
2006 Canadian Census, Statistics Canada.
SUMMARY OF FINDINGS:
Cypress RHA (CYRHA) had an older population than that found for Saskatchewan as a whole. Regina Qu’Appelle RHA (RQRHA) had an increased population from ages 20 to 59 than that found for Saskatchewan as a whole. For both CYRHA and RQRHA and as with Saskatchewan as a whole, a bulge was seen in the 40 to 59 year males and females, the tail end of the baby boomers, and a second bulge was found in the 10 to 19 year males and females representing the echo boom children of the 40 to 59 years population.
���� � � � $ �� � � � � � � � � � � � � � � � � � � � � � / ��; � , � � � - � . . �
��������������" ����8�� ��8�.���!�#$$%
7929�999�92979
SK 2006
SRHA 2006
85+80-8475-7970-7465-6960-6455-5950-5445-4940-4435-3930-3425-2920-2415-1910-14
5-90-4 Male Female
��������������" ����8�� ��8�.����!�#$$%
7929�999�92979
SK 2006
SRRHA2006
85+80-8475-7970-7465-6960-6455-5950-5445-4940-4435-3930-3425-2920-2415-1910-14
5-90-4 Male Female
A. Definitions:
The total population size of a province or other defined area.
B. Significance/Use:
A population pyramid illustrates the distribu-tion of different age groups in a population, The shape relates to the rate of its population's growth or decline.
A population’s size and age/sex composition im-pact the health status of a region and its need for health services. Popula-tion data also provide the “denominators” used to calculate rates for most health and social indica-tors.
Useful to target sub-populations and to deter-mine required services in planning preventive and promotional interven-tions.
C. Limitations:
Considered more as a descriptor than an indi-cator.
Certain subgroups are less well counted than others, e.g., young adults (18 to under 35 years).
Does not include home-less people, or people living on Reserves that have chosen not to par-ticipate in the Census.
D. Source:
2006 Canadian Census, Statistics Canada.
SUMMARY OF FINDINGS:
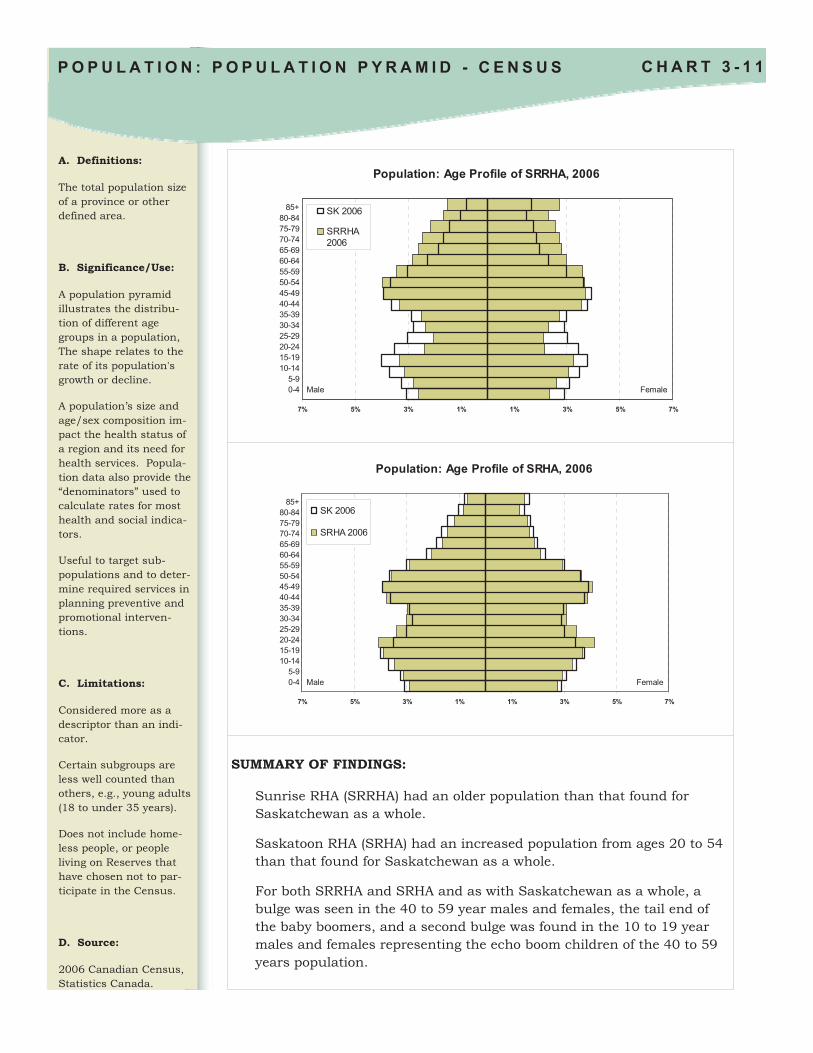
Sunrise RHA (SRRHA) had an older population than that found for Saskatchewan as a whole.
Saskatoon RHA (SRHA) had an increased population from ages 20 to 54 than that found for Saskatchewan as a whole.
For both SRRHA and SRHA and as with Saskatchewan as a whole, a bulge was seen in the 40 to 59 year males and females, the tail end of the baby boomers, and a second bulge was found in the 10 to 19 year males and females representing the echo boom children of the 40 to 59 years population.
���� � � � �� � � � � � � � � � � � � � � � � � � � � � / ��; � , � � � - � . . �

��������������" ����8�� ��8�5����!�#$$%
7929�999�92979
SK 2006
KTRHA2006
85+80-8475-7970-7465-6960-6455-5950-5445-4940-4435-3930-3425-2920-2415-1910-14
5-90-4 Male Female
��������������" ����8�� ��8�����!�#$$%
7929�999�92979
SK 2006
HRHA 2006
85+80-8475-7970-7465-6960-6455-5950-5445-4940-4435-3930-3425-2920-2415-1910-14
5-90-4 Male Female
A. Definitions:
The total population size of a province or other defined area.
B. Significance/Use:
A population pyramid illustrates the distribu-tion of different age groups in a population, The shape relates to the rate of its population's growth or decline.
A population’s size and age/sex composition im-pact the health status of a region and its need for health services. Popula-tion data also provide the “denominators” used to calculate rates for most health and social indica-tors.
Useful to target sub-populations and to deter-mine required services in planning preventive and promotional interven-tions.
C. Limitations:
Considered more as a descriptor than an indi-cator.
Certain subgroups are less well counted than others, e.g., young adults (18 to under 35 years).
Does not include home-less people, or people living on Reserves that have chosen not to par-ticipate in the Census.
D. Source:
2006 Canadian Census, Statistics Canada.
SUMMARY OF FINDINGS:
Both Heartland RHA (HRHA) and Kelsey Trail RHA (KTRHA) had older populations than that found for Saskatchewan as a whole. For both HRHA and KTRHA and as for Saskatchewan as a whole, a bulge was seen in the 40 to 59 year males and females, the tail end of the baby boomers, and a second bulge was found in the 10 to 19 year males and females representing the echo boom children of the 40 to 59 years population.
���� � � � # �� � � � � � � � � � � � � � � � � � � � � � / ��; � , � � � - � . . �

��������������" ����8�� ��8������!�#$$%
7929�999�92979
SK 2006
PNRHA2006
85+80-8475-7970-7465-6960-6455-5950-5445-4940-4435-3930-3425-2920-2415-1910-14
5-90-4 Male Female
��������������" ����8�� ��8�������!�#$$%
7929�999�92979
SK 2006
PAPRHA2006
85+80-8475-7970-7465-6960-6455-5950-5445-4940-4435-3930-3425-2920-2415-1910-14
5-90-4 Male Female
A. Definitions:
The total population size of a province or other defined area.
B. Significance/Use:
A population pyramid illustrates the distribu-tion of different age groups in a population, The shape relates to the rate of its population's growth or decline.
A population’s size and age/sex composition im-pact the health status of a region and its need for health services. Popula-tion data also provide the “denominators” used to calculate rates for most health and social indica-tors.
Useful to target sub-populations and to deter-mine required services in planning preventive and promotional interven-tions.
C. Limitations:
Considered more as a descriptor than an indi-cator.
Certain subgroups are less well counted than others, e.g., young adults (18 to under 35 years).
Does not include home-less people, or people living on Reserves that have chosen not to par-ticipate in the Census.
D. Source:
2006 Canadian Census, Statistics Canada.
SUMMARY OF FINDINGS:
Both Prince Albert Parkland RHA (PAPRHA) and Prairie North RHA (PNRHA) had younger populations than that found for Saskatchewan as a whole.
For both PAPRHA and PNRHA and as for Saskatchewan as a whole, a bulge was seen in the 40 to 59 year males and females, the tail end of the baby boomers, and a second bulge was found in the 10 to 19 year males and females representing the echo boom children of the 40 to 59 years population.
���� � � � � �� � � � � � � � � � � � � � � � � � � � � � / ��; � , � � � - � . . �

��������������" ����8�� ��8�5/���!�#$$%
7929�999�92979
SK 2006
KYRHA2006
85+80-8475-7970-7465-6960-6455-5950-5445-4940-4435-3930-3425-2920-2415-1910-14
5-90-4 Male Female
��������������" ����8�� ��8�;�����!�#$$%
7929�999�92979
SK 2006
MCRRHA2006
85+80-8475-7970-7465-6960-6455-5950-5445-4940-4435-3930-3425-2920-2415-1910-14
5-90-4 Male Female
A. Definitions:
The total population size of a province or other defined area.
B. Significance/Use:
A population pyramid illustrates the distribu-tion of different age groups in a population, The shape relates to the rate of its population's growth or decline.
A population’s size and age/sex composition im-pact the health status of a region and its need for health services. Popula-tion data also provide the “denominators” used to calculate rates for most health and social indica-tors.
Useful to target sub-populations and to deter-mine required services in planning preventive and promotional interven-tions.
C. Limitations:
Considered more as a descriptor than an indi-cator.
Certain subgroups are less well counted than others, e.g., young adults (18 to under 35 years).
Does not include home-less people, or people living on Reserves that have chosen not to par-ticipate in the Census.
D. Source:
2006 Canadian Census, Statistics Canada.
SUMMARY OF FINDINGS:
Both Mamawetan Churchill River RHA (MCRRHA) and Keewatin Yatthé (KYRHA) had much younger populations than that found for Saskatchewan as a whole.
For both MCRRHA and KYRHA, a very slight bulge was seen at the 40 to 44 year males and females, and a second bulge was found in the 10 to 19 year males and females. This pattern was quite different from that for Saskatchewan as a whole that has a bulge at the 40 to 59 year males and females, the tail end of the baby boomers, and a second bulge found in the 10 to 19 year males and females representing the echo boom children of the 40 to 59 years population.
���� � � � + �� � � � � � � � � � � � � � � � � � � � � � / ��; � , � � � - � . . �

��������������" ����8�� ��8����!�#$$%
7929�999�92979
SK 2006
AHA 2006
85+80-8475-7970-7465-6960-6455-5950-5445-4940-4435-3930-3425-2920-2415-1910-14
5-90-4 Male Female
A. Definitions:
The total population size of a province or other defined area.
B. Significance/Use:
A population pyramid illustrates the distribu-tion of different age groups in a population, The shape relates to the rate of its population's growth or decline.
A population’s size and age/sex composition im-pact the health status of a region and its need for health services. Popula-tion data also provide the “denominators” used to calculate rates for most health and social indica-tors.
Useful to target sub-populations and to deter-mine required services in planning preventive and promotional interven-tions.
C. Limitations:
Considered more as a descriptor than an indi-cator.
Certain subgroups are less well counted than others, e.g., young adults (18 to under 35 years).
Does not include home-less people, or people living on Reserves that have chosen not to par-ticipate in the Census.
D. Source:
2006 Canadian Census, Statistics Canada.
SUMMARY OF FINDINGS:
The Athabasca HA (AHA) had a much younger populations than that found for Saskatchewan as a whole.
For AHA, an almost pyramid shape was seen with a broad base, indicating a high proportion of children, a rapid rate of population growth, and a low proportion of older people. This type of pyramid indicates a population in which there is a high birth rate, a high death rate and a short life expectancy.
���� � � � 2 �� � � � � � � � � � � � � � � � � � � � � � / ��; � , � � � - � . . �

������������������� � �� ���������!����!�#$$%
0
10
20
30
40
50
60
70
80
90
100
� �� �
�
Dependency Ratio 80.5 78.8 79.9 66.8 86.9 66.2 83.9 87.3 83.1 79.9 101.5 101.3 100.0 74.1
SCRHA FHRHA CRHA RQRHA SRRHA SRHA HRHA KTRHA PAPRHA PNRHA MCRRHA KYRHA AHA SK
������������, � �� ���������'�8���.�')���0 1�������������!�#$$%
0
10
20
30
40
50
60
70
80
� �� �
�
Dependency Ratio 39.5 47.2 22.2 26.8 61.6 74.1
Canada Saskatchewan Canada Saskatchewan Canada Saskatchewan
Child dependency ratio Aged dependency ratio Total dependency ratio
A. Definitions:
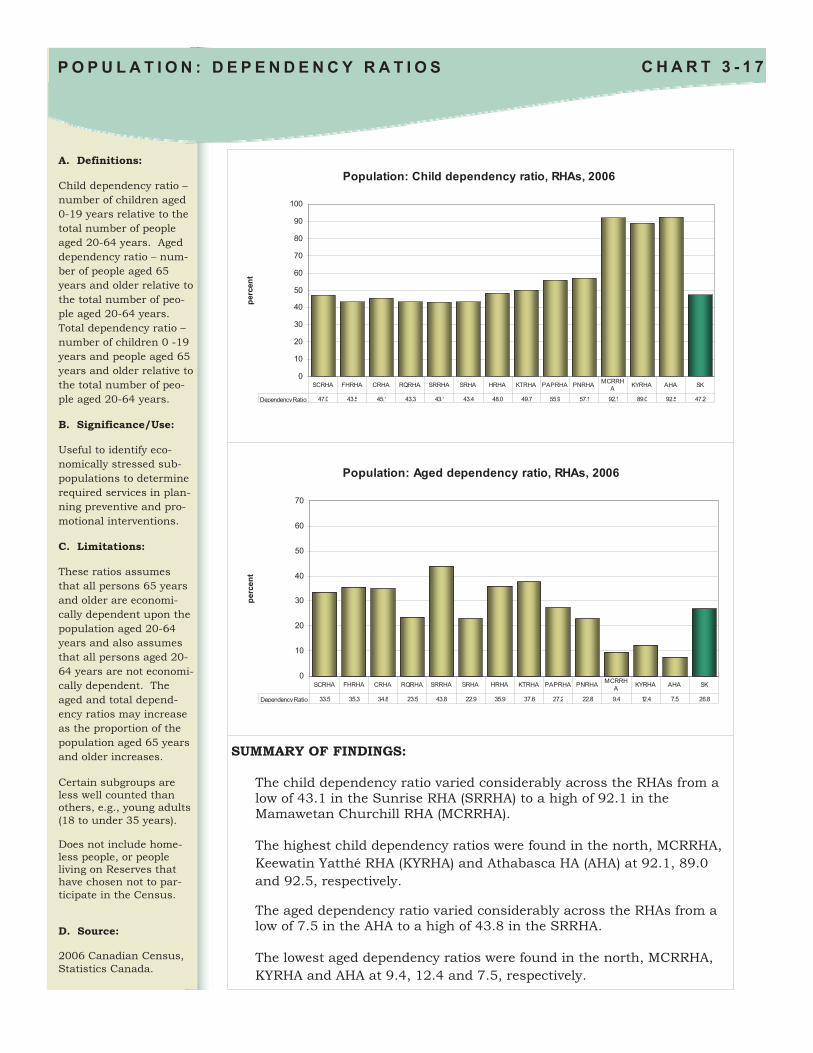
Child dependency ratio – number of children aged 0-19 years relative to the total number of people aged 20-64 years. Aged dependency ratio – num-ber of people aged 65 years and older relative to the total number of peo-ple aged 20-64 years. Total dependency ratio –number of children 0 -19 years and people aged 65 years and older relative to the total number of peo-ple aged 20-64 years.
B. Significance/Use:
Useful to identify eco-nomically stressed sub-populations to determine required services in plan-ning preventive and pro-motional interventions.
C. Limitations:
These ratios assumes that all persons 65 years and older are economi-cally dependent upon the population aged 20-64 years and also assumes that all persons aged 20-64 years are not economi-cally dependent. The aged and total depend-ency ratios may increase as the proportion of the population aged 65 years and older increases.
Certain subgroups are less well counted than others, e.g., young adults (18 to under 35 years).
Does not include home-less people, or people living on Reserves that have chosen not to par-ticipate in the Census.
D. Source:
2006 Canadian Census, Statistics Canada.
SUMMARY OF FINDINGS:
Saskatchewan’s three dependency ratios, child dependency, aged dependency and total dependency are higher than that found for Canada and were among the highest across the provinces and territories. The total dependency ratio varied considerably across the RHAs from a low of 66.2 in the Saskatoon RHA (SRHA) to a high of 100 in the north. The lowest total dependency ratios were found in the urban RHAs of Saskatoon RHA (SRHA) and Regina Qu’Appelle RHA (RQRHA), 66.2 and 66.8, respectively.
���� � � � % �� � � � � � � � � � � , - � - �, -�� / � � � � � � . �
�������������" ��� � �� ���������!����'!�#$$%
0
10
20
30
40
50
60
70
� �� �
�
Dependency Ratio 33.5 35.3 34.8 23.5 43.8 22.9 35.9 37.6 27.2 22.8 9.4 12.4 7.5 26.8
SCRHA FHRHA CRHA RQRHA SRRHA SRHA HRHA KTRHA PAPRHA PNRHA MCRRHA KYRHA AHA SK
�������������0����� � �� ���������!����'!�#$$%
0
10
20
30
40
50
60
70
80
90
100
� �� �
�
Dependency Ratio 47.0 43.5 45.1 43.3 43.1 43.4 48.0 49.7 55.9 57.1 92.1 89.0 92.5 47.2
SCRHA FHRHA CRHA RQRHA SRRHA SRHA HRHA KTRHA PAPRHA PNRHA MCRRHA KYRHA AHA SK
A. Definitions:
Child dependency ratio – number of children aged 0-19 years relative to the total number of people aged 20-64 years. Aged dependency ratio – num-ber of people aged 65 years and older relative to the total number of peo-ple aged 20-64 years. Total dependency ratio –number of children 0 -19 years and people aged 65 years and older relative to the total number of peo-ple aged 20-64 years.
B. Significance/Use:
Useful to identify eco-nomically stressed sub-populations to determine required services in plan-ning preventive and pro-motional interventions.
C. Limitations:
These ratios assumes that all persons 65 years and older are economi-cally dependent upon the population aged 20-64 years and also assumes that all persons aged 20-64 years are not economi-cally dependent. The aged and total depend-ency ratios may increase as the proportion of the population aged 65 years and older increases.
Certain subgroups are less well counted than others, e.g., young adults (18 to under 35 years).
Does not include home-less people, or people living on Reserves that have chosen not to par-ticipate in the Census.
D. Source:
2006 Canadian Census, Statistics Canada.
SUMMARY OF FINDINGS:
The child dependency ratio varied considerably across the RHAs from a low of 43.1 in the Sunrise RHA (SRRHA) to a high of 92.1 in the Mamawetan Churchill RHA (MCRRHA). The highest child dependency ratios were found in the north, MCRRHA, Keewatin Yatthé RHA (KYRHA) and Athabasca HA (AHA) at 92.1, 89.0 and 92.5, respectively.
The aged dependency ratio varied considerably across the RHAs from a low of 7.5 in the AHA to a high of 43.8 in the SRRHA. The lowest aged dependency ratios were found in the north, MCRRHA, KYRHA and AHA at 9.4, 12.4 and 7.5, respectively.
���� � � � 7 �� � � � � � � � � � � , - � - �, -�� / � � � � � � . �

������������� �� ����8�������� *� �������������������' �8�� ���8���"��'������"����!�#$$%
0
10
20
30
40
50
60
70
80
90
100
� �� �
�
Percent 4.77 5.72 14.66 15.27 1.99 1.44 2.42 2.65 1.27 4.64 24.96 49.77 84.55 3.71
BC AB SK MB ON QC NB NS PE NF YT NW NU CAN
A. Definitions:
The percent of population who identify with at least one Aboriginal group, First Nations, Métis or Inuit.
B. Significance/Use:
A population’s composi-tion impact the health status of a region and its need for health services.
Population data also pro-vide the “denominators” used to calculate rates for most health and social indicators.
Useful to target sub-populations and to deter-mine required services in planning preventive and promotional interven-tions.
C. Limitations:
Is a self-reported ques-tion
Certain subgroups are less well counted than others, e.g., young adults (18 to under 35 years).
Does not include home-less people, or people living on Reserves that have chosen not to par-ticipate in the Census.
D. Source:
2006 Canadian Census, Statistics Canada.
SUMMARY OF FINDINGS:
Saskatchewan had the fifth highest Aboriginal self-identifying population of the Canadian provinces and of the three prairie provinces, Saskatchewan had the middle highest Aboriginal self-identifying populations. Approximately 15 percent of Saskatchewan residents self-identified as Aboriginal
The majority of the self-identifying Aboriginal Saskatchewan population identified as North American Indian, followed by Métis, then Aboriginal other, multiple Aboriginal identity and Inuit.
���� � � � : �� � � � � � � � � � � � >�� � 3 � � � � � . - � < � , - � � � < / � � 3 �
������������� �� ����8�.�')���0 1��������"�������������������"����!�#$$%
0
10
20
30
40
50
60
70
� �� �
�
Percent 64.42 33.91 0.15 0.44 1.08
North American Indian
Métis Inuit Multiple Aboriginal identity
Aboriginal other

A. Definitions:
The percent of population who identify with at least one Aboriginal group, First Nations, Métis or Inuit.
B. Significance/Use:
A population’s composi-tion impact the health status of a region and its need for health services.
Population data also pro-vide the “denominators” used to calculate rates for most health and social indicators.
Useful to target sub-populations and to deter-mine required services in planning preventive and promotional interven-tions.
C. Limitations:
Is a self-reported ques-tion
Certain subgroups are less well counted than others, e.g., young adults (18 to under 35 years).
Does not include home-less people, or people living on Reserves that have chosen not to par-ticipate in the Census.
D. Source:
2006 Canadian Census, Statistics Canada.
SUMMARY OF FINDINGS:
Of the 13 health regions, the three northern regions, Mamawetan Churchill RHA (MCRRHA), Keewatin Yatthé RHA (KYRHA) and Athabasca HA (AHA) had over 80 percent of their populations self-identifying as Aboriginal, 80.2, 93.8 and 95.3 percent, respectively.
���� � � � 4 �� � � � � � � � � � � � >�� � 3 � � � � � . - � < � , - � � � < / � � 3 �
������������� �� ����8������������' �8�� ���8���"��'������"����!����'!�#$$%
0
10
20
30
40
50
60
70
80
90
100
� �� �
�
Percent 5.10 4.39 2.38 11.58 8.50 9.27 2.82 14.43 35.63 28.95 80.24 93.82 95.32 14.88
SCRHA FHRHA CRHA RQRHA SRRHA SRHA HRHA KTRHA PAPRHA PNRHA MCRRHA KYRHA AHA SK

A. Definitions:
The percent of landed immigrants relative to the total non-institutional population.
B. Significance/Use:
Useful to target sub-populations and to deter-mine required services in planning preventive and promotional interven-tions.
Studies have shown that immigrants, particularly non-European immi-grants, generally have a longer life expectancy and lower risk of certain chronic conditions than the native-born popula-tion.
C. Limitations:
Certain subgroups are less well counted than others, e.g., young adults (18 to under 35 years).
Does not include home-less people, or people living on Reserves that have chosen not to par-ticipate in the Census.
D. Source:
2006 Canadian Census, Statistics Canada.
SUMMARY OF FINDINGS:
Saskatchewan had the eighth highest percentage of immigrant population among the provinces and territories for Canada.
Of the three western prairie provinces, Saskatchewan had the lowest population percentage for immigrants. Alberta had the highest immigrant population percent followed by Manitoba.
When the immigrant population was examined by generation status, it was apparent that the vast majority of the immigrant population were third generation of more. Unlike the overall Canadian immigrant population, a very small proportion of the immigrant population identified as being first generation.
C H A R T 3 - 2 0 P O P U L A T I O N : I M M I G R A T I O N
Population: Percent of Immigrant population, province/territory, 2006
0
5
10
15
20
25
30
perc
ent
Percent 27.47 16.18 5.05 13.34 28.25 11.45 3.67 5.00 3.57 1.67 9.97 6.84 1.53 19.80
BC AB SK MB ON QC NB NS PE NF YT NW NU CAN
Population: Percent of immigrant population by generation status, Canada and Saskatchewan, 2006
0
10
20
30
40
50
60
70
80
1st generation 2nd generation 3rd generation or more
perc
ent
Can
SK

A. Definitions:
The percent of landed immigrants relative to the total non-institutional population.
B. Significance/Use:
Useful to target sub-populations and to deter-mine required services in planning preventive and promotional interven-tions.
Studies have shown that immigrants, particularly non-European immi-grants, generally have a longer life expectancy and lower risk of certain chronic conditions than the native-born popula-tion.
C. Limitations:
Certain subgroups are less well counted than others, e.g., young adults (18 to under 35 years).
Does not include home-less people, or people living on Reserves that have chosen not to par-ticipate in the Census.
D. Source:
2006 Canadian Census, Statistics Canada.
SUMMARY OF FINDINGS:
Just under 75 percent of Saskatchewan’s immigrant population was found in the Regina Qu’Appelle RHA (RQRHA) (32.9%) and the Saskatoon RHA (SRHA) (39.7%). The proportion of immigrant population within the health authorise varied from a high of 6.9 and 6.8 in SRHA and RQRHA, respectively to a low of 0.57 and 0.45 percent in Keewatin Yatthé RHA (KYRHA) and Athabasca HA (AHA), respectively. The remaining RHAs had proportions of immigrant populations that are less than five percent.
C H A R T 3 - 2 1 P O P U L A T I O N I M M I G R A T I O N
Population: Percent of Immigrant population, province/territory, 2006
0
5
10
15
20
25
30
perc
ent
Percent 27.47 16.18 5.05 13.34 28.25 11.45 3.67 5.00 3.57 1.67 9.97 6.84 1.53 19.80
BC AB SK MB ON QC NB NS PE NF YT NW NU CAN
Population: Percent of immigrant population, RHAs, 2006
0
1
2
3
4
5
6
7
8
9
10
Province/Territory
perc
ent
Percent 2.98 4.23 3.43 6.81 3.23 6.91 2.97 2.29 3.24 2.63 0.92 0.57 0.45 5.05
SCRHA FHRHA CRHA RQRHA SRRHA SRHA HRHA KTRHA PAPRHA PNRHA MCRRH
A KYRHA AHA SK

A. Definitions:
The percentage of a popu-lation that reports be-longing to a given ethnic or cultural groupn.
B. Significance/Use:
A population’s character-istics impact the health status of a region and its need for health services.
Population data also pro-vide the “denominators” used to calculate rates for most health and social indicators.
Useful to target sub-populations and to deter-mine required services in planning preventive and promotional interven-tions.
C. Limitations:
Certain subgroups are less well counted than others, e.g., young adults (18 to under 35 years).
Does not include home-less people, or people living on Reserves that have chosen not to par-ticipate in the Census.
D. Source:
2006 Canadian Census, Statistics Canada.
SUMMARY OF FINDINGS:
The top ten reported ethnic origins for Saskatchewan residents in order of responses were German, English, Scottish, Canadian, Irish, Ukraine, French and North American Indian, Norwegian and Polish.
The top ten reported ethnic origins for Canadian residents in order of responses were Canadian, English, French, Scottish, Irish, German, Italian, Chinese, North American Indian and Ukrainian.
���� � � � # # �� � � � � � � � � � � - � � � � � � � / �
����������������$� �0�������"��'!�.�')���0 1��!�#$$%
0
5
10
15
20
25
30
35
40
-�0�������"��
� �� �
�
Percent 29.99 26.54 19.16 18.07 15.25 13.55 12.39 12.09 7.20 5.96
German English Scottish Canadian Irish Ukrainian French North
American Indian
Norw egian Polish
����������������$� �0�������"��'!�������!�#$$%
0
5
10
15
20
25
30
35
40
-�0�������"��
� �� �
�
Percent 32.22 21.03 15.82 15.11 13.94 10.18 4.63 4.31 4.01 3.87
Canadian English French Scottish Irish German Italian Chinese North
American Indian
Ukrainian

A. Definitions:
The percentage of a popu-lation that reports their knowledge of English only.
B. Significance/Use:
A population’s character-istics impact the health status of a region and its need for health services.
Population data also pro-vide the “denominators” used to calculate rates for most health and social indicators.
Useful to target sub-populations and to deter-mine required services in planning preventive and promotional interven-tions.
C. Limitations:
Certain subgroups are less well counted than others, e.g., young adults (18 to under 35 years).
Does not include home-less people, or people living on Reserves that have chosen not to par-ticipate in the Census.
D. Source:
2006 Canadian Census, Statistics Canada.
SUMMARY OF FINDINGS:
Saskatchewan had one of the highest percentages of population reporting to know English only. Only Newfoundland and Labrador reported a higher percentage than Saskatchewan.
All three western prairie provinces reported high percentages of their populations reporting to know English only. After Saskatchewan, Alberta reported the next highest percentage followed by Manitoba.
The percentage of the population that reported knowledge of English only is fairly similar across the health authorities varying from a high of 97.8 percent in Heartland RHA (HRHA) to a low of 93 percent in Five Hills RHA (FHRHA).
���� � � � # � �� � � � � � � � � � � � � �3 �3- �
������������5��1� �" ��8��88���������"��" '��-�"��'0�����!�������� *� �������!�#$$%
0
10
20
30
40
50
60
70
80
90
100
� �� �
�
Percent 89.67 91.85 94.63 89.77 85.92 4.53 56.28 89.21 87.18 95.08 87.80 90.14 88.08 67.64
BC AB SK MB ON QC NB NS PE NF YT NW NU CAN
������������5��1� �" ��8��88���������"��" '��-�"��'0�����!����'!�#$$%
0
10
20
30
40
50
60
70
80
90
100
� �� �
�
Percent 96.24 92.96 95.12 94.27 97.46 93.67 97.76 95.89 93.04 95.93 95.27 97.34 94.42 94.63
SCRHA FHRHA CRHA RQRHA SRRHA SRHA HRHA KTRHA PAPRHA PNRHA MCRRHA KYRHA AHA SK

A. Definitions:
The percentage of a popu-lation that reports their mother tongue and lan-guage spoken at home.
B. Significance/Use:
A population’s character-istics impact the health status of a region and its need for health services.
Population data also pro-vide the “denominators” used to calculate rates for most health and social indicators.
Useful to target sub-populations and to deter-mine required services in planning preventive and promotional interven-tions.
C. Limitations:
Certain subgroups are less well counted than others, e.g., young adults (18 to under 35 years).
Does not include home-less people, or people living on Reserves that have chosen not to par-ticipate in the Census.
D. Source:
2006 Canadian Census, Statistics Canada.
SUMMARY OF FINDINGS:
The vast majority of Saskatchewan’s population reported that their mother tongue was English only, followed by the category “language other than English or French”. This differed from Canada as a whole in which a lower percentage reported that their mother tongue is English only, followed by almost equivalent percentages of “French only” and the category “language other than English or French”.
The vast majority of Saskatchewan’s population reported that their language spoken at home is English, followed by the category “Non-official language”. This differed from Canada as a whole in which a lower percentage reported that their language spoken at home was English, followed by French only.
C H A R T 3 - 2 4 P O P U L A T I O N : L A N G U A G E
Population: Language spoken at home, Canada and Saskatchewan, 2006
0
10
20
30
40
50
60
70
80
90
100
perc
ent
Can 65.89 21.15 11.11 0.30
SK 94.05 0.40 4.89 0.09
English French Non-off icial language English and French
Population: Mother tongue, Canada and Saskatchewan, 2006
0
10
20
30
40
50
60
70
80
90
100
perc
ent
Can 57.24 21.82 0.32 20.62
SK 85.10 1.68 0.12 13.10
English only French only English and French Other language(s)

A. Definitions:
The percentage of a popu-lation that reports their mother tongue to be Eng-lish only.
B. Significance/Use:
A population’s character-istics impact the health status of a region and its need for health services.
Population data also pro-vide the “denominators” used to calculate rates for most health and social indicators.
Useful to target sub-populations and to deter-mine required services in planning preventive and promotional interven-tions.
C. Limitations:
Certain subgroups are less well counted than others, e.g., young adults (18 to under 35 years).
Does not include home-less people, or people living on Reserves that have chosen not to par-ticipate in the Census.
D. Source:
2006 Canadian Census, Statistics Canada.
SUMMARY OF FINDINGS: Saskatchewan had the fourth highest percentages of population that reported their mother tongue was English only. All three western prairie provinces reported high percentages of their populations reporting to know English only. After Saskatchewan, Alberta reported the next highest percentage followed by Manitoba. The percentage of the population that reported knowledge of English only was fairly similar across the non-northern health authorities varying from a high of 93 percent in Five Hills RHA (FHRHA) to a low of 83.5 percent in Prince Albert Parkland RHA (PAPRHA). The population in the three northern health regions reported considerably lower percentages, varying from a high of 46.4 percent in Mamawetan Churchill RHA (MCRRHA) to a low of 15.8 in Athabasca HA (AHA).
C H A R T 3 - 2 5 P O P U L A T I O N : L A N G U A G E
Population: Mother tongue - English only, province/territory, 2006
0
10
20
30
40
50
60
70
80
90
100
perc
ent
Percent 70.58 79.13 85.10 73.97 68.42 7.74 64.36 92.14 93.33 97.56 84.95 76.84 26.48 57.24
BC AB SK MB ON QC NB NS PE NF YT NW NU CAN
Population: Mother tongue - English only, RHAs, 2006
0
10
20
30
40
50
60
70
80
90
100
perc
ent
Percent 92.53 90.54 83.91 88.38 84.01 85.02 88.44 85.27 83.47 85.59 45.36 46.43 15.81 85.10
SCRHA FHRHA CRHA RQRHA SRRHA SRHA HRHA KTRHA PAPRHA PNRHA MCRRHA KYRHA AHA SK

A. Definitions:
The total population size of a province or other defined area.
B. Significance/Use:
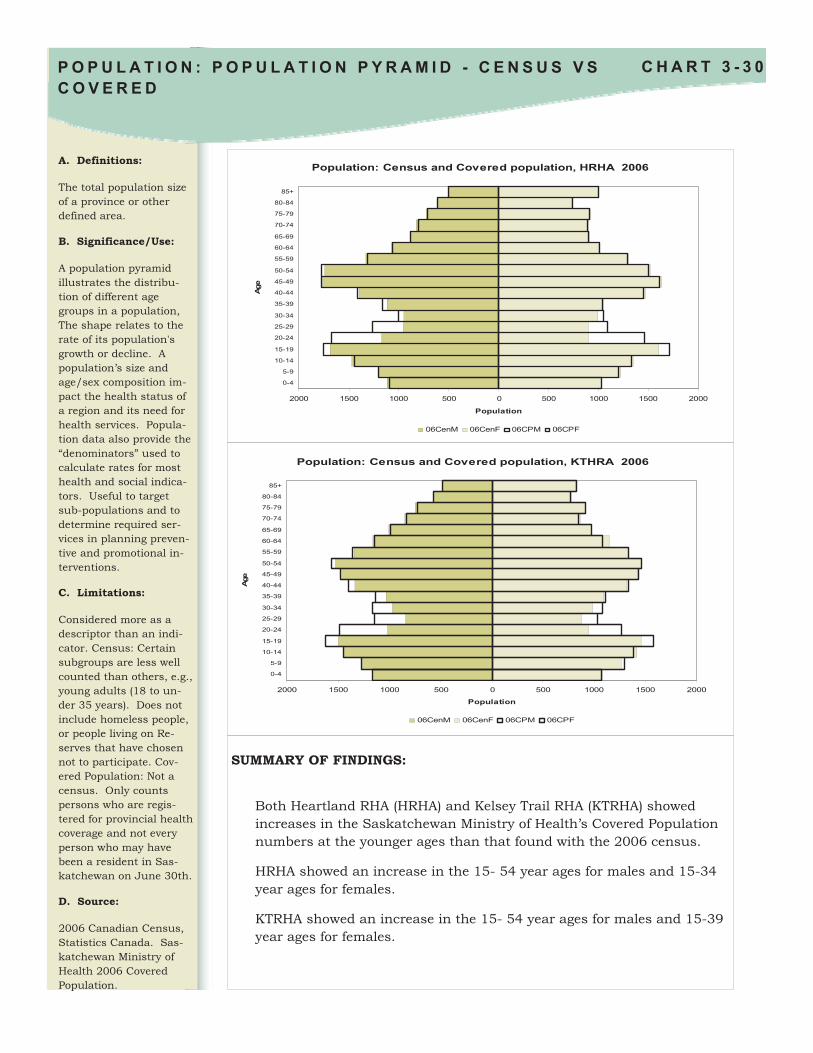
A population pyramid illustrates the distribu-tion of different age groups in a population, The shape relates to the rate of its population's growth or decline. A population’s size and age/sex composition im-pact the health status of a region and its need for health services. Popula-tion data also provide the “denominators” used to calculate rates for most health and social indica-tors. Useful to target sub-populations and to determine required ser-vices in planning preven-tive and promotional in-terventions.
C. Limitations:
Considered more as a descriptor than an indi-cator. Census: Certain subgroups are less well counted than others, e.g., young adults (18 to un-der 35 years). Does not include homeless people, or people living on Re-serves that have chosen not to participate. Cov-ered Population: Not a census. Only counts persons who are regis-tered for provincial health coverage and not every person who may have been a resident in Sas-katchewan on June 30th.
D. Source:
2006 Canadian Census, Statistics Canada. Sas-katchewan Ministry of Health 2006 Covered Population.
SUMMARY OF FINDINGS:
The Saskatchewan Ministry of Health’s Covered Population was higher in total number than found by the 2006 census of Saskatchewan residents, especially among the younger age groups. Considerable increases were seen in the Covered Population’s 20-24 year and 45-49 age categories compared to the 2006 census. When the 2001, 2005, and 2009 Covered Populations were compared, it was seen that the two bulges in Saskatchewan population, are moving into older age categories showing that the population is aging. The peak of the younger age bulge moved from 15 to 20 years to 20 to 24 years during the nine year span. The older age bulge peak moved from 40 to 44 years to 45 to 49 years in the same time span.
C H A R T 3 - 2 6 P O P U L A T I O N : P O P U L A T I O N P Y R A M I D - C E N S U S V S C O V E R E D
Population: Covered Population by age, 2001, 2005 and 2009
0
10,000
20,000
30,000
40,000
50,000
60,000
70,000
80,000
90,000
<1 1 to 45 to 9
10 to 14
15 to 19
20 to 24
25 to 29
30 to 34
35 to 39
40 to 44
45 to 49
50 to 54
55 to 59
60 to 64
65 to 69
70 to 74
75 to 79
80 to 84
85 to 89
90 to 94
95 +
Age
Pop
ulat
ion
2001 2005 2009
Population: Census vs Covered population, SK 2006
50000 40000 30000 20000 10000 0 10000 20000 30000 40000 50000
0-4
5-9
10-14
15-19
20-24
25-29
30-34
35-39
40-44
45-49
50-54
55-59
60-64
65-69
70-74
75-79
80-84
85+
Age
Population
06CenM 06CenF 06CPM 06CPF

A. Definitions:
The total population size of a province or other defined area.
B. Significance/Use:
A population pyramid illustrates the distribu-tion of different age groups in a population, The shape relates to the rate of its population's growth or decline. A population’s size and age/sex composition im-pact the health status of a region and its need for health services. Popula-tion data also provide the “denominators” used to calculate rates for most health and social indica-tors. Useful to target sub-populations and to determine required ser-vices in planning preven-tive and promotional in-terventions.
C. Limitations:
Considered more as a descriptor than an indi-cator. Census: Certain subgroups are less well counted than others, e.g., young adults (18 to un-der 35 years). Does not include homeless people, or people living on Re-serves that have chosen not to participate. Cov-ered Population: Not a census. Only counts persons who are regis-tered for provincial health coverage and not every person who may have been a resident in Sas-katchewan on June 30th.
D. Source:
2006 Canadian Census, Statistics Canada. Sas-katchewan Ministry of Health 2006 Covered Population.
SUMMARY OF FINDINGS:
Both Sun Country RHA (SCRHA) and Five Hills RHA (FHRHA) showed increases in the Saskatchewan Ministry of Health’s Covered Population numbers at the younger ages, 15-39 years for females than found by the 2006 census of Saskatchewan residents. SCRHA showed an increase in the 15-49 year ages for males and females. FHRHA showed the increase in the 15-54 year ages for males and 15-39 year ages for females.
C H A R T 3 - 2 7 P O P U L A T I O N : P O P U L A T I O N P Y R A M I D - C E N S U S V S C O V E R E D
Population: Census and Covered population, FHHRA 2006
2500 2000 1500 1000 500 0 500 1000 1500 2000 2500
0-4
5-9
10-14
15-19
20-24
25-29
30-34
35-39
40-44
45-49
50-54
55-59
60-64
65-69
70-74
75-79
80-84
85+
Age
Population
06CenM 06CenF 06CPM 06CPF
Population: Census and Covered population, SCHRA 2006
2500 2000 1500 1000 500 0 500 1000 1500 2000 2500
0-4
5-9
10-14
15-19
20-24
25-29
30-34
35-39
40-44
45-49
50-54
55-59
60-64
65-69
70-74
75-79
80-84
85+
Age
Population
06CenM 06CenF 06CPM 06CPF

������������� �'�'�������� � ������������!�������#$$%
2500 2000 1500 1000 500 0 500 1000 1500 2000
0-4
5-9
10-14
15-19
20-24
25-29
30-34
35-39
40-44
45-49
50-54
55-59
60-64
65-69
70-74
75-79
80-84
85+
�"
�����������
06CenM 06CenF 06CPM 06CPF
A. Definitions:
The total population size of a province or other defined area.
B. Significance/Use:
A population pyramid illustrates the distribu-tion of different age groups in a population, The shape relates to the rate of its population's growth or decline. A population’s size and age/sex composition im-pact the health status of a region and its need for health services. Popula-tion data also provide the “denominators” used to calculate rates for most health and social indica-tors. Useful to target sub-populations and to determine required ser-vices in planning preven-tive and promotional in-terventions.
C. Limitations:
Considered more as a descriptor than an indi-cator. Census: Certain subgroups are less well counted than others, e.g., young adults (18 to un-der 35 years). Does not include homeless people, or people living on Re-serves that have chosen not to participate. Cov-ered Population: Not a census. Only counts persons who are regis-tered for provincial health coverage and not every person who may have been a resident in Sas-katchewan on June 30th.
D. Source:
2006 Canadian Census, Statistics Canada. Sas-katchewan Ministry of Health 2006 Covered Population.
SUMMARY OF FINDINGS:
Both Cypress RHA (CRHA) and Regina-Qu’Appelle RHA (RQRHA) showed increases in the Saskatchewan Ministry of Health’s Covered Population numbers at the younger ages than that found with the 2006 census.
CRHA showed an increase in the 5-54 year ages for males and the 5-49 year ages in females.
RQRHA showed an increase in the 0-54 year ages for males and the �-49 year ages in females.
���� � � � # : �� � � � � � � � � � � � � � � � � � � � � � / ��; � , � � � - � . . � ? . �� � ? -� -, �
������������� �'�'�������� � ������������!��=�����#$$%
10000 8000 6000 4000 2000 0 2000 4000 6000 8000 10000
0-4
5-9
10-14
15-19
20-24
25-29
30-34
35-39
40-44
45-49
50-54
55-59
60-64
65-69
70-74
75-79
80-84
85+
�"
�����������
06CenM 06CenF 06CPM 06CPF

������������� �'�'�������� � ������������!�.�����#$$%
15000 10000 5000 0 5000 10000 15000
0-4
5-9
10-14
15-19
20-24
25-29
30-34
35-39
40-44
45-49
50-54
55-59
60-64
65-69
70-74
75-79
80-84
85+
�"
����������
06CenM 06CenF 06CPM 06CPF
A. Definitions:
The total population size of a province or other defined area.
B. Significance/Use:
A population pyramid illustrates the distribu-tion of different age groups in a population, The shape relates to the rate of its population's growth or decline. A population’s size and age/sex composition im-pact the health status of a region and its need for health services. Popula-tion data also provide the “denominators” used to calculate rates for most health and social indica-tors. Useful to target sub-populations and to determine required ser-vices in planning preven-tive and promotional in-terventions.
C. Limitations:
Considered more as a descriptor than an indi-cator. Census: Certain subgroups are less well counted than others, e.g., young adults (18 to un-der 35 years). Does not include homeless people, or people living on Re-serves that have chosen not to participate. Cov-ered Population: Not a census. Only counts persons who are regis-tered for provincial health coverage and not every person who may have been a resident in Sas-katchewan on June 30th.
D. Source:
2006 Canadian Census, Statistics Canada. Sas-katchewan Ministry of Health 2006 Covered Population.
SUMMARY OF FINDINGS:
Both Sunrise RHA (SRRHA) and Saskatoon RHA (SRHA) showed increases in the Saskatchewan Ministry of Health’s Covered Population numbers at the younger ages than that found with the 2006 census.
SRRHA showed an increase in the 10-54 year ages for males and 15-39 year ages in females.
SRHA showed an increase in the 25-54 year ages for males and 25-39 year ages in females.
���� � � � # 4 �� � � � � � � � � � � � � � � � � � � � � � / ��; � , � � � - � . . � ? . �� � ? -� -, �
������������� �'�'�������� � ������������!�.������#$$%
2500 2000 1500 1000 500 0 500 1000 1500 2000 2500
0-4
5-9
10-14
15-19
20-24
25-29
30-34
35-39
40-44
45-49
50-54
55-59
60-64
65-69
70-74
75-79
80-84
85+
�"
�����������
06CenM 06CenF 06CPM 06CPF
Population: Census and Covered population, KTHRA 2006
2000 1500 1000 500 0 500 1000 1500 2000
0-4
5-9
10-14
15-19
20-24
25-29
30-34
35-39
40-44
45-49
50-54
55-59
60-64
65-69
70-74
75-79
80-84
85+
Age
Population
06CenM 06CenF 06CPM 06CPF
Population: Census and Covered population, HRHA 2006
2000 1500 1000 500 0 500 1000 1500 2000
0-4
5-9
10-14
15-19
20-24
25-29
30-34
35-39
40-44
45-49
50-54
55-59
60-64
65-69
70-74
75-79
80-84
85+
Age
Population
06CenM 06CenF 06CPM 06CPF
A. Definitions:
The total population size of a province or other defined area.
B. Significance/Use:
A population pyramid illustrates the distribu-tion of different age groups in a population, The shape relates to the rate of its population's growth or decline. A population’s size and age/sex composition im-pact the health status of a region and its need for health services. Popula-tion data also provide the “denominators” used to calculate rates for most health and social indica-tors. Useful to target sub-populations and to determine required ser-vices in planning preven-tive and promotional in-terventions.
C. Limitations:
Considered more as a descriptor than an indi-cator. Census: Certain subgroups are less well counted than others, e.g., young adults (18 to un-der 35 years). Does not include homeless people, or people living on Re-serves that have chosen not to participate. Cov-ered Population: Not a census. Only counts persons who are regis-tered for provincial health coverage and not every person who may have been a resident in Sas-katchewan on June 30th.
D. Source:
2006 Canadian Census, Statistics Canada. Sas-katchewan Ministry of Health 2006 Covered Population.
SUMMARY OF FINDINGS:
Both Heartland RHA (HRHA) and Kelsey Trail RHA (KTRHA) showed increases in the Saskatchewan Ministry of Health’s Covered Population numbers at the younger ages than that found with the 2006 census.
HRHA showed an increase in the 15- 54 year ages for males and 15-34 year ages for females.
KTRHA showed an increase in the 15- 54 year ages for males and 15-39 year ages for females.
C H A R T 3 - 3 0 P O P U L A T I O N : P O P U L A T I O N P Y R A M I D - C E N S U S V S C O V E R E D

������������� �'�'�������� � ������������!��������#$$%
4000 3000 2000 1000 0 1000 2000 3000 4000
0-4
5-9
10-14
15-19
20-24
25-29
30-34
35-39
40-44
45-49
50-54
55-59
60-64
65-69
70-74
75-79
80-84
85+
�"
�����������
06CenM 06CenF 06CPM 06CPF
������������� �'�'�������� � ������������!���������#$$%
4000 3000 2000 1000 0 1000 2000 3000 4000
0-4
5-9
10-14
15-19
20-24
25-29
30-34
35-39
40-44
45-49
50-54
55-59
60-64
65-69
70-74
75-79
80-84
85+
�"
����������
06CenM 06CenF 06CPM 06CPF
A. Definitions:
The total population size of a province or other defined area.
B. Significance/Use:
A population pyramid illustrates the distribu-tion of different age groups in a population, The shape relates to the rate of its population's growth or decline. A population’s size and age/sex composition im-pact the health status of a region and its need for health services. Popula-tion data also provide the “denominators” used to calculate rates for most health and social indica-tors. Useful to target sub-populations and to determine required ser-vices in planning preven-tive and promotional in-terventions.
C. Limitations:
Considered more as a descriptor than an indi-cator. Census: Certain subgroups are less well counted than others, e.g., young adults (18 to un-der 35 years). Does not include homeless people, or people living on Re-serves that have chosen not to participate. Cov-ered Population: Not a census. Only counts persons who are regis-tered for provincial health coverage and not every person who may have been a resident in Sas-katchewan on June 30th.
D. Source:
2006 Canadian Census, Statistics Canada. Sas-katchewan Ministry of Health 2006 Covered Population.
SUMMARY OF FINDINGS:
Both Prince Albert Parkland RHA (PAPRHA) and Prairie North RHA (PNRHA) showed increases in the Saskatchewan Ministry of Health’s Covered Population numbers at the younger ages than that found with the 2006 census.
PAPRHA showed an increase in the 0-49 year ages for males and 0-39 year ages in females.
PNRHA showed an increase in the 0-59 year ages for males and 0-54 year ages in females.
���� � � � � �� � � � � � � � � � � � � � � � � � � � � � / ��; � , � � � - � . . � ? . �� � ? -� -, �

Population: Census and Covered population, KYHRA 2006
800 600 400 200 0 200 400 600 800
0-4
5-9
10-14
15-19
20-24
25-29
30-34
35-39
40-44
45-49
50-54
55-59
60-64
65-69
70-74
75-79
80-84
85+
Age
Population
06CenM 06CenF 06CPM 06CPF
Population: Census and Covered population, MCRHRA 2006
1500 1000 500 0 500 1000 1500
0-4
10-14
20-24
30-34
40-44
50-54
60-64
70-74
80-84
Age
Population
06CenM 06CenF 06CPM 06CPF
A. Definitions:
The total population size of a province or other defined area.
B. Significance/Use:
A population pyramid illustrates the distribu-tion of different age groups in a population, The shape relates to the rate of its population's growth or decline. A population’s size and age/sex composition im-pact the health status of a region and its need for health services. Popula-tion data also provide the “denominators” used to calculate rates for most health and social indica-tors. Useful to target sub-populations and to determine required ser-vices in planning preven-tive and promotional in-terventions.
C. Limitations:
Considered more as a descriptor than an indi-cator. Census: Certain subgroups are less well counted than others, e.g., young adults (18 to un-der 35 years). Does not include homeless people, or people living on Re-serves that have chosen not to participate. Cov-ered Population: Not a census. Only counts persons who are regis-tered for provincial health coverage and not every person who may have been a resident in Sas-katchewan on June 30th.
D. Source:
2006 Canadian Census, Statistics Canada. Sas-katchewan Ministry of Health 2006 Covered Population.
SUMMARY OF FINDINGS:
Compared to the 2006 Census, both Mamawetan Churchill River RHA (MCRRHA) and Keewatin Yatthé (KYRHA) showed increases in the Saskatchewan Ministry of Health’s Covered Population numbers at almost all age categories for both males and females.
The increases were more pronounced for the MCRRHA population.
C H A R T 3 - 3 2 P O P U L A T I O N : P O P U L A T I O N P Y R A M I D - C E N S U S V S C O V E R E D

������������� �'�'�������� � ������������!������#$$%
200 150 100 50 0 50 100 150 200
0-4
5-9
10-14
15-19
20-24
25-29
30-34
35-39
40-44
45-49
50-54
55-59
60-64
65-69
70-74
75-79
80-84
85+
�"
����������
06CenM 06CenF 06CPM 06CPF
A. Definitions:
The total population size of a province or other defined area.
B. Significance/Use:
A population pyramid illustrates the distribu-tion of different age groups in a population, The shape relates to the rate of its population's growth or decline. A population’s size and age/sex composition im-pact the health status of a region and its need for health services. Popula-tion data also provide the “denominators” used to calculate rates for most health and social indica-tors. Useful to target sub-populations and to determine required ser-vices in planning preven-tive and promotional in-terventions.
C. Limitations:
Considered more as a descriptor than an indi-cator. Census: Certain subgroups are less well counted than others, e.g., young adults (18 to un-der 35 years). Does not include homeless people, or people living on Re-serves that have chosen not to participate. Cov-ered Population: Not a census. Only counts persons who are regis-tered for provincial health coverage and not every person who may have been a resident in Sas-katchewan on June 30th.
D. Source:
2006 Canadian Census, Statistics Canada. Sas-katchewan Ministry of Health 2006 Covered Population.
SUMMARY OF FINDINGS:
The Athabasca HA (AHA) showed no distinct pattern in increases or decreases in the Saskatchewan Ministry of Health’s Covered Population numbers than that found with the 2006 census.
���� � � � � � �� � � � � � � � � � � � � � � � � � � � � � / ��; � , � � � - � . . � ? . �� � ? -� -, �

A. Definitions:
The total population size of a province or other defined area.
B. Significance/Use:
A population pyramid illustrates the distribu-tion of different age groups in a population, The shape relates to the rate of its population's growth or decline.
A population’s size and age/sex composition im-pact the health status of a region and its need for health services.
Population data also pro-vide the “denominators” used to calculate rates for most health and social indicators.
Useful to target sub-populations and to deter-mine required services in planning preventive and promotional interven-tions.
C. Limitations:
Considered more as a descriptor than an indi-cator.
Not a census. Only counts persons who are registered for provincial health coverage and not every person who may have been a resident in Saskatchewan on June 30th.
D. Source:
Saskatchewan Ministry f Health Covered Popula-tion, 2006 and 2010.
SUMMARY OF FINDINGS:
The Saskatchewan Ministry of Health’s Covered Population in 2009 was higher than found for 2006.
Considerable increases were found in the Covered Population’s 20 to 39 year and 45 to 69 age categories compared to the 2006 numbers.
When the 2001, 2005, and 2009 Covered Populations are compared, it was seen that the Saskatchewan population is aging. The peak of the younger age bulge moved from 15 to 20 years to 20 to 24 years during the nine year span. The older age bulge peak moved from 40 to 44 years to 45 to 49 years in the same time span.
C H A R T 3 - 3 4 P O P U L A T I O N : P O P U L A T I O N P Y R A M I D - C O V E R E D
Population: Covered Population by age, 2001, 2005 and 2009
0
10,000
20,000
30,000
40,000
50,000
60,000
70,000
80,000
90,000
<1 1 to 45 to 9
10 to 14
15 to 19
20 to 24
25 to 29
30 to 34
35 to 39
40 to 44
45 to 49
50 to 54
55 to 59
60 to 64
65 to 69
70 to 74
75 to 79
80 to 84
85 to 89
90 to 94
95 +
Age
Pop
ulat
ion
2001 2005 2009
Population: Covered population, SK 2006 and 2010
50000 40000 30000 20000 10000 0 10000 20000 30000 40000 50000
<1
1-4
5-9
10-14
15-19
20-24
25-29
30-34
35-39
40-44
45-49
50-54
55-59
60-64
65-69
70-74
75-79
80-84
85-89
90-94
95+
Age
Population
06CPM 06CPF 10CPM 10CPF

A. Definitions:
The total population size of a province or other defined area.
B. Significance/Use:
A population pyramid illustrates the distribu-tion of different age groups in a population, The shape relates to the rate of its population's growth or decline.
A population’s size and age/sex composition im-pact the health status of a region and its need for health services.
Population data also pro-vide the “denominators” used to calculate rates for most health and social indicators.
Useful to target sub-populations and to deter-mine required services in planning preventive and promotional interven-tions.
C. Limitations:
Considered more as a descriptor than an indi-cator.
Not a census. Only counts persons who are registered for provincial health coverage and not every person who may have been a resident in Saskatchewan on June 30th.
D. Source:
Saskatchewan Ministry of Health Covered Popula-tion, 2006 and 2010.
SUMMARY OF FINDINGS:
Both Sun Country RHA (SCRHA) and Five Hills RHA (FHRHA) showed increases in the Saskatchewan Ministry of Health’s Covered Population numbers at the younger ages when the 2006 and 2010 numbers were compared.
SCRHA showed increases in the 0-9 years, 20-39 years and 50-69 years age groups for both males and females
FHRHA showed increases in the male 0-9 years, 20-39 years and 50-69 years age groups, as well as, the female 0-5 year, 20-34 years and 50-69 years age groups.
C H A R T 3 - 3 5 P O P U L A T I O N : P O P U L A T I O N P Y R A M I D - C O V E R E D
Population: Covered population, FHHR 2006 and 2010
2500 2000 1500 1000 500 0 500 1000 1500 2000 2500
<1
1-4
5-9
10-14
15-19
20-24
25-29
30-34
35-39
40-44
45-49
50-54
55-59
60-64
65-69
70-74
75-79
80-84
85-89
90-94
95+
Age
Population
06CPM 06CPF 10CPM 10CPM
Population: Covered population, SCHR 2006 and 2010
2500 2000 1500 1000 500 0 500 1000 1500 2000 2500
<1
1-4
5-9
10-14
15-19
20-24
25-29
30-34
35-39
40-44
45-49
50-54
55-59
60-64
65-69
70-74
75-79
80-84
85-89
90-94
95+
Age
Population
06CPM 06CPF 10CPM 10CPF

Population: Covered population, CYHR 2006 and 2009
-2,500 -2,000 -1,500 -1,000 -500 0 500 1,000 1,500 2,000
<1
1-4
5-9
10-14
15-19
20-24
25-29
30-34
35-39
40-44
45-49
50-54
55-59
60-64
65-69
70-74
75-79
80-84
85-89
90-94
95+
Age
Population (%)
06CPM 06CPF 09CPM 09CPF
A. Definitions:
The total population size of a province or other defined area.
B. Significance/Use:
A population pyramid illustrates the distribu-tion of different age groups in a population, The shape relates to the rate of its population's growth or decline.
A population’s size and age/sex composition im-pact the health status of a region and its need for health services.
Population data also pro-vide the “denominators” used to calculate rates for most health and social indicators.
Useful to target sub-populations and to deter-mine required services in planning preventive and promotional interven-tions.
C. Limitations:
Considered more as a descriptor than an indi-cator.
Not a census. Only counts persons who are registered for provincial health coverage and not every person who may have been a resident in Saskatchewan on June 30th.
D. Source:
Saskatchewan Ministry of Health Covered Popula-tion, 2006 and 2010.
SUMMARY OF FINDINGS:
Cypress RHA (CRHA) showed decreases in almost all age categories when the Saskatchewan Ministry of Health’s Covered Population numbers for 2006 and 2010 were compared.
Regina-Qu’Appelle RHA (RQRHA) shows increases in almost all age categories when the Saskatchewan Ministry of Health’s Covered Population numbers for 2006 and 2010 were compared.
C H A R T 3 - 3 6 P O P U L A T I O N : P O P U L A T I O N P Y R A M I D - C O V E R E D
Population: Covered population, RQHR 2006 and 2010
15000 10000 5000 0 5000 10000 15000
<1
1-4
5-9
10-14
15-19
20-24
25-29
30-34
35-39
40-44
45-49
50-54
55-59
60-64
65-69
70-74
75-79
80-84
85-89
90-94
95+
Age
Population
06CPM 06CPF 10CPM 10CPF

��������������� � ������������!�.����#$$%�����#$$
15000 10000 5000 0 5000 10000 15000
<1
1-4
5-9
10-14
15-19
20-24
25-29
30-34
35-39
40-44
45-49
50-54
55-59
60-64
65-69
70-74
75-79
80-84
85-89
90-94
95+
�"
�����������
06CPM 06CPF 10CPM 10CPF
��������������� � ������������!�.�����#$$%�����#$$
2500 2000 1500 1000 500 0 500 1000 1500 2000 2500
<1
1-4
5-9
10-14
15-19
20-24
25-29
30-34
35-39
40-44
45-49
50-54
55-59
60-64
65-69
70-74
75-79
80-84
85-89
90-94
95+
�"
����������
06CPM 06CPF 10CPM 10CPF
A. Definitions:
The total population size of a province or other defined area.
B. Significance/Use:
A population pyramid illustrates the distribu-tion of different age groups in a population, The shape relates to the rate of its population's growth or decline.
A population’s size and age/sex composition im-pact the health status of a region and its need for health services.
Population data also pro-vide the “denominators” used to calculate rates for most health and social indicators.
Useful to target sub-populations and to deter-mine required services in planning preventive and promotional interven-tions.
C. Limitations:
Considered more as a descriptor than an indi-cator.
Covered Population: Not a census. Only counts persons who are regis-tered for provincial health coverage and not every person who may have been a resident in Sas-katchewan on June 30th.
D. Source:
Saskatchewan Ministry of Health Covered Popula-tion, 2006 and 2010.
SUMMARY OF FINDINGS:
Both Sunrise RHA (SRRHA) and Saskatoon RHA (SRHA) showed increases in the Saskatchewan Ministry of Health’s Covered Population numbers at the younger ages 0-9 years and 50-69 years for both males and females when the numbers for 2006 and 2010 were compared.
SRRHA showed an increase in the 25-39 year ages for males and 25-3� year ages in females.
SRHA showed an increase almost all age categories for both males and females.
���� � � � � 7 �� � � � � � � � � � � � � � � � � � � � � � / ��; � , � � � � ? - � -, �

Population: Covered population, HR 2006 and 2010
2000 1500 1000 500 0 500 1000 1500 2000
<1
1-4
5-9
10-14
15-19
20-24
25-29
30-34
35-39
40-44
45-49
50-54
55-59
60-64
65-69
70-74
75-79
80-84
85-89
90-94
95+
Age
Population
06CPM 06CPF 10CPM 10CPF
A. Definitions:
The total population size of a province or other defined area.
B. Significance/Use:
A population pyramid illustrates the distribu-tion of different age groups in a population, The shape relates to the rate of its population's growth or decline.
A population’s size and age/sex composition im-pact the health status of a region and its need for health services.
Population data also pro-vide the “denominators” used to calculate rates for most health and social indicators.
Useful to target sub-populations and to deter-mine required services in planning preventive and promotional interven-tions.
C. Limitations:
Considered more as a descriptor than an indi-cator.
Not a census. Only counts persons who are registered for provincial health coverage and not every person who may have been a resident in Saskatchewan on June 30th.
D. Source:
Saskatchewan Ministry of Health Covered Popula-tion, 2006 and 2010.
SUMMARY OF FINDINGS:
Both Heartland (HRHA) and Kelsey Trail RHA (KTRHA) showed increases in the Saskatchewan Ministry of Health’s Covered Population numbers at the younger ages, under 1 year for males and 0-4 years for females when the numbers for 2006 and 2010 were compared.
HRHA showed an increase in the 50-69 year age category for males and females.
KYRHA showed a decreases in most age categories except 55-74 year age category for males and the 55-64 year age category for females.
C H A R T 3 - 3 8 P O P U L A T I O N : P O P U L A T I O N P Y R A M I D - C O V E R E D
Population: Covered population, KTHR 2006 and 2010
2000 1500 1000 500 0 500 1000 1500 2000
<1
1-4
5-9
10-14
15-19
20-24
25-29
30-34
35-39
40-44
45-49
50-54
55-59
60-64
65-69
70-74
75-79
80-84
85-89
90-94
95+
Age
Population
06CPM 06CPF 10CPM 10CPF

Population: Covered population, PAPHR 2006 and 2010
4000 3000 2000 1000 0 1000 2000 3000 4000
<1
1-4
5-9
10-14
15-19
20-24
25-29
30-34
35-39
40-44
45-49
50-54
55-59
60-64
65-69
70-74
75-79
80-84
85-89
90-94
95+
Age
Population
06CPM 06CPF 10CPM 10CPF
A. Definitions:
The total population size of a province or other defined area.
B. Significance/Use:
A population pyramid illustrates the distribu-tion of different age groups in a population, The shape relates to the rate of its population's growth or decline.
A population’s size and age/sex composition im-pact the health status of a region and its need for health services.
Population data also pro-vide the “denominators” used to calculate rates for most health and social indicators.
Useful to target sub-populations and to deter-mine required services in planning preventive and promotional interven-tions.
C. Limitations:
Considered more as a descriptor than an indi-cator.
Not a census. Only counts persons who are registered for provincial health coverage and not every person who may have been a resident in Saskatchewan on June 30th.
D. Source:
Saskatchewan Ministry of Health Covered Popula-tion, 2006 and 2010.
SUMMARY OF FINDINGS:
Both Prince Albert Parkland RHA (PAPRHA) and Prairie North RHA (PNRHA) showed increases in the Saskatchewan Ministry of Health’s Covered Population numbers at the younger ages, 0-9 years when the numbers for 2006 and 2010 were compared.
PAPRHA showed an increase in the 20-34 and 50-69 year ages for both males and females.
PNRHA showed an increase in almost all age categories for both males and females.
C H A R T 3 - 3 9 P O P U L A T I O N : P O P U L A T I O N P Y R A M I D - C O V E R E D
Population: Covered population, PNHR 2006 and 2010
4000 3000 2000 1000 0 1000 2000 3000 4000
<1
1-4
5-9
10-14
15-19
20-24
25-29
30-34
35-39
40-44
45-49
50-54
55-59
60-64
65-69
70-74
75-79
80-84
85-89
90-94
95+
Age
Population
06CPM 06CPF 10CPM 10CPF

Population: Covered population, KYHR 2006 and 2010
800 600 400 200 0 200 400 600 800
<1
1-4
5-9
10-14
15-19
20-24
25-29
30-34
35-39
40-44
45-49
50-54
55-59
60-64
65-69
70-74
75-79
80-84
85-89
90-94
95+
Age
Population
06CPM 06CPF 10CPM 10CPF
Population: Covered population, MCRHR 2006 and 2010
1500 1000 500 0 500 1000 1500
<1
1-4
5-9
10-14
15-19
20-24
25-29
30-34
35-39
40-44
45-49
50-54
55-59
60-64
65-69
70-74
75-79
80-84
85-89
90-94
95+
Age
Population
06CPM 06CPF 10CPM 10CPF
A. Definitions:
The total population size of a province or other defined area.
B. Significance/Use:
A population pyramid illustrates the distribu-tion of different age groups in a population, The shape relates to the rate of its population's growth or decline.
A population’s size and age/sex composition im-pact the health status of a region and its need for health services.
Population data also pro-vide the “denominators” used to calculate rates for most health and social indicators.
Useful to target sub-populations and to deter-mine required services in planning preventive and promotional interven-tions.
C. Limitations:
Considered more as a descriptor than an indi-cator.
Not a census. Only counts persons who are registered for provincial health coverage and not every person who may have been a resident in Saskatchewan on June 30th.
D. Source:
Saskatchewan Ministry of Health Covered Popula-tion, 2006 and 2010.
SUMMARY OF FINDINGS:
Both Mamawetan Churchill River RHA (MCRRHA) and Keewatin Yatthé (KYRHA) showed increases in the Saskatchewan Ministry of Health’s Covered Population numbers for the 0-4 years age category for both males and females when the 2006 and 2010 numbers were compared.
MCRRHA showed increases in the 50-69 year age category for males and the 50-64 year age category for females.
KYRHA showed pronounced decreases in the 5-24 year age group for males and the 5 to19 year age category for females. Large decreases were also seen in the 30 to 49 year age category for males and the 25-44 year age category for females.
C H A R T 3 - 4 0 P O P U L A T I O N : P O P U L A T I O N P Y R A M I D - C O V E R E D

��������������� � ������������!������#$$%�����#$$
200 150 100 50 0 50 100 150 200
<1
1-4
5-9
10-14
15-19
20-24
25-29
30-34
35-39
40-44
45-49
50-54
55-59
60-64
65-69
70-74
75-79
80-84
85-89
90-94
95+
�"
�����������
06CPM 06CPF 10CPM 10CPF
A. Definitions:
The total population size of a province or other defined area.
B. Significance/Use:
A population pyramid illustrates the distribu-tion of different age groups in a population, The shape relates to the rate of its population's growth or decline.
A population’s size and age/sex composition im-pact the health status of a region and its need for health services.
Population data also pro-vide the “denominators” used to calculate rates for most health and social indicators.
Useful to target sub-populations and to deter-mine required services in planning preventive and promotional interven-tions.
C. Limitations:
Considered more as a descriptor than an indi-cator.
Not a census. Only counts persons who are registered for provincial health coverage and not every person who may have been a resident in Saskatchewan on June 30th.
D. Source:
Saskatchewan Ministry of Health Covered Popula-tion, 2006 and 2010.
SUMMARY OF FINDINGS:
The Athabasca HA (AHA) showed increases in almost all age categories when the Saskatchewan Ministry of Health’s Covered Population numbers for 2006 and 2010 were compared.
���� � � � + �� � � � � � � � � � � � � � � � � � � � � � / ��; � , � � � � ? - � -, �