2012 wfh global survey report · world federation of hemophilia global survey 2012 1 wfh global...
TRANSCRIPT

December 2013
World Federation of HemophiliaReport on the
ANNUAL GLOBALSURVEY 2012

Report on the Annual Global Survey 2012 is published by the World Federation of Hemophilia. All data are provisional. © World Federation of Hemophilia, 2013 To obtain permission to reprint, redistribute, or translate this publication, please contact the Education and Public Policy Department at the address below. When this data is used in publications or other research the World Federation of Hemophilia must be credited. We encourage researchers to contact us in the event they use the Global Survey data. Please note: This material is intended for general information only. The World Federation of Hemophilia does not endorse particular treatment products or manufacturers; any reference to a product name is not an endorsement by the World Federation of Hemophilia. The WFH is not a regulatory agency and cannot make recommendations relating to safety of manufacturing of specific blood products. For recommendations of a particular product, the regulatory authority in a particular country must make these judgments based on domestic legislation, national health policies and clinical best-practices. World Federation of Hemophilia 1425, boul. René-Lévesque Ouest, bureau 1010 Montréal, Québec H3G 1T7 Canada Tel. (514) 875-7944 Fax: (514) 875-8916 E-mail: [email protected] Website: www.wfh.org

WFH Global Survey 2012
Table of contents Introduction……………………………………….………… 1
Summary of survey data………………………………….…. 3
Graphs – number of identified patients…………………….. 4
Graphs – factor usage……..………………..…………..…… 5
Countries included in the survey……………………………. 10
Population statistics …………………………………..….….. 11
Distribution of reported bleeding disorders by country .….. 15
Gender distribution ………………………………………...… 18
Patients with inhibitors ……………………………………… 19
Age distribution hemophilia and VWD………………..…… 20
HIV and HCV infection …………………………………… 26
Reported use of factor concentrates…………………….… 28
Annual Global Survey 2012 sample questionnaire……….. 32
Glossary……………………………………………………… 37


World Federation of Hemophilia Global Survey 2012
1 WFH Global Survey 2012
Introduction to the Report on the WFH Global Survey 2012
Report on the Annual Global Survey 2012 includes selected demographic and other data on people with hemophilia (PWH), von Willebrand disease (VWD), other rare factor deficiencies, and inherited platelet disorders throughout the world. The purpose of this report is to provide useful information to hemophilia organizations, hemophilia treatment centres (HTCs), and health officials involved in efforts to reduce or prevent complications of bleeding disorders in order to assist with program planning. Methodology In 1998, the World Federation of Hemophilia (WFH) began collecting information on hemophilia care throughout the world. This survey, called the WFH Global Survey, collects basic demographic information, data on resources of care and treatment products, and information on the prevalence (the percentage of the population affected) of infectious complications such as HIV and hepatitis C (HCV). The WFH compiled the first survey report in 1999. Each year questionnaires are sent to national hemophilia associations linked with the WFH with the request that they in turn work with physicians or health officials, as necessary, to complete the survey. The WFH reviews completed questionnaires for inconsistencies, which are clarified where possible by communicating directly with the participating organization. The 2012 survey is the thirteenth WFH survey. This report uses data for the years 2009, 2010, 2011 and 2012. Not all of our members are able to report every year. A list of participating countries and the last year they provided can be found on page 10. The survey includes data on more than 274,000 people with hemophilia, von Willebrand disease and other bleeding disorders in 109 countries. Data from the WFH questionnaire are supplemented with data from other sources in order to provide a general socio-economic picture of each country surveyed. The survey questionnaire is included at the end of this report. Comments on the graphs The graph showing the increase over time in patients identified contains data from the history of the Global Survey. This graph was created using aggregated numbers to demonstrate the increases in patients identified over time. If a country reported data one year and not the next, the older data were used on the assumption that the number of patients did not change substantially from one year to the next. For all the graphs, answers were not always available for all questions. In such cases, the analysis was done using only data from countries that responded, with the number of respondents as the denominator. Comments on data collection Participation in the survey is voluntary. Although these data are self-reported, fairly consistent information on hemophilia care has been obtained from countries with similar economic capacities, validating its use for program planning. Countries that are part of the WFH’s Global Alliance for Progress (GAP) program (Azerbaijan, Belarus, Ecuador, Jordan, Lebanon, Mexico, Russia, Thailand, Tunisia, China, and Syria) report more frequently than once per year, in cases where a 2012 survey form was not completed other WFH data was used. Some countries are only able to provide detailed data on gender, age, inhibitors and HIV/HCV infection for a limited subset of patients, for example they may know the total number of people with hemophilia in the country but have age and gender data from just one treatment centre. This report provides information on the annual usage of treatment products for 2012 only. It includes only those countries where the national hemophilia organization provided information. Quantities reported used were not independently verified except when the WFH has data on humanitarian donations in 2012. The amounts reported may only be factor bought through government or other sources. Not all national hemophilia organizations are able to report on all product used in their country.
World Federation of Hemophilia Global Survey 2012
WFH Global Survey 2012 2
Please consider the following caveats about the data in this report. a) Founder effects can create pockets of patients concentrated geographically. The founder effect occurs when a small population grows in isolation and there is little genetic dilution. This can increase the local frequency of genetic disease compared to the general population. This may occur with hemophilia and all the rare bleeding disorders. In the extremely rare bleeding disorders, consanguinity may lead to an increased incidence in some countries. b) Countries with small populations can appear to have too many identified patients. Countries submitting data to the WFH range in population from 300,000 to over a billion. With a small denominator (total population), just a few extra identified patients (the numerator) can create the appearance of huge percentage differences between expected and identified patients when really there are only a few more patients than expected. c) The type of health care system in a country can influence data quality. A country with universal health care may be more likely to identify patients with hemophilia even if they don't require treatment. In countries with different health care systems, it is likely that patients who do not require treatment will not be identified. d) Definitions may vary from country to country. Countries may use different definitions to diagnose mild hemophilia and other disorders. In the case of the rare bleeding disorders, some countries may report heterozygous patients while other countries report only patients with bleeding symptoms. e) Some countries are reporting every patient who seeks treatment while other countries are using methods to identify patients who do not require treatment, such as laboratory screening or follow up with families of identified patients. f) Data gathering and the state of registries varies. Maintaining accurate registries is time consuming and expensive. It is possible that some registries contain patients who have been double-entered or have died. Even wealthy countries with excellent registries have to carefully review their records to avoid over-counting. Countries with large populations are more susceptible to over-counting. It is harder to keep track of births and deaths, some patients may be registered in more than one treatment centre, validation of registry data is more difficult. g) There is also the possibility that the death rate due to HIV and hepatitis C infection is not the same around the world. In some countries there may have been lower infection rates, while other countries may have had better treatment for infected people with hemophilia. h) The numbers in this report are as reported by our members for their countries. They are not independently verified by the WFH. Some countries are not reporting for the whole country, they only have data from certain treatment centres or large cities.

World Federation of Hemophilia Global Survey 2012
3 WFH Global Survey 2012
2012 WFH Global Survey summary Demographics Number of countries in this survey 109 Percentage of world population covered by countries in 2012 survey report 91% Number of people identified with hemophilia 172,373 Number of people identified with von Willebrand disease 66,144 Number of people identified with other bleeding disorders 35,549 Total number of people with bleeding disorders identified 274,066 Number of people with hemophilia A 142,205 Number of people with hemophilia B 28,008 Number of hemophilia A patients with clinically identified inhibitors 5,675 Number of hemophilia B patients with clinically identified inhibitors 306 These numbers are for the total number identified, not newly identified in this survey. Please note that the total number of patients identified with hemophilia may be higher than the number of patients identified with specific types of hemophilia because some patients in some countries are known to have bleeding disorders but the specific diagnosis has not been reported. Factor usage Mean global per capita factor VIII usage 2.60 IU 67 countries reporting Median global per capita factor VIII usage 1.12 IU 67 countries reporting Mean global per capita factor IX usage 0.39 IU 64 countries reporting Median global per capita factor IX usage 0.18 IU 64 countries reporting Total reported annual global consumption of factor VIII concentrates 6,733,122,643 IU 67 countries reporting Total reported annual global consumption of factor IX concentrates 1,001,016,780 IU 64 countries reporting The average per capita and total consumption figures reported this year cannot be directly compared to the figures from other survey years as the group of countries reporting factor usage changes from year to year. To illustrate, if a large country using large amounts of factor or a large country using very little factor, reports one year and not the next, then this will have a significant effect on the mean and median from year to year. The chart below shows average per capita factor use for the countries that reported in both the 2011 and 2012 surveys. 2011 2012 Mean global per capita factor VIII usage 2.46 IU 2.76 IU 50 countries reporting Median global per capita factor VIII usage 1.23 IU 1.61 IU 50 countries reporting Mean global per capita factor IX usage 0.37 IU 0.38 IU 47 countries reporting Median global per capita factor IX usage 0.20 IU 0.19 IU 47 countries reporting

World Federation of Hemophilia Global Survey 2012
WFH Global Survey 2012 4
A. Identified patients – all disorders
This graph showing the increase over time in patients identified contains data from the history of the Global Survey. This graph was created using aggregated numbers to demonstrate the increases in patients identified over time. If a country reported data one year and not the next, the older data were used on the assumption that the number of patients did not change substantially from one year to the next. Collection of data for other bleeding disorders (rare factor deficiencies, and inherited platelet disorders) began in 2004. For all the graphs, answers are not always available for all questions. In such cases, the graph was created using only data from countries that responded, with the number of respondents as the denominator.
0
50,000
100,000
150,000
200,000
250,000
300,000
1999 2000 2001 2002 2003 2004 2005 2006 2007 2008 2009 2010 2011 2012
Hemophilia A & B von Willebrand disease Other bleeding disorders
World Federation of Hemophilia Global Survey 2012
5 WFH Global Survey 2012
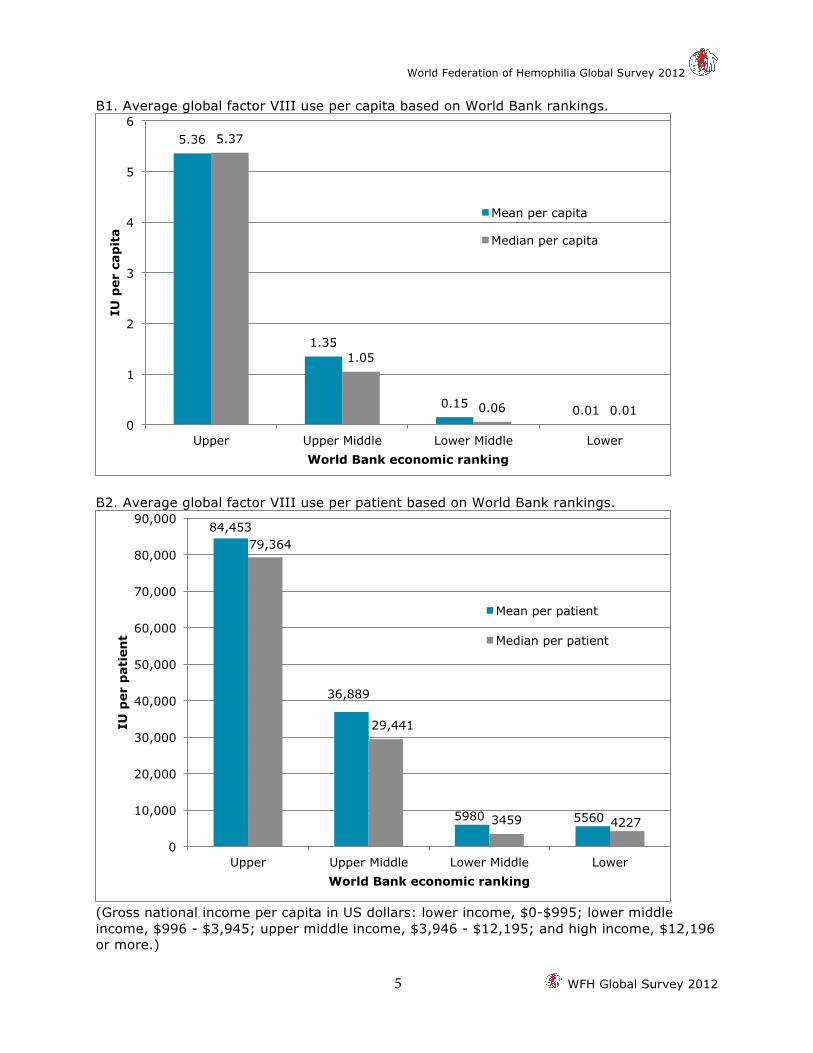
B1. Average global factor VIII use per capita based on World Bank rankings.
B2. Average global factor VIII use per patient based on World Bank rankings.
(Gross national income per capita in US dollars: lower income, $0-$995; lower middle income, $996 - $3,945; upper middle income, $3,946 - $12,195; and high income, $12,196 or more.)
5.36
1.35
0.15 0.01
5.37
1.05
0.06 0.01 0
1
2
3
4
5
6
Upper Upper Middle Lower Middle Lower
IU p
er c
apit
a
World Bank economic ranking
Mean per capita
Median per capita
84,453
36,889
5980 5560
79,364
29,441
3459 4227
0
10,000
20,000
30,000
40,000
50,000
60,000
70,000
80,000
90,000
Upper Upper Middle Lower Middle Lower
IU p
er p
atie
nt
World Bank economic ranking
Mean per patient
Median per patient
World Federation of Hemophilia Global Survey 2012
WFH Global Survey 2012 6
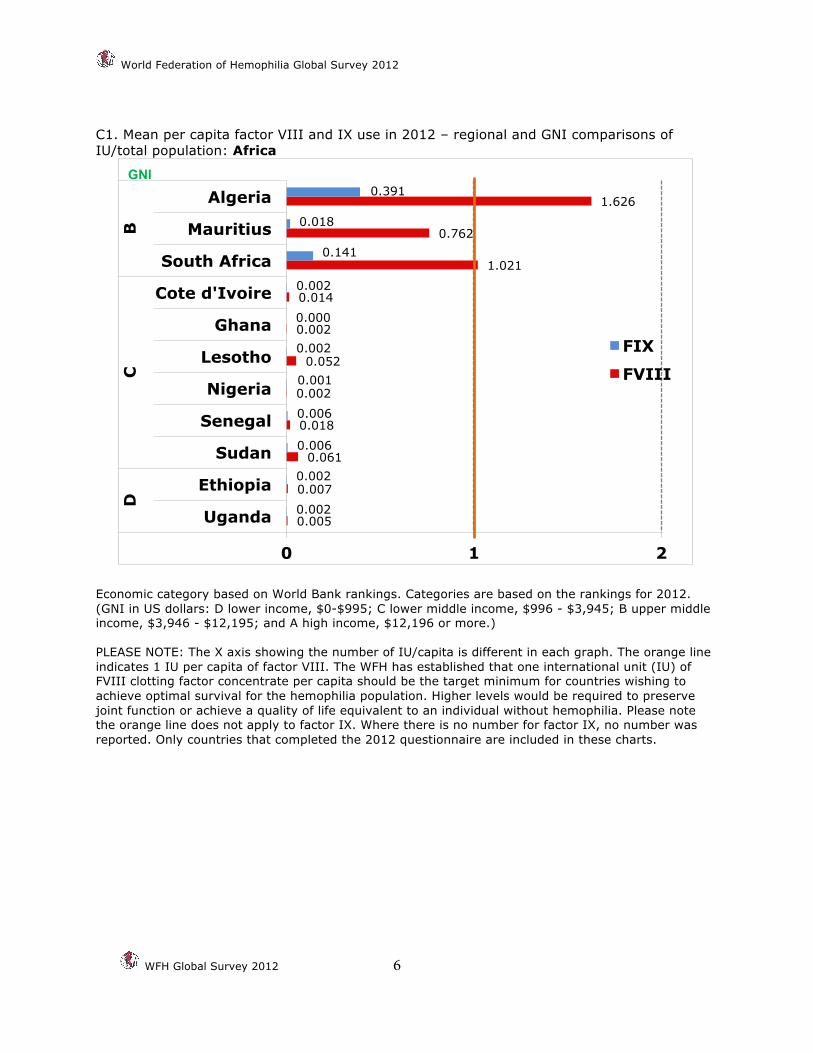
C1. Mean per capita factor VIII and IX use in 2012 – regional and GNI comparisons of IU/total population: Africa
Economic category based on World Bank rankings. Categories are based on the rankings for 2012. (GNI in US dollars: D lower income, $0-$995; C lower middle income, $996 - $3,945; B upper middle income, $3,946 - $12,195; and A high income, $12,196 or more.) PLEASE NOTE: The X axis showing the number of IU/capita is different in each graph. The orange line indicates 1 IU per capita of factor VIII. The WFH has established that one international unit (IU) of FVIII clotting factor concentrate per capita should be the target minimum for countries wishing to achieve optimal survival for the hemophilia population. Higher levels would be required to preserve joint function or achieve a quality of life equivalent to an individual without hemophilia. Please note the orange line does not apply to factor IX. Where there is no number for factor IX, no number was reported. Only countries that completed the 2012 questionnaire are included in these charts.
0.005
0.007
0.061
0.018
0.002
0.052
0.002
0.014
1.021
0.762
1.626
0.002
0.002
0.006
0.006
0.001
0.002
0.000
0.002
0.141
0.018
0.391
0 1 2
Uganda
Ethiopia
Sudan
Senegal
Nigeria
Lesotho
Ghana
Cote d'Ivoire
South Africa
Mauritius
Algeria
D
C
B
FIX
FVIII
GNI

World Federation of Hemophilia Global Survey 2012
7 WFH Global Survey 2012
C2. Mean per capita factor VIII and IX use in 2012 – regional and GNI comparisons of IU/total population: Americas
C3. Mean per capita factor VIII and IX use in 2012 – regional and GNI comparisons of IU/total population: Eastern Mediterranean
0.266
0.231
0.007
0.263
0.824
0.907
1.000
0.964
1.602
0.612
0.053
0.002
0.007
0.115
0.211
0.700
0.193
0.090
0.013
0 1 2 3
Syria
Palestine
Pakistan
Egypt
Tunisia
Lebanon
Jordan
Iraq
Saudi Arabia
Oman
C
B
A
FIX
FVIII
GNI
0.061
0.242
0.187
1.792
1.123
0.227
0.289
3.78
1.354
3.391
2.014
5.098
6.439
0.040
0.057
0.100
0.155
0.007
0.027
0.425
0.565
0.353
0.168
0.797
1.335
0 1 2 3 4 5 6 7
Nicaragua
Honduras
Guatemala
Panama
Mexico
Ecuador
Cuba
Colombia
Belize
Argentina
Venezuela
United States
Canada
C
B
A
FIX
FVIII
GNI

World Federation of Hemophilia Global Survey 2012
WFH Global Survey 2012 8
C4. Mean per capita factor VIII and IX use in 2012 – regional and GNI comparisons of IU/total population: Europe
0.252
0.178
0.116
0.831
1.348
7.584
4.661
10.542
6.521
6.566
4.601
3.433
4.768
5.647
4.419
1.805
6.813
7.794
3.243
6.959
7.06
10.244
5.038
6.706
0.011
0.163
0.003
0.088
0.189
1.301
0.660
1.792
0.359
0.401
0.442
0.518
0.543
0.463
0.611
0.163
0.852
2.510
0.355
1.009
0.882
1.315
0.528
0 2 4 6 8 10 12
Uzbekistan
Moldova
Kyrgyzstan
Georgia
Serbia
United Kingdom
Switzerland
Sweden
Slovenia
Slovak Republic
Russia
Portugal
Poland
Norway
Lithuania
Latvia
Italy
Ireland
Greece
Germany
France
Finland
Czech Republic
Belgium
C
B
A
FIX
FVIII
GNI

World Federation of Hemophilia Global Survey 2012
9 WFH Global Survey 2012
C5. Mean per capita factor VIII and IX use in 2012 – regional and GNI comparisons of IU/total population: South-East Asia
C6. Mean per capita factor VIII and IX use in 2012 – regional and GNI comparisons of IU/total population: Western Pacific
Economic category based on World Bank rankings. Categories are based on the rankings for 2012. (GNI in US dollars: D lower income, $0-$995; C lower middle income, $996 - $3,945; B upper middle income, $3,946 - $12,195; and A high income, $12,196 or more.) PLEASE NOTE: The X axis showing the number of IU/capita is different in each graph. The orange line indicates 1 IU per capita of factor VIII. The WFH has established that one international unit (IU) of FVIII clotting factor concentrate per capita should be the target minimum for countries wishing to achieve optimal survival for the hemophilia population. Higher levels would be required to preserve joint function or achieve a quality of life equivalent to an individual without hemophilia. Please note the orange line does not apply to factor IX. Where there is no number for factor IX no number was reported. Only countries that completed the 2012 questionnaire are included in these charts.
0.003
0.020
0.001
0.004
0 1
Bangladesh
India
D
C
FIX FVIII
GNI
0.010
0.056
0.813
5.858
3.531
3.531
7.079
0.016
0.002
0.355
0.812
0.777
0.780
1.206
0 1 2 3 4 5 6 7 8
Nepal
Viet Nam
Malaysia
New Zealand
Korea, Republic of
Japan
Australia
D
C
B
A
FIX
FVIII
GNI

World Federation of Hemophilia Global Survey 2012
WFH Global Survey 2012 10
Countries included in the 2012 WFH Global Survey Report Please note: the year indicates the year the submitted data applies to. Not all of our members are able to submit data every year. For the 2012 survey report, 86 countries submitted data for 2012. The data used from other years is as follows. 2011: 14 countries, 2010: 5 countries, 2009: 4 countries. For countries that did not complete a 2012 survey form but are part of the WFH GAP program, WFH data on the total number of patients identified and factor use in 2012 was used. All other data are from the year indicated. 2009 to 2011 surveys are only used for reporting the number of patients identified – all other numbers in this report are from 2012 only.
Albania 2011 Algeria 2012 Argentina 2012 Armenia 2009 Australia 2012 Austria 2011 Azerbaijan 2011 Bahrain 2012 Bangladesh 2012 Belarus 2010 Belgium 2012 Belize 2012 Bolivia 2011 Brazil 2012 Bulgaria 2011 Cambodia 2012 Cameroon 2012 Canada 2012 Chile 2009 China 2012 Colombia 2012 Costa Rica 2012 Cote d'Ivoire 2012 Cuba 2012 Czech Rep. 2012 Denmark 2011 Dominican Rep. 2012 Ecuador 2012 Egypt 2012 El Salvador 2012 Eritrea 2012 Ethiopia 2012 Finland 2012 France 2012 Georgia 2012 Germany 2012 Ghana 2012
Greece 2012 Guatemala 2012 Honduras 2012 Hungary 2011 India 2012 Indonesia 2012 Iran 2012 Iraq 2012 Ireland 2012 Israel 2010 Italy 2012 Jamaica 2012 Japan 2012 Jordan 2012 Kenya 2012 Korea, Rep. 2012 Kuwait 2011 Kyrgyzstan 2012 Latvia 2012 Lebanon 2012 Lesotho 2012 Lithuania 2012 Macedonia 2011 Malaysia 2012 Mauritius 2012 Mexico 2012 Moldova 2012 Mongolia 2010 Morocco 2012 Nepal 2012 Netherlands 2012 New Zealand 2012 Nicaragua 2012 Nigeria 2012 Norway 2012 Oman 2012 Pakistan 2012
Palestine 2012 Panama 2012 Paraguay 2009 Peru 2010 Philippines 2011 Poland 2012 Portugal 2012 Qatar 2012 Romania 2011 Russia 2012 Saudi Arabia 2012 Senegal 2012 Serbia 2012 Slovak Rep. 2012 Slovenia 2012 South Africa 2012 Spain 2011 Sri Lanka 2010 Sudan 2012 Sweden 2012 Switzerland 2012 Syria 2012 Tanzania 2012 Thailand 2011 Tunisia 2012 Turkey 2012 Uganda 2012 Ukraine 2012 United Kingdom 2012 United States 2012 Uruguay 2009 Uzbekistan 2012 Venezuela 2012 Viet Nam 2012 Zimbabwe 2011
World Federation of Hemophilia Global Survey 2012
11 WFH Global Survey 2012
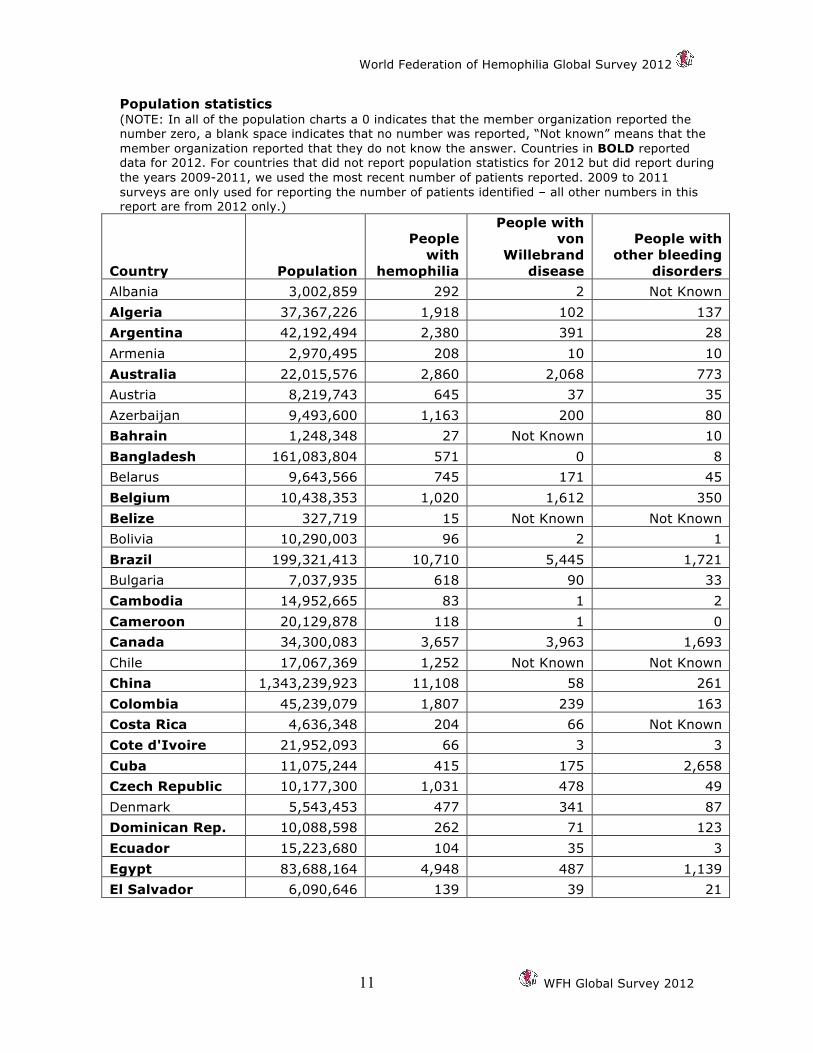
Population statistics (NOTE: In all of the population charts a 0 indicates that the member organization reported the number zero, a blank space indicates that no number was reported, “Not known” means that the member organization reported that they do not know the answer. Countries in BOLD reported data for 2012. For countries that did not report population statistics for 2012 but did report during the years 2009-2011, we used the most recent number of patients reported. 2009 to 2011 surveys are only used for reporting the number of patients identified – all other numbers in this report are from 2012 only.)
Country Population
People with
hemophilia
People with von
Willebrand disease
People with other bleeding
disorders Albania 3,002,859 292 2 Not Known Algeria 37,367,226 1,918 102 137 Argentina 42,192,494 2,380 391 28 Armenia 2,970,495 208 10 10 Australia 22,015,576 2,860 2,068 773 Austria 8,219,743 645 37 35 Azerbaijan 9,493,600 1,163 200 80 Bahrain 1,248,348 27 Not Known 10 Bangladesh 161,083,804 571 0 8 Belarus 9,643,566 745 171 45 Belgium 10,438,353 1,020 1,612 350 Belize 327,719 15 Not Known Not Known Bolivia 10,290,003 96 2 1 Brazil 199,321,413 10,710 5,445 1,721 Bulgaria 7,037,935 618 90 33 Cambodia 14,952,665 83 1 2 Cameroon 20,129,878 118 1 0 Canada 34,300,083 3,657 3,963 1,693 Chile 17,067,369 1,252 Not Known Not Known China 1,343,239,923 11,108 58 261 Colombia 45,239,079 1,807 239 163 Costa Rica 4,636,348 204 66 Not Known Cote d'Ivoire 21,952,093 66 3 3 Cuba 11,075,244 415 175 2,658 Czech Republic 10,177,300 1,031 478 49 Denmark 5,543,453 477 341 87 Dominican Rep. 10,088,598 262 71 123 Ecuador 15,223,680 104 35 3 Egypt 83,688,164 4,948 487 1,139 El Salvador 6,090,646 139 39 21

World Federation of Hemophilia Global Survey 2012
WFH Global Survey 2012 12
Country Population
People with
hemophilia
People with von
Willebrand disease
People with other bleeding
disorders Eritrea 6,086,495 60 Not Known Not Known Ethiopia 91,195,675 61 20 0 Finland 5,262,930 436 3,016 42 France 65,630,692 6,035 1,496 413 Georgia 4,570,934 272 28 16 Germany 81,305,856 4,660 4,450 Not Known Ghana 24,652,402 90 1 Not Known Greece 10,767,827 912 836 246 Guatemala 14,099,032 119 13 1 Honduras 8,296,693 203 3 5 Hungary 9,958,453 Not Known Not Known Not Known India 1,205,073,612 13,314 382 272 Indonesia 248,645,008 1,593 1 Not Known Iran 78,868,711 5,369 1,212 2,719 Iraq 31,129,225 1,004 250 229 Ireland 4,722,028 775 629 1,500 Israel 7,590,758 540 4 1 Italy 61,261,254 4,529 2,233 1,805 Jamaica 2,889,187 Not Known Not Known Not Known Japan 127,368,088 5,617 1,035 635 Jordan 6,508,887 335 215 245 Kenya 43,013,341 642 33 27 Korea, Rep. of 48,860,500 1,944 98 106 Kuwait 2,646,314 Not Known Not Known Not Known Kyrgyzstan 5,496,737 342 8 Not Known Latvia 2,191,580 145 103 5 Lebanon 4,140,289 165 104 69 Lesotho 1,930,493 22 Not Known Not Known Lithuania 3,525,761 166 302 17 Macedonia 2,082,370 315 Not Known Not Known Malaysia 29,179,952 1,218 489 364 Mauritius 1,313,095 52 1 7 Mexico 114,975,406 4,356 221 26 Moldova 3,656,843 224 5 5 Mongolia 3,179,997 75 4 Not Known Morocco 32,309,239 40 0 0

World Federation of Hemophilia Global Survey 2012
13 WFH Global Survey 2012
Country Population
People with
hemophilia
People with von
Willebrand disease
People with other bleeding
disorders Nepal 29,890,686 443 1 13 Netherlands 16,730,632 1,210 2,500 46 New Zealand 4,327,944 421 195 31 Nicaragua 5,727,707 215 63 9 Nigeria 170,123,740 157 6 Not Known Norway 4,707,270 446 903 71 Oman 3,090,150 116 333 325 Pakistan 190,291,129 1,705 530 437 Palestine 4,332,801 140 Not Known 59 Panama 3,510,045 272 430 37 Paraguay 6,541,591 448 1 1 Peru 29,549,517 743 144 17 Philippines 103,775,002 1,131 29 Not Known Poland 38,415,284 2,638 1,387 381 Portugal 10,781,459 645 49 65 Qatar 1,951,591 38 18 12 Romania 21,848,504 1,610 348 9 Russia 142,517,670 5,421 1,254 954 Saudi Arabia 26,534,504 326 75 36 Senegal 12,969,606 154 1 7 Serbia 7,276,604 488 239 23 Slovak Republic 5,483,088 577 570 912 Slovenia 1,996,617 204 162 100 South Africa 48,810,427 2,011 594 212 Spain 47,042,984 1,953 710 211 Sri Lanka 21,481,334 664 Not Known Not Known Sudan 34,206,710 710 191 185 Sweden 9,103,788 1,014 1,474 332 Switzerland 7,925,517 701 137 88 Syria 22,530,746 562 65 63 Tanzania 46,912,768 63 Not Known 1 Thailand 67,091,089 1,260 69 53 Tunisia 10,732,900 380 82 Not Known Turkey 79,749,461 4,895 854 1,430 Uganda 33,640,833 28 2 Not Known Ukraine 44,854,065 2,188 469 11

World Federation of Hemophilia Global Survey 2012
WFH Global Survey 2012 14
Country Population
People with
hemophilia
People with von
Willebrand disease
People with other bleeding
disorders United Kingdom 63,047,162 6,742 9,697 8,355 United States 313,847,465 18,628 8,035 1,796 Uruguay 3,316,328 236 316 11 Uzbekistan 28,394,180 1,301 93 27 Venezuela 28,047,938 2,350 787 860 Viet Nam 91,519,289 2,250 52 181 Zimbabwe 12,619,600 320 Not Known Not Known Total 6,419,691,046 172,373 66,144 35,549

World Federation of Hemophilia Global Survey 2012
15 WFH Global Survey 2012
Distribution of reported bleeding disorders by country (NOTE: In all of the population charts a 0 indicates that the member organization reported the number zero, a blank space indicates that no number was reported. Countries in BOLD reported data for 2012.)
Country Hem
ophi
lia A
Hem
ophi
lia B
Hem
ophi
lia t
ype
unkn
own
VW
D
FI
FII
FV
FV+
VII
I
FVII
FX
FXI
FXII
I
Ble
edin
g D
isor
der:
Typ
e U
nkno
wn
Gla
nzm
anns
th
rom
bast
heni
a
Ber
nard
Sou
lier
Plat
elet
di
sord
ers:
O
ther
/Unk
now
n
Albania 254 38 2 1 Algeria 1,566 352 102 21 3 13 15 56 4 3 9 15
Argentina 2,075 305 180 391 9 1 15 1 2 Armenia 184 18 10 5 2 2 1 1
Australia 2,316 544 2,068 29 15 53 18 170 18 246 14 2 208 Austria 546 99 0 37 0 0 5 1 12 3 7 3 0
Azerbaijan 1,065 98 200 5 11 12 10 3 2 37 6 Bahrain 23 2 0 0 3 2 2 1 5 0 3 0 6
Bangladesh 494 77 6 0 1 1 Belarus 452 94 171 14 1 26 4
Belgium 830 190 8 1,612 1 1 24 2 78 6 112 4 95 19 1 7 Belize 10 5 Bolivia 84 10 2 1 131 Brazil 9,122 1,801 5,445 52 11 112 17 485 73 129 41 285 181 41 294
Bulgaria 560 68 90 1 5 3 2 3 8 11 Cambodia 71 12 1 1 1 2 Cameroon 112 5 0 1 0 0 0 0 0 0 0 0 0
Canada 2,966 691 0 3,963 122 13 59 4 277 37 363 54 11 55 30 668 Chile 1,068 184
China 9,675 1,433 58 2 2 1 2 1 Colombia 1,497 310 167 239 21 9 9 2 17 1 11 7 37 6 5 38
Costa Rica 172 32 66 Cote d'Ivoire 61 5 0 3 0 0 0 0 0 2 1 0 0 0 0 0
Cuba 346 69 175 2 1 2 0 0 0 12 7 10 2 0 2,622 Czech
Republic 898 133 0 478 Denmark 384 91 341 1 1 2 4 7 5 11 8 7 43
Dominican Rep. 223 37 123 71 7 22 3 4 3
Ecuador 98 6 35 1 1 1 Egypt 3,960 988 487 132 8 157 7 95 105 92 29 412 10
El Salvador 120 19 0 39 0 0 0 2 1 5 0 Eritrea 54 6
Ethiopia 51 10 75 20 Finland 339 97 3,016 3 1 5 10 7 2 13 France 4,937 1,098 0 1,496 37 1 44 11 135 18 142 25 0

World Federation of Hemophilia Global Survey 2012
WFH Global Survey 2012 16
Country Hem
ophi
lia A
Hem
ophi
lia B
Hem
ophi
lia t
ype
unkn
own
VW
D
FI
FII
FV
FV+
VII
I
FVII
FX
FXI
FXII
I
Ble
edin
g D
isor
der:
Typ
e U
nkno
wn
Gla
nzm
anns
th
rom
bast
heni
a
Ber
nard
Sou
lier
Plat
elet
di
sord
ers:
O
ther
/Unk
now
n
Georgia 230 40 28 2 2 7 6 Germany 3,910 750 4,450
Ghana 87 3 1 Greece 761 151 836 19 1 16 74 6 70 12 15 11 22
Guatemala 109 10 13 1 1 1 Honduras 180 23 3 3 1 1
Hungary India 11,517 1,797 382 7 5 24 55 31 25 29 62 34
Indonesia 477 66 1,049 1 1 Iran 4,438 931 0 1,212 107 24 147 190 470 153 152 205 478 467 86 254 Iraq 766 273 229 40 1 8 2 55 12 10 29 100
Ireland 547 228 0 629 0 1 131 0 103 58 141 8 846 8 3 201 Israel 458 92 4 Italy 3,779 750 0 2,233 0 20 132 30 595 96 372 41 59 207
Jamaica Japan 4,627 990 1,035 62 7 33 9 72 20 32 60 26
Jordan 255 80 215 4 13 45 25 42 12 103 1 Kenya 428 86 33 14
Korea, Rep. 1,579 365 98 6 4 7 32 2 17 3 Kuwait
Kyrgyzstan 332 10 8 Latvia 121 24 0 103 0 0 0 0 5 0 0 0 0
Lebanon 130 35 0 104 34 0 9 1 7 5 5 2 0 1 0 5 Lesotho 20 2
Lithuania 146 20 302 11 2 2 Macedonia 210 105 Malaysia 1,037 181 489 1 2 18 1 44 15 44 14 43 0 37
Mauritius 48 4 1 3 1 1 2 Mexico 3,793 563 334 221 3 1 14 4 2 1 1
Moldova 207 17 5 1 4 Mongolia 62 13 4 Morocco 36 4 0 4 0
Nepal 388 56 1 1 1 1 7 2 Netherlands 1,026 184 2,500 0 2 4 9 0 1 11 3 16
New Zealand 346 76 0 195 0 1 0 0 6 1 3 1 13 1 0 5 Nicaragua 170 25 20 63 6 1 2
Nigeria 154 3 6 Norway 342 104 0 903 2 2 3 0 24 0 1 4 0 9 2 8
Oman 109 7 333 4 1 7 5 56 4 23 1 19 26 2 177 Pakistan 1,412 293 530 26 2 24 8 50 26 3 35 55 95 10 103

World Federation of Hemophilia Global Survey 2012
17 WFH Global Survey 2012
Country Hem
ophi
lia A
Hem
ophi
lia B
Hem
ophi
lia t
ype
unkn
own
VW
D
FI
FII
FV
FV+
VII
I
FVII
FX
FXI
FXII
I
Ble
edin
g D
isor
der:
Typ
e U
nkno
wn
Gla
nzm
anns
th
rom
bast
heni
a
Ber
nard
Sou
lier
Plat
elet
di
sord
ers:
O
ther
/Unk
now
n
Palestine 113 27 1 3 56 Panama 244 31 0 430 0 0 0 0 8 14 0 0 0 3 1 12 Paraguay 434 14 1 1
Peru 577 103 63 144 1 8 5 1 1 0 Philippines 945 145 41 29
Poland 2,261 377 1,387 17 0 25 3 214 19 39 10 0 19 5 30 Portugal 535 110 49 1 3 2 1 7 1 43 1 6
Qatar 34 4 18 1 2 4 6 0 2 Romania 1,415 195 15 348 1 2 5 1
Russia 4,720 701 1,254 954 Saudi Arabia 260 66 0 75 0 2 3 1 6 1 9 13 0 66 2 0
Senegal 141 13 0 1 0 0 1 0 3 0 0 0 0 0 0 3 Serbia 421 72 0 239 2 0 0 1 10 0 5 3 1 0 1 0 Slovak
Republic 505 72 570 76 0 65 2 640 30 48 3 10 15 23 Slovenia 183 21 162 9 2 11 17 1 3
South Africa 1,696 315 594 7 0 44 5 18 9 30 8 17 23 51 Spain 1,679 277 710 15 3 13 3 25 9 24 17 152 15
Sri Lanka 498 137 29 Sudan 604 106 191 19 29 0 20 15 27 75
Sweden 817 197 1,474 4 1 1 227 20 63 7 1 8 6 250 Switzerland 587 117 0 137 18 0 4 4 29 4 18 14 0 0 0 0
Syria 562 65 65 14 5 28 9 3 11 Tanzania 35 7 22
Thailand 294 51 69 1 0 2 1 14 1 0 0 0 Tunisia 300 70 0 82 24 1 14 6 31 6 12 15 6 62 8 5 Turkey 4,132 763 854 28 537 122 24 106 555 20
Uganda 20 4 4 2 Ukraine 1,860 328 469 1
United Kingdom 5,571 1,171 9,697 174 13 148 23 833 197 2,217 61 116 65 1,525
United States 14,516 4,112 8,035 63 17 94 9 477 65 284 67 103 13 1,746 Uruguay 185 30 21 316 1 2 3 1 2 2 1 1
Uzbekistan 1,201 100 93 1 2 8 9 25 8 15 Venezuela 1,844 506 787 19 65 30 27 125 104 327 16 12 15 4 135 Viet Nam 1,863 397 52 4 3 4 7 17 11 6 4 39 80 Zimbabwe 303 16 1
Total 142,205 28,008 2,158 66,123 1,197 238 1,560 515 6,264 1,427 5,192 1,126 4,192 2,179 361 8,890

World Federation of Hemophilia Global Survey 2012
WFH Global Survey 2012 18
Gender distribution This table provides the number of males and females with each bleeding disorder for the countries that have that data.
Disorder Co
un
trie
s re
po
rtin
g
To
tal
pat
ien
ts
iden
tifi
ed
Mal
e
Per
cen
t m
ale
Fem
ale
Per
cen
t fe
mal
e
Gen
der
no
t kn
ow
n
Per
cen
t n
ot
kno
wn
Hemophilia A 106 142,205 129,708 91 2,344 2 10,153 7 Hemophilia B 106 28,008 25,850 92 719 3 1,439 5 Hemophilia type unknown 39 2,158 2,013 93 22 1 123 6 Von Willebrand disease 95 66,123 22,637 35 33,297 50 10,189 15 Factor I deficiency 55 1,197 442 37 534 45 221 18 Factor II deficiency 51 238 112 47 94 40 32 13 Factor V deficiency 62 1,560 580 37 703 45 277 18 Factor V+VIII deficiency 49 515 289 56 197 38 29 6 Factor VII deficiency 74 6,264 2,796 45 2,697 43 771 12 Factor X deficiency 65 1,427 631 44 596 42 200 14 Factor XI deficiency 65 5,151 2,123 41 2,565 50 463 9 Factor XIII deficiency 67 1,126 586 52 392 35 148 13 Bleeding disorder: type unknown 48 4,192 2,078 49 958 23 1,156 28 Platelet disorders: Glanzmanns thrombasthenia 57 2,179 776 36 786 36 617 28 Platelet disorders: Bernard Soulier syndrome 36 361 148 41 173 48 40 11 Platelet disorders: other or unknown 44 8,890 2,358 27 4,291 48 2,241 25

World Federation of Hemophilia Global Survey 2012
19 WFH Global Survey 2012
Patients with current clinically significant inhibitors (Patients who do not respond to standard treatment.)
Country
Hemophilia A w/ clinically
identified inhibitors
Hemophilia B w/ clinically
identified inhibitors
Algeria 75 No data
Argentina 286 11
Australia 75 1
Bahrain 0 0
Bangladesh 1 No data
Brazil 682 31
Cameroon 8 0
Canada 92 4
China 84 3
Colombia 63 5
Costa Rica 19 1
Cote d'Ivoire
1 0
Cuba 34 0
Czech Rep. 13 2
Dominican Republic
5 0
Ecuador 1 0
Egypt 31 2
El Salvador 6 0
France 115 3
Georgia 4 No data
Germany 90 15
Greece 20 3
Guatemala 2 No data
Honduras 3 No data
India 607 3
Iran 259 11
Iraq 50 2
Ireland 6 2
Italy 417 8
Jamaica 4 0
Japan 87 19
Jordan 17 1
Latvia 2 2
Lebanon 6 0
Lesotho 1 0
Lithuania 5 0
Country
Hemophilia A w/ clinically
identified inhibitors
Hemophilia B w/ clinically
identified inhibitors
Malaysia 93 3
Mauritius 0 0
Mexico 185 11
Moldova 0 0
Morocco 1 0
New Zealand
14 0
Nicaragua 2 No data
Norway 10 0
Oman 17 0
Pakistan 42 3
Palestine 2 No data
Panama 13 0
Poland 150 4
Russia 200 2
Saudi Arabia
42 2
Senegal 4 0
Serbia 22 0
Slovak Republic
5 0
Slovenia 2 No data
South Africa
165 11
Sudan 7 1
Sweden 21 4
Switzerland 8 1
Syria 35 1
Tunisia 7 No data
Turkey 124 15
Uganda 0 0
Ukraine 74 3
United Kingdom
225 10
United States
860 101
Uzbekistan 33 No data
Venezuela 93 3
Viet Nam 48 2
Totals 5675 306

World Federation of Hemophilia Global Survey 2012
WFH Global Survey 2012 20
Age distribution: hemophilia A (76 countries reported age data.)
Country 0-4 5-13 14-18 19-44 45+ Age not known
Algeria 97 168 592 512 197 1,566
Argentina 145 347 224 900 410 49
Australia 129 262 155 883 887
Bahrain 4 4 4 10 1 0
Bangladesh 22 145 118 183 26 0
Belgium 25 111 68 281 342 3
Belize 6 2 2
Brazil 463 1,614 1,127 4,448 1,425 45
Cambodia 21 35 7 8
Cameroon 35 25 34 17 1
Canada 156 415 248 1,210 937
China 393 2,170 1,074 4,709 1,206 123
Colombia 142 149 485 142 42 537
Costa Rica 8 38 23 80 23
Cote d'Ivoire 9 15 20 13 4 0
Cuba 12 44 54 190 46
Czech Republic 41 101 62 384 310 0
Ecuador 0 4 53 10 31
Egypt 1,423 210 73 306 35 1,916
El Salvador 18 62 40
Eritrea 1 17 8 20 3 5
Ethiopia 9 21 12 9 0 0
France 271 796 464 2,116 1,290 0
Georgia 32 40 25 111 24
Ghana 15 48 13 11
Greece 21 85 43 325 265 22
Guatemala 109
Honduras 20 55 43 47 3 11
India 350 1,934 1,301 4,059 670 3,203
Iran 196 644 376 2,573 637 112
Iraq 158 282 146 160 20
Ireland 34 96 44 221 152 0
Italy 3,779
Kenya 121 139 67 61 40
Korea, Republic of 69 225 171 863 251 0
Kyrgyzstan 332
Latvia 7 15 6 61 31 1
Lebanon 10 25 11 65 17 2

World Federation of Hemophilia Global Survey 2012
21 WFH Global Survey 2012
Country 0-4 5-13 14-18 19-44 45+ Age not known
Lesotho 6 8 6
Lithuania 146
Malaysia 252 216 52 82 26 409
Mauritius 2 10 9 17 9 1
Mexico 104 643 485 1,526 320 715
Moldova 1 18 7 92 89
Morocco 4 12 6 13 1 0
Nepal 6 120 80 159 40
Netherlands 8 156 93 250 437 82
New Zealand 15 61 29 125 69 46
Nicaragua 9 32 29 88 10 23
Nigeria 17 58 45 33 2
Norway 18 39 19 143 119 0
Oman 13 31 7 52 6
Pakistan 250 522 353 281 31
Palestine 5 26 21 43 7 11
Panama 12 41 8 142 41
Poland 40 178 120 1,196 726 1
Portugal 15 56 33 225 161 45
Qatar 4 17 13
Russia 4,720
Saudi Arabia 56 92 51 59
Senegal 14 53 19 51 4
Serbia 28 50 30 186 122 5
Slovak Republic 20 53 30 239 163
Slovenia 6 18 4 93 62
South Africa 53 276 210 758 355 44
Sudan 55 197 106 211 17 18
Sweden 34 116 45 126 121
Switzerland 4 69 42 230 242 0
Syria 66 165 92 205 27 7
Turkey 257 943 593 1,794 545 0
Uganda 9 8 1 2 0
Ukraine 473 1,387
United Kingdom 356 712 472 2,147 1,881 3
Uzbekistan 31 165 196 502 44 50
Venezuela 82 287 173 629 211 124
Viet Nam 163 390 254 851 153 76
Totals 6,466 16,179 11,352 38,976 15,346 18,372

World Federation of Hemophilia Global Survey 2012
WFH Global Survey 2012 22
Age distribution: hemophilia B (77 countries reported age data)
Country 0-4 5-13 14-18 19-44 45+ Age not known
Algeria 54 60 71 98 69 352
Argentina 22 63 42 118 54 6
Australia 18 69 28 228 201
Bahrain 0 0 0 2 0 0
Bangladesh 6 26 24 19 2 0
Belgium 4 21 12 64 86 3
Belize 2 1 2
Brazil 93 340 247 812 306 3
Cambodia 6 2 2 2
Cameroon 3 2
Canada 36 66 64 280 245
China 57 273 150 713 231 9
Colombia 40 25 101 28 28 98
Costa Rica 2 5 5 17 3
Cote d'Ivoire 0 0 2 2 1 0
Cuba 2 11 7 36 13
Czech Republic 7 13 9 55 49 0
Ecuador 0 0 1 5 0
Egypt 324 39 14 59 7 544
El Salvador 2 12 5
Eritrea 2 3 1
Ethiopia 2 2 1 3 0 0
France 64 186 104 464 280 0
Georgia 5 4 3 18 10
Ghana 2 1
Greece 4 8 7 72 54 6
Guatemala 10
Honduras 2 21
India 50 296 225 661 124 441
Indonesia 4 17 7 23 1 11
Iran 29 116 78 585 121 2
Iraq 41 95 65 53 19
Ireland 12 41 15 101 59 0
Italy 750
Kenya 5 19 31 29 2
Korea, Republic of 20 68 44 177 56 0
Kyrgyzstan 10
Latvia 1 2 1 16 4 0

World Federation of Hemophilia Global Survey 2012
23 WFH Global Survey 2012
Country 0-4 5-13 14-18 19-44 45+ Age not known
Lebanon 1 9 5 15 5
Lesotho 1 1
Lithuania 20
Malaysia 66 46 7 28 4 30
Mauritius 2 2
Mexico 16 87 76 247 52 85
Moldova 0 1 0 11 5
Morocco 1 1 0 2 0 0
Nepal 14 13 3 17 4
Netherlands 1 24 19 55 69 16
New Zealand 2 7 4 32 24 7
Nicaragua 1 2 1 16 2 2
Nigeria 1 1 1
Norway 8 16 9 36 39 0
Oman 1 2 0 4 0
Pakistan 44 103 81 66 0
Palestine 1 11 4 9 2 0
Panama 2 10 4 13 2
Poland 7 34 22 201 110 3
Portugal 1 11 7 46 35 10
Qatar 1 2 1
Russia 701
Saudi Arabia 4 26 4 28
Senegal 3 7 1 1 1
Serbia 6 14 5 34 13 0
Slovak Republic 6 10 5 36 15
Slovenia 1 1 10 9
South Africa 20 59 24 137 71 4
Sudan 17 40 18 30 1
Sweden 9 23 11 40 55
Switzerland 4 6 8 49 50 0
Syria 2 22 15 23 1 2
Turkey 51 188 110 319 95 0
Uganda 1 3 0 0 0
Ukraine 80 248
United Kingdom 81 136 83 499 372 0
Uzbekistan 5 19 13 56 4 3
Venezuela 14 61 36 160 76 93
Viet Nam 28 60 54 189 34 15
Totals 1,331 2,942 2,083 7,428 3,174 3,238
World Federation of Hemophilia Global Survey 2012
WFH Global Survey 2012 24
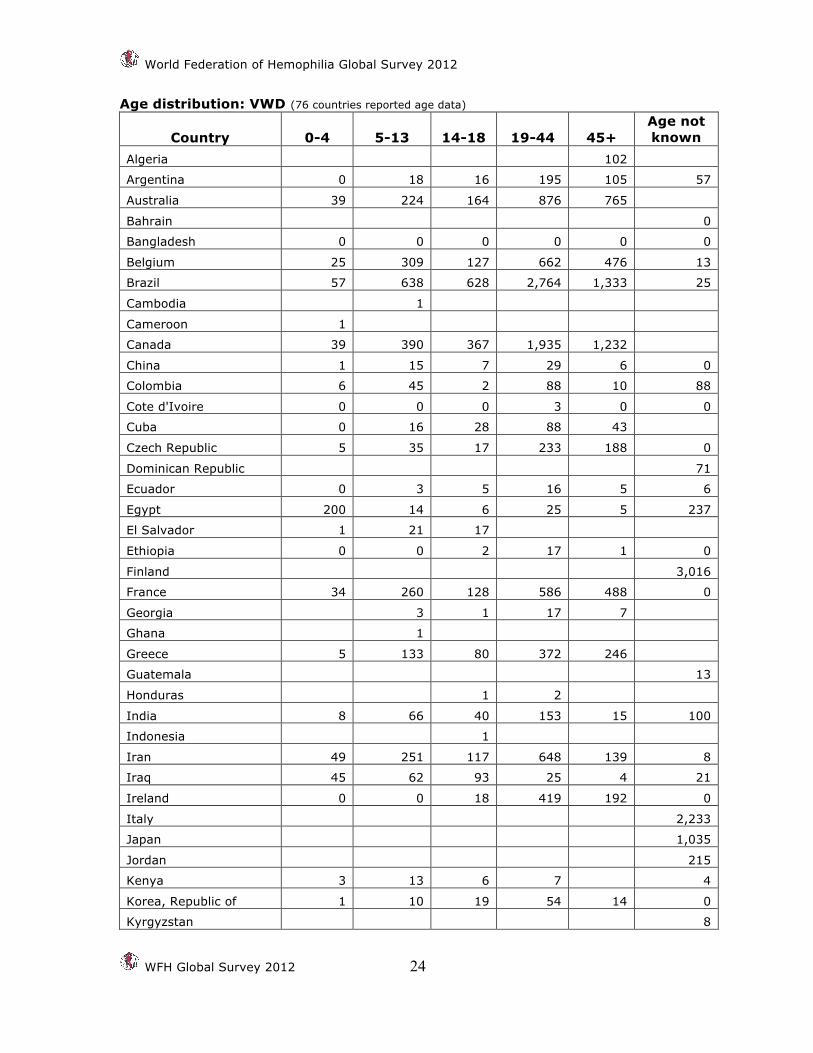
Age distribution: VWD (76 countries reported age data)
Country 0-4 5-13 14-18 19-44 45+ Age not known
Algeria 102
Argentina 0 18 16 195 105 57
Australia 39 224 164 876 765
Bahrain 0
Bangladesh 0 0 0 0 0 0
Belgium 25 309 127 662 476 13
Brazil 57 638 628 2,764 1,333 25
Cambodia 1
Cameroon 1
Canada 39 390 367 1,935 1,232
China 1 15 7 29 6 0
Colombia 6 45 2 88 10 88
Cote d'Ivoire 0 0 0 3 0 0
Cuba 0 16 28 88 43
Czech Republic 5 35 17 233 188 0
Dominican Republic 71
Ecuador 0 3 5 16 5 6
Egypt 200 14 6 25 5 237
El Salvador 1 21 17
Ethiopia 0 0 2 17 1 0
Finland 3,016
France 34 260 128 586 488 0
Georgia 3 1 17 7
Ghana 1
Greece 5 133 80 372 246
Guatemala 13
Honduras 1 2
India 8 66 40 153 15 100
Indonesia 1
Iran 49 251 117 648 139 8
Iraq 45 62 93 25 4 21
Ireland 0 0 18 419 192 0
Italy 2,233
Japan 1,035
Jordan 215
Kenya 3 13 6 7 4
Korea, Republic of 1 10 19 54 14 0
Kyrgyzstan 8

World Federation of Hemophilia Global Survey 2012
25 WFH Global Survey 2012
Country 0-4 5-13 14-18 19-44 45+ Age not known
Latvia 2 63 34 4
Lebanon 4 24 17 46 10 3
Lithuania 302
Malaysia 59 130 39 176 23 62
Mauritius 1 0
Mexico 5 28 27 76 13 72
Moldova 0 0 0 5 0
Morocco 0 0 0 0 0 0
Nepal 1
Netherlands 150 210 300 650 675 515
New Zealand 5 20 15 64 43 48
Nicaragua 5 7 3 1 47
Nigeria 2 4
Norway 10 893
Oman 333
Pakistan 58 215 142 112 3
Panama 6 91 185 121 27
Poland 12 170 147 699 340 19
Portugal 0 1 4 19 23 2
Qatar 18
Russia 1,254
Saudi Arabia 4 10 34 26 1
Senegal 0 0 1 0 0
Serbia 10 23 12 136 58 0
Slovak Republic 570
Slovenia 3 22 10 91 36
South Africa 3 51 56 263 194 27
Sudan 36 82 30 38 5
Sweden 6 28 21 267 264 888
Switzerland 1 10 11 52 63 0
Syria 5 23 6 26 3 2
Tunisia 82
Turkey 70 257 151 312 64 0
Uganda 2
Ukraine 87 382
United Kingdom 314 991 752 4,129 3,508 3
Venezuela 12 131 61 306 110 167
Viet Nam 5 10 3 20 2 12
Totals 1,297 5,061 4,012 17,301 10,875 12,476

World Federation of Hemophilia Global Survey 2012
WFH Global Survey 2012 26
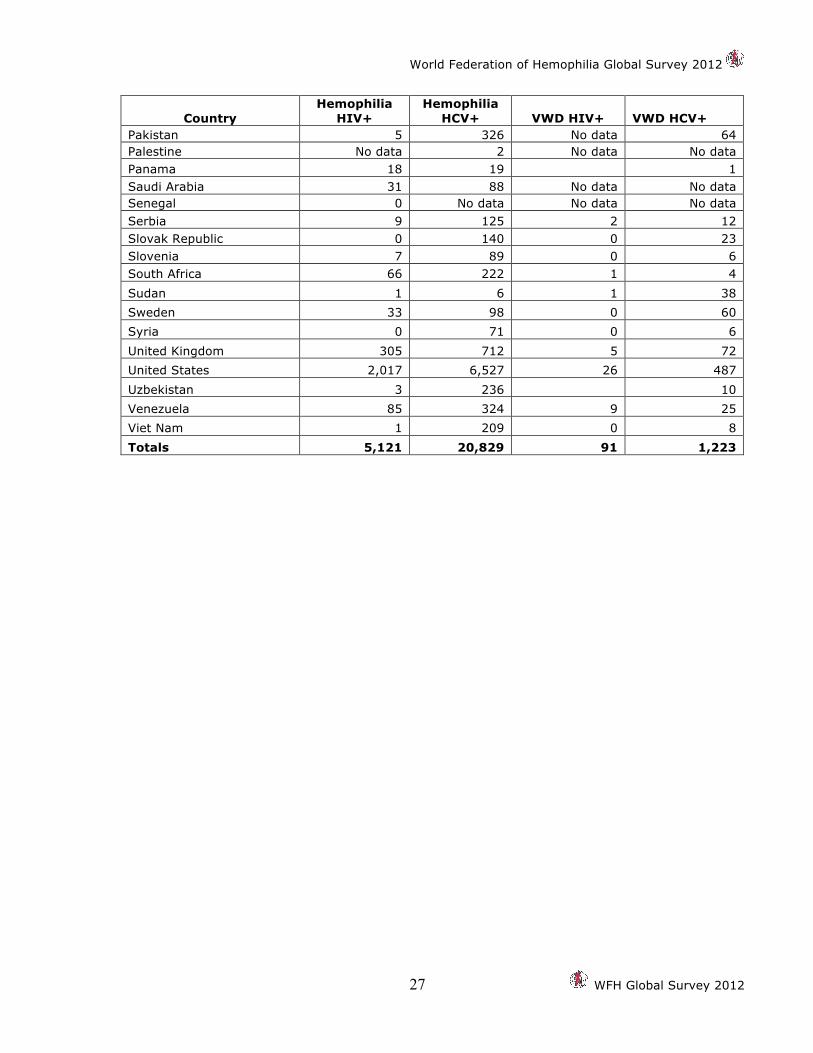
HIV and HCV infection (People currently living with HIV or HCV)
Country Hemophilia
HIV+ Hemophilia
HCV+ VWD HIV+ VWD HCV+ Algeria 3 41 0 5 Argentina 63 620 0 21 Bahrain 0 0 0 0 Bangladesh No data 1 No data No data Cameroon 0 0 0 No data Canada 199 No data No data No data China 32 203 0 0 Colombia 4 150 0 11 Cote d'Ivoire 0 1 0 0 Cuba 4 149 0 9 Czech Republic 2 183 0 4 Dominican Republic 0 12 0 0 Ecuador 0 0 0 0 Ethiopia 4 3 No data No data Finland 0 No data No data No data France 456 1,730 14 151 Georgia 0 130 0 3 Germany 395 2,250 4 No data Greece 63 305 1 26 Guatemala 0 0 0 No data India 156 22 No data No data Indonesia 1 57 No data No data Iran 50 1,800 No data No data Iraq 30 35 Ireland 33 141 0 11 Italy 266 1,501 9 26 Jamaica 1 No data No data No data Japan 743 1,571 7 80 Jordan 2 46 No data No data Kenya 23 No data 0 No data Korea, Republic of No data No data 0 0 Kyrgyzstan No data 300 No data No data Lebanon 0 0 0 0 Lesotho 0 0 No data No data Lithuania 0 No data 0 No data Malaysia 3 168 0 0 Mauritius 0 6 0 1 Mexico 23 119 1 3 Morocco 0 0 No data No data Nepal 0 6 0 0 Netherlands No data No data 10 15 New Zealand 6 57 1 6 Nicaragua 1 17 0 0 Norway 5 No data 0 No data Oman 2 16 No data No data
World Federation of Hemophilia Global Survey 2012
27 WFH Global Survey 2012
Country Hemophilia
HIV+ Hemophilia
HCV+ VWD HIV+ VWD HCV+ Pakistan 5 326 No data 64 Palestine No data 2 No data No data Panama 18 19 1 Saudi Arabia 31 88 No data No data Senegal 0 No data No data No data Serbia 9 125 2 12 Slovak Republic 0 140 0 23 Slovenia 7 89 0 6 South Africa 66 222 1 4 Sudan 1 6 1 38 Sweden 33 98 0 60 Syria 0 71 0 6 United Kingdom 305 712 5 72 United States 2,017 6,527 26 487 Uzbekistan 3 236 10 Venezuela 85 324 9 25 Viet Nam 1 209 0 8 Totals 5,121 20,829 91 1,223

World Federation of Hemophilia Global Survey 2012
WFH Global Survey 2012 28
Reported Use of Factor Concentrates in 2012: Factor VIII The quantities of factor VIII in this chart are as reported to the WFH and are not independently verified. In some cases the numbers reported may be for one region or hospital only. Some countries report the amount of factor concentrate consumed in the year 2012 while others report the amount purchased. The per capita number divides the total IUs used by the total population of the country. This gives an indication of the amount of product being used in a country but cannot be used to determine the level of care for individual patients. Please note that some FVIII products are used in the treatment of von Willebrand disease and not for hemophilia A.
Country Fact
or
VII
I to
tal
IU
Fact
or
VII
I p
lasm
a-d
eriv
ed
Fact
or
VII
I re
com
bin
ant
Fact
or
VII
I h
um
anit
aria
n
aid
Fact
or
VII
I p
er c
apit
a
FVII
I p
er c
ap.
wit
ho
ut
hu
m.
aid
To
tal
per
cen
t p
lasm
a-d
eriv
ed
To
tal
per
cen
t re
com
bin
ant
Algeria 60,772,500 47,115,500 13,657,000 0 1.626 1.626 78% 22% Argentina 143,055,500 108,000,000 35,000,000 55,500 3.391 3.389 75% 24% Australia 155,839,250 17,844,250 137,995,000 7.079 7.079 11% 89% Bangladesh 406,466 387,440 19,026 206,466 0.003 0.001 95% 5% Belgium 70,000,000 5,000,000 65,000,000 6.706 6.706 7% 93% Belize 443,783 11,000 432,783 443,783 1.354 0.000 2% 98% Canada 220,867,573 30,953,715 189,913,858 0 6.439 6.439 14% 86% Colombia 170,996,500 105,761,500 65,235,000 149,580 3.780 3.777 62% 38% Cote d'Ivoire 312,671 22,021 290,650 312,671 0.014 0.000 7% 93% Cuba 3,203,023 3,175,429 27,594 106,023 0.289 0.280 99% 1% Czech Rep. 51,276,608 32,973,006 18,303,602 0 5.038 5.038 64% 36% Ecuador 3,460,600 0 0 0.227 0.227 Egypt 22,000,000 16,000,000 6,000,000 0.263 0.263 73% 27% Ethiopia 665,000 465,000 200,000 199,500 0.007 0.005 70% 30% Finland 53,914,050 6,841,050 47,073,000 10.244 10.244 13% 87% France 463,346,750 66,852,250 396,494,500 7.060 7.060 14% 86% Georgia 3,800,000 50,000 50,000 50,000 0.831 0.820 Germany 565,800,000 248,952,000 316,848,000 0 6.959 6.959 44% 56% Ghana 40,000 40,000 40,000 0.002 0.000 0% 100% Greece 34,917,907 2,231,513 32,686,394 0 3.243 3.243 6% 94% Guatemala 2,631,000 3,500,000 2,631,000 76,326 0.187 0.181 Honduras 2,005,184 205,184 0.242 0.217 India 24,240,000 23,230,000 1,001,000 11,000 0.020 0.020 96% 4% Iraq 30,000,000 30,000,000 0 0.964 0.964 0% 100% Ireland 36,805,250 1,824,500 34,980,750 0 7.794 7.794 5% 95% Italy 417,389,250 91,928,500 325,460,750 0 6.813 6.813 22% 78%
Japan 449,700,000 76,300,000 373,400,000 0 3.531 3.531 17% 83% Jordan 6,508,887 1.000 1.000 Kenya 361,146 361,146 0.008 0.000 Korea, Rep. 172,546,000 70,351,000 102,195,000 3.531 3.531 41% 59% Kyrgyzstan 640,000 300,000 0.116 0.062 Latvia 3,955,000 3,492,000 463,000 0 1.805 1.805 88% 12% Lebanon 3,754,326 2,100,000 970,000 684,326 0.907 0.741 Lesotho 100,000 0 0 0 0.052 0.052 Lithuania 15,580,000 7,381,000 8,199,000 4.419 4.419 47% 53%

World Federation of Hemophilia – Annual Global Survey – 2012
29 WFH Global Survey 2012
Country Fact
or
VII
I to
tal
IU
Fact
or
VII
I p
lasm
a-d
eriv
ed
Fact
or
VII
I re
com
bin
ant
Fact
or
VII
I h
um
anit
aria
n
aid
Fact
or
VII
I p
er c
apit
a
FVII
I p
er c
ap.
wit
ho
ut
hu
m.
aid
To
tal
per
cen
t p
lasm
a-d
eriv
ed
To
tal
per
cen
t re
com
bin
ant
Malaysia 23,731,000 23,321,000 410,000 0.813 0.813 98% 2% Mauritius 1,000,000 1,000,000 0 0.762 0.762 100% 0% Mexico 129,120,000 115,787,750 13,332,250 238,750 1.123 1.121 90% 10% Moldova 650,000 650,000 0 150,000 0.178 0.137 100% 0% Nepal 288,839 230,518 0.010 0.002 New Zealand 25,351,250 3,675,500 21,675,750 0 5.858 5.858 14% 86% Nicaragua 350,000 350,000 0 350,000 0.061 0.000 100% 0% Nigeria 336,508 237,708 98,800 336,508 0.002 0.000 71% 29% Norway 26,580,000 2,710,000 23,870,000 0 5.647 5.647 10% 90% Oman 1,890,000 0 1,890,000 0 0.612 0.612 0% 100% Pakistan 1,320,752 245,690 1,075,062 1,056,602 0.007 0.001 19% 81% Palestine 1,000,000 0.231 0.231 Panama 6,290,465 6,283,215 27,500 0 1.792 1.792 100% 0% Poland 183,162,900 130,506,400 52,656,500 0 4.768 4.768 71% 29% Portugal 37,012,250 13,695,500 23,316,750 3.433 3.433 37% 63% Russia 655,712,308 568,140,858 87,571,450 0 4.601 4.601 87% 13% Saudi Arabia 42,496,000 8,499,200 33,996,800 0 1.602 1.602 20% 80% Senegal 228,000 50,000 178,000 228,000 0.018 0.000 22% 78% Serbia 9,812,500 9,600,000 212,500 0 1.348 1.348 98% 2% Slovak Rep. 36,000,000 34,500,000 1,500,000 0 6.566 6.566 96% 4% Slovenia 13,019,650 2,831,000 10,188,650 6.521 6.521 22% 78% South Africa 49,857,000 46,616,750 3,240,250 0 1.021 1.021 94% 6% Sudan 2,089,022 1,712,500 376,522 376,522 0.061 0.050 82% 18% Sweden 95,970,000 15,473,000 80,497,000 0 10.542 10.542 16% 84% Switzerland 36,942,750 6,899,850 30,046,000 0 4.661 4.661 19% 81% Syria 6,000,000 6,000,000 0 355,000 0.266 0.251 100% 0% Tunisia 8,845,750 6,618,750 2,227,000 0.824 0.824 75% 25% Uganda 152,641 0 152,641 0.005 0.005 0% 100% United Kingdom 478,121,230 53,775,170 424,346,060 0 7.584 7.584 11% 89% United States 1,600,000,000 500,000,000 1,300,000,000 5.098 5.098 Uzbekistan 7,157,000 7,157,000 215,000 0.252 0.244 100% 0% Venezuela 56,500,000 20,000,000 36,500,000 0 2.014 2.014 35% 65% Viet Nam 5,161,750 5,161,750 0 200,000 0.056 0.054 100% 0% Totals 6,733,483,789 2,564,241,265 4,353,952,392 6,938,405 1.072 38% 62%

World Federation of Hemophilia Global Survey 2012
WFH Global Survey 2012 30
Reported Use of Factor Concentrates in 2012: Factor IX The quantities of factor IX in the chart above are as reported to the WFH and are not independently verified. In some cases the numbers reported may be for one region or hospital only. Some countries report the amount of factor concentrate consumed in the year 2012 while others report the amount purchased. The factor IX per capita divides the total IUs used by the total population of the country. This gives an indication of the amount of product being used in a country but cannot be used to determine the level of care for individual patients.
Country Fact
or
IX t
ota
l IU
Fact
or
IX p
lasm
a-d
eriv
ed
Fact
or
IX
reco
mb
inan
t
Fact
or
IX
hu
man
itar
ian
aid
Fact
or
IX p
er c
apit
a Fa
cto
r IX
per
cap
ita
wit
ho
ut
hu
man
itar
ian
aid
To
tal
per
cen
t p
lasm
a-d
eriv
ed
To
tal
per
cen
t re
com
bin
ant
Algeria 14,609,400 14,609,400 0 0 0.391 0.391 100% 0% Argentina 14,877,300 12,260,000 2,600,000 17,300 0.353 0.352 82% 17% Australia 26,556,250 3,224,500 23,331,750 1.206 12% 88% Bangladesh 148,700 0 148,700 148,700 0.001 0.000 0% 100% Belize 185,000 20,000 165,000 185,000 0.565 0.000 11% 89% Canada 45,799,681 6,170,922 39,628,759 0 1.335 1.335 13% 87% Colombia 19,239,000 12,668,800 6,570,200 9,030 0.425 0.425 66% 34% Cote d'Ivoire 40,000 0 40,000 40,000 0.002 0.000 0% 100% Cuba 297,500 297,500 0 0 0.027 0.027 100% 0% Czech Rep. 5,369,862 4,615,700 754,162 0 0.528 0.528 86% 14% Ecuador 103,200 0 0 0.007 0.007 Egypt 600,000 100,000 500,000 0.007 17% 83% Ethiopia 150,000 50,000 100,000 150,000 0.002 0.000 33% 67% Finland 6,918,500 906,000 6,012,500 1.315 13% 87% France 57,911,500 29,437,500 28,474,000 0.882 51% 49% Georgia 4,100,000 4,100,000 0.088 100% 0% Germany 82,000,000 50,020,000 31,980,000 0 1.009 1.009 61% 39% Ghana 10,000 10,000 10,000 0.000 0.000 0% 100% Greece 3,820,406 358,707 3,461,699 0 0.355 0.355 9% 91% Guatemala 800,000 3,500,000 0.057 438% 0% Honduras 641,588 641,588 0.077 0.000 India 5,050,000 5,050,000 0 800,000 0.004 0.004 100% 0% Iraq 6,000,000 6,000,000 0 0.193 0.193 0% 100% Ireland 11,850,750 0 11,850,750 0 2.510 2.510 0% 100% Italy 52,168,700 11,841,200 40,327,500 0 0.852 0.852 23% 77% Japan 99,300,000 46,600,000 52,700,000 0 0.780 0.780 47% 53% Jordan 4,556,221 0.700 Korea, Rep. 37,972,000 0.777 Kyrgyzstan 16,000 0.003 Latvia 357,700 357,700 0 0 0.163 0.163 100% 0% Lebanon 872,350 843,000 29,350 0.211 0.204 97% 0% Lesotho 3,000 0 0 0 0.002 0.002 Lithuania 2,154,700 2,154,700 0 0.611 100% 0%

World Federation of Hemophilia – Annual Global Survey – 2012
31 WFH Global Survey 2012
Country Fact
or
IX t
ota
l IU
Fact
or
IX p
lasm
a-d
eriv
ed
Fact
or
IX
reco
mb
inan
t
Fact
or
IX
hu
man
itar
ian
aid
Fact
or
IX p
er c
apit
a Fa
cto
r IX
per
cap
ita
wit
ho
ut
hu
man
itar
ian
aid
To
tal
per
cen
t p
lasm
a-d
eriv
ed
To
tal
per
cen
t re
com
bin
ant
Malaysia 10,364,000 10,364,000 0 0.355 100% 0% Mauritius 24,000 24,000 0 1,250,000 0.018 0.000 100% 0% Mexico 17,784,500 17,740,800 43,700 43,700 0.155 0.154 100% 0% Moldova 594,760 594,760 0 594,760 0.163 0.000 100% 0% Nepal 486,200 486,200 0.016 0.000 New Zealand 3,515,500 1,581,000 1,934,500 0 0.812 0.812 45% 55% Nicaragua 230,000 230,000 0 230,000 0.040 0.000 100% 0% Nigeria 180,000 0 180,000 180,000 0.001 0.000 0% 100% Norway 2,180,000 1,990,000 190,000 0 0.463 0.463 91% 9% Oman 40,000 40,000 0 0.013 0.013 0% 100% Pakistan 427,000 191,000 236,000 427,000 0.002 0.000 45% 55% Panama 352,300 352,300 0 0 0.100 0.100 100% 0% Poland 20,855,800 20,558,300 297,500 0 0.543 0.543 99% 1% Portugal 5,587,250 4,318,000 1,269,250 0.518 77% 23% Russia 62,984,840 62,984,840 0 0 0.442 0.442 100% 0% Saudi Arabia 2,393,500 2,393,500 0 0 0.090 0.090 100% 0% Senegal 75,000 0 75,000 75,000 0.006 0.000 0% 100% Serbia 1,375,000 1,375,000 0 0 0.189 0.189 100% 0% Slovak Rep. 2,200,000 2,200,000 0 0 0.401 0.401 100% 0% Slovenia 716,500 716,500 0.359 100% 0% South Africa 6,897,500 6,897,500 0 0 0.141 0.141 100% 0% Sudan 217,300 217,300 0.006 100% 0% Sweden 16,314,000 7,129,000 9,185,000 0 1.792 1.792 44% 56% Switzerland 5,231,000 4,380,000 851,000 0 0.660 0.660 84% 16% Syria 1,200,000 1,200,000 0 459,000 0.053 0.033 100% 0% Tunisia 1,233,000 1,233,000 0 0.115 100% 0% Uganda 57,184 0 57,184 0.002 0% 100% United Kingdom 82,034,926 9,355,720 72,679,206 0 1.301 1.301 11% 89% United States 250,100,000 100,000 247,000,000 0.797 0% 99% Uzbekistan 316,000 316,000 0.011 100% 0% Venezuela 4,700,000 4,700,000 0 0 0.168 0.168 100% 0% Viet Nam 212,000 212,000 0 1,580,000 0.002 0.000 100% 0% Totals 1,005,358,368 372,540,149 588,693,360 7,356,628 0.168 41% 59%

World Federation of Hemophilia Global Survey 2012
WFH Global Survey 2012 32
Sample Survey Questionnaire
A. National Hemophilia Organization Organization name
Address
City
State, Province, Region, Prefecture, County
Postal/ZIP Code
Country
Phone
Fax
Website
B. Identified patients
(Please DO NOT estimate or guess) Number Not known
1. Number of identified people with hemophilia A and B (PWH)
2. Number of identified people with von Willebrand disease (vWD)
3. Number of identified people with other hereditary bleeding disorders (including rare factor deficiencies and inherited platelet disorders)
Do you consider these numbers to be accurate? Yes Not sure
The WFH would like to know how you collect the data you are providing for this survey. If you have a registry, we would like to know more about the registry. A registry is a regularly updated centralized list of identified people with hemophilia (PWH) or inherited bleeding disorders. A registry includes information on personal details, diagnosis, treatment, and complications.
4. What is the source of the numbers provided for this survey?
Check one A registry of all PWH and other inherited
bleeding disorders in your country. A registry of all PWH and other inherited
bleeding disorders in your country’s hemophilia treatment centres.
Count information provided by all of your country's hemophilia treatment centres
Count information provided by some of your country’s hemophilia treatment centres.
Other (Describe):
Is your database updated throughout the year or only once per year?
Ongoing update (can be updated anytime) Yearly update (the registry is updated once each
year) Other (please describe):
Who updates the database?
Doctors update the database Patient organization updates the database Hospitals or clinics update the database

World Federation of Hemophilia – Annual Global Survey – 2012
33 WFH Global Survey 2012
Other (please describe):
5. Number of people with Hemophilia and von Willebrand disease by age group
Age group Number with hemophilia A
Number with hemophilia B
Number with VWD
0-4 years old
5 - 13 years old
14 - 18 years old
19 - 44 years old
45 years or older
Patients with age unknown
No age data
Do you consider these numbers to be accurate? Yes Not sure
6.Type of hereditary bleeding disorder
Diagnosis Total Male Female Gender unknown
No data
Hemophilia A
Hemophilia B
Hemophilia, type unknown
von Willebrand disease
Factor I deficiency
Factor II deficiency
Factor V deficiency
Factor V+VIII deficiency
Factor VII deficiency
Factor X deficiency
Factor XI deficiency
Factor XIII deficiency
Other hereditary bleeding disorders: type unknown
Platelet disorders: Glanzmann's thrombasthenia
Platelet disorders: Bernard Soulier Syndrome
Platelet disorders: other or unknown
Do you consider these numbers to be accurate? Yes Not sure

World Federation of Hemophilia Global Survey 2012
WFH Global Survey 2012 34
7. How are patients with rare bleeding disorders (deficiency in FI, FII, FV, FV+VIII, FVII, FX, FXI FXIII) identified?
Factor level below 5% Severe bleeding symptoms Other (please describe):
No data
How are patients with von Willebrand Disease identified?
Laboratory diagnosis Severe bleeding symptoms Other (please describe):
No data
8. Number of identified people with hemophilia by diagnosis of severity
Type of hemophilia Mild (factor level above 5%)
Moderate (factor level 1% to %5)
Severe (factor level below 1%)
Severity unknown
No Data
Hemophilia A male
Hemophilia A female
Hemophilia B male
Hemophilia B female
Do you consider these numbers to be accurate? Yes Not sure
9. Number of severe VWD patients
Total number of severe (type 3) VWD patients
Number of VWD patients receiving replacement therapy
Number of VWD patients with severe bleeding symptoms
No Data
Do you consider these numbers to be accurate? Yes Not sure
10. INHIBITORS: Number of identified people with hemophilia with current clinically significant inhibitors. (Patients who do not respond to normal treatment.)
Type of hemophilia Number with current inhibitors No Data
Hemophilia A
Hemophilia B
11. Products used to treat hemophilia: What percentage of patients is treated with the following products?
Plasma
% Cryoprecipitate
% Plasma-derived concentrate
% Recombinant concentrate
% DDAVP (Desmopressin)
%

World Federation of Hemophilia – Annual Global Survey – 2012
35 WFH Global Survey 2012
12. Products used to treat vWD: What percentage of patients is treated with the following products?
Plasma
% Cryoprecipitate
% Plasma-derived concentrate
% DDAVP (Desmopressin)
% 13. HIV and hepatitis C infection among living people with hemophilia
Infectious Disease
Number of people infected Percentage of people tested No Data
HIV
Hepatitis C
14. HIV and hepatitis C infection among living people with von Willebrand disease
Infectious Disease
Number of people infected Percentage of people tested No Data
HIV
Hepatitis C
15. Number and cause of deaths of people with bleeding disorders (January 1-December 31, 2012)
Cause of death
Number of people with Hemophilia A & B
Number of people with von Willebrand disease
Number of people with other inherited bleeding disorders
Bleeding
HIV
Liver disease
Other causes
C. Hemophilia Care System in Your Country A Hemophilia Treatment Centre (HTC) is a medical centre providing basic diagnosis and treatment for inherited bleeding disorders. A Hemophilia Comprehensive Care Centre (HCCC) is a medical centre providing a full range of facilities for the diagnosis and management of inherited bleeding disorders.
16. How many hemophilia treatment centres are there in your country?
How many hemophilia comprehensive care centres are there in your country?
Percentage of hemophilia patients with access to hemophilia treatment centres:
Prophylaxis is regular, long term treatment with clotting factor concentrates to prevent bleeds. Please indicate if the percentage provided is precise or an estimate.
17. What percentage of children (under age 18) are on prophylaxis?
Precise: Estimate:
Not known
What percentage of adults (over age 18) are on prophylaxis?
Precise: Estimate:
Not known

World Federation of Hemophilia Global Survey 2012
WFH Global Survey 2012 36
D. The Cost and Use of Factor Concentrates 18. Annual usage of factor concentrates Factor VIII Factor IX Not
known
How many international units (IU) of factor concentrates were used in your country in 2012?
How many international units of plasma-derived concentrates were used in your country in 2012?
How many international units of recombinant concentrates were used in your country in 2012?
How many international units were humanitarian aid?
World Federation of Hemophilia – Annual Global Survey – 2012
37 WFH Global Survey 2012
Glossary of terms Bernard-Soulier syndrome: A severe congenital bleeding disorder characterized by thrombocytopenia and large platelets, due to a defect in the platelet glycoprotein 1b/V/IX receptor.
Cryoprecipitate: A fraction of human blood prepared from fresh plasma. Cryoprecipitate is rich in factor VIII, von Willebrand factor, and fibrinogen (factor I). It does not contain factor IX.
Desmopressin (DDAVP): A synthetic hormone used to treat most mild cases of von Willebrand disease and mild hemophilia A. It is administered intravenously or by subcutaneous injection or by intranasal spray.
Factor concentrates: These are fractionated, freeze-dried preparations of individual clotting factors or groups of factors derived from donated blood.
Glanzmann's thrombasthenia: A severe congenital bleeding disorder in which the platelets lack glycoprotein IIb/IIIa, the blood platelet count is normal, but their function is very abnormal.
Hemophilia A: A condition resulting from factor VIII deficiency, also known as classical hemophilia.
Hemophilia B: A condition resulting from factor IX deficiency, also known as Christmas disease.
Hemophilia treatment centre: A specialized medical centre that provides diagnosis, treatment, and care for people with hemophilia and other inherited bleeding disorders.
HIV: Human immunodeficiency virus. The virus that causes AIDS.
Identified person: A living person known to have hemophilia, von Willebrand disease, or another bleeding disorder.
Inhibitors: A PWH has inhibitors when their body's immune system attacks the molecules in factor concentrate, rendering it ineffective.
International Unit (IU): A standardized measurement of the amount of factor VIII or IX contained in a vial. Usually marked on vials as 250 IU, 500 IU, 1000 IU or 2000 IU.
Mild hemophilia: Condition resulting from a level of factor VIII or factor IX clotting activity below normal but above 5% of normal activity in the bloodstream. (National definitions differ on the upper limit for mild hemophilia, ranging from 24% to 50%. The normal range of factor VIII or IX is 50 to 200%)
Moderate hemophilia: Condition resulting from a level of factor VIII or factor IX clotting activity between 1 to 5 % of normal activity in the bloodstream.
Plasma-derived products: Factor concentrates that contain factor VIII or IX that have been fractionated from human blood.
PWH: Person with hemophilia
Recombinant products: Factor concentrates that contain factor VIII or IX that have been artificially produced and are, therefore, not derived from human blood.
Registry: A database or record of identified people with hemophilia or inherited bleeding disorders. A registry includes information on personal details, diagnosis, treatment and complications.
Severe hemophilia: Condition resulting from a level of factor VIII or factor IX clotting activity of less than 1 % in the bloodstream.
von Willebrand disease (VWD): An inherited bleeding disorder resulting from a defect or deficiency of von Willebrand factor.


World Federation of Hemophilia 1425, boul. René-Lévesque Ouest, bureau 1010
Montréal, Québec H3G 1T7 Canada Tel.: +1 (514) 875-7944 Fax: +1 (514) 875-8916
www.wfh.org