global pension risk survey 2017 - aon.com · aon retirement & investment global pension risk...
TRANSCRIPT

AonRetirement & Investment
Global Pension Risk Survey 2017U.S. Survey Findings

Aon 2
Table of Contents
MethodologyU.S. Pension Funding
Long-Term Objectives
Delegation
ExecutiveSummary
InvestmentStrategy
Considerations
Managing Benefits and
Liabilities
Monitoring and Mitigating Pension Risk
Demographics of Survey
Participants
Hedging Risks

12/31/12 12/31/13 12/31/14 12/31/15 12/31/16
July 2012 European Debt Crisis
June 2013“Taper Tantrum”
October 2014Society of Actuaries (SOA) releases final RP-2014 mortality report
November 2016Presidential election
Aon 3
Executive Summary
Every other year, Aon Hewitt’s Global Pension Risk Survey charts the course of pension plan sponsors, mapping out where they’ve been and where they’re going. Since our first survey in 2009, we have seen sponsors of plans in the United States make steady progress along several fronts:
• Opportunistically shrinking plan size via lump-sum windows and annuity buyouts • Shifting away from asset-only frameworks and toward an integrated asset-liability approach to
measuring performance • Shifting away from equities and toward liability-matching investments such as corporate
bonds, treasuries, futures, and swaps • Managing the transition to lower-risk liability-matching investments via dynamic policies linked
most commonly to plan funded status • Refining dynamic policies to reflect interest rate views and credit spreads, for instance via
“hedge paths” and “credit paths” Concurrent with the shift to dynamic investment policies is a shift toward delegation of pension investment management to a firm with the resources to execute these policies effectively. Our 2017 survey shows this trend spreading to larger plans as well. Fueled by this trend, Aon plc’s affiliated investment consulting practices reached $108 billion (USD) in worldwide assets under management for its delegated solutions clients across 10 countries as of June 30, 2017.
The shift to dynamic investment policies has taken place as low interest rates and greater life expectancies exert downward pressure on funded status, slowing the pace of investment de-risking.
Aon Hewitt Pension Risk Tracker (Pension Plan Funded Status for S&P500 Companies)
60%
80%
100%
M E N U

Aon 4
Executive Summary
But rather than abandon their de-risking glide paths, sponsors instead are taking matters into their own hands:
• Some are accelerating contributions to their plans using available cash flow, debt financing, and even non-cash (“in-kind”) vehicles
• Lump-sum windows continue to be an option to reduce headcount and plan costs, with some sponsors planning on a second round
• Annuity liftouts are on the radar for about one-third of survey respondents • Finally, we estimate from company SEC filings that in the five year wave of settlement
activity that started in 2012, just 6% of US corporate pension obligations have actually been settled, of which around 2.5% were settled via annuity buyouts, the remainder via lump sum windows
This survey reveals that sponsors now have greater visibility and control over their pension risk than ever before. Empowered by new tools, they are taking steps to dial pension risk downward.
(Continued)
D E M O G R A P H I C S O F S U R V E Y P A R T I C I P A N T S
M E N U

Under 1,000 8%
5,000 to 10,000 13%
10,000 to 25,00024%
Over 25,000 30%
1,000 to 5,000 25% Under $500 M
40%
$500 to 2,000 M 31%
$2,000 to$5,000 M
13%
$5,000 M and over 16%
By Size of Employee Base in the Defined Benefit Plan By Total Assets in the Defined Benefit Plan
Aon 5
Demographics of Survey Participants
In terms of assets, 40% of respondents’ plans held less than $US 500 million, while 16% held $US 5 billion or more.
Approximately 100 plan sponsors responded to the 2017 survey, totaling nearly 4 million participants and $US 400 billion in assets.
Respondents covered the full range of plan sizes, from the small (8% of respondents’ plans had fewer than 1,000 participants) to the very large (30% with over 25,000 participants).
B A C K T O E X E C U T I V E S U M M A R Y
M E N U

Invest with lower (but still significant) equity-type risks
24%
Minimize accounting expense 4%
No change to current levels of risk
18%Invest without equity-type
risks (e.g., hibernation) 12%
Minimize cash contributions 16%
Insure to remove all risks (e.g., full buyout)
13%
No long-term objective (as yet)
8%
Other long-term strategy 5%
Long-Term Objectives
We first asked respondents about their long-term objectives. As with prior surveys, these objectives varied considerably. We find that they fall into four categories of approximately equal size:
• 25%—minimize or eliminate risk (full buyout or hibernation) • 24%—maintain risk but at a lower level • 20%—minimize cash contributions or accounting expense • 31%—other
Long-term objective
Aon 6F U R T H E R A N A L Y S I SF U R T H E R A N A L Y S I S
M E N U
6–10 years 48%
11–20 years13%
5 years or less 34%
More than 20 years4%
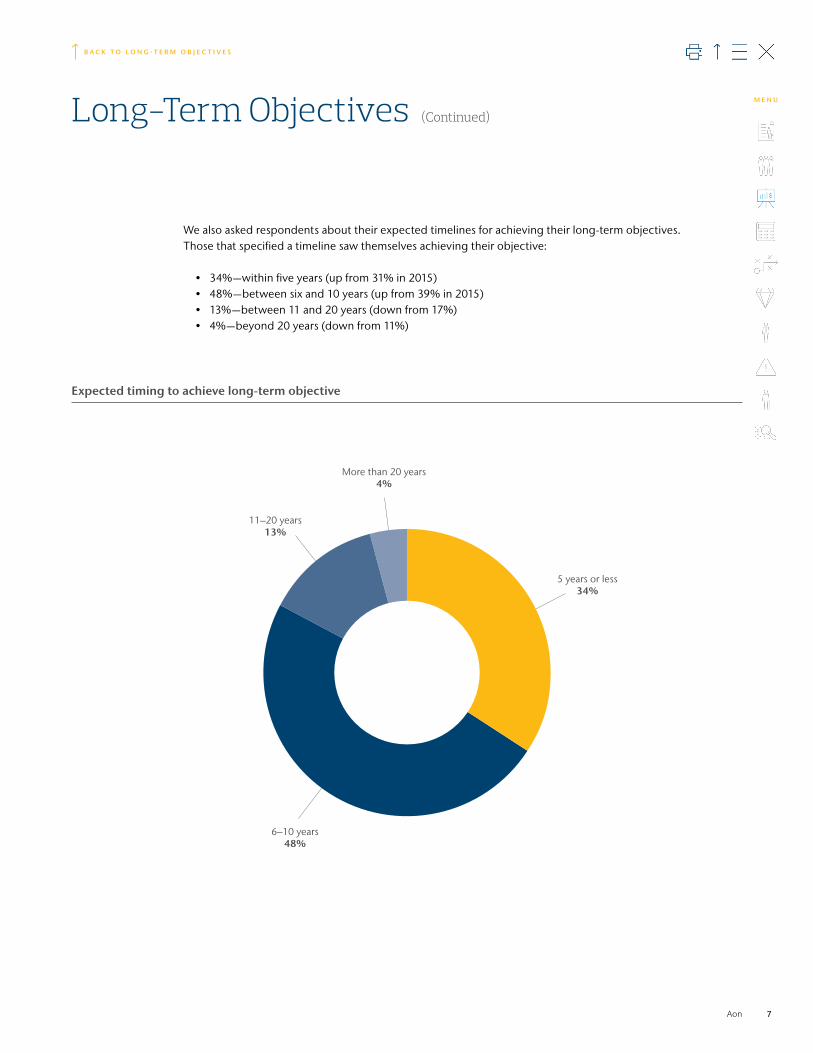
We also asked respondents about their expected timelines for achieving their long-term objectives. Those that specified a timeline saw themselves achieving their objective:
• 34%—within five years (up from 31% in 2015) • 48%—between six and 10 years (up from 39% in 2015) • 13%—between 11 and 20 years (down from 17%) • 4%—beyond 20 years (down from 11%)
Expected timing to achieve long-term objective
Long-Term Objectives (Continued)
Aon 7
B A C K T O L O N G - T E R M O B J E C T I V E S
M E N U
The level of long-term interest rates
38%
The level of corporate bond yields
3%
Amount of risk we arewilling/able to take
26%
Resources to execute our plan
6%Fixed timeline
13%
The employer’s ability to make contributions
13%
The trend toward shorter time horizons is most pronounced with smaller plans. Of those with assets under $500 million, 59% expect to reach their target within five years.
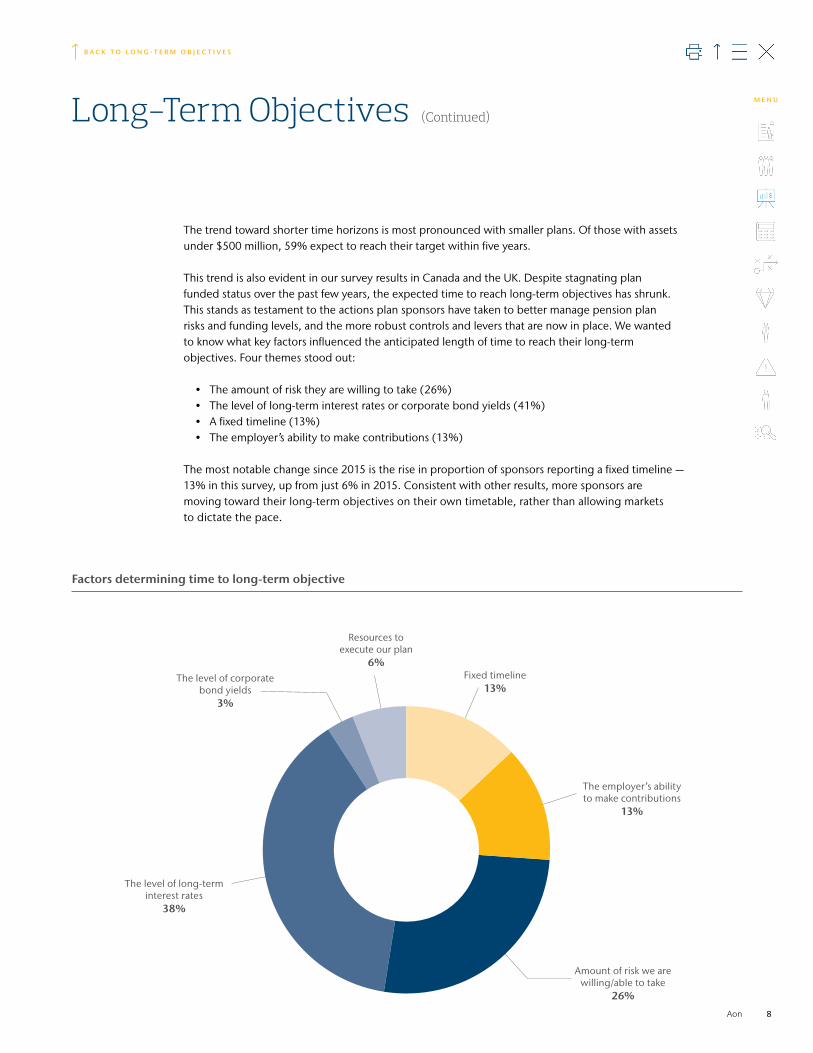
This trend is also evident in our survey results in Canada and the UK. Despite stagnating plan funded status over the past few years, the expected time to reach long-term objectives has shrunk. This stands as testament to the actions plan sponsors have taken to better manage pension plan risks and funding levels, and the more robust controls and levers that are now in place. We wanted to know what key factors influenced the anticipated length of time to reach their long-term objectives. Four themes stood out:
• The amount of risk they are willing to take (26%) • The level of long-term interest rates or corporate bond yields (41%) • A fixed timeline (13%) • The employer’s ability to make contributions (13%)
The most notable change since 2015 is the rise in proportion of sponsors reporting a fixed timeline —13% in this survey, up from just 6% in 2015. Consistent with other results, more sponsors are moving toward their long-term objectives on their own timetable, rather than allowing markets to dictate the pace.
Factors determining time to long-term objective
Long-Term Objectives (Continued)
Aon 8
B A C K T O L O N G - T E R M O B J E C T I V E S
M E N U

All
Over $2B
$500M to $2B
0% 20% 40% 60% 80% 100%
Under $500M
38%
41%
40% 45%
45%
45% 9%
14%
10% 5%
17%4%
8%
35% 43%
Glide path robustness by plan size
Robust Basic Aspirational No plan
Glide paths help sponsors manage risk downward as they get closer to their funded status objective. As in prior surveys, we asked respondents to describe their glide paths as robust, basic, or aspirational. We used the following definitions in the U.S. survey: • A robust glide path is one that has been documented and implemented • A basic plan has documented intent, but is still in the development or implementation phase • An aspirational plan is one where the long-term objective has been established but
development has not yet started The largest sponsors are most likely to have a robust glide path—with 41% of $US 2 billion+ plans having a robust path, compared to 35% of plans holding less than $US 500 million. Similar to the UK survey findings, our U.S. survey shows robust glide paths in place at roughly the same level as in the 2015 survey. The percentage with aspirational plans, or no plans at all, fell from 24% to 17%.
Long-Term Objectives (Continued)
Aon 9
B A C K T O L O N G - T E R M O B J E C T I V E S
M E N U

0% 50%10% 60%20% 70%30% 80% 90%40% 100%
Shifting to defined contribution
Restrict level of earnings on which pension accrues
Reducing future pension benefit levels but retaining
DB-style benefits
Freezing/closing to future accrual for
existing members
Closing plan to new entrants
61% 6% 8% 24%
65%
29%
64%
11%
7%
5%5%
28%
25%
58%
81% 5% 4%
5% 8%
Benefit Actions: What is your outlook on the following strategies over the next 12–24 months?
Already implemented Very likely to implement Somewhat likely to implement Unlikely to implement
Aon 10
Managing Benefits and Liabilities
Pension plans are becoming a legacy obligation for more and more sponsors, as the chart below shows. Our 2017 Hot Topics in Retirement and Financial Wellbeing Report showed open, closed, and frozen plans in roughly equal proportions. Those who responded to our Global Pension Risk Survey reported higher proportions of frozen and closed plans. This is consistent with our observation that companies seeking to control pension risk often start with design changes—closing or freezing their plans—before embarking on other measures.
F U R T H E R A N A L Y S I SF U R T H E R A N A L Y S I S
M E N U

0% 50%10% 60%20% 70% 80%30% 90%40% 100%
Lump-sum offer to former employees
Insured annuity buyout
Restructure plans to reduce PBGC premiums
Insured annuity buy-in
3% 30%
9% 9%
43% 17% 22%
5%
8%
5%5%
2%
Aon 11
Liability management: What is your attitude regarding the following strategies over the next 12–24 months?
Already implemented Very likely to implement Somewhat likely to implement
Further Analysis on Managing Benefits and LiabilitiesOnce design-based savings options have run their course, sponsors generally turn their focus to plan costs. Since 2012, a majority of U.S. corporate plan sponsors have run lump-sum window programs, offering former employees with vested benefits the opportunity to receive the full value in a lump sum. In most cases the goal has been to reduce plan cost and risk. Most sponsors that haven’t done this yet aren’t philosophically opposed to it—instead, they already offer lump sums to terminating employees on an ongoing basis, so further savings from a window are limited. On the other hand, a small portion of respondents that have already opened a window are very likely to do so again in the future.
For those that have exhausted the window opportunity, retiree settlements with life insurance companies is a potential next step. We have seen a surge in buyouts since 2016, usually of a select group of retirees with smaller benefits for whom the cost of administering the plan is high compared to the value of the benefits being delivered. Our survey reveals that sponsors are increasingly aware of the buyout opportunity—and while just a small percentage have actually performed such a transaction, many more are at least somewhat likely to do so in the future.
A few sponsors are exploring more advanced strategies, including plan mergers and spinoffs that may reduce PBGC variable rate premiums. But insured “buy-ins,” somewhat prevalent in the UK, remain of interest to only a handful of sponsors in the U.S.
For pensions in the UK, mandatory pension benefit indexing leads to very high longevity risk. Fortunately, longevity hedging is available in the UK on a standalone basis. For U.S. corporate plans, such indexing is extremely rare, and longevity risk is therefore smaller. U.S. longevity hedging is effectively accomplished via a lump sum or insured annuity settlement by which longevity risk is eliminated along with investment, interest rate, and all other pension risks. Because these alternatives are generally available at a relatively low cost, few U.S. sponsors have even explored standalone longevity risk hedging.
Managing Benefits and Liabilities (Continued)
B A C K T O M A N A G I N G B E N E F I T S A N D L I A B I L I T I E S
M E N U

Investment changes: What changes have you made in the last 12 months to your target investment strategy?
Reduced Not changed Increased
Domestic equities
Fixed government bonds
Corporate bonds
Real estate
Illiquid alts**
Responsible/ESG***
Dynamic asset allocations
21% 63% 16%
18% 66% 16%
6% 76% 18%
5% 88% 7%
13% 67% 21%
15% 76%
7% 83% 10%
13% 73% 13%
8% 77% 15%
3% 84% 12%
100%
92% 8%
84% 16%
10%
Foreign equities
TIPS
Active management
Liquid alts*
Derivatives
Smart beta
0% 50%10% 60%20% 70% 80%30% 90%40% 100%
Hedge funds, commodities, and other liquid alternativesPrivate equity, private real estate, infrastructure, and other illiquid alternativesEnvironment, Social, and Governance
***
***
Aon 12
Investment Strategy Considerations
Our opening questions were aimed at understanding what changes sponsors had made to their asset allocations over the past 12 months.
F U R T H E R A N A L Y S I SF U R T H E R A N A L Y S I S
M E N U

41%–60% 14%
61%–80%18%
21%–40% 27%
20% or less41%
Aon 13
Continuing the trend we have seen in previous surveys, respondents generally are reducing their exposure to equities and moving toward strategies consisting of a diverse portfolio of return-seeking assets combined with a liability-matching portfolio. This is evidenced by the net increase in fixed interest Treasury bonds of 11% (percentage increased less percentage reduced) along with a net increase in corporate bonds (8%) and derivatives (9%). Reductions in equity allocations and increasing allocations to alternative assets are also consistent with this de-risking trend.
Even among this relatively risk-sensitive group, however, it is surprising to note that hedge ratios are still quite low, with 41% showing interest rate hedge ratios of 20% or lower on a liability basis. Many of these plans are poised to de-risk aggressively when their funded status rises or interest rates rise. For now, interest rate risk remains significant.
Interest rate hedging ratios: What is your ratio as a percentage of the value of the liabilities?
(Continued)Investment Strategy Considerations
B A C K T O I N V E S T M E N T S T R A T E G Y C O N S I D E R A T I O N S
M E N U

Manager monitoring
Manager selection
Tactical asset allocation
Hedging
Implementation–entire
Implementation–sleeve
Insured annuity purchase
0% 20% 40% 60% 80% 100%
Delegation: What is your attitude toward having your professional advisers implement aspects of your investment strategy?
Yes, delegate Very likely to delegate Somewhat likely to delegate No, unlikely to delegate No and haven’t evaluated/don’t know
56% 5%3% 36%
44% 7%3% 45%
44% 8%43%
39% 14%42%
33% 10%55%
39% 13%46%
12% 38%7% 5% 38%
4%
4%1%
1%
1%
1%1%
1%1%
Aon 14
Once the investment strategy has been set, the question of how it is implemented arises. We asked respondents how they felt about delegating implementation to a third party across a wide spectrum of investment activities. Not surprisingly, the monitoring of managers is already quite heavily delegated (56%) and remains the most common area of delegation.
However, even the least common area—delegation of the entire investment strategy—has already been carried out by one-third of respondents, up from 25% in 2013 and 29% in 2015. Once primarily a solution for small plans, delegation of investment policy implementation is increasingly embraced by larger plans, with 17% of respondents with over $2 billion in assets taking this path.
(Continued)Investment Strategy Considerations
B A C K T O I N V E S T M E N T S T R A T E G Y C O N S I D E R A T I O N S
M E N U

0% 20% 40% 60% 80% 100%
Domestic equities
Foreign equities
Fixed government bonds
TIPS
Corporate bonds
Active managment
Real estate
Liquid alts*
Illiquid alts**
Derivatives
Responsible/ESG***
Smart beta
Dynamic asset allocations
36% 56% 7%
29% 60% 11%
7% 63% 30%
4% 88% 8%
6% 56% 39%
17% 79% 4%
12% 82% 6%
18% 78% 4%
17% 68% 15%
8% 73% 20%
98%
93% 4%
72% 25%
2%
2%
4%
Hedge funds, commodities, and other liquid alternativesPrivate equity, private real estate, infrastructure, and other illiquid alternativesEnvironment, Social, and Governance
***
** *
Aon 15
Investment changes: What changes do you expect to make in the next 12 months to your target investment strategy?
Reduced Not changed Increased
More details on investment strategy implementationWhen low hedge ratios are combined with widespread adoption of glide paths, and the prospect of accelerated contributions and rising interest rates is mixed in, the path forward seems clear. Looking ahead, our respondents expect to continue their shift out of equities and into liability-matching instruments. This pattern is consistent with prior surveys. While capital markets have slowed glide path progress by pressuring funded status, the glide path concept is proving to be a durable one. Sponsors are sticking with their glide paths, and our survey suggests they have the patience to allow them to work.
In addition to the overall de-risking trend, a smaller move away from active management is evident, with some of that shifting to “smart beta” strategies. “Traditional” alternative allocations, liquid and illiquid alike, would shrink along with public equity exposure if a shift toward higher hedge ratios became apparent.
(Continued)Investment Strategy Considerations
B A C K T O I N V E S T M E N T S T R A T E G Y C O N S I D E R A T I O N S
M E N U

At any price (these are
unrewarded risks)
At “fair value” Pre-determined
triggers
We will not hedge
40%
35%
30%
25%
20%
15%
10%
5%
0
No policy
6%
4%
2%1%
23%
14%13%
10%
36%
18%
9%
14%13%
28%
38%
36%
23%
36%
38%38%
Aon 16
We asked about the general policy on hedging four different types of investment risk. Similar to prior surveys, and in contrast to results in the UK and Canada, U.S. sponsors focus on interest rate risk while choosing to incur inflation, currency, and credit risk. This is understandable: • Most of U.S. respondents with qualified plans have little inflation exposure beyond that
embedded in wage inflation for pay-based plans • The vast majority of U.S. respondents’ plan investments are in U.S. dollar-denominated assets • Credit is usually viewed as a risk to be incurred rather than hedged
Hedging policy
Inflation Rates Credit Currency
Hedging Risks M E N U

0%
10%
20%
30%
40%
50%
60%
Managermonitoring
Managerselection
Tactical assetallocation
Hedging Implementation–entire
41%
52%
56%
35%
44% 44%
31%
38%
44%
24%
28%
39%
25%
29%
33%
Aon 17
Change in attitude to delegation: Percentage of sponsors reporting they had already delegated certain investment functions
2013 2015 2017
The full scale of the increasing delegation trend is apparent when we compare the 2017 results with those of our two prior surveys. The chart below shows that nearly every aspect of the investment strategy has shown consistent growth in delegation over the last four years. Particularly notable is the increase in the delegation of the entire investment strategy (+8%). We believe this rise is likely due to plan sponsors becoming leaner; they are increasingly focused on their core competencies and outsource areas where they lack resources and/or expertise.
And this year, for the first time, we asked respondents whether they delegated the investment of a sleeve (e.g., a single asset class) as opposed to the entire strategy. Over one-third of respondents indicated that they did so, demonstrating that this approach to implementation is most definitely a mainstream activity.
Delegation
F U R T H E R A N A L Y S I SF U R T H E R A N A L Y S I S
M E N U

0%
10%
20%
30%
40%
50%
60%
70%
80%
Managermonitoring
Managerselection
Tactical assetallocation
Hedging Implementation–entire
Implementation–sleeve
29%
59%
71%
21%
50%55%
21%
41%
61%
17%
39%
53%
17%
27%
48%
26% 27%
50%
Aon 18
Is there a link between plan size and the degree of delegation? Most definitely, as shown in this chart—sponsors with smaller plans are more likely to delegate investment implementation across every single category. Investment delegation is one way in which smaller plans can benefit from the advantages of scale, such as access to the best managers and lower fees than their larger counterparts can achieve directly. However, we noted above that larger sponsors are embracing full delegation in increasing numbers, suggesting that the move is as much about improving execution capabilities as it is about lowering costs.
Delegation by size
Large Medium Small
Delegation (Continued)
B A C K T O D E L E G A T I O N
M E N U

0% 20% 40% 60% 80% 100%
Funded status
Year-end accounting balance sheet
Projected P&L cost for next year
Cost of potential annuity purchase
Asset values and investment
performance
12% 52% 23% 13%
37% 48% 13% 2%
51% 39% 9% 1%
78% 19% 3%
3% 54% 31% 11%
Aon 19
Monitoring and Mitigating Pension Risk
As monitoring tools become more powerful, sponsors have access to more timely data on funded status and projected costs. The result is more frequent monitoring of key pension financial variables—not just asset values and funded status, but also projected accounting P&L costs and balance sheet obligations and even potential annuity purchase prices. If we can indeed only
“manage what we measure,” then the scope of pension risk management is now greater than ever before.
Frequency of monitoring
Annually or less frequently Quarterly Monthly Weekly or more frequently
M E N U

0% 20% 40% 60% 80% 100%
Large
Medium
Small
32% 45% 23%
5% 57% 24% 14%
4% 70% 26%
Aon 20
We analyzed the monitoring of pension risks by plan size, and a clear trend became visible. The larger pension plans tend to monitor asset values more frequently than their smaller counterparts. For example, 74% of smaller plans monitored asset values quarterly or less frequently, whereas 68% of respondents managing larger plans monitored assets more frequently.
Frequency of monitoring assets by plan size
Annually or less frequently Quarterly Monthly Weekly or more frequently
Frequency of Monitoring M E N U

Operating cash flow
75%
Cash reserves
39%
Debt offering
8%
Bank loan
3%
Commercial paper
3%
Other
1%
Primary reasons for making additional contributions
Source of additional contributions to plan
“Other” sources, including in-kind contributions of company stock and real property, continue to be relatively uncommon. However Boeing’s recent announcement of a $3.5 billion company stock contribution in the third quarter of 2017 is certain to trigger additional interest in this strategy.
0%
10%
20%
30%
40%
50%
60%
70%
80%
Reduce PBGC premiums
Reduce reported pension deficit
Avoid benefit restrictions
Accelerate tax deductions
Take advantage of low cost
of debt
Achieve earnings
differential on pension EROA vs. cash return
Other
70%
43%
33%
19%16%
10%6%
10%
20%
30%
40%
50%
60%
70%
80%
Aon 21
U.S. Pension Funding
So far, 2017 has seen a surge in corporate pension contributions with US $12 billion in debt-financed contributions reported through August. Survey respondents tell us that this trend is driven primarily by the desire to reduce PBGC premiums.
The responses above hint at another theme: Contributions are increasingly being financed by debt as sponsors seek to lock in low financing costs. But cash flow and cash reserves are still the dominant financing source:
M E N U

Aon 22
Methodology
The 2017 survey was completed by approximately 100 employers across a variety of plan types, sizes and industries. It was administered in the second quarter of 2017 to gain a better understanding of employer trends related to retirement plan offerings, design, and investments.
Unless otherwise indicated, all figures shared were derived from the results of the 2017 Global Pension Risk Survey.
M E N U


About Aon Aon plc (NYSE: AON) is a leading global professional services firm providing a broad range of risk, retirement and health solutions. Our 50,000 colleagues in 120 countries empower results for clients by using proprietary data and analytics to deliver insights that reduce volatility and improve performance. For further information on our capabilities and to learn how we empower results for clients, please visit http://aon.mediaroom.com.
© Aon plc 2017. All rights reserved.The information contained herein and the statements expressed are of a general nature and are not intended to address the circumstances of any particular individual or entity. Although we endeavor to provide accurate and timely information and use sources we consider reliable, there can be no guarantee that such information is accurate as of the date it is received or that it will continue to be accurate in the future. No one should act on such information without appropriate professional advice after a thorough examination of the particular situation.
DisclaimerInvestment advice and consulting services provided by Aon Hewitt Investment Consulting, Inc. (“AHIC”). The information contained herein is given as of the date hereof and does not purport to give information as of any other date. The delivery at any time shall not, under any circumstances, create any implication that there has been a change in the information set forth herein since the date hereof or any obligation to update or provide amendments hereto.
This document is not intended to provide, and shall not be relied upon for, accounting, legal or tax advice or investment recommendations. Any accounting, legal, or taxation position described in this presentation is a general statement and shall only be used as a guide. It does not constitute accounting, legal, and tax advice and is based on AHIC’s under-standing of current laws and interpretation.
This document is intended for general information purposes only and should not be construed as advice or opinions on any specific facts or circumstances. The content of this document is made available on an “as is” basis, without warranty of any kind. AHIC
disclaims any legal liability to any person or organization for loss or damage caused by or resulting from any reliance placed on that content. AHIC reserves all rights to the content of this document. No part of this document may be reproduced, stored, or transmitted by any means without the express written consent of AHIC.
Aon Hewitt Investment Consulting, Inc. is a federally registered investment advisor with the U.S. Securities and Exchange Commission. AHIC is also registered with the Commodity Futures Trading Commission as a commodity pool operator and a commodity trading advisor, and is a member of the National Futures Association. The AHIC ADV Form Part 2A disclosure statement is available upon written request to:
Aon Hewitt Investment Consulting, Inc.200 E. Randolph StreetSuite 1500Chicago, IL 60601ATTN: AHIC Compliance Officer
© Aon plc 2017. All rights reserved.