2012 · fountainhead property trust | integrated annual report 2012 3 1 june 2007 after the...
TRANSCRIPT

INTE
GRATE
D ANNUAL R
EPO
RT 2
012

IFC Scope
1 Highlights
2 Structure
3 Overview
8 Sustainability
14 Board of Directors and Chief Executive Officer
16 Chairman’s report
18 Corporate governance report
22 Manager’s report
30 Property portfolio overview
39 Property portfolio
42 Salient features
44 Fountainhead Property Trust Financial statements
64 Fountainhead Property Trust Management Limited Financial statements
74 Directors’ report
75 Manager’s responsibility statement and approval of the financial statements
76 Directors’ responsibility statement and approval of the financial statements
77 Report of the Audit and Risk Committee
78 Independent auditor’s report
79 Independent auditor’s report
80 Report of the Trustee
80 Certificate by Company Secretary
80 Unitholders’ diary
81 Definitions and Company details
Contents Scope of the integrated report
The Board has identified our stakeholders
and their particular concerns in a detailed
risk analysis exercise, supplemented
by the Trust’s everyday activities and
experience. To assist in formulating the
best approach, we sought the advice of
specialist professionals who are thoroughly
acquainted with the requirements of King III,
the Global Reporting Initiative (GRI), IFRS
and the Companies Act.
As neither the Trust nor the Manager has any
employees, reporting on certain aspects of
sustainability is necessarily limited.
Utility consumption figures disclosed in
this report include consumption relating to
the Trust’s numerous tenants throughout the
portfolio. While the Trust has undertaken a
number of energy-saving initiatives, the buy-
in of tenants is ultimately required in order to
achieve meaningful savings.
The sustainability report has been published
without independent assurance.
This report, covering the
12 months ended 30 September
2012, is Fountainhead Property
Trust’s second integrated annual
report. We are committed to
continuously improving the scope
of our report.
Tsogo Sun OR Tambo International Airport

Fountainhead Property Trust | Integrated annual report 20121
Highlights
The Trust at a glance
2012 2011
Total distribution (cents) 55.83 55.27
Total return (cents) 195 33
Total annual return (%) 28.7 5.1
Market capitalisation (R billion) 9.4 7.8
Property portfolio value (R billion) 10.8 8.5
Borrowings (R billion) 2.7 1.0
Borrowings as a percentage of the value of properties (%) 24 11
Weighted average cost of borrowings (%) 8.0 9.1
Net asset value (cents) 694 669
Premium to net asset value (%) 16.5 0.1
Listed market price at year-end (cents) 809 670
Completion of Blue Route Mall
Acquisition of the remaining 25% of Centurion Mall for R752 million
Vacancies reduced by 10% to 6.7%
NAV up by 3.7% to 694 cents
Reduction of 10% in operating costs to income ratio to 19.8%
Reduction in average cost of debt from 9.08% to 7.97%
Total annual return up from 5.1% to 28.7%
Blue Route Mall
Centurion Mall
Centurion Mall
Fountainhead Property Trust | Integrated annual report 20122
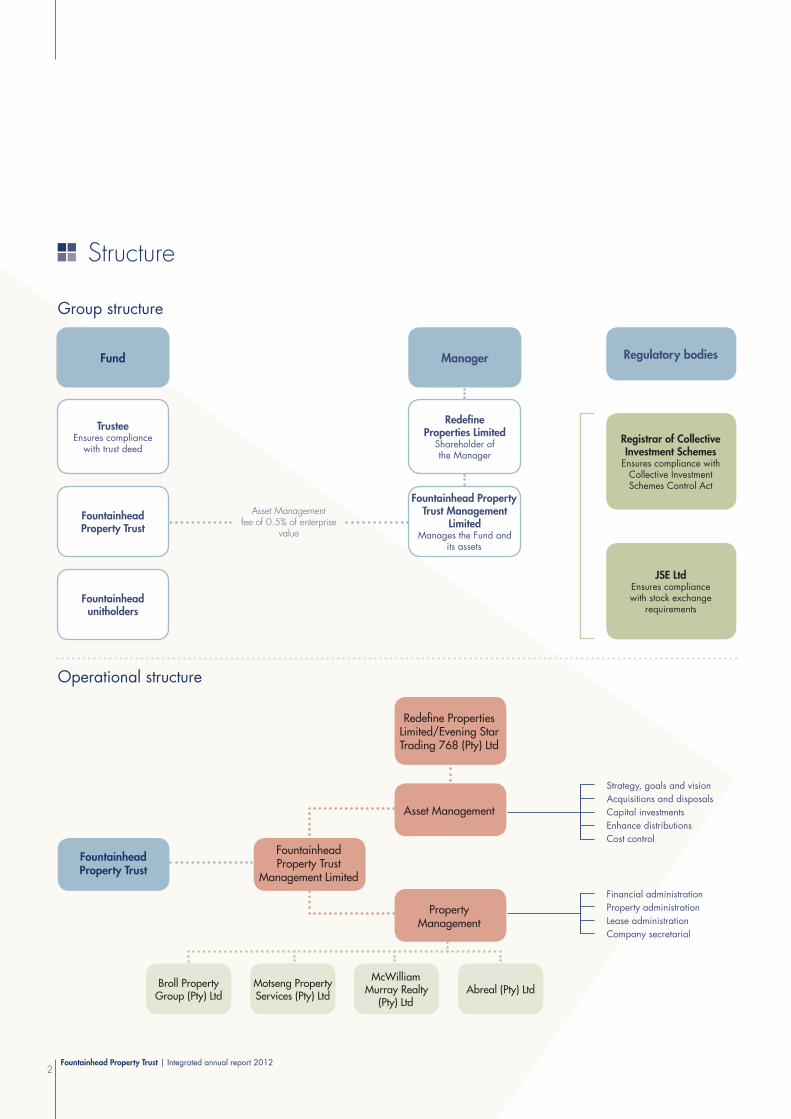
Group structure
Operational structure
Redefi ne Properties Limited/Evening Star Trading 768 (Pty) Ltd
Asset Management
Fountainhead Property Trust
Fountainhead Property Trust
Management Limited
Property Management
Strategy, goals and vision
Acquisitions and disposals
Capital investments
Enhance distributions
Cost control
Financial administration
Property administration
Lease administration
Company secretarial
Broll Property Group (Pty) Ltd
Motseng Property Services (Pty) Ltd
McWilliam Murray Realty
(Pty) LtdAbreal (Pty) Ltd
Structure
Regulatory bodies
Registrar of Collective Investment Schemes
Ensures compliance with Collective Investment Schemes Control Act
JSE LtdEnsures compliance with stock exchange
requirements
Fund
TrusteeEnsures compliance
with trust deed
FountainheadProperty Trust
Fountainheadunitholders
Asset Management fee of 0.5% of enterprise
value
Manager
Redefi neProperties Limited
Shareholder of the Manager
Fountainhead Property Trust Management
LimitedManages the Fund and
its assets

Fountainhead Property Trust | Integrated annual report 20123
1 June 2007 after The Standard Bank of
South Africa Limited purchased the controlling
share in the Manager. The Manager was
later renamed as the Fountainhead Property
Trust Management Limited. On 31 March
2008 Standard Bank sold 50% of its shares
in the Manager to Liberty Group Limited. On
1 August 2012 Redefine Properties Limited
purchased all the shares in the Manager from
Standard Bank and Liberty.
Strategy and valueFountainhead Property Trust aims to grow
and improve its property portfolio in order to
provide sustainable and growing returns for
its unitholders in the long term. This strategy is
implemented by acquiring quality properties
with good growth prospects, while also
disposing of properties with poor growth
prospects. In addition, the refurbishment of
existing assets will be undertaken where
a reasonable return can be generated
for unitholders.
In implementing this strategy, Fountainhead,
as a good corporate citizen, always
seeks to act in the best interests of its
various stakeholders.
Profi leFountainhead Property Trust is a collective
investment scheme in property established in
terms of CISCA.
It is a closed-end fund and distributes to
unitholders all net income earned on its
portfolio of real estate assets.
It is managed by Fountainhead Property Trust
Management Limited (the Manager) whose
investment policy objective is to create wealth
for Fountainhead unitholders by consistently
generating a total rate of return in excess
of inflation. The objective is to optimise
net rental growth and thereby maximising
the appreciation in the value of the underlying
properties in the portfolio.
Formation of FountainheadFountainhead Property Trust is a property
unit trust established in 1983 in terms of the
Unit Trust Control Act, 1981, subsequently, in
March 2003, replaced by CISCA, 2002.
The Trust is a closed-end Fund and is listed
on the Johannesburg Securities Exchange.
Units in the Trust can therefore only be
acquired on the stock exchange and are
not issued by the Manager directly to the
public. Originally known as The Standard
Bank Property Fund and, subsequently,
Allan Gray Property Trust, the Trust was
renamed Fountainhead Property Trust on
Overview
Fountainhead Property Trust aims at
growing and improving its property
portfolio in order to provide
sustainable and growing returns for
its unitholders in the long term.

Overview (continued)
56%
17%
27%
Tenant profi le analysis
Large national tenants, large listed tenants, Government and major franchisees. These include, inter alia, Absa Bank, Edgars Consolidated Stores, FirstRand Bank, Foschini, Pick n Pay Stores, Standard Bank, Telkom, Department of Public Works, Shoprite-Checkers, Massmart, South African Post Offi ce
National tenants, listed tenants, franchisees. These include, inter alia, Cell C, Cape Union Mart, Coricraft, Exclusive Books, Flight Centre, Incredible Connection, Nandos, Nu Metro Cinemas, Pie City Holdings, Ocean Basket, Spec Savers
Other tenants comprise all other tenants that do not fall in the above two categories
A
B
C
Category
Lease expiry profi le by rentable area per sector
Expiry period
Properties by sector by GLA
Retail
Offi ces
Industrial
Specialised
Perc
enta
ge
21%
3%58%
18%
Retail Office Industrial Specialised Total
Number of properties 13 23 26 2 64
Value (R billion) 8.2 1.7 0.5 0.3 10.7
GLA (m2) 471 757 141 702 167 770 26 969 808 198
Occupancy 93.5%* 92.9% 92% 100% 93.3%
0
20
40
60
80
100
Vacant 2013 2014 2015 2016 2017 >2017
8 7 7
17 16
53
14
9
22 22
1411
96
2
8
17
6
22
31
100
Fountainhead Property Trust | Integrated annual report 2012Fountainhead Property Trust | Integrated annual report 20124
*Includes office vacancies at Centurion, Boulders, Benmore and Rosebank Mews.

Fountainhead Property Trust | Integrated annual report 20125
Trust’s performance
Financial summary
(R000) 2012 2011 2010 2009
Net contractual property income 839 783 695 823 653 768 609 482
Interest received 23 750 27 703 25 259 34 658
Interest paid (154 829) (82 098) (98 102) (90 277)
708 704 641 428 580 925 553 863
Trust audit fees, service charges and taxes (59 564) (44 982) (42 265) (35 921)
Income distributions 649 140 596 446 538 660 517 942
Distribution per unit (cents) 55,83 55,27 54,08 52,00
Weighted average number of units in issue during the
period (‘000) 1 162 710 1 075 039 996 043 996 043
Growth in distribution (%) 1% 2,2 4,0 8,1
2011 vs 2012 movement
575 000
595 000
615 000
635 000
655 000
675 000
695 000
715 000
735 000
755 000
19
12 74
41 13
649643
Distributable income 2011
Rights offer prepaid
distribution
Net operating income - Core
Acquisitions Disposals Developments Non-recurring income
Interest paid bond
Interest received
Other Service charge Distributable income 2012
46
25
92 4
Increase on 2011
Decrease on 2011

Overview (continued)
Fountainhead Property Trust | Integrated annual report 2012Fountainhead Property Trust | Integrated annual report 20126
Unit performanceTotal rate of returnThe annual total rates of return for the years ended 30 September are as follows:
2008 2009 2010 2011 2012
5-year average
2008 – 2012
Fountainhead (10.6) 21.3 20.5 5.1 28.7 22.3
PUT sector (15.8) 21.5 29.6 8.5 27.5 20.9
Out/(under) performance 5.2 (0.2) (9.1) (3.4) 1.3 1.4
PLS sector (11.8) 17.2 30.7 78.2 39.8 29.5
Fountainhead closing yield 8.1 8.1 7.7 8.1 7.0 n/a
PUT sector closing yield 9.4 9.1 7.9 8.1 7.1 n/a
FTSE/JSE Africa listed (13.1) 18.3 30.5 8.3 36.5 26.8
(Under)/out performance 2.5 3.0 (10.0) (3.2) (7.8) (4.5)
All share index (18.3) 9.0 20.9 3.2 23.6 20.2
Financial and industrial index (13.5) 13.1 26.5 4.4 35.8 22.4
All bond index 6.0 9.1 15.3 5.9 17.5 9.5
Cash STFIND 11.2 10.3 7.2 5.9 5.6 8.4
Trust’s performance (continued)
(R000) Total
Percentage change
2011Distribution
per unit
Core portfolio 508 371 5.2 43.72
Gross rental 633 964 5.1 54.52
Operating costs (110 540) 3.2 (9.51)
Net utility expense (15 053) 16.7 (1.29)
Acquisitions 250 385 57.6 21.53
Disposals 1 310 (73.8) 0.11
Developments 69 268 37.8 5.96
Non-recurring income 11 687 0.0 1.01
Trust expenses (191 881) 90.4 (16.50)
Interest paid bond (129 638) 57.9 (11.15)
Interest paid – Blue Route (25 192) 0.0 (2.17)
Interest received 22 188 (15.2) 1.91
Other (5 726) 29.8 (0.49)
Service charge (53 513) 32.3 (4.60)
Distributable income 2012 649 140 – 55.83
Growth 1.0% – 1.0%
Fountainhead Property Trust | Integrated annual report 20127
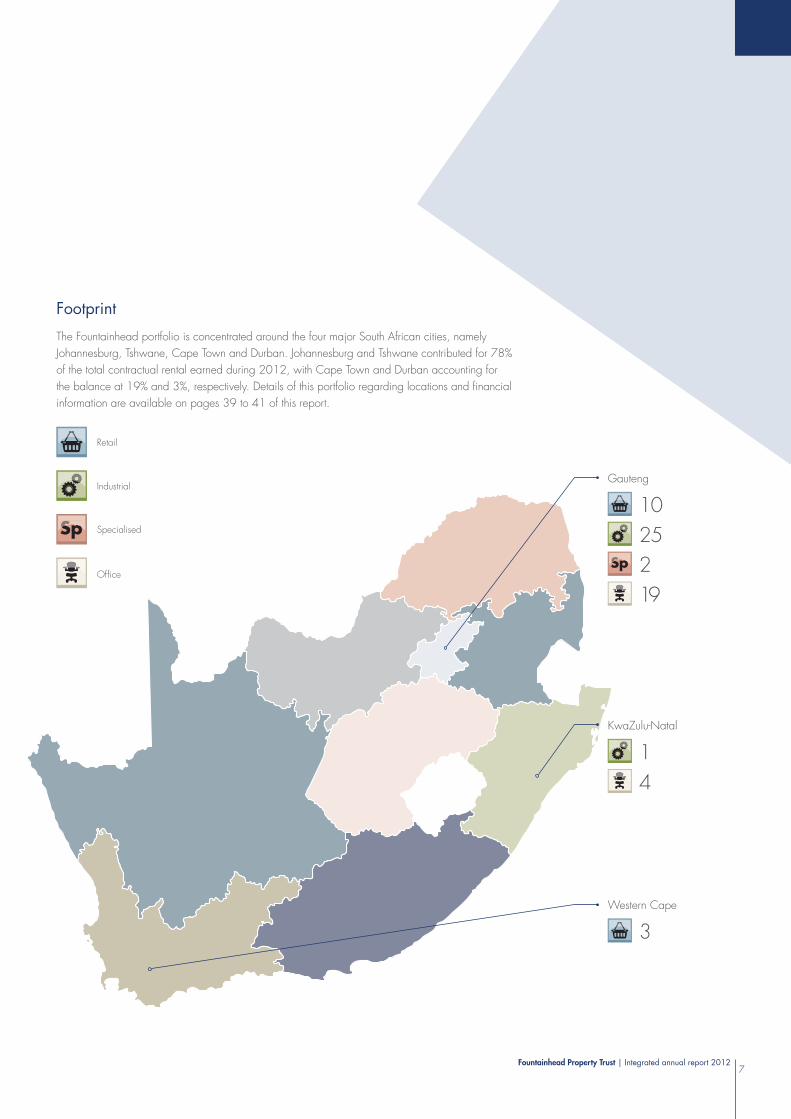
SpSp
10
2
25
19
Gauteng
SpSp
Retail
Specialised
Industrial
Office
1
4
KwaZulu-Natal
3
Western Cape
Footprint
The Fountainhead portfolio is concentrated around the four major South African cities, namely
Johannesburg, Tshwane, Cape Town and Durban. Johannesburg and Tshwane contributed for 78%
of the total contractual rental earned during 2012, with Cape Town and Durban accounting for
the balance at 19% and 3%, respectively. Details of this portfolio regarding locations and financial
information are available on pages 39 to 41 of this report.

Sustainability
Sustainability Key Performance Indicators 2012 2011
Unitholder returns
Distribution growth 1.00% 2.20%
Total return 28.70% 5.10%
Consumer price index 5.76% 5.03%
Property
Vacancies 6.70% 7.40%
Tenant retention ratio 80.00% 58.00%
Comprehensive insurance Yes Yes
OHS Act non-compliance incidents 0 0
Corporate and financial
Board evaluation Yes No
Corporate governance compliance Yes Yes
Fixed interest rate debt 40.00% 76.00%
Environment
Electricity usage (KWh per m2) 270 259
Water usage (Kl per m2) 1.20 1.17
Reported regulatory non-compliance 0 0
Fountainhead Property Trust | Integrated annual report 20128
The Trust evaluates its operation holistically; paying attention to the
communities in which it operates, the environment, other businesses in
its value chain, and tenants and suppliers. With the extensive overview
that this achieves, the Trust is able to ensure a balance between
environmental, social and economic factors and is thus better placed
to create a sustainable business.
Blue Route Mall
Fountainhead Property Trust | Integrated annual report 20129
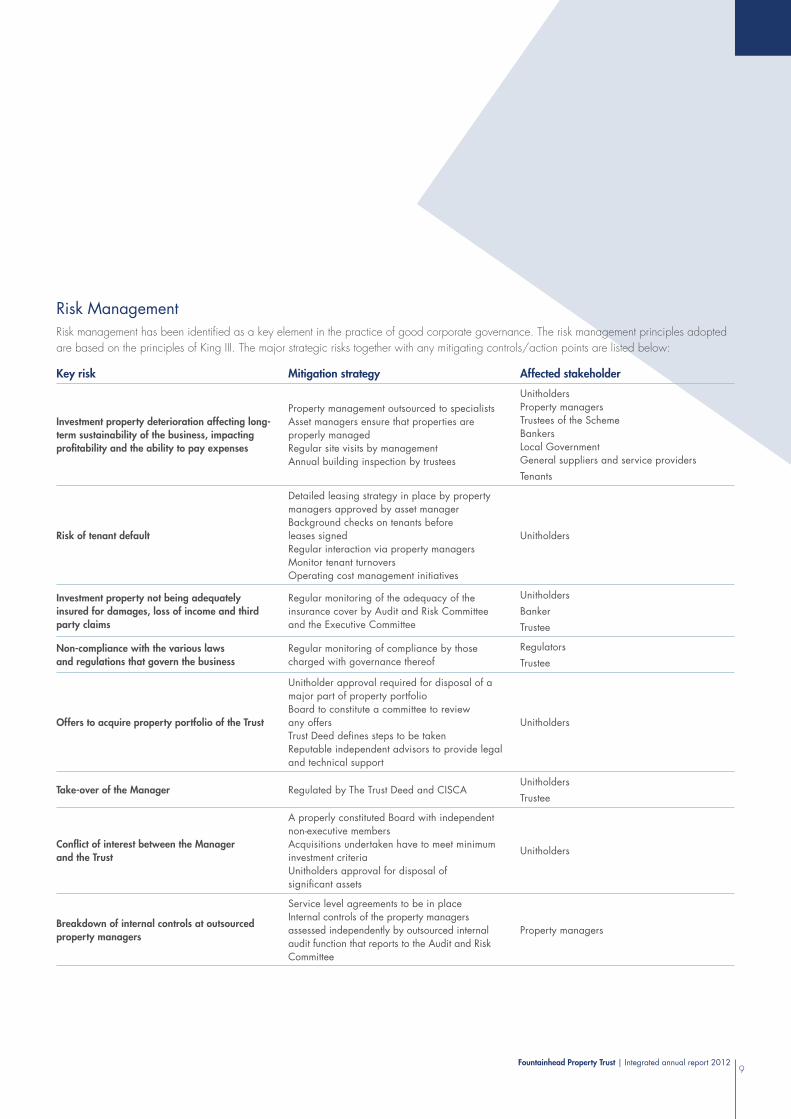
Risk Management
Risk management has been identifi ed as a key element in the practice of good corporate governance. The risk management principles adopted
are based on the principles of King III. The major strategic risks together with any mitigating controls/action points are listed below:
Key risk Mitigation strategy Affected stakeholder
Investment property deterioration affecting long-term sustainability of the business, impacting profi tability and the ability to pay expenses
Property management outsourced to specialistsAsset managers ensure that properties are properly managedRegular site visits by managementAnnual building inspection by trustees
UnitholdersProperty managersTrustees of the SchemeBankersLocal GovernmentGeneral suppliers and service providers
Tenants
Risk of tenant default
Detailed leasing strategy in place by property managers approved by asset managerBackground checks on tenants before leases signedRegular interaction via property managersMonitor tenant turnoversOperating cost management initiatives
Unitholders
Investment property not being adequately insured for damages, loss of income and third party claims
Regular monitoring of the adequacy of the insurance cover by Audit and Risk Committee and the Executive Committee
Unitholders
Banker
Trustee
Non-compliance with the various laws and regulations that govern the business
Regular monitoring of compliance by those charged with governance thereof
Regulators
Trustee
Offers to acquire property portfolio of the Trust
Unitholder approval required for disposal of a major part of property portfolioBoard to constitute a committee to review any offersTrust Deed defi nes steps to be takenReputable independent advisors to provide legal and technical support
Unitholders
Take-over of the Manager Regulated by The Trust Deed and CISCAUnitholders
Trustee
Confl ict of interest between the Manager and the Trust
A properly constituted Board with independent non-executive membersAcquisitions undertaken have to meet minimum investment criteriaUnitholders approval for disposal of signifi cant assets
Unitholders
Breakdown of internal controls at outsourced property managers
Service level agreements to be in placeInternal controls of the property managers assessed independently by outsourced internal audit function that reports to the Audit and Risk Committee
Property managers
Fountainhead Property Trust | Integrated annual report 201210
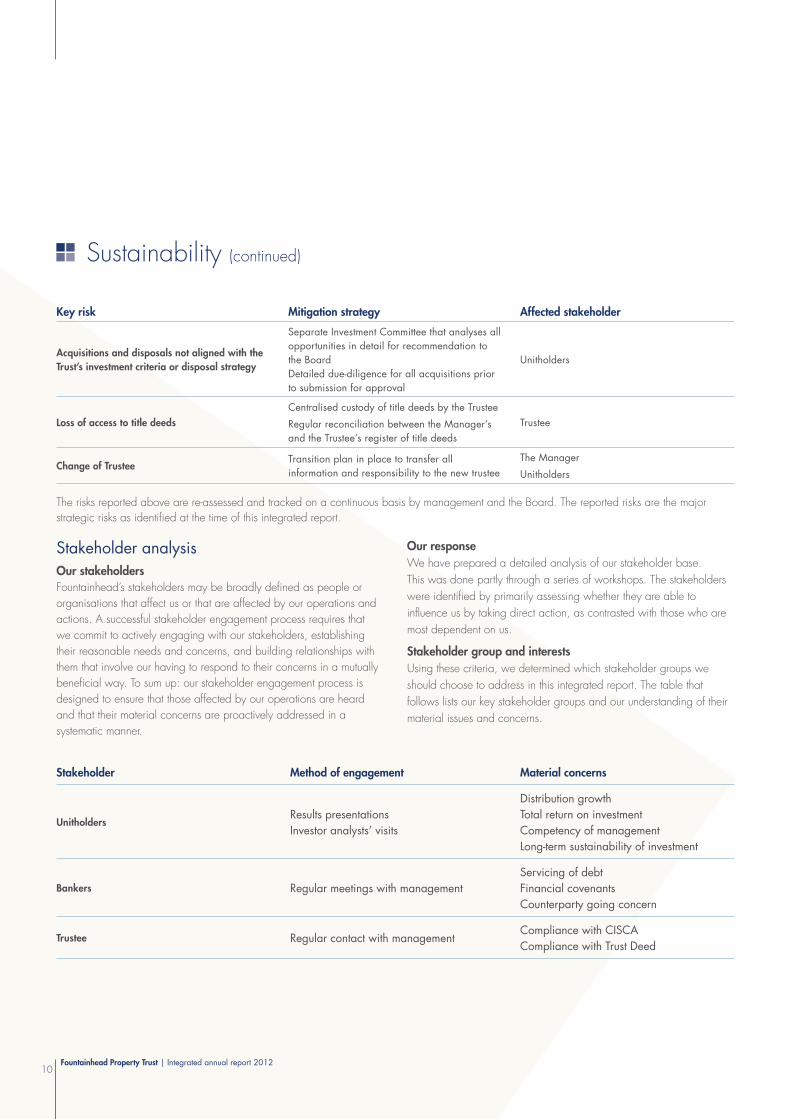
Sustainability (continued)
Key risk Mitigation strategy Affected stakeholder
Acquisitions and disposals not aligned with the Trust’s investment criteria or disposal strategy
Separate Investment Committee that analyses all
opportunities in detail for recommendation to
the Board
Detailed due-diligence for all acquisitions prior
to submission for approval
Unitholders
Loss of access to title deedsCentralised custody of title deeds by the Trustee
Regular reconciliation between the Manager’s
and the Trustee’s register of title deeds
Trustee
Change of TrusteeTransition plan in place to transfer all
information and responsibility to the new trustee
The Manager
Unitholders
The risks reported above are re-assessed and tracked on a continuous basis by management and the Board. The reported risks are the major
strategic risks as identified at the time of this integrated report.
Stakeholder analysis
Our stakeholdersFountainhead’s stakeholders may be broadly defined as people or
organisations that affect us or that are affected by our operations and
actions. A successful stakeholder engagement process requires that
we commit to actively engaging with our stakeholders, establishing
their reasonable needs and concerns, and building relationships with
them that involve our having to respond to their concerns in a mutually
beneficial way. To sum up: our stakeholder engagement process is
designed to ensure that those affected by our operations are heard
and that their material concerns are proactively addressed in a
systematic manner.
Our responseWe have prepared a detailed analysis of our stakeholder base.
This was done partly through a series of workshops. The stakeholders
were identified by primarily assessing whether they are able to
influence us by taking direct action, as contrasted with those who are
most dependent on us.
Stakeholder group and interestsUsing these criteria, we determined which stakeholder groups we
should choose to address in this integrated report. The table that
follows lists our key stakeholder groups and our understanding of their
material issues and concerns.
Stakeholder Method of engagement Material concerns
UnitholdersResults presentations
Investor analysts’ visits
Distribution growth
Total return on investment
Competency of management
Long-term sustainability of investment
Bankers Regular meetings with management
Servicing of debt
Financial covenants
Counterparty going concern
Trustee Regular contact with managementCompliance with CISCA
Compliance with Trust Deed

Fountainhead Property Trust | Integrated annual report 201211
Stakeholder Method of engagement Material concerns
TenantsRegular interaction mainly via outsourced property
managers
Performance in terms of lease agreement
Proper Management and Regulatory compliance
Operating cost management
Safe and Secure Shopping Experience
for customers
Property ManagersMonthly executive meetings
Daily interaction via asset managers
Compliance with management agreements
Key Performance Indicator assessments
Reliance on income from client
Local GovernmentRegular interaction mainly via outsourced property
managers
Timely payment of utility and rates charges
Infrastructure impact of properties
Energy-saving initiatives
General suppliers and service providersRegular interaction mainly via outsourced property
managers
Timely payment of goods and services
Fair tender processes and procurement criteria
Tenant customer and surrounding communitiesRegular interaction mainly via outsourced property
managers
Safe and secure shopping environment
Corporate social investment
Communication with surrounding community
RegulatorsSubmission of periodic returns
Periodic meetings and annual auditsCompliance with laws and regulations
Environmental responsibility
The Trust acknowledges environmental responsibility as an important
principle which affects its future success. The Trust has therefore
undertaken an initiative to further understand the impact of its
properties on the environment in order to monitor and take control of
its environmental impact. The Trust and managers have undertaken
to educate and involve their staff, shareholders, tenants, stakeholders
and suppliers in an effort to create awareness and instigate change at
all levels of its operation.
The Trust strives to employ techniques and technologies to reduce
consumption, ensuring that utilities are kept down, thereby benefitting
not only its tenants but also the environment. Henceforth the Trust
intends to increase the level of environmentally friendly technology in
its commitment to develop and manage properties that are efficient
in minimising negative impacts on the environment.
Not only does the Trust endeavour to mitigate its negative effect on the
environment, but it endeavours to contribute positively by improving the
surroundings of its properties, contributing to community needs
and initiatives, and monitoring security and crime levels in the
communities in which it has a presence. It is also currently in
negotiations with the local authority to assist in the restoration of
the Centurion Lake adjacent to Centurion Mall.
The Trust’s initiatives have already achieved much success and
its properties have been recognised as raising the bar in energy-
efficiency for shopping centres in South Africa.
Recently, in the National Energy Barometer Survey, which is
conducted by Energy Cybernetics, the N1 City Shopping
Centre was awarded first place in energy efficiency. The centre’s
management team took the decision to enter the building into the
survey in order to establish how the building benchmarked within
its relevant retail sector.
In an effort to increase the building’s energy efficiency, the
management team overhauled its lighting, load-shifting, and air-
conditioning by replacing old corroded pipes, installing new chillers
and repainting the building’s entire roof with an energy-saving coating
designed to reflect more light.

Fountainhead Property Trust | Integrated annual report 201212
Sustainability (continued)
The management team also ensured that all operation managers
and employees were informed of the energy-saving initiatives and
are actively involved in implementing them in the Mall’s day-to-day
operations. The team identified this policy of involvement as the
key to its success in reducing utility costs which, in turn, decreased
expenditure and improved the Trust’s bottom-line figures.
The runner-up in the shopping centre category of the Survey was
Centurion Mall, another of the Trust’s properties.
Prior to its participation in the Survey the management team of
Centurion Mall undertook a green initiative which included the
installation of timers in various areas to manage the hours that the lights
operate, the installation of power-correction units and the replacement
of the majority of lights with energy-saving lights. The geysers in all the
bathrooms were also switched off.
This national recognition is a positive indication that the Trust’s
properties and management teams are aware of the need to address
energy efficiency and are engaged in implementing systems to
improve the energy output of its centres.
Electricity and water consumptionThe table below shows the average annual electricity and water consumption by sector for the 12 months ended 30 September 2012:
Reportable area (m2)
Electricity consumptionKWh per m2
Water consumption Kl per m2
Sector 2012 2011 2012 2011 2012 2011
Retail 407 291 394 611 327 325 1.25 1.34
Office 31 713 46 027 113 139 1.06 0.80
Industrial 90 462 113 569 65 77 0.99 0.71
529 466 554 207 270 259 1.20 1.17
Electricity and water consumption are monitored on a continuous
basis. Management has appointed Utility Administration Service CC
(UAS) to administer the utility function. UAS has assisted in identifying
inefficiencies and advising on energy-saving initiatives that we have
undertaken or planned, including:
Fitting energy-efficient light-bulbs.
Upgrading air-conditioners to be more energy efficient at
N1 City Mall, for example, where a total of R5.8 million
(Fountainhead Share) was spent on an air-conditioner chiller
upgrade and, at Westgate Mall, where a similar project is
underway, costing R10.5 million (Fountainhead Share).
At Brightwater Commons Mall, a water reticulation and water
storage system has been installed to collect water and rain water
run-off to irrigate the surrounding gardens.
Social and economic responsibility
The Trust considers the safety and security of shoppers and tenants
a priority. As a matter of strict policy, therefore, all security service
providers and individual security personnel must be registered and
accredited by the Private Security Regulatory Authority (PSIRA).
Security personnel must also be trained in first-aid and undergo regular
emergency evacuation drills.
To ensure that properties are safe for use, each building is assessed
for compliance with Occupational Health and Safety Act (OHS)
regulations by an outsourced service provider, which will continue to
assess them from time to time. In addition, property managers regularly
perform compliance checks as part of their routine responsibilities.
The Trust, through its various shopping centres, has always played
an active role in corporate social responsibility initiatives. These
initiatives include providing complementary promotional court space
to charitable organisations, arranging fund-raising events and
making donations.
During the 2012 financial year, the Trust was instrumental in raising
over R1.5 million through such initiatives.
Specific activities during the year included:
A charity day at N1 City Mall where money was raised for
Robertson House in Milnerton – a home for the physically disabled.
The Mall also hosted a CANSA Shavathon and an Adopt a
Charity Week-end where tenants of the Mall were encouraged to

Fountainhead Property Trust | Integrated annual report 201213
adopt a charity for the day. Those tenants that adopted a charity
were given a free table in the centre and a percentage of the
sales that resulted from the table were donated to the tenant’s
chosen charities.
The Boulders participated in the 67 Minutes for Madiba initiative
by collecting food and toiletry parcels for a welfare organisation in
President Park and revamping the kitchen of the Miriam Makeba
Children’s Home. They also sponsored a full soccer kit for a
community school’s soccer team.
Centurion Mall’s very successful corporate responsibility initiatives,
which included a festive season gift wrapping station, a CANSA
Shavathon, a road race and a spin-a-thon, raised the significant
sum of R0.6 million.
Blue Route Mall made generous donations to the Zwaanswyk
Academy and to Butterfly Way Educare as well as hosting
an exhibition.
Kenilworth Centre raised money for the CANSA Shavathon and
Stop Hunger Now. They also hosted a charity awareness day,
arranged a visit to Erica’s Old Age Home and hosted a party for
an orphanage.
Benmore Shopping Centre donated promotional court space
to CANSA Shavathon, Hospice, Reach for a Dream, the South
African Blood Bank, and book sales in aid of St Johns Church,
United Sisterhood, Jewish Woman’s Benevolent Society and
Our Parents Home.
During the 2012 financial year no fines or penalties have been
incurred for the contravention of any laws and regulations applicable
to the business.
2 Pybus Street, Sandton
Boulders

Fountainhead Property Trust | Integrated annual report 201214
Board of Directors and Chief Executive Officer
David Savage (48)
Independent Non-executive Director
Appointed: 2 August 2011
Nationality: South African
Qualifi cation: BSc (Building) and MSc (Building Project Management)
Experience: Managing Director of Abland since 1998
Current directorships: Abland Proprietary Limited and related subsidiaries; The Pivotal Fund Limited
Haroon Laher (49)
Independent Non-executive Director
Appointed: 4 December 2008
Nationality: South African
Qualifi cation: B Proc, LLB
Experience: Director at Bowman Gilfi llan Inc. practising in the areas of commercial and banking litigation, insolvency and liquidation, BEE mergers and acquisitions, and tax
Current directorships: Bowman Gilfi llan Inc.
Michael Kirchmann (75)
Chairman and Independent
Non-executive Director
Appointed: 1 June 1988
Nationality: South African
Qualifi cation: RQS.M.A.Q.S
Experience: Managing Director of Northprop Proprietary Limited. Involved in the property sector since 1960
Current directorships: Northprop Proprietary Limited; African Realty Proprietary Limited; Hydenorth Proprietary Limited; Craig Park West Proprietary Limited; Linkway Proprietary Limited; Dainfern Shopping Centre Proprietary Limited; Alexandra Village Proprietary Limited; Tucana Property Holdings Proprietary Limited; Zamia Property Holdings Proprietary Limited; Craig Park Four Proprietary Limited
Victor Christian (71)
Chairman of Audit and Risk
Committee and Independent
Non-executive Director
Appointed: 19 July 2006
Nationality: South African
Qualifi cation: CA (SA)
Experience: Former partner at Ernst & Young and Non-executive Director of other companies
Current directorships: Allan Gray Employee Holdings Proprietary Limited; Allan Gray Life Limited; Allan Gray Unit Trust Management Limited; Phetogo Investments Proprietary Limited; Withmore Investments Proprietary Limited; Garden Cities Association Not For Gain

Fountainhead Property Trust | Integrated annual report 201215
Alex Phakathi (46)
Chief Executive Offi cer
Appointed: 7 September 2012
Nationality: South African
Qualifi cation: MCom (Wits)
Experience: Prior to being appointed, Alex was on the executive committee of Redefi ne Properties Limited responsible for acquisitions and disposals. Former Managing Director at Pareto Limited. Over 15 years of commercial property experience
Current directorships: Benguni Investments Proprietary Limited, Gwalagwala Investments Proprietary Limited and South African Council of Shopping Centres
Bernard Nackan (68)
Non-executive Director
Appointed: 20 September 2012
Nationality: South African
Qualifi cation: BA Econ Sep (Stanford)
Experience: Former fi nancial editor of the Rand Daily Mail and Executive Director of Sage Group
Current directorships: Redefi ne Properties Limited, Redefi ne International Limited and Rezco Asset Management
Andrew Konig (45)
Non-executive Director
Appointed: 20 September 2012
Nationality: South African
Qualifi cation: CA (SA)
Experience: Financial Director of Redefi ne Properties Limited. Over 19 years of commercial and fi nancial experience
Current directorships: Redefi ne Properties Limited, Alternate Director for Redefi ne International PLC
John Rainier (56)
Independent Non-executive Director
Appointed: 30 June 1997
Nationality: South African
Qualifi cation: BCom, LLB
Experience: Former Managing Director of Fountainhead Property Trust. Involved in property management since 1980
Current directorships: None

Fountainhead Property Trust | Integrated annual report 201216
It is a great pleasure for me, as Chairman
of Fountainhead Property Trust Management
Limited, to review the general state of
Fountainhead Property Trust for the financial
year ended 30 September 2012.
Whilst the global economic data has
continued to disappoint, the South African
social-economic environment has also been
challenging. GDP growth expectations for
2012 have been lowered from a previous
3.4% to 2.5%. Both consumer and producer
confidence levels are trending down, and
unemployment remains intractable. Two of
the major rating agencies downgraded the
sovereign debt of South Africa (Moody’s
Investor Services and Standard & Poor’s).
The listed property sector performed
well, helping to push the sector’s market
capitalisation to new levels. Once again, for
the 12 months ended 30 September 2012,
the sector produced the highest total return
of 37.71%, followed by equities (24.43%),
bonds (16.99%) and cash (5.61%). Analysts,
however, caution that it would be unrealistic
to expect a repeat of last year’s total return.
There continues to be downward pressure
on office rentals and rising operating
expenses across all sectors. These factors are
expected to have a negative impact on the
performance of the property sector in the short
to medium term.
The Fountainhead portfolio showed resilience
over this financial year. The weighting of
the portfolio in favour of retail has been a
distinct benefit in the performance of the
We are proud to present
Fountainhead’s second Integrated
Annual Report. Fountainhead’s aim
is to improve engagement with its
various stakeholders, ensuring that
their main concerns and interests
are adequately addressed.
Chairman’s report
Trust. Our well-located regional shopping
centres have demonstrated their defensive
attributes by maintaining low vacancies and
positive rental growth. The two key projects,
the acquisition of the remaining 25% of
Centurion and redevelopment of Blue Route
Mall, were successfully completed during
the financial year. Retailers and shoppers
responded positively to both investments.
The refurbishment and upgrade of Bryanston
Shopping Centre is progressing well.
We are pleased to report that, despite the
challenges mentioned above, Fountainhead
met its distribution forecasts for 2012, and
achieved a total annual return of 28.7%.
Operating costs were contained at 19.8%
of revenue and average cost of borrowings
reduced from 9.08% to 7.97%. Also, market
capitalisation grew by 20% to R9.4 billion.
On 1 August, Redefine Properties Limited
acquired the entire shareholding in
Fountainhead Property Trust Management
Limited (The Manager). As a result of this
acquisition, Redefine seconded asset managers
to manage the Fountainhead property portfolio,
and Alex Phakathi was appointed the Chief
Executive Officer. In September and October,
Redefine Properties Limited and Growthpoint
Limited, respectively, submitted indicative offers
to acquire the property assets of Fountainhead.
The Board of directors has appointed an
independent committee to deal with these
unsolicited offers.
Consequent to the change in shareholding
in the Manager, the following changes to
WM Kirchmann – Chairman

Fountainhead Property Trust | Integrated annual report 2012
the Board of directors occurred: Messrs Shaw-Taylor, Ogbu and
Reubenheimer resigned from the Board and Messrs Nackan and
Konig were appointed. We would like to thank the retired directors
for their contribution to the success of Fountainhead over the years.
We look forward to benefiting from the contribution of Messrs Konig,
Nackan and Phakathi.
In concluding my remarks on this unexpected new phase in
Fountainhead’s life, I wish to stress that we on the Fountainhead Board
and in the management team have endeavoured to be absolutely
scrupulous in advising unitholders about every development to enable
them to make fully informed decisions.
Finally I wish to thank my colleagues on the Board of Fountainhead
Property Trust Management Limited for their wise counsels and clear
strategy in driving the Trust’s performance, the excellence of which
has been signally recognised by our peers in the market place. Their
experience and expertise in the property sector will ensure optimum
performance by the Trust in the future, however discouraging the
macro-economy may be.
WM Kirchmann
Chairman
Blue Route Mall
Blue Route Mall
17Fountainhead Property Trust | Integrated annual report 2012

Fountainhead Property Trust | Integrated annual report 201218
King III Chapter Principle not fully applied
Board and directors The Board currently does not appoint the Chief Executive Officer. This is done by the
shareholders of the Manager. Each Board member assesses the performance of the
Chief Executive Officer annually.
No separate Nomination Committee is in place. All appointments are agreed by the Board and
the shareholder of the Manager.
No Remuneration Committee is in place as the Trust and the Manager do not have any
employees. The remuneration of each individual director is reflected in the table on page 20.
Director fees are approved by the Shareholder of the Manager.
Audit and Risk Committee The Audit and Risk Committee recommends the appointment of the external auditor and overseeing
the external audit process. Auditors are not approved by the Shareholder as no AGM is held but
reviewed and recommended by Audit and Risk Committee to the Board as required by CISCA.
Integrated reporting and disclosure The sustainability reporting and disclosure has not been independently assessed. It is envisaged
that this will be done in the future as this process matures.
Corporate governance report
The Board of Fountainhead Property
Trust Management Limited is committed
to complying with the principles of good
corporate governance as outlined in the King
Code on Corporate Governance (King III).
The board acknowledges that maintaining
good corporate governance is a continuous
process that must be consistently applied.
Having implemented various practices and
procedures recommended by King III, the
Board is satisfied that Fountainhead complies
with the requirements of King III, except in the
specific instances outlined below.
After comparing current practices with those
recommended by King III, key areas of
improvement have been identified and goals
set to achieve the desired compliance.
9. Integrated Reporting and disclosure
7. Internal Audit
8. Governing stakeholder relationships
Current State Desired State
1. Ethical leadership and corporate citizenship
2. Board and Directors
4. The governance of risk
5. The governance of Information Technology
6. Compliance with laws, codes, rules and standards
3. Audit and Risk Committee

Fountainhead Property Trust | Integrated annual report 201219
with Mr Raubenheimer stepping down as Managing and Financial
Director. Messers Konig and Nackan are directors of the Shareholder
of the Manager and are therefore not considered independent. Messrs
Laher, Savage, Christian and Rainer are classified as independent non-
executive directors.
Responsibilities:The Board meets regularly and retains full and effective control
of the Trust. The Board monitors the activities and performance of
management and is responsible for the following:
The Trust’s overall strategy
The Acquisitions and Disposal policy
Approving and monitoring the annual budget
Approving development projects
Communicating with unitholders openly and timeously throughout
the year
Significant matters relating to finance
Corporate governance
Directors are encouraged to take independent advice, at the
cost of the Manager, for the proper execution of their duties and
responsibilities. The Board has unrestricted access to the external
auditors, professional advisors, the services of the Company
Secretary, the executives and the staff of the property and asset
managers at any given time.
Board of directors:
In terms of CISCA, the Registrar of Collective Investments Schemes
strictly controls the shareholding of the Manager. The change
in shareholding of the Manager to Redefine Properties Limited,
previously Standard Bank Properties Proprietary Limited and Liberty
Group Limited, has resulted in the change in the composition of the
Board. Three directors resigned during the period and Redefine
appointed two directors to the Board of the Manager. Each director
has one vote.
The Board comprises seven non-executive directors. Five of these
directors are considered independent. The independence of directors
is assessed in accordance with King III, the JSE Listings Requirements,
and the determination of Fit and Proper assessments as required by
the Registrar. There exists a balance of power and authority at Board
level such that no one individual director has undue powers of
decision-making.
The roles of Chairman and CEO are separated. Mr Kirchmann, an
independent non-executive director, is the Chairman of the Board. The
Board has examined Mr Kirchmann’s independent status in light of his
length of service (director since 1988). The board is of the opinion
that Mr Kirchmann still acts in an independent manner in fulfilling his
duties as a Board Member. Mr Alex Phakathi was appointed CEO
The attendance at Board and Audit and Risk Committee meetings held during the year was as follows:
Director BoardAudit and Risk
CommitteeMeetingsattended
Meetings eligible
Percentageattendance
Non-executive
WM Kirchmann (Chairman) 6 – 6 7 86
VC Christian 6 5 11 12 91
HY Laher 7 5 12 12 100
DS Ogbu (resigned 24 August 2012) 4 – 4 6 67
S Shaw Taylor (resigned 24 August 2012) 5 – 5 6 83
DS Savage 7 – 7 7 100
JD Rainier 6 5 11 12 91
AJ Konig (appointed 20 September 2012) – – – – –
B Nackan (appointed 20 September 2012) – – – – –
Executive
AE Raubeheimer (resigned 30 September 2012) 7 7 7 100
Overall attendance 48 15
Maximum attendance 54 15
Percentage attendance 89 100
Fountainhead Property Trust | Integrated annual report 201220
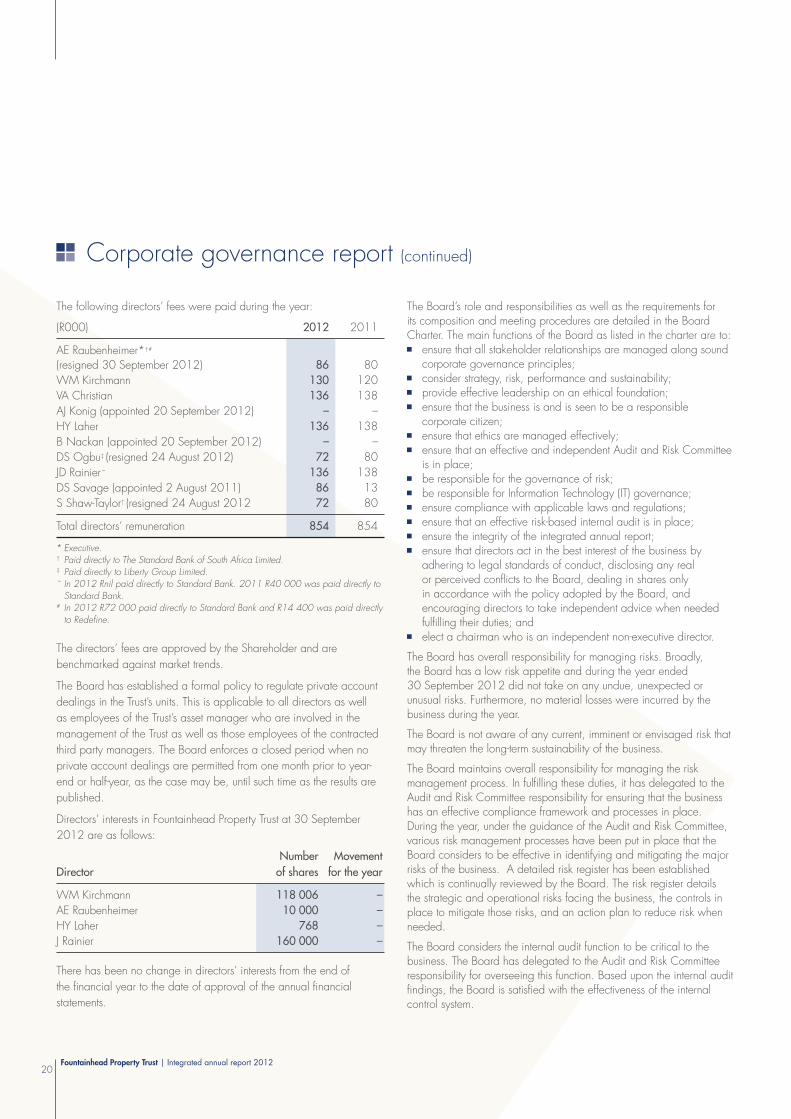
The Board’s role and responsibilities as well as the requirements for its composition and meeting procedures are detailed in the Board Charter. The main functions of the Board as listed in the charter are to: ensure that all stakeholder relationships are managed along sound
corporate governance principles; consider strategy, risk, performance and sustainability; provide effective leadership on an ethical foundation; ensure that the business is and is seen to be a responsible
corporate citizen; ensure that ethics are managed effectively; ensure that an effective and independent Audit and Risk Committee
is in place; be responsible for the governance of risk; be responsible for Information Technology (IT) governance; ensure compliance with applicable laws and regulations; ensure that an effective risk-based internal audit is in place; ensure the integrity of the integrated annual report; ensure that directors act in the best interest of the business by
adhering to legal standards of conduct, disclosing any real or perceived conflicts to the Board, dealing in shares only in accordance with the policy adopted by the Board, and encouraging directors to take independent advice when needed fulfilling their duties; and
elect a chairman who is an independent non-executive director.
The Board has overall responsibility for managing risks. Broadly, the Board has a low risk appetite and during the year ended 30 September 2012 did not take on any undue, unexpected or unusual risks. Furthermore, no material losses were incurred by the business during the year.
The Board is not aware of any current, imminent or envisaged risk that may threaten the long-term sustainability of the business.
The Board maintains overall responsibility for managing the risk management process. In fulfilling these duties, it has delegated to the Audit and Risk Committee responsibility for ensuring that the business has an effective compliance framework and processes in place. During the year, under the guidance of the Audit and Risk Committee, various risk management processes have been put in place that the Board considers to be effective in identifying and mitigating the major risks of the business. A detailed risk register has been established which is continually reviewed by the Board. The risk register details the strategic and operational risks facing the business, the controls in place to mitigate those risks, and an action plan to reduce risk when needed.
The Board considers the internal audit function to be critical to the business. The Board has delegated to the Audit and Risk Committee responsibility for overseeing this function. Based upon the internal audit findings, the Board is satisfied with the effectiveness of the internal control system.
The following directors’ fees were paid during the year:
(R000) 2012 2011
AE Raubenheimer*†#
(resigned 30 September 2012) 86 80
WM Kirchmann 130 120
VA Christian 136 138
AJ Konig (appointed 20 September 2012) – –
HY Laher 136 138
B Nackan (appointed 20 September 2012) – –
DS Ogbu‡ (resigned 24 August 2012) 72 80
JD Rainier˜ 136 138
DS Savage (appointed 2 August 2011) 86 13
S Shaw-Taylor† (resigned 24 August 2012 72 80
Total directors’ remuneration 854 854
* Executive.† Paid directly to The Standard Bank of South Africa Limited.‡ Paid directly to Liberty Group Limited.˜ In 2012 Rnil paid directly to Standard Bank. 2011 R40 000 was paid directly to
Standard Bank.# In 2012 R72 000 paid directly to Standard Bank and R14 400 was paid directly
to Redefine.
The directors’ fees are approved by the Shareholder and are
benchmarked against market trends.
The Board has established a formal policy to regulate private account
dealings in the Trust’s units. This is applicable to all directors as well
as employees of the Trust’s asset manager who are involved in the
management of the Trust as well as those employees of the contracted
third party managers. The Board enforces a closed period when no
private account dealings are permitted from one month prior to year-
end or half-year, as the case may be, until such time as the results are
published.
Directors’ interests in Fountainhead Property Trust at 30 September
2012 are as follows:
Director
Number
of shares
Movement
for the year
WM Kirchmann 118 006 –
AE Raubenheimer 10 000 –
HY Laher 768 –
J Rainier 160 000 –
There has been no change in directors’ interests from the end of
the financial year to the date of approval of the annual financial
statements.
Corporate governance report (continued)

Fountainhead Property Trust | Integrated annual report 201221
The committee has adopted formal terms of reference which have been approved by the Board. The committee has fulfilled its responsibilities for the year in compliance with its terms of reference. The main responsibilities of the committee as listed in the terms of reference are to: oversee the integrated reporting process; ensure that the combined assurance model is applied to provide a
co-ordinated approach to all assurance activities; review the expertise, resources and experience of the Trust’s
finance function; oversee the internal audit function; oversee the risk management process; and recommend the appointment of the external auditor and oversee
the external audit process.
The internal audit function has been outsourced to BDO Risk Advisory Services Proprietary Limited (BDO). BDO has a direct reporting line to the committee, and works closely with management in order to help fulfil their duties.
The committee reviewed and approved the internal audit plan for 2012 and is satisfied that the plan was executed accordingly. The committee has also reviewed the internal audit findings from BDO for the 2012 financial year. Based on the internal audit report, the committee is satisfied that adequate controls exist and that they operate effectively within the internal control environment. In conjunction with BDO, the committee formulated an internal audit charter which has been approved by the Board.
The committee has complied with all applicable legal and regulatory responsibilities.
Based on the committee’s aggregated experience and assurances received, nothing has come to the attention of the committee that could possibly impair the independence of the external auditor. The committee has recommended the re-appointment of KPMG Inc. as external auditors for 2013. The committee has assessed the expertise, adequacy and experience of the finance function and its senior staff members. After discussion with external and internal audit, and following the committee’s interaction with the finance function, the committee is satisfied with the expertise and adequacy of the finance function as well as the experience of senior staff members within the finance function. Furthermore, the committee believes that Mr Aaron Suckerman, the Financial Manager, possesses the appropriate expertise and experience to meet his responsibilities in this position as required by the JSE Listings Requirements.
The committee has recommended the integrated annual report to the Board for approval.
On behalf of the committee
Victor Christian
Chairman of the Audit and Risk Committee
The Board considers sound relationships with the various stakeholders to be a priority and management has responsibility for ensuring that effective and transparent communication channels with the various stakeholders are in place. In line with the requirements of the Registrar, the Trust has established a Complaint Resolution Policy which is available for viewing on the Trust’s website and at the registered office. During the year, dealings with stakeholders have been in the normal course of business and have been administered in a professional manner.
Board assessmentThe Board has adopted a Board and committee assessment framework. The first assessment was performed during the 2012 financial year, the evaluation including an evaluation of the true independence of directors classified as independent non-executive directors.
The Board was asked to rate relevant issues on a 1 to 5 scale; from ‘strongly disagree’ to ‘strongly agree’. The responses are indicative of a general perception by Board Members that they contribute to corporate leadership and stewardship and the achievement of the Trust’s objectives. The directors believe they have a good understanding of Fountainhead’s strategic plan and key issues. Board members generally believe that they contribute constructively to the resolution of issues at meetings, and that communication of expectations is clear. In general, the view is that information is obtained in an adequate, relevant and timely manner and that meeting attendance and preparation for such meetings are good.
Audit and Risk CommitteeThe Audit and Risk Committee (the committee) is a statutory committee of the Board of directors of Fountainhead Property Trust Management Limited in respect of its statutory duties in terms of the Companies Act. In addition, the committee has similar duties in terms of CISCA in relation to Fountainhead Property Trust. The committee also has other duties as assigned to it by the Board of directors. It reports to the Board regularly. In addition, it reports to unitholders on the extent to which it has carried out its statutory oversight duties – in respect of the external auditors, the appropriateness of the financial statements and the accounting practices, as well as the effectiveness of the internal financial controls.
The committee comprises three independent directors:
Director Period served on committee
VA Christian 19 May 2006 – present
HY Laher 4 February 2009 – present
JD Rainier 4 February 2009 – present

Fountainhead Property Trust | Integrated annual report 201222
1. Nature of business and strategy As indicated earlier in this integrated report, the Fountainhead
Property Trust, as a collective investment scheme in property, distributes to its unitholders all the net income derived from its real estate assets.
Our strategy is to grow the value of our property portfolio and our distributions to provide sustainable and increasing returns for unitholders over the long term. We seek to acquire quality properties with good growth prospects and where appropriate, dispose of underperforming assets. Properties are refurbished where the expenditure is justified by the return on capital or to preserve the asset values.
Manager’s report
2. Global economic overview Domestic economic confidence and performance have
shadowed the turmoil in global economic markets. Global economic data continues to disappoint expectations of imminent recovery, especially in the Eurozone, and GDP growth forecasts have sagged across the board. Expected World GDP growth for 2012 has fallen to 3.1%, 0.6% lower than was forecast in October 2011. South Africa’s GDP growth for 2012 has also been revised down to 2.5%, 0.9% lower than the previous forecast.
Expectations of GDP growth for 2012 in various major global economies are shown in the table below:
Oct 2011 Nov 2012 Change
US 2.5 2.2 (0.3)Euro Area 0.9 (0.4) (1.3)UK 1.4 0.0 (1.4)Japan 2.4 2.1 (0.3)Brazil 3.9 1.6 (2.3)Russia 4.4 3.9 (0.5)India 7.6 5.4 (2.2)China 8.4 7.6 (0.8)South Africa 3.4 2.5 (0.9)World 3.7 3.1 (0.6)
Source: Barclays Capital
In this scenario, most central banks, including the South African Reserve Bank (SARB), have kept interest rates at lower levels for far longer than ever before in an effort to stimulate their economies. The SARB has kept the repo rate below 10% since 2009. The current repo rate is 5%.
South African economic overview As illustrated in the graph below, business and consumer confidence have fallen steadily over the short to medium term, further confirming that
the economy is in a period of much subdued growth. Real retail sales registered growth of 4.3% in the year to 30 September 2012.
-20
0
20
40
60
80
100
05
05
06
06
06
06
07
07
08
08
08
08
09
09
09
09
10
10
10
10
11
11
11
11
12
12
12
12
07
07
Source: Bureau for Economic Research

Fountainhead Property Trust | Integrated annual report 201223
Certain salient issues emerging from an analysis of the 2011 census figures are influencing and will continue to influence the general direction of the economy and the property sector. These issues are:
Relatively slower population growth. A younger population. Migration to the metropolitan areas, where work opportunities
are greater. Increases in the numbers of learners completing school and in
the numbers of those proceeding to tertiary education. Increasing average household income.
These findings have a particular relevance in planning property development and investment, especially in retail properties.
The property market trends For the 12 months ended 30 September 2012, SA Listed
Property, as an asset class, recorded the highest total return (37.71%), followed by SA Equities (24.43%), SA Bonds (16.99%) and Cash (5.61%). Direct property investment, according to the recent IPD Index, achieved a respectable total return of 10.4%, which is above the inflation rate for the same period. Income return and capital growth registered 8.9% and 1.4%, respectively.
The chart below shows the relative performance of the three property sectors in South Africa. There were no significant differences in the capital growth performance of the individual sectors. Retail property was marginally ahead of office and industrial, but it is expected that all values will remain subdued until there is improvement in the overall economy.
Source: Investment Property Databank
REIT tax legislation Real Estate Investment Trust (REIT) tax legislation was announced
and published in the Taxation Laws Amendment Bill of 25 October
2012, to come into effect from 1 April 2013. A “REIT” is defined
as a company that is a South African resident and the shares of
which are listed on an exchange. The definition of “company”
has been expanded to include a portfolio of a collective
investment scheme in property (PUT). This allows PUTs to qualify
for company restructuring provisions and rollover relief at unitholder
level. The salient features of the REIT tax legislation are:
REITs are permitted to have external asset management
companies.
No conversion or transfer tax will be payable.
Deferred tax arising from property revaluations will be
eliminated from statements of financial position and no CGT
will be payable on property disposals.
Gearing is capped at 60% loan to value.
Minimum 75% of income to be property rental.
Minimum 75% payout ratio (retained income will be taxed).
Foreign withholding tax of 15% to be levied from 2014.
The introduction of REIT legislation is a significant development for
the listed property industry and should benefit all stakeholders.
3. Management of the Fountainhead Portfolio
On 1 August 2012 Redefine Properties Limited acquired
the entire shareholding in Fountainhead Property Trust
Management Limited (the Manager), replacing Standard
Bank and Liberty. All formalities have been completed
and the shares have been duly transferred to Redefine. In
September, Redefine seconded four asset managers and a
finance manager to provide asset management services to
the Fountainhead Portfolio.
The Broll Property Group continues to provide property
management to the bulk of the property portfolio, whilst
Redefine and Motseng Property Services have been appointed
to manage the remainder of the properties.
In November 2011, Absa Bank Limited gave notice of its
intention to retire as trustee of Fountainhead Property Trust, in
accordance with the requirements of the Collective Investments
Schemes Control Act of 2002. The board of directors of
the Manager approved the appointment of FirstRand Bank
Limited as trustee in the place of Absa, subject to approval
by the FSB, which was duly granted with effect from
16 November 2012.
Ret
urn
(%pa)
0
2
4
6
8
10
12
14
Retail
1.6
8.3
10.1
Office
1.3
9.7
11.2
Industrial
1.4
10.4
11.9
Capital Growth (% pa)
Income Return (% pa)
Total Return (% pa)
All Property
1.4
8.9
10.4

Fountainhead Property Trust | Integrated annual report 201224
4. Review of results and operations
Fountainhead Property Trust has declared a distribution of
27.83 cents per unit for the six months ended 30 September
2012 which, combined with the distribution of 28 cents for the
half-year ended 30 March 2012, resulted in a total distribution
of 55.83 cents per unit for the year ended 30 September
2012, 1% more than in the previous year. Included in the
current year’s distribution is the reversal of prior year municipal
accruals of R11.6 million and the dilutive effect of expensing the
borrowing costs of the redevelopment of Blue Route Mall. The
core portfolio, excluding properties acquired, properties disposed
of, or properties under development showed growth of 5.2%,
with contractual rental showing muted growth of 6.0%, primarily
due to tougher market conditions and negative reversions on
lease renewals.
Retail Market The Trust’s retail portfolio, which measures 471 757 m2,
generated net income growth of 20.9% for the year to
30 September 2012. On a like-for-like basis, excluding the
effect of purchasing 25% of Centurion Mall, net income growth
was 11.7%. The Blue Route Mall opened on 29 March 2012
and contributed R52 million to distributable income for the year.
The retail market continues to perform well, with retail vacancies
declining from 7.0% to 6.5%. Included in the vacancy figure is
the office space at Centurion Mall, which remains vacant and
contributes 3.2% of the total vacancy. Leases were concluded
on 65 501m2 of GLA at an average rental of R165/m2,
representing average rental growth of 1.1%. Of the leases that
expired during the period, 85% were renewed. The weighted
average rental increased from R133/m2 at 30 September 2011
to R141/m2 at 30 September 2012, with an average lease
escalation of 8.32%.
Key Retail Portfolio indicators Total reported sales turnover grew by 8.78%.
Foot-counts increased by 2%.
Average basket size increased by 6% to R111.
The operating expenses as a percentage of income reduced
by 10.0% to 21.1%.
The rent-to-turnover ratio is 6.03% and remains comfortably within
accepted norms for the retail sector. The tenant’s sales revenues
are growing comfortably in line with rentals.
Office Portfolio The Trust’s office portfolio, which measures 141 702m2,
generated net income growth of 33.6%. On a like-for-like basis,
excluding the effect of properties not held for 12 months in a
comparable period, the growth for the year is 3.72%. The office
market continues to improve in the year under review, the vacancy
rate declining sharply from 10.2% at September 2011 to 7.1%
at the end of the current financial year. Leases were concluded
on 23 393m2 of GLA at an average rental of R88/m2 and an
average negative rental reversion of -12.14%.The weighted
average rental increased from R109/m2 at 30 September 2011
to R115/m2, representing an average lease escalation of 8.24%.
Key Performance Indicators Negative rental reversions of -12.14% on new lets
and renewals.
71% of leases expiring during the period were renewed.
The operating expenses as a percentage of income reduced
by 18.00% to 17.42%.
Industrial Portfolio The Trust’s Industrial portfolio, which measures 167 770m2,
generated net income growth of 2.4%. The industrial market
continued to take strain, with rental continuing to be under
negative pressure and the vacancy rate increasing from 7.3%
at 30 September 2011 to 8% at the end of the current financial
Manager’s report (continued)
Segmental contribution to retail turnover for the year
6%
2%26%
5%
2%
8%
7%
4%
40%
Food Retailers
Apparel
Home & Furniture
Electronic & Media
Health & beauty
Food & Entertainment
Jewellery & Eyewear
Mass Discounters
Other

Fountainhead Property Trust | Integrated annual report 201225
year. Leases were concluded on 42 624m2 of GLA at an
average rental of R38/m2 and an average negative rental
reversion of -10.89%. The weighted average rental increased
slightly from R45/m2 at 30 September 2011 to R47/m2, with
an average lease escalation of 8.05%.
Key Performance Indicators Negative rental reversions of –10.89% on new lets and renewals.
74% of leases expiring during the period were renewed.
The operating expenses as a percentage of income increased
by 2.00% to 21.64%.
5. Property expenses and cost ratios
Net operating income from properties:
Property revenue (R) 1 042 million
Operating costs (R) 202 million
Net operating income (R) 840 million
Operating cost (%)* 19.8
*Excludes tenant installation and letting commission amortisation
Percentage of total operating cost summarised as follows:
Portfolio ratios: Property management costs as a % of collections 2.7%
Municipal recoveries as a % of municipal charges 74.0%
Electricity recoveries as a % of electricity charges 115.0%
6. Exposure to major tenants Exposure to major tenants is as follows (proportionate share where appropriate):
0%
5%
10%
15%
20%
25% 23.3%20.6%
18.7%
12.8%
4.9% 4.7% 3.8% 3.6% 2.8% 2.6% 2.2%
Man
agem
ent f
ees
Staf
f
Clean
ing
Letting
com
miss
ion
Repa
irs &
mai
nten
ance
Insu
ranc
e
Sund
ry e
xpen
ses
Tena
nt in
stalla
tions
Secu
rity
Bad
debt
s
Mar
ketin
g
Edco
n
Stan
dard
Ban
k
Shop
rite
Ster
Kinek
or
Truw
orths
Mr P
rice
Southe
rn S
un
PEPK
OR
Mas
smar
t
Ned
bank
Fosc
hini
ABSA
Life
Hea
lthca
re G
roup
Clic
ks
Mur
ray
and
Robe
rts
Pick
n P
ay
Gov
ernm
ent o
f RSA
Woo
lwor
ths
First N
atio
nal B
ank
Virg
in A
ctive
0
1%
2%
3%
4%
5%
6%
% Total Fountainhead Area % Total Fountainhead Rental

Fountainhead Property Trust | Integrated annual report 201226
7. Lease expiries for the next 12 months The lease expiry profile as a % of rentable area at 30 September 2012 is:
Building Vacant Year 1 Year 2 Year 3 Year 4 Year 5 5 year +
Retail 8 17 14 22 9 8 22
Office 7 16 9 14 6 17 31
Industrial 7 53 22 11 2 6 0
Specialised 0 0 0 0 0 0 100
Total 6 25 14 18 7 9 21
Due to the large number of industrial tenants on monthly leases, the lease expiry figure for the following year is inflated. The majority of these
tenants have been in occupation for over three years and are not expected to vacate during the next 12 months.
8. Valuations The composition of Fountainhead Property Trust’s Portfolio, as valued by the independent valuer, Rode and Associates CC,
as at 30 September 2012, is as follows:
Value Cents/UnitForward
earnings yield Percentage of portfolio
Sector (Rm) (%) 2012 2011
Retail 8 226 707 8.0 76 72
Office blocks 1 680 145 9.7 16 18
Industrial 541 47 12.1 5 7
Specialised 348 30 10.4 3 3
Total property 10 795 929 8.5 100 100
Interest-bearing liability (2 733) (235)
Net current assets 1 0
8 063 694
The portfolio is concentrated significantly around 15 properties making up 85% of the portfolio value. There have been no material changes
to the information used and the assumptions applied by the registered valuer compared to prior years.
Manager’s report (continued)

Fountainhead Property Trust | Integrated annual report 201227
9. Acquisitions and disposals The Trust purchased the following properties during the year:
Sector Building name Location Price Initial yield Transfer date
Retail Centurion Mall – 25% undivided share Centurion, PTA R751 519 364 7,10% 15 December 2011
Retail Centurion Boulevard Centurion, PTA R366 000 000 8,20% 27 March 2012
Office Cedarwood Bryanston, JHB R77 843 799 9,00% 4 January 2012
The Trust sold the following properties during the year:
Sector Building name Location Transfer date Selling price Valuation Profit on sale
Industrial Medsave House Strijdom Park, Johannesburg 3 October 2011 R2 446 000 R2 446 000 –
Industrial 4 Walter Place Watervalpark, Mayville 18 April 2012 R27 352 730 R22 536 643 R4 816 087
Office Wierda Mews 41 Wierda Road, Wierda Valley 3 April 2012 R17 949 963 R10 979 681 R6 970 282
Essex Park realised net proceeds of R30.2 million (valuation R30.2 million), with registration of transfer occurring after year-end.
10. Major capital projects
Blue Route Mall The Mall was opened on 29 March 2012 and was 99% let at the time. The Mall is trading in line with expectations and has been
well-received by tenants and shoppers. On-grade parking for an additional 2 000 parking bays is currently under construction and is due
for completion in early 2013, bringing this phase of the project to final completion. During the year an application for additional bulk
was submitted to allow for future expansion of the Mall. The additional parking bays under construction will allow for future expansion of
the Mall.
Bryanston Shopping Centre A R32 million refurbishment is underway at Bryanston Shopping Centre. The centre will receive a major facelift, with all ceilings and floors
being replaced and entrances enhanced. The refurbishment, due for completion in November 2012, will marginally enhance earnings.
Centurion Mall A R19 million refurbishment is underway which includes an upgrade of the spine area and capital replacement of the skylights.
The refurbishment is due for completion in November 2012. This capital expenditure will enhance the overall appeal of the Mall.
11. Letting activity
Retail Office Industrial
Area (m2)% of year end area Area (m2)
% of year end area Area (m2)
% of year end area
Vacant at 30 September 2011 29 221 6.2 14 217 10.0 13 355 8.0
Sold – – 1 166 0.8 – –
Acquired 3 994 0.8 – – – –
Vacated 22 834 4.8 5 890 4.2 13 493 8.0
New leases (25 237) (5.3) (11 272) (7.9) (13 359) (8.0)
Vacant at 30 September 2012 30 812 6.5 10 001 7.1 13 489 8.0

Fountainhead Property Trust | Integrated annual report 201228
12. Borrowings The Trust has a total facility of R3 035 million. The Trust’s gearing level is presently at 24.3%. The recent acquisitions and the redevelopment
of Blue Route Mall have increased the gearing ratio from 11.32% at 30 September 2011. The Board is satisfied with the increase in
gearing and the trust deed allows for a maximum gearing of up to 40%. The Interest cover is currently 5.2 times, which is well within the
debt covenants, set at 2 times.
Current facilities
Facility
(R000)Balance at
September 2012 Available Rate Maturity
Term loan 1 685 544 64 456 7.06% 30 June 2015
Term loan 2 250 000 – 11.39% 30 June 2013
Term loan 3 200 000 – 6.76% 30 June 2013
Term loan 4a 350 000 – 8.42% 31 May 2015
Term loan 4b 427 661 157 339 7.54% 31 May 2015
Term loan 5 520 000 80 000 8.72% 28 February 2016
Term loan 6 220 000 – 6.79% 30 June 2013
Term loan 7 80 000 – 6.74% 30 June 2013
2 733 205 301 795 7.97%
13. Vacancies The table below provides details of the Trust’s vacancies at 30 September 2011 and 30 September 2012:
SectorSeptember 2012
%September 2011
%
Retail 6.5 7.0
Office blocks 7.1 10.2
Industrial 8.0 7.3
Specialised – –
Total 6.7 7.4
Vacancy levels in terms of rentable area were as follows:
By value, the vacancies equated to 3.5% of the rent roll for September 2012, compared with 4.9% at 30 September 2011.
The retail component has a vacancy of 6.5%, primarily at Brightwater Commons and the offices at Centurion Mall, also known as
Die Anker.
The office component has a vacancy of 7.1%, primarily in Grayston Ridge and AMR Office Park.
The industrial component has a vacancy of 8%, primarily at Supreme Industrial Park and the Jet Park mini-units.
Manager’s report (continued)

Fountainhead Property Trust | Integrated annual report 201229
14. Unitholder summary The Trust’s major shareholders at 30 September 2012 are shown below:
Unitholders’ groupings holding 3% or more Number of units Percentage
Old Mutual 96 049 720 8.26STANLIB 87 389 923 7.52Government Employees Pension Fund 70 551 641 6.07Investec 59 073 608 5.08Standard Bank 51 523 517 4.43Eskom Pension & Provident Fund 45 899 050 3.95Investment Solutions 44 443 083 3.82Sanlam 34 919 055 3.00
Total 489 849 597 42.13
Public and non-public unitholders According to Fountainhead’s transfer secretaries, the unitholders spread of Fountainhead is as follows:
Number of unitholders Number of units Percentage
Non-public unitholders 5 580 494 0.05Public unitholders 8 267 1 162 129 254 99.95
Total 8 272 1 162 709 748 100.00
The non-public unitholders are the directors, whose interests are disclosed in the Corporate governance report, and the Manager whose holding is disclosed in note 2 to the annual financial statements of FPTML.
15. Asset and property management fees The service fee payable by the Trust to the Manager for the year was 0.5% per annum of the enterprise value of the Fund, which is total
market capitalisation plus the aggregate amount of borrowings, calculated monthly on the average daily closing prices. The amount paid was R53.5 million (2011: R40.4 million).
Asset management fees of R40.1 million (2011: R30.3 million) were paid by the Manager to the Evening Star Trading 768 Proprietary Limited. Administration fees of R1.3 million (2011: R1.2 million) were paid by the Manager to Broll Property Group.
Property management fees paid for the 12 months ended 30 September 20122012(R000)
2011(R000)
Broll Property Group Proprietary Limited 31 084 32 426Motseng Property Services Proprietary Limited 3 070 2 801McWilliam Murray Realty Proprietary Limited 1 362 1 219Abreal Proprietary Limited 6 446 –
41 962 36 446
16. Prospects Based on difficult trading conditions currently being experienced, the temporary dilution of Blue Route Mall, the effect of hedging the debt
and further committed capital expenditure of approximately R98 million, it is anticipated that distributions for 2013 will be unchanged compared with the year ended 30 September 2012. Distributions for the year ending 30 September 2014 are expected to show an increase of 7.2%.
This forecast has not been reviewed or reported on by Fountainhead Property Trust’s auditor.

Fountainhead Property Trust | Integrated annual report 201230
Blue Route MallA thorough redevelopment of the Blue Route
Mall in Cape Town had been contemplated
for some years and several considerations
contributed to the ultimate decision to proceed
with a radical makeover including the erection
of a new shopping centre.
The thirty-year old premises had grown
somewhat haphazardly over time, with
little regard to the architectural aptness of
occasional add-ons. The fabric of the building
and the services (power and water) had also
considerably decayed or deteriorated.
In addition, the centre did not function well
from a retail perspective – parking was
neither adequate nor readily accessible and
customer traffic flow through and around the
Mall was poor. Importantly, retail tenants did
not have ideally sized and suited spaces and
were therefore not trading as successfully as
they otherwise might have.
After consideration of the above, the
Fountainhead Board decided to rebuild
Blue Route in order to create a new mall
with a lettable area of 55 504m² and attract
retail tenants appropriate to the upmarket
demographics of the neighbourhood. The
budgeted estimated project capital cost
was approximately R935 million at a 5%
incremental yield.
A double-volume design with spacious, airy
malls was decided on, with attractive views of
the Constantiaberg to be had from the food-
court and elsewhere.
While construction was proceeding,
the Manager applied for 20 000m² of
additional bulk which is still being considered
by the local authority. Fountainhead has
decided to proceed with construction of a
further 400 parking bays needed for future
expansion. These will be completed by the
end of November 2012.
During the construction of the Mall, the centre’s
management had contact with people living
in the surrounding residential neighbourhoods
who were concerned about the potential
impact on the environment of the activities
involved in so large a construction project.
The management of the Mall had, however,
taken into account the construction’s
potential impact on the environment and it
had implemented processes to recycle the
brickwork and concrete from the demolished
buildings for use in the underlay of the
basement. A public refuse area for materials to
be recycled was also designated. In addition,
a system for collecting rain and storm water
from the roof was set up to complement
the centre’s own borehole for use in the
surrounding gardens.
Blue Route Mall opened for trading
on 29 March. The new mall
measures 55 504 m2 and has an
occupancy of 99%. The new Mall
is projected to contribute 12% of
the Trust’s net income for the year
ending 30 September 2013.
Property portfolio overview
Blue Route Mall
Blue Route Mall

Fountainhead Property Trust | Integrated annual report 201231
Centurion Mall
Blue Route Mall
an estimated 7.1%. Transfer was registered on 15 December 2011.
Centurion Mall is one of Fountainhead’s best-performing assets and
our asset managers, having identified further major opportunities
to increase revenues, acquired the adjoining Centurion Boulevard
property from Sanlam for R366 million at an initial yield of 8.2%.
The R19 million refurbishment of the Mall, now underway, is already
significantly enhancing its appeal for shoppers. This includes
upgrading the spine area from the waterfront right through to the
top of the centre with retail on both sides, the possible upgrading of
Checkers, and the enlargement and upgrade of both Woolworths
and Edgars.
The refurbishment is expected to be completed by November 2012.
The result is that a good retail centre is now an excellent asset with
estimated turnover growth of 15% to 25% and good densities in a
location surrounded by some 1.2 million people at desirable LSMs.
It is forecast to contribute some 37% of Fountainhead’s retail rental
income in the 2013 financial year.
Fountainhead has been trying for some time to create something
worthwhile for the lake area and it appears that other owners of
sites on the lake’s edge are willing to work with the local authority
in embarking on some kind of joint upgrading process.
Boulders
The Boulders Centre is now fully let thanks largely to the R25 million
cosmetic refurbishment which returned the magnificent boulders, which
made up this heritage site and gave their name to the Mall, to their
original positions.
The centre is performing very well with a good through-flow of
customers, good rentals and good value (the 2004 purchase price
of R170 million has grown to a present market value of R592 million).
An important environmental element of the design is the extremely
sophisticated Hvac system. As a result of the open, airy design of the
centre there is a great deal of natural light and an excellent flow of air
to the interior. These factors account for reduced power consumption in
air-conditioning systems and artificial lighting.
Nearby residents have also reacted positively to our suggestions to
employ landscaping experts to look at ways of making fuller and better
use of the green belt which the Blue Route Mall overlooks. We are
currently engaged in discussions with the local authority to devise a
common approach to the opportunities flowing from the recreational
and aesthetic benefits which the green belt offers.
Letting of retail space in the new Mall has progressed well, and by
year-end leases for 99% of its area were concluded. National brands
which signed up (often with more space than previously) included
Edgars, Woolworths, Foschini, Truworths, Dis-Chem, DionWired and
Hi-Fi Corporation.
The taxi associations have applied to the Mall for a taxi rank, for
which we have allocated a site adjacent to the Ster-Kinekor complex.
Since the opening of the new Blue Route Mall on 29 March 2012,
tenants have experienced strong turnover growth and when all parking
has been completed it is expected that many of the new tenants will be
growing turnover by 10% to 15%. We estimate that by March 2013
over 600 000 people will be passing through the Mall every month.
Public reaction to the new Mall has been extremely positive and it is
already clear that this regional shopping centre should dominate the
retail market of Cape Town’s Southern Peninsula.
CenturionAs announced during 2011, Fountainhead exercised a pre-emptive right to acquire the 25% undivided share in Centurion Mall which it did not already own, for a purchase price of some R751 million, yielding

Fountainhead Property Trust | Integrated annual report 201232
Property portfolio overview (continued)
Blue Route Mall
Tokai Road, Tokai, Cape Town Current Change 2011
GLA m2 55 504
Vacancy 0.94%
Valuation R906 million 76%
Centre average monthly turnover R84 million 46%
Average monthly foot count (last six months) 589 334 39%
IPD Footfall Indicator: 10 – 12 feet per m2 10.6
Trading density 1 652 15%
Rent to turnover ratio 4.38% 13%
Percentage contribution to net property income 9.02%
Expense to income ratio 27% 13%
Weighted average rental per m2 139
Major tenants
Edgars, Shoprite-Checkers, Woolworths,
Ster-Kinekor, Dis-Chem 37,54% of rental
Approved capex still to be spent R173 million
Heuwel Avenue, Centurion Current Change 2011
GLA m2 134 582
Vacancy* 13.14% 14%
Valuation R3.4 billion 62%
Centre average monthly turnover R220 million 9%
Average monthly foot count (last six months) 1 347 233 4%
IPD Footfall Indicator: 10 – 12 feet per m2 12.1
Trading density 2 201
Rent to turnover ratio 8.12% 2%
Percentage contribution to net property income 35.43%
Expense to income ratio 18% 6%
Weighted average rental per m2 177
Major tenants
Meltz, Dis-Chem, Edgars, Game, Osbro Cash
and Carry, Pick n Pay, Shoprite-Checkers,
Truworths, Woolworths, Ster-Kinekor 34,24% of rental
Approved capex still to be spent R15 million
Centurion Mall
* Includes office vacancy at De Anker.

Fountainhead Property Trust | Integrated annual report 201233
Doncaster Road, Kenilworth Current Change 2011
GLA m2 46 842
Vacancy 0.57% 0.24%
Valuation R695 million 5%
Centre average monthly turnover R95 million 1%
Average monthly foot count (last six months) 800 622
IPD Footfall Indicator: 10 – 12 feet per m2 17.1
Trading density 2 628 11%
Rent to turnover ratio 6.12% 14%
Percentage contribution to net property income 9.06%
Expense to income ratio 26% 12%
Weighted average rental per m2 126
Major tenants
Clicks, Wetherleys 28.54% of rental
Approved capex still to be spent R5.5 million
Kenilworth Centre
Old Pretoria Road, Midrand Current Change 2011
GLA m2 49 103
Vacancy* 5.00% 14%
Valuation R592 billion 9%
Centre average monthly turnover R67 million 8%
Average monthly foot count (last six months) 923 531 7%
IPD Footfall Indicator: 10 – 12 feet per m2 18.8
Trading density 2 237 9%
Rent to turnover ratio 7.68%
Percentage contribution to net property income 8.99%
Expense to income ratio 21%
Weighted average rental per m2 112
Major tenants
Edgars, Game, Osbro Cash and Carry,
Pick n Pay, Virgin Active26.69% of rental
Approved capex still to be spent R1.5 million
The Boulders Shopping Centre
* Includes office vacancy.

Fountainhead Property Trust | Integrated annual report 201234
Property portfolio overview (continued)
The Brightwater Commons
Republic Road, Randburg Current Change 2011
GLA m2 42 384
Vacancy 14.43% 20%
Valuation R174 million 5%
Centre average monthly turnover R33 million 8%
Average monthly foot count (last six months) 410 049 2%
IPD Footfall Indicator: 10 – 12 feet per m2 9.7
Trading density 1 220 8%
Rent to turnover ratio 8.79%
Percentage contribution to net property income 3.49%
Expense to income ratio 45% 7%
Weighted average rental per m2 86
Major tenants
The Market Place, Pick n Pay, Virgin Active,
Caltex, Woolworths 34.55% of rental
Approved capex still to be spent R1 million
Ontdekkers Road, Roodepoort Current Change 2011
GLA m2 45 034
Vacancy 1.24% 1%
Valuation R768 billion 11%
Centre average monthly turnover R154 million
Average monthly foot count (last six months) 1 185 305 2%
IPD Footfall Indicator: 10 – 12 feet per m2 10.9
Trading density 1 606
Rent to turnover ratio 10.03% 6%
Percentage contribution to net property income 10.35%
Expense to income ratio 24% 25%
Weighted average rental per m2 111
Major tenants
Shoprite, Edgars, Game, Woolworths,
Ackermans, Jet, Mr Price, Truworths,
Hi-Fi Corporation
29.74% of rental
Approved capex still to be spent R25 million
Westgate Shopping Centre (41.32%) Fountainhead share

Fountainhead Property Trust | Integrated annual report 201235
Benmore Shopping Centre
Benmore Road, Sandton Current Change 2011
GLA m2 22 690
Vacancy* 4.07% 6%
Valuation R540 million 4%
Centre average monthly turnover R48 million 11%
Average monthly foot count (last six months) 529 921 3%
IPD Footfall Indicator: 15 – 18 feet per m2 23
Trading density 3 530 8%
Rent to turnover ratio 7.56% 5%
Percentage contribution to net property income 7.16%
Expense to income ratio 24% 8%
Weighted average rental per m2 191
Major tenants
Woolworths, Pick n Pay, Dis-Chem 23,53%
Approved capex still to be spent R6.6 million
N1 City Mall
Louwtjie Rothman Street, Goodwood Current Change 2011
GLA m2 37 241
Vacancy 0.25% 0.02%
Valuation R603 million 5%
Centre average monthly turnover R102 million 8%
Average monthly foot count (last six months) 870 111 1%
IPD Footfall Indicator: 10 – 12 feet per m2 13,6
Trading density 1 767 6%
Rent to turnover ratio 5.02%
Percentage contribution to net property income 8.88%
Expense to income ratio 21%
Weighted average rental per m2 145
Major tenants
OK, Pick n Pay, Ster-Kinekor, Wonderland
Amusement Centre, Woolworths 38.01%
Approved capex still to be spent R1.2 million
(58%) Fountainhead share
* Includes office vacancy.
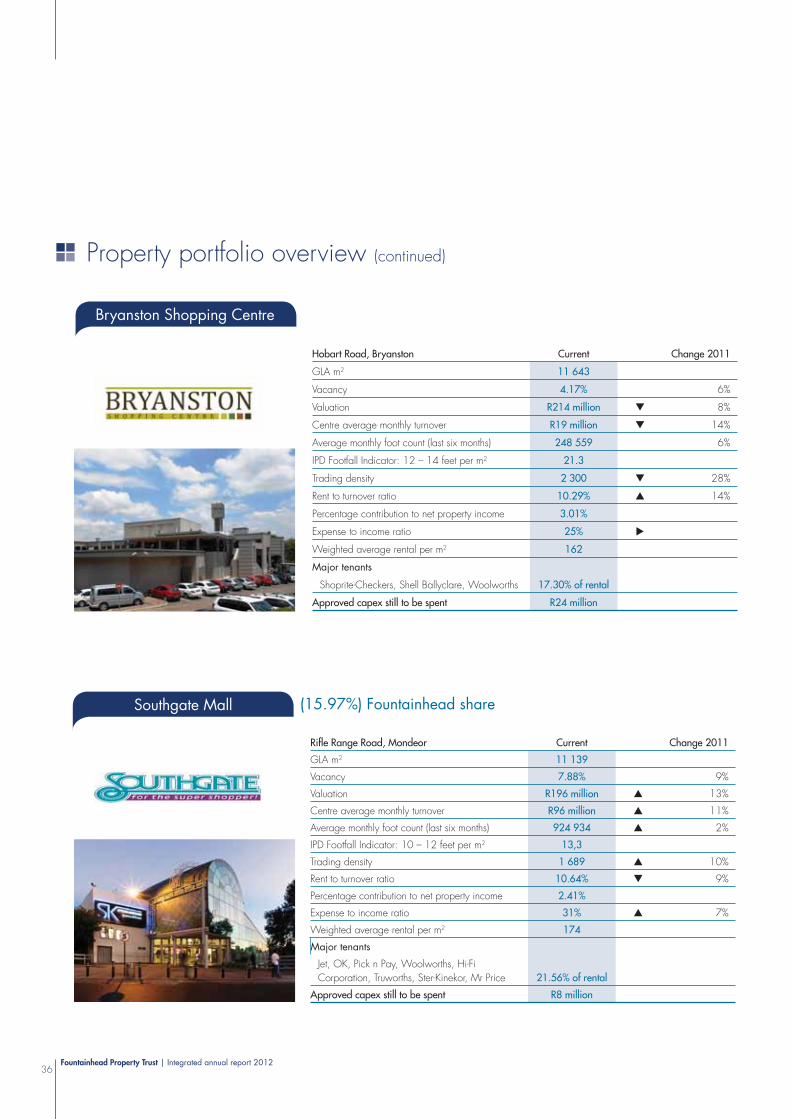
Fountainhead Property Trust | Integrated annual report 201236
Property portfolio overview (continued)
Southgate Mall
Rifl e Range Road, Mondeor Current Change 2011
GLA m2 11 139
Vacancy 7.88% 9%
Valuation R196 million 13%
Centre average monthly turnover R96 million 11%
Average monthly foot count (last six months) 924 934 2%
IPD Footfall Indicator: 10 – 12 feet per m2 13,3
Trading density 1 689 10%
Rent to turnover ratio 10.64% 9%
Percentage contribution to net property income 2.41%
Expense to income ratio 31% 7%
Weighted average rental per m2 174
Major tenants
Jet, OK, Pick n Pay, Woolworths, Hi-Fi
Corporation, Truworths, Ster-Kinekor, Mr Price 21.56% of rental
Approved capex still to be spent R8 million
(15.97%) Fountainhead share
Bryanston Shopping Centre
Hobart Road, Bryanston Current Change 2011
GLA m2 11 643
Vacancy 4.17% 6%
Valuation R214 million 8%
Centre average monthly turnover R19 million 14%
Average monthly foot count (last six months) 248 559 6%
IPD Footfall Indicator: 12 – 14 feet per m2 21.3
Trading density 2 300 28%
Rent to turnover ratio 10.29% 14%
Percentage contribution to net property income 3.01%
Expense to income ratio 25%
Weighted average rental per m2 162
Major tenants
Shoprite-Checkers, Shell Ballyclare, Woolworths 17.30% of rental
Approved capex still to be spent R24 million

Fountainhead Property Trust | Integrated annual report 201237
173 Oxford Road, Rosebank Current Change 2011
GLA m2 7 302
Vacancy 5.09% 3%
Valuation R77 million 7%
Centre average monthly turnover R2.5 million 17%
Average monthly foot count (last six months) n/a
IPD Footfall Indicator: 10 – 12 feet per m2 n/a
Trading density 2 445 17%
Rent to turnover ratio 31.66% 14%
Percentage contribution to net property income 1.15%
Expense to income ratio 30% 43%
Weighted average rental per m2 111
Major tenants
Clicks, Wetherleys 16.74% of rental
Approved capex still to be spent R137 000
Rosebank Mews
Southgate Value Market
Rifl e Range Road, Mondeor Current Change 2011
GLA m2 3 651
Vacancy 0.00% 0.33%
Valuation R24 million
Centre average monthly turnover R33 million 15%
Average monthly foot count (last six months) n/a
IPD Footfall Indicator: 10 – 12 feet per m2 n/a
Trading density 2 058 19%
Rent to turnover ratio 4,93% 9%
Percentage contribution to net property income 0,55%
Expense to income ratio 17% 59%
Weighted average rental per m2 86
Major tenants
Game, Virgin Active, Shoprite, Furncity 36,00% of rental
Approved capex still to be spent R29 000
(19.01%) Fountainhead share

Fountainhead Property Trust | Integrated annual report 201238
Property portfolio overview (continued)
Dekema Mall
Dekema Road, Wadeville, Germiston Current Change 2011
GLA m2 4 642
Vacancy 9.69% 7%
Valuation R25 million 4%
Percentage contribution to net property income 0.50%
Expense to income ratio 27%
Weighted average rental per m2 78
Major tenant
Dekama Mall Supermarket
Standard Bank 32.6% of rental
Centurion Mall
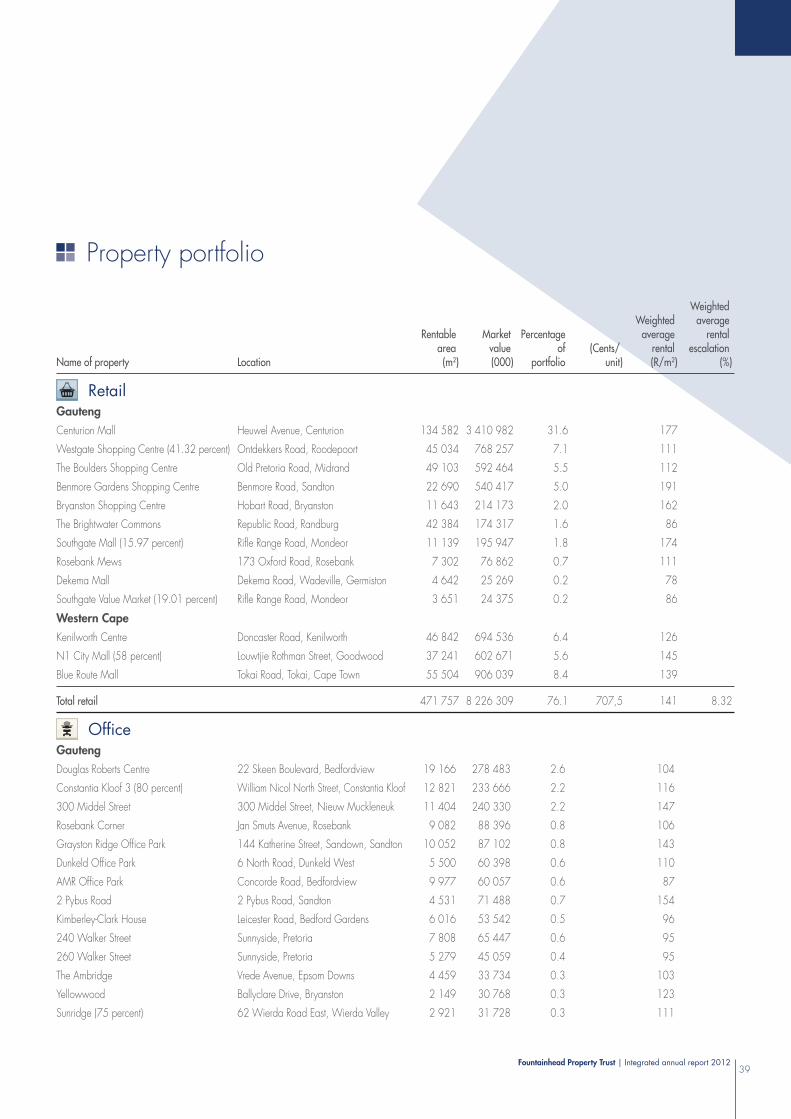
Fountainhead Property Trust | Integrated annual report 201239
Name of property Location
Rentablearea(m2)
Marketvalue(000)
Percentage of
portfolio(Cents/
unit)
Weightedaverage
rental(R/m2)
Weightedaverage
rentalescalation
(%)
RetailGautengCenturion Mall Heuwel Avenue, Centurion 134 582 3 410 982 31.6 177
Westgate Shopping Centre (41.32 percent) Ontdekkers Road, Roodepoort 45 034 768 257 7.1 111
The Boulders Shopping Centre Old Pretoria Road, Midrand 49 103 592 464 5.5 112
Benmore Gardens Shopping Centre Benmore Road, Sandton 22 690 540 417 5.0 191
Bryanston Shopping Centre Hobart Road, Bryanston 11 643 214 173 2.0 162
The Brightwater Commons Republic Road, Randburg 42 384 174 317 1.6 86
Southgate Mall (15.97 percent) Rifle Range Road, Mondeor 11 139 195 947 1.8 174
Rosebank Mews 173 Oxford Road, Rosebank 7 302 76 862 0.7 111
Dekema Mall Dekema Road, Wadeville, Germiston 4 642 25 269 0.2 78
Southgate Value Market (19.01 percent) Rifle Range Road, Mondeor 3 651 24 375 0.2 86
Western CapeKenilworth Centre Doncaster Road, Kenilworth 46 842 694 536 6.4 126
N1 City Mall (58 percent) Louwtjie Rothman Street, Goodwood 37 241 602 671 5.6 145
Blue Route Mall Tokai Road, Tokai, Cape Town 55 504 906 039 8.4 139
Total retail 471 757 8 226 309 76.1 707,5 141 8.32
OfficeGautengDouglas Roberts Centre 22 Skeen Boulevard, Bedfordview 19 166 278 483 2.6 104
Constantia Kloof 3 (80 percent) William Nicol North Street, Constantia Kloof 12 821 233 666 2.2 116
300 Middel Street 300 Middel Street, Nieuw Muckleneuk 11 404 240 330 2.2 147
Rosebank Corner Jan Smuts Avenue, Rosebank 9 082 88 396 0.8 106
Grayston Ridge Office Park 144 Katherine Street, Sandown, Sandton 10 052 87 102 0.8 143
Dunkeld Office Park 6 North Road, Dunkeld West 5 500 60 398 0.6 110
AMR Office Park Concorde Road, Bedfordview 9 977 60 057 0.6 87
2 Pybus Road 2 Pybus Road, Sandton 4 531 71 488 0.7 154
Kimberley-Clark House Leicester Road, Bedford Gardens 6 016 53 542 0.5 96
240 Walker Street Sunnyside, Pretoria 7 808 65 447 0.6 95
260 Walker Street Sunnyside, Pretoria 5 279 45 059 0.4 95
The Ambridge Vrede Avenue, Epsom Downs 4 459 33 734 0.3 103
Yellowwood Ballyclare Drive, Bryanston 2 149 30 768 0.3 123
Sunridge (75 percent) 62 Wierda Road East, Wierda Valley 2 921 31 728 0.3 111
Property portfolio

Name of property Location
Rentablearea(m2)
Marketvalue(000)
Percentage of
portfolio(Cents/
unit)
Weightedaverage
rental(R/m2)
Weightedaverage
rentalescalation
(%)
Office (continued)
Gauteng (continued)
Summit Park 439 Summit Road, Morningside 2 874 25 420 0.2 100
Lakeside Place Queen Street, Bruma 3 386 15 654 0.1 85
256 Kent Avenue 256 Kent Avenue, Randburg 2 244 12 635 0.1 81
RPA Centre 180 Smit Street, Fairland 1 716 8 425 0.1 70
Cedarwood 35 Ballyclare Drive, Bryanston 4 665 66 086 0.6 190
KwaZulu-Natal18 The Boulevard Westway, Durban 5 007 79 176 0.7 157
Delmat House 28 Jan Hofmeyr Road, Westville 3 939 42 136 0.4 136
Essex Park 46 Essex Terrace, Berea West, Westville 4 335 30 200 0.3 107
Kent House 1 Neptune Road, Berea West, Westville 2 371 20 105 0.2 107
Total offices 141 702 1 680 035 15.6 144,5 115 8.24
SpecialisedGautengBedford Gardens Private Hospital Leicester Road, Bedford Gardens 12 817 227 466 2.1 131
Southern Sun OR Tambo International Airport Kempton Park 14 152 120 450 1.1 90
Total specialised 26 969 347 916 3.2 29,9 109 8.85
Property portfolio (continued)
Fountainhead Property Trust | Integrated annual report 201240
SpSp

Fountainhead Property Trust | Integrated annual report 201241
Name of property Location
Rentablearea(m2)
Marketvalue(000)
Percentage of
portfolio(Cents/
unit)
Weightedaverage
rental(R/m2)
Weightedaverage
rentalescalation
(%)
IndustrialGautengMifa Industrial Park 399 George Street, corner 16th Road
Midrand 34 002 123 515 1.1 43
Strijdom Industrial Park Hammer Avenue, Strijdompark, Randburg 25 037 103 065 1.0 52
Supreme Industrial Park Klipriviersberg Road, Steeledale 31 061 55 213 0.5 39
Nashua House Old Pretoria Road, Midrand 7 551 49 188 0.5 77
Jupiter Ext 1 Nasmith Road, Jupiter Ext 1, Germiston 10 540 28 050 0.3 41
Vodacom Midrand 142, 16th Road, Midrand 4 519 23 658 0.2 64
Gateway Industrial Park Graniet Street, Jet Park 4 805 10 987 0.1 39
Delta Old Pretoria Road, Midrand 1 504 12 252 0.1 153
Dismed House 733/747, 16th Road, Midrand 2 871 10 889 0.1 53
Strike House Richards Drive, Halfway House 1 880 6 964 0.1 41
Canberra Industrial Park Derick Coetzee Street, Jet Park 2 621 7 280 0.1 36
The House of Rubber Crusher Road, Crown Extension 2 266 6 950 0.1 36
Jay Park Piet Bekker Street, Jet Park 2 264 5 569 0.1 38
Humsa House Graniet Street, Jet Park 2 113 6 306 0.1 29
Monit House Van der Bijl Street, Meadowdale 1 985 6 031 0.1 39
Astro Place Van der Bijl Street, Meadowdale 1 876 5 614 0.1 39
Staceylee Industrial Park Derick Coetzee Street, Jet Park 1 876 5 592 0.1 42
Mercury Park Piet Bekker Street, Jet Park 2 105 5 012 0.0 32
Lifetime House Kelly Road, Jet Park 1 799 5 364 0.0 45
Orion Place Piet Bekker Street, Jet Park 1 519 3 819 0.0 43
Dale House Corner Bell and Fleming Streets Meadowdale 1 308 4 212 0.0 40
Ventura Industrial Park Derick Coetzee Street, Jet Park 1 402 4 054 0.0 40
Hydra Park Piet Bekker Street, Jet Park 1 643 3 887 0.0 37
Gail Industrial Park Patrick Road, Jet Park 1 504 3 505 0.0 36
Precision House Precision Road, Kya Sand 604 1 705 0.0 43
KwaZulu-NatalMurrayfield Prospecton Road, Prospecton 17 115 42 051 0.4 50
Total industrial 167 770 540 732 5.1 46,5 47 8.05
Total property portfolio of Fountainhead 808 198 10 794 992 100.0 928,4 117 8.31
The average annualised property historical yield based on valuations as at 30 September 2012 is 7.79% (2011: 7.91%).
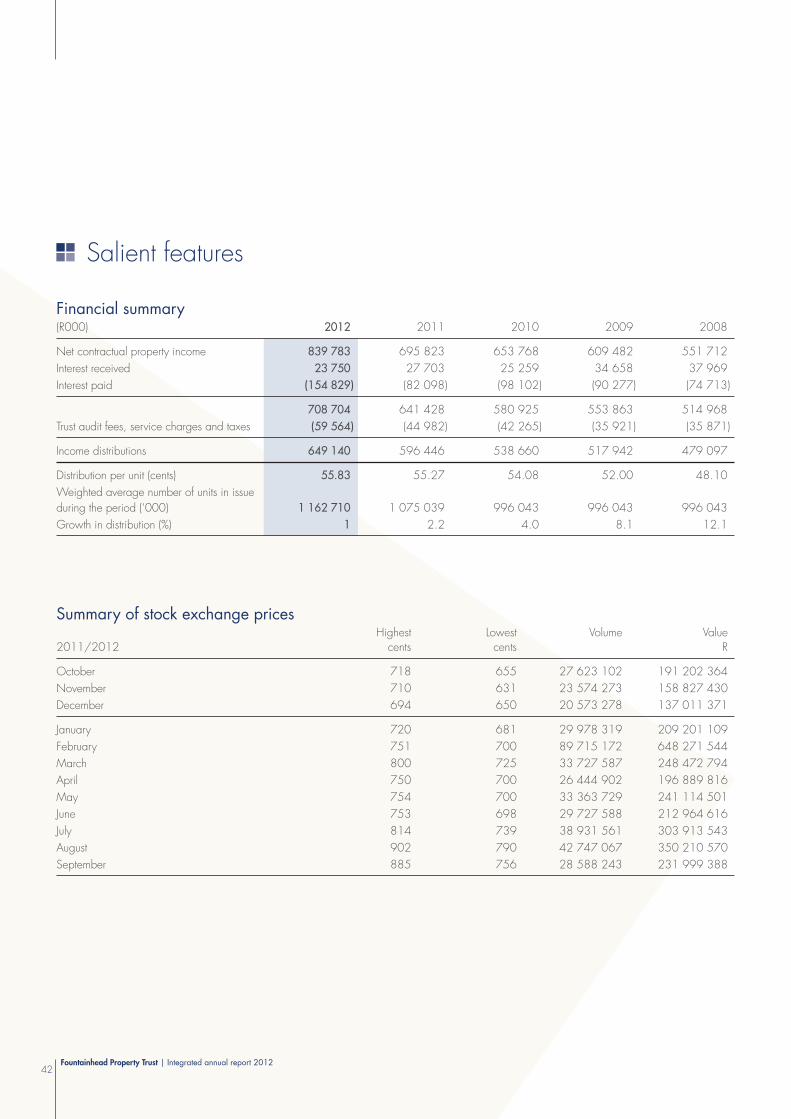
Salient features
Financial summary(R000) 2012 2011 2010 2009 2008
Net contractual property income 839 783 695 823 653 768 609 482 551 712
Interest received 23 750 27 703 25 259 34 658 37 969
Interest paid (154 829) (82 098) (98 102) (90 277) (74 713)
708 704 641 428 580 925 553 863 514 968
Trust audit fees, service charges and taxes (59 564) (44 982) (42 265) (35 921) (35 871)
Income distributions 649 140 596 446 538 660 517 942 479 097
Distribution per unit (cents) 55.83 55.27 54.08 52.00 48.10
Weighted average number of units in issue
during the period (‘000) 1 162 710 1 075 039 996 043 996 043 996 043
Growth in distribution (%) 1 2.2 4.0 8.1 12.1
Fountainhead Property Trust | Integrated annual report 201242
Summary of stock exchange prices
2011/2012Highest
centsLowest
centsVolume Value
R
October 718 655 27 623 102 191 202 364
November 710 631 23 574 273 158 827 430
December 694 650 20 573 278 137 011 371
January 720 681 29 978 319 209 201 109
February 751 700 89 715 172 648 271 544
March 800 725 33 727 587 248 472 794
April 750 700 26 444 902 196 889 816
May 754 700 33 363 729 241 114 501
June 753 698 29 727 588 212 964 616
July 814 739 38 931 561 303 913 543
August 902 790 42 747 067 350 210 570
September 885 756 28 588 243 231 999 388
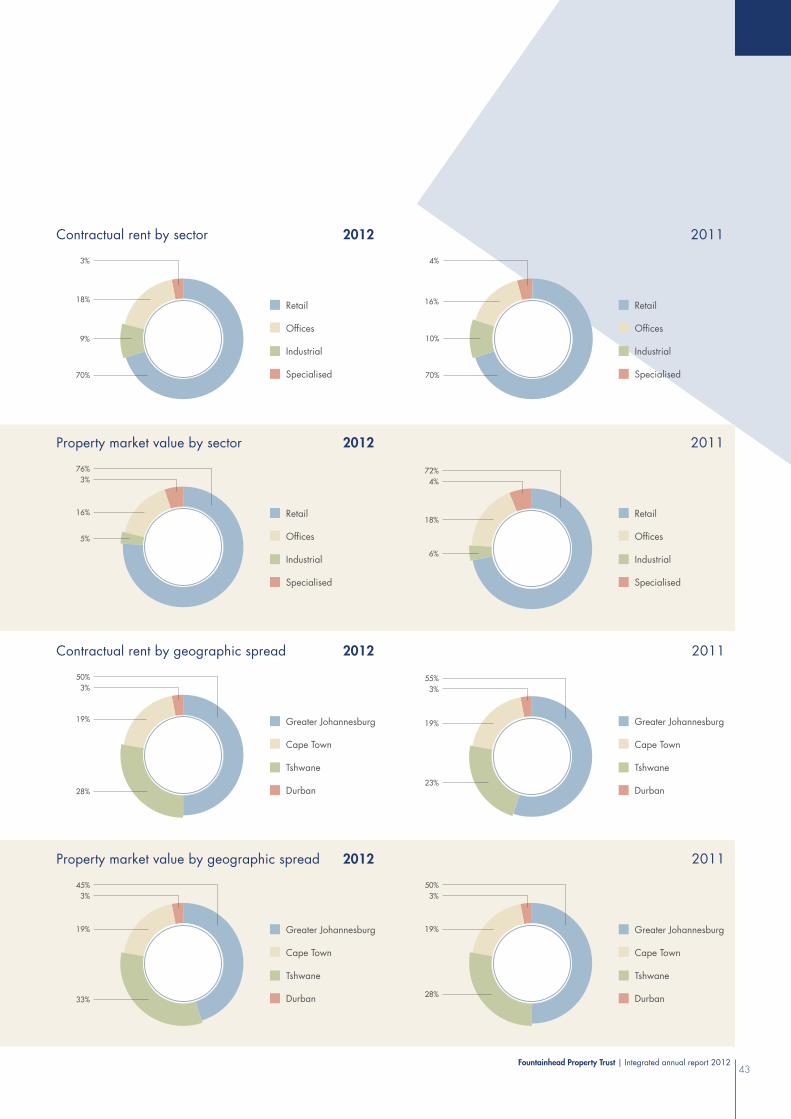
Fountainhead Property Trust | Integrated annual report 201243
Property market value by geographic spread 2012
Greater Johannesburg
Cape Town
Tshwane
Durban
Greater Johannesburg
Cape Town
Tshwane
Durban
19%
45%
3%
33%
19%
50%
3%
28%
Contractual rent by sector 2012 2011
Retail
Offi ces
Industrial
Specialised
9%
3%
18%
70%
Retail
Offi ces
Industrial
Specialised
10%
4%
16%
70%
Retail
Offi ces
Industrial
Specialised
Property market value by sector 2012 2011
16%
3%
76%
5%
Retail
Offi ces
Industrial
Specialised
18%
4%
6%
72%
Contractual rent by geographic spread 2012
Greater Johannesburg
Cape Town
Tshwane
Durban
19%
50%
3%
28%
2011
19%
55%
3%
23%
Greater Johannesburg
Cape Town
Tshwane
Durban
2011
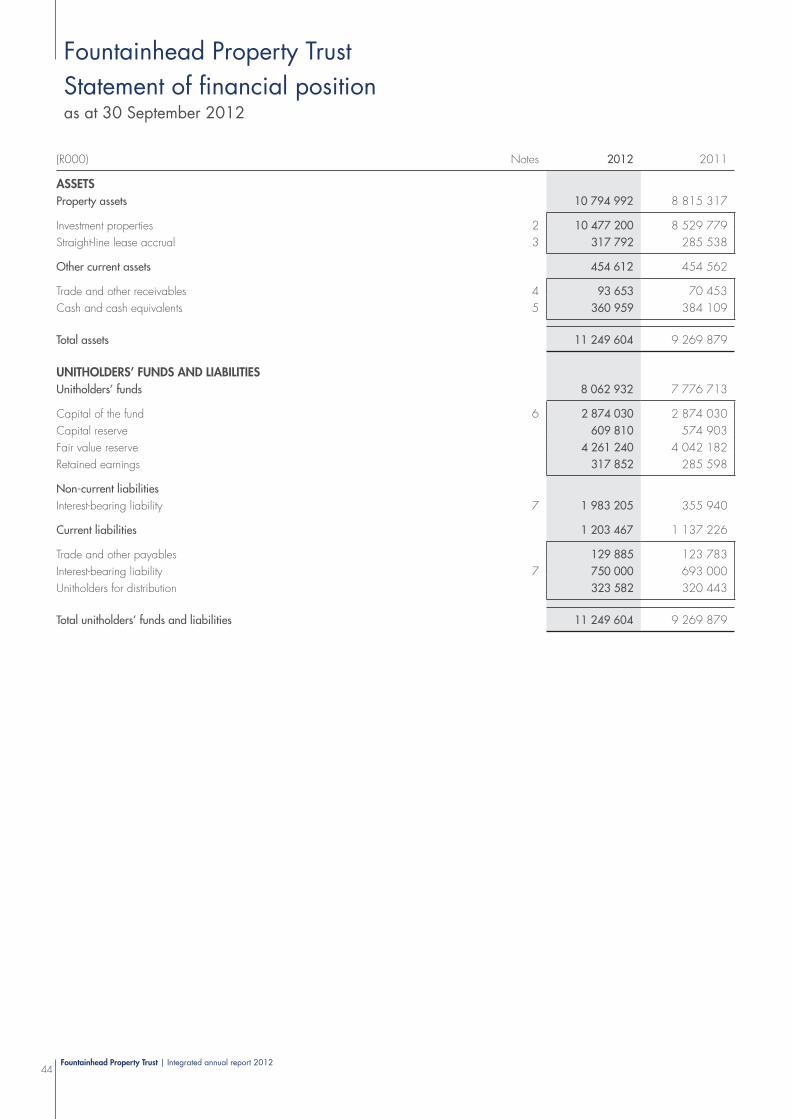
Fountainhead Property Trust | Integrated annual report 201244
Fountainhead Property Trust
Statement of financial positionas at 30 September 2012
(R000) Notes 2012 2011
ASSETSProperty assets 10 794 992 8 815 317
Investment properties 2 10 477 200 8 529 779
Straight-line lease accrual 3 317 792 285 538
Other current assets 454 612 454 562
Trade and other receivables 4 93 653 70 453
Cash and cash equivalents 5 360 959 384 109
Total assets 11 249 604 9 269 879
UNITHOLDERS’ FUNDS AND LIABILITIESUnitholders’ funds 8 062 932 7 776 713
Capital of the fund 6 2 874 030 2 874 030
Capital reserve 609 810 574 903
Fair value reserve 4 261 240 4 042 182
Retained earnings 317 852 285 598
Non-current liabilities
Interest-bearing liability 7 1 983 205 355 940
Current liabilities 1 203 467 1 137 226
Trade and other payables 129 885 123 783
Interest-bearing liability 7 750 000 693 000
Unitholders for distribution 323 582 320 443
Total unitholders’ funds and liabilities 11 249 604 9 269 879
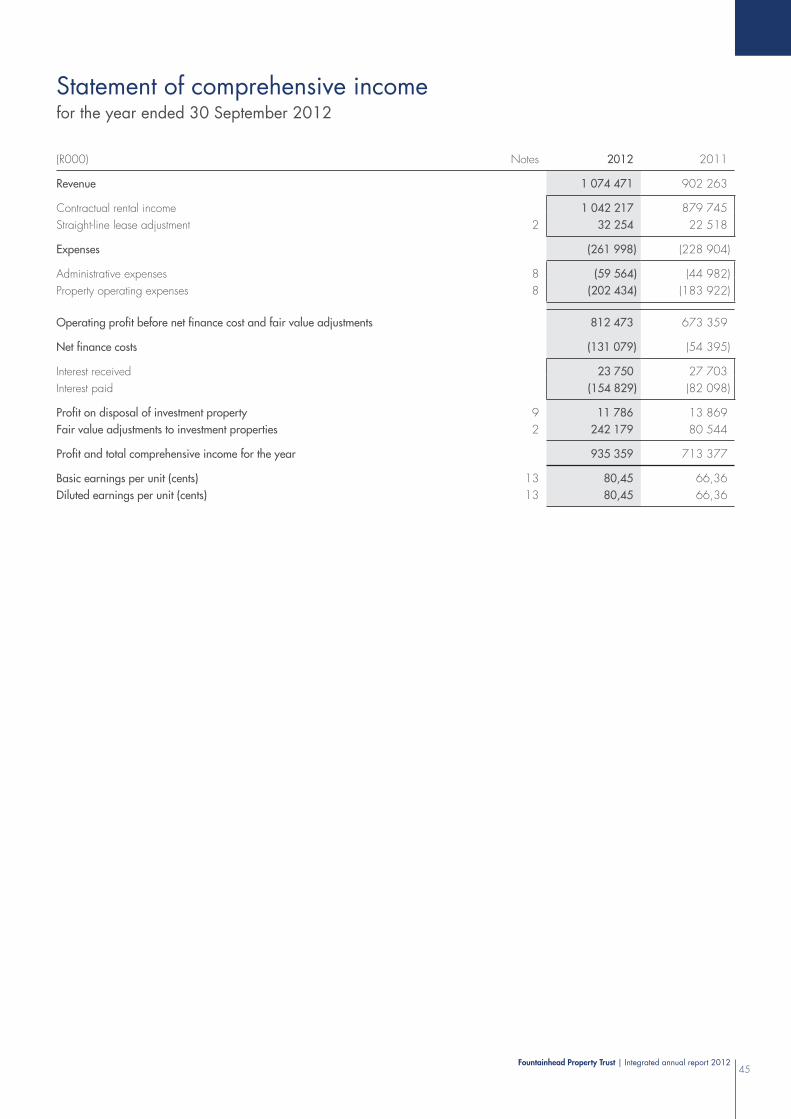
Fountainhead Property Trust | Integrated annual report 201245
Statement of comprehensive incomefor the year ended 30 September 2012
(R000) Notes 2012 2011
Revenue 1 074 471 902 263
Contractual rental income 1 042 217 879 745
Straight-line lease adjustment 2 32 254 22 518
Expenses (261 998) (228 904)
Administrative expenses 8 (59 564) (44 982)
Property operating expenses 8 (202 434) (183 922)
Operating profit before net finance cost and fair value adjustments 812 473 673 359
Net finance costs (131 079) (54 395)
Interest received 23 750 27 703
Interest paid (154 829) (82 098)
Profit on disposal of investment property 9 11 786 13 869
Fair value adjustments to investment properties 2 242 179 80 544
Profit and total comprehensive income for the year 935 359 713 377
Basic earnings per unit (cents) 13 80,45 66,36
Diluted earnings per unit (cents) 13 80,45 66,36
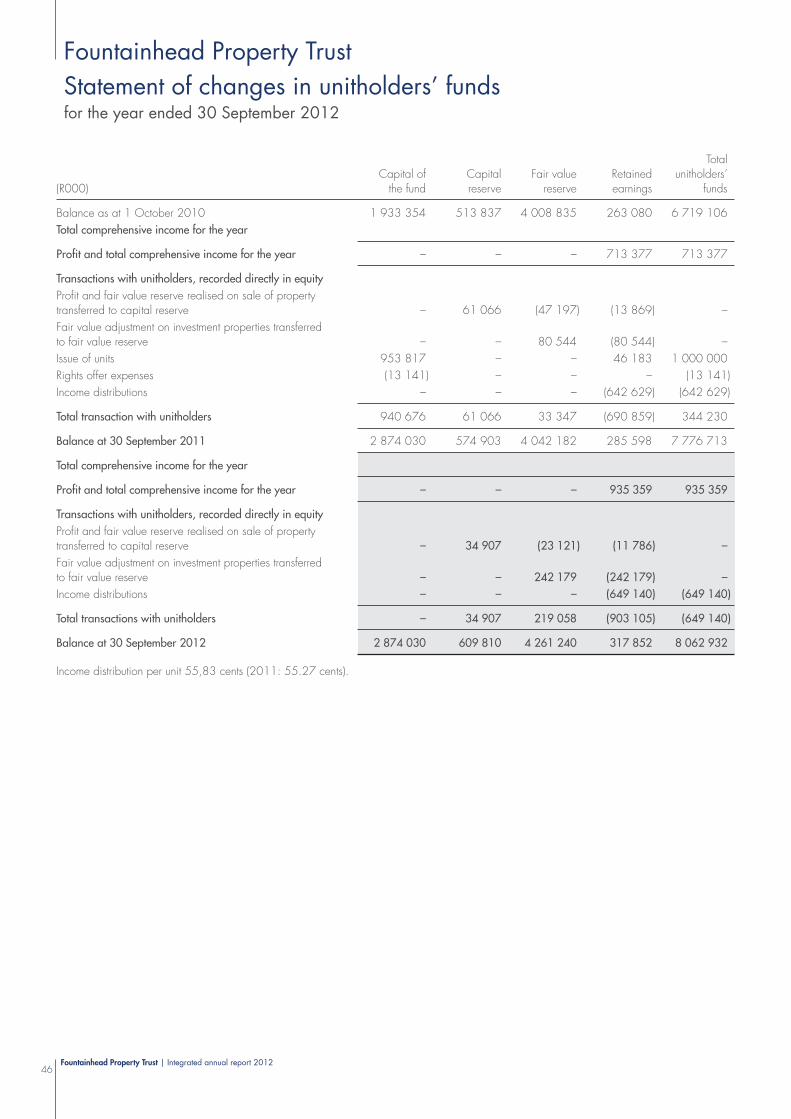
Fountainhead Property Trust | Integrated annual report 201246
Statement of changes in unitholders’ fundsfor the year ended 30 September 2012
(R000)Capital of
the fundCapitalreserve
Fair valuereserve
Retainedearnings
Totalunitholders’
funds
Balance as at 1 October 2010 1 933 354 513 837 4 008 835 263 080 6 719 106
Total comprehensive income for the year
Profit and total comprehensive income for the year – – – 713 377 713 377
Transactions with unitholders, recorded directly in equity
Profit and fair value reserve realised on sale of property transferred to capital reserve – 61 066 (47 197) (13 869) –
Fair value adjustment on investment properties transferred to fair value reserve – – 80 544 (80 544) –
Issue of units 953 817 – – 46 183 1 000 000
Rights offer expenses (13 141) – – – (13 141)
Income distributions – – – (642 629) (642 629)
Total transaction with unitholders 940 676 61 066 33 347 (690 859) 344 230
Balance at 30 September 2011 2 874 030 574 903 4 042 182 285 598 7 776 713
Total comprehensive income for the year
Profit and total comprehensive income for the year – – – 935 359 935 359
Transactions with unitholders, recorded directly in equity
Profit and fair value reserve realised on sale of property transferred to capital reserve – 34 907 (23 121) (11 786) –
Fair value adjustment on investment properties transferred to fair value reserve – – 242 179 (242 179) –
Income distributions – – – (649 140) (649 140)
Total transactions with unitholders – 34 907 219 058 (903 105) (649 140)
Balance at 30 September 2012 2 874 030 609 810 4 261 240 317 852 8 062 932
Income distribution per unit 55,83 cents (2011: 55.27 cents).
Fountainhead Property Trust
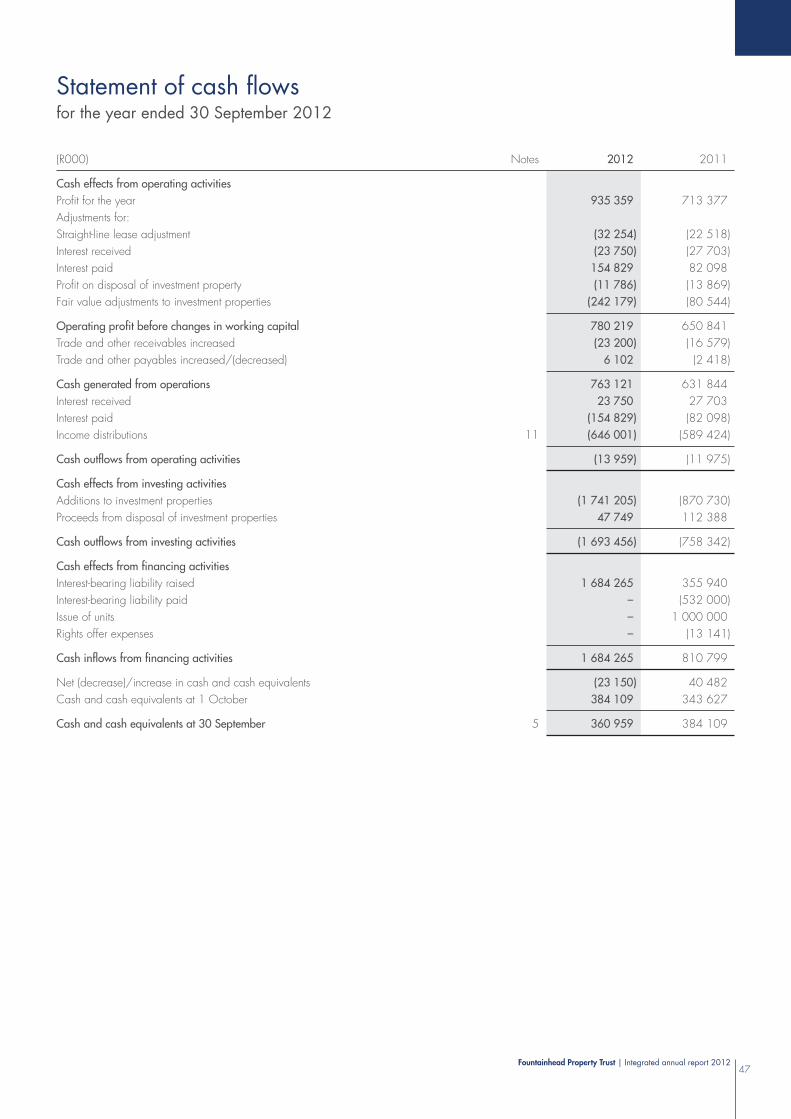
Fountainhead Property Trust | Integrated annual report 201247
Statement of cash flowsfor the year ended 30 September 2012
(R000) Notes 2012 2011
Cash effects from operating activities
Profit for the year 935 359 713 377
Adjustments for:
Straight-line lease adjustment (32 254) (22 518)
Interest received (23 750) (27 703)
Interest paid 154 829 82 098
Profit on disposal of investment property (11 786) (13 869)
Fair value adjustments to investment properties (242 179) (80 544)
Operating profit before changes in working capital 780 219 650 841
Trade and other receivables increased (23 200) (16 579)
Trade and other payables increased/(decreased) 6 102 (2 418)
Cash generated from operations 763 121 631 844
Interest received 23 750 27 703
Interest paid (154 829) (82 098)
Income distributions 11 (646 001) (589 424)
Cash outflows from operating activities (13 959) (11 975)
Cash effects from investing activities
Additions to investment properties (1 741 205) (870 730)
Proceeds from disposal of investment properties 47 749 112 388
Cash outflows from investing activities (1 693 456) (758 342)
Cash effects from financing activities
Interest-bearing liability raised 1 684 265 355 940
Interest-bearing liability paid – (532 000)
Issue of units – 1 000 000
Rights offer expenses – (13 141)
Cash inflows from financing activities 1 684 265 810 799
Net (decrease)/increase in cash and cash equivalents (23 150) 40 482
Cash and cash equivalents at 1 October 384 109 343 627
Cash and cash equivalents at 30 September 5 360 959 384 109

Fountainhead Property Trust | Integrated annual report 201248
Notes to the annual financial statementsfor the year ended 30 September 2012
1. Accounting policies
Fountainhead Property Trust (the Trust) is a Collective Investment Scheme in Property domiciled in South Africa. The financial statements were authorised for issue by the Directors of Fountainhead Property Trust Management Limited on 31 October 2012.
1.1 Statement of compliance The financial statements have been prepared in accordance with International Financial Reporting Standards (IFRS), the AC 500
series issued by the Accounting Practices Board, the requirements of the Collective Investment Schemes Control Act of South Africa, and the JSE Limited Listing Requirements.
1.2 Basis of preparation The financial statements are presented in Rands, rounded to nearest thousand, which is the Trust’s functional currency. They are
prepared on the historical cost basis, except for investment properties and certain financial instruments which are stated at fair value. Fair value adjustments (where applicable) do not affect the calculation of distributable earnings but do affect the net asset value per unit to the extent that adjustments are made to the carrying values of assets and liabilities.
The preparation of financial statements in conformity with IFRS requires management to make judgements, estimates and assumptions that affect the application of accounting policies and reported amounts of assets, liabilities, income and expenses. The estimates and underlying assumptions are based on historical experience and various other factors that are believed to be reasonable under the circumstances, the results of which form the basis of making judgements about the carrying values of assets and liabilities that are not apparent from other sources. Significant estimates are required in the determination of future cash flows, probabilities in assessing net recoverable amounts and fair value for disclosure purposes. Estimates and underlying assumptions are reviewed on an ongoing basis. Revisions to accounting estimates are recognised in the period in which the estimates are revised and in any future periods affected. Actual results may differ from these estimates.
The following standards were adopted for the 2012 financial year:
IAS 24 – Related Party Disclosure (revised)
IAS 24 (revised) adopted by the Trust for the first time for its reporting period ending 30 September 2012 was applied retrospectively.
IAS 24 (revised) addresses the disclosure requirements in respect of related parties, with the main change relating to the definition of a related party. No significant impact was noted.
IFRS 7 – Financial Instruments: Disclosure (amendments)
The amendment added an explicit statement that qualitative disclosures should be made in the context of the qualitative disclosures to better evaluate the Trust’s exposure to risk arising from financial instruments. There were no significant changes to these disclosures.
The annual financial statements have been prepared under the supervision of Aaron Suckerman (ACCA UK).
1.3 Investment properties Investment properties (including partially held investment properties) are properties which are held for the purpose of earning rental
income and/or for capital appreciation.
Properties are stated initially at cost on acquisition which comprises the purchase price and directly attributable expenditure. Property interests held under an operating lease are accounted for as investment property, using the fair value model. Subsequent expenditure relating to investment properties is capitalised when it is probable that future economic benefits associated with the item will flow to the Trust and when the cost can be reliably measured. All other subsequent expenditure is expensed in the period in which it is incurred.
Subsequent to initial recognition, investment properties are measured at their fair values. Fair value is determined annually by an independent valuer based on the open market value basis, using either the discounted cash flow method or the capitalisation of net income method. Gains or losses arising from changes in fair value are included in profit or loss for the period in which they arise. These gains or losses are transferred to the fair value reserve within equity as they are not available for distribution.
When the Trust begins to redevelop an existing investment property for continued use as an investment property, the property remains an investment property which is measured at fair value, and is not reclassified as property, plant and equipment during redevelopment.
Realised gains or losses on the disposal of investment properties are recognised in profit or loss for the year and are calculated as the difference between the net disposal proceeds and the sum of the carrying amount of the property and the straight-line lease accrual. The net gain or loss on the sale of investment properties is transferred to the capital reserve. The balance relating to the sold properties which was previously included in the fair value reserve is also transferred to the capital reserve.
Partially held investment properties are treated as jointly controlled assets as the co-owners jointly control the property.
Fountainhead Property Trust

Fountainhead Property Trust | Integrated annual report 201249
The following is therefore recognised in the annual financial statements: the undivided share of the jointly controlled assets, classified according to the nature of the assets; any liabilities incurred; the undivided share of any liabilities incurred jointly with the other co-owners in relation to the partially held investment property; any income from the sale or use of its undivided share of the output of the partially held investment property, together with its
share of any expenses incurred by the partially held investment property; and any expenses that it has incurred in respect of the interest held in the partially held investment property.
1.4 Impairment A financial asset not carried at fair value through profit or loss is assessed at each reporting date to determine whether there is
objective evidence that it is impaired. A financial asset is impaired if objective evidence indicates that a loss event has occurred after the initial recognition of the asset, and that the loss event has a negative effect on the estimated future cash flows of that asset that can be estimated reliably.
The Trust considers evidence of impairment for loans and receivables at both specific asset and collective levels. All individually significant receivables are assessed for specific impairment. All individually significant loans and receivables found not to be specifically impaired are then collectively assessed for any impairment that has been incurred but not yet identified. Loans and receivables that are not individually significant are collectively assessed for impairment by grouping together loans and receivables with similar risk characteristics.
An impairment loss in respect of a financial asset measured at amortised cost is calculated as the difference between its carrying amount and the present value of the estimated future cash flows discounted at the asset’s original effective interest rate. Losses are recognised in profit or loss and reflected in an allowance account against loans and receivables. Interest on the impaired asset continues to be recognised. When a subsequent event causes the amount of impairment loss to decrease, the decrease in impairment loss is reversed through profit or loss.
1.5 Financial instruments A financial instrument is recognised when the Trust becomes a party to the contractual provisions of the instrument. Financial assets
are derecognised when the Trust’s contractual rights to the cash flows from the financial assets expire or when the Trust transfers the financial asset to another party without retaining control or substantially all risks and rewards of the asset. The Trust derecognises a financial liability when its contractual obligations are discharged, cancelled or expire.
Measurement Financial instruments are initially measured at fair value, which includes transaction costs. Subsequent to the initial recognition, these
instruments are measured as set out below:
Trade and other receivables Trade and other receivables are carried at amortised cost, using the effective interest method after deducting accumulated
impairment losses. Trade and other receivables form part of the loans and receivables category.
Cash and cash equivalents Cash and cash equivalents comprise cash on hand, deposits held on call with banks, negotiable certificates of deposit and
surplus funds deposited in the Trust’s access bond facility, all of which are available for use by the Trust. Cash and cash equivalents are measured at amortised cost. Cash and cash equivalents form part of the loans and receivables category.
Trade and other payables and unitholders for distribution Trade and other payables and unitholders for distribution are carried at amortised cost, using the effective interest method.
Interest-bearing loans Interest-bearing borrowings are stated at amortised cost using the effective interest method, with any difference between cost
and redemption value being recognised in profit or loss over the period of the borrowings on an effective interest basis.
Set-off Financial assets and financial liabilities are offset and the net amount reported in the statement of financial position when the Trust
has a legally enforceable right to set off the recognised amounts and intends either to settle on a net basis or to realise the asset and settle the liability simultaneously.
1.6 Capital of the fund Units issued are classified as capital of the fund. Incremental costs directly attributable to the issue of units are recognised as a
deduction from capital of the fund.
1.7 Capital reserve All surpluses/deficits arising on the disposal of investment properties are transferred to the capital reserve and are not available for
distribution. The balance relating to the sold properties which was previously included in the fair value reserve is also transferred to the capital reserve.
Fountainhead Property Trust | Integrated annual report 201250
Notes to the annual financial statements (continued)for the year ended 30 September 2012
1.8 Fair value reserve All unrealised surpluses/deficits arising on the fair value measurement of investment properties are transferred to the fair value
reserve and are not available for distribution.
1.9 Revenue Rental income from investment properties comprises gross rental and is recognised in profit or loss on a straight-line basis over the
period of the term of the lease. Lease incentives granted and costs incurred, that are directly attributable to the lease, are recognised as an integral part of the total rental income.
1.10 Property operating expenses Property operating expenses include all expenses directly incurred in the daily operations of the investment property. It includes
property management fees, cleaning and security costs, repairs and maintenance, letting costs, rates charges, as well as utility costs incurred net of any recovery from tenants.
1.11 Interest income Interest income is recognised, as it accrues, in profit or loss using the effective interest method.
1.12 Interest expense Interest expense is recognised, as it accrues, in profit or loss using the effective interest method.
1.13 Borrowing costs Borrowing costs are capitalised to the extent that they are directly attributable to the acquisition, construction or production of
a qualifying asset. A qualifying asset is an asset that takes a substantial period of time to be ready for its intended use or sale. Capitalisation of borrowing costs commences when the activities to prepare the asset are in progress and expenditures and borrowing costs are being incurred. Capitalisation of borrowing costs continue until the asset is substantially ready for intended use. If the resulting carrying amount of the asset exceeds its recoverable amount, an impairment loss is recognised. The capitalisation rate is arrived at by reference to the actual rate payable on borrowings for development purposes or, with regard to that part of development cost financed out of general funds, the weighted average cost of borrowings.
1.14 Leases The Trust is party to numerous contracts as the lessor of property. All leases are operating leases where the significant risks and
rewards of ownership are that of the Trust. Operating lease rentals with fixed escalation clauses are recognised in profit or loss on a straight-line basis over the lease term.
1.15 Basic, headline and diluted earnings per unit The Trust presents basic earnings per unit calculated by dividing the profit or loss attributable to unitholders of the Trust by the
weighted average number of units outstanding during the period. Diluted earnings per unit are calculated on the same basis.
The Trust presents headline earnings per unit calculated by dividing the profit or loss attributable to unitholders less any fair value adjustments and capital profit or loss of the Trust, by the weighted average number of units outstanding during the period.
1.16 Segmental information The Trust consists of investment properties. The Trust earns revenue in the form of rentals from tenants of these investment properties.
The Trust is organised into five major business segments: Retail segment comprising mainly shopping centres; Office segment comprising mainly office parks and office buildings; Industrial segment comprising mainly industrial buildings such as warehouses and factories; Specialised segment comprising a hospital and a hotel; and Corporate segment comprising all assets and expenses not directly attributable to the other segments.
The basis of segment reporting is representative of the internal structure used for management reporting.
In addition, the geographical location of the properties has been identified as an important requirement for management reporting.
Segment results include revenue and property expenses that are directly attributable to a segment and the relevant portion of enterprise revenue and expenses that can be allocated on a reasonable basis to that segment, whether from external transactions or from transactions with other Trust segments.
Segment assets and liabilities comprise those operating assets and liabilities that are directly attributable to the segment or can be allocated to a segment on a reasonable basis. Segment assets are reported after deducting related allowances that are reported as direct offsets in the Trust’s statement of financial position.
Segment capital expenditure represents the total costs incurred during the period to acquire segment assets that are expected to be used during more than one period.
Fountainhead Property Trust
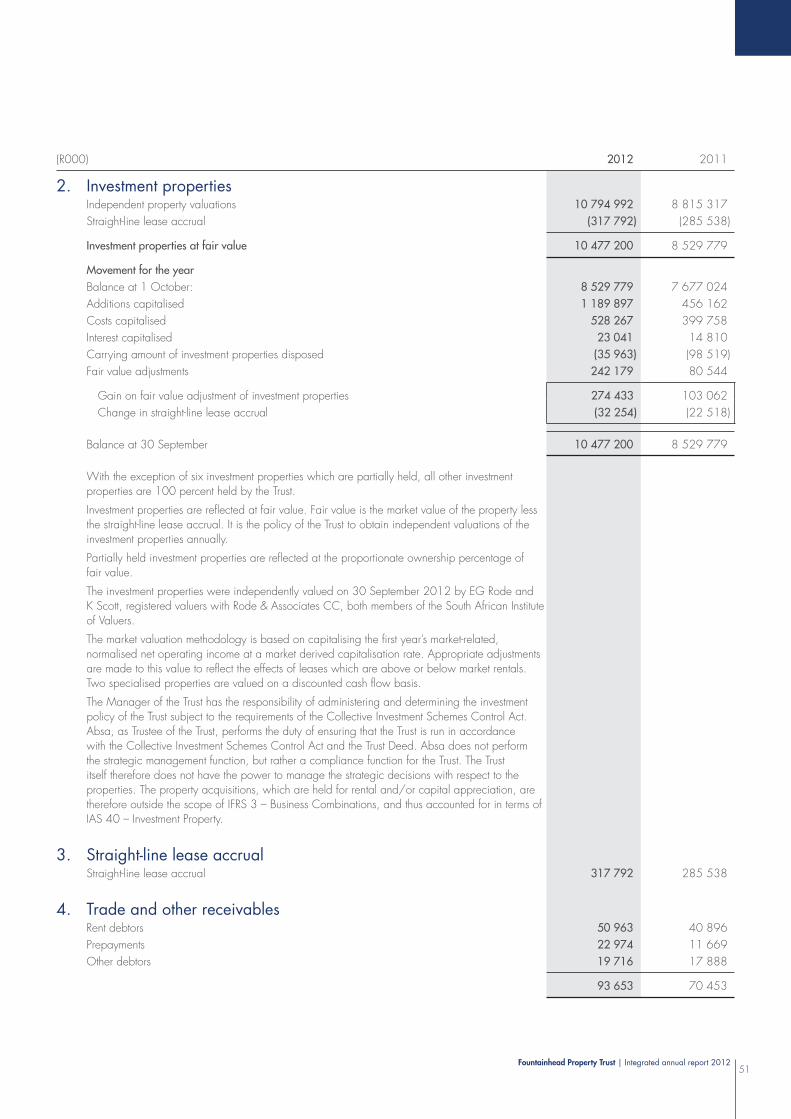
Fountainhead Property Trust | Integrated annual report 201251
(R000) 2012 2011
2. Investment propertiesIndependent property valuations 10 794 992 8 815 317
Straight-line lease accrual (317 792) (285 538)
Investment properties at fair value 10 477 200 8 529 779
Movement for the year
Balance at 1 October: 8 529 779 7 677 024
Additions capitalised 1 189 897 456 162
Costs capitalised 528 267 399 758
Interest capitalised 23 041 14 810
Carrying amount of investment properties disposed (35 963) (98 519)
Fair value adjustments 242 179 80 544
Gain on fair value adjustment of investment properties 274 433 103 062
Change in straight-line lease accrual (32 254) (22 518)
Balance at 30 September 10 477 200 8 529 779
With the exception of six investment properties which are partially held, all other investment properties are 100 percent held by the Trust.
Investment properties are reflected at fair value. Fair value is the market value of the property less the straight-line lease accrual. It is the policy of the Trust to obtain independent valuations of the investment properties annually.
Partially held investment properties are reflected at the proportionate ownership percentage of fair value.
The investment properties were independently valued on 30 September 2012 by EG Rode and K Scott, registered valuers with Rode & Associates CC, both members of the South African Institute of Valuers.
The market valuation methodology is based on capitalising the first year’s market-related, normalised net operating income at a market derived capitalisation rate. Appropriate adjustments are made to this value to reflect the effects of leases which are above or below market rentals. Two specialised properties are valued on a discounted cash flow basis.
The Manager of the Trust has the responsibility of administering and determining the investment policy of the Trust subject to the requirements of the Collective Investment Schemes Control Act. Absa, as Trustee of the Trust, performs the duty of ensuring that the Trust is run in accordance with the Collective Investment Schemes Control Act and the Trust Deed. Absa does not perform the strategic management function, but rather a compliance function for the Trust. The Trust itself therefore does not have the power to manage the strategic decisions with respect to the properties. The property acquisitions, which are held for rental and/or capital appreciation, are therefore outside the scope of IFRS 3 – Business Combinations, and thus accounted for in terms of IAS 40 – Investment Property.
3. Straight-line lease accrualStraight-line lease accrual 317 792 285 538
4. Trade and other receivablesRent debtors 50 963 40 896
Prepayments 22 974 11 669
Other debtors 19 716 17 888
93 653 70 453
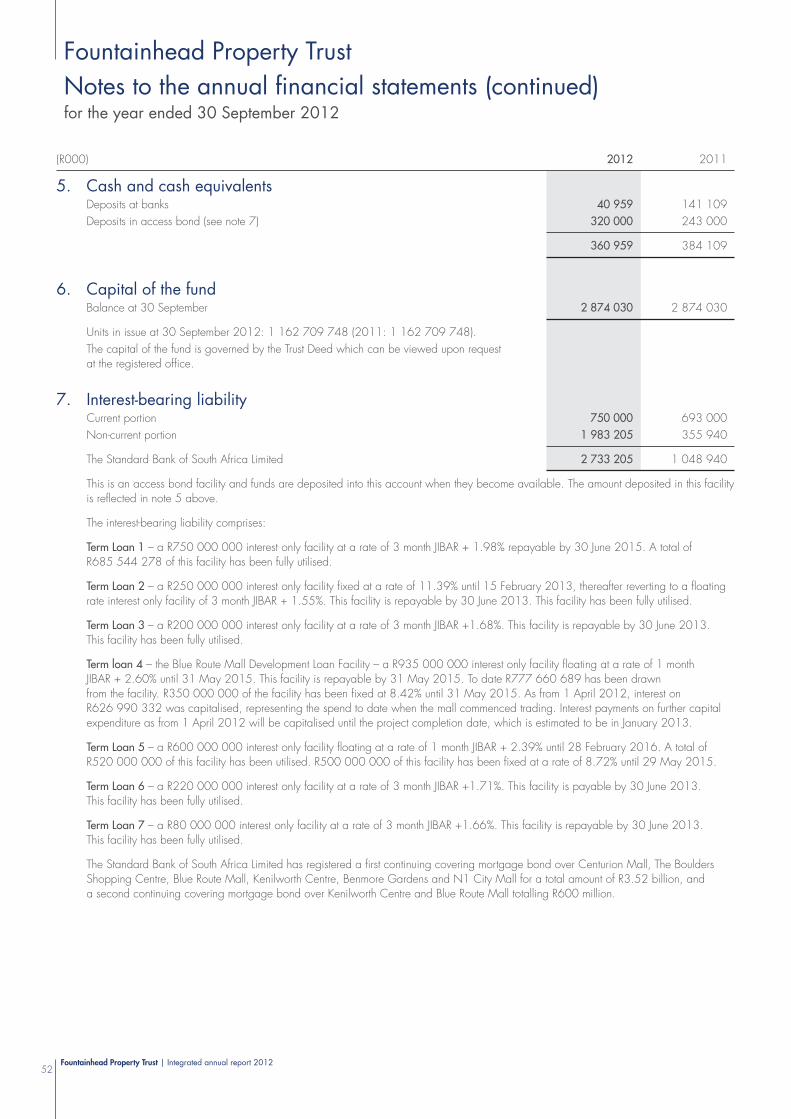
Fountainhead Property Trust | Integrated annual report 201252
Notes to the annual financial statements (continued)for the year ended 30 September 2012
(R000) 2012 2011
5. Cash and cash equivalentsDeposits at banks 40 959 141 109
Deposits in access bond (see note 7) 320 000 243 000
360 959 384 109
6. Capital of the fundBalance at 30 September 2 874 030 2 874 030
Units in issue at 30 September 2012: 1 162 709 748 (2011: 1 162 709 748).
The capital of the fund is governed by the Trust Deed which can be viewed upon request at the registered office.
7. Interest-bearing liabilityCurrent portion 750 000 693 000
Non-current portion 1 983 205 355 940
The Standard Bank of South Africa Limited 2 733 205 1 048 940
This is an access bond facility and funds are deposited into this account when they become available. The amount deposited in this facility is reflected in note 5 above.
The interest-bearing liability comprises:
Term Loan 1 – a R750 000 000 interest only facility at a rate of 3 month JIBAR + 1.98% repayable by 30 June 2015. A total of R685 544 278 of this facility has been fully utilised.
Term Loan 2 – a R250 000 000 interest only facility fixed at a rate of 11.39% until 15 February 2013, thereafter reverting to a floating rate interest only facility of 3 month JIBAR + 1.55%. This facility is repayable by 30 June 2013. This facility has been fully utilised.
Term Loan 3 – a R200 000 000 interest only facility at a rate of 3 month JIBAR +1.68%. This facility is repayable by 30 June 2013. This facility has been fully utilised.
Term loan 4 – the Blue Route Mall Development Loan Facility – a R935 000 000 interest only facility floating at a rate of 1 month JIBAR + 2.60% until 31 May 2015. This facility is repayable by 31 May 2015. To date R777 660 689 has been drawn from the facility. R350 000 000 of the facility has been fixed at 8.42% until 31 May 2015. As from 1 April 2012, interest on R626 990 332 was capitalised, representing the spend to date when the mall commenced trading. Interest payments on further capital expenditure as from 1 April 2012 will be capitalised until the project completion date, which is estimated to be in January 2013.
Term Loan 5 – a R600 000 000 interest only facility floating at a rate of 1 month JIBAR + 2.39% until 28 February 2016. A total of R520 000 000 of this facility has been utilised. R500 000 000 of this facility has been fixed at a rate of 8.72% until 29 May 2015.
Term Loan 6 – a R220 000 000 interest only facility at a rate of 3 month JIBAR +1.71%. This facility is payable by 30 June 2013. This facility has been fully utilised.
Term Loan 7 – a R80 000 000 interest only facility at a rate of 3 month JIBAR +1.66%. This facility is repayable by 30 June 2013. This facility has been fully utilised.
The Standard Bank of South Africa Limited has registered a first continuing covering mortgage bond over Centurion Mall, The Boulders Shopping Centre, Blue Route Mall, Kenilworth Centre, Benmore Gardens and N1 City Mall for a total amount of R3.52 billion, and a second continuing covering mortgage bond over Kenilworth Centre and Blue Route Mall totalling R600 million.
Fountainhead Property Trust

Fountainhead Property Trust | Integrated annual report 201253
(R000) 2012 2011
8. Income and expenditure8.1 Administrative expenses include:
Audit fees (internal and external audit) 1 701 1 471
Service fee paid to the Manager 53 513 40 442
The service fee is equal to 0.5 percent per annum of the Trust’s enterprise value. The enterprise value is the sum of the market capitalisation and the borrowings of the Trust. The market capitalisation is based on the average daily closing price of the units as quoted on the JSE.
8.2 Property operating expenses include:Property management fees 41 962 36 446
Repairs and maintenance 31 885 28 581
9. Profit on disposal of investment propertyProfit on disposal of investment property 11 786 13 869
The following investment properties were disposed of by the Trust during the year:
(R000)Carrying
value ProceedsProfit ondisposal
2012
Medsave House 2 446 2 446 –
Wierda Mews 10 980 17 950 6 970
4 Walter Place 22 537 27 353 4 816
35 963 47 749 11 786
2011
Northmead Mall 50 264 50 688 424
Human Rights House 28 661 38 500 9 839
22 Wellington Road 16 512 19 500 2 988
Zero Park 3 082 3 700 618
98 519 112 388 13 869
10. TaxationThe Trust is not liable for income tax or capital gains tax as the income and capital gains vest in the unitholders’ hands. The Trust therefore does not provide for current taxation or deferred taxation.
(R000) 2012 2011
11. Notes to the cash flow statementIncome distributions
Amounts unpaid at 1 October (320 443) (267 238)
Distributable income for the year (649 140) (642 629)
Amounts unpaid at 30 September 323 582 320 443
(646 001) (589 424)

Fountainhead Property Trust | Integrated annual report 201254
Notes to the annual financial statements (continued)for the year ended 30 September 2012
(R000) 2012 2011
12. Income distribution per unitIncome distribution per unit is calculated based on distributable earnings of R649.1 million for the year ended 30 September 2012 (2011: R642.6 million) and on units in issue of 1 162 709 748 (2011: 1 162 709 748).
Distribution income reconciliation
Profit for year 935 359 713 377
Straight-line lease adjustment (32 254) (22 518)
Profit on disposal of investment property (11 786) (13 869)
Fair value adjustments to investment properties (242 179) (80 544)
Rights offer prepaid distribution – 46 183
Distribution income 649 140 642 629
Income distribution
Interim distribution 325 558 276 003
Rights offer prepaid distribution – 46 183
Final distribution 323 582 320 443
649 140 642 629
13. Basic, diluted and headline earnings per unitBasic and diluted earnings per unit are calculated based on earnings of R935.4 million for the year ended 30 September 2012 (2011: R713.3 million) and on a weighted average number of units in issue of 1 162 709 748 (2011: 1 075 038 515).
Headline earnings per unit is calculated based on earnings of R681.4 million for the year ended 30 September 2012 (2011: R618.9 million) and on a weighted average number of units in issue of 1 162 709 748 (2011: 1 075 038 515).
Headline earnings reconciliation
Profit for the year 935 359 713 377
Profit on disposal of investment property (11 786) (13 869)
Fair value adjustments to investment properties (242 179) (80 544)
Headline earnings 681 394 618 964
14. Operating lease rentalsLeases as lessor:
The Trust leases out its investment property held under operating leases (see note 2).
Lease agreements vary in length and escalation rates. Some lease agreements allow the tenant the option to renew the lease once expired. In addition, certain leases have a turnover clause included, meaning that additional rentals may be received if the tenant’s turnover exceeds a certain agreed upon threshold.
As at 30 September, the Trust had contracted with tenants for the following future minimum lease rentals:
Within one year 971 955 741 917
In the second to fifth years inclusive 2 276 431 1 785 459
After five years 1 094 188 978 709
Total future minimum lease rentals 4 342 574 3 506 085
Fountainhead Property Trust

Fountainhead Property Trust | Integrated annual report 201255
15. Capital commitmentsAs at 30 September 2012 the capital contractual commitments were R251 million (2011: R1 903 million). Funds to meet these commitments can be provided by the Trust out of existing approved loan facilities.
16. Management companyThe management company, Fountainhead Property Trust Management Limited, is owned by Redefine Properties Limited effective from 1 August 2012. Prior to this the management company was equally owned by Standard Bank Properties Limited and Liberty Group Limited.
17. Borrowing powersIn terms of its Trust Deed, the Trust may borrow up to 40 percent (2011: 40 percent) of the value of the underlying assets comprising the portfolio, effectively the value of the investment properties.
The borrowings of the Trust at 30 September 2012 were R2 733 million (2011: R1 049 million) which is 25 percent (2011: 12 percent) of the value of the property portfolio.
18. Contingent liabilitiesGuarantees
The Trust has provided bank guarantees in lieu of deposits for municipal services and electricity to the value of R6.52 million (2011: R5.02 million).
(R000) 2012 2011
19. Financial risk managementThe Trust’s financial instruments consist mainly of deposits with banks, loans from banks, trade and other receivables and trade and other payables. In respect of all financial instruments listed above, carrying value approximates fair value.
Exposure to interest rate, credit and liquidity risk arises in the normal course of business.
Credit risk
Credit risk refers to the risk that a counterparty will default on its contractual obligations resulting in a financial loss to the Trust. The Trust’s financial assets that are subject to credit risk are cash resources and trade and other receivables.
The carrying amount of financial assets represents the maximum credit exposure. The maximum exposure to credit risk at the reporting date was:
Trade and other receivables 70 679 70 453
Cash and cash equivalents 360 959 384 109
431 638 454 562
Credit risk attached to the Trust’s cash resources is minimised by using reputable financial institutions.
The exposure to credit risk is mainly in respect of tenants and is influenced by the individual characteristics of each tenant. The widespread
tenant base with no single major counterparty reduces credit risk. Geographically, credit risk is concentrated within the regions where the
Trust operates, being Gauteng, Western Cape and KwaZulu-Natal. Management has established a credit policy under which each new
tenant is analysed individually for creditworthiness before the standard payment terms and conditions are offered which include, in the
majority of cases, the provision of a deposit of at least one month’s rental. When available, the credit review includes external ratings.
Impairment losses have been recorded for those debts whose recovery was not reasonably assured at year-end. The Trust establishes an
allowance for impairment that represents its estimate of incurred losses in respect of trade and other receivables. The main components of
this allowance are specific loss component that relates to individually significant exposures. The credit quality of trade and other receivables
that are current and not impaired is deemed adequate.

Fountainhead Property Trust | Integrated annual report 201256
Notes to the annual financial statements (continued)for the year ended 30 September 2012
(R000) 2012 2011
19. Financial risk management (continued)Rental and utilities receivable
The ageing of rental and utilities receivable at reporting date was:
Current* 50 356 42 267
Past due 0 – 30 days 2 203 1 056
Past due 31 – 120 days 2 107 1 536
Past due 120+ days 997 1 307
Total 55 663 46 166
* Included in current are September rentals of R6.2 million (2011: R3.0 million).
The movement in allowance for credit losses was as follows:
Balance at 1 October (5 270) (6 487)
Impairment loss recognised (2 106) (2 124)
Amounts written off as uncollectable 2 676 3 341
Balance at 30 September (4 700) (5 270)
The ageing of the doubtful debt as follows:
Current (1 850) (2 021)
Past due 0 – 30 days (874) (898)
Past due 31 – 120 days (1 759) (1 316)
Past due 120+ days (217) (1 035)
Total (4 700) (5 270)
A total of R9.8 million is held as collateral against outstanding rental and utilities in the form of cash deposits and bank guarantees.
Liquidity risk
Liquidity risk is the risk that the Trust will not be able to meet its financial obligations as they fall due. Cash flows are monitored on a weekly basis to ensure that cash resources are adequate to meet funding requirements.
Currently the Trust’s current liabilities exceed current assets as R750 million of borrowings has been classified as short term due to it being payable within the next 12 months. This is a temporary situation as new facilities will be negotiated with the bank. Based on preliminary discussions with the bank, the risk of new facilities not being granted is minimal due to the low gearing of the Trust.
The following table details the Trust’s contractual maturities of financial liabilities, excluding interest payments. The table has been prepared based on undiscounted cash flows of financial liabilities based on the earliest date that the Trust may be required to pay.
Between 0 – 2 months
– Unitholders for distribution 323 582 320 443
– Trade and other payables (excluding VAT payable) 124 736 123 783
– Interest-bearing liability 750 000 693 000
Between 1 and 5 years
– Interest-bearing liability 1 983 205 355 940
3 181 523 1 493 166
Fountainhead Property Trust

Fountainhead Property Trust | Integrated annual report 201257
(R000) 2012 2011
19. Financial risk management (continued)Interest rate risk
Interest rate movements impact on the net cost of the Trust’s short-term cash investments and interest-bearing borrowings.
The risk is managed by the Trust by maintaining an appropriate mix between fixed and floating rate borrowings, and investing surplus cash at negotiated rates.
At reporting date, the interest rate profile of the Trust’s interest-bearing financial instruments was as follows:
Fixed rate instruments
– Interest-bearing liabilities 1 100 000 800 000
Variable rate instruments
– Cash and cash equivalents 360 959 384 109
– Interest-bearing liabilities 1 633 205 248 940
Interest rate sensitivity analysis
The sensitivity analysis is based on the exposure to interest rates at reporting date. For floating rate liabilities, the analysis assumes that the amount of liability outstanding at the reporting date was outstanding for the whole year.
For floating rate assets, the analysis assumes that the asset existing at the reporting date existed for the whole year.
A 50 basis point increase or decrease is used when reporting interest rate internally to key management personnel and represents management’s reasonable assessment of the possible change in interest rates.
For floating rate liabilities, if interest rates were 50 basis points higher/lower and all other variables were constant, the Trust net profit for the year ended 30 September 2012 would decrease/increase by R7 412 673 (2011: decrease/increase by R1 239 998).
For floating rate assets, if interest rates were 50 basis points higher/lower and all other variables were constant, the Trust net profit for the year ended 30 September 2012 would increase/decrease by R1 731 420 (2011: increase/decrease by R1 889 650).
The analysis was performed on the same basis in 2011.
The Trust does not account for any fixed rate financial liabilities at fair value through profit or loss. Therefore a change in interest income at reporting date would not affect profit or loss.
Capital management
The capital structure of the Trust is governed by the Trust Deed. The allowed borrowing capacity is 40% (2011: 40%) of the value of the underlying asset comprising the property portfolio.
Value of property portfolio 10 794 992 8 815 317
40% thereof 4 317 997 3 526 127
Total borrowings (2 733 205) (1 048 940)
Capital commitments – (1 903 000)
Unutilised borrowing capacity 1 584 792 574 187

Fountainhead Property Trust | Integrated annual report 201258
Notes to the annual financial statements (continued)for the year ended 30 September 2012
(R000) 2012 2011
20. Related partiesAll transactions with related parties were concluded on an arm’s length basis.
Related parties with whom the Trust transacted during the year:
Fountainhead Property Trust Management Limited
Relationship: Manager of the Trust in terms of the Collective Investment Schemes Control Act
Related party transactions for the year:
– Distributions on 291 720 units in the trust 163 161
– Service fee paid to Fountainhead Property Trust Management Limited 53 513 40 442
– Service fee payable to Fountainhead Property Trust Management Limited (5 770) (4 161)
– Proceeds from rights offer – (252)
FHP Managers Proprietary Limited
Relationship: Fellow subsidiary of the managers shareholder, Standard Bank Properties Proprietary Limited
Related party transaction for the year:
– Purchase of Constantia Kloof 3 property – 204 000
The Standard Bank of South Africa Limited (period related: 1 October 2011 – 31 July 2012)
Standard Bank Properties ceased to be a related party effective 1 August 2012 after the Company disposed of its interest in Fountainhead Property Trust Management Limited to Redefine Properties Limited
Relationship: Fellow subsidiary of the Manager’s shareholder, Standard Bank Properties Proprietary Limited
Related party transactions:
– Loan (refer to note 7) – (1 048 940)
– Interest on loan 129 024 82 098
– Interest income (19 792) (26 232)
– Bank charges 398 305
– Gross rent received (27 521) (22 126)
– Sponsor fee 50 120
– Corporate advisor fee for rights offer – 2 462
– Commitment fee paid for rights offer – 547
– Proceeds from rights offer – (36 456)
Absa Bank Limited
Relationship: Trustee of Fountainhead Property Trust
Related party transactions for the year:
– Interest income 12 (10)
– Bank charges 38 44
– Trustee fees 552 552
– Gross rent received (11 711) (12 141)
WM Kirchmann
Relationship: Director of the manager
Related party transaction for the year:
– Proceeds from rights offer – (108)
S Shaw-Taylor
Relationship: Director of the manager
Related party transaction for the year:
– Proceeds from rights offer – (96)
D Savage
Relationship: Director of the manager
Related party transaction for the year:
– Management fees paid 6 446 –
– Development fees paid 714 –
Redefine Properties Limited – (period related: 1 August 2012 – 30 September 2012)
Relationship: Sole shareholder of the manager of Fountainhead Property Trust Management Limited
– Services fees paid 10 176 –
Fountainhead Property Trust

Fountainhead Property Trust | Integrated annual report 201259
21. New accounting statements and interpretations issued and not yet effectiveThere are new or revised Accounting Standards and Interpretations in issue that are not yet effective. These include the following Standards and Interpretations that are applicable to the Trust and will have an impact on future financial statements. These will be adopted in the period that they become mandatory, unless otherwise indicated. The impact on the financial statements has not yet been determined.
IAS 1 – Presentation of Financial Statements (amendments)
The Trust will present those items of other comprehensive income that may be reclassified to profit or loss in the future separately from those that would never be reclassified to profit or loss. The related tax effects for the two sub-categories will be shown separately. This is a change in presentation and will have no impact on the recognition or measurement of items in the financial statements. This amendment will be applied retrospectively and the comparative information will be restated. The standard will be adopted for the first time for the 30 September 2013 financial year-end.
IFRS 13 – Fair Value Measurement
The standard will be applied prospectively and comparatives will not be restated. IFRS 13 introduces a single source of guidance on fair value measurement for both financial and non-financial assets and liabilities by defining fair value, establishing a framework for measuring fair value and setting out disclosure requirements for fair value measurements. The standard will be adopted for the first time for the 30 September 2014 financial year-end.
IFRS 7 – Financial Instruments: Disclosures (amendments)
The amendments contain new disclosure requirements for financial assets and financial liabilities that are offset in the statement of financial position or are subject to enforceable master netting arrangements or similar agreements. The standard will be adopted for the first time for the 30 September 2014 financial year-end.
IAS 32 – Financial Instruments: Presentation (amendments)
The amendments clarify that an entity currently has a legally enforceable right to set-off if that right is not contingent on a future event and enforceable both in the normal course of business and in the event of default, insolvency or bankruptcy of the entity and all counterparties. The standard will be adopted for the first time for the 30 September 2016 financial year-end.
IFRS 9 – Financial Instruments
IFRS 9 addresses the initial measurement and classification of financial assets and financial liabilities and will replace the relevant sections of IAS 39. Under IFRS 9 there are two options in respect of classification of financial assets, namely, financial assets measured at amortised cost or at fair value. Financial assets are measured at amortised cost when the business model is to hold assets in order to collect contractual cash flows and when they give rise to cash flows that are solely payments of principal and interest on the principal outstanding. All other financial assets are measured at fair value. Embedded derivatives are no longer separated from hybrid contracts that have a financial asset host. The standard will be applied retrospectively, subject to transitional provisions. The standard will be adopted for the first time for the 30 September 2016 financial year-end.
22. Significant mattersProposal to acquire the assets of the Trust
On 28 September 2012, a proposal to acquire all of the asset of the Trust’s other than Orion Place, Gail Industrial Park and Precision House for a purchase consideration that will result in unitholders receiving 3 Hyprop units and 62.5 Redefine units for every 100 Fountainhead units, was made to the Board. The Board has constituted an independent sub-committee which, together with its advisors, will consider the proposal.
Changes to Trustee
During November 2011, Absa Bank Limited (Absa) issued a notice of the intention to resign as Trustee under the Collective Investment Schemes Control Act. The extension of the notice period expires on 16 November 2012. FirstRand Bank Limited has been appointed to replace Absa as Trustee. The appointment is subject to approval by the Financial Services Board (FSB).
23. Events after reporting periodDisposal of asset
The Trust sold one of its office properties, Essex Park, for a net selling price of R30,2 million. Registration of transfer took place subsequent to year end.
Proposal to acquire the assets of the Trust
On 23 October 2012, the Directors of Fountainhead Property Trust Management Limited received a proposal from Growthpoint Properties Limited to acquire all of the assets of the Trust in return for a combination of cash and Growthpoint units. The proposal has been submitted to the independent sub-committee of the Board for consideration.

Fountainhead Property Trust | Integrated annual report 201260
Notes to the annual financial statements (continued)for the year ended 30 September 2012
(R000) Retail Office Industrial Specialised Corporate Total
24. Segmental information24.1 Business segment
2012Segment revenueContractual rental income 735 002 186 068 87 686 33 461 – 1 042 217Straight-line rental adjustment 3 234 27 624 (550) 1 946 – 32 254
Total revenue 738 236 213 692 87 136 35 407 – 1 074 471
Segment resultOperating profit/(loss) 584 609 182 970 68 981 35 151 (59 238) 812 473Interest received 1 149 279 131 3 22 188 23 750Interest paid – – – – (154 829) (154 829)Profit on disposal of investment property – 6 970 4 816 – – 11 786Fair value adjustments to investment properties 220 998 (7 382) (10 090) 38 653 – 242 179
806 756 182 837 63 838 73 807 (191 879) 935 359
Other informationReportable segment assetsProperty assets 8 226 310 1 680 034 540 732 347 916 – 10 794 992Trade and other receivables 76 727 9 577 5 776 – 1 573 93 653Cash and cash equivalents 21 961 1 923 – – 337 075 360 959
Total assets 8 324 998 1 691 534 546 508 347 916 338 648 11 249 604
Reportable segment liabilitiesInterest-bearing liabilities – – – – 2 733 205 2 733 205Trade and other payables 65 969 21 945 12 381 429 29 160 129 884Unitholders for distribution – – – – 323 582 323 582
Total liabilities 65 969 21 945 12 381 429 3 085 947 3 186 671
Capital expenditure 1 654 101 81 861 5 243 – – 1 741 205
Business segmentSegment revenue2011Contractual rental income 620 816 142 788 85 187 30 954 – 879 745Straight-line rental adjustment 6 246 13 978 (1 418) 3 712 – 22 518
Total revenue 627 062 156 766 83 769 34 666 – 902 263
Segment resultOperating profit/(loss) 487 202 130 228 66 374 34 408 (44 853) 673 359Interest received 1 079 223 239 – 26 162 27 703Interest paid – – – – (82 098) (82 098)Profit on disposal of investment properties 424 12 827 618 – – 13 869Fair value adjustments to investment properties 98 025 (17 752) (15 310) 15 581 – 80 544
586 730 125 526 51 921 49 989 (100 789) 713 377
Other informationReportable segment assetsProperty assets 6 347 978 1 588 910 571 112 307 317 – 8 815 317Trade and other receivables 49 685 8 552 6 542 – 5 674 70 453Cash and cash equivalents 3 667 – – – 380 442 384 109
Total assets 6 401 330 1 597 462 577 654 307 317 386 116 9 269 879
Reportable segment liabilitiesInterest-bearing liabilities – – – – 1 048 940 1 048 940Trade and other payables 56 479 25 446 15 819 398 25 641 123 783Unitholders for distribution – – – – 320 443 320 443
Total liabilities 56 479 25 446 15 819 398 1 395 024 1 493 166
Capital expenditure 410 319 459 983 428 – – 870 730
Fountainhead Property Trust
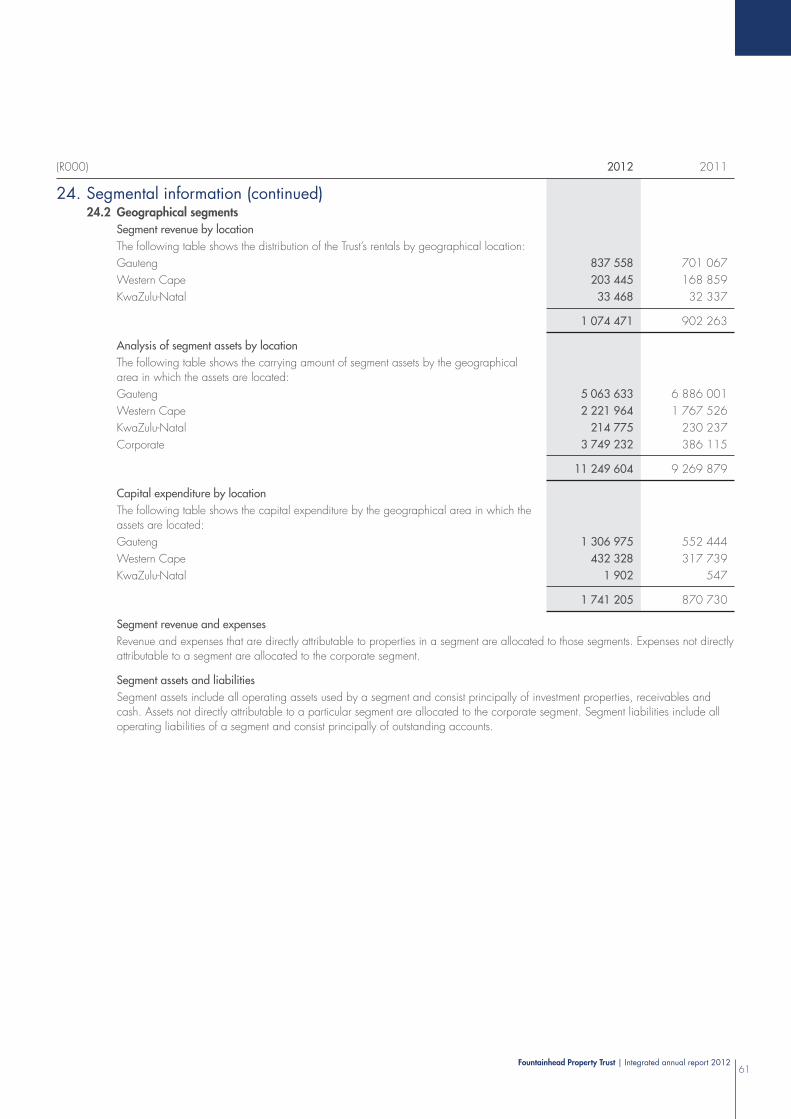
Fountainhead Property Trust | Integrated annual report 201261
(R000) 2012 2011
24. Segmental information (continued)24.2 Geographical segments
Segment revenue by location
The following table shows the distribution of the Trust’s rentals by geographical location:
Gauteng 837 558 701 067
Western Cape 203 445 168 859
KwaZulu-Natal 33 468 32 337
1 074 471 902 263
Analysis of segment assets by location
The following table shows the carrying amount of segment assets by the geographical area in which the assets are located:
Gauteng 5 063 633 6 886 001
Western Cape 2 221 964 1 767 526
KwaZulu-Natal 214 775 230 237
Corporate 3 749 232 386 115
11 249 604 9 269 879
Capital expenditure by location
The following table shows the capital expenditure by the geographical area in which the assets are located:
Gauteng 1 306 975 552 444
Western Cape 432 328 317 739
KwaZulu-Natal 1 902 547
1 741 205 870 730
Segment revenue and expenses
Revenue and expenses that are directly attributable to properties in a segment are allocated to those segments. Expenses not directly attributable to a segment are allocated to the corporate segment.
Segment assets and liabilities
Segment assets include all operating assets used by a segment and consist principally of investment properties, receivables and cash. Assets not directly attributable to a particular segment are allocated to the corporate segment. Segment liabilities include all operating liabilities of a segment and consist principally of outstanding accounts.

Fountainhead Property Trust | Integrated annual report 201262
Unaudited supplementary property portfolio informationfor the year ended 30 September 2012
2012 2011
1. Geographical profile – market valueGreater Johannesburg 45% 50%
Cape Town 19% 19%
Tshwane 33% 28%
Durban 3% 3%
2. Geographical profile – contractual rentalGreater Johannesburg 50% 55%
Cape Town 19% 19%
Tshwane 28% 23%
Durban 3% 3%
3. Sectoral profile – market valueRetail 76% 72%
Office 16% 18%
Industrial 5% 6%
Specialised 3% 4%
4. Sectoral profile – contractual rentalRetail 70% 70%
Office 18% 16%
Industrial 9% 10%
Specialised 3% 4%
5. Tenant profileLarge listed companies, SA Government and parastatals and large multi-national companies 56% 54%
Other listed companies, franchises of listed companies and other large companies 17% 15%
Other 27% 31%
6. Vacancy profile by sector by rental areaRetail 6,5% 7,0%
Office 7,1% 10,2%
Industrial 8,0% 7,3%
Specialised – –
Let 93,3% 92,6
7. Lease expiry profile by contractual rentalVacancy
2013 22% 21%
2014 20% 18%
2015 19% 19%
2016 9% 12%
2017 12% 9%
>2017 18% 21%
2012 2011
Fountainhead Property Trust

Fountainhead Property Trust | Integrated annual report 201263
2012 2011
8. Lease expiry profile by areaVacancy 6% 7%
2013 25% 24%
2014 14% 16%
2015 18% 14%
2016 7% 12%
2017 9% 7%
>2017 21% 20%
9. Weighted average rental per square metre by rentable areaRetail 141 133
Office 115 109
Industrial 47 45
Specialised 109 100
10. Weighted average escalation profile by sector by rentable areaRetail 8,3% 8,6%
Office 8,2% 8,6%
Industrial 8,1% 9,3%
Specialised 8,9% 7,9%
11. Average annualised property portfolio yield 7,79% 7,91%

64Fountainhead Property Trust Management Limited | Integrated annual report 2012
Statement of financial positionas at 30 September 2012
Statement of comprehensive incomefor the year ended 30 September 2012
(R000) Notes 2012 2011
ASSETSNon-current assetsInvestment in Fountainhead Property Trust 2 2 360 1 955
Current assets 8 161 7 278
Trade and other receivables 3 5 923 4 293Cash and cash equivalents 4 2 238 2 985
Total assets 10 521 9 233
EQUITY AND LIABILITIESEquity 5 656 5 613
Share capital 5 1 000 1 000Revaluation reserve 1 310 1 035Retained earnings 3 346 3 578
Non-current liabilitiesDeferred taxation 8 299 168
Current liabilities 4 566 3 452
Trade and other payables 6 4 560 3 442Taxation payable 6 10
Total equity and liabilities 10 521 9 233
(R000) Notes 2012 2011
Revenue 53 894 40 784
Service fee 53 513 40 442Interest received 219 194Distributions received 162 148
Expenditure 43 252 33 105
Administration expenses 790 571Audit fees 132 118Directors’ fees 7 854 854Management and administration fees 9 41 476 31 562
Profit before taxation 10 642 7 679Taxation 8 3 474 2 549
South African normal tax 2 974 2 149Secondary Tax on Companies 500 400
Profit for the year 7 168 5 130
Other comprehensive incomeFair value adjustment on investment in Trust 405 (26)Income tax on other comprehensive income (130) 4
Total comprehensive income for the year 7 443 5 108
Fountainhead Property Trust Management Limited
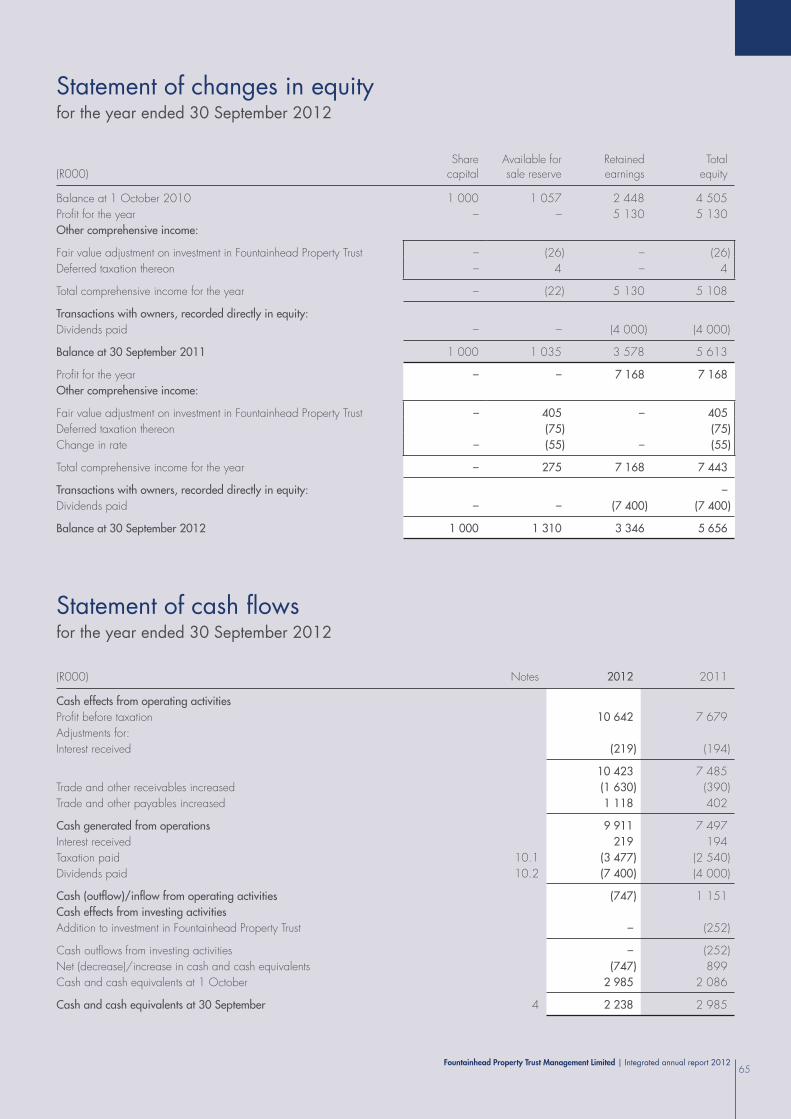
Fountainhead Property Trust Management Limited | Integrated annual report 201265
Statement of changes in equityfor the year ended 30 September 2012
Statement of cash flowsfor the year ended 30 September 2012
(R000) Notes 2012 2011
Cash effects from operating activities
Profit before taxation 10 642 7 679
Adjustments for:
Interest received (219) (194)
10 423 7 485
Trade and other receivables increased (1 630) (390)
Trade and other payables increased 1 118 402
Cash generated from operations 9 911 7 497
Interest received 219 194
Taxation paid 10.1 (3 477) (2 540)
Dividends paid 10.2 (7 400) (4 000)
Cash (outflow)/inflow from operating activities (747) 1 151
Cash effects from investing activities
Addition to investment in Fountainhead Property Trust – (252)
Cash outflows from investing activities – (252)
Net (decrease)/increase in cash and cash equivalents (747) 899
Cash and cash equivalents at 1 October 2 985 2 086
Cash and cash equivalents at 30 September 4 2 238 2 985
(R000)Share
capitalAvailable forsale reserve
Retainedearnings
Total equity
Balance at 1 October 2010 1 000 1 057 2 448 4 505
Profit for the year – – 5 130 5 130
Other comprehensive income:
Fair value adjustment on investment in Fountainhead Property Trust – (26) – (26)
Deferred taxation thereon – 4 – 4
Total comprehensive income for the year – (22) 5 130 5 108
Transactions with owners, recorded directly in equity:
Dividends paid – – (4 000) (4 000)
Balance at 30 September 2011 1 000 1 035 3 578 5 613
Profit for the year – – 7 168 7 168
Other comprehensive income:
Fair value adjustment on investment in Fountainhead Property Trust – 405 – 405
Deferred taxation thereon (75) (75)
Change in rate – (55) – (55)
Total comprehensive income for the year – 275 7 168 7 443
Transactions with owners, recorded directly in equity: –
Dividends paid – – (7 400) (7 400)
Balance at 30 September 2012 1 000 1 310 3 346 5 656

Fountainhead Property Trust Management Limited | Integrated annual report 201266
Notes to the annual financial statementsfor the year ended 30 September 2012
1. Accounting policies Fountainhead Property Trust Management Limited (the Company) administers Fountainhead Property Trust (the Trust) in accordance with the
provisions of the Collective Investment Schemes Control Act of South Africa. There has been no change in the nature of the business of the Company during the period under review. The financial statements were authorised for issue by the directors on 31 October 2012.
1.1 Statement of compliance These financial statements have been prepared in accordance with International Financial Reporting Standards (IFRS) and the
requirements of the Companies Act, 2008 (amended), and the Companies Regulations, 2011.
1.2 Basis of preparation The financial statements are presented in Rands, rounded to the nearest thousand, which is the Company’s functional currency.
They are prepared on the historical cost basis, except for certain financial instruments which are stated at fair value.
The preparation of financial statements in conformity with IFRS requires management to make judgements, estimates and assumptions that affect the application of accounting policies and reported amounts of assets, liabilities, income and expenses. The estimates and underlying assumptions are based on historical experience and various other factors that are believed to be reasonable under the circumstances, the results of which form the basis of making judgements about the carrying values of assets and liabilities that are not apparent from other sources. Significant estimates are required in the determination of future cash flows, probabilities in assessing net recoverable amounts and fair value for disclosure purposes. Estimates and underlying assumptions are reviewed on an ongoing basis. Revisions to accounting estimates are recognised in the period in which the estimates are revised and in any future periods affected. Actual results may differ from these estimates.
The following standards were adopted for the 2012 financial year:
IAS 24 – Related Party Disclosure (revised)
IAS 24 (revised) was adopted by the Company for the first time for its reporting period ending 30 September 2012 and was applied retrospectively.
IAS 24 (revised) addresses the disclosure requirements in respect of related parties, with the main change relating to the definition of a related party. No significant impact was noted.
IFRS 7 – Financial Instruments: Disclosure (amendments)
The amendment added an explicit statement that qualitative disclosures should be made in the context of the qualitative disclosures to better evaluate the Company’s exposure to risk arising from financial instruments. There were no significant changes to these disclosures.
The annual financial statements have been prepared under the supervision of Aaron Suckerman (ACCA UK).
1.3 Revenue Revenue comprises service fees, interest income and distributions received.
1.4 Service fees Service fees represent management fees received for the asset management of the Trust, and are recognised on an accrual basis.
1.5 Distributions received Distributions on investments are recognised in profit or loss where the distribution date falls within the reporting period.
1.6 Interest income Interest income is recognised on an accrual basis, using the effective interest method.
1.7 Taxation Income tax expense comprises current and deferred tax. Current tax and deferred tax are recognised in profit or loss except to
the extent that it relates to a business combination or items recognised directly in equity or in other comprehensive income.
Current tax is the expected tax payable or receivable on the taxable income or loss for the year, using tax rates enacted or substantively enacted at the reporting date, and any adjustment to tax payable in respect of previous years.
Deferred tax is recognised in respect of temporary differences between the carrying amounts of assets and liabilities for financial reporting purposes and the amounts used for taxation purposes. Deferred tax is not recognised for the following temporary differences: the initial recognition of assets or liabilities in a transaction that is not a business combination and that affects neither accounting nor taxable profit or loss, and differences relating to investments in subsidiaries and jointly controlled entities to the extent that it is probable that they will not reverse in the foreseeable future. In addition, deferred tax is not recognised for taxable temporary differences arising on the initial recognition of goodwill. Deferred tax is measured at the tax rates that are expected to be applied to temporary differences when they reverse, based on the laws that have been enacted or substantively enacted by the reporting date. Deferred tax assets and liabilities are off set if there is a legally enforceable right to off set current tax liabilities and assets, and they relate to income taxes levied by the same tax authority on the same taxable entity, or on different tax entities, but they intend to settle current tax liabilities and assets on a net basis or their tax assets and liabilities will be realised simultaneously.
Fountainhead Property Trust Management Limited

Fountainhead Property Trust Management Limited | Integrated annual report 201267
A deferred tax asset is recognised for unused tax losses, tax credits and deductible temporary differences, to the extent that it is probable that future taxable profits will be available against which they can be utilised. Deferred tax assets are reviewed at each reporting date and are reduced to the extent that it is no longer probable that the related tax benefit will be realised.
Secondary Tax on Companies and Dividends Tax Secondary Tax on Companies (STC) is imposed at a rate of 10% of the net amount of dividends declared by resident companies.
STC was replaced by a dividends tax with effect from 1 April 2012. Dividends Tax is a tax imposed on shareholders at a rate of 15% on receipt of dividends.
The dividends tax is categorised as a withholding tax as the tax is withheld and paid to the South African Revenue Services (SARS) by the Company paying the dividend or by a regulated intermediary (i.e. a withholding agent interposed between the company paying the dividend and the beneficial owner), and not by the person liable for the tax.
Dividend tax that arises from the distribution of dividends is recognised at the same time as the liability to pay the related dividend.
1.8 Share capital Ordinary shares are classified as equity. Incremental costs directly attributable to the issue of ordinary shares are recognised as a
deduction from equity, net of any tax effects.
1.9 Available-for-sale reserve All unrealised gains/losses arising on the revaluation of the investment in the Trust to fair value are recognised in other
comprehensive income in the available-for-sale reserve, and recycled through profit or loss on sale or impairment.
1.10 Investment in the Trust The investment is stated at fair value (note 2) and is classified as an available-for-sale financial asset. Any gains or losses arising
from a change in fair value is included directly in other comprehensive income for the year in which it arises.
1.11 Financial instruments A financial instrument is recognised when the Company becomes a party to the contractual provisions of the instrument. Financial
assets are derecognised when the Company’s contractual rights to the cash flows from the financial assets expire or when the Company transfers the financial asset to another party without retaining control or substantially all risks and rewards of the asset. The Company derecognises a financial liability when its contractual obligations are discharged, cancelled or expire.
Measurement Financial instruments are initially measured at fair value, including directly attributable transaction costs. Subsequent to the initial
recognition these instruments are measured as set out below: Trade and other receivables Trade and other receivables are carried at amortised cost, using the effective interest method, after deducting accumulated
impairment losses. Trade and other receivables form part of the loans and receivables category.
Cash and cash equivalents Cash and cash equivalents comprise cash on hand, deposits held on call with banks and negotiable certificates of deposit.
Cash and cash equivalents are measured at amortised cost. Cash and cash equivalents form part of the loans and receivables category.
Other investments in debt and equity The Company classifies its investments in debt and equity securities into the available-for-sale category.
Changes in fair value on subsequent measurement of financial assets classified as: available-for sale are recognised in other comprehensive income and presented within equity in the revaluation reserve, other
than changes related to impairment losses, which are recognised in profit or loss.
Trade and other payables Trade and other payables are carried at amortised cost, using the effective interest method.
Set-off Financial assets and financial liabilities are offset and the net amount reported in the statement of financial position when the Trust
has a legally enforceable right to set off the recognised amounts, and intends to settle on a net basis or to realise the asset and settle the liability simultaneously.
1.12 Impairment A financial asset not carried at fair value through profit or loss is assessed at each reporting date to determine whether there is
objective evidence that it is impaired. A financial asset is impaired if objective evidence indicates that a loss event has occurred after the initial recognition of the asset, and that the loss event has a negative effect on the estimated future cash flows of that asset that can be estimated reliably.

Fountainhead Property Trust Management Limited | Integrated annual report 201268
Notes to the annual financial statements (continued)for the year ended 30 September 2012
The Company considers evidence of impairment for loans and receivables at both specific asset and collective levels. All individually significant receivables are assessed for specific impairment. All individually significant loans and receivables found not to be specifically impaired are then collectively assessed for any impairment that has been incurred, but not yet identified. Loans and receivables that are not individually significant are collectively assessed for impairment by grouping together loans and receivables with similar risk characteristics.
Individually significant financial assets are tested for impairment on an individual basis. The carrying amount of the impaired financial asset is reduced through the use of an allowance account, and the amount of the loss is recognised in profit or loss.
When a receivable is uncollectible, it is written off against the allowance account for receivables. Subsequent recoveries of amounts written off are credited to profit or loss. An impairment loss is reversed if the reversal can be related objectively to an event occurring after the impairment loss was recognised.
In the case of an available-for-sale financial asset, a significant or prolonged decline in the fair value of the financial asset below its cost is considered as an indicator that the financial asset is impaired. Impairment losses on available-for-sale financial assets are recognised by reclassifying the losses accumulated in the fair value reserve in equity, to profit or loss. The cumulative loss that is reclassified from equity to profit or loss is the difference between the acquisition cost and the current fair value, less any impairment loss recognised previously in profit or loss. If, in a subsequent period, the fair value of an impaired available-for-sale debt security increases and the increase can be related objectively to an event occurring after the impairment loss was recognised in profit or loss, then the impairment loss is reversed with the amount of the reversal recognised in profit or loss. However, any subsequent recovery in the fair value of an impaired available-for-sale equity security is recognised in other comprehensive income.
(R000) 2012 2011
2. Investment in Fountainhead Property Trust291 720 (2011: 291 720) units in the Trust 2 360 1 955
The investment in the Trust is stated at fair value. The fair value is based on the closing price on the JSE Securities Exchange on 30 September.
3. Trade and other receivablesService fee receivable from the trust 5 770 4 161
Prepayments 153 132
5 923 4 293
4. Cash and cash equivalentsDeposits at bank 40 10
Deposits on call 2 198 2 975
2 238 2 985
5. Share capitalAuthorised and issued
1 000 000 ordinary shares of R1 each 1 000 1 000
The Company declared and paid a dividend of 740 cents (2011: 400 cents) per ordinary share, totaling R7,4 million (2011: R4 million).
6. Trade and other payablesManagement fees 4 328 3 121
VAT payable 154 103
Sundry creditors – 163
Audit fee 78 55
4 560 3 442
Fountainhead Property Trust Management Limited
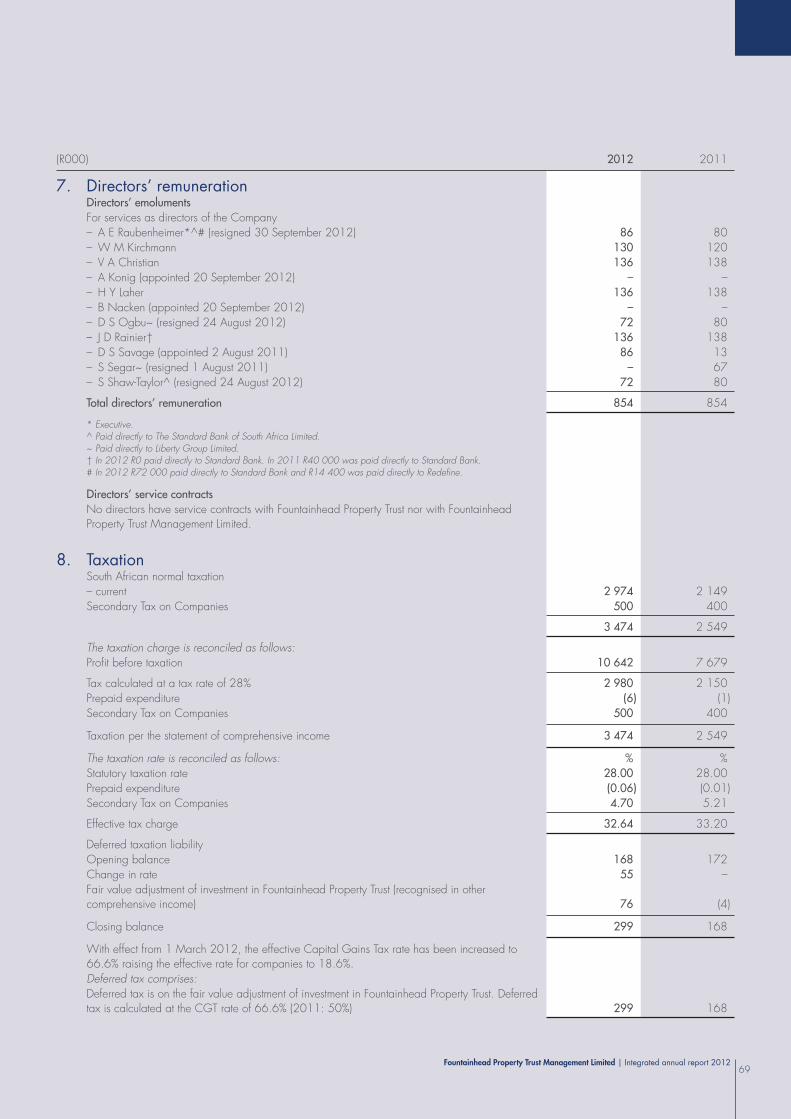
Fountainhead Property Trust Management Limited | Integrated annual report 201269
(R000) 2012 2011
7. Directors’ remunerationDirectors’ emolumentsFor services as directors of the Company– A E Raubenheimer*^# (resigned 30 September 2012) 86 80– W M Kirchmann 130 120– V A Christian 136 138– A Konig (appointed 20 September 2012) – –– H Y Laher 136 138– B Nacken (appointed 20 September 2012) – –– D S Ogbu~ (resigned 24 August 2012) 72 80– J D Rainier† 136 138– D S Savage (appointed 2 August 2011) 86 13– S Segar~ (resigned 1 August 2011) – 67– S Shaw-Taylor^ (resigned 24 August 2012) 72 80
Total directors’ remuneration 854 854
* Executive.^ Paid directly to The Standard Bank of South Africa Limited.~ Paid directly to Liberty Group Limited.† In 2012 R0 paid directly to Standard Bank. In 2011 R40 000 was paid directly to Standard Bank.# In 2012 R72 000 paid directly to Standard Bank and R14 400 was paid directly to Redefine.
Directors’ service contractsNo directors have service contracts with Fountainhead Property Trust nor with Fountainhead Property Trust Management Limited.
8. TaxationSouth African normal taxation– current 2 974 2 149Secondary Tax on Companies 500 400
3 474 2 549
The taxation charge is reconciled as follows:Profit before taxation 10 642 7 679
Tax calculated at a tax rate of 28% 2 980 2 150Prepaid expenditure (6) (1)Secondary Tax on Companies 500 400
Taxation per the statement of comprehensive income 3 474 2 549
The taxation rate is reconciled as follows: % %Statutory taxation rate 28.00 28.00Prepaid expenditure (0.06) (0.01)Secondary Tax on Companies 4.70 5.21
Effective tax charge 32.64 33.20
Deferred taxation liabilityOpening balance 168 172Change in rate 55 –Fair value adjustment of investment in Fountainhead Property Trust (recognised in other comprehensive income) 76 (4)
Closing balance 299 168
With effect from 1 March 2012, the effective Capital Gains Tax rate has been increased to 66.6% raising the effective rate for companies to 18.6%.Deferred tax comprises:Deferred tax is on the fair value adjustment of investment in Fountainhead Property Trust. Deferred tax is calculated at the CGT rate of 66.6% (2011: 50%) 299 168

Fountainhead Property Trust Management Limited | Integrated annual report 201270
Notes to the annual financial statements (continued)for the year ended 30 September 2012
(R000) 2012 2011
9. Management and administration feesThe following management and administration fees were paid during the year:
Evening Star Trading 768 Proprietary Limited 40 135 30 331
Broll Property Group Proprietary Limited 1 341 1 231
41 476 31 562
10. Notes to the cash flow statement10.1 Taxation paid Amounts unpaid at 1 October 178 173
Amounts charged to profit or loss 3 474 2 549
Amount recognised in other comprehensive income 130 (4)
Amounts unpaid at 30 September (305) (178)
3 477 2 540
10.2 Dividends paid Amounts unpaid at 1 October – –
Amounts declared 7 400 4 000
Amounts unpaid at 30 September – –
7 400 4 000
11. Additional information required in terms of the Collective Investment Schemes Control Act of 2002 In terms of the Collective Investment Schemes Control Act, 2002, the Company is required to have a minimum capital of R1 283 541. At 30 September 2012 the capital balance was R3 982 915.
The cost of the investment in Fountainhead Property Trust at 30 September 2012 was R750 704 (2011: R750 704).
Fountainhead Property Trust Management Limited

Fountainhead Property Trust Management Limited | Integrated annual report 201271
(R000) 2012 2011
12. Financial risk managementThe Company’s financial instruments consist mainly of its investment in Fountainhead Property Trust, cash and cash equivalents, trade and other receivables and trade and other payables.
In respect of all financial instruments listed above, carrying value approximates fair value.
Exposure to interest rate, credit and liquidity risk arises in the normal course of business.
Credit risk
Credit risk refers to the risk that a counterparty will default on its contractual obligations resulting in a financial loss to the Company. The Company’s financial assets that are subject to credit risk are cash resources and trade and other receivables.
The Company uses reputable financial institutions for investing and cash-handling purposes.
Trade and other receivables are mainly due from the Fountainhead Property Trust. All amounts receivable are current and no impairments are deemed necessary. The credit quality of the receivables is deemed to be adequate.
The carrying amount of financial assets represents the maximum credit exposure. The maximum exposure to credit risk at the reporting date was:
Trade and other receivables 5 770 4 293
Cash and cash equivalents 2 238 2 985
8 008 7 278
Liquidity risk
Liquidity risk is the risk that the Company will not be able to meet its financial obligations as they fall due. Cash flows are monitored on a weekly basis to ensure that cash resources are adequate to meet funding requirements.
The following table details the Company’s contractual maturities of financial liabilities, excluding interest payments. The table has been prepared based on undiscounted cash flows of financial liabilities based on the earliest date that the Company may be required to pay.
Less than three months:
– Trade and other payables 4 406 3 442
Interest rate risk Interest rate movements impact on the net income of the Company’s short-term cash investments.
The risk is managed by the Company by investing surplus cash at negotiated rates.
Interest rate sensitivity analysis The sensitivity analysis is based on the exposure to interest rates at reporting date.
For floating rate assets, the analysis assumes that the asset existing at the reporting date existed for the whole year.
A 50 basis point increase or decrease is used when reporting interest rate internally to key management personnel and represents management’s reasonable assessment of the possible change in interest rates.
For floating rate assets, if interest rates were 50 basis points higher/lower and all other variables were constant, the company’s profit for the year ended 30 September 2012 would increase/decrease by R11 189 (2011: increase/decrease by R14 925).
The analysis was performed on the same basis in 2011.
Capital management The capital structure of the company is governed by the Collective Investment Schemes Control Act, 2002.
The minimal capital requirement is R1 283 541 (2011: R1 149 971).
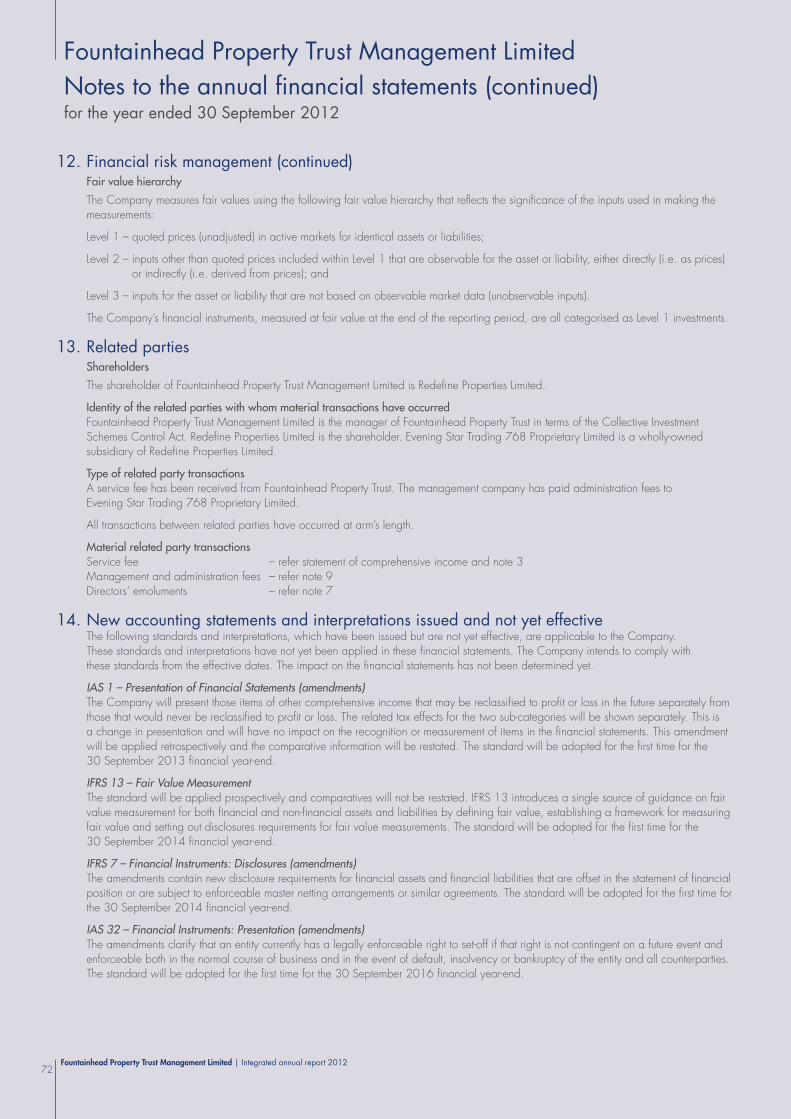
Fountainhead Property Trust Management Limited | Integrated annual report 201272
Notes to the annual financial statements (continued)for the year ended 30 September 2012
12. Financial risk management (continued) Fair value hierarchy
The Company measures fair values using the following fair value hierarchy that reflects the significance of the inputs used in making the measurements:
Level 1 – quoted prices (unadjusted) in active markets for identical assets or liabilities;
Level 2 – inputs other than quoted prices included within Level 1 that are observable for the asset or liability, either directly (i.e. as prices) or indirectly (i.e. derived from prices); and
Level 3 – inputs for the asset or liability that are not based on observable market data (unobservable inputs).
The Company’s financial instruments, measured at fair value at the end of the reporting period, are all categorised as Level 1 investments.
13. Related parties Shareholders
The shareholder of Fountainhead Property Trust Management Limited is Redefine Properties Limited.
Identity of the related parties with whom material transactions have occurred Fountainhead Property Trust Management Limited is the manager of Fountainhead Property Trust in terms of the Collective Investment
Schemes Control Act. Redefine Properties Limited is the shareholder. Evening Star Trading 768 Proprietary Limited is a wholly-owned subsidiary of Redefine Properties Limited.
Type of related party transactions A service fee has been received from Fountainhead Property Trust. The management company has paid administration fees to
Evening Star Trading 768 Proprietary Limited.
All transactions between related parties have occurred at arm’s length.
Material related party transactions Service fee – refer statement of comprehensive income and note 3 Management and administration fees – refer note 9 Directors’ emoluments – refer note 7
14. New accounting statements and interpretations issued and not yet effective The following standards and interpretations, which have been issued but are not yet effective, are applicable to the Company.
These standards and interpretations have not yet been applied in these financial statements. The Company intends to comply with these standards from the effective dates. The impact on the financial statements has not been determined yet.
IAS 1 – Presentation of Financial Statements (amendments) The Company will present those items of other comprehensive income that may be reclassified to profit or loss in the future separately from
those that would never be reclassified to profit or loss. The related tax effects for the two sub-categories will be shown separately. This is a change in presentation and will have no impact on the recognition or measurement of items in the financial statements. This amendment will be applied retrospectively and the comparative information will be restated. The standard will be adopted for the first time for the 30 September 2013 financial year-end.
IFRS 13 – Fair Value Measurement The standard will be applied prospectively and comparatives will not be restated. IFRS 13 introduces a single source of guidance on fair
value measurement for both financial and non-financial assets and liabilities by defining fair value, establishing a framework for measuring fair value and setting out disclosures requirements for fair value measurements. The standard will be adopted for the first time for the 30 September 2014 financial year-end.
IFRS 7 – Financial Instruments: Disclosures (amendments) The amendments contain new disclosure requirements for financial assets and financial liabilities that are offset in the statement of financial
position or are subject to enforceable master netting arrangements or similar agreements. The standard will be adopted for the first time for the 30 September 2014 financial year-end.
IAS 32 – Financial Instruments: Presentation (amendments) The amendments clarify that an entity currently has a legally enforceable right to set-off if that right is not contingent on a future event and
enforceable both in the normal course of business and in the event of default, insolvency or bankruptcy of the entity and all counterparties. The standard will be adopted for the first time for the 30 September 2016 financial year-end.
Fountainhead Property Trust Management Limited

Fountainhead Property Trust Management Limited | Integrated annual report 201273
IFRS 9 – Financial Instruments IFRS 9 addresses the initial measurement and classification of financial assets and financial liabilities and will replace the relevant
sections of IAS 39. Under IFRS 9 there are two options in respect of classification of financial assets, namely, financial assets measured at amortised cost or at fair value. Financial assets are measured at amortised cost when the business model is to hold assets in order to collect contractual cash flows and when they give rise to cash flows that are solely payments of principal and interest on the principal outstanding. All other financial assets are measured at fair value. Embedded derivatives are no longer separated from hybrid contracts that have a financial asset host. The standard will be applied retrospectively, subject to transitional provisions. The standard will be adopted for the first time for the 30 September 2016 financial year-end.
15. Events after reporting period The Board has nominated Andrew J Konig for appointment as Financial Director. The appointment is subject to FSB approval.
Fountainhead Property Trust | Integrated annual report 2012Fountainhead Property Trust Management Limited | Integrated annual report 201274
Directors’ reportfor the year ended 30 September 2012
NATURE OF BUSINESS: The Company continued with its business as the Manager for the Trust in terms of the Collective Investment Schemes Control Act.
GENERAL REVIEW: The results for the year under review are reflected in the accompanying annual financial statements.
SHARE CAPITAL: Details of the authorised and issued share capital of the Company appear in note 5 to the financial statements.
DIVIDENDS: A dividend of R7.4 million (2011: R4.0 million) was declared during the year.
DIRECTORS: The Directors of the Company are as follows:AE Raubenheimer (Managing Director and Financial Director) (resigned 30 September 2012)WM Kirchmann (Chairman)VA ChristianHY LaherDS Ogbu (resigned 24 August 2012)JD RainierDS SavageS Shaw-Taylor (resigned 24 August 2012)A J Konig (appointed 20 September 2012)B Nackan (appointed 20 September 2012)
Business address: Redefine Place2 Arnold RoadRosebank 2196Johannesburg
Postal address: PO Box 1731Parklands 2121
SECRETARIES:Business address:
Broll Property Group Proprietary Limited2nd Floor, Broll House27 Fricker RoadIllovo 2196Johannesburg
Postal address: PO Box 1455Saxonwold 2132
AUDITORS: KPMG Inc. is re-appointed in terms of section 90 of the Companies Act
REGISTRATION NUMBER: 1983/003324/06
Fountainhead Property Trust Management Limited
Fountainhead Property Trust | Integrated annual report 201275
Manager’s responsibility statement and approval of the financial statementsfor the year ended 30 September 2012
The Manager, represented by the Directors of Fountainhead Property Trust Management Limited, is responsible for the preparation and fair
presentation of the financial statements of Fountainhead Property Trust, comprising the statement of financial position at 30 September 2012,
and the statements of comprehensive income, changes in unitholders’ funds and cash flows for the year then ended, and the notes to the financial
statements which include a summary of significant accounting policies and other explanatory notes, in accordance with International Financial
Reporting Standards and the requirements of the Collective Investment Schemes Control Act of South Africa.
The Manager is also responsible for such internal control as the Manager determines is necessary to enable the preparation of financial
statements that are free from material misstatement, whether due to fraud or error, and for maintaining adequate accounting records
and an effective system of risk management as well as the preparation of the supplementary schedules included in these financial statements.
The Manager has made an assessment of the ability of Fountainhead Property Trust to continue as a going concern and has no reason to
believe that the business will not be a going concern in the year ahead.
The auditor is responsible for reporting on whether the financial statements are fairly presented in accordance with the applicable financial
reporting framework.
Approval of annual financial statements
The annual financial statements of Fountainhead Property Trust were approved by the Board of Directors of the Manager on 31 October 2012
and signed by:
WM Kirchmann JD Rainer
Chairman Authorised Director

Fountainhead Property Trust | Integrated annual report 201276
Directors’ responsibility statement and approval of the financial statementsfor the year ended 30 September 2012The Directors are responsible for the preparation and fair presentation of the financial statements of Fountainhead Property Trust Management Limited, comprising the statement of financial position at 30 September 2012, and the statements of comprehensive income, changes in equity and cash flows for the year then ended, and the notes to the financial statements which include a summary of significant accounting policies and other explanatory notes, in accordance with International Financial Reporting Standards and the requirements of the Companies Act of South Africa. In addition, the Directors are responsible for preparing the Directors’ report.
The Directors are also responsible for such internal control as the Directors determine is necessary to enable the preparation of financial statements that are free from material misstatement, whether due to fraud or error, and for maintaining adequate accounting records and an effective system of risk management as well as the preparation of the supplementary schedules included in these financial statements.
The Directors have made an assessment of the ability of Fountainhead Property Trust Management Limited to continue as a going concern and have no reason to believe that the business will not be a going concern in the year ahead.
The auditor is responsible for reporting on whether the financial statements are fairly presented in accordance with the applicable financial reporting framework.
Approval of annual financial statements
The annual financial statements of Fountainhead Property Trust Management Limited were approved by the Board of Directors on 31 October 2012 and signed by:
WM Kirchmann JD RainerChairman Authorised Director

Fountainhead Property Trust | Integrated annual report 201277
Report of the Audit and Risk Committee
Report in terms of section 61(8)(a)(ii) and section 94(7)(f) of the Companies Act, 71 of 2008
(the Companies Act)
Information on the role and composition of the Audit Committee, its terms of reference and procedures, meeting attendance and responsibilities are described more fully in the Corporate governance report commencing on page 18 of this integrated report. The Audit and Risk Committee has executed its duties and responsibilities during the financial year in accordance with its terms of reference as they relate to the Company’s accounting, internal control and financial reporting practices.
Execution of functions of the Audit and Risk Committee
The committee performed the following activities during the year under review: Considered the independence and objectivity of the external auditors and ensured that the scope of additional services provided did
not impair their independence; Reviewed the external audit plan and approved the external auditors’ fee proposal for the 2011 financial year; Reviewed and approved the internal audit plan and ensured that it was executed accordingly; Approved the non-audit-related services performed by the external auditors in the year in accordance with the policy established and
approved by the Board; Considered accounting treatments, significant financial transactions and other financial information; In compliance with the JSE Listings Requirement Section 3.84(h), the committee reviewed the performance, appropriateness and expertise of
Mr A Suckerman in his role of financial manager, and was satisfied with his experience and expertise to fulfill his role; and Considered the appropriateness of the accounting policies.
After assessing the requirements set out in sections 94(7)(a – e) of the Companies Act, the committee is satisfied with the independence and objectivity of the external auditors, and recommends the re-appointment of the external auditors at the next annual general meeting.
The Audit and Risk Committee has evaluated the financial statements of the trust and Company for the year ended 30 September 2011 and, based on the information provided to the Audit Committee, considers that the Company complies with the Companies Act and International Financial Reporting Standards (IFRS).
VA ChristianAudit and Risk Committee Chairman

Fountainhead Property Trust | Integrated annual report 201278
Independent auditor’s reportfor the year ended 30 September 2012
To the Manager
We have audited the financial statements of Fountainhead Property Trust, which comprise the statement of financial position at 30 September 2012, and the statements of comprehensive income, changes in unitholders’ funds and cash flows for the year then ended, and the notes to the financial statements which include a summary of significant accounting policies and other explanatory notes as set out on pages 44 to 61.
Manager’s responsibility for the financial statements The Manager, represented by the Directors of Fountainhead Property Trust Management Limited, is responsible for the preparation and fair presentation of these financial statements in accordance with International Financial Reporting Standards and the requirements of the Collective Investment Schemes Control Act of South Africa, and for such internal control as the Manager determines is necessary to enable the preparation of financial statements that are free from material misstatement, whether due to fraud or error.
Auditor’s responsibility Our responsibility is to express an opinion on these financial statements based on our audit. We conducted our audit in accordance with International Standards on Auditing. Those standards require that we comply with ethical requirements and plan and perform the audit to obtain reasonable assurance about whether the financial statements are free from material misstatement.
An audit involves performing procedures to obtain audit evidence about the amounts and disclosures in the financial statements. The procedures selected depend on the auditor’s judgement, including the assessment of the risks of material misstatement of the financial statements, whether due to fraud or error. In making those risk assessments, the auditor considers internal control relevant to the entity’s preparation and fair presentation of the financial statements in order to design audit procedures that are appropriate in the circumstances, but not for the purpose of expressingan opinion on the effectiveness of the entity’s internal control. An audit also includes evaluating the appropriateness of accounting policies used and the reasonableness of accounting estimates made by management, as well as evaluating the overall presentation of the financial statements.
We believe that the audit evidence we have obtained is sufficient and appropriate to provide a basis for our audit opinion.
Opinion In our opinion, these financial statements present fairly, in all material respects, the financial position of Fountainhead Property Trust at 30 September 2012, and its financial performance and cash flows for the year then ended in accordance with International Financial Reporting Standards and the requirements of the Collective Investment Schemes Control Act of South Africa.
KPMG Inc.Registered Auditor
Per M FouchéChartered Accountant (SA)Registered Auditor
Director
31 October 2012
KPMG Crescent85 Empire RoadParktown, JohannesburgSouth Africa2193

Fountainhead Property Trust | Integrated annual report 201279
Independent auditor’s reportfor the year ended 30 September 2012
To the shareholders of Fountainhead Property Trust Management Limited
We have audited the financial statements of Fountainhead Property Trust Management Limited, which comprise the statement of financial position at 30 September 2012, and the statements of comprehensive income, changes in equity and cash flows for the year then ended, and the notes to the financial statements which include a summary of significant accounting policies and other explanatory notes as set out on pages 64 to 73.
Directors’ responsibility for the financial statements The Directors are responsible for the preparation and fair presentation of these financial statements in accordance with International Financial Reporting Standards and the requirements of the Companies Act of South Africa, and for such internal control as the Directors determine is necessary to enable the preparation of financial statements that are free from material misstatement, whether due to fraud or error.
Auditor’s responsibility Our responsibility is to express an opinion on these financial statements based on our audit. We conducted our audit in accordance with International Standards on Auditing. Those standards require that we comply with ethical requirements and plan and perform the audit to obtain reasonable assurance about whether the financial statements are free from material misstatement.
An audit involves performing procedures to obtain audit evidence about the amounts and disclosures in the financial statements. The procedures selected depend on the auditor’s judgement, including the assessment of the risks of material misstatement of the financial statements, whether due to fraud or error. In making those risk assessments, the auditor considers internal control relevant to the entity’s preparation and fair presentation of the financial statements in order to design audit procedures that are appropriate in the circumstances, but not for the purpose of expressing an opinion on the effectiveness of the entity’s internal control. An audit also includes evaluating the appropriateness of accounting policies used and the reasonableness of accounting estimates made by management, as well as evaluating the overall presentation of the financial statements.
We believe that the audit evidence we have obtained is sufficient and appropriate to provide a basis for our audit opinion.
Opinion In our opinion, these financial statements present fairly, in all material respects, the financial position of Fountainhead Property Trust Management Limited at 30 September 2012, and its financial performance and cash flows for the year then ended in accordance with International Financial Reporting Standards and the requirements of the Companies Act of South Africa.
Other reports required by the Companies Act As part of our audit of the financial statements for the year ended 30 September 2012, we have read the Directors’ Report, the Audit and Risk Committee’s Report and the Company Secretary’s Certificate for the purpose of identifying whether there are material inconsistencies between these reports and the audited financial statements. These reports are the responsibility of the respective preparers. Based on reading these reports we have not identified material inconsistencies between these reports and the audited financial statements. However, we have not audited these reports and accordingly do not express an opinion on these reports.
KPMG Inc.Registered Auditor
Per M FouchéChartered Accountant (SA)Registered Auditor
Director
31 October 2012
KPMG Crescent85 Empire RoadParktown, JohannesburgSouth Africa2193

Fountainhead Property Trust | Integrated annual report 201280
Report of the Trusteefor the year ended 30 September 2012
In terms of section 70(1)(f) of the Collective Investment Schemes Control Act of 2002
To the unitholders of Fountainhead Property Trust
During the period as set out above, during which the Collective Investment Schemes Control Act has been in effect, the Trust has been administered in accordance with:
(i) the limitations imposed on the investment and borrowing powers of the Manager by the Act; and(ii) the provisions of the Act and Deed.
ABSA Bank LimitedTrustee
Johannesburg31 October 2012
Certificate by Company Secretaryfor the year ended 30 September 2012
Unitholders’ diary
We hereby certify that for the year ended 30 September 2012, the Company has lodged with the Registrar of Companies all such returns as are required of a public company in terms of section 88(2)(e) of the Companies Act, 2008, as amended, and all such returns are true, correct and up to date.
Broll Property Group Proprietary LimitedSecretaries
31 October 2012
Financial year-end 30 September
Distribution number 60 61
Six months ended 31 March 2013 30 September 2013
Declaration date 8 May 2013 6 November 2013
Payment date 27 May 2013 25 November 2013
Fountainhead Property Trust | Integrated annual report 201281
CISCA Collective Investments Schemes Control Act, 2002
Companies Act Companies Act, 2008 of South Africa, as amended
Evening Star Evening Star Trading 768 Proprietary Limited – wholly-owned subsidiary of Redefine
FPTML/The Manager Fountainhead Property Trust Management Limited
FSB Financial Services Board
GLA Gross Lettable Area
IFRS International Financial Reporting Standards
IPD Investment Property Databank
JSE Johannesburg Stock Exchange
King III King Report on Corporate Governance for South Africa and King Code of Governance Principles
M2 Square Metre
OHS Occupational Health and Safety Act
PUT Property Unit Trust
Redefine Redefine Properties Limited, a PLS company listed on the JSE
Registrar Registrar of the Collective Investment Schemes
REIT Real Estate Investment Trust
SENS Stock Exchange News Service of the JSE
The Board The Board of Directors
The Trust Fountainhead Property Trust
Trustee Absa Bank limited
UAS Utility Administration Service CC
Company details
Fountainhead Property Trust JSE share code: FPTISIN: ZAE000097416
Registered office and business addressRedefine Place, 2 Arnold Road, Rosebank 2196PO Box 1731, Parklands 2121Telephone: +27 11 283 0000Fax: +27 11 283 0055E-mail: [email protected]
Commercial bankersThe Standard Bank of South Africa Limited
Independent auditorsKPMG Inc.85 Empire Road, Parktown 2193Private Bag 9, Parkview 2122 Tel: +27 11 647 7111Fax: +27 11 647 8000
Administrators and Company secretaryBroll Property Group Propriety Limited2nd Floor, Broll House, 2 Fricker Road, Illovo, Johannesburg 2196PO Box 1455, Saxonwold 2132Telephone: +27 11 441 4000Fax: +27 11 441 4042/4043
Transfer secretariesComputershare Investor Services Proprietary Limited70 Marshall Street, Johannesburg 2001Telephone: +27 11 370 5000
Corporate sponsorThe Standard Bank of South Africa Limited
Definitions

www.fountainheadproperty.co.za | [email protected]