2012 citizen survey results background implementing our vision action chart key drivers areas of...
TRANSCRIPT

2012 Citizen Survey results
• Background
• Implementing Our Vision
• Action Chart
• Key Drivers
• Areas of Significant Change
• Trends over Time
• What’s Next?

Background
• 10th year – National Citizen Survey
• Customized for City, developed with staff
• Mailed to 1,200 randomly selected households
• 426 responses – 39% response rate
• Reflects Palm Coast’s demographic composition
• 5% margin of error – plus or minus

Implementing Our Vision
• Tool for monitoring citizen feedback, trends
• Last year: part of Five-Year Progress Report and Budget Report
• Identifies strengths and weaknesses
• Helps City plan, allocate resources – for improved services, enhanced civic engagement, greater quality of life and stronger public trust
• Strategic Action Plan – Budget Process

Approaching the Data
• Benchmarks the City to 500 communities across in U.S.
• 26% are located in the South• 34 cities and counties in Florida
• Eight Focus Areas:
• Significant statistical changes (>7 %) from year-to-year
• Geographic analysis by Council District – first time
Community Quality Community Design
Environmental Sustainability
Public Safety
Recreation and Wellness Community Inclusiveness
Civic Engagement Public Trust
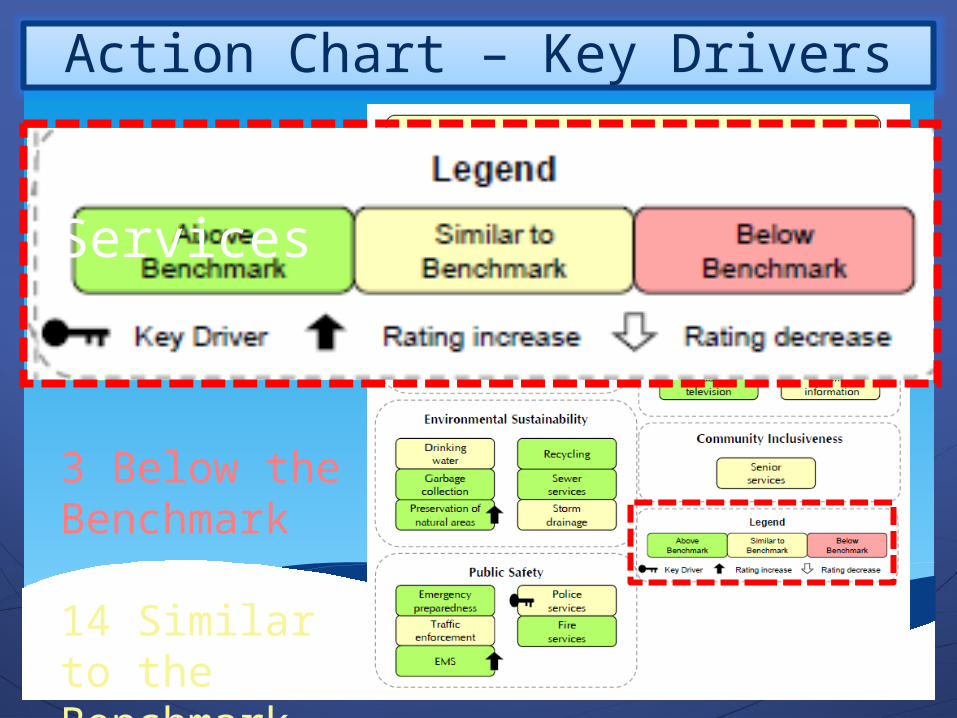
Action Chart – Key Drivers
12 Above the Benchmark
3 Below the Benchmark
14 Similar to the Benchmark
29 Services

Action Chart – Key Drivers
Rating increase
Rating decrease

Rating Public Service
Palm Coast Average Rating Rank
Number of Jurisdictions for Comaprison
Comparison to benchmark
Street Repair 62 26 376 Much aboveStreet cleaning 64 59 261 Much aboveStreet lighting 44 250 282 Much belowSidewalk maintenance 61 32 247 Much aboveTraffi c signal timing 49 100 216 SimilarAmount of public parking 60 15 206 Much above
Land use, planning and zoning 42 178 269 BelowCode enforcement (weeds, abandoned buildings, etc.) 48 132 313 SimilarAnimal control 59 95 283 Above
Economic Development 35 218 255 Much Below
City Parks 72 117 280 SimilarRecreation programs or classes 64 143 283 SimilarRecreation cetners or facilities 62 127 240 Similar
Transportation and Parking Services Benchmarks
Planning and Community Code Enforcement Services Benchmarks
Economic Development Services Benchmarks
Parks and Recreation Services Benchmarks
Palm Coast Average Rating Rank
Number of Jurisdictions for Comaprison
Comparison to benchmark
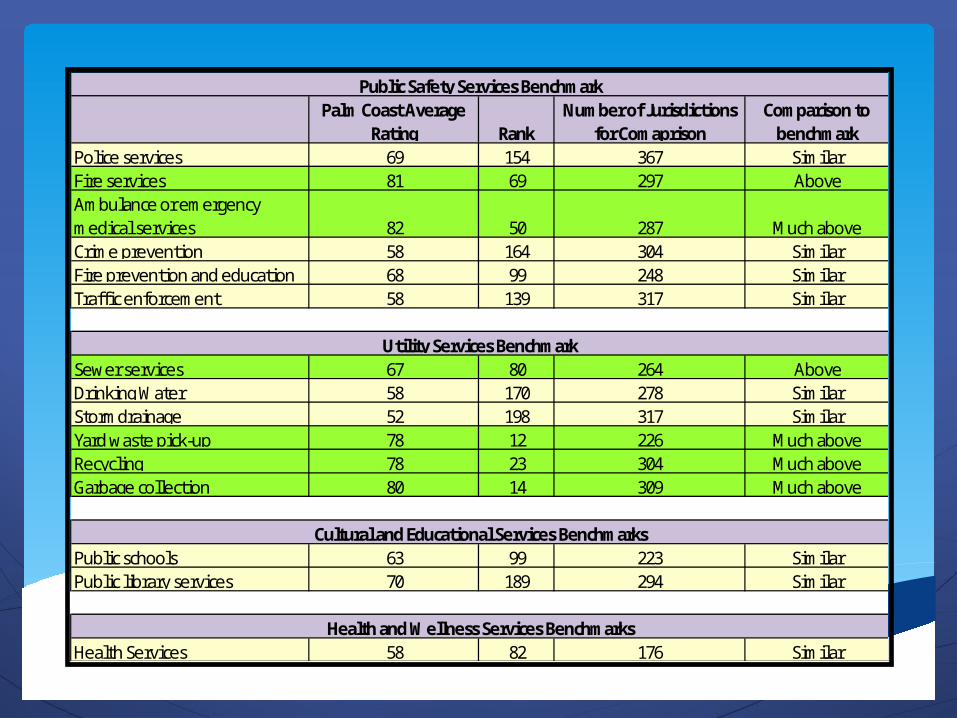
Police services 69 154 367 SimilarFire services 81 69 297 AboveAmbulance or emergency medical services 82 50 287 Much aboveCrime prevention 58 164 304 SimilarFire prevention and education 68 99 248 SimilarTraffi c enforcement 58 139 317 Similar
Sewer services 67 80 264 AboveDrinking Water 58 170 278 SimilarStormdrainage 52 198 317 SimilarYard waste pick-up 78 12 226 Much aboveRecycling 78 23 304 Much aboveGarbage collection 80 14 309 Much above
Public schools 63 99 223 SimilarPublic library services 70 189 294 Similar
Health Services 58 82 176 Similar
Cultural and Educational Services Benchmarks
Health and Wellness Services Benchmarks
Public Safety Services Benchmark
Utility Services Benchmark
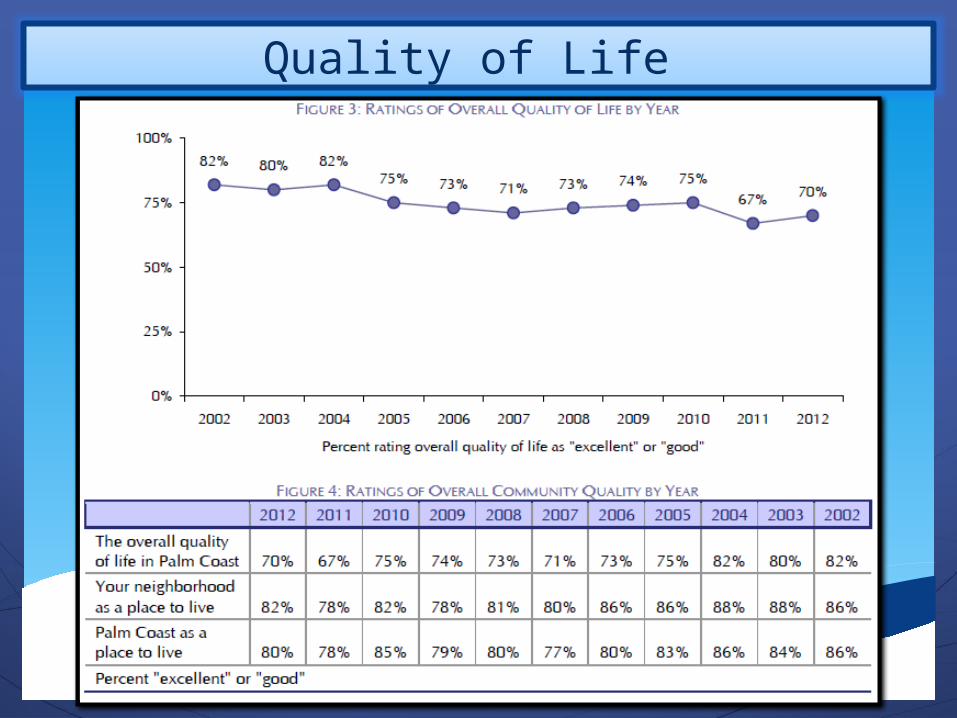
Quality of Life
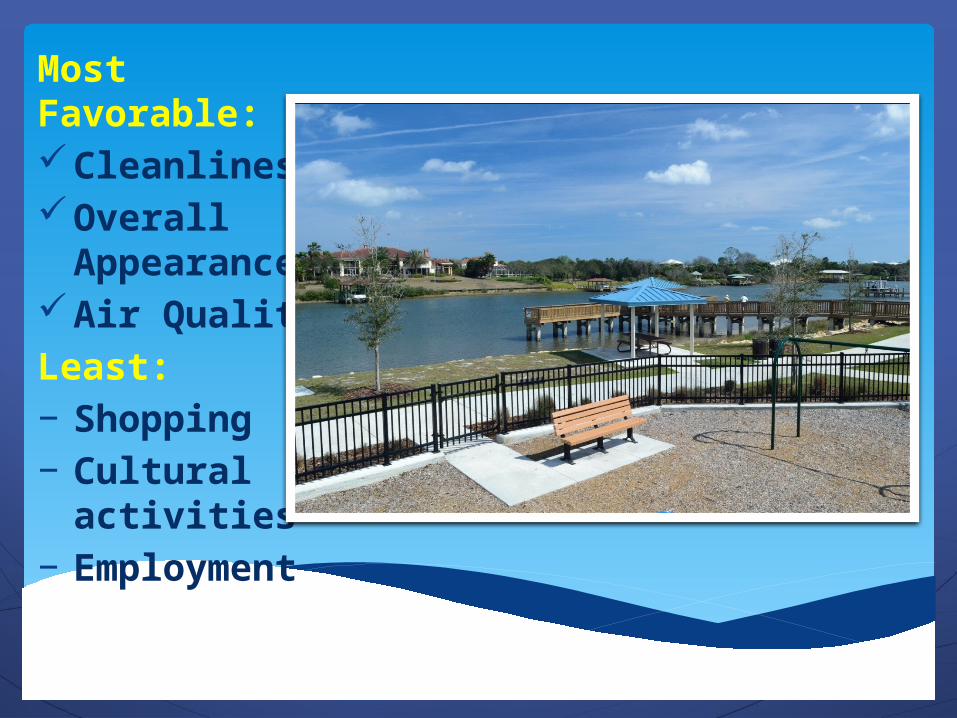
Most Favorable:Cleanliness Overall
Appearance Air Quality Least:−Shopping−Cultural
activities−Employmen
t

Statistically Significant ChangesPOSITIVES:
Availability of Child Care15 %
Ease of Car Travel14 %
Affordability of Health Care11 %
City Website Usage11 %
Amount of Public Parking11 %
Traffic Flow on Major Streets10 %
Opportunity to Participate inCommunity Matters10 %
Services provided by State Government 10 %Street Lighting 9 %Traffic Signal Timing
9 %Preservation of Open Space
9 %Availability of Affordable Housing
9 %Code Enforcement
8 %Animal Control 8 %Public Schools 8 %Ambulance/Emergency Medical Services 8 %Sense of Community
8 %Palm Coast as a Place to Raise Children 8 %
NEGATIVES:
Retail Growth Seen as Too Slow 9 %Overall Rating of City Employees
9 %
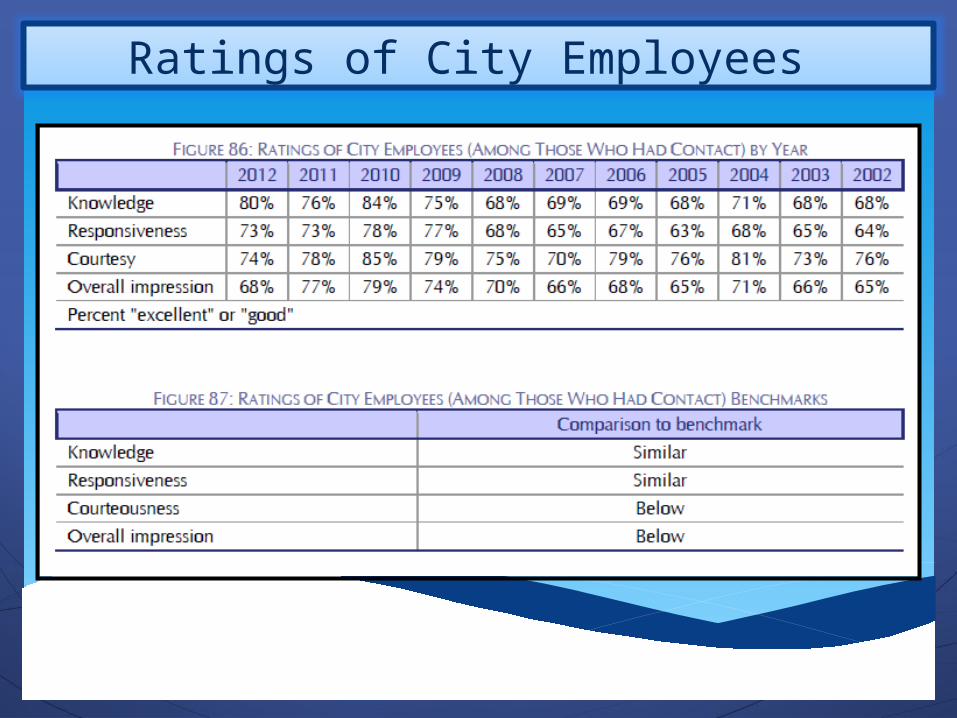
Ratings of City Employees
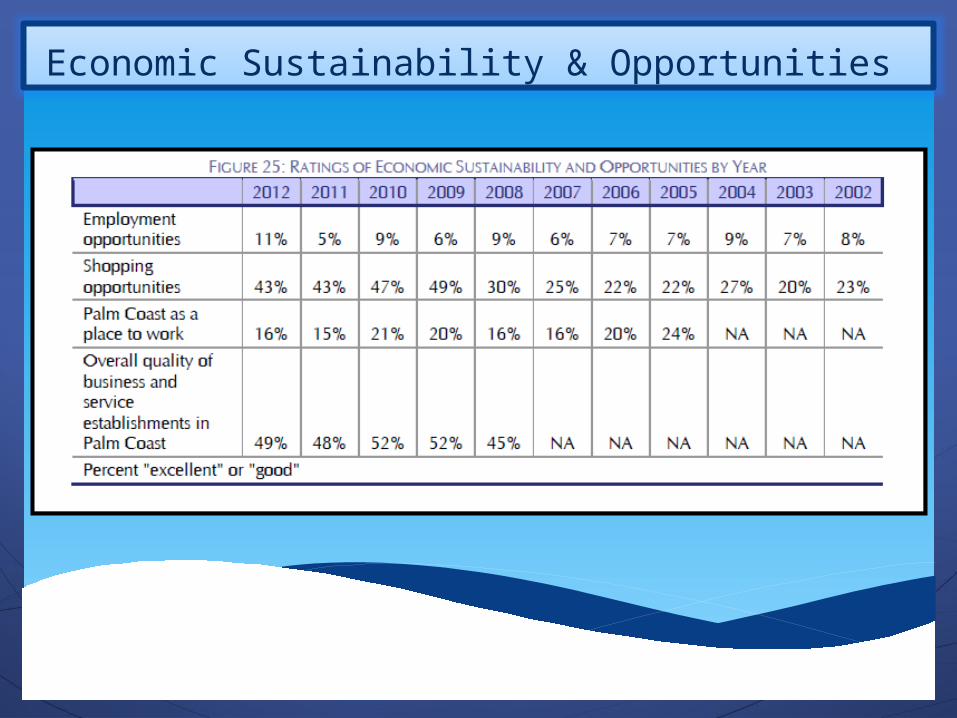
Economic Sustainability & Opportunities
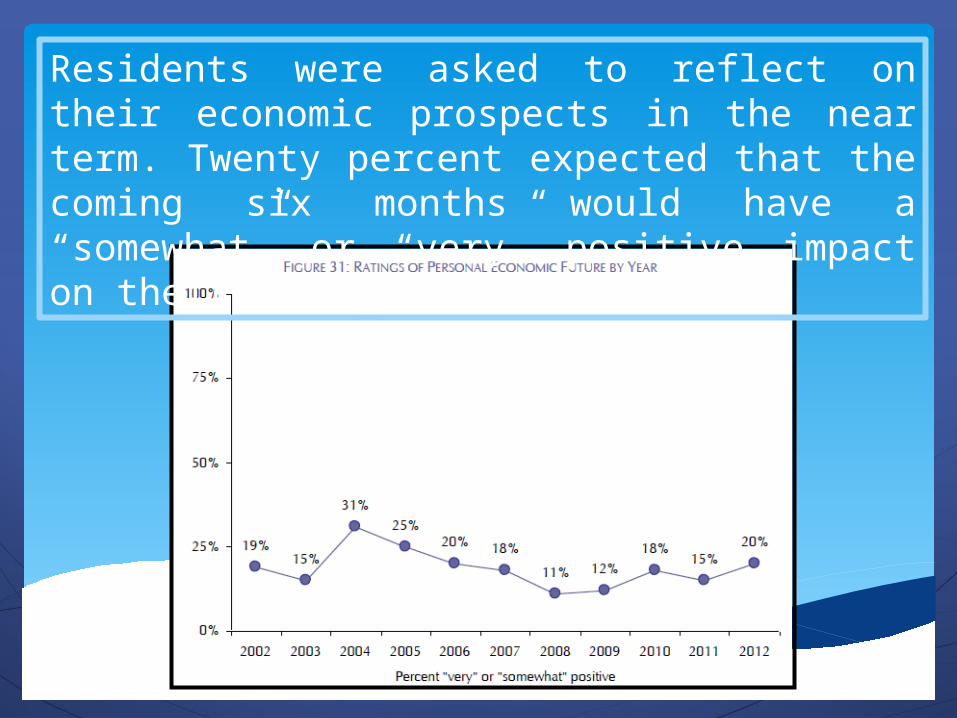
Residents were asked to reflect on their economic prospects in the near term. Twenty percent expected that the coming six months would have a “somewhat” or “very” positive impact on their family.

Population Growth rated as ‘too fast’

Parks & Recreation

Transportation

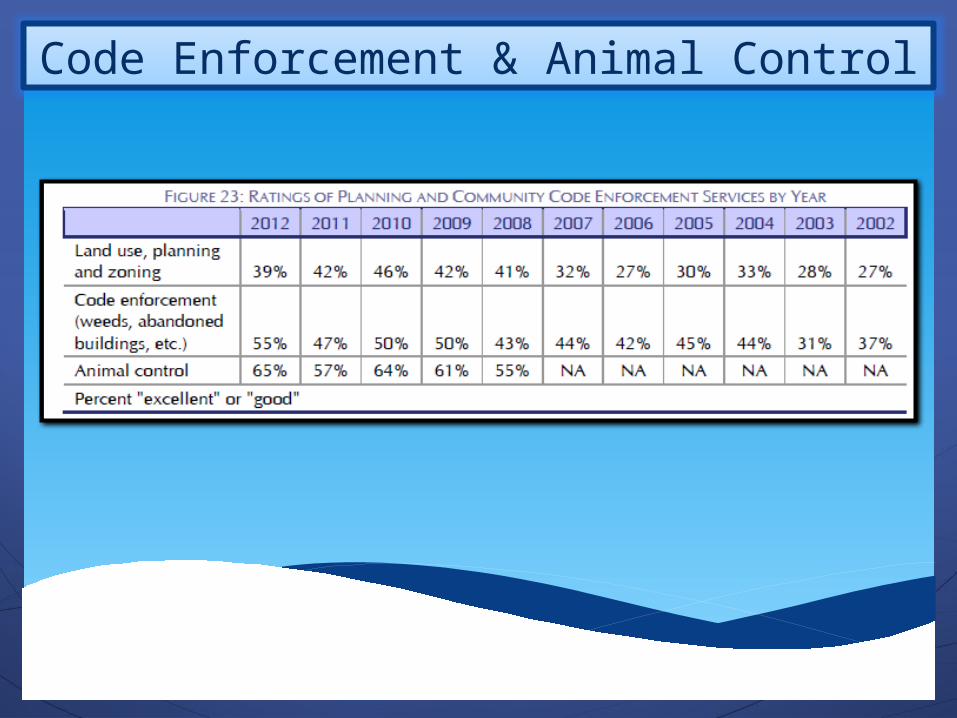
Code Enforcement & Animal Control
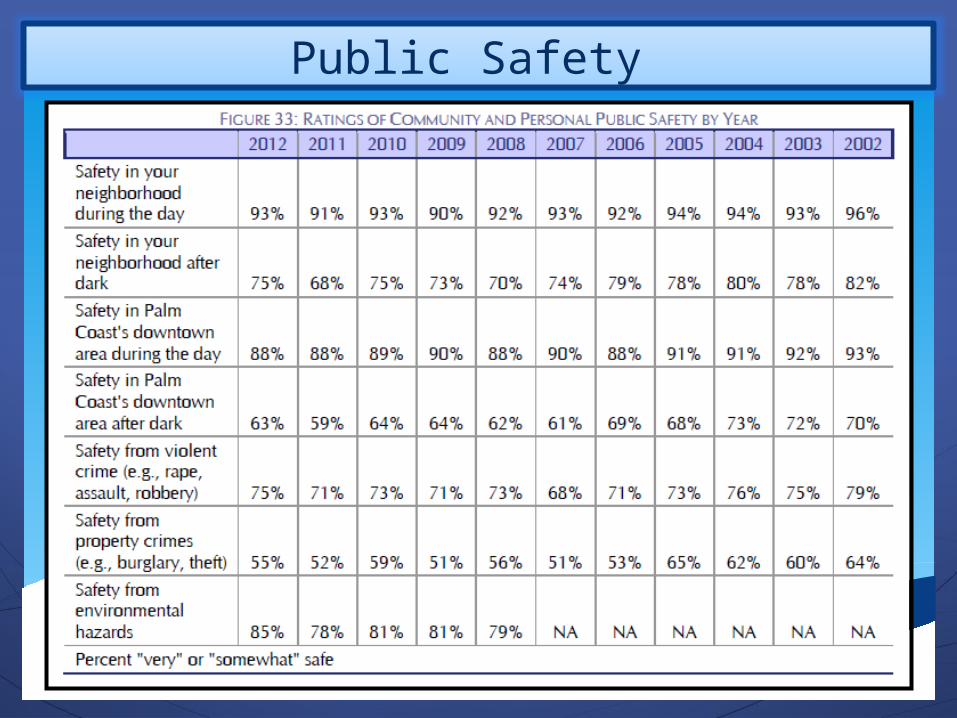
Public Safety


Public Information

Environmental Sustainability

Resident recycling was much greater than recycling reported in comparison communities.

Custom Question 1:City Hall – Rent or Own?
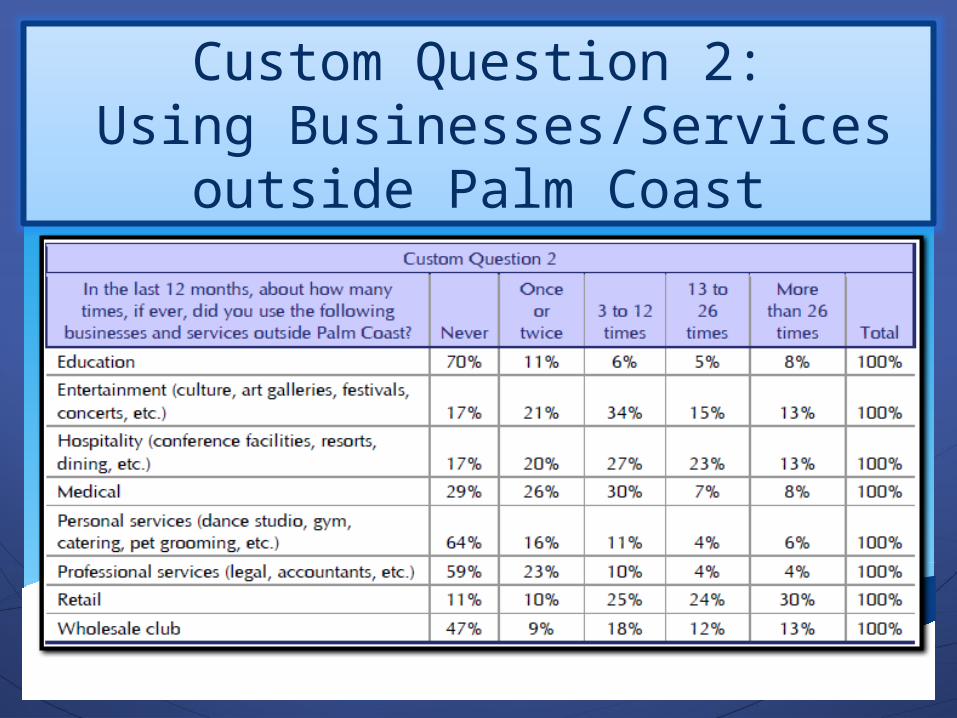
Custom Question 2: Using Businesses/Services
outside Palm Coast

Custom Question 3:Recruiting new Job Opportunities

Next Steps

Questions