2012-13 budget recommendations - boarddocsfile/2012-13 boe budget...2012 – 13 budget...
TRANSCRIPT

Denver Public Schools
2012-13 Budget Recommendations
Presentation to the Board of Education
February 2, 2012
Table of Contents
- 2 -
I. FY2011-12 Reviewa) FY2011-12 Guiding principlesb) FY2011-12 Decisions linking to guiding principlesc) Central support services impact on operating budget
II. FY2012-13 Budgeting Processa) 2012 calendar
III. FY2012-13 Funding Update
IV. FY2012-13 Recommendationsa) Summary links to guiding principlesb) Summary of operating budget recommendationsc) Budget recommendation detailsd) Summary of SBB recommendationse) Select ideas that were not recommended
V. 2012 Bond & Mill Levy Override Planninga) Planning timeline b) Mill levy override funding levelsc) Summary areas of investment interest

Table of Contents
- 3 -
I. FY2011-12 Reviewa) FY2011-12 Guiding principlesb) FY2011-12 Decisions linking to guiding principlesc) Central support services impact on operating budget
II. FY2012-13 Budgeting Processa) 2012 calendar
III. FY2012-13 Funding Update
IV. FY2012-13 Recommendationsa) Summary links to guiding principlesb) Summary of operating budget recommendationsc) Budget recommendation detailsd) Summary of SBB recommendationse) Select ideas that were not recommended
V. 2012 Bond & Mill Levy Override Planninga) Planning timeline b) Mill levy override funding levelsc) Summary areas of investment interest

Guiding Principles from the 2011 – 12 Budget Task Force
The budget process continues to use the Denver Plan to guide priorities, also leveraging the guiding
principles developed last year with the Budget Task Force.
1. Direct more resources to schools
2. Increase school autonomy and accountability
3. Increase our investment in leadership
4. Increase accountability and performance of central administration
5. Fund what works
6. Raise revenues together
- 4 -
Existing Structure
AddModifyReduce
New Programs
SupplementalAdditional

2011 – 12 Budget Decisions Aligned to Budget Task Force Principles
- 5 -
Guiding Principle Budget Recommendations
Direct more resources to schools
� Increased targeted funds for students in poverty and gifted and talented students� Additional SBB weight for SPF performance
Increase school autonomy and accountability
� Implemented proposed staffing levels with more flexibility for Nurses, Mental Health support and Mild Moderate staffing
� Reallocated $27M in SpEd and PSN to less restrictive methodology (SBB)
Increase our investment in leadership
� Added Teacher Effectiveness Coaches to support roll-out of Educator Effectiveness initiative
Increaseaccountability of central administration
� Significantly reduced centrally budgeted expenditures� Replace lost grant funding for Parent Engagement and Multi-Cultural Outreach
Fund what works� Continued support for key programs such as ELA Academy and 6th and 9th grade
academies
Raise revenues together
� Awarded over $20 million in new, non formula grants� This funding includes large private grants from organizations such as The Anschutz
Foundation, Colorado Legacy, Daniels Fund, Michael & Susan Dell Foundation, The Bill & Melinda Gates Foundation, The Wallace Foundation, and The Walton Foundation.

Review of 2011-12 Key Budget Inputs and Decisions
- 6 -
State Funding� Statewide funding was reduced roughly $200 million, or 4%
� Per pupil funding decreased $94, or 1.5%, versus 2010-11*
Federal Funding
� Overall, available Federal funding decreased $27 million versus 2010-11
� Decreases are largely due to the finish for ARRA programs such as Title I, VI and Title IID and one time ARRA funding for SFSF and Ed Jobs which were used to supplement general fund expenses
Major Budget Changes / Drivers($ millions)
� The SBB Base was increased for all schools by 1%
� Increased funding of $4.8 million for students in poverty, including additional funds for kinder
� Student services funding for SpEd and PSNs distributed to schools through per pupil SBB funding
� SBB funding provided for SPF performance
Funding for Investments Amount
Cuts to centrally budgeted services
($10.0)
Budgeted use of General Fund Balance
($20.0)
Increased Investments Amount
Increase Per Student School Funding through SBB
$10.5
Increase Funding for Highest Priorities (such as multiple-pathways schools)
$8.0
*PPR would have decreased 5%, but federal adjustment funding mitigated the state funding impact

DPS Maximizes Spending Directly in the Classroom
- 7 -- 7 -
15%
8%
12%
8%
11%
10%
7%
6%
4%
6%
8%
10%
12%
14%
16%
% of K12 Operating Budget for Central Overhead
7%
6%
5%
0%
2%
4%
6%
8%
FY09 FY10 FY11
DPS continues to reduce centrally budgeted services and remains among comparative urban districts with the lowest percentage of central funding in order to maximize funding in our classrooms.
Source: Education Resource Strategies: FY10Source: DPS
Comparison of DPS against other districts: FY10DPS % of Budget on Central Overhead
Table of Contents
- 8 -
I. FY2011-12 Reviewa) FY2011-12 Guiding principlesb) FY2011-12 Decisions linking to guiding principlesc) Central support services impact on operating budget
II. FY2012-13 Budgeting Processa) 2012 Calendar
III. FY2012-13 Funding Update
IV. FY2012-13 Recommendationsa) Summary links to guiding principlesb) Summary of operating budget recommendationsc) Budget recommendation detailsd) Summary of SBB recommendationse) Select ideas that were not recommended
V. 2012 Bond & Mill Levy Override Planninga) Planning timeline b) Mill levy override funding levelsc) Summary areas of investment interest

Budgeting Process: Where we are Today
- 9 -
2012
Oct Nov Dec Jan Feb Mar Apr May Jun
2011
Planning Preparation Development Finalization
Where weare today
BoardBudget
Adoption
Budget Discussion with Board
ProposedBudget
DueApril 19
One month earlier than prior years
Challenges This Year:� State and federal funding cuts� Providing sufficient resources
for critical priorities
SIAC / Budget Task
Force
ERS Work Sessions / Prioritization ProcessApril 2011 – January 2012
Budget Forms DistributedFeb 10 - 17
1-on-1 with PrincipalsFeb 13 - 24
Table of Contents
- 10 -
I. FY2011-12 Reviewa) FY2011-12 Guiding principlesb) FY2011-12 Decisions linking to guiding principlesc) Central support services impact on operating budget
II. FY2012-13 Budgeting Processa) 2012 calendar
III. FY2012-13 State Funding Update
IV. FY2012-13 Recommendationsa) Summary links to guiding principlesb) Summary of operating budget recommendationsc) Budget recommendation detailsd) Summary of SBB recommendationse) Select ideas that were not recommended
V. 2012 Bond & Mill Levy Override Planninga) Planning timeline b) Mill levy override funding levelsc) Summary areas of investment interest
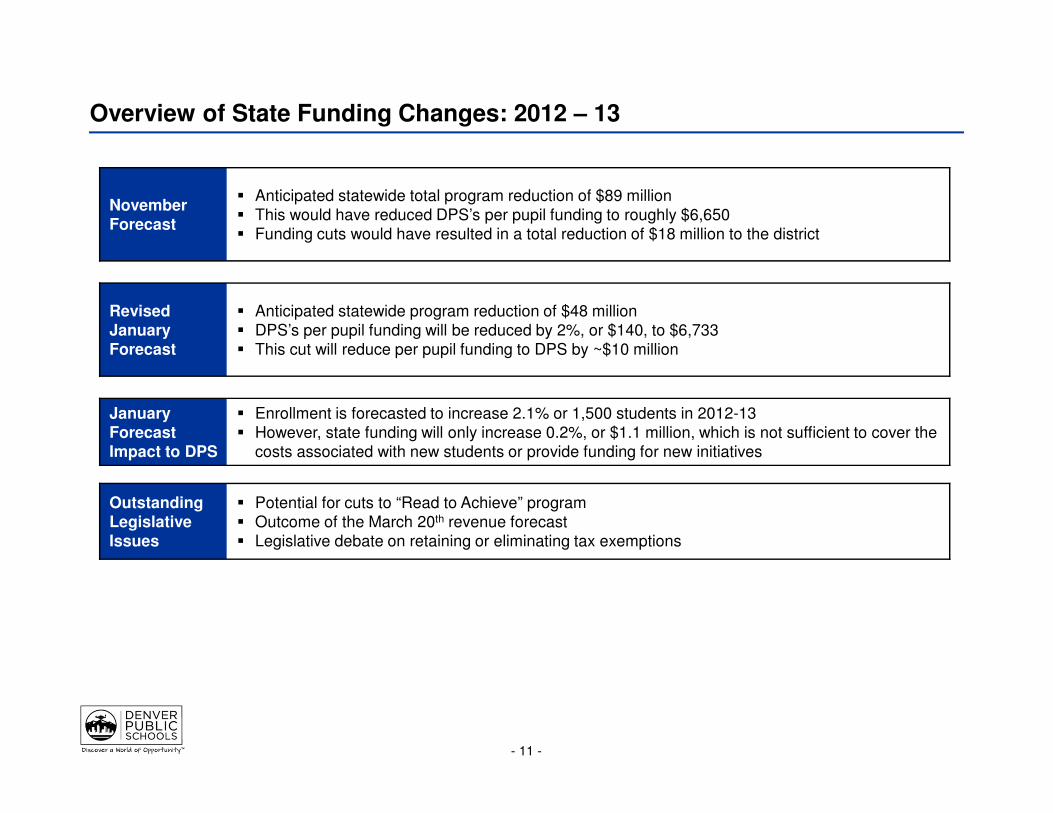
Overview of State Funding Changes: 2012 – 13
- 11 -
November Forecast
� Anticipated statewide total program reduction of $89 million� This would have reduced DPS’s per pupil funding to roughly $6,650 � Funding cuts would have resulted in a total reduction of $18 million to the district
Revised January Forecast
� Anticipated statewide program reduction of $48 million� DPS’s per pupil funding will be reduced by 2%, or $140, to $6,733� This cut will reduce per pupil funding to DPS by ~$10 million
JanuaryForecast Impact to DPS
� Enrollment is forecasted to increase 2.1% or 1,500 students in 2012-13� However, state funding will only increase 0.2%, or $1.1 million, which is not sufficient to cover the
costs associated with new students or provide funding for new initiatives
OutstandingLegislative Issues
� Potential for cuts to “Read to Achieve” program� Outcome of the March 20th revenue forecast� Legislative debate on retaining or eliminating tax exemptions

State Funding Cuts: Impact to DPS on Per Pupil Funding
- 12 -- 12 -
The state has decreased per pupil funding more than 12% since 2009–10. The January 2012 proposed budget shows a decrease of nearly 2% versus last year.
*2010-11 funding is prior to the federal adjustment of $21M. Funding would have been $6,941 without this adjustment
$7,672
$7,232*
$6,847**
$6,733
$6,200
$6,400
$6,600
$6,800
$7,000
$7,200
$7,400
$7,600
$7,800
2009-10 2010-11 2011-12 2012-13
DPS Per Pupil Funding
Jan 2012 proposed state budget
**2011-12 funding would increase to $6,873 if state supplemental funds are released
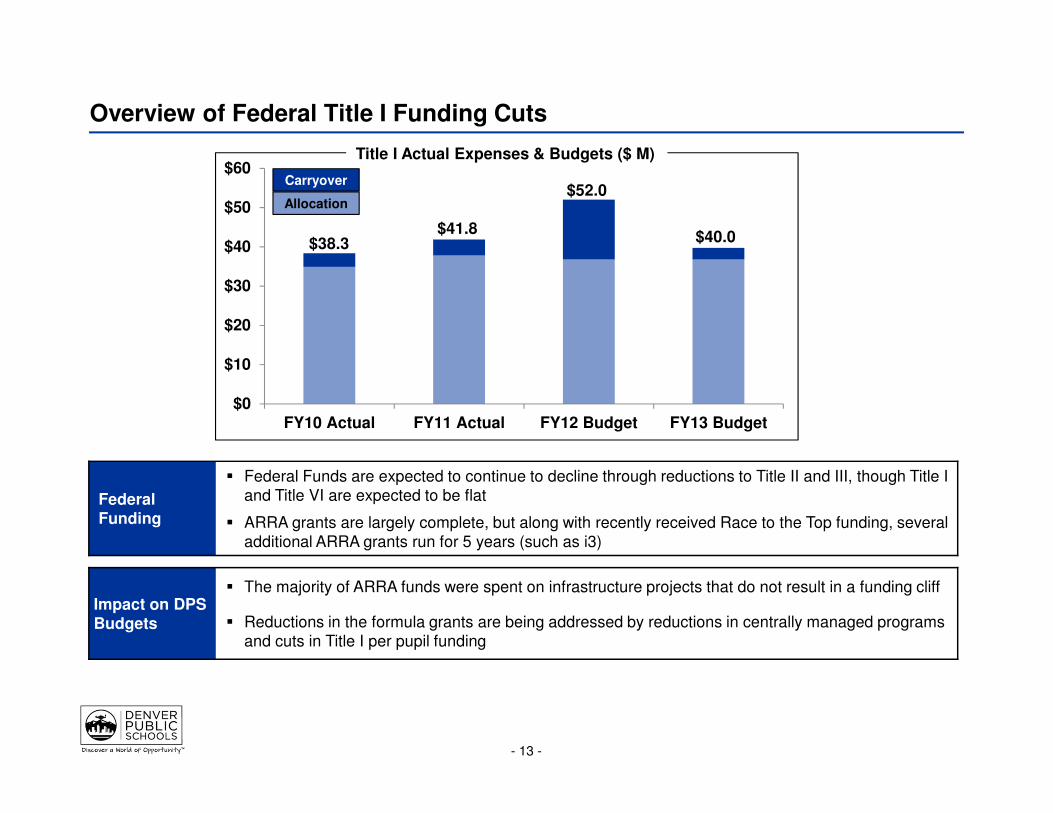
Overview of Federal Title I Funding Cuts
- 13 -
Carryover
Allocation
Federal Funding
� Federal Funds are expected to continue to decline through reductions to Title II and III, though Title I and Title VI are expected to be flat
� ARRA grants are largely complete, but along with recently received Race to the Top funding, severaladditional ARRA grants run for 5 years (such as i3)
Impact on DPS Budgets
� The majority of ARRA funds were spent on infrastructure projects that do not result in a funding cliff
� Reductions in the formula grants are being addressed by reductions in centrally managed programs and cuts in Title I per pupil funding
$0
$10
$20
$30
$40
$50
$60
FY10 Actual FY11 Actual FY12 Budget FY13 Budget
Title I Actual Expenses & Budgets ($ M)
$52.0
$40.0$41.8
$38.3

Table of Contents
- 14 -
I. FY2011-12 Reviewa) FY2011-12 Guiding principlesb) FY2011-12 Decisions linking to guiding principlesc) Central support services impact on operating budget
II. FY2012-13 Budgeting Processa) 2012 calendar
III. FY2012-13 Funding Update
IV. FY2012-13 Recommendationsa) Summary links to guiding principlesb) Summary of operating budget recommendationsc) Budget recommendation detailsd) Summary of SBB recommendationse) Select ideas that were not recommended
V. 2012 Bond & Mill Levy Override Planninga) Planning timeline b) Mill levy override funding levelsc) Summary areas of investment interest
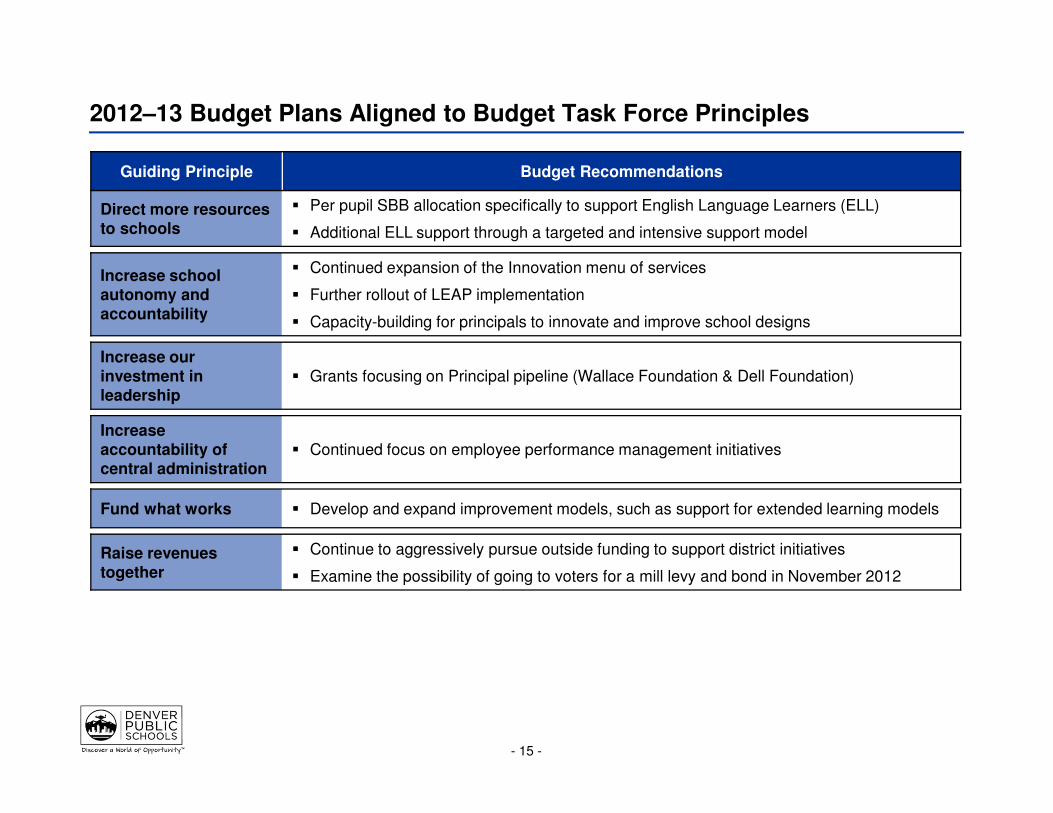
2012–13 Budget Plans Aligned to Budget Task Force Principles
- 15 -
Guiding Principle Budget Recommendations
Direct more resources to schools
� Per pupil SBB allocation specifically to support English Language Learners (ELL)
� Additional ELL support through a targeted and intensive support model
Increase school autonomy and accountability
� Continued expansion of the Innovation menu of services
� Further rollout of LEAP implementation
� Capacity-building for principals to innovate and improve school designs
Increase our investment in leadership
� Grants focusing on Principal pipeline (Wallace Foundation & Dell Foundation)
Increaseaccountability of central administration
� Continued focus on employee performance management initiatives
Fund what works � Develop and expand improvement models, such as support for extended learning models
Raise revenues together
� Continue to aggressively pursue outside funding to support district initiatives
� Examine the possibility of going to voters for a mill levy and bond in November 2012
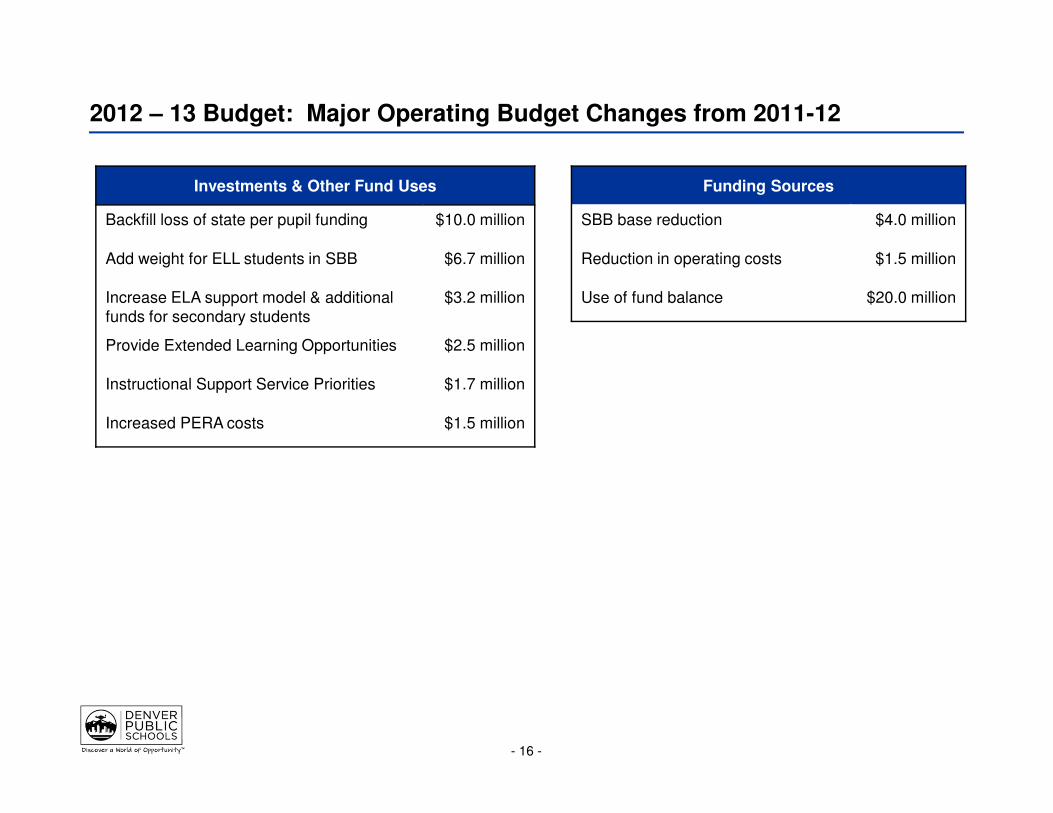
2012 – 13 Budget: Major Operating Budget Changes from 2011-12
- 16 -
Investments & Other Fund Uses
Backfill loss of state per pupil funding $10.0 million
Add weight for ELL students in SBB $6.7 million
Increase ELA support model & additional funds for secondary students
$3.2 million
Provide Extended Learning Opportunities $2.5 million
Instructional Support Service Priorities $1.7 million
Increased PERA costs $1.5 million
Funding Sources
SBB base reduction $4.0 million
Reduction in operating costs $1.5 million
Use of fund balance $20.0 million
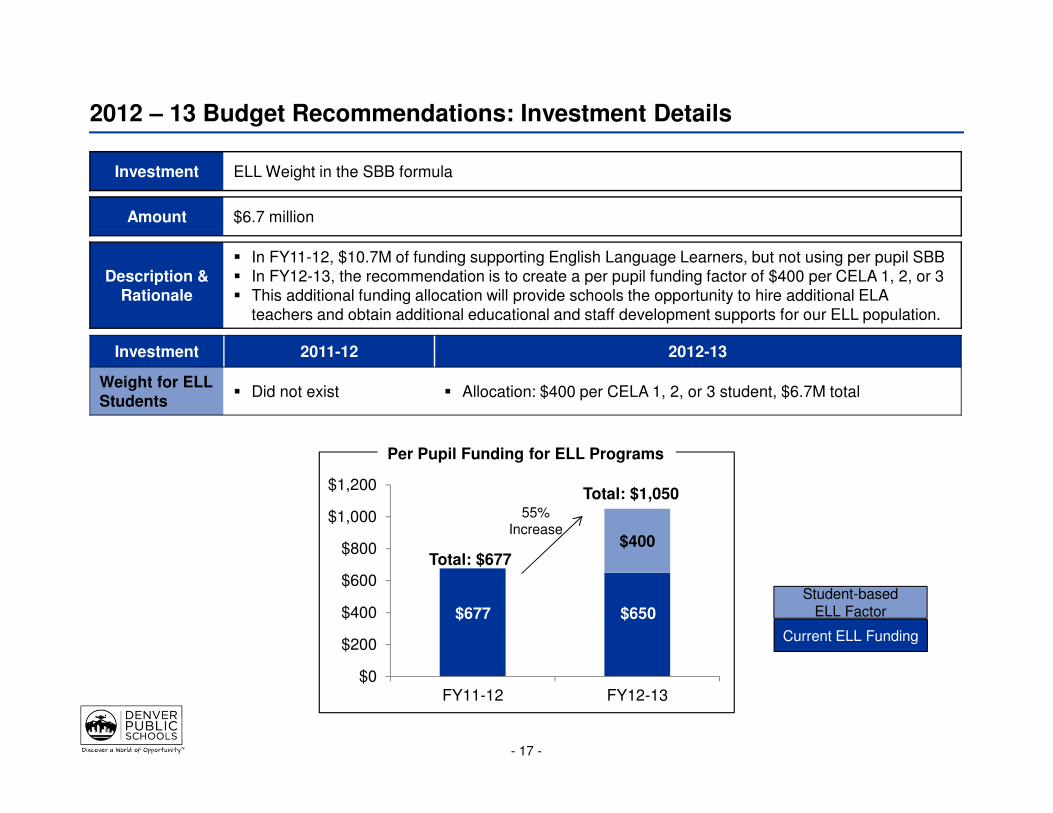
2012 – 13 Budget Recommendations: Investment Details
- 17 -
Investment ELL Weight in the SBB formula
Amount $6.7 million
Description & Rationale
� In FY11-12, $10.7M of funding supporting English Language Learners, but not using per pupil SBB� In FY12-13, the recommendation is to create a per pupil funding factor of $400 per CELA 1, 2, or 3� This additional funding allocation will provide schools the opportunity to hire additional ELA
teachers and obtain additional educational and staff development supports for our ELL population.
Investment 2011-12 2012-13
Weight for ELL Students
� Did not exist � Allocation: $400 per CELA 1, 2, or 3 student, $6.7M total
$400
$0
$200
$400
$600
$800
$1,000
$1,200
FY11-12 FY12-13
Current ELL Funding
Student-based ELL Factor
Total: $677
Total: $1,050
Per Pupil Funding for ELL Programs
55%Increase
$677 $650

2012 – 13 Budget Recommendations: Investment Details
- 18 -
Investment ELA Support Model
Amount $3.2 million
Description & Rationale
� The ELL Support Model provides a tiered approach to provide support to schools.
� ALL SCHOOLS: Raise student performance expectations, build staff capacity of ELL best practices and initiate a shared accountability structure for ELL achievement
� SOME SCHOOLS: Provide additional support for improvement planning and coaching
� HIGH NEEDS SCHOOLS: Provide targeted and differentiated resources to position them to make significant progress on ELL achievement
� Add an ELA-S resource teacher to secondary schools that have a significant ELL population, but do not meet requirements to be a program school (ELL population between 51-99)
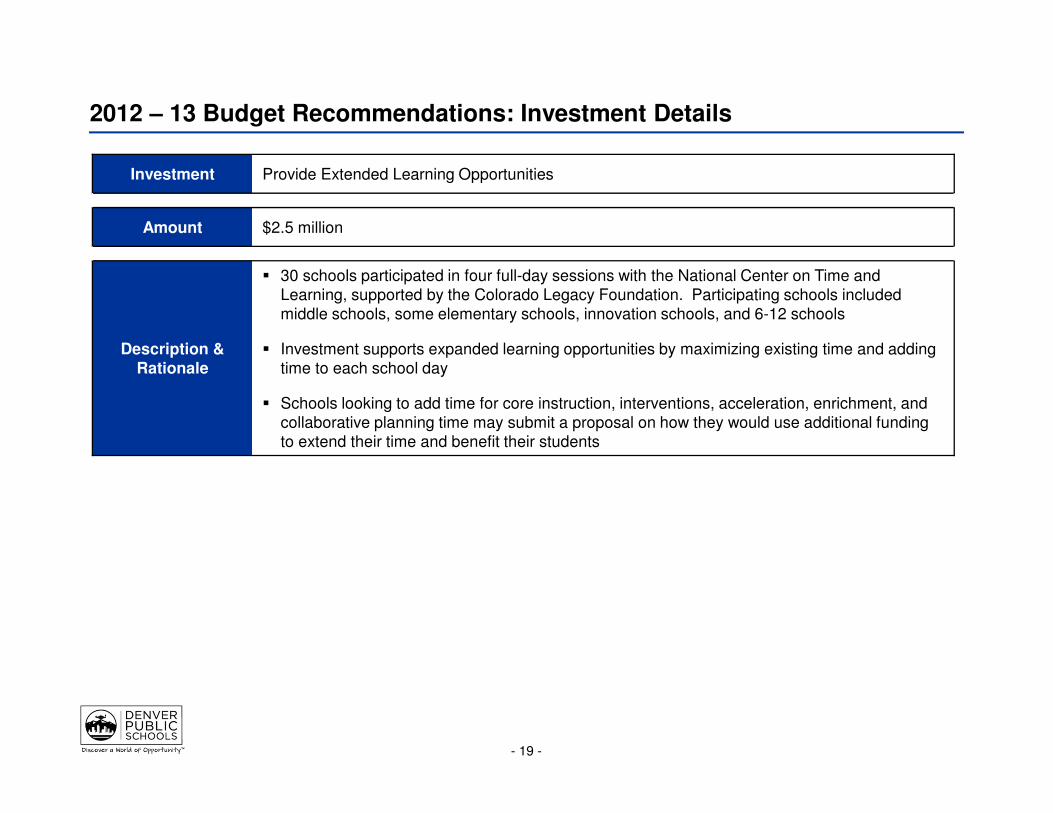
2012 – 13 Budget Recommendations: Investment Details
- 19 -
Investment Provide Extended Learning Opportunities
Amount $2.5 million
Description & Rationale
� 30 schools participated in four full-day sessions with the National Center on Time and Learning, supported by the Colorado Legacy Foundation. Participating schools included middle schools, some elementary schools, innovation schools, and 6-12 schools
� Investment supports expanded learning opportunities by maximizing existing time and adding time to each school day
� Schools looking to add time for core instruction, interventions, acceleration, enrichment, and collaborative planning time may submit a proposal on how they would use additional funding to extend their time and benefit their students
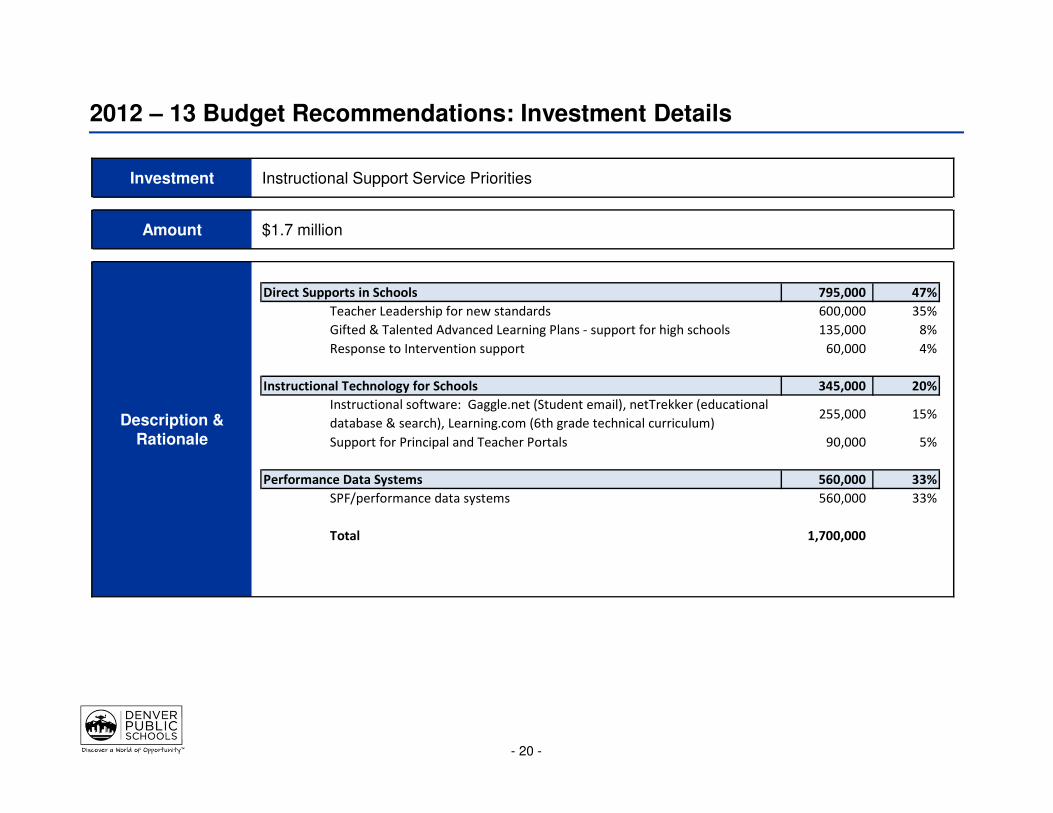
2012 – 13 Budget Recommendations: Investment Details
- 20 -
Investment Instructional Support Service Priorities
Amount $1.7 million
Description & Rationale
795,000 47%
Teacher Leadership for new standards 600,000 35%
Gifted & Talented Advanced Learning Plans - support for high schools 135,000 8%
Response to Intervention support 60,000 4%
345,000 20%
Instructional software: Gaggle.net (Student email), netTrekker (educational
database & search), Learning.com (6th grade technical curriculum)255,000 15%
Support for Principal and Teacher Portals 90,000 5%
560,000 33%
SPF/performance data systems 560,000 33%
Total 1,700,000
Performance Data Systems
Direct Supports in Schools
Instructional Technology for Schools

2012 – 13 Budget Recommendations: Reduction Details
- 21 -
Funds Impacted SBB Reduction to the Base to Align with Average Teacher Salary
Amount $4 million reduction
Description & Rationale
� Reduction reflects a decrease in average compensation costs from the prior year due to:
- No salary increases this year
- Staff turnover has resulted in a reduction in average cost per teacher
� This will not result in a change in purchasing power/reduction in staffing levels for schools.
FundingSource
2011-12 2012-13
Reduce SBB Base by 1.5%
� Allocation: $3,931
� Increased $403 versus 2010-11, due to base reallocations and overall increases
� Allocation: $3,872
� No loss in purchasing power due to average salary declines of 1.5% (~$4M in savings)
2012 – 13 Budget Recommendations: Reduction Details
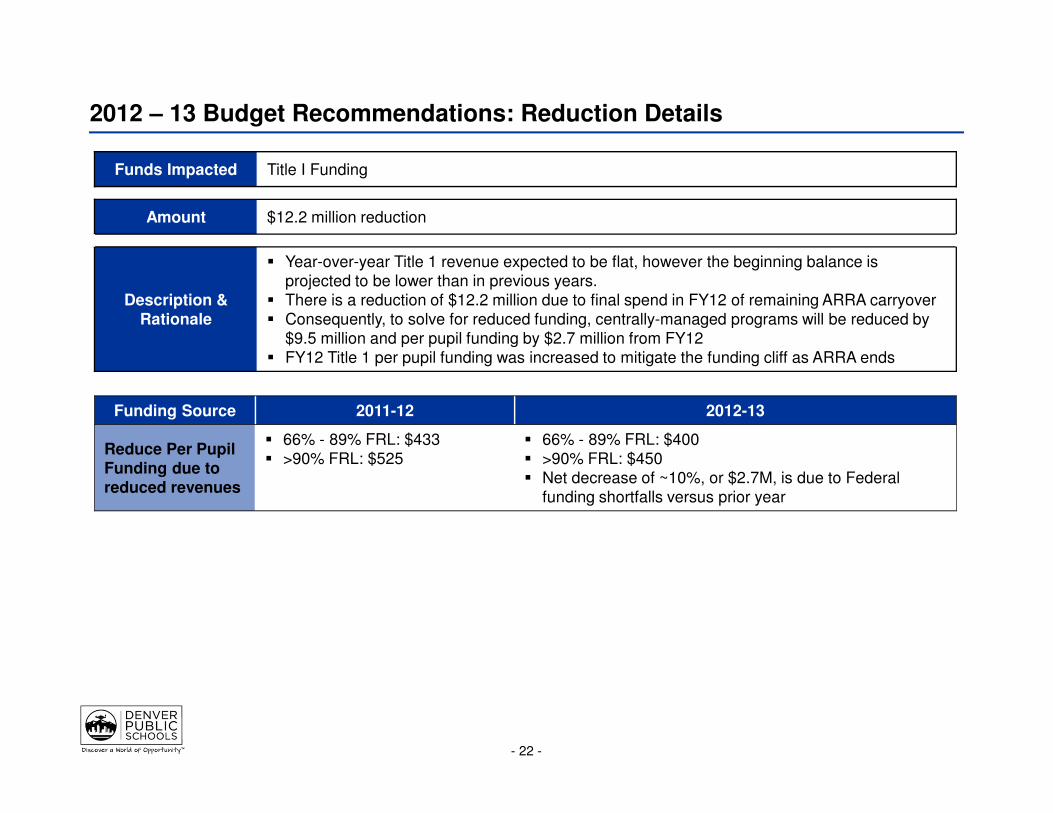
- 22 -
Funds Impacted Title I Funding
Amount $12.2 million reduction
Description & Rationale
� Year-over-year Title 1 revenue expected to be flat, however the beginning balance is projected to be lower than in previous years.
� There is a reduction of $12.2 million due to final spend in FY12 of remaining ARRA carryover� Consequently, to solve for reduced funding, centrally-managed programs will be reduced by
$9.5 million and per pupil funding by $2.7 million from FY12 � FY12 Title 1 per pupil funding was increased to mitigate the funding cliff as ARRA ends
Funding Source 2011-12 2012-13
Reduce Per Pupil Funding due to reduced revenues
� 66% - 89% FRL: $433� >90% FRL: $525
� 66% - 89% FRL: $400� >90% FRL: $450� Net decrease of ~10%, or $2.7M, is due to Federal
funding shortfalls versus prior year

2012 – 13 Budget Recommendations: Investment Details
- 23 -
Investment PERA Cost Increases
Amount $1.5 million
Description & Rationale
� By statute, pension costs will increase by 0.9% of payroll
� By statute, 0.5% of this amount is to come from the employee and 0.4% from the employer.
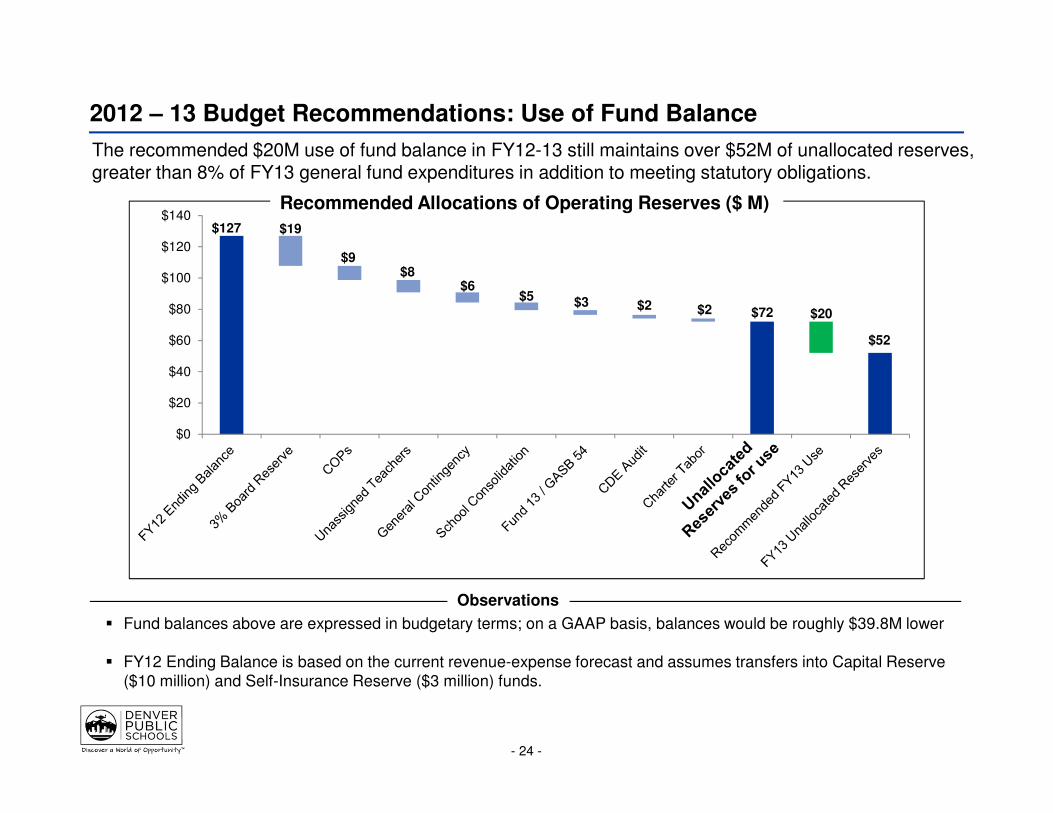
2012 – 13 Budget Recommendations: Use of Fund Balance
- 24 -
� Fund balances above are expressed in budgetary terms; on a GAAP basis, balances would be roughly $39.8M lower
� FY12 Ending Balance is based on the current revenue-expense forecast and assumes transfers into Capital Reserve ($10 million) and Self-Insurance Reserve ($3 million) funds.
The recommended $20M use of fund balance in FY12-13 still maintains over $52M of unallocated reserves, greater than 8% of FY13 general fund expenditures in addition to meeting statutory obligations.
Observations
$127
$6$5 $3 $2 $2 $20
$0
$20
$40
$60
$80
$100
$120
$140Recommended Allocations of Operating Reserves ($ M)
$19
$9$8
$72
$52

Select ideas that were not funded
- 25 -
Opportunity Rationale for Lower Priority
Extended learning time district-wideExtensive costs make this prohibitive in the current funding environment. Will pursue partial roll-out
Early Education ExpansionEnrollment not increased due to existing funding deficit and flat funding from CPP and DPP
Expansion of enrichment programsPrioritized core subject initiatives over enrichment programs due to funding cuts
Additional TECs (Teacher Effectiveness Coaches)Will continue to use existing personnel (~35) to support LEAP pilot phase
Additional SBB for SPF Green Schools (meeting expectations)
Will continue to fund schools that have increased their SPF until additional funding is available
Additional purchases of assessment support technology
Tango will continue to be available in Title I schools, district-wide rollout contingent upon additional funding
Backfill Reading Recovery cutsSchools have the ability to maintain this program through their SBB spending decisions

$38.9 $13.2
$5.4
$4.9
$4.2
$2.7
$1.4$7.2
$0
$5
$10
$15
$20
$25
$30
$35
$40
$45
Total Costs CPP Tuition DPP Gen Fund:Kinder
2003 MillLevy
State-FundKinder
FundingShortfall
Funding Overview of Early Childhood Education & Full Day Kindergarten
- 26 -
Costs
Revenues
Shortfall
Early Childhood Education: FY12-13 Budget ($ M)
There is currently a $7.2M annual funding shortfall to maintain the ECE and full-day kindergarten programs at current levels. In prior years, additional DPP funds and the 2003 MLO reserves have been able to cover this, but going forward general fund backfills are required.
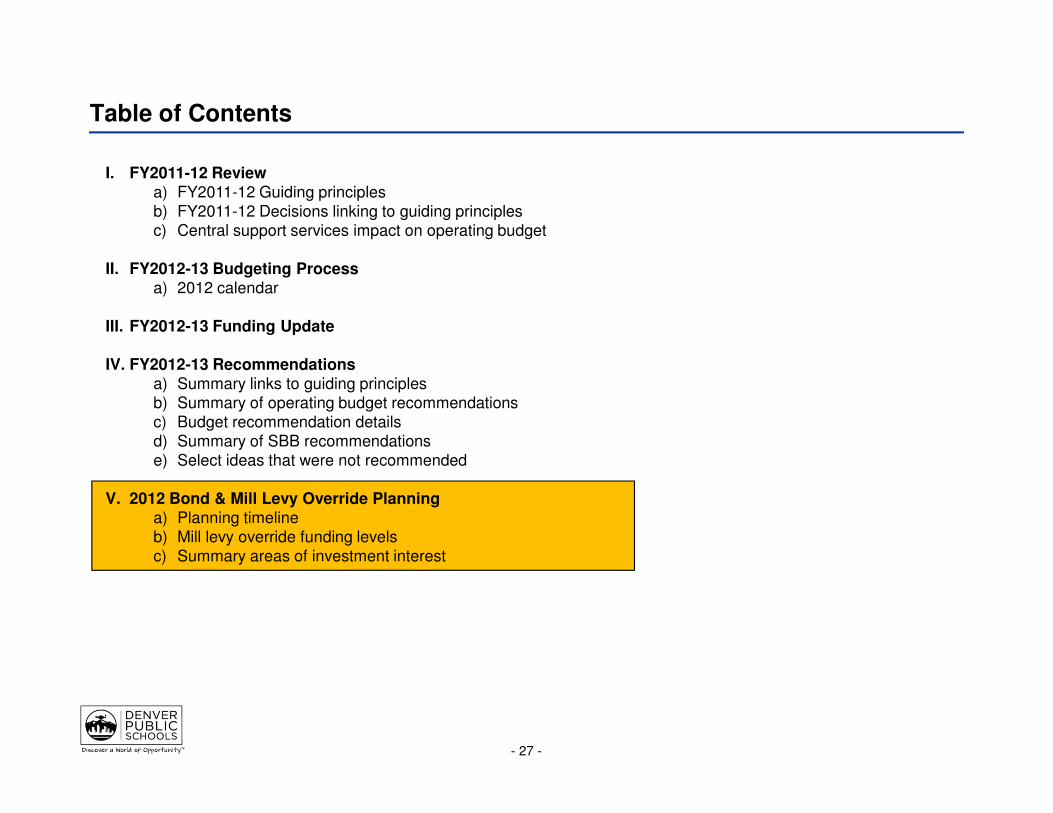
Table of Contents
- 27 -
I. FY2011-12 Reviewa) FY2011-12 Guiding principlesb) FY2011-12 Decisions linking to guiding principlesc) Central support services impact on operating budget
II. FY2012-13 Budgeting Processa) 2012 calendar
III. FY2012-13 Funding Update
IV. FY2012-13 Recommendationsa) Summary links to guiding principlesb) Summary of operating budget recommendationsc) Budget recommendation detailsd) Summary of SBB recommendationse) Select ideas that were not recommended
V. 2012 Bond & Mill Levy Override Planninga) Planning timeline b) Mill levy override funding levelsc) Summary areas of investment interest
2012 Bond-Mill Levy: Summary Project Plan
- 28 -
2012
Jan Feb Mar Apr May Jun Jul
OverallCPAC Kickoff
CPAC Leads Kickoff
Board Approval
Initial CPAC Community Meetings
� Different topics per location
� Briefings and gather input
� Full CPAC meet monthly
� Sub-committee meet monthly
Second Round of CPAC Community Meetings
� Different locations across regions
� Focus on recommendations
DPS Tour of Needs� Week prior to the Board vote
� Media coverage
� CPAC members present to the attendees between stops
Key Community Organization Meetings
Groups include: A+, INC, LWV, City Council, Compact, Rotary, etc.
DPS Regional Briefings / Parent Forum
Aug Sep
County Clerk Submission
July 27
School Board & Student Board Updates
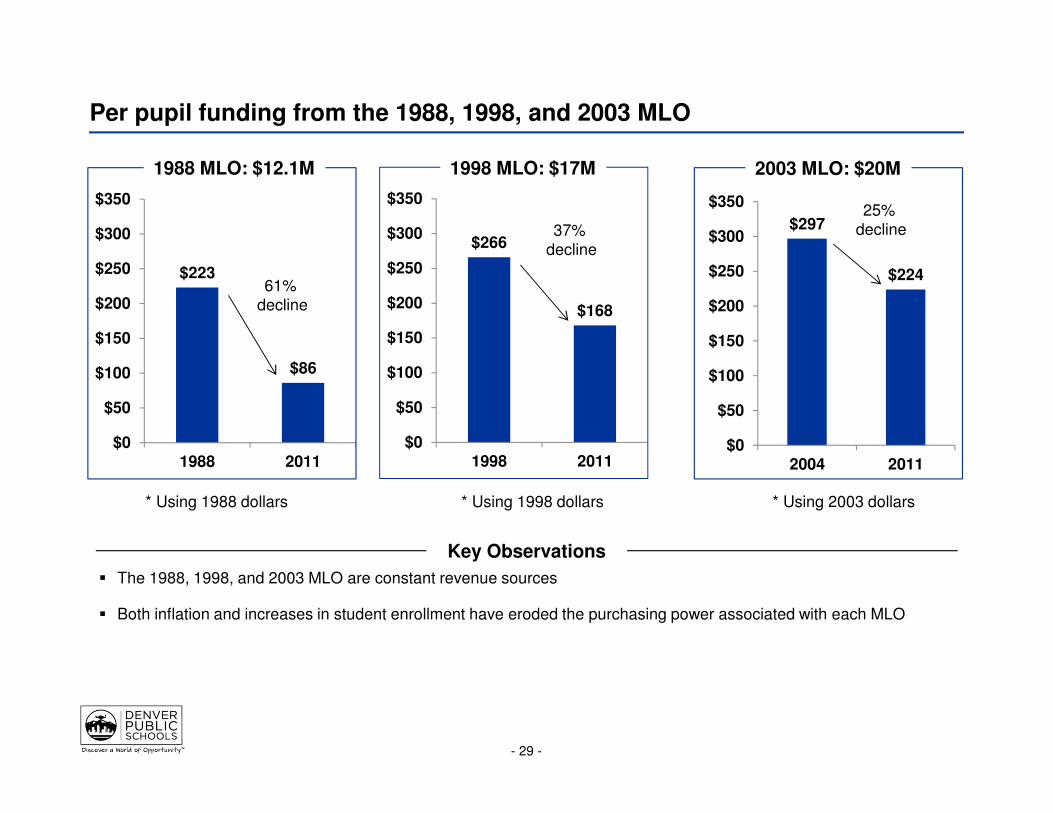
Per pupil funding from the 1988, 1998, and 2003 MLO
� The 1988, 1998, and 2003 MLO are constant revenue sources
� Both inflation and increases in student enrollment have eroded the purchasing power associated with each MLO
- 29 -
Key Observations
$297
$224
$0
$50
$100
$150
$200
$250
$300
$350
2004 2011
2003 MLO: $20M
$266
$168
$0
$50
$100
$150
$200
$250
$300
$350
1998 2011
1998 MLO: $17M
37% decline
25% decline
* Using 1998 dollars * Using 2003 dollars
$223
$86
$0
$50
$100
$150
$200
$250
$300
$350
1988 2011
1988 MLO: $12.1M
61% decline
* Using 1988 dollars

Mill Impact for 1988, 1998, and 2003 MLO
� The 1988, 1998, and 2003 MLO are constant revenue sources
� Due to increases in assessed value, the number of mills per household required to fund the MLO has decreased
- 30 -
Key Observations
2.46
1.79
0.0
0.5
1.0
1.5
2.0
2.5
3.0
2004 2011
2003 MLO: $20M
2.55
1.19
0.0
0.5
1.0
1.5
2.0
2.5
3.0
1988 2011
As
se
ss
ed
Mil
ls
1988 MLO: $12M
2.70
1.52
0.0
0.5
1.0
1.5
2.0
2.5
3.0
1998 2011
1998 MLO: $17M
53% decline
44% decline 27%
decline
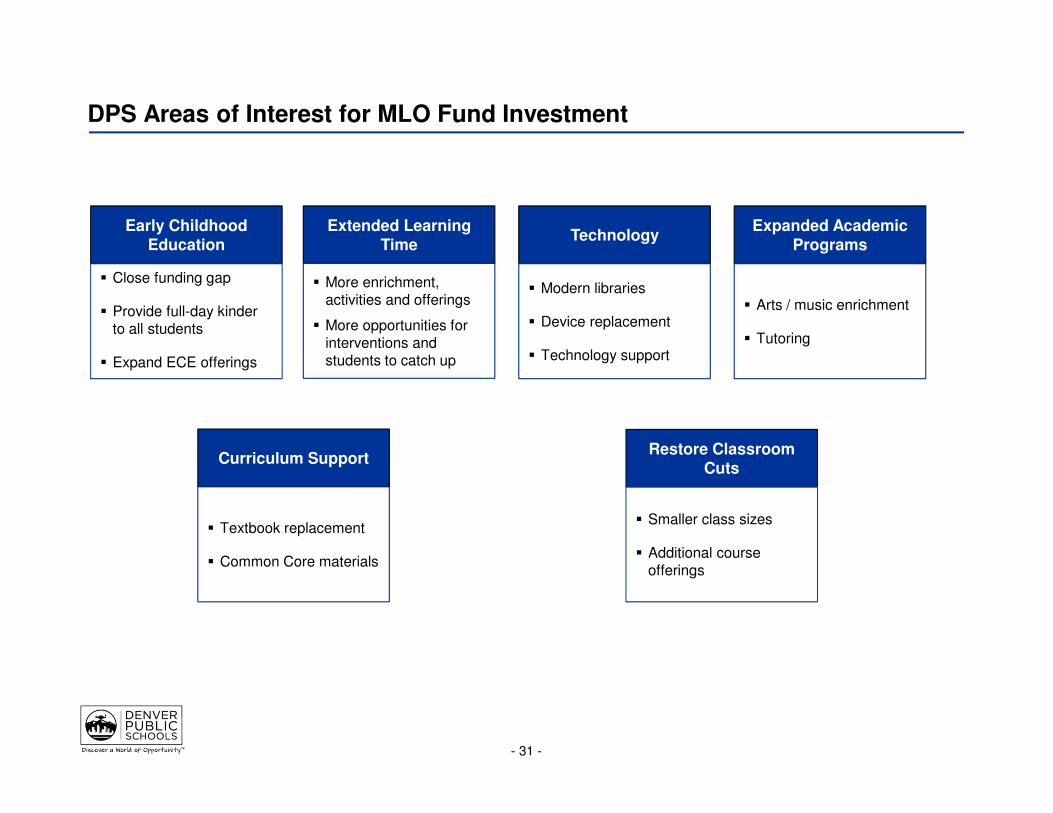
DPS Areas of Interest for MLO Fund Investment
- 31 -
Early Childhood Education
� Close funding gap
� Provide full-day kinder to all students
� Expand ECE offerings
Extended Learning Time
� More enrichment, activities and offerings
� More opportunities for interventions and students to catch up
Technology
� Modern libraries
� Device replacement
� Technology support
Expanded Academic Programs
� Arts / music enrichment
� Tutoring
Curriculum Support
� Textbook replacement
� Common Core materials
Restore Classroom Cuts
� Smaller class sizes
� Additional course offerings
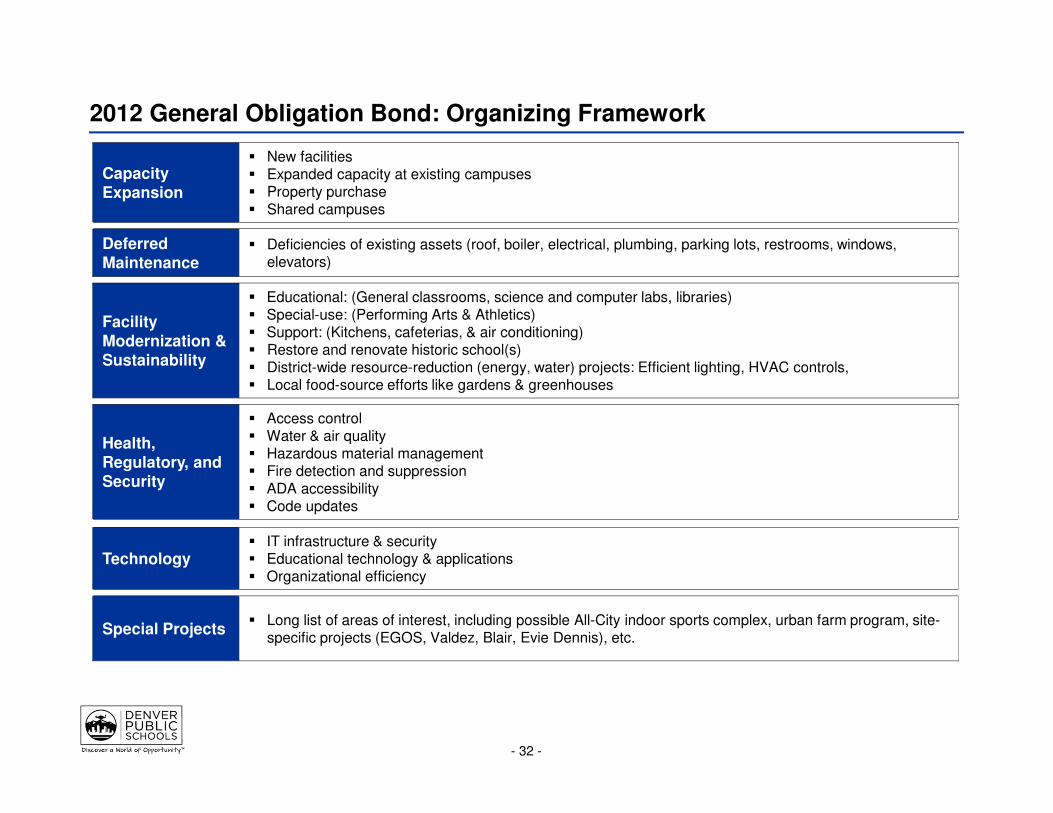
2012 General Obligation Bond: Organizing Framework
- 32 -
Capacity Expansion
� New facilities� Expanded capacity at existing campuses� Property purchase� Shared campuses
Deferred Maintenance
� Deficiencies of existing assets (roof, boiler, electrical, plumbing, parking lots, restrooms, windows, elevators)
Facility Modernization &Sustainability
� Educational: (General classrooms, science and computer labs, libraries)� Special-use: (Performing Arts & Athletics)� Support: (Kitchens, cafeterias, & air conditioning)� Restore and renovate historic school(s)� District-wide resource-reduction (energy, water) projects: Efficient lighting, HVAC controls, � Local food-source efforts like gardens & greenhouses
Health, Regulatory, and Security
� Access control� Water & air quality� Hazardous material management� Fire detection and suppression� ADA accessibility� Code updates
Technology� IT infrastructure & security� Educational technology & applications� Organizational efficiency
Special Projects� Long list of areas of interest, including possible All-City indoor sports complex, urban farm program, site-
specific projects (EGOS, Valdez, Blair, Evie Dennis), etc.