2011 - wwf deutschland · 2011 study eating habits meat consumption land consumption meat eats...
TRANSCRIPT
2011
STUDY
Eating habits Land consumptionMeat consumption
MEAT EATS LAND
Imprint
Published by WWF Germany, Berlin September 2011
Authors Harald von Witzke, Steffen Noleppa, Inga Zhirkova
Editors/Coordination Tanja Dräger de Teran, Thomas Köberich/WWF Germany
Contact [email protected]
Design/Layout Thomas Schlembach/WWF Germany

Contents
Summary 5
1. Problem definition and objectives 9
2. Eating habits in Germany: A brief history 13
3. Meat consumption and health 20
4. Meat consumption and the demand for feed 23
5. Agricultural trade and virtual land trade by the EU and Germany 28
5.1 Methodological concept for the assessment of virtual land trade 28
5.2 Agricultural foreign trade and virtual land trade by the EU and Germany 32
5.3 Virtual land imports resulting from soya imports 38
5.4 Virtual land imports resulting from the trade in meat 50
6. Our meat consumption’s “footprints” in terms of agricultural land and soya 56
WWF recommendations, demands, and activities 63
References 70
Meat Eats Land | 3

What does our meat consumption have to do with the cutting down of tropical rainfo-rests in Latin America or with the destruction of the Brazilian savanna, the Cerrado? How much soya is being imported into the EU and Germany? Which countries does the soya come from and how large is the EU’s and Germany’s “land footprint” in those countries to satisfy the demand for soya? What, if anything, is soya doing in cattle, pig and poultry feed in the first place? How much soya are we actually consuming when we are eating chicken or pigmeat? What size is the “land and soya footprint” of each German person eating the average amount of meat of approximately 60 kg per year and what size is the total “footprint” for Germany? What size is the “land and soya footprint” of a pork roast, a grilled sausage, or a hamburger?
This study, as commissioned by WWF, addresses the above questions. Based on the concept of “virtual land trade” it analyses the agricultural trade flows of the EU and Germany and converts them into land areas required for the production of the agricultural commodities in question, e.g. soyameal or wheatmeal. If the EU’s total agricultural trade is assessed in this manner and converted into land areas it is obvious that the EU engages in the large-scale virtual importation of land; in other words, it utilizes land outside of the Communities borders. In the years of the last decade, more than 30 million ha were involved, of which 20 million ha are located in South America. This is roughly equivalent to the combined land areas of Hungary and Portugal.
In the 2008-2010 period, Germany’s share in this “virtual land trade” comprised almost 7 million ha, or almost 25 % of the total virtual land trade by the EU, which roughly equates to an area the size of Bavaria. Of these, 4.4 million ha were in South America. Compared to the years prior to this period, Germany’s contribution to the EU’s agricultural trade and virtual land trade has increased significantly. Germany’s own agricultural area comprises approximately 17 million ha. Given a virtual land grab of 7 million ha, this means that Germany utilizes additional land outside of the EU equating to more than 40 % of its own agricultural land base. One agricultural commodity in particular is responsible: the production of soyabeans alone accounts for 40 % of Germany’s virtual land grab.
In 2008-2010 the EU imported on average approximately 35 million tonnes (Mt) of soya and soya products (including 13 Mt of soyabeans, more than 21 Mt of soyabean meal and 380.000 tonnes of soyabean oil). Soyabeans are further processed into soyabean oil and soyabean meal. Soyabean meal is used almost exclusively to feed livestock. About 88 % of net imports of soyabeans and soyabean products originate in South America, primarily in Brazil and Argentina. At 6.4 Mt, Germany’s share in these net imports and thus its share in total EU foreign trade in soyabean products is very significant.
Summary
Meat Eats Land | 5
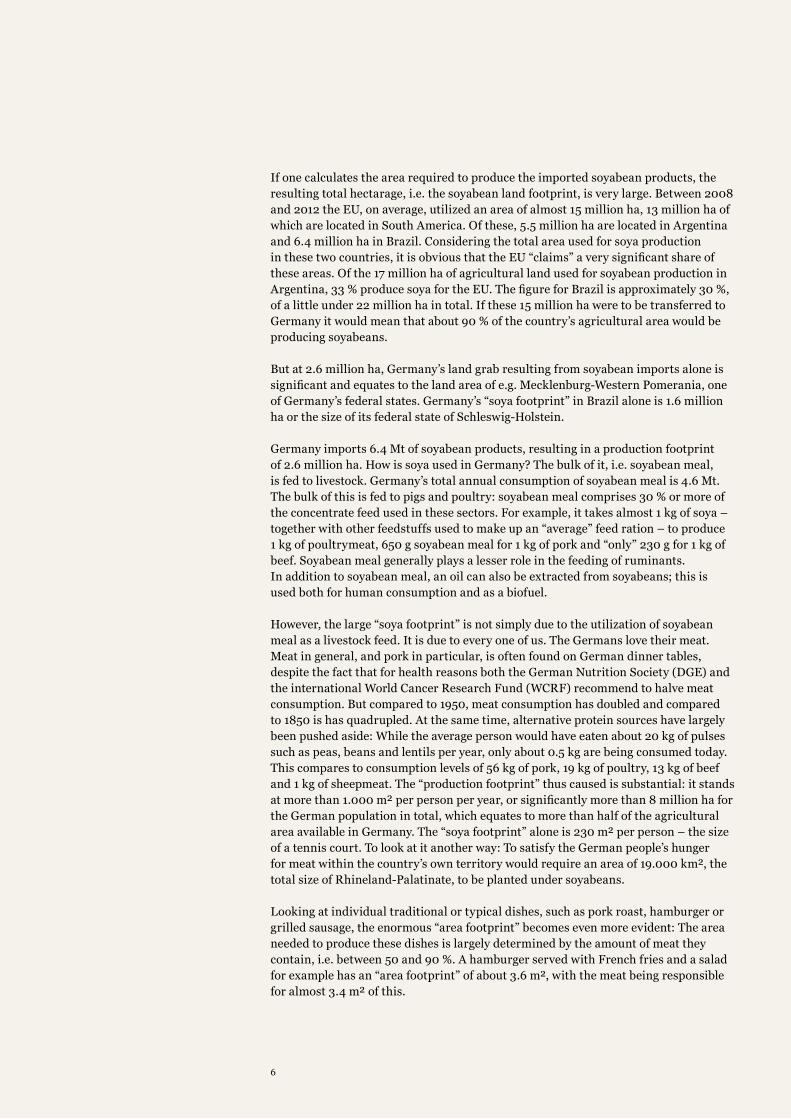
If one calculates the area required to produce the imported soyabean products, the resulting total hectarage, i.e. the soyabean land footprint, is very large. Between 2008 and 2012 the EU, on average, utilized an area of almost 15 million ha, 13 million ha of which are located in South America. Of these, 5.5 million ha are located in Argentina and 6.4 million ha in Brazil. Considering the total area used for soya production in these two countries, it is obvious that the EU “claims” a very significant share of these areas. Of the 17 million ha of agricultural land used for soyabean production in Argentina, 33 % produce soya for the EU. The figure for Brazil is approximately 30 %, of a little under 22 million ha in total. If these 15 million ha were to be transferred to Germany it would mean that about 90 % of the country’s agricultural area would be producing soyabeans.
But at 2.6 million ha, Germany’s land grab resulting from soyabean imports alone is significant and equates to the land area of e.g. Mecklenburg-Western Pomerania, one of Germany’s federal states. Germany’s “soya footprint” in Brazil alone is 1.6 million ha or the size of its federal state of Schleswig-Holstein.
Germany imports 6.4 Mt of soyabean products, resulting in a production footprint of 2.6 million ha. How is soya used in Germany? The bulk of it, i.e. soyabean meal, is fed to livestock. Germany’s total annual consumption of soyabean meal is 4.6 Mt. The bulk of this is fed to pigs and poultry: soyabean meal comprises 30 % or more of the concentrate feed used in these sectors. For example, it takes almost 1 kg of soya – together with other feedstuffs used to make up an “average” feed ration – to produce 1 kg of poultrymeat, 650 g soyabean meal for 1 kg of pork and “only” 230 g for 1 kg of beef. Soyabean meal generally plays a lesser role in the feeding of ruminants.In addition to soyabean meal, an oil can also be extracted from soyabeans; this is used both for human consumption and as a biofuel.
However, the large “soya footprint” is not simply due to the utilization of soyabean meal as a livestock feed. It is due to every one of us. The Germans love their meat. Meat in general, and pork in particular, is often found on German dinner tables, despite the fact that for health reasons both the German Nutrition Society (DGE) and the international World Cancer Research Fund (WCRF) recommend to halve meat consumption. But compared to 1950, meat consumption has doubled and compared to 1850 is has quadrupled. At the same time, alternative protein sources have largely been pushed aside: While the average person would have eaten about 20 kg of pulses such as peas, beans and lentils per year, only about 0.5 kg are being consumed today. This compares to consumption levels of 56 kg of pork, 19 kg of poultry, 13 kg of beef and 1 kg of sheepmeat. The “production footprint” thus caused is substantial: it stands at more than 1.000 m² per person per year, or significantly more than 8 million ha for the German population in total, which equates to more than half of the agricultural area available in Germany. The “soya footprint” alone is 230 m² per person – the size of a tennis court. To look at it another way: To satisfy the German people’s hunger for meat within the country’s own territory would require an area of 19.000 km², the total size of Rhineland-Palatinate, to be planted under soyabeans.
Looking at individual traditional or typical dishes, such as pork roast, hamburger or grilled sausage, the enormous “area footprint” becomes even more evident: The area needed to produce these dishes is largely determined by the amount of meat they contain, i.e. between 50 and 90 %. A hamburger served with French fries and a salad for example has an “area footprint” of about 3.6 m², with the meat being responsible for almost 3.4 m² of this.
6

Clearly the area footprints of our overall highly meat-based diet are very large. Given that the land requirements for our meat consumption have a direct impact on land use in other countries outside of Europe, and in Brazil and Argentina in particular, each and every one of us should be conscious of our responsibilities with regard to resource protection. The cutting down of tropical rainforests and the ploughing up of grasslands as a consequence of the expansion of agricultural lands result in signifi-cant impacts on climate and biodiversity.
In South America for example almost 4 million ha of forests are still being destroyed every year, 2.6 million ha in Brazil alone. While these figures are lower than those recorded in the 1990s they clearly are still much too high and soya-based livestock production plays a major role in this ongoing destruction. If we do not manage to moderate our consumption of livestock-based foods, and meat in particular, this process is very likely to continue. We need a more conscious approach to eating meat. This would not only benefit the environment and species diversity and would decrease the amount of production area required, it would also be very beneficial for health reasons.
Further research is needed on eating habits and their successive modification. Many questions need to be answered: What would be the impact on land consumption of changes in dietary patterns in Germany? What would be the consequences on the demand for feedstuffs such as soya and on foreign trade? What would be the impact of changing eating habits on virtual land consumption and on land use, for example with respect to tropical rainforests and the Cerrado in South America? What would be the positive effects in terms of the greenhouse gas balance? These and other questions will need to be assessed further to the study report which is documented below. They denote what further steps are required, steps the WWF and the authors of the study are ready to take.
As a next step, WWF is planning to develop a number of scenarios with respect to changes in eating habits as well as food waste. In particular, the question will be addressed as to how certain types of diets impact on virtual land grab and on the production of greenhouse gas emissions.
Tanja Dräger de Teran/WWF
Meat Eats Land | 7
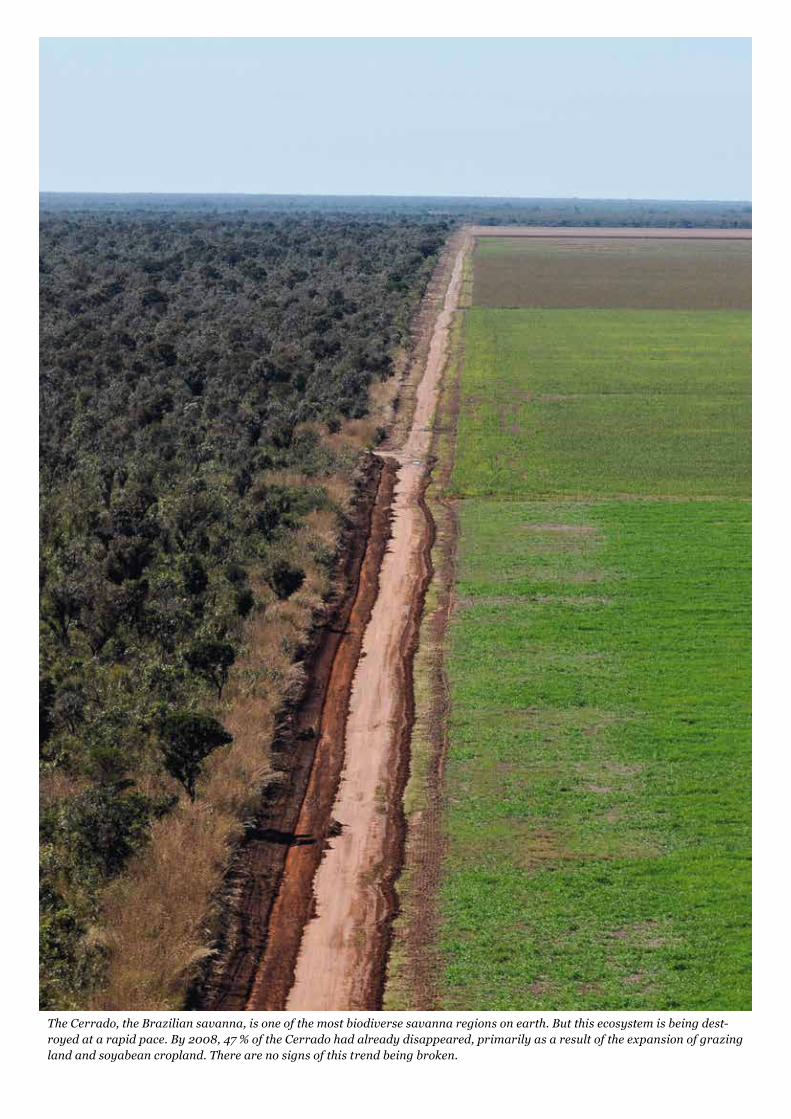
The Cerrado, the Brazilian savanna, is one of the most biodiverse savanna regions on earth. But this ecosystem is being dest-royed at a rapid pace. By 2008, 47 % of the Cerrado had already disappeared, primarily as a result of the expansion of grazing land and soyabean cropland. There are no signs of this trend being broken.
1 . Problem definition and objectives
Land area needed for global livestock production
Over the past twenty years meat consumption has increased in all the regions of the world except for Africa. While in the industrialized countries meat consumption has shown only a slight increase, albeit coming from a high level, the increases in developing and emerging countries were considerable (FAO, 2010). There has been a corresponding rapid increase in meat production over the past decades. Global meat production more than quadrupled between 1961 and 2009 from just over 70 million tonnes (Mt) to almost 300 Mt (FAO, 2011). And this trend does not seem to be abating (FAO, 2010).
That is the situation. So where is the problem? To begin with, livestock-based foods require a much greater area for their production, i.e. grassland and arable land for feed production, than plant-based foods. Already about a third of the land area worldwide is used in one way or another to produce livestock. This makes livestock production the largest land use by far in terms of area, and the trend is still upwards (FAO, 2010). The expansion of grassland and tillage land use for the production of feedstuffs is therefore also an important factor in global land use changes.
Destruction of natural habitats as a result of livestock production
The cutting down of tropical rainforests for the purposes of creating pastureland or arable land for feed production is one of the most momentous land use changes. The impact can be dramatic, with serious repercussions for i.a. the climate, the regional water regime and regional species diversity. Livestock production has meanwhile, in addition to logging, been identified as a main driver of the decline in species diversity in the tropical rainforests of Latin America and the Brazilian Cerrado (i.a. Baines & Jones, 2010; FAO, 2010; Gibson et al., 2011; Sleeswijk et al., 2010).
A further impact of the expansion of agricultural land use is that deforestation and the conversion of natural grasslands to arable land release large quantities of the greenhouse gas carbon dioxide (Searchinger et al., 2008; Tyner et al., 2010). Indeed, global land use change contributes to climate change to a greater extent than the global industrial production or global transport (e.g. Stern, 2007; WEF, 2010).
Meat Eats Land | 9
The role of the EU
The EU Member States, and thus also Germany, are part of the problem. The EU in general and Germany in particular have become major net importers of specific agricultural commodities such as soya. Witzke & Noleppa (2009, 2010) as well WTO (2010) for example have concluded that the EU is the world‘s largest net agricultural importer after China and Japan. And there are no indications that there will be any significant changes to this situation in the near future. The challenges connected to this issue are all too powerful, such as the persistently high demand for biofuel, changing consumer preferences in the EU and in other industrial as well as emerging countries, or the drop in productivity increases in European farming (Kirschke et al., 2011).
Agricultural trade and virtual land trade
The growing trade in agricultural commodities is further associated with an in-creasing virtual trade in e.g. workers, water, and land for the production of those commodities. With respect to agricultural commodities and agricultural trade, the land factor is key. For example, if Germany imports a certain quantity of soya from Brazil, its production requires arable land in Brazil. One could say, Germany “gains” arable land while Brazil “looses” arable land in the sense that it can no longer utilize this resource for domestic purposes. What takes place therefore is a virtual export of arable land from Brazil to Germany.
Aims of the study
Full meat counters and supermarket shelves necessitate competitive production. However, production only operates at full force if a continuous supply of feedstuff and other agricultural commodities is guaranteed. Against this background, the key questions to be addressed in this study are as follows: How much land area is needed in total to produce the agricultural commodities imported by the EU? How much land area is needed to satisfy the EU’s demand for soya for livestock feed? Which countries have land resources to produce these feedstuffs? And how big is the “land and soya footprint” of meat, or in other words, how much land does, for example, a pork roast take?
10
Report structure
With a view to answering the above questions, the report is structured as follows:
» Chapter 2 shows how Germany feeds itself today and how dietary preferences have developed over time. Particular consideration is given to the consumption of meat and meat products.
» Chapter 3 examines the health implications of our eating habits, especially with respect to the consumption of livestock-based foods.
» Chapter 4 looks at the connections between meat consumption and the demand for feedstuffs. Which types of feed and what quantity of feed crops are needed to satisfy our demand for meat products?
» Finally, Chapter 5 examines agricultural trade in Germany during the past decade and draws comparisons with the EU as a whole. The focus is on the following questions: How can we quantify the virtual land trade associated with agricultu-ral trade, i.e. the utilization of agricultural land outside of the EU and Germany respectively? How can we calculate land consumption required for the production and consumption of foods? Particular consideration is given to individual prime trading regions, such as Brazil and other South American nations, as well as to the soyabean trade.
» Chapter 6 provides concrete data on land consumption, i.e. the “land and soya footprint” of meat consumption in Germany and concludes with brief pre- liminary results.
The present study is indeed only an initial part of a more comprehensive project. Later in the project the methodology will be expanded with a view to developing a number of scenarios with respect to changes in eating habits as well as food waste. In particular, the question will be addressed as to how certain types of diets impact on virtual land grab and on the production of greenhouse gas emissions.
Meat Eats Land | 11
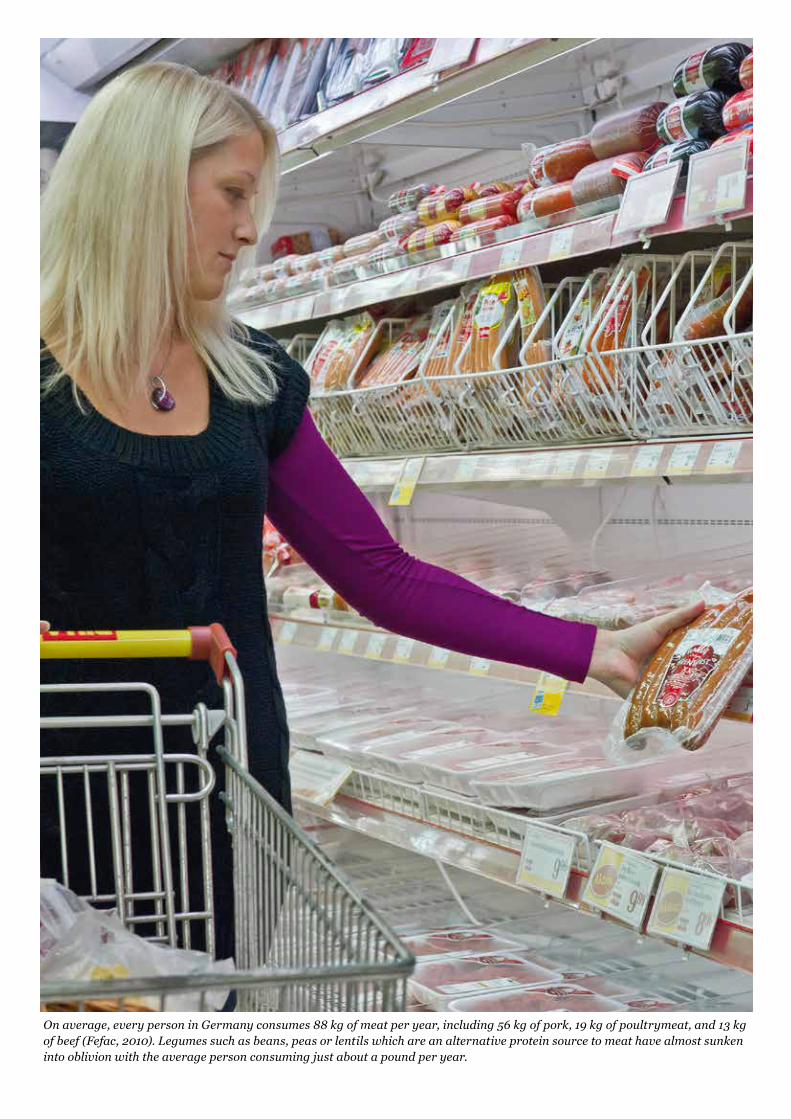
On average, every person in Germany consumes 88 kg of meat per year, including 56 kg of pork, 19 kg of poultrymeat, and 13 kg of beef (Fefac, 2010). Legumes such as beans, peas or lentils which are an alternative protein source to meat have almost sunken into oblivion with the average person consuming just about a pound per year.
2. Eating habits in Germany: A brief history
57 million tonnes of food are consumed in Germany: 700 kg per
inhabitant, 2 kg per person per day.
What is the annual per capita food consumption in Germany?
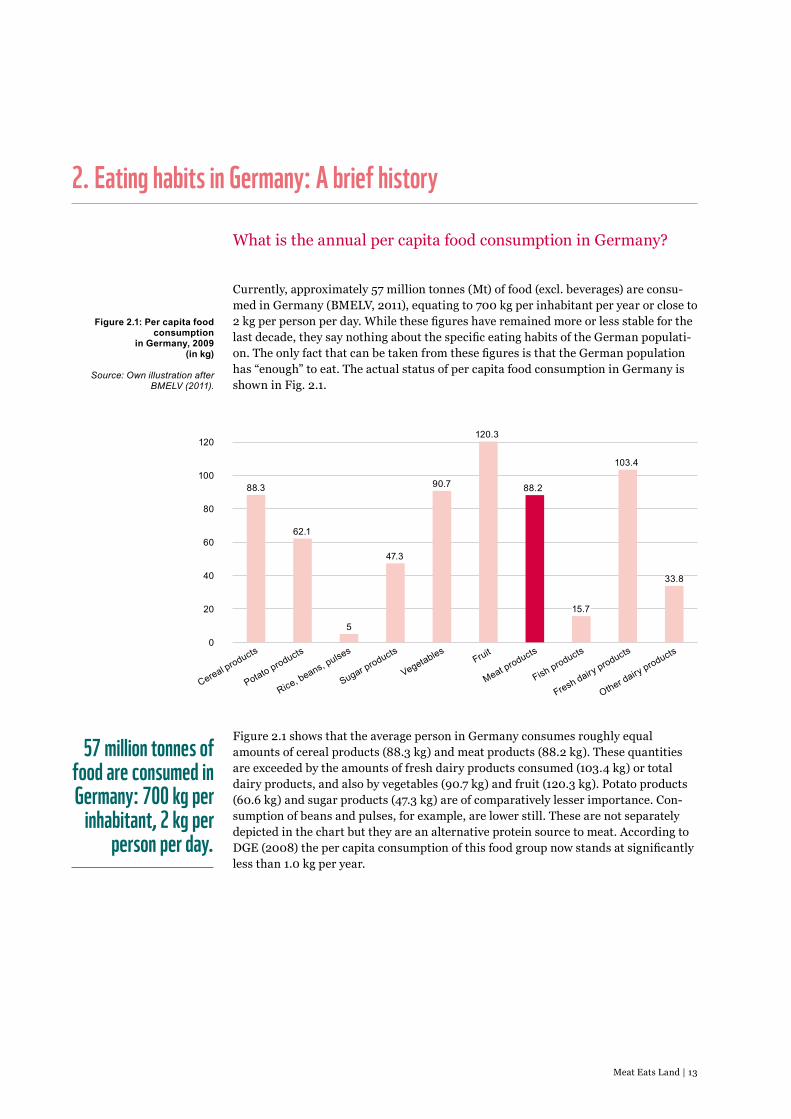
Currently, approximately 57 million tonnes (Mt) of food (excl. beverages) are consu-med in Germany (BMELV, 2011), equating to 700 kg per inhabitant per year or close to 2 kg per person per day. While these figures have remained more or less stable for the last decade, they say nothing about the specific eating habits of the German populati-on. The only fact that can be taken from these figures is that the German population has “enough” to eat. The actual status of per capita food consumption in Germany is shown in Fig. 2.1.
Figure 2.1 shows that the average person in Germany consumes roughly equal amounts of cereal products (88.3 kg) and meat products (88.2 kg). These quantities are exceeded by the amounts of fresh dairy products consumed (103.4 kg) or total dairy products, and also by vegetables (90.7 kg) and fruit (120.3 kg). Potato products (60.6 kg) and sugar products (47.3 kg) are of comparatively lesser importance. Con-sumption of beans and pulses, for example, are lower still. These are not separately depicted in the chart but they are an alternative protein source to meat. According to DGE (2008) the per capita consumption of this food group now stands at significantly less than 1.0 kg per year.
Cereal products
88.3
0
20
40
60
80
100
120
62.1
5
47.3
90.7
120.3
88.2
15.7
103.4
33.8
Potato products
Rice, beans, pulses
Sugar products
VegetablesFruit
Meat products
Fish products
Fresh dairy products
Other dairy products
Figure 2.1: Per capita food consumption
in Germany, 2009 (in kg)
Source: Own illustration after BMELV (2011).
Meat Eats Land | 13
Beef, pork and poultry – How much meat is consumed in Germany?
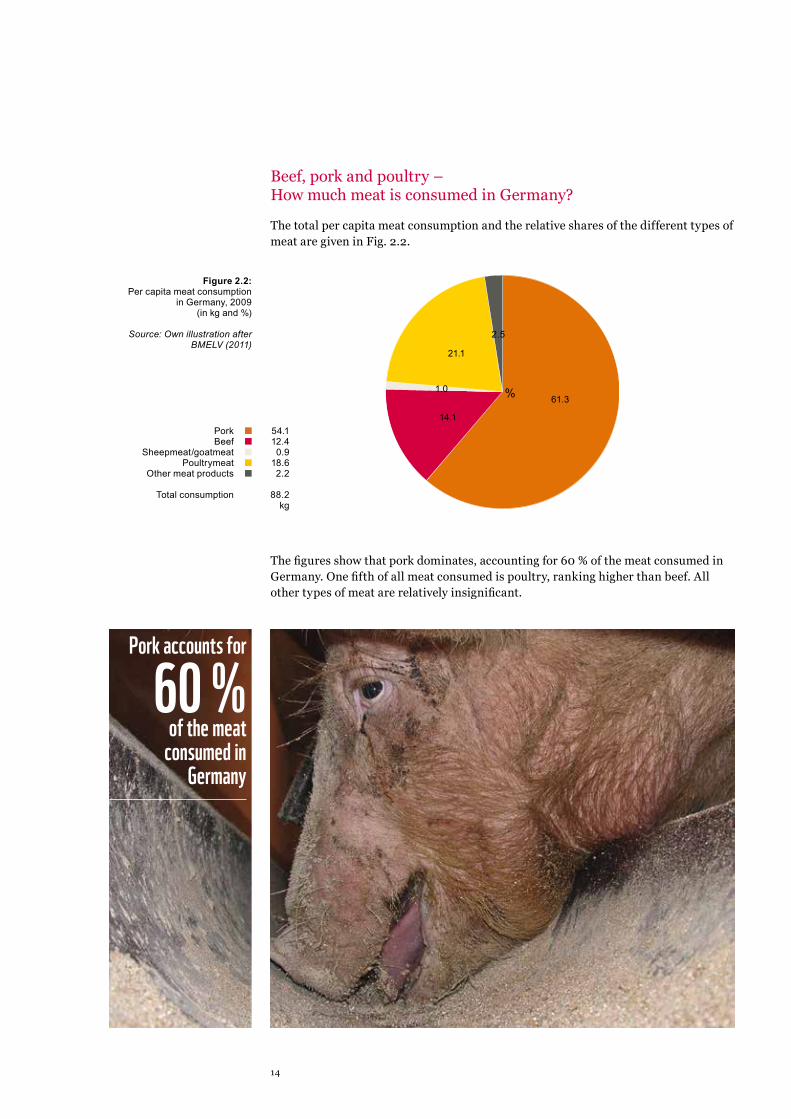
The total per capita meat consumption and the relative shares of the different types of meat are given in Fig. 2.2.
The figures show that pork dominates, accounting for 60 % of the meat consumed in Germany. One fifth of all meat consumed is poultry, ranking higher than beef. All other types of meat are relatively insignificant.
Figure 2.2: Per capita meat consumption
in Germany, 2009 (in kg and %)
Source: Own illustration after BMELV (2011)
PorkBeef
Sheepmeat/goatmeatPoultrymeat
Other meat products
Total consumption
54.112.40.9
18.62.2
88.2kg
61.3 %
14.1
1.0
21.1
2.5
Pork accounts for 60 %
of the meat consumed in
Germany
14

Figure 2.3:Change in per capita
consumption of selected food groups in Germany,
1950-2005 (in kg)
Source: DGE (2008)
Meat (all), pork
Cereal products
There has been a dramatic increase in meat consumption in
Germany since the 1960s.
How have our eating habits changed over time? Food consumption is never static. It is an indicator of eating habits which dynamically develop in different directions and are impacted upon by a number of factors. Fig. 2.3 shows the development of per capita consumption in Germany for the most important food groups over the past six decades. Data up to 1990 refer to the former Federal Republic of Germany (Western Germany), data after 1990 refer to the re-unified Germany.
Fig. 2.3 clearly shows the different trends for different food groups. The dramatic increase in meat consumption from the 1960s until the early 1990s is evident. Since then meat consumption first decreased and then stagnated, albeit at a high level. This trend is largely attributable to the consumption of pork. The consumption of fresh dairy products decreased into the 1980s and has since seen a slight recovery. Cereal products saw a similar, albeit somewhat more pronounced, decline and recovery. Potato consumption however has continued to decline since the 1950s. In 1950 per capita consumption stood at 200 kg, three times as much as today.
The consumption of beans and pulses saw a particularly dramatic decline: While the average person consumed just under 2 kg of beans and pulses per year at the start of the 1960s (Teuteberg, 1979), consumption had dropped to 0.5 kg by 2006 (DGE, 2008).
Potatoes and vegetables
Fresh dairy products
Meat Eats Land | 15

Who ate more meat: Our parents and grandparents or ourselves?
As this study focuses on meat consumption, the following Fig. 2.4 will address the developments with regard to this food group over the past few decades and draw attention to a methodological peculiarity.
A comparison of Figures 2.1-2.3 with the chart above shows that there is a discrepan-cy of almost 30 kg between the different figures for meat consumption. This is due to the fact that Fig. 2.4 only accounts for the consumption of meat that was actually eaten and does not consider meat fed to pets, bones, and other waste products that arise in industrial or domestic processing and food preparation. Moreover, industrial uses have also been deducted (BVDF, 2011).
According to the BVDF (2011) figures, meat consumption in Germany more than doubled between 1950 and 2009 with the most significant increase between 1950 and 1975. At present, there would appear to be a slight decline or a stagnation in demand. Pork consumption almost tripled between 1950 and 2009. Only poultrymeat shows a continuous increase from close to zero to 11 kg by 2009. This trend would appear to be continuing. Beef and pork consumption actually peaked in 1975 and 1985 respec-tively. At those times, Germans consumed c. 3 kg more pork (1985) and almost 7 kg more beef (1975) than at present and total meat consumption peaked in 1985 at 66 kg compared to the current 60 kg. Innards have declined in importance. Sheepmeat and other meats continue to be of minor importance in Germany
Figure 2.4: Per capita meat consumption in
Germany, 1950-2009 (in kg)
Source: Own illustration after BVDF (2011)
0
10
20
30
40
50
60
1950 1975 1985 1995 20052000 2009
TotalPorkBeef
PoultrymeatOther meat (Innards,
Sheepmeat)
16
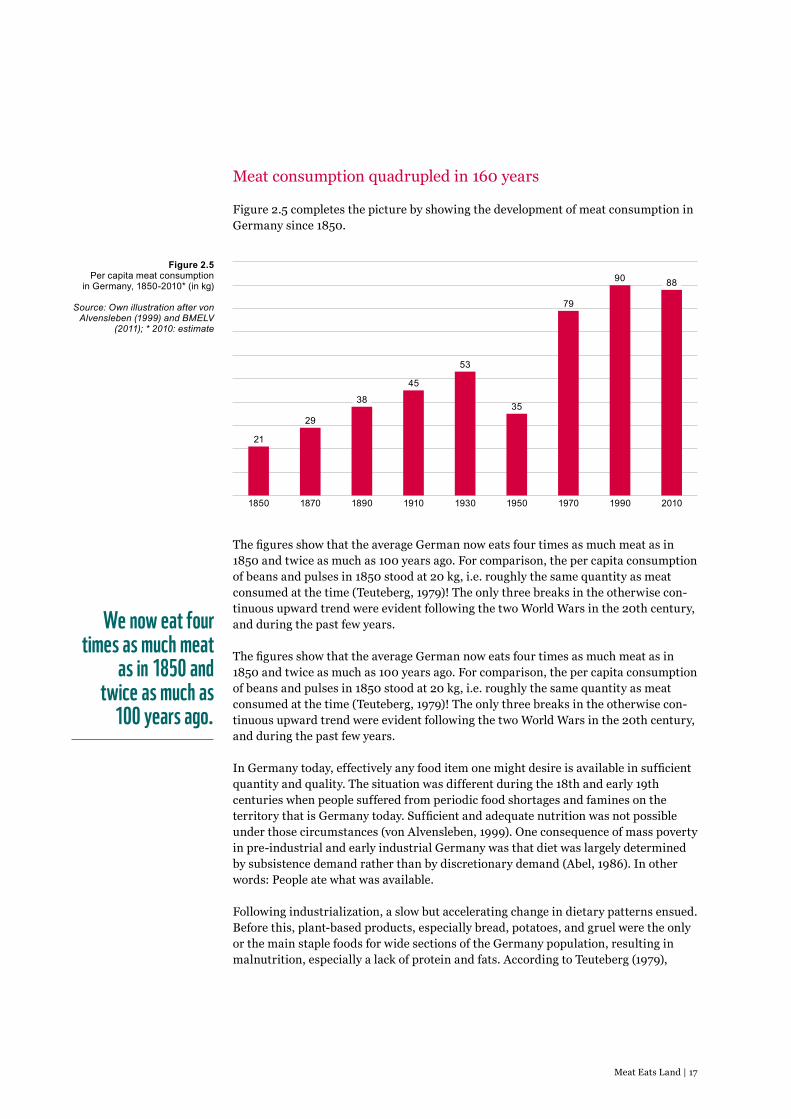
Meat consumption quadrupled in 160 years Figure 2.5 completes the picture by showing the development of meat consumption in Germany since 1850.
The figures show that the average German now eats four times as much meat as in 1850 and twice as much as 100 years ago. For comparison, the per capita consumption of beans and pulses in 1850 stood at 20 kg, i.e. roughly the same quantity as meat consumed at the time (Teuteberg, 1979)! The only three breaks in the otherwise con-tinuous upward trend were evident following the two World Wars in the 20th century, and during the past few years.
The figures show that the average German now eats four times as much meat as in 1850 and twice as much as 100 years ago. For comparison, the per capita consumption of beans and pulses in 1850 stood at 20 kg, i.e. roughly the same quantity as meat consumed at the time (Teuteberg, 1979)! The only three breaks in the otherwise con-tinuous upward trend were evident following the two World Wars in the 20th century, and during the past few years.
In Germany today, effectively any food item one might desire is available in sufficient quantity and quality. The situation was different during the 18th and early 19th centuries when people suffered from periodic food shortages and famines on the territory that is Germany today. Sufficient and adequate nutrition was not possible under those circumstances (von Alvensleben, 1999). One consequence of mass poverty in pre-industrial and early industrial Germany was that diet was largely determined by subsistence demand rather than by discretionary demand (Abel, 1986). In other words: People ate what was available.
Following industrialization, a slow but accelerating change in dietary patterns ensued. Before this, plant-based products, especially bread, potatoes, and gruel were the only or the main staple foods for wide sections of the Germany population, resulting in malnutrition, especially a lack of protein and fats. According to Teuteberg (1979),
Figure 2.5Per capita meat consumption
in Germany, 1850-2010* (in kg)
Source: Own illustration after von Alvensleben (1999) and BMELV
(2011); * 2010: estimate
1850 1870 1890 1910 1930 19901950 1970 2010
21
29
38
45
53
35
79
90 88
We now eat four times as much meat
as in 1850 and twice as much as
100 years ago.
Meat Eats Land | 17
the consumption of animal-based products increased however by 50 % between 1850 and 1910. In the period of 1895-1910 alone the consumption of meat and dairy pro-ducts increased by approximately one third, signifying a profound change in dietary preferences towards animal proteins and fats. This was made possible by the change in economic circumstances of broader strata of the German population.
As has been mentioned above, the consumption of meat products has risen steadily ever since, with the trend having been interrupted only in the aftermath of WWI and WWII (von Alvensleben, 1999). Falling food prices meant that German households were able to spend a continuously decreasing share of their income on food.
Based on the sentiments of the population itself it would be fair to say that roughly since the late 1950s food security in Germany has been ensured. Since the 1960s the typical German diet has been dominated by a combination of meat, potatoes and vegetables. Additionally, there has been a significant internationalization of the “cuisine”. Following the hunger years subsequent to WWII people were finally, and literally, enjoying the entire range of food items that are out there.
A further important determinant that has contributed to the developments in terms of dietary choices in Germany since the 1960s has been the “time factor”: On the one hand a “ketchup culture” developed which freed up ever more time that could be used in other ways, while at the same time cooking became a form of socializing, such as with barbecues. Both these developments further promoted meat consumption as well as the consumption of processed foods.
As economic factors became less significant, other determinants took their place in driving dietary choices. This process has accelerated yet again over the past two deca-des: Consumers have become more environmentally conscious and cultural trends as well as ethical and in particular health considerations nowadays strongly determine food preferences.
How do we compare to the EU?
Finally, a comparison of per capita meat consumption in Germany and the EU as a whole shows that at 88 kg, meat consumption in Germany ranks above the EU average (82 kg) (Fefac, 2010). The EU country with the highest meat consumption is Denmark (111 kg). In terms of consumption of pork there is a particularly marked dif-ference between Germany (56 kg) and the EU average (41 kg), while Spain tops the list with 63 kg. In contrast, despite an overall increase in the past, Germans eat relatively little poultrymeat, well under the EU average of 23 kg. Only the Italians consume less poultry (18 kg) than the Germans (19 kg) (Fefac, 2010). To conclude: The Germans love their meat. Meat in general, and pork in particular, is often found on German dinner tables.
At 88 kg
per year Germans consume more meat
than the average EU citizen.
18
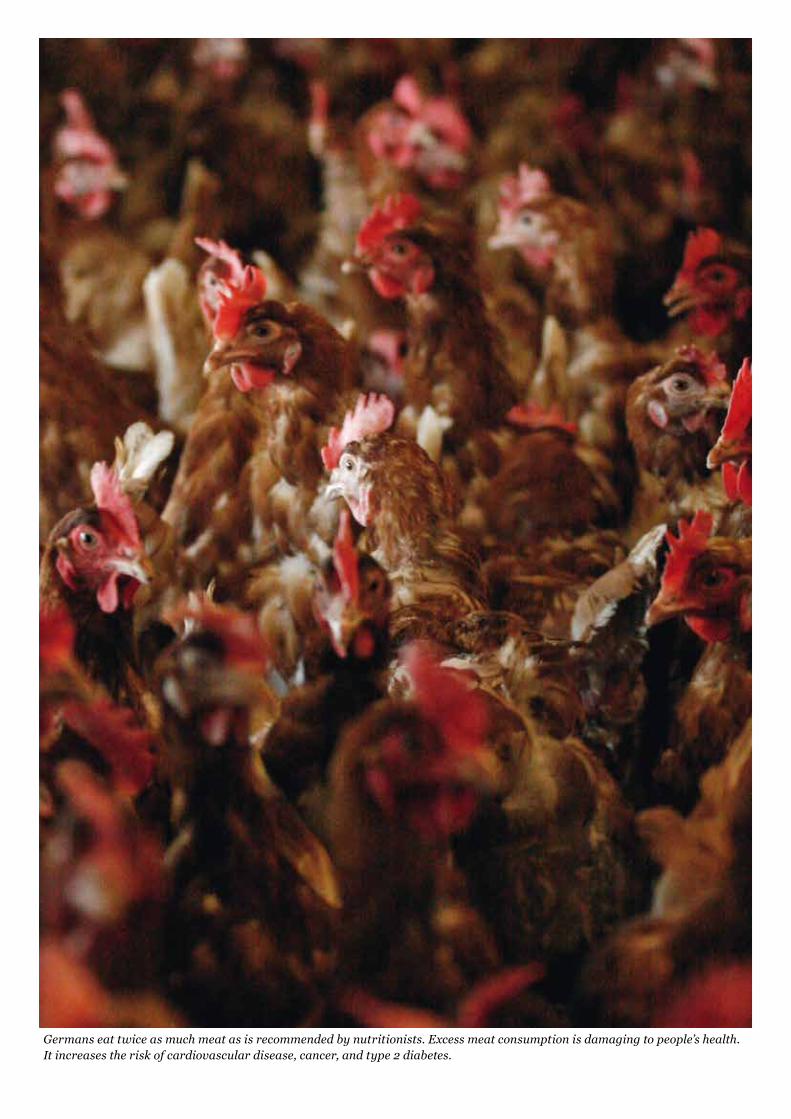
Germans eat twice as much meat as is recommended by nutritionists. Excess meat consumption is damaging to people’s health. It increases the risk of cardiovascular disease, cancer, and type 2 diabetes.
In many countries meat is consumed on a daily basis and not only in Germany but basically in all industrialized countries it is consumed in large quantities (Berndsen 2005, McAfee, 2010). Judging by the DGE recommendations or by those of the international World Cancer Research Fund (WCRF), far too much meat is being eaten in Germany and the EU as a whole. The 2008 National Nutrition Survey for example concluded that the average German adult consumed more than 120 g of meat per day (MRI, 2008). The survey also found gender-specific differences, with men eating significantly more meat than women. The DGE however recommend an average of 64 g per person per day (Dieckau, 2009) and the WCRF recommends 71 g per adult (WCRF, 2007). So Germans eat twice as much meat as is recommended from a nutritional standpoint.
Meat provides valuable components of a balanced diet
DGE and WCRF consider high meat consumption to be linked to health risks. These risks will briefly be outlined below, without however neglecting to say that meat is indeed an important and valuable component of a balanced human diet. Meat is a high-nutrient-dense food and primarily provides easily digestible proteins as well as important amino acids, vitamins and trace elements. Especially the iron contained in meat – which is more easily absorbed than that contained in plant-based foods – as well as selenium, folic acid, zinc, various B vitamins and vitamin A all contribute to the overall health of the human body (i.a. Cosgove, 2005; Ferguson, 2010; McAfee, 2010). Moreover, pure muscle tissue is low in calories and fat (BfR, 2009).
But too high a level of meat consumption is also at the root of massive health risks
The health risks of high meat consumption are primarily due to the level of animal fat ingested at the same time – and saturated fatty acids in particular – and to the way the meat is prepared. In terms of health risks, the focus of attention is primarily on red meat and on meat processing involving smoking, marinating or salting (McAffee, 2010; Micha et al., 2009; MRI, 2008). In this context, health risks are divided into three main groups:
» cardio-vascular diseases, i.e. illnesses affecting the heart and the vascular system, such as coronaries, strokes and myocardial infarcts;
» oncological diseases, including colon cancer and cancer affecting other organs of the digestive tract;
» Type 2 diabetes.
The fat content of meat products and the high proportion of saturated fatty acids in particular are decisive factors with respect to cardio-vascular illnesses. Fatty meat raises cholesterine levels and generally increases the probability of weight gain. Obesity in turn places a burden on the cardio-vascular system (Spiller, 2008; WCRF, 2007).
3. Meat consumption and health
Germans eat twice as much meat as is
recommended by nutritionists.
20
Many epidemiological studies list red meat such as beef, lamb and pork as well as processed meat as risk factors for cancer (i.a. Boeing, 2004; Demeyer, 2008; Fergu-son, 2010; WCRF, 2007). Approximately 80 % of all colon cancer cases are considered to be due to diet and life-styles involving high levels of meat consumption (i.a. Willet, 1995, BfR, 2009 and WCRF 2007).
Thirty to forty percent of cancers could be avoided purely by adherence to dietary recommendations. In other words: those who eat less meat and compensate for the essential nutrients they thus miss out on by eating more fruit, vegetables, beans and pulses as well as wholemeal products, significantly reduce their risk of serious illness.
The association between meat consumption and Type 2 diabetes has only lately been given attention in health research. Micha et al. (2010) and Pan et al. (2011) have concluded from recent meta-analyses that in particular the consumption of processed red meats, i.e. cured ham and sausage/cold cuts, is associated with higher incidence of Type 2 diabetes. For example, the consumption of an additional 50 g of sausage/cold cuts is considered to increase the risk of Type 2 diabetes by 25-40 %. Conversely, the substitution of such a portion with, for example, nuts, low-fat milk or whole-meal products reduces the risk of contracting Type 2 diabetes by 16-35 % (Pan et al., 2011).
Meat consumption and lifestyle must be assessed together
Even though the association between meat consumption and health risks is evident, a reduction in meat consumption or a complete shift to lean meat products is certainly not the silver bullet for maintaining good health. Generally the illnesses outlined above are not mono-causal.
McAfee et al. (2010) for example emphasize that simply by not eating meat one does not lower the risk of cancer, just in as much as meat itself is not the root cause of the illness. Rather, the fat content of the meat causes health problems (Corgrove et al., 2005) and also the way the meat is processed, possible additives (e.g. salts, smoke) and what else is used in its preparation (Micha et al., 2010).
High meat consumption must be looked at in conjunction with an overall “unhealthy” life-style due to lack of exercise and so forth. A varied whole-food diet containing a moderate amount of meat is a key to better health (BfR, 2008; WCRF, 2007).
Studies report that
many cases of colon cancer are
due to a high intake of meat.
Meat Eats Land | 21
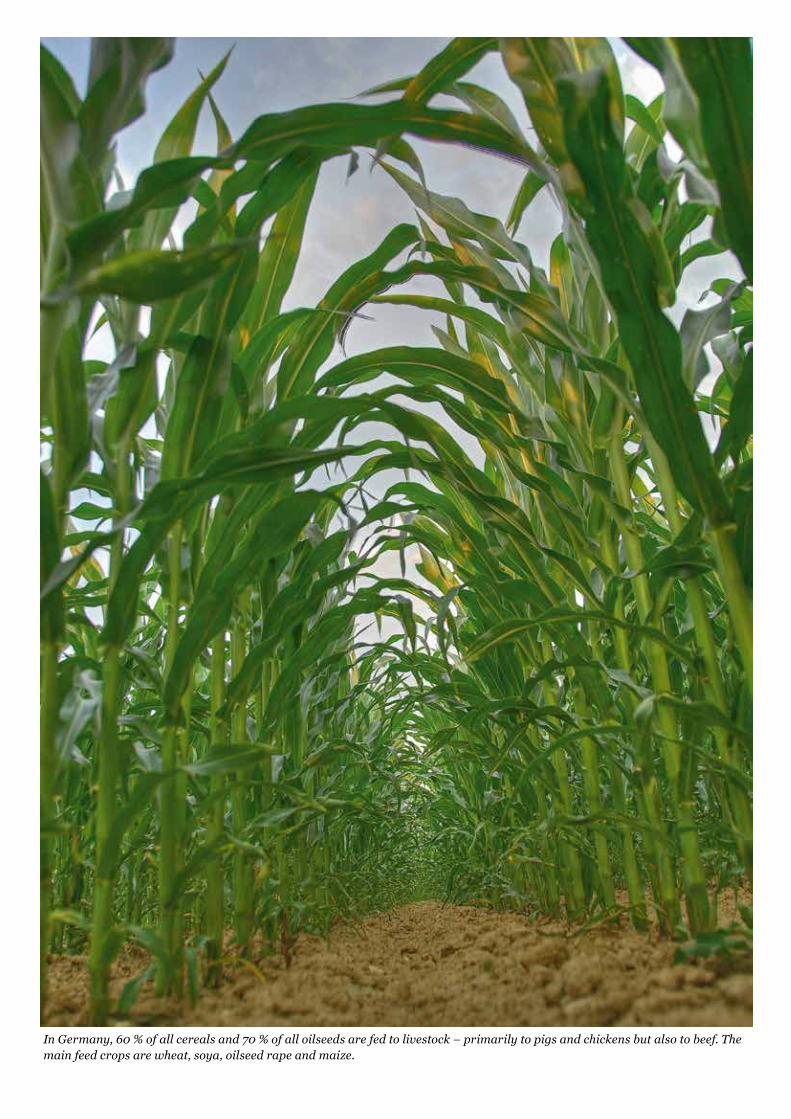
In Germany, 60 % of all cereals and 70 % of all oilseeds are fed to livestock – primarily to pigs and chickens but also to beef. The main feed crops are wheat, soya, oilseed rape and maize.

How much feed and what types of feed are consumed in Germany?
Germany’s high meat consumption is associated with a high consumption of livestock feed. This is particularly true for cereals (e.g. wheat, feed grain maize, barley) and oilseeds (e.g. oilseed rape, soya and sunflowers) as well as green feed for ruminants (e.g. grass, maize silage, cereals for whole-crop harvesting). Initial indications of feed consumption in Germany can be obtained from the feed industry (DVT, 2011) according to which more than 70 million tonnes (Mt) of cereal equivalent (CE) were fed to livestock in the 2008/2009 marketing year. One CE is equivalent to 100 kg of cereals. More than 30 Mt CE of these were fed as grass and green feed or feed straw. 27 Mt came from cereal crops while just over 12 Mt CE were derived from other crops, primarily oilseed crops, and to a minor extent also from root crops such as potatoes and sugarbeet.
Where does the feed come from?
Of the 70 Mt CE, 58.6 Mt CE are produced domestically. The bulk of this is grass and green feed or cereals; oilseeds are secondary. Additionally, about 5.3 Mt CE of cereals and 6.3 Mt CE of other feed crops, mostly based on oilseed crops, are imported annually. Overall about 17 % of livestock feed is imported. However, for oilseed crops the imported share exceeds domestic production for feed purposes.
Forage is primarily produced on more than 4.7 million ha of permanent grassland, 4.0 million ha of which are meadows and pastures (the bulk of the remainder, i.e. 0.6 million ha, are seasonal alpine pastures), and on approximately 2.5 million ha of arable land on which green feed crops are grown (BMELV, 2011). Therefore more than 7.2 million ha of the total of 17 million ha of Germany’s agricultural area are used for the production of grass and other forage. Expressed in quantities, the feed grown and harvested for livestock includes more than 32 Mt of feed from meadows and pastu-res, 73.5 Mt of maize silage, and a further 7.0 Mt of other green feed crops including cereals, legumes and grass ley. This feed is almost exclusively produced and exclusively consumed domestically. The situation is different for concentrate feeds, i.e. primarily straight cereals and the usually industrially produced compound feeds. More than a quarter of concentrate feeds are foreign imports (DVT, 2011).
4. Meat consumption and the demand for feed crops
Meat Eats Land | 23
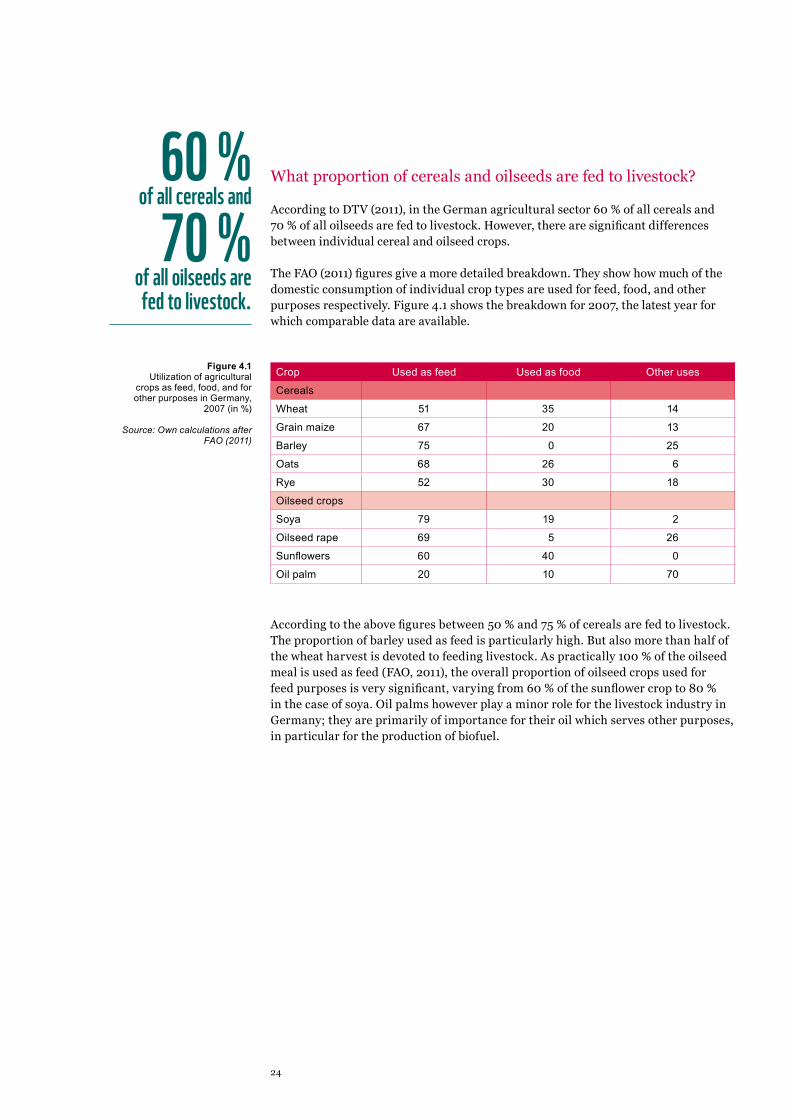
What proportion of cereals and oilseeds are fed to livestock?
According to DTV (2011), in the German agricultural sector 60 % of all cereals and 70 % of all oilseeds are fed to livestock. However, there are significant differences between individual cereal and oilseed crops.
The FAO (2011) figures give a more detailed breakdown. They show how much of the domestic consumption of individual crop types are used for feed, food, and other purposes respectively. Figure 4.1 shows the breakdown for 2007, the latest year for which comparable data are available.
Crop Used as feed Used as food Other uses
Cereals
Wheat 51 35 14
Grain maize 67 20 13
Barley 75 0 25
Oats 68 26 6
Rye 52 30 18
Oilseed crops
Soya 79 19 2
Oilseed rape 69 5 26
Sunflowers 60 40 0
Oil palm 20 10 70
According to the above figures between 50 % and 75 % of cereals are fed to livestock. The proportion of barley used as feed is particularly high. But also more than half of the wheat harvest is devoted to feeding livestock. As practically 100 % of the oilseed meal is used as feed (FAO, 2011), the overall proportion of oilseed crops used for feed purposes is very significant, varying from 60 % of the sunflower crop to 80 % in the case of soya. Oil palms however play a minor role for the livestock industry in Germany; they are primarily of importance for their oil which serves other purposes, in particular for the production of biofuel.
Figure 4.1Utilization of agricultural
crops as feed, food, and for other purposes in Germany,
2007 (in %)
Source: Own calculations after FAO (2011)
60 % of all cereals and
70 % of all oilseeds are fed to livestock.
24
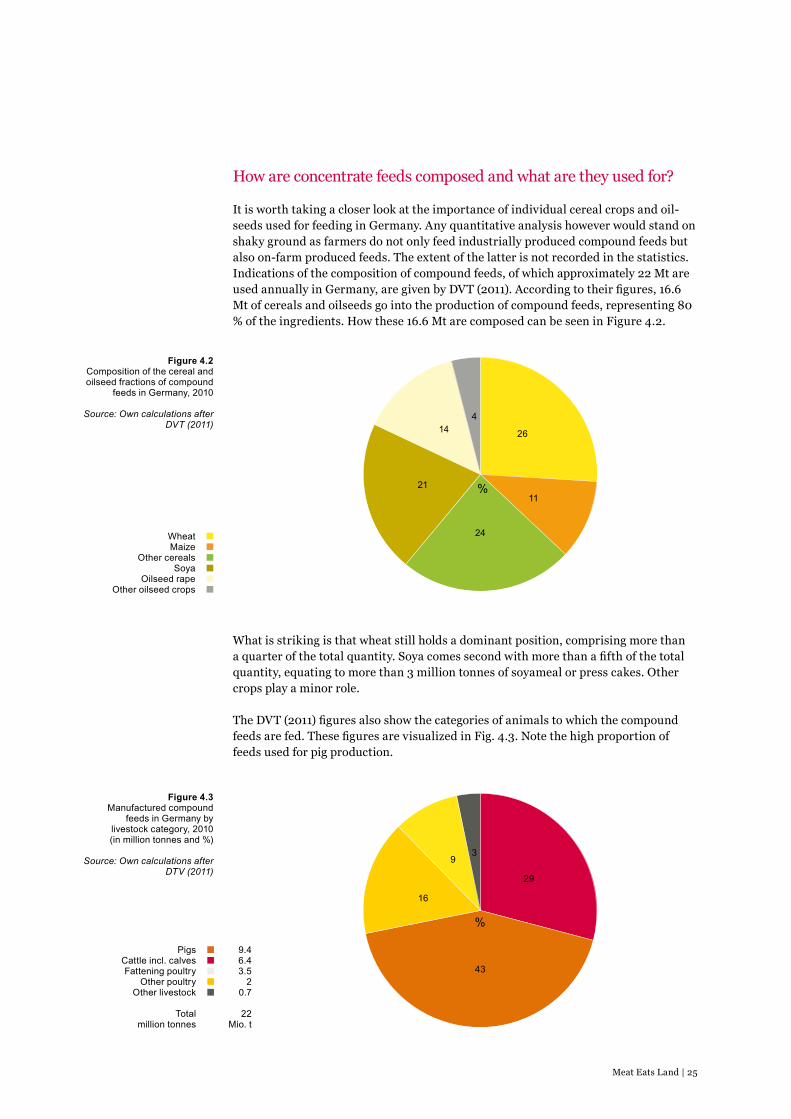
How are concentrate feeds composed and what are they used for?
It is worth taking a closer look at the importance of individual cereal crops and oil-seeds used for feeding in Germany. Any quantitative analysis however would stand on shaky ground as farmers do not only feed industrially produced compound feeds but also on-farm produced feeds. The extent of the latter is not recorded in the statistics. Indications of the composition of compound feeds, of which approximately 22 Mt are used annually in Germany, are given by DVT (2011). According to their figures, 16.6 Mt of cereals and oilseeds go into the production of compound feeds, representing 80 % of the ingredients. How these 16.6 Mt are composed can be seen in Figure 4.2.
What is striking is that wheat still holds a dominant position, comprising more than a quarter of the total quantity. Soya comes second with more than a fifth of the total quantity, equating to more than 3 million tonnes of soyameal or press cakes. Other crops play a minor role.
The DVT (2011) figures also show the categories of animals to which the compound feeds are fed. These figures are visualized in Fig. 4.3. Note the high proportion of feeds used for pig production.
Figure 4.2Composition of the cereal and oilseed fractions of compound
feeds in Germany, 2010
Source: Own calculations after DVT (2011)
Figure 4.3Manufactured compound
feeds in Germany by livestock category, 2010 (in million tonnes and %)
Source: Own calculations after DTV (2011)
WheatMaize
Other cerealsSoya
Oilseed rapeOther oilseed crops
26
%
24
1121
144
PigsCattle incl. calvesFattening poultry
Other poultryOther livestock
Total million tonnes
9.46.43.5
20.7
22Mio. t
29
%
43
16
93
Meat Eats Land | 25
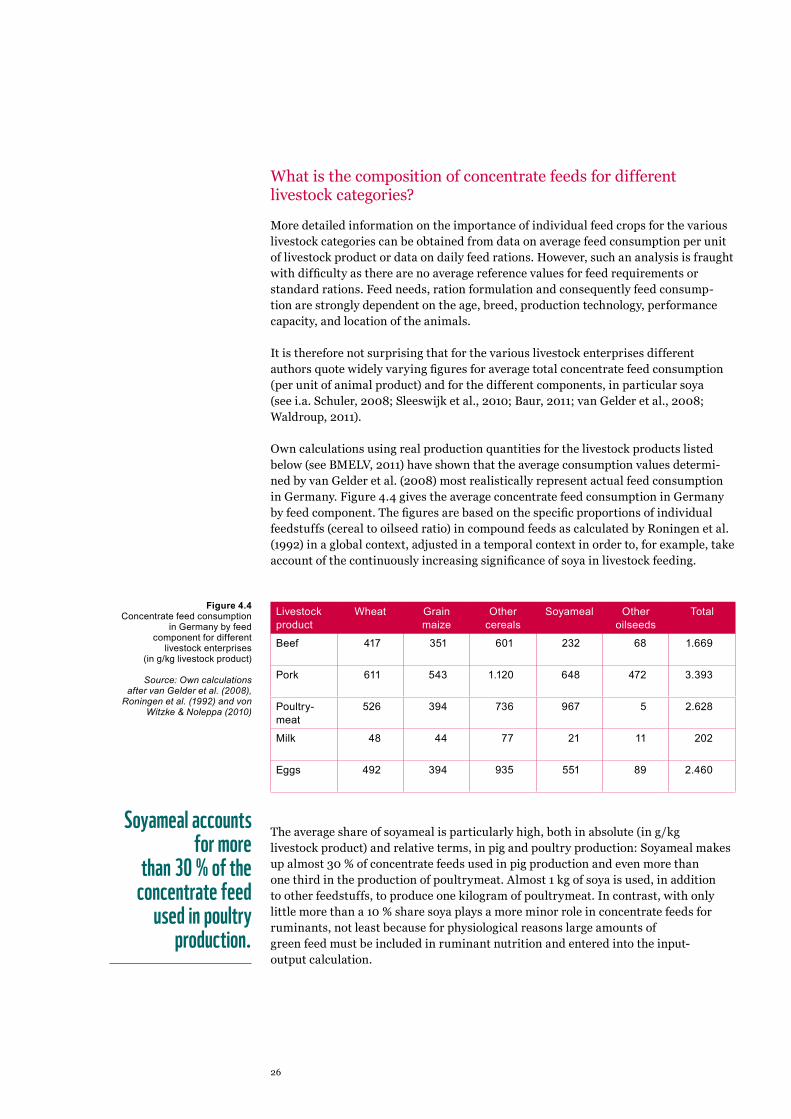
What is the composition of concentrate feeds for different livestock categories?
More detailed information on the importance of individual feed crops for the various livestock categories can be obtained from data on average feed consumption per unit of livestock product or data on daily feed rations. However, such an analysis is fraught with difficulty as there are no average reference values for feed requirements or standard rations. Feed needs, ration formulation and consequently feed consump-tion are strongly dependent on the age, breed, production technology, performance capacity, and location of the animals.
It is therefore not surprising that for the various livestock enterprises different authors quote widely varying figures for average total concentrate feed consumption (per unit of animal product) and for the different components, in particular soya (see i.a. Schuler, 2008; Sleeswijk et al., 2010; Baur, 2011; van Gelder et al., 2008; Waldroup, 2011).
Own calculations using real production quantities for the livestock products listed below (see BMELV, 2011) have shown that the average consumption values determi-ned by van Gelder et al. (2008) most realistically represent actual feed consumption in Germany. Figure 4.4 gives the average concentrate feed consumption in Germany by feed component. The figures are based on the specific proportions of individual feedstuffs (cereal to oilseed ratio) in compound feeds as calculated by Roningen et al. (1992) in a global context, adjusted in a temporal context in order to, for example, take account of the continuously increasing significance of soya in livestock feeding.
Livestock product
Wheat Grain maize
Other cereals
Soyameal Other oilseeds
Total
Beef 417 351 601 232 68 1.669
Pork 611 543 1.120 648 472 3.393
Poultry-meat
526 394 736 967 5 2.628
Milk 48 44 77 21 11 202
Eggs 492 394 935 551 89 2.460
The average share of soyameal is particularly high, both in absolute (in g/kg livestock product) and relative terms, in pig and poultry production: Soyameal makes up almost 30 % of concentrate feeds used in pig production and even more than one third in the production of poultrymeat. Almost 1 kg of soya is used, in addition to other feedstuffs, to produce one kilogram of poultrymeat. In contrast, with only little more than a 10 % share soya plays a more minor role in concentrate feeds for ruminants, not least because for physiological reasons large amounts of green feed must be included in ruminant nutrition and entered into the input- output calculation.
Figure 4.4Concentrate feed consumption
in Germany by feed component for different
livestock enterprises (in g/kg livestock product)
Source: Own calculations after van Gelder et al. (2008),
Roningen et al. (1992) and von Witzke & Noleppa (2010)
Soyameal accounts
for more than 30 % of the
concentrate feed used in poultry
production.
26
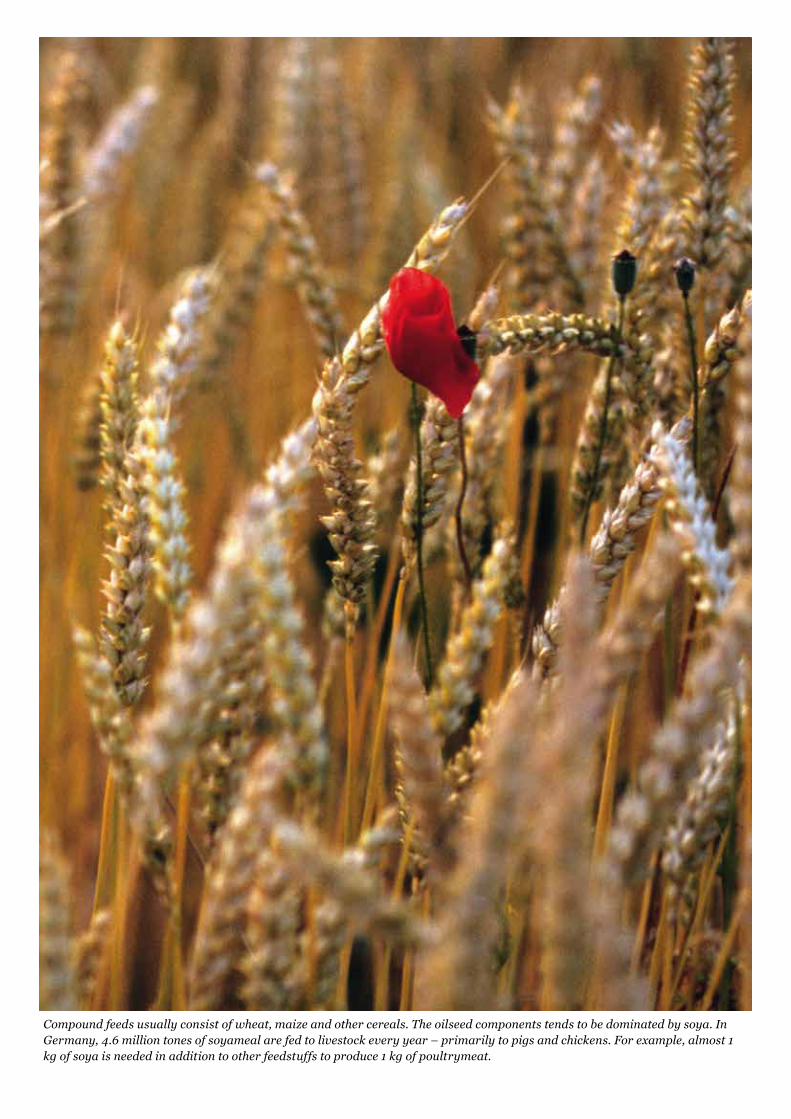
Compound feeds usually consist of wheat, maize and other cereals. The oilseed components tends to be dominated by soya. In Germany, 4.6 million tones of soyameal are fed to livestock every year – primarily to pigs and chickens. For example, almost 1 kg of soya is needed in addition to other feedstuffs to produce 1 kg of poultrymeat.

5.1 Methodological concept for the assessment of virtual land trade
How much land outside of the national borders is utilized to satisfy the domestic consumption of agricultural commodities from abroad? To answer this question. this study applies the concept of “virtual land trade”. The concept and the methodology used will be discussed in more detail below.
The concept of trade in virtual inputs such as water
The following analysis is based on the concept of trade in virtual inputs which was first put forward by the British geographer J. A. Allan (1993; 1994) and was initially used to calculate the water consumption of production and transport chains for ag-ricultural commodities. Simply put. the basic idea is this: Producing goods generally requires water. While real water is not traded between countries. water used for the production of goods can be measured and considered as virtual water if the goods in question are traded internationally (Hoekstra. 2003; Hoekstra & Hung. 2003).
Virtual land trade
Similar to water, virtual land can be defined as the amount of land needed per unit of agricultural commodity. If one tonne (t) of an agricultural product is traded a certain hectarage (ha) of land is traded virtually along with it. To give an example, if Germany imports soya from Brazil, then Brazilian arable land had earlier been utilized to produce the soyabean crop. The arable land itself is not imported but its output is. In this manner, Germany extends its own arable land resource onto Brazil’s territory. Brazil in turn “looses” this arable land as it can not use this resource for domestic purposes. Therefore, a virtual export of arable land from Brazil to Germany takes place. A conversion of agricultural trade flow into virtually traded agricultural land, expressed in hectares, is given in the following sections...
Step 1: Analysis of international agricultural trade flows
International agricultural trade flows are the starting point of the analysis. Relevant data are contained in the available agricultural trade statistics. However, these are based on different internationally agreed standards. One of the most widely used clas-sifications is the Standard International Trade Classification (SITC). This standard classifies goods based on the degree of processing and thus distinguishes i.a. between agricultural primary products, first stage processed products (from mills. abattoirs etc.), and final retail products (e.g. flour, pasta, butter, yoghurt, sausages, tinned foods, beverages containing sugar, etc.). Using this standard it is possible to assign products subjected to varying degrees of processing back to the original primary product (Ximing & Fukao. 2010), in this instance to the agricultural production of
5. Agricultural trade and virtual land trade by the EU and Germany
28
crop plants. Whether the product in question (e.g. soyameal) originated in an agricultural production chain (e.g. production of cooking oil) or is a by–product of an industrial process (e.g. residues from the production of biofuel from soya) is immaterial.
In a first step. the import and export flows for the years 2001 to 2010 for both Germany and the EU were documented. The analysis covers foreign trade with individual world regions. Some countries are listed separately. These are in particular Brazil. Argentina and Paraguay. in keeping with the aim of this study of assessing the meat–soya issue. The analysis thus highlights certain regions. The data are taken from Eurostat (2011).
Step 2: Conversion of traded goods into agricultural primary products
In a second step, the trade volumes listed in the statistics are converted into quanti-ties of agricultural primary products. There are certain complexities and difficulties with this step:
» The conversion is easy for primary products such as wheat or soya as the traded quantity generally equals that of the primary product.
» The conversion is more complex for products such as flour: For example, 1 t of wheat roughly yields 0.75 t of wheat flour. with conversion factors differing slightly between different sources in this particular case (FAO (2001), FAO (2010). USDA (1992) and USDA (2011)). In other words, 1.0 t of imported standardized wheat flour is roughly equivalent to 1.33 t of standardized wheat produced in the exporting country. All cereals, oilseeds and their derivatives can be treated in this manner. Principally the same process can also be used for all other product groups (such as oils. canned fruit and vegetables as well as fruit and vegetable juices) derived from primary crops.
» Finally, the conversion of livestock products into primary crops used to produce the required livestock feed is even more complex. Firstly, a distinction must be made between live animals, those that have already been slaughtered, and pro-cessed animal products. To give an example, only 56 % of the live weight of beef cattle remain in the dressed carcass and a further 16 % must be subtracted to calculate the weight of the boneless meat for human consumption (CIV. 2011; USDA. 1992). In other words. if a country imports 1.0 t of beef carcasses this is equivalent to 1.72 t of live cattle in the exporting country.
Step 3: Conversion of agricultural primary products into the required land area
This third step in the analysis represents the actual conversion of agricultural prima-ry products, traded either directly or indirectly in the form of processed products into virtually traded land. To this end, regional exports and imports are weighted using regional yield data and converted into area equivalents.
Meat Eats Land | 29
In this context, the application of regional yield data can have interesting effects. For example, it is possible that a country is a net exporter of a particular agricultural primary product while the land area needed would indicate an import situation, as illustrated by the following example: Let us assume that Region A exports 12 t of wheat into Region B and also imports 10 t of wheat from Region C, resulting in a net export of 2 t. Assuming further that in Region A typically 8 t/ha are harvested, the wheat grown on a total of 1.5 ha is thus exported. And if the yield level in Region C is only 5 t/ha. Region A is importing 2 hectares worth of wheat. The net export balance, expressed in tonnes, thus becomes a net import balance if the land area is considered in the calculation. In the example given here, the result is a net import of wheat from an area of 0.5 ha.
A note on methodology: Special challenges of the analysis
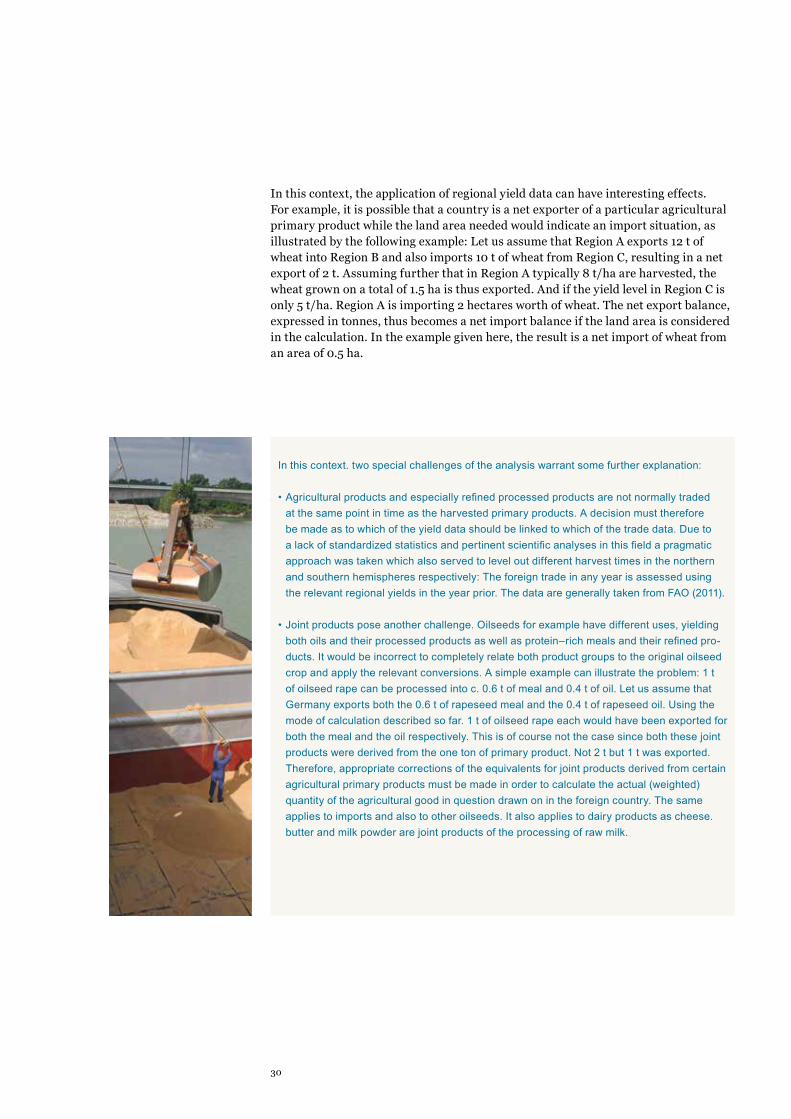
In this context. two special challenges of the analysis warrant some further explanation:
• Agricultural products and especially refined processed products are not normally traded at the same point in time as the harvested primary products. A decision must therefore be made as to which of the yield data should be linked to which of the trade data. Due to a lack of standardized statistics and pertinent scientific analyses in this field a pragmatic approach was taken which also served to level out different harvest times in the northern and southern hemispheres respectively: The foreign trade in any year is assessed using the relevant regional yields in the year prior. The data are generally taken from FAO (2011).
• Joint products pose another challenge. Oilseeds for example have different uses, yielding both oils and their processed products as well as protein–rich meals and their refined pro-ducts. It would be incorrect to completely relate both product groups to the original oilseed crop and apply the relevant conversions. A simple example can illustrate the problem: 1 t of oilseed rape can be processed into c. 0.6 t of meal and 0.4 t of oil. Let us assume that Germany exports both the 0.6 t of rapeseed meal and the 0.4 t of rapeseed oil. Using the mode of calculation described so far. 1 t of oilseed rape each would have been exported for both the meal and the oil respectively. This is of course not the case since both these joint products were derived from the one ton of primary product. Not 2 t but 1 t was exported. Therefore, appropriate corrections of the equivalents for joint products derived from certain agricultural primary products must be made in order to calculate the actual (weighted) quantity of the agricultural good in question drawn on in the foreign country. The same applies to imports and also to other oilseeds. It also applies to dairy products as cheese. butter and milk powder are joint products of the processing of raw milk.
30
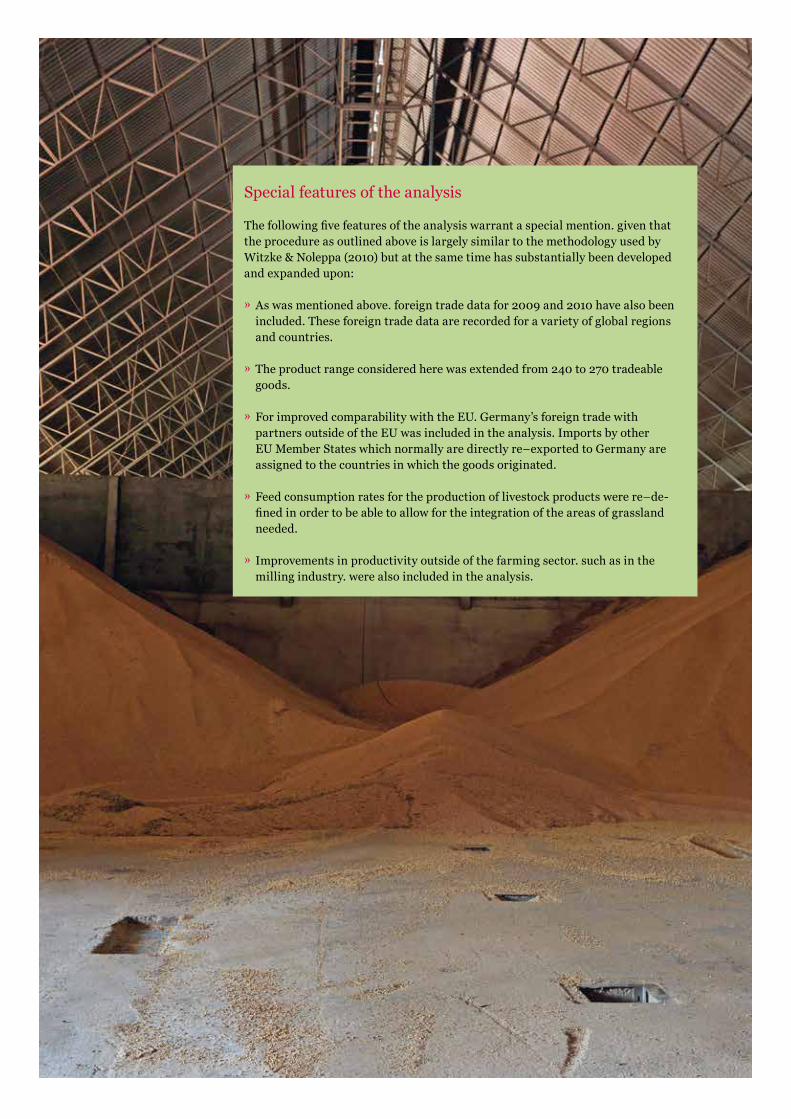
Special features of the analysis
The following five features of the analysis warrant a special mention. given that the procedure as outlined above is largely similar to the methodology used by Witzke & Noleppa (2010) but at the same time has substantially been developed and expanded upon:
» As was mentioned above. foreign trade data for 2009 and 2010 have also been included. These foreign trade data are recorded for a variety of global regions and countries.
» The product range considered here was extended from 240 to 270 tradeable goods.
» For improved comparability with the EU. Germany’s foreign trade with partners outside of the EU was included in the analysis. Imports by other EU Member States which normally are directly re–exported to Germany are assigned to the countries in which the goods originated.
» Feed consumption rates for the production of livestock products were re–de-fined in order to be able to allow for the integration of the areas of grassland needed.
» Improvements in productivity outside of the farming sector. such as in the milling industry. were also included in the analysis.
5.2 Agricultural foreign trade and virtual land trade by the EU and Germany
Does the European Union generate a trade surplus or not?
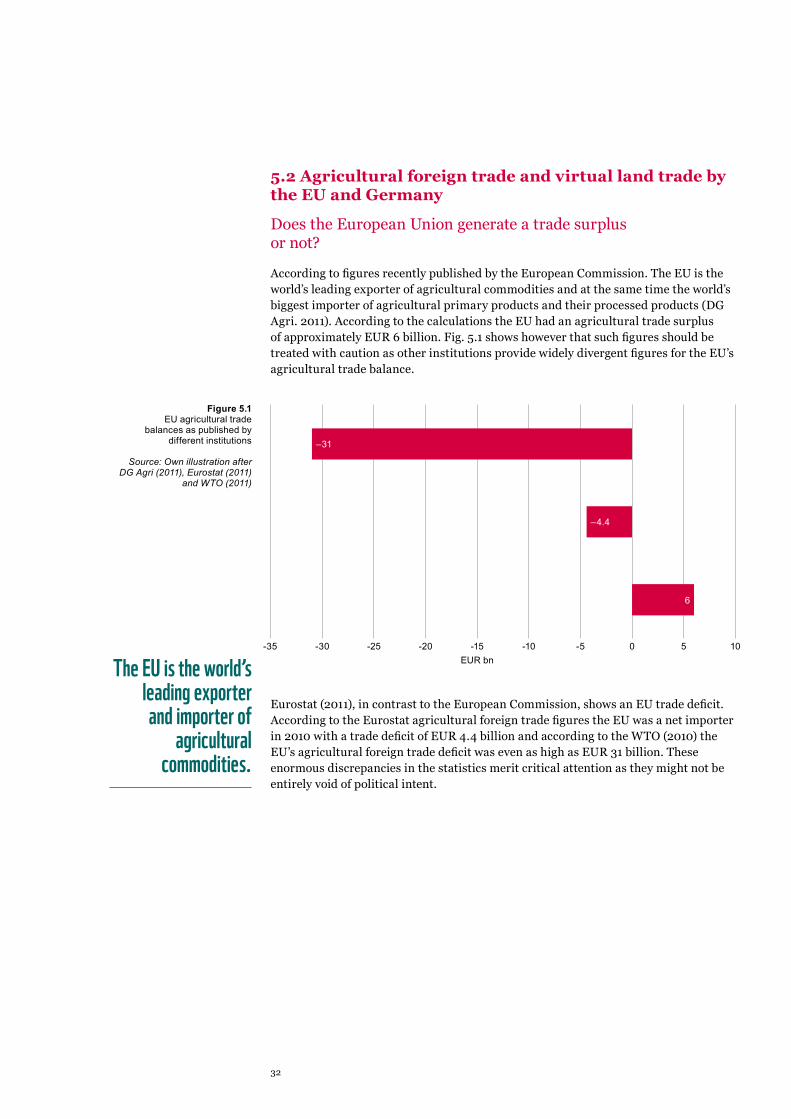
According to figures recently published by the European Commission. The EU is the world’s leading exporter of agricultural commodities and at the same time the world’s biggest importer of agricultural primary products and their processed products (DG Agri. 2011). According to the calculations the EU had an agricultural trade surplus of approximately EUR 6 billion. Fig. 5.1 shows however that such figures should be treated with caution as other institutions provide widely divergent figures for the EU’s agricultural trade balance.
Eurostat (2011), in contrast to the European Commission, shows an EU trade deficit. According to the Eurostat agricultural foreign trade figures the EU was a net importer in 2010 with a trade deficit of EUR 4.4 billion and according to the WTO (2010) the EU’s agricultural foreign trade deficit was even as high as EUR 31 billion. These enormous discrepancies in the statistics merit critical attention as they might not be entirely void of political intent.
-30-35
–31
–4.4
6
-25 -20 -15EUR bn
-10 5-5 0 10
Figure 5.1EU agricultural trade
balances as published by different institutions
Source: Own illustration after DG Agri (2011), Eurostat (2011)
and WTO (2011)
The EU is the world’s
leading exporter and importer of
agricultural commodities.
32

The statistics game: What is or is not considered agricultural trade?
There is an explanation for the differences between the statistics. in that they are based on different definitions as to what constitutes agricultural goods. While the European Commission excludes some chapters of the WTO definition from their definition of “agricultural products” (cf. DG Agri. 2011). the WTO base their figures on their own “WTO International Trade Statistics” (cf. WTO. 2011). Eurostat (2011) also base their figures on the WTO standard but notably exclude the chapter “Oilseeds” as well as some other chapters such as “Animal or vegetable fats”. This largely explains the huge differences between the Eurostat and WTO (2011) figures discussed above.
The present study seeks to integrate. in as much as possible. all tradeable products that are based on agricultural primary products. The following analysis does not only include the “classic” agricultural trade categories SITC0 and SITC1 as used by Eurostat (2011). i.e. ‘Food and live animals’ as well as ‘Beverages and tobacco’. but also SITC22 (Oil seeds and oleaginous fruits). SITC 263 (Cotton textile fibres). SITC 268 (Wool). and SITC4 (all animal and vegetable oils. fats and waxes). In this context. the inclusion of the oilseeds category and their use for feed and fuel (plant oils) demonst-rates how too narrow a definition of agricultural trade can yield very different results.
In contrast to WTO (2011) the present study does not include wood and wood pro-ducts and fish and fish products respectively in its analysis. Undoubtedly. due to their feed requirements. aquaculture industries also have an impact on the development of agricultural land use and their significance in terms of foreign trade continues to in-crease. However. robust statistics on these particular agricultural goods are presently not yet available.
Meat Eats Land | 33
Germany accounts for a quarter of the EU’s enormous net land imports
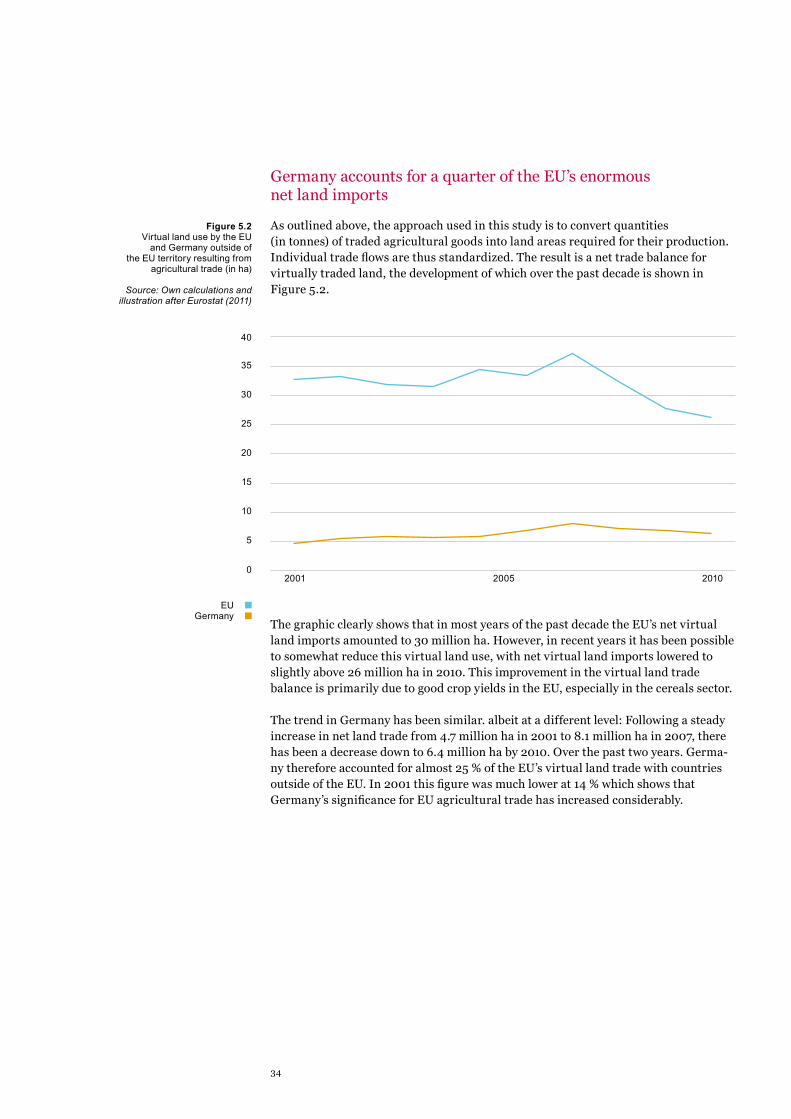
As outlined above, the approach used in this study is to convert quantities (in tonnes) of traded agricultural goods into land areas required for their production. Individual trade flows are thus standardized. The result is a net trade balance for virtually traded land, the development of which over the past decade is shown in Figure 5.2.
The graphic clearly shows that in most years of the past decade the EU’s net virtual land imports amounted to 30 million ha. However, in recent years it has been possible to somewhat reduce this virtual land use, with net virtual land imports lowered to slightly above 26 million ha in 2010. This improvement in the virtual land trade balance is primarily due to good crop yields in the EU, especially in the cereals sector.
The trend in Germany has been similar. albeit at a different level: Following a steady increase in net land trade from 4.7 million ha in 2001 to 8.1 million ha in 2007, there has been a decrease down to 6.4 million ha by 2010. Over the past two years. Germa-ny therefore accounted for almost 25 % of the EU’s virtual land trade with countries outside of the EU. In 2001 this figure was much lower at 14 % which shows that Germany’s significance for EU agricultural trade has increased considerably.
0
5
10
15
20
25
30
35
40
20052001 2010
EUGermany
Figure 5.2Virtual land use by the EU
and Germany outside of the EU territory resulting from
agricultural trade (in ha)
Source: Own calculations and illustration after Eurostat (2011)
34
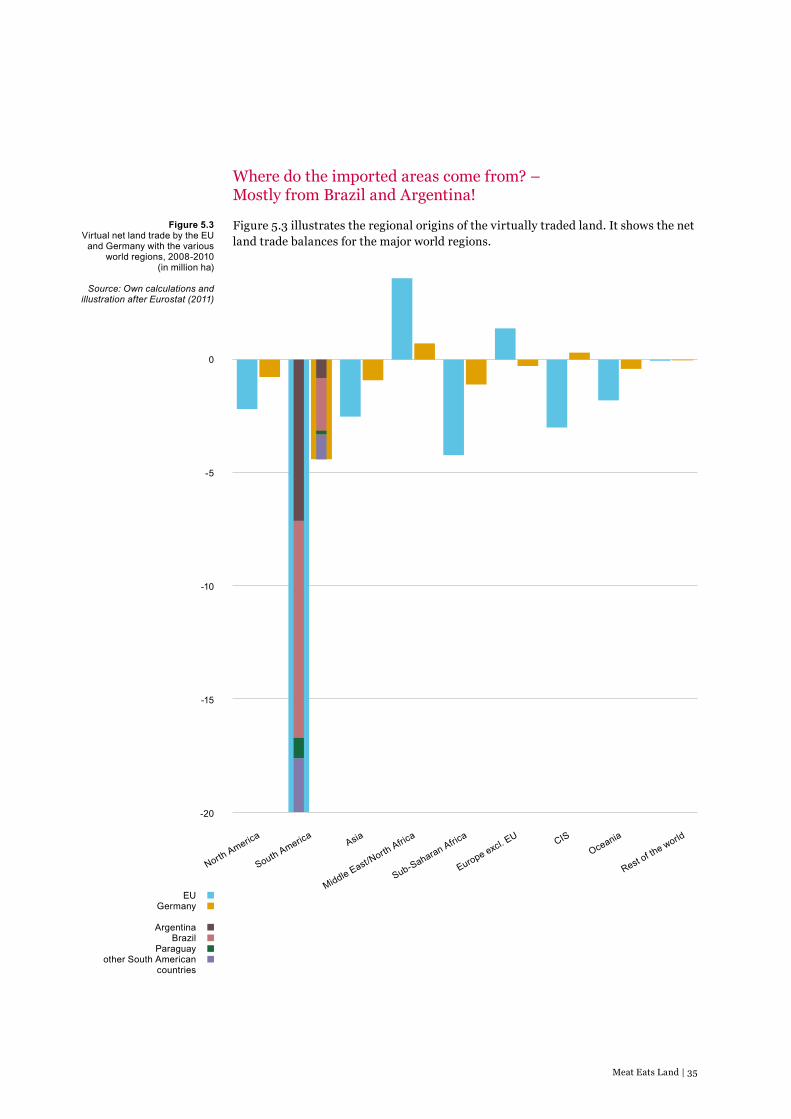
Where do the imported areas come from? – Mostly from Brazil and Argentina!
Figure 5.3 illustrates the regional origins of the virtually traded land. It shows the net land trade balances for the major world regions.
0
-5
-10
-15
-20
Figure 5.3Virtual net land trade by the EU
and Germany with the various world regions, 2008-2010
(in million ha)
Source: Own calculations and illustration after Eurostat (2011)
EUGermany
ArgentinaBrazil
Paraguay other South American
countries
North America
South AmericaAsia
Middle East/North Afric
a
Sub-Saharan Africa
Europe excl. EU CIS
Oceania
Rest of the world
Meat Eats Land | 35
What is evident from the figures are the similar structures in the EU and Germany respectively and the major significance of South America for the net balance of the EU and Germany in terms of virtual land trade. In this region alone the EU and Germany “use” a net of 20.0 and 4.4 million ha respectively. No other world region features as strongly in this type of trade. Africa takes second place by a wide margin with a net 4.2 and 1.1 million ha “used” by the EU and Germany respectively. Given the special significance of South America. individual countries on this continent merit a closer look (see Figure 5.4).
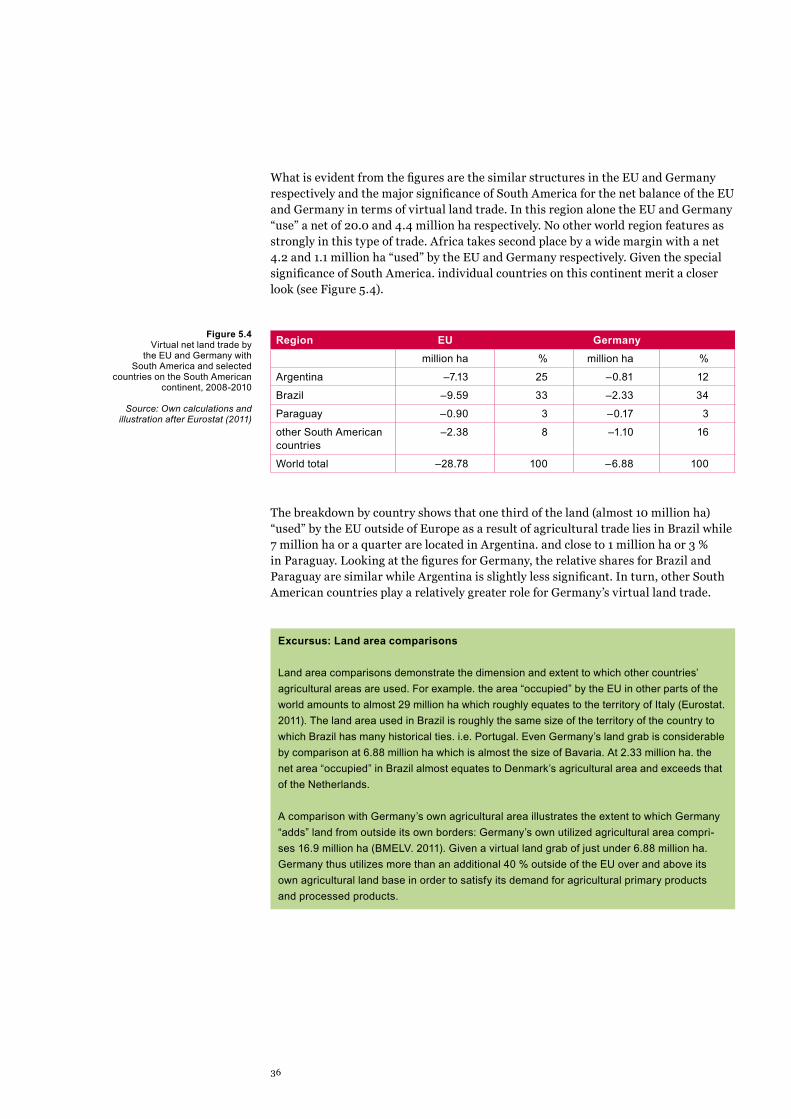
Region EU Germanymillion ha % million ha %
Argentina –7.13 25 –0.81 12
Brazil –9.59 33 –2.33 34
Paraguay –0.90 3 –0.17 3
other South American countries
–2.38 8 –1.10 16
World total –28.78 100 –6.88 100
The breakdown by country shows that one third of the land (almost 10 million ha) “used” by the EU outside of Europe as a result of agricultural trade lies in Brazil while 7 million ha or a quarter are located in Argentina. and close to 1 million ha or 3 % in Paraguay. Looking at the figures for Germany, the relative shares for Brazil and Paraguay are similar while Argentina is slightly less significant. In turn, other South American countries play a relatively greater role for Germany’s virtual land trade.
Excursus: Land area comparisons
Land area comparisons demonstrate the dimension and extent to which other countries’ agricultural areas are used. For example. the area “occupied” by the EU in other parts of the world amounts to almost 29 million ha which roughly equates to the territory of Italy (Eurostat. 2011). The land area used in Brazil is roughly the same size of the territory of the country to which Brazil has many historical ties. i.e. Portugal. Even Germany’s land grab is considerable by comparison at 6.88 million ha which is almost the size of Bavaria. At 2.33 million ha. the net area “occupied” in Brazil almost equates to Denmark’s agricultural area and exceeds that of the Netherlands.
A comparison with Germany’s own agricultural area illustrates the extent to which Germany “adds” land from outside its own borders: Germany’s own utilized agricultural area compri-ses 16.9 million ha (BMELV. 2011). Given a virtual land grab of just under 6.88 million ha. Germany thus utilizes more than an additional 40 % outside of the EU over and above its own agricultural land base in order to satisfy its demand for agricultural primary products and processed products.
Figure 5.4Virtual net land trade by
the EU and Germany with South America and selected
countries on the South American continent, 2008-2010
Source: Own calculations and illustration after Eurostat (2011)
36
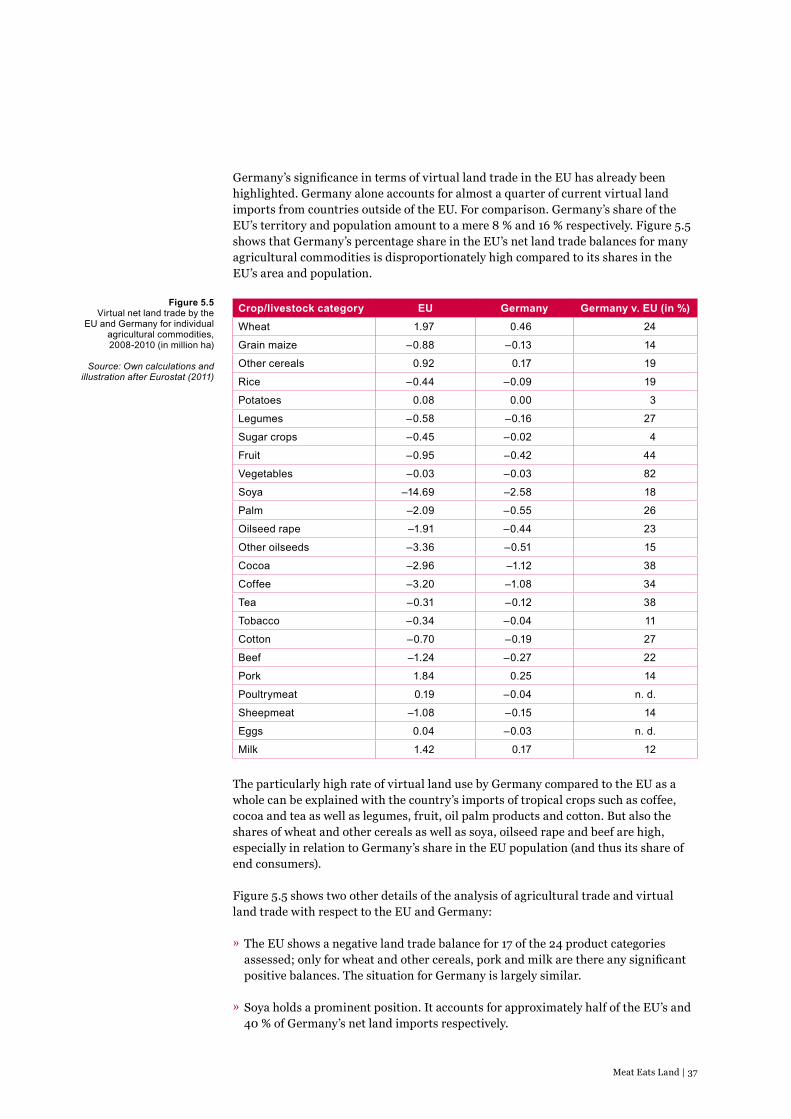
Figure 5.5Virtual net land trade by the
EU and Germany for individual agricultural commodities, 2008-2010 (in million ha)
Source: Own calculations and illustration after Eurostat (2011)
Germany’s significance in terms of virtual land trade in the EU has already been highlighted. Germany alone accounts for almost a quarter of current virtual land imports from countries outside of the EU. For comparison. Germany’s share of the EU’s territory and population amount to a mere 8 % and 16 % respectively. Figure 5.5 shows that Germany’s percentage share in the EU’s net land trade balances for many agricultural commodities is disproportionately high compared to its shares in the EU’s area and population.
Crop/livestock category EU Germany Germany v. EU (in %)Wheat 1.97 0.46 24
Grain maize –0.88 –0.13 14
Other cereals 0.92 0.17 19
Rice –0.44 –0.09 19
Potatoes 0.08 0.00 3
Legumes –0.58 –0.16 27
Sugar crops –0.45 –0.02 4
Fruit –0.95 –0.42 44
Vegetables –0.03 –0.03 82
Soya –14.69 –2.58 18
Palm –2.09 –0.55 26
Oilseed rape –1.91 –0.44 23
Other oilseeds –3.36 –0.51 15
Cocoa –2.96 –1.12 38
Coffee –3.20 –1.08 34
Tea –0.31 –0.12 38
Tobacco –0.34 –0.04 11
Cotton –0.70 –0.19 27
Beef –1.24 –0.27 22
Pork 1.84 0.25 14
Poultrymeat 0.19 –0.04 n. d.
Sheepmeat –1.08 –0.15 14
Eggs 0.04 –0.03 n. d.
Milk 1.42 0.17 12
The particularly high rate of virtual land use by Germany compared to the EU as a whole can be explained with the country’s imports of tropical crops such as coffee, cocoa and tea as well as legumes, fruit, oil palm products and cotton. But also the shares of wheat and other cereals as well as soya, oilseed rape and beef are high, especially in relation to Germany’s share in the EU population (and thus its share of end consumers).
Figure 5.5 shows two other details of the analysis of agricultural trade and virtual land trade with respect to the EU and Germany: » The EU shows a negative land trade balance for 17 of the 24 product categories assessed; only for wheat and other cereals, pork and milk are there any significant positive balances. The situation for Germany is largely similar.
» Soya holds a prominent position. It accounts for approximately half of the EU’s and 40 % of Germany’s net land imports respectively.
Meat Eats Land | 37
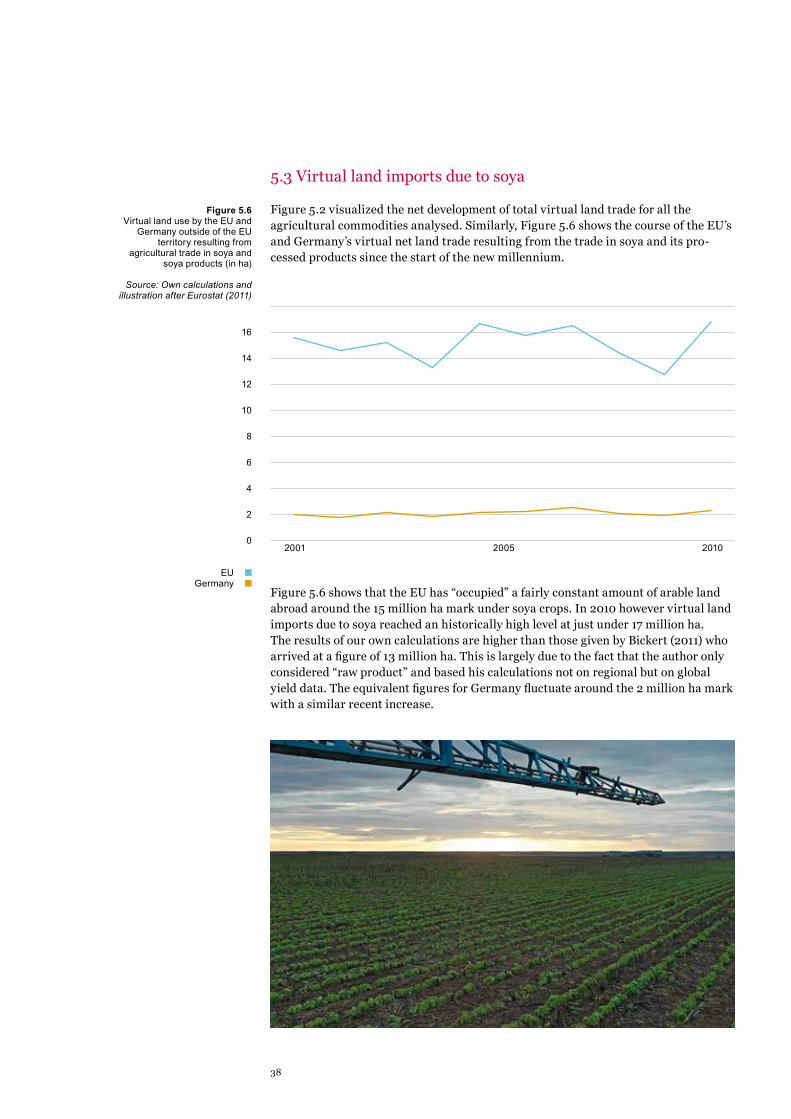
5.3 Virtual land imports due to soya
Figure 5.2 visualized the net development of total virtual land trade for all the agricultural commodities analysed. Similarly, Figure 5.6 shows the course of the EU’s and Germany’s virtual net land trade resulting from the trade in soya and its pro-cessed products since the start of the new millennium.
Figure 5.6 shows that the EU has “occupied” a fairly constant amount of arable land abroad around the 15 million ha mark under soya crops. In 2010 however virtual land imports due to soya reached an historically high level at just under 17 million ha. The results of our own calculations are higher than those given by Bickert (2011) who arrived at a figure of 13 million ha. This is largely due to the fact that the author only considered “raw product” and based his calculations not on regional but on global yield data. The equivalent figures for Germany fluctuate around the 2 million ha mark with a similar recent increase.
Figure 5.6Virtual land use by the EU and
Germany outside of the EU territory resulting from
agricultural trade in soya and soya products (in ha)
Source: Own calculations and illustration after Eurostat (2011)
0
2
4
6
8
10
12
14
16
20052001 2010
EUGermany
38
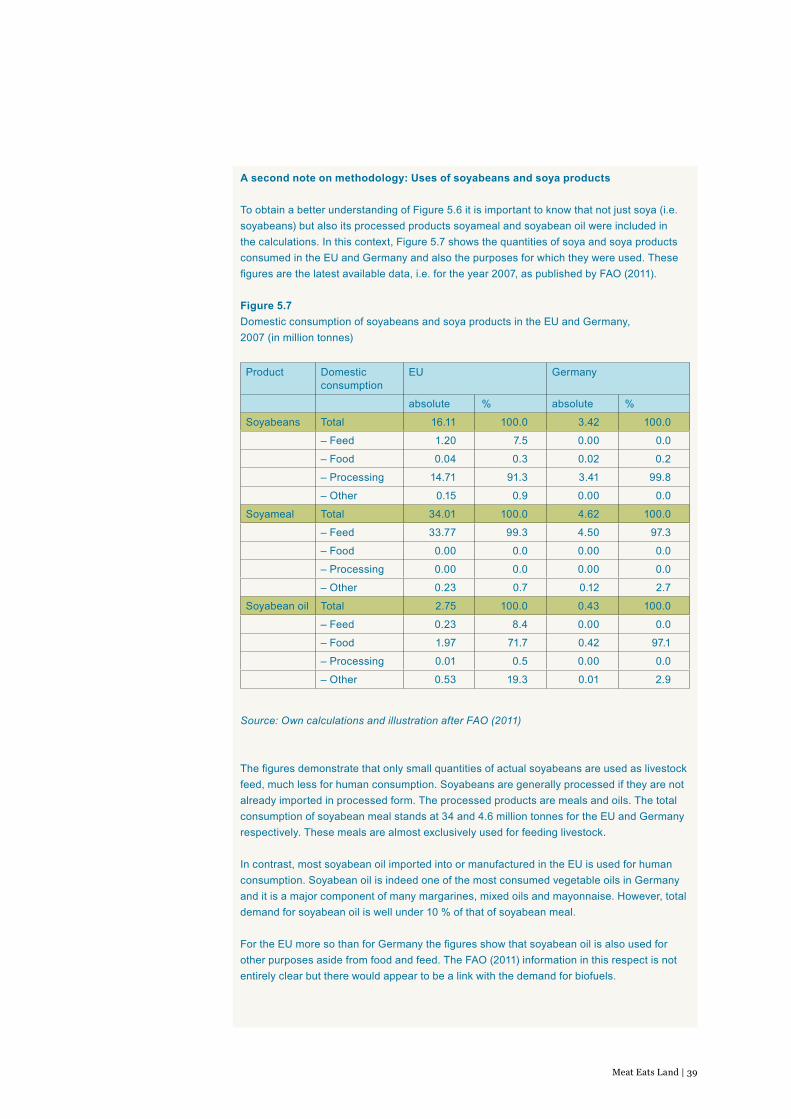
A second note on methodology: Uses of soyabeans and soya products
To obtain a better understanding of Figure 5.6 it is important to know that not just soya (i.e. soyabeans) but also its processed products soyameal and soyabean oil were included in the calculations. In this context, Figure 5.7 shows the quantities of soya and soya products consumed in the EU and Germany and also the purposes for which they were used. These figures are the latest available data, i.e. for the year 2007, as published by FAO (2011).
Figure 5.7 Domestic consumption of soyabeans and soya products in the EU and Germany, 2007 (in million tonnes)
Product Domestic consumption
EU Germany
absolute % absolute %
Soyabeans Total 16.11 100.0 3.42 100.0
– Feed 1.20 7.5 0.00 0.0
– Food 0.04 0.3 0.02 0.2
– Processing 14.71 91.3 3.41 99.8
– Other 0.15 0.9 0.00 0.0
Soyameal Total 34.01 100.0 4.62 100.0
– Feed 33.77 99.3 4.50 97.3
– Food 0.00 0.0 0.00 0.0
– Processing 0.00 0.0 0.00 0.0
– Other 0.23 0.7 0.12 2.7
Soyabean oil Total 2.75 100.0 0.43 100.0
– Feed 0.23 8.4 0.00 0.0
– Food 1.97 71.7 0.42 97.1
– Processing 0.01 0.5 0.00 0.0
– Other 0.53 19.3 0.01 2.9
Source: Own calculations and illustration after FAO (2011)
The figures demonstrate that only small quantities of actual soyabeans are used as livestock feed, much less for human consumption. Soyabeans are generally processed if they are not already imported in processed form. The processed products are meals and oils. The total consumption of soyabean meal stands at 34 and 4.6 million tonnes for the EU and Germany respectively. These meals are almost exclusively used for feeding livestock.
In contrast, most soyabean oil imported into or manufactured in the EU is used for human consumption. Soyabean oil is indeed one of the most consumed vegetable oils in Germany and it is a major component of many margarines, mixed oils and mayonnaise. However, total demand for soyabean oil is well under 10 % of that of soyabean meal.
For the EU more so than for Germany the figures show that soyabean oil is also used for other purposes aside from food and feed. The FAO (2011) information in this respect is not entirely clear but there would appear to be a link with the demand for biofuels.
Meat Eats Land | 39
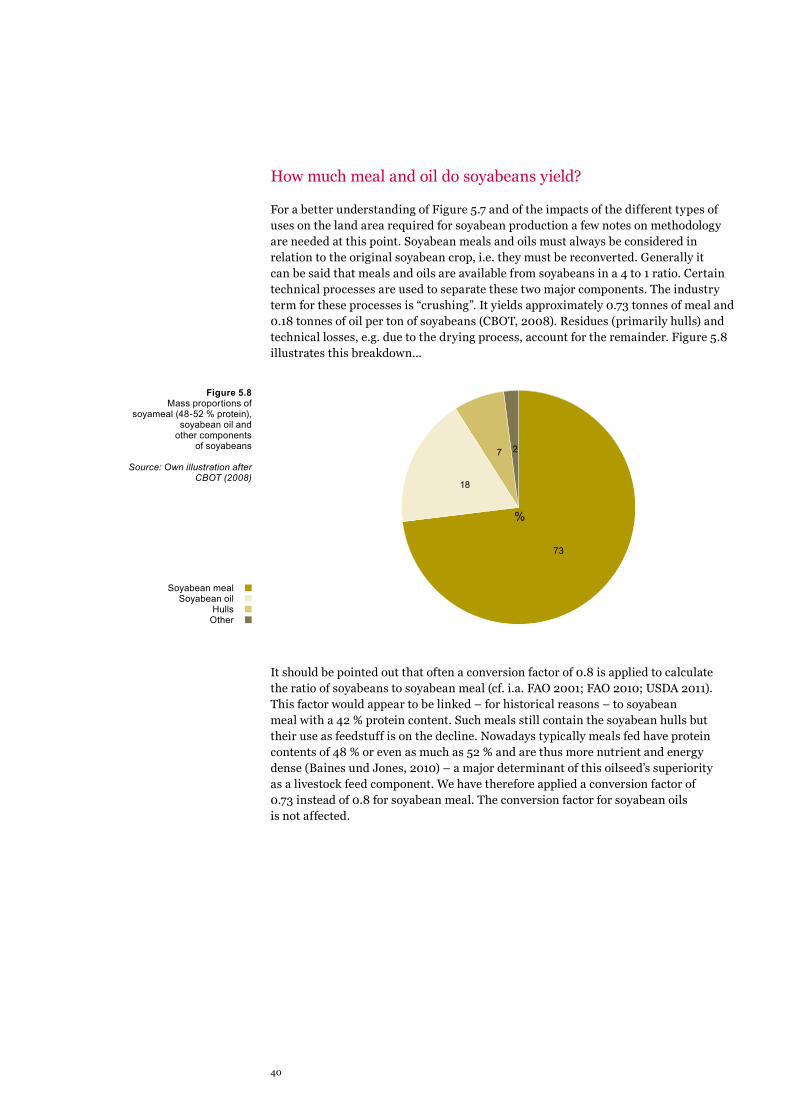
How much meal and oil do soyabeans yield?
For a better understanding of Figure 5.7 and of the impacts of the different types of uses on the land area required for soyabean production a few notes on methodology are needed at this point. Soyabean meals and oils must always be considered in relation to the original soyabean crop, i.e. they must be reconverted. Generally it can be said that meals and oils are available from soyabeans in a 4 to 1 ratio. Certain technical processes are used to separate these two major components. The industry term for these processes is “crushing”. It yields approximately 0.73 tonnes of meal and 0.18 tonnes of oil per ton of soyabeans (CBOT, 2008). Residues (primarily hulls) and technical losses, e.g. due to the drying process, account for the remainder. Figure 5.8 illustrates this breakdown...
It should be pointed out that often a conversion factor of 0.8 is applied to calculate the ratio of soyabeans to soyabean meal (cf. i.a. FAO 2001; FAO 2010; USDA 2011). This factor would appear to be linked – for historical reasons – to soyabean meal with a 42 % protein content. Such meals still contain the soyabean hulls but their use as feedstuff is on the decline. Nowadays typically meals fed have protein contents of 48 % or even as much as 52 % and are thus more nutrient and energy dense (Baines und Jones, 2010) – a major determinant of this oilseed’s superiority as a livestock feed component. We have therefore applied a conversion factor of 0.73 instead of 0.8 for soyabean meal. The conversion factor for soyabean oils is not affected.
Figure 5.8Mass proportions of
soyameal (48-52 % protein), soyabean oil and
other components of soyabeans
Source: Own illustration after CBOT (2008)
Soyabean mealSoyabean oil
HullsOther
%
73
18
7 2
40

A third note on methodology: What is the land footprint of meal, oil, and soyabeans?
Key to the consideration of traded processed products for the purposes of drawing up balance sheets of acreages are the weight ratios. For each ton of oil there are approximately four tonnes of meal. In calculating the tonnages therefore meals are entered into the balance sheet at 80 % and oils at 20 % of the crop acreage. The following example describes the approach in more detail.
In 2010 Germany imported as much as 2.4 million tonnes (Mt) of soyabean meal from Brazil but only 10,000 tonnes of soyabean oil (Eurostat, 2011). Converted into soyabean crop these imports equate to roughly 3.3 Mt and 55,000 t of soyabeans respectively. Applying the 80 % and 20 % weightings we arrive at a total of 2.64 Mt soyabean equivalents from soyabean meal and oils. Given the latest crop yield figure of 2.64 t/ha (FAO, 2011) this equates, as it happens, to exactly 1.0 million ha of cropland. To this figure we must add the area of land needed to produce the imported unprocessed soyabeans: Germany imported 1.1 Mt of soyabeans from Brazil which were produced on 0.42 million ha of land. Therefore, in this example, Germany virtually “occupied” approximately 1.42 million ha of land in Brazil in 2010.
Following this approach (please also refer to the earlier notes on methodology) it was possible to calculate the EU’s and Germany’s virtual land imports due to soya by region as shown in Figure 5.9 as an analogy to Figure 5.3.
One tonne of soyabeans yields
about 0.73 tonnes of soyabean meal
and 0.18 tonnes of oil.
Meat Eats Land | 41

North America
South America
AsiaM
iddle East/North Africa
Sub-Saharan Africa
Europe excl. EU
CIS
Oceania
Rest of the world
Figure 5.9Virtual net land trade
by the EU and Germany with the various world
regions due to soyabeans and
soyabean products, 2008-2010 (in million ha)
Source: Own calculations and
illustration after Eurostat (2011)
0
–1
–2
–3
–4
–5
–6
–7
–8
–9
–10
–11
–12
EUGermany
ArgentinaBrazil
Paraguay other South American
countries
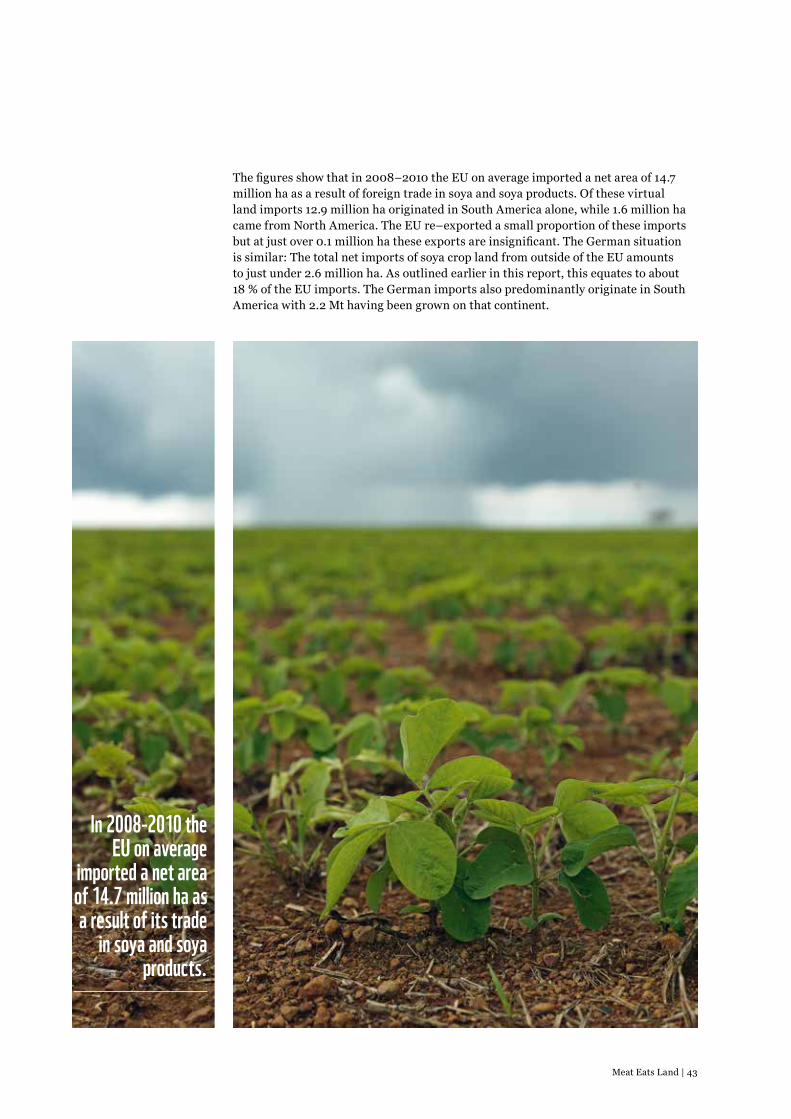
The figures show that in 2008–2010 the EU on average imported a net area of 14.7 million ha as a result of foreign trade in soya and soya products. Of these virtual land imports 12.9 million ha originated in South America alone, while 1.6 million ha came from North America. The EU re–exported a small proportion of these imports but at just over 0.1 million ha these exports are insignificant. The German situation is similar: The total net imports of soya crop land from outside of the EU amounts to just under 2.6 million ha. As outlined earlier in this report, this equates to about 18 % of the EU imports. The German imports also predominantly originate in South America with 2.2 Mt having been grown on that continent.
In 2008-2010 the EU on average
imported a net area of 14.7 million ha as a result of its trade
in soya and soya products.
Meat Eats Land | 43
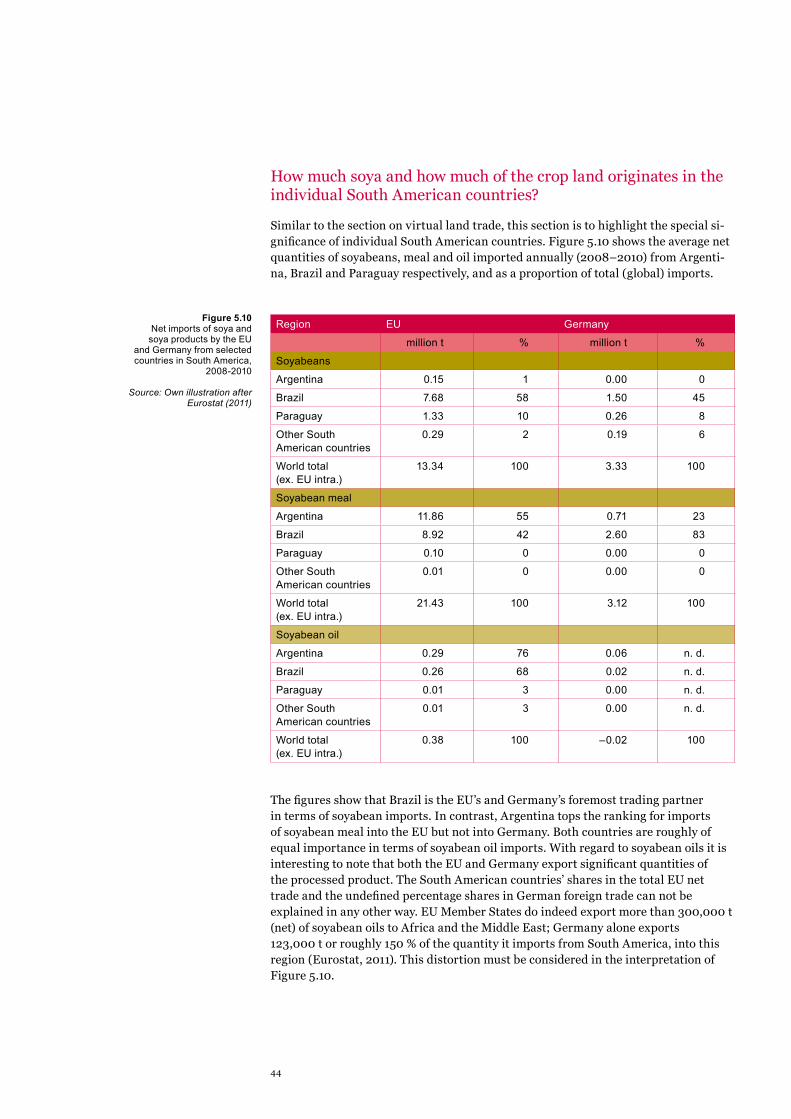
How much soya and how much of the crop land originates in the individual South American countries?
Similar to the section on virtual land trade, this section is to highlight the special si-gnificance of individual South American countries. Figure 5.10 shows the average net quantities of soyabeans, meal and oil imported annually (2008–2010) from Argenti-na, Brazil and Paraguay respectively, and as a proportion of total (global) imports.
Region EU Germany
million t % million t %
Soyabeans
Argentina 0.15 1 0.00 0
Brazil 7.68 58 1.50 45
Paraguay 1.33 10 0.26 8
Other South American countries
0.29 2 0.19 6
World total (ex. EU intra.)
13.34 100 3.33 100
Soyabean meal
Argentina 11.86 55 0.71 23
Brazil 8.92 42 2.60 83
Paraguay 0.10 0 0.00 0
Other South American countries
0.01 0 0.00 0
World total (ex. EU intra.)
21.43 100 3.12 100
Soyabean oil
Argentina 0.29 76 0.06 n. d.
Brazil 0.26 68 0.02 n. d.
Paraguay 0.01 3 0.00 n. d.
Other South American countries
0.01 3 0.00 n. d.
World total (ex. EU intra.)
0.38 100 –0.02 100
The figures show that Brazil is the EU’s and Germany’s foremost trading partner in terms of soyabean imports. In contrast, Argentina tops the ranking for imports of soyabean meal into the EU but not into Germany. Both countries are roughly of equal importance in terms of soyabean oil imports. With regard to soyabean oils it is interesting to note that both the EU and Germany export significant quantities of the processed product. The South American countries’ shares in the total EU net trade and the undefined percentage shares in German foreign trade can not be explained in any other way. EU Member States do indeed export more than 300,000 t (net) of soyabean oils to Africa and the Middle East; Germany alone exports 123,000 t or roughly 150 % of the quantity it imports from South America, into this region (Eurostat, 2011). This distortion must be considered in the interpretation of Figure 5.10.
Figure 5.10Net imports of soya and
soya products by the EU and Germany from selected countries in South America,
2008-2010
Source: Own illustration after Eurostat (2011)
44

These tonnages, in conjunction with the conversions outlined earlier in this report and in the notes on methodology, result in the figures given in Fig. 5.11 which explicitly highlight the significance of Argentina, Brazil and Paraguay in terms of the EU’s and Germany’s virtual land use in these countries compared to their global land ‘take’.
Region EU Germany
million ha % million ha %
Argentina –5.47 37 –0.34 13
Brazil –6.43 44 –1.59 61
Paraguay –0.80 5 –0.16 6
Other South American countries
–0.17 1 –0.11 4
World, total –14.69 100 –2.58 100
Figures 5.11 and 5.9 demonstrate Brazil’s outstanding importance in the soya trade for both Germany and the EU as a whole. But their trade with Argentina also results in the utilization of a considerable acreage. In contrast, Paraguay and the other South American countries are of minor significance.
Figure 5.11Virtual net land trade by the EU
and Germany resulting from trade in soya and soya
products with selected South American countries,
2008-2010
Source: Own calculations and illustration
after Eurostat (2011)
In terms of the soya trade,
Brazil is of outstanding
importance to both the EU and Germany.
Meat Eats Land | 45
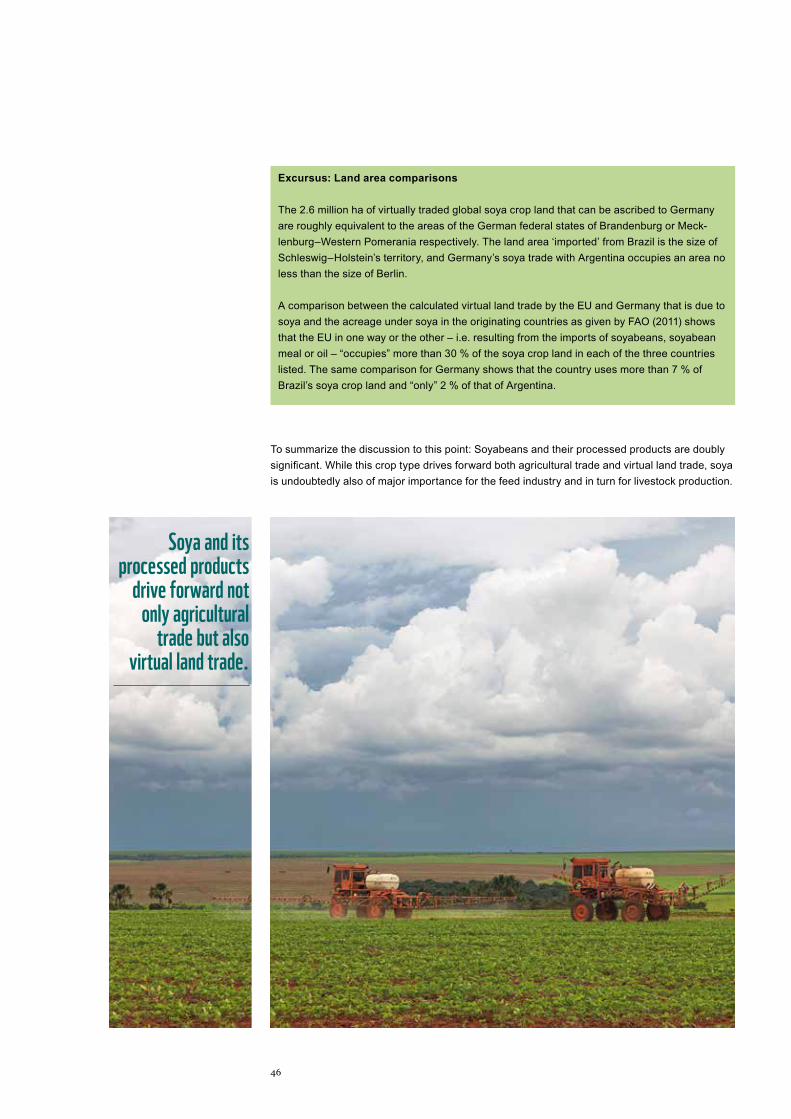
Excursus: Land area comparisons
The 2.6 million ha of virtually traded global soya crop land that can be ascribed to Germany are roughly equivalent to the areas of the German federal states of Brandenburg or Meck-lenburg–Western Pomerania respectively. The land area ‘imported’ from Brazil is the size of Schleswig–Holstein’s territory, and Germany’s soya trade with Argentina occupies an area no less than the size of Berlin.
A comparison between the calculated virtual land trade by the EU and Germany that is due to soya and the acreage under soya in the originating countries as given by FAO (2011) shows that the EU in one way or the other – i.e. resulting from the imports of soyabeans, soyabean meal or oil – “occupies” more than 30 % of the soya crop land in each of the three countries listed. The same comparison for Germany shows that the country uses more than 7 % of Brazil’s soya crop land and “only” 2 % of that of Argentina.
To summarize the discussion to this point: Soyabeans and their processed products are doubly significant. While this crop type drives forward both agricultural trade and virtual land trade, soya is undoubtedly also of major importance for the feed industry and in turn for livestock production.
Soya and its
processed products drive forward not
only agricultural trade but also
virtual land trade.
46

Excursus: Soya cropping threatens biodiversity hotspots*
Soya is one of the most important crop plants in the world and the area under soyabeans is rapidly growing. Between 1960 and 2009 alone, soyabean production increased almost tenfold (from approximately 27 million tonnes (Mt) to just under 230 Mt). This increase is also reflected in the expansion of soya crop land from 24 million ha in 1960 to almost 100 million ha in 2009. Since 1970 soyabean cropping has seen the highest growth rates compared to other crop plants.
Originally valued mainly for its oil and use in human food as an alternative protein source to meat, since the 1970s increased soya cultivation has been driven by meat production itself – through its widespread use as an ingredient of livestock feed. 80% of soya is used for animal feed worldwide.
With the increase in soya cropping, global trade in soya products also expanded. However, the soya export market is dominated by only a small number of countries. In 2010, more than 93% of global soya exports came from just four countries: the US, Brazil, Argentina and Paraguay. Imports were somewhat less concentrated, but still dominated by two principal buyers: China and the European Union (37% and 28% respectively).
The growing soya trade has led to an ongoing drastic expansion of soya crop land in South America. This becomes a problem in particular when the expansion of cropland results in the destruction of natural ecosystems or displaces existing land uses which in turn then intrude into previously untouched ecosystems. The destruction of the ecosystems has far–reaching consequences not only in the regions affected, e.g. for their water regime, but is felt far beyond. The soya boom results in a drastic reduction of regional biodiversity and also impacts on the climate as in the course of the conversion large quantities of GHG emissions are released.
In Argentina, the expansion of soya cropping (with approximately 17 million ha under soyabeans in 2009) affects, for example, the Chaco dry forests as well as the cloud forests. The Argentinean cloud forests are amongst the most highly endangered terrestrial ecosys-tems on earth. In Paraguay (with approximately 2.6 million ha under soyabeans in 2009) only fragments of the Atlantic rainforests remain. Brazil grows soyabeans on 22 million ha – the largest soya cropping area by far. This area doubled in the past 12 years alone, seriously affecting for example the Brazilian Cerrado and, indirectly by displacing livestock systems more so than directly, the Amazonian tropical rainforest.
Though not as well known as the Amazonian rainforest, the Cerrado, the central Brazilian savannah, is one of the most biodiverse savannah regions on the planet. The Cerrado is characterized by its diverse range of habitats and high species diversity, resulting in it being considered one of the global biodiversity hotspots. This unique ecosystem is under enor-mous pressure. By 2008, some 47% of the natural vegetation of the Cerrado had been lost. Primarily it had made way for agriculture with the expansion of soya cropping being the main culprit. Average deforestation of the Cerrado runs at a little over 14,000 sq km per year and there is no end in sight.
*Source: WWF 2011: Soya and the Cerrado: Brazil’s forgotten jewel. WWF UK.
Meat Eats Land | 47
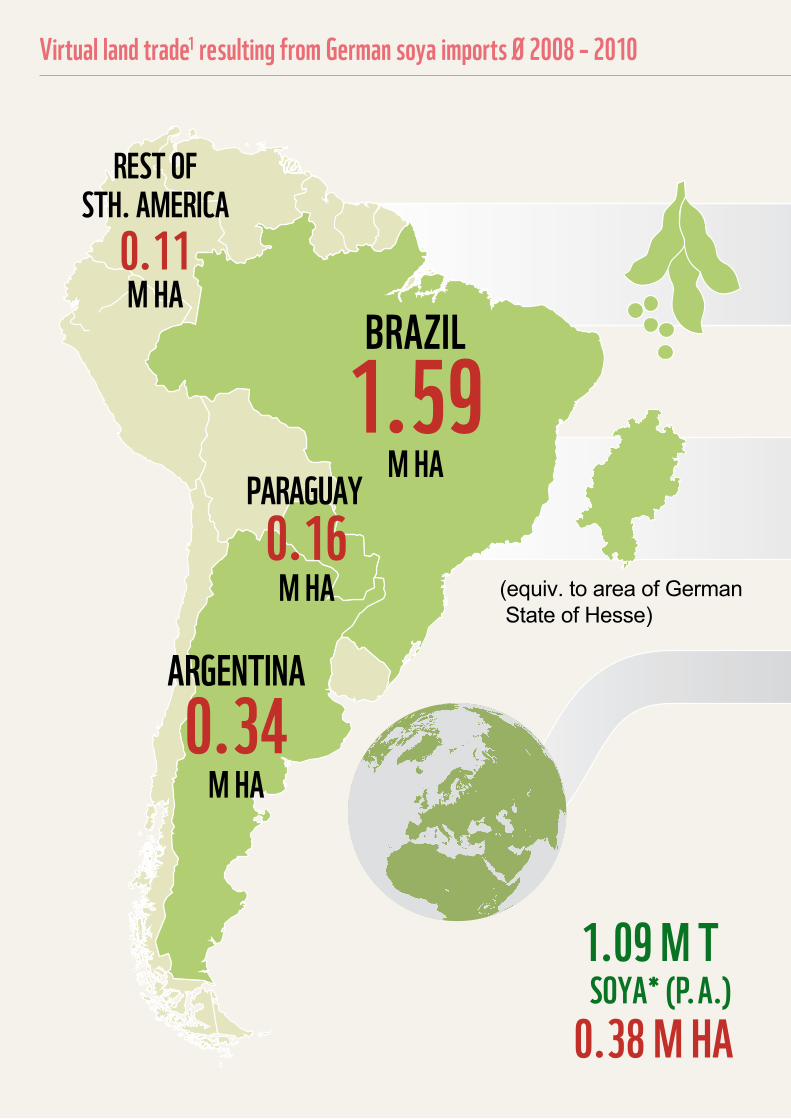
BRAZIL
1.59M HA
ARGENTINA0.34
M HA
PARAGUAY 0.16
M HA
REST OFSTH. AMERICA
0.11M HA
(equiv. to area of German State of Hesse)
1.09 M T SOYA* (P. A.)
0.38 M HA
79%FEED
19%FOOD
2%OTHER USES
Source :FAO 2007
5.34 M TSOYA* ( P. A.)
2.2 M HASOUTH AMERICA
*Soya equivalents
REST OF THE WORLD:
HOW SOYAIS USED
Virtual land trade1 resulting from German soya imports Ø 2008 – 2010
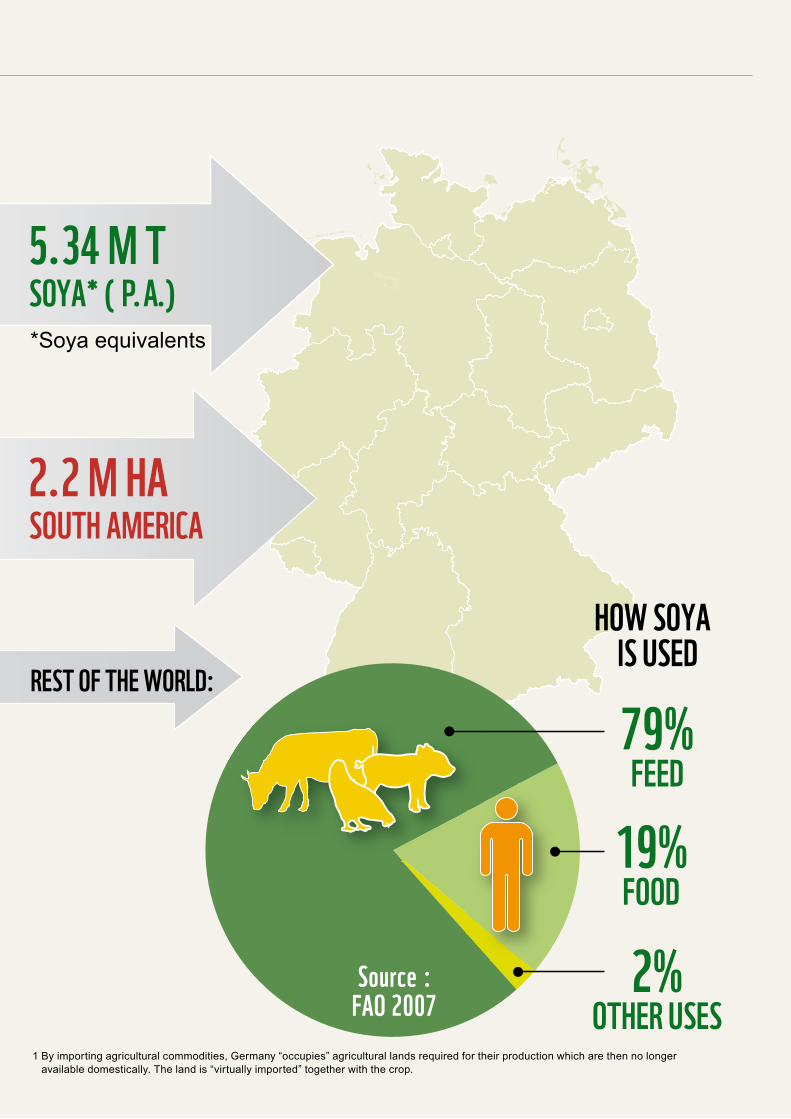
1 By importing agricultural commodities, Germany “occupies” agricultural lands required for their production which are then no longer available domestically. The land is “virtually imported” together with the crop.
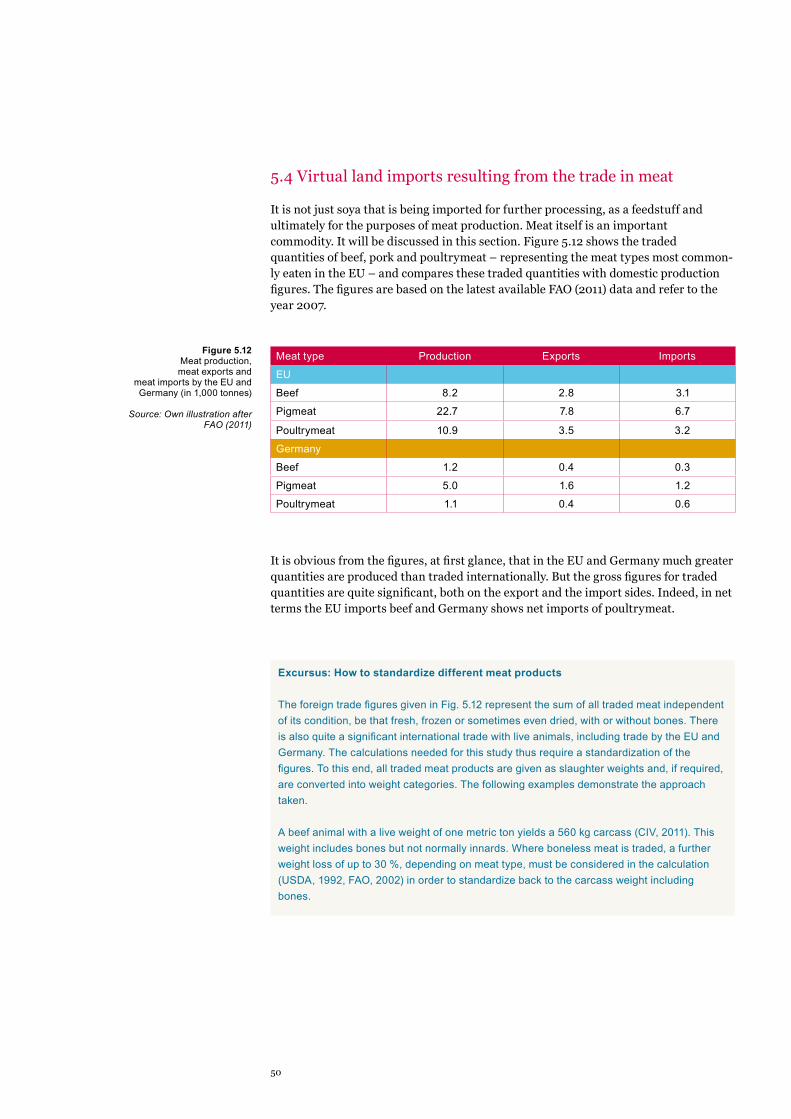
5.4 Virtual land imports resulting from the trade in meat
It is not just soya that is being imported for further processing, as a feedstuff and ultimately for the purposes of meat production. Meat itself is an important commodity. It will be discussed in this section. Figure 5.12 shows the traded quantities of beef, pork and poultrymeat – representing the meat types most common-ly eaten in the EU – and compares these traded quantities with domestic production figures. The figures are based on the latest available FAO (2011) data and refer to the year 2007.
Meat type Production Exports Imports
EU
Beef 8.2 2.8 3.1
Pigmeat 22.7 7.8 6.7
Poultrymeat 10.9 3.5 3.2
Germany
Beef 1.2 0.4 0.3
Pigmeat 5.0 1.6 1.2
Poultrymeat 1.1 0.4 0.6
It is obvious from the figures, at first glance, that in the EU and Germany much greater quantities are produced than traded internationally. But the gross figures for traded quantities are quite significant, both on the export and the import sides. Indeed, in net terms the EU imports beef and Germany shows net imports of poultrymeat.
Figure 5.12Meat production, meat exports and
meat imports by the EU and Germany (in 1,000 tonnes)
Source: Own illustration after FAO (2011)
Excursus: How to standardize different meat products
The foreign trade figures given in Fig. 5.12 represent the sum of all traded meat independent of its condition, be that fresh, frozen or sometimes even dried, with or without bones. There is also quite a significant international trade with live animals, including trade by the EU and Germany. The calculations needed for this study thus require a standardization of the figures. To this end, all traded meat products are given as slaughter weights and, if required, are converted into weight categories. The following examples demonstrate the approach taken.
A beef animal with a live weight of one metric ton yields a 560 kg carcass (CIV, 2011). This weight includes bones but not normally innards. Where boneless meat is traded, a further weight loss of up to 30 %, depending on meat type, must be considered in the calculation (USDA, 1992, FAO, 2002) in order to standardize back to the carcass weight including bones.
50
Beef and poultrymeat from South America also result in land imports
As a result of the standardization to a uniform carcass weight, as outlined in the above excursus, our own calculations yield trade balances that may differ from those of the FAO (2011). Figure 5.13 shows these net trade balances for the most important meat types in the EU and Germany. Moreover, Figure 5.13 reveals the actual origins of the meat. It is important to note that the figures are averages of the years 2008–2010 and that the figures for Germany again refer “only” to trade with trade partners from outside the EU to allow for improved comparability.
It is obvious that the EU is a net importer of beef and a net exporter of pigmeat and poultrymeat. However, a more detailed assessment of the data shows that the foreign trade with South America in particular stands out from the rest: Massive quantities of beef and poultrymeat are imported from that part of the world. Similarly, Germany is a net importer of beef, pigmeat and poultrymeat from South America while its overall trade balance with all trade partners outside of the EU is positive.
Brazil and Argentina are again the main actors, as of the total of 362,000 tonnes of beef imported into the EU from South America, Brazil and Argentina account for 176,000 and 106,000 tonnes respectively. The situation with regard to poultrymeat is similar: Brazil accounts for 381,000 tonnes and Argentina for 16,000 tonnes of the regional balance of 412,000 tonnes net imported into the EU. The same pattern holds true for German imports, albeit at a lower overall level.
At a trade volume of a few million tonnes, meat as a commodity may appear relatively insignificant compared to other commodities but that is not so. For example, 412,000 tonnes of chicken meat from South America, at an average broiler carcass weight of 1,100 g, are equivalent to approximately 375 million broilers or three times the German national flock (Destatis, 2011; DVT, 2011). Similarly, 362,000 tonnes of beef from South America at an average carcass weight of 342 kg (Rindermastberatung, 2011) translate into just under 1.1 million beef cattle or as many cattle as are kept in Schleswig–Holstein, a German federal state with high comparative advantages for beef production.
Meat Eats Land | 51
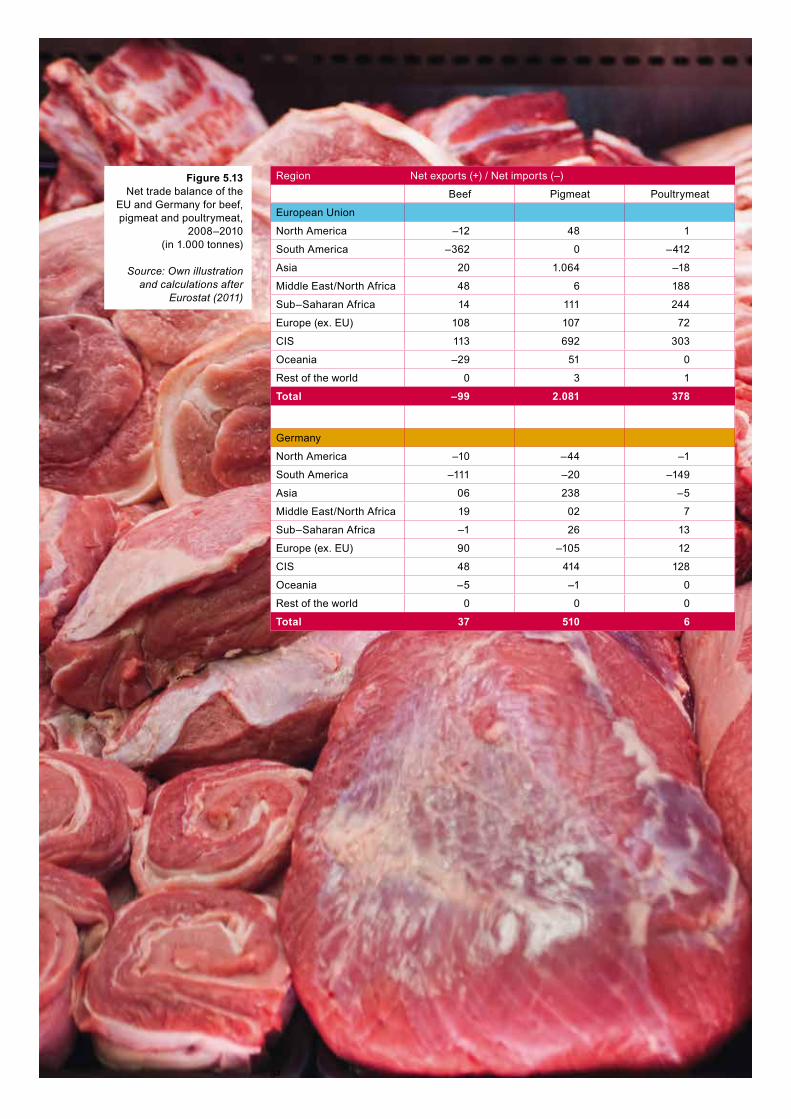
Region Net exports (+) / Net imports (–)
Beef Pigmeat Poultrymeat
European Union
North America –12 48 1
South America –362 0 –412
Asia 20 1.064 –18
Middle East/North Africa 48 6 188
Sub–Saharan Africa 14 111 244
Europe (ex. EU) 108 107 72
CIS 113 692 303
Oceania –29 51 0
Rest of the world 0 3 1
Total –99 2.081 378
Germany
North America –10 –44 –1
South America –111 –20 –149
Asia 06 238 –5
Middle East/North Africa 19 02 7
Sub–Saharan Africa –1 26 13
Europe (ex. EU) 90 –105 12
CIS 48 414 128
Oceania –5 –1 0
Rest of the world 0 0 0
Total 37 510 6
Figure 5.13Net trade balance of the
EU and Germany for beef, pigmeat and poultrymeat,
2008–2010 (in 1.000 tonnes)
Source: Own illustration and calculations after
Eurostat (2011)
52

What is the land footprint of this meat?
The traded quantities are anything but “small” for yet another reason: Together with the traded meat, there is additional virtual trade in soya and other feedstuffs with the land area these require for their production.
Excursus: How can the land area required for meat production be calculated?
When calculating the virtual trade flows of agricultural land resulting from livestock production two issues are of significance.
• In contrast to the plant–based products where yield data can be used for conversions, it is not possible for livestock–based products to simply infer the land area required from data on production or foreign trade. Such a conversion would need to be based on average feed rations for each of the world regions considered here. Obtaining such data is not without difficulty.
• Even for Germany it proved quite difficult to calculate average concentrate feed rations (cf. comments earlier in the text). Things become even more complex when – in particular for ruminants – the green feed component must be considered as well as feedstuffs such as sugar beet pulp, molasses, legumes etc. that are fed across the entire spectrum of livestock categories.
This area of research has been fairly neglected, with few systematic studies and a great deal of uncertainty overall. For the calculations here we used feed ration data for concentrate feed mixtures (cf. comments earlier in the text) – for which average values could also be determined as described for the rest of the world outside of the EU – and the results of a meta–analysis by de Vries & Boer (2010) who compared a total of 16 studies with respect to individual assessment methods and different countries. As a result, the following figures can be given for land use per kg livestock product:
• Beef: 27–49 m2.• Pigmeat: 9–12 m2.• Poultrymeat: 8–10 m2.• Milk: 1–2 m2 and• Eggs: 4–6 m2.
Schlatzer (2010) uses a similar rationale and the estimates given by Leescher et al. (2011) are also broadly similar.
Comparing the findings and data on land requirements for livestock production (see Excursus) with the authors’ own inferred concentrate feed rations (cf. Chapter 4) and assuming that (a) in the EU overall and in Germany in particular feed efficiency is relatively high, and (b) important beef exporting countries predominantly utilize grasslands, the resultant notional land requirements for Germany, the EU, and outside of the EU are given in Fig. 5.14.
Meat Eats Land | 53
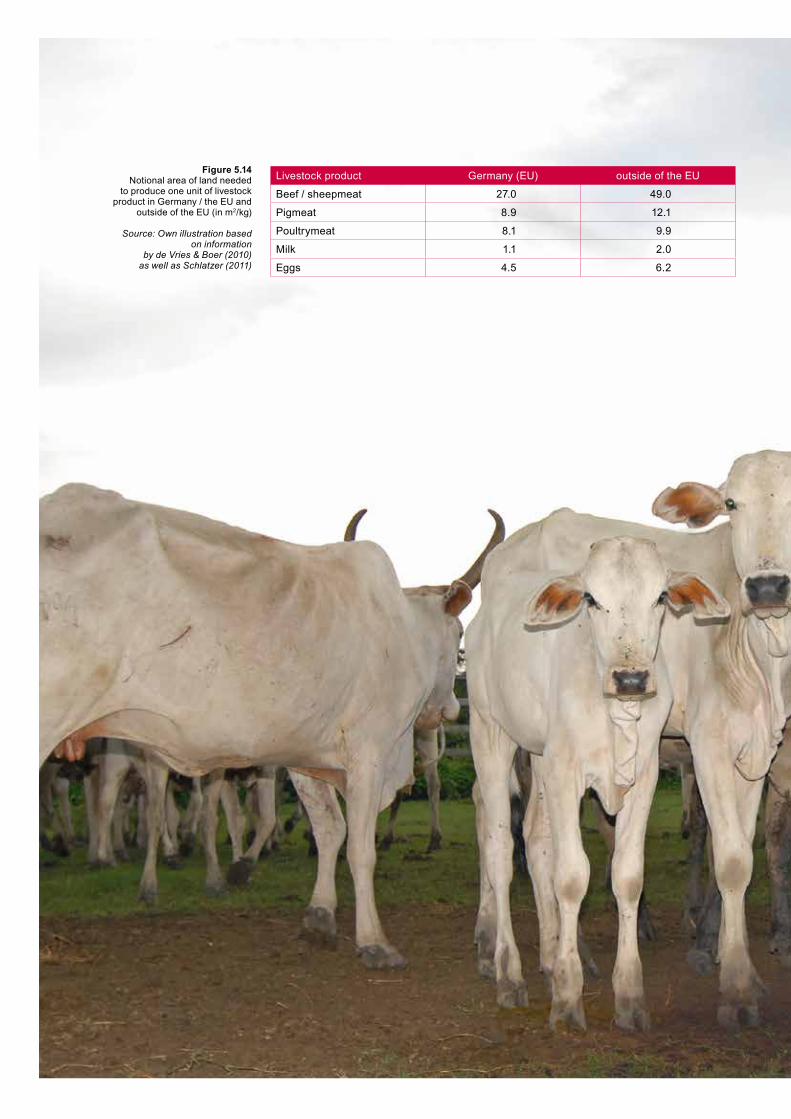
Livestock product Germany (EU) outside of the EU
Beef / sheepmeat 27.0 49.0
Pigmeat 8.9 12.1
Poultrymeat 8.1 9.9
Milk 1.1 2.0
Eggs 4.5 6.2
Figure 5.14Notional area of land needed
to produce one unit of livestock product in Germany / the EU and
outside of the EU (in m2/kg)
Source: Own illustration based on information
by de Vries & Boer (2010) as well as Schlatzer (2011)
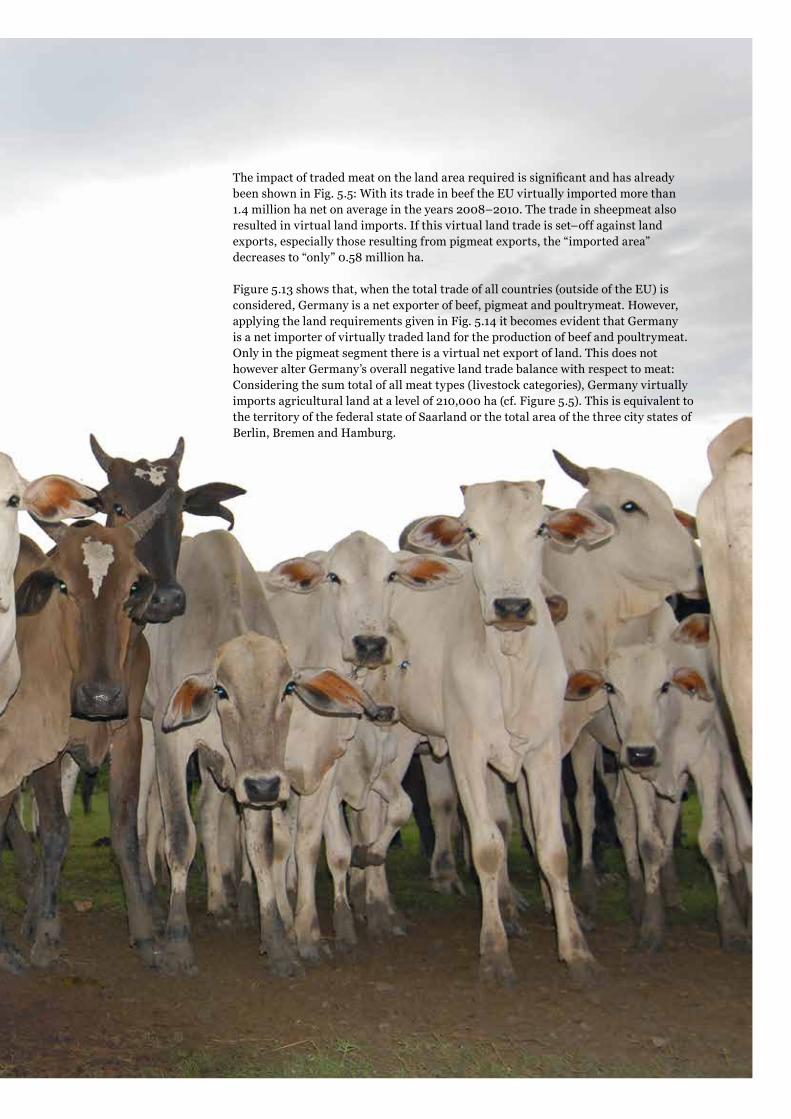
The impact of traded meat on the land area required is significant and has already been shown in Fig. 5.5: With its trade in beef the EU virtually imported more than 1.4 million ha net on average in the years 2008–2010. The trade in sheepmeat also resulted in virtual land imports. If this virtual land trade is set–off against land exports, especially those resulting from pigmeat exports, the “imported area” decreases to “only” 0.58 million ha.
Figure 5.13 shows that, when the total trade of all countries (outside of the EU) is considered, Germany is a net exporter of beef, pigmeat and poultrymeat. However, applying the land requirements given in Fig. 5.14 it becomes evident that Germany is a net importer of virtually traded land for the production of beef and poultrymeat. Only in the pigmeat segment there is a virtual net export of land. This does not however alter Germany’s overall negative land trade balance with respect to meat: Considering the sum total of all meat types (livestock categories), Germany virtually imports agricultural land at a level of 210,000 ha (cf. Figure 5.5). This is equivalent to the territory of the federal state of Saarland or the total area of the three city states of Berlin, Bremen and Hamburg.
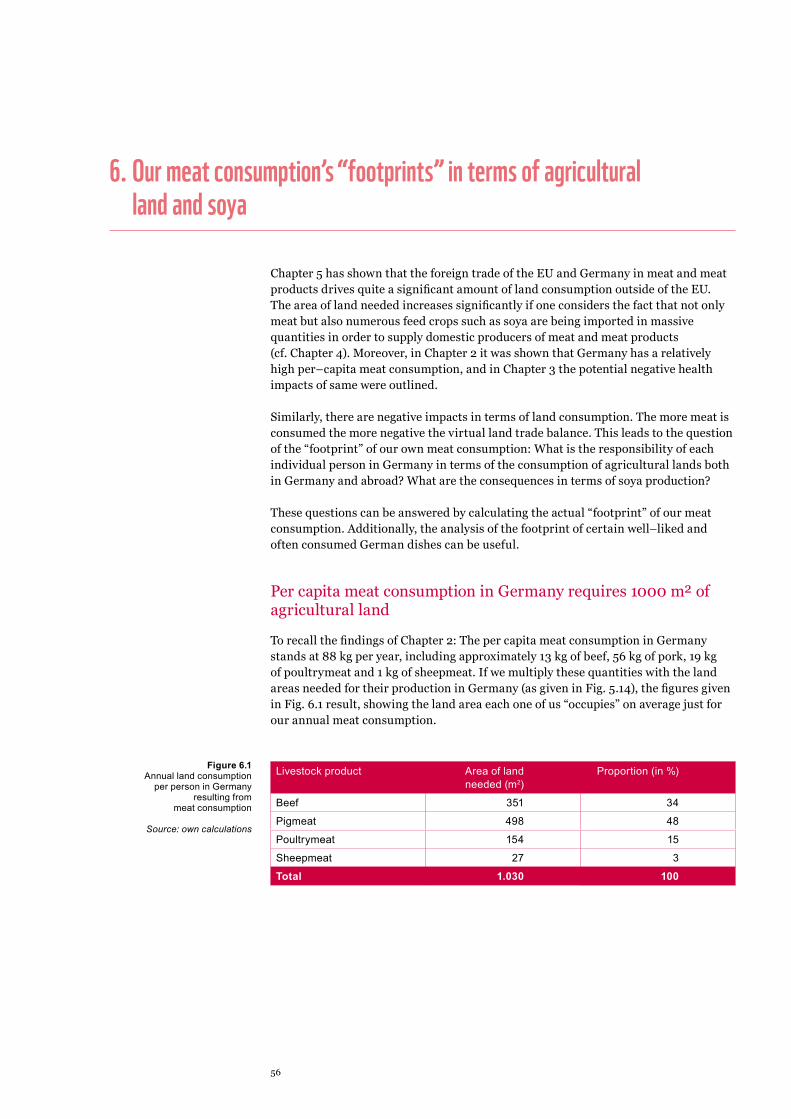
Chapter 5 has shown that the foreign trade of the EU and Germany in meat and meat products drives quite a significant amount of land consumption outside of the EU. The area of land needed increases significantly if one considers the fact that not only meat but also numerous feed crops such as soya are being imported in massive quantities in order to supply domestic producers of meat and meat products (cf. Chapter 4). Moreover, in Chapter 2 it was shown that Germany has a relatively high per–capita meat consumption, and in Chapter 3 the potential negative health impacts of same were outlined.
Similarly, there are negative impacts in terms of land consumption. The more meat is consumed the more negative the virtual land trade balance. This leads to the question of the “footprint” of our own meat consumption: What is the responsibility of each individual person in Germany in terms of the consumption of agricultural lands both in Germany and abroad? What are the consequences in terms of soya production?
These questions can be answered by calculating the actual “footprint” of our meat consumption. Additionally, the analysis of the footprint of certain well–liked and often consumed German dishes can be useful.
Per capita meat consumption in Germany requires 1000 m² of agricultural land
To recall the findings of Chapter 2: The per capita meat consumption in Germany stands at 88 kg per year, including approximately 13 kg of beef, 56 kg of pork, 19 kg of poultrymeat and 1 kg of sheepmeat. If we multiply these quantities with the land areas needed for their production in Germany (as given in Fig. 5.14), the figures given in Fig. 6.1 result, showing the land area each one of us “occupies” on average just for our annual meat consumption.
Livestock product Area of land needed (m2)
Proportion (in %)
Beef 351 34
Pigmeat 498 48
Poultrymeat 154 15
Sheepmeat 27 3
Total 1.030 100
6. Our meat consumption’s “footprints” in terms of agricultural land and soya
Figure 6.1Annual land consumption
per person in Germany resulting from
meat consumption
Source: own calculations
56
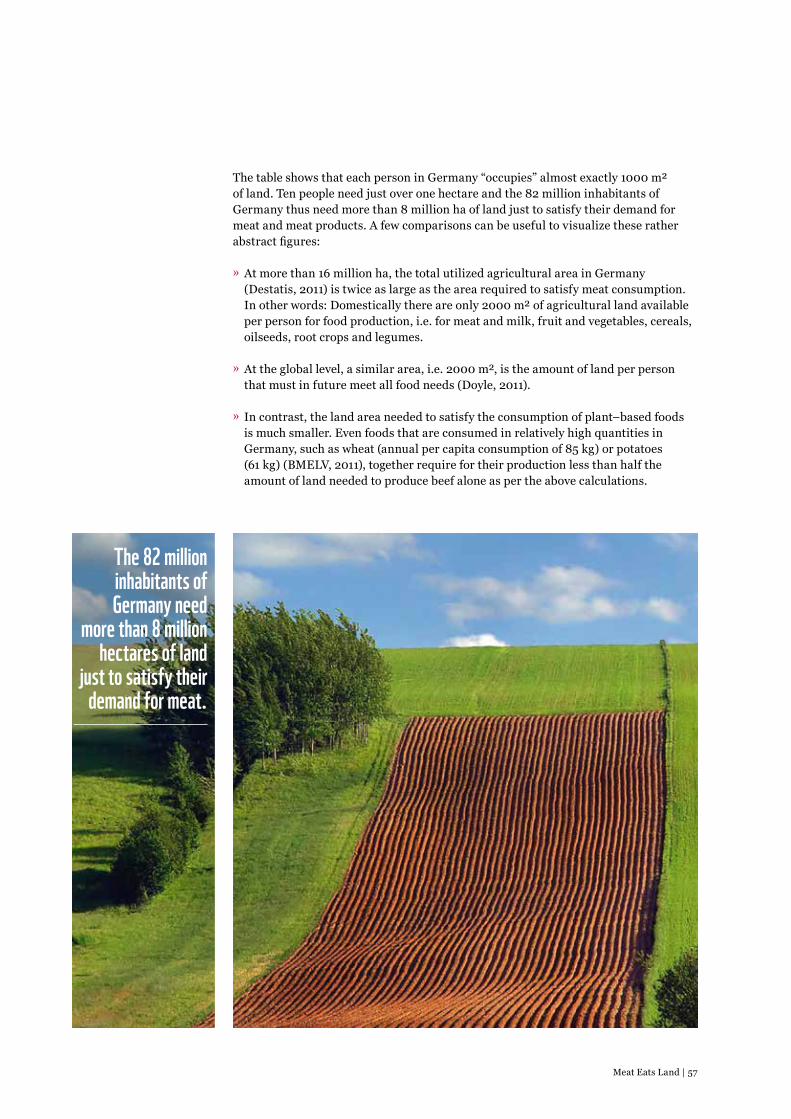
The table shows that each person in Germany “occupies” almost exactly 1000 m² of land. Ten people need just over one hectare and the 82 million inhabitants of Germany thus need more than 8 million ha of land just to satisfy their demand for meat and meat products. A few comparisons can be useful to visualize these rather abstract figures:
» At more than 16 million ha, the total utilized agricultural area in Germany (Destatis, 2011) is twice as large as the area required to satisfy meat consumption. In other words: Domestically there are only 2000 m² of agricultural land available per person for food production, i.e. for meat and milk, fruit and vegetables, cereals, oilseeds, root crops and legumes.
» At the global level, a similar area, i.e. 2000 m², is the amount of land per person that must in future meet all food needs (Doyle, 2011).
» In contrast, the land area needed to satisfy the consumption of plant–based foods is much smaller. Even foods that are consumed in relatively high quantities in Germany, such as wheat (annual per capita consumption of 85 kg) or potatoes (61 kg) (BMELV, 2011), together require for their production less than half the amount of land needed to produce beef alone as per the above calculations.
The 82 million inhabitants of Germany need
more than 8 million hectares of land
just to satisfy their demand for meat.
Meat Eats Land | 57

Figure 6.2Annual soya cropland
consumption per person in Germany resulting
from meat consumption
Source: own calculations
To satisfy our appetite for meat the entire territory of Saxony would need to be devoted to soya cropping
The figures given in Fig. 6.1 include soya. However, it is also possible to account separately for soya as shown in Fig. 6.2. Here, the soyameal feed consumption of 232 g/kg beef or sheepmeat, 648 g/kg pigmeat and 967 g/kg poultrymeat have been converted into soya and then divided by average yields based on the latest available figures on production and foreign trade structures. According to these calculations, 229 m² of soya cropland are needed to satisfy the average per capita meat consumption in Germany.
Livestock product Area of land needed (m2) Proportion (in %)
Beef 12 5
Pigmeat 143 63
Poultrymeat 73 32
Sheepmeat 1 1
Total 229 100
At first sight that does not seem to be all that much. However, a comparison illustrates the actual dimensions: An area of 229 m² is about the size of a tennis court (260m²). 82 million Germans “occupy” just under 19,000 km² of soya cropland just to satisfy their appetite for meat. This is roughly equivalent to the territory of the federal states of Saxony or Rhineland–Palatinate respectively.
MEAT CONSUMPTION PER PERSON IN 2009
(IN KG)4.07
1.26
2.87
0.22
8.5
2.0
11.0
PORK
POULTRY
BEEF
OTHER MEAT
39.08.42
LAND AREA NEEDED FOR GERMAN MEAT CONSUMPTION(IN MILLION HA)
58
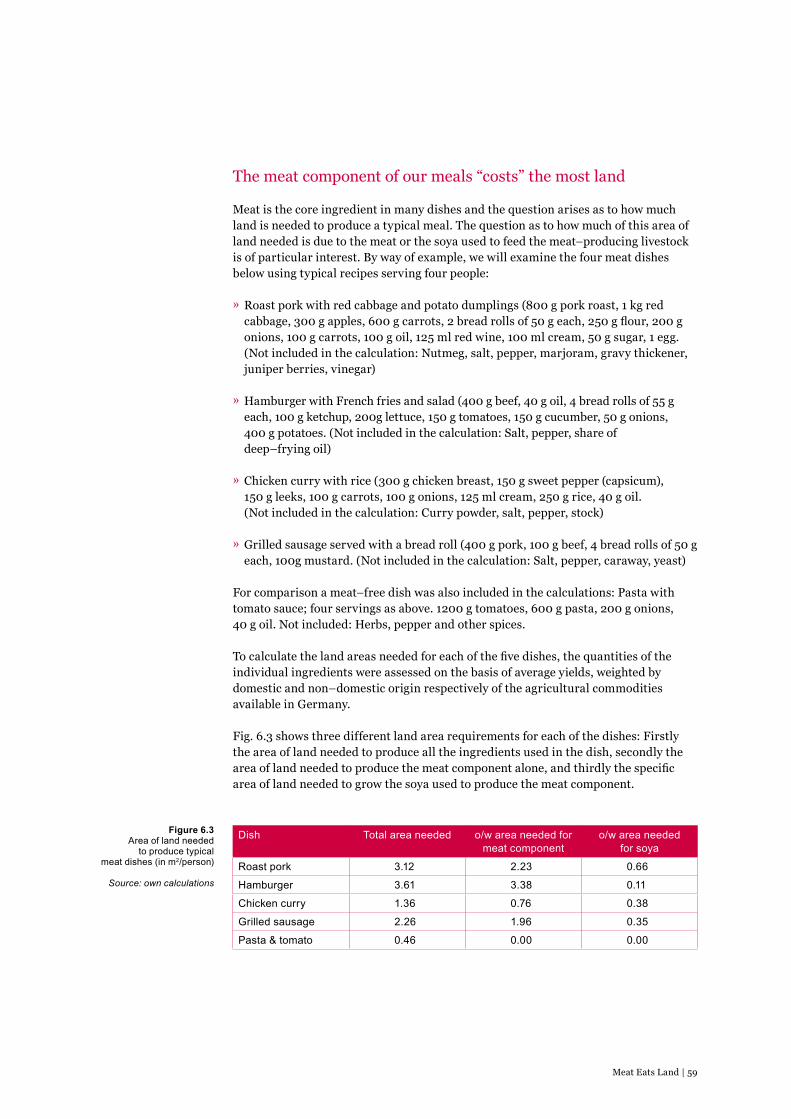
The meat component of our meals “costs” the most land
Meat is the core ingredient in many dishes and the question arises as to how much land is needed to produce a typical meal. The question as to how much of this area of land needed is due to the meat or the soya used to feed the meat–producing livestock is of particular interest. By way of example, we will examine the four meat dishes below using typical recipes serving four people:
» Roast pork with red cabbage and potato dumplings (800 g pork roast, 1 kg red cabbage, 300 g apples, 600 g carrots, 2 bread rolls of 50 g each, 250 g flour, 200 g onions, 100 g carrots, 100 g oil, 125 ml red wine, 100 ml cream, 50 g sugar, 1 egg. (Not included in the calculation: Nutmeg, salt, pepper, marjoram, gravy thickener, juniper berries, vinegar)
» Hamburger with French fries and salad (400 g beef, 40 g oil, 4 bread rolls of 55 g each, 100 g ketchup, 200g lettuce, 150 g tomatoes, 150 g cucumber, 50 g onions, 400 g potatoes. (Not included in the calculation: Salt, pepper, share of deep–frying oil)
» Chicken curry with rice (300 g chicken breast, 150 g sweet pepper (capsicum), 150 g leeks, 100 g carrots, 100 g onions, 125 ml cream, 250 g rice, 40 g oil. (Not included in the calculation: Curry powder, salt, pepper, stock)
» Grilled sausage served with a bread roll (400 g pork, 100 g beef, 4 bread rolls of 50 g each, 100g mustard. (Not included in the calculation: Salt, pepper, caraway, yeast)
For comparison a meat–free dish was also included in the calculations: Pasta with tomato sauce; four servings as above. 1200 g tomatoes, 600 g pasta, 200 g onions, 40 g oil. Not included: Herbs, pepper and other spices.
To calculate the land areas needed for each of the five dishes, the quantities of the individual ingredients were assessed on the basis of average yields, weighted by domestic and non–domestic origin respectively of the agricultural commodities available in Germany.
Fig. 6.3 shows three different land area requirements for each of the dishes: Firstly the area of land needed to produce all the ingredients used in the dish, secondly the area of land needed to produce the meat component alone, and thirdly the specific area of land needed to grow the soya used to produce the meat component.
Dish Total area needed o/w area needed for meat component
o/w area needed for soya
Roast pork 3.12 2.23 0.66
Hamburger 3.61 3.38 0.11
Chicken curry 1.36 0.76 0.38
Grilled sausage 2.26 1.96 0.35
Pasta & tomato 0.46 0.00 0.00
Figure 6.3 Area of land needed
to produce typical meat dishes (in m2/person)
Source: own calculations
Meat Eats Land | 59

While the selection of dishes is a random one and does not claim to be representative there are some interesting differences as well as commonalities:
» The figures show that of the five examples the hamburger with French fries and salad needs the most land per person, even more than the typical German Sunday dish of roast pork with red cabbage and dumplings.
» However, the area of land needed for soya is highest for the pork roast, followed by the chicken dish. This is due to the high proportion of soyabean meal in the average feed rations for non–ruminants as outlined earlier in this report.
» The following holds true for all the meat dishes: The proportion of the area of land needed which is caused by the dishes’ meat component is greater than that of all the other ingredients. In all examples it is greater than 50 % and it can even be greater than 90 %.
» In contrast, the vegetarian dish needs significantly less cropland for its production and no soya cropland at all.
72 %
87 %
94 %
Hamburger with French fries and salad(100 g beef)
Roast pork with red cabbage and potato dumplings(200 g pork)
Proportion of total area needed due to MEAT
Grilled sausage with a bread roll(100 g pork, 25 g beef)
Pasta with tomato sauce
Chicken curry with rice and vegetables(75 g chicken)
3.61 m2 3.12 m2
2.26 m21.36 m2
0.46 m2
56 %
Area of land needed for some typical dishes
60
Conclusions and outlook
The area footprints of our overall highly meat–based diet are very large. This statement is quite generally applicable, but particularly so with regard to the traditional German dishes. In the introduction to this study it was pointed out that land use changes such as the cutting down of tropical rainforests and the ploughing up of grasslands resulting from extensive livestock production can have serious repercussions for i.a. the climate, the water regime and biodiversity. Every one of us should be conscious of our responsibilities with regard to resource protection as the conversion of natural areas into agricultural land is likely to continue into the future. As the world’s human population is expanding and changing eating habits push global demand for food to ever higher levels (Kirschke et al., 2011) this will be difficult to stop. The growing demand for food comes together with the equally rising demand for biofuels. Both result in increasing pressure on land as a resource which at a global level can very likely not be offset by yield increases (Kirschke et al., 2011).
The result would be massive land use changes. In South America for example almost 4 million ha of forests are still being destroyed every year, 2.6 million ha in Brazil alone (FAO, 2011). While these figures are lower than those recorded in the 1990s they clearly are still much too high and strongly soya–based livestock production in South America for export purposes plays a major role in this ongoing destruction (cf. Steinfeld et al., 2006). If we do not manage to moderate our consumption of livestock–based foods, and meat in particular, this process is very likely to continue.
Given that meat is a nutritious food, these concerns should not be taken as an appeal to completely abstain from meat products in favour of a vegetarian diet. We do however need a more conscious approach to eating meat. It is important to realize that excessive meat consumption has repercussions both for one’s health and for the environment. Moreover, lower meat consumption would positively impact on Germany’s and the EU’s agricultural foreign trade net balances.
Further research is needed on eating habits and their successive modification. Many questions need to be answered: What would be the impact on land consumption of changes in dietary patterns in Germany? What would be the con-sequences on the demand for feedstuffs such as soya, and on foreign trade? What would be the impact of changing eating habits on virtual land consumption and on land use, for example with respect to tropical rainforests and the Cerrado in South America? What would be the positive effects in terms of the greenhouse gas balance? Further work on this project will focus on these and other questions.

The “area footprint” and the “soya footprint” of our strongly meat-based diet are very large and have negative repercussions for the environment. Moreover, at an average of 88 kg of per person and year we would also be well advised to reconsider our meat consumption levels from a health point of view. The German Nutrition Society (DGE) recommends a level of 300-600 g per week which is significantly less than half of what is currently being consumed. A healthy and balanced diet in which vegetables and cereal products are more frequently substituted for meat can thus make an important contribution to both our health and to the protection of rainforests and other species-rich ecosystems.
Furthermore, the WWF recommends that when consumers buy meat they do so more consciously and buy meat that is produced with the least environmental impact. Generally this includes meat produced to the standards of the EU Organic Regulation, the organic farming associations and the Neuland producer association as well as “pastured meat” from livestock kept on pasture year-round.
It is the view of the WWF that key criteria for “good” meat are as follows:
» In the production of feedstuffs the use of chemical nitrogen fertilizers is not permitted. The aim should be that material and energy cycles are closed to the greatest extent possible.
» In the production of feedstuffs the use of synthetic plant protection products is not permitted.
» In the production of feedstuffs the use of genetically modified crop plants is not permitted.
» Livestock management fulfils the animals’ welfare requirements. This includes i.a. that the animals enjoy sufficient space for movement throughout the year and have access to pasture / outdoor runs year-round. Fully slatted houses are not permitted.
» Painful procedures may only be carried out under anaesthesia and with pain treatment. Moreover, practices such as for example tail-docking or tooth-cutting in pig production, as they are frequently used in conventional livestock production, are prohibited.
» The use of conventional medication is only permitted in exceptional cases. Preventi-ve use of antibiotics and the use of antibiotics for fattening are prohibited. Similarly, synthetic growth promoters and production enhancers must not be used.
» Cattle, sheep and other ruminants spend much of their time on pasture and their feed consists largely of green feed (grass, hay, silage, clover) (“pastured meat”).
» Live transports of livestock should not exceed a duration of four hours.
For further information please see: www.wwf.de/themen/landwirtschaft/
WWF consumer recommendations
Meat Eats Land | 63
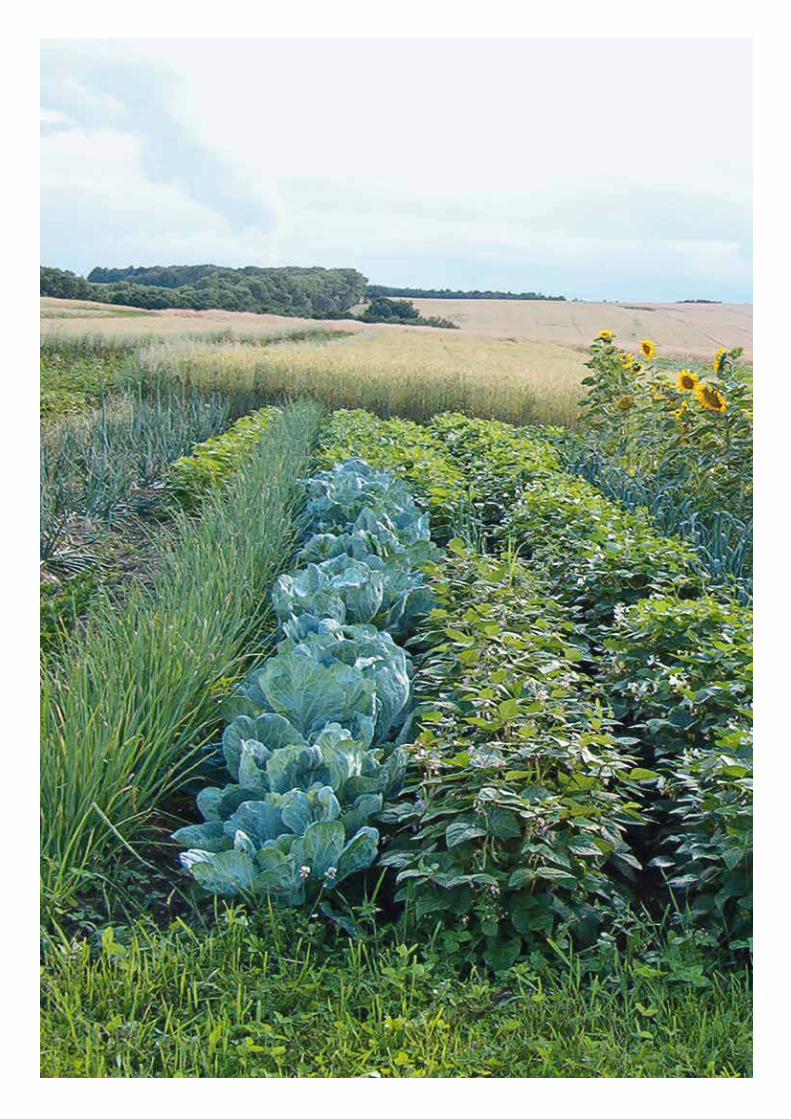

WWF’s agricultural policy demands
In the context of the current Common Agricultural Policy (CAP) reform process WWF has developed a vision calling for a fundamental reorientation of the CAP. The proposed future “Common Environmental and Rural Development Policy” (CERP) is based on the principle that public money should only be used for the provision of public goods. These public goods include for example the preservation of biodiversity, the protection of soils, and the protection of water resources. Finan-cial support should be paid to those farmers who provide these goods to the benefit of society at large and who rigorously implement the principles of sustainability. Moreover, WWF calls for renewed support for the production of feedstuffs within the EU in order to have alternatives to soya at hand. Such changes in the policy environment would significantly contribute to improved sustainability in meat production in the future.
» From 2021 onwards European farmers should no longer receive direct payments. In order to qualify for premia, any farmer must implement clearly defined measures. For example: Establish riparian zones beyond legal requirements; adhere to ambitious crop rotations; devote 10 % of the holding’s agricultural area to conservation measures; protect grasslands.
» Investment support for farmers must be subject to environmental impact assessments.
» No investment support for the construction of large-scale livestock production units.
» The enormous nitrogen surpluses in regions with high livestock densities must be radically reduced. To this end there should be a significant reduction in stocking rates (linking livestock production to available land area).
» European funding should be more strongly devoted to supporting ethologically sound livestock management systems.
» In the future, support should only be directed at farmers who actively support nature conservation, environmental protection and animal welfare in the context of their work.
For further information please see: www.wwf.de/themen/landwirtschaft/
Meat Eats Land | 65

WWF activities in the areas of meat production and feedstuffs
“Farming for Biodiversity”
The farming sector in Germany continues to be the main driver of biodiversity loss. However, in contrast to “conventional” farming, methods used in organic farming can have a positive impact on biodiversity. The aim of the project is to systematically build on this potential with a view to preserving and enhancing biodiversity. In cooperation with the Biopark organic producer association and the Mecklenburg-Western Pomeranian Ministry of Agriculture, the Environment and Consumer Production the WWF has developed a concept that will allow for the future integration of biodiversity criteria into the Biopark organic production standards. Mecklenburg-Western Pomerania will serve as a pilot region. Each of the Biopark certified farms are to implement species and habitat protection measures on 10 % of their holdings. Approximately 280 farms with a combined area of about 68,000 hectares will be included in the project. Due to the Biopark farms’ production structures the focus will be on livestock management. Support for the maintenance of heritage livestock breeds will be part of the project.
For further information please see: www.wwf.de/themen/landwirtschaft/
Cooperation with Danone: Conversion of milk production to GM-free milk and increased production of domestic feed crops
The aim of this cooperation is to convert Danone’s largest dairy plant, in Ochsenfurth, to GM-free milk production. To this end the dairy cows are to be fed GM-free soya and increasing proportions of domestically produced feed crops. The creamery is associated with 520 farm holdings and total milk production is at a level of 94,000 tonnes (94 million kg).
Two-step conversion process:
» As a first step, imported GM-free soya is to be substituted for the genetically modified soya.
» The second step involves is increasing substitution of domestically produced feed crops for imported feedstuffs.
For further information please see: www.wwf.de/themen/landwirtschaft/
Meat Eats Land | 67

The EU’s land consumption by region and for selected agricultural primary products. 2008-2010 (in million ha)
Wheat Grain maize Feed-grade cereals
Soya Oilpalm Oilseed rape Other oilseeds Coffee/cocoa Tea/tobacco Legumes Beef Pigmeat Poultrymeat Sheepmeat Milk Total*
North America –0.93 –0.01 0.01 –1.59 –0.01 –0.08 0.25 0.59 –0.02 –0.42 –0.06 0.04 0.00 –0.00 0.08 –2.18
South America 0.01 –0.80 0.10 –12.87 –0.08 –0.01 –0.72 –2.03 –0.18 –0.05 –1.78 –0.00 –0.41 –0.07 0.09 –20.00
of which
Brazil 0.00 –0.53 0.05 –6.43 –0.01 –0.00 0.03 –0.78 –0.13 0.00 –0.86 0.00 –0.38 –0.00 0.00 –9.59
Argentina –0.00 –0.20 –0.04 –5.47 –0.00 –0.01 –0.72 0.01 –0.02 –0.03 –0.52 0.00 –0.02 –0.03 0.00 –7.13
Paraguay –0.00 –0.06 0.00 –0.80 0.00 –0.00 –0.02 0.00 –0.00 –0.00 –0.01 0.00 0.00 0.00 0.00 –0.90
Asia 0.45 0.04 0.17 –0.20 –1.99 0.01 –0.64 –0.77 –0.15 0.00 0.05 0.95 –0.05 0.01 0.32 –2.52
Middle East/North Africa
2.45 0.14 0.40 0.08 0.00 –0.09 –0.54 0.12 0.06 0.05 0.13 0.01 0.15 0.01 0.52 3.60
Sub-Saharan Africa
1.01 0.03 0.16 0.06 –0.13 0.00 –0.11 –4.81 –0.20 –0.00 –0.02 0.10 0.20 0.01 0.23 –4.22
Europe (excl. EU)
0.30 –0.08 0.14 –0.01 0.04 0.06 0.25 0.35 –0.20 0.00 0.28 0.09 0.06 0.00 0.03 1.38
CIS –1.13 –0.21 –0.07 –0.16 0.08 –1.41 –1.89 0.41 0.04 –0.16 0.30 0.62 0.25 0.00 0.24 –2.98
Oceania –0.18 0.00 0.01 0.00 0.00 –0.40 0.04 0.02 0.00 –0.00 –0.14 0.05 0.00 –1.04 –0.09 –1.80
Rest of the World
0.00 0.00 0.00 0.00 –0.01 0.00 –0.00 –0.05 –0.00 0.00 –0.00 0.00 0.00 0.00 0.00 –0.05
Total 1.97 –0.88 0.92 –14.69 –2.09 –1.91 –3.36 –6.17 –0.65 –0.58 –1.24 1.84 0.19 –1.08 1.42 –28.78
Germany’s land consumption by region and for selected agricultural primary products, 2008-2010 (in ‘000 ha)
Wheat Grain maize Feed-grade cereals
Soya Oilpalm Oilseed rape Other oilseeds Coffee/cocoa Tea/tobacco Legumes Beef Pigmeat Poultrymeat Sheepmeat Milk Total*
North America –145 –29 55 –529 0 –30 –17 176 –6 –38 –51 –57 –1 0 –41 –774
South America 15 –121 –20 –2.199 –40 –4 –88 –966 –59 –5 –584 –25 –147 –5 22 –4.413
of which 0
Brazil 0 –100 2 –1.588 –3 0 –9 –306 –38 1 –104 0 –126 0 0 –2.329
Argentina –2 –19 –19 –345 0 –4 –58 0 –8 –5 –306 0 –14 –1 0 –807
Paraguay 0 –1 0 –156 0 0 –8 0 0 0 –5 0 0 0 0 –173
Asia 137 –2 32 –5 –477 1 –288 –454 12 –31 17 193 –8 0 173 –907
Middle East/North Africa
369 6 127 48 0 0 –30 38 47 –3 52 2 5 0 121 721
Sub-Saharan Africa
262 5 10 15 –42 0 –18 –1.274 –53 1 –24 21 11 0 111 –1.095
Europe (excl. EU)
82 13 25 9 5 193 1 –45 –116 –11 219 –201 1 3 –379 –284
CIS –256 1 –50 78 5 –375 –67 327 18 –73 128 316 104 0 187 315
Oceania 0 1 –5 0 0 –221 0 32 1 0 –29 –2 0 –146 –20 –406
Rest of the World
0 0 0 0 0 0 –2 –32 0 0 0 0 0 0 0 –35
Total 464 –126 172 –2.583 –549 –436 –510 –2.198 –156 –160 –272 247 –36 –147 174 –6.878
EU–27 0 –83 –278 493 55 –419 –333 589 64 0 451 –7 –96 5 188 42
Total + EU 464 –208 –106 –2.090 –493 –855 –843 –1.609 –92 –160 179 239 –132 –142 362 –6.836
Annex
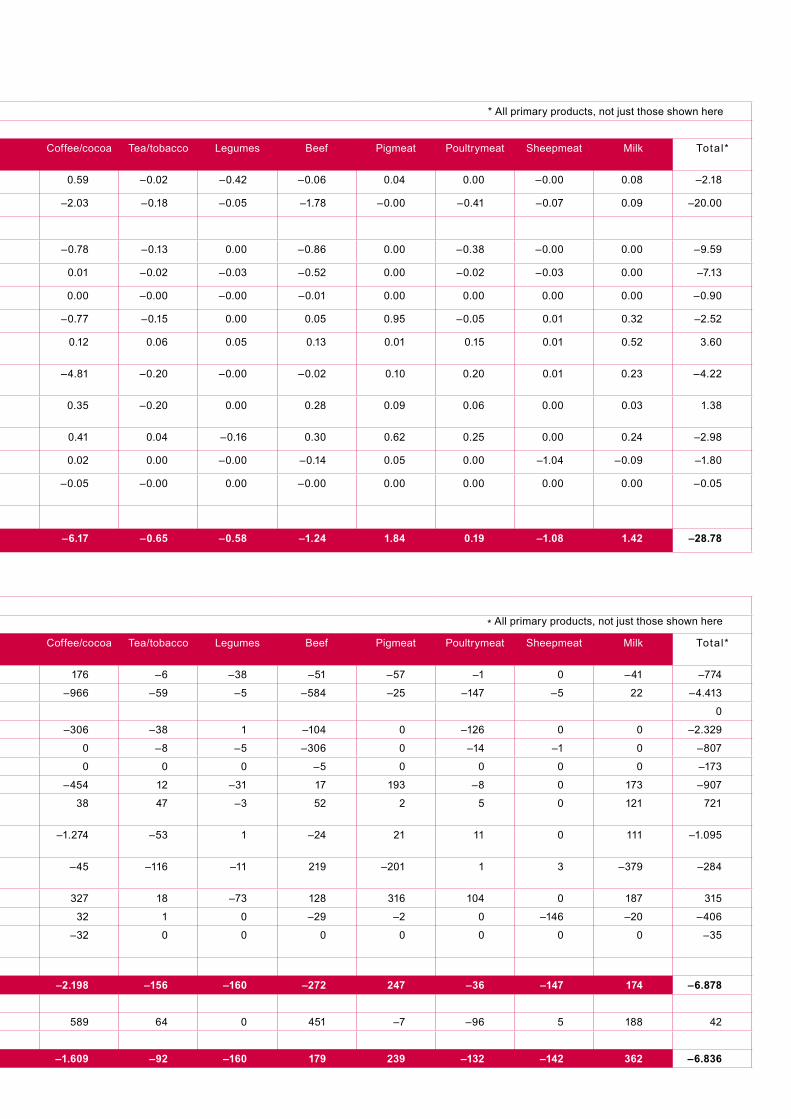
The EU’s land consumption by region and for selected agricultural primary products. 2008-2010 (in million ha)
Wheat Grain maize Feed-grade cereals
Soya Oilpalm Oilseed rape Other oilseeds Coffee/cocoa Tea/tobacco Legumes Beef Pigmeat Poultrymeat Sheepmeat Milk Total*
North America –0.93 –0.01 0.01 –1.59 –0.01 –0.08 0.25 0.59 –0.02 –0.42 –0.06 0.04 0.00 –0.00 0.08 –2.18
South America 0.01 –0.80 0.10 –12.87 –0.08 –0.01 –0.72 –2.03 –0.18 –0.05 –1.78 –0.00 –0.41 –0.07 0.09 –20.00
of which
Brazil 0.00 –0.53 0.05 –6.43 –0.01 –0.00 0.03 –0.78 –0.13 0.00 –0.86 0.00 –0.38 –0.00 0.00 –9.59
Argentina –0.00 –0.20 –0.04 –5.47 –0.00 –0.01 –0.72 0.01 –0.02 –0.03 –0.52 0.00 –0.02 –0.03 0.00 –7.13
Paraguay –0.00 –0.06 0.00 –0.80 0.00 –0.00 –0.02 0.00 –0.00 –0.00 –0.01 0.00 0.00 0.00 0.00 –0.90
Asia 0.45 0.04 0.17 –0.20 –1.99 0.01 –0.64 –0.77 –0.15 0.00 0.05 0.95 –0.05 0.01 0.32 –2.52
Middle East/North Africa
2.45 0.14 0.40 0.08 0.00 –0.09 –0.54 0.12 0.06 0.05 0.13 0.01 0.15 0.01 0.52 3.60
Sub-Saharan Africa
1.01 0.03 0.16 0.06 –0.13 0.00 –0.11 –4.81 –0.20 –0.00 –0.02 0.10 0.20 0.01 0.23 –4.22
Europe (excl. EU)
0.30 –0.08 0.14 –0.01 0.04 0.06 0.25 0.35 –0.20 0.00 0.28 0.09 0.06 0.00 0.03 1.38
CIS –1.13 –0.21 –0.07 –0.16 0.08 –1.41 –1.89 0.41 0.04 –0.16 0.30 0.62 0.25 0.00 0.24 –2.98
Oceania –0.18 0.00 0.01 0.00 0.00 –0.40 0.04 0.02 0.00 –0.00 –0.14 0.05 0.00 –1.04 –0.09 –1.80
Rest of the World
0.00 0.00 0.00 0.00 –0.01 0.00 –0.00 –0.05 –0.00 0.00 –0.00 0.00 0.00 0.00 0.00 –0.05
Total 1.97 –0.88 0.92 –14.69 –2.09 –1.91 –3.36 –6.17 –0.65 –0.58 –1.24 1.84 0.19 –1.08 1.42 –28.78
Germany’s land consumption by region and for selected agricultural primary products, 2008-2010 (in ‘000 ha)
Wheat Grain maize Feed-grade cereals
Soya Oilpalm Oilseed rape Other oilseeds Coffee/cocoa Tea/tobacco Legumes Beef Pigmeat Poultrymeat Sheepmeat Milk Total*
North America –145 –29 55 –529 0 –30 –17 176 –6 –38 –51 –57 –1 0 –41 –774
South America 15 –121 –20 –2.199 –40 –4 –88 –966 –59 –5 –584 –25 –147 –5 22 –4.413
of which 0
Brazil 0 –100 2 –1.588 –3 0 –9 –306 –38 1 –104 0 –126 0 0 –2.329
Argentina –2 –19 –19 –345 0 –4 –58 0 –8 –5 –306 0 –14 –1 0 –807
Paraguay 0 –1 0 –156 0 0 –8 0 0 0 –5 0 0 0 0 –173
Asia 137 –2 32 –5 –477 1 –288 –454 12 –31 17 193 –8 0 173 –907
Middle East/North Africa
369 6 127 48 0 0 –30 38 47 –3 52 2 5 0 121 721
Sub-Saharan Africa
262 5 10 15 –42 0 –18 –1.274 –53 1 –24 21 11 0 111 –1.095
Europe (excl. EU)
82 13 25 9 5 193 1 –45 –116 –11 219 –201 1 3 –379 –284
CIS –256 1 –50 78 5 –375 –67 327 18 –73 128 316 104 0 187 315
Oceania 0 1 –5 0 0 –221 0 32 1 0 –29 –2 0 –146 –20 –406
Rest of the World
0 0 0 0 0 0 –2 –32 0 0 0 0 0 0 0 –35
Total 464 –126 172 –2.583 –549 –436 –510 –2.198 –156 –160 –272 247 –36 –147 174 –6.878
EU–27 0 –83 –278 493 55 –419 –333 589 64 0 451 –7 –96 5 188 42
Total + EU 464 –208 –106 –2.090 –493 –855 –843 –1.609 –92 –160 179 239 –132 –142 362 –6.836
* All primary products, not just those shown here
* All primary products, not just those shown here

References
Abel, W. (1986): Massenarmut und Hungerkrisen im vorindustriellen Deutschland. Göttingen: Vandenhoeck & Ruprecht.
Allan, J.A. (1994): Overall perspectives on countries and regions. In: Rogers, P.; Lydon, P. (eds.): Water in the Arab world: Perspectives and prognoses, p. 65–100. Cambridge, MA: Harvard University Press.
Allan, J.A. (1993): Fortunately there are substitutes for water otherwise our hydro-political futures would be impossible. In: Priorities for water resources allocation and management (1993), p. 13–26. London: ODA.
Baines, R.; Jones, J. (2010): The potential of replacing imported soy with alternative home grown protein feeds for UK livestock. Part 1: Technical feasibility and possible policy interventions. Cirencester: Royal Agricultural College.
Baur, P. (2011): Sojaimporte Schweiz: Möglichkeiten und Grenzen der Reduktion/Vermeidung von Sojaimporten in die Schweiz. Frick: Agrofutura.
Berndsen, M.; van der Pligt, J. (2005): Risks of meat: the relative impact of cognitive, affective and moral concerns. In: Appetite 44, p. 195–205.
BfR (Bundesinstitut für Risikobewertung) (2009): Studie zu Fleischverzehr und Sterblichkeit. Stellungnahme Nr. 023/2009 des BfR vom 29. Mai 2009. Berlin: BfR.
Bickert, C. (2011): So viel Fläche importieren wir. In: DLG Mitteilungen 5/2011, p. 80-83.BMELV (Bundesministerium für Ernährung, Landwirtschaft und Forsten) (2011): Statistisches
Jahrbuch über Ernährung, Landwirtschaft und Forsten 2010. Bremerhaven: Wirtschafts-verlag.
Boenig, H. (2004): Tumorentstehung – hemmende und fördernde Ernährungsfaktoren. In: DGE (Hrsg.): Ernährungsbericht 2004. Bonn: DGE.
BVDF (Bundesverband der Deutschen Fleischwarenindustrie) (2010): Geschäftsbericht des Deutschen Fleischer-Verbands 2009/2010. Bonn: BVDF.
CBOT (Chicago Board of Trade) (2008): Soybean crush reference guide. Chicago: CBOT.CIV (Centre d’Information des Viandes) (2011): Meat conversion ratios. Paris: CIV.Cosgrove, M.; Flynn, A.; Kiely, M. (2005): Consumption of red meat, white meat and processed
meat in Irish adults in relation to dietary quality. In: British Journal of Nutrition 93, p. 933–942.
Demeyer, D.; Honikel, K.; de Smet, S. (2008): The world cancer research fund report 2007: A challenge for the meat processing industry. In: Meat Science 80, p. 953–959.
Destatis (2011): Fachveröffentlichungen: Land- und Forstwirtschaft: Viehbestand. Wiesbaden: Destatis.
de Vries, M.; de Boer, J.M. (2010): Comparing environmental impacts for livestock products: A review of life cycle assessments. In: Livestock Science 128, p. 1–11.
DG AGRI (Directorate General Agriculture and Rural Development) (2011): Global and EU agricultural exports rebound. In: MAP: Monitoring Agritrade Policy, May 2011, p. 1–12.
DGE (Deutsche Gesellschaft für Ernährung) (2008): Ernährungsbericht 2008. Bonn: DGE.Dickau, K. (2009): Die Nährstoffe: Bausteine für Ihre Gesundheit. Bonn: DGE.DVT (Deutscher Verband Tiernahrung) (2011): Futtermittel-Tabellarium: Ausgabe 2011. Bonn:
DVT.Eurostat (2011): Statistics database: External trade detailed data. Luxembourg: Eurostat.FAO (Food and Agriculture Organization) (2011): FAOSTAT statistical database. Rome: FAO.FAO (Food and Agriculture Organization) (2011): State of the world‘s forests. Rome: FAO. FAO (Food and Agriculture Organization) (2010): Global forest resources assessment 2010.
Rome: FAO.
70
FAO (Food and Agriculture Organization) (2010): National technical conversion factors for agricultural commodities. In: FAO: CountrySTAT: An integrated system for nutritional food and agriculture statistics. Rome: FAO.
FAO (Food and Agriculture Organization) (2001): Inter-temporal changes of conversion factors, extraction rates, and productivity of crops and livestock and related measures: 1963-1967 to 1993-1997. Rome: FAO.
Fefac (2010): Feed and food: Statistical yearbook 2009. Brussels: Fefac.Ferguson, L.R. (2010): Meat and cancer. In: Meat science 84, p. 308-313.Gibson, L.; Ling, T.M.; Koh, L.P.; Brook, B.W.; Gardner, T.A.; Barlow, J.; Peres, C.A.; Bradshaw,
C.J.A.; Laurance, W.F.; Lovejoy, T.E.; Sodhi, N.S. (2011): Primary forests are irreplaceable for sustaining tropical biodiversity. In: Nature 2011, 14. September 2011.
Hoekstra, A.Y. (2003): Virtual water: An introduction. In: Hoekstra, A.Y. (ed.): Virtual water trade: Proceedings of the international expert meeting on virtual water trade. Value of water research report series 11, p. 13-23. Delft: IHE.
Hoekstra A.Y.; Hung, P.Q. (2003): Virtual water trade: A quantification of virtual water flows between nations in relation to international crop trade. In: Hoekstra, A.Y. (ed.): Virtual water trade: Proceedings of the international expert meeting on virtual water trade. Value of water research report series 11, p. 25-47. Delft: IHE.
Kirschke, D.; Häger, A.; Noleppa, S. (2011): Rediscovering productivity in European agriculture: Theoretical background, trends, global perspectives and policy options. HFFA Working Paper 02/2011. Berlin: HFFA.
Lesschen, J.P.; van den Berg, M.; Westhoek, H.J.; Witzke, H.P.; Oenema, O. (2011): Green-house gas emission profiles of European livestock sectors. In: Animal feed science and technology 166, p. 16-28.
McAfee, A.J.; McSorley, E.M.; Cuskelly, G.J.; Moss, B.W.; Wallace, J.M.W.; Bonham, M.P.; Fearon, A.M. (2010): Red meat consumption: An overview of the risks and benefits. In: Meat Science 84, p. 1-13.
Micha, R.; Wallace, S.K.; Mozaffarian, D. (2010): Red and processed meat consumption and risk of incident coronary heart disease, stroke, and diabetes mellitus: A systematic review and meta-analysis. In: Circulation, 17. Mai 2010.
MRI (Max Rubner Institut) (2008): Nationale Verzehrstudie II (NVS II): Ergebnisbericht Teil 2. Karlsruhe: MRI.
Pan, A.; Sun, Q.; Bernstein, A.M.; Schulze, M.B.; Manson, J.E.; Willett, W.C.; Hu, F.B. (2011): Red meat consumption and risk of type 2 diabetes: Three cohorts of US adults and an updated meta-analysis. In: The American Journal for Clinical Nutrition, August 2011.
Rindermastberatung (2011): Bullenmast: Betriebszweigauswertung Rindermast 2008/2009. Blekendorf: Rindermastberatung e.V.
Roningen, V.; Sullivan, F.; Dixit, P. (1991): Documentation of the static world policy simulation (SWOPSIM) modeling framework. ERS Staff Report No. AGES 9151. Washington D.C.: USDA.
Schlatzer, M. (2010): Tierproduktion und Klimawandel: Ein wissenschaftlicher Diskurs zum Einfluss der Ernährung auf Umwelt und Klima. Berlin: Lit Verlag.
Schuler, C. (2008): Für Fleisch nicht die Bohne: Futter und Agrokraftstoff – Flächenkonkurrenz im Doppelpack. Eine Studie zum Sojaanbau für die Erzeugung von Fleisch und Milch und für den Agrokraftstoffeinsatz in Deutschland 2007. Berlin: BUND.
Searchinger, T.; Heimlich, R.; Houghton, A.; Dong, F.; Elobeid, A.; Fabiosa, J.; Tokgoz, S.; Hayes, D.; Yu, T.H. (2008): Use of U.S. croplands for biofuels increases greenhouse gases through emissions from land-use change. Princeton, NJ: Princeton University.
Meat Eats Land | 71

References
Sleeswijk, A.; Sevenster, M.N.; Croezen, H.J.; Davidson, M.D. (2010): A comparison of South American soy and European legumes. Delft: CE Delft.
Spiller, A.; Schulze, B. (2008): Trends im Verbraucherverhalten: Ein Forschungsüberblick zum Fleischkonsum. In: Spiller, A.; Schulze, B. (Hrsg.): Zukunftsperspektiven der Fleisch-wirtschaft – Verbraucher, Märkte, Geschäftsbeziehungen. Göttingen: Universitätsverlag Göttingen.
Steinfeld, H.; Mooney, H.A.; Schneider, F. (2010): Livestock in a changing landscape, Volume 1: Drivers, consequences, and responses. Washington, DC: Island Press.
Steinfeld, H.; Ferber, P.; Wassenaar, T.; Castel, V.; Rosales, M.; de Haan, C. (2006): Livestock’s long shadow: Environmental issues and options. Rome: FAO.
Stern, N. (2007): The economics of climate change: The Stern review. Cambridge: Cambridge University Press.
Teuteberg, H.J. (1979): Der Verzehr von Nahrungsmittel in Deutschland pro Kopf und Jahr seit Beginn der Industrialisierung (1850-1975): Versuch einer quantitativen Langzeitanalyse. In: Archiv für Sozialgeschichte 19, S. 331-388.
Tyner, W.E.; Taheripour, F.; Zhuang, Q.; Birur, D.; Baldos, U. (2010): Land use changes and consequent CO2 emissions due to US corn ethanol production: A comprehensive analysis. West Lafayette, IN: Purdue University.
USDA (United States Department of Agriculture) (2011): Items and conversion factors used in estimating agricultural imports. Washington DC: USDA.
USDA (United States Department of Agriculture) (1992): Weights, measures, and conversion factors for agricultural commodities and their products. Washington DC: USDA.
van Gelder, J.W.; Kammeraat, K.; Kroes, H. (2008): Soy consumption for feed and fuel in the European Union. KX Castricum: Profundo.
von Alvensleben, R. (1999): Die Fleischwirtschaft von morgen: Anforderungen von Gesellschaft und Verbrauchern. In: Lohmann Information Januar–März 1999, 1/99.
von Witzke, H. Noleppa, S. (2010): EU agricultural production and trade: Can more efficiency prevent increasing ‘land grabbing’ outside of Europe: Piacenza: OPERA.
Waldroup, P.W. (2011): Soybean use: Poultry. Farmington, MO: Soybean Meal Information Center.
WCRF (World Cancer Research Fund International) (2007): Zusammenfassung: Ernährung, körperliche Aktivität und Krebsprävention – Eine globale Perspektive. London: WCRF.
WEF (World Economic Forum) (2010): Realizing a new vision for agriculture: A roadmap for stakeholders. Cologny and Geneva: WEF.
WTO (World Trade Organization) (2009): International trade statistics 2009. Geneva: WTO.WTO (World Trade Organization) (2010): International trade statistics 2010. Geneva: WTO.Ximing, Y.; Fukao, K. (2010): Commodity classification systems for trade statistics: Tokyo:
Institute for Economic Research.
picture credits: Cover: iStock, 4 Agrarphoto, 8 Adriano Gambarini/WWF Brazil, 12 Agrarphoto, 14 Agrarphoto, 19 Steve Morgan/WWF-UK, 22 Agrarphoto, 27 Andrzej Matoga/WWF, 30 Agrar-photo, 31/38/41/43/45/46 Peter Caton/WWF, 52 iStock, 54–55 Anton Vorauer/WWF, 57 WWF, 61 photodisc [M], 62 Bernd Lammel/WWF, 64 WWF, 66 Agrarphoto
72

Meat Eats Land | 73
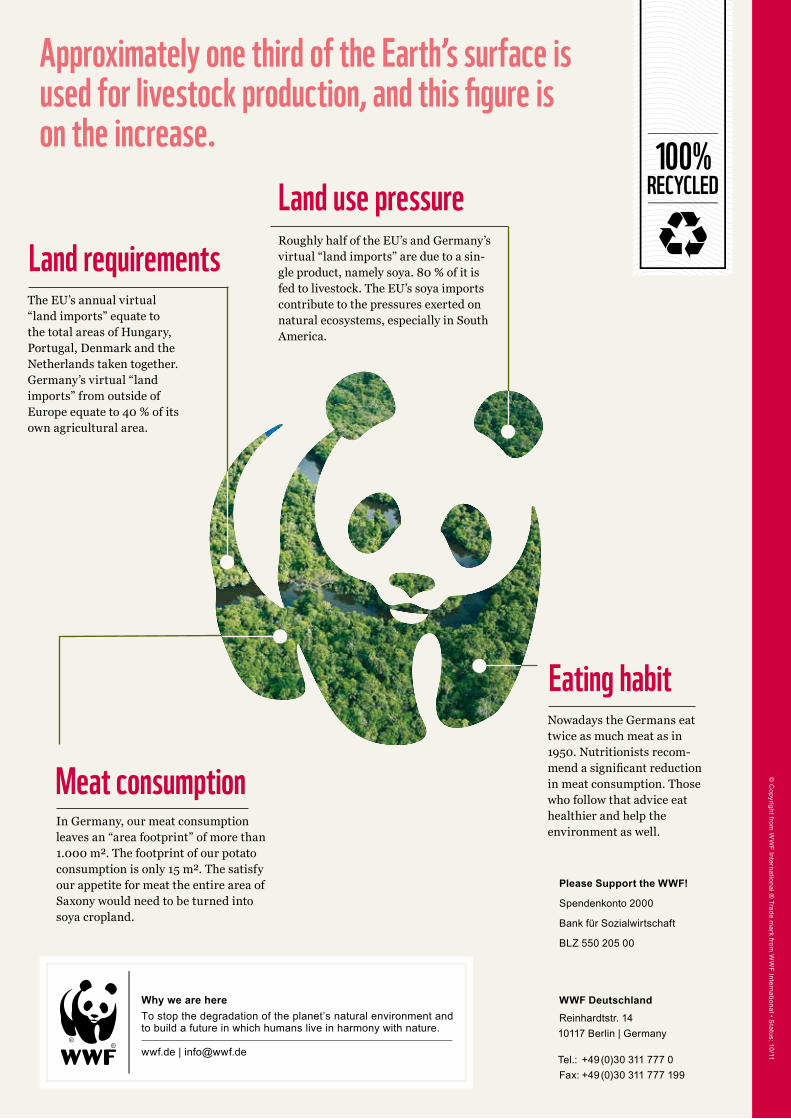
© C
opyright from W
WF International ®
Trade mark from
WW
F International • Status: 10/11
100%RECYCLED
WWF DeutschlandReinhardtstr. 14 10117 Berlin | Germany
Tel.: +49 (0)30 311 777 0Fax: +49 (0)30 311 777 199
Please Support the WWF!
Spendenkonto 2000
Bank für Sozialwirtschaft
BLZ 550 205 00
Why we are hereTo stop the degradation of the planet’s natural environment andto build a future in which humans live in harmony with nature.
wwf.de | [email protected]
Land use pressure
Approximately one third of the Earth’s surface is used for livestock production, and this figure is on the increase.
Land requirements
Eating habit
Meat consumption
Roughly half of the EU’s and Germany’s virtual “land imports” are due to a sin-gle product, namely soya. 80 % of it is fed to livestock. The EU’s soya imports contribute to the pressures exerted on natural ecosystems, especially in South America.
In Germany, our meat consumption leaves an “area footprint” of more than 1.000 m². The footprint of our potato consumption is only 15 m². The satisfy our appetite for meat the entire area of Saxony would need to be turned into soya cropland.
The EU’s annual virtual “land imports” equate to the total areas of Hungary, Portugal, Denmark and the Netherlands taken together. Germany’s virtual “land imports” from outside of Europe equate to 40 % of its own agricultural area.
Nowadays the Germans eat twice as much meat as in 1950. Nutritionists recom-mend a significant reduction in meat consumption. Those who follow that advice eat healthier and help the environment as well.