2011 oberlin transportation profile
DESCRIPTION
CNT offers 10 ways Oberlin, Ohio, can cut transportation carbon emissions to zero by 2050TRANSCRIPT

Oberlin Transportation Profile
Center for Neighborhood Technology
May 27, 2011
PDF compression, OCR, web optimization using a watermarked evaluation copy of CVISION PDFCompressor

OBERLIN TRANSPORTATION PROFILE CENTER FOR NEIGHBORHOOD TECHNOLOGY
2
About the Center for Neighborhood Technology The Center for Neighborhood Technology (CNT) is an award-‐winning innovations laboratory for urban sustainability. Since 1978, CNT has been working to show urban communities in Chicago and across the country how to develop more sustainably. CNT promotes the better and more efficient use of the undervalued resources and inherent advantages of the built and natural systems that comprise the urban environment. As a creative think-‐and-‐do tank, we research, promote, and implement innovative solutions to improve the economy and the environment; make good use of existing resources and community assets; restore the health of natural systems and increase the wealth and well-‐being of peopleresearch and analysis, public policy advocacy, the creation of web-‐based information tools for transparency and accountability, and the advancement of economic development social ventures to address those problems in innovative ways. CNT works in four areas: transportation and community development, natural resources, energy and climate. CNT has two affiliates, I-‐GOTM Car Sharing and CNT Energy. CNT is a recipient of the 2009 MacArthur Award for Creative and Effective Institutions. More information about CNT is available at www.cnt.org
PDF compression, OCR, web optimization using a watermarked evaluation copy of CVISION PDFCompressor

OBERLIN TRANSPORTATION PROFILE CENTER FOR NEIGHBORHOOD TECHNOLOGY
3
Table of Contents About the Center for Neighborhood Technology ......................................................................................... 2
1 Transportation in and around Oberlin .................................................................................................. 5
1.1 Introduction and Context .............................................................................................................. 5
1.2 Transportation Demographics ...................................................................................................... 7
1.3 Cost of Living ............................................................................................................................... 16
1.4 Greenhouse Gas Emissions and Energy Use ............................................................................... 20
1.5 Transportation Options in Oberlin .............................................................................................. 28
2 Land Use .............................................................................................................................................. 36
2.1 Overview ..................................................................................................................................... 36
2.2 Oberlin College ............................................................................................................................ 36
2.3 Downtown Oberlin ...................................................................................................................... 37
2.4 Other commercial districts ......................................................................................................... 38
2.5 Residential neighborhoods ......................................................................................................... 39
2.6 Industrial Areas ........................................................................................................................... 40
2.7 Parking ........................................................................................................................................ 40
3 Travel Destinations ............................................................................................................................. 42
3.1 Overview ..................................................................................................................................... 42
3.2 Residents of Oberlin .................................................................................................................... 42
3.3 College students .......................................................................................................................... 50
3.4 Visitors to Oberlin ....................................................................................................................... 50
4 Trends and Plans Shaping O ........................................................................................ 53
4.1 Introduction ................................................................................................................................ 53
4.2 Transportation Trends Affecting Emissions ................................................................................ 53
4.3 The People of Oberlin ................................................................................................................. 54
4.4 Local and Regional Plans ............................................................................................................. 55
4.5 Finances ...................................................................................................................................... 59
5 Conclusion ........................................................................................................................................... 61
5.1 Next Steps: Solutions .................................................................................................................. 61
PDF compression, OCR, web optimization using a watermarked evaluation copy of CVISION PDFCompressor

OBERLIN TRANSPORTATION PROFILE CENTER FOR NEIGHBORHOOD TECHNOLOGY
4
Table of Maps Map 1. Oberlin 2010 Population ................................................................................................................... 9 Map 2. Oberlin 2000 Population ................................................................................................................. 10 Map 3. Housing and Transportation Costs in Oberlin ................................................................................. 17 Map 4. Housing and Transportation Costs in Lorain County ...................................................................... 18 Map 5. Transportation Costs in Oberlin ...................................................................................................... 19 Map 6. Transportation Costs in Lorain County ........................................................................................... 20 Map 7. One Half Mile Radius around Downtown Oberlin .......................................................................... 39 Map 8. Local Employment Destinations for Residents of the City of Oberlin ............................................ 43 Map 9. Local Employment Destinations for Oberlin Residents in Lorain County ....................................... 44 Map 10. Local Employment Destinations for Lower Income Oberlin Residents in Oberlin ....................... 45 Map 11. Local Employment Destinations for Lower Income Oberlin Residents in Lorain County ............. 46 Map 12. Blocks within a Half Mile Walking Distance of Major Grocery Stores in Oberlin ......................... 48 Map 13. Oberlin Workers Who Lived in Lorain County in 2008 ................................................................. 51
Table of Figures Figure 1. Oberlin Population 1970 to 2010 ................................................................................................... 8 Figure 2. Means of Transportation to Work ............................................................................................... 14 Figure 3. Share of Commuters Bicycling in Oberlin and Bicycling Magazine's Top 5 Bike Cities under 100,000 Population ..................................................................................................................................... 15 Figure 4. Share of Commuters Bicycling in US, Oberlin, and Bicycling Magazine's Top 10 Bike Cities ....... 15 Figure 5. Hertz Connect Utilization in Oberlin ............................................................................................ 33
PDF compression, OCR, web optimization using a watermarked evaluation copy of CVISION PDFCompressor

OBERLIN TRANSPORTATION PROFILE CENTER FOR NEIGHBORHOOD TECHNOLOGY
5
1 Transportation in and around Oberlin
1.1 Introduction and Context
forests to part of a major metropolitan region and a place world-‐renown for its sustainability ideas and actions.1 visitors have changed as well. Like the rest of the country, fossil fuel-‐powered vehicles have
However, Oberlin has made a commitment to address its contribution to global climate change by seeking to achieve net neutral emissions of greenhouse gases. Fulfilling this commitment requires assessing all aspects
-‐carbon solutions. To be sustainable, these
and businesses, and lay the framework for the next century of a thriving Oberlin College and
therefore be an important part of the solution to reducing emissions in Oberlin.
All day every day, goods and people are moving into, out of, and around Oberlin. Students and professors are going to classes. Business owners are arriving at shops, receiving goods, and selling them to neighbors and visitors. Residents are going to work in communities throughout the region. Trips to Cleveland are being made for concerts, doctor appointments, and
Creating a sustainable transportation plan for Oberlin requires asking: What will these trips look like in the future? How will low-‐carbon transportation options enable mobility in the region? Are there ways to make trips shorter and faster or even unnecessary?
The first step in developing a set of sustainable transportation solutions for Oberlin is understanding the current transportation system. This report provides a transportation profile for Oberlin today. It inventories current transportation assets, trends, opportunities, and challenges.
The next step will be to identify and analyze a portfolio of potential energy efficient, low carbon transportation solutions for the area. Such a portfolio will be developed in coming months and will culminate in an Energy Efficient Transportation Plan for Oberlin and Northern Ohio that will create a road map of greenhouse gas emissions and energy savings from transportation at Oberlin College and in the City of Oberlin, as well as identify opportunities for northern Ohio.
1
PDF compression, OCR, web optimization using a watermarked evaluation copy of CVISION PDFCompressor

OBERLIN TRANSPORTATION PROFILE CENTER FOR NEIGHBORHOOD TECHNOLOGY
6
The transportation profile of Oberlin provided here is arranged into five sections and is meant as a reference document.
Section 1 provides a description of transportation in and around Oberlin, including demographics, costs, emissions, and transportation options.
Section 2 documents land use in Oberlin and provides context for how land use
Section 3 focuses in on travel destinations that create transportation demand. Section 4
future. Section 5 provides a brief summary of the next steps in the process of developing a
sustainable transportation plan for Oberlin.
1.1.1 History Historically, Oberlin was served by several different forms of intercity transportation, including a commuter rail, streetcars, and greyhound buses. As the Oberlin Heritage Center describes in its Biking Tour of Historic Oberlin pamphlet,
from 1866 to 1949. The train service gradually decreased over the years, and by the 1930s, there was only one train a day a commuter train on its way from Toledo to Cleveland stopped in Oberlin around 7:00 each morning and returned
clock for many people in town. There was also a trolley line that operated in Oberlin from 1897 to 1931. Known as the Interurban, the trolley took people to
2
The College was a noted user of the rail service; Pictorial Memories of Oberlin notes that College travel for events, such as sports and music, at times had dedicated trains and rail cars. In addition, rail carried freight and fresh milk from the surrounding areas. Students and residents could ride to the train stations in the area by hiring a horse-‐drawn carriage.3
As transportation in and around Oberlin has evolved over the years, some things have
means that Oberlin remains a very walkable place. A recent essay by new urbanist Hazel
2 Oberlin Heritage Center, Biking Tour of Historic Oberlin, 2008, http://www.oberlinheritage.org/cms/files/File/webtour%205-‐2008b.pdf. 3 Rotary Club of Oberlin, Pictorial Memories of Oberlin, 2nd ed., Oberlin, 1989.
PDF compression, OCR, web optimization using a watermarked evaluation copy of CVISION PDFCompressor
OBERLIN TRANSPORTATION PROFILE CENTER FOR NEIGHBORHOOD TECHNOLOGY
7
Borys provides a modern picture of the day-‐to-‐day transportation use of an Oberlin resident,
-‐a-‐week sort of requirements. Walking and bikes were the primary modes of transportation for daily needs, and the gathering places were plentiful and engaging. It was a 5-‐minute walk from most residences to either civic amenities or the retail of Main and College Streets. The variety of housing types was wide enough to allow a bevy of college students to assist with our childcare from a close proximity. On the commercial corridors, vertical mixed use allows for an integration of services, and recent new developments encourage aging in place and some town-‐gown reconnection. 4
Today, while Oberlin supports many transportation alternatives, regional public transit has foundered. Lorain County Transit, which supplied bus service to Oberlin, cut almost all service in 2010. The Oberlin Connecter bus service now runs just two days a week from 9am to 3pm on a demand response basis, an obstacle that Oberlin must overcome if it is to meet its sustainable transportation goals.
1.2 Transportation Demographics some
numbers. Data on population, households, vehicle count, miles traveled, means of transportation to work, and freight transport are detailed in this section to help document transportation use in Oberlin today.
4 2011, http://placeshakers.wordpress.com/2011/03/25/oberlin-‐ohio-‐and-‐the-‐promise-‐of-‐place-‐a-‐love-‐letter.
PDF compression, OCR, web optimization using a watermarked evaluation copy of CVISION PDFCompressor

OBERLIN TRANSPORTATION PROFILE CENTER FOR NEIGHBORHOOD TECHNOLOGY
8
1.2.1 Population and Households: 8,286 Residents There were 8,286 residents in Oberlin in 2010 according to the U.S. Census bureau. This is a 1% change from the 2000 census population. Oberlin has seen a slower rate of growth than the national average; population in the U.S. grew 9.7% between 2000 and 2010. As Figure 1 shows,
5
Figure 1. Oberlin Population 1970 to 2010
5 of
http://www.census.gov/prod/cen1990/cph2/cph-‐2-‐1-‐1.pdf.
PDF compression, OCR, web optimization using a watermarked evaluation copy of CVISION PDFCompressor

OBERLIN TRANSPORTATION PROFILE CENTER FOR NEIGHBORHOOD TECHNOLOGY
9
Map 1. Oberlin 2010 Population
Map 1 and Map 2 provide visualizations of how population is dispersed in and around Oberlin. Each dot in the maps represents 15 persons and is placed randomly in the census block where it belongs to create a general picture of population density. Looking at population in this way clearly shows the clusters of students in campus housing, where population density is high relative to other parts of town.
PDF compression, OCR, web optimization using a watermarked evaluation copy of CVISION PDFCompressor

OBERLIN TRANSPORTATION PROFILE CENTER FOR NEIGHBORHOOD TECHNOLOGY
10
Map 2. Oberlin 2000 Population
There were 2,730 households in Oberlin in 2010,6 which is a 2% change from the 2,678 households in 2000.7 As with population, the number of households has remained fairly steady over recent decades. The slight increase in households since 1970 may be in keeping with national trends of decreasing household size resulting in higher household numbers.
households alone, however, because students living in dormitories are not considered households. population. 2010 census data on this are not yet available, but in 2000, the census showed 2,018 people in group quarters
6 U.S. Census Bureau, Census 2010. 7 U.S. Census Bureau, Census 2000.
PDF compression, OCR, web optimization using a watermarked evaluation copy of CVISION PDFCompressor

OBERLIN TRANSPORTATION PROFILE CENTER FOR NEIGHBORHOOD TECHNOLOGY
11
most of which were likely students.8 people not living in households as living in group quarters. There are two types of group quarters: institutional (for example, correctional facilities, nursing homes, and mental hospitals) and non-‐institutional (for example, college dormitories, military barracks, group homes,
9
1.2.2 Vehicles: 3,200 Residential Vehicles The American Community Survey (ACS) estimates household vehicle ownership in Oberlin at 3,200 from 2005 to 2009 with a margin of error of plus or minus 602 vehicles.10 The U.S. Census American Community Survey is a new type of study from the census that uses sampling data to estimate demographic characteristics more frequently. The use of sampling data results in a higher margin of error than the traditional decennial census, so the decrease in vehicles between the 2000 census data and the more recent ACS data cannot be identified as a definitive trend. The 2000 census found that there were 3,985 vehicles in Oberlin households, which excludes vehicles owned by the student population living in dormitories.11
rch has shown that households that live in location efficient neighborhoods those areas with transportation alternatives and nearby amenities own 1 less vehicle per household on average. As a result, households in location efficient areas spend less of their income on transportation. A typical Oberlin household has just 1 car (51% of households) with 2 cars (32%) and no cars (13%) being the next most common households.12 According to the 2000 Census, there were 1.5 vehicles per household that year, which is slightly lower than the U.S. average of 1.7 vehicles per household.13
In addition to household vehicle ownership, the City of Oberlin and Oberlin College have fleets Commercial vehicles are
another important piece of the transportation picture, though one that is harder to quantify. In total, there are approximately 5,000 vehicles registered in Oberlin,14 a figure that may undercount student vehicles that are registered to other states and localities.
8 U.S. Census Bureau, Census 2000. 9 U.S. Census Bureau, American Factfinder Glossary, accessed May 5, 2011, http://factfinder.census.gov/home/en/epss/glossary_a.html. 10 U.S. Census Bureau, 2005-‐2009 American Community Survey 5-‐Year Estimates. 11 U.S. Census Bureau, Census 2000. 12 U.S. Census Bureau, 2005-‐2009 ACS. 13 U.S. Census Bureau, Census 2000. 14
PDF compression, OCR, web optimization using a watermarked evaluation copy of CVISION PDFCompressor

OBERLIN TRANSPORTATION PROFILE CENTER FOR NEIGHBORHOOD TECHNOLOGY
12
1.2.3 Vehicle Miles Traveled: 40.6 million miles In addition to the number of vehicles, it is important to understand their use if one is trying to get a picture of motor vehicle travel in Oberlin. Annual vehicle miles traveled (VMT) per vehicle is a primary measure of vehicle use. There is more than one way to consider VMT for a community. Three of these methods are particularly relevant to this profile:
1) The method used for many greenhouse gas inventories and climate action plans is to count all vehi . This essentially puts a bubble over the community and counts all vehicle movement within that bubble.
2) Alternatively, one can estimate the residents wherever those vehicles go within a region and assign those VMT to the place where the vehicle is owned. This can be useful in considering measures to change household travel behavior and household transportation costs.
3) Finally, origin/destination models can be used to understand the travel to and from a community by residents and non-‐residents alike. Such models are helpful for a more nuanced understanding of transportation in a region.
Using the first method of on-‐road vehicle travel within the community, VMT in Oberlin was an estimated 40.6 million miles in 2006 according to data provided by the Northeast Ohio Areawide Coordinating Agency (NOACA) and reported in A Baseline Greenhouse Gas Inventory for Oberlin: Stepping Up to the Challenge of Climate Neutrality.15 This averages to approximately
residents.16
2006 vehicle travel in Oberlin was a 2.5% increase from the 2000 level of 39.6 million miles traveled.17 Over that same period, VMT grew 10% nationally from 2.7 billion miles in 200018 to 3 billion miles in 2006.19 population than the national average, though this correlation may not be a causal relationship.
15 Meyer, 16 U.S. Census Bureau, Census 2010. 17 Meyer, 18 U.S. Department of Transportation, Federal Highway Administration, eled in Miles and Related Data-‐ 19 U.S. Department of Transportation, Federal Highway Administration, and Related Data-‐
PDF compression, OCR, web optimization using a watermarked evaluation copy of CVISION PDFCompressor
OBERLIN TRANSPORTATION PROFILE CENTER FOR NEIGHBORHOOD TECHNOLOGY
13
The error involved in downscaling a regional travel model to a small place like Oberlin means that the vehicle travel figures for the city have a great deal of uncertainty. Moreover, the GHG inventory states,
seems likely that NOACA city limits, but [NOACA staff did not] provide any opinion regarding the
Furthermore, several other factors specific to Oberlin are somewhat problematic. ant non-‐workplace
-‐day week and has an irregular boundary, both 20
the second method described above assigning vehicle travel to the household that owns the vehicle. Using this method, a median income household in the Cleveland-‐-‐Lorain Elyria region would have driven an average of 17,242 miles in 2000, while that same household in Lorain County would have driven an average of 19,906 vehicle miles.
Origin/destination modeling, the third type described above, is used within the NOACA transportation model that was the basis for estimates of on-‐road VMT in Oberlin for the GHG inventory. Additionally, origin destination modeling is used later in this report to look at the locations of jobs for employees coming to and from Oberlin for work.
1.2.4 Mode Share: 32% Walking to Work Oberlin residents, businesses, and visitors use more than just automobiles to meet their transportation needs. A complete picture of transportation for the area has many different transportation modes, including bicycles, walking, taxis, and carpooling. The U.S. Census Bureau collects data on the means of transportation to work. made up of much more than just the commute patterns of its residents, so the census data provides an incomplete picture of transportation in Oberlin. Yet, it is useful to consider commute patterns by mode, as it provides indications for the mode share among all travel in the town. Moreover, these are trips that can often be shifted to other modes with the provision of transportation alternatives, incentives, and education.
The U.S. Census Bureau American Community Survey finds that a majority of workers in Oberlin, 53%, drive to work, which is considerably lower than the national average of 86%.
20 Meyer,
PDF compression, OCR, web optimization using a watermarked evaluation copy of CVISION PDFCompressor
OBERLIN TRANSPORTATION PROFILE CENTER FOR NEIGHBORHOOD TECHNOLOGY
14
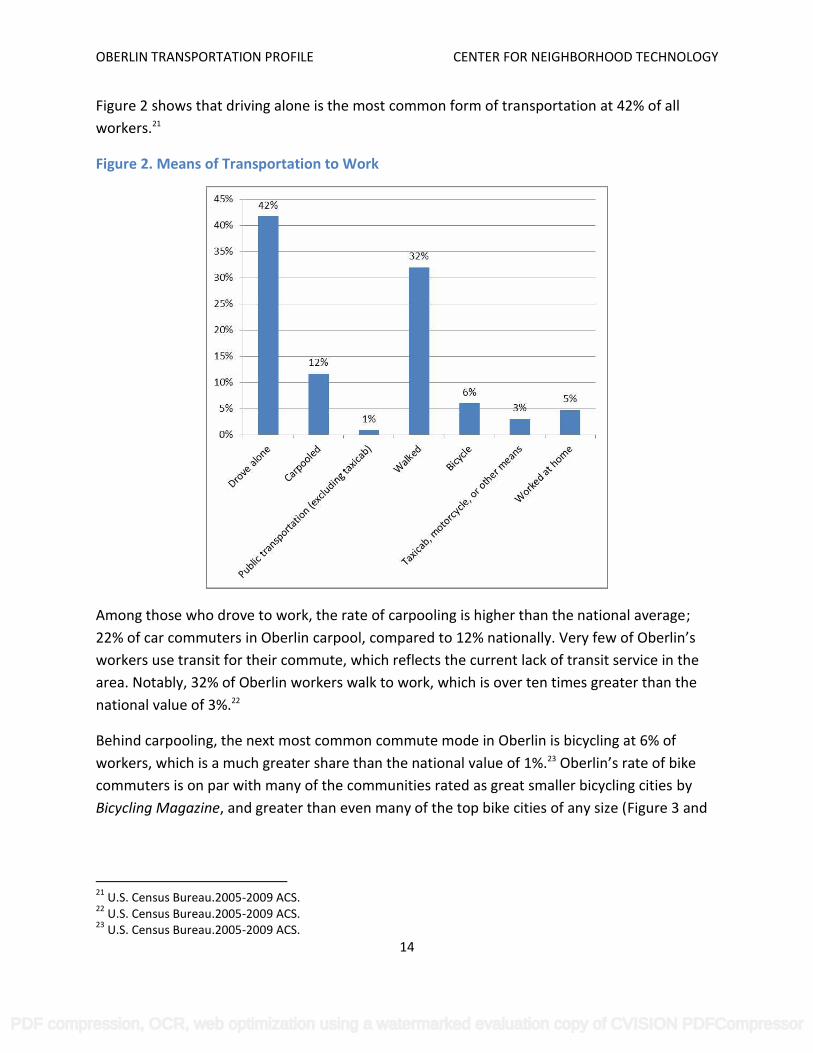
Figure 2 shows that driving alone is the most common form of transportation at 42% of all workers.21
Figure 2. Means of Transportation to Work
Among those who drove to work, the rate of carpooling is higher than the national average; 22% of car commuters in Oberlin carpool, compared to 12% nationally. workers use transit for their commute, which reflects the current lack of transit service in the area. Notably, 32% of Oberlin workers walk to work, which is over ten times greater than the national value of 3%.22
Behind carpooling, the next most common commute mode in Oberlin is bicycling at 6% of workers, which is a much greater share than the national value of 1%.23 commuters is on par with many of the communities rated as great smaller bicycling cities by Bicycling Magazine, and greater than even many of the top bike cities of any size (Figure 3 and
21 U.S. Census Bureau.2005-‐2009 ACS. 22 U.S. Census Bureau.2005-‐2009 ACS. 23 U.S. Census Bureau.2005-‐2009 ACS.
PDF compression, OCR, web optimization using a watermarked evaluation copy of CVISION PDFCompressor

OBERLIN TRANSPORTATION PROFILE CENTER FOR NEIGHBORHOOD TECHNOLOGY
15
Figure 4).24 Some of those bicycling cities, such as Davis, California and Boulder, Colorado, have significantly higher shares of bicycling commuters than Oberlin, which shows that there may be
Figure 3. Share of Commuters Bicycling in Oberlin and Bicycling Magazine's Top 5 Bike Cities under 100,000 Population
Figure 4. Share of Commuters Bicycling in US, Oberlin, and Bicycling Magazine's Top 10 Bike Cities
24 -‐http://www.bicycling.com/news/featured-‐stories/5-‐small-‐bike-‐friendly-‐cities.
PDF compression, OCR, web optimization using a watermarked evaluation copy of CVISION PDFCompressor

OBERLIN TRANSPORTATION PROFILE CENTER FOR NEIGHBORHOOD TECHNOLOGY
16
The average Oberlin commuter has a very short commute; 53% of Oberlin commuters travel under 10 minutes to work, as compared to 27% nationwide. A significant share of those with short commutes are walking and biking, but 41% of those in Oberlin with commutes of 10 minutes or less are driving or carpooling, so there is great potential for shifting to lower-‐carbon transportation modes among this population. 25
1.2.5 Freight and Deliveries As is typical for the national transportation system, goods that are delivered to Oberlin businesses arrive primarily by truck from other destinations in the global supply chain. An estimate of twenty to thirty 54-‐foot trucks deliver goods to retail stores and restaurants in downtown Oberlin each week.26 While no data was collected for Wal-‐Mart for this project, the company maintains a vast and decentralized distribution system that relies heavily on tractor trailers.27 UPS sends several delivery trucks to both the College and the downtown on a daily basis.28 OH-‐58 and OH-‐511 carry most of the truck traffic through town.29
Oberlin does not manufacture many consumer items, so downtown stores and restaurants are largely reliant on regional and national suppliers that distribute by truck.30
1.3 Cost of Living
provides a unique perspective on transportation and the role it plays in the cost of living in Oberlin. While affordability has historically been considered in terms of housing costs, this index considers the transportation costs associated with living in any particular place.
25 U.S. Census Bureau.2005-‐2009 ACS. 26 Jason Adelman and Krista Long, interviewed by Kyle Smith, Oberlin OH, May 16 2011. 27 -‐ s ICFAI Center for Management Research, 2003. 28 Jason Adelman and Krista Long. 29 Oberlin Resident Focus Groups, Conducted by Kyle Smith, Oberlin, OH, May 16, 2011 and May 17, 2011. 30 Jason Adelman and Krista Long.
PDF compression, OCR, web optimization using a watermarked evaluation copy of CVISION PDFCompressor

OBERLIN TRANSPORTATION PROFILE CENTER FOR NEIGHBORHOOD TECHNOLOGY
17
Map 3. Housing and Transportation Costs in Oberlin
Map 3 shows that for a household earning the area median income (AMI) of $42,089, downtown Oberlin is most affordable when considering the combined costs of housing and transportation. Next most affordable is the west side of town. These findings are in keeping with the walkability and bikeability of these areas, which is discussed in other parts of this document. Beyond those two parts of town, the remainder of Oberlin has estimated housing and transportation costs that are 50 to 60% of AMI, which is above the 45shows is a good benchmark for affordability.
PDF compression, OCR, web optimization using a watermarked evaluation copy of CVISION PDFCompressor

OBERLIN TRANSPORTATION PROFILE CENTER FOR NEIGHBORHOOD TECHNOLOGY
18
Map 4. Housing and Transportation Costs in Lorain County
Looking beyond city boundaries, Map 4 shows the relative affordability of housing and transportation in downtown Oberlin as compared to surrounding areas in Lorain County. Elyria and Grafton have neighborhoods with affordability similar to that of Oberlin, but the average household in the surrounding areas can spend 60% or more of their income on housing and transportation combined.
PDF compression, OCR, web optimization using a watermarked evaluation copy of CVISION PDFCompressor

OBERLIN TRANSPORTATION PROFILE CENTER FOR NEIGHBORHOOD TECHNOLOGY
19
Map 5. Transportation Costs in Oberlin
Drilling down to examine transportation expenses alone, as Map 5 does, provides an even clearer picture of transportation in Oberlin. The core areas of town show the lowest transportation costs, while outlying areas, including more recently annexed land with shopping destinations, are areas of higher transportation cost. An average household living in the outer parts of Oberlin might spend $60 to $70 more per month on transportation than they would if they lived downtown, where they would need to use a vehicle less. These additional expenses,
overall economy.
PDF compression, OCR, web optimization using a watermarked evaluation copy of CVISION PDFCompressor

OBERLIN TRANSPORTATION PROFILE CENTER FOR NEIGHBORHOOD TECHNOLOGY
20
Map 6. Transportation Costs in Lorain County
In the broader Lorain County area, Map 6 shows that transportation costs increase the further out an average household is from the town centers in the county. This implies that despite the recent public transit challenges in the area, the historic towns still have land use patterns that reduce transportation needs as compared to the more newly developed parts of the region. Focusing new housing into these more affordable areas could curb transportation demand and transportation costs going forward.
1.4 Greenhouse Gas Emissions and Energy Use Oberlin has completed greenhouse gas (GHG) inventories for the city, government operations, and the College. This transportation profile focuses in on the transportation-‐related emissions in those inventories, as it is crucial to understand the scale of GHGs and energy use associated with travel in and around Oberlin if one is to develop low-‐carbon solutions for the area.
The methods for calculating the GHG impacts of transportation vary slightly from source to source, but the big picture is the same the largest source of GHG emissions in the
PDF compression, OCR, web optimization using a watermarked evaluation copy of CVISION PDFCompressor

OBERLIN TRANSPORTATION PROFILE CENTER FOR NEIGHBORHOOD TECHNOLOGY
21
transportation sector is the use of fossil fuels. The less fossil fuel used whether through less driving, more efficient cars, or the use of lower-‐carbon alternative fuels the lower GHG emissions will be.
Beyond the emissions from vehicle fuel, transportation has climate change impacts through the GHGs used in vehicle air conditioners, the lifecycle GHG impacts of vehicles, and the carbon footprint of transportation infrastructure. Vehicles, roads, streets, and sidewalks all contain imbedded carbon and have a significant lifecycle carbon footprint that includes their manufacturing, transport, repair, and disposal. Similarly, fuels have additional GHG impacts when one considers the extraction, refining, and transportation required to get the fuel to the gas pump. An analysis of these lifecycle impacts have not been done for Oberlin, but it is worth keeping in mind that the emissions values presetransportation GHG impact.
1.4.1 Community Transportation Emissions: 23,887 mtCO2e
is primarily fueled by petroleum that emits GHGs when combusted. Transportation accounted for 15% of the community-‐wide GHG emissions in Oberlin in 2007, emitting 23,887 metric tons of carbon dioxide equivalent (mtCO2e). This was a slight 2% decrease in emissions from the 2001 inventory, which showed 24,441 mtCO2e in emissions from the transportation sector. Emissions decreased in that period, even though VMT increased, because average on-‐road vehicle fuel economy was estimated to have improved over that time period.31
As a share of its total GHG footprint of 158,213 mtCO2
low relative to many other communities. This is caused, in part, by the carbon intensity of
emissions profile than the same amount of electricity use would in other places. In 2007, Oberlin Municipal Light and Power System (OMLPS) had an average GHG intensity of 0.87 kilograms CO2e per kilowatt hour (kg CO2e/kWh).32 This is 48% higher than the national average that year (0.59 kg CO2e/kWh); and 23% higher than the average for the regional electrical grid (0.71 kg CO2e/kWh).33
in the electricity generation mix. Coal, one of the most carbon-‐intensive fuels, was the
31 Meyer, 32 Meyer, 33 May 9, 2011, http://www.epa.gov/cleanenergy/documents/egridzips/eGRID2010V1_1_year07_GHGOutputrates.pdf
PDF compression, OCR, web optimization using a watermarked evaluation copy of CVISION PDFCompressor

OBERLIN TRANSPORTATION PROFILE CENTER FOR NEIGHBORHOOD TECHNOLOGY
22
generation source for 76% of the electricity used in Oberlin in 2007. Comparatively, coal
nationinstead of 15%.34
55% of the community-‐wide GHG inventory in Oberlin in 2007, while making up only 26% of the end-‐use energy consumed in the community in terms of British thermal units (BTUs). Comparatively, transportation was 15% of the emissions profile but 23% of the energy use.35 This shows that if the electricity generation mix were to stay the same, electrification would not be a sound carbon reduction strategy for transportation, as switching a given vehicle from gasoline and diesel fuel to coal-‐based electricity could increase its emissions. However, as Oberlin works to decarbonize its electricity generation, electricity will become much more competitive on a carbon-‐per-‐useful-‐energy basis, to the point where electricity may become the cleaner choice as a transportation fuel. The wind, landfill gas, and hydropower electricity t -‐carbon electricity for transportation.
1.4.1.1 Fugitive Emissions: 738 mtCO2e The refrigerant used in most vehicle air conditioners, known as HFC-‐134a, is a potent GHG with a global warming impact 1,300 times greater than CO2 -‐wide GHG inventory estimates that the leakage of this gas from vehicles emitted 738 mtCO2e that year, based on an estimate of average emissions rates and vehicle registrations in the city. This
less than 1% but is a source that should be considered when designing sustainable transportation strategies for the area.36
1.4.2 Community Petroleum Use: 2.4 Million Gallons Oof gasoline and 53,038 million BTUs of diesel fuel in 2007, which is approximately 2 million gallons of gasoline and 400,000 gallons of diesel. At 2011 retail fuel prices, this represents about $8.5 million of expenditures, most of which are leaving the community, making the value of reducing transportation fuel use in Oberlin clearly evident; that level of expenditure equates to approximately $1,000 per capita.
34
35 Meyer, 36 Meyer,
PDF compression, OCR, web optimization using a watermarked evaluation copy of CVISION PDFCompressor

OBERLIN TRANSPORTATION PROFILE CENTER FOR NEIGHBORHOOD TECHNOLOGY
23
1.4.3 Biofuel Biofuels, such as biodiesel and straight vegetable oil (SVO) can offer low-‐carbon alternatives to petroleum powered travel, though much debate has occurred in recent years over the total climate change impact of biofuels, as fuels derived from non-‐sustainably grown sources, or fuels that require large amounts of energy for processing, can have very large lifecycle GHG footprints. 2 emissions from burning biofuels are often excluded from GHG calculations anyway as sustainably grown biofuels will allow the carbon that is emitted during combustion to be reabsorbed when the plants are regrown.
Some vehicles in Oberlin have been converted to alternative fuels. Oberlin College grounds vehicles use 20% biodiesel37 and a few tractors can use SVO. A small number of residents of Oberlin and farmers in surrounding townships have also converted their vehicles and tractors to utilize SVO. However, the City of Oberlin has been hesitant to use even small amounts of biodiesel in its fleet. 38
Since 2004, Full Circle Fuels has converted over 300 cars, trucks, big rigs, and tractors to run on SVO.39 Many of these conversions were for vehicles owned by residents outside Lorain County and Full Circle Fuels draws customers from as far away as Kentucky and Maryland. In addition to performing conversions themselves, Full Circle Fuels also educates vehicle owners about the process to encourage adoption of the practice beyond Oberlin. 40
Fuel Circle Fuels also operates two gas pumps for biodiesel and for SVO. Customers at the biodiesel pump can choose between 100% biodiesel, 100% conventional diesel, or nine combinations of the two.41 About half of the roughly one dozen restaurants in town that produce vegetable oil export it to Full Circle for use as SVO.42 The City purchased the tanks for Full Circle Fuels through the sale of renewable energy credits.43
However, Full Circle Fuels only operates between 9 AM and 5 PM, and biofuel sales are a secondary focus of its business. Most residential customers who purchase biofuel at Full Circle use it for longer trips to Cleveland and Pittsburgh rather than for trips around town. A biofuel
37 Colin Koffel, Rob Lamppa, and Madeline Marvar, interviewed by Kyle Smith, Oberlin OH., May 16 2011 38 Sam Merritt, Interviewed by Kyle Smith, May 26 2011 39 accessed May 26 2011, http://www.fullcirclefuels.com/. 40 Sam Merritt. 41 42 Sam Merritt. 43 Bryan Burgess and Ken Sloane, interviewed by Kyle Smith, Oberlin OH, May 16 2011.
PDF compression, OCR, web optimization using a watermarked evaluation copy of CVISION PDFCompressor

OBERLIN TRANSPORTATION PROFILE CENTER FOR NEIGHBORHOOD TECHNOLOGY
24
station that operates longer hours and accepts credit cards would make biofuel a more convenient option on a day-‐to-‐day basis.44
1.4.4 Electric Vehicles Hybrid electric vehicles are becoming common on the road in the U.S. and while data are not available on the number of hybrid-‐electric vehicles in Oberlin, the College has hybrids in its fleet.45 However, the College has begun phasing them out of service after facilities staff complained of lower utilization.46
The City of Oberlin has begun switching its fleet to more fuel efficient vehicles and purchased two hybrids in 2010. The Oberlin Police Department resisted purchasing hybrid vehicles out of concern that the engines are too weak for public safety needs. City Council is exploring purchasing hybrid pick-‐up trucks for other maintenance vehicles. 47
While plug-‐in electric vehicles are not commonly used in Oberlin today, the city is investigating installing electric vehicle charging stations downtown. The City has installed capacity for one or two charging stations in the lot behind College Street and Main Street in the western section of downtown.48 Also, Oberlin College mail service has a plug-‐in electric cargo van.49
1.4.5 Municipal Operations Transportation Emissions: 801 mtCO2e In addition to a community-‐wide GHG inventory, Oberlin has prepared an inventory of emissions associated with its municipal operations. Municipal operations emitted 10,355 mtCO2e in 2007 or 6.5% of the community emissions (though some municipal emissions occurred outside community boundaries).50 Within municipal operations, transportation emissions were calculated based on gasoline and diesel usage for city-‐owned vehicles. A survey of employee commute patterns was also administered to estimate emissions associated with employee commute travel.
The total government transportation emissions were 801 mtCO2e or 8% of the total government inventory. Fleet vehicles emitted 485 mtCO2e from fuel use, while employee commuting emitted 316 mtCO2e. Fugitive emissions from vehicle air conditioners were
44 Sam Merritt. 45 Oberlin College, 2011.http://new.oberlin.edu/office/environmental-‐sustainability/progress/transportation.dot 46 Colin Koffel, Rob Lamppa, and Madeline Marvar. 47 Bryan Burgess and Ken Sloane. 48 Bryan Burgess and Ken Sloane. 49
http://www.greenreportcard.org/report-‐card-‐2011/schools/oberlin-‐college/surveys/campus-‐survey. 50
PDF compression, OCR, web optimization using a watermarked evaluation copy of CVISION PDFCompressor
OBERLIN TRANSPORTATION PROFILE CENTER FOR NEIGHBORHOOD TECHNOLOGY
25
estimated to be 14 mtCO2e in 2007. Each fleet vehicle emitted an average of 5 mtCO2e in 2007 and each employee commute emitted an average of 2 mtCO2e.51
Municipal fleet vehicles consumed 32,874 gallons of gasoline and 17,315 gallons of diesel in 2007, which cost $135,751. City employee commuting consumed about the same amount of gasoline 32,144 gallons but significantly less diesel 279 gallons.52
1.4.6 Air Travel While Oberlin does not have
an airport within its boundaries, Oberlin is a community that both attracts visitors from around the world and has a very highly connected population of residents and scholars. Therefore, it is likely that the emissions profiles of residents and organizations in Oberlin and visitors to Oberlin include a substantial amount of air travel. There is no international consensus on how to account for air travel emissions in communities that do not have an airport, but when the average round trip flight from Cleveland to New York can produce nearly a half ton of GHG emissions per person, plus the potential increased impacts of emissions emitted at higher altitudes, it is not an emissions source that should be ignored for a fully sustainable transportation system.53
While the College has periodically discussed energy-‐efficient solutions for student travel during academic breaks and the end of semesters, the College has not identified a solution for the energy use of faculty trips to academic conferences and other professional endeavors. The College has installed teleconferencing technology, but it has not been not heavily adopted. Restrictions or regulations on air travel are not seen as an acceptable strategy for College business. Similarly, a large number of parents, former students, and other visitors come to Oberlin for Commencement weekend, but no energy-‐efficient mode of transportation has been discussed for their visits and no mechanism for implementation has been identified.54
1.4.7 College Transportation Emissions: 2,891 mtCO2e Oberlin College has made a commitment to climate neutrality by 2025 relative to its 2007 baseline emissions inventory of 51,049 mtCO2e by signing the American College and University Presidents Climate Commitment (ACUPCC).55 As shown in Table 1, transportation emissions accounted for 6% of the total emissions from the College in 2007, which includes emissions from fleet vehicles commuting and air travel for College events.
51 52 53 bon Emissions Calculator accessed May 2011, http://carbon.trx.com/Home.asp. 54 Colin Koffel, Rob Lamppa, and Madeline Marvar. 55
PDF compression, OCR, web optimization using a watermarked evaluation copy of CVISION PDFCompressor

OBERLIN TRANSPORTATION PROFILE CENTER FOR NEIGHBORHOOD TECHNOLOGY
26
An updated emissions inventory was reported for 2009 and found transportation accounted for 2,891 mtCO2 Emissions from all types of transportation were lower in 2009 than in 2007; however, caution should be taken in extrapolating those trends as the report for 2009 notes,
56
Table 1. Oberlin College Transportation GHG Emissions
Category 2000 GHG Emissions
(metric CO2e)57*
2007 GHG Emissions (metric tons CO2e)58**
2009 GHG Emissions (metric tons CO2e)59
Total Oberlin College Emissions
45,738 51,049 42,609
Total Transportation Emissions
2,648 (6% of total)
3,217 (6% of total)
2,891 (7% of total)
Fleet Vehicles 371 238 220 Commuting 1,521 1,814 1,792 Air Travel 424 1,165 879 Ground Travel for College Events
136 Not reported, possibly in another category
Not reported, possibly in another
category Transport of Coal to College
196 Not reported Not reported
*Note the 2000 inventory used a different methodology and published emissions values in short tons, they have been recalculated here to metric tons, but care should be made when making comparisons with the 2007 and 2009 inventories.
The report Oberlin College: Climate Neutral by 2020, which was published in 2002, was one of the first of its kind, and in it the Rocky Mountain Institute prepared a GHG inventory for the College for the year 2000.60 These emissions are included in Table 1, but as different methodologies and boundaries were used to develop that inventory the transportation
56 American College & University Presidents ClimaFebruary 15, 2011, http://rs.acupcc.org/ghg/1707. 57 Rocky Mountain Institute, Oberlin College: Climate Neutral by 2020, January 2002. 58 American College & University Presidents Climate CommitmeNovember 26, 2008, http://rs.acupcc.org/ghg/367. 59 February 15, 2011, http://rs.acupcc.org/ghg/1707. 60 Rocky Mountain Institute, Oberlin College: Climate Neutral by 2020.
PDF compression, OCR, web optimization using a watermarked evaluation copy of CVISION PDFCompressor

OBERLIN TRANSPORTATION PROFILE CENTER FOR NEIGHBORHOOD TECHNOLOGY
27
numbers are not directly comparable to the 2007 and 2009 inventories. It is interesting to note, however, that even with the differences between the reports, transportation is a similar share of emissions for the College at 6%.
As part of its climate neutral commitment, Oberlin College published a climate action plan in 2009, Oberlin College: A Plan to Be Carbon Neutral. The emissions reduction strategies identified in the plan did not focus on transportation aside from discussing the purchase of a limited number of carbon offsets for activities like transportation. Stationary combustion
focusing emissions reduction on those areas is understandable. types of energy use get cleaner, the transportation emissions will become greater share of its footprint if not addressed as well. That said, the College has developed many transportation alternatives as part of its environmental policy and sustainability initiatives that are documented elsewhere in this report. 61
A 2010 Campus Survey completed by Oberlin for the College Sustainability Report Card shows
cars. The survey respreplace older, less efficient vehicles. Additionally a Kubota tractor was converted to run on
62
The Campus Survey response for Oberlin also estimates that 99% of students and 60% of -‐occupancy
63 The 2009 version of the same survey showed a breakdown estimate of 99 % of students, 48% faculty and 27% staff commuting via non-‐single occupancy vehicles.64 The almost universal use of non-‐single occupant vehicles for commute by Oberlin students is greatly facilitated by the estimated 90% of full-‐time students that live on campus.65
scope and sets an ambitious agenda for sustainable transportation. The Environmental Policy states,
61 62 port Card 2011: Oberlin College. 63 The College Susta port Card 2011: Oberlin College. 64 0http://www.greenreportcard.org/report-‐card-‐2010/schools/oberlin-‐college/surveys/campus-‐survey 65 T .
PDF compression, OCR, web optimization using a watermarked evaluation copy of CVISION PDFCompressor

OBERLIN TRANSPORTATION PROFILE CENTER FOR NEIGHBORHOOD TECHNOLOGY
28
in students, faculty, and staff have become increasingly reliant on cars for their day-‐to-‐day activities. This development has reduced the
centrally located parking lots and increased traffic. More importantly, it has also reinforced an increasingly troublesome culture of environmental disregard. College transportation policy should therefore be formulated to reverse this trend by encouraging alternative modes of transportation, such as bicycles, and increasing the efficiency of the vehicles that continue to be used. The strong link between transportation use and environmental quality provides an ideal opportunity to educate Oberlin students, faculty, and staff about environmental
66
The Environmental Policy goes on to prioritize low-‐carbon transportation modes, but states a
The Environmental Policy sets the goal of incentivizing sustainable transportation by both students and employees, but calls for consideration for those students, employees, and visitors traveling from outlying areas. The transportation strategies discussed in detail
67
1.5 Transportation Options in Oberlin For a place its size, Oberlin has a remarkable number of transportation alternatives; showing itself to be a bit of an experimental proving ground with young entrepreneurs setting up small-‐scale transportation options on campus and in town.
1.5.1 In-‐town Alternatives and Regional Travel Those traveling within Oberlin and the region have different transportation needs than those going on long-‐distance trips. Accordingly, the transportation alternatives for those types of trips need to be considered in different ways. This transportation profile therefore looks at the transportation choices for short and longer-‐distance trips separately.
1.5.1.1 Bike The town enjoys a robust set of services and infrastructure for a place of its size. Aside from OH-‐58 and OH-‐511, the lightly trafficked streets make them suitable for bicycling.68 Although no
66 Oberlin College, http://oberlin.edu/sustainability/about/OCEnvironmentalPolicyMay2004.pdf. 67 nvironmental Policy. 68 City of Oberlin, Ohio, Comprehensive Plan, January 3, 2005.
PDF compression, OCR, web optimization using a watermarked evaluation copy of CVISION PDFCompressor

OBERLIN TRANSPORTATION PROFILE CENTER FOR NEIGHBORHOOD TECHNOLOGY
29
bike lanes exist in the city, streets such as Professor Street see regular activity. The town has installed bicycle racks in key locations around downtown Oberlin.69
Significant gaps remain in the citywide bicycle infrastructure. Students lock so many bikes on the fences in front of Slow Train Café that it has become difficult to walk past them on the sidewalks some days.70 Disrepair of some Oberlin roads discourages widespread cycling, especially during harsh Ohio winters.71
Oberlin College has experimented with numerous bicycle policies with mixed results. The College recently installed covered bike canopies that cost $15,000 outside of Mudd Library in the center of campus designed to handle heavy snow. Students are currently designing a new bike canopy that would be cheaper to construct, but additional locations have not been identified. The College considered a bicycle giveaway program for new students, but determined that it would not reduce the number of vehicles on campus. The College once developed a bicycle sharing program but discontinued it after many bicycles were stolen.72
Three bicycle shops and stores operate around Oberlin. The Oberlin Bike Co-‐Op is located at 154 North Main Street and offers bicycle repair, rental, and education services to students at the College and residents of the town.73 -‐20 at 43239 Oberlin-‐Elyria Road.74 In 2011, Swerve opened at 23 S. Main Street in Downtown.75
The North Coast Inland Trail connects the city of Oberlin to the city of Elyria to the northeast and the town of Kipton to the southwest. Lorain County Metro Parks is extending the trail northward to downtown Lorain, with an on-‐road connection through Elyria.76 The completed trail will connect Oberlin with the two largest cities in Lorain County.
Lorain County lacks the infrastructure to allow bicycling to be a realistic alternative to regional car trips. Only one street that intersects with the Kipton-‐Elyria trail has a marked lane.77 Before LCT cut its service, it removed bike racks from its fleet due to poor maintenance.78 Due to a lack
69 Jason Adelman and Krista Long. 70 Bryan Burgess and Ken Sloane. 71 Jason Adelman and Krista Long. 72 Colin Koffel, Rob Lamppa, and Madeline Marvar. 73 Oberlin College Student Organizations, http://www.oberlin.edu/stuorg/bikecoop/bchome/bchome.html. 74 http://dalesbikeshop.com/. 75 Back Roads and Beaches, May 6, 2011, http://backroadsandbeaches.blogspot.com/2011/05/new-‐bike-‐shop-‐swerve-‐in-‐oberlin-‐now.html. 76 Lorain County Metro Parks, http://www.metroparks.cc/reservation-‐north-‐coast-‐inland-‐trail.php. 77 Google Maps, accessed May 2011. 78 Richard Enty, interviewed by Kyle Smith, Oberlin OH, May 17 2011.
PDF compression, OCR, web optimization using a watermarked evaluation copy of CVISION PDFCompressor

OBERLIN TRANSPORTATION PROFILE CENTER FOR NEIGHBORHOOD TECHNOLOGY
30
of coordination between county park systems, bicycle trails in Lorain County do not connect to trails in Cuyahoga County.79
Within Oberlin, the lack of a designated lane connecting the Kipton-‐Elyria trail and to the rest of the city has discouraged recreational riders from visiting Downtown. The city is installing its first bicycle lane along North Professor Street, which will connect downtown Oberlin to the trail.
some visitors might ride on weekends once the lane is complete. However, the majority of outside visitors will continue to drive. 80
1.5.1.2 Walk The developments with the existing street grid. The city encourages sidewalks and discourages cul-‐de-‐sacs and dead end streets in all new developments.81
Because the College campus is located across Tappan Square from downtown, it is easy to walk between the two.82 Numerous pedestrian paths connect the buildings of the campus across attractive open spaces and regularly intersect with sidewalks in the remainder of the town.
Oberl approximately half that of the national average makes it a particularly attractive walking city.83 students that do not feel comfortable walking alone.84 However, a recent rape outside of an elementary school has created a heightened sense of caution for families with younger children.85
In downtown Oberlin, sidewalks include brick pavers, trees, and other amenities. Most of these amenities were installed in the 1980s and need replacement. Over the last decade, the City has invested in new curb cuts at intersections, pedestrian crossing signals at Main and Vine and Main and College, and new crosswalk markings at intersections without traffic lights.86
79 Hunter Morrison, interviewed by Kyle Smith, May 26 2011. 80 Jason Adelman and Krista Long. 81 City of Oberlin, Ohio, Comprehensive Plan. 82 City of Oberlin, Ohio, Comprehensive Plan. 83 City-‐data.com, -‐data.com/city/Oberlin-‐Ohio.html 84 Oberlin College, Accessed May 19, 2011.http://new.oberlin.edu/transportation/get-‐around-‐campus.dot 85 Bryan Burgess and Ken Sloane. 86 City of Oberlin, Ohio, Downtown Revitalization and Development Plan: Update 2010, May 13 2010.
PDF compression, OCR, web optimization using a watermarked evaluation copy of CVISION PDFCompressor

OBERLIN TRANSPORTATION PROFILE CENTER FOR NEIGHBORHOOD TECHNOLOGY
31
Significant gaps in sidewalk coverage limit mobility in newer neighborhoods. The degraded state of some sidewalks makes them dangerous for seniors during icy winters.87 Many neighborhoods built between 1950 and 1980 lack sidewalks altogether. Sections of OH-‐511 and OH-‐58 maintained by the Ohio Department of Transportation (ODOT) also lack sidewalks. ODOT has opposed lower speed limits and additional stop signs along both roads.88
In 2011, ODOT awarded the City of Oberlin a $610,000 Safe Routes to School grant to improve area sidewalks to three neighborhood schools. The grant includes traffic signal flashers at three intersections, School Zone flashers on Prospect Street, and ADA-‐compliant sidewalk and crosswalk improvements at twelve locations. 89 The grant will make it easier for all residents to walk around sections of town where the installation of sidewalks lapsed after the 1950s.90
1.5.1.3 Lorain County Transit Due to budget difficulties, Lorain County Transit (LCT) reduced its 12 transit routes to 2 and ended regular bus connection from Oberlin to other destinations in the County. The cuts were the result of a combination of state and federal budget cuts and a decision by the County Board of Commissioners to reduce funding by $500,000 when a sales tax levy failed. According to The Chronicle-‐Telegram -‐Copley Township, was able to arrange for $295,000 in transit funding, but county officials said many routes still must be eliminated
91
1.5.1.4 Oberlin Connector After LCT eliminated transit service, the town and College evaluated several mobility alternatives and eventually settled on a Circulator service. The city originally sought an allocation of Congestion Mitigation and Air Quality (CMAQ) dollars through NOACA but could not secure a large enough local match to adequately fund a service that would meet all of the transportation demands of students and residents. The city then scaled back its plans. 92
In 2010, the city launched a three-‐month pilot for the Oberlin circulator and chose to continue the service after it proved successful.93 The Oberlin Connector runs on Monday to pre-‐arranged destinations within Oberlin and alternates between destinations in Elyria and Lorain from 9:00 AM and 3:00 PM. Fares cost $2.35 for adults, $1.15 for senior citizens and low-‐income 87 Oberlin Resident Focus Groups. 88 Bryan Burgess and Ken Sloane. 89 City of Oberlin, Ohio, Safe Routes to School Countermeasure Application application to the Ohio Department of Transportation, November 5 2010. 90 Bryan Burgess and Ken Sloane. 91 Cindy Leise, The Chronicle-‐Telegram, December 31, 2009. http://chronicle.northcoastnow.com/2009/12/31/countys-‐transit-‐plan-‐reduces-‐lct-‐to-‐two-‐routes/ 92 Gary Boyle and Eric Norenberg, interviewed by Kyle Smith, May 25 2011. 93 Gary Boyle and Eric Norenberg.
PDF compression, OCR, web optimization using a watermarked evaluation copy of CVISION PDFCompressor

OBERLIN TRANSPORTATION PROFILE CENTER FOR NEIGHBORHOOD TECHNOLOGY
32
residents, and $5.00 for a one-‐day pass. The city contracts with Lorain County to provide the service. It costs $40 to operate the vehicle per hour with an additional federal $40 per hour match provided through Lorain County.94
This limited service does not fully address mobility issues for most residents, especially those with medical appointments, but the city cannot afford to expand it. Anticipating general revenue losses in 2012, the city has asked the Walton Family Foundation for a $25,000 grant.95
1.5.1.5 RideLine Oberlin College operates a stop-‐to-‐stop vehicle escort service called RideLine that runs along a fixed route around the campus.96 It operates between 9 PM and 2 AM daily and it provides Oberlin College students a safe mode of transportation from one destination to another. It is
97
1.5.1.6 Student Union The Oberlin College student union occasionally offers shuttles to certain parts of Cleveland, including West Side Market and Crocker Park.98
1.5.1.7 Cleveland RTA at Airport While the RTA does not offer direct service to Oberlin, the RTA Red Line is about 25 miles away and serves Tower City, University Circle, and West Side Market. The closest station is at Cleveland-‐Hopkins Airport and the closest Park-‐and-‐Ride is at Brookpark Station.
1.5.1.8 Hertz Connect Since October Oberlin College has partnered with Connect by Hertz for three shared vehicles in the town. Membership for students is free. Cars include the cost of gasoline and insurance and are priced by the mile. 99 Oberlin College has considered auto-‐enrolling first year students into the program as a part of tuition and fees.100
Each of the three cars is located along the edge of the campus within walking distance to surrounding residential neighborhoods:101
94 City of Oberlin, Accessed May 2001. http://www.cityofoberlin.com/files/city%20manager/oberlin%20connector%2012-‐16-‐10.pdf. 95 Gary Boyle and Eric Norenberg. 96 Accessed May 2011. http://new.oberlin.edu/transportation/get-‐around-‐campus.dot. 97 Colin Koffel, Rob Lamppa, and Madeline Marvar. 98 Colin Koffel, Rob Lamppa, and Madeline Marvar. 99 Oberlin College Office of Sustainability, May 2011. 100 Colin Koffel, Rob Lamppa, and Madeline Marvar. 101 Hertz, Accessed May 2011, http://www.connectbyhertz.com/.
PDF compression, OCR, web optimization using a watermarked evaluation copy of CVISION PDFCompressor

OBERLIN TRANSPORTATION PROFILE CENTER FOR NEIGHBORHOOD TECHNOLOGY
33
A Mazda 3 behind Keep Cottage at 154 N. Main Street. A Toyota Prius behind the Adam Joseph Lewis Center for Environmental Studies on Elm
Street. A Ford Escape behind the Oberlin Inn at 7 N. Main Street.
In the six months of Hertz service, the number of members has increased from 17 to 91. While utilization of the vehicles steadily increased from October to March 2011 (Figure 5), 102 the city does not believe that car sharing has affected the number of student vehicles in Oberlin.103
Figure 5. Hertz Connect Utilization in Oberlin
Hertz is rolling out charging stations nationally and the College installed wiring behind Kahn Hall during its construction. However, Hertz will not consider electric vehicles to be an effective investment until the ridership for the cars increase.104
The city of Oberlin also attempted to coordinate a volunteer car sharing program among local residents, but it failed due to legal concerns about insurance in the event of an accident.105
1.5.1.9 Shared Rides through Oberlin Classifieds Students at the College and residents of the town both find shared rides through the Oberlin classifieds.106
102 Connect by Hertz, Monthly Reports, accessed May 2011. 103 Gary Boyle and Eric Norenberg. 104 Colin Koffel, Rob Lamppa, and Madeline Marvar. 105 Bryan Burgess and Ken Sloane. 106 Colin Koffel, Rob Lamppa, and Madeline Marvar.
PDF compression, OCR, web optimization using a watermarked evaluation copy of CVISION PDFCompressor

OBERLIN TRANSPORTATION PROFILE CENTER FOR NEIGHBORHOOD TECHNOLOGY
34
array of regional destinations including the Cleveland Clinic, concert venues, connections to bus stops, rail stations, and both airports. 107 Nearly two thirds of the postings were for long-‐distance intercity trips on weekends and after commencement to all parts of the country.
-‐distance travelers for the summer looking to share gas costs as well as several different ad hoc paid ride services. Sample prices included $10 within Oberlin, $15 to Elyria, $20 to the Cleveland Airport, and $30 to other transport hubs in Cleveland. At least one driver charged a $10 premium for late night or early morning rides.
1.5.1.10 Rideshare NOACA, along with two other regional planning agencies, operates OhioRideShare, which allows users to identify potential carpool partners to destinations. While NOACA does not track
; 8 vehicles registered in other zip codes listed 44074 as a destination.108
One of the concerns of carpool participants is a lack of flexibility and the potential to get stuck at work when an issue arises. The program reimburses 80% of bus or taxi fare up to $60 as often as 4 times per year.109
1.5.2 Travel Options for Long Distance Travel
scholarly community, so long-‐distance travel is more a part of Otowns its size. There are several long-‐distance travel options available in the region, but accessing them other than by car can be a challenge.
1.5.2.1 Air Travel Cleveland-‐Hopkins International Airport is about 25 minutes from Oberlin. It is the largest airport in Ohio. As a Continental Airlines hub, it offers direct flights to several metropolitan areas throughout the country, although this could change after the airline completes its merger with United Airlines.110
Two carriers offer shuttle service between Oberlin and Cleveland-‐Hopkins International Airport. The Airport Oberlin Shuttle (AOS) operates three shared vans from Oberlin to Cleveland-‐ 107 Oberlin Classifieds, , sed May 19, 2011, https://oncampus.oberlin.edu/classifieds 108 Colleen Donnelly, Email to Kyle Smith, May 9 2011. 109 Northeast Ohio Areawide Coordinating Agency, Guaranteed Ride Home (GRH) Program Accessed May 6, 2011.http://www.noaca.org/grh.html 110 Jay Miller, Crains Cleveland, November 10 2010.
PDF compression, OCR, web optimization using a watermarked evaluation copy of CVISION PDFCompressor
OBERLIN TRANSPORTATION PROFILE CENTER FOR NEIGHBORHOOD TECHNOLOGY
35
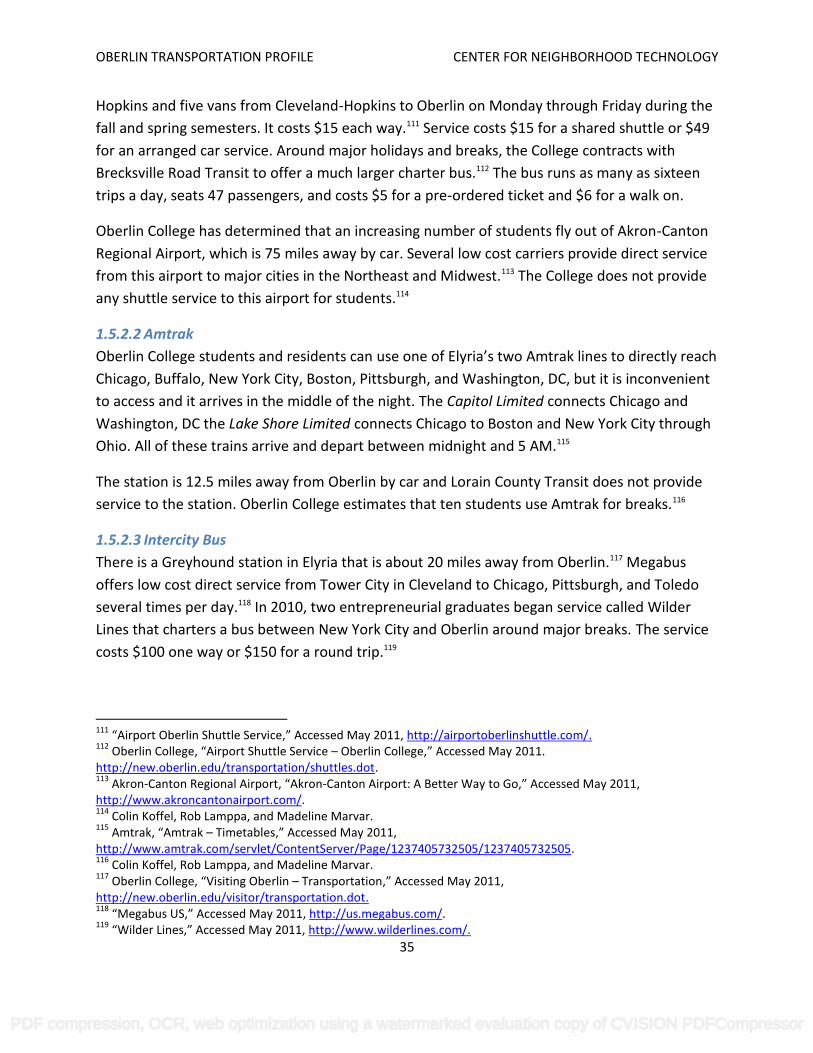
Hopkins and five vans from Cleveland-‐Hopkins to Oberlin on Monday through Friday during the fall and spring semesters. It costs $15 each way.111 Service costs $15 for a shared shuttle or $49 for an arranged car service. Around major holidays and breaks, the College contracts with Brecksville Road Transit to offer a much larger charter bus.112 The bus runs as many as sixteen trips a day, seats 47 passengers, and costs $5 for a pre-‐ordered ticket and $6 for a walk on.
Oberlin College has determined that an increasing number of students fly out of Akron-‐Canton Regional Airport, which is 75 miles away by car. Several low cost carriers provide direct service from this airport to major cities in the Northeast and Midwest.113 The College does not provide any shuttle service to this airport for students.114
1.5.2.2 Amtrak Oberlin College students and residents can Chicago, Buffalo, New York City, Boston, Pittsburgh, and Washington, DC, but it is inconvenient to access and it arrives in the middle of the night. The Capitol Limited connects Chicago and Washington, DC the Lake Shore Limited connects Chicago to Boston and New York City through Ohio. All of these trains arrive and depart between midnight and 5 AM.115
The station is 12.5 miles away from Oberlin by car and Lorain County Transit does not provide service to the station. Oberlin College estimates that ten students use Amtrak for breaks.116
1.5.2.3 Intercity Bus There is a Greyhound station in Elyria that is about 20 miles away from Oberlin.117 Megabus offers low cost direct service from Tower City in Cleveland to Chicago, Pittsburgh, and Toledo several times per day.118 In 2010, two entrepreneurial graduates began service called Wilder Lines that charters a bus between New York City and Oberlin around major breaks. The service costs $100 one way or $150 for a round trip.119
111 Accessed May 2011, http://airportoberlinshuttle.com/. 112 Oberlin College, Oberlin College Accessed May 2011. http://new.oberlin.edu/transportation/shuttles.dot. 113 Akron-‐Canton Regional Airport, -‐Canton Airport: A Better Way to Go Accessed May 2011, http://www.akroncantonairport.com/. 114 Colin Koffel, Rob Lamppa, and Madeline Marvar. 115 Amtrak, Timetables Accessed May 2011, http://www.amtrak.com/servlet/ContentServer/Page/1237405732505/1237405732505. 116 Colin Koffel, Rob Lamppa, and Madeline Marvar. 117 Oberlin College, isiting Oberlin Transportation Accessed May 2011, http://new.oberlin.edu/visitor/transportation.dot. 118 Megabus US Accessed May 2011, http://us.megabus.com/. 119 Accessed May 2011, http://www.wilderlines.com/.
PDF compression, OCR, web optimization using a watermarked evaluation copy of CVISION PDFCompressor

OBERLIN TRANSPORTATION PROFILE CENTER FOR NEIGHBORHOOD TECHNOLOGY
36
2 Land Use
2.1 Overview The design of Oberlin and its location and mix of homes, businesses, and institutions affects where residents go and how they get choose to get there. Much research continues to be done on the complex interplay of travel demand and land use, but the basic concepts are simple to understand. When it is easy to walk a few blocks for an errand, more people will do so. If the library, post office, or destination of any other errand is far away, difficult to access, or unsafe, fewer people will walk there. Every day, these individual decisions are shaped in part by the land use of a place and added together they determine the travel patterns for the region.
Oberlin remains small and compact, with a land area of 4.4 square miles.120 The central configuration of the town includes interconnected streets and a concentration of amenities around downtown Oberlin and the Oberlin College campus. This makes it an inherently very walkable and bikeable place, even with growing commercial areas at the edge of town. Automobile trips within Oberlin are likely to be short, which can make alternative vehicles and fuels an especially good fit. transportation alternative. Solutions that require a larger scale of users to become economically viable will require creativity to implement in Oberlin.
patterns as well. The nearest major city, Cleveland, is 35 miles away and difficult to access by means other than an automobile, yet is a destination for students and residents. relative remoteness also means that it does not benefit from some of the transportation alternatives available in the region; do not extend as far as Oberlin.
2.2 Oberlin College The configuration of the Oberlin College campus makes it easy and convenient for students to access all of their destinations without an automobile. Many classrooms, a student union, and Mudd Library all overlook the central quad of Wilder Bowl with two clusters of student housing to the north and the south.121 Additional housing options include co-‐operative housing, program housing, and off-‐campus rentals, some of which are located further from Wilder Bowl.
120 U.S. Census Bureau, Census 2000. 121 Oberlin College, Accessed May 27 2011, http://new.oberlin.edu/visitor/index.dot.
PDF compression, OCR, web optimization using a watermarked evaluation copy of CVISION PDFCompressor

OBERLIN TRANSPORTATION PROFILE CENTER FOR NEIGHBORHOOD TECHNOLOGY
37
A few student services are located just outside the heart of the campus. Student Health Services and Allen Memorial Hospital on West Lorain Street provide health services west of Wilder Bowl. Indoor and outdoor athletic facilities are located at the northwestern edge of campus near the intersection of Union and Woodland Streets. The distance between these facilities and South Campus just exceeds ten minutes or one half mile, a commonly accepted standard for reasonable walking distance.122
2.3 Downtown Oberlin Downtown Oberlin sits across Tappan Square from Wilder Bowl and spans the south side of College Street and both sides of S. Main Street. Most buildings along both streets are relatively dense, compact and occupied, which make it an easy and enjoyable place to walk.123 Surface parking lots, vacant lots, and open space create some small gaps in retail frontage further south along Main Street towards Vine Street. Many buildings downtown date from the 19th century, are in fair to good condition, and create a unique sense of place and shopping experience.
The most recent survey by Main Street Oberlin found 46 commercial enterprises downtown.124 Amenities located downtown include a hardware store, a Ben Franklia bookstore, two banks, and a movie theater. Oberlin City Hall, the public library, and a post office are also downtown.
The growing residential population in Downtown Oberlin has been led by the recent development of Sustainablbuilding with retail space and 33 residential units, which represents the type of downtown
tenants include a bank, a cafe, and offices, with plans for an Asian market, restaurant, art gallery, and studios. A diversity of destinations like this within walking distance of each other enable trip chaining combining many trips into one and can cut down on travel time and vehicle use with its related fuel consumption and emissions.125
Eleven other buildings in the downtown district have apartments on the second floor and third floors of multistory buildings. Other upstairs uses include professional offices and service space.126 The entire downtown is zoned C-‐1, which permits residential uses on the second story of buildings.127 There are no parking requirements. Vacant spaces in five downtown buildings
122 Google Maps. 123 City of Oberlin, Ohio, Downtown Revitalization and Development Plan. 124 Geoffrey Comings and Gregory Tisher, Downtown Market Study, 2010. 125 Sustainable Communities Associates, Home Page and Tenants, Accessed May 23, 2011, http://sustainableca.com/retail/new-‐tenants/ 126 Geoffrey Comings and Gregory Tisher. 127 City of Oberlin, Ohio, Comprehensive Plan.
PDF compression, OCR, web optimization using a watermarked evaluation copy of CVISION PDFCompressor

OBERLIN TRANSPORTATION PROFILE CENTER FOR NEIGHBORHOOD TECHNOLOGY
38
could accommodate additional downtown residential units in the existing building stock.128 There will probably be demand for additional units as the housing market recovers.129
2.4 Other commercial districts Oberlin has annexed property on the outskirts of town to accommodate development, which has resulted in the creation of non-‐downtown shopping destinations in Oberlin that are most easily accessed by automobile, as transportation infrastructure for other modes has not kept pace with development.
The largest and most recent commercial development in Oberlin is anchored by a Wal-‐Mart at the intersection of OH-‐58 and US-‐20.130 The annexation of this land was a contentious issue, but the town ultimately decided to proceed to gain control of the design of the development.131 Wal-‐Mart installed sidewalks and bicycle parking as part of that agreement.132 However, these sidewalks do not connect the development to the center of town.
Smaller automobile oriented districts exist elsewhere around the periphery of town:
A small commercial district at the intersection of OH-‐511 and Pyle-‐Amherst Road that includes a Dollar General to the west of town.133
A Discount Drug Mart at the intersection of Butternut Ridge Road and Leavitt Road to the north of town.134
An IGA at 331 E Lorain Street that is within a walkable park of town but set back behind a large parking lot.135
downtown.136
As will be discussed later in this report, focus groups suggested that permanent residents of Oberlin rely on these developments for groceries and other basic household needs. They sit along state roads where the Ohio Department of Transportation has resisted sidewalk installation and traffic calming measures on them in the past.137
128 City of Oberlin, Ohio, Downtown Revitalization and Development Plan. 129 Gary Boyle and Eric Norenberg. 130 Google Maps. 131 Bryan Burgess and Ken Sloane. 132 Gary Boyle and Eric Norenberg. 133 Google Maps. 134 Google Maps. 135 Oberlin Resident Focus Groups. 136 Oberlin Resident Focus Groups. 137 Bryan Burgess and Ken Sloane.
PDF compression, OCR, web optimization using a watermarked evaluation copy of CVISION PDFCompressor

OBERLIN TRANSPORTATION PROFILE CENTER FOR NEIGHBORHOOD TECHNOLOGY
39
2.5 Residential neighborhoods of development, many residential neighborhoods in
Oberlin are clustered around the urban core138 within an easy walk of downtown. As Map 7 shows, a majority of Oberlin neighborhoods in Oberlin are one half mile from downtown or closer. A total of 4,857 out of 8,761 people or 55% lived within a ten minute walk of downtown in 2010.139
Map 7. One Half Mile Radius around Downtown Oberlin
The number of Oberlin residents within walking distance declined over the last decade. Since 2000, this half-‐mile radius has lost 188 residents and 122 occupied housing units (a close proxy for households).140 The city has demolished several derelict properties in these neighborhoods
138 City of Oberlin, Ohio, Comprehensive Plan. 139 U.S. Census Bureau, Census 2010. 140 U.S. Census Bureau, Census 2010.
PDF compression, OCR, web optimization using a watermarked evaluation copy of CVISION PDFCompressor

OBERLIN TRANSPORTATION PROFILE CENTER FOR NEIGHBORHOOD TECHNOLOGY
40
and believes they can be redeveloped as the housing market improves.141 Infill development on these sites would put more Oberlin households within walking distance of downtown.
South of the core of town, the Oberlin Plan Commission encouraged higher density development in some undeveloped land immediately surrounding the Wal-‐Mart in the hope that it can build an interconnected residential neighborhood here as the housing market recovers.142
2.6 Industrial Areas Located along Artino Street in the northwest quadrant of the city, the Oberlin Industrial Park includes a facility for the Federal Aviation Administration that employs 700 workers and several smaller manufacturers.143 While the FAA facility has been a stable tenant, the Park has lost other, smaller manufacturers over the course of the last decade.144
The park generates significant truck and commuter traffic along OH-‐511 from US-‐20. One of the focus groups for this project identified this traffic as a serious deterrent from walking to an IGA in the center of town.145
2.7 Parking Although College campus and downtown are compact and walkable, a significant amount of land is devoted to parking. Most designated parking lots for Oberlin College are located around the edge of campus behind major buildings rather than in its core areas.146 Major parking lots are separated from pedestrian and open spaces of the campus and do not discourage walking from one part of the campus to another. The College has designated seven LEED parking spaces for fuel efficient vehicles outside the Kohl Building, Kahn Hall, and the Allen Art Museum.147
Students at Oberlin College must purchase a parking permit to use a College lot. Safety and Security has successfully raised permit prices $75 to $200 to dissuade students from bringing vehicles to Oberlin.148 Oberlin College is also considering preventing freshman from bringing cars altogether. In Kahn Hall, which opened in 2010, students pledge to live without a car for their first year in Oberlin. To build the residence hall, the College requested and was granted a
141Gary Boyle and Eric Norenberg. 142Gary Boyle and Eric Norenberg. 143 , ltBod
, http://www.cityofoberlin.com/Files/Finance/TIF%20E%20College%20St%20Note%209-‐9-‐09.pdf 144 City of Oberlin, Ohio, Comprehensive Plan. 145 Oberlin Resident Focus Groups. 146 Oberlin College, lin , http://new.oberlin.edu/visitor/parking.dot. 147 Colin Koffel, Rob Lamppa, and Madeline Marvar. 148 Oberlin College Office of Sustainability, on Survey Winter 2009.
PDF compression, OCR, web optimization using a watermarked evaluation copy of CVISION PDFCompressor

OBERLIN TRANSPORTATION PROFILE CENTER FOR NEIGHBORHOOD TECHNOLOGY
41
variance by the City to reduce the number of mandated spaces from 180 to 20. The Hertz Connect car behind Kahn Hall sees heavy utilization.149
College employees receive two free parking permits. The College does not offer incentives for carpooling or a condensed work week for staff.150 Visitors to Oberlin College campus require a temporary parking permit in order to park in visitor-‐designated spaces.151
The Oberlin College Office of Sustainability has estimated the yearly cost of a parking space for the College to be $8,000 to construct and $600 per year to maintain a subsidy of $400 per student and $1,200 per staff person. However, the College has not accepted these numbers because they represent overhead costs that vary with the size of the lot.152
In Downtown, two privately-‐owned lots sit behind the streetscape along College and Main Streets.153 Additionally, there is some land now dedicated to free on-‐street parking that could be converted to sidewalk space and accommodate more outdoor dining like existing options at
Because most downtown parking is free, the student body of Oberlin uses many spots to park vehicles that were not intended for them. Students park in the free diagonal spots along College and Main Streets rather than the permitted lots near campus. It can also be difficult to find parking when events are held at the Oberlin Conservatory. The city of Oberlin has stepped up its enforcement policies of downtown parking spaces over the last year.154
The status of Oberlin as a shopping destination and the lack of regional transit connections create demand for visitor parking. As one example, Slow Train Café has increased the strain on available parking because it draws customers from other communities. Oberlin also experiences peak parking needs during commencement and special events. When a 150 car parking lot closes as part of the Green Arts District, supply will shrink even more.155
149 Colin Koffel, Rob Lamppa, and Madeline Marvar. 150 Colin Koffel, Rob Lamppa, and Madeline Marvar. 151 Oberlin College. 152 Colin Koffel, Rob Lamppa, and Madeline Marvar. 153 Jason Adelman and Krista Long. 154 Gary Boyle and Eric Norenberg. 155 Bryan Burgess and Ken Sloane.
PDF compression, OCR, web optimization using a watermarked evaluation copy of CVISION PDFCompressor

OBERLIN TRANSPORTATION PROFILE CENTER FOR NEIGHBORHOOD TECHNOLOGY
42
3 Travel Destinations
3.1 Overview As a college town and regional destination for shopping and entertainment, many different kinds of people come to and from Oberlin for different reasons, and at different times of the day and week. Energy-‐efficient solutions for transportation mobility in Oberlin should consider the needs of all three of these groups:
Residents of Oberlin. Many residents of Oberlin work in surrounding parts of Lorain County and need a car to get to work every day. Residents of Oberlin are much more likely to drive a car for groceries or shopping than Oberlin College students.
Students at Oberlin College. All College facilities are accessible by foot and students appear to be the core market for downtown.
Visitors to Oberlin. People travel to Oberlin for work, downtown shopping and eating, and special events. Few options exist for them to reach Oberlin other than by car.
Wide variation in transportation behavior across these groups has made it difficult to find equitable and cost-‐effective transportation alternatives. When the city and College considered a more robust Circulator service than the one eventually implemented, they found they could not afford to operate at the hours and locations these constituencies demanded.156
After a travel survey suggested a significant split in travel behavior between College students and permanent residents of the town, CNT conducted two focus groups that emphasized seniors, lower income residents, and those with special needs. This section emphasizes findings from those focus groups and previous surveys.
3.2 Residents of Oberlin Although Oberlin is a compact place, permanent residents often go elsewhere to work, shop, and access services. Not everybody who lives in Oberlin works there and many of the amenities downtown serve students with a different set of tastes and needs. Residents without access to a car face severely limited choices in daily needs and may be unable to find a job altogether.
156 Gary Boyle and Eric Norenberg.
PDF compression, OCR, web optimization using a watermarked evaluation copy of CVISION PDFCompressor

OBERLIN TRANSPORTATION PROFILE CENTER FOR NEIGHBORHOOD TECHNOLOGY
43
3.2.1 Work Although it now accounts for less than one quarter of all trips, the journey to work is the primary trip that a household makes and significantly affects other travel behavior.157 While the city of Oberlin has -‐Administration,158 more than half of Oberlin workers travel elsewhere to earn their paycheck.159 The severe cutbacks in LCT service have eliminated transit access to these jobs.160
A significant number of Oberlin residents work within the city. Out of the 1,793 jobs in Lorain County staffed by Oberlin residents in 2008, 1,043 of them, or 58%, were located in and around the city.161 As Map 8 shows, the most significant work destination for residents of the city of Oberlin is the northwest quadrant, which contains the core of Oberlin College and the neighborhoods in and around downtown.
Map 8. Local Employment Destinations for Residents of the City of Oberlin
157 Nancy McGuckin and Nandu Srinivasan, -‐to-‐Work in the Context of Daily Travel Census Data for Transportation Planning Conference, 2001. 158 159 U.S. Census Bureau, Locational Employment Dynamics, 2008. 160 Oberlin Resident Focus Groups. 161 As defined by the six U.S. Census Block Groups that contain sections of the town of Oberlin.
PDF compression, OCR, web optimization using a watermarked evaluation copy of CVISION PDFCompressor

OBERLIN TRANSPORTATION PROFILE CENTER FOR NEIGHBORHOOD TECHNOLOGY
44
Map 9. Local Employment Destinations for Oberlin Residents in Lorain County
Map 9 shows that significant numbers of Oberlin residents work elsewhere in Lorain County, but they do not commute to any single destination. Oberlin residents staff 222 jobs in Elyria and 139 jobs in Lorain, but not very many of them work near each other. Another 389 jobs are located elsewhere in Lorain County. This job decentralization will make a fixed-‐route transit solution extremely challenging to implement. 162
162 U.S. Census Bureau, Locational Employment Dynamics, 2008.
PDF compression, OCR, web optimization using a watermarked evaluation copy of CVISION PDFCompressor
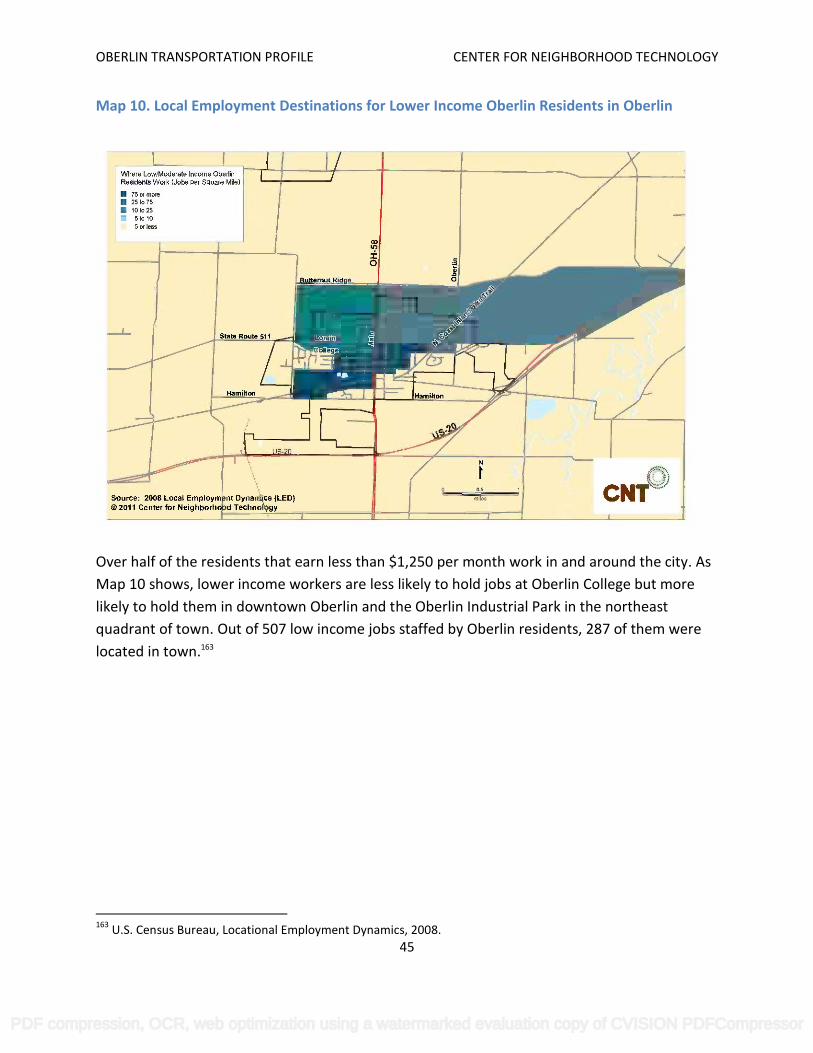
OBERLIN TRANSPORTATION PROFILE CENTER FOR NEIGHBORHOOD TECHNOLOGY
45
Map 10. Local Employment Destinations for Lower Income Oberlin Residents in Oberlin
Over half of the residents that earn less than $1,250 per month work in and around the city. As Map 10 shows, lower income workers are less likely to hold jobs at Oberlin College but more likely to hold them in downtown Oberlin and the Oberlin Industrial Park in the northeast quadrant of town. Out of 507 low income jobs staffed by Oberlin residents, 287 of them were located in town.163
163 U.S. Census Bureau, Locational Employment Dynamics, 2008.
PDF compression, OCR, web optimization using a watermarked evaluation copy of CVISION PDFCompressor

OBERLIN TRANSPORTATION PROFILE CENTER FOR NEIGHBORHOOD TECHNOLOGY
46
Map 11. Local Employment Destinations for Lower Income Oberlin Residents in Lorain County
As indicated in Map 11, lower income residents travel all over Lorain County for work, just like residents of all income levels, although retail centers in Elyria and Amherst are significant destinations for lower income workers.164
These numbers date to 2008 and do not reflect the recent elimination of Lorain County Transit and the loss of blue collar jobs. Focus groups suggested that the end of transit service to jobs around Midway Mall in Elyria and along County Line Road has forced Oberlin residents with special needs for mobility into unemployment.165 Additionally, several manufacturers vacated the Oberlin Industrial Park as the national economic climate worsened in 2008 and 2009.166
164 U.S. Census Bureau, Locational Employment Dynamics, 2008. 165 Oberlin Resident Focus Groups. 166 Gary Boyle and Eric Norenberg.
PDF compression, OCR, web optimization using a watermarked evaluation copy of CVISION PDFCompressor

OBERLIN TRANSPORTATION PROFILE CENTER FOR NEIGHBORHOOD TECHNOLOGY
47
These events have made it even harder to find work within the city of Oberlin or access jobs outside of it.
3.2.2 Food After work, the grocery store is the most significant in-‐town destination for Oberlin residents and it often requires a car.167 Five businesses offer groceries in the town:
products, and groceries, although some residents find that their inventory caters to the College and is more expensive than other stores.168
Oberlin IGA Foodliner at 331 E. Lorain Street offers produce and a full inventory but older residents see it as an inconvenient destination by foot.169
Wal-‐Mart Super Center at 46440 US Route 20 offers cheaper prices and better produce y to walk or bike there.170
Discount Drug Mart and Food Fair at 12289 Leavitt Road. The Drug Mart offers some grocery inventory but is not accessible by foot.
and offers a mix of Korean groceries and prepared goods. It appears to be a specialty store.171
Residents and students reported walking and biking to it.172 Its closing significantly reduced the variety, price, and quality of groceries available to pedestrians in Oberlin.173
Most of the food shopping options are not an easy walk from residential neighborhoods. Map 12 displays the location of full-‐service grocers in Oberlin and a half mile walking distance around them.
167 Oberlin Resident Focus Groups. 168 Oberlin Resident Focus Groups. 169 Oberlin Resident Focus Groups. 170 Oberlin Resident Focus Groups. 171Alex la Ferla, Oberlin Review, February 17 2011. 172 Cindy Leise, The Chronicle-‐Telegram, September 17 2007, http://chronicle.northcoastnow.com/2007/09/17/oberlin-‐grocery-‐closing-‐its-‐doors/ 173 Oberlin Resident Focus Groups.
PDF compression, OCR, web optimization using a watermarked evaluation copy of CVISION PDFCompressor
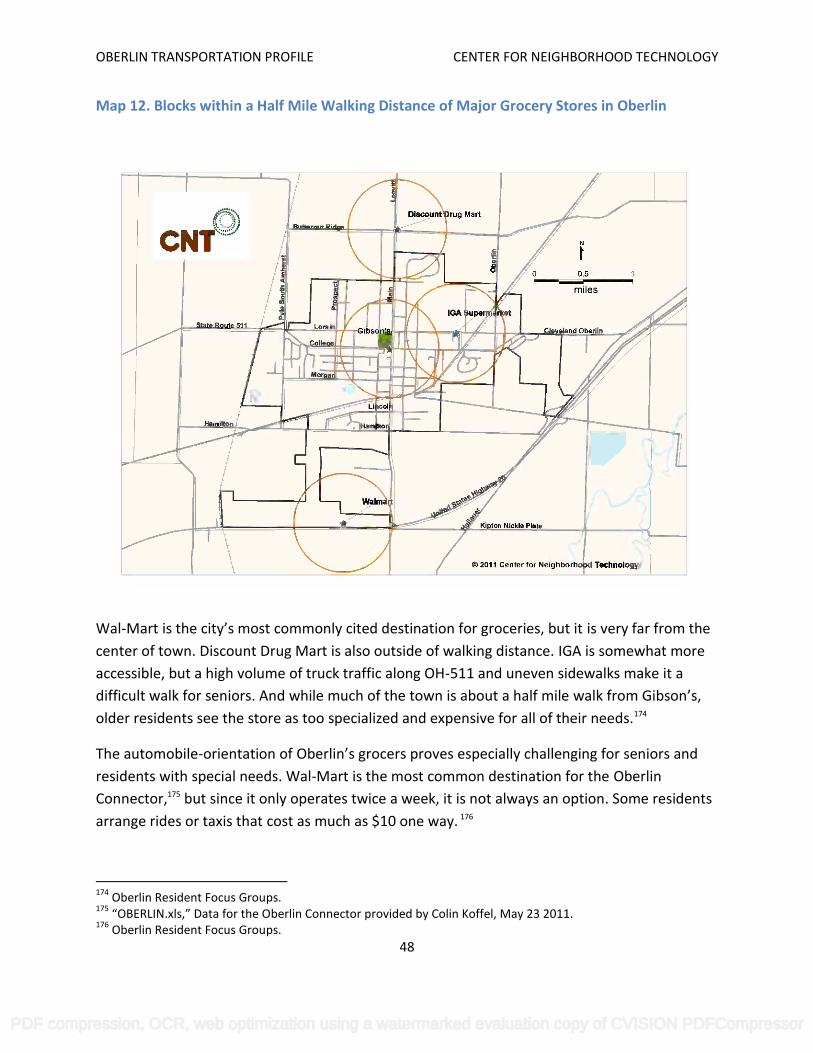
OBERLIN TRANSPORTATION PROFILE CENTER FOR NEIGHBORHOOD TECHNOLOGY
48
Map 12. Blocks within a Half Mile Walking Distance of Major Grocery Stores in Oberlin
Wal-‐ is very far from the center of town. Discount Drug Mart is also outside of walking distance. IGA is somewhat more accessible, but a high volume of truck traffic along OH-‐511 and uneven sidewalks make it a difficult walk for seniors. And while much of the town is about a half mile walk older residents see the store as too specialized and expensive for all of their needs.174
The automobile-‐orientation of proves especially challenging for seniors and residents with special needs. Wal-‐Mart is the most common destination for the Oberlin Connector,175 but since it only operates twice a week, it is not always an option. Some residents arrange rides or taxis that cost as much as $10 one way. 176
174 Oberlin Resident Focus Groups. 175 IN.xls Data for the Oberlin Connector provided by Colin Koffel, May 23 2011. 176 Oberlin Resident Focus Groups.
PDF compression, OCR, web optimization using a watermarked evaluation copy of CVISION PDFCompressor

OBERLIN TRANSPORTATION PROFILE CENTER FOR NEIGHBORHOOD TECHNOLOGY
49
3.2.3 Shopping As with groceries, residents cannot always walk to the amenities they want or need. Businesses estimate that permanent residents only spend about 11% of their retail purchases downtown.177 After Wal-‐Mart opened at the edge of town, several stores downtown closed.178 Focus group participants observed that downtown no longer caters to their daily needs.179
As with groceries, focus groups and travel surveys identified Wal-‐Mart the single biggest shopping destination, followed by Dollar General and Drug Mart. All three of these stores sit along highly trafficked state routes and lack consistent sidewalk coverage. 180
The remaining shopping options are outside of Oberlin. LCT once served retail destinations in Elyria and Lorain via the 11 and 21 buses. The Oberlin Connector does provide transportation on demand to these cities on alternating weeks, but a wait for a return trip takes hours. Residents find rides or hail cabs to reach the lifestyle center in Crocker Park. 181
3.2.4 Medical services While there are a few medical offices and a hospital in Oberlin, fewer doctors are holding weekly office hours there182 and most medical specialists in Lorain County are located in Elyria, Sheffield, and Avon. The Oberlin Connector does not always operate on the days of appointments and many residents take cabs or hire a local driver for medical appointments. These trips can cost more than $30 for a round trip. 183
3.2.5 Social services Oberlin Community Services (OCS) is a not-‐for-‐profit social services organization at 285 S. Professor Street. OCS provides direct assistance to low income residents for utilities, housing, transportation, and food.184 It can be challenging for residents to reach some services outside of Oberlin. The nearest license bureau is in Wellington, which means that residents cannot easily acquire identification for subsidized transportation.185 Oberlin residents seeking subsidized housing must apply at the Lorain Metropolitan Housing Authority administration offices in Lorain.
177 Geoffrey Comings and Gregory Tisher. 178 Jason Adelman and Krista Long. 179 Oberlin Resident Focus Groups. 180 Oberlin Resident Focus Groups. 181 Oberlin Resident Focus Groups. 182 Gary Boyle and Eric Norenberg. 183 Oberlin Resident Focus Groups. 184 Accessed May 2011, http://www.oberlincommunityservices.org/client_food.html. 185 Oberlin Resident Focus Groups.
PDF compression, OCR, web optimization using a watermarked evaluation copy of CVISION PDFCompressor

OBERLIN TRANSPORTATION PROFILE CENTER FOR NEIGHBORHOOD TECHNOLOGY
50
3.3 College students The travel behavior of Oberlin College students has not been as well studied as the transportation needs of residents of the town. However, recent travel surveys suggest that students generally meet their needs in-‐town more often than permanent residents and that many, but not all, of their trips occur by foot or by bike.186
3.3.1 Oberlin College The most frequent destination for Oberlin College students is, of course, the classroom and other College facilities. As noted earlier, the vast majority of trips to class occur by foot. A survey conducted by the Oberlin College Office of Sustainability finds that students that own a bike use it to get to class more frequently than any other need.187
3.3.2 Food Oberlin College provides dining meal plans for its students.188 Students also provide a core market for the fifteen restaurants in downtown.189 A travel survey conducted by the Transportation Working Group identified a handful of students that drive to IGA and Drugmart for groceries.190 The Oberlin College Office of Sustainability finds that an equal number of students travel to Drug Mart, IGA, and Wal-‐Mart to meet their needs.191
3.3.3 Shopping & Services In contrast to town residents, downtown Oberlin serves many if not all shopping needs for students at Oberlin. Oberlin College students are in many ways a captive market for local businesses, who stock their inventory accordingly. It has been estimated that Oberlin College students make one third of their yearly retail purchases in downtown.192 The single largest competitor for retail sales with downtown Oberlin is Crocker Park, which includes an Urban
193
3.4 Visitors to Oberlin Visitors to Oberlin form the third constituency for travel and transportation in Oberlin. While data exist for people who work in Oberlin but live in other locations in Lorain County, the travel behavior of visitors to downtown and special events is largely anecdotal. Nonetheless, there are very few options for people who travel to Oberlin for work or events. 186 Oberlin College Office of Sustainability. 187 Oberlin College Office of Sustainability. 188 Oberlin College, , , http://www.oberlin.edu/cds/mealplans/. 189 Geoffrey Comings and Gregory Tisher. 190 Oberlin Transportation Working Group, Transportation Survey of Oberlin Residents provided by Kristin Braziunas, April 19 2011. 191 Oberlin College Office of Sustainability. 192 Geoffrey Comings and Gregory Tisher. 193 Jason Adelman and Krista Long.
PDF compression, OCR, web optimization using a watermarked evaluation copy of CVISION PDFCompressor

OBERLIN TRANSPORTATION PROFILE CENTER FOR NEIGHBORHOOD TECHNOLOGY
51
3.4.1 Visitors that work in Oberlin Over the last decade, Lorain County and the whole of Northeast Ohio have witnessed a decline in blue collar jobs as domestic automobile manufacturing and steel production lagged.194 By
the county economy restructures. And as Map 13 shows, a significant number of people who work in and around Oberlin live elsewhere.
Map 13. Oberlin Workers Who Lived in Lorain County in 2008
Out of the 3,765 jobs located in and around Oberlin, only 1,043, or 28%, of the workers live in the city. Another 821 live in unincorporated Lorain County. And while 267 workers live in Lorain
194 The Cleveland-‐Plain Dealer, January 5, 2010.
PDF compression, OCR, web optimization using a watermarked evaluation copy of CVISION PDFCompressor

OBERLIN TRANSPORTATION PROFILE CENTER FOR NEIGHBORHOOD TECHNOLOGY
52
and 270 workers live in Elyria, they are not concentrated in any single neighborhood.195 The existing distribution of jobs and employees will make a fixed-‐route solution like transit service difficult to serve everybody even if LCT service were to be increased.
Due to limitations in the data, this analysis does not consider the Federal Aviation Administration facility on Lorain Street. That facility employs many out-‐of-‐town workers who use a combination of OH-‐511 and US-‐20 to access their shifts.196 Some workers at the FAA facility drive as long as thirty minutes or even two hours.197
In the past, Oberlin College has discussed creating more opportunities for College staff to live in town through an employer assisted housing program modeled after the Greater Circle Living Program in Cleveland. While the program was never implemented, it could also stimulate the market for some infill residential parcels around town.198
3.4.2 Visitors to Downtown Oberlin The businesses and restaurants of downtown Oberlin make it a unique destination in Lorain County. Downtown merchants estimate that almost half of their business comes from Cleveland or destinations that are even further away. Almost all of these visitors will choose to drive because no good alternatives exist from one point of Northeast Ohio to another. Although the Elyria-‐Kipton trail connects Oberlin with some other destinations in Lorain County, shoppers prefer to drive to carry things home.199
3.4.3 Visitors for Special Events Cultural events at the Oberlin College Conservatory, the Jazz Center, and other venues draw significant numbers of visitors from a large regional area. Downtown and College parking lots struggle to accommodate the vehicles from out-‐of-‐town visitors during these events.200
195 U.S. Census Bureau, Locational Employment Dynamics, 2008. 196 Oberlin Resident Focus Groups. 197 Gary Boyle and Eric Norenberg. 198 Gary Boyle and Eric Norenberg. 199 Jason Adelman and Krista Long. 200 Jason Adelman and Krista Long.
PDF compression, OCR, web optimization using a watermarked evaluation copy of CVISION PDFCompressor

OBERLIN TRANSPORTATION PROFILE CENTER FOR NEIGHBORHOOD TECHNOLOGY
53
4
4.1 Introduction Most of this transportation However, transportation planning decisions require a forward looking perspective as well. There are
years.
4.2 Transportation Trends Affecting Emissions Emissions reductions in Oberlin will be influenced by national, local, and regional trends in transportation energy intensity and travel demand. Overall, vehicles in the U.S. are slated to become more efficient in coming years, which Oberlin can benefit from, but this change is not going to be enough to overcome trends in VMT growth, which Oberlin will have to work to change.
4.2.1 National VMT Growth Nationally, vehicle miles traveled has been on the rise for decades, though with slight downticks in recent years due to the economic downturn and high gas prices. Growth in VMT is expected to continue through 2035 nationally, though at slower rates than in the past.201
opulation growth is just one cause of increasing VMT, and Oberlin will face many of the same VMT pressures as the rest of the country if it does not proactively counteract the trend.
4.2.2 Fuel Economy Improvements On the other hand, Oberlin will see the GHG benefit of federal regulations requiring increased fuel economy of light duty and heavy duty vehicles. 2016 model year vehicles are required to achieve 34.1 miles per gallon (mpg) on average by 2016, and rules are being set for even more stringent fuel economy and emissions rates beyond that year.202 It will take time for those new
-‐road fuel economy will lag the standards, but the trend is toward reducing emissions per VMT. The U.S. Department of Energy estimates that the average light-‐duty vehicle on the road in 2030 will get 28 miles per gallon (mpg), as compared to 22.6 mpg today.203,204 This could result in as
201 U.S. Department of Energy, Energy Information Administration, Annual Energy Outlook 2011, April 26, 2011, http://www.eia.gov/forecasts/aeo/pdf/0383(2011).pdf 202 U.S. Department of Transportation, National Highway Traffic Safety Administration, CAFE and GHG Emission Fact Sheet, April 1, 2010, http://www.nhtsa.gov/staticfiles/rulemaking/pdf/cafe/CAFE-‐GHG_Fact_Sheet.pdf 203 U.S. Department of Energy, Energy Information Administration, Annual Energy Outlook 2010, Report #:DOE/EIA-‐0383(2010), May 11, 2010, http://www.eia.doe.gov/oiaf/aeo/index.html
PDF compression, OCR, web optimization using a watermarked evaluation copy of CVISION PDFCompressor

OBERLIN TRANSPORTATION PROFILE CENTER FOR NEIGHBORHOOD TECHNOLOGY
54
much as a 35% drop in GHG emissions per passenger mile over that time. But nationally these expected improvements in vehicle efficiency are not large enough to overcome travel growth, so transportation emissions are expected to continue to rise.205
4.2.3 National Emissions Growth While Oberlin has created strong GHG reduction targets, this local action is taking place in the context of a national trend of emissions growth. Emissions in the U.S. have grown 0.4% per year since 1990 on average. The growth rate was even stronger before the economic downturn, and can be expected to increase as the economy improves, barring other major interventions. This emissions growth is correlated with fossil fuel consumption, which has also been on the rise. 206
4.2.4 Transit Ridership Struggles The loss of most public transit service in Oberlin in recent years means that transit ridership has dropped. While data do not exist as to how many former LCT customers are now using private vehicles for their trips, it can be presumed that some shift to private vehicle travel has occurred to fill the mobility gap created by the loss of LCT buses. Returning transit ridership to the levels of just a few years ago will take a major initiative to restore service.
4.3 The People of Oberlin Any transportation plan needs to address the travel needs of the people in the community.
that bring both high expectations for sustainable outcomes and great enthusiasm for, and expertise in, new and innovative transportation options.
4.3.1 Aging Population The U.S. population is aging, and as the number of senior citizens increases around the country, including in Oberlin, transportation needs will change. Older residents may face mobility challenges, may no longer be able to drive, and have different travel patterns than students and workers.
4.3.2 Enthusiasm and Experience
expected to continue to grow, which is a major asset to any sustainability plan. Carbon neutrality is a big deal for Oberlin residents, so they would be likely to support town transportation policies aimed at combating climate change. Most residents will buy into town 204 U.S. Department of Transportation, Federal Highway Administration, Highway Statistics 2008.Table VM-‐1, December 2009, http://www.fhwa.dot.gov/policyinformation/statistics/2008/vm1.cfm 205 U.S. DOE, EIA, Annual Energy Outlook 2011. 206 U.S. Environmental Protection Agency, Inventory of U.S. Greenhouse Gas Emissions and Sinks: 1990 2009, April 15, 2011.
PDF compression, OCR, web optimization using a watermarked evaluation copy of CVISION PDFCompressor

OBERLIN TRANSPORTATION PROFILE CENTER FOR NEIGHBORHOOD TECHNOLOGY
55
investments that produce energy efficiency without affecting day-‐to-‐day consumer behavior, such as hybrid vehicles, compact bulbs, and weatherization of older homes. However, residents are more hesitant to change their consumer behavior, especially concerning car ownership.207
4.3.3 Activism around Local Food One of the challenges for reducing the energy use of goods movement in Oberlin is that little is produced in town, so residents and businesses are reliant on truck deliveries. However, there is significant interest by students, residents, and businesses for a food access solution that increases the number of items produced at local farms. Oberlin College launched a Farm to Fork program and partners with 23 local farms to provide local produce, meat, honey, and other items in campus dining halls.208 The popularity of entrees with seasonal mushrooms at the Feve implies that downtown patrons would support dishes made from local ingredients.209
Joe Waltzer, a former student of Oberlin College, has proposed an organic food store that southeast quadrant. It would include a
retail component for residents of the town as well as a bulk sales, processing, and distribution facility for the regional customers.210 Students would be likely to support it, but it is unclear whether they represent a large enough customer base.211 The focus group of seniors also supported the idea of this store.212
Similarly, stakeholders interviewed for this project expressed an interest in food delivery solutions. Not every downtown restaurant offers delivery service due to the overhead costs and each business uses its own vehicle to make trips.213
4.4 Local and Regional Plans There are a number of local and regional projects underway which will impact transportation in Oberlin. From downtown Oberlin redevelopment to regional sustainability and transit planning, there are important efforts happening in and around the community that a sustainable transportation plan should seek to leverage.
4.4.1 City Climate Action Plan The City of Oberlin is developing a climate action plan to help it meet its GHG reduction targets. As members of ICLEI-‐Local Governments for Sustainability, the plan is the next step in a 5-‐
207 Bryan Burgess and Ken Sloane. 208 Oberlin College, Local Foods Accessed May 2011, http://www.oberlin.edu/cds/social/vendors.html. 209 Jason Adelman and Krista Long. 210 David Orr, interviewed by Kyle Smith, May 16 2011. 211 Colin Koffel, Rob Lamppa, and Madeline Marvar. 212 Oberlin Resident Focus Groups. 213 Jason Adelman and Krista Long.
PDF compression, OCR, web optimization using a watermarked evaluation copy of CVISION PDFCompressor

OBERLIN TRANSPORTATION PROFILE CENTER FOR NEIGHBORHOOD TECHNOLOGY
56
milestone process of climate action which started with the GHG inventory and will include implementation of GHG reduction measures and ongoing measurement and tracking. The transportation elements of the climate action plan are still in development, but the sustainable transportation plan will both be informed by, and seek to build on, the climate action plan as it is finalized.
4.4.2 Oberlin 2025 Strategic Plan Oberlin is currently undertaking a strategic planning process with visioning and goals for Oberlin in 2025. The Public Services Institute of Lorain County Community College and Management Assistance for Nonprofit Agencies of Kendal are assisting the city with this process. Public
hosted ad locations around town.214
4.4.3 Oberlin Project The Oberlin Project is a collaborative venture between the College, City, School District and private sector with support from the Clinton Climate Initiative. It has three components. A block of Main Street fronting Tappan Square will be redeveloped into a Green Arts District that includes improvements to the Allen Memorial Art Museum and Hall Auditorium as well as a new four star hotel, student housing, retail space, a conference center, and an ecological design center. The city and College will work together to achieve carbon neutrality through alternative energy needs. Finally, public partners will acquire 35 surrounding farms, resuscitate them back into productive re-‐use, and establish a greenbelt around Oberlin for forestry, biofuels, agriculture, and carbon sequestration.215
Transportation planning did not play a major role in the Oberlin Project, although parking policies for the new Green Arts District have been discussed.216 However, several components of the Oberlin project do address transportation challenges and needs addressed elsewhere in this document. Additional amenities and retail space in the Green Arts District would augment a
residential population and could support more businesses, although that could also make downtown more of a destination for drivers too. The Greenbelt around Oberlin could supply some food and wood products that currently arrive into town by tractor trailer.217
214 City of Oberlin, ommunity Conversation Guide Winter 2011, http://www.cityofoberlin.com/files/city%20manager/city_of_oberlin_conversation_guide.pdf. 215 David Orr, Oberlin Project: A Clinton Climate Initiative Climate Positive Project May 2010. 216 David Orr. 217 Jason Adelman and Krista Long.
PDF compression, OCR, web optimization using a watermarked evaluation copy of CVISION PDFCompressor

OBERLIN TRANSPORTATION PROFILE CENTER FOR NEIGHBORHOOD TECHNOLOGY
57
4.4.4 NOACA Sustainable Communities Grant Although the Northeast corner of Ohio has evolved into a sixteen county megaregion anchored by Cleveland, Akron, Youngstown, Canton, and surrounding cities and suburbs, they have not coordinated well on transportation and land use planning. Four Metropolitan Planning Organizations (MPO) plan for federal transportation investments independently and many of them use incompatible forecasting models. This lack of coordinated planning has helped spur a
especially for a town the size of Oberlin.218
In October 2010, the U.S. Department of Housing and Urban Development awarded a $4.25 million Sustainable Communities grant to a consortium of 21 metropolitan planning organizations, county and municipal governments, housing authorities, and non-‐profit advocates. Five outcomes of the grant align with the transportation challenges facing Oberlin:219
1. Creation of regional transportation, housing, water & air quality plans that are deeply aligned with and tied to local comp land use & capital investment plans
2. Reduced social and economic disparities for low-‐income, minority communities, and other disadvantaged populations in the target region.
3. Decrease in per capita VMT and per-‐capita emissions for the region. 4. Decrease in housing and transportation costs per household. 5. An increased proportion of low and very low households within a thirty minute transit
commute of employment centers. The grant will regularly convene conversations between regional stakeholders about land use, housing, transit, and service delivery. Some communities will discuss the concepts of sustainability and coordinated investments for the first time. A highly engaged community like
communities in Northeast Ohio will.220
The Sustainable Communities grant will also track best practices across all 16 counties to facilitate widespread adoption. Both the Oberlin Project and the energy-‐efficiency plans produced as a part of the Department of Energy grant aim to develop a replicable model for smaller communities,221 and the Sustainable Communities grant could a vehicle for spreading this model across Lorain County and Northeast Ohio.222
218 Hunter Morrison. 219 Northeast Ohio Areawide Coordinating Agency, Regional Planning Grant Application to U.S. Department of Housing and Urban Development, August 23 2010. 220 Hunter Morrison. 221 David Orr. 222 Hunter Morrison.
PDF compression, OCR, web optimization using a watermarked evaluation copy of CVISION PDFCompressor

OBERLIN TRANSPORTATION PROFILE CENTER FOR NEIGHBORHOOD TECHNOLOGY
58
4.4.5 Westshore Corridor Transportation Project A consortium of transit providers and MPOs are overseeing an alternatives analysis for a regional transportation service that would connect the downtowns of Cleveland and Sandusky through the city of Lorain. Lorain County is the only county that borders Cuyahoga County but lacks an express connection to downtown Cleveland.223 Three express bus corridors, one rail corridor, and a no-‐build scenario are currently under consideration in the study. The rail corridor would utilize a lightly trafficked Norfolk Southern freight line with a station in downtown Lorain at Black River landing.224
The service is unlikely to be an attractive alternative for Oberlin residents. Without regular LCT bus service, residents will still need to drive 23 minutes and almost 13 miles to reach it.225 While the Brookpark Park-‐and-‐Ride station for the RTA Red Line is 23 miles from Oberlin, the drive takes an equivalent amount of time. The Rapid already provides more frequent service and serves some additional destinations like West Side Market and University Circle.
4.4.6 Passenger Rail Service Students and the College have shown support for passenger rail, but state investment will be needed for it to be a better transportation option. In 2004 the Ohio Rail Development Corporation released the Ohio & Lake Erie Regional Rail Ohio Hub Study, which envisioned connections to every major Ohio city as well as Detroit, Toronto, Buffalo, and Pittsburgh through a passenger rail hub in Cleveland.226 In 2010, the Federal Rail Administration awarded
rvice between Cleveland, Columbus and Cincinnati.227 The service would have stopped at Puritas Avenue, about 26 miles from Oberlin. It would have operated at a conventional 79 MPH speed and advocates believed it would build a ridership base and political constituency for additional improvements. The Oberlin College Student Senate passed a referendum in support of the 3C service.228
The federal grant became a political issue in the race for Governor in 2010. argued that the service was too slow, that Ohioans would not ride it, and that the
229 The politicization of the issue demonstrated that passenger rail service struggles to find a constituency in Ohio, in part
223 Richard Enty. 224 Parsons Brinkerhoff, Westshore Corridor Transportation Project: Alternatives Analysis Study, April 2011. 225 Google Maps. 226 Transportation Economics and Management Systems, Inc., Ohio Hub 2004 Full Draft Technical Memorandum and Business Plan, October 2004. 227 Mark Dodosh, Business, January 28, 2010. 228 Colin Koffel, Rob Lamppa, and Madeline Marvar. 229 2010.
PDF compression, OCR, web optimization using a watermarked evaluation copy of CVISION PDFCompressor

OBERLIN TRANSPORTATION PROFILE CENTER FOR NEIGHBORHOOD TECHNOLOGY
59
because decades of declining service has left residents unfamiliar with its benefits. But, unless the state becomes an active partner again in planning and financing new passenger rail improvements, the level of Amtrak service in Lorain County is unlikely to change.
Nonetheless, three members of Congress recently met with the U.S. Department of Transportation and Amtrak to discuss improvements that would reduce delays to existing services through station re-‐design.230 Sometime in 2011, Amtrak will also offer a direct ride between Philadelphia and Elyria by picking up two passenger cars from the Pennsylvanian to the Capitol Limited.231 While these improvements are expected to increase ridership, they will not change the number of trains or times or arrival in Elyria.
4.5 Finances A sustainable transportation plan must take into consideration the financial issues that are affecting a community and its residents and businesses. In Oberlin this has been particularly important as financial constraints have led to major cuts in transit services. Even as the national economy enters a period of recovery form the recent downturn, cities like Oberlin face financial challenges that will affect the feasibility of investment in transportation alternatives.
4.5.1 City of Oberlin Fiscal Outlook The City of Oberlin faces a significant budget shortfall in 2012 that will make implementing new transportation solutions a challenge. Residents in Oberlin have been willing to raise local taxes in exchange for increased services, but the municipal income tax now meets the 2% maximum allowed by state law. The City also increased the registration fee for vehicles to the maximum level mandated by state law. Future increases in taxes and fees would be applied to meet general obligations, although special assessments may be allocated for specific projects.232
Developments at the state and federal level further threaten the stability of the city budget. Revenues from the state estate tax currently allocate at least $250,000 to the city each year, but the General Assembly has proposed legislation that would eliminate the tax and end these distributions.233 The General Assembly also recently reduced the local government fund by 25%
ng budget. The recession has reduced the returns on local bond investments. These reductions will represent an aggregate loss of one million dollars of revenue in 2012.234
230 All Aboard Ohio, Passenger Rail News, Issue 175, Spring 2011. 231 Amtrak, PIIRA Section 210 Report: Capitol Limited Performance Improvement Plan, September 2010. 232 Bryan Burgess and Ken Sloane. 233 Gary Boyle and Eric Norenberg. 234 Bryan Burgess and Ken Sloane.
PDF compression, OCR, web optimization using a watermarked evaluation copy of CVISION PDFCompressor

OBERLIN TRANSPORTATION PROFILE CENTER FOR NEIGHBORHOOD TECHNOLOGY
60
The fiscal situation threatens several transportation programs and improvements, most notably the Oberlin Circulator. The City Council has not yet prioritized its cuts, but there is a chance that it will tap its capital improvement fund and begin deferring maintenance on sidewalks and roads if the shortfall cannot be met elsewhere.235
4.5.2 Lack of Dedicated Funding for LCT LCT is the only transit agency in Ohio that lacks a dedicated revenue source.236 Voters in Lorain County have consistently opposed a dedicated revenue mechanism for LCT and this held true during a sales tax levy in 2010. Urban areas in Lorain County have been too fragmented to overcome opposition from voters in predominantly rural areas to the south.237
The lack of local support for transit is compounded by scant investment by the state. The state Motor Fuel Tax is restricted to highway funding.238 Because no dedicated revenue stream for transit exists, it competes with other services like education and health care. Since his inauguration in January, Governor Kasich has rescinded prior awards for transit services and does not support increased state investment.239
option for robust transit service may be the consolidation of regional transit services under the RTA. Such a consolidation would create a better economy of scale for operations and capital purchases, allow for more convenient bus trips that do not stop at county lines, and create the capacity to plan specifications for vehicles that run on clean burning fuels and natural gas. However, stakeholders and voters still have a negative memory of the consolidation of smaller systems into the RTA over the last thirty years. Lorain County leaders would want assurances of local control and RTA faced its own funding crisis in 2010.240
While regional t level of engagement about transit issues that could be utilized to advocate for greater transit funding or consolidation in the future. Participants at both CNT focus groups energetically communicated about their transportation needs and a Transportation Working Group meets regularly. There is a belief that with persistent advocacy about the economic development benefits of transit a new sales tax levy could pass countywide.241
235 Gary Boyle and Eric Norenberg. 236 Gary Boyle and Eric Norenberg. 237 Richard Enty. 238 Greater Ohio Policy Center, Presented in Columbus, OH, January 27 2010. 239 Angie Schmitt, , DCStreetsBlog, April 15 2011. http://dc.streetsblog.org/2011/04/15/john-‐kasichs-‐sad-‐war-‐on-‐transit-‐and-‐cities/ 240 Richard Enty. 241 Gary Boyle and Eric Norenberg.
PDF compression, OCR, web optimization using a watermarked evaluation copy of CVISION PDFCompressor

OBERLIN TRANSPORTATION PROFILE CENTER FOR NEIGHBORHOOD TECHNOLOGY
61
5 Conclusion
5.1 Next Steps: Solutions As this transportation profile has shown, Oberlin has a unique set of assets and challenges as it works to meet its ambitious GHG reduction goals. Reducing the climate change impact of transportation in Oberlin will require a multi-‐pronged approach decarbonizing fuel sources, improving the efficiency of vehicles, reducing travel demand, and providing alternatives to personal vehicle trips.
The next step in this project is to create a portfolio of transportation solutions for Oberlin that address all of those approaches. GHG reduction solutions will be prioritized to ensure that the transportation plan is feasible and meets the needs of the community, including supporting
Once a set of high-‐priority transportation solutions has been selected, each will be analyzed for its GHG emissions and energy use reduction potential for Oberlin. CNT will assess the policy, regulatory, and financial barriers to the implementation of the priority transportation options and offer potential solutions to overcoming those barriers. The result will be a plan that serves
PDF compression, OCR, web optimization using a watermarked evaluation copy of CVISION PDFCompressor