oberlin climate action plan - city of oberlin change and forge a better tomorrow for oberlin and the...
TRANSCRIPT

1
Oberlin Climate Action Plan

2

3
4 Oberlin’s Vision
5 A Message from Council President
Ron Rimbert and City Manager
Eric Norenberg
6 Introduction
7 Oberlin Community and Leadership
9 About This Report
10 Oberlin’s Emissions Inventory
11 Vision, Goals and Strategic Direction
14 Renewable Energy
19 Energy Efficiency
22 Transportation
26 Green Building
30 Waste Management
30 Solid Waste
32 Wastewater
34 Education and Awareness
37 Oberlin College
38 Achieving Climate Positive
39 Climate Positive Credits
40 Land Use and Local Food Systems
41 Financing
42 Policy
43 Measurement and Verification
44 Conclusion
45 Looking Ahead: Adaptation and
Resilience
46 Table of Greenhouse Gas Reductions
49 Abbreviations
50 Acknowledgements
51 Appendices
82 References
Contents
4
With a rich history of social and civil rights leadership beginning
with its founding, the Oberlin commu-nity’s identity as a leader has emerged again in the context of another gen-eration-defining challenge: climate change. The City of Oberlin is com-mitted to reducing community-wide greenhouse gas emissions below zero, while striving to balance the environ-mental, social, and economic interests of the Oberlin community.
With the adoption of a Sustainability Resolution by City Council in 2001, the City committed to uphold sustain-ability principles in carrying out their duties. In 2006, Oberlin College signed the American College and University Presidents’ Climate Commitment, committing the College to become climate neutral by 2025. In 2007, the City became one of the first Ohio mem-bers of an international organization known as ICLEI–Local Governments for Sustainability, initiating a greenhouse gas inventory and developing a local climate action plan.
In 2010, the City and the College each signed an agreement with the Clinton Foundation and the United States Green Building Council to participate in the Climate Positive Development Program. Oberlin will become a community that will not just
neutralize its emissions but improve the environment by offsetting emis-sions. This goal of “reducing the City of Oberlin’s GHG (greenhouse gas) emissions below zero through the implementation of economically viable innovations” committed the City and the College to becoming a climate posi-tive community.
In accordance with membership in ICLEI and the Climate Positive Development Program agreement, the City developed and adopted a Climate Action Plan in 2011. The 2011 plan set systematic goals of reducing 2007 GHG inventory emissions by 50% in 2015, 75% by 2030 and below 100% by 2050.
The Climate Action Committee, a community-based group created by City Council, developed this 2013 Climate Action Plan as a roadmap for transi-tioning to a climate positive commu-nity. Work by the City and the College through the use of the recommended strategies and community outreach will create not only a climate positive com-munity but also a community in which its residents live, learn, and lead.
This document serves as the 2013 Climate Action Plan for the City of Oberlin. For further information includ-ing background information, reports and more details of the strategies visit www.cityofoberlin.com.
Oberlin's Vision
Oberlin Climate Action Plan • Oberlin's Vision
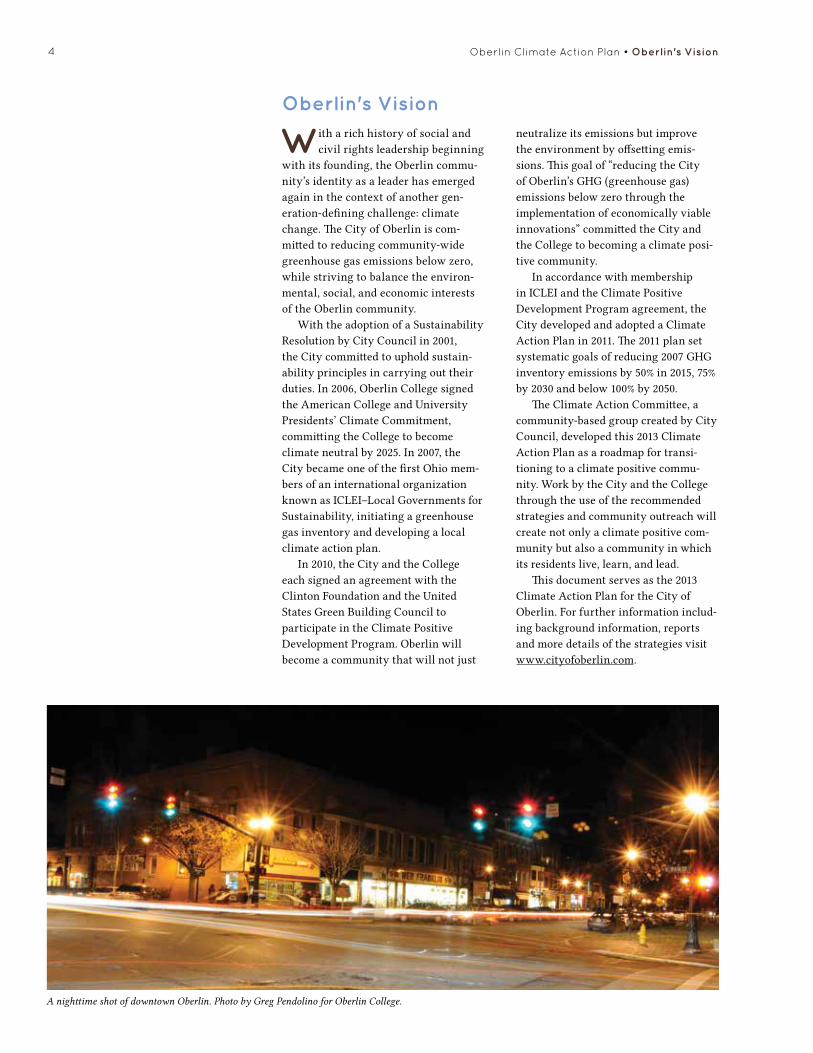
A nighttime shot of downtown Oberlin. Photo by Greg Pendolino for Oberlin College.
5
Dear Oberlinians:We are pleased to present the City of Oberlin’s 2013 Climate Action Plan which
describes how the City and its residents can work together to address the challenges of climate change and forge a better tomorrow for Oberlin and the nation.
Oberlin has always been at the forefront of important issues of the day. The chal-lenge of climate change is no different. We are proud of the leadership role Oberlin has played in our country since its founding in 1833. Now, we are in the vanguard demon-strating that environmental sustainability will not only foster a healthy environment, but also result in a prosperous community.
This plan demonstrates municipal government’s commitment to addressing climate change and calls on all residents and businesses to be partners in this effort. Each of us can help by driving less and walking more, by weatherizing and increasing efficiency of homes and businesses, and by decreasing our use of fossil fuels. Cooperation among the City and community-based partners can help make such efforts easier as well as affordable.
We are grateful for the work of the Climate Action Committee, City staff and the Oberlin Project for helping to provide leadership and guidance in developing the 2013 Climate Action Plan. For it is only through collaboration, teamwork and the combined efforts of our entire community that we can achieve our goal of a climate positive com-munity by 2050.
With your participation we can together address the challenge of climate change and in the process provide leadership for other communities and the nation as Oberlin has done before.
Sincerely,
Ronnie Rimbert Eric NorenbergCity Council President City Manager
A Message from Council President Ron Rimbert and City Manager Eric Norenberg
A Message • Oberlin Climate Action Plan
Cover photos, from top left to bottom right: Sunset over Oberlin's Main Street, photo by Greg Pendolino; Family Fun Day, photo by John Seyfried; Solar panel rendition, photo by Rob Lamppa; the Bertram and Judith Kohl Building, photo by Kevin Reeves; OMLPS replacing traffic lights with LED bulbs; downtown Oberlin, photo by Yvonne Gay Fowler; West College Street shops, photo by Laura Blake.
Table of Contents photo: aerial photo of Oberlin's downtown by John Petersen for Oberlin College.
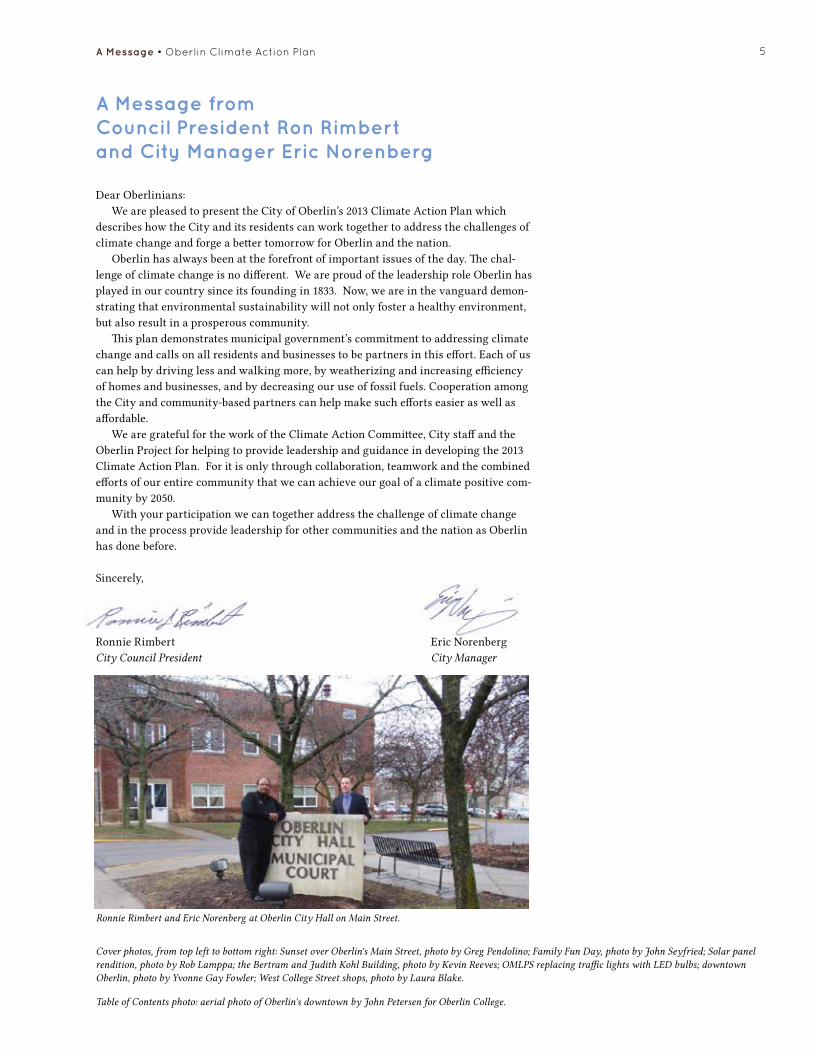
Ronnie Rimbert and Eric Norenberg at Oberlin City Hall on Main Street.

6
Oberlin's Past Commitments to Sustainability
2001: The City adopted a Sustainability Resolution (Resolution No. R01-08 CMS) embracing the 1987 United Nations Commission on Environment and Development definition of sustainabil-ity: Policies, decisions, and actions will meet “current needs without compro-mising the ability of future generations to meet their needs.”
2004: The College created a comprehen-sive Environmental Policy establishing its
special obligation as an institution of high-er learning to educate its students, man-age its internal affairs, and interact with
the broader community in ways consistent with the best environmental practices.
2004: The City embraced sustain-ability as a central theme in its 2004 Comprehensive Plan
2005: The Board of Trustees of Oberlin College unanimously adopted “Move toward Environmental Sustainability” as one of the College’s strategic directions in its Strategic Plan.
2006: The College signed the American College and University Presidents' Climate Commitment
(ACUPCC) committing the college to become cli-mate neutral with the current target date of 2025.
2007: The City joined ICLEI-Local Governments for Sustainability, committing the City to address
climate change.
Oberlin Climate Action Plan • Introduction
A scene of Oberlin's Main Street. Photo by Matthew Lester for Oberlin College.

7
Oberlin Community and LeadershipOberlin has demonstrated its capacity for leadership in social justice from its inception with the high standards of John Shipherd and Philo Stewart, who together founded Oberlin in 1833—Shipherd, the town; Stewart, the school. Oberlin’s central role in civil rights is the foremost historical example of its social courage and vision. Oberlin College at its founding “embraced the joint education of the sexes” which led in 1841 to the first bachelor’s degrees in the nation awarded to women. Furthermore, in 1835, the College became the first institution of higher learning in the United States to accept students regardless of race.
Oberlin has also been credited with being the spark that ignited the Civil War.1 In 1858, a group of Oberlin citizens traveled to neighbor-ing Wellington and freed John Price, an escaped slave, in defiance of the Fugitive Slave Law. Their prosecution in the federal court in Cleveland brought widespread attention to the injustices of slavery. The 20th century saw Oberlin continue its leadership in civil rights through actions to end segregation and discrimination based on race, gender, and sexual orientation.
Prophetically, soon after Oberlin’s
founding, Shipherd observed, “Oberlin is peculiar in that which is good.”
Climate Change and Commitments to SustainabilityOberlin has again emerged at the begin-ning of the 21st century as a leader in another generation-defining challenge: climate change (See Sidebar: Climate Change). Accepting the scientific con-sensus that climate change is here, the City of Oberlin and the College have made significant progress and new commitments to address climate change consistent with their history of coura-geous and morally sensitive leadership.
City GovernanceOberlin has a council-manager form of government. A seven-member City Council is elected at large every two years, and the City Council appoints the City Manager. The part-time Council members do not have physical offic-es but rather interact with citizens through personal contact. The City Manager is responsible for the daily operation of City departments and coordination of department heads and City staff. The City Manager, Finance Director, Law Director, and Council Clerk report directly to City Council and provide independent management, operational supervision, and expert
Introduction
2008: The City continued efforts to reduce the carbon intensive sources in its electricity portfolio by withdrawing from participation in a 50-year contract to purchase power from a proposed coal-fired power plant.
2009: The City hired the energy consulting firm Black & Veatch to investigate viable low-car-
bon energy sources to replace the City’s traditional fossil-fu-el-based electricity portfolio.
2010: The City and College both joined the Clinton Foundation’s Climate Positive Development Program (CPDP) thereby com-
mitting each to become climate positive by reducing communi-ty-wide greenhouse gas (GHG) emissions below zero.
2011: The City completed its 2025 Strategic Plan in which environmental and economic sustainability were two
of its top strategic priorities.
2011: The City completed the first version of its Climate Action Plan (the 2011 CAP)
that commits the City to reducing its GHG emissions below 2007 emission levels 50%
by 2015, 75% by 2030, and 100% by 2050.
Introduction • Oberlin Climate Action Plan
Sustainability: Policies, decisions, and actions that meet current needs without compromising the ability of future generations to meet their needs.
define it:
How to read this document: there are links within this document, noted by an underline, included to provide you with additional information. Also, throughout the document there will be helpful definitions in this sidebar.
8
advice. More than 20 boards and com-missions composed of Oberlin resi-dents are appointed by City Council to provide advice and recommendations to city officials and City Council concern-ing various matters including planning, development, utility infrastructure, and quality of life issues.
City UtilitiesThe City’s Public Works Department has six divisions: Engineering, Administration, General Maintenance, Building and Grounds, Water, and Wastewater. Public Works operates the City’s refuse and recycling col-lection program as a self-supporting Enterprise Fund. In addition to water and wastewater utilities, the City has a community-owned, not-for-profit electric utility, Oberlin Municipal Light and Power System (OMLPS). Created in 1934, OMLPS generates, purchas-es, transmits, and distributes electric power to more than three thousand residential and commercial customers. An Electric Director who reports to the City Manager oversees OMLPS.
Oberlin CollegeOberlin College is the largest employer in the City, and its student body com-prises approximately one third of the population of the city. Oberlin College uses about 25% of the city’s electricity and is responsible for about the same percentage of the city’s carbon emis-sions. A significant percentage of these emissions come from its coal-fired pow-er plant, which produces steam to heat College buildings. Sustainability plan-ning at the College is led by the Office of Environmental Sustainability (OES) and the Committee on Environmental Sustainability (CES), a committee of the General Faculty.
Since their beginning in 1833, Oberlin College and the City of Oberlin have nurtured and challenged each other to advance human well-being locally and beyond. Testimony to this relationship is provided above with the list of sustainability resolutions and commitments each has made in the past decade. By signing in 2010 individual memoranda of understanding with the CPDP to become climate positive,
the College and City created an even stronger interdependent relationship. At the signing ceremony, Bob Berkebile, an internationally renowned Kansas City architect speaking for the United States Green Building Council (USGBC), foreshadowed the future this way: “This alignment of common purpose, of hav-ing to work together, will change this community in ways unimaginable and for the better.”
The Oberlin ProjectThe Oberlin Project, a local collabora-tive venture that can trace its origins to 2007 and became a staffed operating initiative in 2011, provides an interface among the City, College, Oberlin City Schools, and the many institutions and groups within the Oberlin area, as well as its citizens. The Oberlin Project is the scaffolding in the Oberlin community to facilitate the development of full spec-trum sustainability (FSS) in which sus-tainability becomes the default setting for all policies, decisions, and actions. The Project serves as the catalyzing agent for many of the GHG reduction strategies and the sustainability work in and around the City and College, and serves as the lead contact and coordi-nator for the CPDP. Funded by grants and individual donors independent of both the City and College, the Oberlin Project staff has been tasked with assisting in moving forward the many parts that encompass FSS. In addition to bringing in resources for assisting with implementation of the CAP and the CPDP’s Climate Positive Credits, the Oberlin Project has tasked itself with facilitating a radical lowering of carbon emissions while building a stronger local economy, increasing local food supply and agriculture resources, and working to further FSS with all four local educational institutions: Oberlin City Schools, Oberlin College, Lorain County Joint Vocational School, and Lorain County Community College.
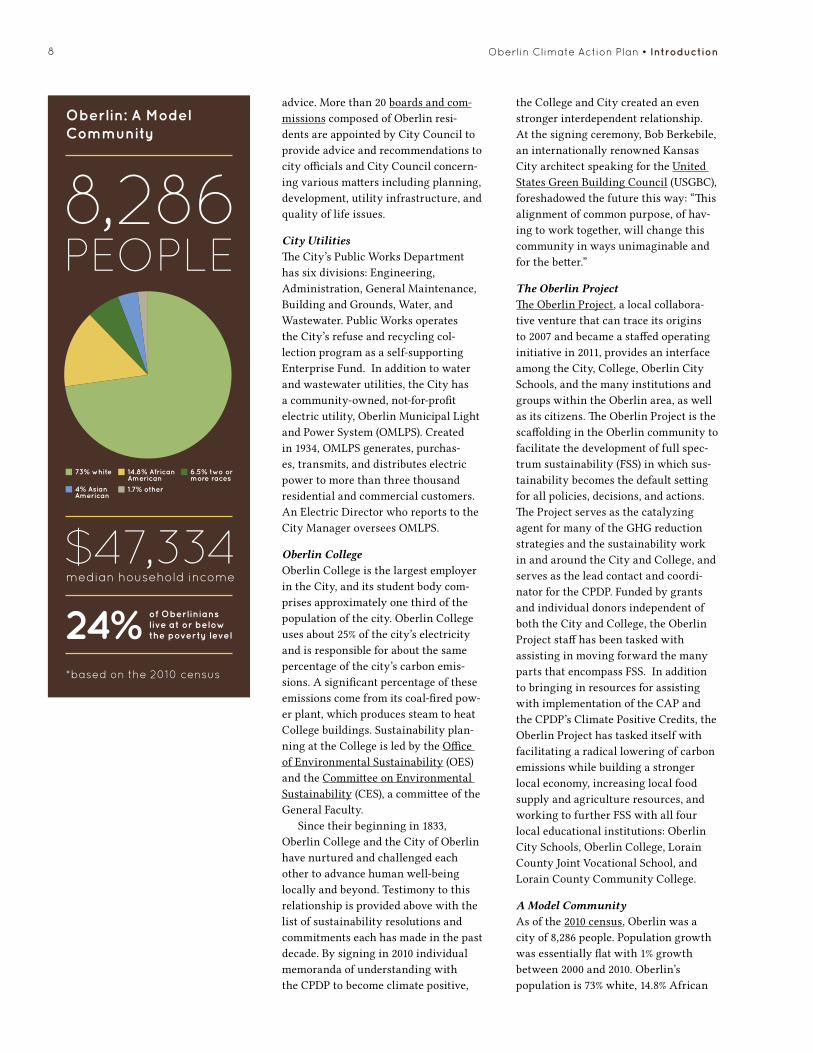
A Model CommunityAs of the 2010 census, Oberlin was a city of 8,286 people. Population growth was essentially flat with 1% growth between 2000 and 2010. Oberlin’s population is 73% white, 14.8% African
8,286 peOple
Oberlin: A Model Community
73% white 14.8% African American
6.5% two or more races
4% Asian American
1.7% other
$47,334median household income
24% of Oberlinians live at or below the poverty level
*based on the 2010 census
Oberlin Climate Action Plan • Introduction
9
American, 6.5% two or more races, and 4% Asian American.2 Oberlin also includes a broad range of socioeconomic backgrounds; the median household in-come is $47,334, and 24% of the individu-als in Oberlin live at or below the pover-ty level.3 This plan was created with the premise that Oberlin is a representative community within the United States, that it is large and diverse enough to serve as a proxy for larger cities, but small enough that the community as a whole is capable of addressing many of the major sources of emissions that contribute to global warming. Oberlin strives to serve as a model that can be learned from and replicated nationally and worldwide.
About This Report
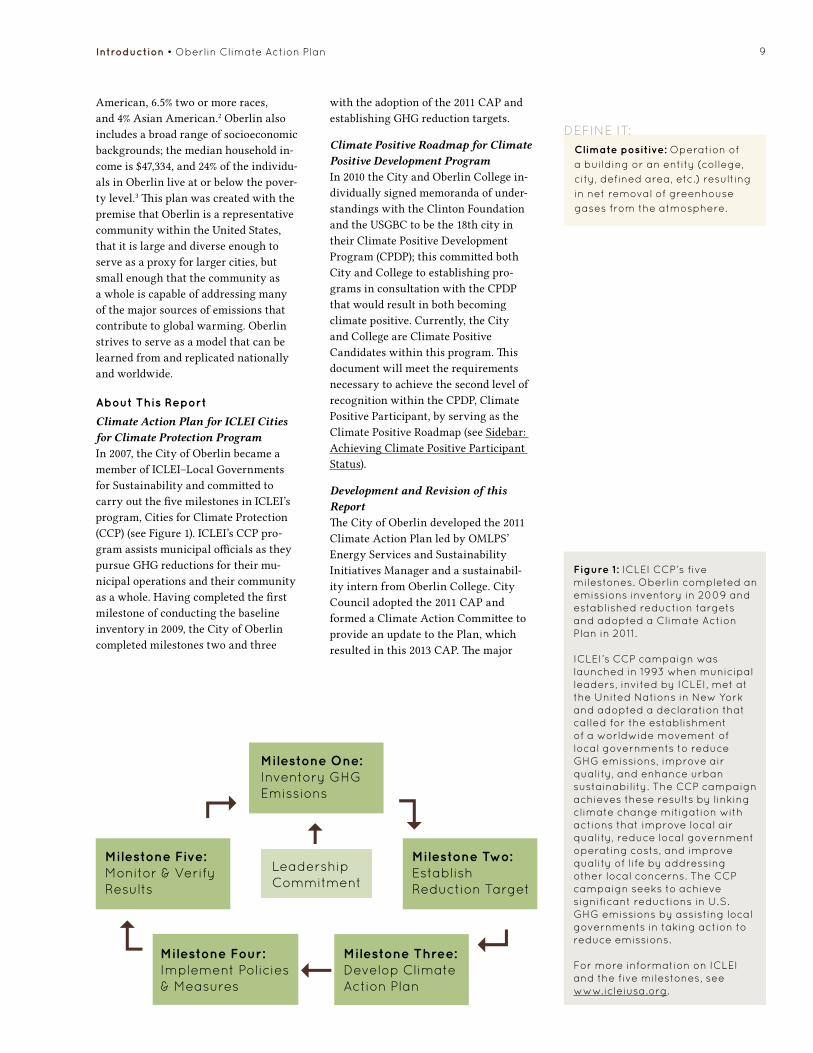
Climate Action Plan for ICLEI Cities for Climate Protection ProgramIn 2007, the City of Oberlin became a member of ICLEI–Local Governments for Sustainability and committed to carry out the five milestones in ICLEI’s program, Cities for Climate Protection (CCP) (see Figure 1). ICLEI’s CCP pro-gram assists municipal officials as they pursue GHG reductions for their mu-nicipal operations and their community as a whole. Having completed the first milestone of conducting the baseline inventory in 2009, the City of Oberlin completed milestones two and three
with the adoption of the 2011 CAP and establishing GHG reduction targets.
Climate Positive Roadmap for Climate Positive Development ProgramIn 2010 the City and Oberlin College in-dividually signed memoranda of under-standings with the Clinton Foundation and the USGBC to be the 18th city in their Climate Positive Development Program (CPDP); this committed both City and College to establishing pro-grams in consultation with the CPDP that would result in both becoming climate positive. Currently, the City and College are Climate Positive Candidates within this program. This document will meet the requirements necessary to achieve the second level of recognition within the CPDP, Climate Positive Participant, by serving as the Climate Positive Roadmap (see Sidebar: Achieving Climate Positive Participant Status).
Development and Revision of this Report The City of Oberlin developed the 2011 Climate Action Plan led by OMLPS’ Energy Services and Sustainability Initiatives Manager and a sustainabil-ity intern from Oberlin College. City Council adopted the 2011 CAP and formed a Climate Action Committee to provide an update to the Plan, which resulted in this 2013 CAP. The major
Milestone One:inventory GHG emissions
Milestone Two:establish Reduction target
Milestone Three:develop Climate Action Plan
Milestone Four:implement Policies & Measures
Milestone Five:Monitor & Verify Results
Leadership Commitment
Figure 1: iCLei CCP’s five milestones. Oberlin completed an emissions inventory in 2009 and established reduction targets and adopted a Climate Action Plan in 2011.
iCLei’s CCP campaign was launched in 1993 when municipal leaders, invited by iCLei, met at the United nations in new York and adopted a declaration that called for the establishment of a worldwide movement of local governments to reduce GHG emissions, improve air quality, and enhance urban sustainability. the CCP campaign achieves these results by linking climate change mitigation with actions that improve local air quality, reduce local government operating costs, and improve quality of life by addressing other local concerns. the CCP campaign seeks to achieve significant reductions in U.S. GHG emissions by assisting local governments in taking action to reduce emissions.
for more information on iCLei and the five milestones, see www.icleiusa.org.
Introduction • Oberlin Climate Action Plan
Climate positive: Operation of a building or an entity (college, city, defined area, etc.) resulting in net removal of greenhouse gases from the atmosphere.
define it:

10
changes in the 2013 CAP reflect the work of the Climate Action Committee and take into account the roles of Oberlin College, local non-profits, and others to identify further potential strategies to chart the path toward a climate positive community. The 2013 CAP includes both recommended strat-egies under and outside of the City’s di-rect control. See the Acknowledgements section of this report for more infor-mation on the participants involved in drafting the 2013 CAP.
Oberlin’s Emissions InventoryThe purpose of a baseline emissions inventory is to understand current pat-terns of GHG emissions, to prioritize strategies to reduce emissions, and to establish measurable reduction targets. Breaking out emissions by sector (e.g. commercial, residential) and energy use (e.g. heating, vehicle fuel, electric-ity) allows Oberlin to identify the best opportunities for significantly reduc-ing emissions. An inventory is also useful for comparing emissions with other communities and for tracking progress over time.
The City’s GHG inventory was conducted through a partnership of OMLPS, the City, and the College’s Environmental Studies Program. The
inventory was compiled and calculated using ICLEI’s Clean Air and Climate Protection (CACP) software. Both a municipal and community-wide inventory were completed for the years 2001 and 2007. For the purposes of setting Oberlin’s emissions reductions targets, 2007 was chosen as the baseline because of the availability of more complete data than 2001. The emissions inventory will be updated every five years, allowing Oberlin to track its progress toward emission reduction targets over time. See the Measurement and Verification section of this plan for detail and a discussion of GHG emis-sions protocol and software.
Community-wide Inventory ResultsThe community-wide inventory includ-ed GHG emitted within the municipal boundary of the City of Oberlin. Figure 2 outlines emissions sources included in the inventory. The inventory deter-mined that as a whole, the community emitted 174,391 tons of carbon dioxide equivalent (CO2e) in 2007. The com-munity’s per capita annual emissions (using population of 8,286) were 21.0 tons CO2e. According to the US Energy Information Administration, per capita energy-related CO2e emissions in the US were 19.8 tons per person in 2007.
Figure 2: Total Community-Wide EmissionsResidential, commercial (including College and municipal buildings), transportation, solid waste, and other were broad emissions sectors included in Oberlin’s community-wide inventory. Activities that produce emissions taken into account in this inventory are listed under each sector.
Residential
Commercial
transportation
Solid Waste
Other
Heating
electricity
electricity Generation
Combustion of automobile fuel inside city limits
Landfilled solid waste
Composted brush & leaves
fugitive Sf6 emissions
fugitive refrigerant emissions
On-site combustion of natural gas
Combustion of fossil fuels at electricity generating facilities outside city limits
On-site combustion of fossil fuels
Oberlin Climate Action Plan • Introduction
SECTOR SOURCE OF GHG EMISSIONS

11
Municipal Inventory ResultsAn inventory of emissions from munic-ipal operations was also completed for 2007 and is summarized in Appendix II.
Vision, Goals, and Strategic DirectionThe City of Oberlin is committed to reducing community-wide GHG emissions below zero, while striving to balance the environmental, social, and economic interests of the Oberlin community. The 2013 CAP serves as a roadmap for transitioning to a climate positive community by charting specific emissions reduction strategies and establishing a plan for measurement and verification of emissions reductions. This plan is a living document that will be reviewed on an ongoing basis and updated periodically. Annual updates on the progress of goals and strategies will be prepared for City Council.
Using 2007 as a baseline, the City of Oberlin has set goals of reducing GHG emissions at least 50% by 2015, at least 75% by 2030, and below zero by 2050. The City will strive to achieve measur-able GHG emissions reductions each year in order to ensure incremental progress toward reduction targets. To bring this into perspective it will be necessary to reduce emissions by at least 1.5% annually. Reductions will be
calculated every 5 years with an updat-ed GHG emissions inventory.
This document was created with some important guiding principles in mind. First, in order to achieve a climate positive outcome in an environmental-ly and economically responsible way, the City and community must strive to reduce its own emissions as much as possible across sectors and energy uses highlighted in the GHG emissions inventory. However, it will be necessary to offset remaining GHG emissions and reduce emissions below zero through the creation of Climate Positive credits, which can be generated by carbon se-questration projects (such as tree plant-ing) or extending emissions reductions to the surrounding community (such as through implementing large scale renewable energy infrastructure).
Second, the GHG emissions in-ventory highlights the sectors and energy uses that are responsible for the majority of emissions, allowing us to identify and pursue strategies that will achieve the greatest emissions reductions first. The 2007 inventory identified electricity as the largest con-tributor to community-wide emissions. The City has addressed these emissions through its locally owned electric util-ity, OMLPS, by entering into long-term contracts for landfill gas, hydro, and
Introduction • Oberlin Climate Action Plan
38% Commercial 66,080 CO
2e
22% College38,696 CO
2e
16% Residential27,671 CO
2e
15% Transportation26,330 CO
2e
7% Municipal11,400 CO
2e
1% Waste1,622 CO
2e
1% Other2,592 CO
2e
Figure 3. Percentage of CO2 tons emitted by sector in 2007. the commercial sector, including all businesses, Oberlin College properties, and municipal facilities within city limits, made up 67% of total community-wide emissions.

12
Climate Change
Life on earth is possible because earth’s warm surface temperature allows water to exist in liquid form. Earth has a warm temperature because our atmosphere
is composed of greenhouse gases (GHG) that act as a blanket; these GHG adsorb infrared radiation, meaning they trap heat and thereby warm the earth’s surface. Without GHG the earth’s temperature would be about 60º F cooler or -3º F. Water (H2O), carbon dioxide (CO2), methane (CH4), and chlorofluorocarbons are all greenhouse gases affecting climate change, but water and carbon dioxide have a greater influence than the others. Climate science has established a positive cor-relation between atmospheric CO2 concentration and surface temperature. That is, in the past when CO2 went up, temperature rose and when CO2 went down, temperature decreased. Simply put, carbon dioxide acts like a blanket that retains infrared radiation thereby making the planet warmer.
Over the past 65 million years earth’s average temperature ranged from 50º F to 81º F while over the past 10,000 years the range was 51º F to 58º F with pres-ent-day average temperature being 57º F. Over the last 10,000 years agriculture and civilization arose during a period of relatively stable temperatures to which we are acclimated. Over the last 100 years human activities have increased CO2 concen-tration from 310 parts per million (ppm) to 390 ppm, and the temperature has risen 1.4º F, with a 0.9 º F rise since 1980. Climate scientists predict that on our present course the temperature will increase from 4º F to 11º F over the next 100 years.4
Although the average temperature rise of 1.4º F appears to be small, we are seeing its effects. Spring comes a week or two earlier while fall is a week or two later and the ranges of many northern hemisphere species are moving north and to higher altitudes.5 The result is the unraveling of ecosystems and life support. Glaciers are melting almost everywhere. Greenland glaciers lost 36 to 60 cubic miles annually between 2002 and 2006 while Antarctica glaciers lost 36 cubic miles between 2002 and 2005, causing sea level rise and threatening low land pop-ulations.6 Oceans are more acidic from CO2 adsorption causing coral reefs to die.
The hottest 10 years based on actual recorded temperatures have occurred since 1997.7 Extreme weather events are increasing: intense rainfalls, extremely high temperatures, droughts, tornados, and class 4 and 5 hurricanes. If the climate were stable, then record-setting low and high temperatures would be about equal. This was the case before 1980, but since then high records have occurred twice as often as low records. The climate dice are now set for extremes that will become the new norms if we persist in pumping heat trapping GHGs into the atmosphere. The thicker we make the heat-trapping blanket, the warmer the planet.
See CLiMAte CHAnGe APPendix i fOR MORe infORMAtiOn.
SUN
Solar radiation passes through the clear atmosphere.
Most radiation is absorbed by the Earth’s surface and warms it.
Some solar radiation is reflected by the Earth and the atmosphere.
Some of the infrared radiation passes through the atmosphere, and some is absorbed and re-emitted in all directions by greenhouse gas molecules. The effect of this is to warm the Earth’s surface and the lower atmosphere.
Infrared radiation is emitted from the Earth’s surface.
Oberlin Climate Action Plan • Introduction
solar power supply. See the Renewable Energy Section for more information on these renewable/carbon neutral resources, which will provide Oberlin with 90% renewable/carbon-neutral electricity in 2015.
This plan outlines the GHG emis-sions reductions needed to achieve our goal of becoming climate positive. However, it does not chart how we will achieve the reduction goals while balancing, and indeed improving, the environmental, social, and economic interests of the Oberlin community. With concern for achieving economic resilience and social and environmen-tal justice, we will need to measure success using social, physical, and economic indicators of sustainabili-ty. These metrics and financial tools, which speak to economic and social as-pects, are currently being developed in partnership with The Oberlin Project and Oberlin College.
Reader’s Guide The remainder of the plan is organized into six main sections addressing GHG emission reduction strategies. We have ordered the sections from greatest to least percentage of GHG emissions based on the 2007 inventory and presented relevant material in each section with an associated appendix of more detailed information and data. Each section includes potential strategies that are recommended for consideration and/or implementation by the City and partner organizations within the next five years.
13
Achieving Climate Positive Participant Status
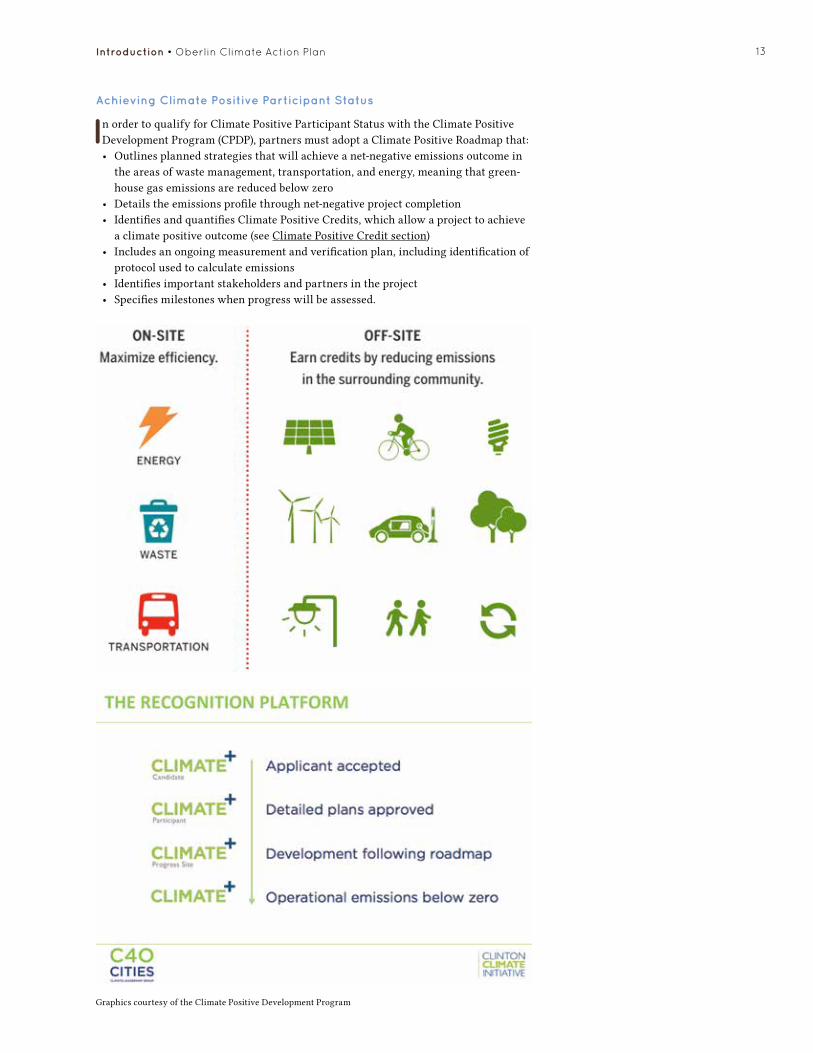
In order to qualify for Climate Positive Participant Status with the Climate Positive Development Program (CPDP), partners must adopt a Climate Positive Roadmap that: • Outlines planned strategies that will achieve a net-negative emissions outcome in
the areas of waste management, transportation, and energy, meaning that green-house gas emissions are reduced below zero
• Details the emissions profile through net-negative project completion• Identifies and quantifies Climate Positive Credits, which allow a project to achieve
a climate positive outcome (see Climate Positive Credit section)• Includes an ongoing measurement and verification plan, including identification of
protocol used to calculate emissions• Identifies important stakeholders and partners in the project• Specifies milestones when progress will be assessed.
Introduction • Oberlin Climate Action Plan
Graphics courtesy of the Climate Positive Development Program

14 Oberlin Climate Action Plan • Renewable Energy
IntroductionEnergy accounts for about two-thirds of global GHG emissions and includes en-ergy used for electricity, space heating, and transportation. Drastically reduc-ing emissions requires steep reductions
Renewable Energy
in the use of carbon-intensive fossil fuels. The carbon intensity of Oberlin’s energy portfolio can be reduced by replacing fossil fuels with renewable en-ergy sources such as photovoltaic sys-tems, low-carbon energy sources such
10.4% coal
1% natural gas
23.1% hydro
59% land�ll gas
2% nuclear
4.5% wind
Figure 4: Oberlin Fuel Resources for 2007. 2007 chart does not reflect associated environment attributes sold by City.
74% coal
11% hydro
4% land�ll gas
3.7% natural gas
7% nuclear
0.3% wind
Rendition of the 2.27 MW solar array constructed on Oberlin College property in 2012. Photo by Rob Lamppa for Oberlin College.
Figure 5: Oberlin Fuel Resources for 2015. 2015 chart reflects associated environmental attributes retained by City.

15Renewable Energy • Oberlin Climate Action Plan
About Renewable Energy
What is Renewable Energy?Renewable energy resources are constantly replenished and will never run out. According to the National Renewable Energy Laboratory (NREL), renewable ener-gy sources include solar, wind, biomass, geothermal, ocean, and hydropower.
Benefits of Renewable EnergyRenewable energy creates many public benefits for the city and the region includ-ing environmental improvement, increased fuel diversity and security, regional economic development benefits, and local revenue:• Environmental Improvement – Emissions of CO2, mercury, NOx, SOx,
and particulate matter are significantly reduced. Damage associated with fuel extraction/processing/transport is almost eliminated.
• Fuel Diversity and Security – Multiple energy assets mitigate risk from under-performance or loss of any one source. Energy sources spread across two regional transmission organizations (RTOs) and multiple transmission networks minimize risk of reliability problems. Energy sources sited within Oberlin are effectively insulated from regional grid outage.
• Economic Benefits – Rates will be immune to the volatile market swings of fossil fuels. Utility revenues paid to Ohio-based companies provide local jobs and continue to circulate the money through the local economy. Oberlin-based energy sources avoid transmission fees and garner capacity credits, both of which lower electric rates. Reliable electricity with stable rates is attractive to new and existing businesses that provide jobs for the communi-ty and a healthy tax base.
• Local Revenue - A Renewable Energy Credit (REC) encapsulates the positive environmental attributes of electricity from a renewable source and can be sold as a separate commodity from the associated electricity to another entity wishing to offset the negative environmental attributes of its power source. For example, the City has in the past sold RECs to Oberlin College and created the Sustainable Reserve Fund. Senate Bill 221, signed by Gov. Strickland in 2008, requires that investor-owned utilities in Ohio obtain 12.5% of their electricity from renewable resources by the year 2025. While SB221 requirements do not apply to Oberlin's municipal utility, they do have long-term implications for the market value of in-state RECs held and sold by Oberlin. With further acquisition of Ohio-based renewable energy resources, Oberlin has the opportunity to expand its REC sale program by selling in-state RECs and replacing them with out-of-state RECs to realize significant revenue for future local environmental initiatives.
Challenges of Transitioning to Renewable EnergyThe wind does not always blow and the sun does not always shine, but we have become accustomed to electricity – anytime – at the flip of a switch. Replacing fossil fuel generators running 24/7 with highly intermittent renewable energy is not a satisfactory solution. Until the technology is available to efficiently store and utilize renewable energy with low capacity factors such as solar and wind power (10%-40% capacity factors), interim sources of low-carbon or carbon neutral power must be relied upon. The most promising of these energy sources is landfill gas (LFG), which is derived from the decomposition of organic matter in municipal solid waste and is widely considered a carbon neutral energy resource. However, because LFG is a by-product of landfills, and landfills are only replenished so long as we continue to generate and dispose of waste in the same way, LFG is not considered renewable. It is also important to note that there are GHG emissions resultant from the initial construction and continuing operations and mainte-nance of renewable energy infrastructure also known as embodied carbon or carbon footprint.
as nuclear energy, or carbon neutral sources such as landfill gas. In contrast to other sources of energy, renewable energy resources are constantly replen-ished and will never run out.
Background: Oberlin Energy PortfolioOberlin is in the enviable position of owning its own municipally-operated electric system. This allows Oberlin to make local decisions on the composition of its power supply, an opportunity that most cities in the United States do not have. Furthermore, as a member of American Municipal Power (AMP), Oberlin is involved in renewable/carbon neutral joint power supply projects that the City would not be able to manage or afford on its own.
Oberlin’s 2007 baseline renewable/carbon-neutral power supply includes a mix of landfill gas (LFG), hydro, wind, and solar. Because of the high percentage of coal in Oberlin’s electricity portfolio, electricity accounted for 55% of commu-nity-wide GHG emissions in 2007.
Energy used for space heating and transportation presents a different challenge because the fossil fuel-based sources for these sectors are outside of the direct control of the City. Natural gas is the major energy source for space heating and is supplied to the majority of customers through an investor-owned utility. Transportation is heavily reliant on gasoline and diesel, which are sold commercially. Reducing CO2e in these sectors can be accomplished by transitioning from equipment dependent on fossil fuels to efficient renewable, low-carbon, or carbon neutral alternatives.
Renewable Energy GoalsThe City of Oberlin is committed to developing and maintaining a portfolio of renewable resources that will provide the city with reliable power at a stable and reasonable cost to its residents. Specifically, Oberlin will strive to:• Eliminate fossil fuel use for electric-
ity generation no later than 2050.• Transition away from fossil fuel use
to carbon neutral energy for sectors such as space heating and transpor-tation as efficient technologies allow (see Sidebar on Fuel Switching).

16
Present StrategiesBased on present power supply com-mitments, our municipal electric utility will have a 90% carbon neutral portfolio of energy sources by 2015, reducing community-wide emissions by approxi-mately 50%. (See table below)
Oberlin Climate Action Plan • Renewable Energy
Present Strategies for Renewable Energy
Strategy Lead Entity
Timeline Reduction CO
2e tons
– annual
Benefits
Belleville Hydro Project OMLPS 1999–2050 8,182 Owned asset, baseload resource, renewable
New York Power Authority - Niagara and St. Lawrence Hydro
OMLPS 1999–2030 1.986 Low cost, baseload resource, renewable
Ohio Renewable Energy Services, LLC - Erie County LFG
OMLPS 2010–2022 3.615 Contract capacity and 1/2 RECs, baseload resource, carbon-neutral
AMP JV6 - Bowling Green Wind Project
OMLPS 1999–2030 360 Owned asset, renewable
Iberdrola Renewables Blue Creek Wind Project
OMLPS 2012–2022 1,440 Contract capacity/RECs, renewable
Spear Point Solar One, LLC Oberlin College Solar Field
Oberlin College
2012–2036 2,270 Customer-owned generation, peaking resource, renewable
Purchasing Natural Gas Blended with Methane for City Buildings
OMLPS 2009– ongoing
25 Reduced carbon-footprint of space heating
Customer-Owned Solar Generation
Utility customers
1999– ongoing
183 Local assets, peaking resource, renewable
Waste Management Renewable Energy, LLC - Mahoning and Geneva County LFG
OMLPS 2013–2027 44,365 Contract capacity/RECs, baseload resource, carbon-neutral
AMP Hydro Phase I - Cannelton, Smithland, and Willow Island
OMLPS 2013–2080 9,319 Owned asset, baseload resource, renewable
AMP Hydro Phase II - Meldahl and Green-up
OMLPS 2014–2080 2,815 Owned asset, baseload resource, renewable
Sustainable Reserve Fund OMLPS 2007– ongoing
TBD Provides funding for GHG reduction efforts
Electric Vehicle Charging Stations OMLPS 2013– ongoing
TBD Reduction of vehicle emissions, available to the public in downtown parking
Renewable energy resources are
constantly replenished and will
neveR Run Out.
"
"
Spotlight: Spear point Solar Energy 2.27 MW PV FieldIn 2012, Oberlin College and the City of Oberlin collaborated on the develop-ment of a 2.27 megawatt solar photo-voltaic facility located on 11 acres of college-owned property in New Russia Township. The College entered into a power purchase agreement (PPA) with Spear Point Energy of Aspen, Colorado to purchase the renewable solar energy for a 25-year period. The solar photovol-taic project was designed and construct-ed by SPG Solar of Novato, California and incorporates a single-axis tracking system for solar production enhance-ment. The project is estimated to pro-duce 3,000 megawatt-hours of renewable energy annually serving 12% of the College’s power supply requirements.
Power Purchase Agreement (PPA): A contract in which the seller retains ownership of the generation facility and the buyer agrees to purchase electricity at prescribed terms over time.
define it:
17
The College and the City entered into an Interconnection Agreement to permit the photovoltaic solar facility to tie into Oberlin’s electric grid and virtually deliver the solar generation output to College facilities. The project offers significant benefits to the City as a renewable fuel based resource within its power supply and through wholesale power cost savings associated with transmission-shaving and installed capacity obligations.
Potential StrategiesGiven the goal of eliminating fossil fuel use, Oberlin will continue to acquire generation assets of renewable energy to supply our community's electricity needs as technology and opportunity al-lows, to promote transitioning to carbon neutral electricity for sectors that are currently heavily reliant on fossil fuel, and to utilize existing opportunities in the renewable energy market to finance additional GHG reduction efforts.
AMP Hydro Phase III – R.C. Byrd and Pike Island Hydro ProjectsIn 2010, the City authorized AMP to apply on its behalf for the Federal Energy Regulatory Commission (FERC) license to develop a 49.5 MW hydro-electric project at the Pike Island Locks and Dam on the Ohio River. Previously, the City of Orrville, OH had held the development license for twenty years. AMP's evaluation of potential hydro-electric projects identified Pike Island as being sixth in terms of megawatt capacity. The R.C. Byrd Locks and Dam is a 48 MW hydro project being developed jointly by AMP and the City of Wadsworth, OH. The City should consider participation in these projects if they are developed by AMP.
Replace Natural Gas for HeatingNatural gas is widely used in Oberlin for space heating, domestic hot water (DHW), and cooking. While combustion of natural gas produces fewer emissions than coal or oil, there is debate over whether the life cycle CO2e emissions are significantly less than those of coal.8 Replacement of all natural gas use with electricity or carbon neutral energy sources should be encouraged if Oberlin is to become climate positive. Both
Renewable Energy • Oberlin Climate Action Plan
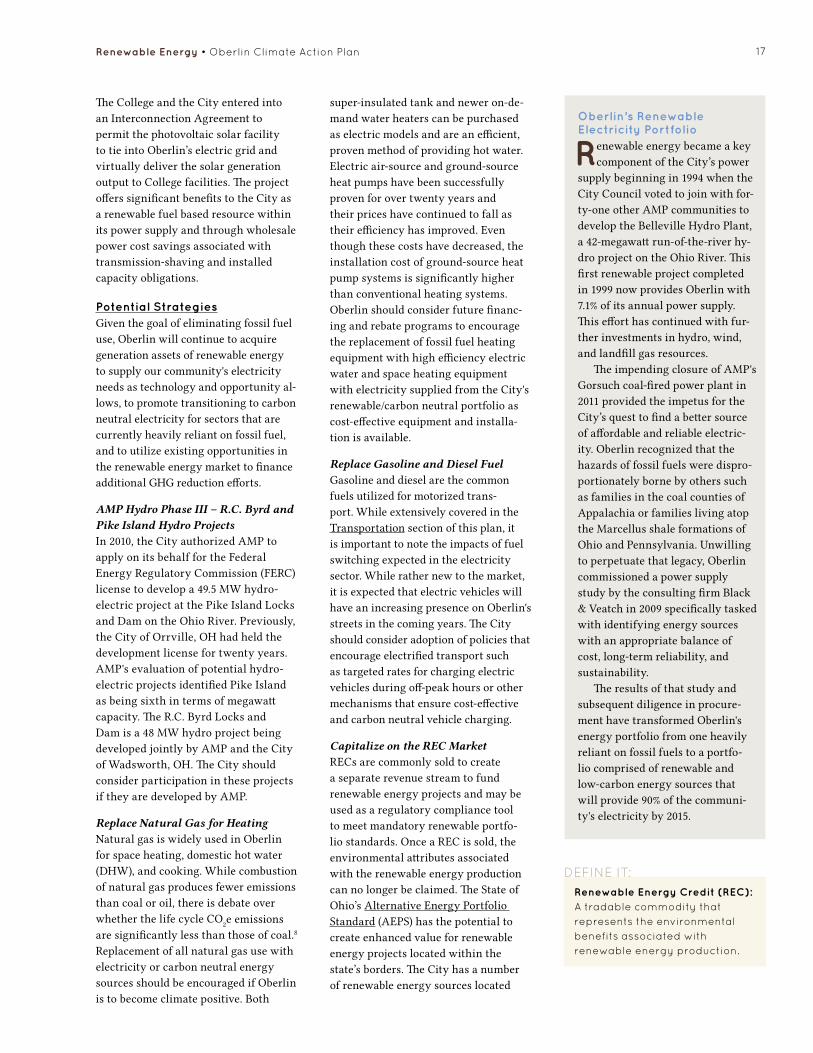
Oberlin’s Renewable Electricity Portfolio
Renewable energy became a key component of the City’s power
supply beginning in 1994 when the City Council voted to join with for-ty-one other AMP communities to develop the Belleville Hydro Plant, a 42-megawatt run-of-the-river hy-dro project on the Ohio River. This first renewable project completed in 1999 now provides Oberlin with 7.1% of its annual power supply. This effort has continued with fur-ther investments in hydro, wind, and landfill gas resources.
The impending closure of AMP's Gorsuch coal-fired power plant in 2011 provided the impetus for the City’s quest to find a better source of affordable and reliable electric-ity. Oberlin recognized that the hazards of fossil fuels were dispro-portionately borne by others such as families in the coal counties of Appalachia or families living atop the Marcellus shale formations of Ohio and Pennsylvania. Unwilling to perpetuate that legacy, Oberlin commissioned a power supply study by the consulting firm Black & Veatch in 2009 specifically tasked with identifying energy sources with an appropriate balance of cost, long-term reliability, and sustainability.
The results of that study and subsequent diligence in procure-ment have transformed Oberlin's energy portfolio from one heavily reliant on fossil fuels to a portfo-lio comprised of renewable and low-carbon energy sources that will provide 90% of the communi-ty's electricity by 2015.
super-insulated tank and newer on-de-mand water heaters can be purchased as electric models and are an efficient, proven method of providing hot water. Electric air-source and ground-source heat pumps have been successfully proven for over twenty years and their prices have continued to fall as their efficiency has improved. Even though these costs have decreased, the installation cost of ground-source heat pump systems is significantly higher than conventional heating systems. Oberlin should consider future financ-ing and rebate programs to encourage the replacement of fossil fuel heating equipment with high efficiency electric water and space heating equipment with electricity supplied from the City's renewable/carbon neutral portfolio as cost-effective equipment and installa-tion is available.
Replace Gasoline and Diesel FuelGasoline and diesel are the common fuels utilized for motorized trans-port. While extensively covered in the Transportation section of this plan, it is important to note the impacts of fuel switching expected in the electricity sector. While rather new to the market, it is expected that electric vehicles will have an increasing presence on Oberlin's streets in the coming years. The City should consider adoption of policies that encourage electrified transport such as targeted rates for charging electric vehicles during off-peak hours or other mechanisms that ensure cost-effective and carbon neutral vehicle charging.
Capitalize on the REC MarketRECs are commonly sold to create a separate revenue stream to fund renewable energy projects and may be used as a regulatory compliance tool to meet mandatory renewable portfo-lio standards. Once a REC is sold, the environmental attributes associated with the renewable energy production can no longer be claimed. The State of Ohio’s Alternative Energy Portfolio Standard (AEPS) has the potential to create enhanced value for renewable energy projects located within the state’s borders. The City has a number of renewable energy sources located
Renewable Energy Credit (REC): A tradable commodity that represents the environmental benefits associated with renewable energy production.
define it:

18
within the state. To that end, the City should explore selling in-state RECs and purchasing out-of-state RECs using the resulting revenues to benefit Oberlin electric consumers. Examples of how revenues could be used include:
1. Returning a portion of the value to electric customers through credits on the City's wholesale power bill.
2. Significantly expanding funding capacity and scope of projects of the Sustainable Reserve Fund to assist environmentally positive endeavors that demonstrate a purpose related to the municipal electric system op-eration and with community-wide benefit.
3. Providing a funding mechanism to achieve higher targets of energy efficiency than mandated in the current Efficiency Smart program from AMP.
ConclusionOberlin has made a lasting commitment to renewable energy and will strive to eliminate fossil fuel use for electricity generation no later than 2050. Based on present power supply commitments, our municipal electric utility will have an approximately 90% carbon neutral portfolio of energy sources by 2015. Reduction of CO2e emissions from other sectors relying on gasoline, diesel, or natural gas can be accomplished by transitioning to carbon neutral electricity and will be promoted by the City. As technology and opportunity allow, Oberlin will continue to acquire generation assets of renewable energy to supply our community's electricity needs.
Oberlin Climate Action Plan • Renewable Energy
Greenhouse Gas Considerations When Switching from Fossil Fuel to Electricity Use for Heating
In the very near future the City of Oberlin will have an electric supply that is largely carbon neutral. Thereafter, most of the City’s GHG emissions will be
associated with other non-electric uses of energy including natural gas used for heating and gasoline/diesel used for transportation.
One option to reduce natural gas usage could be to switch to carbon neutral electric technologies for heating; however, an important GHG implication must be considered. Electric generating plants, on average, use three units of natural gas (or coal) energy to produce one unit of electric energy. Therefore, on average, every unit of natural gas heating energy in Oberlin that is replaced with one unit of carbon-neutral electric energy will result in the burning of three units of natural gas (or coal) at some power plant connected to the grid. As a result, total GHG emissions (in and outside of Oberlin) are three times greater than would have been the case had natural gas been used for heating in the first place. In general, shifting from natural gas to electricity for heating results in increased greenhouse gas emissions unless the switch to electricity uses 1/3 of the energy as compared to the amount of energy used heating with natural gas. Some, but not all, air-to-air and ground-source heat pump systems can deliver such sav-ings. An electric on-demand domestic hot water system may also deliver such savings (owing to the fact that it does not have the standby losses of the typical hot water storage tank), but this depends on the details of the usage.
The City of Oberlin should encourage fuel switching from natural gas to electric energy whenever the technology employed is cost-effective and that such switching will result in the overall reduction in primary energy use or GHG emissions (both inside and outside of Oberlin). As fuel switching increas-es demand, OMLPS will have to increase its carbon neutral power portfolio or increase energy efficiency initiatives to meet the energy requirements.
These same criteria apply to switching from gasoline to electric energy for transportation.
Landfill gas to energy generators at the Lorain County Landfill.

IntroductionEnergy efficiency means accomplishing the same tasks and functions as before with less energy. Because the least expensive means of providing energy is not to use that energy in the first place, energy efficiency is one of the most cost-effective ways to reduce GHG emissions. Energy efficiency can result from improvements in technology, better management of existing technology, or better organization of existing systems.
Background: Impact of Energy Efficiency on Oberlin’s GHG EmissionsEfficient use of electricity and natu-ral gas are both important to pursue as energy efficiency remains the best way to reduce GHG emissions. In fact, you may be surprised to know that this remains true even when Oberlin’s electricity portfolio is mostly carbon neutral because of Oberlin’s interconnec-tivity to the nation’s electric grid, which
remains inefficient and carbon-intensive. One kilowatt-hour of electricity saved in Oberlin results in one less kilowatt-hour purchased from the grid. If in the future Oberlin’s carbon neutral electric supply exceeds its load requirement, one kilo-watt-hour of saved energy in Oberlin means that Oberlin exports one more kilowatt-hour of carbon neutral electric-ity to the grid. In either case, somewhere on the nation’s electric grid, our energy efficiency will displace a fossil-fuel plant that is only 33% efficient, burning three units less of natural gas or coal and therefore reduce its GHG emissions. Natural gas, the major energy source for space heating, accounts for about 18% of Oberlin’s GHG emissions. Therefore, increasing the space heating efficiency of Oberlin’s building stock is an important short-term strategy for reducing GHG emissions.
As discussed in the Renewable Energy section, a longer-term goal for
Energy Efficiency
Benefits of Energy Efficiency
Using energy more efficiently is about as close as one can come
to getting something for nothing. It has a number of benefits:• Long-term decreased costs for
energy consumers• Long-term decreased environ-
mental impacts• Additional revenue available
for diffusion into the local economy
• Creation of local jobs in selling and installing energy efficiency measures
• Reduced vulnerability to rising energy prices or economic costs that may be imposed through new regulations
OMLPS replacing traffic lights with LED leading to a two-thirds reduction in energy use.
19

20
achieving climate positive will be to shift space heating from natural gas to renew-able resources. Because natural gas use is widely distributed among individual businesses and households, maximizing GHG emission reduction through fuel switching will be labor-intensive and expensive. Creating a culture in which people value using less energy, and providing homeowners and businesses with the resources they need to make informed decisions, will be crucial to maximizing efficiency.
Energy Efficiency GoalsThe City’s recent electric power supply commitments create a near-term base-load energy surplus, meaning the City needs to seek an appropriate balance between energy efficiency reductions and managing its load profile. Therefore, the City aims to:• Reduce electricity demand by 1% per
year (from 2010 levels) over 5 years, beginning in 2011.
• Reduce natural gas use by 1.5% per year (from 2010 levels) over 10 years, beginning in 2011.
Present Strategies in Energy Efficiency
Strategy Lead Entity Timeline Reduction CO
2e tons
– annual
Benefits
Heat Loss Inspections OMLPS 2000– ongoing
18 Energy efficiency awareness on an individ-ual basis
Industrial Audits OMLPS 2005– ongoing
42 Potential energy reductions on a larger scale
Promotion of Compact Fluorescent Light Bulbs
OMLPS 2007– ongoing
83 Lowest cost electrical energy efficiency measure
Energy Efficiency at OMLPS Power Plant
OMLPS 2007–2010 444 Reduced energy usage and reduced cost to ratepayers
Energy Efficiency at OMLPS Technical Services Office
OMLPS 2007–2010 24 Reduced energy usage and reduced cost to ratepayers
Energy Efficiency at Water Environment Protection Facility
Public Works 2007–2010 176 Reduced energy usage and reduced cost to ratepayers
Energy Efficiency Upgrades at Water Treatment Plant
Public Works 2008–2010 48 Reduced energy usage and reduced cost to ratepayers
Traffic Light Upgrades to Light Emitting Diodes (LEDs)
OMLPS 2009–2010 59 Reduced energy usage and reduced cost to ratepayers
Building Efficiency Upgrades to Parks and Cemetery Building
Public Works 2009– ongoing
14 Reduced energy usage and reduced cost to ratepayers
Building Efficiency Upgrades to City Facilities
Public Works 2009– ongoing
7 Reduced energy usage and reduced cost to ratepayers
Downtown Christmas Lighting Upgrade to LEDs
OMLPS 2010 90 Reduced energy usage and reduced cost to ratepayers
Lighting Upgrades to City Buildings
Public Works 2010 9 Reduced energy usage and reduced cost to ratepayers
Efficiency Smart OMLPS 2011–2013 1035 Energy efficiency promoted on a communi-ty wide scale
Oberlin Super Rebate Program OMLPS 2012–2013 TBD Energy efficiency promoted on a communi-ty wide scale
Efficiency Upgrades to City Office Equipment
Engineering & Administration
Ongoing 2 Reduced energy usage and reduced cost to ratepayers
Develop One-Stop Shop for Residential Energy Efficiency Information and Assistance
POWER 2007– ongoing
1.5 Energy efficiency completed and promoted on a community-wide scale
Oberlin Climate Action Plan • Energy Efficiency

21
Spotlight: Providing Oberlin with Efficiency Responsibly (POWER)
POWER was founded in 2008 in collaboration with Zion Community
Development Corporation and Oberlin Community Services. The purpose of this non-profit, grassroots, environmen-tal justice organization is to increase the energy efficiency of Oberlin housing with an emphasis on those homes whose residents may not be able to af-ford the upfront cost of energy efficien-cy upgrades. Since 2008, POWER has insulated and weatherized 28 houses, resulting in reduced emissions of CO2e of more than 8 tons. POWER estimates that 50% of the housing stock (approx-imately 1,000 homes) still requires efficiency upgrades. By setting a goal of working with 100 households per year, POWER aims to facilitate efficiency ret-rofits of 100% of the inefficient housing stock in Oberlin by 2025.
Present StrategiesSee table on opposite page.
Potential StrategiesThe strategies recommended below are expected to set Oberlin on the path to achieving its energy efficiency goals and are based on best practices and policies in other cities. Adoption of new technol-ogy and policies will depend on research, feasibility of implementation, and cost/benefit analysis.
Building Performance Disclosures for Residential and Commercial PropertiesConsumers need better information about the amount and cost of energy used in buildings when they consider buying, renting or leasing them. A growing practice across the country is to require sellers and landlords to share this information with prospective buyers and tenants. The City should research building energy performance disclosure programs and evaluate benefits.
Develop One-Stop Shop for Commercial Energy Efficiency Information and AssistanceDevelop a One-Stop shop to gath-er and disseminate information on
energy efficiency services and programs available to the commercial sector. The one-stop shop would make it easier for commercial customers to navigate available services and programs as well as encourage adoption of energy efficient measures to reduce energy costs.
Evaluate and Consider Adoption of Smart Grid Technologies for Future Real-Time Monitoring of Energy Consumption and Load Control OpportunitiesAdvanced Metering Infrastructure (AMI), which allows for two-way communication between the customer’s meter and the utility through software and hardware upgrades, can offer op-portunities for a utility to better manage its peak load requirements and help customers understand and better manage their energy consumption. In consider-ation of future upgrades to its metering infrastructure, OMLPS will research the benefits and costs of advanced metering infrastructure (AMI) including real-time monitoring, load control, and other enhanced customer services.
ConclusionWith the creation of the Energy Services Division of OMLPS in 1998, Oberlin has taken a proactive role in promot-ing and offering a number of energy efficiency services and programs to residents and businesses, culminating with the deployment of the Efficiency Smart program in 2011. Through rebates and technical assistance through this program, it is expected that Oberlin will reduce its electrical consumption by 1% per year over the next three-year period, the equivalent of powering 388 homes. The non-profit organization POWER has weatherized 28 homes (over 1% of the residential building stock) and continues to increase its weatherization and energy education efforts. Projects, programs, education, and incentives by the City, the College, and the community have brought energy efficiency to the forefront in our mission to reduce energy usage and GHG emissions. It will be import-ant to emphasize the benefits of energy efficiency in order for all stakeholders to fully embrace and practice efficient use of energy as the norm.
Setting the Bar for Efficiency Goals
According to research conduct-ed by the American Council
for an Energy Efficient Economy (ACEEE) and cited in State Energy Efficiency Scorecard 2011, p. 17, the best state-wide electric energy effi-ciency programs typically achieve annual reductions in electricity demand of .74% - 1.64% (Comparable data was not available for natural gas energy efficiency programs). ACEEE also researched electrici-ty and gas standards set by state governments around the country. Goals set by the top 10 states for electricity reduction started at 1% initial reductions, ramping up to 2.5% reductions over several years. Natural gas reduction goals started as low as .2%, and increased to 1.9% over several years.
Lightbulbs collected throughout the community to be replaced by energy-saving ones. Photo by Dale Preston for Oberlin College.
Energy Efficiency • Oberlin Climate Action Plan
Advanced Metering Infrastrucutre (AMI): Systems that measure, collect, and analyze energy use and communicate with metering devices such as electricity meters, gas meters, heat meters, and water meters, either on request or on a schedule.
define it:

22
IntroductionThe City of Oberlin will promote a more sustainable transportation system that serves the needs of the Oberlin community. Since transporta-tion networks cross political boundar-ies, the City’s goals will be pursued in partnership with local, county, region-al, and state entities and stakeholders. Envisioning and ultimately re-creat-ing local and regional transportation systems will not only reduce GHG emissions but will have numerous posi-tive additional environmental, social, and economic benefits.
Background: Transportation Profile of OberlinNationally, the transportation sector accounts for approximately 27% of GHG emissions. By contrast, in 2007 Oberlin’s transportation sector accounted for 15% of community-wide emissions (23,887 metric tons). As the City transitions to
a lower-carbon electrical power supply however, GHG emissions associated with the transportation sector will make up an increasingly larger percent-age of the City’s CO2e emissions profile.
Many residents work in Oberlin; 53% of commuters travel less than 10 minutes to work. Average commutes of Oberlin residents differ considerably from national averages: 53% of Oberlin residents drive to work (12% of whom carpool) compared with 86% nationally; 32% walk; and 6% bike. Fifty-one percent of Oberlin households own one car, 32% own two cars, and 13% have none. This equates to an average of 1.5 vehicles per household, slightly less than the nation-al average of 1.7 vehicles per household.9
Almost all motor vehicles on Oberlin’s roads are powered by fossil fu-els, approximately 82% gasoline and 18% diesel. Both the College and the City have hybrid-electric cars in their fleets. At the moment, plug-in electric vehicles
Transportation
Oberlin Bike Festival features safety demonstration, equipment giveaways, bike raffle, maintenance and free food. Photo by Gary Cohen '11 for Oberlin College.
Hybrid vehicle: A vehicle that uses more than one power source (such as an internal combustion engine and electric power sources).
define it:
Biofuel: fuel derived from biomass conversion, including bioethanol (made from fermented sugar or corn crops) and biodiesel (made from vegetable oils or animal fats).
define it:

23
are rare, but the College has a charging station and the City is evaluating instal-lation for others. Finally, Oberlin has a biofuel station, Full Circle Fuels, that provides up to 100% bio-diesel for sale to the public. Full Circle Fuels has also converted 300 cars, trucks and tractors to run on straight vegetable oil (SVO).
In order to reduce Oberlin’s trans-portation-related GHG emissions, it will be necessary to address the diverse transportation needs of various constit-uencies on multiple fronts.
Transportation GoalsOur goal is to reduce our transporta-tion-related carbon emissions by 1.5% annually with aggregate goals of 5% by 2015, 30% by 2030, and 60% by 2050. The City of Oberlin will strive to achieve these goals by implementing programs and policies to: • Lowertheamountoffuelconsumed:Work with local and regional partners toward a more complete network of affordable, environmentally friendly transpor-tation choices.
• Reducethecarboncontentofthefuel: Increase electric and alter-native fuel adoption for fleets and residents. Electric-powered vehi-cles “filling up” in Oberlin will use renewable/carbon neutral energy resources, and energy dollars will stay in the region.
• Reducevehiclemilestraveled(VMT): Comprehensive and inte-grated land use planning reduces dependence on carbon-based fuels for transportation by providing the structure to encourage the com-munity to travel, commute, and shop using low carbon methods of transportation such as transit, biking, walking, ride sharing, and car sharing.
Present StrategiesOberlin already promotes alterna-tive modes of transportation, such as public transit, walking, and bicycling. Improving the convenience and safety of these modes of transportation will decrease the use of automobiles and help reduce the City’s carbon footprint.
The strategies outlined in this
Vehicle Miles Traveled (VMT) in Oberlin
Total VMT for the City of Oberlin in 2006 was 40.6 million miles, a 2.5% in-crease from 2000; if this trend were to continue, Oberlin VMT would increase
20% by 2050. In comparison, VMT grew 10% nationally during the same 2000-2006 time period. National VMT has been on the rise for decades and is expected to grow until 2035.
Generally, transportation-related emissions can be described as the product of the carbon content of the fuel, vehicle miles traveled, and fuel consumption of the vehicle.
Emissions[Carbon] = [Gallons/Mile] x [Miles Traveled/Vehicle] x [Carbon/gallon]or [Fuel Consumption] x [Activity] x [Carbon Content2]
section are based on the “Oberlin Transportation Profile” by the Center for Neighborhood Technology (CNT) completed on May 27, 2011. CNT is an award winning innovations laboratory for urban sustainability.
See table on following page.
Spotlight: Rethink Your RideMore than half of Oberlin’s residents live within a 10-minute walk of the town center. In recognition of this demographic, the Transportation Working Group of the Oberlin Project developed a mode-shift competition called “Rethink your Ride” to encourage residents to use active transportation and alternative transportation modes. This challenge encouraged those who live, learn, work, and play in Oberlin to replace at least one-single vehicle trip per week with a low-carbon mode of transportation. More than half of the activity was walking and biking. In addition, local businesses sponsored the weekly participation prizes and were highlighted online as part of a shop lo-cal campaign. Participants avoided over 3,762 single-occupancy vehicle miles during the 6-week competition.
Potential StrategiesContinued cooperation between the City, local institutions, and regional, state, and federal entities will be neces-sary to rethink the nature of our built environment to provide a more compre-hensive network of no- and low-carbon transportation options. Note, however, that success in reducing emissions is largely dependent on changing driving
ten minutes53% of commuters
travel less than
Transportation Profile of Oberlin
12% commuters CA R P OO L
51% own one car
36% own two or more cars
13% own no car
1.5cars per household in the city of Oberlin (0.2 less than the national average)
Transportation • Oberlin Climate Action Plan

24 Oberlin Climate Action Plan • Transportation
Present Strategies in Transportation
Strategy Lead Entity
Timeline Reduction CO
2e tons
– annual
Benefits
Strategies: Increase active transportation – walking and biking
Wayfinding Signage City, Non-profit, Commercial
Ongoing TBD Improved ease and efficiency for all modes of transportation
Safe Routes to School City, Non-profit Present–2014 TBD Expanded, safe active transportation options promote healthy lifestyles
Expand Bicycle and Pedestrian Infrastructure
City Present–2014 TBD Promotes active lifestyles
Bicycle Parking at Events City, College, Commercial
Ongoing TBD Health, lower transportation costs
Bicycle Giveaway Commercial Ongoing TBD Free bicycle, improved health
Bicycle Tourism Program City, County, Non-profit
Ongoing TBD Increased health benefits, economic de-velopment potential
Bicycle and Pedestrian Education and Safety
City, Non-profit Ongoing TBD Promoting public health, safety, and sustainable transportation
Strategies: Transit
Oberlin Connector Transit Service
City, Non-profit, Commercial
Present–2015 TBD Available, affordable option for those who do not drive, eliminating a 2nd vehicle saves money
Regional Transit Coordination City Ongoing TBD Personal mobility. For every $1 invested in public transportation, $4 in economic returns is generated
WestShore Corridor Transportation Project
City 2015–2030 TBD Encourages compact, walkable communities
Strategies: Increase Use of Alternative, Efficient Fuels and Vehicles
Biofuel Pumping Station Commercial Present–2014 TBD
Environmental and economic benefits. Potentially lower fuel costs, may offer convenience of home refueling.
Electric Vehicle Charging Stations
City, College 2013–2015 TBD
Alternative Fuel Station for Consumers
City, College, Commercial
2015–2030 TBD
Alternative-Fueled and Hybrid Vehicles
City, College, Commercial
Present–2014 TBD
Efficient Fleet Standards City, College Present–2014 TBD Environmental and economic benefits
Anti-Idling Training City, College Present–2014 TBD Improved health benefits, Diesel particu-late pollution has been linked to asthma, heart disease, cancer, and premature death
Eco-Driving Training City, Non-profit, Commercial
Present–2014 TBD Improved road safety, reduced fuel costs
Strategies: Reduced Vehicle Ownership
Increase Carpooling/Car-Sharing City, College, Commercial
Ongoing TBD Reduced vehicle miles traveled
Strategies: Trip Reduction
Rethink Your Ride – Mode Shift Competition
Community Ongoing TBD Improved health, reduces traffic conges-tion, monetary savings

25
behaviors. See Appendix V for addition-al potential strategies.
Adopt Complete Streets PolicyDevelop and adopt a Complete Streets Policy intended to ensure that the City’ streetscapes are consistently designed with all users in mind including cars and trucks, emergency and safety-ser-vice vehicles, bicyclists and pedestrians of all ages and abilities, and where applicable, public transit.
Explore Changes to Parking Infrastructure and Policies Considerable research demonstrates that restructuring parking design and cost can have a big impact on driving patterns. Currently, permit parking for College students is $100 per year (recently raised from $75); College em-ployees receive two free permits to park in faculty/staff spaces. Parking in the City of Oberlin is free though restrict-ed. Consideration should be given to infrastructure and policy changes that discourage driving/parking and encour-age alternative forms of transportation. Options could include: charging for parking and offering employees payment to opt out of parking, as well as increas-ing student parking fees while providing more transportation alternatives so students will have less need for a car on campus. Parking revenue could be used to fund the City’s GHG reduction efforts.
Explore Low-Carbon Solutions for Cargo Transport This strategy involves encouraging businesses to change their logistics to combine shipments and use lower-car-bon shipping methods. For example, green procurement standards can require suppliers to reveal the carbon intensity of their supply chain and allow purchasers to select goods with lower-carbon lifecycles.
Explore Options for Low-Carbon Long Distance TravelLong distance travel is not included in the 2007 GHG inventory for Oberlin be-cause most emissions from long-distance trips occur elsewhere. Because Oberlin’s community GHG inventory does not include air travel, efforts to reduce it will not help toward meeting any emissions
reduction targets. However, CNT esti-mates that long distance travel accounts equates to 31% of Oberlin’s total trans-portation inventory. Providing low-emis-sion long distance travel options, such as high-speed rail and airplanes powered by sustainable biofuels, is obviously not something that Oberlin can undertake alone. However, in addition to collabo-rating regionally to promote long-dis-tance transportation alternatives, it may be able to initiate some alternatives. For example, Oberlin’s Wilder Lines, a char-ter bus to New York City and other cities runs during Oberlin College breaks, is considered a “best practice” for reducing single-occupancy vehicle miles traveled.
ConclusionReaching the goal of reducing carbon emissions as a result of transportation changes will require a multi-faceted approach. This includes increasing the safety, convenience and social accept-ability of biking and walking, improv-ing the availability and reliability of no- and low-carbon fuel sources, and re-ducing travel demand. These approaches must be considered in the context of the widely divergent transportation needs of the community. Oberlin has many as-sets in place that provide the foundation for achieving these goals. To meet the goal of reducing transportation-related GHG emissions, existing infrastructure and policies must be re-evaluated and new programs and policies established to provide the necessary framework for progress to meet – and possibly exceed – the incremental goals.
Transportation • Oberlin Climate Action Plan
improving the
cOnvenience & safety of these modes of transportation will decrease the use of automobiles and help
Reduce the city's caRbOn fOOtpRint.
"
"

26
IntroductionThe green building movement is about creating better buildings and commu-nities in which people want to live as well as ones that are compatible with ecological principles. In addition, green buildings and communities can con-serve resources, save money on energy and water bills and provide a comfort-able and healthy environment. Green buildings are proving to be cost effective and more desirable and valuable than conventional buildings. Both new and existing structures benefit from the best green building practices that can result in climate positive buildings, especial-ly when being high-performance and climate positive are the primary goals (see Appendix VI: Green Building, A and D 2).
Background: Energy Use and GHG Emissions in BuildingsThe operation of buildings takes about 40% of the energy used in the US with residential energy accounting for 22% while commercial buildings use around 18%. In the residential sector, the four biggest uses account for 66% of the energy used: heating, 31%; cooling and hot water, 12% each; and lighting, 11%. In commercial buildings, the three largest uses account for 53% of the energy used: lighting, 26%, heating, 14%, and cooling, 13%. Electricity represents about 75% of the primary energy used in buildings. In Oberlin’s 2007 GHG-emissions inventory, residential buildings accounted for 16% of emissions while commercial buildings were 38%. (See Figure 5)
Green Building
Oberlin's East College Street Project is expected to receive LEED Neighborhood Certification. Photo by Kevin Reeves for Oberlin College.
High-performance building: A building operating on 40% or less of the average energy used by a similar type of building in the same region of the county.
define it:

27
Green Building GoalsThese energy use data indicate that increased efficiencies in heating, cooling, and lighting provide the best opportuni-ties for substantial energy and monetary savings, thereby meriting early attention.
Present StrategiesSee table below.
Spotlight: Green Buildings in OberlinCommercial Building: The Adam Joseph Lewis Center for Environmental Studies (AJLC)The AJLC, a classroom-office building, is an early example of ecological design that provides a healthy and comfortable place of learning while minimizing negative impacts of the built environ-ment. Building systems clean and recycle wastewater with a “living machine” that employs natural processes. Daylighting with passive and active solar reduce energy demand and provide operating energy. The landscape restores native habitats and produces food. These attributes create a building that teaches. Showcasing a variety of energy efficient strategies and technologies, the 13,600 square foot building is the winner of numerous architecture awards and was named the most important green build-ing constructed since 1980 in a poll of green building experts and advocates.11
Residence: Trail Magic Trail Magic is a passive-active solar home built in 2008 that is climate positive, running on site-produced solar and renewable energy and having the capacity to run entirely on solar
Present Strategies in Green Building
Strategy Lead Entity Timeline Benefits
Oberlin College Green Building Policy College 2006– ongoing
New construction/major renovations LEED Silver or equivalent
City Green Building Policy City 2007–ongoing New construction/major renovations LEED Silver or better
Planet Footprint to Monitor Municipal Gas and Electric Energy Use
OMLPS 2011–ongoing Inform City staff on energy use, provide com-parative data over time and in relation to other cities
Rehabilitation of LMHA Housing in Oberlin
Lorain Metropolitan Housing Authority
Reduce energy costs of tenants, reduce GHG emissions
energy. It provides an excellent design and example of a sustainable residential building. Based on metered electricity use, homeowner data, and calculations the passive solar design provides a sub-stantial fraction of the home's operating energy. A 5.2 kilowatt photovoltaic sys-tem generates 40% more electricity than used. Trail Magic’s primary energy use is less than 10% of the average two-person US home. Water saving technologies and appliances combined with resident be-havior reduce indoor and hot water use to 20% and 40%, respectively, of that used by the average two-person US home.
Potential StrategiesFacilitate Development of City-Owned Green Acres Property The City intends to facilitate the devel-opment of the City-owned Green Acres property to create a model neighborhood with all houses built to high perfor-mance standards, which are expected to include both passive and active solar features with the goal of acquiring most if not all operating energy from the sun. Creative design of the property will
Figure 5: National energy use and GHG emissions in residential and commercial buildings.10
40% Buildings
28% Transportation
32% Industry
22% Residential
18% Commercial
8% Refrigeration
11% Lighting
12% Cooling12% Water Heat
31% Heating
7% Water Heat13% Other
13% Cooling
14% Heating26% Lighting
Adam Joseph Lewis Center for Environmental Studies (AJLC). Courtesy of Oberlin College.
Trail Magic.
Green Building • Oberlin Climate Action Plan

28
provide the City with the opportunity not only to have a climate positive neigh-borhood, but also one that has common open space and vegetable gardens, aesthetically pleasing locations and rela-tionships among houses, and attractive landscaping created to complement neighboring properties.
Develop Commercial and Residential Green Building Certification ProgramsOhio law limits the ability of cities to establish more stringent building codes than those required by the State. This restriction, however, can be overcome in at least two ways. First, the City could certify buildings as “Green” if they meet specified green building standards estab-lished by the City, with separate criteria for commercial and residential buildings. Second, the City could develop a residen-tial building standard in which homes could be rated based on high performance and ecological criteria.
In establishing green building certi-fication programs, criteria could come from one of the established certification programs including LEED, Passive House, Living Building Challenge, Energy Star Certified New Homes, and National Association of Home Builders. Criteria would ensure that all certified houses would be high performance and poten-tially climate positive or positive energy (see Appendix VI, Green Building, E).
Establish Procedures and Policies that Encourage Green BuildingThe City should consider establishing procedures and policies that encour-age builders and homeowners to build high-performance, climate positive, or positive-energy homes. Positive-energy homes generate more energy than they use, meaning they can export electricity back to the grid. These procedures and policies could include favorable publicity such as opinion articles and editori-als in local newspapers, City Council proclamations, “Green House” plaques, reduced permit fees, or other actions that will be of minimal cost to the City. (See Appendix VI, Green Building F for effective incentives)
ConclusionThe City and College have made notable strides in embracing green building standards. As we strive to follow best green building practices, we can learn from what has been accomplished. It is important for the City and College to use not only green building certification pro-grams and other best-practice standards for new construction and renovations, but also to develop policies and mecha-nisms to reduce costs for similar quality construction and to assess performance over several years. Such policies can cor-rect missteps and in other ways improve and guide future projects.
Oberlin Climate Action Plan • Green Building
Best Practices for Building Envelope and Lighting Efficiency
A building’s envelope – the slab, walls, and ceiling or roof –
defines the movement of heat and light into and out of a building which in turn determines the ener-gy required to light, heat, and cool a building.
For existing structures, elimi-nating air leaks is the least expen-sive change for the greatest savings in heating and cooling energy with payback times of 3 to 6 years in residential buildings.
Daylighting followed by lighting with compact fluorescent light bulbs (CFLs), linear fluorescent lamps, and light-emitting diode (LED) bulbs provides the most energy efficient lighting.
See APPendix Vi, GReen BUiLdinG, B
The Architecture 2030 Challenge
Architecture 2030, a non-profit formed to address climate change by focusing on eliminating fossil fuel energy use in buildings, issued the following guide-
lines to global architects and builders as The 2030 Challenge:
All new buildings, developments and major renovations shall be designed to meet a fossil fuel, GHG-emitting, energy consumption performance standard of 60% below the regional (or country) average for that building type.
At a minimum, an equal amount of existing building area shall be renovated annu-ally to meet a fossil fuel, GHG-emitting, energy consumption performance standard of 60% of the regional (or country) average for that building type.
The fossil fuel reduction standard for all new buildings and major renovations shall be increased to:
• 70% in 2015• 80% in 2020• 90% in 2025• Carbon-neutral in 2030 (using no fossil fuel GHG-emitting energy to operate)These targets may be accomplished by implementing innovative sustainable design
strategies, generating on-site renewable power, and/or purchasing (20% maximum) renewable energy.
HttP://ARCHiteCtURe2030.ORG/2030_CHALLenGe/tHe_2030_CHALLenGe
A view of the roof of the AJLC. Photo by John Petersen for Oberlin College.
Positive energy: A building or entity (college, city, defined area, etc.) that produces more solar energy than it uses.
define it:
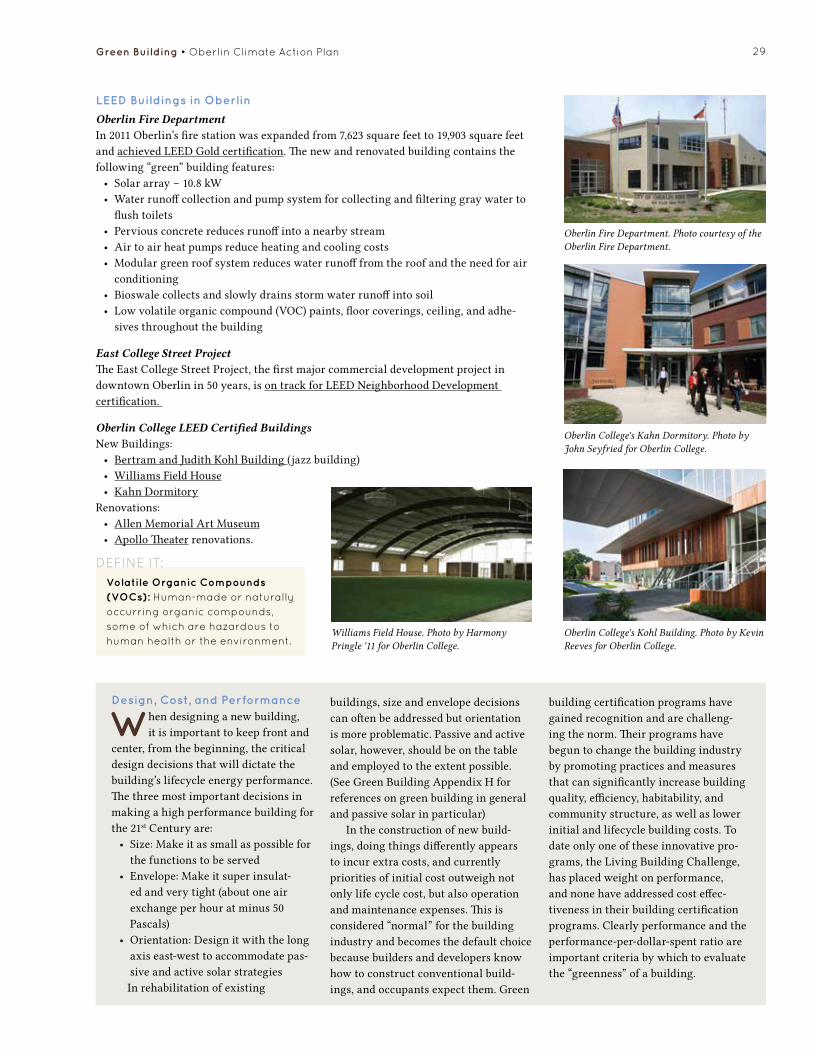
29Green Building • Oberlin Climate Action Plan
LEED Buildings in Oberlin
Oberlin Fire DepartmentIn 2011 Oberlin’s fire station was expanded from 7,623 square feet to 19,903 square feet and achieved LEED Gold certification. The new and renovated building contains the following “green” building features:• Solar array – 10.8 kW• Water runoff collection and pump system for collecting and filtering gray water to
flush toilets• Pervious concrete reduces runoff into a nearby stream• Air to air heat pumps reduce heating and cooling costs• Modular green roof system reduces water runoff from the roof and the need for air
conditioning• Bioswale collects and slowly drains storm water runoff into soil• Low volatile organic compound (VOC) paints, floor coverings, ceiling, and adhe-
sives throughout the building
East College Street ProjectThe East College Street Project, the first major commercial development project in downtown Oberlin in 50 years, is on track for LEED Neighborhood Development certification.
Oberlin College LEED Certified BuildingsNew Buildings:• Bertram and Judith Kohl Building (jazz building)• Williams Field House• Kahn Dormitory
Renovations:• Allen Memorial Art Museum• Apollo Theater renovations.
Design, Cost, and Performance
When designing a new building, it is important to keep front and
center, from the beginning, the critical design decisions that will dictate the building’s lifecycle energy performance. The three most important decisions in making a high performance building for the 21st Century are: • Size: Make it as small as possible for
the functions to be served • Envelope: Make it super insulat-
ed and very tight (about one air exchange per hour at minus 50 Pascals)
• Orientation: Design it with the long axis east-west to accommodate pas-sive and active solar strategiesIn rehabilitation of existing
buildings, size and envelope decisions can often be addressed but orientation is more problematic. Passive and active solar, however, should be on the table and employed to the extent possible. (See Green Building Appendix H for references on green building in general and passive solar in particular)
In the construction of new build-ings, doing things differently appears to incur extra costs, and currently priorities of initial cost outweigh not only life cycle cost, but also operation and maintenance expenses. This is considered “normal” for the building industry and becomes the default choice because builders and developers know how to construct conventional build-ings, and occupants expect them. Green
building certification programs have gained recognition and are challeng-ing the norm. Their programs have begun to change the building industry by promoting practices and measures that can significantly increase building quality, efficiency, habitability, and community structure, as well as lower initial and lifecycle building costs. To date only one of these innovative pro-grams, the Living Building Challenge, has placed weight on performance, and none have addressed cost effec-tiveness in their building certification programs. Clearly performance and the performance-per-dollar-spent ratio are important criteria by which to evaluate the “greenness” of a building.
Oberlin Fire Department. Photo courtesy of the Oberlin Fire Department.
Oberlin College's Kahn Dormitory. Photo by John Seyfried for Oberlin College.
Oberlin College's Kohl Building. Photo by Kevin Reeves for Oberlin College.
Williams Field House. Photo by Harmony Pringle '11 for Oberlin College.
Volatile Organic Compounds (VOCs): Human-made or naturally occurring organic compounds, some of which are hazardous to human health or the environment.
define it:

30
IntroductionEffective waste management to mini-mize CO2e emissions includes reducing solid and industrial waste and diverting remaining waste from landfills. The present and future strategies addressed in this plan encompass residential, commercial, institutional, and industri-al solid wastes as well as residual waste products from wastewater treatment. Strategies to minimize emissions include recycling, composting, and methane recapture.
Background: Measurement of GHG Emissions from Waste ManagementReduction in CO2e emissions from waste management strategies is measured in emissions from terminal waste management (landfilling, recycling, composting, etc.). Anaerobic decompo-sition of organic wastes in landfills or compost facilities can release significant
carbon dioxide and methane. Methane production is the major concern because its heat trapping potential is approxi-mately 21 times that of carbon dioxide. According to the City’s 2007 emissions inventory, the Waste Management sector accounted for 1,622 tons CO2e, equal to 0.9% of the community’s GHG emissions. Note that CO2e emissions as-sociated with collection, transport, and processing of wastes are measured in the Transportation and Energy sectors and are not included as part of the 1,622 tons attributed to Waste Management.
Solid Waste ManagementMeasuring reductions in CO2e emis-sions for the solid waste sector is linked to waste disposal by landfilling. Reductions in the disposal quantity will most likely be attributed to reduced consumption, improved re-use, and/or increases in recycling and composting.
Waste Management
Food waste collected for composting.
Anaerobic decomposition: A process in which organic wastes are broken down in the absence of oxygen.
define it:

31
Measurable goals can be set to reduce solid waste disposal. These reductions can be modeled to project correspond-ing reductions in CO2e emissions.
To meet or exceed the goal of becoming climate positive by 2050, the City would have to reduce solid waste disposal by 10% each and every year throughout the planning cycle. Even then, a small amount of residual waste (63.32 tons or 1.62% of the current waste stream) would still be landfilled. This is not considered a realistic scenario. However, more modest annual reduc-tions do net significant results over the planning period. The table below shows the net impact of reducing solid waste disposal at 1%, 2%, and 3% per year.
It seems highly unlikely that reduc-tions in waste disposal will be achieved in consistent and regular increments. Rather, reductions in waste disposal are more likely to be tied to programs and policies that are put into place to help achieve such reductions as well as such external factors as local, regional, and global economic conditions; technologi-cal improvements; etc.
Nevertheless it appears reasonable to set an annual reduction target of at least 2% per year. Although meeting this goal will achieve a significant reduction
in corresponding CO2e emissions, the City’s CAP will need to include the nec-essary CO2e offsets for the remaining emissions associated with solid waste disposal by 2050.
Present Strategies – Solid WasteThe City of Oberlin provides residential and commercial solid waste and recy-cling services for its residents, business-es, and institutions. All solid waste is delivered to the Republic Services Inc. sanitary landfill just east of Oberlin for disposal. Recyclable materials are delivered to Republic and other proces-sors to be reclaimed. The City supports the efforts of the Abitibi-Bowater Paper Retriever program that provides drop-off paper recycling facilities through-out the community. The City provides seasonal leaf, brush, and yard waste collection for its residents. Organic wastes are transported to the City’s Class IV compost facility where they are composted using the static pile method. See Waste Management Appendix for additional details. See table below for present strategies.
Spotlight: Debris Diversion for Green Acres Public Works staff have been charged with preparing plans and
Present Strategies in Solid Waste Disposal
Strategy Lead Entity Timeline Benefits
Residential Curbside Recycling City Ongoing Reduction in landfill disposal decreases CO2e emissions; recaptures embodied energy in waste materials; enhances consumer awareness of resource issues; adds reuse/resale value of materials.
Commercial and Institutional Recycling City Ongoing
Composting City Ongoing
Projected Reductions from 2008–2011 Average Disposal Baseline of 3,855.42 tons/year
Year Cumulative reduction at 1%/year
Residual Quantity tons/year
Cumulative reduction at 2%/year
Residual Quantity tons/year
Cumulative reduction at 3%/year
Residual Quantity tons/year
2015 3.94% 2,703.51 7.76% 3,556.12 11.47% 3,412.18
2030 17.38% 3,185.23 31.88% 2,626.44 43.94% 2,161.40
2050 32.43% 2,605.22 54.52% 1,753.43 69.51% 1,175.36
Waste Management • Oberlin Climate Action Plan
Embodied energy: the energy used to make something or used to provide the end use energy for a task.
define it:
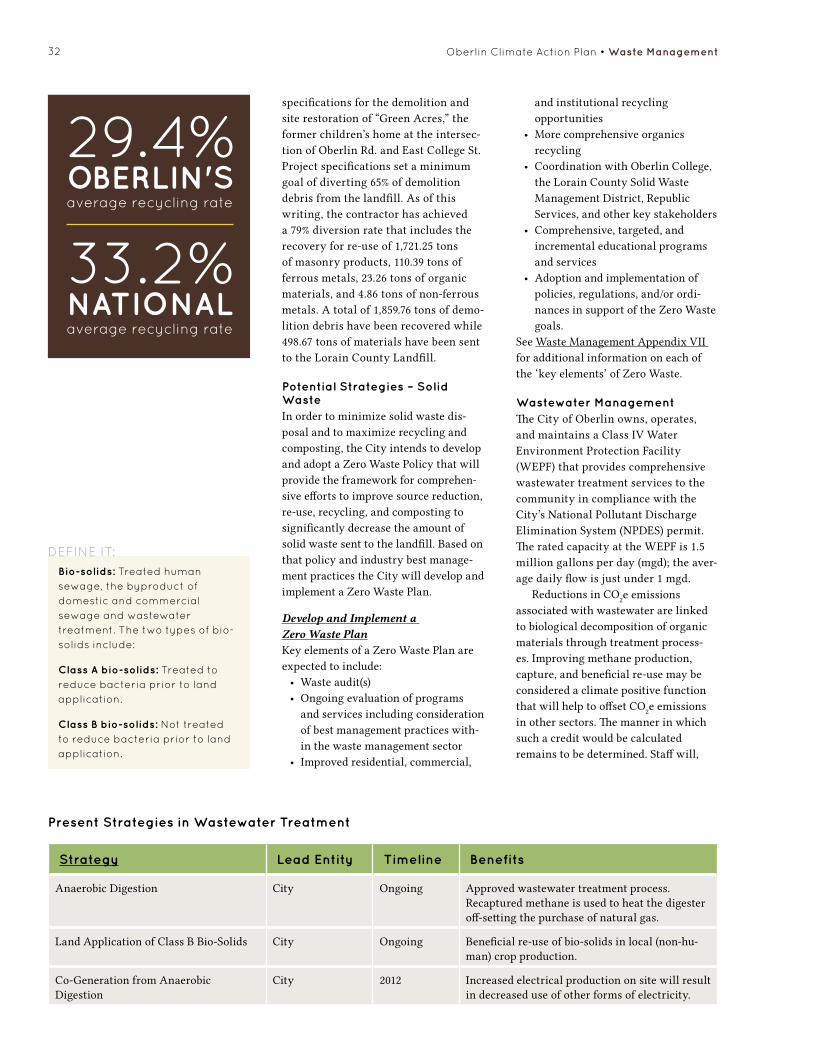
32
specifications for the demolition and site restoration of “Green Acres,” the former children’s home at the intersec-tion of Oberlin Rd. and East College St. Project specifications set a minimum goal of diverting 65% of demolition debris from the landfill. As of this writing, the contractor has achieved a 79% diversion rate that includes the recovery for re-use of 1,721.25 tons of masonry products, 110.39 tons of ferrous metals, 23.26 tons of organic materials, and 4.86 tons of non-ferrous metals. A total of 1,859.76 tons of demo-lition debris have been recovered while 498.67 tons of materials have been sent to the Lorain County Landfill.
Potential Strategies – Solid WasteIn order to minimize solid waste dis-posal and to maximize recycling and composting, the City intends to develop and adopt a Zero Waste Policy that will provide the framework for comprehen-sive efforts to improve source reduction, re-use, recycling, and composting to significantly decrease the amount of solid waste sent to the landfill. Based on that policy and industry best manage-ment practices the City will develop and implement a Zero Waste Plan.
Develop and Implement a Zero Waste PlanKey elements of a Zero Waste Plan are expected to include: • Waste audit(s)• Ongoing evaluation of programs
and services including consideration of best management practices with-in the waste management sector
• Improved residential, commercial,
and institutional recycling opportunities
• More comprehensive organics recycling
• Coordination with Oberlin College, the Lorain County Solid Waste Management District, Republic Services, and other key stakeholders
• Comprehensive, targeted, and incremental educational programs and services
• Adoption and implementation of policies, regulations, and/or ordi-nances in support of the Zero Waste goals.
See Waste Management Appendix VII for additional information on each of the ‘key elements’ of Zero Waste.
Wastewater ManagementThe City of Oberlin owns, operates, and maintains a Class IV Water Environment Protection Facility (WEPF) that provides comprehensive wastewater treatment services to the community in compliance with the City’s National Pollutant Discharge Elimination System (NPDES) permit. The rated capacity at the WEPF is 1.5 million gallons per day (mgd); the aver-age daily flow is just under 1 mgd.
Reductions in CO2e emissions associated with wastewater are linked to biological decomposition of organic materials through treatment process-es. Improving methane production, capture, and beneficial re-use may be considered a climate positive function that will help to offset CO2e emissions in other sectors. The manner in which such a credit would be calculated remains to be determined. Staff will,
Present Strategies in Wastewater Treatment
Strategy Lead Entity Timeline Benefits
Anaerobic Digestion City Ongoing Approved wastewater treatment process. Recaptured methane is used to heat the digester off-setting the purchase of natural gas.
Land Application of Class B Bio-Solids City Ongoing Beneficial re-use of bio-solids in local (non-hu-man) crop production.
Co-Generation from Anaerobic Digestion
City 2012 Increased electrical production on site will result in decreased use of other forms of electricity.
29.4%OBERLIN'Saverage recycling rate
33.2%NATIONALaverage recycling rate
Oberlin Climate Action Plan • Waste Management
Bio-solids: treated human sewage, the byproduct of domestic and commercial sewage and wastewater treatment. the two types of bio-solids include:
Class A bio-solids: treated to reduce bacteria prior to land application.
Class B bio-solids: not treated to reduce bacteria prior to land application.
define it:

33
however, continue to track natural gas and electricity consumption as well as methane production from the WEPF for ongoing evaluation of environmental and economic benefits.
Present Strategies – WastewaterAs described above, CO2e emissions associated with sanitary sewer col-lection and the wastewater treatment processes are primarily measured in the Transportation and Energy sectors. There may, however, be CO2e emissions associated with the biological decom-position of bio-solids. Solids from the primary and final settling tanks must be further treated prior to disposal. The WEPF can use both aerobic and anaer-obic digestion processes. Current treat-ment methodology is anaerobic. Sludge is heated in the anaerobic digester to between 90° to 100° F. The methane by-product of anaerobic digestion is captured in the digester and combusted to heat the boiler that maintains di-gester temperature. Digested solids are sent to the sand drying beds or stored in the sludge holding lagoons. Class B bio-solids are sampled and analyzed prior to land application at agronomic rates in accordance with all applica-ble Ohio Environmental Protection Agency (OEPA) regulations. See table on previous page.
Spotlight: WEPF GeneratorWEPF staff developed plans to use methane created through anaerobic di-gestion to power an engine generator. A 30kW generator has been purchased and installed just outside the digest-er. Once in operation, methane from the digester will produce electricity that will be used on-site to power plant equipment and processes. The waste heat from the generator will be transferred back into the digester via heat exchange equipment to maintain digester operating temperatures.
Potential Strategies – WastewaterAlthough the primary mission of the WEPF must be compliance with NPDES permit requirements, the Public Works Department will continue to support the efforts of WEPF staff to operate the plant as efficiently as possible. This will
History of Oberlin’s Recycling Program
As one of only two remain-ing “self-haul” communities
in Lorain County, the City of Oberlin enjoys a great deal of local control over its solid waste management programs. This has allowed staff to frequently analyze revenues and expenses as well as opportunities and chal-lenges to maximize service to the community. In 2010, the Public Works Department published a ”Recycling Program Status Report”. This report reviewed pro-gram history and current opera-tions and analyzed the pros and cons of the existing source-sepa-rated recycling program as well as the pros and cons of imple-menting co-mingled recycling. A key finding is that the City has an economic incentive to continue to operate its source-separated recycling program.
The report states that the 2008 national average recycling rate is 33.2% while Oberlin’s 4-year average rate is 29.4%. To improve the recovery rate, the report recommends: 1) improve public education; 2) consider regulatory changes to make source-sepa-ration mandatory, followed by making recycling mandatory; and 3) develop and adopt a ‘Zero Waste’ policy.
Following the report, it was de-termined that operational changes could achieve significant savings that would alleviate the need to raise rates in the short term and provide funding to fill the vacant Recycling Coordinator position. In April 2012, a part-time recycling coordinator was hired. In the first several months, the coordinator started a pilot recycling program at one of the largest apartment complexes in town, implemented recycling at the City’s recreation complex, and worked closely with the Oberlin College staff to improve recycling on campus.
include continuing efforts to maximize energy conservation through efficiency measures and to continually examine opportunities to enhance resource recov-ery (energy and organic matter) associat-ed with the treatment of wastewater.
Landfill Gas (LFG) Generator Waste Heat Recovery Feasibility StudyCost effective reuse of waste heat could improve WEPF treatment processes. Significant quantities of waste heat available have economic development potential for appropriate industries (such as greenhouses) with high heat demand.
Evaluate Additional Anaerobic Digestion Opportunities to Maximize Methane Production for Re-Use in the Co-Generation SystemManaging organic inputs to the anaer-obic digester could lead to increased methane production that in turn will further reduce the need to purchase natural gas and when the co-generation system comes on-line, will decrease use of electricity from the municipal utility.
Evaluate Costs and Benefits Associated with the Production of Class A Bio-SolidsUnlike Class B bio-solids, Class A bio-solids may be applied without restriction to farmlands, gardens, and landscapes. As a more desirable soil amendment, Class A bio-solids could reduce the City’s transportation costs associated with land application of Class B bio-solids.
ConclusionAlthough Waste Management cur-rently accounts for a small percentage of the City’s GHG emissions (0.9%), this relative percentage will increase as the City makes progress towards reducing its CO2e emissions portfolio in all sectors. Ongoing tabulation of Waste Management GHG emissions will be necessary to evaluate progress in decreasing related emissions from the 2007 emissions inventory level of 1,622 tons CO2e. Continuous evaluation and improvement of solid waste and waste-water management practices will also result in important related climate-pos-itive benefits that will accrue in every other sector of the Climate Action Plan.
Waste Management • Oberlin Climate Action Plan

34
Education & Awareness
A camper at George Jones Farm, Oberlin, Ohio. Photo by John Seyfried for Oberlin College.
IntroductionNo action is complete without an effec-tive education and awareness program. Simply making information available has limited impact. The educational strategies employed in Oberlin seek to embrace the age-old, educational adage: “Tell me and I will forget; show me and I will know; have me do and I will understand.”
Effecting behavioral changes that will foster the creation of a climate positive community, with sustainability as the default setting, is a monumental opportunity. The educational challenge is to employ those aspects of human be-havior that enable persons and groups to embrace new norms of behavior consistent with the principles of ecosys-tems that undergird full spectrum sus-tainability. The actions and programs
proposed in this section build largely on existing outreach, education, and empowerment efforts in the community. Their goal is to contribute to building a critical mass of Oberlin citizens, City and College employees, and business people engaged in a achieving a climate positive community.
City departments and community organizations can use community-based social marketing (CBSM) tools to ensure that programs are as effective as pos-sible at encouraging behavior change. CBSM builds on research and expertise from the fields of social psychology and marketing and lays out a systematic ap-proach for identifying the most effective strategies to promote positive behavior change that supports sustainability. A thorough how-to guide is available free for download at www.cbsm.com.

35
Background: Accomplishments to DateIn 2002, OMLPS began employing an “energy bike” for use in the Oberlin City School District to provide instruction for students on electricity generation and energy efficiency. In the same year, a 1 kilowatt (kW) photovoltaic (PV) system was installed at Prospect Elementary School to illustrate and promote solar energy as well as to provide no-cost electricity to the school.
In 2012, the school district and Michigan-based Creative Change Educational Solutions announced a partnership to develop a comprehen-sive K-12 Educational for Sustainability curriculum under the Oberlin Project. The initiative is designed to enhance the district’s International Baccalaureate (IB) programs currently in place. The inte-gration of sustainability will go beyond environmental education to serve as a mechanism for meeting core standards, as well as supporting equity and deep-ening connections between the school and the community. Teacher training began in July 2012 and implementation in classrooms was scheduled to begin in January 2013.
In early 2012, the Oberlin Project Community Engagement Team was formed to ensure community engage-ment in all aspects of sustainability projects through the Oberlin Project and CAP. The Team works with the larger community to define and achieve col-lective goals and develop open and trans-parent communications, create wide and ongoing opportunities for discussion and feedback, identify and build on existing community assets and projects, and en-sure that projects create tangible benefit for all members of our community.
Education and Awareness Goals• Motivate Oberlin residents and
businesses to change their behavior in ways that reduce carbon emis-sions and enable the City to reach its Climate Positive goal by 2050.
• Empower K-12 educational institu-tions to enhance curricula to create learning environments that support sustainability, leadership, health, creativity and social justice through place-based learning, which is
focused on understanding and solving problems within the local community.
• Support sustainability and envi-ronmental studies majors at higher education intuitions to identify long-term technology and career op-portunities to prepare students for careers in developing and maintain-ing a sustainable future.
• Provide ongoing sustainability-re-lated learning opportunities for all interested community members, institutions, and students through service learning, community events, workshops, and other educational programs.
Present StrategiesTo effect real change, it is vital that the community hears and sees frequent and consistent messaging about initia-tives, particularly about how they can play a part in the process. See table on next page.
Spotlight: Bioregional DashboardThe Bioregional Dashboard is a technol-ogy that monitors and displays the total flows of electricity and water and envi-ronmental conditions in the entire city of Oberlin. It provides an animated and narrated depiction of the city that is de-signed to help the community better un-derstand how the decisions each person makes affect Oberlin’s ecological and social community. The overarching goal is to use information on these resource flows to engage, educate, motivate and empower the community to value and conserve environmental resources. Bioregional dashboard displays are currently located at the Oberlin Public Library, Prospect Elementary School, Slow Train Café, and Adam Joseph Lewis Center for Environmental Studies on the Oberlin College campus. View the Oberlin Bioregional Dashboard on-line at: www.oberlindashboard.org.
Potential StrategiesThe following provide a highlight of fu-ture strategies to achieve the education and awareness goals outlined above. Additional potential strategies can be found in Appendix VIII.
the educational challenge is to employ those aspects of human behavior that enable persons and groups to
embRace new nORms
of behavior consistent with the principles of ecosystems that undergird full spectrum sustainability.
"
"
Education and Awareness • Oberlin Climate Action Plan
The website for the Oberlin's Bioregional Dashboard (http://oberlindashboard.org/brd/).
Education for Sustainability: A life-long learning process that leads to an informed citizenry having the creative problem-solving skills, scientific and social literacy, and commitment to engage in responsible individual and cooperative actions.
define it:

36
Create a Community and/or Business Environmental AwardRecognize and celebrate the environ-mental leadership of local businesses, business associations, and community groups.
Promote Green Business and Green Restaurant MembershipFor businesses interested in third party certification, green restaurant and/or business membership can offer a host of benefits including cost savings, public-ity, new customer attraction, improved employee morale, and a healthier work environment.
Develop Support of a Buy Local CampaignEncouraging local purchasing decreases carbon emissions associated with travel outside of the community and increases the vibrancy of downtown Oberlin. One example of a buy local campaign is a "cash mob" in which consumers are en-couraged to visit local businesses using social media and peer-to-peer outreach.
Annual Speaker and Film SeriesBoth an annual speaker series and an annual film series on a broad range of subjects will empower an informed,
engaged public.
Hold Community Workshops to Educate the CommunityWorkshops could include home energy conservation, home composting, water conservation and storm water manage-ment, home gardening/farming, etc.
ConclusionOberlin will create an engaging, mul-tifaceted education program that moti-vates residents to reduce their carbon footprint and make sustainability their default choice. It builds commitment to these goals through long-term partic-ipation and invites residents to create and share new solutions. This requires an understanding of citizen motivations and constraints and requires designing a program to make climate-friendly choices as attractive as possible. For some, saving money is of the greatest concern. For others it is convenience. For others still it is concern about the environment or climate change. The educational initiatives in this section and throughout the CAP strive to lower the barriers and enhance the incentives for making choices consistent with a climate positive community.
Present Strategies in Education and Awareness
Strategy Lead Entity Timeline Benefits
Media Marketing of Sustainability Opportunities and Benefits
City, Non-profit 2012–ongoing To effect real change, it is vital the community hears/sees frequent and consistent messaging about CAP initiatives, particularly about how they can play a part.
Develop New/Enhanced Sustainability Curricula at Oberlin City Schools and Other Institutions of Learning
City Schools, Non-profit
2012–2014 The integration of sustainability serves as a mechanism for meeting core standards, as well as supporting equity and deepening connections between the school and the community.
Install Bioregional Dashboard at Various Locations in the Community
City Schools, College
2012–2013 Dashboards provide real-time information on energy and resource consumption
Complete Sustainability Tracking Assessment and Rating System (STARS) Assessment at All Partner Schools
College, Lorain County Community College, Lorain Conty Join Vocational School, City Schools
2012–2014 Allows schools to calculate and track progress towards sustainability at institutional, physical, and academic levels.
Partner with POWER to Raise Awareness of Residential Energy Opportunities
City, Non-profit 2012–ongoing Promote the "one-stop shop" for information and assistance in navigating available efficiency programs to all Oberlin residents.
Oberlin Climate Action Plan • Education and Awareness
A child at Prospect Elementary School with an Oberlin college student envisioning a sustain-able future.
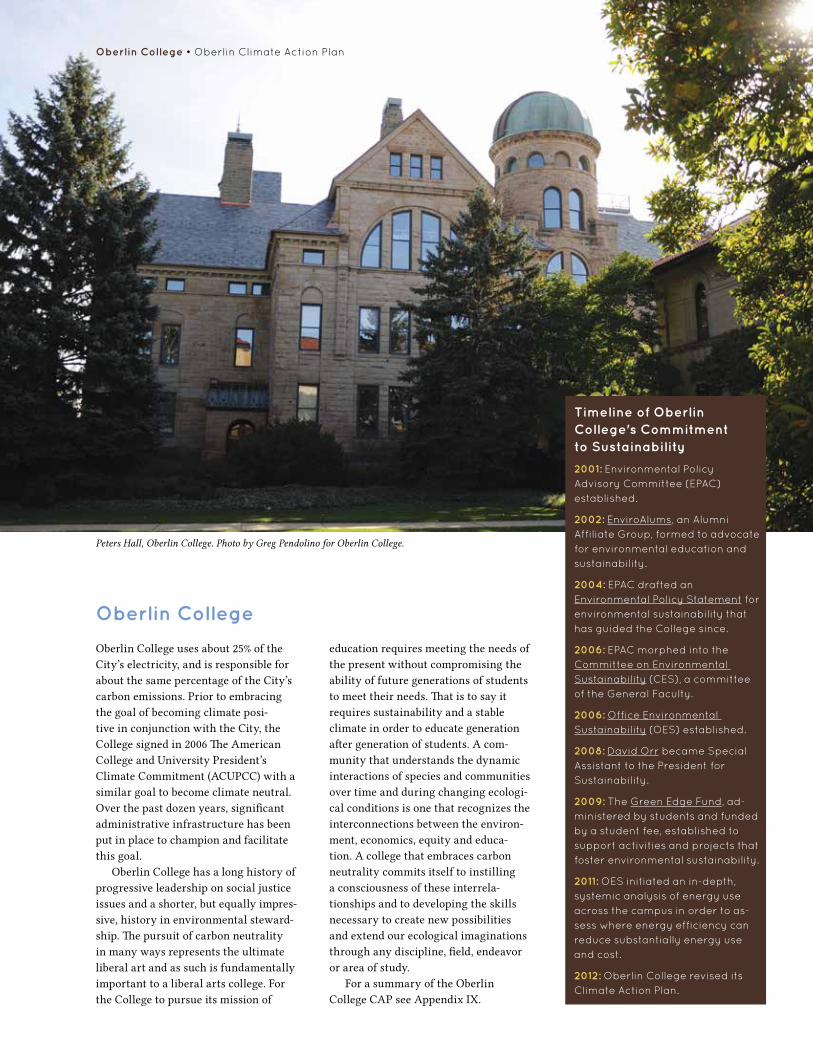
Oberlin College
Peters Hall, Oberlin College. Photo by Greg Pendolino for Oberlin College.
Oberlin College uses about 25% of the City’s electricity, and is responsible for about the same percentage of the City’s carbon emissions. Prior to embracing the goal of becoming climate posi-tive in conjunction with the City, the College signed in 2006 The American College and University President’s Climate Commitment (ACUPCC) with a similar goal to become climate neutral. Over the past dozen years, significant administrative infrastructure has been put in place to champion and facilitate this goal.
Oberlin College has a long history of progressive leadership on social justice issues and a shorter, but equally impres-sive, history in environmental steward-ship. The pursuit of carbon neutrality in many ways represents the ultimate liberal art and as such is fundamentally important to a liberal arts college. For the College to pursue its mission of
education requires meeting the needs of the present without compromising the ability of future generations of students to meet their needs. That is to say it requires sustainability and a stable climate in order to educate generation after generation of students. A com-munity that understands the dynamic interactions of species and communities over time and during changing ecologi-cal conditions is one that recognizes the interconnections between the environ-ment, economics, equity and educa-tion. A college that embraces carbon neutrality commits itself to instilling a consciousness of these interrela-tionships and to developing the skills necessary to create new possibilities and extend our ecological imaginations through any discipline, field, endeavor or area of study.
For a summary of the Oberlin College CAP see Appendix IX.
Oberlin College • Oberlin Climate Action Plan
Timeline of Oberlin College's Commitment to Sustainability
2001: environmental Policy Advisory Committee (ePAC) established.
2002: enviroAlums, an Alumni Affiliate Group, formed to advocate for environmental education and sustainability.
2004: ePAC drafted an environmental Policy Statement for environmental sustainability that has guided the College since.
2006: ePAC morphed into the Committee on environmental Sustainability (CeS), a committee of the General faculty.
2006: Office environmental Sustainability (OeS) established.
2008: david Orr became Special Assistant to the President for Sustainability.
2009: the Green edge fund, ad-ministered by students and funded by a student fee, established to support activities and projects that foster environmental sustainability.
2011: OeS initiated an in-depth, systemic analysis of energy use across the campus in order to as-sess where energy efficiency can reduce substantially energy use and cost.
2012: Oberlin College revised its Climate Action Plan.

38
Achieving Climate Positive
Becoming a climate positive community means that Oberlin is striving not just to minimize harm caused by energy use, transportation, waste management, and environmental degradation, but to actually have a net positive impact that will improve our local and global community. The 2013 CAP address-es ways in which we can reduce our negative impact by pursuing strategies that reduce greenhouse gas emissions.
This section will address the require-ments for achieving a climate positive outcome, including Climate Positive Credits, land use and local food systems, financing solutions, policy recommen-dations, and measurement and verifica-tion of emissions reductions.
The CPDP is not rigidly prescriptive as there is no single path for Oberlin to achieve a Climate Positive outcome. A project of this size can take decades to
Trees being planted in Tappan Square as a part of the Carbon Offsetting Initiative, 2012. Photo by Janine Bentivegna for Oberlin College.
39
complete. The framework encourages the community to set realistic plans for achieving the emissions target by project completion, demonstrate that implementation conforms to those plans at important milestones, and adjust implementation as circumstances and technologies change over time.
Climate Positive CreditsThe Climate Positive Development Program stipulates that members should strive to reduce their on-site emission impacts first, but they will also have to create Climate Positive credits in order to reduce operational GHG emissions below zero. Emission credits are measured by metric ton (CO2e) in the same manner as GHG emissions. Reducing or abating emis-sions in the surrounding community or capturing carbon on-site can create Climate Positive Credits. These avoided emissions must be quantifiable.
Creating Credits: Local Carbon Offset PilotThe student body of Oberlin College has long demonstrated leadership on environmental issues and serves as a catalyst for local sustainability projects through the Green EDGE Fund, a student-run sustainability grant and efficiency loan fund. The Green EDGE Fund in collaboration with the Student Finance Committee, the College Grounds and Athletics Departments, the City , and the Oberlin Rotary Club organized three events to plant 102 trees in fall 2012. The first tree was planted in the common green space in the center of town, Tappan Square, on September 29, and an additional 26 trees were planted in November. As part of its 75th anniversary, Rotary set a goal of pur-chasing 75 trees to donate to the City for planting in curb lawns. The EDGE Fund supported 30 of these trees. Rotary and the student body are both interest-ed in calculating carbon sequestration associated with these trees to count as offsets.
In spring 2012, the student body vot-ed in favor of creating a student-funded local carbon offset program to offset emissions associated with student travel to and from Oberlin. This could generate
the long-term goal is to
incRease lOcal fOOd access within the cOmmunity to provide residents and businesses with convenient and affordable choices to meet a majority of their food needs through local farms, grocers, and other sources by
2030.
"
"
approximately $50,000 per year for use toward the purchase of carbon offsets. Demonstrating the viability of a local carbon offset program will support the creation of a dedicated funding stream to support local carbon reduction and sequestration projects that create Climate Positive Credits.
In collaboration with the Oberlin Project and many other community partners, Oberlin College is applying for seed grant funding to provide proof of concept for a local carbon offset market based in Oberlin, Ohio as a viable option for sequestering and reducing carbon emissions. College students, faculty, staff, and community partners will engage in project planning, imple-mentation, and verification. Students working alongside faculty advisors will be responsible for calculating carbon emissions associated with activities to be offset and setting a price for carbon offsets. Projects include pilots in energy efficiency, reforestation, and soil seques-tration through sustainable agricultural and land use practices. These pilot projects will also offset specific sources of emissions for the College and partner organizations, including the city school bus fleet and the City’s Police and Fire Departments vehicles.
Achieving Climate Positive • Oberlin Climate Action Plan

40
Creating Credits: Greenhouse PilotThe Oberlin Project is researching the viability of a greenhouse operation that would be located outside of the city lim-its of Oberlin and heated by the waste heat released by landfill gas-to-energy generators operating at the nearby landfill. Greenhouses would extend the growing season for local food, provide a new business opportunity for a local entrepreneur, and have a guaranteed market through institutional partners such as Oberlin College. This project could generate climate positive credits by avoiding natural gas use for heating outside city limits and providing a rep-licable model for regional food produc-tion; if food is sold to partners outside of Oberlin, the reduction in emissions associated with the transportation of food from national or international sources would also count as a climate positive credit.
Creating Credits: Next StepsThe success of early projects in creating offsets for credits will provide the basis for researching future sequestration projects and determining the types of credits appropriate for Oberlin to achieve its goal of becoming climate positive. Additional credits may be explored via reduction of emissions through strategies that impact commu-nities outside of Oberlin’s boundaries, such as production and sale of excess renewable energy and leadership in a regional transportation system that reduces emissions elsewhere.
Land Use and Local Food SystemsPlanning surrounding land use and local food systems, while outside of the scope of the 2013 CAP, are important to the long-term health, resilience, and GHG emissions reductions. This section outlines components of land use and lo-cal food systems that will be expanded upon in a revised version of this plan.
Land Use PlanningLand use planning involves decisions that shape the entire community, including setting priorities for new and existing development, making zoning recommendations, guiding new com-mercial and neighborhood development,
and defining boundaries or connections between different parts of the city. Overall land use plans can have ripple effects on transportation decisions, energy use, efficient delivery of city services, health and safety, success of local businesses, and quality of life, to name a few (figure 6). These factors are important to the climate impacts of a community’s activities as well as to its long-term resiliency and prosperity.
The City updated its Comprehensive Plan in 2004 and the Planning Commission completed a "5 Year Review" of the Plan in 2011 and found its policy direction to continue to be relevant. The update includes sections on general policies, land use, trans-portation, utilities, annexation, and special areas such as downtown and Oberlin College. General policies for land use outlined in the plan are to encourage infill and density, connect neighbors and neighborhoods, and to become a more sustainable communi-ty. The Comprehensive Plan and the 2013 CAP can be used to complement each other ensuring future sustainable development.
Green SpaceGreen space is part of overall land use planning, but it deserves special mention as green spaces serve a number of important roles in a community for recreation, congregation, and connec-tion with each other. The Open Space and Visual Environment Commission of the City provides recommenda-tions on green space to City Council. Recently the Public Works and Planning Departments participated in the devel-opment of the 2011 Parks and Recreation Strategic Plan. Integration of existing planning with green space planning is included in the City’s Comprehensive Plan and should be considered in revi-sions to the CAP.
Local Food and AgricultureLocal food and agriculture are a vital part of the innovative vision for a post-fossil fuel community. As part of the Oberlin Project, partner entities are working with local landowners to identify a 20,000-acre patchwork of land, within a 6-county area, that might
land use
transportation decisions energy use
efficient deliveryof city services
health and safety
success of local businesses
quality of life
Figure 6: A diagram of what over-all land use can influence.
Oberlin Climate Action Plan • Achieving Climate Positive
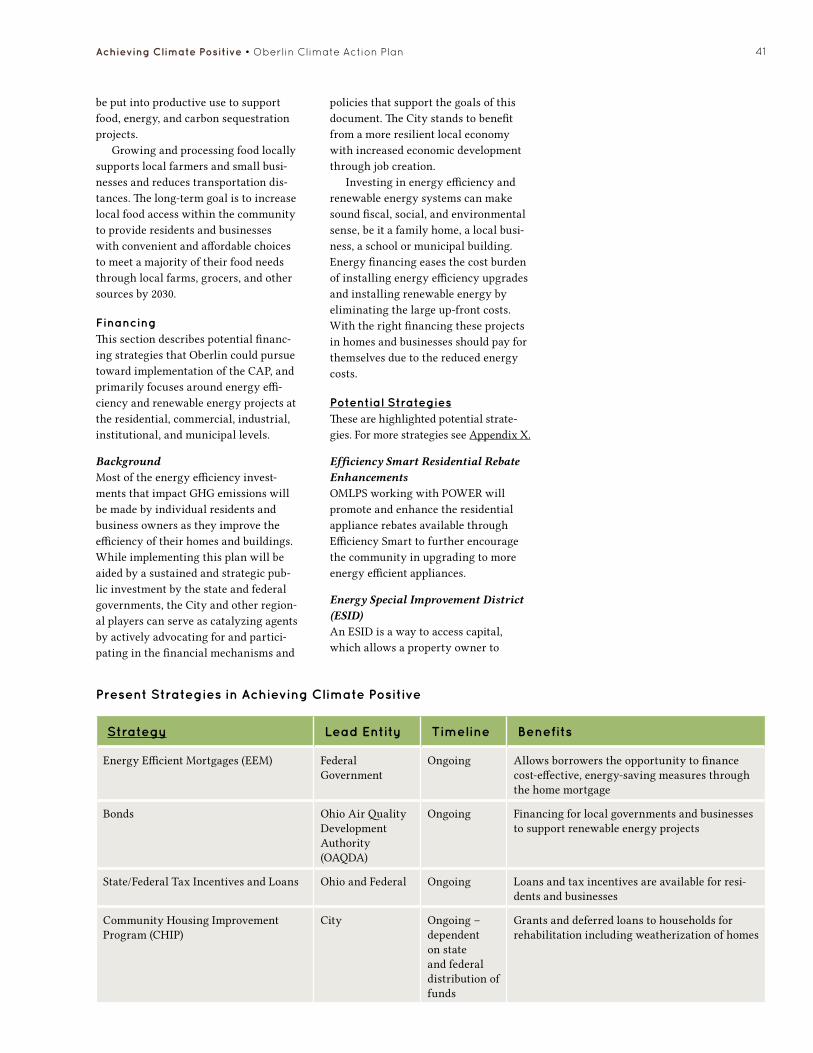
41
be put into productive use to support food, energy, and carbon sequestration projects.
Growing and processing food locally supports local farmers and small busi-nesses and reduces transportation dis-tances. The long-term goal is to increase local food access within the community to provide residents and businesses with convenient and affordable choices to meet a majority of their food needs through local farms, grocers, and other sources by 2030.
FinancingThis section describes potential financ-ing strategies that Oberlin could pursue toward implementation of the CAP, and primarily focuses around energy effi-ciency and renewable energy projects at the residential, commercial, industrial, institutional, and municipal levels.
BackgroundMost of the energy efficiency invest-ments that impact GHG emissions will be made by individual residents and business owners as they improve the efficiency of their homes and buildings. While implementing this plan will be aided by a sustained and strategic pub-lic investment by the state and federal governments, the City and other region-al players can serve as catalyzing agents by actively advocating for and partici-pating in the financial mechanisms and
policies that support the goals of this document. The City stands to benefit from a more resilient local economy with increased economic development through job creation.
Investing in energy efficiency and renewable energy systems can make sound fiscal, social, and environmental sense, be it a family home, a local busi-ness, a school or municipal building. Energy financing eases the cost burden of installing energy efficiency upgrades and installing renewable energy by eliminating the large up-front costs. With the right financing these projects in homes and businesses should pay for themselves due to the reduced energy costs.
Potential StrategiesThese are highlighted potential strate-gies. For more strategies see Appendix X.
Efficiency Smart Residential Rebate EnhancementsOMLPS working with POWER will promote and enhance the residential appliance rebates available through Efficiency Smart to further encourage the community in upgrading to more energy efficient appliances.
Energy Special Improvement District (ESID)An ESID is a way to access capital, which allows a property owner to
Present Strategies in Achieving Climate Positive
Strategy Lead Entity Timeline Benefits
Energy Efficient Mortgages (EEM) Federal Government
Ongoing Allows borrowers the opportunity to finance cost-effective, energy-saving measures through the home mortgage
Bonds Ohio Air Quality Development Authority (OAQDA)
Ongoing Financing for local governments and businesses to support renewable energy projects
State/Federal Tax Incentives and Loans Ohio and Federal Ongoing Loans and tax incentives are available for resi-dents and businesses
Community Housing Improvement Program (CHIP)
City Ongoing – dependent on state and federal distribution of funds
Grants and deferred loans to households for rehabilitation including weatherization of homes
Achieving Climate Positive • Oberlin Climate Action Plan

42
install alternative energy and perform energy efficiency work by financing the work without upfront costs. The financing is then paid for through a special assessment on the property tax bill. This program is being evaluated on a county-wide basis, which would include Oberlin.
Local Energy Capital FundDevelop a local revolving loan fund that would provide funds at competi-tive rates to finance energy efficiency improvements and alternative energy. The fund would be created with local in-vestment dollars keeping the financing in the community while improving the environment and the economy.
Residential PACEProperty Assessed Clean Energy (PACE) financing supports energy efficiency and alternative energy projects by providing upfront capital through a special assessment on the participant’s property tax bill. PACE financing allows property owners to benefit from imme-diate energy savings while spreading the cost of improvements over a number of years.
For more information on under-standing the needs for alternate types of financing see “Barriers to Efficiency and Renewable Energy Projects” in Appendix X.
ConclusionFinancing of energy efficiency and renewable energy projects can make these projects happen when they oth-erwise would not have moved past the proposal stage. Numerous federal, state, and regional incentives are available to assist with funding some of the more expensive strategies related to renew-able energy. Further, there is potential to leverage financing opportunities by partnering with other jurisdictions in the county to administer joint pro-grams as in the possibility of an Energy Special Improvement District. With properly designed energy financing available, businesses, residents, and government can invest in energy effi-ciency and renewable energy projects that are self-sustaining.
PolicyPolicy legislation serves an important role in the strategic rollout and imple-mentation of the goals of the 2013 CAP. Policy decisions, including the decisions by City Council to join ICLEI and the Climate Positive Development Program have been crucial in developing the direction and goals of carbon neutrality while improving the local economy. Policy actions are the tools that will be used to both guide and direct the City in implementing the 2013 CAP and serve as a roadmap for best practices and prioritization. Policy Matters Ohio has been working with the City, the College, and the Oberlin Project to develop a set of tools or policy platform to guide our efforts in developing pri-orities for achieving our goal of a more sustainable community.
Potential StrategiesPolicy strategies currently being researched for implementation over the coming two years include (see Appendix X for complete list):
Local Living / Live Near Your Work Policy InitiativeThis program, which is working well in other college towns, provides direct financial assistance for eligible employ-ees to encourage homeownership near the place of employment, serving to benefit employees, employers, and the community. For the community as a whole, this program works by improv-ing air quality, reducing urban sprawl and traffic congestion, rehabilitating neighborhood housing stock, support-ing area businesses, diversifying the economy, contributing to the tax base, and by helping to achieve a greater bal-ance between homeowners and renters in targeted neighborhoods.
Enabling employees to live closer to their workplaces minimizes the daily commute, encourages alternate means of travel including walking and biking, and reduces household energy costs all which improve the quality of living. Further, the financial benefit of this pro-gram helps to ensure the family’s ability to purchase a home.
For the employer, this program improves employee morale and
Financing Benefits for EE and RE Projects
Key financing benefits for energy efficiency and renew-
able energy projects include: • Leverage existing energy
efficiency programs and their funding sources
• Minimize the amount of public dollars used
• Bring local private capital into local market
• Generate opportunities for local businesses
• Help to conduct “deep” retrofits
Oberlin Climate Action Plan • Achieving Climate Positive
43Achieving Climate Positive • Oberlin Climate Action Plan
productivity, and encourages staff to plant long-term roots in the communi-ty, resulting in reduced turnover and reduced training costs. It also serves to revitalize the community the employer resides in, making it more attractive to customers, clients, and future staff recruits.
Existing structures within Oberlin, including the City’s Oberlin Community Improvement Corporation (OCIC) could potentially be a strong conduit for this type of program.
Residential Energy Disclosure PolicyThis practice already successful in Austin, TX, requires home sellers and landlords to disclose energy bills to potential homebuyers and renters. This policy increases market awareness of EE and promotes the message that a home's energy use is an important factor that home-buyers can consider as part of their purchasing or renting decision. This in turn drives demand for more efficient housing stock while positively impacting job and business growth in the efficiency sector. It is suggested that this begin as a voluntary program in Oberlin.
Measurement and VerificationMeasurement and verification is required by both ICLEI and by the CPDP in order to achieve Climate Positive Participant status. To meet the criteria set out in the CPDP, the CAP must “clearly identify measurement protocol or calculation methodology Development Partners plan to employ in order to calculate and verify actual emissions.” Measurement and verifica-tion of actual emissions reductions will assure that the City is making progress toward the short- and long-term goals adopted by City Council in 2011.
Goals and Measurement/Verification ScheduleUsing 2007 as baseline GHG emis-sions, the City set goals of reducing greenhouse gas emissions at least 50% below baseline by 2015, at least 75% below baseline by 2030, and below zero by 2050 at the latest. To achieve these goals, the City must eliminate 87,195 tons of CO2e by 2015, at least 130,793 tons CO2e by 2030 and at least 174,391
CO2e by 2050.To bring clarity in achieving the
adopted GHG emission reduction goals, the City is looking at incremental goals of at least 1.5% emissions reductions each year. This equates to 2,616 tons annually or 13,079 tons CO2e every five years. A revised GHG inventory is planned every five years.
Emissions Reductions Estimates in this PlanThroughout this document, many strat-egies are accompanied by estimated reduction in greenhouse gas emissions, expressed as carbon dioxide equivalent (CO2e). The estimates in this plan were primarily generated using the ICLEI Climate and Air Pollution Planning Assistant (CAPPA), a tool developed with the assistance of hundreds of local governments. In the transporta-tion section, estimates were provid-ed by the Center for Neighborhood Technology as part of the Energy Efficient Transportation Plan for Oberlin and Northern Ohio. The emissions coef-ficients and methodology employed by these tools are consistent with national and international inventory standards established by the Intergovernmental Panel on Climate Change, the U.S. Voluntary Greenhouse Gas Reporting Guidelines, and, for emissions generated from solid waste, the U.S. EPA’s Waste Reduction Model (WARM).
Future Greenhouse Gas Emissions Inventory The City will be responsible for con-ducting future greenhouse gas emis-sions inventories. In conducting future emissions inventory, the City expects to adopt the Global Protocol for Community-Scale GHG Emissions (GPC) developed jointly in 2011-12 by the C40 Cities Climate Leadership Group and ICLEI Local Governments for Sustainability.
It is recommended that the City update its baseline emissions inventory using this newly developed protocol in order to both better capture baseline emissions and identify or develop tools that will be used for future invento-ries. The next emissions inventory to measure and verify progress will be compiled and calculated in 2013 using
emissions for the year 2012.
Measurement and Verification of Climate Positive CreditsClimate Positive Credits must also be measured and verified in order to count as an emissions reduction for the City. The most appropriate methodology should be selected to quantify Climate Positive Credits, and the process of verifying credits should also establish that the credits are connected to the City or its partners (relevant) and would not have been accomplished without the work of the City or its partners (addi-tional). In the case of Climate Positive Credits associated with projects such as energy efficiency improvements, refor-estation, and agricultural or land use changes, relevant carbon offset proto-cols should be used such as the ACUPCC Voluntary Carbon Offset Protocol, Verified Carbon Standard, or subsets of these protocols.
Additional Considerations To the greatest extent possible future decisions in planning and development within the City should be take GHG emission impacts into consideration. This includes changes in land use and new construction. New large-scale de-velopment projects should utilize tools such as the Climate Positive Modeling Tool developed by the consulting firm Arup to fully account for emissions associated with land use changes, con-struction, transportation, energy use, water and storm water, and waste. This will better enable the City to aim proac-tively for climate positive developments at the beginning of any development process.
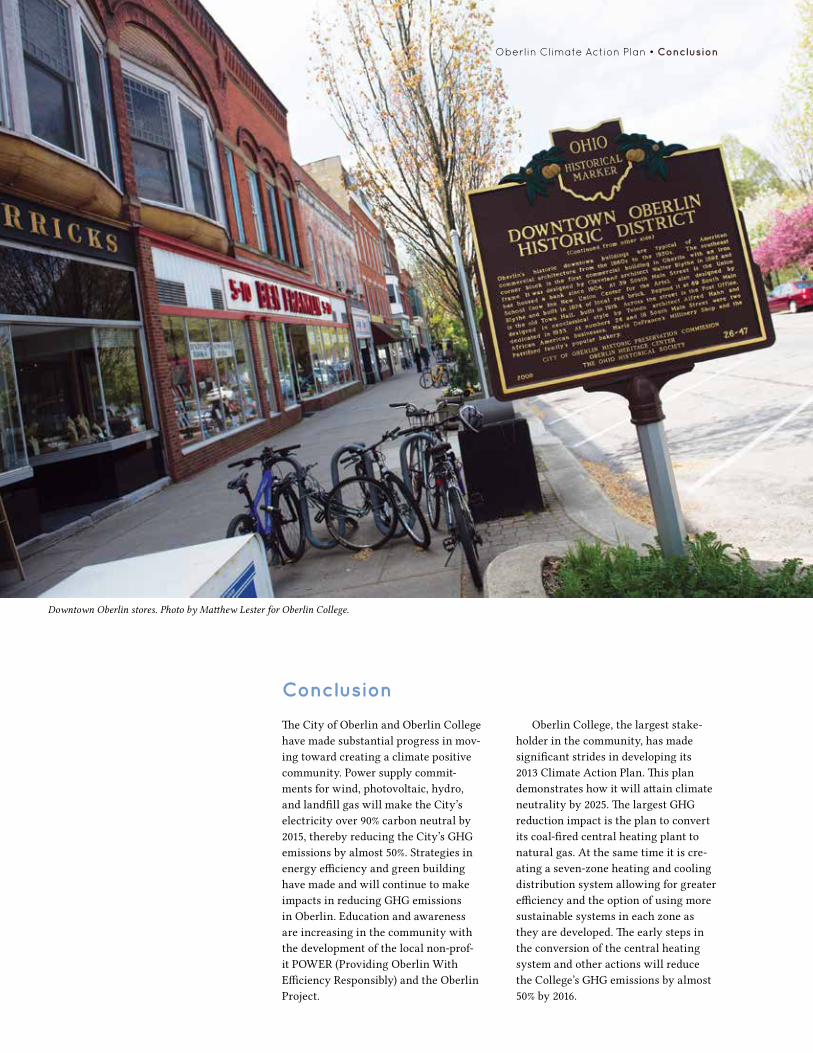
44
Conclusion
Downtown Oberlin stores. Photo by Matthew Lester for Oberlin College.
Oberlin Climate Action Plan • Conclusion
The City of Oberlin and Oberlin College have made substantial progress in mov-ing toward creating a climate positive community. Power supply commit-ments for wind, photovoltaic, hydro, and landfill gas will make the City’s electricity over 90% carbon neutral by 2015, thereby reducing the City’s GHG emissions by almost 50%. Strategies in energy efficiency and green building have made and will continue to make impacts in reducing GHG emissions in Oberlin. Education and awareness are increasing in the community with the development of the local non-prof-it POWER (Providing Oberlin With Efficiency Responsibly) and the Oberlin Project.
Oberlin College, the largest stake-holder in the community, has made significant strides in developing its 2013 Climate Action Plan. This plan demonstrates how it will attain climate neutrality by 2025. The largest GHG reduction impact is the plan to convert its coal-fired central heating plant to natural gas. At the same time it is cre-ating a seven-zone heating and cooling distribution system allowing for greater efficiency and the option of using more sustainable systems in each zone as they are developed. The early steps in the conversion of the central heating system and other actions will reduce the College’s GHG emissions by almost 50% by 2016.

45Conclusion • Oberlin Climate Action Plan
As described in this plan, the City and Oberlin College have initiated numerous strategies, and identified others that will reduce further GHG emissions in all sectors by emphasizing energy efficiency and transitioning to less carbon intensive and carbon neutral primary energy sources. The City and College consider their CAPs to be works in progress and will continue to evalu-ate strategies and actions to attain the ultimate goal of being climate positive.
Looking Ahead: Adaptation and ResilienceNatural disasters are occurring with increasing frequency and severity: Katrina, Fukushima, Haiti, Irene, and Sandy. The discussion about sustainabil-ity has been primarily concerned with prevention of further climate change and is the major focus of this and most CAPs. It is becoming clear that adap-tation is important as well because we failed to prevent the dangerous buildup of carbon dioxide in the atmosphere.
As a result, we are experiencing more extreme weather events. It is highly likely that today’s extremes will become increasingly more severe in an environment where “the normal” is con-tinually shifting. No matter what we do, Oberlin and the rest of the planet will experience significant warming and its multiple consequences. We recog-nize that adaptation needs to be fully addressed as we move forward.
The standard for adaptive strate-gies – behavioral, technological, and infrastructural changes – is resilience, which is the capacity of ecosystems, the built environment, communities, and people to absorb varied changes without significant change in core functions and values. Creating resilient patterns of habitation that can absorb the expect-ed variances of climate change and adaptive strategies for when resilience is overcome are concerns that will need to be addressed.
Adaptation and resilience are topics of concern even as we move toward becoming climate positive. ICLEI has recognized this need and developed the next generation of sustainability planning tools including the STAR Community Index and the
Sustainability Planning Toolkit to assist governments in preparing for adapta-tion and resiliency in their communi-ties. The City of Oberlin and Oberlin College will continue in leadership roles as they strive to transform Oberlin into an even more sustainable and livable community.
the City and College consider their Climate Action Plans to be works in progress and will continue to evaluate strategies and actions to
attain the ultimate gOal Of being climate pOsitive.
"
"
Oberlin's Farmers' Market in summer, 2009. Photo by John Seyfried for Oberlin College.
Oberlin College student Kobi Shevin taking a water quality sample at Plum Creek. Photo by Chris Canning '12.

46 Oberlin Climate Action Plan • Table of Greenhouse Gas Reductions
Table of Greenhouse Gas Reductions
Renewable Energy Generation
Present Strategies CO2e tons reduction
Belleville Hydro Project
New York Power Authority - Niagara and St. Lawrence Hydro Projects
Ohio Renewable Energy Services, LLC – Erie County Landfill Gas (LFG)
AMP JV6 – Bowling Green Wind Project
Iberdrola Renewables Blue Creek Wind Project
Spear Point Solar One, LLC Oberlin College Solar Field
Purchasing Natural Gas Blended with Methane for City Buildings
Customer–Owned Solar Generation
Waste Management Renewable Energy, LLC – Mahoning and Geneva County LFG
AMP Hydro Phase I – Cannelton, Smithland, and Willow Island
AMP Hydro Phase II – Meldahl and Green-up
Sustainable Reserve Fund
Electric Vehicle Charging Stations
Potential Strategies
AMP Hydro Phase III – R.C. Byrd and Pike Island Projects
Replace Natural Gas for Heating
Replace Gasoline and Diesel Fuel
Capitalize on the REC Market
Energy Efficiency
Present Strategies CO2e tons reduction
Heat Loss Inspections
Industrial Audits
Promotion of Compact Fluorescent Light Bulbs
Energy Efficiency at OMLPS Power Plant
Energy Efficiency at OMLPS Technical Services Office
Energy Efficiency at Water Environment Protection Facility
Energy Efficiency at Water Treatment Plant
Traffic Light Upgrades to Light Emitting Diodes (LEDs)
Building Efficiency Upgrades to Parks and Cemetery Building
Building Efficiency Upgrades to City Facilities
Downtown Christmas Lighting Upgrade to LEDs
Lighting Upgrades to City Buildings
Efficiency Smart
Oberlin Super Rebate Program
Efficiency Upgrades to City Office Equipment
Develop One-Stop Shop for Residential Energy Efficiency Information and Assistance - POWER

47Table of Greenhouse Gas Reductions • Oberlin Climate Action Plan
Potential Strategies
Building Performance Disclosures for Residential and Commercial Properties
Develop One-Stop Shop for Commercial Energy Efficiency and Assistance
Evaluate and Consider Adoption of Smart Grid Technologies for Future Real-Time Monitoring of Energy Consumption and Load Control Opportunities
Transportation
Present Strategies CO2e tons reduction
Wayfinding Signage
Safe Route to Schools
Expand Bicycle and Pedestrian Infrastructure
Bicycle Parking at Events
Bicycle Giveaway
Bicycle Tourism Program
Bicycle and Pedestrian Education and Safety
Oberlin Connector Transit Service
Regional Transit Coordination
WestShore Corridor Transportation Project
Biofuel Pumping Station
Electric Vehicle Charging Stations
Alternative Fuel Station for Consumers
Alternative-Fueled and Hybrid Vehicles
Efficient Fleet Standards
Anti-Idling training
Eco-Driving training
Increase Carpooling/Car-Sharing
Rethink Your Ride – Mode Shift Competition
Potential Strategies
Adopt Complete Streets Policy
Explore Changes to Parking Infrastructure and Policies
Explore Low-Carbon Solutions for Cargo Transport
Explore Option for Low-Carbon Long Distance Travel
Green Building
Present Strategies CO2e tons reduction
Oberlin College Green Building Policy
City Green Building Policy
Planet Footprint to Monitor Municipal Gas and Electric Use
Rehabilitation of Lorain Metropolitan Housing Authority (LMHA) Housing in Oberlin
Potential Strategies
Facilitate Development of City-Owned Green Acres Property
Develop Commercial and Residential Green Building Certification Programs
Establish Procedures and Policies that Encourage Green Building

48
Waste Management
Present Strategies CO2e tons reduction
Residential Curbside Recycling
Commercial and Institutional Recycling
Composting
Anaerobic Digestion
Land Application of Class B Bio-Solids
Co-Generation from Anaerobic Digestion
Potential Strategies
Develop and Implement a Zero Waste Plan
LFG Generator Waste Heat Recovery Feasibility Study
Evaluate Additional Anaerobic Digestion Opportunities to Maximize Methane Production for Re-Use in the Co-Generation System
Evaluate Costs and Benefits Associated with the Production of Class A Bio-Solids
Education
Present Strategies CO2e tons reduction
Media Marketing of Sustainability Opportunities and Benefits
Develop New/Enhanced Sustainability Curricula at Oberlin City Schools and Other Institutions of Learning
Install Bioregional Dashboard at Various Locations in the Community
Complete STARS Assessment at All Partner Schools
Partner with POWER to Raise Awareness of Residential Energy Opportunities
Potential Strategies
Create a Community and/or Business Environmental Award
Promote Green Business and Green Restaurant Membership
Develop Support of a Buy Local Compaign
Annual Speaker and Film Series
Hold Community Workshops to Educate the Community
Achieving Climate Positive
Present Strategies CO2e tons reduction
Climate Positive Credits: Local Carbon Offset Pilot
Climate Positive Credits: Greenhouse Pilot
Community Housing Improvement Program (CHIP)
Potential Strategies
Energy Special Improvement District (ESID)
Local Energy Capital Fund
Residential PACE
Local Living / Live Near Your Work Policy Initiative
Residential Energy Disclosure Policy
Oberlin Climate Action Plan • Table of Greenhouse Gas Reductions
49Acknowledgements • Oberlin Climate Action Plan
AcknowledgementsClimate Action CommitteeLinda ArbogastJeff BaumannGary BoyleKristin BraziunasBryan BurgessSteve DupeeRick FloodRosa GadsdenRob LamppaCarl McDanielDoug McMillanEric NorenbergJohn PesuitRobert SmithBryan StubbsJordan SuterJennifer Wilson
Additional Climate Action Subcommittee Members and AdvisorsHeather AdelmanJoyce BabyakRebecca BagleyNorm BevanKelley BrittBob CoanCourtney DeOreoBridget FlynnCindy FrantzBrian FrederickJanet HaarCharles HortonPaul KobulnickyGeorge LambertJessica MinorSteve MoreyDavid OrrJerry PavlikSharon PearsonMico PeralesTita ReedDerrick RobbinsSheri RunalsJan RybarczykTerri SanduJohn SchrothSavitri SedlacekDonna SmithDavid SonnerFred SwansonAmy Szmania
2007 GHG Emissions InventoryNathaniel MeyerJohn Petersen
2011 Climate Action PlanSavannah Sullivan
Center for Neighborhood Technology (CNT)Jen McGrawKyle Smith
Center on Wisconsin StrategySatya Rhodes-Conway
Clinton Climate Initiative Zach Tofias
Oberlin Project
Ohio Environmental CouncilBrian KaiserNolan Moser
Ohio Partners for Affordable EnergyStacia Harper
Policy Matters OhioAmanda Woodrum
DOE report - compiled byNancy London
Copy EditorJames Sunshine
Graphic DesignerStacy Harrison

50
AbbreviationsAJLC – Adam Joseph Lewis Center for Environmental Studies
CAP - Climate Action Plan
CFL – Compact Fluorescent Light
CHIP – Community Housing Improvement Program
CNT - Center for Neighborhood Technology
CPDP – Climate Positive Development Program
EV – Electric Vehicle
GHG - Greenhouse Gas
HTG – Heat Trapping Gas
kW – Kilowatt
kWh – Kilowatt hour
LCCC - Lorain County Community College
LCJVS - Lorain County Joint Vocational School
LED – Light Emitting Diode
LEED – Leadership in Energy and Environmental Design
LGIF – Local Government Innovation Fund
NEOSCC – Northeast Ohio Sustainable Communities Consortium
NOACA – Northeast Ohio Areawide Coordinating Agency
OAQDA – Ohio Air Quality Development Authority
OC - Oberlin College
OCSD - Oberlin City School District
ODOT – Ohio Department of Transportation
OMLPS - Oberlin Municipal Light and Power System
POWER - Providing Oberlin with Efficiency Responsibly
PV – Photovoltaic
RCRC - Resource Conservation and Recovery Commission
REC – Renewable Energy Credit
STARS - Sustainability Tracking, Assessment and Rating System
SVO – Straight Vegetable Oil
TLCI – Transportation for Livable Communities Initiative
USGBC – United States Green Building Council.
VMT – Vehicle Miles Traveled
VOC – Volatile Organic Compound
Oberlin Climate Action Plan • Abbreviations

51Appendix I: Climate Change • Oberlin Climate Action Plan
Appendix I: Climate ChangeThe scientific consensus on the basic scientific conclusions that climate warming is happening and human activities are a major cause is supported by numerous anal-yses of the climate science literature. A recent analysis by the National Academy of Sciences affirms that, using a database of 1,372 climate scientists, “(i) 97–98% of the climate researchers most actively publishing in the field support the tenets of anthro-pocentric climate change [ACC] outlined by the Intergovernmental Panel on Climate Change, and (ii) the relative climate expertise and scientific prominence of the re-searchers unconvinced of ACC are substantially below that of the convinced research-ers.” (William R. L. Anderegg, James W. Prall, Jacob Harold, and Stephen H. Schneider, Expert credibility in climate, [http://www.pnas.org/content/early/2010/06/04/1003187107.full.pdf+html]).
Numerous books have been written on climate change over the past three decades. The following are among the best general audience books.
Richard Alley, The Two-Mile Time Machine: Ice Cores, Abrupt Climate Change, and Our Future (Princeton:Princeton University Press, 2011)
Climate Central, Global Weirdness: Severe Storms, Deadly Heat Waves, Relentless Drought, Rising Seas and the Weather of the Future (New York: Pantheon, 2012)
Tim Flannery, The Weather Makers: How Man Is Changing the Climate and What It Means for Life on Earth (New York: Atlantic Monthly Press, 2005)
Ross Gelbspan, The Heat is ON: The High Stakes Battle over Earth’s Threatened Climate (Reading, MA:Addison-Wesley, 1997)
James Hanson, Storms of My Grandchildren: The Truth About the Coming Climate Catastrophe and Our Last Chance to Save Humanity (New York: Bloomsbury USA, 2009)
Bill McKibben, The End of Nature (New York: Random House, 1987)
Bill McKibben, Eaarth: Making a Life on a Tough New Planet (New York: Times Books, 2010)
National Research Council, Abrupt Climate Change: Inevitable Surprises (Washington, DC: National Academies Press, 2002)
Naomi Oreskes and Erik M. Conway, Merchants of Death: How a Handful of Scientists Obscured the Truth on Issues from Tobacco Smoke to Global Warming (New York::Bloomsbury Press, 2010)
James Powell, The Inquisition of Climate Science (New York: Columbia University Press, 2011)
Stephen H. Schneider, Global Warming: Are We Entering the Greenhouse Century? (San Francisco: Sierra Club Books, 1989)
Spencer R. Weart, The Discovery of Global Warming (Cambridge: Harvard University Press, 2003)
Three websites that are useful for understanding climate science Global Warming entry on Wikipedia provides a detailed discussion and refer-ences (http://en.wikipedia.org/wiki/Global_Warming).
Science Daily is an excellent source of the latest, scientific-based articles on climate change (www.sciencedaily.com).
Climate Central is an excellent website for the latest information on climate change (www.climatecentral.org).

52
Appendix II: Municipal Inventory ResultsThe municipal emissions inventory includes emissions from municipal operations outside of the city limits of Oberlin and thus is not entirely a subset of the communi-ty-wide inventory (see Figure 7). Municipal operations were responsible for emitting 11,400 tons CO2 in 2007.
Oberlin Climate Action Plan • Appendix II: Municipal Inventory Results
Two recent articles that together succinctly present the challenge before usBill McKibben, Global Warning’s Terrifying New Math: Three simple numbers that add up to global catastrophe and that make clear who the real enemy is (Rolling Stone, August 2, 2012) (http://www.rollingstone.com/politics/news/global-warmings-terrifying-new-math-20120719)
Dan Satterfield, NASA Climate Expert James Hansen & An Amazing Forecast (http://blogs.agu.org/wildwildscience/2012/08/10/nasa-climate-expert-james-han-sen-an-amazing-forecast/). [This is a general audience discussion of Hansen, J., Mki. Sato, and R. Ruedy, 2012: Perception of climate change. Proc. Natl. Acad. Sci., 109, 14726-14727, E2415-E2423, doi:10.1073/pnas.1205276109 {http://pubs.giss.nasa.gov/docs/2012/2012_Hansen_etal_1.pdf}]
Buildings & Other facilities
Heating
Combustion of fossil fuels at electricity generating facilities outside municipal operational control
TOTAL MUNICIPAL OPERATIONS EMISSIONS SOURCE OF GHG EMISSIONS
Streetlights
Water/Sewage
Vehicle fleet
employee Commute
Solid Waste
Other
electricity
On-site combustion of natural gas
Municipal electricity Generation On-site combustion of fossil fuels
On-site combustion of natural gas (in facilities & electricity generators)
Combustion of automobile fuel
Landfilled solid waste
Composted brush & leaves
fugitive refrigerant emissions (vehicle A/C)
Landfilled solid waste
Figure 7: Municipal Operations Emissions

53Appendix III: Renewable Energy • Oberlin Climate Action Plan
Appendix III: Renewable EnergyPresent Strategies
AMP Joint Venture 5 – Belleville Hydro ProjectImplementation year(s): 1999 – 2050Lead entity: OMLPSProjected GHG reduction: 8,182 tons CO2e
Forty-two AMP member communities, including Oberlin, own the Belleville Hydro Plant located on the Ohio River in Belleville, West Virginia. The City owns 1.3 MW of generation from this 42 megawatt plant supplying approximately 7.1% of the communi-ty’s annual power requirements.
New York Power Authority (NYPA) – Niagara and St. Lawrence Hydro ProjectsImplementation year(s): 1999-2030Lead entity: OMLPSProjected GHG reduction: 1,986 tons CO2e
The City receives an allocation of .455 MW of federal preferential hydro power from the New York Power Authority. This hydroelectric power supplies 2.4% of the City’s annual power requirements.
Ohio Renewable Energy Services, LLC – Erie County Landfill GasImplementation year(s): 2010 – 2022Lead entity: OMLPSProjected GHG reduction: 3,615 tons CO2e
In 2010, the City contracted to purchase .66 megawatts of capacity through AMP from the Erie County landfill gas generation project located near Milan, Ohio. Three cities including Oberlin purchase power from this landfill gas generation project rated at 1.6 MW. This landfill gas generation supplies approximately 4% of the City’s annual power requirements.
Figure 8: Municipal Operations Emissions by Sector and Energy Source
54
AMP Joint Venture 6 – Bowling Green Wind ProjectImplementation year(s): 1999 - 2030Lead entity: OMLPSProjected GHG reduction: 360 tons CO2e
The City is a joint owner with nine other communities in a four-turbine wind genera-tion project located in Bowling Green, Ohio. The four wind turbines are rated at an ag-gregate capacity of 7.2 megawatts. The City’s ownership share of the project is .25 MW supplying approximately 0.4% of the City’s annual power requirements. It is important to note that this joint project developed through AMP was the first utility scale wind farm to be developed and constructed in Ohio.
Iberdrola Renewables - Blue Creek Wind ProjectImplementation years: 2012-2022Lead entity: OMLPSProjected GHG reduction: 1,440 tons CO2e
In 2012, the City contracted to purchase 1 MW of capacity through AMP from the 350 MW Blue Creek Wind project located in Van Wert, OH.
Spear Point Solar One, LLC – Oberlin College Solar FieldImplementation year(s): 2011 – 2036Lead entity: Oberlin CollegeProjected GHG reduction: 2270 CO2e tons
In 2012, Oberlin College contracted to purchase power from a 2.27 MW single axis tracking photovoltaic generation project owned by Oberlin Spear Point Solar One, LLC and constructed on Oberlin College Property located in New Russia Township, OH. The project is interconnected to the City's electric distribution system and energy is credited to the College's monthly retail generation costs.
Strategy: Purchasing Natural Gas Blended With Methane for City BuildingsImplementation year(s): 2009 - ongoingLead entity: OMLPSProjected GHG reduction: 25 CO2e tons
In 2009, the City contracted to purchase its natural gas supply from Integrys Energy Services. Integrys has a voluntary program, Ecovations™ Renewable Gas which pro-vides 8% carbon-neutral gas to be included in a customer’s gas supply. This program provides for carbon reduction by using carbon-neutral gas and purchasing carbon offsets. In 2010, the City consumed 5,893 MBtu of natural gas which would have had GHG emissions of 314 CO2e tons. The blending of methane reduced the GHG emissions by 25 CO2e tons.
Customer-Owned Solar GenerationImplementation year(s): ongoingLead entity: Private interests and OMLPSProjected GHG reduction: 183 tons CO2e will increase as customers add solar generation
Oberlin passed a net metering ordinance in 2000 to allow customers interconnection to the City's electric distribution grid. This net metering agreement allows customers to feed power back to the grid when the PV system produces more electricity than what is being used at a given time. Customers who have up to 10 kW of PV receive full credit for the power produced by offsetting usage up to their total annual usage. Customers who install more than 10 kW must sign a net metering agreement with the City to install and receive credit for any excess electricity produced. In this case full credit is given for kW hours produced but the standard monthly distribution charge is based on the peak demand of the facility. At the present time there are nine photovoltaic (PV) installations in Oberlin. Four of these are on residential homes and five are on com-mercial buildings. These provide a combined total of 200 kW installed solar.
Oberlin Climate Action Plan • Appendix III: Renewable Energy

55
Waste Management Renewable Energy, LLC – Mahoning and Geneva County Landfill GasImplementation year(s): 2013 – 2027Projected GHG reduction: 44,365 tons CO2e
In 2011, the City contracted to purchase 8.1 MW of capacity through AMP from the Mahoning County and Geneva County landfill gas generation projects owned and operated by Waste Management Renewable Energy. The City of Oberlin is the sole pur-chaser of power from these projects. This landfill gas generation will supply approxi-mately 56% of the City's annual power requirements.
AMP Hydro Phase I – Cannelton, Smithland, and Willow Island Hydro ProjectsImplementation year(s): 2013 - 2080Lead entity: OMLPSProjected GHG reduction: 9,319 tons CO2e
In 2007, the City contracted to purchase 2.6 MW of capacity from three new hydroelec-tric projects under development on the Ohio River by AMP. These plants are located at the Cannelton Locks and Dam, the Smithland Locks and Dam, and the Willow Island Locks and Dam. It is estimated that these projects will supply 12% of the City’s annual power requirements.
AMP Hydro Phase II - Meldahl and Green-up Hydro ProjectsImplementation year(s): 2014 - 2080Lead entity: OMLPSProjected GHG reduction: 2,815 tons CO2e
In 2009, the City contracted to purchase .84 MW of of capacity from two hydroelectric plants including an existing facility and a new facility presently under construction. The existing facility is located at the Green-up Locks and Dam and the new facility under construction is located at the Meldahl Locks and Dam. The projects are owned and developed jointly as a partnership between AMP and the City of Hamilton, OH. It is estimated that these projects will supply 4% of Oberlin's annual power requirements.
Sustainable Reserve FundImplementation year(s): 2007 - OngoingLead entity: OMLPSProjected GHG reduction: TBD
In 2007, Oberlin City Council established a Sustainable Reserve Fund (SRF) to provide grants and leverage other funding sources for community-based, utility related, envi-ronmentally-friendly initiatives demonstrating energy efficiency, energy conservation, greenhouse gas reductions, and/or development of green power generation resources. The SRF is funded through the sale of energy attributes to Oberlin College. Grants from the SRF have been used to insulate low income homes, perform a local wind study, assist in developing a local biodiesel fuel station, procure and install concentrated solar arrays from a local manufacturer, and create an energy auditing and efficiency advocacy program.
Appendix III: Renewable Energy • Oberlin Climate Action Plan

56
Appendix IV: Energy EfficiencyPresent Strategies
Heat Loss InspectionsImplementation year: 2000 - ongoingLead entity: OMLPSProjected GHG reduction: 18 tons CO2e
OMLPS offers free heat loss inspections for residential and small commercial cus-tomers. Over 550 inspections have been completed over 10 years. This inspection includes a blower door test and thermal scan of the building or home with an infra-red camera. Heat loss areas are identified and recommendations to address problem areas are provided to the customer. This service provides customers the opportunity to identify and make energy efficiency upgrades to their homes. It further develops a growing awareness of energy inefficiencies in the community.
Industrial Audits – Department of Energy Industrial Assessment GrantsImplementation year(s): 2005 - ongoingLead entity: OMLPSProjected GHG reduction: 42 tons CO2e
Through its Key Account “Direct Connections” Program, OMLPS and AMP secured four industrial energy audits for Oberlin’s largest manufacturing customers. These audits inspected the mechanicals, HVAC, building egresses, and processes for each company. The opportunity for an average of 12% energy savings for these large commercial customers was identified through the audits. OMLPS and AMP continue to work to find methods of helping large commercial customers reduce their energy costs.
Promotion of Compact Fluorescent Light (CFL) BulbsImplementation year: 2007 - ongoingLead entity: OMLPSProjected GHG reduction: 83 tons CO2e additional reduction annually
CFLs use 75% less electricity than an incandescent bulb. OMLPS offers a no-cost CFL bulb to each customer on an annual basis. On the average OMLPS, hands out 950 CFL bulbs to its customers each year. Based on a usage of four hours per day per bulb this annual offering reduces the electrical usage in Oberlin by an additional 106,800 kWh every year, an equivalent of twelve households per year.
Energy Efficiency at OMLPS Power Plant Implementation year(s): 2007-2010Lead entity: OMLPSProjected GHG reduction: 444 tons CO2e
Lighting upgrades in the plant included replacing high pressure sodium (HPS) high bay fixtures with induction and fluorescent lighting. Replacing the HPS fixtures not only increased efficiency of the fixtures but provided the ability to turn fixtures off in areas where lighting was not needed at certain times. Jacket water electrical con-sumption was reduced dramatically through the use of programmable logic control-lers (PLC’s) and variable frequency drives (VFD’s) on the jacket water pumps. VFD’s were also installed on cooling system pump motors reducing the consumption of electricity. The power consumption in the plant was reduced from 1,298,400 kWh in 2007 to 694,000 kWh in 2010 resulting in an annual power reduction of 604,000 kWh.
Oberlin Climate Action Plan • Appendix IV: Energy Efficiency
57
Energy Efficiency at OMLPS Technical Services Office Implementation year(s): 2007-2010Lead entity: OMLPSProjected GHG reduction: 24 tons CO2e
The OMLPS technical services department has been very successful in reducing its annual electrical consumption since 2007. Electric resistance heating was replaced with mini-split heat pumps which use a third of the electricity to heat the office area and break room. These units are also more efficient than the air conditioning units that had been in use thus reducing cooling costs as well. Additional cellulose insulation was added to the attic area above the garage area and foam insulation was applied to the roof sheeting in the second floor storage area above the office. Lighting controls were also installed in the technical service work area. These controls use both infrared and motion sensors as they control the lighting in different work areas to provide light when needed and automatically turn them off when they are not. A 3.8 KW solar array was added to the roof in 2008 producing 9% of the annual con-sumption of the building, reducing power needed from the grid. These upgrades have reduced the annual power consumption from 76,040 kWh to 43,000 kWh, a reduction of 33,040 kWh annually.
Energy Efficiency at Water Environment Protection Facility Implementation year(s): 2007-2010Lead entity: Water Environment Protection FacilityProjected GHG reduction: 176 tons CO2e
The energy efficiency work at the Water Environment Protection Facility has includ-ed installing VFDs on various pumps, changing incandescent to fluorescent lighting, upgrading heating and cooling systems to mini-split heat pumps, and improving me-chanical systems. In 2007 the annual consumption of the plant was 1,124,080 kWh. After the efficiency upgrades, the consumption in 2010 was 885,440 kWh resulting in a 21% decrease in annual electrical consumption.
Energy Efficiency at Water Treatment Plant Implementation year(s): 2008 - 2010Lead entity: Water Dept.Projected GHG reduction: 48 tons CO2e
Approximately $4.2 million in upgrades at the Water Treatment Plant and the Raw Water Pump Station to replace obsolete equipment including pumps, motors, control systems, process equipment, compressors, HVAC, and mechanical systems. From 2006 to 2009, the annual electrical consumption averaged 607,113 kWh. In 2010, after the improvement project was substantially complete, electrical consumption was 541,320 kWh, a 12.15% decrease.
Traffic Light Upgrades to Light Emitting Diodes (LEDs)Implementation year(s): 2009 - 2010Lead entity: OMLPSProjected GHG reduction: 59 tons CO2e
Oberlin began converting its traffic signals from incandescent bulbs to LEDs in 2009. LEDs in traffic signals consume 70% less energy than incandescent bulbs, last up to ten times longer, and require less maintenance. In the case of traffic signals, the conversion pays for itself in three to four years depending on whether the conversion involves upgrading the present signal with LEDs or is a complete replacement of the signal. Furthermore, the greatly increased lifetime of the lights reduces maintenance and the run time of trucks performing re-lamping work. Upgrading to LED traffic signals in Oberlin has reduced the electrical consumption for traffic signal control by two thirds.
Appendix IV: Energy Efficiency • Oberlin Climate Action Plan

58
Building Efficiency Upgrades to Parks and Cemetery Building Implementation year(s): 2007 - 2010Lead entity: Cemetery and Parks Dept.Projected GHG reduction: 14 tons CO2e
Dryvit system was installed on the exterior walls of building increasing R-value from R-3 to R-13. Cellulose insulation was added to the attic of the building bringing the R-value to R-38. Steel frame windows were replaced with triple-pane, low-e ar-gon-filled vinyl replacement windows reducing air leakage and thermal losses. More efficient mini-split heat pumps were installed to supplement the gas furnace.
Building Efficiency Upgrades in City FacilitiesImplementation year(s): 2009 – OngoingLead entity: Public WorksProjected GHG reduction: 7 tons CO2e in 2010
Additional monitoring of GHG emission reductions from city building upgrades will be accomplished with the Planet Footprint Environmental Scorekeeper subscription which tracks municipal buildings utility use.
Recent work includes:
Flat roof over the administrative area of city hall was upgraded with 360 sq. ft. of white reflective roofing, reducing heating costs. An older rooftop HVAC unit in the Police Department was replaced with a new higher efficiency HVAC reducing heat-ing and cooling costs.
Sub-division of office, work and break room space at the Water Distribution metal storage/shop building will allow separate conditioning of occupied spaces. Split sys-tem equipment for heating and air conditioning will provide efficient space heating and cooling. The existing 75 gallon gas-fired hot water heater will be replaced by a tankless hot water heater. New T8 and CFL fixtures in occupied areas combined with (5) DayLight Solar Skylights in parts, garage, and mezzanine areas will improve lighting levels while decreasing electricity consumption.
Future City Projects:
As work was being planned for this rooftop HVAC upgrade in 2010, it was deter-mined that with ducting and control modification a third HVAC for the police department will be eliminated in the future. Further lighting system upgrades are in the plans for City Hall. Surveying and planning in the areas that are lighted 24/7 are being implemented first.
Staff will continue to evaluate opportunities to improve the energy efficiency of building envelopes, lighting systems, and mechanical equipment both as existing systems near the end of their useful lives and as other opportunities arise that would result in decreased energy consumption.
Downtown Christmas Lighting Upgrade to LED Implementation year(s): 2010Lead entity: OMLPSProjected GHG reduction: 90 tons of CO2e
Oberlin replaced 8,500 incandescent Christmas bulbs with the same number of LED bulbs for its downtown holiday lighting. The use of these bulbs reduced the total annual usage for holiday lighting from 124,740 kWh to 2,566 kWh, a reduction of 122,174 kWh in holiday lighting energy use for the City.
Oberlin Climate Action Plan • Appendix IV: Energy Efficiency
R-value: A measure of the flow of energy (heat) through a material. the higher the number the slower the flow of energy.
define it:
59
Lighting Upgrades in City BuildingsImplementation year(s): 2010Lead entity: OMLPSProjected GHG reduction: 9 tons of CO2e
Advances in lighting technology in recent years have made the upgrading of lighting an obvious and cost-effective means of reducing energy use and GHG emissions. The City has budgeted $5,000 in 2011 for lighting upgrades at City Hall, which includes the court and police department. The first of these projects, replacing 100W mercu-ry vapor lights with 15W LED flood light bulbs reduced the electrical use by 11,589 kWh annually. Continued upgrades are in the planning stages and will significantly reduce the lighting power consumption at City Hall over time.
Efficiency SmartImplementation year(s): 2011 - 2013Lead entity: OMLPSProjected GHG reduction: 1035 tons CO2e
In 2010, the City voted to join with forty-six other members of American Municipal Power (AMP) to become part of Efficiency Smart developed by AMP and Vermont Energy Investment Corporation (VEIC). Efficiency Smart will offer an opportuni-ty for all customers in the Oberlin Municipal Light and Power territory to reduce electrical consumption through energy efficiency. VEIC, which has managed and overseen energy efficiency for the entire state of Vermont for the past 10 years, will provide the same oversight in managing Efficiency Smart for AMP communities enrolled in the program. VEIC, a leading energy efficiency provider in the country, has both the experience and knowledge to run a successful energy efficiency pro-gram. Energy efficiency services through Efficiency Smart will be provided through building relationships, providing incentives, and monitoring the results within each community. The projected goal is to reduce MWh use by 1407 MWhs annually by the end of 2013.
Oberlin Super Rebate ProgramImplementation year: 2012-2013Lead entity: OMLPSProjected GHG reduction: TBD
The City of Oberlin increased the energy efficiency rebates available by Efficiency Smart starting the last quarter of 2102 through 2013. Efficiency Smart provides rebates on six types of electrical appliances. The City tripled the amounts on three of the appliances and doubled the rebate on the other three. Sustainable Reserve Funds are being used to provide the additional rebates. OMLPS oversees the program and POWER is providing administrative support.
Efficiency Upgrades to City Office EquipmentImplementation year(s): ongoing Lead entity: CityProjected GHG reduction: 2 tons CO2e per 10 computer and monitor replacements, additional reductions over time as more equipment is upgraded
The City of Oberlin will purchase ENERGY STAR® approved office equipment as equipment needs to be replaced wherever possible. Additionally, the City will publi-cize this ENERGY STAR® recommendation to residential community members and encourage the purchase of efficient home appliances.
Appendix IV: Energy Efficiency • Oberlin Climate Action Plan
60
Develop One-Stop Shop for Residential Energy Efficiency Information and Assistance –Providing Oberlin With Efficiency Responsibly (POWER) Implementation year(s): 2008 – OngoingLead entity: Local non-profit agencyProjected GHG reduction: 8 tons CO2e additional reduction annually
The mission of POWER is to improve and increase awareness of the energy efficiency of homes in Oberlin with a particular focus on Oberlin’s most vulnerable low-income residents. POWER currently achieves this mission by providing energy efficiency ret-rofits, specifically insulation and weatherization, at no cost to low-income homeown-ers in Oberlin. POWER is a non-profit organization governed by a Board of Trustees and administered by a part-time Program Coordinator.
POWER was originally conceived when a group of concerned citizens and city staff were motivated to address the initial increase in cost of renewable power and the effect it would have on low income residents. One of POWER’s founding principles is that change comes from within, and as such the organization was established by and for the community members it is designed to serve. Participants in this process have included: local pastors; low-income homeowners; citizen activists; city staff; local non-profit organizations staff; Oberlin College staff and students; and Oberlin City Council members.
Funded entirely by grants and donations from individuals, organizations, businesses, and institutions, POWER insulates and weatherizes seven to nine homes a year. This organization not only reduces costs for homeowners in Oberlin it also improves the livability of the home. As an example of what can be done, POWER has demonstrat-ed how members of a community can work for solutions to improve the well-being of the community and the environment.
Oberlin Climate Action Plan • Appendix IV: Energy Efficiency

61
Present Strategies
Wayfinding Signage Implementation year(s): CompletedLead Entity: City, commercial, nonprofitProjected GHG reduction: TBD
Install pedestrian signage pointing to major destinations. Directional signage, maps, and identification signs help passengers plan and execute their transit journeys more easily and efficiently.
Safe Routes to SchoolsImplementation year(s): Present - 2014 Lead Entity: City, nonprofitProjected GHG reduction: TBD
Provide bicycle and pedestrian amenities and safety improvements to enable walking and biking by students. Walking and biking are two of the easiest ways to be active. Active transportation encourages healthier lifestyles for children.
Expand Bicycle and Pedestrian Infrastructure Implementation year(s): Ongoing Lead Entity: CityProjected GHG reduction: TBD
Improve existing active transportation infrastructure to encourage walking and bicy-cling to local destinations for work and shopping. More bicycle infrastructure is need-ed in the downtown area as is apparent by all the bicycles near the East College Street project. Making use of resources from the Northeast Ohio Sustainable Communities Consortium (NEOSCC) and funding through Northeast Ohio Areawide Coordinating Agency (NOACA) Transportation for Livable Communities Initiative (TLCI) grant helps promote more active lifestyles within the community while also lowering carbon emissions.
Bicycle Parking at EventsImplementation year(s): OngoingLead Entity: City, College, CommercialProjected GHG reduction: TBD
Use vegetated open space or turf pavement for bicycle parking, such as at Oberlin College’s commencement. All community event organizers should be encouraged to provide bicycle parking. Providing more locations for bicycle parking encourages people to consider biking over driving alone. Bicycling is part of a healthier lifestyle regiment, lowers transportation costs while also reducing carbon emissions.
Bicycle GiveawayImplementation year(s): Ongoing Lead Entity: CommercialProjected GHG reduction: TBD
Bicycle giveaway or raffle at least once a year at a community event to encourage peo-ple to bike over driving alone. Residents have the opportunity to obtain a free bicycle that may improve health if used while emitting zero carbon emissions.
Appendix V: Transportation
Appendix V: Transportation • Oberlin Climate Action Plan

62
Bicycle Tourism ProgramImplementation year(s): Ongoing Lead Entity: City, nonprofitProjected GHG reduction: TBD
Encourage visitors to Oberlin to ride bicycles through outreach including maps, tour groups, and wayfinders. Bicycling increases health benefits and economic development growth within a community.
Bicycle and Pedestrian Education and SafetyImplementation year(s): OngoingLead Entity: City, nonprofitProjected GHG reduction: TBD
Promote public health, safety, and sustainable transportation through making walking and bicycling use safe and accessible. The rights of bicycle and pedestrians on City streets must be strictly enforced as well. This can be achieved through legislation, planning, and education.
Oberlin Connector Transit ServiceImplementation year(s): Ongoing Lead Entity: City, nonprofitProjected GHG reduction: TBD
Continue and extend current transit services to Oberlin residents seeking travel throughout the county. A single commuter switching his or her commute to public transportation can reduce a household’s carbon emissions by 10%, or up to 30% if he or she eliminates a second car.
Regional Transit CoordinationImplementation year(s): OngoingLead Entity: CityProjected GHG reduction: TBD
Coordinate with other communities in the region to increase transit op-tions. Coordinate with NOACA, NEOSCC, Lorain County Administrators and Commissioners, and other local non-profit organizations. Public transportation provides personal mobility and freedom for people from every walk of life. For every $1 invested in public transportation, $4 in economic returns is generated. In addition, people who use transit more often are more active because of walking to and from the transit locations.
WestShore Corridor Transportation ProjectImplementation year(s): Ongoing Lead Entity: City, nonprofitProjected GHG reduction: TBD
Construct a commuter rail line from Lorain that serves downtown Cleveland and Sandusky. Increased bus transit services and ridership within the county can lead to the development of this project. High quality rail systems encourage compact, walk-able communities, and provide sustainable, comfortable transportation while greatly reducing oil use and carbon emissions. Walkable communities support rail systems by providing high ridership.
Biofuel Pumping StationImplementation year(s): Present - 2014Lead Entity: CommercialProjected GHG reduction: TBD
Expand present biofuel station that would operate long hours and accepts credit cards, like a conventional gas station. Using biodiesel as a vehicle fuel increases energy secu-rity improves public health and reduces carbon emissions.
Oberlin Climate Action Plan • Appendix V: Transportation

63Appendix V: Transportation • Oberlin Climate Action Plan
Electric Vehicle Charging StationsImplementation year(s): 2013 - 2015 Lead Entity: City, CollegeProjected GHG reduction: TBD
Alternative fuels are generally cleaner-burning so they put less relative strain on the environment. Consumers can see lower fuel costs when they use some alternative fu-els, although the initial cost of a vehicle can be higher. Home refueling of electric cars can save time and be cost effective
Alternative Fuel Station for Consumers Implementation year(s): 2014 Lead Entity: CommercialProjected GHG reduction: TBD
In additional to biofuels, alternative vehicle fuels include Compressed Natural Gas (CNG), Liquefied Natural Gas (LNG), and Propane. See Electric Vehicle Charging Station description above.
Alternative-Fueled and Hybrid VehiclesImplementation year(s): Ongoing Lead Entity: City, CollegeProjected GHG reduction: TBD
Hybrid vehicles that can operate on both fossil fuels and electricity use regenerative braking to capture wasted energy. If just 25% of corporate fleets converted to green vehicles, there would be a substantial reduction in carbon emissions. Greening fleets is an opportunity to be the catalyst for economic and environmental benefits.
Efficient Fleet StandardsImplementation year(s): 2014 Lead Entity: City, CollegeProjected GHG reduction: TBD
Fleet requirements that set minimum standards for vehicle fuel use efficiency provide environmental and economic benefits for the City and College.
Anti- Idling TrainingImplementation year(s): Ongoing Lead Entity: City, CollegeProjected GHG reduction: TBD
Anti-idling habits will reduce carbon emissions and may assist with improving health benefits of the residents. Diesel particulate pollution has been linked to asthma, heart disease, cancer, and premature death.
Eco-Driving TrainingImplementation year(s): OngoingLead Entity: City, CollegeProjected GHG reduction: TBD
Train drivers to improve vehicle efficiency through driving behavior. Eco-driving improves road safety as well as the quality of the local and global environment and reduces fuel costs.

64
Increase Carpooling/Car-SharingImplementation year(s): 2014 Lead Entity: City, College, CommunityProjected GHG reduction: TBD
Carpooling participants save money by sharing the cost of all travel related expenses. By sharing a vehicle, it reduces the number of vehicles on the road, which reduces pol-lution and carbon emissions. Also those who use car-sharing services tend to sell their own cars, which results in active transportation modes such as biking and walking.
Rethink Your Ride – Mode Shift CompetitionImplementation year(s): OngoingLead Entity: CommunityProjected GHG reduction: TBD
This challenge encouraged those who live, learn, work, and play in Oberlin to replace at least one-single vehicle trip per week with a low-carbon mode of transportation. Added benefits include improved health, reduced traffic congestion, and saving money.
Additional Potential Strategies
Car-Sharing for FleetsImplementation year(s): 2015 - ongoingLead Entity: City, CollegeProjected GHG reduction: TBD
Sharing vehicles among multiple institutional entities lowers the operation costs of a fleet while enhancing personal and business travel program. It also helps to reduce carbon footprint.
Peer-to-Peer Car-SharingImplementation year(s): 2015 - ongoingLead Entity: CommunityProjected GHG reduction: TBD
A peer-to-peer car-sharing program, in which individuals share their personal vehicles with others, will better address the issues that threaten urban livability, sustainability, and air quality.
Low-Carbon ShoppingImplementation year(s): 2015 - ongoingLead Entity: Commercial, CommunityProjected GHG reduction: TBD
Local merchants provide perks to encourage shoppers who bike and walk. Residents can reduce their carbon footprint by purchasing locally produced goods and services. Anchor institutions can be the catalyst of such change, leading by example. Such a lifestyle change promotes economic development, reduces carbon emissions, and saves money on transportation expenses.
Car-Free Visitor ProgramImplementation year(s): 2015 - ongoingLead Entity: City, College, Commercial, non-profitProjected GHG reduction: TBD
Car-free planning, which is focused on enabling Oberlin visitors to enjoy their visit without a car, reduces carbon emissions and traffic congestions, and increases consum-er savings.
Oberlin Climate Action Plan • Appendix V: Transportation
65Appendix VI: Green Building • Oberlin Climate Action Plan
Appendix VI: Green BuildingA. Energy Basics: Primary Energy, End Use Energy, and Embodied Energy.
Primary and End Use Energy:Energy is a complex topic for several reasons including the units used—kilowatt hour, barrels of oil, ton of coal, joule, British Thermal Unit, therm, cord—and differences among primary energy, end use energy, and embodied energy.
The complexity of units makes it useful in comparative assessments to select a sin-gle unit and convert the energy under consideration to this unit. The British Thermal Unit, the amount of heat energy needed to raise the temperature of one pound of water by one degree F, is often selected because it is the standard unit used to state the amount of energy in a fuel. For example, to compare the energy used to heat house A with electricity and house B with natural gas, we convert kWhs and therms used in each to BTUs where 1 kWh = 3412 BTUs and 1 therm = 100,000 BTUs.
In the above example, electricity is the end use energy source but not the primary energy source for heating house A while natural gas is both for house B. The primary energy source in house A is the energy used by the power company to generate the electricity used. Coal, natural gas, nuclear reaction, and other heat sources are gener-ally used to make steam that powers a turbine that generates electricity. Let us assume that coal is the primary energy source for heating house A. In generating electricity about three BTUs of primary energy (coal) are required to generate one BTU of elec-tricity. This conforms to a general law in physics: when coal is converted to electricity, useful energy is lost. In this conversion 3 BTUs of coal become 1 BTU of electricity.
In house A, 3 BTUs of primary energy are used to provide each BTU of electricity used for heating. The conversion of electrical energy to heat energy is very efficient so almost all of the energy in electricity becomes heat. However, in the whole process only one third of the primary energy in coal ends up as heat energy in the house. In house B, conversion of natural gas to heat can be 97% efficient in modern furnaces. Thus, the primary energy to heat house B is about one third of the primary energy to heat house A.
Embodied EnergyIn our example above it took other energy inputs than the end use energy of electricity and natural gas to heat the houses. This other energy is all the energy necessary in the processes and systems required to get the end use energy to where it is used. For house A this would include the components of the electrical transmission system, the coal, all the components of the electrical generation process, all the components of the coal mining system, and so on. Needless to say, it is very difficult to calculate embodied energy with any precision; however, it is a convenient way to talk about energy inputs that are real but difficult to measure precisely.
To give an example let us compare the energy used by two all electric homes: house 1 with PV sourced electricity and house 2 with coal generated grid sourced electrici-ty. House 1’s primary and end use electricity is that supplied by the PV system while the embodied energy is that required to make the PV system and get it on the house. House 2’s primary and end use energies are coal and electricity, respectively. The em-bodied energy in house 2’s primary energy is all the components involved in mining, getting the coal to the power station, generating electricity, and getting electricity to House 2.
The general public when making energy use comparisons rarely distinguishes between primary and end use energy. However, energy professionals use this distinc-tion to make valid comparisons and analyses. In the example above, the house 2 would use the same amount of electricity whether supplied by the grid or PV, but uses about 3 times the primary energy used by house 1. If house 2 used coal directly for heating, it would use less coal or primary energy.
These examples illustrate why solar generated electricity (wind, PV) and passive so-lar are desirable. The energy source is everywhere and free. No GHG emissions result
Primary energy: the original source energy for a particular task.
define it:
End use energy: the energy for accomplishing a task such as the energy to run a microwave or heat a house.
define it:
66
except from embodied energy in the infrastructure required to acquire the solar ener-gy. In addition, the some fraction of the fossil fuel based embodied energy in the grid infrastructure must be accounted for when a PV system is net-metered. That is, the grid acts like a battery storing electrical energy produced during the day and then with-drawn at night or at other times when more energy is needed than being produced.
B. Basic and deep energy retrofits can have substantial benefits for home ownersMany people have renovated their houses to be more energy efficient by caulking air leaks, adding wall and ceiling insulation, installing high efficiency windows and pro-grammable thermostats, upgrading inefficient appliances and replacing incandescent lamps with CFLs. Each of these changes can reduce energy use and GHG emissions; however, these reductions are rarely quantified.
Howard and Margaret Stoner have provided an informative example. Beginning in 2006 and through 2007 they installed CFLs, a night setback thermostat, caulked air leaks, added more insulation in attic, walls, and basement walls for a cost of $4,821 ($5,250 actual cost minus $429 NY state rebates). Their annual energy use in 2005 and 2006 went from 121 to 69 million BTU in 2007 and energy cost went from $2,278 to $1,369, a raw savings of $909 and actual savings of about $1,200 because no income tax is paid on the saved money. The pay back for these improvements was 4 years with an annual dividend of $1,200 or 25% return-on-investment for as long as they live in the house.
The Stoners began major improvements in 2008 that extended into the first two months of 2009. They installed a new boiler (mostly for hot water), a 3.3 kW photovol-taic system, and an airtight efficient wood stove for a cost of $26,000 ($46,200 minus $20,000 in federal tax credit and NY state ERDA rebates). The 2009 and 2010 annual energy use was 59 million BTU including 42 million BTU from solar (wood and PV electricity) and 17 million BTU of gas for a cost of $418 (fossil fuel; offset by 3,300 kWh of PV electricity which they used with a few dozen kWh being sent to the grid thereby making the Stoner home positive energy and climate positive).
The annual raw savings for all improvements was $2,040, an actual savings of $2,700; this is an 8% annual return on investment that gives a payback time of 13 years and an annual dividend thereafter of $2,040.
The lack of data on the savings that can be realized by small and large energy use changes has hindered efforts to make houses more energy efficient. Documented en-ergy use retrofits are critical for people to know that these changes are effective both economically and environmentally. The Stoner example and basic physics establish that significant reductions in residential fossil fuel and energy use are cost effective and that deep energy retrofits can allow residents of older housing stock to create positive-energy, climate-positive homes.
Conserving water is also relatively easy to do. Each gallon not used also saves electricity and reduces GHG emissions. Professor Rumi Shammin in Oberlin College’s Environmental Studies Department has studied the energy consumed for each gallon of water used in Oberlin. His research indicated that the energy necessary to take a gallon of water from and back-to the Black River is 86 BTU or 25 watt hours resulting in the release of 0.013 lbs of carbon dioxide.
C. Envelope and lighting best practicesA building’s envelope is the slab, walls, and ceiling or roof that separate inside from outside. Envelope characteristics define the movement of heat and light into and out of a building, which in turn determines the energy required to light, heat, and cool a building to meet human requirements.
For existing structures, eliminating air leaks is the least expensive change for the greatest savings in heating and cooling energy with payback times of 3 to 6 years in residential buildings. Increasing insulation in residential buildings also provides significant savings with payback times of 5 to 10 years. Because commercial buildings usually have a significantly smaller surface-to-volume ratio and often do not have the
Oberlin Climate Action Plan • Appendix VI: Green Building

67Appendix VI: Green Building • Oberlin Climate Action Plan
physiological comfort requirements of homes, the payback times are a dozen or more years and envelope improvements are often not considered economical. However, to achieve climate positive status, commercial buildings in Oberlin will not only need to use energy more efficiently, but also use carbon-neutral electricity and curtail or eliminate the use of fossil fuels.
Inexpensive compact fluorescent lamps (CFL) and linear fluorescent lamps have been available for several decades, reduce electricity consumption about 70% for an equivalent amount of light and last six times longer when compared with incandescent bulbs. Many homes and businesses have already converted to fluorescent lamps.
LED (light emitting diode) lamps are now economical for many uses including traffic signals, Christmas lighting, parking lot lighting and other uses that require extended hours of lighting. With prices dropping and quality increasing, LED lamps will eventually replace incandescent and fluorescent lamps for many applications. LED lamps are more efficient than CFLs and are 85% more efficient than an incandes-cent bulb. They also have very long life (LED: 20,000 to 50,000 hours; CFL: 8,000 hours; incandescent: 1,000 hours).
D. A policy on green building standards for municipal buildings in Oberlin was proposed and unanimously passed for municipal buildings on September 4th, 2007.
City of Oberlin Green Building PolicyThe City of Oberlin shall incorporate green building principles and practices into the design, construction, and operations of all City facilities, City funded projects and infrastructure projects to the fullest extent possible.
All new construction exceeding 5,000 sq. ft. and major renovations exceeding 1,000 sq. ft. of municipally owned and operated facilities shall be required to meet minimally the U.S. Green Building Council’s latest version of LEED Silver Certification.
In addition, the City shall evaluate all land purchases for future development on the basis of reducing environmental impacts that include but are not limited to transit and bicycle accessibility, urban and brownfields redevelopment, solar access, on-site storm water mitigation capacity and vegetation and habitat restoration.
Furthermore, the City will provide the leadership and guidance to encourage the appli-cation of green building practices in private sector development. To this end, the City shall endeavor to resolve any code or other regulatory conflicts with green building practices.
This Policy is expected to yield long-term cost savings to the City’s taxpayers due to the substantial improvements in life-cycle performance and reduced lifecycle costs.
E. Spotlight: Trail Magic Trail Magic is a passive-active solar home built in 2008 with about 2,500 square feet of conditioned space. It runs on solar energy and cost no more to build than standard custom construction. It is a positive energy home because it produces more energy than it uses and climate positive because its operation results in a reduction of GHG in the atmosphere.
The average US home purchases about 100 million BTUs of operating energy while Trail Magic purchases no energy. If energy were purchased, it would be 10 million BTUs or 10% of average US home. However, no electricity is purchased so in a primary energy comparison between Trail Magic and the standard US home, Trail Magic uses about 5% of the primary energy used by the typical two person home (10 million BTUs ÷ [100 million BTUs × 2 {factor to convert end use energy to primary energy}] = 0.05).
The total cost for building the house was $365,000. Trail Magic has about 2,500 square feet of conditioned space thereby making the cost $146 per square foot of con-ditioned space. Custom houses in NE Ohio begin around $125 per square foot of con-ditioned space and go well over $200 per square foot. Trail Magic is a modest custom house. If the upscale features that do not relate to high performance and being passive/active solar are substituted with standard materials (e.g., $17,000 for metal roof verses $5,500 for 25 year, asphalt shingle roof) the price drops to $110 per square foot of condi-tioned space. This is similar to the cost of a quality development house in NE Ohio.

68
Passive solar design features (orienting the long axis of the house east-west; placing few windows on the north, east, and west sides, and most windows on the south side; and extending roof overhangs about one foot to shade-out summer sun) provides over half the home’s operating energy (about 15 million BTUs for heating and 5 million for day lighting). The 5.2 kW PV system annually produces 5,200 kWh of which 4,400 kWh (15 million BTUs) provides the remaining operating energy, if the pond source heat pump is used for heating and cooling. In practice, one cord of onsite wood is used for essentially all heating and then Trail Magic runs on 10 million BTUs or just under 3,000 kWh.
Water saving technologies and appliances and resident behavior at Trail Magic reduce indoor and hot water use to 20% and 40%, respectively, of that used by the average two-person home. Other green features include very tight, super insulated envelope; high performance double and triple paned windows; passive cooling design; pond-source heat pump for cooling and heating; high performance, air tight, soap-stone wood stove; cistern to collect roof water for outside use; almost 100% permeable landscaping, swales, and pond to slow storm water runoff; site and local lumber for flooring, shelving, book case, beams, and pantry counter; raised seam metal roof; and Hardiboard siding.
For more information and details see Carl N. McDaniel (2012) Trail Magic: Creating a Positive Energy Home (Sigel Press, Medina, OH).
F. Green Building Rating Systems A variety of certification programs have arisen in the past decade or so for defining
in specific terms what constitutes a “green building.” The most widely known national-ly-based rating systems (as of 2012) are summarized below.1. LEED: Leadership in Energy and Environmental Design was developed by the
U.S. Green Building Council (USGBC) in 2000. The LEED rating systems are developed through an open, consensus-based process led by LEED committees. The next update of the LEED rating system, coined LEED 2012, is the next step in the continuous improvement process and on-going development cycle of LEED. LEED provides building owners and operators with a framework for identifying and implementing practical and measurable green building design, construction, operations and maintenance solutions. LEED certification provides independent, third-party verification that a building, home or community was designed and built using strategies aimed at achieving high performance in key areas of human and environmental health: sustainable site development, water savings, energy efficiency, materials selection and indoor environmental quality. LEED rating systems apply to new construction, existing buildings, operations and mainte-nance, core and shell, commercial interiors, schools, retail, healthcare, homes, and neighborhood development.
2. PassiveHouse: The Passive House system was developed in Europe, where some 15,000 buildings have been designed and built or remodeled to the standard. The emphasis is on creating very well-insulated, virtually air-tight buildings that are primarily heated by passive solar gain and by internal gains from people, elec-trical equipment, and other heat sources that normally occur in a building. Any remaining heat demand is provided by an extremely small source. Avoidance of heat gain through shading and window orientation also helps to limit any cooling load, which is similarly minimized. An energy recovery ventilator provides a constant, balanced fresh air supply. The result is a system that not only saves up to 90% of space heating costs, but also provides a uniquely high indoor air quality.
3. LivingBuildingChallenge: Developed by the Cascadia Green Building Council, the Living Building Challenge seeks to go beyond LEED in building design and performance standards into the wider realm of sustainability. Initially focusing on buildings, the program now addresses development at all scales. It is com-prised of seven performance areas: Site, Water, Energy, Health, Materials, Equity and Beauty. These are further subdivided into twenty Imperatives, each of which focuses on a specific sphere of influence. This standard seeks to define the most
Oberlin Climate Action Plan • Appendix VI: Green Building
69Appendix VI: Green Building • Oberlin Climate Action Plan
advanced measure of sustainability in the built environment possible today, providing a framework for design, construction and the symbiotic relationship between people and all aspects of the built environment.
4. ENERGYSTAR: Developed by the U.S. Government, ENERGY STAR certifies new homes that meet strict energy efficiency guidelines set by the U.S. Environmental Protection Agency (USEPA). These homes are independently verified to be at least 15% more energy efficient than homes built to the 2009 International Energy Conservation Code (IECC), and feature additional measures that deliver a total energy efficiency improvement of up to 30 percent compared to typical new homes and even more compared to most resale homes. ENERGY STAR also certi-fies buildings and manufacturing plants that earn a 75 or higher on USEPA’s 1-100 energy performance scale, indicating that the facility performs better than at least 75% of similar buildings nationwide. The ENERGY STAR energy performance scale accounts for differences in operating conditions, regional weather data, and other important considerations.
5. NAHBGreen: Developed in 2008 by the National Association of Homebuilders, NAHBGreen ICC 700 National Green Building Standard applies to new and remodeled single and multifamily buildings as well as residential subdivisions. The system is the first and only residential green rating system to have earned the approval of the American National Standards Institute (ANSI). Similar to LEED, the system focuses on these categories: Lot Design; Preparation and Development; Resource Efficiency; Water Efficiency; Indoor Environmental Quality; and Operation, Maintenance, and Building Owner Education. To meet the highest lev-el of rating (Emerald), a building must incorporate energy savings of 60% or more.
G. Green Building Incentive Programs A detailed review of incentive programs for state and local green building programs is needed. Two resources are worth noting: 1. AmericanInstituteofArchitects,LocalLeadersinSustainability: This
project was developed in partnership with the National Association of Counties (NACo) to help local government officials incentivize green construction in their communities. Their survey found that state and local government green building incentives range from options that are virtually cost-free to those that involve more investment. They found that the most attractive incentives are tax incen-tives, density/floor area ratio bonuses, and expedited permitting. Their findings show that communities should select incentives based on their financial situation and desired impact on the construction industry. The simpler the policy, the more likely it is to be implemented successfully. The Local Leaders report focuses on five key areas of green incentives: financial costs, oversight structure, local polit-ical and cultural environment, limits to power, and industry engagement. Green Incentive Trends analyzes initiatives instituted by localities across the country in recent years to provide in-depth best practice examples and a focused analysis on strategies that work well for different communities. The report also highlights in-novative green architecture and interviews with the architects and local officials who are making it possible. The report (2009) details green building policies and incentives in a number of states and municipalities.
2. U.S.GreenBuildingCouncilGreenBuildingIncentiveStrategies: Research by this organization describes structural incentives (expedited review/permitting, density bonuses), financial incentives (tax credits and abatements, fee reductions or waivers, grants, revolving loan funds), and other incentives (technical assis-tance, marketing assistance) across the country.

70
H. General reference books on residential green building and articles on passive solar designMany books have been written on the subject of green building and a search on the web will provide many of them. Two that provide a comprehensive overview of resi-dential green building are:
Alex Wilson, Your Green Home: A Guide to Planning a Healthy, Environmentally Friendly New Home (Gabriola Isalnd, BC, Canada: New Society Publishers 2006)
Abe Kruger and Carl Seville, Green Building: Principles & Practices in Residential Construction (Clifton Park, NY; Delmar, Cengage Learning 2013)
Solar Today, published nine times a year by the American Solar Energy Society, 4760 Walnut Street Suite 106, Boulder, CO 80301, routinely has articles on energy aspects of green building. The recent series of seven articles by Norbert Lechner in Solar Today are an excellent introduction to passive solar design. Norbert Lechner is described this way in Solar Today:
Norbert M. Lechner is an architect, professor emeritus in the College of Architecture, Design, and Construction at Auburn University, LEED-accredited professional and ASES Fellow. He is an expert in energy-respon-sive architectural design with an emphasis on solar-responsive design. Lechner’s book, Heating, Cooling, Lighting: Sustainable Design Methods for Architects, is used by more than a third of all architecture schools in the United States and in architecture schools worldwide. His articles are as follows:
Choose the Low-Hanging Fruit. PV may be the sexy strategy, but solar-respon-sive design is cheaper and, by reducing a building’s energy consumption, more sustainable. November/December 2011
For Aggressive Efficiency, Choose Passive Solar. Every south-facing window is a basic passive solar space-heating system. The challenge is minimizing heat loss while maximizing solar energy collected throughout the day. January/February 2012
Shading for Energy Savings. By reducing the need for air conditioning, this de-sign technique goes a long way in saving money and energy. March/April 2012
Playing the Angles for Solar-Responsive Design. Solar geometry provides the tools for effective passive solar heating, shading and daylighting. May 2012
Daylighting Illuminated. A good design will provide ample quality daylight, saving energy and money. June 2012
White is the Greenest Color. Selecting light-colored roofs and walls is one of the easiest ways to save energy and money. So why don’t we see more white roofs? July/August 2012
Think You Know Solar-Responsive Design? September 2012. List from lowest to highest hanging fruit: 1) Form and orientation, 2) Color, 3) Window size and placement, 4) Shading, 5) Passive solar, 6) Daylighting, 7) Active Solar, 8) Photovoltaics. The URL to access these articles at Solar Today is: solartoday.org/lechner
Oberlin Climate Action Plan • Appendix VI: Green Building

71AppendixVII:Waste•Oberlin Climate Action Plan
Solid WasteRecyclingProgramStatusReport.The City’s most recent analysis of its recycling program is the April, 2010 ‘Recycling Program Status Report’. This report reviews the history of recycling in Oberlin (to 1993) including the rationale for the current source-separated collection system. Recycling program operations, including means of collection and processing/transfer, economics, participation, and the pros and cons of source-separated collection are reviewed. A section on co-mingled recycling discusses anticipated collection and transfer, economics, participation, and the pros and cons of switching from source-separated to co-mingled recycling. The report concludes with recommendations for program improvements.
RecoveryRates. Ongoing analysis of the City’s refuse and recycling programs indi-cates that the City’s most recent 4-year average recovery rate is 29.4%.
Year Solid Waste Recycling Composting Recovered Total
Percent Recovered
2008 3,997.00 642.30 351.66 993.96 24.87%
2009 3,830.13 726.68 424.83 1,151.51 30.06%
2010 3,799.28 813.81 392.75 1,206.56 31.76%
2011 3,795.29 774.82 408.82 1,183.64 31.19%
All data reported in tons. Solid waste and recycling are weighed, compost is estimated.
ZeroWaste. To reduce CO2e emissions and achieve other related environmental, economic and social benefits, the City intends to adopt a Zero Waste Policy and to im-plement a Zero Waste Plan. “Zero Waste” describes a closed loop system used primari-ly in industry in which the byproducts of production and consumption are designed to provide the feedstocks for the fabrication of new products. The zero waste philosophy is increasingly adopted by public sector agencies as a framework to expand public understanding of waste as a misplaced resource. Zero Waste is defined as diverting at least 90% of the waste stream from landfill and incineration.
The creation of a zero waste plan provides a unique opportunity to educate both the public and decision-makers, as well as to establish a meaningful dialogue within the community about the value of reusing, repairing, reselling, recycling, and compost-ing materials rather than throwing them away. Adopting such a policy will provide guiding principles and goals regarding waste management and a continued platform for staff and leaders from which to act.
KeyElementsoftheZeroWastePlan1. Waste Audits: Waste audits should be used to evaluate materials placed for
landfill disposal in the City’s residential, commercial, institutional, and industrial sectors to more fully assess recovery potential. Waste audits should be conducted on a regular basis to provide the necessary level of detail to target increasingly comprehensive resource recovery. Initially, a baseline can be established from nationally/regionally available data for comparison with the results of local waste audits.
2. Ongoing Evaluation: Ongoing evaluations of programs and services should in-clude consideration of best management practices within the waste management sector.
3. Improved residential, commercial, and institutional recycling opportunities.4. Organics recycling: Continued promotion of home composting efforts including
both backyard composting and indoor vermicomposting. Continued evaluation of the feasibility of developing a local or regional Class II compost facility capable of processing additional feedstocks, including food wastes.
Appendix VII: Waste
72 Oberlin Climate Action Plan • Appendix VII: Waste
5. Coordination with Oberlin College, the Lorain County Solid Waste Management District, Republic Services, Inc., and other key stakeholders to increase recycling services.
6. Comprehensive, targeted, and incremental educational programs and services7. Adoption and implementation of policies, regulations, and/or ordinances in sup-
port of the Zero Waste goals. Possibilities include: a. Local ordinance requiring managers of multi-family buildings to provide
tenants with the opportunity to recycle, including the provision of the appropriate receptacles and tenant education;
b. Local ordinance requiring managers of commercial buildings to provide commercial tenants with the opportunity to recycle, including the provi-sion of shared storage containers and tenant education;
c. City policy to mandate source separation of recyclables for those residents who choose to participate in the curbside program; and
d. Local ordinance(s) mandating residential recycling and, as comprehensive services become available, mandating commercial, institutional, and industrial recycling
e. City policy to mandate minimum construction and demolition debris recy-cling from construction projects.
f. City policy to require the purchase of products with a minimum post-con-sumer recycled content (ie. office supplies, park equipment, recycling and trash bins, etc).
AdditionalPotentialStrategies1. Reduce the amount of materials/wastes produced in the community to minimize
the amount that needs management. Work with residents, businesses, institutions, the industrial park, etc. to reduce waste through smarter purchasing habits, and encouraging donation of unwanted items, repair of damaged items. Continued evaluation of recycling program structure and equipment, including consider-ation of a more robust Pay As You Throw (PAYT) program to further incentivize recycling.
2. Ongoing development of recycling opportunities for the business community, multi-family housing, institutions (public schools, hospital, etc.), the industrial park, and at public events.
3. The City will continue to work closely and collaborate with Oberlin College to identify, plan, develop, and implement various programs designed to achieve zero waste, minimize solid waste, and maximize recycling and composting.
4. Support efforts to hold zero waste events within the community, as well as Recycling On The Go (ROGO) programs at sporting events, along Main Street, etc.
5. Ongoing evaluation of recycling program structure and equipment.
These various strategies and programs will be supported by a robust public education program to ensure that the City’s residents, businesses, and institutions have the best available information about preferred waste management options for all manner of materials.
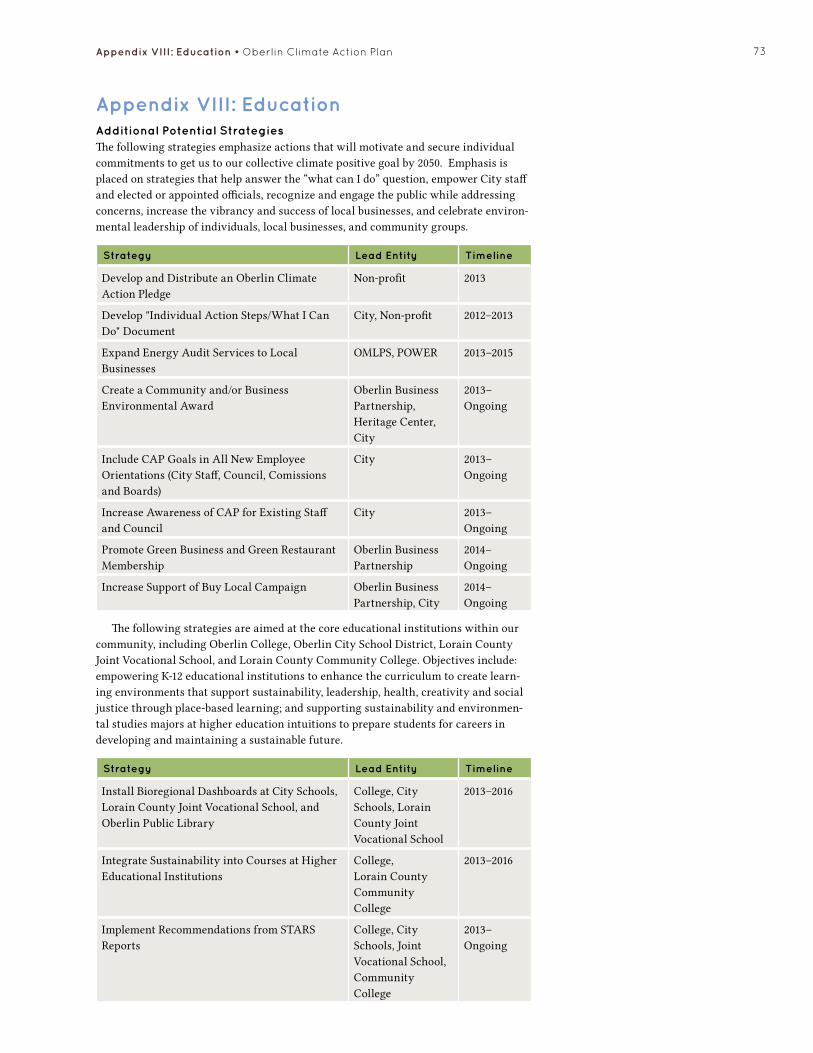
73
Additional Potential StrategiesThe following strategies emphasize actions that will motivate and secure individual commitments to get us to our collective climate positive goal by 2050. Emphasis is placed on strategies that help answer the “what can I do” question, empower City staff and elected or appointed officials, recognize and engage the public while addressing concerns, increase the vibrancy and success of local businesses, and celebrate environ-mental leadership of individuals, local businesses, and community groups.
Strategy Lead Entity Timeline
Develop and Distribute an Oberlin Climate Action Pledge
Non-profit 2013
Develop "Individual Action Steps/What I Can Do" Document
City, Non-profit 2012–2013
Expand Energy Audit Services to Local Businesses
OMLPS, POWER 2013–2015
Create a Community and/or Business Environmental Award
Oberlin Business Partnership, Heritage Center, City
2013– Ongoing
Include CAP Goals in All New Employee Orientations (City Staff, Council, Comissions and Boards)
City 2013–Ongoing
Increase Awareness of CAP for Existing Staff and Council
City 2013–Ongoing
Promote Green Business and Green Restaurant Membership
Oberlin Business Partnership
2014–Ongoing
Increase Support of Buy Local Campaign Oberlin Business Partnership, City
2014–Ongoing
The following strategies are aimed at the core educational institutions within our community, including Oberlin College, Oberlin City School District, Lorain County Joint Vocational School, and Lorain County Community College. Objectives include: empowering K-12 educational institutions to enhance the curriculum to create learn-ing environments that support sustainability, leadership, health, creativity and social justice through place-based learning; and supporting sustainability and environmen-tal studies majors at higher education intuitions to prepare students for careers in developing and maintaining a sustainable future.
Strategy Lead Entity Timeline
Install Bioregional Dashboards at City Schools, Lorain County Joint Vocational School, and Oberlin Public Library
College, City Schools, Lorain County Joint Vocational School
2013–2016
Integrate Sustainability into Courses at Higher Educational Institutions
College, Lorain County Community College
2013–2016
Implement Recommendations from STARS Reports
College, City Schools, Joint Vocational School, Community College
2013–Ongoing
Appendix VIII: Education
AppendixVIII:Education•Oberlin Climate Action Plan

74
The following strategies focus on opportunities for partner educational institutions to prepare students for career opportunities and entry into the local economy, as well as identify and train new farmers to ensure the success of local food production, a particular need in the region.
Strategy Lead Entity Timeline
Determine Future Community Needs and Create Courses/Curriculum Accordingly
Education Committee
2013–Ongoing
Partner with Lorain County Community College and Lorain County Joint Vocational School to Develop Work Force Training Programs
Education and Economic Development Committees
2014–Ongoing
Implement a "Grow the Growers" Program for Area Farmers and Students
Education Committee, LCJVS
2014–Ongoing
The following strategies focus on activities that encourage an informed and engaged public by providing learning opportunities for all interested community members, institutions, and students through service learning projects, community events, workshops, and other educational opportunities. It is our mission to enable all interested individuals to have the opportunity for hands-on experience, increased job opportunities, and access to products and services that reduce GHG emissions.
Strategy Lead Entity Timeline
Provide Internships for Students to Get Engaged in CAP Initiatives and Programs
City, Oberlin Project staff
2012–Ongoing
Annual Speaker and Film Series City, College, Education Committee
2012–Ongoing
Hold Community Workshops to Educate the Community
Education Committee, City, Oberlin Project staff
2013–Ongoing
Promote CAP Initiatives and Goals at Community Events
City 2012–Ongoing
Increase Local Food IQ – Encourage Local Food Purchasing and Expansion of the Oberlin Farmers' Market
Local Food Committee and the OFMA
2012–Ongoing
Oberlin Climate Action Plan • Appendix VIII: Education

75
Summary of Oberlin College Climate Action PlanOberlin College uses about 25% of the City’s electricity, and is responsible for about the same percentage of the City’s carbon emissions. Prior to embracing the goal of becoming climate positive in conjunction with the City, the College signed in 2006 The American College and University President’s Climate Commitment (ACUPCC) with a similar goal to become climate neutral. Over the past dozen years, significant adminis-trative infrastructure has been put in place to champion and facilitate this goal. 2001: Environmental Policy Advisory Committee (EPAC) established.2002: EnviroAlums, an Alumni Affiliate Group, formed to advocate for environmen tal education and sustainability. 2004: EPAC drafted an Environmental Policy Statement for environmental sustain ability that has guided the College since. 2006: EPAC morphed into the Committee on Environmental Sustainability (CES), a committee of the General Faculty. 2006: Office Environmental Sustainability (OES) established.2008: David Orr became Special Assistant to the President for Sustainability.2009: The Green Edge Fund, administered by students and funded by a student fee, established to support activities and projects that foster environmental sustainability.2011: OES initiated an in-depth, systemic analysis of energy use across the campus in order to assess where energy efficiency can reduce substantially energy use and cost.
Accomplishments and Strategies
Central Heating PlantThe College has heated its buildings for decades with steam from its coal-fired power plant. Replacing coal with a less carbon intensive fuel is a major hurdle to becoming climate positive. In 2011 the College initiated an in-depth analysis of the various ways to replace coal. The College is committed to replacing coal in a timely manner, but the final choice of plan is still to be made in conjunction with the Board of Trustees. The current recommendation is to install high efficiency gas boilers over the next few years in a way that foresees the campus, now essentially one heating system, as being divided in to 7 thermal zones with each zone having heating and cooling system(s) designed for its specific requirements. This plan would incorporate a shift from coal as a fuel, to natural gas and electric energy. The distributive system would be phased in over perhaps 10-15 years and is expected to lower significantly total energy use and tons of CO2 released. Table 1 gives the GHG inventory for fiscal year 2010 and table 2 is the projected GHG inventory for 2015.
Table 1. Greenhouse gas inventory for fiscal year 2010.
Item Quantity Million Tons GHG (CO
2)
% of Gross
Purchased electricity 23,913,818 kWh 20,126 47.9
Lewis Center electricity
199,625 kWh -17 0.04
Coal burned 5,948 tons 13,906 33.1
Natural gas burned 998,095 therms 5,280 12.6
Transportation fuels 21,109 gallons 186 0.4
Commuting 1,703,000 miles 2,106 5.0
Miscellaneous n/a 486 1.0
RECs purchased 9,781,615 kWh -8,232 --
TotalMTCO2 -- 33,791 --
Appendix IX: Oberlin College
AppendixIX:OberlinCollege•Oberlin Climate Action Plan

76
Table 2. Greenhouse gas inventory for fiscal year 2015 (projected).
Item Quantity Million Tons GHG (CO
2)
% of Gross
Purchased electricity with 20% reduction with 90% renewable from OMLPS
17,085,496 kWh 1,438 8.2
New PV use 3,050,000 kWh -257
Lewis Center electricity
164,625 kWh -14 0.08
Coal burned 0 tons -- --
Natural gas burned 2,458,250 therms 13,004 73.8
Transportation fuels and ground commuting
189,217 gallons 1,673 9.5
Air travel 4,542,061 miles 851 4.8
Miscellaneous n/a 648 3.7
RECs Purchased 0 -- --
TotalMTCO2 -- 17,343 57%reductionfrom2012
Strategies to make energy conserving behavior the normIn 2005 the College began a 3-week, dormitory-energy-reduction contest held each spring semester. Some dorms reduced their electricity use 55% over the 3 week contest of which some reduction persisted. Dorms now have real time displays of electricity and water use for students to see, and which appear to have led to reduced resource use through behavioral changes. Faculty research is seeking to establish the best ways to display resource use for behavior modification.
The OES has made a systemic analysis of energy use on campus, and has initiated a comprehensive program to affect behavior of students, faculty, and staff so as to embrace sustainability. • Design student orientation materials to positively affect energy use conservation
behavior.• Have College Resident Education include energy sustainability awareness and
behavior.• Have OES staff trained to talk and discuss with staff, faculty, and others office
energy and water use, recycling initiatives, and other sustainability initiatives on campus.
• Reemphasize recycling and reuse initiatives on campus to minimize solid waste. • Develop metrics to assess “the greenness” of student rooms and staff and faculty
offices on campus. On a voluntary basis designate rooms and offices as “green” based upon compliance with rubrics.
• Work with the Purchasing Department to encourage the procurement of “green” office supplies used on campus.
The underlying philosophy of these initiatives: Use what is needed, and only when needed—as, “the most energy efficient lamp or device is one that is turned off”.
Strategies to reduce GHG emissions beyond Central Heating PlantThe OES has initiated and planned the following energy efficiency programs.
1. Indoor lighting retrofit projects over two fiscal years to install high efficiency fluo-rescent and LED lamps with sensor controls. A 3.5 year payback is expected for this $600,000 project.
Oberlin Climate Action Plan • Appendix IX: Oberlin College
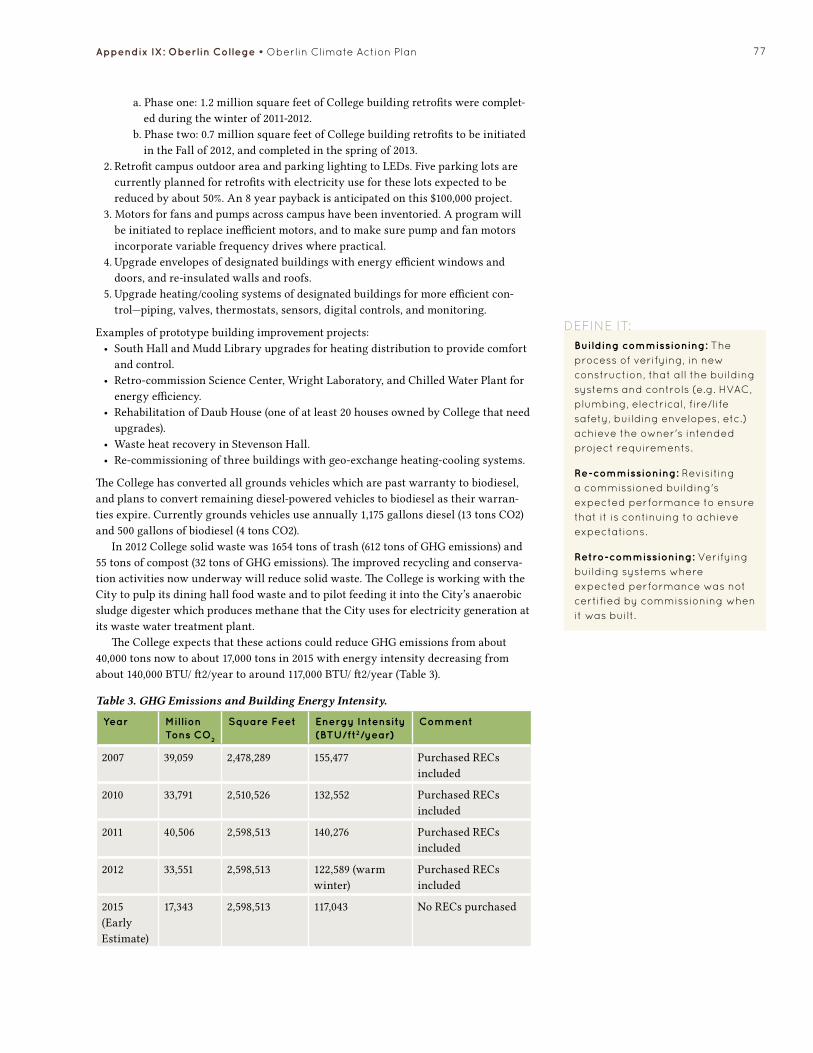
77
a. Phase one: 1.2 million square feet of College building retrofits were complet-ed during the winter of 2011-2012.
b. Phase two: 0.7 million square feet of College building retrofits to be initiated in the Fall of 2012, and completed in the spring of 2013.
2. Retrofit campus outdoor area and parking lighting to LEDs. Five parking lots are currently planned for retrofits with electricity use for these lots expected to be reduced by about 50%. An 8 year payback is anticipated on this $100,000 project.
3. Motors for fans and pumps across campus have been inventoried. A program will be initiated to replace inefficient motors, and to make sure pump and fan motors incorporate variable frequency drives where practical.
4. Upgrade envelopes of designated buildings with energy efficient windows and doors, and re-insulated walls and roofs.
5. Upgrade heating/cooling systems of designated buildings for more efficient con-trol—piping, valves, thermostats, sensors, digital controls, and monitoring.
Examples of prototype building improvement projects: • South Hall and Mudd Library upgrades for heating distribution to provide comfort
and control.• Retro-commission Science Center, Wright Laboratory, and Chilled Water Plant for
energy efficiency.• Rehabilitation of Daub House (one of at least 20 houses owned by College that need
upgrades).• Waste heat recovery in Stevenson Hall.• Re-commissioning of three buildings with geo-exchange heating-cooling systems.
The College has converted all grounds vehicles which are past warranty to biodiesel, and plans to convert remaining diesel-powered vehicles to biodiesel as their warran-ties expire. Currently grounds vehicles use annually 1,175 gallons diesel (13 tons CO2) and 500 gallons of biodiesel (4 tons CO2).
In 2012 College solid waste was 1654 tons of trash (612 tons of GHG emissions) and 55 tons of compost (32 tons of GHG emissions). The improved recycling and conserva-tion activities now underway will reduce solid waste. The College is working with the City to pulp its dining hall food waste and to pilot feeding it into the City’s anaerobic sludge digester which produces methane that the City uses for electricity generation at its waste water treatment plant.
The College expects that these actions could reduce GHG emissions from about 40,000 tons now to about 17,000 tons in 2015 with energy intensity decreasing from about 140,000 BTU/ ft2/year to around 117,000 BTU/ ft2/year (Table 3).
Table 3. GHG Emissions and Building Energy Intensity.
Year Million Tons CO
2
Square Feet Energy Intensity (BTU/ft2/year)
Comment
2007 39,059 2,478,289 155,477 Purchased RECs included
2010 33,791 2,510,526 132,552 Purchased RECs included
2011 40,506 2,598,513 140,276 Purchased RECs included
2012 33,551 2,598,513 122,589 (warm winter)
Purchased RECs included
2015 (Early Estimate)
17,343 2,598,513 117,043 No RECs purchased
AppendixIX:OberlinCollege•Oberlin Climate Action Plan
Building commissioning: the process of verifying, in new construction, that all the building systems and controls (e.g. HVAC, plumbing, electrical, fire/life safety, building envelopes, etc.) achieve the owner's intended project requirements.
Re-commissioning: Revisiting a commissioned building's expected performance to ensure that it is continuing to achieve expectations.
Retro-commissioning: Verifying building systems where expected performance was not certified by commissioning when it was built.
define it:

78
By 2016, the programs and actions summarized above are expected to reduce the College’s GHG emissions to approximately 17,000 metric tons. To attain the stated goal of being climate neutral by 2025, the College would have 10 years to reduce GHG emis-sions to zero. Making the following assumptions, emissions could be reduced to about 6,100 metric tons in 2025; assuming:• 10% reduction of natural gas use as a result of building efficiency improvements.• 75% of remaining GHG emissions reduced with carbon neutral electricity.• 80% reduction of miscellaneous category resulting from enhanced recycling and
composting.• 50% of transportation GHG emissions offset by local tree planting.
The estimated remaining GHG emissions would be 3,200 metric tons from fossil fuel use (most extreme scenario), 1,500 metric tons from transportation and commuting, and 1,400 metric tons for non-renewable electricity (assuming 1. increased electricity use for heating and 2. OMLPS’s electricity is not all carbon neutral). It is the College’s intention to use credits, RECs, tree planting, or some yet-to-be-identified way to elimi-nate or offset these tons of GHG.
ConclusionOne of the goals of Oberlin College for its students has long been “to expand their social awareness, social responsibility, and capacity for moral judgment in order to prepare them for intelligent and useful response to the present and future demands of society.” The Strategic Plan for Oberlin adopted in 2005 states “Oberlin is committed to providing an education that develops scientific knowledge, global perspectives, environmental consciousness, concern for social justice, and artistic understanding” and lists “Move toward environmental sustainability” as one of the seven points under its Educational Goals.
Oberlin College has a long history of progressive leadership on social justice issues and a shorter, but equally impressive, history in environmental stewardship. The pur-suit of carbon neutrality in many ways represents the ultimate liberal art and as such is fundamentally important to a liberal arts college. For the College to pursue its mis-sion of education requires meeting the needs of the present without compromising the ability of future generations of students to meet their needs. That is to say it requires sustainability and a stable climate in order to educate generation after generation of students. A community that understands the dynamic interactions of species and com-munities over time and during changing ecological conditions is one that recognizes the interconnections between the environment, economics, equity and education. A college that embraces carbon neutrality commits itself to instilling a consciousness of these interrelationships and to developing the skills necessary to create new possibili-ties and extend our ecological imaginations through any discipline, field, endeavor, or area of study.
Oberlin Climate Action Plan • Appendix IX: Oberlin College

79
Additional Potential Strategies
Financing
Strategy Lead Entity Benefits
Feed-in Tariffs and Clean Contracts
Individuals and OMLPS
A feed-in tariff requires utilities to pay rates set by the government for renewable power over a certain pe-riod of time. This encourages private investment into renewable projects.
Policy
Strategy Lead Entity Benefits
Local Purchasing Policy
City of Oberlin, Oberlin College
The City and Oberlin College could adopt, implement, and aggressively pursue local and green purchasing policies to support local and sus-tainable businesses.
Home Grown Power/Sustainability Triggers
City of Oberlin, OMLPS
Sustainability Trigger: Any signifi-cant change in supply or demand for electricity that results in substan-tially greater demand for electricity from OMLPS than is currently projected due to factors such as economic growth, new customers outside of Oberlin, increased rates of electric vehicle adoption, or, alterna-tively, due to a significant reduction in supply to meet existing demand (such as a reduction in landfill gas available over time), should be met with renewable energy, CLEAN con-tracts, and efficiency purchases.
Eco Industrial Park City of Oberlin, Team Lorain County
The City can foster a communi-ty of manufacturing and service businesses that comes together to enhance their environmental and economic performance through collaboration in managing envi-ronmental and resource issues, including energy, water, and ma-terials. Requires strong Economic Development leadership.
Carbon Footprint Label/Anaylysis
Oberlin College Oberlin College should require carbon footprint analyses from all large suppliers, implement green and local purchasing policies, and work with Oberlin Eco-Industrial Park Members to determine how members can serve Oberlin College needs (and then help them do so).
Appendix X: Achieving Climate Positive
AppendixX:AchievingClimatePositive•Oberlin Climate Action Plan
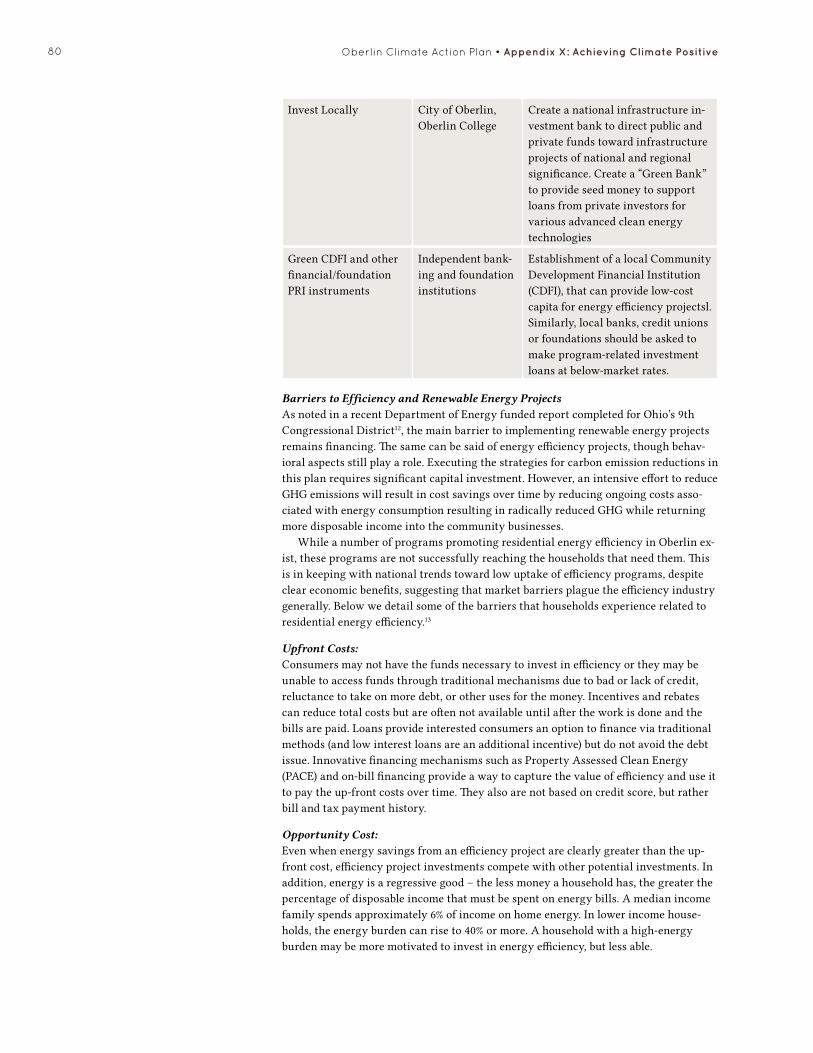
80
Invest Locally City of Oberlin, Oberlin College
Create a national infrastructure in-vestment bank to direct public and private funds toward infrastructure projects of national and regional significance. Create a “Green Bank” to provide seed money to support loans from private investors for various advanced clean energy technologies
Green CDFI and other financial/foundation PRI instruments
Independent bank-ing and foundation institutions
Establishment of a local Community Development Financial Institution (CDFI), that can provide low-cost capita for energy efficiency projectsl. Similarly, local banks, credit unions or foundations should be asked to make program-related investment loans at below-market rates.
Barriers to Efficiency and Renewable Energy ProjectsAs noted in a recent Department of Energy funded report completed for Ohio’s 9th Congressional District12, the main barrier to implementing renewable energy projects remains financing. The same can be said of energy efficiency projects, though behav-ioral aspects still play a role. Executing the strategies for carbon emission reductions in this plan requires significant capital investment. However, an intensive effort to reduce GHG emissions will result in cost savings over time by reducing ongoing costs asso-ciated with energy consumption resulting in radically reduced GHG while returning more disposable income into the community businesses.
While a number of programs promoting residential energy efficiency in Oberlin ex-ist, these programs are not successfully reaching the households that need them. This is in keeping with national trends toward low uptake of efficiency programs, despite clear economic benefits, suggesting that market barriers plague the efficiency industry generally. Below we detail some of the barriers that households experience related to residential energy efficiency.13
Upfront Costs: Consumers may not have the funds necessary to invest in efficiency or they may be unable to access funds through traditional mechanisms due to bad or lack of credit, reluctance to take on more debt, or other uses for the money. Incentives and rebates can reduce total costs but are often not available until after the work is done and the bills are paid. Loans provide interested consumers an option to finance via traditional methods (and low interest loans are an additional incentive) but do not avoid the debt issue. Innovative financing mechanisms such as Property Assessed Clean Energy (PACE) and on-bill financing provide a way to capture the value of efficiency and use it to pay the up-front costs over time. They also are not based on credit score, but rather bill and tax payment history.
Opportunity Cost: Even when energy savings from an efficiency project are clearly greater than the up-front cost, efficiency project investments compete with other potential investments. In addition, energy is a regressive good – the less money a household has, the greater the percentage of disposable income that must be spent on energy bills. A median income family spends approximately 6% of income on home energy. In lower income house-holds, the energy burden can rise to 40% or more. A household with a high-energy burden may be more motivated to invest in energy efficiency, but less able.
Oberlin Climate Action Plan • Appendix X: Achieving Climate Positive

81Appendix X: Achieving Climate Positive • Oberlin Climate Action Plan
Lack of Knowledge/Understanding: Many households are simply not aware of the opportunities or benefits of energy efficiency. If they are, they often have incorrect perceptions of what measures are most effective in increasing the efficiency of their home and lack understanding of the payback time of various measures. This lack of knowledge is a significant barrier to the widespread uptake of energy efficiency retrofits.
Risk: Homeowners may be unsure that savings from energy efficiency improvements will pay for themselves over time in energy savings. Owners or occupants may be unsure they will stay in the structure long enough to recoup their costs. Structuring the payment obligation to run with the meter or the property ensures that occupants who benefit from the energy savings continue to pay the installation costs.
Split Incentives: Landlords have little incentive to improve their properties’ energy performance if tenants pay the energy bills. Aside from reductions in their utility bills, there is little incentive on behalf of the renter to fund improvements to the property that ultimately benefits the landlord. Any installed measure a renter makes will ultimately benefit the landlord through property appreciation because the majority of installed measures will stay with the property. Utility-based programs can place repayment charges on energy bills that go to tenants. With the energy savings, the tenants’ net cost decreas-es, and the landlord benefits from an improved property at no cost other than to notify subsequent tenants of the arrangement. In addition, programs could design “cost-shares” between tenants and landlords.
Multiple Utilities: Many households are served by multiple utilities, e.g. an electric company and a different source of heating, such as a gas company or fuel oil company. This presents a challenge for “on-bill” programs in that measures are likely to impact both heat and electrical use, and savings will thus be seen on both bills, but costs will only be charged on one of the bills. A related problem exists for PACE and signature loan programs – savings will be seen on utility bills, but will be paid as a monthly loan payment or on the property tax.

82
End Notes1. For more information, see Nat Brandt, The Town That Started the Civil War (Syracuse, NY: Syracuse University Press, 1990)
2. “Profile of General Population and Housing Characteristics: 2010 Demographic Profile Data,” accessed February 13, 2013, http://factfinder2.census.gov/bkmk/table/1.0/en/DEC/10_DP/DPDP1/1600000US3957834
3. “SELECTED ECONOMIC CHARACTERISTICS, 2006-2010 American Community Survey 5-Year Estimates,” accessed February 13, 2013, http://factfinder2.census.gov/bkmk/table/1.0/en/ACS/10_5YR/DP03/1600000US3957834
4. “Global Analysis 2012,” accessed February 13, 2013, http://www.ncdc.noaa.gov/sotc/global
5. Daniel Grossman, “Spring Forward,” Scientific American, January 2004, 84-91.
6.Andrew Sheperd, et. al, “A Reconciled Estimate of Ice-Sheet Mass Balance,” November 2012, accessed February 13, 2013, http://www.sciencemag.org/content/338/6111/1183
7. Solomon, S., et.al, “Climate Change 2007: The Physical Science Basis ,” accessed February 13, 2013, http://www.ipcc.ch/publications_and_data/publications_ipcc_fourth_assessment_report_wg1_report_the_physical_science_basis.htm
8. Jeff Tollefson, “Methane leaks erode green credentials of natural gas,” Nature: 493, 12, January 2, 2013, accessed February 13, 2013, http://www.nature.com/news/methane-leaks-erode-green-credentials-of-natural-gas-1.12123
9. “Energy Efficient Transportation Plan for Oberlin and Northern Ohio”, Center for Neighborhood Technology (CNT), August 26, 2011, accessed February 13, 2013, http://www.oberlinproject.org/images/policy-library/CNT%20Oberlin%20Transportation%20Plan.pdf
10. Preston, Koerner, “Breaking Down Building Energy Use,” accessed February 13, 2013, http://www.jetsongreen.com/2009/08/breaking-down-building-energy-use.html
11. Hosey, L. “The G-list,” Architect, July 27, 2010, accessed February 13, 2013, http://www.architectmagazine.com/green-building/web-exclusive-the-g-list-survey-of-archi-tecture.aspx
12. “Transforming and Embracing Innovation in Ohio’s 9th Congressional District: Moving Toward Sustainable, Efficient & Reliable Energy,” accessed February 13, 2013, http://www.oberlinproject.org/images/policy-library/NETL%20Oberlin%20Report.pdf
13. Taken from "Implementing Residential Energy Efficiency: Oberlin, OH," Ohio Environmental Council, accessed February 13, 2013, http://www.oberlinproject.org/images/policy-library/Oberlin%20Residential%20Energy%20Efficiency.pdf
Oberlin Climate Action Plan • References

83References • Oberlin Climate Action Plan