© 2011 climateworks foundation - energy...
TRANSCRIPT

© 2011 ClimateWorks Foundation 235 Montgomery Street, Suite 1300 San Francisco, CA 94104 www.climateworks.org

1
The costs of delayHal Harvey, Chief Executive Officer, ClimateWorks Foundation Sonia Aggarwal, Manager, Global Research and Special Projects, ClimateWorks Foundation
The physics of the earth harbor a frightening punch line for the climate change story: Even though the consequences of climate change persist for the very long term, the time to avoid those consequences is very short. A delay — of even a decade — in reducing CO2 emissions will lock in large-scale, irreversible change. Delay also increases the risk that the whole climate system will spin out of control.
This message may be alarming, but it is not alarmism; it’s physics. And the earth’s climate physics have serious implications for political action and technological innovation in the coming decade.
The story has five parts:
1 Stabilizing at any CO2 concentration requires very low emissions Carbon dioxide persists in the atmosphere for a very long time; because it can accumulate for millennia, stabilizing concentrations at any level ultimately requires nearly zero emissions.
2 Carbon “sinks” are disappearing Natural safety valves — primarily the biosphere and oceans, which absorb almost half our CO2 emissions — are shutting down as they become saturated with CO2.
3 Many impacts of climate change are irreversible Continued high emissions will lock in persistent damage.
4 The system can spin out of control If the natural system crosses certain tipping points, it can unleash runaway change.
5 Acting now saves money The economic costs of stabilizing later, even at a higher CO2 concentration, will be very painful or even impossible.
Addressing climate change is like turning an ocean liner: Changing course takes time, and no amount of rudder, applied too late, can hit the mark. The world must start to reduce emissions now, or it will not reach any meaningful CO2 concentration target. The upshot is that the next decade is critical.
2
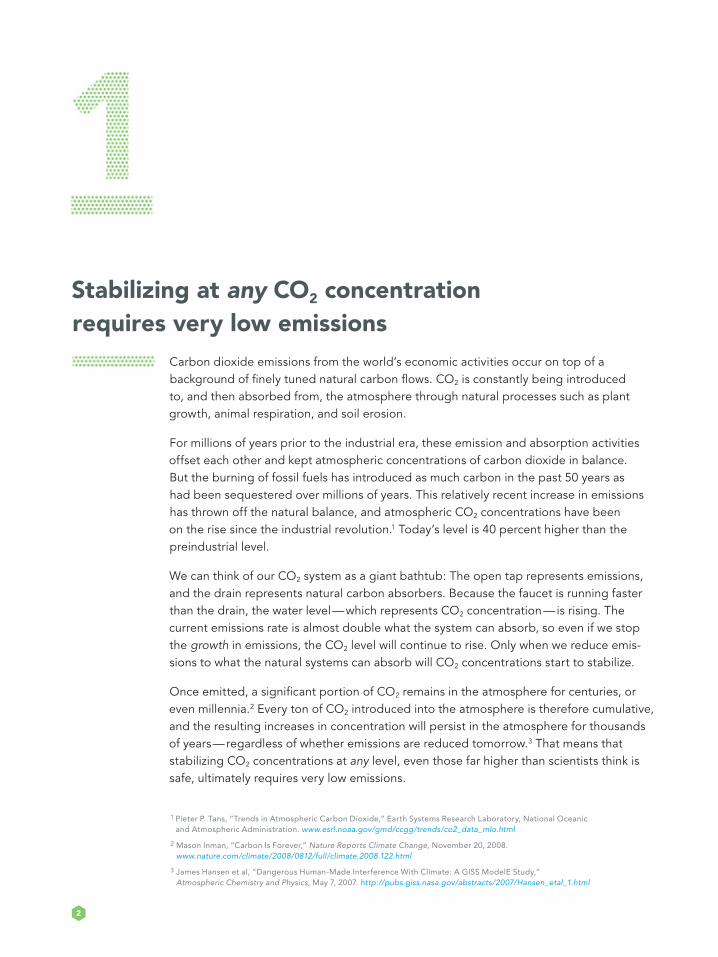
Stabilizing at any CO2 concentration requires very low emissions
Carbon dioxide emissions from the world’s economic activities occur on top of a background of finely tuned natural carbon flows. CO2 is constantly being introduced to, and then absorbed from, the atmosphere through natural processes such as plant growth, animal respiration, and soil erosion.
For millions of years prior to the industrial era, these emission and absorption activities offset each other and kept atmospheric concentrations of carbon dioxide in balance. But the burning of fossil fuels has introduced as much carbon in the past 50 years as had been sequestered over millions of years. This relatively recent increase in emissions has thrown off the natural balance, and atmospheric CO2 concentrations have been on the rise since the industrial revolution.1 Today’s level is 40 percent higher than the preindustrial level.
We can think of our CO2 system as a giant bathtub: The open tap represents emissions, and the drain represents natural carbon absorbers. Because the faucet is running faster than the drain, the water level — which represents CO2 concentration — is rising. The current emissions rate is almost double what the system can absorb, so even if we stop the growth in emissions, the CO2 level will continue to rise. Only when we reduce emis-sions to what the natural systems can absorb will CO2 concentrations start to stabilize.
Once emitted, a significant portion of CO2 remains in the atmosphere for centuries, or even millennia.2 Every ton of CO2 introduced into the atmosphere is therefore cumulative, and the resulting increases in concentration will persist in the atmosphere for thousands of years — regardless of whether emissions are reduced tomorrow.3 That means that stabilizing CO2 concentrations at any level, even those far higher than scientists think is safe, ultimately requires very low emissions.
1 Pieter P. Tans, “Trends in Atmospheric Carbon Dioxide,” Earth Systems Research Laboratory, National Oceanic and Atmospheric Administration. www.esrl.noaa.gov/gmd/ccgg/trends/co2_data_mlo.html
2 Mason Inman, “Carbon Is Forever,” Nature Reports Climate Change, November 20, 2008. www.nature.com/climate/2008/0812/full/climate.2008.122.html
3 James Hansen et al, “Dangerous Human-Made Interference With Climate: A GISS ModelE Study,” Atmospheric Chemistry and Physics, May 7, 2007. http://pubs.giss.nasa.gov/abstracts/2007/Hansen_etal_1.html
3
CO
2e
CO
NC
EN
TR
AT
ION
S IN
PP
M
300
540
780
1,020
1,260
1,500
GT
CO
2e
EM
ISSI
ON
S P
ER
YE
AR
0
30
60
90
120
150
LEGEND
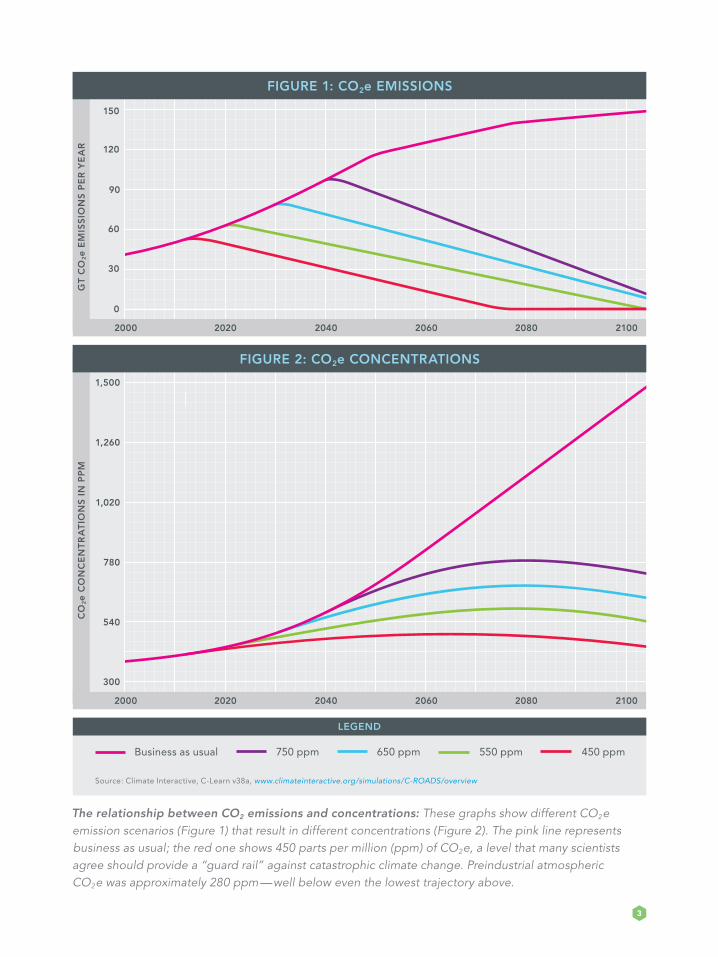
450 ppmBusiness as usual 750 ppm 650 ppm 550 ppm
2000 2020 2040 2060 2080 2100
FIGURE 2: CO2e CONCENTRATIONS
FIGURE 1: CO2e EMISSIONS
2000 2020 2040 2060 2080 2100
The relationship between CO2 emissions and concentrations: These graphs show different CO2e emission scenarios (Figure 1) that result in different concentrations (Figure 2). The pink line represents business as usual; the red one shows 450 parts per million (ppm) of CO2e, a level that many scientists agree should provide a “guard rail” against catastrophic climate change. Preindustrial atmospheric CO2e was approximately 280 ppm — well below even the lowest trajectory above.
Source: Climate Interactive, C-Learn v38a, www.climateinteractive.org/simulations/C-ROADS/overview

4
4 S. Khatiwala, F. Primeau, and T. Hall, “Reconstruction of the History of Anthropogenic CO2 Concentrations in the Ocean,” Nature, November 19, 2009. www.nature.com/nature/journal/v462/n7271/full/nature08526.html
Carbon “sinks” are disappearingUntil recently, natural carbon “sinks,” primarily oceans and plants, absorbed much of the carbon dioxide emitted into the atmosphere. About a quarter of the CO2 dumped into the atmosphere each year is absorbed by the oceans (although this has the nasty effect of making the oceans more acidic, potentially devastating marine life) and approximately another quarter by plants. Without these carbon sinks, atmospheric CO2 levels would rise almost twice as fast as they have since the dawn of the industrial era. But as the world emits more CO2, these sinks are becoming saturated. This means that even if CO2 emissions remain constant, the growth rate of CO2 concentrations in the atmosphere will continue to rise.
Researchers at Columbia University estimate that the oceans currently absorb more than 8 gigatonnes, or billion metric tons (Gt), of CO2 from human activities each year. But the proportion of total emissions soaked up by the oceans between 2000 and 2007 may have declined by as much as 10 percent.4 As the seas warm, their ability to sequester carbon dioxide decreases; in addition, the more CO2 they absorb, the more acidic they become, further reducing their ability to absorb carbon. Meanwhile, changing land-use patterns and deforestation are reducing the ability of plants — Earth’s other main carbon sink — to absorb CO2.
In essence, these natural sinks have masked the impact of half of our CO2 emissions. When that physical forgiveness gives out, we will be in deep trouble. Over the next several decades, emissions must be reduced to very low levels to stabilize CO2 in the atmosphere at any concentration.

5
Over the next few decades, emissions must be reduced to very low levels to stabilize CO2 in the atmosphere at any concentration.
5
6
Many impacts of climate change are irreversibleDue to time lags inherent in Earth’s physical systems, climate changes caused by CO2 emissions will persist — and even grow — for centuries, even after emissions are halted. We are already seeing some effects of increased greenhouse gas levels, but we have yet to witness the full impact of the current accumulation in the atmosphere.
As shown in Figure 3, even if CO2 emissions are reduced substantially (orange line), and atmospheric concentrations subsequently stabilize (purple line), the average surface air temperature will continue to rise for at least a century, and sea level will continue to rise for several millennia. This is because the earth’s surface temperature does not react instantaneously to rising carbon dioxide levels. Much of this lag, called
“thermal inertia,” is attributable to the slow warming of the oceans, which have tremen-dous heat-absorption capacity.
These changes do not reverse, even as emissions drop. And they can have serious consequences. A warmer climate is likely to permanently alter ecosystems, spur a wave of extinctions, and significantly reduce crop yields because of more frequent heat waves and drier soil.5
Optimistic projections of climate warming estimate that 18 percent of all species will become extinct because of ecosystem alteration and loss. More worrisome estimates show that up to 35 percent of species will vanish.6 The low estimate would rank among the greatest waves of extinction in all history; the higher range is unthinkable. But the point is clear: Early action is crucial — and delays will lead to irreversible loss.
5 David S. Battisti and Rosamond L. Naylor, “Historical Warnings of Future Food Insecurity With Unprecedented Seasonal Heat,” Science 323, no. 5927, January 9, 2009. http://fsi.stanford.edu/publications/historical_warnings_of_future_food_insecurity_with_unprecedented_seasonal_heat
6 Chris D. Thomas et al, “Extinction Risk From Climate Change,” Nature 427, January 8, 2004. www.nature.com/nature/journal/v427/n6970/full/nature02121.html

7
LEGEND
Sea-level rise due to melting ice:several millennia
CO2 emissions Temperature stabilization:a few centuries
CO2 stabilization:100 to 300 years
Sea-level rise due to thermal expansion:centuries to millennia
CO2 EMISSIONS PEAK
1,000 YEARS100 YEARSTODAY
FIGURE 3: TIME REQUIRED TO REACH EQUILIBRIUM
CO2 concentration, temperature, and sea level continue to rise long after emissions are reduced.
Source: Intergovernmental Panel on Climate Change, Climate Change 2001: Synthesis Report—Summary for Policymakers. www.ipcc.ch/pdf/assessment-report/ar4/syr/ar4_syr_spm.pdf
8
At the current emissions rate, the world will burn through its carbonbudget in 20 years.
10
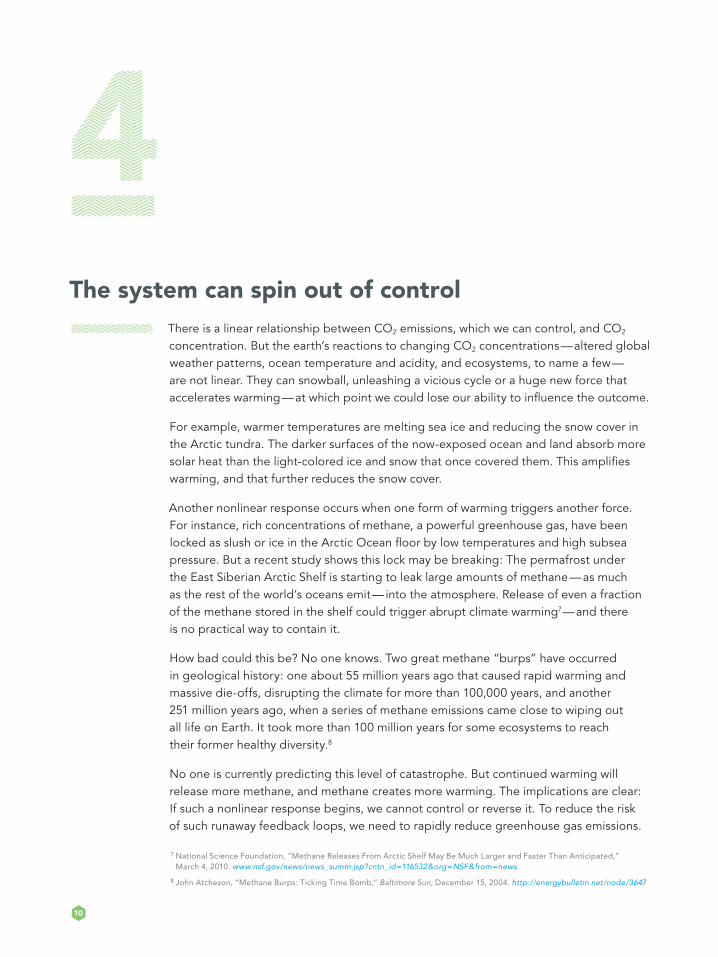
The system can spin out of controlThere is a linear relationship between CO2 emissions, which we can control, and CO2 concentration. But the earth’s reactions to changing CO2 concentrations — altered global weather patterns, ocean temperature and acidity, and ecosystems, to name a few — are not linear. They can snowball, unleashing a vicious cycle or a huge new force that accelerates warming — at which point we could lose our ability to influence the outcome.
For example, warmer temperatures are melting sea ice and reducing the snow cover in the Arctic tundra. The darker surfaces of the now-exposed ocean and land absorb more solar heat than the light-colored ice and snow that once covered them. This amplifies warming, and that further reduces the snow cover.
Another nonlinear response occurs when one form of warming triggers another force. For instance, rich concentrations of methane, a powerful greenhouse gas, have been locked as slush or ice in the Arctic Ocean floor by low temperatures and high subsea pressure. But a recent study shows this lock may be breaking: The permafrost under the East Siberian Arctic Shelf is starting to leak large amounts of methane — as much as the rest of the world’s oceans emit — into the atmosphere. Release of even a fraction of the methane stored in the shelf could trigger abrupt climate warming7 — and there is no practical way to contain it.
How bad could this be? No one knows. Two great methane “burps” have occurred in geological history: one about 55 million years ago that caused rapid warming and massive die-offs, disrupting the climate for more than 100,000 years, and another 251 million years ago, when a series of methane emissions came close to wiping out all life on Earth. It took more than 100 million years for some ecosystems to reach their former healthy diversity.8
No one is currently predicting this level of catastrophe. But continued warming will release more methane, and methane creates more warming. The implications are clear: If such a nonlinear response begins, we cannot control or reverse it. To reduce the risk of such runaway feedback loops, we need to rapidly reduce greenhouse gas emissions.
7 National Science Foundation, “Methane Releases From Arctic Shelf May Be Much Larger and Faster Than Anticipated,” March 4, 2010. www.nsf.gov/news/news_summ.jsp?cntn_id=116532&org=NSF&from=news
8 John Atcheson, “Methane Burps: Ticking Time Bomb,” Baltimore Sun, December 15, 2004. http://energybulletin.net/node/3647

11
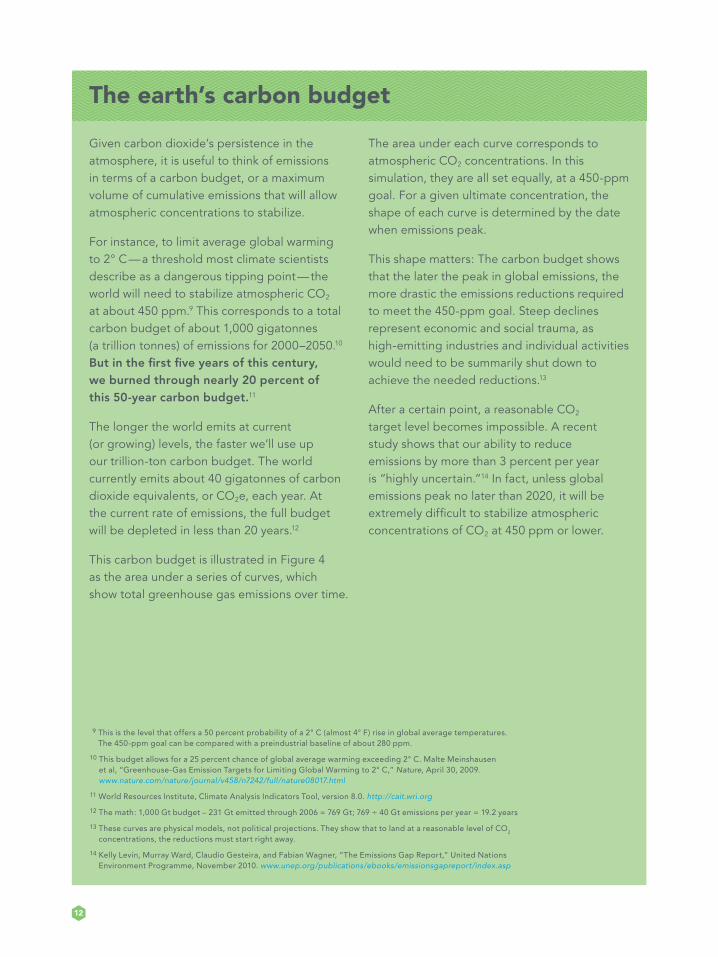
Unless global emissions peak by 2020, it will be nearly impossible to stabilize atmospheric concentrations of CO2 at 450 ppm or lower.
12
Given carbon dioxide’s persistence in the atmosphere, it is useful to think of emissions in terms of a carbon budget, or a maximum volume of cumulative emissions that will allow atmospheric concentrations to stabilize.
For instance, to limit average global warming to 2° C — a threshold most climate scientists describe as a dangerous tipping point — the world will need to stabilize atmospheric CO2 at about 450 ppm.9 This corresponds to a total carbon budget of about 1,000 gigatonnes (a trillion tonnes) of emissions for 2000–2050.10 But in the first five years of this century, we burned through nearly 20 percent of this 50-year carbon budget.11
The longer the world emits at current (or growing) levels, the faster we’ll use up our trillion-ton carbon budget. The world currently emits about 40 gigatonnes of carbon dioxide equivalents, or CO2e, each year. At the current rate of emissions, the full budget will be depleted in less than 20 years.12
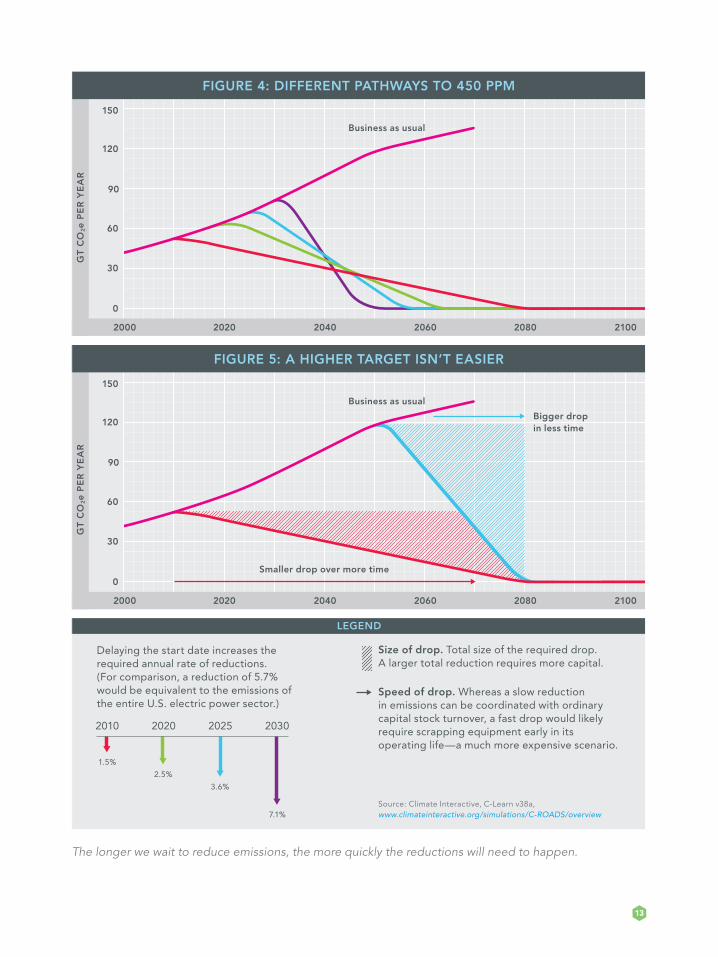
This carbon budget is illustrated in Figure 4 as the area under a series of curves, which show total greenhouse gas emissions over time.
The area under each curve corresponds to atmospheric CO2 concentrations. In this simulation, they are all set equally, at a 450-ppm goal. For a given ultimate concentration, the shape of each curve is determined by the date when emissions peak.
This shape matters: The carbon budget shows that the later the peak in global emissions, the more drastic the emissions reductions required to meet the 450-ppm goal. Steep declines represent economic and social trauma, as high-emitting industries and individual activities would need to be summarily shut down to achieve the needed reductions.13
After a certain point, a reasonable CO2 target level becomes impossible. A recent study shows that our ability to reduce emissions by more than 3 percent per year is “highly uncertain.”14 In fact, unless global emissions peak no later than 2020, it will be extremely difficult to stabilize atmospheric concentrations of CO2 at 450 ppm or lower.
The earth’s carbon budget
9 This is the level that offers a 50 percent probability of a 2° C (almost 4° F) rise in global average temperatures. The 450-ppm goal can be compared with a preindustrial baseline of about 280 ppm.
10 This budget allows for a 25 percent chance of global average warming exceeding 2° C. Malte Meinshausen et al, “Greenhouse-Gas Emission Targets for Limiting Global Warming to 2° C,” Nature, April 30, 2009. www.nature.com/nature/journal/v458/n7242/full/nature08017.html
11 World Resources Institute, Climate Analysis Indicators Tool, version 8.0. http://cait.wri.org
12 The math: 1,000 Gt budget – 231 Gt emitted through 2006 = 769 Gt; 769 ÷ 40 Gt emissions per year = 19.2 years
13 These curves are physical models, not political projections. They show that to land at a reasonable level of CO2 concentrations, the reductions must start right away.
14 Kelly Levin, Murray Ward, Claudio Gesteira, and Fabian Wagner, “The Emissions Gap Report,” United Nations Environment Programme, November 2010. www.unep.org/publications/ebooks/emissionsgapreport/index.asp
13
GT
CO
2e
PE
R Y
EA
R
0
30
60
90
120
150
FIGURE 4: DIFFERENT PATHWAYS TO 450 PPM
2000 2020 2040 2060 2080 2100
GT
CO
2e
PE
R Y
EA
R
0
30
60
90
120
150
Business as usual
Business as usual
Bigger dropin less time
Smaller drop over more time
LEGEND
1.5%2.5%
7.1%
2010 2020
3.6%
2025 2030
Size of drop. Total size of the required drop. A larger total reduction requires more capital.
Speed of drop. Whereas a slow reduction in emissions can be coordinated with ordinary capital stock turnover, a fast drop would likely require scrapping equipment early in its operating life—a much more expensive scenario.
Delaying the start date increases the required annual rate of reductions. (For comparison, a reduction of 5.7% would be equivalent to the emissions of the entire U.S. electric power sector.)
2000 2020 2040 2060 2080 2100
FIGURE 5: A HIGHER TARGET ISN’T EASIER
The longer we wait to reduce emissions, the more quickly the reductions will need to happen.
Source: Climate Interactive, C-Learn v38a, www.climateinteractive.org/simulations/C-ROADS/overview

14
Acting now saves money Most energy-consuming assets — such as homes, offices, power plants, and industrial facilities — have long lives that lock in their energy use patterns for decades.
The cheapest way to reduce CO2 emissions is to ensure that all new capital equipment — factories, buildings, power plants, and cities — is very efficient and is powered by low-carbon sources. It will be enormously costly if the world misses this opportunity, builds inefficient infrastructure, and then has to renovate it.
It is not difficult to halve the energy consumed in most sectors. For example, a house built with thick insulation, high-performance windows, and an efficient furnace uses very little energy, year after year—and costs only nominally more to build than an inefficient home. In contrast, fixing up a leaky house is much more expensive — and less effective.
The same logic applies to efforts to reduce the carbon emissions from the energy sector. Worldwide, the electricity delivery system has some 5,000 gigawatts of capacity,14 equivalent to about 5,000 large nuclear power plants. It would be prohibi-tively expensive to rapidly replace a large fraction of that power-generating equipment
The longer we delay, the more likely we are to face irreversible impacts and therefore be forced to make far costlier investments in human relocation and adaptation. The Stern Review, for example, estimated that mitigation
would cost 1 percent of GDP, whereas the cost of dealing with unabated climate change could reach 20 percent or more of GDP.1 Several subsequent studies indicate that the costs of adaptation will be substantially higher.2
Mitigation versus adaptation
1 Stern Review on the Economics of Climate Change, October 2006. http://webarchive.nationalarchives.gov.uk/+/http:/www.hm-treasury.gov.uk/sternreview_index.htm
2 Martin Parry et al, “Assessing the Costs of Adaptation to Climate Change: A Review of the UNFCCC and Other Recent Estimates,” International Institute for Environment and Development, August 2009, http://pubs.iied.org/pdfs/11501IIED.pdf; and International Bank for Reconstruction and Development and the World Bank, “Economics of Adaptation to Climate Change: Synthesis Report,” 2010, http://climatechange.worldbank.org/sites/default/files/documents/EACCSynthesisReport.pdf
15
in a very short time. To give a rough estimate of the costs involved, a single nuclear power plant that produces about 1 GW costs about $3 billion to build, depending on technology and location. (That is the lower end of the range; more recent estimates — even before the crisis in Japan — run as high as $9 billion.15)
Some quick math suggests that it would cost about $15 trillion — or more than a quarter of global GDP — to immediately replace the world’s power plants with low-carbon sources. This estimate does not include the expected increase in power demand in India, China, and other fast-growing countries. But an early start on the transition to clean energy means that natural turnover, replacing equipment at the end of its useful life, will pay much of this bill. Delay will jack up the price.
To ensure that houses, cars, equipment, and factories are designed to save energy, nations need to have energy efficiency policies — such as fuel efficiency standards and building codes — in place now, not later. And to drive down the cost of clean technologies and get the rest of the way to zero emissions, governments must invest substantially in R&D today. If we start immediately and make steady improvement over the next 50 years, we can convert our energy supplies to near-zero sources. If we wait even a decade, the accelerated transition will shock the global economy.
14 International Energy Agency, World Energy Outlook 2010. www.worldenergyoutlook.org
15 Fred Pals and Kari Lundgren, “EDF, RWE May Spend $9.3 Billion Per New Nuclear Plant in U.K., Hendry Says,” Bloomberg, August 25, 2010. www.bloomberg.com/news/2010-08-25/edf-rwe-may-spend-9-3-billion-per-new-nuclear-plant-in-u-k-hendry-says.html
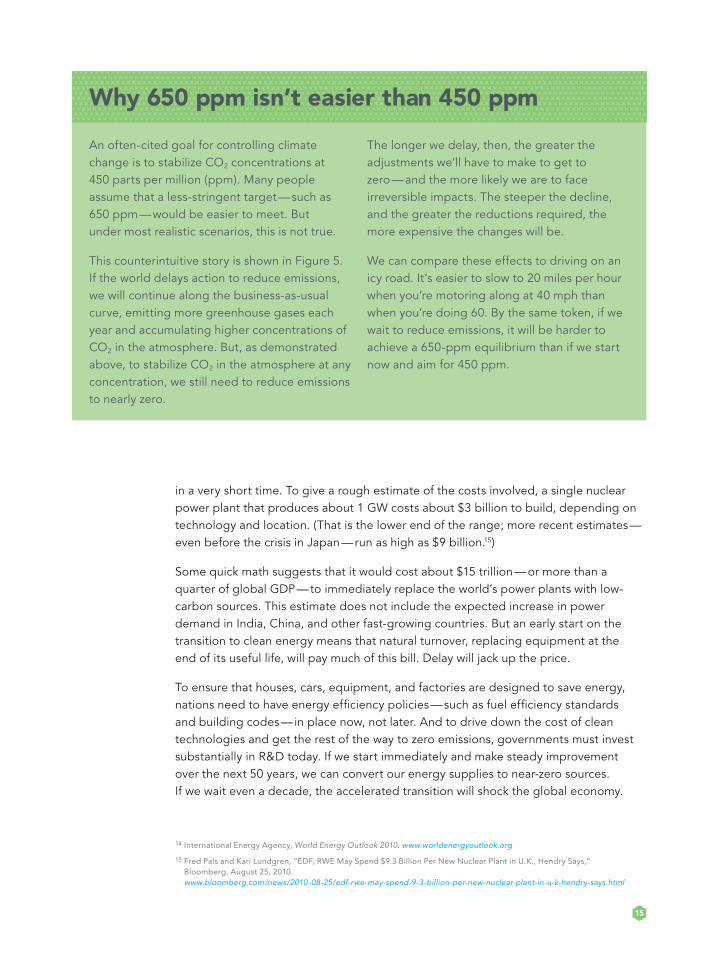
An often-cited goal for controlling climate change is to stabilize CO2 concentrations at 450 parts per million (ppm). Many people assume that a less-stringent target — such as 650 ppm — would be easier to meet. But under most realistic scenarios, this is not true.
This counterintuitive story is shown in Figure 5. If the world delays action to reduce emissions, we will continue along the business-as-usual curve, emitting more greenhouse gases each year and accumulating higher concentrations of CO2 in the atmosphere. But, as demonstrated above, to stabilize CO2 in the atmosphere at any concentration, we still need to reduce emissions to nearly zero.
The longer we delay, then, the greater the adjustments we’ll have to make to get to zero — and the more likely we are to face irreversible impacts. The steeper the decline, and the greater the reductions required, the more expensive the changes will be.
We can compare these effects to driving on an icy road. It’s easier to slow to 20 miles per hour when you’re motoring along at 40 mph than when you’re doing 60. By the same token, if we wait to reduce emissions, it will be harder to achieve a 650-ppm equilibrium than if we start now and aim for 450 ppm.
Why 650 ppm isn’t easier than 450 ppm
16
Putting it all togetherThe consequences of a delay in reducing carbon emissions are insidious and inescapable. To recap: The math of historical CO2 accumulation gives us no choice but to slash emissions to very low levels. Earth’s natural carbon sinks are becoming saturated, so our safety valve is slowly closing; our planet’s ecosystems face irreversible damage such as widespread extinctions; and these changes are pushing our climate system toward tipping points beyond which the domino effects could be devastating. Because many effects lag emissions, we have yet to experience the full impact of historical emissions.
The longer we wait, the more drastic the cuts — and associated costs — will be. If we delay action for even a decade, CO2 concentrations will likely blow right past 450 ppm and unleash the dangers of nonlinear ecological and geophysical responses. If, instead, we step up to the challenge and pass strong energy policies and invest aggressively in clean energy R&D, we have a fighting chance of containing CO2 concentrations at 450 ppm — and averting a climate catastrophe.

The ClimateWorks Foundation supports public policies that prevent dangerous climate change and promote global prosperity.
ClimateWorks’ goal is to limit annual global greenhouse gas emissions to 44 billion metric tons by the year 2020 (25 percent below business-as-usual projections) and 35 billion metric tons by the year 2030 (50 percent below projections).
These ambitious targets require the immediate and widespread adoption of smart energy and land use policies. ClimateWorks and its network of affiliated organizations promote these policies in the regions and sectors responsible for most greenhouse gas emissions.
Design: Hyperakt, www.hyperakt.com

ClimateWorks Foundation 235 Montgomery Street, Suite 1300 San Francisco, CA 94104 www.climateworks.org