2010 water quality report university of florida …soils.ifas.ufl.edu/campuswaterquality/pdf/2010...
TRANSCRIPT
1
2010 Water Quality Report
University of Florida
Main Campus
Prepared by
Italo Lenta, M.S., M.S.
Mark Clark, Ph.D.
Soil and Water Science Department
Institute of Food and Agricultural Sciences
University of Florida, Gainesville

2
UF Clean Water Campaign The UF Clean Water Campaign is an initiative by faculty, staff and students at the University of Florida whose mission is to protect the campus waterways from non-point source pollution, one of the major sources of pollution to rivers, lakes and estuaries. Specifically, the campaign addresses requirements under the National Pollutant Discharge Elimination System (NPDES), which is implemented by the United States Environmental Protection Agency (US EPA) and is administered in the state of Florida by the Department of Environmental Protection (DEP). Under the NPDES program, the University of Florida is required to implement a stormwater management program. The UF Clean Water Campaign focuses on the public education and participation components of the UF stormwater management program. The campaign aims to reduce stormwater pollution as well as other non-point sources of pollution through the following activities:
Campus Water Quality Monitoring Program (CWQ);
Storm drain marking events to discourage dumping in storm drains;
An informational website to educate the public about their role in keeping water clean; and
A tour of Best Management Practices (BMPs) that are found on the UF campus or could be implemented in the future.
For more information see http://campuswaterquality.ifas.ufl.edu
Overview Water features in the landscape are often critical habitat for flora and fauna, but they can also provide many aesthetic and recreational amenities to humans. The types of habitat provided and opportunities for human use are often dictated by the quality of water. Many factors affect water quality, and chemical characteristics are often significantly influenced by activities not within the water body itself, but instead by input contributions upstream in the watershed. Characteristics of upstream inputs are driven both by geomorphologic (natural) characteristics of the soil, and anthropogenic (human-caused) activities within the watershed. As the intensity of development within a watershed increases, there is often a commensurate increase in the runoff of chemical and particulate contaminants. For this reason, maintaining or achieving a particular use and aesthetic condition of a water body is dependent on a holistic management effort not just within the water body, but also throughout the entire drainage basin and/or watershed. The University of Florida (UF) has demonstrated its commitment to a sustainable campus through a variety of initiatives, including Greening UF, an application to be certified under Audubon International’s Cooperative Sanctuary Program, the incorporation of a conservation component in its master plan, the creation of a Water Institute, and the establishment of an Office of Sustainability. In addition to these self-initiated efforts, the University is also required under Phase II of the National Pollution Discharge Elimination System (NPDES) to address potential sources of non-point source pollution through public education, illicit discharge detection and elimination, and implementation of Best Management Practices for storm water runoff. To facilitate these multiple initiatives, a better understanding of water quality on the UF campus is warranted, and will better characterize existing conditions, help identify potential areas of concern, and establish a baseline for future assessment. Water quality monitoring has existed in Lake Alice for many years, typically in association with the UF Department of Fisheries and Aquatic Sciences. However, monitoring of tributaries that flow into Lake Alice as well as other prominent tributaries that flow into Bivens Arm, Hogtown Creek or to groundwater “sinks” on campus have only been intermittently sampled if at all. The sampling effort reported here was initiated in May 2003 by the UF Wetlands Club and is now organized under the UF Clean Water Campaign. Sampling presently consists of 11 stations on the UF campus, 5 stations at the Stormwater Ecological Enhancement Project (SEEP) located in the Natural Areas Teaching Lab (NATL), and 4 stations on the UF Golf Course. Coordination and sample analysis is financially supported by UF Physical Plant Division under NPDES Phase II permitting. Field sampling is facilitated by volunteer efforts of several UF student organizations. Presently, sampling is focused on water quality parameters related to physical characteristics and macro- nutrients. This report outlines the results of data collected during 2010. It is hoped that these efforts will provide water resource managers with

3
a better understanding of existing conditions and means to protect these valuable campus resources.
Water Sampling In November 2003, the Campus Water Quality monitoring program (CWQ) was formalized as part of the UF Clean Water Campaign with student volunteers from the UF Wetlands Club and the American Water Resources Association. The program has four main goals:
1) To develop a baseline of water quality data for campus waters; 2) To provide an annual summary of the data to the university community; 3) To identify potential pollution sources on campus; and 4) To propose the implementation of Best Management Practices (BMPs) in areas that
would best alleviate water pollution. Once a month, trained student volunteers collect water samples from twenty sites. At each site, temperature, dissolved oxygen, pH, conductivity, total dissolved solids, and reduction/oxidation potential (redox potential) are measured with a YSI 556 Multi-Probe Sensor. Measurements are taken approximately 30 - 40cm below the water surface between 12 and 5 pm. When water is present, a 500 mL water sample is collected from the mid-point in the water column. Samples are then transported to the laboratory and processed according to standard operating procedures certified by the National Environmental Laboratory Accreditation Conference (NELAC). Water samples are analyzed for total suspended solids, total nitrogen, nitrates, total Kjeldahl nitrogen, ammonium, total phosphorus, and soluble reactive phosphorus. A more detailed description of sampling methods, sample preservation and analysis techniques can be found in Appendix A.
Watersheds The UF Campus is part of four different watersheds: Lake Alice, Hogtown Creek, Tumblin Creek and internally drained Depression Basins (Figure 1). The majority of the University of Florida campus is a part of the Lake Alice watershed (1058 acres). None of these watersheds flow to tide, instead runoff from these areas eventually flow to groundwater either through natural sink or facilitated by gravity infiltration well. The entire campus is located in the St. Johns River Water Management District (SJRWMD) which, in addition to the Florida Department of Environmental Protection, provides regulatory oversight.

4
Figure 1. Major watersheds and sub-watersheds on the University of Florida Campus

5
Sampling Sites
There were 20 sites regularly sampled during the 2010 monitoring period (Figure 2). Eleven of these sites were on the Main Campus, five were at the Stormwater Ecological Enhancement Project (SEEP) in the Natural Area Teaching Lab (NATL), and four were at the UF Golf Course. Sampling sites were selected to characterize main tributaries flowing to Lake Alice, a tributary flowing to Bivens Arm, tributaries or water bodies flowing directly to a sink, or sites that subdivide a tributary into stream reaches or sub-catchments.
Figure 2. Location of Water Quality Sampling Stations
Description of Sampling Locations
1 2
Site 1 is the southern fork of the creek flowing south of Diamond Village and north of the McKnight Brain Institute. Its watershed includes the Brain Institute, parking garages and some of the academic and medical buildings to the south of the creek and east of Newell Drive. Lat/Lon: N29º 38’ 32.64996” W82º 20’ 36.86959” Site 2 is the northern fork of the creek flowing north of Diamond Village. Its watershed includes diamond village as well as buildings to the east of Newell Drive and south of Inner Road. Lat/Lon: N29º 38’ 32.64997” W82º 20’ 36.86959” Both forks have flow year round with some seasonal fluctuations. The two forks meet just north of the Brain Institute before the creek flows under Newell Drive and then continues on to Sites 3 and 4 before terminating in Lake Alice.
Sites 1 and 2: Brain Institute South and North

6
Site 3 is downstream from Sites 1 and 2 on the western side of Center Drive south of the New Engineering Building. The watershed for Site 3 includes the sub-watersheds of Sites 1 and 2 as well as Medical buildings east of Center Drive (to the south of the creek) and runoff from Center Drive itself. The creek widens at this point, has year-round flow and appears to be a point of periodic soil deposition. This creek terminates at Lake Alice. Lat/Lon: N29º 38’ 28.14122” W82º 20’ 46.49562”
Site 4 is downstream from Site 3 on the west side of North South Drive. The watershed for Site 4 includes the sub-watersheds of Sites 1, 2 and 3 as well as buildings and parking lots to the north and south of the creek and to the east of North South Drive. The sub-watershed also includes ponds and wetlands which flow south of the Chemical Engineering building and Wastewater Treatment Plant and runoff from Center Drive itself. The creek continues to widen, has year-round flow and has seasonal blooms of Lemna sp. west of the culvert. This creek enters the Lake Alice wetland and terminates at Lake Alice. Lat/Lon: N29º 38’ 27.33574” W82º 21’ 02.31465”
Site 5 is located upstream from Hume Pond by the bridge between the Commuter Parking Garage and the Hume Honors Dormitory parking lot. The watershed for Site 5 includes two creeks which drain a large area to the north and east of Hume Pond. The eastern fork of the creek drains the majority of the area east of North South Drive, south of University Avenue and North of Museum Road. The western fork drains the area west of North South Drive, south of SW 2nd Ave, and east of Woodlawn Drive. The entire watershed includes academic buildings, residences, parking areas, and athletic facilities including the Ben Hill Griffin Stadium and Perry Field. The creek has year-round flow and flows to Hume Pond before terminating in Lake Alice. Lat/Lon: N29º 38’ 38.39625” W82º 21’ 06.06332”
Site 3: New Engineering Building (NEB)
Site 4: North South Drive
Site 5 Hume Creek

7
Site 6 is located in the University Gardens south of Museum Road near the intersection with Fraternity Drive. The creek watershed includes Levin School of Law, Fraternity Row residences and athletic facilities including the Soccer Field and Beard Track. The creek has year-round flow and continues downstream to Site 7 and then terminates at Lake Alice. Lat/Lon: N29º 38’ 41.16428” W82º 21’ 26.31308”
Site 7 is located downstream from Site 6 after the creek flows through a small pond area. The creek watershed is similar to that of Site 6. The creek has year-round flow and terminates at Lake Alice. Lat/Lon: N29º 38’ 41.16428” W82º 21’ 26.31308”
Site 8 is located at the Baughman Center on the western side of the bridge. Water sampled at Site 8 is somewhat representative of Lake Alice water. Water passing under the bridge is likely to discharge down one of two gravity infiltration wells on Lake Alice that flow directly to the Floridian Aquifer. This is the only sampling site located on Lake Alice. Lat/Lon: N29º 38’ 33.46003” W82º 21’ 50.09270”
Site 9 is located on the south side of Mowry Road east of IFAS Facilities Planning/Operations and north of an improved pasture. The site drains the pasture and open spaces south of the site. The creek continues north under Mowry Road where it enters the Lake Alice wetland, terminating at Lake Alice. Lat/Lon: N29º 38’ 17.92599” W82º 21’ 14.44418”
Site 6: Medicinal Gardens upstream
Site 7: Medicinal Gardens downstream
Site 8: Baughman Center
Site 9: Pony Field

8
Site 13 Golf View Creek originates offsite, and flows through the Golf View residential community before terminating in the Golf Course Pond. The catchment for this stream flows through a residential watershed and is in direct contact with the underlying Hawthorne Formation, a geological formation consisting mostly of sandy clay with often high background concentrations of phosphorus.
Site 12 The lined Golf Course Pond primarily receives tertiary treated wastewater from the UF Water Reclamation Facility. However, contributions from Golf View Creek, precipitation and runoff from the golf course can also be significant depending on rainfall and season. Water from the pond is used for irrigation on the golf course. Storm overflow from the pond is directed off site to the low spot of Depressional Basin UF-1A just north of Elmore Hall.
Site 10 is located on the south side of Ritchey Road near the Animal Sciences facility. The watershed for Site 10 includes academic buildings, roads and animal pastures south of SW 16th Ave, west of Shealy Drive and north of Ritchey Road. Flow in this creek is not continuous and often dry or only intermittent during the dry season. This creek flows south and terminates at Bivens Arm. Lat/Lon: N29º 37’ 49.17346” W82º 21’ 11.57746”
Site 11 is located on the east side of Natural Area Drive just north of the intersection with Archer Road. The watershed for Site 11 is comprised largely of natural areas and street runoff from Archer Road and some facilities east of Natural Area Drive in the Surge Area. This creek terminates at a natural sink located on the Natural Area Teaching Laboratory. Lat/Lon: N29º 37’ 50.72151” W82º 21’ 57.95536”
Site 10: Animal Sciences
Site 11: Surge Area
Site 12: Golf Course Pond
Site 13: Golf View Creek

9
Site 14: 7th Fairway
Site 15: Shop Stormwater Pond
Site 14 The 7th Fairway site is located at the end of a stormwater drainage pipe for the southern portion of the golf course. The pipe empties into a shallow channel which exits the golf course and empties into the low spot of UF basin 1A. This site is of importance because it is a site where water exits the golf course and is a potential source of water to the aquifer via infiltration at the old collapsed sinkhole.
Site 15 The Shop Stormwater Pond site is located on the northwest corner of the golf course and is an integrated wetland pond. Sampling occurs on the creek discharge side of the weir along the southern side of the pond. Flow at the weir only occurs during or shortly after storm events. On two occasions, water was present on the wetland side, but not on the creek side. In these cases, sampling was conducted in the wetland. Water discharged from the pond to the creek eventually enters Hogtown Creek to the west of campus.
Site 17 The Weir – SEEP site is located at the northern edge of the SEEP treatment wetland. It captures 80 % of the stormwater runoff entering the wetland. Water quality is improved within the forebay through sediment removal and nutrient uptake by wetland plants.
Site 16 The Forebay – SEEP site is located in the western portion of the forebay. This area receives the greatest inflow of water from the watershed, mainly from the parking lots in front of the Harn Museum of Art, the Natural History Museum, and the Phillips Center. Water quality in this part of the SEEP is likely most similar to a traditional stormwater basin and if the collection is during or shortly after a storm event it likely resembles water quality inputs to the basin.

10
Site 20 The Discharge March – SEEP site is located on the western side of the SEEP and does not receive water until the shallow areas west of the boardwalk are approximately 18 inches deep. It is technically not a sinkhole, but a depressional area with very high infiltration rates.
Site 19 The Pond – SEEP site is located on the southern side of the SEEP and is the final destination of water from the treatment wetland. Water quality at this point represents “treated” water.
Site 18 The Shallow Marsh – SEEP site is located at the southeast side of the SEEP wetland. This collection point captures water flowing from the cypress swamp into the pond and provides and provides an idea of the quality of water flowing into the pond
11
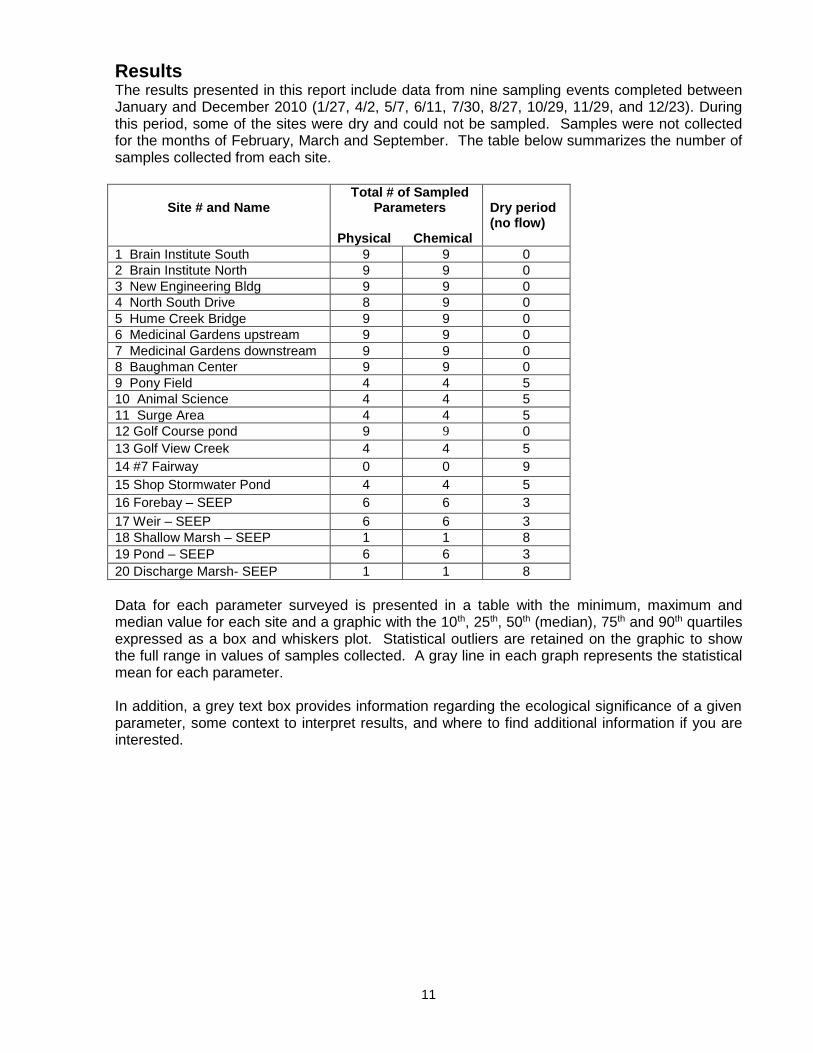
Results The results presented in this report include data from nine sampling events completed between January and December 2010 (1/27, 4/2, 5/7, 6/11, 7/30, 8/27, 10/29, 11/29, and 12/23). During this period, some of the sites were dry and could not be sampled. Samples were not collected for the months of February, March and September. The table below summarizes the number of samples collected from each site.
Site # and Name Total # of Sampled
Parameters Physical Chemical
Dry period (no flow)
1 Brain Institute South 9 9 0
2 Brain Institute North 9 9 0
3 New Engineering Bldg 9 9 0
4 North South Drive 8 9 0
5 Hume Creek Bridge 9 9 0
6 Medicinal Gardens upstream 9 9 0
7 Medicinal Gardens downstream 9 9 0
8 Baughman Center 9 9 0
9 Pony Field 4 4 5
10 Animal Science 4 4 5
11 Surge Area 4 4 5
12 Golf Course pond 9 9 0
13 Golf View Creek 4 4 5
14 #7 Fairway 0 0 9
15 Shop Stormwater Pond 4 4 5
16 Forebay – SEEP 6 6 3
17 Weir – SEEP 6 6 3
18 Shallow Marsh – SEEP 1 1 8
19 Pond – SEEP 6 6 3
20 Discharge Marsh- SEEP 1 1 8
Data for each parameter surveyed is presented in a table with the minimum, maximum and median value for each site and a graphic with the 10th, 25th, 50th (median), 75th and 90th quartiles expressed as a box and whiskers plot. Statistical outliers are retained on the graphic to show the full range in values of samples collected. A gray line in each graph represents the statistical mean for each parameter. In addition, a grey text box provides information regarding the ecological significance of a given parameter, some context to interpret results, and where to find additional information if you are interested.
12
What does the temperature mean?
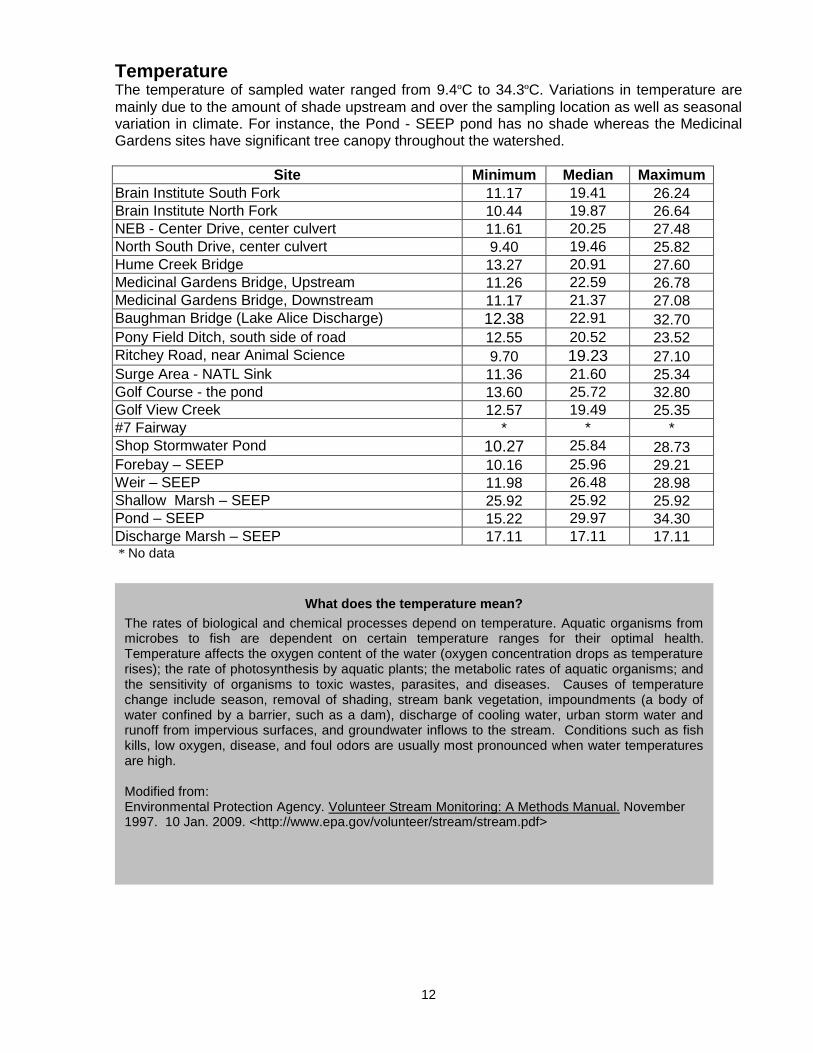
The rates of biological and chemical processes depend on temperature. Aquatic organisms from microbes to fish are dependent on certain temperature ranges for their optimal health. Temperature affects the oxygen content of the water (oxygen concentration drops as temperature rises); the rate of photosynthesis by aquatic plants; the metabolic rates of aquatic organisms; and the sensitivity of organisms to toxic wastes, parasites, and diseases. Causes of temperature change include season, removal of shading, stream bank vegetation, impoundments (a body of water confined by a barrier, such as a dam), discharge of cooling water, urban storm water and runoff from impervious surfaces, and groundwater inflows to the stream. Conditions such as fish kills, low oxygen, disease, and foul odors are usually most pronounced when water temperatures are high.
Modified from: Environmental Protection Agency. Volunteer Stream Monitoring: A Methods Manual. November 1997. 10 Jan. 2009. <http://www.epa.gov/volunteer/stream/stream.pdf>
Temperature The temperature of sampled water ranged from 9.4ºC to 34.3ºC. Variations in temperature are
mainly due to the amount of shade upstream and over the sampling location as well as seasonal variation in climate. For instance, the Pond - SEEP pond has no shade whereas the Medicinal Gardens sites have significant tree canopy throughout the watershed.
Site Minimum Median Maximum Brain Institute South Fork 11.17 19.41 26.24 Brain Institute North Fork 10.44 19.87 26.64 NEB - Center Drive, center culvert 11.61 20.25 27.48 North South Drive, center culvert 9.40 19.46 25.82 Hume Creek Bridge 13.27 20.91 27.60 Medicinal Gardens Bridge, Upstream 11.26 22.59 26.78 Medicinal Gardens Bridge, Downstream 11.17 21.37 27.08 Baughman Bridge (Lake Alice Discharge) 12.38 22.91 32.70 Pony Field Ditch, south side of road 12.55 20.52 23.52 Ritchey Road, near Animal Science 9.70 19.23 27.10 Surge Area - NATL Sink 11.36 21.60 25.34 Golf Course - the pond 13.60 25.72 32.80 Golf View Creek 12.57 19.49 25.35 #7 Fairway * * * Shop Stormwater Pond 10.27 25.84 28.73 Forebay – SEEP 10.16 25.96 29.21 Weir – SEEP 11.98 26.48 28.98 Shallow Marsh – SEEP 25.92 25.92 25.92 Pond – SEEP 15.22 29.97 34.30 Discharge Marsh – SEEP 17.11 17.11 17.11 * No data

13
Temperature by Site
14
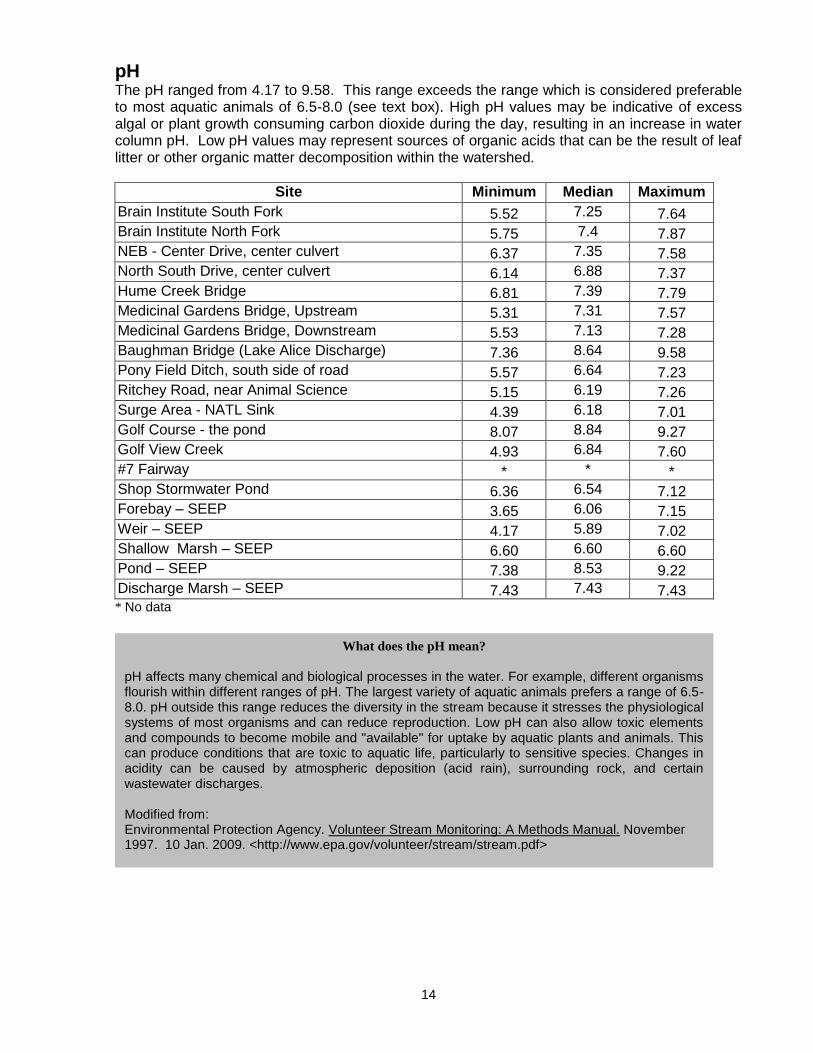
What does the pH mean? pH affects many chemical and biological processes in the water. For example, different organisms flourish within different ranges of pH. The largest variety of aquatic animals prefers a range of 6.5-8.0. pH outside this range reduces the diversity in the stream because it stresses the physiological systems of most organisms and can reduce reproduction. Low pH can also allow toxic elements and compounds to become mobile and "available" for uptake by aquatic plants and animals. This can produce conditions that are toxic to aquatic life, particularly to sensitive species. Changes in acidity can be caused by atmospheric deposition (acid rain), surrounding rock, and certain wastewater discharges. Modified from: Environmental Protection Agency. Volunteer Stream Monitoring: A Methods Manual. November 1997. 10 Jan. 2009. <http://www.epa.gov/volunteer/stream/stream.pdf>
pH The pH ranged from 4.17 to 9.58. This range exceeds the range which is considered preferable to most aquatic animals of 6.5-8.0 (see text box). High pH values may be indicative of excess algal or plant growth consuming carbon dioxide during the day, resulting in an increase in water column pH. Low pH values may represent sources of organic acids that can be the result of leaf litter or other organic matter decomposition within the watershed.
Site Minimum Median Maximum
Brain Institute South Fork 5.52 7.25 7.64 Brain Institute North Fork 5.75 7.4 7.87 NEB - Center Drive, center culvert 6.37 7.35 7.58 North South Drive, center culvert 6.14 6.88 7.37 Hume Creek Bridge 6.81 7.39 7.79 Medicinal Gardens Bridge, Upstream 5.31 7.31 7.57 Medicinal Gardens Bridge, Downstream 5.53 7.13 7.28 Baughman Bridge (Lake Alice Discharge) 7.36 8.64 9.58 Pony Field Ditch, south side of road 5.57 6.64 7.23 Ritchey Road, near Animal Science 5.15 6.19 7.26 Surge Area - NATL Sink 4.39 6.18 7.01 Golf Course - the pond 8.07 8.84 9.27 Golf View Creek 4.93 6.84 7.60 #7 Fairway * * * Shop Stormwater Pond 6.36 6.54 7.12 Forebay – SEEP 3.65 6.06 7.15 Weir – SEEP 4.17 5.89 7.02 Shallow Marsh – SEEP 6.60 6.60 6.60 Pond – SEEP 7.38 8.53 9.22 Discharge Marsh – SEEP 7.43 7.43 7.43 * No data

15
pH by Site
Optimal range for
largest variety of
aquatic animals

16
What does the conductivity mean?
Conductivity is a measure of the ability of water to pass an electrical current. Conductivity in water is affected by the presence of inorganic dissolved solids such as chloride, nitrate, sulfate, and phosphate anions (ions that carry a negative charge) or sodium, magnesium, calcium, iron, and aluminum cations (ions that carry a positive charge). Organic compounds like oil, phenol, alcohol, and sugar do not conduct electrical current very well and therefore have a low conductivity when in water. Conductivity is also affected by temperature: the warmer the water, the higher the conductivity. For this reason, conductivity is reported as conductivity at 25 degrees Celsius (25 C). Conductivity in streams and rivers is affected primarily by the geology of the area through which the water flows. Streams that run through areas with clay soils tend to have higher conductivity because of the presence of materials that ionize when washed into the water. A failing sewage system would raise the conductivity because of the presence of chloride, phosphate, and nitrate; an oil spill would lower the conductivity. Conductivity is measured in micromhos per centimeter (µmhos/cm) or microsiemens per centimeter (µs/cm). The conductivity of rivers in the United States generally ranges from 50 to 1500 µmhos/cm. Studies of inland fresh waters indicate that streams supporting good mixed fisheries have a range between 150 and 500 µhos/cm. Conductivity outside this range could indicate that the water is not suitable for certain species of fish or macroinvertebrates. Each stream tends to have a relatively constant range of conductivity that, once established, can be used as a baseline for comparison with regular conductivity measurements. Significant changes in conductivity could be an indicator that a discharge or other pollutant has entered a stream. Modified from:
Environmental Protection Agency. Volunteer Stream Monitoring: A Methods Manual. November 1997. 10 Jan. 2009. <http://www.epa.gov/volunteer/stream/stream.pdf>
Conductivity Conductivity ranged from 7 to 1590 µS. Conductivity levels at the SEEP are low for several possible reasons. Much of the water at the SEEP is from parking lot runoff. Car oil present in this runoff could lower the conductivity. Also, most the water entering the SEEP is from areas with little background nitrogen and phosphorus, which can increase conductivity. On the other hand, conductivity levels at the Course pond and Hume Creek Bridge can be attributed to elevated nitrate and phosphorus levels.
Site Minimum Median Maximum
Brain Institute South Fork 323 401 801 Brain Institute North Fork 331 387 1160 NEB - Center Drive, center culvert 35 437 1012 North South Drive, center culvert 228 277 1004 Hume Creek Bridge 495 612 1363 Medicinal Gardens Bridge, Upstream 76 357 744 Medicinal Gardens Bridge, Downstream 303 358 759 Baughman Bridge (Lake Alice Discharge) 232 279 626 Pony Field Ditch, south side of road 244 261 271 Ritchey Road, near Animal Science 243 377 482 Surge Area - NATL Sink 152 163 176 Golf Course - the pond 69 601 1590 Golf View Creek 334 362 377 #7 Fairway * * * Shop Stormwater Pond 95 129 375 Forebay – SEEP 71 115 199 Weir – SEEP 16 90 119 Shallow Marsh – SEEP 73 73 73 Pond – SEEP 7 69 382 Discharge Marsh – SEEP 63 63 63 * No data

17
Conductivity by Site
100
200
300
400
500
600
700
800
900
1000C
onduct#
(us)
Bra
in Instit
ute
South
Fork
Bra
in Instit
ute
Nort
h F
ork
NE
B -
Cente
r D
rive, cente
r culv
ert
Nort
h S
outh
Drive, cente
r culv
ert
Hum
e C
reek B
ridge
Medic
inal G
ard
ens B
ridge, U
pstr
eam
Medic
inal G
ard
ens B
ridge, D
ow
nstr
eam
Baughm
an B
ridge (
Lake A
lice D
ischarg
e)
Pony F
ield
Ditc
h, south
sid
e o
f ro
ad
Ritc
hey R
oad, near
Anim
al S
cie
nce
Surg
e A
rea -
NA
TL S
ink
Golf
Cours
e -
the p
ond
Golf
Vie
w C
reek
#7 F
airw
ay
Shop S
torm
wate
r P
ond
Fore
bay -
SE
EP
Weir -
SE
EP
Shallo
w M
ars
h -
SE
EP
Pond -
SE
EP
Dis
charg
e M
ars
h -
SE
EP
Site Name

18
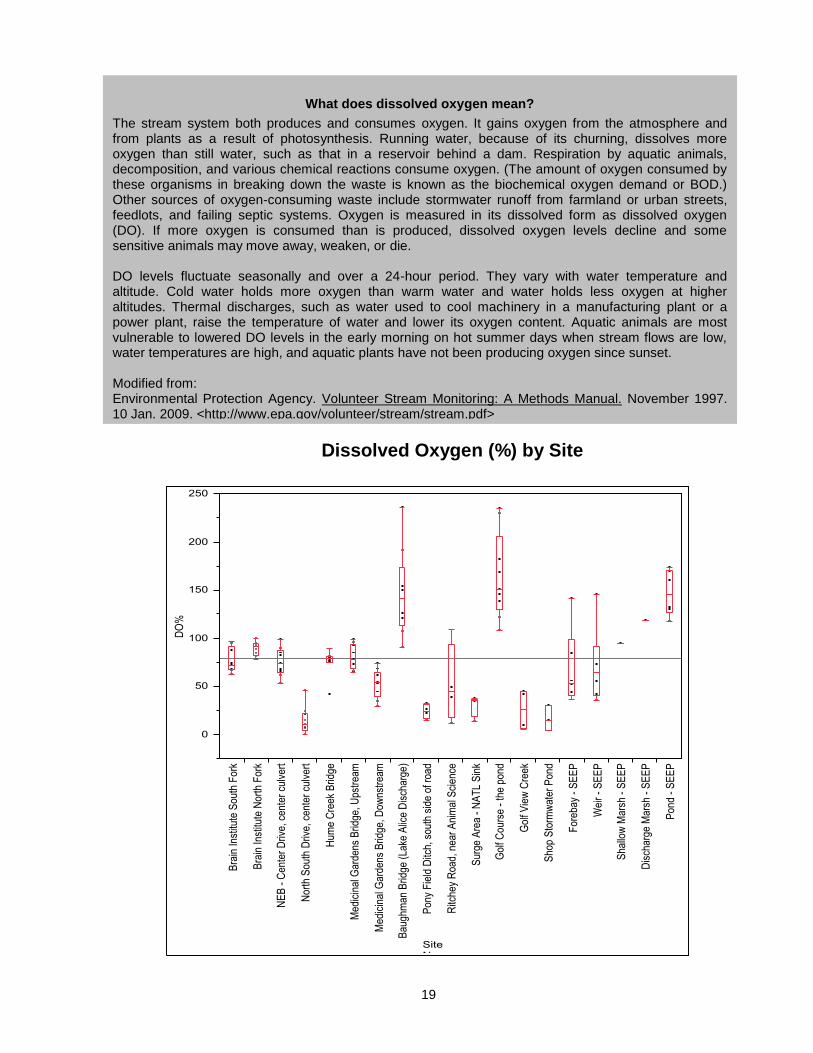
Dissolved Oxygen % Dissolved oxygen monitoring data is presented both as % of saturation at the temperature and pressure during sampling and later as a concentration in milligrams oxygen per liter of water. Percent dissolved oxygen saturation, ranged from 1.0% to 235.5%. While dissolved oxygen levels may fluctuate over a 24-hour period, most samples were collected at approximately the same time of the day between 12 and 5 pm to avoid potential wide ranges in values. Variation of dissolved oxygen levels between sites could be due to a number of different factors, but are typically driven by temperature, light, water flow rate and biological oxygen demand which are related to the amount of labile organic matter in the water column. For instance, the Pony Field site shows consistently low oxygen, possibly due to a high level of organic matter found in the water and relatively stagnant flow conditions, whereas, the Golf Course Pond has higher daytime levels of oxygen which may be due to a high algal population and photosynthetic production of oxygen.
Site Minimum Median Maximum
Brain Institute South Fork 62.5 71.9 96 Brain Institute North Fork 78.3 91.2 99.9 NEB - Center Drive, center culvert 53.7 74.0 99.2 North South Drive, center culvert 1.0 12.2 46.3 Hume Creek Bridge 41.7 79.0 89.1 Medicinal Gardens Bridge, Upstream 64.7 78.4 99.2 Medicinal Gardens Bridge, Downstream 29.1 54.0 74.4 Baughman Bridge (Lake Alice Discharge) 90.8 141 236 Pony Field Ditch, south side of road 14.9 24.3 33.2 Ritchey Road, near Animal Science 11.1 44.1 108.6 Surge Area - NATL Sink 13.5 35.1 37.4 Golf Course - the pond 108.1 150.8 235.5 Golf View Creek 5.21 25.9 45.3 #7 Fairway * * * Shop Stormwater Pond 3.97 14.3 30.2 Forebay – SEEP 36.1 53.8 141.5 Weir – SEEP 35.6 64.1 146.2 Shallow Marsh – SEEP 95 95 95 Pond – SEEP 117.5 150 160 Discharge Marsh – SEEP 118.4 118.4 118.4 * No data
19
What does dissolved oxygen mean?
The stream system both produces and consumes oxygen. It gains oxygen from the atmosphere and from plants as a result of photosynthesis. Running water, because of its churning, dissolves more oxygen than still water, such as that in a reservoir behind a dam. Respiration by aquatic animals, decomposition, and various chemical reactions consume oxygen. (The amount of oxygen consumed by these organisms in breaking down the waste is known as the biochemical oxygen demand or BOD.) Other sources of oxygen-consuming waste include stormwater runoff from farmland or urban streets, feedlots, and failing septic systems. Oxygen is measured in its dissolved form as dissolved oxygen (DO). If more oxygen is consumed than is produced, dissolved oxygen levels decline and some sensitive animals may move away, weaken, or die. DO levels fluctuate seasonally and over a 24-hour period. They vary with water temperature and altitude. Cold water holds more oxygen than warm water and water holds less oxygen at higher altitudes. Thermal discharges, such as water used to cool machinery in a manufacturing plant or a power plant, raise the temperature of water and lower its oxygen content. Aquatic animals are most vulnerable to lowered DO levels in the early morning on hot summer days when stream flows are low, water temperatures are high, and aquatic plants have not been producing oxygen since sunset. Modified from: Environmental Protection Agency. Volunteer Stream Monitoring: A Methods Manual. November 1997. 10 Jan. 2009. <http://www.epa.gov/volunteer/stream/stream.pdf>
Dissolved Oxygen (%) by Site

20
Dissolved Oxygen mg/L Dissolved oxygen, in mg/L, ranged from 0.1 to 17.41 mg/L. State water quality standards for Class III waters, which is the designated use for water bodies adopted by the Campus Master Plan, have standard criteria that are deemed protective of that designated use. In the case of dissolved oxygen concentrations, the criterion state that no average value for DO should be below 5 mg/l and no single value should be below 4 mg/l. Although part of state administrative code, these criteria are presently being reassessed by the Florida Department of Environmental Protection as some water bodies are thought to have DO concentrations below these standard limits may be due to natural and not anthropogenic processes. The use of these state standards in this report is for reference only, and may not be appropriate at some of the sites sampled such as Surge Area-NATL Sink. However, some sites, such as North South Drive, Pony Field Ditch, and the Shop Stormwater Pond, appear to have depressed DO concentrations.
Site Minimum mg/L
Median mg/L
Maximum mg/L
Brain Institute South Fork 5.71 6.44 10.44 Brain Institute North Fork 6.58 8 10.79 NEB - Center Drive, center culvert 4.46 6.13 10.47 North South Drive, center culvert 0.1 1.14 5.29 Hume Creek Bridge 4.23 6.76 8.51 Medicinal Gardens Bridge, Upstream 5.59 6.72 10.6 Medicinal Gardens Bridge, Downstream 2.48 5.03 8.16 Baughman Bridge (Lake Alice Discharge) 8.28 11.77 17.41 Pony Field Ditch, south side of road 1.26 2.19 3.51 Ritchey Road, near Animal Science 0.97 3.84 12.34 Surge Area - NATL Sink 1.11 3.18 3.88 Golf Course - the pond 10.92 13.64 17.16 Golf View Creek 0.84 3.94 5.21 #7 Fairway * * * Shop Stormwater Pond 1.16 2.33 3.97 Forebay – SEEP 3.31 4.84 10.89 Weir – SEEP 2.95 5.1 11.24 Shallow Marsh – SEEP 7.72 7.72 7.72 Pond – SEEP 9.47 11.70 12.70 Discharge Marsh – SEEP 11.44 11.44 11.44 * No data

21
Dissolved Oxygen mg/L by Site

22
Total Solids
Total solids are dissolved solids plus suspended and settleable solids in water. In stream water, dissolved solids consist of calcium, chlorides, nitrate, phosphorus, iron, sulfur, and other ions particles that will pass through a filter with pores of around 2 microns (0.002 cm) in size. Suspended solids include silt and clay particles, plankton, algae, fine organic debris, and other particulate matter. These are particles that will not pass through a 2-micron filter.
Total Dissolved Solids
The concentration of total dissolved solids affects the water balance in the cells of aquatic organisms. An organism placed in water with a very low level of solids, such as distilled water, will swell up because water will tend to move into its cells, which have a higher concentration of solids. An organism placed in water with a high concentration of solids will shrink somewhat because the water in its cells will tend to move out. This will in turn affect the organism's ability to maintain the proper cell density, making it difficult to keep its position in the water column. It might float up or sink down to a depth to which it is not adapted, and it might not survive. Modified from: Environmental Protection Agency. Volunteer Stream Monitoring: A Methods Manual. November 1997. 10 Jan. 2009. <http://www.epa.gov/volunteer/stream/stream.pdf>
Total Dissolved Solids Total Dissolved Solids (TDS) ranged from 0.034 to 1.142 mg/L and is calculated from conductivity and temperature measurements by the YSI. Two sites, Hume Creek Bridge and Ritchey Road, have reported high median TDS values in the past and in the present study. In addition, the Golf Course Pond reported high values. These values are probably a result of high nutrient concentrations from manure and/or fertilizer.
Site Minimum Median Maximum
Brain Institute South Fork 0.254 0.292 0.585 Brain Institute North Fork 0.239 0.293 0.853 NEB - Center Drive, center culvert 0.242 0.296 0.723 North South Drive, center culvert 0.146 0.266 0.700 Hume Creek Bridge 0.343 0.472 0.961 Medicinal Gardens Bridge, Upstream 0.242 0.275 0.543 Medicinal Gardens Bridge, Downstream 0.230 0.277 0.552 Baughman Bridge (Lake Alice Discharge) 0.156 0.196 0.450 Pony Field Ditch, south side of road 0.158 0.190 0.232 Ritchey Road, near Animal Science 0.199 0.262 0.381 Surge Area - NATL Sink 0.098 0.119 0.142 Golf Course - the pond 0.142 0.389 1.142 Golf View Creek 0.244 0.263 0.285 #7 Fairway * * * Shop Stormwater Pond 0.083 0.088 0.227 Forebay – SEEP 0.048 0.073 0.120 Weir – SEEP 0.046 0.071 0.096 Shallow Marsh – SEEP 0.047 0.047 0.047 Pond – SEEP 0.034 0.049 0.220 Discharge Marsh – SEEP 0.046 0.046 0.046
* No data

23
Total Dissolved Solids by Site, mg/L

24
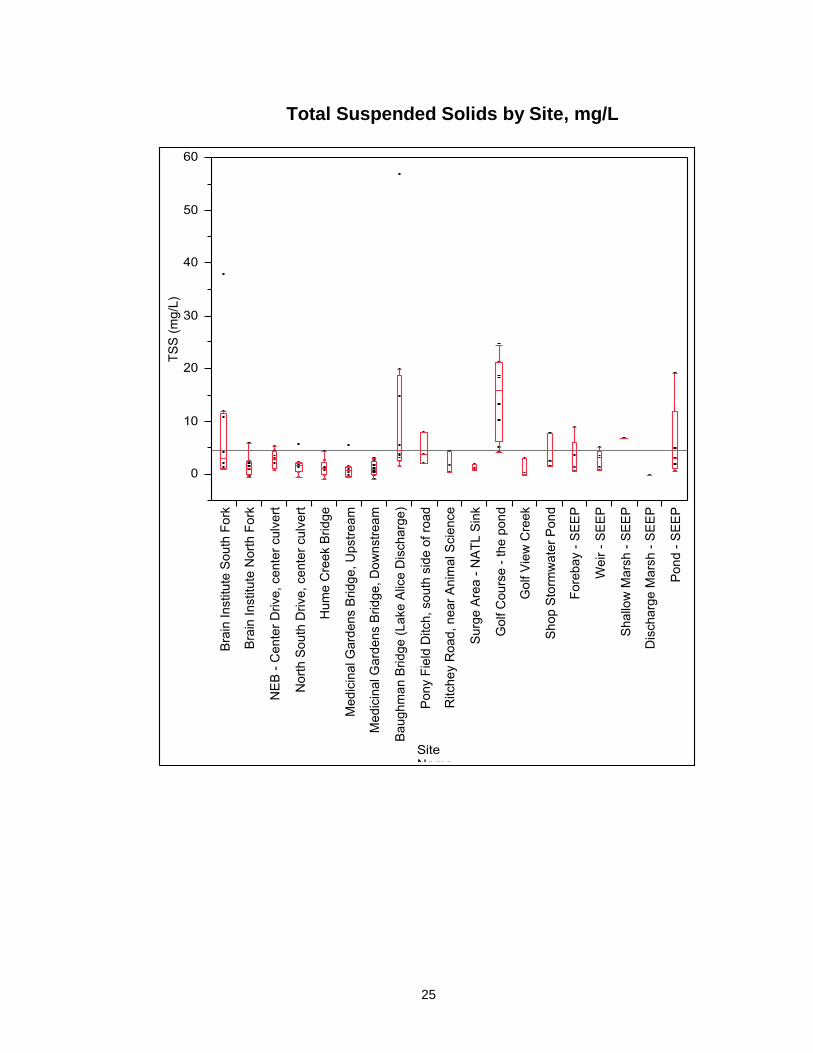
Total Suspended Solids The range for Total Suspended Solids (TSS) was from below detection to 56.82 mg/L. Fluctuations in TSS are most prominently influenced by the timing of sample collection relative to stormwater runoff events. TSS values are generally highest during or directly after storm events or during high flow conditions, when particles from runoff or streambed sediment can be picked up and remain in suspension. However, changes in watershed land use, or construction activities upstream of a sampling site can also contribute significantly to an increase in TSS. Elevated TSS levels can block sunlight from reaching submerged vegetation, reduce photosynthesis, and lower DO levels.
Site Minimum
mg/L Median mg/L
Maximum mg/L
Brain Institute South Fork 0.90 3.07 37.72 Brain Institute North Fork ^ 1.12 5.96 NEB - Center Drive, center culvert 0.59 3.10 5.26 North South Drive, center culvert ^ 1.62 5.79 Hume Creek Bridge ^ 1.08 4.30 Medicinal Gardens Bridge, Upstream ^ 0.57 5.55 Medicinal Gardens Bridge, Downstream ^ 0.76 3.08 Baughman Bridge (Lake Alice Discharge) 1.37 4.58 56.82 Pony Field Ditch, south side of road 1.98 3.69 8.00 Ritchey Road, near Animal Science 0.20 1.59 4.34 Surge Area - NATL Sink 0.70 1.09 1.90 Golf Course - the pond 4.16 15.79 24.40 Golf View Creek ^ 0.02 3.04 #7 Fairway * * * Shop Stormwater Pond 1.52 2.40 7.76 Forebay – SEEP 0.48 1.34 9.00 Weir – SEEP 0.62 1.26 5.16 Shallow Marsh – SEEP 6.74 6.74 6.74 Pond – SEEP 0.36 3.02 19.00 Discharge Marsh – SEEP ^ ^ ^ ^ Below detection * No data
25
Total Suspended Solids by Site, mg/L

26
What does nitrogen mean?
Nitrogen is found in all living things and is a basic nutrient. About 80% of the air we breathe is nitrogen gas (N2). Nitrogen in water can be inorganic (not associated with living tissues) or organic (associated with living tissues). Inorganic forms typically dissolve in water and include: ammonia (NH3), nitrate (NO3
-), and nitrite (NO2-), while organic forms may be dissolved or particulate and
include cells or pieces of cells that are or once were living. Excess nitrogen in lakes can contribute to accelerated eutrophication. (Eutrophication is the process of lake aging and can be culturally accelerated by nutrient introduction that causes excessive algae and rooted plant growth.) Nitrogen can enter the water when bacteria called blue-green algae convert or “fix” nitrogen gas into ammonia for use in their tissues. Because of this bacterial “fixing” capability, there is an unlimited supply of nitrogen to aquatic systems. Other sources of nitrogen to lakes and streams include: fertilizer runoff, decomposing organic material, and human and animal waste products. Modified from: Tippecanoe Environmental Lake & Watershed Foundation. 2004. 28 Feb. 2009. <http://www.telwf.org/watertesting/watertesting.htm>
Total Nitrogen
The range of values for Total Nitrogen (TN) was 0.135 to 10.818 mg/L. Three sampling sites consistently showed elevated TN values relative to the rest of campus. Hume Creek Bridge and both Medicinal Garden sites have consistently shown elevated TN values since the monitoring program began in 2003. These elevated nitrogen levels are coming from fertilizer that is applied to baseball and football practice fields, as well as, Ben Hill Griffin Stadium. Nearby Bivens Arm has an average total nitrogen concentration of 3.38 mg/L (LAKEWATCH data between 1992 and 2009). All campus sites have lower median values, with exception of the three elevated sites identified above.
Site Minimum mg/L
Median mg/L
Maximum mg/L
Brain Institute South Fork 0.185 0.729 1.093 Brain Institute North Fork 0.632 0.952 1.599 NEB - Center Drive, center culvert 0.398 0.816 1.267 North South Drive, center culvert 0.511 0.748 1.058 Hume Creek Bridge 3.362 4.074 4.937 Medicinal Gardens Bridge, Upstream 6.475 7.618 9.046 Medicinal Gardens Bridge, Downstream 3.606 5.488 8.162 Baughman Bridge (Lake Alice Discharge) 0.628 1.143 10.818 Pony Field Ditch, south side of road 1.222 1.347 1.593 Ritchey Road, near Animal Science 0.956 1.301 2.400 Surge Area - NATL Sink 0.214 0.739 1.203 Golf Course - the pond 0.939 1.664 3.532 Golf View Creek 0.571 1.139 1.850 #7 Fairway * * * Shop Stormwater Pond 2.663 3.322 8.674 Forebay – SEEP 0.267 0.754 0.915 Weir – SEEP 0.181 0.953 1.710 Shallow Marsh – SEEP 0.963 0.963 0.963 Pond – SEEP 0.135 1.008 1.201 Discharge Marsh – SEEP 0.568 0.568 0.568 * No data

27
Total Nitrogen Concentration by Site
3.38 mg/L Average Total
Nitrogen concentration in
Bivans Arm 1992-2009
(LAKEWATCH)

28
What does nitrate mean?
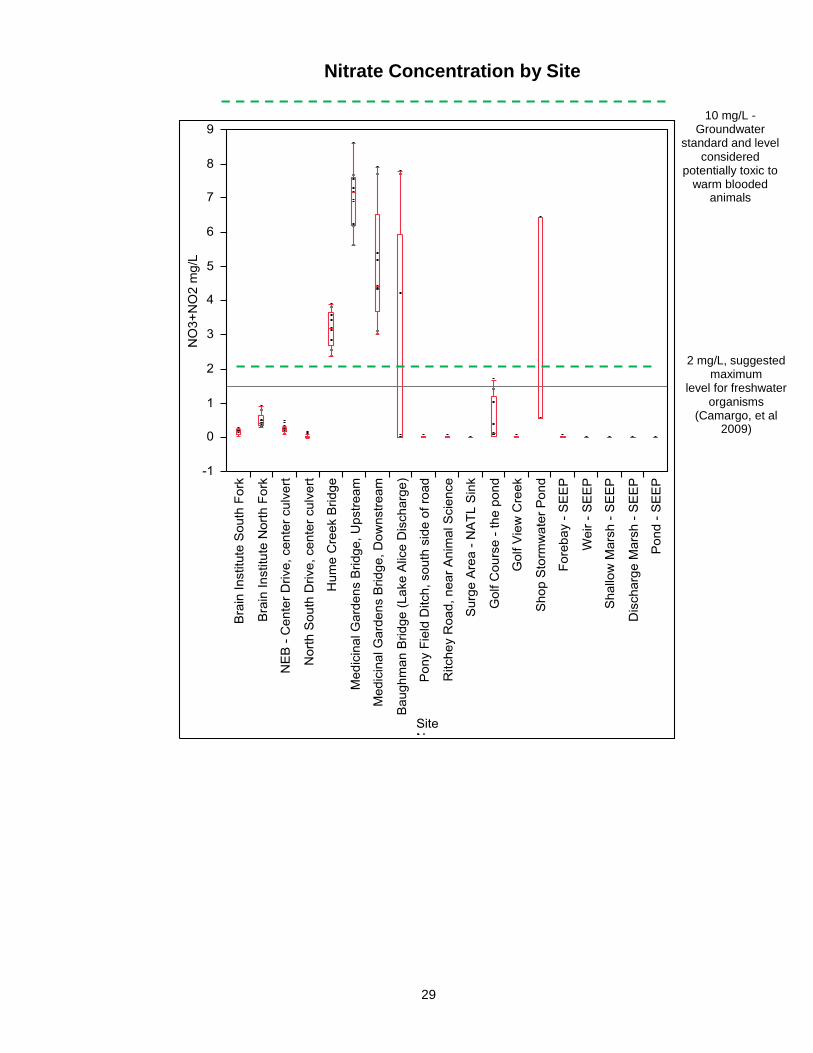
Nitrates are a form of nitrogen, which is found in several different forms in terrestrial and aquatic ecosystems. These forms of nitrogen include ammonia (NH3), nitrates (NO3), and nitrites (NO2). Nitrates are essential plant nutrients, but in excess amounts they can cause significant water quality problems. Together with phosphorus, nitrates in excess amounts can accelerate eutrophication, causing dramatic increases in aquatic plant growth and changes in the types of plants and animals that live in the stream. This, in turn, affects dissolved oxygen, temperature, and other indicators. Excess nitrates can cause hypoxia (low levels of dissolved oxygen) and can become toxic to warm-blooded animals at higher concentrations (10 mg/L) or higher) under certain conditions. However, one paper which reviewed published scientific literature on the impacts of nitrates to freshwater and marine animals concluded that nitrate levels in freshwater should not exceed 2 mg/L. [Camargo, Julio A., Alvaro Alonso, Annabella Salamanca. Nitrate toxicity to aquatic animals: a review with new data for freshwater invertebrates. Chemosphere 58 (2009) 1255-1267)] The natural level of ammonia or nitrate in surface water is typically low (less than 1 mg/L). Sources of nitrates include wastewater treatment plants, runoff from fertilized lawns and cropland, failing on-site septic systems, runoff from animal manure storage areas, and industrial discharges that contain corrosion inhibitors. Modified from: Environmental Protection Agency. Volunteer Stream Monitoring: A Methods Manual. November 1997. 10 Jan. 2009. <http://www.epa.gov/volunteer/stream/stream.pdf>
Nitrate The range for nitrate-N is 0.005 mg/L to 7.910 mg/L. Nitrate-N comprised the majority of total nitrogen identified on campus. Several sites (Hume Creek and both Medicinal Garden sites) have consistently elevated nitrate values. Although nitrate levels were high at some sites, none exceeded 10 mg/L which is an EPA threshold for human toxicity in groundwater (not surface water). Nitrate levels on campus have been steadily decreasing since 2003, which is probably a result of reduced fertilizer application to the landscape, as well as better removal of nitrates by the wastewater treatment facility.
Site Minimum mg/L
Median mg/L
Maximum mg/L
Brain Institute South Fork 0.030 0.179 0.274 Brain Institute North Fork 0.290 0.425 0.880 NEB - Center Drive, center culvert 0.060 0.233 0.460 North South Drive, center culvert ^ 0.015 0.130
Hume Creek Bridge 2.390 3.201 3.890
Medicinal Gardens Bridge, Upstream 5.640 7.180 8.60
Medicinal Gardens Bridge, Downstream 3.020 4.430 7.910 Baughman Bridge (Lake Alice Discharge) 0.006 0.019 7.770 Pony Field Ditch, south side of road 0.010 0.018 0.031 Ritchey Road, near Animal Science 0.009 0.016 0.045 Surge Area - NATL Sink 0.006 0.010 0.016 Golf Course - the pond 0.028 0.105 1.670 Golf View Creek 0.008 0.020 0.056 #7 Fairway * * * Shop Stormwater Pond 0.541 0.551 6.450 Forebay – SEEP 0.005 0.016 0.033 Weir – SEEP 0.006 0.013 0.017 Shallow Marsh – SEEP 0.007 0.007 0.007 Pond – SEEP 0.005 0.011 0.015 Discharge Marsh – SEEP 0.014 0.014 0.014 ^ Below detection limit (0.010 mg/L) * No data
29
Nitrate Concentration by Site
2 mg/L, suggested maximum
level for freshwater organisms
(Camargo, et al 2009)
10 mg/L - Groundwater
standard and level considered
potentially toxic to warm blooded
animals

30
What does ammonium mean?
The ammonium ion, NH4+, is an important member of the group of nitrogen-containing compounds that act
as nutrients for aquatic plants and algae. In surface water, most of the ammonia, NH3, is found in the form of ammonium ion, NH4
+. This fact allows us to approximate the concentration of all of the nitrogen in the form of ammonia and ammonium combined, commonly called ammonia nitrogen.
Factors that influence the amount of ammonium nitrogen include decaying plants and animals; animal waste; industrial waste effluent; agricultural runoff; and atmospheric nitrogen.
What is the optimal amount of ammonium nitrogen concentration in a watershed? 1. Levels of ammonium nitrogen should not exceed 0.5 mg/L. 2. Streams or ponds near heavily fertilized fields may have ammonium nitrogen levels that exceed 0.5 mg/L.
What factors are affected by the amount of ammonium nitrogen in a watershed? 1. Ammonium nitrogen is a compound that acts as nutrients for aquatic plants and algae. If enough nutrients are available, eutrophication and increased algal blooms may occur. 2. If ammonium nitrogen levels are too high in surface waters, they can be toxic to some aquatic organisms. 3. When ammonium nitrogen levels are high, it can increase nitrification. Consequently, dissolved oxygen concentration is lowered. 4. Low levels of Ammonium nitrogen may limit plant and algal growth.
Excerpt from: LEO and the SERVIT Group. LEO EnviroSci Inquiry. 2000-2002. Lehigh University. 28 Feb. 2009. <http://www.leo.lehigh.edu/envirosci/watershed/wq/wqbackground/nh4nitrogenbg.html>
Ammonium Ammonium concentrations ranged from 0.005 to 0.493 mg/L. Ammonium concentrations made up only a small fraction of the total nitrogen measured in sites sampled. None of the data points in this year’s sampling exceeded the threshold of concern for aquatic organisms of 0.5 mg/L (see dashed line). The two highest levels of ammonium were found at the Shop Stormwater Pond and the Golf Course Pond, which could be a result of high organic nitrogen entering both sites.
Site Minimum
mg/L Median mg/L
Maximum mg/L
Brain Institute South Fork 0.016 0.042 0.080
Brain Institute North Fork 0.006 0.032 0.070
NEB - Center Drive, center culvert 0.034 0.063 0.188
North South Drive, center culvert 0.073 0.127 0.330
Hume Creek Bridge 0.004 0.067 0.110 Medicinal Gardens Bridge, Upstream 0.023 0.050 0.080 Medicinal Gardens Bridge, Downstream 0.031 0.060 0.103 Baughman Bridge (Lake Alice Discharge) 0.008 0.027 0.070 Pony Field Ditch, south side of road 0.046 0.088 0.116 Ritchey Road, near Animal Science 0.027 0.058 0.137 Surge Area - NATL Sink 0.016 0.035 0.101 Golf Course - the pond 0.017 0.040 0.220 Golf View Creek 0.027 0.056 0.157 #7 Fairway * * * Shop Stormwater Pond 0.228 0.248 0.493 Forebay – SEEP 0.012 0.042 0.059 Weir – SEEP 0.021 0.042 0.093 Shallow Marsh – SEEP 0.011 0.011 0.011 Pond – SEEP 0.006 0.022 0.086 Discharge Marsh – SEEP 0.005 0.005 0.005 * No data

31
Ammonium Concentration by Site
Threshold of concern
32
What does total Kjeldahl nitrogen (TKN) mean?
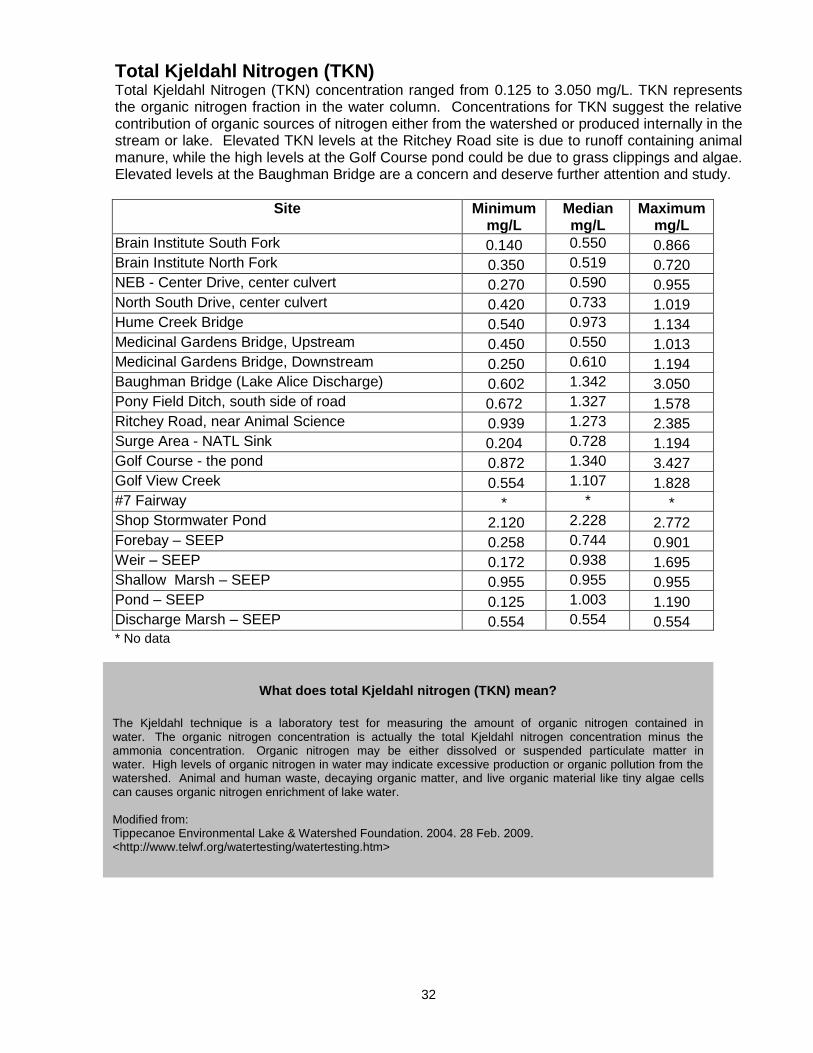
The Kjeldahl technique is a laboratory test for measuring the amount of organic nitrogen contained in water. The organic nitrogen concentration is actually the total Kjeldahl nitrogen concentration minus the ammonia concentration. Organic nitrogen may be either dissolved or suspended particulate matter in water. High levels of organic nitrogen in water may indicate excessive production or organic pollution from the watershed. Animal and human waste, decaying organic matter, and live organic material like tiny algae cells can causes organic nitrogen enrichment of lake water. Modified from: Tippecanoe Environmental Lake & Watershed Foundation. 2004. 28 Feb. 2009. <http://www.telwf.org/watertesting/watertesting.htm>
Total Kjeldahl Nitrogen (TKN) Total Kjeldahl Nitrogen (TKN) concentration ranged from 0.125 to 3.050 mg/L. TKN represents the organic nitrogen fraction in the water column. Concentrations for TKN suggest the relative contribution of organic sources of nitrogen either from the watershed or produced internally in the stream or lake. Elevated TKN levels at the Ritchey Road site is due to runoff containing animal manure, while the high levels at the Golf Course pond could be due to grass clippings and algae. Elevated levels at the Baughman Bridge are a concern and deserve further attention and study.
Site Minimum mg/L
Median mg/L
Maximum mg/L
Brain Institute South Fork 0.140 0.550 0.866 Brain Institute North Fork 0.350 0.519 0.720 NEB - Center Drive, center culvert 0.270 0.590 0.955 North South Drive, center culvert 0.420 0.733 1.019 Hume Creek Bridge 0.540 0.973 1.134 Medicinal Gardens Bridge, Upstream 0.450 0.550 1.013 Medicinal Gardens Bridge, Downstream 0.250 0.610 1.194 Baughman Bridge (Lake Alice Discharge) 0.602 1.342 3.050 Pony Field Ditch, south side of road 0.672 1.327 1.578 Ritchey Road, near Animal Science 0.939 1.273 2.385 Surge Area - NATL Sink 0.204 0.728 1.194 Golf Course - the pond 0.872 1.340 3.427 Golf View Creek 0.554 1.107 1.828 #7 Fairway * * * Shop Stormwater Pond 2.120 2.228 2.772 Forebay – SEEP 0.258 0.744 0.901 Weir – SEEP 0.172 0.938 1.695 Shallow Marsh – SEEP 0.955 0.955 0.955 Pond – SEEP 0.125 1.003 1.190 Discharge Marsh – SEEP 0.554 0.554 0.554 * No data

33
TKN Concentration by Site, mg/L

34
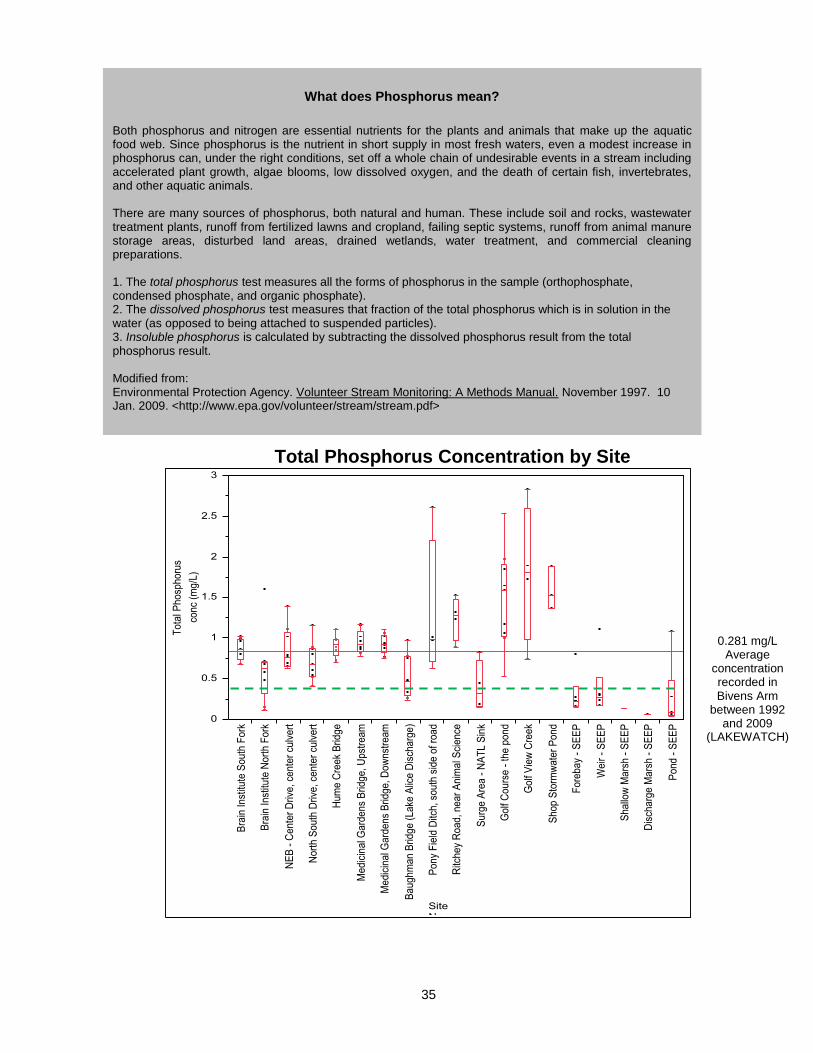
Phosphorus The range in concentration for Total Phosphorus (TP) was 0.033 to 2.830 mg/L. Nearby Bivens Arm has an average total phosphorus concentration of 0.281 mg/L (LAKEWATCH data between 1992 and 2009). All sites have average values that exceed Bivens Arm with the exception of the sites in the SEEP. This may be explained by the fact that much of campus is situated on the Hawthorne Layer, and many tributary streams are actively eroding the stream bed and likely mobilizing high concentration phosphorus sediments. Total Phosphorous concentration is not as indicative of the short-term biological response potential as Soluble Reactive Phosphorus (see page 36). However, TP values provide a better representation of the amount of phosphorus that may at some point become available for uptake. The majority of higher values appear to be associated with the golf course which may be due to the maintenance regime of the site.
Site Minimum mg/L
Median mg/L
Maximum mg/L
Brain Institute South Fork 0.677 0.853 1.023 Brain Institute North Fork 0.105 0.622 1.600 NEB - Center Drive, center culvert 0.619 0.756 1.384 North South Drive, center culvert 0.408 0.682 1.163 Hume Creek Bridge 0.701 0.916 1.116 Medicinal Gardens Bridge, Upstream 0.765 0.916 1.170 Medicinal Gardens Bridge, Downstream 0.751 0.924 1.102 Baughman Bridge (Lake Alice Discharge) 0.228 0.465 0.969 Pony Field Ditch, south side of road 0.621 0.984 2.605 Ritchey Road, near Animal Science 0.890 1.274 1.521 Surge Area - NATL Sink 0.184 0.311 0.823 Golf Course - the pond 0.518 1.583 2.526 Golf View Creek 0.736 1.806 2.830 #7 Fairway * * * Shop Stormwater Pond 1.364 1.525 1.878 Forebay – SEEP 0.152 0.221 0.794 Weir – SEEP 0.164 0.262 1.115 Shallow Marsh – SEEP 0.130 0.130 0.130 Pond – SEEP 0.033 0.082 1.086 Discharge Marsh – SEEP 0.063 0.063 0.063 * No data
35
What does Phosphorus mean?
Both phosphorus and nitrogen are essential nutrients for the plants and animals that make up the aquatic food web. Since phosphorus is the nutrient in short supply in most fresh waters, even a modest increase in phosphorus can, under the right conditions, set off a whole chain of undesirable events in a stream including accelerated plant growth, algae blooms, low dissolved oxygen, and the death of certain fish, invertebrates, and other aquatic animals. There are many sources of phosphorus, both natural and human. These include soil and rocks, wastewater treatment plants, runoff from fertilized lawns and cropland, failing septic systems, runoff from animal manure storage areas, disturbed land areas, drained wetlands, water treatment, and commercial cleaning preparations. 1. The total phosphorus test measures all the forms of phosphorus in the sample (orthophosphate, condensed phosphate, and organic phosphate). 2. The dissolved phosphorus test measures that fraction of the total phosphorus which is in solution in the water (as opposed to being attached to suspended particles). 3. Insoluble phosphorus is calculated by subtracting the dissolved phosphorus result from the total phosphorus result. Modified from: Environmental Protection Agency. Volunteer Stream Monitoring: A Methods Manual. November 1997. 10 Jan. 2009. <http://www.epa.gov/volunteer/stream/stream.pdf>
Total Phosphorus Concentration by Site
0.281 mg/L Average
concentration recorded in Bivens Arm
between 1992 and 2009
(LAKEWATCH)

36
What does soluble reactive phosphorus (SRP) mean?
Soluble reactive phosphorus also known as SRP is a dissolved form of phosphorus. Because dissolved phosphorus is readily available for uptake by plants, the amount of SRP found in a lake provides a good estimation of how much phosphorus is available for algae and plant growth. Because aquatic plant growth is typically limited by phosphorus, added phosphorus especially in the dissolved, bioavailable form can fuel plant growth and cause algae blooms. Sources of SRP can include: failing septic systems, animal waste, fertilizers, decaying plants and animals, and resuspension from the lake bottom. Modified from: Tippecanoe Environmental Lake & Watershed Foundation. 2004. 28 Feb. 2009. <http://www.telwf.org/watertesting/watertesting.htm>
Soluble Reactive Phosphorus (SRP) Distribution of SRP concentrations ranged from 0.006 to 2.810 mg/L. SRP is the most bioavailable form of phosphorus and therefore the most likely to cause a rapid biological response if phosphate is limiting. The golf course sites generally tended to show concentrations greater than that of main campus. Because SRP concentrations are so high in tributaries, this data suggest that Nitrogen and not Phosphorus may be the limiting nutrient controlling algal and plant productivity at most areas of campus.
Site Minimum mg/L
Median mg/L
Maximum mg/L
Brain Institute South Fork 0.665 0.834 0.969 Brain Institute North Fork 0.456 0.625 1.575 NEB - Center Drive, center culvert 0.516 0.707 1.355 North South Drive, center culvert 0.347 0.530 1.135 Hume Creek Bridge 0.535 0.684 0.941 Medicinal Gardens Bridge, Upstream 0.750 0.928 1.074 Medicinal Gardens Bridge, Downstream 0.688 0.949 1.022 Baughman Bridge (Lake Alice Discharge) 0.056 0.370 0.429 Pony Field Ditch, south side of road 0.480 0.940 2.360 Ritchey Road, near Animal Science 0.817 0.977 1.420 Surge Area - NATL Sink 0.109 0.158 0.396 Golf Course - the pond 0.437 0.909 2.215 Golf View Creek 1.628 1.766 2.810 #7 Fairway * * * Shop Stormwater Pond 1.292 1.295 1.750 Forebay – SEEP 0.117 0.177 0.203 Weir – SEEP 0.118 0.142 0.253 Shallow Marsh – SEEP 0.084 0.084 0.084 Pond – SEEP 0.006 0.045 0.220 Discharge Marsh – SEEP 0.052 0.052 0.052 * No data

37
Soluble Reactive Phosphorus Concentrations by Site

38
Appendix A Methods and Quality Assurance and Quality Control
Volunteers Training and Participation
The Campus Water Quality Monitoring (CWQM) program is managed by the Soil and Water Sciences Department. Part of a student Research Assistantship is allocated to oversight of the CWQM and this student is responsible for monitoring all sampling, data collection and analysis, preparation of samples for analysis, and volunteer recruitment and training.
During the course of the year, the student manager trains student volunteers to assist with the collection and processing of samples. Volunteers are provided with a one hour training including information on the program and proper sampling techniques. A Volunteer Handbook provides step-by-step instructions as a reference for all volunteers. During 2004, eleven student volunteers assisted with the CWQM program, providing more than 50 volunteer hours. Field and Laboratory Procedures
Pre and post testing of the YSI 556 Multi-Probe on the day of sampling were conducted to assure all field data (temperature, conductivity, pH, DO, and redox) were within calibration targets. If test values were outside of the predetermined variance, the instrument was recalibrated and retested.
All water samples were collected in acid-cleaned and triple-rinsed 500 mL Nalgene bottles. Once collected, samples were stored in a cooler during transportation to the lab. At the laboratory, a 20mL sample was filtered using a 0.45µm membrane filter, preserved with one drop of concentrated H2SO4 and stored in a 20mL scintillation vial in a refrigerator at 4 degrees Celsius. Additionally, two 20mL scintillation vials were filled with unfiltered samples, preserved with one drop of concentrated H2SO4 and stored at 4 degrees Celsius. The 500mL samples were shaken to re-suspend any particulates prior to pouring into 20mL scintillation vials. All sample preparation and analysis was conducted at the Wetland Biogeochemistry Laboratory (WBL) within the Soil and Water Science Department. The WBL is certified under the National Environmental Laboratory Accreditation Conference and all methods and techniques adhere to standard operating procedures as outlined in this certification program. Quality Control (QA/QC)
Each month, a field and equipment blank were run along with a duplicate sampling at one of the stations and processed along with the samples. Additional laboratory blanks, duplicates, QC’s and spikes were used for each lab analysis. Samples were processed within proper holding times as necessary for each laboratory analysis unless otherwise noted. Chain of custody forms were completed to log every sample that enters the lab.
Reliability of Data
In many volunteer programs, emphasis is place on developing standardized methods and QA/QC procedures to ensure the accuracy of the data and lessen the potential for human error as much as possible. The UF Clean Water Campaign’s Water Quality Monitoring program is managed to ensure that all processes are conducted in the same manner month to month. Additionally, the use of instrumentation such as the YSI yields consistent, reliable data with little room for human error as long as the equipment is properly calibrated each time.
When volunteer efforts follow a standard set of procedures, the resulting data can be just as valid as that collected by professional scientists. For instance, LAKEWATCH, a volunteer citizen lake monitoring program, has been sampling lakes throughout Florida since 1986. A study to test the reliability of volunteer collected samples in the LAKEWATCH program found that data collected by volunteers was comparable to that collected by professionals. (Canfield, et al, 2002).

39
References
Camargo, Julio A., Alvaro Alonso, and Annabella Salamanca. Nitrate toxicity to aquatic animals: a review with new data for freshwater invertebrates. Chemosphere, 58, 1255-1267, 2009.
Canfield, Daniel E., Jr., Claude D. Brown, Roger W. Bachmann, and Mark V. Hoyer. Volunteer Lake Monitoring: Testing the Reliability of Data Collected by the Florida LAKEWATCH Program. Lake and Reservoir Management 18(1): 1-9, 2002. Environmental Protection Agency. Volunteer Stream Monitoring: A Methods Manual. November 1997. 10 Jan. 2009. http://www.epa.gov/volunteer/stream/stream.pdf Florida LAKEWATCH 2009 Report. October 6, 2009. <http://lakewatch.ifas.ufl.edu/data2009.htm>
LEO and the SERVIT Group. LEO EnviroSci Inquiry. 2000-2002. Lehigh University. 28 Feb. 2009. <http://www.leo.lehigh.edu/envirosci/watershed/wq/wqbackground/nh4nitrogenbg.html>
Tippecanoe Environmental Lake & Watershed Foundation. 2004. 28 Feb. 2009. <http://www.telwf.org/watertesting/watertesting.htm>

40