2010 using band microelectrode arrays to investigate the
TRANSCRIPT
University of WollongongResearch Online
University of Wollongong Thesis Collection University of Wollongong Thesis Collections
2010
Using band microelectrode arrays to investigate thecut edge and bare corrosion behaviour of 55% AL-ZN coated steelTroy LoweUniversity of Wollongong
Research Online is the open access institutional repository for theUniversity of Wollongong. For further information contact ManagerRepository Services: [email protected].
Recommended CitationLowe, Troy, Using band microelectrode arrays to investigate the cut edge and bare corrosion behaviour of 55% AL-ZN coated steel,Doctor of Philosophy thesis, School of Chemistry, University of Wollongong, 2010. http://ro.uow.edu.au/theses/3393
NOTE
This online version of the thesis may have different page formatting and pagination from the paper copy held in the University of Wollongong Library.
UNIVERSITY OF WOLLONGONG
COPYRIGHT WARNING
You may print or download ONE copy of this document for the purpose of your own research or study. The University does not authorise you to copy, communicate or otherwise make available electronically to any other person any copyright material contained on this site. You are reminded of the following: Copyright owners are entitled to take legal action against persons who infringe their copyright. A reproduction of material that is protected by copyright may be a copyright infringement. A court may impose penalties and award damages in relation to offences and infringements relating to copyright material. Higher penalties may apply, and higher damages may be awarded, for offences and infringements involving the conversion of material into digital or electronic form.
USING BAND MICROELECTRODE ARRAYS TO INVESTIGATE THE CUT EDGE AND BARE CORROSION BEHAVIOUR OF 55% AL-ZN COATED
STEEL
A thesis submitted in fulfilment of the
requirements for the award of the degree
DOCTOR OF PHILOSOPHY
from
UNIVERSITY OF WOLLONGONG
by
Troy Lowe, BSc (Hons)
School of Chemistry
April 2007 - October 2010
Supervisors:
Prof Gordon G Wallace (IPRI)
Dr Aaron K Neufeld (BlueScope Steel)

i
DECLARATION
This is to certify that the work described in this thesis is my own unless
otherwise indicated and has not been submitted for qualifications at any other
academic institution
Troy Lowe
ii
TABLE OF CONTENTS
Declaration.............................................................................................................i
Table of contents .................................................................................................. ii
Abstract................................................................................................................ vi
Acknowledgements............................................................................................ viii
Abbreviations and non SI units .............................................................................x
Chapter 1 | Introduction
1.1 Introduction .....................................................................................................1 1.1.1 Formation and microstructure of 55% Al-Zn metal coating ............................... 1
1.1.2 Electrochemical polarisation theory of corrosion ............................................... 3
1.1.3 Electrochemical polarisation theory applied to an experimental corrosion
system ........................................................................................................................ 8
1.1.4 Microelectrodes and their relevance to corrosion.............................................. 9
1.1.5 Localised micro-pH sensing ............................................................................ 14
1.1.6 Literature review of the bare corrosion of 55% Al-Zn coated steel and corrosion
of Al-Zn alloys........................................................................................................... 17
1.1.7 Literature review of the cut-edge corrosion of 55% Al-Zn metal coated steel . 20
1.1.8 Electrochemical impedance spectroscopy of anodic Al-Zn electrodes............ 23
1.1.9 Thesis objectives and research outline ........................................................... 26
Chapter 2 | Experimental 2.1 Introduction ...................................................................................................29
2.2 Experimental .................................................................................................29 2.2.1 All Chapters: Materials and synthesis of model Al-Zn alloys........................... 29
2.2.2 Chapter 3: Fabrication of band microelectrode and surface preparation ........ 30
2.2.3 Chapter 3: Electrochemical polarisation experiments ..................................... 31
2.2.4 Chapters 4 & 5: Preparation of band microelectrode arrays ........................... 32
2.2.5 Chapter 4: Galvanic coupling and diffusion field overlap experiments on bare
type band microelectrode arrays .............................................................................. 33
2.2.6 Chapter 4: pH sensitive iridium microelectrode preparation and calibration ... 34
2.2.7 Chapter 4: Near surface pH sensing ............................................................... 39
2.2.8 Chapter 5: Galvanic coupling and simultaneous polarisation experiment of cut-
edge type band microelectrode arrays ..................................................................... 40
2.2.9 Chapter 5: pH mapping and vertical pH profiles over steel ............................. 41
iii
2.2.10 Chapter 6: Open circuit transients and electrochemical polarisation of variable
composition Al-Zn alloys........................................................................................... 42
2.2.11 Chapter 6: Electrochemical impedance spectroscopy of variable composition
Al-Zn alloys............................................................................................................... 42
2.2.12 Chapter 6: X-ray photoelectron spectroscopy of variable composition Al-Zn
alloys ........................................................................................................................ 43
Chapter 3 | Electrochemical polarisation behaviour of Al, Zn and Al-40% Zn alloys
3.1 Introduction ...................................................................................................45
3.2 Results ..........................................................................................................46 3.2.1 Microstructure of binary Al-40% Zn alloys ....................................................... 46
3.2.2 Electrochemical polarisation on BMEs versus macrodisc electrodes.............. 49
3.2.3 Electrochemical polarisation of Al-40% Zn alloys............................................ 50
3.2.4 Electrochemical polarisation of high purity Al and Zn...................................... 60
3.3 Discussion ....................................................................................................61 3.3.1 Band microelectrodes compared to traditional macro-sized electrodes .......... 61
3.3.2 The electrochemical polarisation behaviour of high purity Al and Zn .............. 62
3.3.3 Microstructure of rolled and heat treated Al-40% Zn alloy............................... 66
3.3.4 The effect of SO42- and Cl- on the polarisation behaviour of Al-40% Zn alloys.66
3.3.5 The effect of pH on the polarisation behaviour of Al-40% Zn alloys................ 68
3.3.6 The effect of microstructure on the polarisation behaviour of Al-40% Zn alloy 69
3.4 Conclusions ..................................................................................................71
Chapter 4 | Emulating the bare corrosion of 55% Al-Zn metal coating using band microelectrode arrays 4.1 Introduction ...................................................................................................72
4.2 Results ..........................................................................................................76 4.2.1 Galvanic coupling of Al-40% Zn alloy and high purity zinc .............................. 76
4.2.2 Diffusion field overlap of triband arrays ........................................................... 80
4.2.3 Near surface pH of Al-40% Zn alloy during galvanic coupling and during
polarisation ............................................................................................................... 83
4.3 Discussion ....................................................................................................85 4.3.1 Generation and transport of OH- during zinc polarisation................................ 85
4.3.2 Galvanic coupling of variably spaced BME arrays .......................................... 87
4.3.3 Near surface pH over Al-40 % Zn alloy ........................................................... 89
iv
4.3.4 Implications for the bare corrosion behaviour of 55% Al-Zn coating ............... 90
4.4 Conclusion ....................................................................................................91
Chapter 5 | Emulating the galvanic corrosion of 55% Al-Zn metal coating with steel using band microelectrode arrays 5.1 Introduction ...................................................................................................92
5.2 Results ..........................................................................................................94 5.2.1 Galvanic coupling of Zn, 55% Al-Zn coating and Al-40% Zn alloy with steel .. 94
5.2.2 Near surface pH sensing over galvanically coupled BME arrays .................... 98
5.2.3 Vertical pH profiles over cathodically polarised steel .................................... 103
5.2.4 Electrochemical polarisation experiments ..................................................... 106
5.3 Discussion ................................................................................................. 112 5.3.1 Galvanic coupling of 55% Al-Zn coating, Zn and Al-40% Zn alloy with steel 112
5.3.2 Near surface pH values during galvanic coupling of cut-edge BME arrays... 113
5.3.3 Effect of Al3+ and Zn2+ on the cathodic polarisation behaviour of steel.......... 118
5.3.4 Comparison of BME arrays to commercial cut edge samples....................... 121
5.4 Conclusions ............................................................................................... 122
Chapter 6 | Characterisation of the properties and influence of the passive oxide on electrochemical corrosion behaviour of Al-Zn alloys 6.1 Introduction ................................................................................................ 123
6.2 Results ....................................................................................................... 124 6.2.1 Electrochemical polarisation of solid solution Al-x% Zn binary alloys ........... 124
6.2.2 Galvanic coupling of solid solution Al-x% Zn binary alloys with steel............ 128
6.2.3 SEM of Al-x% Zn binary alloys ...................................................................... 130
6.2.4 Chemical composition of the oxide film on Al-40% Zn alloy by XPS ............. 134
6.2.5 EIS of Al-x% Zn binary alloys ........................................................................ 138
6.2.6 Fitting of an equivalent circuit to the EIS data ............................................... 142
6.3 Discussion ................................................................................................. 147 6.3.1 Effect of composition of solid solution Al-Zn binary alloys on the
electrochemical behaviour...................................................................................... 147
6.3.2 EIS of anodic dissolution of Al-Zn alloys ....................................................... 149
6.3.3 Validation of the experimental impedance data............................................. 150
6.3.4 Selection of an equivalent circuit to interpret EIS data on Al-x% Zn alloys ... 153
v
6.3.5 Equivalent circuit (R1+Q1)/(R2+Q2)/(R3+L4/R4) used to model the EIS
behaviour of anodically polarised Al-x% Zn alloys ................................................. 158
6.3.6 Limitations of the (R1+Q1)/(R2+Q2)/(R3+L4/R4) equivalent circuit fit .......... 159
6.3.7 Cl- and SO42- to affect the anodic behaviour of Al-x% Zn alloys .................... 160
6.3.8 A model for the electrochemical behaviour of the passive film on Al-x% Zn
binary alloys............................................................................................................ 162
6.4 Conclusions ............................................................................................... 165
Chapter 7 | Conclusions 7.1 Overview of conclusions............................................................................ 168
7.1.1 Electrochemical polarisation behaviour of Al-40% Zn alloys ......................... 168
7.1.2 Bare corrosion behaviour of 55% Al-Zn metal coating .................................. 168
7.1.3 Cut-edge corrosion behaviour of 55% Al-Zn metal coating ........................... 169
7.1.4 Composition and behaviour of the passive film on Al-Zn alloys .................... 170
Chapter 8 | References.................................................................................. 171
vi
ABSTRACT
This thesis describes investigations into the initiation and short term
atmospheric corrosion behaviour of 55% Al-Zn metal coating. It explores the
influence of ions produced by localised oxidation and reduction reactions to
affect nearby sites during bare and cut edge corrosion. Band microelectrode
(BME) arrays were used to achieve this aim.
Al-40% Zn alloy exhibiting solid solution precipitate microstructures were
prepared as model alloys for the α-phase of a 55% Al-Zn metal coating on steel.
The effect of electrolyte composition and pH on the polarisation
electrochemistry was investigated. Enhanced anodic processes were observed
in Cl- compared to SO42- electrolytes. The electrolyte pH influenced both anodic
and cathodic processes by affecting the solubility of the native oxide film. The
presence of zinc rich islands influenced the electrochemical polarisation
behaviour by enhancing zinc dissolution.
The interaction between the α- and β-phases of 55% Al-Zn metal coating was
quantified by arranging model alloys into BME arrays. Only a small galvanic
driving force was observed between the phases. During coupling, OH- and
metal ions from cathodic and anodic sites respectively were transported tens to
hundreds of microns. Micro-pH sensing near the surface of the alloys allowed
the pH at anodic and cathodic sites to be recorded and the transport of OH- ions
to be visualised. When the elements of BME arrays were closely spaced, the
changes in the near surface electrolyte volume had the effect of reversing the
polarity of the galvanic current. Mechanisms for the polarity reversal are
discussed as well as the implications for the surface corrosion of unpainted 55%
Al-Zn alloy.
The galvanic interaction of 55% Al-Zn and its constituent phases with steel was
also quantified using BME arrays. Near surface pH mapping revealed
ubiquitous distribution of OH- from the cathodic processes and localised acidic
sites from the anodic processes. Simultaneous polarisation experiments on
BME arrays enabled the influence of ion transport during polarisation to be
vii
measured. Al3+ and Zn2+ ions were found to have a strong pH buffering effect,
which accelerated the cathodic hydrogen evolution reaction on steel. The steel
generated an alkaline environment that solubilised the native oxide film on the
sacrificial metal coatings. This shifted their corrosion potentials more negative.
The relevance of these observations to the cut edge corrosion behaviour of
55% Al-Zn alloy is explored.
Interfacial composition and impedance properties of Al-Zn alloys exposed to
sulfate and chloride bearing electrolytes was investigated using X-ray
photoelectron spectroscopy, scanning electron microscopy and electrochemical
impedance spectroscopy. Results show that the surface of the native oxide on a
series of Al-Zn alloys (2 – 40 wt% zinc) was composed predominantly of
aluminium oxides. Zinc and aluminium metal content increased with depth
through the oxide, however results show negligible zinc oxide was present in
the oxide film, regardless of composition. Impedance results provide information
regarding the effect of Cl- and SO42- on the dissolution mechanism of the alloys.
It was concluded that the electrochemical behaviour of the Al-Zn alloys was
affected by Cl- and SO42- anions by changing ion transport mechanisms through
the passive film, whereas electrolyte pH affected the electrochemical behaviour
via solubility of the native oxides. A model of the Al-Zn oxide – electrolyte
interface is presented which accounts for the data in this thesis.

viii
ACKNOWLEDGEMENTS
I would like to express my sincere gratitude to Aaron, my mentor and friend, for
outstanding supervision. There are too many things to write here, so some
specific examples such as the hours of your time you spent on my technical
growth at the start; being open to communication at any time; always being
supportive, especially those times it took months to get good results; helping me
obtain a good position after graduation; talking science with me; giving me
constructive criticism; making time to meet with me around your hectic
workload; treating me as a colleague; and the selfless value you placed on my
professional development all reflect the quality of your leadership. Your passion
for science, your honesty, personal integrity and humour have made it an
honour to know you and to work with you. You’re a legend mate. Thanks and
cheers!
I would like to gratefully thank my supervisor Gordon for the opportunity to work
with the wonderful people at IPRI, your insight, suggestions, humour and ideas.
I really appreciate your solid support of me studying corrosion electrochemistry
in a non-corrosion group and illuminating me of the fact that corrosion is “a
waste of electrons.”
I gratefully acknowledge the financial support of: the Australian Research
Council for my APA; BlueScope Steel for my job, helping with my overseas trip
and providing facilities and people; and Gordon Wallace / IPRI for covering
instrument costs, providing world-class facilities and encouraging a passion for
science.
There are a number of people who, without their guidance, I would not be doing
research today. Firstly I would like to express my sincere appreciation to Dr
Steve Blanksby, Dr Phil Barker and Mr Mal Graham. You three have played a
very big part in my career and life choices and I want to thank you for being
great role models and friends to me for many years. I would like to express my
thanks to Dr. Ken Jessop, Dr. Peter Riley and Mr David Varcoe for encouraging,
supporting and enabling my decision to undertake a PhD. I also thank Dr Evan

ix
Evans and Dr David Buxton for the unending support shown by you both on
behalf of BlueScope Steel in the latter half of my project. I would like to express
my sincere thanks to Dr David Nolan. Your knowledge and input regarding heat
treatments, quenching and all matters involving the black art of metallurgy have
touched all parts of this work. A number of other people have been helped me
in my work over the past 3 years and I thank you: Mark Thompson and Zoran
MItic for rolling the Al-Zn alloys; Scotty Griffiths for teaching me metallography;
Doug Andrews for machining electrodes and making Faraday cages; Andonia
McCulloch for assisting with SEM operation and Dr Stewart Ford for your work
with low Zn alloys.
I would like to gratefully thank Dr. Nick Birbilis for hosting my visit to Monash in
November 2009 and teaching me some new tricks. I would like to gratefully
acknowledge Dr. Glenn Bryant from the Uni of Newcastle and Dr Bill Gong from
UNSW, who collected the XPS data presented in Chapter 6. I appreciate the
help a lot. I sincerely thank Steve Cooper, Michael Weir and Geoff Hurt in the
UoW science faculty workshop for their presence and patience with my cell
making requirements.
I would especially like to thank my many friends and colleagues at IPRI for the
fun times, support and making IPRI a great workplace. Tom Tom, Oxide, Willo,
Eimear, Barnsey, Shannon, Bin Bin, Jules, Crouchy, Scotty, Attila, Matty G,
Timmy Coinhorn, Bob, Adrian, Wid, Becs, Nick P, Gina & Phil, Ben M,
Uuuchalee, Marky Mark, Fluffer, George, Cathal and Lucy – you guys are
legends, I hope our friendships last a lifetime. And a big thankyou to Elise
Stewart for reminding me regularly to ________.
I would like to thank the love and support of those close to me. Mum, Ronnie
and Dad I really appreciate your love, your encouragement and the knowledge
that you guys are always there for me. Ad and Court, thanks for the love, the
laughs and especially for your understanding during my write up. Nath, Muff &
Racka, thanks be being absolute top blokes and awesome mates. Finally, thank
you so much to Chantelle for your support, especially during my writeup. Your
love, courage and unshakable belief inspires me always. I love you dearly.

x
ABBREVIATIONS AND NON SI UNITS
a constant term in the Tafel equation
A electrode surface area (cm2)
Å ångstrom (10-10 m)
AC alternating current
b pre-exponential constant in the Tafel equation (Tafel slope)
ba anodic Tafel slope, note ba = 2.303 βa
bc cathodic Tafel slope, note bc = 2.303 βc
BME band microelectrode
C* concentration in bulk (M)
Ca concentration anodic species at electrode surface (M)
Cbsat concentration of product at interfacial saturation (M)
Cc concentration cathodic species at electrode surface (M)
CE counter electrode
Cn capacitor in electrical circuit (where n=1,2,3…)
CPE constant phase element CPE α1
1Z =Q (jω)
D diffusion coefficient (cm2 s-1)
DC direct current
DHS dilute Harrison’s solution
E electrode potential (V vs Ag|AgCl - 3.5 M)
Ecorr corrosion potential
EIS electrochemical impedance spectroscopy
F Faradays constant (96485.34 C mol-1)
i current (A)
i0 exchange current density (A cm-2)
ia current due to anodic process (A)
ic current due to cathodic process (A)
Icorr corrosion current
Im(Z) the imaginary component of the impedance (Ω cm2)
J electrode current density (A cm-2)
KK Kramers-Kronig transform
LEIS localised electrochemical impedance spectroscopy

xi
Ln inductor in electrical circuit (where n=1,2,3…)
mV milli-Volts
n number of electrons transferred per reaction
OCP open circuit potential
Qn constant phase element in electrical circuit (where n=1,2,3…)
r radius of circle/sphere (m)
R ideal gas constant (8.314472 J K-1 mol-1)
Re(Z) the real component of the impedance (Ω cm2)
Ref reference electrode (Ag|AgCl, 3.5 M)
Rn resistor in electrical circuit (where n=1,2,3…)
SECM scanning electrochemical microscope technique
SEM scanning electron microscope
SRET scanning reference electrode technique
SVET scanning vibrating electrode technique
t time (s)
T temperature (298 K)
UME ultramicroelectrode
WE working electrode
XPS X-ray photoelectron spectroscopy
Z impedance (Ω cm2)
α transfer coefficient
α-phase aluminium rich phase of the 55% Al-Zn coating
βa anodic Tafel coeffient, note Fn
T R βa α=
βc cathodic Tafel coefficient, note Fn )1(
T R βc α−=
β-phase zinc rich phase of the 55% Al-Zn coating
δ Nernstian diffusion layer thickness (cm)
ζ corrosion overpotential (ζ = Eapplied - Ecorr)
η overpotential, E - Eequilibrium (V or mV)
Φ phase (degrees)
ω frequency (rad s-1)

Chapter 1 | Introduction
1
1.1 INTRODUCTION
Metallic surface coatings are commonly used to inhibit the corrosion rate of
steel. 55% Al–Zn coated steel (known as Galvalume in the US, Zincalume®
steel in Australasia and AluZinc in Europe) is a corrosion resistant surface
coating, designed as an alternative to galvanised products, affording superior
corrosion performance in some environments.2 Sacrificial metal coatings for
steel must exhibit two main characteristics; firstly, a slow self-corrosion rate to
enable acceptable surface quality over a long period, and secondly the ability to
protect the steel at cut edges and at sites of coating damage.
The bulk of this thesis describes electrochemical investigations into Al-Zn alloys
with the goal of improving the fundamental understanding of the bare and
galvanic corrosion behaviour of the 55% Al-Zn metal coating. In this chapter, a
review of the literature regarding the corrosion behaviour of 55% Al-Zn coated
steel is presented and the experimental strategy and materials are introduced.
1.1.1 Formation and microstructure of 55% Al-Zn metal coating
55% Al-Zn coating is a protective metal coating that is applied to steel strip in a
continuous process via dipping in a molten bath. The microstructure of 55% Al-
Zn metal coating has been well characterised.3-6 and optical images of the
surface and cross section are shown in Figure 1.1.
2
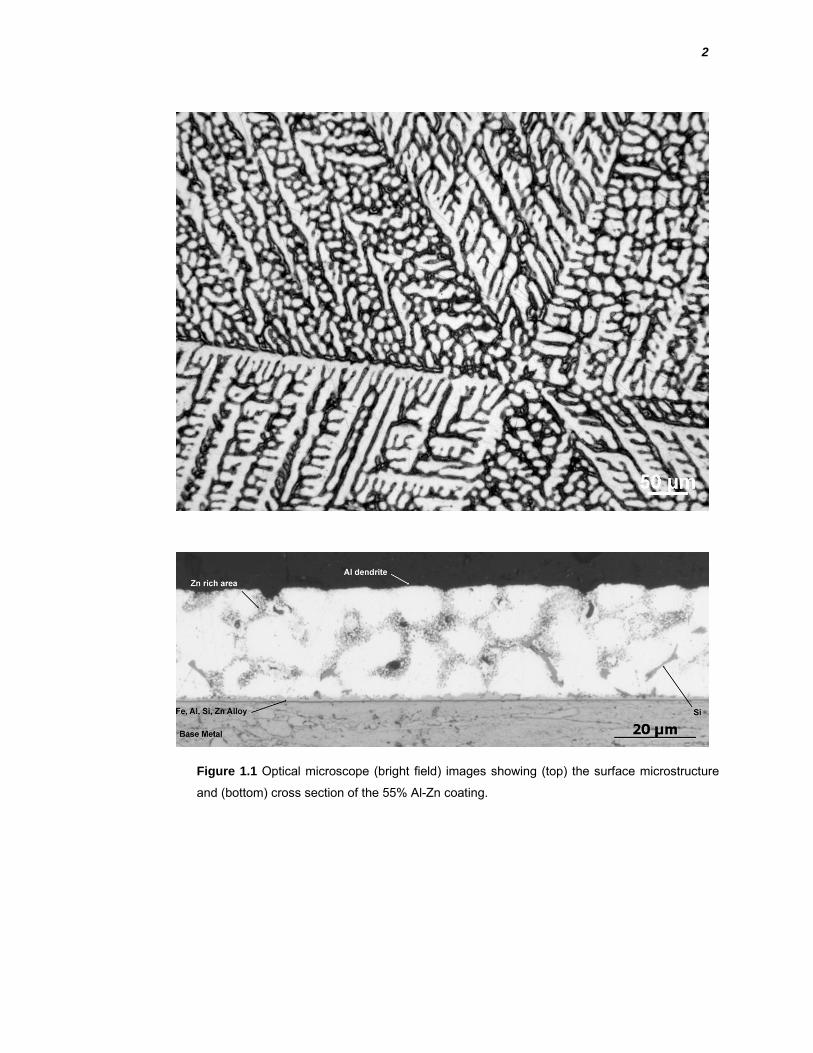
Figure 1.1 Optical microscope (bright field) images showing (top) the surface microstructure
and (bottom) cross section of the 55% Al-Zn coating.
3
The metallic coating consists of two components, the coating overlay and the
alloy layer. The coating overlay may be described simply as being composed of
two phases: the primary aluminium-rich, dendritic phase (α-phase) containing
approximately 65 wt.% Al, 35 wt.% Zn. and 0.2 wt.% Si and occupying about
80% of the overlay; and the secondary interdendritic phase (β-phase)
containing approximately 95% zinc, about 4 wt.% aluminium and less than 1
wt.% silicon. The alloy layer is a quaternary Al-Fe-Si-Zn metal that exists
between the steel and the overlay. The microstructure of the metallic coating is
a consequence of a complex solidification sequence; however, it can be
simplified somewhat as follows. The interfacial Al–Fe–Si–Zn quaternary alloy
layer forms at the steel-overlay interface, followed by solidification of the α-
phase in the overlay, producing dendrites supersaturated with zinc and
containing fine zinc precipitates. Solidification of β-phase proceeds as a 5% Al–
Zn eutectic within the interdendritic regions interspersed with α-phase, iron
intermetallics, and larger silicon particles, the latter residing near the quaternary
alloy layer.
The dendritic structure of the α-phase is present as arms that are spaced
approximately 10 µm apart and exhibiting high lateral regularity (Figure 1.1,
top). This dendrite arm spacing (DAS) is highly influenced by cooling rate. The
β-phase fills the interdendritic volume as an interconnected network of channels
from the surface of the coating to the quaternary alloy layer. Figure 1.1 (bottom)
shows the vertical distribution of the phases.
1.1.2 Electrochemical polarisation theory of corrosion
Electrochemical polarisation data, or Tafel plots, have been used extensively in
the experimental results in this thesis. The underlying theory and interpretation
of this data is well established and the relevant parts are summarised briefly
here.
4
Early studies into the relationship between potential and current showed that, in
the absence mass transport limitations, current relates exponentially to the
overpotential. This resulted in the well known Tafel equation (Equation 1.1).
It was found that this relationship could be explained using a physical model,
and a unified theory of electrode kinetics was presented in work by Butler in
1924 and Volmer in 1930 (Equation 1.2). This model is known as the Butler-
Volmer model of electrode kinetics and it, or a variation derived from it, is used
in almost every problem dealing with heterogeneous electron transfer kinetics.
An important parameter in electrochemical kinetics is the exchange current
density, i0. This is measure of the rate of the forward and reverse partial
reactions when there is zero net current flow (ie. η = 0). This is a convenient
representation of the inherent speed of an electrochemical reaction.
The Butler-Volmer relation applies to a single redox couple at an
electrode/electrolyte interface and has been adapted to the problem of
corrosion kinetics. The result was mixed potential theory. Mixed potential theory
states that the electrode potential arises from the balancing of spatially
separated anodic and cathodic reactions. With no externally applied potential
difference, the anodic and cathodic reactions have equal rates of electron
transfer across the metal/electrolyte interface, thus, the potential of the
electrode arises from the superposition of the anodic and cathodic kinetics of
two half-reactions.
i log b a η +=
Equation 1.1. The Tafel equation relating overpotential to current, where a and b are
constants. b is commonly known at the Tafel slope
⎟⎠⎞
⎜⎝⎛
⎟⎠⎞
⎜⎝⎛= ηαηα
T RFn )-(1exp
CC
i - T RFn exp
CC
i i *c
c0*
a
a0
Equation 1.2. The Butler-Volmer relation for electrode kinetics for a one step, heterogeneous
electron transfer
5
An outcome of this theory is that the measured corrosion potential of an
electrode will fall between the equilibrium potentials of the separate anodic and
cathodic reactions and, in the absence of mass transport limitations and
complicated reaction mechanisms, is closer to the one whose reaction has
faster kinetics. There are some assumptions made in derivation of the theory
and these are experimentally important. Firstly, it is assumed that the reverse
reactions of the anodic and cathodic partial reactions are negligible. This is a
reasonable approximation in corrosion systems as the mixed potential is often
not near the equilibrium potential of either anodic or cathodic reactions.
Secondly, it is assumed that the kinetics of the two partial reactions are
independent of each other. Finally, the overpotential, which is the difference
between the electrode potential and the equilibrium potential, is now described
as the corrosion overpotential, the difference between the electrode potential
and the corrosion potential (ζ = E – Ecorr). The combined expression is given in
Equation 1.4.
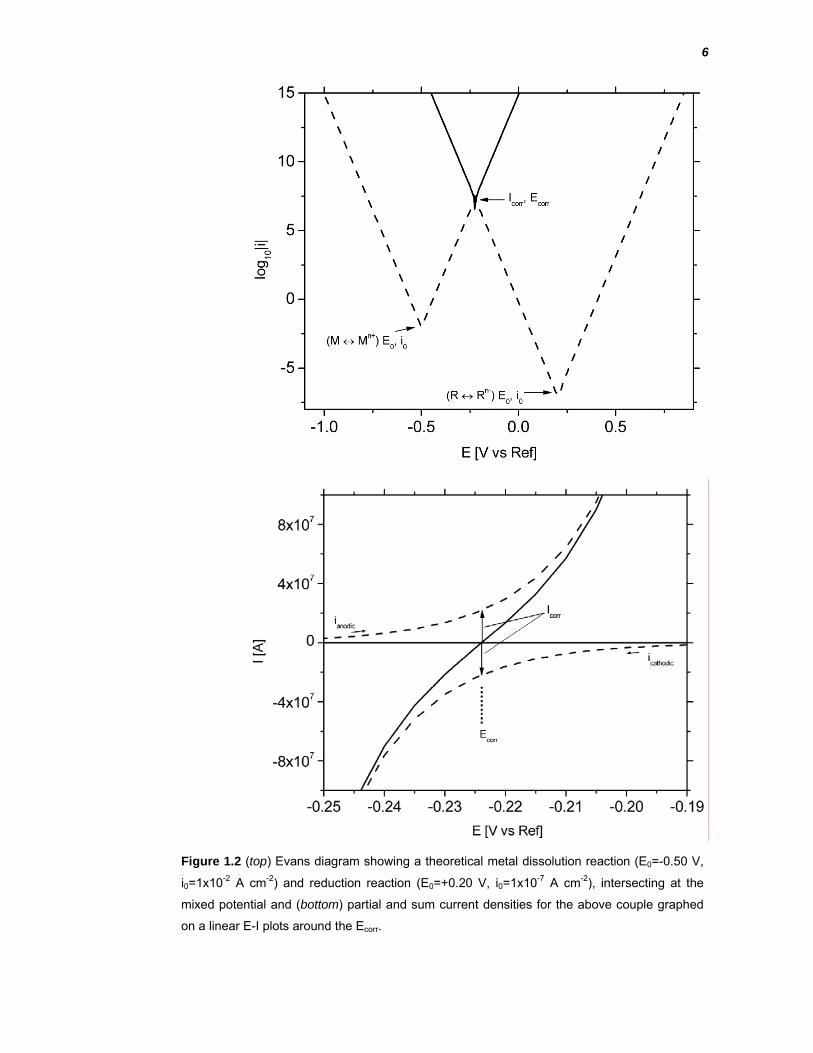
Graphical representation of the mixed potential theory of corrosion is often done
using Evans diagrams, which are E vs log|i| plots of the partial reactions Figure
1.2 provides a theoretical example for illustration. The intersection of their
potential-current lines defines the mixed potential behaviour. The resulting
current that is observed around this potential is measured experimentally during
electrochemical polarisation of a real system. In Figure 1.2 (top), the solid line is
the sum of the two partial reactions and is observed experimentally, while the
dashed lines represent the partial reactions, drawn from their equilibrium
potential and i0. In practise it is often impossible to measure the partial couples
due to the active nature of the electrode. The intersection of these partial
reactions is graphed on a linear scale in Figure 1.2 (bottom). In this figure, the
Ecorr is clearly defined as the intersection of the current axis and the Icorr is equal
to the magnitude of the partial currents at the Ecorr.
⎟⎟⎠
⎞⎜⎜⎝
⎛−⎟⎟
⎠
⎞⎜⎜⎝
⎛=
ccorr
acorr β
ζexp iβζexp i i
Equation 1.4. The Butler-Volmer equivalent for a mixed potential system containing different
anodic and cathodic partial reactions
6
Figure 1.2 (top) Evans diagram showing a theoretical metal dissolution reaction (E0=-0.50 V,
i0=1x10⁻² A cm-2) and reduction reaction (E0=+0.20 V, i0=1x10⁻⁷ A cm-2), intersecting at the
mixed potential and (bottom) partial and sum current densities for the above couple graphed
on a linear E-I plots around the Ecorr.
7
In deriving Equation 1.3 and Equation 1.4, the assumption is made that the
concentration of the reactants at the electrode surface is the same as in the
bulk (Ca = Ca*). Stated in another way, there is negligible depletion of reactants
from the electrolyte as mass transport occurs faster than the electrode kinetics.
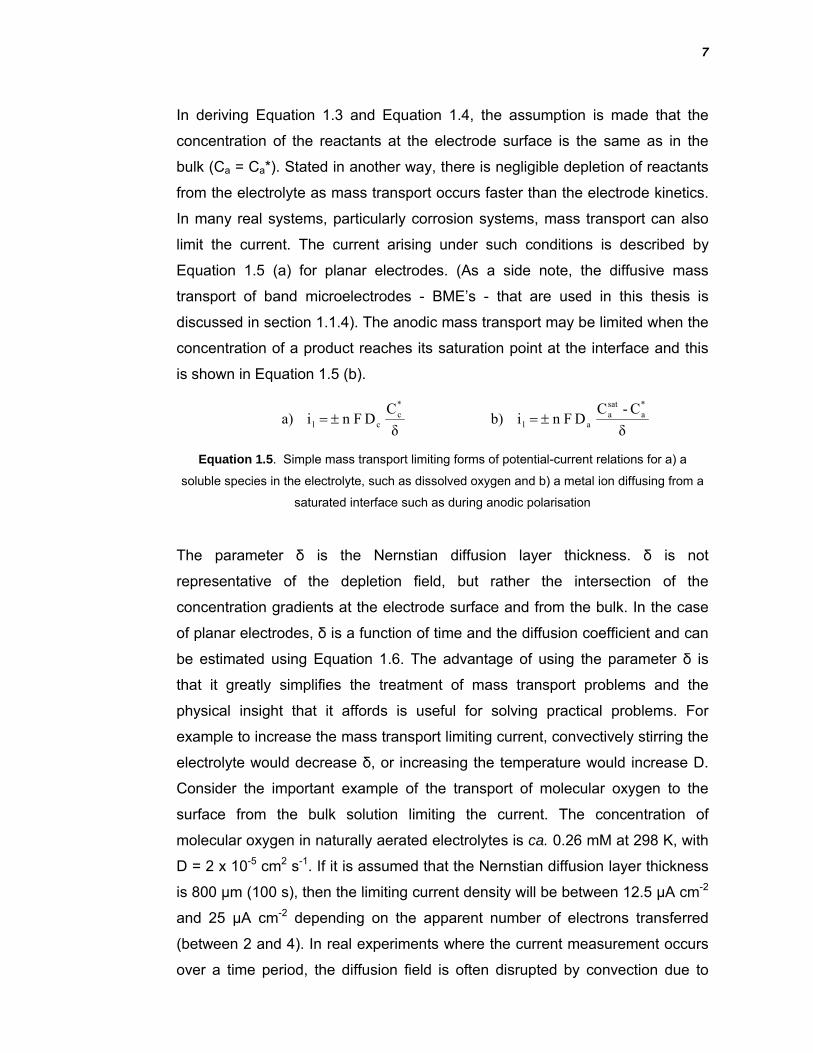
In many real systems, particularly corrosion systems, mass transport can also
limit the current. The current arising under such conditions is described by
Equation 1.5 (a) for planar electrodes. (As a side note, the diffusive mass
transport of band microelectrodes - BME’s - that are used in this thesis is
discussed in section 1.1.4). The anodic mass transport may be limited when the
concentration of a product reaches its saturation point at the interface and this
is shown in Equation 1.5 (b).
The parameter δ is the Nernstian diffusion layer thickness. δ is not
representative of the depletion field, but rather the intersection of the
concentration gradients at the electrode surface and from the bulk. In the case
of planar electrodes, δ is a function of time and the diffusion coefficient and can
be estimated using Equation 1.6. The advantage of using the parameter δ is
that it greatly simplifies the treatment of mass transport problems and the
physical insight that it affords is useful for solving practical problems. For
example to increase the mass transport limiting current, convectively stirring the
electrolyte would decrease δ, or increasing the temperature would increase D.
Consider the important example of the transport of molecular oxygen to the
surface from the bulk solution limiting the current. The concentration of
molecular oxygen in naturally aerated electrolytes is ca. 0.26 mM at 298 K, with
D = 2 x 10⁻⁵ cm2 s-1. If it is assumed that the Nernstian diffusion layer thickness
is 800 µm (100 s), then the limiting current density will be between 12.5 µA cm-2
and 25 µA cm-2 depending on the apparent number of electrons transferred
(between 2 and 4). In real experiments where the current measurement occurs
over a time period, the diffusion field is often disrupted by convection due to
δC
D Fn i a)*c
cl ±=δ
C-C D Fn i b)
*a
sata
al ±=
Equation 1.5. Simple mass transport limiting forms of potential-current relations for a) a
soluble species in the electrolyte, such as dissolved oxygen and b) a metal ion diffusing from a
saturated interface such as during anodic polarisation
8
density gradients and mechanical vibration, resulting in slightly higher current
densities.
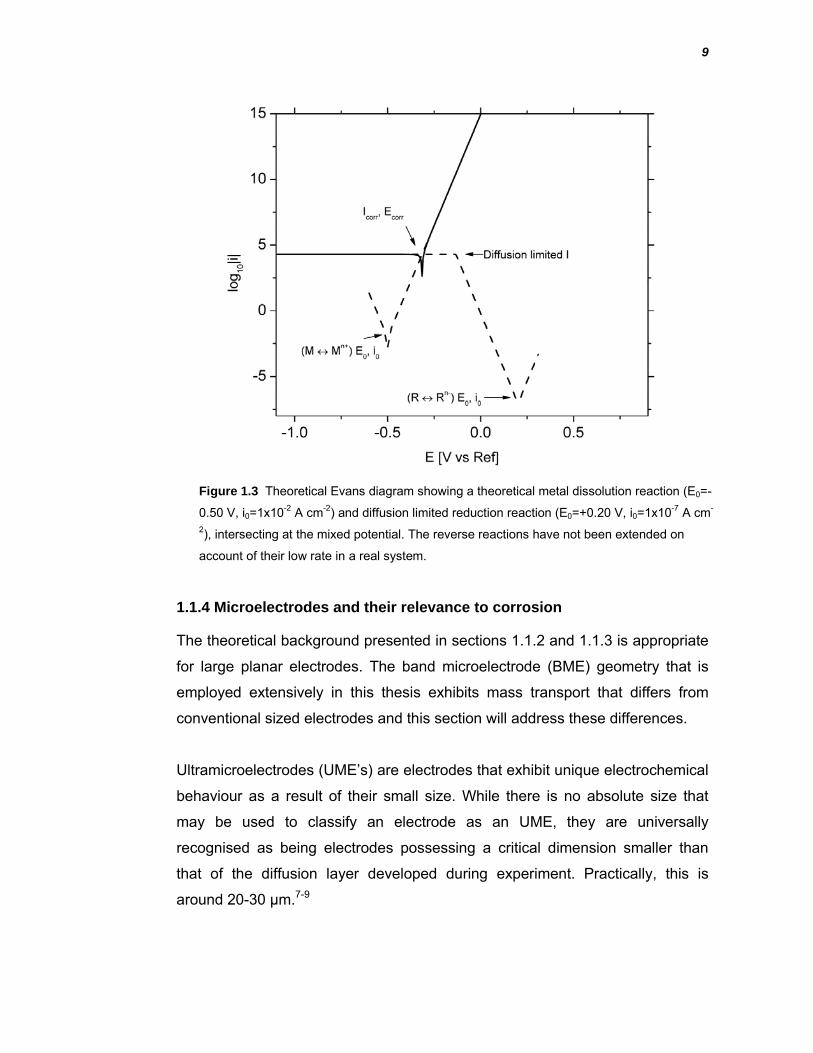
1.1.3 Electrochemical polarisation theory applied to an experimental corrosion system
To provide a framework for interpretation of the electrochemical polarisation
data presented in this thesis, mixed potential theory and diffusion limited
cathodic behaviour are both applied. These theories have been combined and
presented as a modified Evans diagram in Figure 1.3. The data presented in
this figure uses the same parameters that were used to construct Figure 1.2,
with some modifications. Firstly, the cathodic partial reaction reaches the point
at which diffusion limits the current. This current is independent of electrode
potential and is shown as a flat line in Figure 1.3. This diffusion limited process
intersects the anodic polarisation curve and thus defines the Ecorr and Icorr. The
other modification is limitation of the two reverse reactions, labelled as Mn+ → M
and Rn- → R as in Figure 1.3. These have not been extended like they were in
Figure 2 Figure 2 to more accurately reflect a real corrosion cell where a low
concentration of Mn+ and Rn- is usually present.
tD π δ =
Equation 1.6. Estimation of the Nernstian diffusion layer thickness
9
1.1.4 Microelectrodes and their relevance to corrosion
The theoretical background presented in sections 1.1.2 and 1.1.3 is appropriate
for large planar electrodes. The band microelectrode (BME) geometry that is
employed extensively in this thesis exhibits mass transport that differs from
conventional sized electrodes and this section will address these differences.
Ultramicroelectrodes (UME’s) are electrodes that exhibit unique electrochemical
behaviour as a result of their small size. While there is no absolute size that
may be used to classify an electrode as an UME, they are universally
recognised as being electrodes possessing a critical dimension smaller than
that of the diffusion layer developed during experiment. Practically, this is
around 20-30 µm.7-9
Figure 1.3 Theoretical Evans diagram showing a theoretical metal dissolution reaction (E0=-
0.50 V, i0=1x10⁻² A cm-2) and diffusion limited reduction reaction (E0=+0.20 V, i0=1x10⁻⁷ A cm-
2), intersecting at the mixed potential. The reverse reactions have not been extended on
account of their low rate in a real system.
10
The application of UME’s to problems in corrosion science has remained almost
exclusively the domain of the scanning probe techniques that employ UME’s as
their active tips. Examples include the scanning reference electrode technique
(SRET), scanning vibrating electrode technique (SVET), scanning
electrochemical microscopy (SECM) and local electrochemical impedance
spectroscopy (LEIS). These techniques can be used to interrogate electrolyte
properties such as the electric field gradient (SVET and SRET) or localised ion
concentration (SECM) as well as the surface properties such as surface film
impedance (LEIS) or heterogeneous electron transfer rate (SECM). The nature
of the scanning probe techniques makes them well suited for investigating
corrosion phenomena for two reasons: firstly, anodic and cathodic processes
tend to be spatially separated on most metallic surfaces and the micron sized
tips can resolve these. Secondly, corrosion processes are often localised, so
current and potential measurements on large electrodes are often governed by
events occurring on a small fraction of the surface. For example Basame and
White have demonstrated that ~65 % of the total current during Br- oxidation on
titanium occurs at sites that occupy 0.01% – 0.10% of the total surface area.10
Another technique that is closely related to the scanning probe techniques is the
capillary microcell technique, where a glass capillary filled with electrolyte is
used to isolate a site of interest on a working electrode that is typically tens of
microns in diameter. The counter and working electrodes are often placed in a
reservoir attached to the capillary. The capillary microcell technique allows a
range of electrochemical techniques such as open-circuit measurements,
electrochemical polarisation and noise analysis to be conducted on a small
region of interest. It has been successfully used to isolate the electrochemistry
of intermetallic particles 11 and microstructural phases12 from the bulk matrix.
While there has been significant work into probing localised corrosion sites
using localised techniques such as those described above, much less attention
has been applied to investigate localised corrosion sites using micron sized
electrodes as active, corroding electrodes. The use of UMEs composed of Al,
Zn and Al-Zn alloys in this thesis is based on the hypothesis that UMEs and
UME arrays may accurately reproduce real corrosion phenomena whose active
11
anodic and cathodic domains occur on the same size scale and are close
enough to each other to exhibit interacting diffusion fields. These criteria
encompass the interaction of the α- and β-phases of the 55% Al-Zn coating with
each other as well as the interaction of the coating with exposed steel from the
substrate. The mass transport properties of UMEs, particularly BMEs, will be
explored in the remainder of this section.
The unusual electrochemical properties of UMEs are a direct result of diffusion
to the electrodes and their geometry is critical in describing the mass transport
behaviour. To understand this, diffusion behaviour at a normal sized electrode
will be briefly addresses. The diffusive behaviour of normal sized (macroscopic)
electrodes can be described by the linear, semi-infinite diffusion problem,
regardless of the geometry and microscale surface topography. The reason that
this universal description applies is that the electrode size is much larger than
the dimensions over which diffusion occurs, thus after a short time period, mass
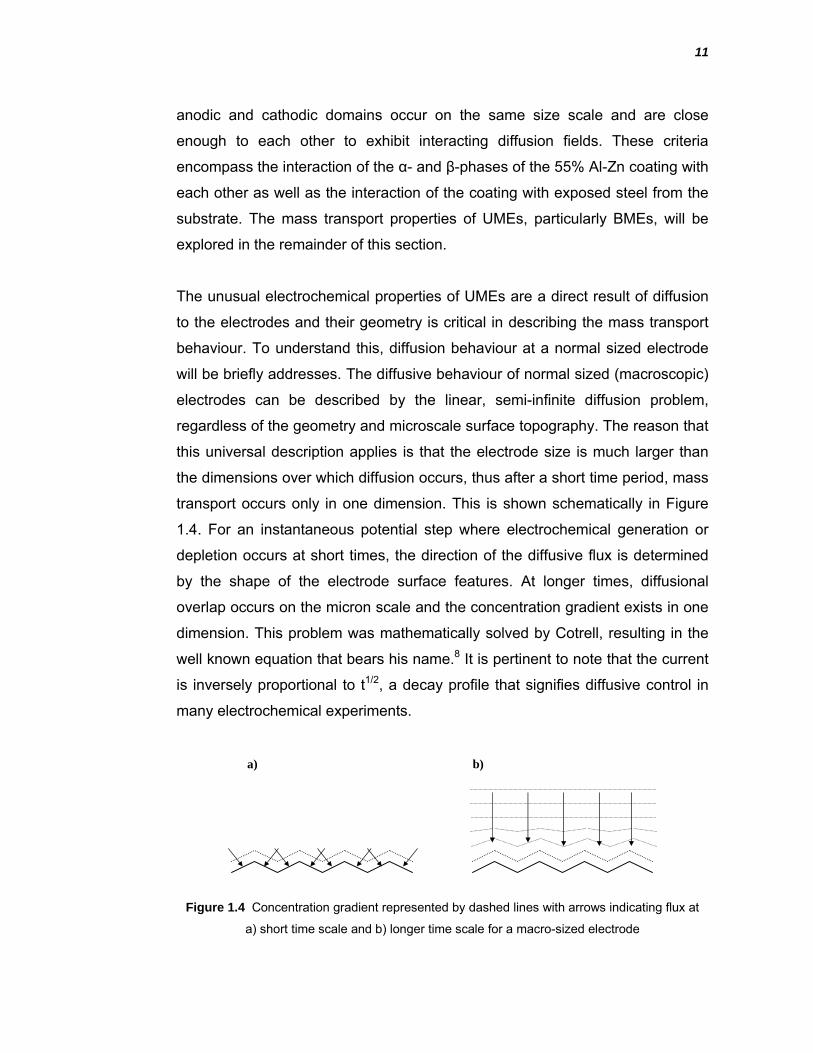
transport occurs only in one dimension. This is shown schematically in Figure
1.4. For an instantaneous potential step where electrochemical generation or
depletion occurs at short times, the direction of the diffusive flux is determined
by the shape of the electrode surface features. At longer times, diffusional
overlap occurs on the micron scale and the concentration gradient exists in one
dimension. This problem was mathematically solved by Cotrell, resulting in the
well known equation that bears his name.8 It is pertinent to note that the current
is inversely proportional to t1/2, a decay profile that signifies diffusive control in
many electrochemical experiments.
a) b)
Figure 1.4 Concentration gradient represented by dashed lines with arrows indicating flux at
a) short time scale and b) longer time scale for a macro-sized electrode
12
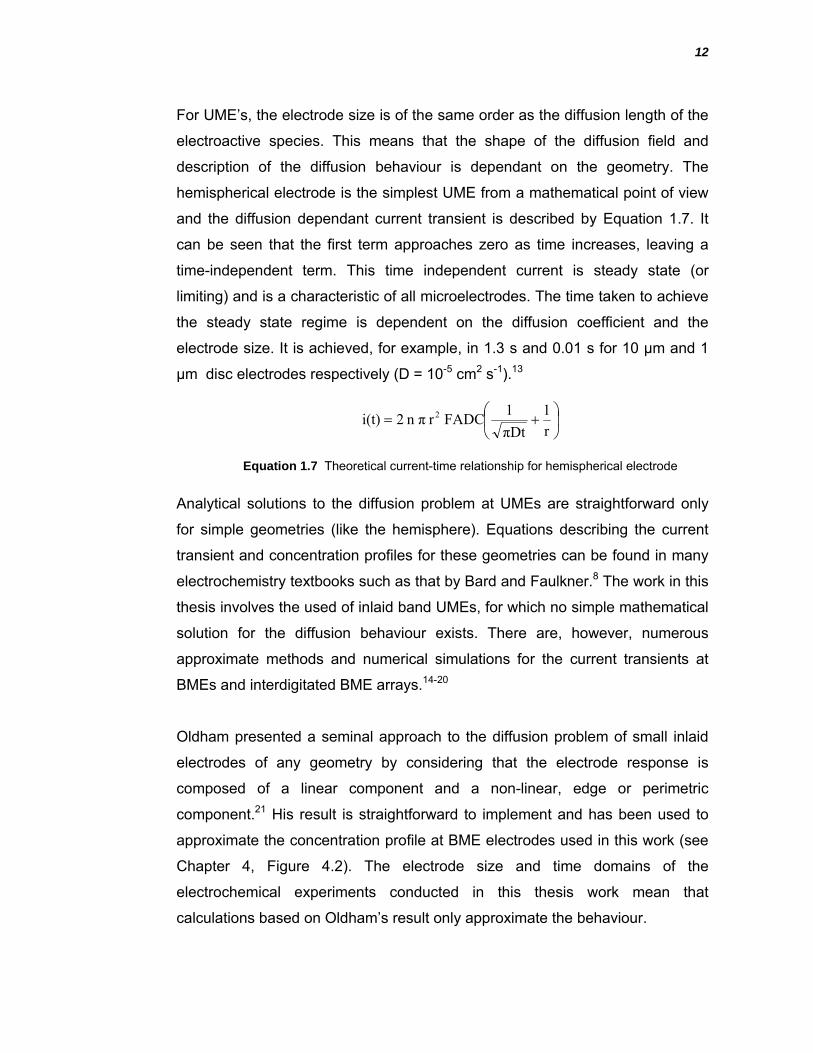
For UME’s, the electrode size is of the same order as the diffusion length of the
electroactive species. This means that the shape of the diffusion field and
description of the diffusion behaviour is dependant on the geometry. The
hemispherical electrode is the simplest UME from a mathematical point of view
and the diffusion dependant current transient is described by Equation 1.7. It
can be seen that the first term approaches zero as time increases, leaving a
time-independent term. This time independent current is steady state (or
limiting) and is a characteristic of all microelectrodes. The time taken to achieve
the steady state regime is dependent on the diffusion coefficient and the
electrode size. It is achieved, for example, in 1.3 s and 0.01 s for 10 µm and 1
µm disc electrodes respectively (D = 10-5 cm2 s-1).13
Analytical solutions to the diffusion problem at UMEs are straightforward only
for simple geometries (like the hemisphere). Equations describing the current
transient and concentration profiles for these geometries can be found in many
electrochemistry textbooks such as that by Bard and Faulkner.8 The work in this
thesis involves the used of inlaid band UMEs, for which no simple mathematical
solution for the diffusion behaviour exists. There are, however, numerous
approximate methods and numerical simulations for the current transients at
BMEs and interdigitated BME arrays.14-20
Oldham presented a seminal approach to the diffusion problem of small inlaid
electrodes of any geometry by considering that the electrode response is
composed of a linear component and a non-linear, edge or perimetric
component.21 His result is straightforward to implement and has been used to
approximate the concentration profile at BME electrodes used in this work (see
Chapter 4, Figure 4.2). The electrode size and time domains of the
electrochemical experiments conducted in this thesis work mean that
calculations based on Oldham’s result only approximate the behaviour.
⎟⎠
⎞⎜⎝
⎛+=
r1
πDt1FADC r n π 2i(t) 2
Equation 1.7 Theoretical current-time relationship for hemispherical electrode
13
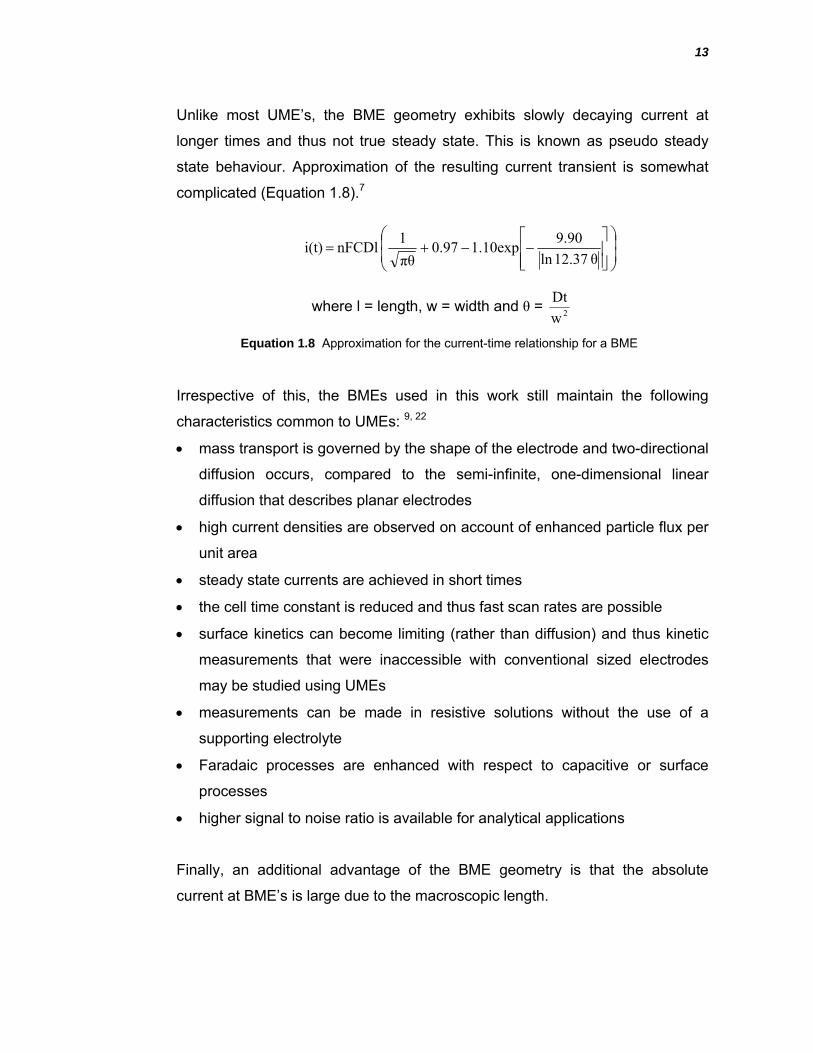
Unlike most UME’s, the BME geometry exhibits slowly decaying current at
longer times and thus not true steady state. This is known as pseudo steady
state behaviour. Approximation of the resulting current transient is somewhat
complicated (Equation 1.8).7
where l = length, w = width and θ = 2wDt
Irrespective of this, the BMEs used in this work still maintain the following
characteristics common to UMEs: 9, 22
• mass transport is governed by the shape of the electrode and two-directional
diffusion occurs, compared to the semi-infinite, one-dimensional linear
diffusion that describes planar electrodes
• high current densities are observed on account of enhanced particle flux per
unit area
• steady state currents are achieved in short times
• the cell time constant is reduced and thus fast scan rates are possible
• surface kinetics can become limiting (rather than diffusion) and thus kinetic
measurements that were inaccessible with conventional sized electrodes
may be studied using UMEs
• measurements can be made in resistive solutions without the use of a
supporting electrolyte
• Faradaic processes are enhanced with respect to capacitive or surface
processes
• higher signal to noise ratio is available for analytical applications
Finally, an additional advantage of the BME geometry is that the absolute
current at BME’s is large due to the macroscopic length.
⎟⎟⎠
⎞⎜⎜⎝
⎛
⎥⎥⎦
⎤
⎢⎢⎣
⎡−−+=
θ 12.37ln 9.901.10exp 0.97
πθ1 nFCDl i(t)
Equation 1.8 Approximation for the current-time relationship for a BME
14
1.1.5 Localised micro-pH sensing
Localised pH sensing is a potentiometric SECM technique that has been used
in this thesis to spatially resolve pH changes in the near surface region. The
apparatus involves a pH sensitive microelectrode tip (1 - 25 µm) scanned three-
dimensionally with a computer controlled micropositioner over an immersed
object of interest.23
Electrolyte pH is an important parameter in corrosion systems as it has a
profound influence on the rate of corrosion of most metals, principally by
affecting the solubility of native oxide films. Potential and pH conditions where
corrosion, passivation and immunity are thermodynamically favoured may be
predicted from Pourbaix diagrams.24 These diagrams can be strongly affected
by the presence of anions and complexing species. To overcome this,
databases of equilibrium constants combined with software can account for the
effect of some ions,1 however not all ions and species are included. Another
limitation is that these diagrams represent equilibrium conditions under which
active corrosion cells rarely exists. A complicating issue is that both anodic and
cathodic processes occurring during corrosion can affect the electrolyte pH near
the surface and if the active sites are close enough, these may interact. This
becomes particularly important in situations where the local electrolyte volume
is small, such as crevice corrosion, pitting corrosion and under-film corrosion.
The main cathodic reactions are that of proton and oxygen reduction and both
of these processes serve to increase the pH via consumption of protons or
production of hydroxide. Anodic reactions can, and often do, lower the pH due
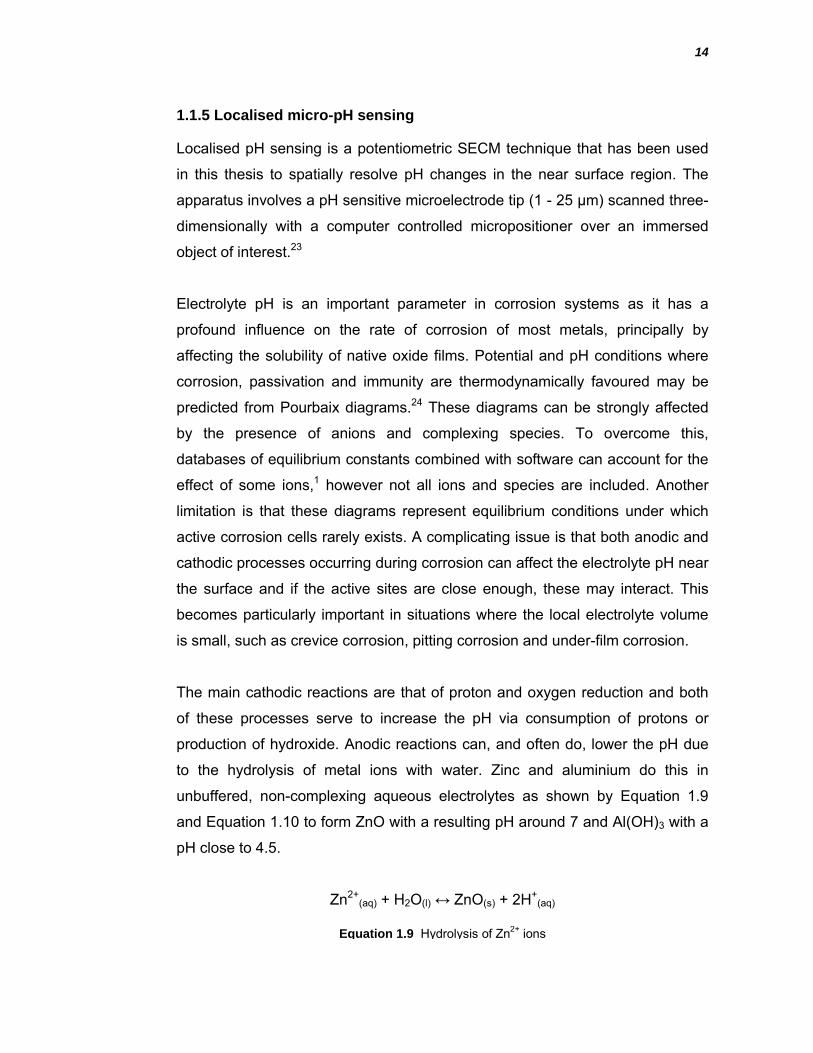
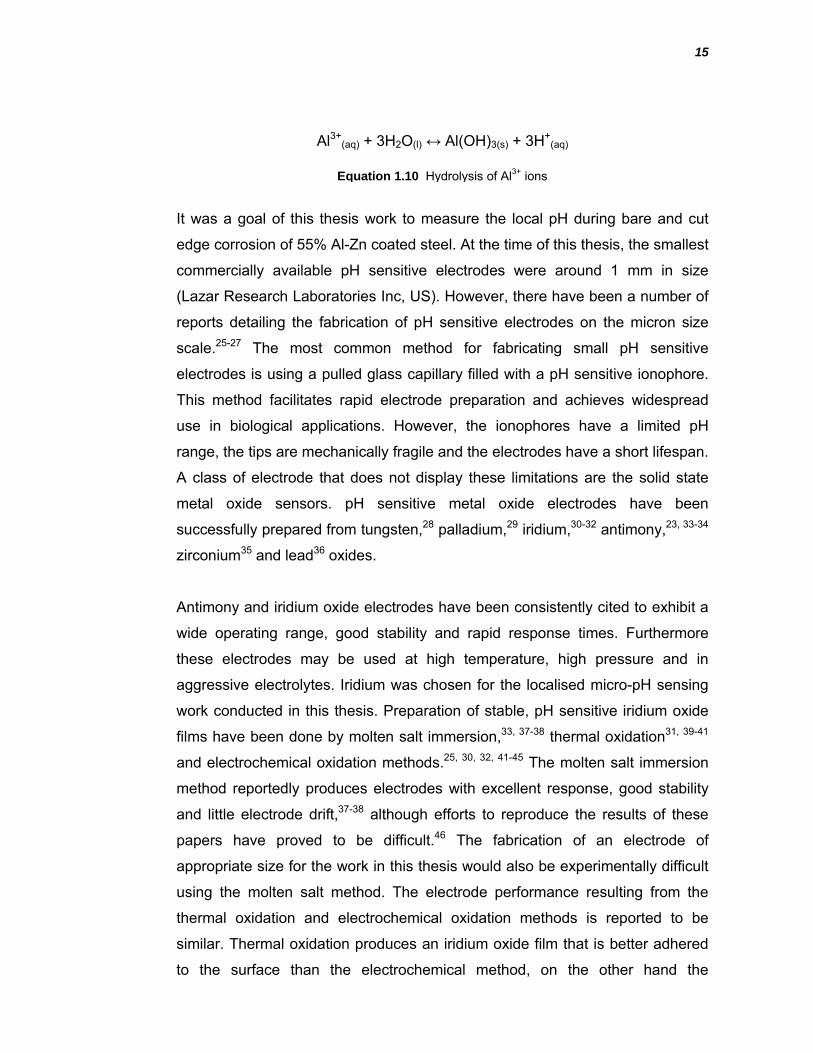
to the hydrolysis of metal ions with water. Zinc and aluminium do this in
unbuffered, non-complexing aqueous electrolytes as shown by Equation 1.9
and Equation 1.10 to form ZnO with a resulting pH around 7 and Al(OH)3 with a
pH close to 4.5.
Zn2+(aq) + H2O(l) ↔ ZnO(s) + 2H+
(aq)
Equation 1.9 Hydrolysis of Zn2+ ions
15
Al3+(aq) + 3H2O(l) ↔ Al(OH)3(s) + 3H+
(aq)
It was a goal of this thesis work to measure the local pH during bare and cut
edge corrosion of 55% Al-Zn coated steel. At the time of this thesis, the smallest
commercially available pH sensitive electrodes were around 1 mm in size
(Lazar Research Laboratories Inc, US). However, there have been a number of
reports detailing the fabrication of pH sensitive electrodes on the micron size
scale.25-27 The most common method for fabricating small pH sensitive
electrodes is using a pulled glass capillary filled with a pH sensitive ionophore.
This method facilitates rapid electrode preparation and achieves widespread
use in biological applications. However, the ionophores have a limited pH
range, the tips are mechanically fragile and the electrodes have a short lifespan.
A class of electrode that does not display these limitations are the solid state
metal oxide sensors. pH sensitive metal oxide electrodes have been
successfully prepared from tungsten,28 palladium,29 iridium,30-32 antimony,23, 33-34
zirconium35 and lead36 oxides.
Antimony and iridium oxide electrodes have been consistently cited to exhibit a
wide operating range, good stability and rapid response times. Furthermore
these electrodes may be used at high temperature, high pressure and in
aggressive electrolytes. Iridium was chosen for the localised micro-pH sensing
work conducted in this thesis. Preparation of stable, pH sensitive iridium oxide
films have been done by molten salt immersion,33, 37-38 thermal oxidation31, 39-41
and electrochemical oxidation methods.25, 30, 32, 41-45 The molten salt immersion
method reportedly produces electrodes with excellent response, good stability
and little electrode drift,37-38 although efforts to reproduce the results of these
papers have proved to be difficult.46 The fabrication of an electrode of
appropriate size for the work in this thesis would also be experimentally difficult
using the molten salt method. The electrode performance resulting from the
thermal oxidation and electrochemical oxidation methods is reported to be
similar. Thermal oxidation produces an iridium oxide film that is better adhered
to the surface than the electrochemical method, on the other hand the
Equation 1.10 Hydrolysis of Al3+ ions
16
electrochemical method is more convenient. Of these two methods,
electrochemical oxidation has been the most widely reported procedure and
was the one used in this thesis.
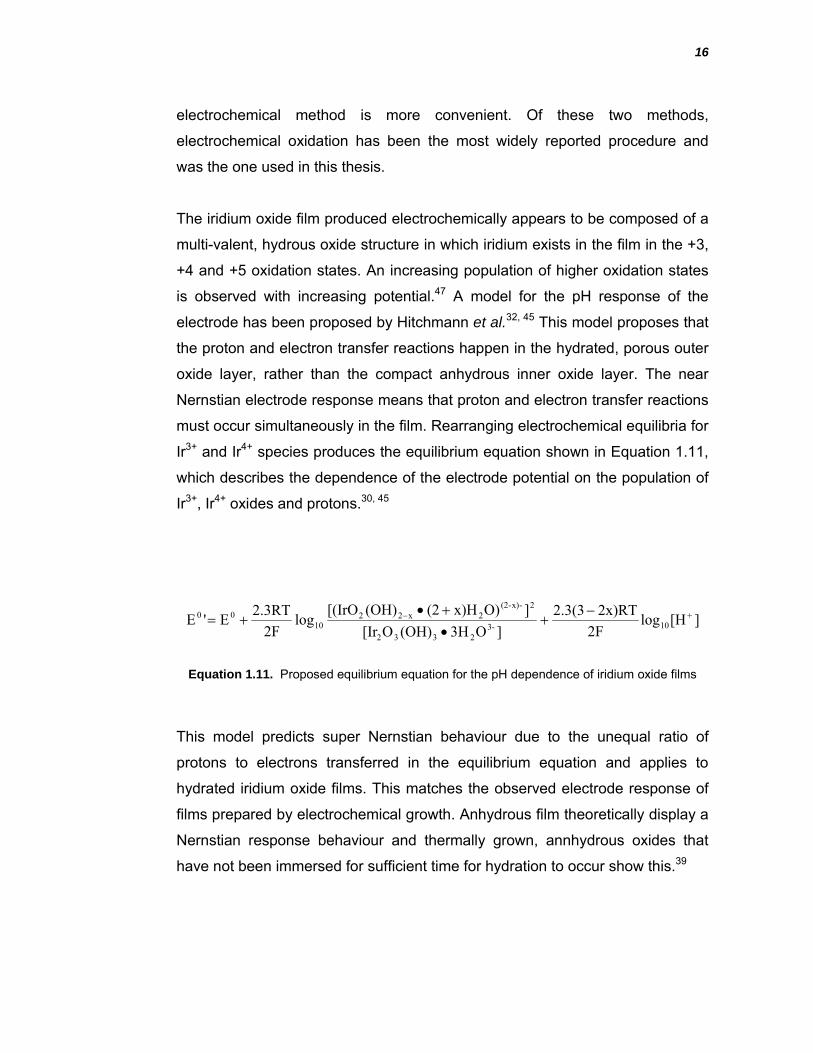
The iridium oxide film produced electrochemically appears to be composed of a
multi-valent, hydrous oxide structure in which iridium exists in the film in the +3,
+4 and +5 oxidation states. An increasing population of higher oxidation states
is observed with increasing potential.47 A model for the pH response of the
electrode has been proposed by Hitchmann et al.32, 45 This model proposes that
the proton and electron transfer reactions happen in the hydrated, porous outer
oxide layer, rather than the compact anhydrous inner oxide layer. The near
Nernstian electrode response means that proton and electron transfer reactions
must occur simultaneously in the film. Rearranging electrochemical equilibria for
Ir3+ and Ir4+ species produces the equilibrium equation shown in Equation 1.11,
which describes the dependence of the electrode potential on the population of
Ir3+, Ir4+ oxides and protons.30, 45
This model predicts super Nernstian behaviour due to the unequal ratio of
protons to electrons transferred in the equilibrium equation and applies to
hydrated iridium oxide films. This matches the observed electrode response of
films prepared by electrochemical growth. Anhydrous film theoretically display a
Nernstian response behaviour and thermally grown, annhydrous oxides that
have not been immersed for sufficient time for hydration to occur show this.39
Equation 1.11. Proposed equilibrium equation for the pH dependence of iridium oxide films
][Hlog2F
2x)RT2.3(3]O3H(OH)O[Ir
]O)x)H(2 (OH)[(IrOlog
2F2.3RT E'E 10-3
2332
2-x)-(22x22
1000 +− −
+•+•
+=
17
1.1.6 Literature review of the bare corrosion of 55% Al-Zn coated steel and corrosion of Al-Zn alloys
In the context of this thesis, bare corrosion (also termed self corrosion) refers to
the atmospheric corrosion behaviour of the 55% Al-Zn coating without
electrochemical coupling to steel (or another metal) and without chemical
treatments or polymer coatings on the metal coating surface that are often
employed on commercial products.
While the bare and galvanic corrosion behaviour of galvanized (zinc coated
steel) products has been well reported in literature, there is much less literature
regarding the corrosion behaviour of 55% Al-Zn coated steel. The free corrosion
potentials of the α- and β- phases in common electrolytes and hence the
likelihood and degree of galvanic interaction between the phases is not well
known. The rate or mechanism of the cathodic processes have not been
experimentally quantified for each phase, nor have the anodic dissolution
mechanisms. The studies that have been reported focus on the general
corrosion behaviour of the 55% Al-Zn coating and a number of other Al-Zn
metal coatings.
Examination of 55% Al-Zn alloy coated steel after atmospheric exposure in
industrial, rural and marine test sites from a number of studies indicates that
corrosion commences at the surface of alpha and zinc rich beta phases, but
then proceeds in the zinc rich β-phase.3, 48-49 It is viewed that the improved
corrosion performance of the 55% Al-Zn coating compared to galvanised
coatings may be attributed to the accumulation and retention of corrosion
products, which occlude channels that exists between the dendrites, on the
surface of the metal coating and on exposed steel at a cut edge or defect.50-51
SRET and SVET studies by McMurray, Worsley and co-workers have
demonstrated that multiple coactive anodic sites are present on the surface of a
55% Al-Zn coating. These sites were shown to generate localised current
densities of 100-200 μA cm-2 and deactivated relatively quickly after initiation.52-
53 Ex situ microscopic examination following these measurements revealed
18
localised dezincification from the β-phase of the coating. The authors’
conclusions emphasise that the localised current and the lifetime of the anodic
sites decreased with increasing amount of aluminium in the overlay. However, a
profoundly different microstructure is implicit with a variation of aluminium at
levels of 0.1%, 4.3% and 55%, making the direct comparisons between these
compositions less useful towards a mechanistic understanding of the bare
corrosion behaviour of the 55% Al-Zn coating.
Electrochemical based studies of galvanised, Zn-0.1% Al, Zn-4.3% Al and 55%
Al-Zn coated steel have been reported.54-58 With respect to the oxygen
reduction processes, the conclusions emphasise diffusion-limited oxygen
reduction and facile dissolution kinetics at the β-phase of 55% Al-Zn coating,
similar to that of pure zinc.59 Proton reduction and water hydrolysis are not
considered to be significant cathodic processes in neutral and mildly alkaline pH
electrolytes at ambient temperature. Based on the high aluminium content, or
perhaps due to the relatively fast processes on the β-phase, an unsubstantiated
assumption is made that the α-phase makes negligible contribution to reduction
processes. Experiments conducted by Dafydd et al. show that the rate of
cathodic processes on the surface of 55% Al-Zn alloy was found to be higher
than a pure zinc electrode.56 The authors rationalised these results by
suggesting a plausible but unverified mechanism involving water hydrolysis by
trace amounts of substrate derived iron in the coating. The source of iron is
more likely to be due to trace amounts of iron in the hot dip bath, solidifying as
intermetallics interspersed within the eutectic (β-phase). Their contribution to
cathodic processes on the coating is not in the scope of this thesis but
nevertheless could warrant further investigation where they are present.
In low pH conditions, hydrogen evolution has been observed as a cathodic
process on the 55% Al-Zn coating.51 The high overpotential for proton reduction
on zinc would suggest that this process occurs at aluminium rich sites, however
this is postulation and the location, temporal persistence and kinetics of this
processes needs to be better evidenced and quantified. It cannot be excluded
that hydrogen evolution may arise at the anodic sites at 55% Al-Zn alloy due to
the negative difference effect.60-61
19
The anodic processes on the 55% Al-Zn coating have been investigated by
Sakairi et al. using a photon rupture technique to remove the native oxide film
and initiate corrosion in a controlled manner.62 Results of these experiments on
5%- and 55% Al-Zn metal coatings lead the authors to postulate that Zn2+ ions
present in the electrolyte inhibit the anodic dissolution process via precipitation
of zinc hydroxide. The presence of Al3+ ions were shown to prevent this
inhibition, presumably through a near surface pH buffering effect. While the
photon rupture technique is an effective method for removing the native oxide
film and investigating the initiation electrochemistry, the 0.5 M borate buffer
electrolyte that was used appears to interact strongly with the coating, as
evidenced by Ecorr values that were ca. 300 mV more positive than reported in
unbuffered Cl- and SO42- electrolytes.50, 63
It remains that the electrochemistry of the α-phase, which occupies about 80%
of the 55% Al-Zn overlay volume in the form of dendrites and an equally high
proportion of the surface area, is poorly understood. It is not known if, and
under what conditions, a potential difference between the α- and β-phases and
if this potential difference is sufficient to support inter-phase galvanic corrosion.
The difference in the corrosion potentials of high purity aluminium and high
purity zinc has led some workers to postulate that the zinc rich β-phase may
galvanically protect the aluminium rich α-phase.63 While this hypothesis may
rationalise the preferential dissolution of the β-phase, it remains experimentally
unverified. Furthermore, it is likely that the α-phase, which contains ca. 40% Zn,
does not display the same corrosion potential and kinetics as aluminium and
conclusions about its galvanic behaviour with the β-phase may not be drawn in
this way. Therefore, understanding the electrochemical behaviour of the α-
phase is the primary focus of Chapter 3 of this thesis, while the interaction of
the α-phase with the β-phase is explored using BME arrays in Chapter 4.
20
1.1.7 Literature review of the cut-edge corrosion of 55% Al-Zn metal coated steel
“Cut edge” corrosion of 55% Al-Zn metal coated is a type of galvanic corrosion
that occurs not only at a cut edge, but also at defects where the steel substrate
and metal coating are simultaneously exposed such as deep scratches, cracks
and punctures. The 55% Al-Zn metal coating is designed so that the galvanic
cell between the coating and the steel has a strong thermodynamic driving force
towards cathodic protection of the steel.
Two galvanic situations are common, the first of which involves a surface area
ratio in favour of the steel by 5:1 to 50:1. The value of the ratio depends on the
relative thickness of the steel and coating and is most often encountered at the
cut edge of prepainted sheet. The second situation involves a surface area ratio
greatly favouring the metal coating and is encountered at the cut edge of an
unpainted sheet. The corrosion cell may extend 2-3 mm from the cut edge
along the surface of the metal coating, which is quite different to the respective
cross-sections in the prepainted case above. The relationship between the
relative surface areas of the steel and metal coating is important as the surface
area and reaction kinetics of the limiting electrode controls the current density
and ultimately the functional metal coating life.
There have been numerous theoretical and experimental studies regarding the
cut edge corrosion of zinc coated sheet steel (galvanized) and this area remains
an active area of research, with recent focus on corrosion inhibitors.64-69
However, much less work exists in the open literature regarding the details of
cut-edge corrosion of 55% Al-Zn alloy coated steels. Unlike galvanized steel,
information about the metal-electrolyte interface such as the near surface pH
during corrosion, corrosion products precipitation on the steel and metal
coatings, what the nature of these corrosion products are and the effect of
common environmental anions and cations have not been reported. In addition,
coating compositional factors such as whether Al3+ ions are dissolving and what
role they play in the corrosion process, how the microstructure of the coating
21
affects corrosion, the nature and effect of the passive film on the coating and so
on are also not clear.
Some of the published work on cut edge corrosion of 55% Al-Zn coated steel
involves outdoor exposure testing. Measurement of the corrosion performance
of steel coated with Zn, Zn-5% Al, Zn-15% Al, 55% Al-Zn, Al-13% Si and high
purity Al has been undertaken by inducing a scribe defect to initiate corrosion.70
It was found that cathodic protection was afforded by Al, Al-13% Si and 55% Al-
Zn (the Al-rich coatings) in high Cl- environments but not in moderate Cl-
environments. Outdoor exposure studies such as these provide realistic
corrosion rates in a range of environments, however they are limited given that
they are time consuming and little mechanistic information on the corrosion
behaviour may be obtained from the results.
Work by Yadav et al. compared the ability of Zn, Zn-5% Al and 55% Al-Zn to
provide galvanic protection on large samples under thin film electrolytes where
the steel and metal coating surface areas are equal.51 Results of this study
showed that a very low pH (pH 2) developed over the 55% Al-Zn metal coating
during galvanic coupling, which was attributed to the hydrolysis of Al3+ ions. The
low pH enhanced self-corrosion of the coating via increasing the rate of
hydrogen evolution. This had the effect of increasing both the local metal ion
concentration and the accumulation of corrosion products. This accumulation
was proposed to account for the poor longer term galvanic protection of the
55% Al-Zn coating that was observed under these experimental conditions. The
paper presented by Yadav et al. provides important mechanistic detail into the
corrosion product transport and precipitation behaviour of 55% Al-Zn coated
steel. It is, however, uncertain whether these results may be directly
extrapolated to a cut edge cell, given the different surface area ratio of either a
bare or coated cut edge and significantly different cell size and geometry. For
instance, questions remain as to whether the near surface pH values on
samples 10-20 mm in size correlate to near surface pH values of a 500 µm wide
cut edge where the anodic and cathodic domains are much closer together and
electrolyte mixing is more prevalent.
22
In other work, the influence of Mg2+ ions in chloride containing electrolytes on
55% Al-Zn alloy was investigated.71 It was shown that in NaCl electrolyte the
galvanic current was proportional to the surface area of the steel and thus under
cathodic control, while in NaCl electrolyte with Mg2+ ions added, the galvanic
current was found to be independent of the surface area ratio. This was
attributed to cathodic inhibition due to precipitation of magnesium compounds,
primarily Mg(OH)2, on the steel. Their electrode design was a triband array
which employed a surface area ratio and geometry that emulates that of a bare
sheet cut-edge corrosion cell. The tri band array is composed of three closely
spaced, parallel, coplanar electrodes. In this case a central steel band with two
adjacent bands of 55% Al-Zn coating was used. The size of the steel was
selected to be consistent with common commercial products (0.8 mm, 3.2 mm
and 10 mm). The electrodes were placed as “close to each other as keeping
insulation”,71 ensuring that the design approximates that of a real cut edge
corrosion cell, where corrosion products from the steel and metal coating
interact. An advantage of this design is that the current at each of the electrodes
may be measured independently, separating the contributions of each electrode
to the overall cell behaviour. For these reasons, a similar electrode design
composed of three electrically isolated, adjacent, coplanar band electrodes, was
adopted for the work detailed in this thesis. Schematics of the design are shown
in Chapter 2. Other workers have utilised this design to investigate galvanised
coatings rather than 55% Al-Zn metal coating. For example, Zin et al.,69
reported a tri-band array of electrodes being used to model the cut edge of
galvanized steel and the mechanism of corrosion inhibition by coating pigments.
In their paper, polarisation of the elements was conducted simultaneously,
allowing de-convolution of the total current into its component on each
electrode. This technique is used in this thesis to explore the cut edge corrosion
behaviour of the 55% Al-Zn coating (Chapter 5).
The near surface pH over a spontaneously corroding galvanized cut edge has
been measured using localised techniques by Ogle et al.65 These results show
that, in NaCl electrolyte, the pH ranged from 7.5 to 10. Correlating these results
with SVET revealed that the pH 10 regions arose from cathodic activity on the
steel, while zinc dissolution was responsible for the pH 7.5 regions. Precipitation
23
of corrosion products was observed where the Zn2+ ions mixed with the alkaline
regions and these corrosion products inhibited the cathodic current density on
the steel in these areas. In addition, corrosion product precipitation was not
observed in (NH4)2SO4 electrolyte as the near surface pH was between 6 and 7
over the entirety of the cut edge. This was ascribed to the buffering effect of the
ammonium ion. The work presented by Ogle provides valuable insight into the
corrosion behaviour of galvanised steel. Similar work detailing the near surface
pH over cut edge or bare 55% Al-Zn coated steel, experimental or theoretical,
has not been reported and was one of the aims of this thesis. This data is
presented in Chapter 5.
1.1.8 Electrochemical impedance spectroscopy of anodic Al-Zn electrodes
The early stages of this thesis work (Chapter 3) showed that Al-Zn alloys
display both passive and active anodic dissolution behaviour depending on the
anion present (Cl- or SO42-). Detailed anodic dissolution mechanisms have been
presented in the literature for high purity zinc and aluminium, however the
details of charge transfer at the metal-oxide-electrolyte interface of binary Al-Zn
alloys are not as well known.72-77
Electrochemical impedance spectroscopy (EIS) is a powerful technique for
investigating processes at the electrode-electrolyte interface. It differs from
traditional electrochemical experiments in that a small sinusoidal perturbation
(eg. 10 mV) is applied to the electrode potential and the system response is
recorded. One advantage of EIS lies in the ability to make measurements over
a wide frequency range, thus capturing a variety of processes with overlapping
signals in the time domain. Only small perturbations are made, meaning that the
system is virtually unchanged by the measurement and data can be averaged
over a long time, enhancing the precision. A significant limitation of the
technique is that the chemical system needs to be at steady state. Like with
traditional electrochemical corrosion measurements, spatially localised
processes may also dominate the current and potential response of the system,
making data interpretation difficult. For EIS measurements, authors such as
24
Keddam and Mansfeld have developed theoretical models which account for
impedance data arising from local events on iron and aluminium respectively.77-
80
In this thesis EIS is used to probe the interfacial interaction of Cl- and SO42- ions
on Al-Zn alloys of variable composition (Chapter 6). It is pertinent then to review
the application of EIS to the corrosion behaviour of Al-Zn alloys in other
publications.
The motivation and outcomes of the application of EIS to investigating
interfacial phenomena of Al-Zn alloys have varied. Amin et al. have used EIS to
evaluate corrosion behaviour of Al-Zn alloys under a range of experimental
conditions such as anion concentration, temperature, overpotential and alloy
composition in SCN- electrolyte.81 Their conclusions emphasise that the
presence of zinc in the alloys resulted in an oxide film that exhibits more defects
and a higher conductivity compared with high purity aluminium. The authors
propose that these defects arise from ZnO particles in the film, which allow
SCN- penetration and subsequent pitting initiation. These results have limited
scope, as the authors make no reference to the microstructure of their alloys
and the SCN- anion is a not common atmospheric pollutant.
Osorio et al. have shown that microstructure has a strong influence on the
impedance behaviour of hypereutectic Al-Zn alloys (>4% Al) with a
concentration of 25% and 55% Al.82 These alloys were studied as potential
candidates for battery anodes. It was found that coarser dendritic
microstructures improved the corrosion resistance, however this was
complicated by the solute distribution in the phases, which also influenced the
impedance response. Other work by the same group has shown that the
impedance response is indistinguishable for both columnar and equiaxed Al-Zn
macrostructures, while decreasing the dendritic arm spacing of the
microstructure was shown to increase the impedance.83 The authors
hypothesise that the spatial distribution of the phases may affect the reactivity of
the active α-phase, although a possible mechanism is not explored by the
authors. Results presented in Chapter 4 of this thesis demonstrate that such an
25
interaction is possible: close proximity of active phases results in interacting
corrosion products, creating a unique localised environment in the electrolyte.
El-Mahdy used EIS to investigate the impedance of 55% Al-Zn coating under
thin layers of electrolyte.50 A simple equivalent circuit was used to model the
behaviour and the polarisation resistance was estimated from the reciprocal of
the impedance at 10 mHz. The calculated corrosion rate was shown to
increased markedly when the film thickness was less than 100 µm, a
consequence of enhanced diffusion of oxygen to the surface. EIS was also
used to calculate the corrosion rate during wet-dry cycles and the presence of
SO2 in the atmosphere. A similar equivalent circuit to that used by El-Mahdy
has also been used to interpret the results of an EIS study on the corrosion
mechanisms of commercial 5%Al-Zn and 55% Al-Zn metal coatings.55 The
Warburg diffusion element in the equivalent circuit was associated with the
mass transport of oxygen to the surface. These authors use this equivalent
circuit to propose that restriction of oxygen occurs due to the corrosion product
accumulation in pores of the coating.
There have been few studies focussed on the relationship between composition
of Al-Zn alloys and their electrochemical behaviour. One such study was
conducted by Salinas et al. on Al-Zn alloys of variable zinc content, covering the
full range of compositions.84 Their work shows that the solidification
microstructure has a strong influence on the anodic capacity. All the
compositions displayed preferential dissolution of zinc from zinc rich phases.
These experiments were conducted galvanostatically as a survey for potential
zinc battery anode materials and a mechanistic understanding of the dissolution
processes was not a focus and thus not explored.
In the above studies on Al-Zn alloys, with the exception of assigning the
Warburg element to the diffusion of oxygen by McMurray, EIS was used simply
as a tool to estimate the corrosion rate. The measurements were conducted at
open circuit to allow meaningful corrosion rate estimates, however this also
means that simple equivalent circuits are suited to analysis of the impedance
data. It is clear that a basic mechanistic understanding of the dissolution
26
processes on Al-Zn alloys is not widely known. EIS is used in Chapter 6 as part
of an experimental strategy for the foundations of a dissolution mechanism on
Al-Zn alloys.
1.1.9 Thesis objectives and research outline
The work of this thesis was conducted to achieve four mains goals:
• To prepare an Al-Zn alloy that resembles the α-phase of the 55% Al-Zn
coating and characterise its electrochemical behaviour
• To measure and understand the galvanic interaction between the α- and β-
phases of the 55% Al-Zn coating
• To gain a fundamental understanding of the cut edge corrosion behaviour of
55% Al-Zn coated steel
• To understand how material composition and the presence of anions affects
the formation and behaviour of the native oxide film on Al-Zn alloys.
In achieving these goals, two hypotheses underpin the experimental approach
taken. Firstly, that the transport of corrosion products (ions and soluble
complexes) affects the behaviour of neighbouring phases during bare and cut
edge corrosion of 55% Al-Zn coating. A similar hypothesis has been put forward
to explain the clustering of pits in stainless steels and it has been shown that
pitting probability is increased on area of the surface that are close to active
pits.85-86 Secondly, that the electrochemical processes occurring on an actively
corroding heterogeneous material, which incorporates both the cut edge and
bare situations presented in this thesis, can be deconvoluted and measured
discreetly on each of the phases, or on model phases. This approach has been
successful for investigating the behaviour of intermetallic phases in aluminium
alloys.11, 87-88
The scope of this thesis has been restricted to short term experiments, which
provide information most relevant to the initiation of atmospheric corrosion on
55% Al-Zn alloy during periods that an electrolyte is present. The mid-life and
long term corrosion behaviour, as well as the underfilm and other unique
27
environments (pores and crevices) is beyond the scope of this thesis. Short
term, corrosion initiation experiments were focused on as they provide a
foundation for the exploration of these and other long term corrosion behaviour
(for example depletion of metal alloy phases, corrosion product compound films
etc.), a foundation which has received little attention in the open literature.
Immersion conditions have also been used, however in a real service
environment wet and dry cycles are present. Immersion conditions were
selected to provide a foundation for the interpretation of wet/dry cycle
experiments, which are inherently more complicated. Wet and dry cyclic
experiments have been conducted at BlueScope Steel, but not by the author
and are beyond the scope of this thesis.
The actual service environments (both residential and commercial use) of the
bare and prepainted metal coated steel are in the majority of cases a near
coastal region where the influence of airbourne sality is significant. Hence,
chloride based electrolytes during high humidty, dew formation and rain events
are of primary concern. The range of pH for chloride and sulfate based
electrolytes used in this thesis work are representative of conditions that would
be imposed in a corrosion cell comprised of distinct anodic and cathodic
regions. The use of sulfate, although a minor component of salt aerosols,
evidences the role of anions not only as participant ion migration but in the
dissolution of passive films during steady state corrosion processes
In Chapter 3 of this thesis, electrochemical polarisation data for Al, Zn and Al-Zn
alloys in SO42- and Cl- electrolytes at pH 4, 7 and 10 is presented. The Al-Zn
alloys were prepared as synthetic analogues to the α-phase of the 55% Al-Zn
coating, while high purity zinc was used as a facsimile of the β-phase of the
coating. All experiments were conducted using BME’s to better represent the
diffusion behaviour of the micron sized phases in the coating.
This polarisation data is used as a foundation for Chapter 4, where galvanic
couple experiments, generation-detection type experiments and localised pH
sensing techniques were used in conjunction with BME array electrodes to
28
probe the interaction between the α- and β-phases of the coating. This chapter
focuses on the bare corrosion behaviour of 55% Al-Zn coated steel and the
effect of proximity of the α- and β-phases on their galvanic interaction.
Chapter 5 progresses with the use of BME arrays as models for the cut edge
corrosion cell. Herein, the galvanic interaction of the coating and its phases with
steel is investigated. The influence of Zn2+ and Al3+ metal ions on the steel and
hydroxide generation on the metal coating and its phases is a major theme. The
pH was found to significantly affect the behaviour of the steel and the metal
coating and localised pH sensing is prominently used.
The final experimental chapter (Chapter 6) pertains to a series of Al-x% Zn
binary alloys (x=2, 10, 30, 40) produced with a solid solution microstructure. The
ability of these alloys to galvanically protect steel was measured, particularly in
low chloride electrolytes. XPS and EIS investigations were used extensively to
probe the composition of the passive film on the surface of these alloys. Finally,
a conceptual model of the passive film on Al-Zn alloys is proposed which aligns
with all the experimental data presented in this thesis.

Chapter 2 | Experimental
29
2.1 INTRODUCTION
In this chapter, the experimental detail for the work in this thesis is described.
This chapter is divided into sections based on the relevance to each of the
chapters containing experimental data (Chapters 3 to 6).
2.2 EXPERIMENTAL
2.2.1 All Chapters: Materials and synthesis of model Al-Zn alloys
Al-x% Zn alloys (x=2, 10, 30, 40) were prepared by melting high purity Al and
Zn at 600 °C and casting into cylindrical ingots of ca. 25 mm diameter and 70
mm long. The ingots were heat treated at 450°C for six hours and quenched in
water (ambient temperature). To prepare foils of the alloys, the ingots were cut
to a rectangular blocks which were hot-rolled down to ca. 500-1000 μm sheet.
Hot-rolling was preferred over cold rolling on account of less cracking. For some
experiments, discs were punched from the 500-1000 μm sheet. Foils were
produced from the 500 – 1000 µm sheet by hot rolling down to 50 µm thick.
Analysis of the composition of these alloys was conducted by inductively
coupled plasma atomic adsorption spectroscopy. Analysis results
(%mass/mass) on Al-40% Zn were: Al 59.4, Zn 40.4, Si 0.02, Fe 0.06, V 0.009
and Ti, Mg, Cr, Zr, B all <0.005.
Homogenisation of the microstructure was achieved by further heat-treating the
samples at 400 ºC for one hour and quenching in water. This temperature is the
middle of the α-Al phase region of the binary phase diagram for compositions
up to ca. 70 wt% zinc (Figure 2.1). The microstructure of the foils was
characterised using a Hitachi S3400-N scanning electron microscope (SEM).
High purity Zn (99.99%) and Al (99.999%) foils used for polarisation
experiments were obtained from Goodfellow. Foils of the 55% Al-Zn coating
were supplied by BlueScope steel. This material was obtained from a
continuous coating line operating under the undesirable condition where the
oxide film on the steel base prevents adhesion of the metal coating. This
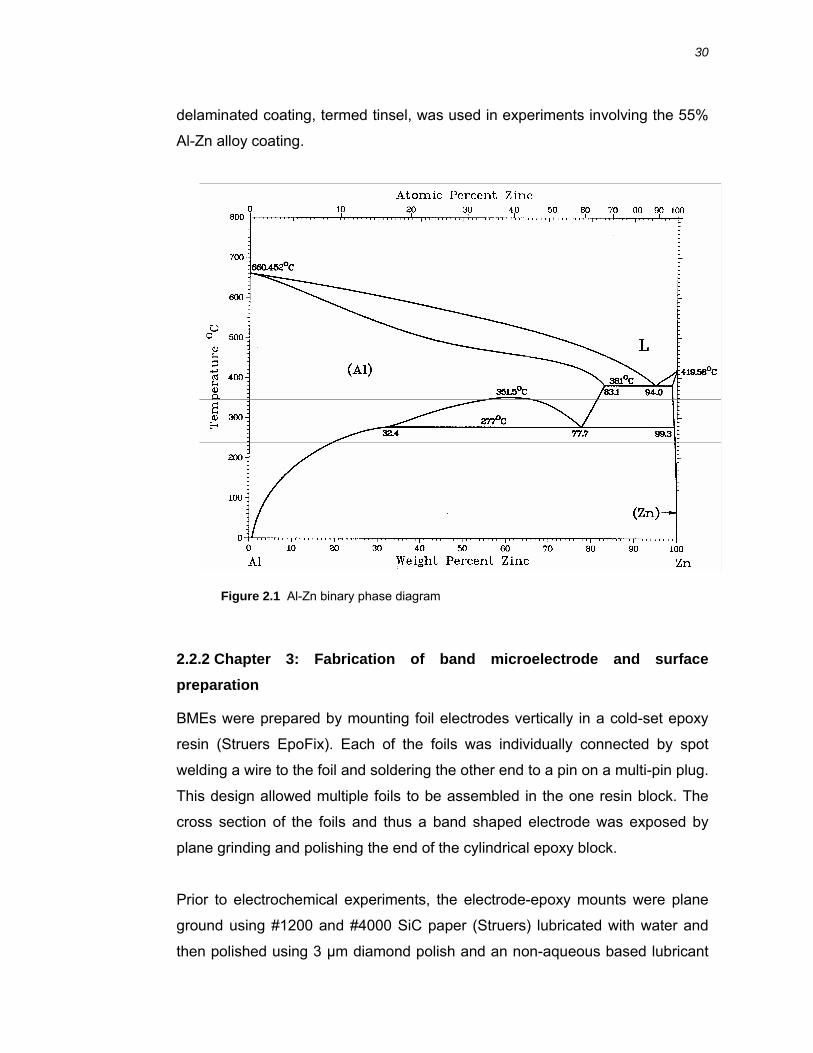
30
delaminated coating, termed tinsel, was used in experiments involving the 55%
Al-Zn alloy coating.
2.2.2 Chapter 3: Fabrication of band microelectrode and surface preparation
BMEs were prepared by mounting foil electrodes vertically in a cold-set epoxy
resin (Struers EpoFix). Each of the foils was individually connected by spot
welding a wire to the foil and soldering the other end to a pin on a multi-pin plug.
This design allowed multiple foils to be assembled in the one resin block. The
cross section of the foils and thus a band shaped electrode was exposed by
plane grinding and polishing the end of the cylindrical epoxy block.
Prior to electrochemical experiments, the electrode-epoxy mounts were plane
ground using #1200 and #4000 SiC paper (Struers) lubricated with water and
then polished using 3 μm diamond polish and an non-aqueous based lubricant
Figure 2.1 Al-Zn binary phase diagram
31
(Struers, Yellow). The polished surface was cleaned with ethanol, dried with a
tissue and left for 10 minutes in air at ambient prior to experiments. Polishing
was necessary for BME’s as the coarser grinding processes smeared the
bands, artificially increasing their surface area.
2.2.3 Chapter 3: Electrochemical polarisation experiments
The bulk of the electrochemical measurements reported in this thesis were
made using multiple channel VSP and VMP3 potentiostats (Biologic Science
Instruments, France). All potentials reported in this thesis are referenced to the
3.5 M Ag|AgCl reference electrode which has a formal potential E0 = +0.205 V
vs the standard hydrogen electrode.89
Potentiodynamic polarisation experiments reported in Chapter 3 were
conducted in 0.1 M Na2SO4, 0.1 M NaCl and a mixture of 0.0265 M (NH4)2SO4
and 0.00856 M NaCl, commonly known as dilute Harrison’s solution (DHS). AR
grade reagents were used for all electrolytes (Sigma Aldrich). Neutral Na2SO4
and NaCl solutions had a pH between 6.0 and 6.5, while DHS had a pH
between 5.0 and 5.5. Concentrated H2SO4 and HCl were used to adjust the pH
of electrolytes to pH 4 and NaOH to adjust the pH to 10. Air was bubbled
through the electrolytes for at least twenty minutes prior to the start of
experiments to ensure aeration. Electrolytes were otherwise unbuffered. Prior to
the potential sweep experiment, the working electrode was left for ten minutes
at open circuit, and then the potential swept at a rate of 1.667 mV sec-1. A
cathodic sweep of the potential involved polarisation from +0.015 V versus OCP
to -1.5 or -1.8 V, an anodic sweep of the potential from -0.015 V versus OCP to
-0.7 V. Different from the above mentioned “single sided” potentiodynamic
experiment, a traditional full sweep of the potential ranged from -1.5 V (-1.8 V at
pH 10) to -0.5 V. Polarisation data were repeated 3 to 10 times on multiple
BMEs simultaneously using the NSTAT mode of the Biologic Science
instruments. The NSTAT mode allows multiple working electrodes in a single
cell with common reference and platinum counter electrodes. Where possible,
the corrosion current (Icorr) was calculated by extrapolating the Tafel slopes from
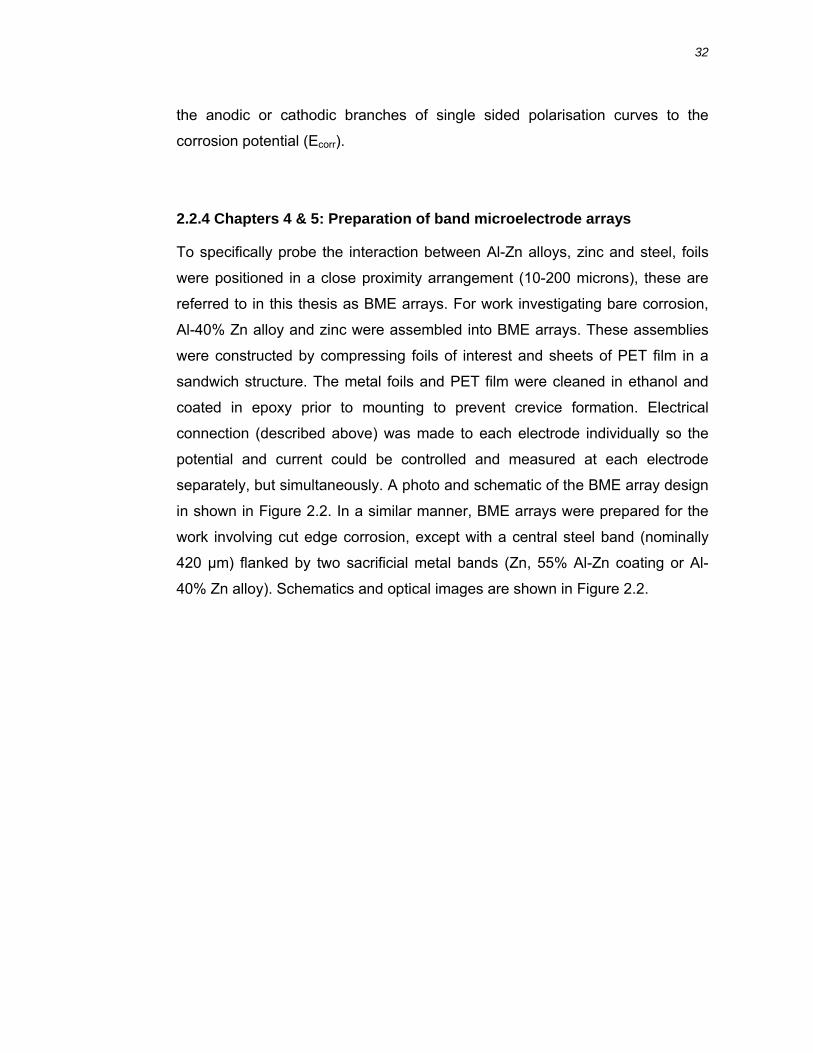
32
the anodic or cathodic branches of single sided polarisation curves to the
corrosion potential (Ecorr).
2.2.4 Chapters 4 & 5: Preparation of band microelectrode arrays
To specifically probe the interaction between Al-Zn alloys, zinc and steel, foils
were positioned in a close proximity arrangement (10-200 microns), these are
referred to in this thesis as BME arrays. For work investigating bare corrosion,
Al-40% Zn alloy and zinc were assembled into BME arrays. These assemblies
were constructed by compressing foils of interest and sheets of PET film in a
sandwich structure. The metal foils and PET film were cleaned in ethanol and
coated in epoxy prior to mounting to prevent crevice formation. Electrical
connection (described above) was made to each electrode individually so the
potential and current could be controlled and measured at each electrode
separately, but simultaneously. A photo and schematic of the BME array design
in shown in Figure 2.2. In a similar manner, BME arrays were prepared for the
work involving cut edge corrosion, except with a central steel band (nominally
420 µm) flanked by two sacrificial metal bands (Zn, 55% Al-Zn coating or Al-
40% Zn alloy). Schematics and optical images are shown in Figure 2.2.
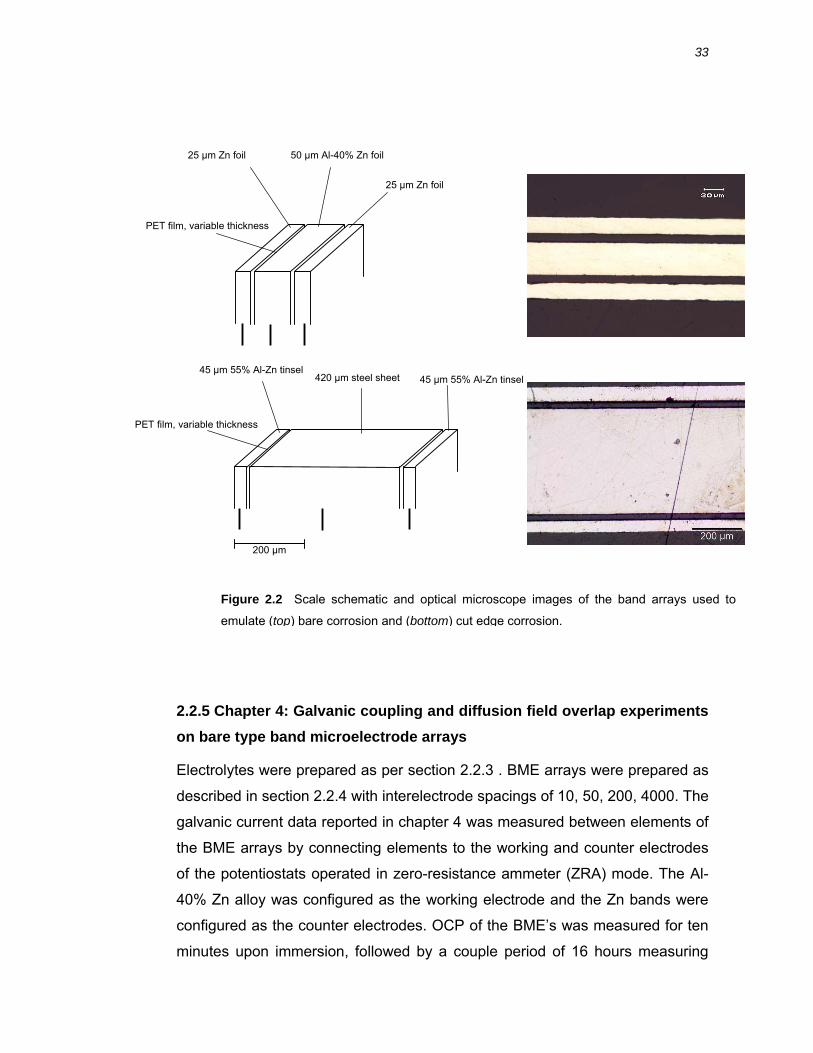
33
2.2.5 Chapter 4: Galvanic coupling and diffusion field overlap experiments on bare type band microelectrode arrays
Electrolytes were prepared as per section 2.2.3 . BME arrays were prepared as
described in section 2.2.4 with interelectrode spacings of 10, 50, 200, 4000. The
galvanic current data reported in chapter 4 was measured between elements of
the BME arrays by connecting elements to the working and counter electrodes
of the potentiostats operated in zero-resistance ammeter (ZRA) mode. The Al-
40% Zn alloy was configured as the working electrode and the Zn bands were
configured as the counter electrodes. OCP of the BME’s was measured for ten
minutes upon immersion, followed by a couple period of 16 hours measuring
Figure 2.2 Scale schematic and optical microscope images of the band arrays used to
emulate (top) bare corrosion and (bottom) cut edge corrosion.
25 µm Zn foil
25 µm Zn foil 50 µm Al-40% Zn foil
PET film, variable thickness
PET film, variable thickness
420 µm steel sheet 45 µm 55% Al-Zn tinsel
45 µm 55% Al-Zn tinsel
200 µm
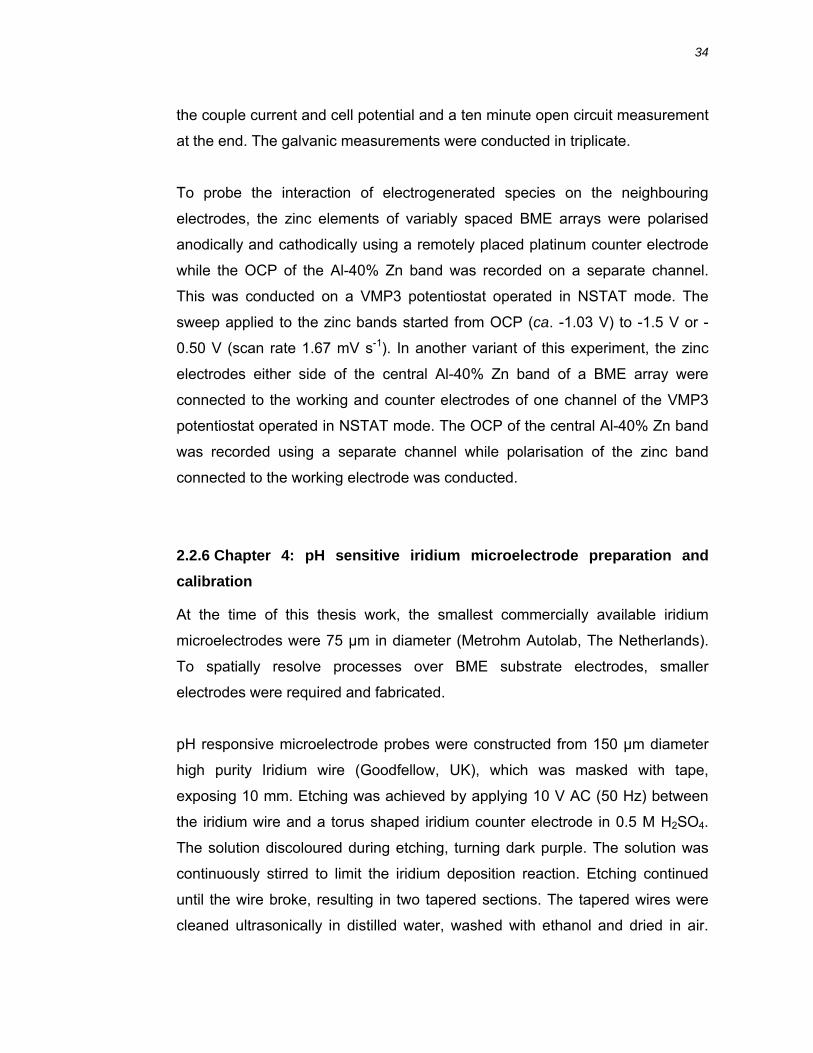
34
the couple current and cell potential and a ten minute open circuit measurement
at the end. The galvanic measurements were conducted in triplicate.
To probe the interaction of electrogenerated species on the neighbouring
electrodes, the zinc elements of variably spaced BME arrays were polarised
anodically and cathodically using a remotely placed platinum counter electrode
while the OCP of the Al-40% Zn band was recorded on a separate channel.
This was conducted on a VMP3 potentiostat operated in NSTAT mode. The
sweep applied to the zinc bands started from OCP (ca. -1.03 V) to -1.5 V or -
0.50 V (scan rate 1.67 mV s-1). In another variant of this experiment, the zinc
electrodes either side of the central Al-40% Zn band of a BME array were
connected to the working and counter electrodes of one channel of the VMP3
potentiostat operated in NSTAT mode. The OCP of the central Al-40% Zn band
was recorded using a separate channel while polarisation of the zinc band
connected to the working electrode was conducted.
2.2.6 Chapter 4: pH sensitive iridium microelectrode preparation and calibration
At the time of this thesis work, the smallest commercially available iridium
microelectrodes were 75 µm in diameter (Metrohm Autolab, The Netherlands).
To spatially resolve processes over BME substrate electrodes, smaller
electrodes were required and fabricated.
pH responsive microelectrode probes were constructed from 150 µm diameter
high purity Iridium wire (Goodfellow, UK), which was masked with tape,
exposing 10 mm. Etching was achieved by applying 10 V AC (50 Hz) between
the iridium wire and a torus shaped iridium counter electrode in 0.5 M H2SO4.
The solution discoloured during etching, turning dark purple. The solution was
continuously stirred to limit the iridium deposition reaction. Etching continued
until the wire broke, resulting in two tapered sections. The tapered wires were
cleaned ultrasonically in distilled water, washed with ethanol and dried in air.
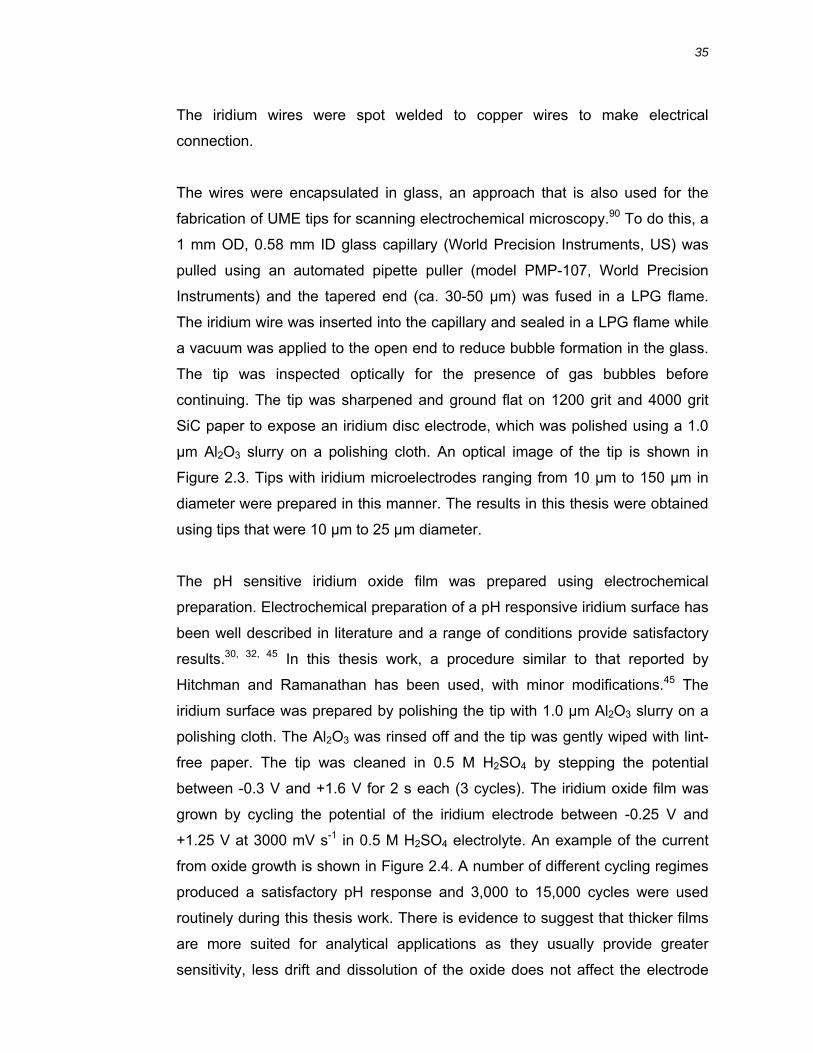
35
The iridium wires were spot welded to copper wires to make electrical
connection.
The wires were encapsulated in glass, an approach that is also used for the
fabrication of UME tips for scanning electrochemical microscopy.90 To do this, a
1 mm OD, 0.58 mm ID glass capillary (World Precision Instruments, US) was
pulled using an automated pipette puller (model PMP-107, World Precision
Instruments) and the tapered end (ca. 30-50 µm) was fused in a LPG flame.
The iridium wire was inserted into the capillary and sealed in a LPG flame while
a vacuum was applied to the open end to reduce bubble formation in the glass.
The tip was inspected optically for the presence of gas bubbles before
continuing. The tip was sharpened and ground flat on 1200 grit and 4000 grit
SiC paper to expose an iridium disc electrode, which was polished using a 1.0
µm Al2O3 slurry on a polishing cloth. An optical image of the tip is shown in
Figure 2.3. Tips with iridium microelectrodes ranging from 10 µm to 150 µm in
diameter were prepared in this manner. The results in this thesis were obtained
using tips that were 10 µm to 25 µm diameter.
The pH sensitive iridium oxide film was prepared using electrochemical
preparation. Electrochemical preparation of a pH responsive iridium surface has
been well described in literature and a range of conditions provide satisfactory
results.30, 32, 45 In this thesis work, a procedure similar to that reported by
Hitchman and Ramanathan has been used, with minor modifications.45 The
iridium surface was prepared by polishing the tip with 1.0 µm Al2O3 slurry on a
polishing cloth. The Al2O3 was rinsed off and the tip was gently wiped with lint-
free paper. The tip was cleaned in 0.5 M H2SO4 by stepping the potential
between -0.3 V and +1.6 V for 2 s each (3 cycles). The iridium oxide film was
grown by cycling the potential of the iridium electrode between -0.25 V and
+1.25 V at 3000 mV s-1 in 0.5 M H2SO4 electrolyte. An example of the current
from oxide growth is shown in Figure 2.4. A number of different cycling regimes
produced a satisfactory pH response and 3,000 to 15,000 cycles were used
routinely during this thesis work. There is evidence to suggest that thicker films
are more suited for analytical applications as they usually provide greater
sensitivity, less drift and dissolution of the oxide does not affect the electrode
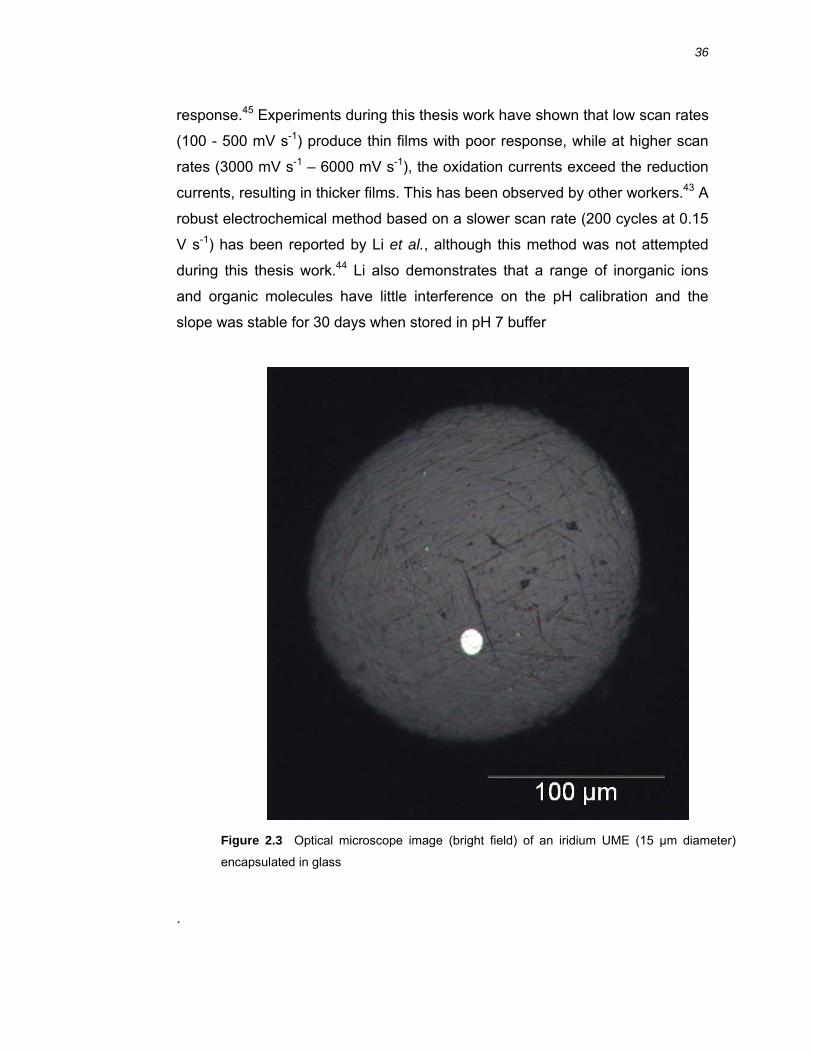
36
response.45 Experiments during this thesis work have shown that low scan rates
(100 - 500 mV s-1) produce thin films with poor response, while at higher scan
rates (3000 mV s-1 – 6000 mV s-1), the oxidation currents exceed the reduction
currents, resulting in thicker films. This has been observed by other workers.43 A
robust electrochemical method based on a slower scan rate (200 cycles at 0.15
V s-1) has been reported by Li et al., although this method was not attempted
during this thesis work.44 Li also demonstrates that a range of inorganic ions
and organic molecules have little interference on the pH calibration and the
slope was stable for 30 days when stored in pH 7 buffer
.
Figure 2.3 Optical microscope image (bright field) of an iridium UME (15 µm diameter)
encapsulated in glass
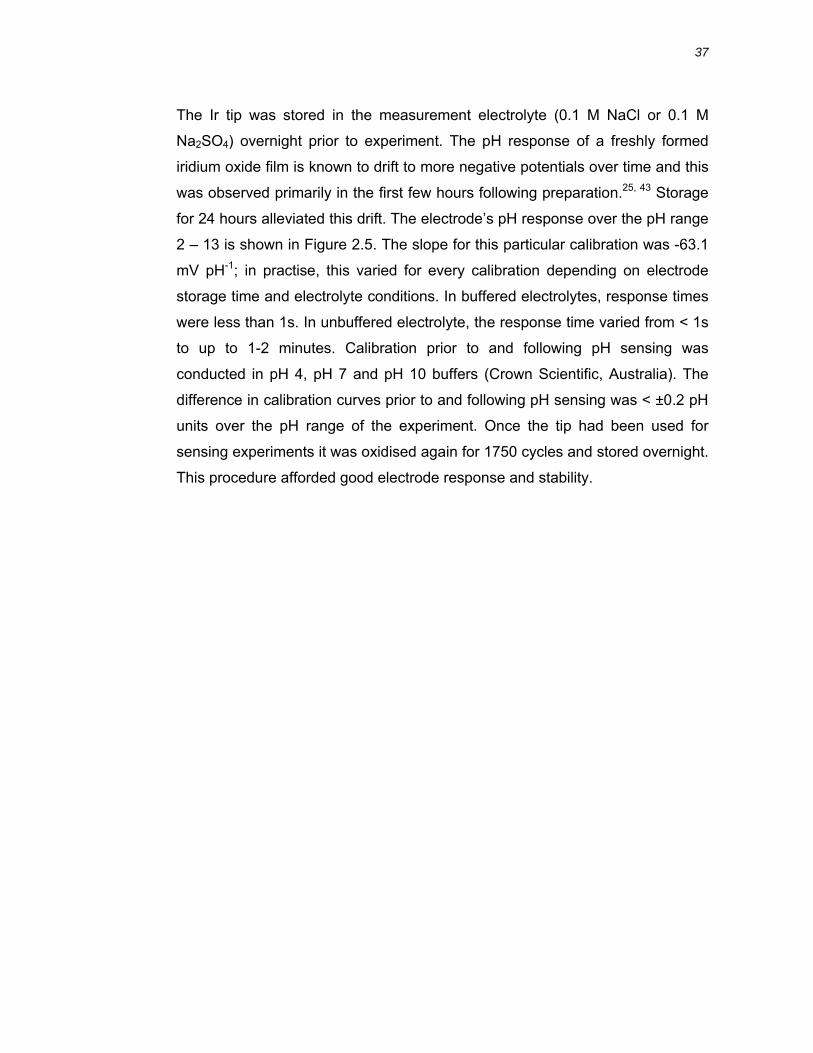
37
The Ir tip was stored in the measurement electrolyte (0.1 M NaCl or 0.1 M
Na2SO4) overnight prior to experiment. The pH response of a freshly formed
iridium oxide film is known to drift to more negative potentials over time and this
was observed primarily in the first few hours following preparation.25, 43 Storage
for 24 hours alleviated this drift. The electrode’s pH response over the pH range
2 – 13 is shown in Figure 2.5. The slope for this particular calibration was -63.1
mV pH-1; in practise, this varied for every calibration depending on electrode
storage time and electrolyte conditions. In buffered electrolytes, response times
were less than 1s. In unbuffered electrolyte, the response time varied from < 1s
to up to 1-2 minutes. Calibration prior to and following pH sensing was
conducted in pH 4, pH 7 and pH 10 buffers (Crown Scientific, Australia). The
difference in calibration curves prior to and following pH sensing was < ±0.2 pH
units over the pH range of the experiment. Once the tip had been used for
sensing experiments it was oxidised again for 1750 cycles and stored overnight.
This procedure afforded good electrode response and stability.
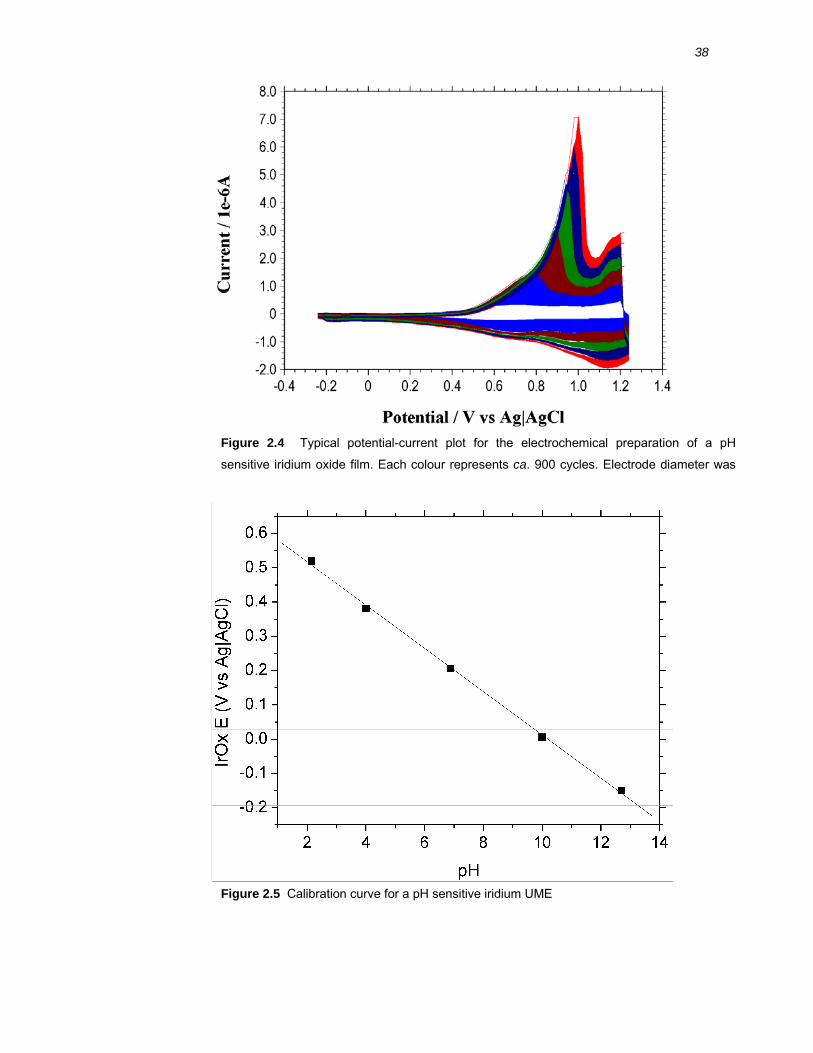
38
Figure 2.4 Typical potential-current plot for the electrochemical preparation of a pH
sensitive iridium oxide film. Each colour represents ca. 900 cycles. Electrode diameter was
Figure 2.5 Calibration curve for a pH sensitive iridium UME

39
2.2.7 Chapter 4: Near surface pH sensing
pH sensing experiments were conducted in situ with electrochemical
polarisation over Al-40% Zn BME’s. To do this, BME’s mounted in epoxy were
installed into a custom made holder fitted to a commercial scanning
electrochemical microscope (model 900B, CH Instruments, USA). The substrate
electrode was connected to the working lead of a potentiostat (model 263A,
PAR) while a Pt counter and Ag|AgCl reference electrode completed the cell.
The potential of the iridium tip was measured against a separate reference
electrode with a portable, battery operated pH meter (Hanna Instruments). The
floating ground of the handheld pH meter was required to avoid interference
with the potentiostat circuit. Prior to filling the cell, the tip position relative to the
substrate was determined with the aid of a stereomicroscope. The tip was
retracted, the cell was filled with electrolyte and the tip potential was recorded
during an equilibration period of five minutes.
Lateral pH profiles over cathodically polarised Zn BME’s were obtained by
positioning the tip 50 µm off the surface of the epoxy resin at 3000 µm away
from the band. The Zn BME was polarised to -1.15 V and -1.40 V in separate
experiments while the pH was recorded as the tip was brought closer to the
band.
Near surface pH measurements over polarised Al-40% Zn alloy and over
galvanically coupled BME array as follows. The Al-40% Zn alloy was polarised
anodically or cathodically (± 200 mV) while the iridium tip was retracted. After
10 minutes of polarisation and the substrate current was stable, the tip was
positioned 50 µm from the surface of the alloy and the pH recorded. The tip was
retracted and relocated to another site. Ten sites were measured in this
manner. This same measurement regime was conducted over the Al-40% Zn
element of a triband Zn | Al-40% Zn | Zn BME array during galvanic coupling.
40
2.2.8 Chapter 5: Galvanic coupling and simultaneous polarisation experiment of cut-edge type band microelectrode arrays
BME arrays were prepared in the manner described in section 2.2.4 (see also
Figure 2.2). A central steel band was sandwiched between a pair of BME’s of
Zn, 55% Al-Zn metal coating or Al-40% Zn alloy and separated by 10 µm using
PET. The BME widths were:
Zn, Fe, Zn: 49 , 420 and 49 µm
55% Al-Zn | steel | 55% Al-Zn: 41, 421 and 41 µm
Al-40% Zn | steel | Al-40% Zn: 67.5, 425 and 67.5 µm
The ratios of the steel to sacrificial metal were 4.3, 5.1 and 3.1 for Zn, 55% Al-
Zn metal coating and Al-40% Zn alloy respectively, simulating the surface area
of a painted cut edge where light gauge and high strength grade steel may be
used.
The galvanic current data reported in chapter 5 were measured between
elements of the BME arrays by connecting the steel to the working and the
sacrificial metal coating to the counter electrodes of the potentiostat (VMP3,
Bio-logic Science Instruments, France) operated in ZRA mode. 0.1 M Na2SO4
and 0.1 M NaCl electrolytes were prepared and used as described in section
2.2.3. OCP’s of the BME elements were measured for ten minutes upon
immersion followed by a couple period of 16 hours measuring the couple
current and cell potential and a ten minute open circuit measurement at the end.
The galvanic measurements were conducted in triplicate.
Simultaneous polarisation experiments were performed on the BME array using
a VMP3 model multichannel potentiostat (Bio-logic) operated in NSTAT mode
employing common reference and counter electrodes. The steel electrode was
the working electrode of one channel, while the zinc, Al-40% Zn alloy or 55% Al-
Zn metal coating bands were connected as the working electrode of a second
channel. Prior to polarisation, the OCP’s of the steel and metal coating were
measured for one minute. Identical potential sweeps were applied to the steel
and metal coating bands simultaneously. The starting potential was selected so

41
that the steel and metal coatings were both cathodic and the potential was
scanned at 1.66 mV min-1 to a final potential of –0.5 V vs the reference.
2.2.9 Chapter 5: pH mapping and vertical pH profiles over steel
Preparation and calibration of a pH sensitive Ir microelectrode is described in
section 2.2.6. The apparatus used for the pH mapping experiments in Chapter 5
was identical to that described in section 2.2.7. BME arrays containing steel
with Zn or Al-40% Zn alloy were used. The elements of the arrays were
galvanically coupled and the cell was filled with the tip retracted from the
surface. The galvanic current and potential were recorded for 10 minutes to
ensure a steady state was obtained. The tip was then positioned 50 µm off the
surface of the epoxy at a site 450 µm laterally from the centre of the band. The
pH was recorded after the potential stabilised (<1 mV min-1) and the tip was
stepped in 100 µm increments, perpendicular to the BME array for a distance of
900 µm so that the array was positioned in the centre of the line scan. Upon
completion of a line, the tip was moved 200 µm parallel to the BME array
direction and another row was completed in the opposing direction to the first.
This raster pattern was completed to produce a 10 x 10 pH map 900 µm x 1800
µm. The time taken to complete each map was 15 to 30 minutes.
Vertical pH profiles over cathodically polarised steel were recorded in the same
manner as described in section 2.2.7 The electrolytes used were: aerated,
unbuffered, 0.1 M NaCl at neutral pH and adjusted to pH 3.5 with HCl; aerated,
unbuffered 0.1 M NaCl with 10 mM of AlCl3 added; and aerated, unbuffered 0.1
M NaCl with 10mM ZnCl2 added. The steel was polarised to -1.0 V while the
vertical pH was recorded by stepping the tip towards the surface from 2000 µm
to 50 µm in 50 µm increments. In the electrolyte with 10 mM ZnCl2 added, -0.90
V was used instead of -1.0 V to eliminate the Zn2+ reduction reaction.
42
2.2.10 Chapter 6: Open circuit transients and electrochemical polarisation of variable composition Al-Zn alloys
BME’s Al-x% Zn were prepared and electrochemical polarisation experiments
were conducted in a manner as described in sections 2.2.1 to 2.2.3
Galvanic coupling experiments of BME arrays composed of Al-x% Zn alloys and
steel were conducted in the same was as described in section 2.2.8 with the
exception that electrolytes were prepared as mixtures of NaCl and Na2SO4. The
concentrations prepared were: 1 mM Cl-; 1 mm Cl- + 99 mM SO42-;10 mM Cl-
10 mm Cl- + 90 mM SO42-; 50 mM Cl-; 50 mm Cl- + 50 mM SO4
2-; and 100 mM
Cl-.
2.2.11 Chapter 6: Electrochemical impedance spectroscopy of variable composition Al-Zn alloys
Macrodiscs (rather than BME’s) of Al-x% Zn (x = 2, 10, 30, 40) alloys used for
interrogation of the passive film using electrochemical impedance spectroscopy
(EIS). This was done so that XPS data could be obtained on the same
electrodes as the EIS results were obtained. 10 mm diameter discs of Al-Zn
alloys were punched from strip that had been fabricated and rolled down to
1000 µm thick sheet as described in 2.2.1 These were solution heat treated at
400 ºC for 90 minutes and quenched in water.
The surface was prepared by hand grinding on P1200 grit, followed by P4000
grit SiC papers using water as lubricant. 3µm diamond polish on a nylon pad
(Struers DAC pad) using an ethanol based lubricant (Struers, Yellow Lubricant)
was used to polish the surface prior to measurement. The surface of the discs
were masked with adhesive backed PET film to expose a disc of 2.75 mm
diameter (area = 5.94 mm2). The samples were left at ambient for 10 minutes
prior to polarisation.
The OCP of the electrodes was recorded for 10 minutes then an anodic
polarisation of +100 mV vs OCP was applied. After 60 s, while maintaining +100
43
mV overpotential, a sinusoidal potential perturbation of 10 mV amplitude was
applied from 200 kHz to 50 mHz from high to low frequency. Data spacing was
six frequencies per decade (log spacing), measuring and averaging 3 data sets
per frequency.
2.2.12 Chapter 6: X-ray photoelectron spectroscopy of variable composition Al-Zn alloys
10 mm diameter discs (1000 µm thick) of Al-x% Zn (x = 2, 10, 30, 40) were
prepared for X-ray photoelectron spectroscopy (XPS). Samples were ground
and polished according to section 2.2.2. Some samples were polarised
anodically at +100 mV vs OCP for 20 minutes in 0.1 M NaCl and 0.1 M Na2SO4
electrolytes. Following polarisation they were washed in distilled water by
immersion and dried under a stream of nitrogen. All samples were stored in a
desiccator for 2 to 7 days prior to analysis.
XPS data were collected on two different instruments. The first was a Physical
Electronics instrument fitted with a CMA analyser (Physical Electronics PHI-
550) at a pass energy of 100 eV using a source equipped with a Mg Anode (Mg
Kα = 1253.6 eV). Sputtering was carried out using a static ion source (Physical
Electronics) at a chamber pressure of 4.5 x 10⁻⁵ Torr argon, with 5 keV beam
energy and a filament current of 20 mA. The beam was rastered over an area of
approximately 6 x 6 mm. Data were collected using cycles of sputtering for 15
or 30 minutes, followed by re-establishing UHV and collecting an XPS scan.
Sputtering of a 200nm Ta2O5 film indicated a sputtering rate of 0.1 nm min-1.
This value is only an approximation and hence depth profiles in Chapter 6 are
presented with sputtering time, rather than depth, as the x-axis.
The second instrument was an ESCALAB250Xi (Thermo Scientific, UK) using a
source equipped with an Al Anode (Al Kα = 1486.68 eV) using a source power
of120 W (8.5 mA and 14.3 kV). Background vacuum was better than 1x10⁻⁹ Torr
Sputtering and analysis spot size was 400 µm. Sputtering of a 200 nm Ta2O5
film indicated a sputtering rate of 0.66 nm s-1. This value is also approximate.
44
Elemental composition was estimated by applying relative sensitivity factors to
the most intense electron emissions for each element, namely the Al(2s), O(1s)
and Zn(2p3/2) lines.91 The binding energy scale of the system (Physical
Electronics instrument) used to collect the data was 10 eV lower than the ‘true’
binding energy and the Al(2s) metal peak was observed at 106.6 eV (true =
117.9 eV); the O(1s) peak at 521.8 eV (true = 531.1 eV); and the Zn(2p3/2)
peak at 1011.8 eV (true = 1021.8 eV). A C(1s) peak was observed in the survey
spectrum for all samples prior to sputtering at 275.4 eV (true = 285 eV). The
L3M45M45 Auger electron peak for zinc was observed at 250.2 eV on the Al-
40% Zn alloys, resulting in a calculated Auger parameter of 2015.2 eV. The
calculated Auger parameter is the difference in energy between the XPS
emission line and the Auger peak, plus the energy of the incident photons (Mg
Kα = 1253.6 eV). The relative abundance of aluminium and oxidised aluminium
was estimated from the ratio of the Al(2s) peaks for each. Chemical species
containing Al in the +3 oxidation state, for example Al2O3 and Al(OH)3, have
similar binding energies and could not be differentiated.
Chapter 3 | Electrochemical polarisation
behaviour of Al, Zn and Al-40% Zn alloys
45
3.1 INTRODUCTION
One of the aims of this thesis was to synthesise an alloy resembling the
composition and microstructure of the dendritic α-phase of the 55% Al-Zn
coating and characterise it’s corrosion electrochemistry. The amount of zinc in
the α-phase varies spatially due to the solidification sequence of the coating,
resulting in higher zinc content closer to the interdendritic β-phases.3 In this
work, Al-40% Zn was the composition selected as a nominal composition for the
α-phase. The α-phase is a supersaturated solution of zinc in aluminium,
displaying fine zinc precipitates which coarsen over time. Reproduction of this
exact microstructure in an alloy is difficult, so Al-40% Zn alloy foils with two
different microstructures were prepared; a solid solution microstructure and as
well as one exhibiting extensive discontinuous zinc precipitation. The
electrochemical polarisation behaviour of these alloys is investigated in this
chapter.
To highlight electrochemical processes on the Al-Zn alloys that arise from the
component elements, the electrochemical polarisation curves of high purity
aluminium and high purity zinc were also recorded. The data for zinc is
additionally pertinent, as high purity zinc was used as a facsimile for the β-
phase of the 55% Al-Zn coating (which is ca. 95% Zn) and the interaction of the
β-phase with the α-phase is explored using BME arrays in Chapter 4.
One of the hypotheses underpinning this thesis work is that the production of
electrochemically generated products from an active site affects the
electrochemical corrosion behaviour of nearby sites. Chapter 4 and Chapter 5
involve using BME arrays to investigate this phenomenon for bare and cut edge
cells respectively. The BME and array geometries were selected as they allow
ease of fabrication, good control over the electrode size and array spacing, and
larger currents than microelectrodes of other geometries. With this in mind,
individual BMEs were used to conduct the electrochemical polarisation
experiments of Al-40% Zn alloys, aluminium and zinc that are presented in this
chapter. In addition to the advantages listed above, multiple electrodes could be
prepared in the same mount and tested simultaneously, increasing throughput.
46
Finally, using foils to fabricate BMEs allows significantly faster quenching rates
than ingots, which enabled preparation of a relatively stable solid solution
microstructure, something that was not possible otherwise.
A disadvantage of using BMEs for electrochemical polarisation work is that the
results must be carefully considered when comparing the data to that obtained
on a normal macro-sized electrode. Currents arising from processes where
diffusion is a contributing factor are enhanced on the BME, resulting in higher
current densities.
The composition of the electrolytes used for these studies was varied for both
pH and anion content. It is widely accepted that anion content and pH of an
environment or an electrolyte have a significant effect on the corrosion
mechanism and consequently the lifetime of material. NaCl and Na2SO4
electrolytes were used due to the ubiquitous distribution and often detrimental
presence of Cl- anions in marine environments and SO42- anions in industrial
environments. (NH4)2SO4 and NaCl mixtures are routinely employed as
corrosive electrolytes, so results of polarisation experiments in DHS (dilute
Harrison’s solution) are also presented in this chapter.
In summary, this chapter presents an account of the effect of microstructure,
anions and pH on the polarisation electrochemistry of Al-40% Zn alloys, high
purity aluminium and high purity zinc.
3.2 RESULTS
3.2.1 Microstructure of binary Al-40% Zn alloys
Three forms of the Al-40% Zn alloy were prepared: cast Al-40% Zn ingots,
rolled foils and rolled foils that had undergone heat treatment at 400 °C and
quenched. Backscattered SEM images of these three forms are shown in
Figure 3.1. The cast ingot, Figure 3.1 (a), may be described as having three
components, 1) a uniform phase that had a chemical composition of about Al-
20% Zn, 2) a regular but heterogeneous phase that had an average
47
composition about Al-40% Zn but contains small (<5 µm diameter) zinc rich
particles, and 3) irregularly distributed larger zinc rich particles that are greater
than 5 µm in diameter (none are present in Figure 3.1a). The partition of the
uniform and heterogeneous domains is about even. When rolled, these
domains are literally smashed together, resulting in a striated mixture of course
and fine discontinuous zinc rich precipitates (Figure 3.1b). These particles
varied in size from ca. 100 nm to 2 µm, most of which were around the later
size. The heat treatment and quench processes resulted in the microstructure
shown in Figure 3.1c, which is a supersaturated, quasi-solid solution of zinc in
aluminium. Some small (less than 100 nm and round in shape) precipitates
were scattered through the matrix. The heat treated form of the alloy most
resembles the microstructure of the α-phase of the 55% Al-Zn coating and is
used extensively throughout the rest of this thesis. The atomic arrangement of
this alloy is non equilibrium and thus metastable, decomposing over time (10-15
days at room temperature) into a two phase system unlike that observed in the
cast or rolled samples. Initially this manifested as very small zinc rich
precipitates 0.1 to 0.3 μm in diameter (some can be seen in Figure 3.1c),
generally localised to the boundaries of grains. The grains of the alloy were
observed to be around 20 μm to 30 μm in size. After twenty to thirty days a high
density of zinc rich precipitates up to 0.5 μm in length were observed to occupy
entire grains, while the majority of the remaining surface (about 70%) of the
band maintained a homogeneous dispersion of zinc in aluminium (Figure 3.2).
Electrochemical experiments involving the heat treated Al-40% Zn alloy were
conducted within 10 days of heat treatment to best capture the microstructure
that resembles the α-phase contained in a 55% Al-Zn coating (Figure 3.1c).
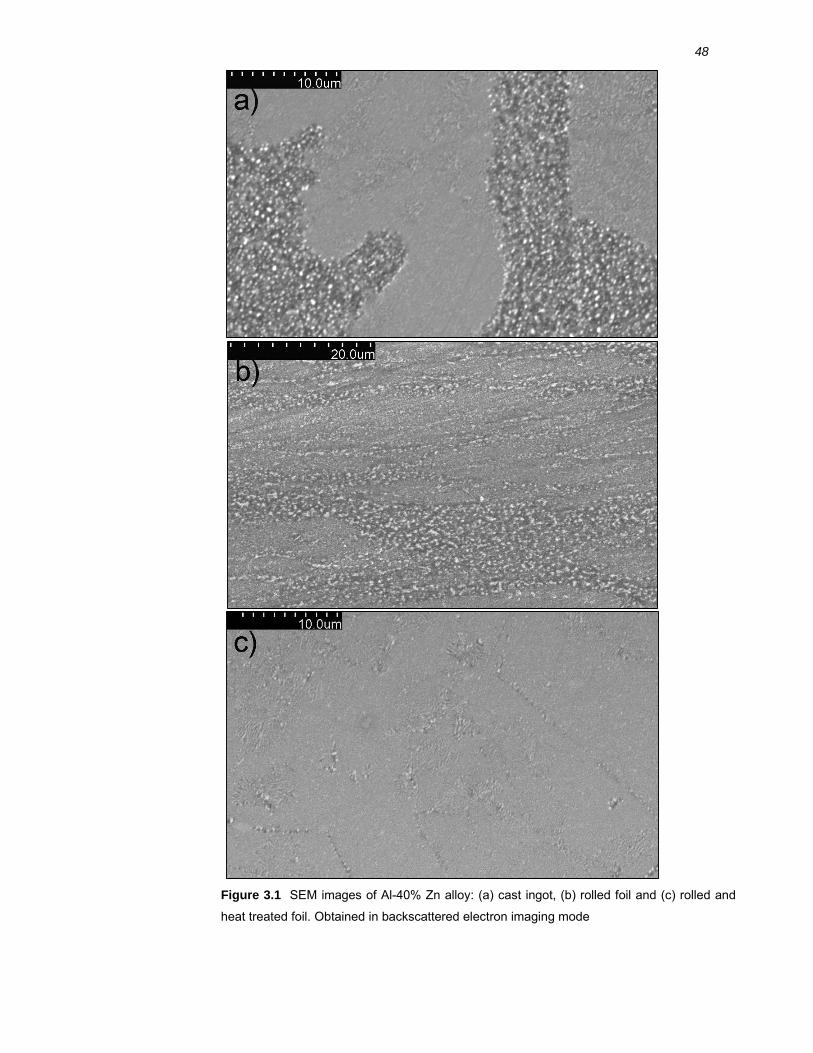
48
Figure 3.1 SEM images of Al-40% Zn alloy: (a) cast ingot, (b) rolled foil and (c) rolled and
heat treated foil. Obtained in backscattered electron imaging mode
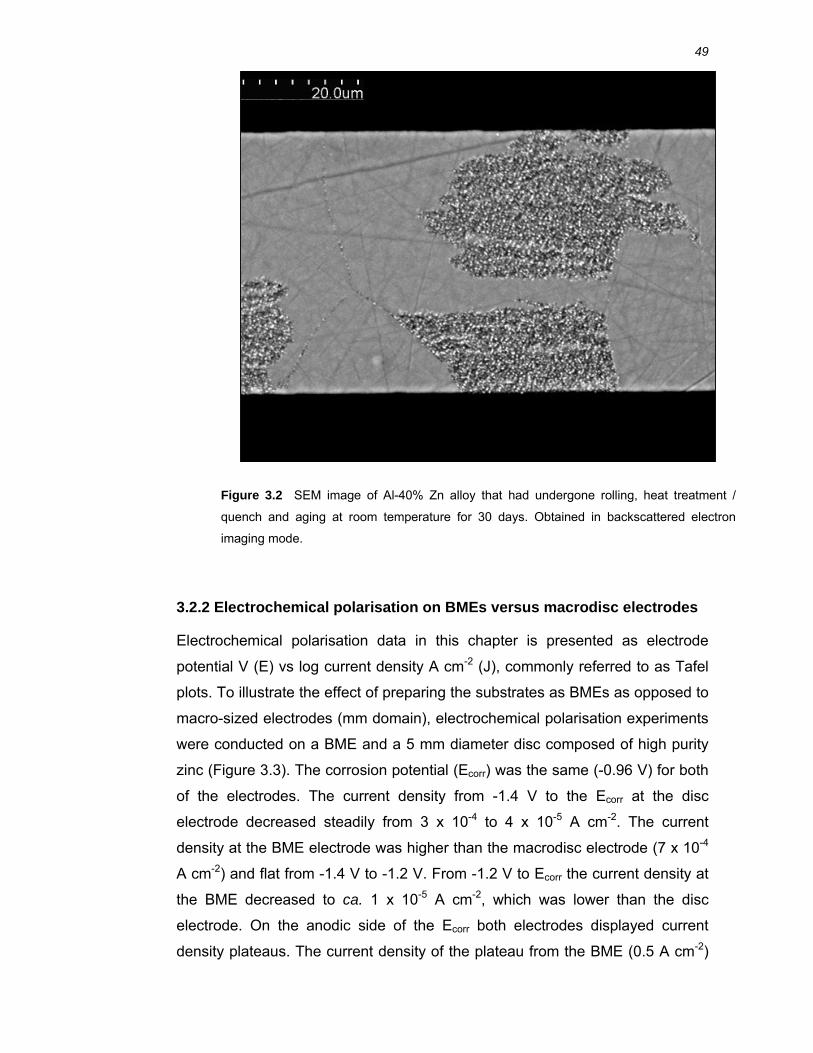
49
3.2.2 Electrochemical polarisation on BMEs versus macrodisc electrodes
Electrochemical polarisation data in this chapter is presented as electrode
potential V (E) vs log current density A cm-2 (J), commonly referred to as Tafel
plots. To illustrate the effect of preparing the substrates as BMEs as opposed to
macro-sized electrodes (mm domain), electrochemical polarisation experiments
were conducted on a BME and a 5 mm diameter disc composed of high purity
zinc (Figure 3.3). The corrosion potential (Ecorr) was the same (-0.96 V) for both
of the electrodes. The current density from -1.4 V to the Ecorr at the disc
electrode decreased steadily from 3 x 10⁻⁴ to 4 x 10⁻⁵ A cm-2. The current
density at the BME electrode was higher than the macrodisc electrode (7 x 10⁻⁴
A cm-2) and flat from -1.4 V to -1.2 V. From -1.2 V to Ecorr the current density at
the BME decreased to ca. 1 x 10⁻⁵ A cm-2, which was lower than the disc
electrode. On the anodic side of the Ecorr both electrodes displayed current
density plateaus. The current density of the plateau from the BME (0.5 A cm-2)
Figure 3.2 SEM image of Al-40% Zn alloy that had undergone rolling, heat treatment /
quench and aging at room temperature for 30 days. Obtained in backscattered electron
imaging mode.
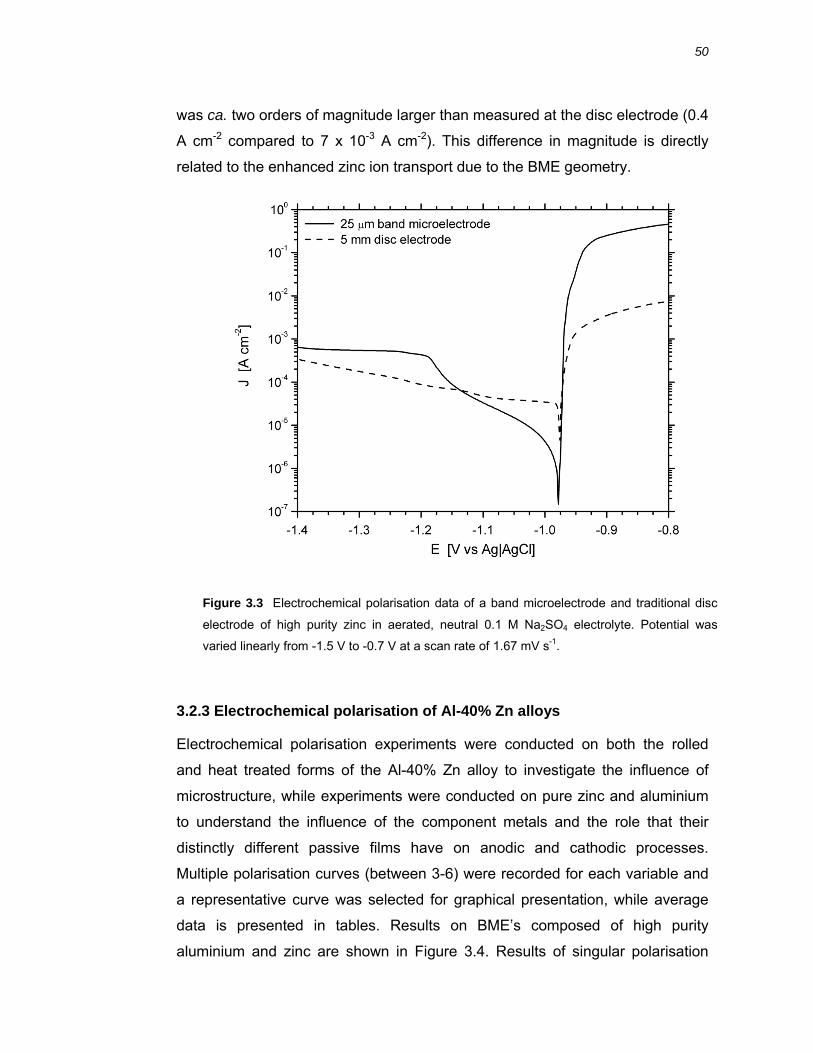
50
was ca. two orders of magnitude larger than measured at the disc electrode (0.4
A cm-2 compared to 7 x 10⁻³ A cm-2). This difference in magnitude is directly
related to the enhanced zinc ion transport due to the BME geometry.
3.2.3 Electrochemical polarisation of Al-40% Zn alloys
Electrochemical polarisation experiments were conducted on both the rolled
and heat treated forms of the Al-40% Zn alloy to investigate the influence of
microstructure, while experiments were conducted on pure zinc and aluminium
to understand the influence of the component metals and the role that their
distinctly different passive films have on anodic and cathodic processes.
Multiple polarisation curves (between 3-6) were recorded for each variable and
a representative curve was selected for graphical presentation, while average
data is presented in tables. Results on BME’s composed of high purity
aluminium and zinc are shown in Figure 3.4. Results of singular polarisation
Figure 3.3 Electrochemical polarisation data of a band microelectrode and traditional disc
electrode of high purity zinc in aerated, neutral 0.1 M Na2SO4 electrolyte. Potential was
varied linearly from -1.5 V to -0.7 V at a scan rate of 1.67 mV s-1.

51
experiments of BMEs constructed from heat treated and rolled Al-40% Zn alloys
at pH 4, neutral and pH 10 are shown in Figure 3.5, Figure 3.6 and Figure 3.7
respectively. Average Ecorr and Icorr values extracted from the electrochemical
polarisation data for all electrolytes and pH values are given in Tables 3.1 and
Table 3.2 respectively.
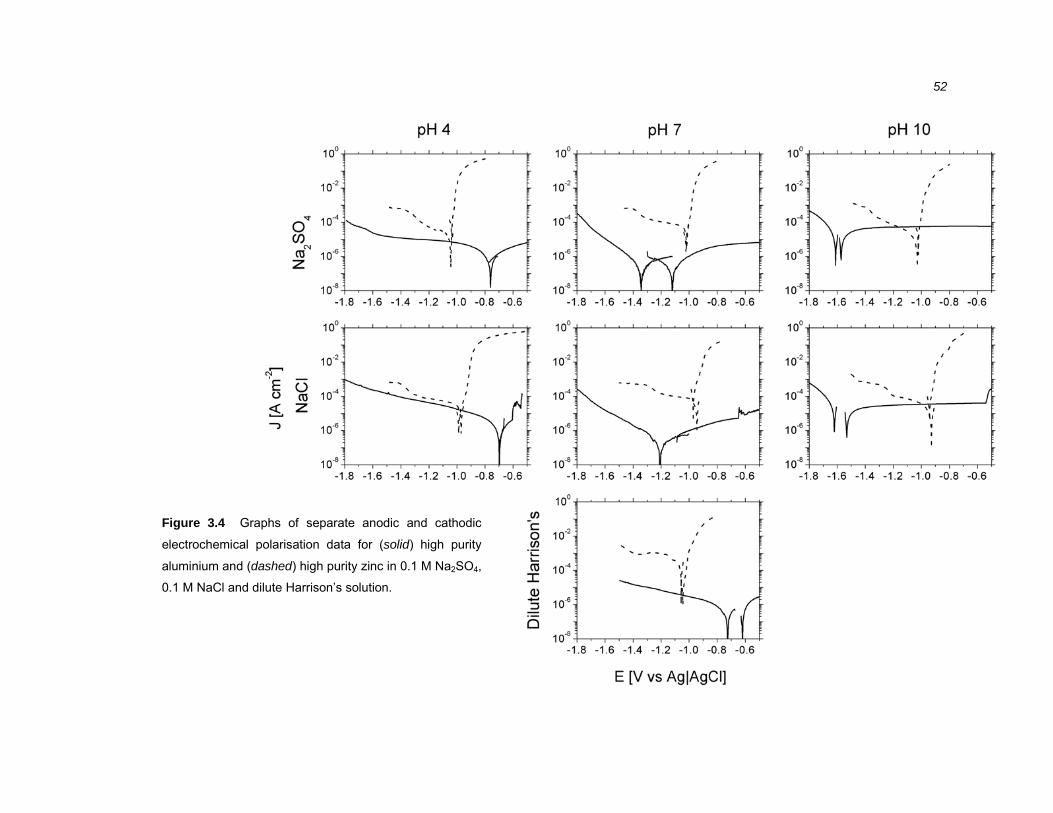
52
Figure 3.4 Graphs of separate anodic and cathodic
electrochemical polarisation data for (solid) high purity
aluminium and (dashed) high purity zinc in 0.1 M Na2SO4,
0.1 M NaCl and dilute Harrison’s solution.
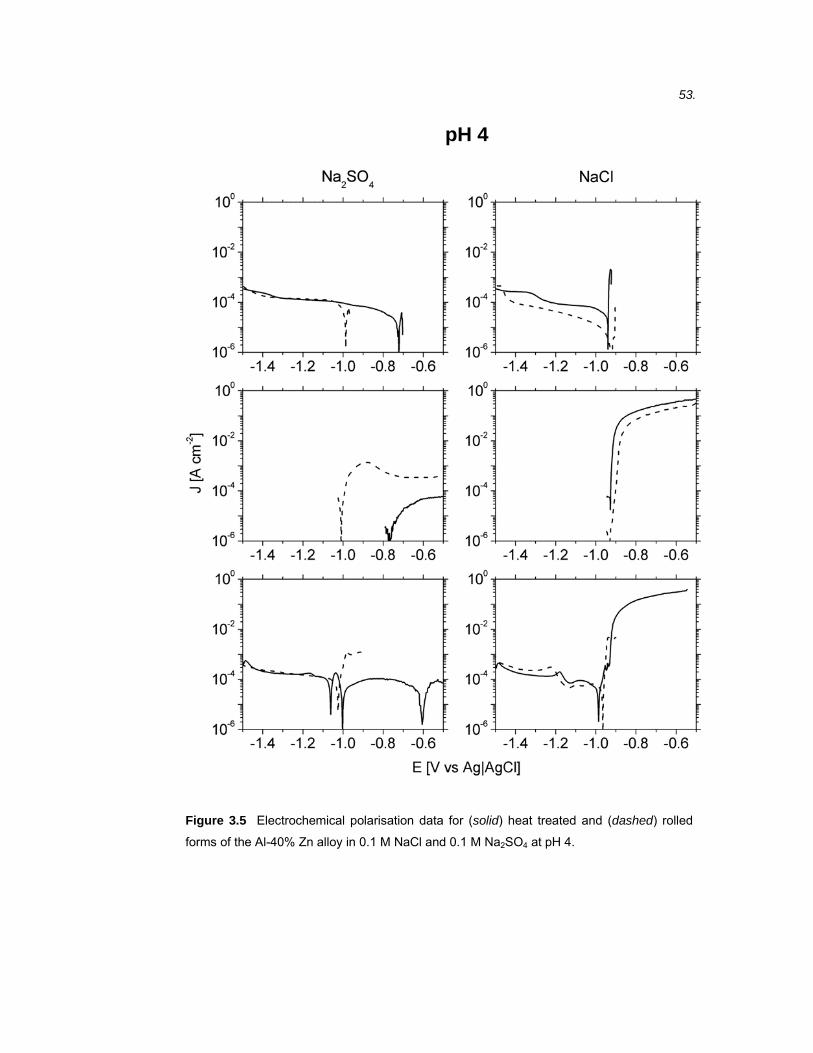
53.
Figure 3.5 Electrochemical polarisation data for (solid) heat treated and (dashed) rolled
forms of the Al-40% Zn alloy in 0.1 M NaCl and 0.1 M Na2SO4 at pH 4.
pH 4
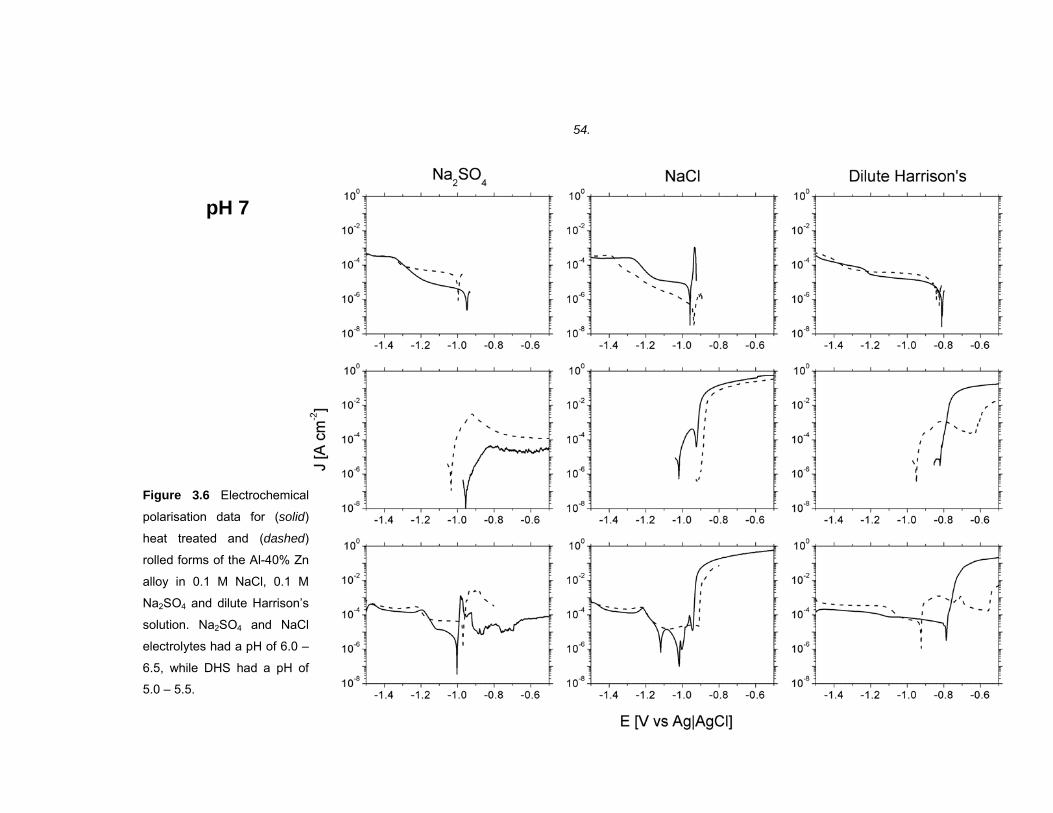
54.
Figure 3.6 Electrochemical
polarisation data for (solid)
heat treated and (dashed)
rolled forms of the Al-40% Zn
alloy in 0.1 M NaCl, 0.1 M
Na2SO4 and dilute Harrison’s
solution. Na2SO4 and NaCl
electrolytes had a pH of 6.0 –
6.5, while DHS had a pH of
5.0 – 5.5.
pH 7
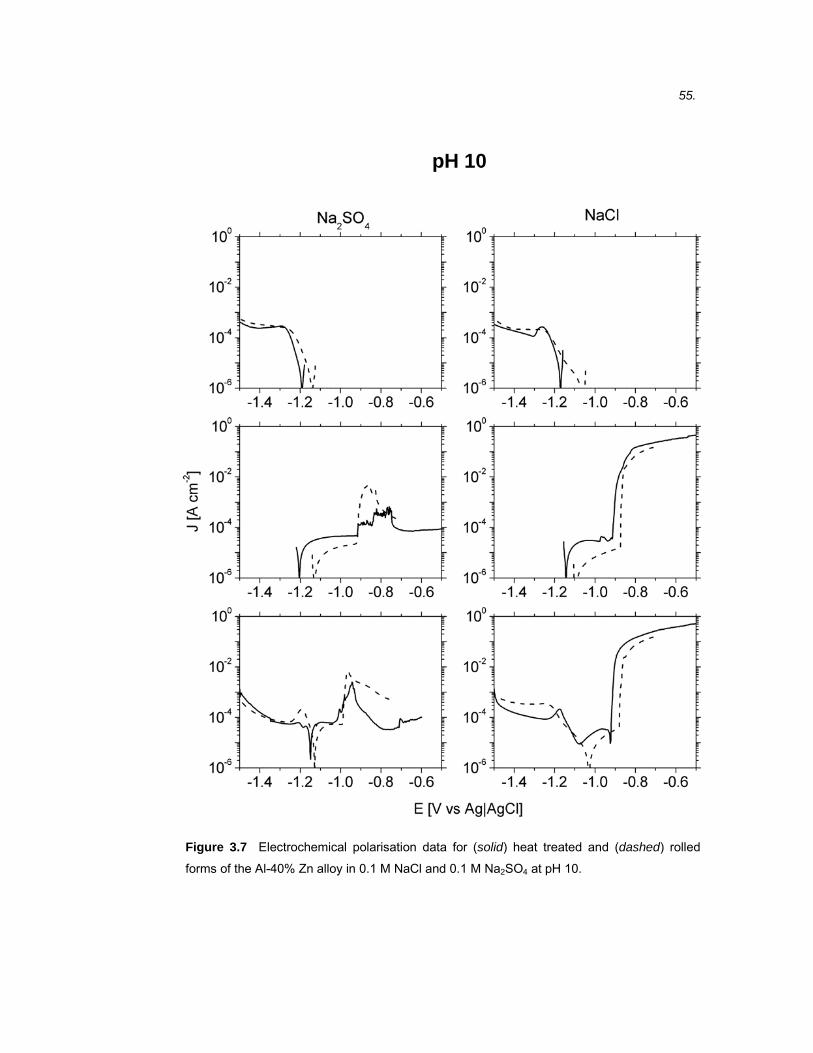
55.
Figure 3.7 Electrochemical polarisation data for (solid) heat treated and (dashed) rolled
forms of the Al-40% Zn alloy in 0.1 M NaCl and 0.1 M Na2SO4 at pH 10.
pH 10
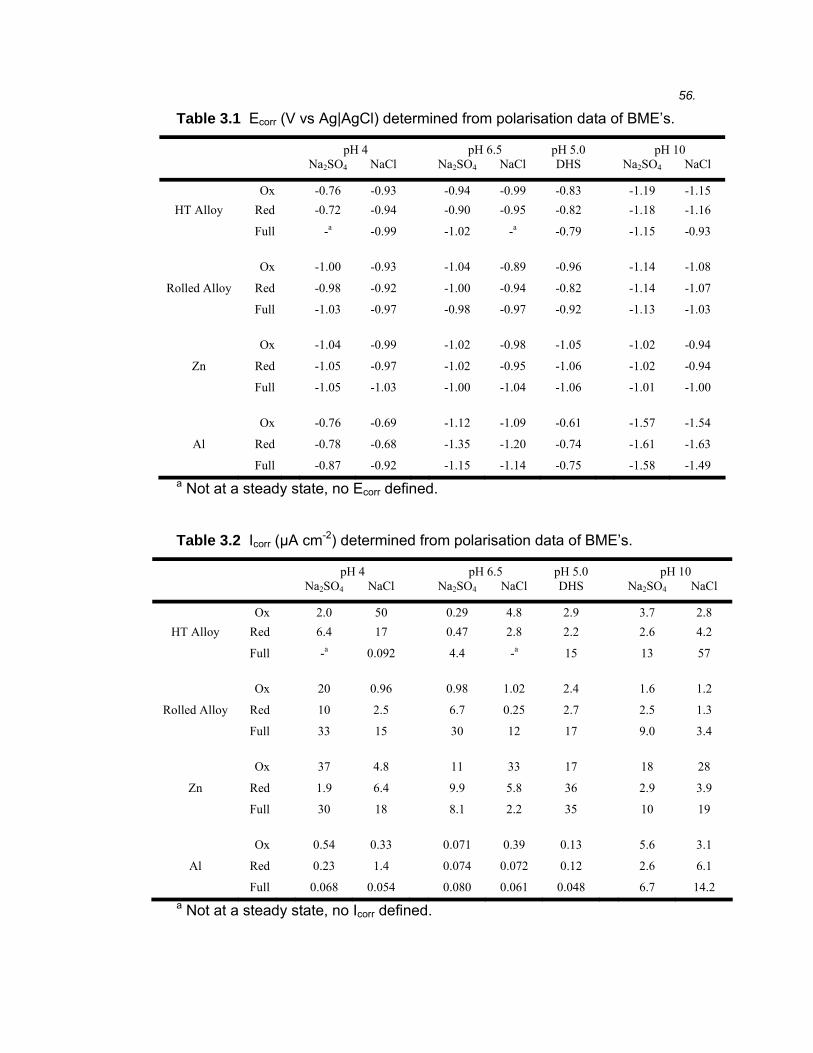
56.
Table 3.1 Ecorr (V vs Ag|AgCl) determined from polarisation data of BME’s.
pH 4 pH 6.5 pH 5.0 pH 10 Na2SO4 NaCl Na2SO4 NaCl DHS Na2SO4 NaCl
Ox -0.76 -0.93 -0.94 -0.99 -0.83 -1.19 -1.15 HT Alloy Red -0.72 -0.94 -0.90 -0.95 -0.82 -1.18 -1.16
Full -a -0.99 -1.02 -a -0.79 -1.15 -0.93 Ox -1.00 -0.93 -1.04 -0.89 -0.96 -1.14 -1.08
Rolled Alloy Red -0.98 -0.92 -1.00 -0.94 -0.82 -1.14 -1.07
Full -1.03 -0.97 -0.98 -0.97 -0.92 -1.13 -1.03
Ox -1.04 -0.99 -1.02 -0.98 -1.05 -1.02 -0.94
Zn Red -1.05 -0.97 -1.02 -0.95 -1.06 -1.02 -0.94
Full -1.05 -1.03 -1.00 -1.04 -1.06 -1.01 -1.00 Ox -0.76 -0.69 -1.12 -1.09 -0.61 -1.57 -1.54
Al Red -0.78 -0.68 -1.35 -1.20 -0.74 -1.61 -1.63
Full -0.87 -0.92 -1.15 -1.14 -0.75 -1.58 -1.49 a Not at a steady state, no Ecorr defined.
Table 3.2 Icorr (μA cm-2) determined from polarisation data of BME’s.
pH 4 pH 6.5 pH 5.0 pH 10
Na2SO4 NaCl Na2SO4 NaCl DHS Na2SO4 NaCl
Ox 2.0 50 0.29 4.8 2.9 3.7 2.8 HT Alloy Red 6.4 17 0.47 2.8 2.2 2.6 4.2
Full -a 0.092 4.4 -a 15 13 57 Ox 20 0.96 0.98 1.02 2.4 1.6 1.2
Rolled Alloy Red 10 2.5 6.7 0.25 2.7 2.5 1.3
Full 33 15 30 12 17 9.0 3.4 Ox 37 4.8 11 33 17 18 28
Zn Red 1.9 6.4 9.9 5.8 36 2.9 3.9
Full 30 18 8.1 2.2 35 10 19 Ox 0.54 0.33 0.071 0.39 0.13 5.6 3.1
Al Red 0.23 1.4 0.074 0.072 0.12 2.6 6.1
Full 0.068 0.054 0.080 0.061 0.048 6.7 14.2 a Not at a steady state, no Icorr defined.
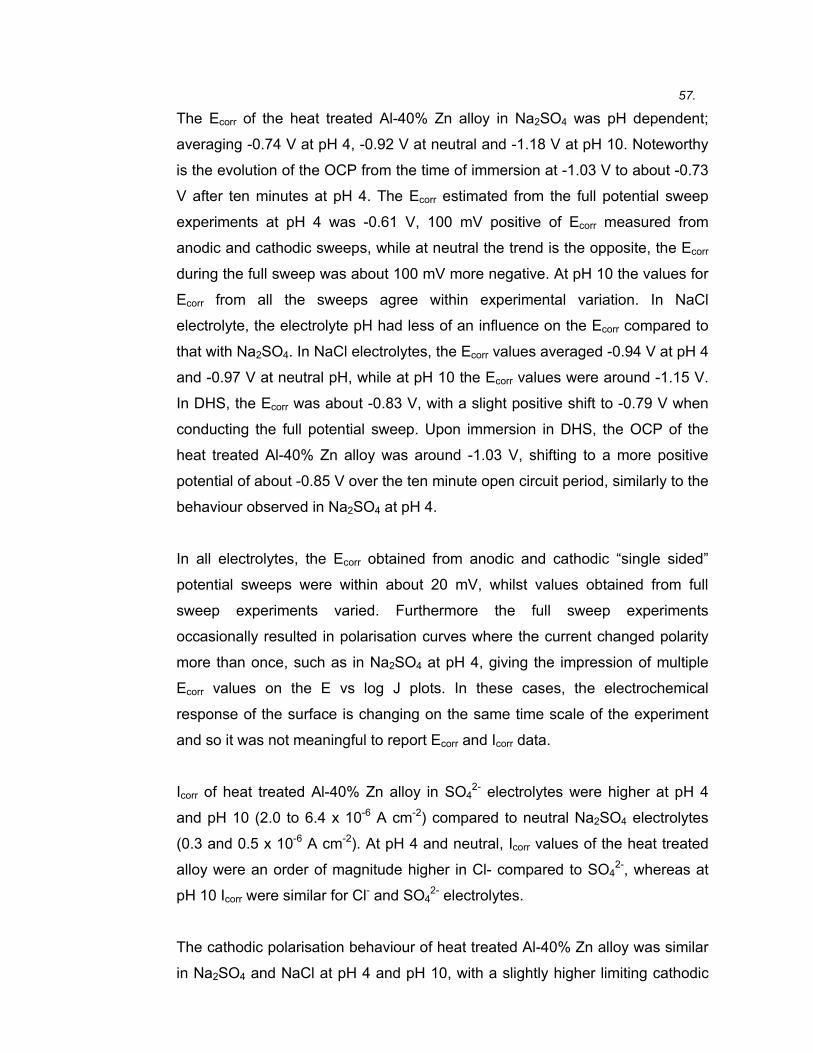
57.
The Ecorr of the heat treated Al-40% Zn alloy in Na2SO4 was pH dependent;
averaging -0.74 V at pH 4, -0.92 V at neutral and -1.18 V at pH 10. Noteworthy
is the evolution of the OCP from the time of immersion at -1.03 V to about -0.73
V after ten minutes at pH 4. The Ecorr estimated from the full potential sweep
experiments at pH 4 was -0.61 V, 100 mV positive of Ecorr measured from
anodic and cathodic sweeps, while at neutral the trend is the opposite, the Ecorr
during the full sweep was about 100 mV more negative. At pH 10 the values for
Ecorr from all the sweeps agree within experimental variation. In NaCl
electrolyte, the electrolyte pH had less of an influence on the Ecorr compared to
that with Na2SO4. In NaCl electrolytes, the Ecorr values averaged -0.94 V at pH 4
and -0.97 V at neutral pH, while at pH 10 the Ecorr values were around -1.15 V.
In DHS, the Ecorr was about -0.83 V, with a slight positive shift to -0.79 V when
conducting the full potential sweep. Upon immersion in DHS, the OCP of the
heat treated Al-40% Zn alloy was around -1.03 V, shifting to a more positive
potential of about -0.85 V over the ten minute open circuit period, similarly to the
behaviour observed in Na2SO4 at pH 4.
In all electrolytes, the Ecorr obtained from anodic and cathodic “single sided”
potential sweeps were within about 20 mV, whilst values obtained from full
sweep experiments varied. Furthermore the full sweep experiments
occasionally resulted in polarisation curves where the current changed polarity
more than once, such as in Na2SO4 at pH 4, giving the impression of multiple
Ecorr values on the E vs log J plots. In these cases, the electrochemical
response of the surface is changing on the same time scale of the experiment
and so it was not meaningful to report Ecorr and Icorr data.
Icorr of heat treated Al-40% Zn alloy in SO42- electrolytes were higher at pH 4
and pH 10 (2.0 to 6.4 x 10⁻⁶ A cm-2) compared to neutral Na2SO4 electrolytes
(0.3 and 0.5 x 10⁻⁶ A cm-2). At pH 4 and neutral, Icorr values of the heat treated
alloy were an order of magnitude higher in Cl- compared to SO42-, whereas at
pH 10 Icorr were similar for Cl- and SO42- electrolytes.
The cathodic polarisation behaviour of heat treated Al-40% Zn alloy was similar
in Na2SO4 and NaCl at pH 4 and pH 10, with a slightly higher limiting cathodic
58.
current density in NaCl at pH 4. In neutral electrolytes, the cathodic polarisation
curves in both NaCl and Na2SO4 exhibited two diffusion limited current plateaus,
like that observed for zinc, the first close to 1 x 10⁻⁵ A cm-2 and the second
around 3 x 10⁻⁴ A cm-2. In DHS, the second plateau in the cathodic polarisation
curve displayed a slightly lower current density at about 1 x 10⁻⁴ A cm-2. The
anodic polarisation curves of the heat treated Al-40% Zn alloy were very
different in NaCl, Na2SO4 and DHS. In Na2SO4 at pH 4, current density initially
displayed Tafel behaviour near Ecorr and then asymptotically approached 6 x 10-
3 A cm-2, while at neutral pH the anodic current density fluctuated at around 2 x
10-3 A cm-2. In Na2SO4 at pH 10 the alloy showed a flat oxidation current density
from -1.20 V to -0.92 V of about 6 x 10⁻³ A cm-2 with a rapid increase in current
density at -0.9 V and then repassivation at about -0.7 V. In NaCl at pH 4 and at
neutral pH the anodic current density was four orders of magnitude higher than
observed in Na2SO4, displaying a rapid increase in oxidation current density
immediately positive of the corrosion potential in a manner comparable to the
anodic polarisation curves of pure zinc in NaCl. At pH 10 the anodic curve
showed a gradual increase in current density from Ecorr to -0.9 V, then a rapid
increase in current density of five orders of magnitude. In DHS, the rapid
increase in oxidation current was similar to that observed in neutral NaCl, but it
was observed at a more positive potential of -0.8 V.
In contrast to the heat treated Al-40% Zn alloy, Ecorr of the rolled alloy in Na2SO4
electrolyte was around -1.00 V at pH 4 and neutral, and -1.14 V at pH 10. The
same trend was observed in NaCl electrolyte, albeit the Ecorr was consistently
50 mV to 100 mV more positive. Ecorr of the rolled Al-40% Zn alloy depended
less on electrolyte pH than the heat treated form of the alloy. Icorr of the rolled
Al-40% Zn alloy varied somewhat between the anodic, cathodic and full sweep
experiments. In pH 4 Na2SO4 the Icorr were an order of magnitude higher than in
NaCl, which was the opposite trend to that observed for the heat treated alloy.
In neutral and pH 10 electrolytes, the Icorr determined from the anodic and
cathodic polarisation sweeps were typically around 1 x 10⁻⁶ A cm-2 for all
electrolytes and an order of magnitude higher for the full sweeps.
59.
The current densities and shape of cathodic polarisation curves of the rolled Al-
40% Zn alloy were similar to the heat treated Al-40% Zn alloy at pH 4 and pH
10 in both NaCl and Na2SO4. In neutral Na2SO4, the first cathodic current
density plateau for the rolled alloy was an order of magnitude higher than the
heat treated alloy, while the curves were very similar negative of -1.3 V where
the second plateau began. In neutral NaCl, the cathodic current densities were
approximately an order of magnitude lower than the heat treated alloy and did
not display the current density plateaus observed for the heat treated alloy. In
DHS, the cathodic behaviour of the rolled alloy was similar to the heat treated
alloy, with the first diffusion limited plateau extending to approximately -1.35 V
rather than -1.2.
In Na2SO4 at neutral and pH 4, the rolled alloy exhibited an anodic current
density peak immediately positive of Ecorr which tailed off to a steady state
current density of around 10-4 A cm-2. SEM images of the surface following
polarisation revealed dealloying of the large zinc-rich precipitates (Figure 3.8).
At pH 10, the anodic polarisation curve in Na2SO4 was similar to that of the heat
treated alloy, showing a rapid current increase at -0.90 V and subsequent
decrease at -0.70 V. The anodic polarisation curves for the rolled alloy were
similar to those observed for the heat treated alloy and zinc in NaCl at all pH
values. In DHS, anodic polarisation of the rolled alloy resulted in a current
density peak of 10-3 A cm-2 at -0.80 V followed by a passive region and an
increase in current density more positive of -0.60 V.
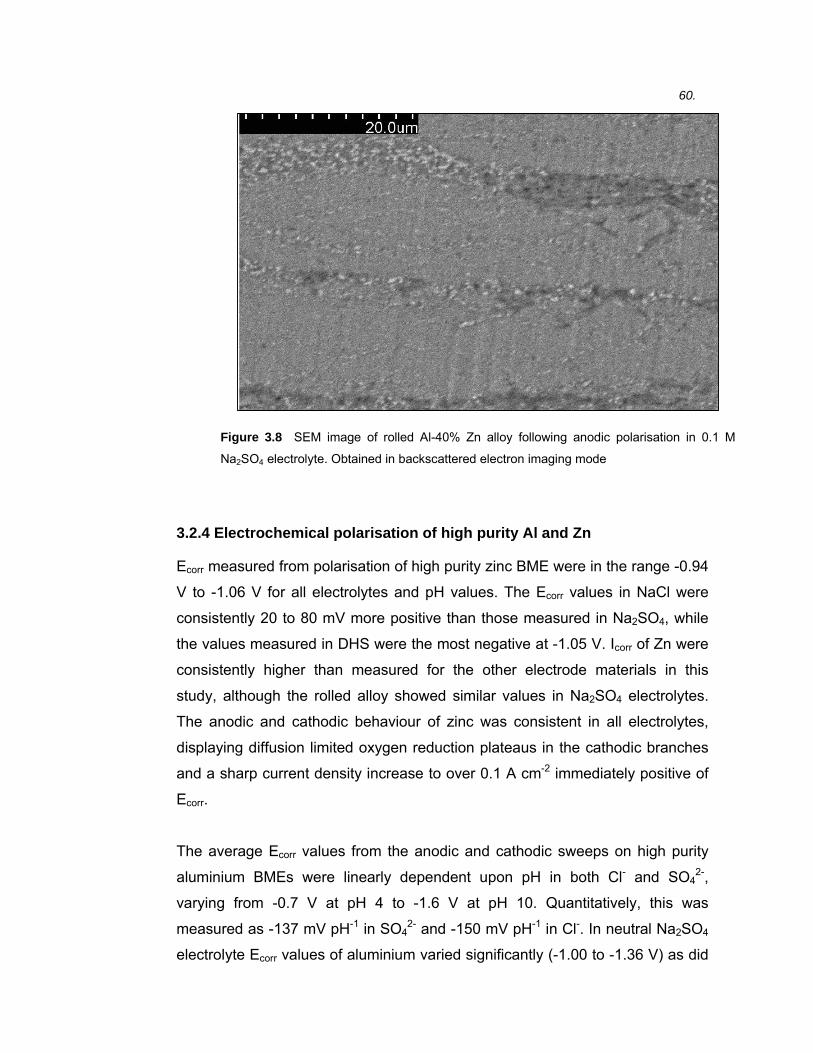
60.
3.2.4 Electrochemical polarisation of high purity Al and Zn
Ecorr measured from polarisation of high purity zinc BME were in the range -0.94
V to -1.06 V for all electrolytes and pH values. The Ecorr values in NaCl were
consistently 20 to 80 mV more positive than those measured in Na2SO4, while
the values measured in DHS were the most negative at -1.05 V. Icorr of Zn were
consistently higher than measured for the other electrode materials in this
study, although the rolled alloy showed similar values in Na2SO4 electrolytes.
The anodic and cathodic behaviour of zinc was consistent in all electrolytes,
displaying diffusion limited oxygen reduction plateaus in the cathodic branches
and a sharp current density increase to over 0.1 A cm-2 immediately positive of
Ecorr.
The average Ecorr values from the anodic and cathodic sweeps on high purity
aluminium BMEs were linearly dependent upon pH in both Cl- and SO42-,
varying from -0.7 V at pH 4 to -1.6 V at pH 10. Quantitatively, this was
measured as -137 mV pH-1 in SO42- and -150 mV pH-1 in Cl-. In neutral Na2SO4
electrolyte Ecorr values of aluminium varied significantly (-1.00 to -1.36 V) as did
Figure 3.8 SEM image of rolled Al-40% Zn alloy following anodic polarisation in 0.1 M
Na2SO4 electrolyte. Obtained in backscattered electron imaging mode
61.
the OCP measured prior to polarisation. This is consistent with values quoted in
literature for aluminium in neutral Na2SO4, as these range from -0.63 to -1.47
V.92 Ecorr values were generally more positive in NaCl than Na2SO4 by 50 to 100
mV while in DHS Ecorr were -0.6 V to -0.75 V, similar to pH 4 NaCl and Na2SO4.
Icorr of high purity aluminium were the lowest of all the materials used here save
for at pH 10 where they were comparable to the Al-Zn alloys. The cathodic
polarisation curves for high purity aluminium were typically one order of
magnitude lower in current density than the other materials. The cathodic
curves were flat and featureless, the current density rising as the potential was
scanned more negative than about -1.45 V. The anodic polarisation scans were
also generally, flat, featureless and the current densities were an order of
magnitude or more lower than the other materials. In neutral NaCl electrolyte, a
rapid but relatively small increase in the current density was observed close to -
0.65 V for the anodic and full sweep polarisation experiments.
3.3 DISCUSSION
3.3.1 Band microelectrodes compared to traditional macro-sized electrodes
All the polarisation data presented in this chapter were obtained using BME as
substrates, which have implications for comparing these results to those
obtained on normal sized electrodes. The enhanced mass transport to
microelectrodes may be expected to increase the Icorr where diffusion processes
limit the current density. The corrosion potential would theoretically be affected
by a change to an UME if diffusion contributed unequally to the anodic and
cathodic current densities around the Ecorr. It can be seen in Figure 3.3 that the
corrosion potential of zinc is unaffected by the change from macrodisc to BME
and that both the cathodic and anodic current densities are enhanced at high
overpotentials (+40/-200 mV) where the reaction kinetics are fast and the
current is diffusion limited. This suggests that both the anodic and cathodic
mechanisms feature rate limiting steps that are controlled by diffusion
processes. Work on the cathodic mechanism shows that the rate limiting step in
neutral electrolytes is usually diffusion of oxygen to the surface; while
62.
desorption and diffusion of zincate away from the surface has been shown to
limit the anodic dissolution mechanism, most notably under steady state
conditions, which are quickly established with microelectrodes.54, 59, 67, 93-94
The decay of the cathodic current from -1.4 V to Ecorr on the macrodisc is likely
due to a combination of Cottrellian current decay from an expanding diffusion
field and the onset of surface oxide formation concurrent with a change from
four-electron to two-electron oxygen reduction at potentials positive of ca. -1.2
V. The diffusion field around the zinc BME exists in steady state and does not
display Cotrellian current decay and consequently the current from -1.5 V to -
1.2 V is relatively flat. The potential region from -1.2 V to Ecorr is difficult to
interpret based on the result shown here. The time spent at negative potentials
means that significant OH- is generated and diffusion away from the surface
differs between the two electrodes.
3.3.2 The electrochemical polarisation behaviour of high purity Al and Zn
It is immediately apparent from the polarisation curves of high purity aluminium
and zinc that the pH and anion content of the electrolytes used have a strong
affect on the electrochemical behaviour of aluminium, but little effect on zinc.
The Ecorr of zinc under our experimental conditions is close to its equilibrium
value (EZn|Zn2+ = -1.085 V assuming [Zn2+] = 10-4 M)67 and similar to that
reported in a range of neutral, non-complexing electrolytes. The similarity
between the measured and equilibrium value is largely due to the high
exchange current density of the zinc dissolution equilibrium (i0 = 0.2 A cm-2) and
comparatively low i0 for hydrogen evolution and low diffusion limited current
from oxygen reduction.67, 95 In addition to the high i0 value for zinc, the anodic
Tafel slope has a very low value, that is, the slope is ‘steep’. This characteristic
reportedly arises from a self-catalytic dissolution mechanism, where adsorbed
Zn+ ions catalyse the dissolution of more zinc metal.96-97 The effect of this
dissolution mechanism is fast dissolution kinetics, which afford high current
densities with little overpotential. The more negative Ecorr values recorded in
SO42- compared to Cl- electrolytes are consistent with results that have
63.
previously been reported.98 The facile kinetics and steep Tafel slope for zinc are
responsible for the Icorr values being consistently the highest reported out of all
the materials. At pH 10, the Pourbaix diagram for zinc shows that formation of
zinc oxide is thermodynamically favoured (Figure 3.9), however results of these
polarisation experiments show the oxide is not passive under the conditions
used.
The cathodic polarisation results for zinc exhibit two diffusion limited plateaus.
Both are due to oxygen reduction, the difference in current arises from a change
in the reaction mechanism and the electrochemical reduction of surface
oxides.54, 56, 58-59, 94, 99 Specifically, from Ecorr to ca. -1.25 V, a two-electron
oxygen reduction mechanism dominates and the surface is oxide covered. At
potentials more negative of -1.25 V, a four-electron oxygen reduction
mechanism dominates and the surface is bare zinc.
High purity aluminium displays significantly different electrochemical behaviour
to zinc, having much lower current densities over all potential ranges. It is well
established that this a consequence of the passivity of the native oxide that
spontaneously and immediately forms on aluminium when exposed to air.74, 100-
101 In terms of electrolyte pH, the stability region of this oxide is from ca. pH 3.5
to pH 12.5 (Figure 3.9) although experimental measurements indicated that it
starts dissolving around pH 4 and pH 10.102 This stability region accounts for the
trend in the Icorr values, which were generally an order of magnitude lower in
neutral electrolytes than at pH 4 or pH 10. Lee and Pyun have shown that
hydroxide ions chemically attack the hydroxide film, changing the dissolution
mechanism from pitting in neutral electrolytes in the presence of Cl- to general
dissolution in alkaline electrolytes.103 Their polarisation results are qualitatively
similar to ours, although their pH was much higher (ca. pH 13) hence their
steady dissolution current was an order of magnitude higher (1 x 10⁻³ A cm-2).
Electrochemistry of both high purity aluminium and aluminium alloys is often
dominated by alloying elements or intermetallic particles, where the oxide film
exhibits defects or is discontinuous. It has been shown that even on 99.999%
and 99.9999% purity aluminium samples, the bulk pitting potential is still
64.
determined by impurities in the metal causing the formation of localised active
sites.104 The large variation in open circuit potential measured observed in the
results in this thesis at neutral pH can be related to very slow anodic and
cathodic reaction kinetics on the passive oxide and the stochastic nature of the
dissolution mechanism. Without fast surface reactions to poise the electrode
potential, localised electrode events may affect the electrode potential and their
transient nature is the likely cause of potential variation in aluminium at neutral
pH. This may be the reason for the large variation in OCP values reported by
numerous authors in neutral SO42- electrolytes and why the anodic and cathodic
polarisation curves for high purity aluminium in neutral SO42- electrolyte (Figure
3.4) display Ecorr that are separated by 100 mV.92 At pH 4 and pH 10, chemical
dissolution of the oxide film means that the anodic and cathodic processes on
the metal are enhanced and the localised events at the impurities only make a
small contribution to the electrode potential.
The correlation of the aluminium Ecorr with pH observed in this work (137-150
mV pH-1) is unsurprising given that the equilibrium potentials for aluminium
dissolution, proton reduction and water reduction are all pH dependant (-78.8
mV pH-1 and -59 mV pH-1).24 The pH dependence of the open circuit potential of
high purity aluminium has been reported previously to be -46 mV pH-1 to -66 mV
pH-1, although these measurements were reported over small pH ranges and
while investigating repassivation kinetics with the scratch technique.105-107 The
values determined in this work were significantly higher (137 – 150 mV pH-1),
possibly due to the concomitant effect of the pH on aluminium oxide film stability
and the rate of the proton reduction reaction.
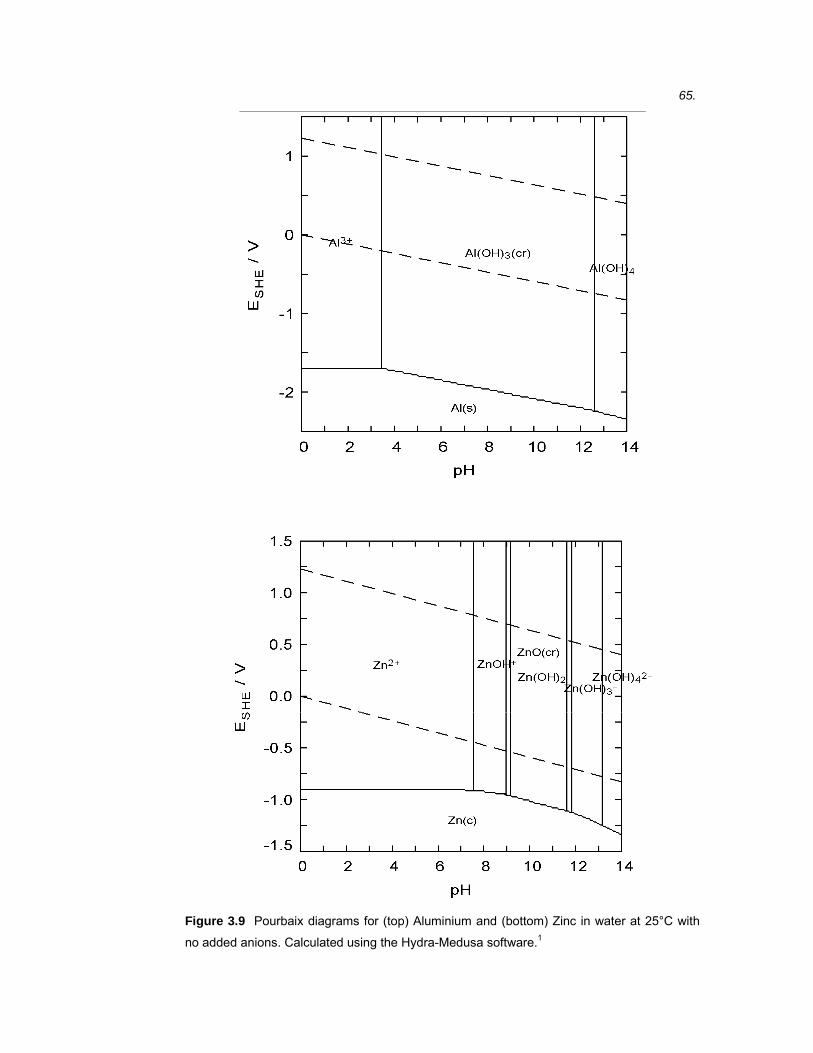
65.
Figure 3.9 Pourbaix diagrams for (top) Aluminium and (bottom) Zinc in water at 25°C with
no added anions. Calculated using the Hydra-Medusa software.1
66.
3.3.3 Microstructure of rolled and heat treated Al-40% Zn alloy
The crystal structures (face-centred cubic and hexagonal) and atomic radii (1.43
Å and 1.34 Å) of aluminium and zinc are significantly different, thus the
elements are sparingly soluble in each other.108 The equilibrium state of Al-40%
Zn alloy at room temperature is a two phase system consisting of the face
centred cubic, aluminium rich α-phase and the hexagonal zinc rich β-phase with
atomic fractions of aluminium and zinc of ca. 99% and 99.5% respectively. The
microstructures presented for the rolled and heat treated alloys are therefore
non-equilibrium and undergo spontaneous rearrangement at room temperature.
This manifested as precipitation initiating at sites such as grain boundaries
where the mobility of zinc is the highest and subsequently the precipitation front
proceeding over entire grains. In the rolled alloy, where there was already
extensive zinc precipitation, zinc migration was slower and the precipitates were
observed to coarsen slowly (room temperature) over a period of 6-12 months.
3.3.4 The effect of SO42- and Cl- on the polarisation behaviour of Al-40% Zn alloys
Anodic polarisation curves of the metals shows that the heat-treated alloy
displayed hindered anodic processes in SO42- electrolyte compared to the rolled
alloy and pure zinc, this effect was more pronounced in acidic than neutral or
alkaline electrolytes. The higher anodic current densities in chloride electrolyte
for the Al-40% Zn alloys indicate that chloride ions accelerate metal dissolution
on the alloy. While mechanistic details cannot be deduced from this data, it is
plausible that the solubilisation of corrosion products and the transport of metal
ions through surface oxides, not unlike the dissolution mechanisms often
reported for aluminium alloys, may contribute.75-76 The high anodic current
densities on the Al-40% Zn alloy in Cl- are consistent with the high galvanic
protection ability of the 55% Al-Zn coating compared to Al-Zn alloys with lower
aluminium content in the initial stages of corrosion in chloride electrolytes.51 The
evolution of the OCP of the heat treated alloy in acidic SO42- from ca. -1.03 V to
-0.73 V observed over the first few minutes after immersion is evidence that a
spontaneous change in the surface composition occurs. The OCP value of -1.0
67.
V immediately upon immersion, is similar to that of high purity zinc in all the pH
and anion conditions used in this work, it is thus likely that it is zinc dissolution
pinning the potential of the electrode (high exchange current density). The shift
of the Ecorr to more positive potentials (-0.73 V) indicates a reduction in the zinc
dissolution rate, resulting in a mixed potential contributed to by the aluminium
content of the alloy.
The cathodic branches of both the heat treated and rolled forms of the Al-40%
Zn alloys displayed higher current densities at low overpotential compared to
pure zinc at low pH. It is possible that this is due to a larger contribution of
proton reduction on the Al-40% Zn alloys, given the exchange current density
(i0) for hydrogen evolution reaction on zinc is very low (log i0 = -8.9 to -10.8)109-
110 whereas on aluminium it is higher (log i0 = -6.5 to -9.3).111 On the other hand,
the high cathodic current density of the Al-40% Zn alloys compared to high
purity aluminium may arise from the relative passivity of the oxide films, which
may be significantly disrupted by the zinc content of both forms of the alloy.
These results indicate that the cathodic behaviour of Al-40% Zn alloy is unlike
that of aluminium or zinc, suggesting that the native oxide film on the binary
alloy is unique. Work on the composition of the native oxide film on binary solid
solution Al-Zn alloys of variable composition and its effect on the corrosion
electrochemistry of these alloys is explored further in Chapter 6 of this thesis.
The fact that the Ecorr and Icorr values for the rolled alloy and pure zinc are
similar can be attributed to the presence of active zinc rich islands in the rolled
alloy. This postulation is further evidenced by the dealloying observed after
anodic polarisation (Figure 3.8). These observations are also consistent with
results from atmospheric exposure data for the 55% Al-Zn coating, where it is
frequently observed that the zinc rich β-phase corrodes preferentially.3, 48-49 The
lower current densities displayed by the rolled alloy compared to zinc during
anodic polarisation in sulfate electrolytes indicates that a stable passive film
may be present on regions of the surface not occupied by the active zinc rich
sites. Furthermore, not all zinc rich particles dealloy upon polarisation in SO42-
electrolyte, thus it is possible that the aluminium content in these areas is still
sufficiently high, or these areas are small enough, that dissolution is inhibited.
68.
3.3.5 The effect of pH on the polarisation behaviour of Al-40% Zn alloys
The negative Ecorr in alkaline electrolytes (-1.1 V to -1.2 V) for both forms of the
Al-40% Zn alloy is a consequence of the aluminium content of the alloys. Mixed
potential theory indicates that the Ecorr is the resulting potential arising from
equal rates of different anodic and cathodic reactions. The anodic reaction on
these alloys must be either zinc dissolution, aluminium dissolution or both. The
Ecorr values are 200 – 300 mV negative of the Ecorr for zinc dissolution in pH 10
electrolytes. Extrapolating the zinc dissolution reaction to these potentials
indicates that the zinc dissolution rate is very slow, hence the aluminium
dissolution reaction contributes significantly to the anodic processes and to the
measured OCP and Ecorr in alkaline electrolytes. Indeed the polarisation curve
on high purity aluminium in pH 10 electrolytes exhibits an anodic current density
similar to the Al-40% Zn alloys in alkaline electrolytes from the Ecorr up to the
break down potential in SO42- and zinc dissolution potential in Cl-. At pH 10, the
principle cathodic reaction on zinc is oxygen reduction, while on aluminium it is
water reduction. The cathodic current densities of the alloys in alkaline
electrolyte are similar to that of zinc, thus it is probable that oxygen reduction is
the dominant cathodic mechanism on Al-40% Zn alloys in this electrolyte.
Therefore the OCP and Ecorr of the alloys in pH 10 electrolytes arise principally
from aluminium dissolution and oxygen reduction.
The polarisation scans employing a traditional full sweep, where the potential
scan was started at -1.5 V or -1.7 V, displayed multiple polarity reversals in pH
10 SO42- and neutral Cl-, giving the impression of multiple Ecorr. Furthermore,
most of the other polarisation curves displayed peaks and troughs that cannot
be accounted for by considering simple anodic and cathodic processes on the
surface. Starting at large cathodic overpotentials has the effect of generating
significant hydroxide, resulting in a near surface environment whose pH is
higher than the bulk. The near surface pH will change as the potential is swept
positive and the cathodic reaction rate decreases while the metal dissolution
rate increases. It is proposed that the transient pH has the effect of altering the
69.
solubility of the native oxide and metal ions in situ, meaning that the
electrochemical response of the surface is changing on the same time scale as
the polarisation experiment. This postulation is supported by the evidence that
the full sweeps of both Al-40% Zn alloys in DHS displayed stable polarisation
curves, where the ammonium ion will buffer the pH around pH 9 (pKa = 9.25),
thus limiting the change in the near surface pH.112
3.3.6 The effect of microstructure on the polarisation behaviour of Al-40% Zn alloy
A simplistic model of the electrochemical behaviour of Al-40% Zn alloy would be
that the zinc and aluminium atoms in the alloy act independently of each other.
This model assumes that native oxides on an Al-Zn alloy are identical to those
found on pure zinc and pure aluminium and thus, the current densities observed
on the alloys would be the sum of the current densities measured on these
metals, weighted for atomic fraction. Such behaviour would mean that the
microstructure of the alloy would have no bearing on the electrochemical
response. Furthermore, considering the results of electrochemical polarisation
on aluminium and zinc (Figure 3.4), an Al-40% Zn alloy would behave much like
high purity zinc, given the large disparity in current densities between aluminium
and zinc.
At the opposite extreme would exist a model where the electrochemical
behaviour of an Al-40% Zn alloy is completely unlike high purity aluminium or
zinc and is dependant solely upon the interaction of aluminium and zinc in
various microstructural domains that form. These would have unique mixed
metal native oxides that are unlike their equivalents on the high purity metals.
The results of electrochemical polarisation experiments suggest that the
behaviour varies somewhat between these two simplified extremes and is
dependant upon the microstructure, the electrolyte and the polarisation
conditions. For example, consider the polarisation results in Cl- and SO42-
electrolytes at pH 4. The Ecorr of the heat treated alloy in acidic SO42- electrolyte
70.
is similar to the Ecorr measured for high purity aluminium, however the cathodic
current density is an order of magnitude higher than observed on aluminium
and similar to the current densities measured on zinc.
It is clear that the microstructure also influences the alloy behaviour. The rolled
alloy having an Ecorr that is 300 mV more positive than the heat treated alloy is
clearly a result of the low anodic currents on the heat treated alloy, as their
cathodic polarisation curves are indistinguishable. While the Ecorr of the rolled
alloy is similar to that measured for pure zinc in acidic SO42-, the anodic current
densities are much lower. Thus, formation of a solid solution microstructure
inhibits anodic dissolution in acidic SO42- electrolyte.
Some of the zinc rich islands in the rolled alloy behave similar to high purity
zinc, as evidenced by localised dissolution (Figure 3.8). The influence of zinc on
the behaviour of the alloys is also revealed in the Ecorr values (and consequently
the OCP values) of the rolled Al-40% Zn alloy, which were consistently 60 - 130
mV more positive in Cl- compared to SO42- electrolyte. This trend is the same as
observed for purity zinc in this work and by other authors.98 This trend was not
observed for the heat treated alloy, suggesting that the zinc rich islands present
on the rolled alloy are responsible for it displaying polarisation characteristics, at
times, similar to zinc.
The heat treated alloy exhibits unusual behaviour in neutral Cl- electrolyte,
having an Ecorr that ranged from -0.94 V to -1.02 V and OCP varied between
these values during the 10 minute immersion period. This may be due to
multiple anodic or cathodic processes or complex electrochemical reaction
mechanisms. Given that the cathodic polarisation curves display classic
diffusion limited response and are reproducible, while the anodic curves
displayed an Ecorr of -1.02 V as well as a secondary current drop around -0.92 V
(Figure 3.6), it is likely that the anodic reactions are responsible for this
behaviour. There are a number of possibilities for this such as mixed aluminium
and zinc dissolution, oxide film break down and repassivation, or an unusual
pitting mechanism. The data presented in this chapter have indicated that the
Al-Zn alloys exhibit passivity in SO42- electrolytes, undoubtedly due to the
71.
aluminium content. However, the cathodic current densities and their anodic
behaviour in Cl- electrolytes indicate that the Al-40% Zn alloys also display
behaviours like that of zinc. Investigation into the relationship between
composition and native oxide structure on the electrochemistry of these Al-Zn
alloys is explored in Chapter 6.
3.4 CONCLUSIONS
BME’s were demonstrated to be an attractive geometry to fabricate electrodes
for corrosion studies. The advantages of UME’s were displayed along with
easily measured currents due to the macroscopic length. The relative thinness
of the foils permitted rapid quenching, enabling the production of solid solution
microstructures of otherwise multiphase alloys.
The polarisation behaviour of the Al-40% Zn alloys was dependant upon pH and
the presence of Cl- and SO42-. Electrochemical polarisation experiments have
shown that anodic dissolution processes on Al-40% Zn alloys are significantly
enhanced in Cl- compared to SO42- based electrolytes. Electrolyte pH affected
the solubility of the native oxide and the anodic and cathodic processes. Large
precipitates present in microstructure of the rolled Al-40% Zn alloy served to act
as local islands of zinc, which dominated the electrochemical polarisation
response.
While the composition and microstructure of the heat treated Al-40% alloy
resembles that of the α-phase of the coating, the results presented here still
need to be correlated with the behaviour of the real α-phase of the 55% Al-Zn
coating. Unfortunately significant experimental challenges remain to physically
or electrochemically isolate α-phase from the coating matrix.
For the remainder of the work reported in this thesis, the heat treated (solid
solution) Al-40% Zn alloy is used for electrochemical investigations as a model
of the α-phase of the coating.
Chapter 4 | Emulating the bare corrosion of
55% Al-Zn metal coating using band
microelectrode arrays
72
4.1 INTRODUCTION
In the previous chapter, the electrochemical polarisation data for Al-40% Zn
alloys and high purity aluminium and zinc were presented. In this chapter, we
progress to a model for the bare corrosion behaviour of the 55% Al-Zn coating.
To this end, an the electrochemical interaction between the aluminium rich α-
phase and the zinc rich β-phase of the 55% Al-Zn coating is simulated with Al-
40% Zn alloy and Zn using BME arrays.
When two dissimilar metals in electrical contact are exposed to an electrolyte, a
galvanic current is generated between them. The metal with a more negative
corrosion potential becomes the anode, while the metal with the more positive
corrosion potential becomes the cathode. The dynamics of this relationship can
be complicated by microstructural, environmental and geometric factors.68
During coupling, both electrodes polarise to a cell potential that lies between the
corrosion potential of each of the metals. The degree of polarisation and
magnitude of the galvanic current between the metals is determined by the
anodic and cathodic kinetics on the respective anode and cathode. Accurately
measuring this interaction as a discrete cell requires physical separation of the
metals and one approach is to synthesise the phases and conduct galvanic
coupling experiments between them.87, 113 To implement this strategy with the
55% Al-Zn coating, the heat treated Al-40% Zn alloy was used as a facsimile of
the α-phase of the coating in terms of composition and microstructure, while
high purity zinc modelled the β-phase.
Using the electrochemical polarisation data presented in the previous chapter, a
theoretical estimation of the galvanic behaviour of the α- and β-phases of the
55% Al-Zn coating in various electrolytes can be made. Polarisation curves of
heat treated Al-40% Zn alloy and high purity zinc in neutral SO42- and Cl-
electrolytes are reproduced, showing their intersection (Figure 4.1). During
galvanic coupling in SO42- electrolyte, the heat treated alloy would be expected
undergo polarisation by ca. -80 mV, resulting in a cell potential of -1.02 V and a
galvanic current density of 5 µA cm-2 between the metals. The heat treated alloy
would behave as the cathode, while the zinc would behave as the anode.
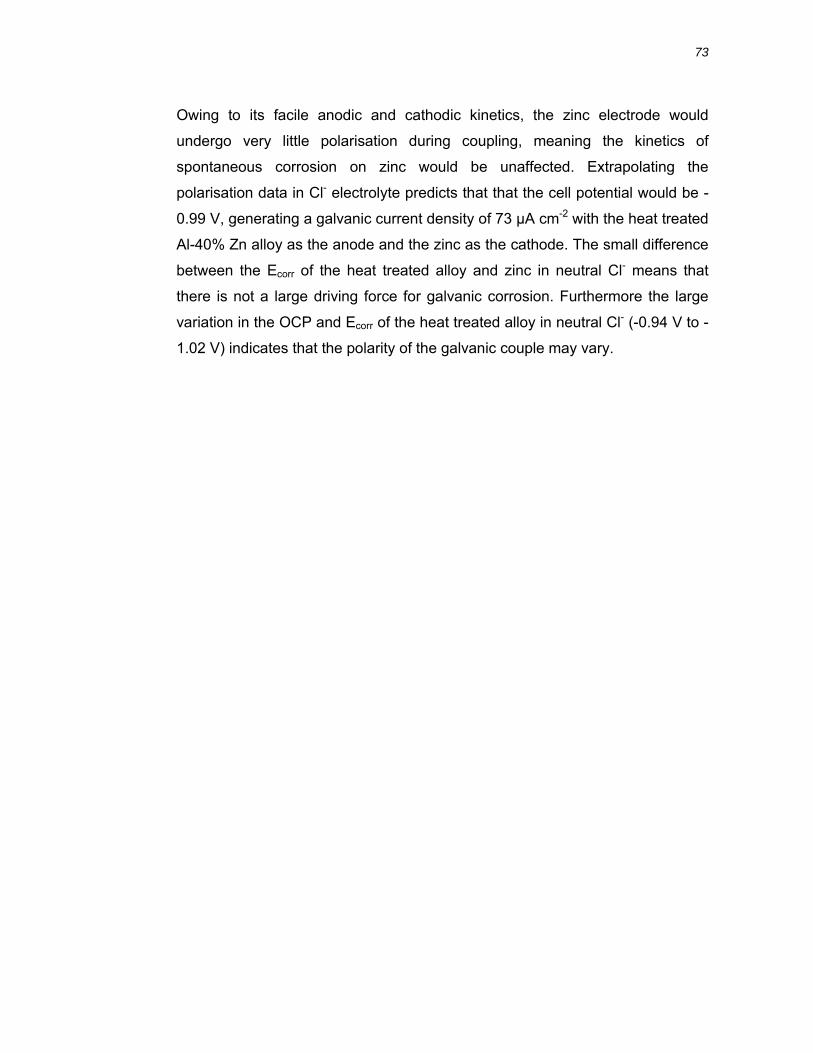
73
Owing to its facile anodic and cathodic kinetics, the zinc electrode would
undergo very little polarisation during coupling, meaning the kinetics of
spontaneous corrosion on zinc would be unaffected. Extrapolating the
polarisation data in Cl- electrolyte predicts that that the cell potential would be -
0.99 V, generating a galvanic current density of 73 µA cm-2 with the heat treated
Al-40% Zn alloy as the anode and the zinc as the cathode. The small difference
between the Ecorr of the heat treated alloy and zinc in neutral Cl- means that
there is not a large driving force for galvanic corrosion. Furthermore the large
variation in the OCP and Ecorr of the heat treated alloy in neutral Cl- (-0.94 V to -
1.02 V) indicates that the polarity of the galvanic couple may vary.
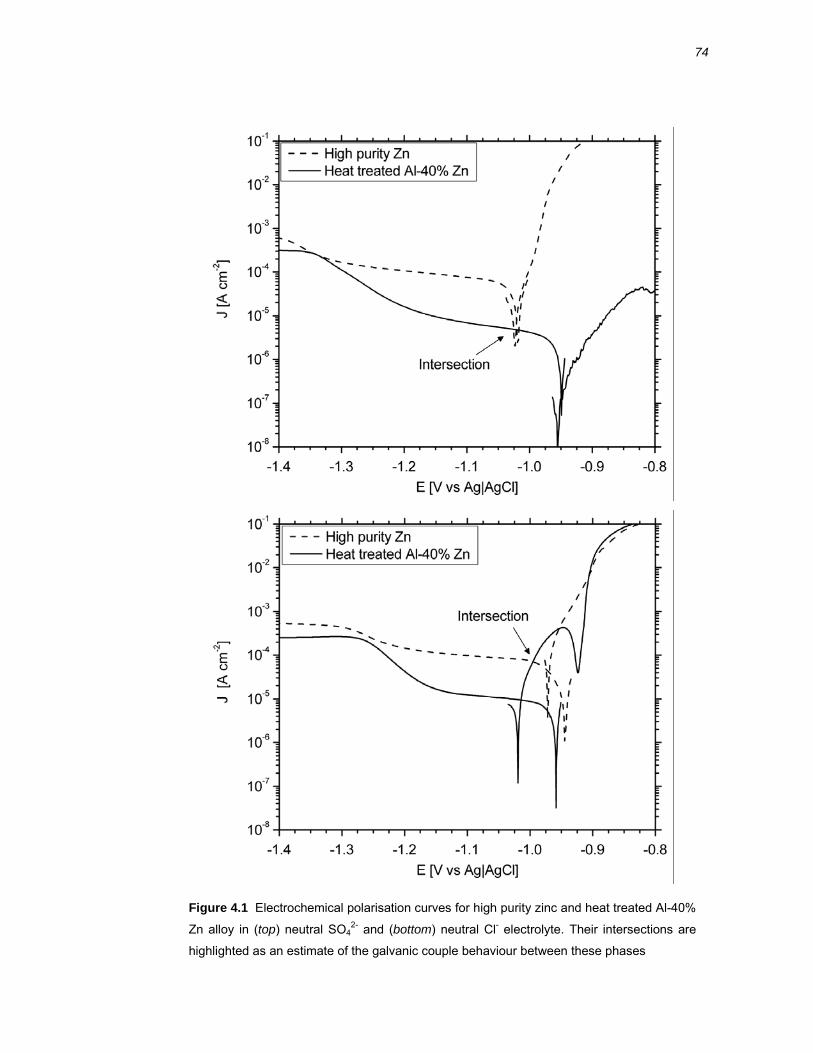
74
Figure 4.1 Electrochemical polarisation curves for high purity zinc and heat treated Al-40%
Zn alloy in (top) neutral SO42- and (bottom) neutral Cl- electrolyte. Their intersections are
highlighted as an estimate of the galvanic couple behaviour between these phases
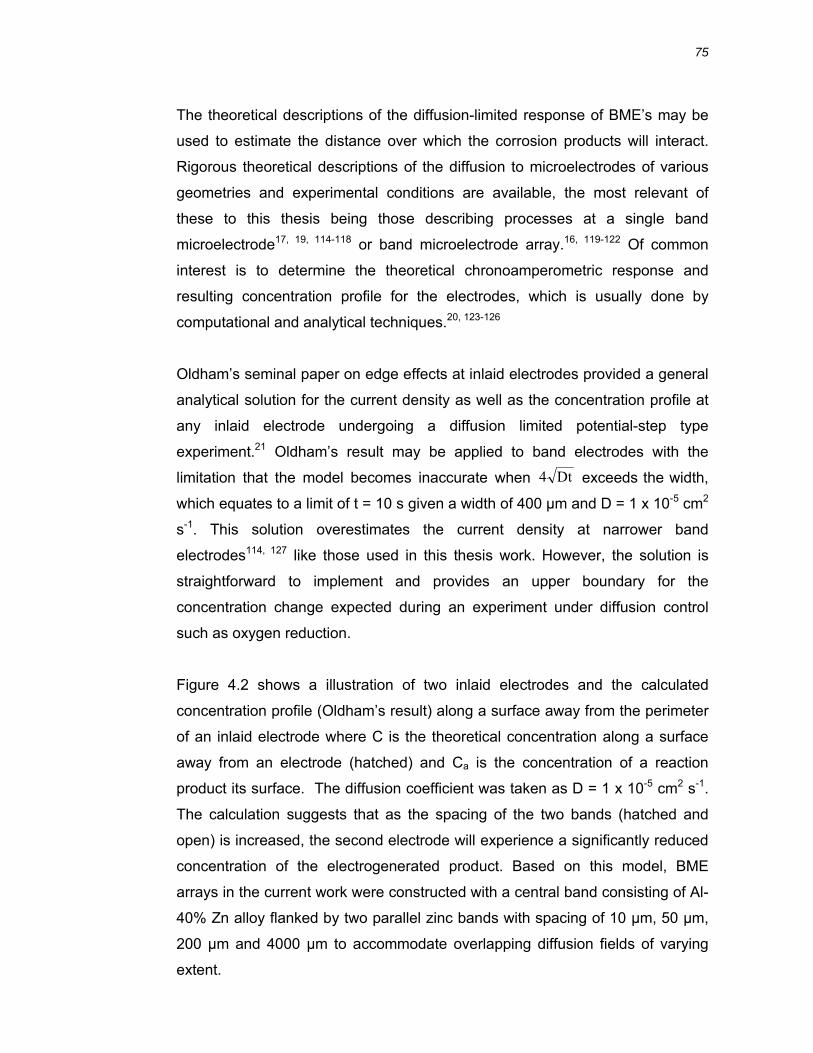
75
Dt4
The theoretical descriptions of the diffusion-limited response of BME’s may be
used to estimate the distance over which the corrosion products will interact.
Rigorous theoretical descriptions of the diffusion to microelectrodes of various
geometries and experimental conditions are available, the most relevant of
these to this thesis being those describing processes at a single band
microelectrode17, 19, 114-118 or band microelectrode array.16, 119-122 Of common
interest is to determine the theoretical chronoamperometric response and
resulting concentration profile for the electrodes, which is usually done by
computational and analytical techniques.20, 123-126
Oldham’s seminal paper on edge effects at inlaid electrodes provided a general
analytical solution for the current density as well as the concentration profile at
any inlaid electrode undergoing a diffusion limited potential-step type
experiment.21 Oldham’s result may be applied to band electrodes with the
limitation that the model becomes inaccurate when exceeds the width,
which equates to a limit of t = 10 s given a width of 400 μm and D = 1 x 10⁻⁵ cm2
s-1. This solution overestimates the current density at narrower band
electrodes114, 127 like those used in this thesis work. However, the solution is
straightforward to implement and provides an upper boundary for the
concentration change expected during an experiment under diffusion control
such as oxygen reduction.
Figure 4.2 shows a illustration of two inlaid electrodes and the calculated
concentration profile (Oldham’s result) along a surface away from the perimeter
of an inlaid electrode where C is the theoretical concentration along a surface
away from an electrode (hatched) and Ca is the concentration of a reaction
product its surface. The diffusion coefficient was taken as D = 1 x 10⁻⁵ cm2 s-1.
The calculation suggests that as the spacing of the two bands (hatched and
open) is increased, the second electrode will experience a significantly reduced
concentration of the electrogenerated product. Based on this model, BME
arrays in the current work were constructed with a central band consisting of Al-
40% Zn alloy flanked by two parallel zinc bands with spacing of 10 μm, 50 μm,
200 μm and 4000 μm to accommodate overlapping diffusion fields of varying
extent.
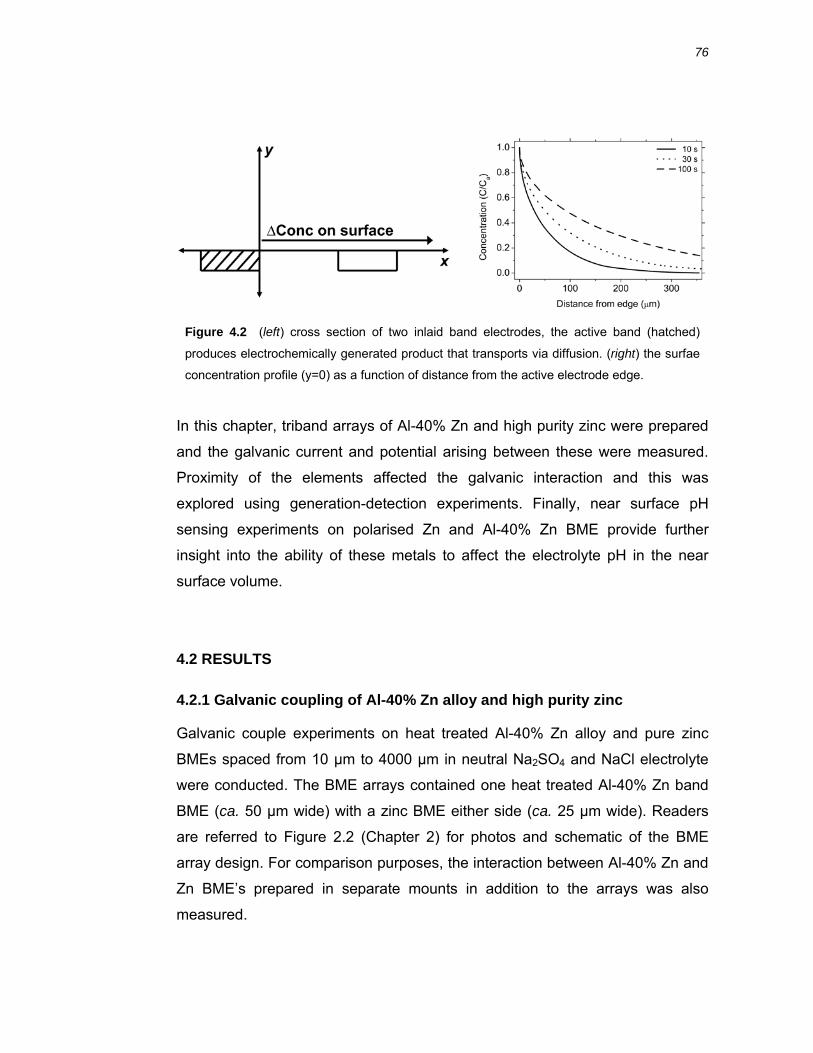
76
In this chapter, triband arrays of Al-40% Zn and high purity zinc were prepared
and the galvanic current and potential arising between these were measured.
Proximity of the elements affected the galvanic interaction and this was
explored using generation-detection experiments. Finally, near surface pH
sensing experiments on polarised Zn and Al-40% Zn BME provide further
insight into the ability of these metals to affect the electrolyte pH in the near
surface volume.
4.2 RESULTS
4.2.1 Galvanic coupling of Al-40% Zn alloy and high purity zinc
Galvanic couple experiments on heat treated Al-40% Zn alloy and pure zinc
BMEs spaced from 10 μm to 4000 μm in neutral Na2SO4 and NaCl electrolyte
were conducted. The BME arrays contained one heat treated Al-40% Zn band
BME (ca. 50 µm wide) with a zinc BME either side (ca. 25 µm wide). Readers
are referred to Figure 2.2 (Chapter 2) for photos and schematic of the BME
array design. For comparison purposes, the interaction between Al-40% Zn and
Zn BME’s prepared in separate mounts in addition to the arrays was also
measured.
Figure 4.2 (left) cross section of two inlaid band electrodes, the active band (hatched)
produces electrochemically generated product that transports via diffusion. (right) the surfae
concentration profile (y=0) as a function of distance from the active electrode edge.
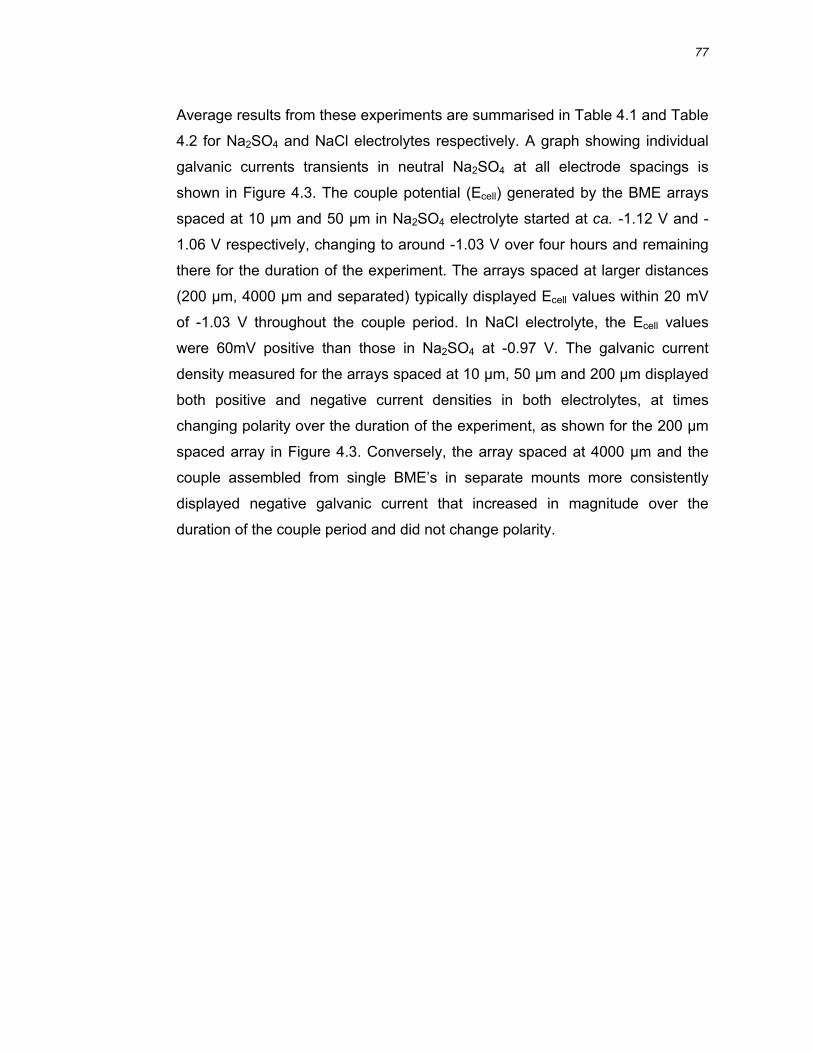
77
Average results from these experiments are summarised in Table 4.1 and Table
4.2 for Na2SO4 and NaCl electrolytes respectively. A graph showing individual
galvanic currents transients in neutral Na2SO4 at all electrode spacings is
shown in Figure 4.3. The couple potential (Ecell) generated by the BME arrays
spaced at 10 μm and 50 μm in Na2SO4 electrolyte started at ca. -1.12 V and -
1.06 V respectively, changing to around -1.03 V over four hours and remaining
there for the duration of the experiment. The arrays spaced at larger distances
(200 μm, 4000 μm and separated) typically displayed Ecell values within 20 mV
of -1.03 V throughout the couple period. In NaCl electrolyte, the Ecell values
were 60mV positive than those in Na2SO4 at -0.97 V. The galvanic current
density measured for the arrays spaced at 10 μm, 50 μm and 200 μm displayed
both positive and negative current densities in both electrolytes, at times
changing polarity over the duration of the experiment, as shown for the 200 μm
spaced array in Figure 4.3. Conversely, the array spaced at 4000 μm and the
couple assembled from single BME’s in separate mounts more consistently
displayed negative galvanic current that increased in magnitude over the
duration of the couple period and did not change polarity.
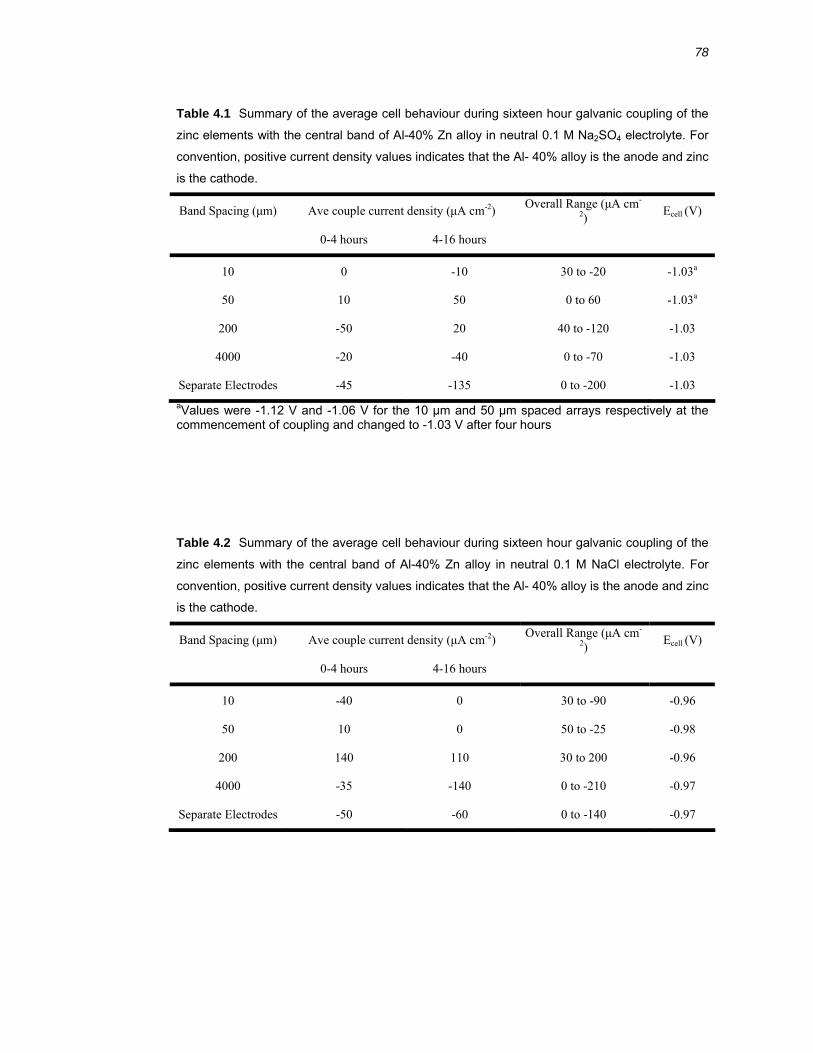
78
Table 4.1 Summary of the average cell behaviour during sixteen hour galvanic coupling of the
zinc elements with the central band of Al-40% Zn alloy in neutral 0.1 M Na2SO4 electrolyte. For
convention, positive current density values indicates that the Al- 40% alloy is the anode and zinc
is the cathode.
Band Spacing (μm) Ave couple current density (μA cm-2) Overall Range (μA cm-
2) Ecell (V)
0-4 hours 4-16 hours
10 0 -10 30 to -20 -1.03a
50 10 50 0 to 60 -1.03a
200 -50 20 40 to -120 -1.03
4000 -20 -40 0 to -70 -1.03
Separate Electrodes -45 -135 0 to -200 -1.03 aValues were -1.12 V and -1.06 V for the 10 μm and 50 μm spaced arrays respectively at the commencement of coupling and changed to -1.03 V after four hours
Table 4.2 Summary of the average cell behaviour during sixteen hour galvanic coupling of the
zinc elements with the central band of Al-40% Zn alloy in neutral 0.1 M NaCl electrolyte. For
convention, positive current density values indicates that the Al- 40% alloy is the anode and zinc
is the cathode.
Band Spacing (μm) Ave couple current density (μA cm-2) Overall Range (μA cm-
2) Ecell (V)
0-4 hours 4-16 hours
10 -40 0 30 to -90 -0.96
50 10 0 50 to -25 -0.98
200 140 110 30 to 200 -0.96
4000 -35 -140 0 to -210 -0.97
Separate Electrodes -50 -60 0 to -140 -0.97
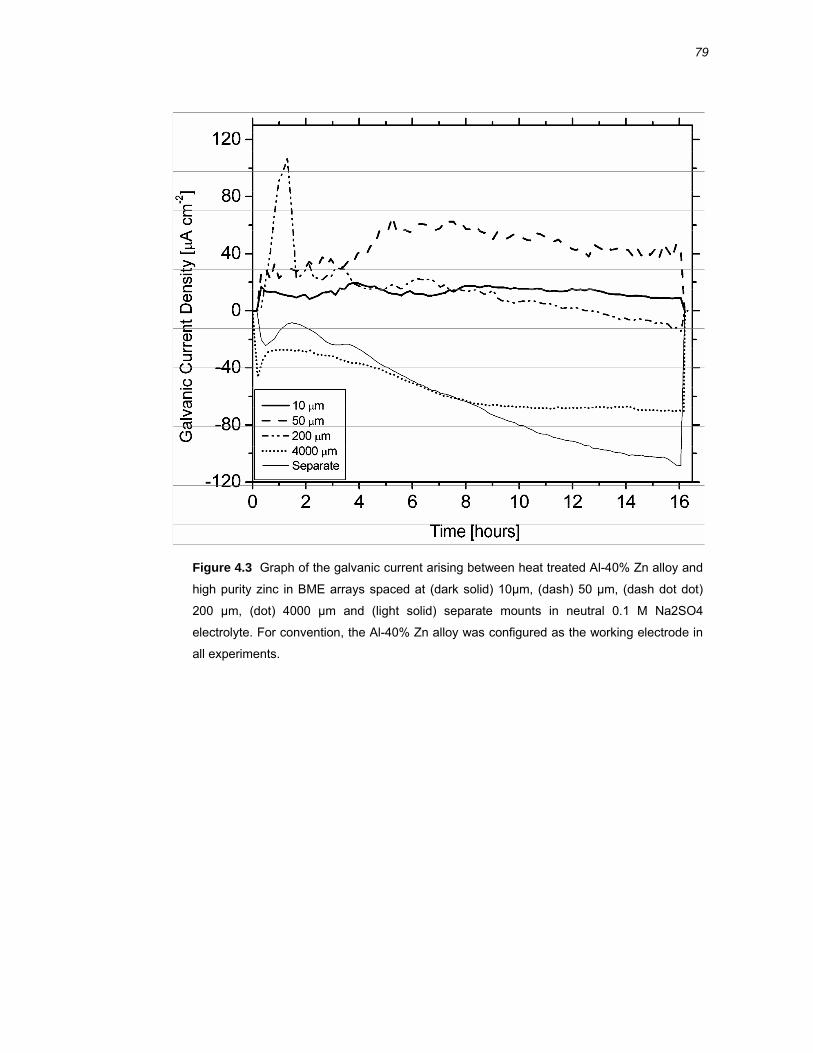
79
Figure 4.3 Graph of the galvanic current arising between heat treated Al-40% Zn alloy and
high purity zinc in BME arrays spaced at (dark solid) 10μm, (dash) 50 μm, (dash dot dot)
200 μm, (dot) 4000 μm and (light solid) separate mounts in neutral 0.1 M Na2SO4
electrolyte. For convention, the Al-40% Zn alloy was configured as the working electrode in
all experiments.
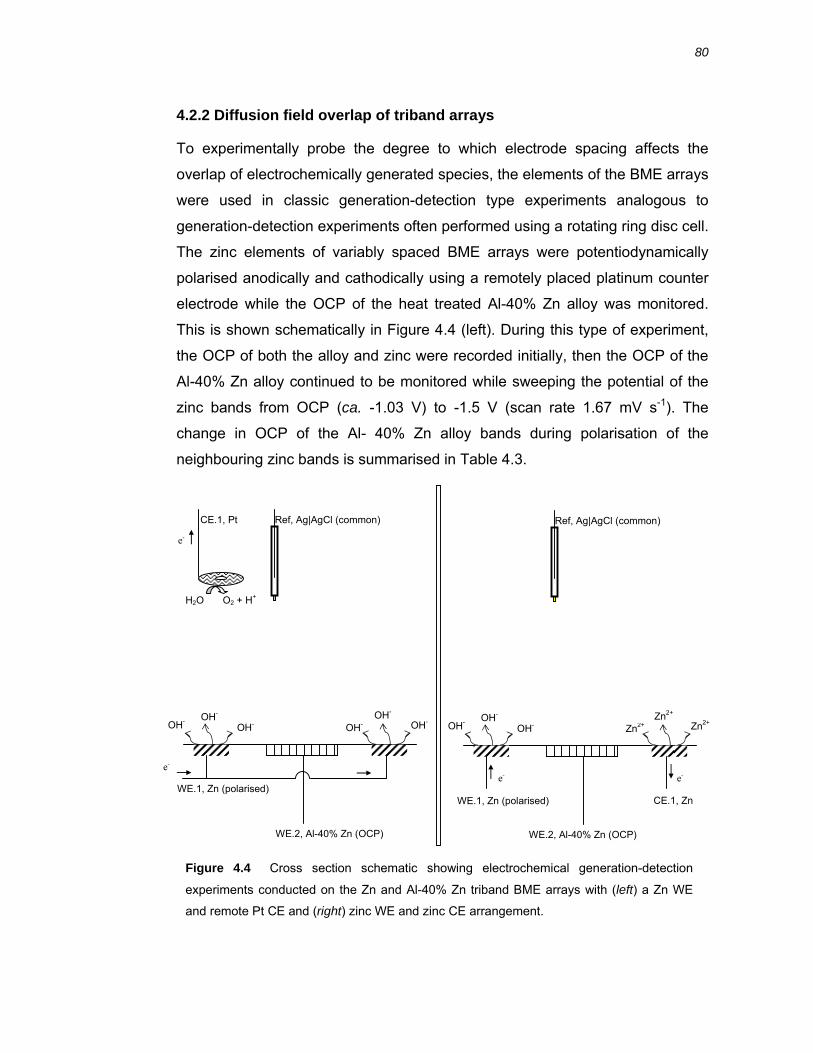
80
4.2.2 Diffusion field overlap of triband arrays
To experimentally probe the degree to which electrode spacing affects the
overlap of electrochemically generated species, the elements of the BME arrays
were used in classic generation-detection type experiments analogous to
generation-detection experiments often performed using a rotating ring disc cell.
The zinc elements of variably spaced BME arrays were potentiodynamically
polarised anodically and cathodically using a remotely placed platinum counter
electrode while the OCP of the heat treated Al-40% Zn alloy was monitored.
This is shown schematically in Figure 4.4 (left). During this type of experiment,
the OCP of both the alloy and zinc were recorded initially, then the OCP of the
Al-40% Zn alloy continued to be monitored while sweeping the potential of the
zinc bands from OCP (ca. -1.03 V) to -1.5 V (scan rate 1.67 mV s-1). The
change in OCP of the Al- 40% Zn alloy bands during polarisation of the
neighbouring zinc bands is summarised in Table 4.3.
Figure 4.4 Cross section schematic showing electrochemical generation-detection
experiments conducted on the Zn and Al-40% Zn triband BME arrays with (left) a Zn WE
and remote Pt CE and (right) zinc WE and zinc CE arrangement.
WE.1, Zn (polarised)
WE.2, Al-40% Zn (OCP)
Ref, Ag|AgCl (common) CE.1, Pt
OH- OH-
OH- OH- OH-
OH-
WE.1, Zn (polarised)
WE.2, Al-40% Zn (OCP)
Ref, Ag|AgCl (common)
OH- OH-
OH- Zn2+ Zn2+
Zn2+
CE.1, Zn
H2O O2 + H+
e-
e- e- e-
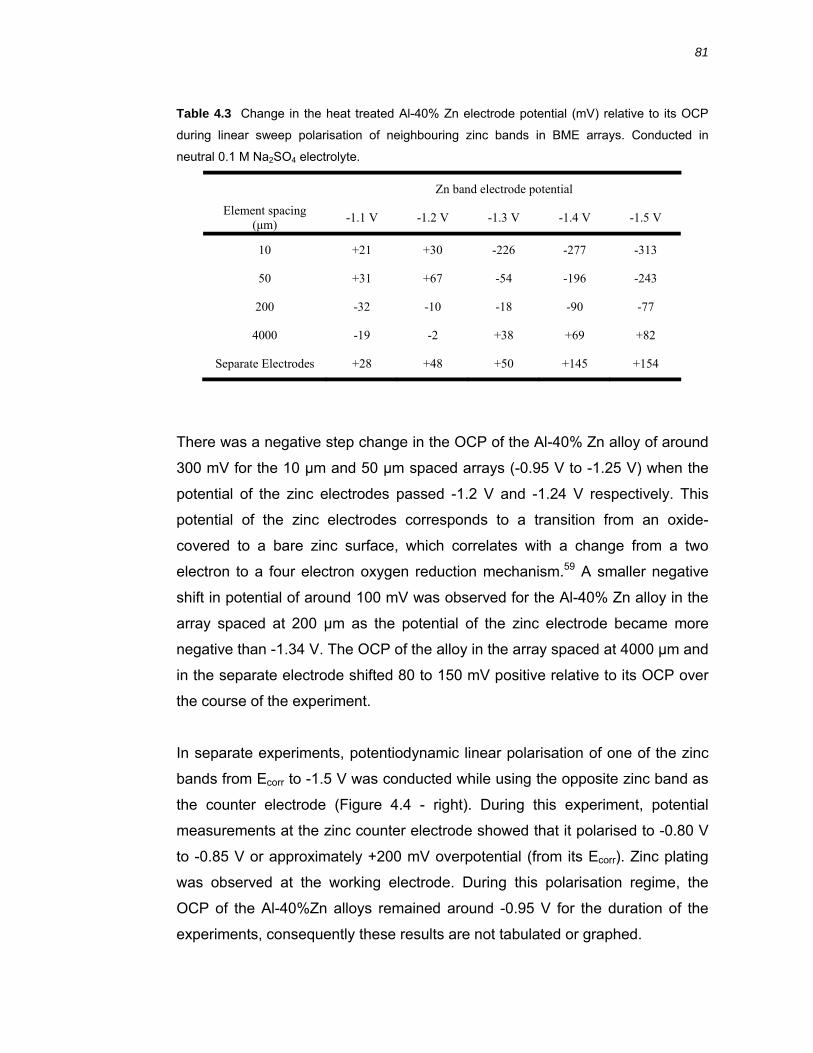
81
Table 4.3 Change in the heat treated Al-40% Zn electrode potential (mV) relative to its OCP
during linear sweep polarisation of neighbouring zinc bands in BME arrays. Conducted in
neutral 0.1 M Na2SO4 electrolyte.
Zn band electrode potential
Element spacing (μm) -1.1 V -1.2 V -1.3 V -1.4 V -1.5 V
10 +21 +30 -226 -277 -313
50 +31 +67 -54 -196 -243
200 -32 -10 -18 -90 -77
4000 -19 -2 +38 +69 +82
Separate Electrodes +28 +48 +50 +145 +154
There was a negative step change in the OCP of the Al-40% Zn alloy of around
300 mV for the 10 μm and 50 μm spaced arrays (-0.95 V to -1.25 V) when the
potential of the zinc electrodes passed -1.2 V and -1.24 V respectively. This
potential of the zinc electrodes corresponds to a transition from an oxide-
covered to a bare zinc surface, which correlates with a change from a two
electron to a four electron oxygen reduction mechanism.59 A smaller negative
shift in potential of around 100 mV was observed for the Al-40% Zn alloy in the
array spaced at 200 μm as the potential of the zinc electrode became more
negative than -1.34 V. The OCP of the alloy in the array spaced at 4000 μm and
in the separate electrode shifted 80 to 150 mV positive relative to its OCP over
the course of the experiment.
In separate experiments, potentiodynamic linear polarisation of one of the zinc
bands from Ecorr to -1.5 V was conducted while using the opposite zinc band as
the counter electrode (Figure 4.4 - right). During this experiment, potential
measurements at the zinc counter electrode showed that it polarised to -0.80 V
to -0.85 V or approximately +200 mV overpotential (from its Ecorr). Zinc plating
was observed at the working electrode. During this polarisation regime, the
OCP of the Al-40%Zn alloys remained around -0.95 V for the duration of the
experiments, consequently these results are not tabulated or graphed.
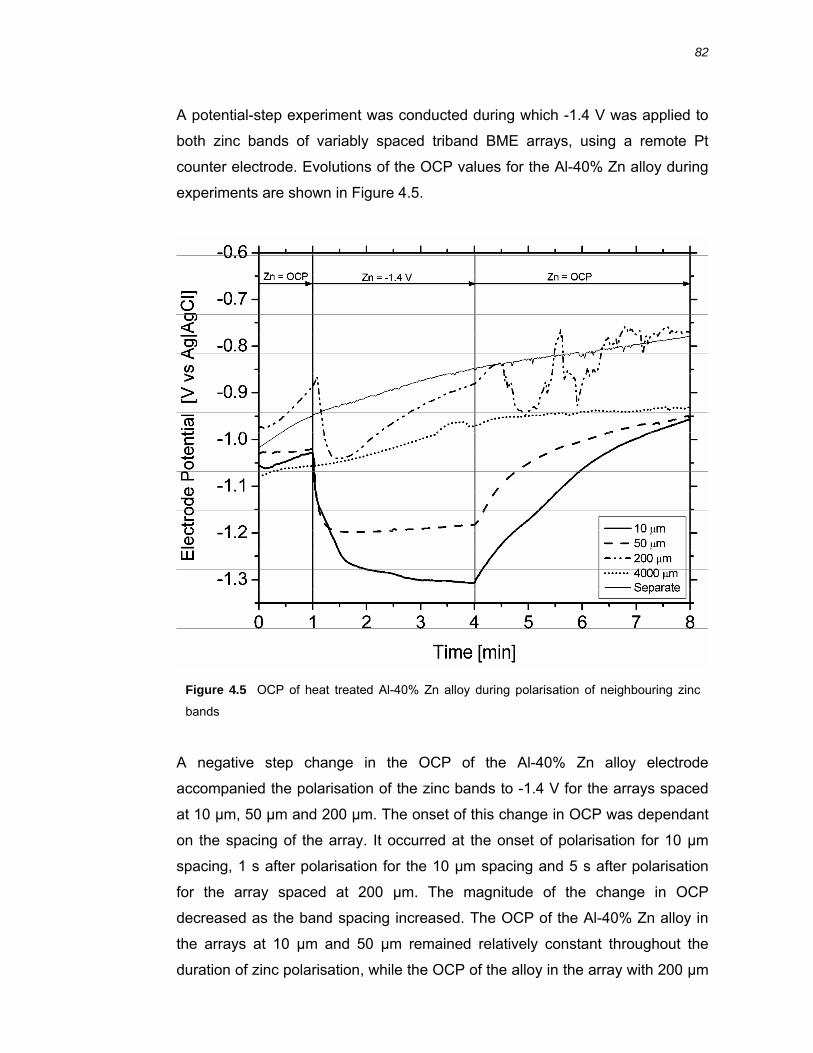
82
A potential-step experiment was conducted during which -1.4 V was applied to
both zinc bands of variably spaced triband BME arrays, using a remote Pt
counter electrode. Evolutions of the OCP values for the Al-40% Zn alloy during
experiments are shown in Figure 4.5.
A negative step change in the OCP of the Al-40% Zn alloy electrode
accompanied the polarisation of the zinc bands to -1.4 V for the arrays spaced
at 10 μm, 50 μm and 200 μm. The onset of this change in OCP was dependant
on the spacing of the array. It occurred at the onset of polarisation for 10 μm
spacing, 1 s after polarisation for the 10 μm spacing and 5 s after polarisation
for the array spaced at 200 μm. The magnitude of the change in OCP
decreased as the band spacing increased. The OCP of the Al-40% Zn alloy in
the arrays at 10 μm and 50 μm remained relatively constant throughout the
duration of zinc polarisation, while the OCP of the alloy in the array with 200 μm
Figure 4.5 OCP of heat treated Al-40% Zn alloy during polarisation of neighbouring zinc
bands
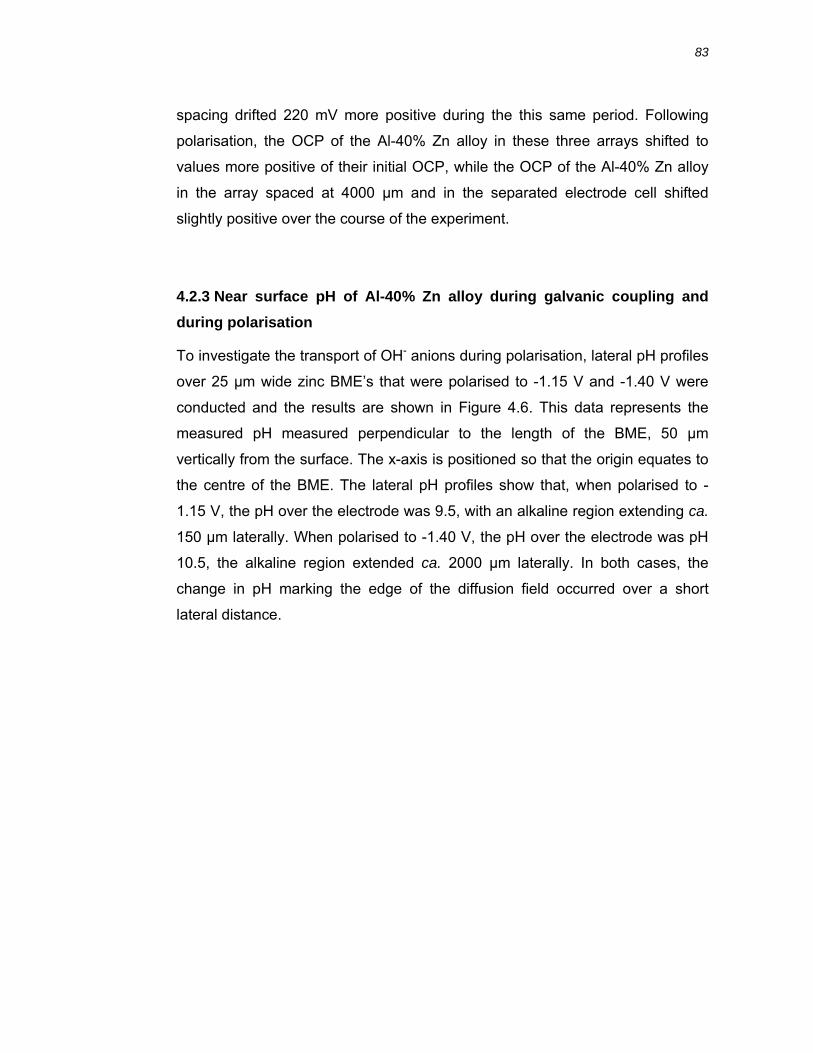
83
spacing drifted 220 mV more positive during the this same period. Following
polarisation, the OCP of the Al-40% Zn alloy in these three arrays shifted to
values more positive of their initial OCP, while the OCP of the Al-40% Zn alloy
in the array spaced at 4000 μm and in the separated electrode cell shifted
slightly positive over the course of the experiment.
4.2.3 Near surface pH of Al-40% Zn alloy during galvanic coupling and during polarisation
To investigate the transport of OH- anions during polarisation, lateral pH profiles
over 25 μm wide zinc BME’s that were polarised to -1.15 V and -1.40 V were
conducted and the results are shown in Figure 4.6. This data represents the
measured pH measured perpendicular to the length of the BME, 50 µm
vertically from the surface. The x-axis is positioned so that the origin equates to
the centre of the BME. The lateral pH profiles show that, when polarised to -
1.15 V, the pH over the electrode was 9.5, with an alkaline region extending ca.
150 µm laterally. When polarised to -1.40 V, the pH over the electrode was pH
10.5, the alkaline region extended ca. 2000 µm laterally. In both cases, the
change in pH marking the edge of the diffusion field occurred over a short
lateral distance.
84
The pH in the near surface region (ca. 50 µm from the surface) of the heat
treated Al-40% Zn alloy was measured at a number of sites over the surface
during both anodic and cathodic electrochemical polarisation. The sites were
randomly selected. The near surface pH was also measured at a number of
sites over the centre of an Zn | Al-40% Zn | Zn BME array (10 µm spacing)
during galvanic coupling. The pH data from these measurements is summarised
in Table 4.4. During anodic polarisation (+200 mV overpotential), there was
significant variation in the near surface pH, from 3.6 to 8.5, with an average
value of 5.6. Under cathodic polarisation (200 mV overpotential), the average
pH over a number of sites was 9.8, ranging from 9.5 to 10.5. Over galvanically
Figure 4.6 Lateral pH profile surrounding Zn BMEs (25 µm wide) undergoing cathodic
polarisation at -1.15 V and -1.40 V in neutral, aerated, unbuffered 0.1 M Na2SO4 electrolyte.
The vertical distance from the tip to the surface was 50 µm and the data was recorded over
20 minutes.
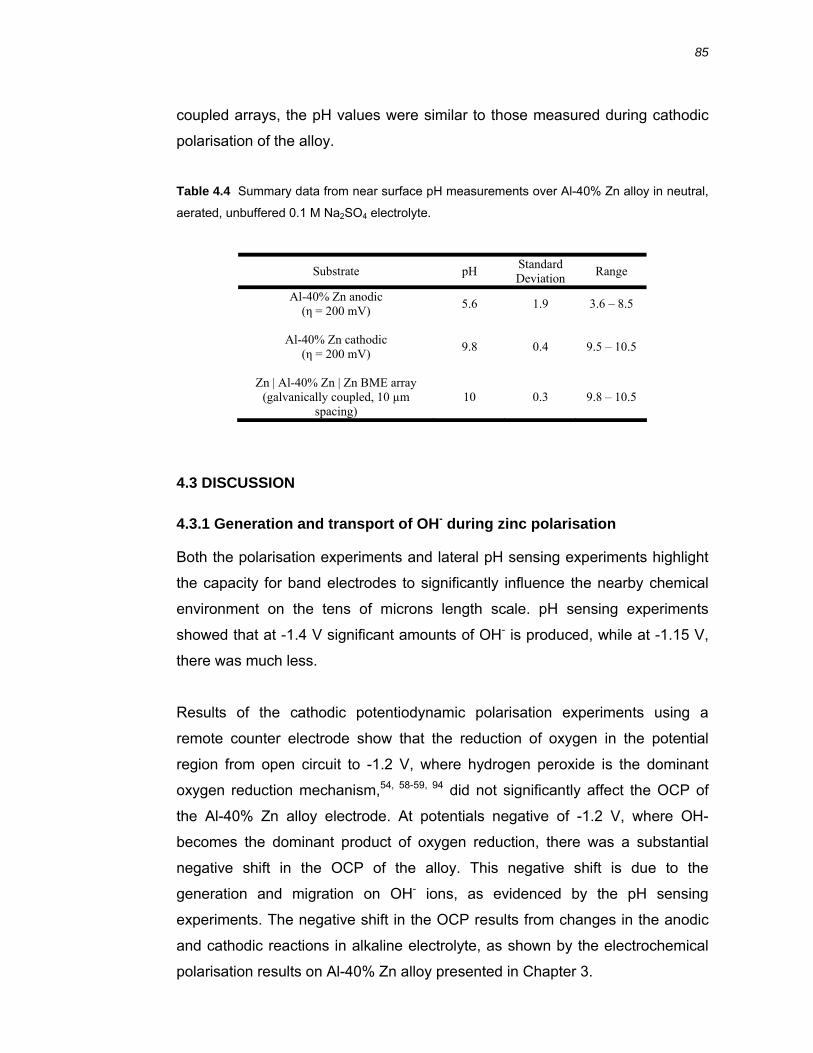
85
coupled arrays, the pH values were similar to those measured during cathodic
polarisation of the alloy.
Table 4.4 Summary data from near surface pH measurements over Al-40% Zn alloy in neutral,
aerated, unbuffered 0.1 M Na2SO4 electrolyte.
Substrate pH Standard Deviation Range
Al-40% Zn anodic (η = 200 mV) 5.6 1.9 3.6 – 8.5
Al-40% Zn cathodic
(η = 200 mV) 9.8 0.4 9.5 – 10.5
Zn | Al-40% Zn | Zn BME array
(galvanically coupled, 10 µm spacing)
10 0.3 9.8 – 10.5
4.3 DISCUSSION
4.3.1 Generation and transport of OH- during zinc polarisation
Both the polarisation experiments and lateral pH sensing experiments highlight
the capacity for band electrodes to significantly influence the nearby chemical
environment on the tens of microns length scale. pH sensing experiments
showed that at -1.4 V significant amounts of OH- is produced, while at -1.15 V,
there was much less.
Results of the cathodic potentiodynamic polarisation experiments using a
remote counter electrode show that the reduction of oxygen in the potential
region from open circuit to -1.2 V, where hydrogen peroxide is the dominant
oxygen reduction mechanism,54, 58-59, 94 did not significantly affect the OCP of
the Al-40% Zn alloy electrode. At potentials negative of -1.2 V, where OH-
becomes the dominant product of oxygen reduction, there was a substantial
negative shift in the OCP of the alloy. This negative shift is due to the
generation and migration on OH- ions, as evidenced by the pH sensing
experiments. The negative shift in the OCP results from changes in the anodic
and cathodic reactions in alkaline electrolyte, as shown by the electrochemical
polarisation results on Al-40% Zn alloy presented in Chapter 3.

86
The apparent delay in the change of OCP observed between the arrays spaced
at 10, 50 and 200 μm is related to diffusion time across the electrode gap, while
the magnitude of the change in potential was proportional to the hydroxide
concentration at the surface.
During potential step experiments where both zinc bands were polarised to -1.4
V to generate hydroxide, the magnitude of the negative shift in OCP for the Al-
40% Zn alloy in the arrays spaced at 10 μm and 50 μm was proportional to the
concentration of hydroxide at the surface. The positive drift in the OCP of the
alloy in the array spaced at 200 μm during the zinc potential step reflects the
smaller impact of pH change at this band separation and the underlying
behaviour of the alloy to spontaneously change to a more positive potential in
this electrolyte, as observed for the largely spaced electrodes. The behaviour of
the OCP of the alloy in the closely spaced arrays on cessation of hydroxide
generation suggests that the pH in the near surface region tended to return to
neutral pH over time due to mixing and diffusion. However, the OCP of the heat
treated alloys did not attain the same values measured for the largely spaced
electrodes, suggesting that the surface of the alloy was altered by exposure to
the alkaline conditions.
There is some discrepancy between the potentiodynamic polarisation data and
the pH sensing data. The OCP of the Al-40% Zn BME was observed to change
only after the zinc electrode potential passed -1.25 V, whereas the pH sensing
data shows a near surface pH of 9.5 when the electrode was poised at -1.15 V.
This discrepancy may be due to the different time scales of each experiment,
the pH measurements being recorded over twenty minutes, allowing time for
development of a larger and more alkaline diffusion field. At these longer time
scales, the influence of vibrations and mixing arising from density gradients in
the electrolyte enhance mass transport, whereas diffusion would be the
principle transport mechanism for the generation-detection experiments.
During cathodic polarisation of one of the zinc bands, using the other zinc band
in the array as the counter electrode, the OCP of the Al- 40% Zn alloy remained
87
around -0.95 V. This result illustrates the importance of the interaction between
the generated species at both the anodic and cathodic sites. During cathodic
polarisation at the Al-40% Zn alloy working electrode, the zinc counter electrode
polarises anodically, producing Zn2+. Diffusion and migration of Zn2+ ions from
the anode and OH- ions from the cathode result in mixing and neutralisation,
buffering the pH over the central Al-40% ZN alloy BME. Furthermore, the
availability of Zn2+ at the working electrode means that Zn2+ competes with
oxygen reduction, reducing the amount of OH- that is produced. These
processes serve to maintain a neutral pH over the Al-40% Zn alloy.
4.3.2 Galvanic coupling of variably spaced BME arrays
The cell potentials for the galvanic couple data were close to the Ecorr of zinc in
both Na2SO4 and NaCl electrolytes, suggesting that the bulk of the galvanic
current arose from oxygen reduction and zinc dissolution reactions. The current
density of the all the couples varied significantly both during the couple period
and between repeat measurements. Furthermore, the polarity reversed during
the couple periods for the 50 µm and 200 µm spaced BME arrays in both
electrolytes. These behaviours are indicative of a small difference in corrosion
potential of the elements of the galvanic cell and hence a small thermodynamic
driving force for galvanic corrosion. Self corrosion of both materials, that is,
where both anodic and cathodic processes exist on one metal in the couple, is
thus expected to occur. The stochastic nature of the galvanic current transients
may be explained considering that localised cells initiate, stay active and
terminate over the surface of both electrodes and these are controlled by
surface variation and localised concentration gradients.
It was predicted from the intersection of the polarisation curves of Al-40% Zn
and Zn that the heat treated Al-40% Zn alloy would act as a cathode and the
zinc as an anode in neutral Na2SO4 electrolyte with a galvanic current of 5 μA
cm-2. The results of galvanic coupling experiments show this behaviour in cells
with large inter-electrode spacing soon after coupling. At longer times, however
the galvanic current density increased significantly (up to 200 µA cm-2),
88
although the polarity remained constant with the zinc electrodes maintaining a
net anodic polarity. The increase in current density at longer times, and
deviation from predicted behaviour, reflect changes in the surface and near
surface environment of the electrodes over time. If cathodic process on the Al-
40% Zn alloy is limiting, then enhanced cathodic processes on the Al-40% Zn
alloy would be the primary contributor to the increasing galvanic current. The
cell potential represents only slight polarisation away from the Ecorr of both
metals, so it would be expected that self corrosion of both Zn and Al-40% Zn
alloy is not affected by galvanic coupling. The behaviour in Cl- electrolyte for the
galvanic couples with large inter-electrode spacing was qualitatively the same,
although there was more variation in the data.
The arrays with small inter-electrode spacing (10 µm, 50 µm, 200 µm) differ
from the behaviour predicted by the intersection of the polarisation curves. The
polarity of the Al-40% Zn alloy in these cases was anodic, with the zinc
polarising cathodically. The current densities varied and there was no
discernable trend between spacing and current or potential. The results
presented suggest that the polarity is affected by the spacing. It is possible that
the interaction of the anodic and cathodic domains on the electrodes has
created localised environment which encourages the anodic processes on the
Al-40% Zn alloy and cathodic processes on the zinc. It is also possible that the
polarity results from the enhanced flux of oxygen to the zinc electrodes, which
drives the zinc to be cathodic. Another explanation arises from the near surface
pH sensing over the Al-40% Zn alloy during galvanic coupling. It is shown that
an alkaline environment is generated over the Al-40% Zn alloy (pH 9.8 to pH
10.5). The alkaline pH is due to cathodic processes, and given the potential of
the galvanic couple, that may occur on both the zinc and the Al-40% Zn alloy.
Results from Chapter 3, as well as those from generation detection experiments
reported above, show that alkaline pH results in the Al-40% Zn alloy exhibiting a
more negative Ecorr as well as enhanced anodic processes. This would drive the
polarity of the galvanic cell to be anodic with respect to the Al-40% Zn alloy.
The polarisation experiments on the BME arrays demonstrate that varying
degrees of diffusional overlap occur at 10 μm, 50 μm and 200 μm spacings. The
89
similarity of the galvanic behaviour between these arrays, however, suggested
that the degree of interaction did not significantly affect the overall galvanic
behaviour of the cells. The more negative cell potential observed for the 10 μm
and 50 μm spaced arrays in the first four hours of coupling may be attributed to
the interaction of the reaction products originating from the bands, but this did
not appear to affect the galvanic current. Inspection of the electrode surfaces
following the galvanic coupling experiments revealed corrosion product
distribution in localised areas. The distribution of solid corrosion product
compounds and surface damage indicated that galvanic cells were established
along the band length as well as between the bands. This localisation of the
galvanic cells lengthwise and laterally complicates the behaviour of the arrays.
In summary, the galvanic couple results demonstrate that the inter-electrode
spacing the bands has a significant effect on the overall behaviour of the array.
A number of possible mechanisms were proposed. Near surface pH sensing
measurements suggest that the alkaline pH over the galvanically coupled array
impel the Al-40% Zn alloy to behave anodically.
4.3.3 Near surface pH over Al-40 % Zn alloy
Near surface pH sensing over cathodically polarised Al-40% Zn alloy show that
the near surface pH was consistently in the range pH 9.5 to pH 10.5. The
consistency of the measurements indicated that the cathodic processes were
uniformly distributed over the electrode.
During anodic polarisation, pH values as low as 3.6 and as high as 8.5 were
measured. The low pH values arose from the hydrolysis of Al3+ and Zn2+ ions
and the buffering effect of these ions is examined in detail in Chapter 5. The
higher pH values (pH 8.5) may have arose from OH- produced by cathodic
processes during polarisation and the open-circuit period. Another mechanism
for OH- generation during anodic polarisation is also possible, the so called
negative difference effect.60 This effect describes the increase in hydrogen
evolution with the increase in anodic current (and anodic overpotential), in
90
apparent contrast with polarisation theory. The negative difference effect is
observed on aluminium and aluminium alloys and has been observed in
experiments conducted on Al-40%Zn at BlueScope Steel whilst being anodically
polarised at relatively high anodic current densities (unpublished results).
The large variation in the pH measurements during anodic polarisation of Al-
40% Zn alloy indicates a spatially localised nature. The pH sensing experiments
over the galvanically coupled BME array showed that the near surface pH was
9.8 – 10.5. The central Al-40% Zn band had a net anodic current and the zinc
bands had a net cathodic current, although the cell potential of -1.03 V indicates
that cathodic processes would occur at appreciable rates on both materials. The
alkaline pH results from oxygen reduction on both electrodes, while the lack of
low pH values may arise from spatial localisation of the anodic processes.
4.3.4 Implications for the bare corrosion behaviour of 55% Al-Zn coating
The results presented here suggest that there is not a strong thermodynamic
driving force for galvanic corrosion between the α- and β-phases that comprise
the surface of the 55% Al-Zn coating. Over relatively long time periods,
selective dissolution of the β-phase is often observed in outdoor exposure. Both
the α- and β-phases may support both anodic and cathodic processes during
galvanic coupling. The overall behaviour is complicated by the fact that
electrolyte composition in the near surface region can have a strong effect on
the location, polarity and magnitude of corrosion current. The Stochastic nature
of the sign and magnitude of the current density during BME array coupling
highlight the transient nature of the corrosion processes in this couple and
suggest that the initiation, propagation and termination of localised cells is of
primary importance. Overlap of anodic and cathodic sites may occur over a
couple of hundred microns, which is much larger than the size of the dendrites,
suggesting that spatial variation of the two phases may not have as large an
influence on the corrosion behaviour as other factors such as composition.
91
The alkaline pH generated from OH- and hydrogen evolution reactions appears
to be uniformly distributed during bare corrosion and may activate the Al-40%
Zn alloy (α-phase) towards anodic dissolution. Neutralisation of the alkaline pH
by metal ions from anodic dissolution is likely to occur at the anodic sites.
4.4 CONCLUSION
Closely spaced BME arrays are found to be a suitable platform for investigating
the galvanic couple behaviour in circumstances where interaction via diffusive
mass transport is important. The variable results in the polarity and current
during galvanic interaction between zinc and Al-40% Zn alloy is not a downfall
of the experimental approach, it is in fact a valuable realisation because of it.
Results in this chapter suggest that changes in the pH in the near surface
region may have the ability to influence a galvanic couple polarity and current of
metals whose corrosion potentials are similar.
The data provided by galvanic corrosion experiments provides a basis to the
foundations of subsequent work that can focus on modelling of the interaction
between the zinc and aluminium-zinc alloys. It is clear that overlap of
electrochemically generated diffusion fields may occur over hundreds of
microns on a short time scale (101 s) or over one to two millimetres on the
longer time scale (103 s) and work in this thesis demonstrates the importance of
pH in this regard. The interaction of anodic and cathodic sites was not spatially
confined to the galvanic interaction between the two phases, so self corrosion of
the metals is significant. Thus an understanding of the overall bare corrosion
behaviour also needs to account for the self corrosion rate of the two phases in
close proximity to each other.
The influence of other corrosion products such as metal ions and hydrogen
peroxide to affect the electrochemistry of the corrosion cells and the effect of
precipitation reactions remain important unknown parameters regarding the
mechanistic understanding of the bare corrosion of 55% Al-Zn alloy.
Chapter 5 | Emulating the galvanic corrosion
of 55% Al-Zn metal coating with steel using
band microelectrode arrays
92
5.1 INTRODUCTION
While the bare corrosion behaviour of the 55% Al-Zn metal coating is an
important facet underpinning the lifetime of unpainted coated steel products, cut
edge corrosion is critical to the lifetime of both painted and unpainted metal
coated products. Literature regarding investigations into the corrosion behaviour
of 55% Al-Zn coated steel has been summarised in Chapter 1. In this brief
introduction, the rationale for the experiment strategy is established.
In the previous chapter, the bare corrosion behaviour of 55% Al-Zn metal
coating was investigated using BME arrays to measure the galvanic interaction
of Al-40% Zn alloy and zinc. The application of BME array electrodes to the cut
edge corrosion cell is an obvious experimental strategy given the similarities
between the geometry of a real cut edge system and the BME arrays.
Importantly, the close proximity of the electrode elements allows the affect of
electrochemically generated products on nearby electrodes to be measured.
Herein, BME arrays are constructed with steel coupled to 55% Al-Zn metal
coating to simulate a real cut edge. In addition, Al-40% Zn alloy and zinc are
also coupled with steel to represent the α- and β-phases respectively.
Using electrochemical polarisation data on zinc, Al-40% Zn alloy and steel, a
theoretical estimation of the galvanic couple behaviour can be made and this is
done for neutral Cl- and SO42- electrolytes in Figure 5.1. In the case of cathodic
processes on steel and anodic processes on zinc, only one set of data is used
as the current densities were similar in both electrolytes (see Figure 3.4 for
zinc). Reported current densities for the polarisation curves of zinc and Al-40 Zn
alloys are scaled down by a factor of 10 to provide a realistic intersection point
given a ten times larger surface area of steel at a painted cut edge for common
gauge steel and metal coating weight for roofing and cladding using in Australia.
The Ecorr of steel is around -0.50 V in neutral Cl- and SO42- electrolytes, which is
400 mV to 500 mV positive of the Ecorr of the zinc and Al-40% Zn alloys. The
large difference in potential results in a strong thermodynamic driving force for
the galvanic cell. Unlike the couple between Zn and Al-40% Zn alloy where
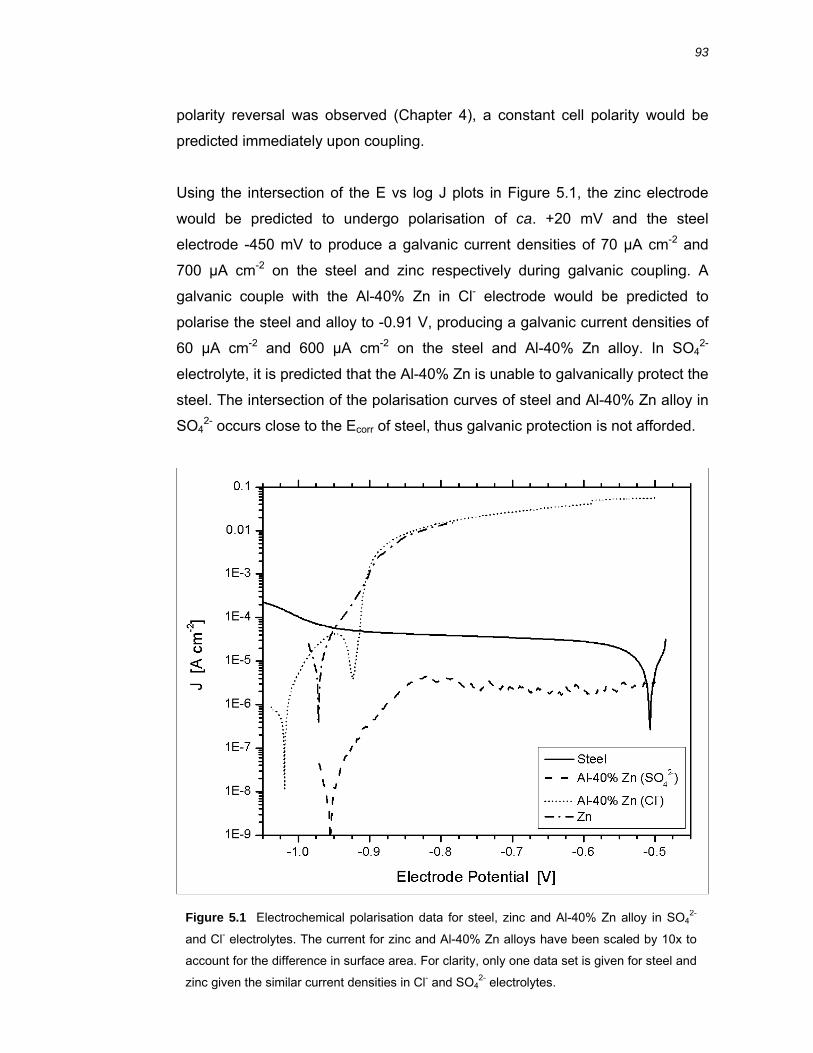
93
polarity reversal was observed (Chapter 4), a constant cell polarity would be
predicted immediately upon coupling.
Using the intersection of the E vs log J plots in Figure 5.1, the zinc electrode
would be predicted to undergo polarisation of ca. +20 mV and the steel
electrode -450 mV to produce a galvanic current densities of 70 µA cm-2 and
700 µA cm-2 on the steel and zinc respectively during galvanic coupling. A
galvanic couple with the Al-40% Zn in Cl- electrode would be predicted to
polarise the steel and alloy to -0.91 V, producing a galvanic current densities of
60 µA cm-2 and 600 µA cm-2 on the steel and Al-40% Zn alloy. In SO42-
electrolyte, it is predicted that the Al-40% Zn is unable to galvanically protect the
steel. The intersection of the polarisation curves of steel and Al-40% Zn alloy in
SO42- occurs close to the Ecorr of steel, thus galvanic protection is not afforded.
Figure 5.1 Electrochemical polarisation data for steel, zinc and Al-40% Zn alloy in SO42-
and Cl- electrolytes. The current for zinc and Al-40% Zn alloys have been scaled by 10x to
account for the difference in surface area. For clarity, only one data set is given for steel and
zinc given the similar current densities in Cl- and SO42- electrolytes.
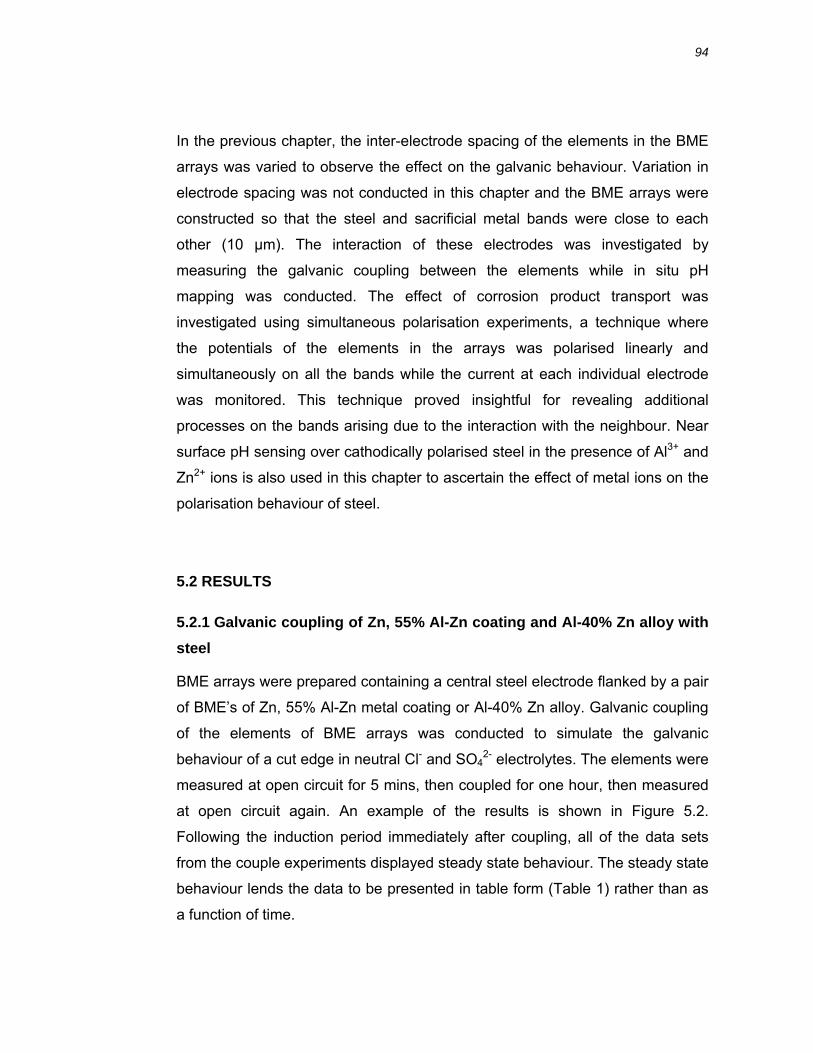
94
In the previous chapter, the inter-electrode spacing of the elements in the BME
arrays was varied to observe the effect on the galvanic behaviour. Variation in
electrode spacing was not conducted in this chapter and the BME arrays were
constructed so that the steel and sacrificial metal bands were close to each
other (10 µm). The interaction of these electrodes was investigated by
measuring the galvanic coupling between the elements while in situ pH
mapping was conducted. The effect of corrosion product transport was
investigated using simultaneous polarisation experiments, a technique where
the potentials of the elements in the arrays was polarised linearly and
simultaneously on all the bands while the current at each individual electrode
was monitored. This technique proved insightful for revealing additional
processes on the bands arising due to the interaction with the neighbour. Near
surface pH sensing over cathodically polarised steel in the presence of Al3+ and
Zn2+ ions is also used in this chapter to ascertain the effect of metal ions on the
polarisation behaviour of steel.
5.2 RESULTS
5.2.1 Galvanic coupling of Zn, 55% Al-Zn coating and Al-40% Zn alloy with steel
BME arrays were prepared containing a central steel electrode flanked by a pair
of BME’s of Zn, 55% Al-Zn metal coating or Al-40% Zn alloy. Galvanic coupling
of the elements of BME arrays was conducted to simulate the galvanic
behaviour of a cut edge in neutral Cl- and SO42- electrolytes. The elements were
measured at open circuit for 5 mins, then coupled for one hour, then measured
at open circuit again. An example of the results is shown in Figure 5.2.
Following the induction period immediately after coupling, all of the data sets
from the couple experiments displayed steady state behaviour. The steady state
behaviour lends the data to be presented in table form (Table 1) rather than as
a function of time.
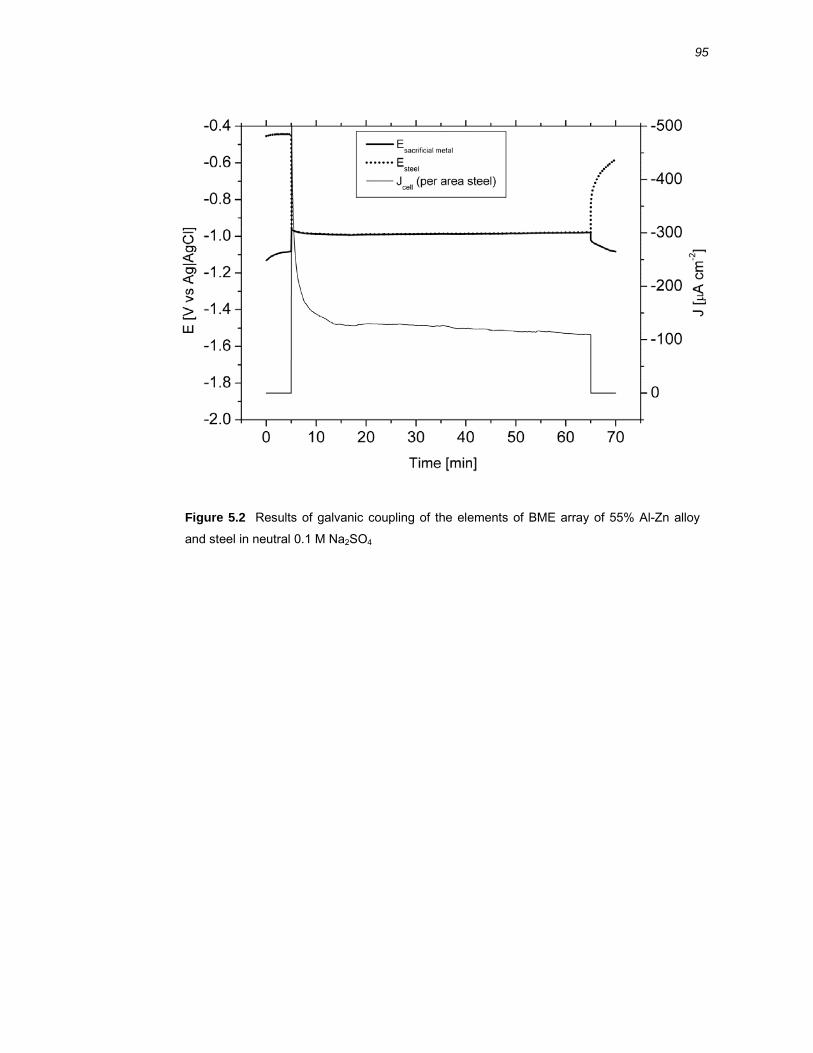
95
Figure 5.2 Results of galvanic coupling of the elements of BME array of 55% Al-Zn alloy
and steel in neutral 0.1 M Na2SO4
96
Table 5.1 Summary of potential and current for galvanic couple experiments on BME arrays. Negative current density indicates cathodic polarity in the
couple, while positive current density indicates anodic polarity. Both electrodes have the same potential (Ecell) during the couple period.
Sacrificial Area Ecell Jsteel JSac metal OCPSac Metal (V) OCPSteel (V) Metal ratio Electrolyte (V) (µA cm-2) (µA cm-2) Before After Before After
Zn 4.3 : 1 Cl- -1.00 -74 +310 -1.01 -1.02 -0.45 -0.50
Zn 4.3 : 1 SO42- -1.05 -98 +420 -1.03 -1.07 -0.48 -0.58
Al-40% Zn 3.1 : 1 Cl- -0.92 -85 +266 -1.01 -1.04 -0.39 -0.49
Al-40% Zn 3.1 : 1 SO42- -0.66 -38 +120 -1.03 -1.10 -0.47 -0.60
55% Al-Zn 5.1 : 1 Cl- -0.93 -95 +487 -0.91 -1.01 -0.40 -0.56
55% Al-Zn 5.1 : 1 SO42- -0.98 -110 +562 -1.08 -1.09 -0.44 -0.58
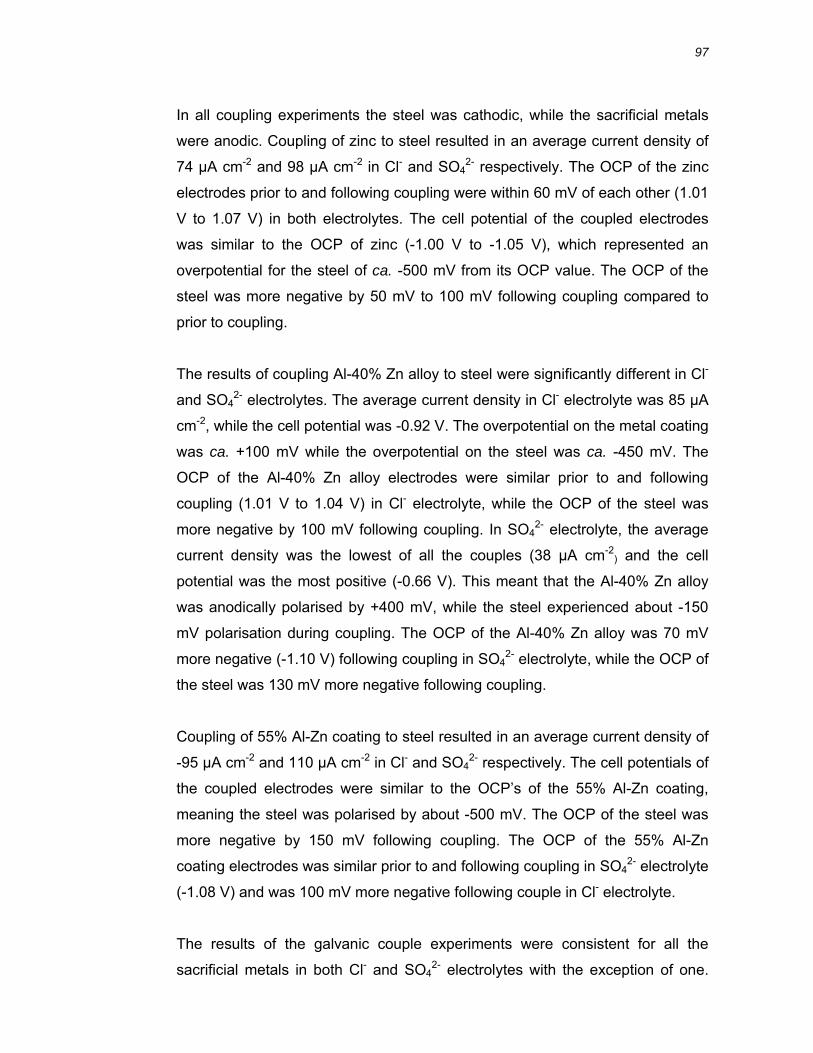
97
In all coupling experiments the steel was cathodic, while the sacrificial metals
were anodic. Coupling of zinc to steel resulted in an average current density of
74 µA cm-2 and 98 µA cm-2 in Cl- and SO42- respectively. The OCP of the zinc
electrodes prior to and following coupling were within 60 mV of each other (1.01
V to 1.07 V) in both electrolytes. The cell potential of the coupled electrodes
was similar to the OCP of zinc (-1.00 V to -1.05 V), which represented an
overpotential for the steel of ca. -500 mV from its OCP value. The OCP of the
steel was more negative by 50 mV to 100 mV following coupling compared to
prior to coupling.
The results of coupling Al-40% Zn alloy to steel were significantly different in Cl-
and SO42- electrolytes. The average current density in Cl- electrolyte was 85 µA
cm-2, while the cell potential was -0.92 V. The overpotential on the metal coating
was ca. +100 mV while the overpotential on the steel was ca. -450 mV. The
OCP of the Al-40% Zn alloy electrodes were similar prior to and following
coupling (1.01 V to 1.04 V) in Cl- electrolyte, while the OCP of the steel was
more negative by 100 mV following coupling. In SO42- electrolyte, the average
current density was the lowest of all the couples (38 µA cm-2) and the cell
potential was the most positive (-0.66 V). This meant that the Al-40% Zn alloy
was anodically polarised by +400 mV, while the steel experienced about -150
mV polarisation during coupling. The OCP of the Al-40% Zn alloy was 70 mV
more negative (-1.10 V) following coupling in SO42- electrolyte, while the OCP of
the steel was 130 mV more negative following coupling.
Coupling of 55% Al-Zn coating to steel resulted in an average current density of
-95 µA cm-2 and 110 µA cm-2 in Cl- and SO42- respectively. The cell potentials of
the coupled electrodes were similar to the OCP’s of the 55% Al-Zn coating,
meaning the steel was polarised by about -500 mV. The OCP of the steel was
more negative by 150 mV following coupling. The OCP of the 55% Al-Zn
coating electrodes was similar prior to and following coupling in SO42- electrolyte
(-1.08 V) and was 100 mV more negative following couple in Cl- electrolyte.
The results of the galvanic couple experiments were consistent for all the
sacrificial metals in both Cl- and SO42- electrolytes with the exception of one.
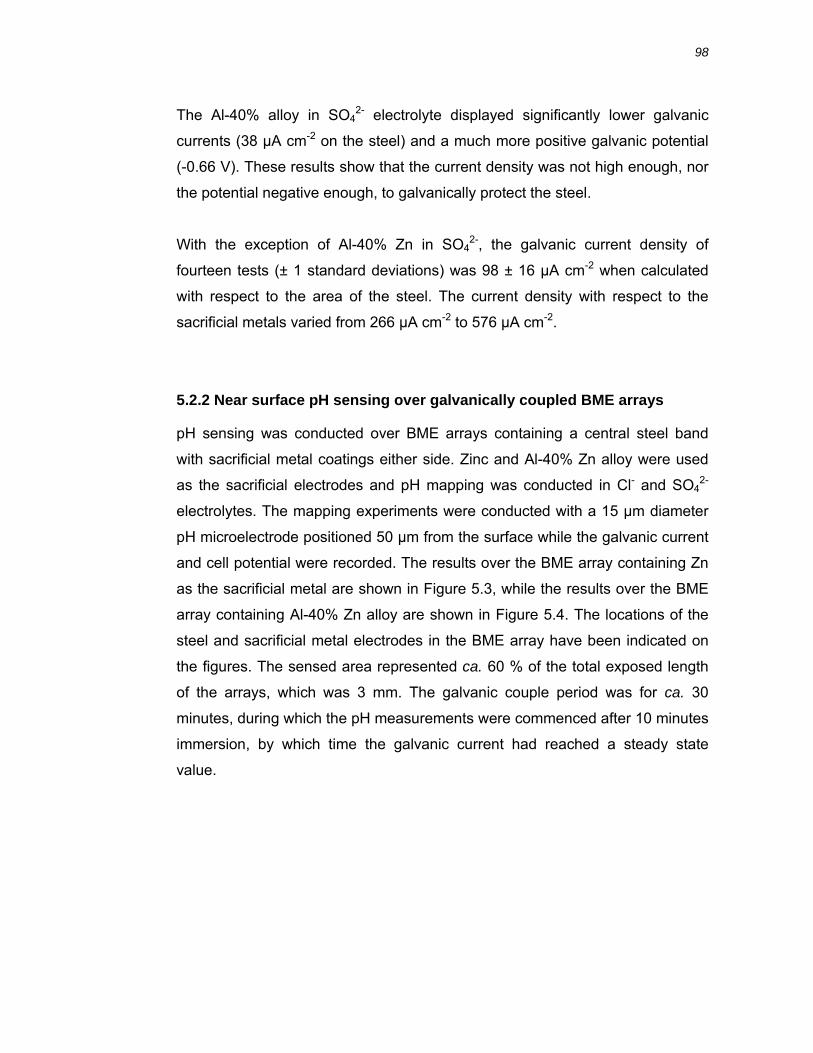
98
The Al-40% alloy in SO42- electrolyte displayed significantly lower galvanic
currents (38 µA cm-2 on the steel) and a much more positive galvanic potential
(-0.66 V). These results show that the current density was not high enough, nor
the potential negative enough, to galvanically protect the steel.
With the exception of Al-40% Zn in SO42-, the galvanic current density of
fourteen tests (± 1 standard deviations) was 98 ± 16 µA cm-2 when calculated
with respect to the area of the steel. The current density with respect to the
sacrificial metals varied from 266 µA cm-2 to 576 µA cm-2.
5.2.2 Near surface pH sensing over galvanically coupled BME arrays
pH sensing was conducted over BME arrays containing a central steel band
with sacrificial metal coatings either side. Zinc and Al-40% Zn alloy were used
as the sacrificial electrodes and pH mapping was conducted in Cl- and SO42-
electrolytes. The mapping experiments were conducted with a 15 µm diameter
pH microelectrode positioned 50 µm from the surface while the galvanic current
and cell potential were recorded. The results over the BME array containing Zn
as the sacrificial metal are shown in Figure 5.3, while the results over the BME
array containing Al-40% Zn alloy are shown in Figure 5.4. The locations of the
steel and sacrificial metal electrodes in the BME array have been indicated on
the figures. The sensed area represented ca. 60 % of the total exposed length
of the arrays, which was 3 mm. The galvanic couple period was for ca. 30
minutes, during which the pH measurements were commenced after 10 minutes
immersion, by which time the galvanic current had reached a steady state
value.
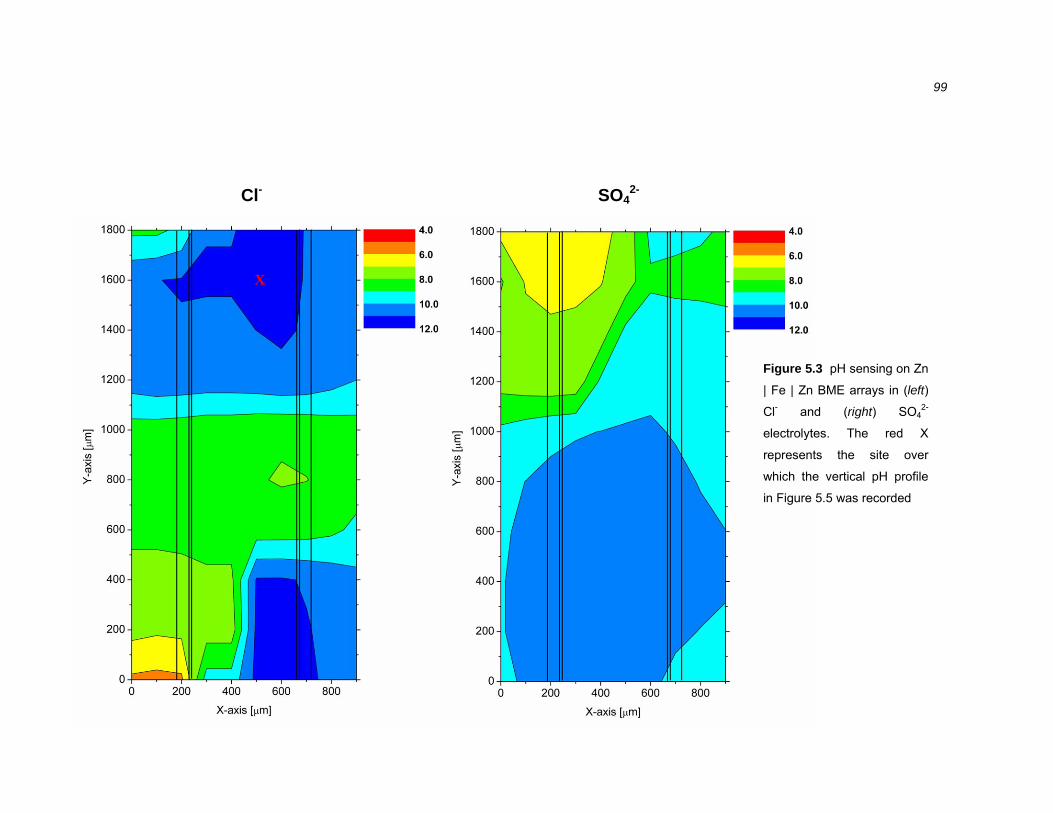
99
Figure 5.3 pH sensing on Zn
| Fe | Zn BME arrays in (left)
Cl- and (right) SO42-
electrolytes. The red X
represents the site over
which the vertical pH profile
in Figure 5.5 was recorded
X
Cl- SO42-
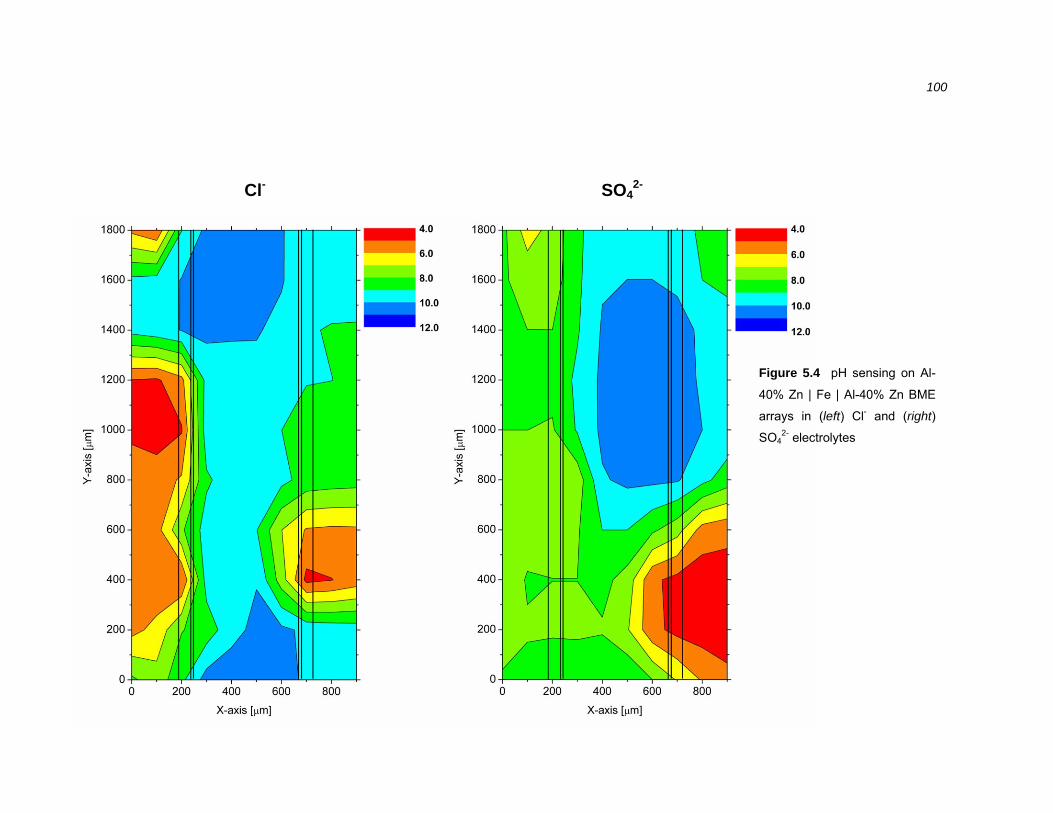
100
Figure 5.4 pH sensing on Al-
40% Zn | Fe | Al-40% Zn BME
arrays in (left) Cl- and (right)
SO42- electrolytes
Cl- SO42-
101
The near surface pH over BME arrays containing zinc ranged from 5.7 to 11.3
in Cl- and 6.5 to 10.4 in SO42- electrolytes. In Cl- electrolyte, there was a large
alkaline region at the top and at the bottom of the map, extending >500 µm.
These alkaline regions were centred on the steel electrode with some over lap
of the alkaline region over the zinc bands. A lower pH region (5.7 to 7.0) was
also present on the edge of the map, adjacent to one of the zinc band. The local
pH zones were on the size scale of a few hundred microns and its centre was
located off the map. In SO42- electrolyte there was a single large alkaline region
centred over the steel band that extended over the entire width of the BME
array. There was a lower pH region (6.5 to 7.0), which was ca. 400 µm in
diameter, centred over one of the zinc bands of the array. In between these two
regions was a diffuse neutral pH region.
The near surface pH measurements over the BME arrays containing Al-40% Zn
alloy ranged from 4.4 to 10.6 in Cl- electrolyte and 4.4 to 10.4 in SO42-
electrolyte. In Cl- electrolyte, there were two low pH regions (< 5.0) which were
situated on each of the Al-40% Zn bands and extended laterally away from the
steel. Surrounding these low pH regions were near neutral regions. There were
two high pH regions (> 10.0) centred over the steel, encompassing its width (ca.
400 µm). The area between the centres of the alkaline and acidic zones was pH
9.0 to pH 10.0.
pH sensing over the Al-40% Zn BME array in SO42- electrolyte revealed an
acidic zone (pH 4.0 – 5.0) that covered a small part of one of the Al-40% Zn
alloy bands and extended laterally away from the array. There was an alkaline
region (pH 10.0 – 11.0) centred on the steel band and overlapping one of the
Al-40% Zn bands, it was approximately 700 µm by 400 µm in size. The mapped
area outside of these regions had a pH that was slightly alkaline (pH 7.0 to pH
9.0).
The current density on the steel was ca. 90 to 105 µA cm-2 for the zinc
containing BME arrays in Cl- and SO42- electrolytes. The Al-40% Zn BME arrays
developed a galvanic current density of ca. 90 to 105 µA cm-2 in Cl- electrolyte
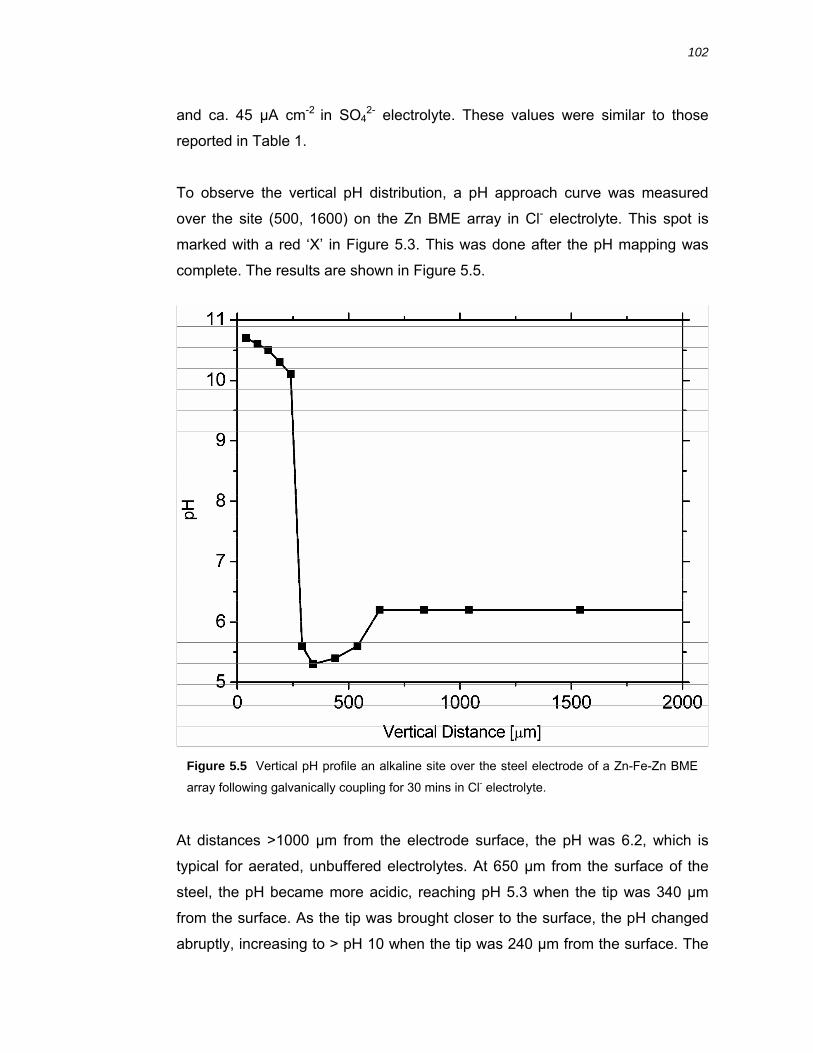
102
and ca. 45 µA cm-2 in SO42- electrolyte. These values were similar to those
reported in Table 1.
To observe the vertical pH distribution, a pH approach curve was measured
over the site (500, 1600) on the Zn BME array in Cl- electrolyte. This spot is
marked with a red ‘X’ in Figure 5.3. This was done after the pH mapping was
complete. The results are shown in Figure 5.5.
At distances >1000 µm from the electrode surface, the pH was 6.2, which is
typical for aerated, unbuffered electrolytes. At 650 µm from the surface of the
steel, the pH became more acidic, reaching pH 5.3 when the tip was 340 µm
from the surface. As the tip was brought closer to the surface, the pH changed
abruptly, increasing to > pH 10 when the tip was 240 µm from the surface. The
Figure 5.5 Vertical pH profile an alkaline site over the steel electrode of a Zn-Fe-Zn BME
array following galvanically coupling for 30 mins in Cl- electrolyte.
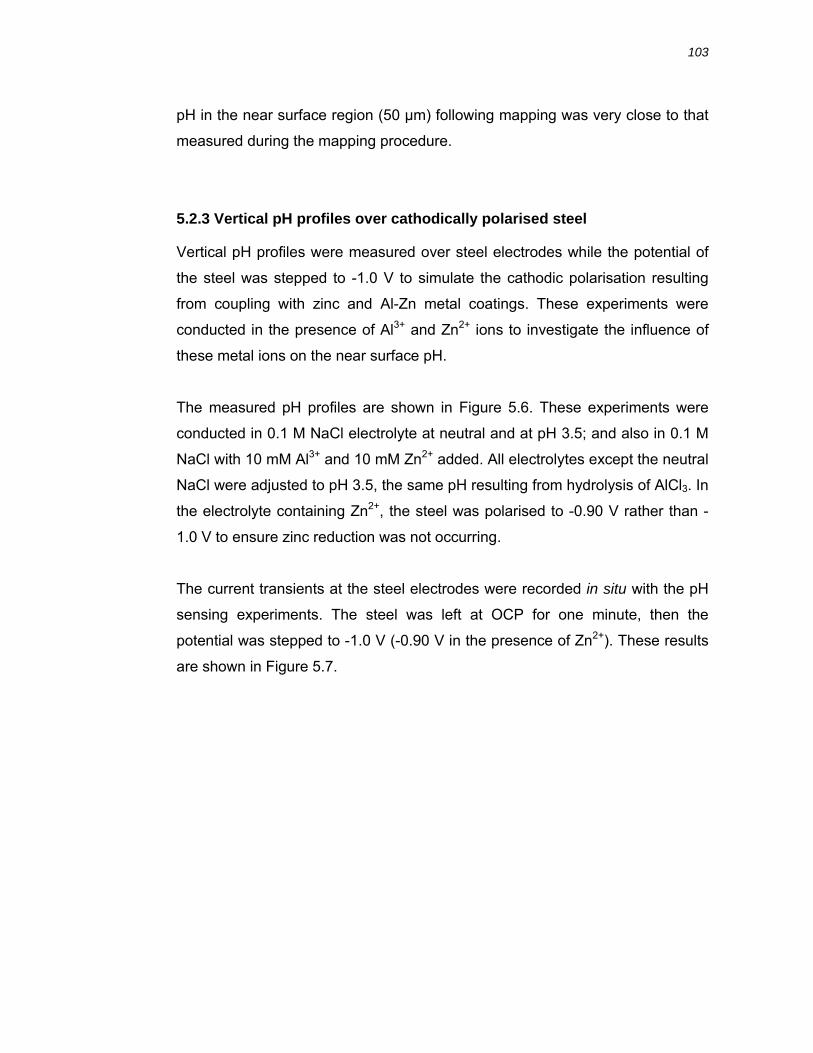
103
pH in the near surface region (50 µm) following mapping was very close to that
measured during the mapping procedure.
5.2.3 Vertical pH profiles over cathodically polarised steel
Vertical pH profiles were measured over steel electrodes while the potential of
the steel was stepped to -1.0 V to simulate the cathodic polarisation resulting
from coupling with zinc and Al-Zn metal coatings. These experiments were
conducted in the presence of Al3+ and Zn2+ ions to investigate the influence of
these metal ions on the near surface pH.
The measured pH profiles are shown in Figure 5.6. These experiments were
conducted in 0.1 M NaCl electrolyte at neutral and at pH 3.5; and also in 0.1 M
NaCl with 10 mM Al3+ and 10 mM Zn2+ added. All electrolytes except the neutral
NaCl were adjusted to pH 3.5, the same pH resulting from hydrolysis of AlCl3. In
the electrolyte containing Zn2+, the steel was polarised to -0.90 V rather than -
1.0 V to ensure zinc reduction was not occurring.
The current transients at the steel electrodes were recorded in situ with the pH
sensing experiments. The steel was left at OCP for one minute, then the
potential was stepped to -1.0 V (-0.90 V in the presence of Zn2+). These results
are shown in Figure 5.7.
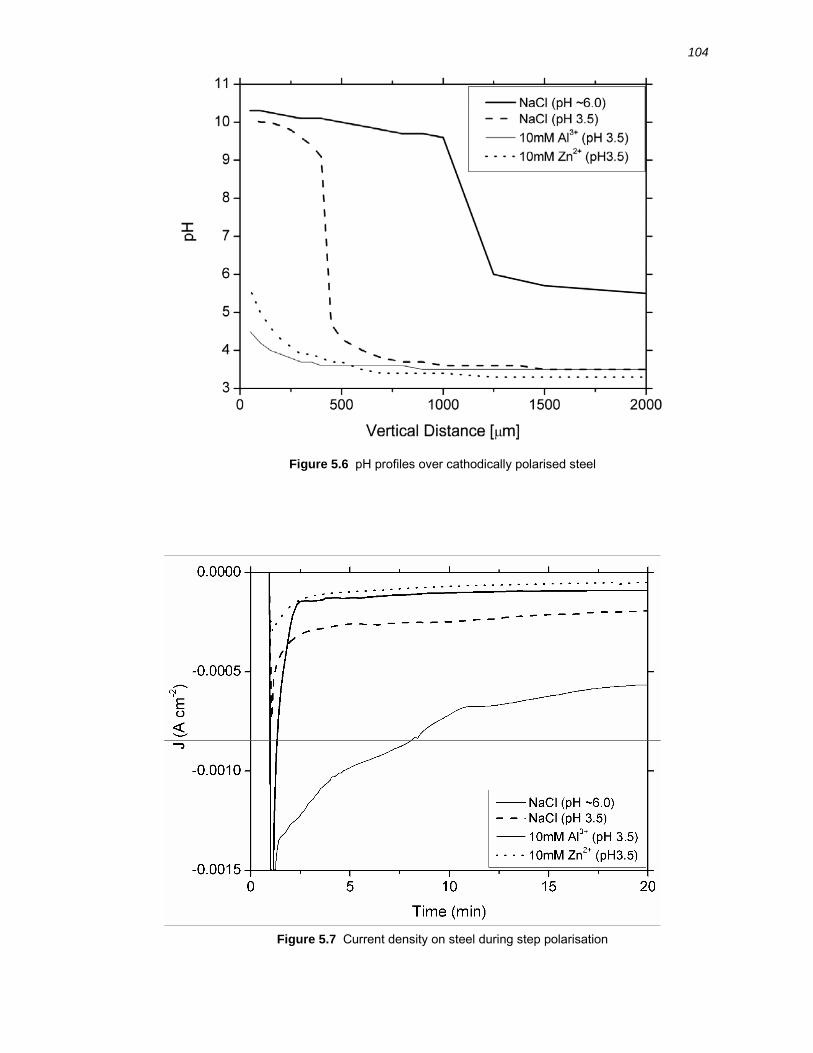
104
Figure 5.6 pH profiles over cathodically polarised steel
Figure 5.7 Current density on steel during step polarisation
105
In neutral 0.1 M NaCl electrolyte without metal ions added, the pH close to the
surface of the polarised steel band was around 10 and the alkaline region
extended ca. 1000 µm into the electrolyte (Figure 5.6). The pH change between
the alkaline region and the bulk was sharp and occurred over a short distance.
The corresponding current transient for the steel electrode decayed rapidly
within the first minute of polarisation and stabilised at a steady state value of ca.
90 µA cm-2 (Figure 5.7).
The near surface region of the steel immersed in the 0.1 M NaCl electrolyte at
pH 3.5 had a pH of around 10, which was similar to that measured in the neutral
0.1 M NaCl. The alkaline zone extended 500 µm into the electrolyte, much less
than that measured for the neutral electrolyte and the pH also changed very
rapidly from alkaline in the near surface region to pH 3.5 of the bulk electrolyte.
The corresponding current transient on the steel electrode decayed rapidly,
approaching a steady state value of 200 – 250 µA cm-2 within 5 minutes.
In 0.1M NaCl with 10mM Zn2+ added and adjusted to pH 3.5, the near surface
pH during polarisation of the steel was ca. 5.5. The pH changed gradually to the
bulk value of 3.5 over a distance of 500 µm, rather than the sharp pH change
observed in the two electrolytes devoid of metal ions. The cathodic current
density on the steel decayed rapidly in the first two minutes, stabilising around
50 – 70 µA cm-2.
When polarisation was conducted in 0.1 M NaCl with 10 mM Al3+ added to the
electrolyte, the pH in the near surface region was close to 4.5. The pH changed
gradually to that of the bulk electrolyte (pH 3.5) over ca. 400 µm, similarly to the
electrolyte containing Zn2+. The cathodic current on the steel in the electrolyte
containing Al3+ was significantly higher than observed in the other electrolytes
and did not exhibit a rapid decay, but dropped from 1300 to 680 µA cm-2 in the
first 10 minutes and from 680 to 570 µA cm-2 in the second 10 minutes. Bubbles
of hydrogen were observed on the steel electrode during polarisation in this
electrolyte.
106
5.2.4 Electrochemical polarisation experiments
Electrochemical polarisation experiments on steel were conducted in the
presence of Al3+ and Zn2+ ions. Results of polarisation of steel in 0.1 M NaCl
adjusted to pH 3.5, NaCl with 10 mM Al3+ added and NaCl with 10 mM Zn2+
added are shown in Figure 5.8. The potential was swept from slightly positive of
the corrosion potential to -1.0 V. The cathodic polarisation behaviour of the steel
in acidic NaCl electrolyte has been well reported and is typical of the data
presented in Figure 5.8.128 The polarisation curve exhibits a diffusion limited
plateau from the corrosion potential (-0.51 V) to ca. -0.95 V with a current
density of 40 µA cm-2, which arises from diffusion limited oxygen and proton
reduction. In the electrolyte containing 10 mM Al3+ at pH 3.5, the steel corrosion
potential was shifted negative by 150 mV and the cathodic current density was
over an order of magnitude larger over the whole cathodic potential range. In
the electrolyte containing Zn2+ at pH 3.5, the cathodic current density on the
steel was similar to the NaCl electrolyte at pH 3.5, with the corrosion potential
shifted positive by 30 mV.
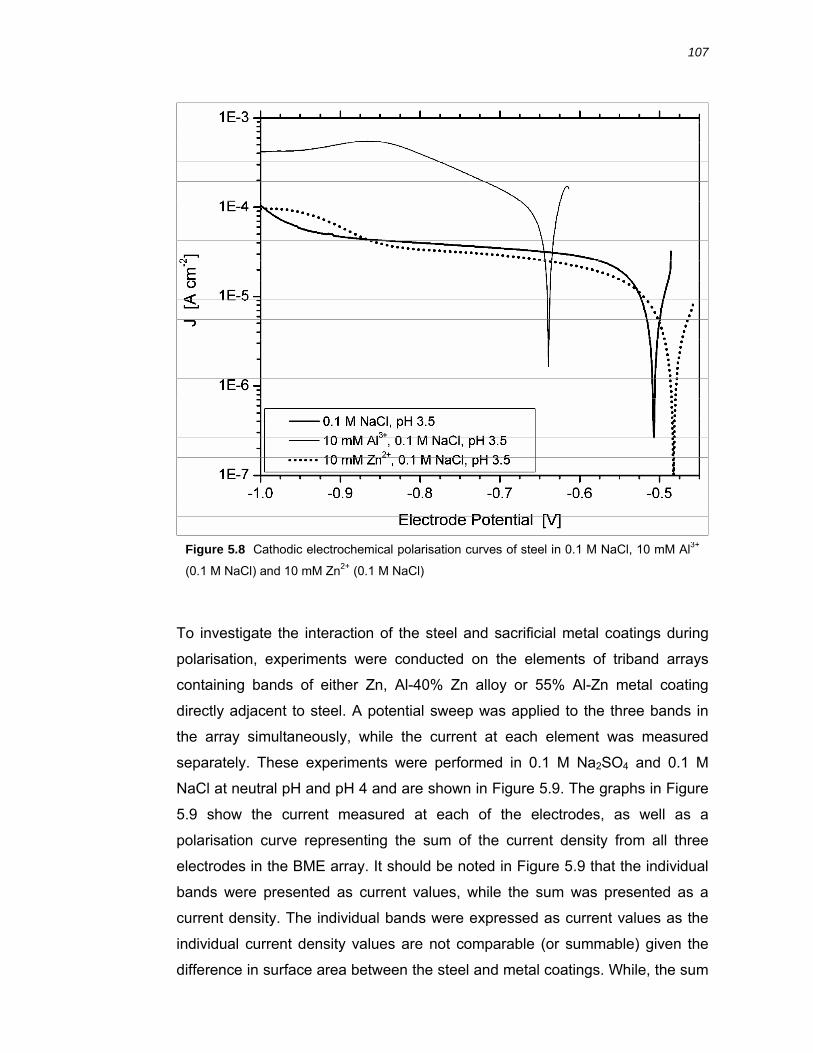
107
To investigate the interaction of the steel and sacrificial metal coatings during
polarisation, experiments were conducted on the elements of triband arrays
containing bands of either Zn, Al-40% Zn alloy or 55% Al-Zn metal coating
directly adjacent to steel. A potential sweep was applied to the three bands in
the array simultaneously, while the current at each element was measured
separately. These experiments were performed in 0.1 M Na2SO4 and 0.1 M
NaCl at neutral pH and pH 4 and are shown in Figure 5.9. The graphs in Figure
5.9 show the current measured at each of the electrodes, as well as a
polarisation curve representing the sum of the current density from all three
electrodes in the BME array. It should be noted in Figure 5.9 that the individual
bands were presented as current values, while the sum was presented as a
current density. The individual bands were expressed as current values as the
individual current density values are not comparable (or summable) given the
difference in surface area between the steel and metal coatings. While, the sum
Figure 5.8 Cathodic electrochemical polarisation curves of steel in 0.1 M NaCl, 10 mM Al3+
(0.1 M NaCl) and 10 mM Zn2+ (0.1 M NaCl)
108
was expressed as current density as it is what would be reported for a polarised
cut edge.
Only polarisation curves in neutral electrolyte are shown as the polarisation
curves in pH 4 electrolytes were indistinguishable to those in neutral electrolyte.
The sum polarisation curve reflects the response that would be measured at a
polarised cut edge. The plots for the steel and metal coating are expressed in
terms of absolute current so they may be directly compared; while the sum
polarisation curve is expressed as a current density (combined surface area of
the steel and metal coating). The corrosion current (Icorr) and corrosion potential
(Ecorr) of the sacrificial metals and of the summed data were determined from
the Tafel plots and are given in Table 2. Icorr values for the sacrificial metal foils
are reported per surface area of the two sacrificial foils, while Icorr for the
summed cell is reported per total surface area of the three electrodes in the
array.
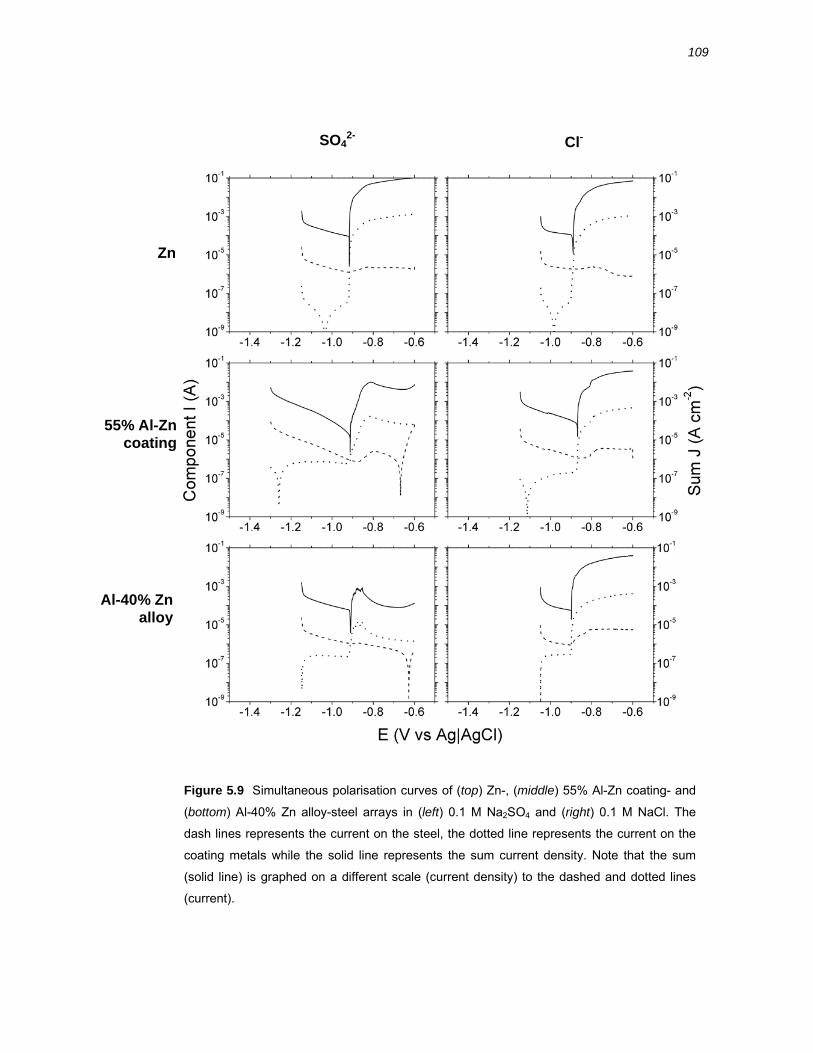
109
Figure 5.9 Simultaneous polarisation curves of (top) Zn-, (middle) 55% Al-Zn coating- and
(bottom) Al-40% Zn alloy-steel arrays in (left) 0.1 M Na2SO4 and (right) 0.1 M NaCl. The
dash lines represents the current on the steel, the dotted line represents the current on the
coating metals while the solid line represents the sum current density. Note that the sum
(solid line) is graphed on a different scale (current density) to the dashed and dotted lines
(current).
Zn
55% Al-Zn coating
Al-40% Zn alloy
SO42- Cl-
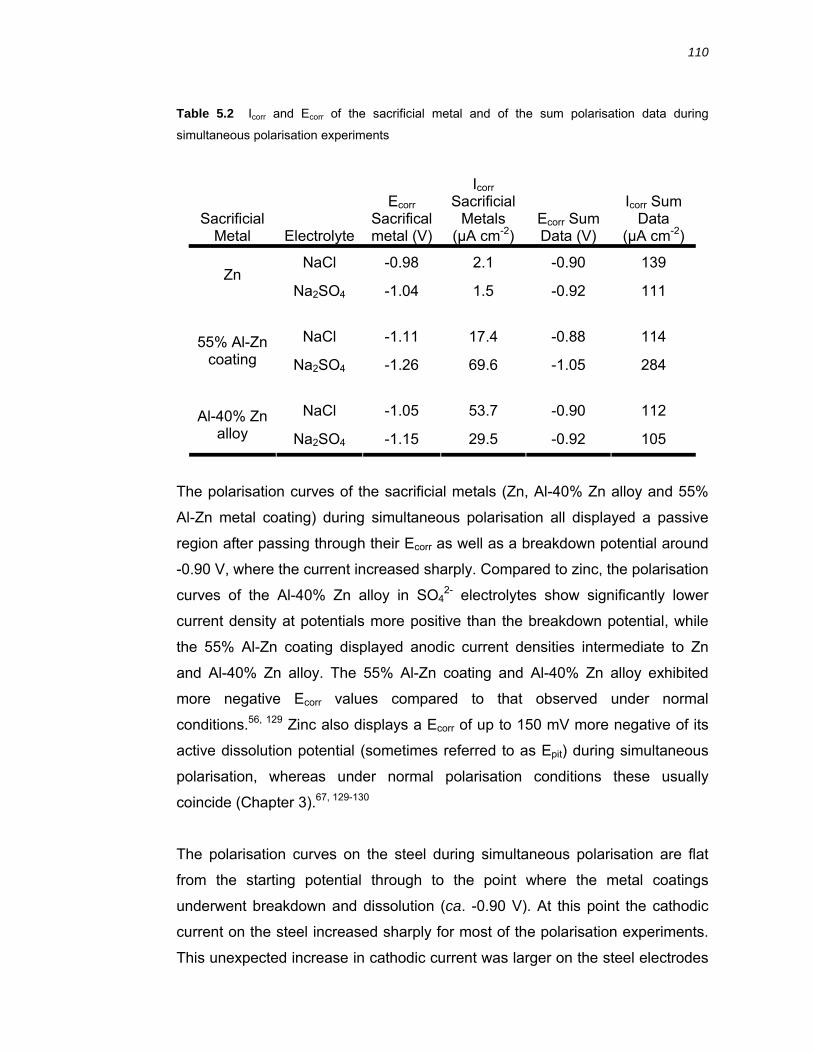
110
Table 5.2 Icorr and Ecorr of the sacrificial metal and of the sum polarisation data during
simultaneous polarisation experiments
Sacrificial Metal Electrolyte
Ecorr Sacrifical metal (V)
Icorr Sacrificial
Metals (µA cm-2)
Ecorr Sum Data (V)
Icorr Sum Data
(µA cm-2)
NaCl -0.98 2.1 -0.90 139 Zn
Na2SO4 -1.04 1.5 -0.92 111
NaCl -1.11 17.4 -0.88 114 55% Al-Zn coating Na2SO4 -1.26 69.6 -1.05 284
NaCl -1.05 53.7 -0.90 112 Al-40% Zn
alloy Na2SO4 -1.15 29.5 -0.92 105
The polarisation curves of the sacrificial metals (Zn, Al-40% Zn alloy and 55%
Al-Zn metal coating) during simultaneous polarisation all displayed a passive
region after passing through their Ecorr as well as a breakdown potential around
-0.90 V, where the current increased sharply. Compared to zinc, the polarisation
curves of the Al-40% Zn alloy in SO42- electrolytes show significantly lower
current density at potentials more positive than the breakdown potential, while
the 55% Al-Zn coating displayed anodic current densities intermediate to Zn
and Al-40% Zn alloy. The 55% Al-Zn coating and Al-40% Zn alloy exhibited
more negative Ecorr values compared to that observed under normal
conditions.56, 129 Zinc also displays a Ecorr of up to 150 mV more negative of its
active dissolution potential (sometimes referred to as Epit) during simultaneous
polarisation, whereas under normal polarisation conditions these usually
coincide (Chapter 3).67, 129-130
The polarisation curves on the steel during simultaneous polarisation are flat
from the starting potential through to the point where the metal coatings
underwent breakdown and dissolution (ca. -0.90 V). At this point the cathodic
current on the steel increased sharply for most of the polarisation experiments.
This unexpected increase in cathodic current was larger on the steel electrodes
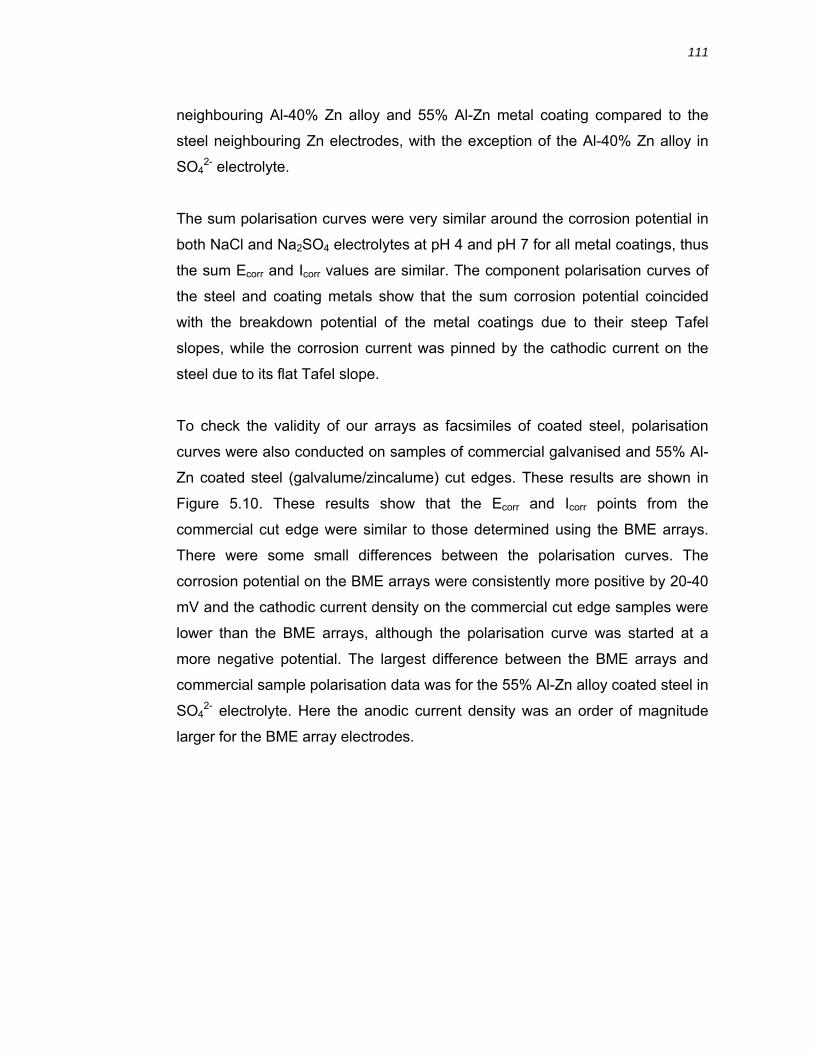
111
neighbouring Al-40% Zn alloy and 55% Al-Zn metal coating compared to the
steel neighbouring Zn electrodes, with the exception of the Al-40% Zn alloy in
SO42- electrolyte.
The sum polarisation curves were very similar around the corrosion potential in
both NaCl and Na2SO4 electrolytes at pH 4 and pH 7 for all metal coatings, thus
the sum Ecorr and Icorr values are similar. The component polarisation curves of
the steel and coating metals show that the sum corrosion potential coincided
with the breakdown potential of the metal coatings due to their steep Tafel
slopes, while the corrosion current was pinned by the cathodic current on the
steel due to its flat Tafel slope.
To check the validity of our arrays as facsimiles of coated steel, polarisation
curves were also conducted on samples of commercial galvanised and 55% Al-
Zn coated steel (galvalume/zincalume) cut edges. These results are shown in
Figure 5.10. These results show that the Ecorr and Icorr points from the
commercial cut edge were similar to those determined using the BME arrays.
There were some small differences between the polarisation curves. The
corrosion potential on the BME arrays were consistently more positive by 20-40
mV and the cathodic current density on the commercial cut edge samples were
lower than the BME arrays, although the polarisation curve was started at a
more negative potential. The largest difference between the BME arrays and
commercial sample polarisation data was for the 55% Al-Zn alloy coated steel in
SO42- electrolyte. Here the anodic current density was an order of magnitude
larger for the BME array electrodes.
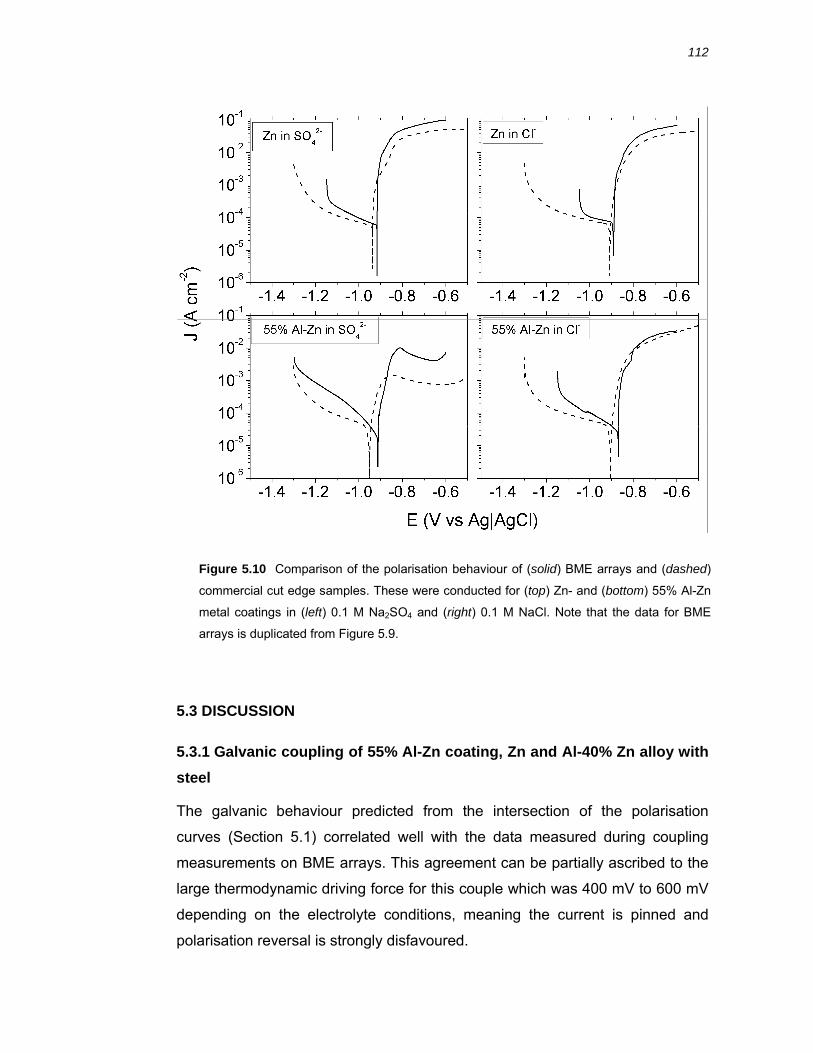
112
5.3 DISCUSSION
5.3.1 Galvanic coupling of 55% Al-Zn coating, Zn and Al-40% Zn alloy with steel
The galvanic behaviour predicted from the intersection of the polarisation
curves (Section 5.1) correlated well with the data measured during coupling
measurements on BME arrays. This agreement can be partially ascribed to the
large thermodynamic driving force for this couple which was 400 mV to 600 mV
depending on the electrolyte conditions, meaning the current is pinned and
polarisation reversal is strongly disfavoured.
Figure 5.10 Comparison of the polarisation behaviour of (solid) BME arrays and (dashed)
commercial cut edge samples. These were conducted for (top) Zn- and (bottom) 55% Al-Zn
metal coatings in (left) 0.1 M Na2SO4 and (right) 0.1 M NaCl. Note that the data for BME
arrays is duplicated from Figure 5.9.
113
The data measured during galvanic coupling of steel and sacrificial metal
coatings indicate that the galvanic corrosion rate process is under cathodic
control, with one exception. The Al-40% Zn alloy in SO42- electrolyte displayed
lower current densities and a couple potential that afforded inadequate galvanic
protection. The polarisation data from the Al-40% Zn alloy in SO42- electrolyte
(Chapter 3) shows that the hindered anodic current density of this alloy in SO42-
is insufficient to support the cathodic current required for galvanic protection of
the steel. This explains the large polarisation of the alloy and small polarisation
of the steel, along with the comparatively lower current density during galvanic
coupling. For the remaining couples, the current densities were controlled by
the size of the steel electrode and averaged 98 µA cm-2. The reasons for the
stable couple current density and Ecell values of the couples are clear from the
shape of the cathodic polarisation curve on the steel and the anodic polarisation
curves on the sacrificial metals. The flat cathodic behaviour of the steel limits
the current density, while the steep anodic Tafel slopes of the sacrificial metal
coatings pins the galvanic cell potential. Thus the galvanic current is similar to
the cathodic current on steel, while the Ecell is similar to the break down
potential of the sacrificial metals.
The OCP of the steel following coupling displayed values that were 100 mV
more negative than the OCP values prior to coupling. The transient data (Figure
5.2) indicated that the OCP of the steel had not reached steady state and that it
changed gradually from the Ecell value. This change in OCP following coupling
may be related to diffusion of corrosion products such as OH-, Zn2+ and Al3+
ions and complexes away from the surface and the reestablishment of a
population Fe2+ ion in the near surface region as self corrosion recommences.
5.3.2 Near surface pH values during galvanic coupling of cut-edge BME arrays
Results of the near surface pH sensing experiments over galvanically coupled
BME arrays of Zn and steel show lower pH (6-7) regions that are localised,
which suggests that the anodic processes on the zinc BME’s are also localised.
114
The lowering of the pH in these areas is due to the hydrolysis of Zn2+ ions. In
the case of the Al-40% Zn alloy, localised anodic sites are also observed
although these areas present much lower pH values (pH 4-5), a consequence
of Al3+ ion hydrolysis.
To understand the effect of Al3+ and Zn2+ ions on the pH of the electrolyte,
calculation of the thermodynamically favoured species using the Medusa
software for Al3+ and Zn2+ resulted in the fraction diagrams shown in Figure 5.11
and Figure 5.12 respectively.1 For Zn2+ ions, the formation of Zn5(OH)8Cl2(s) in
Cl- electrolyte and Zn4(OH)6SO4(s) in SO42- electrolyte represent the onset of
precipitate formation at pH 6.5 and 7.5 respectively. Above pH 7.5, ZnO(s) is the
favoured species. At lower pH values, soluble complexes are favoured in both
electrolytes that do not involve hydrolysis. The Zn5(OH)8Cl2(s) precipitate has
been observed during atmospheric corrosion of zinc in Cl- rich environments
and also during the galvanic corrosion of galvanized steel.65, 131 Al3+ ions may
form insoluble AlOHSO4(s) and Al(OH)3(s) in SO42- and Cl- electrolytes
respectively at around pH 3. Below this pH, soluble complexes are favoured
that do not involve hydrolysis and thus do not affect the pH.
Thermodynamic calculations suggest that hydrolysis of Al3+ ions would produce
a lower electrolyte pH than the hydrolysis Zn2+ ions. This was consistent with
lower pH values measured over Al-40% Zn alloy compared to zinc during
galvanic coupling with steel. Over the remaining surface area of the BME
arrays, the pH ranges from 7 to 12. At these pH values, Zn2+ and Al3+ species
are all insoluble. There was no evidence, optically or reduced current densities,
of precipitate formation during these mapping experiments, however the
calculated domains represent equilibrium conditions and the time scale of the
experiments conducted here may not be sufficient to reach equilibrium.
The pH map over the coupled Al-40% Zn alloy & steel BME array in SO42-
electrolyte was qualitatively similar to that observed in Cl- electrolyte, displaying
both alkaline and acidic domains. It is apparent that the pH was more alkaline
over the steel electrode in Cl- compared to SO42- electrolyte and the acidic
regions are more abundant and of lower pH in Cl- compared to SO42- electrolyte.
115
Both of these observations are consistent with a lower galvanic current density
in SO42-. The local acidic domains over the Al-40% Zn alloy bands in both
electrolytes indicate that the anodic processes are localised. It could be viewed
that the cathodic domains are distributed over the surface, punctuated by acidic
areas exhibiting localised dissolution. Such pH distribution is also consistent
with a cathodic mechanism involving diffusion limited oxygen reduction.
Vertical pH sensing results showed that the pH above the galvanically coupled
BME array varied from the near surface region and the bulk. The presence of
an acidic volume above the alkaline volume near the surface indicate that
electrolyte mixing from nearby regions has occurred, or there was an active
anodic site present prior to the mapping experiment that has subsequently
deactivated. The persistence of the pH domains and the extent of electrolyte
mixing during galvanic coupling have important implications for a mechanistic
understanding of corrosion product precipitation by extension, the long term cut
edge corrosion performance of coated steel products.
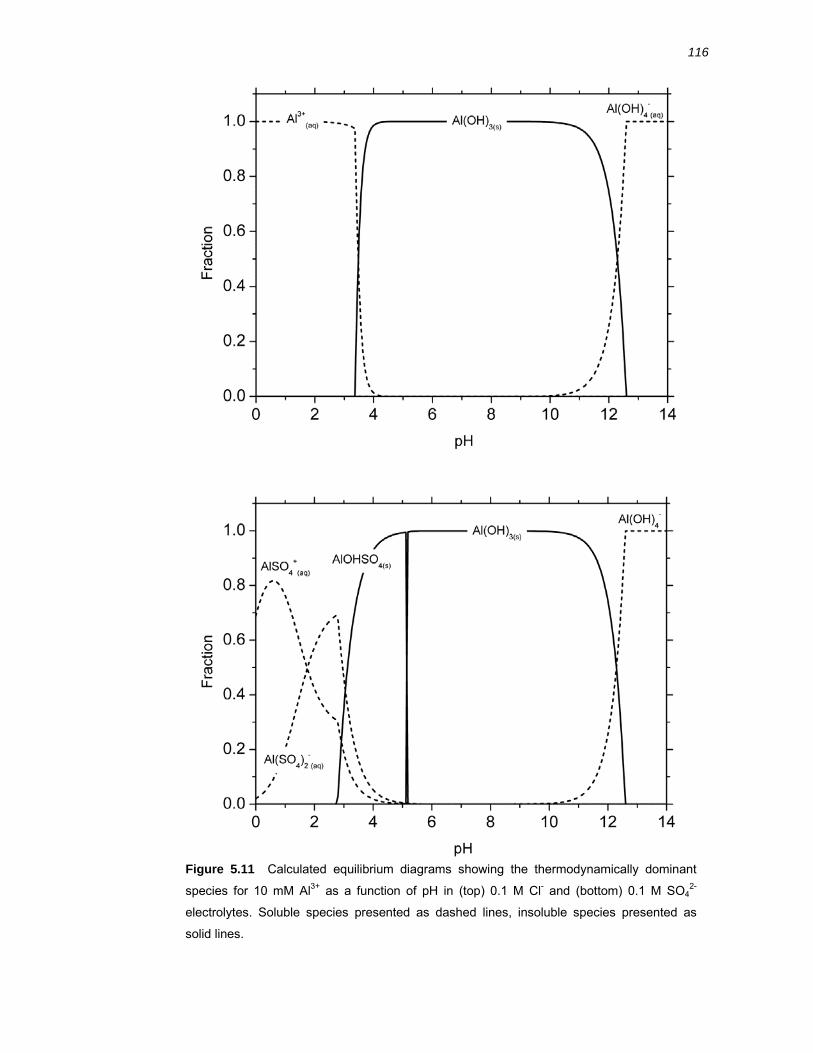
116
Figure 5.11 Calculated equilibrium diagrams showing the thermodynamically dominant
species for 10 mM Al3+ as a function of pH in (top) 0.1 M Cl- and (bottom) 0.1 M SO42-
electrolytes. Soluble species presented as dashed lines, insoluble species presented as
solid lines.
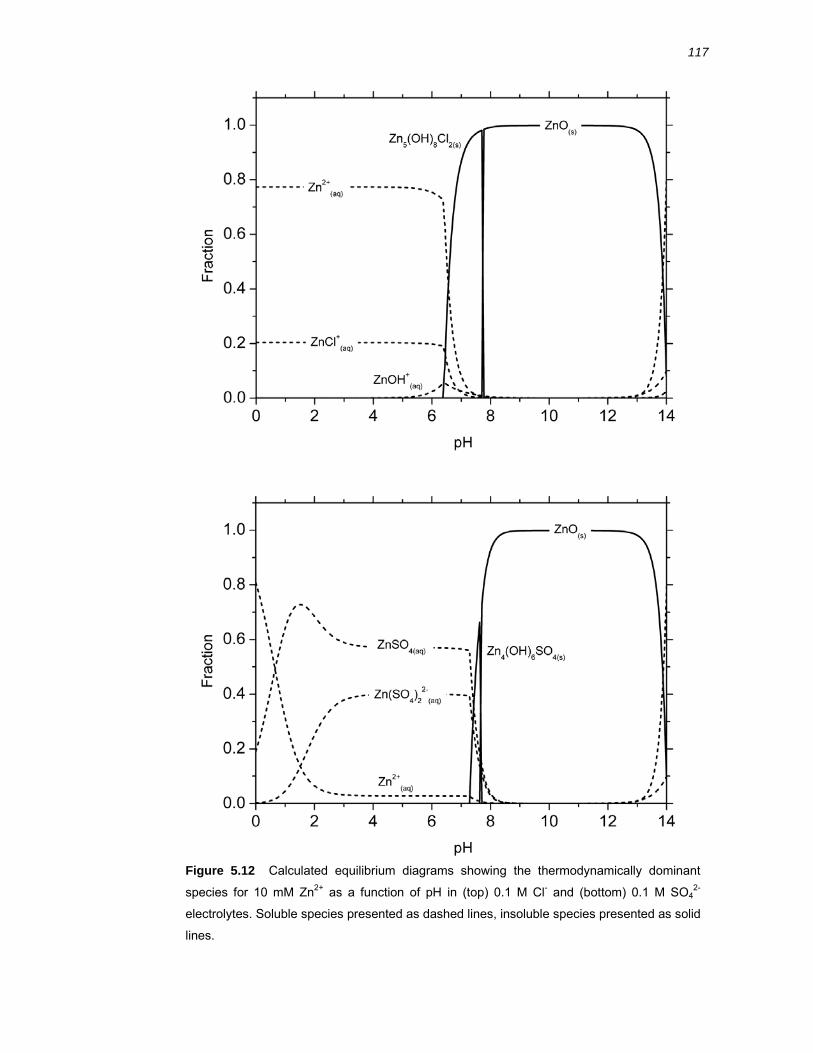
117
Figure 5.12 Calculated equilibrium diagrams showing the thermodynamically dominant
species for 10 mM Zn2+ as a function of pH in (top) 0.1 M Cl- and (bottom) 0.1 M SO42-
electrolytes. Soluble species presented as dashed lines, insoluble species presented as solid
lines.
118
5.3.3 Effect of Al3+ and Zn2+ on the cathodic polarisation behaviour of steel
Data from the simultaneous polarisation experiments in pH 4 and neutral
electrolytes were indistinguishable. This consistent with the pH sensing
experiments conducted over cathodically polarised steel in neutral and pH 3.5
electrolytes, which demonstrate a similar near surface pH (10.0 to 10.5) in these
electrolyte This shows that, in the short term experiments conducted here, the
bulk pH is less influential than the near surface pH. The alkaline environment
generated by the steel electrode was responsible for the negative shift in the
Ecorr of the Al-Zn electrodes.
Anodic breakdown of the Al-40% Zn alloy in SO42- electrolyte during
simultaneous polarisation resulted in a significantly lower current density
compared to zinc, which is consistent with the electrochemical polarisation data
(Chapter 3). The anodic current during simultaneous polarisation intersected
that cathodic current on the steel at -0.90 V, however the galvanic couple data
in Table 5.1 shows that this material did not afford galvanic protection (Ecell = -
0.66 V and Jcell = 38 µA cm-2). It is likely that the very alkaline conditions
generated by the cathodic polarisation of the steel enables breakdown of alloy
by solubilisation of the native oxide.
The 55% Al-Zn coating exhibits anodic current densities intermediate of the Al-
40% Zn alloy and pure zinc upon breakdown in SO42- electrolyte during
simultaneous polariastion. This may be a consequence of the microstructure: if
the α-phase behaves similarly to the Al-40% Zn alloy, then it exhibits slow
dissolution kinetics in SO42- electrolyte, while the zinc rich inter-dendritic regions
of the 55% Al-Zn metal coating undergo facile dissolution.
In all of the simultaneous polarisation curves, the cathodic current on the steel
was observed to increase as the potential passed the break down potential of
the metal coatings. This deviates from the normal electrochemistry of steel,
where flat and continuous Tafel plots are observed in the cathodic region.128
The zinc bands had the highest rate of metal dissolution, however the increase
119
in cathodic current on the steel neighbouring the zinc bands was modest
compared to the 55% Al-Zn coating and the Al-40% Zn alloy in chloride
electrolyte. Cathodic polarisation of steel in Al3+ containing electrolyte resulted
in a higher current density by an order of magnitude, compared to 0.1 M NaCl
or electrolyte with Zn2+ added (Figure 5.8). This is consistent with the cathodic
current transients on the steel substrates during pH sensing, which also show a
significantly larger current in the electrolyte containing Al3+. Thus, there is strong
evidence that the increased cathodic current on the steel during simultaneous
polarisation experiments arises principally from aluminium dissolution occurring
from both 55% Al-Zn coating and Al-40% Zn alloy.
The reason that Al3+ ions increase the cathodic current density on the steel
becomes apparent when the localised pH sensing experiments over
cathodically polarised steel are considered (Figure 5.6). These results reveal a
strong buffering effect due to Al3+ in the near surface region, resulting in a
surface pH of 4.5. By comparison, cathodic polarisation of steel in neutral and
pH 4 NaCl electrolytes resulted in a near surface pH that was very alkaline (pH
10-12), while the near surface pH in electrolyte containing Zn2+ was 5.5. It is
proposed that the enhanced cathodic current density on the steel is due to
increased proton reduction arising from the pH buffering effect of Al3+. This is
consistent with the observations of hydrogen bubbles forming on the steel
during cathodic polarisation in the electrolyte containing Al3+ and similar to the
results reported during cathodic polarisation of iron immersed in acetate buffer
at pH 4.7.132 Furthermore, it is well established that in acidic electrolytes the
reduction current on iron increases with decreasing electrolyte pH.133-134
The influence of Al3+ ions on the near surface pH is relevant to investigations of
other corrosion cells, such as iron intermetallics in aluminium alloys. It is well
established that the intermetallic particles act as local cathodes and the nearby
aluminium surface undergoes rapid galvanic corrosion, creating a localised
environment rich in Al3+.134 pH sensing over iron intermetallic particles by Park
et al has shown that the pH fluctuates from pH 4 to pH 9 over time, some values
which are much lower than the maximum pH estimated by the authors.134 These
fluctuations are consistent with a stochastic dissolution processes and the lower
120
pH than expected may be rationalised considering a pH buffering effect of Al3+
in the near surface region.
Zn2+ also has a buffering effect due to the formation of zinc hydroxyl chloride
and zinc oxide complexes (Figure 5.12), albeit at a higher pH than Al3+. Results
from simultaneous polarisation experiments show a small increase in the
cathodic current on the steel-Zn electrodes and pH sensing experiments show
that the near surface pH is close to 5.5. Correspondingly, cathodic polarisation
of steel in electrolyte containing Zn2+ reveals a small effect on the cathodic
current density.
The near surface pH of a galvanised steel cut edge undergoing spontaneous
corrosion has been investigated by other researchers.64-65 Their results show
that when a pH microelectrode was positioned over the zinc coating, the
electrolyte pH was not significantly altered by the presence of Zn2+. It was,
however, proposed by these authors that localised dissolution or a higher
current density could theoretically result in a lower pH. Experimental evidence
for this is reported in other work using a model galvanic cell with a much larger
steel cathode.135 It was found that high Zn2+ ion flux results in a near surface pH
of 5.5 – 6.0. Peulon et al. have also shown that in an electrolyte containing zinc
ions the near surface pH of a tin oxide electrode undergoing cathodic
polarization is 6.5 to 7.0, compared to pH 10 in the absence of zinc ions.136
These studies and our results indicate that Zn2+ ions have a buffering effect on
the near surface pH during cut edge corrosion, although buffering occurs at a
higher pH than Al3+.
For a concentration of 10 mM Al3+, precipitation to form Al(OH)3 and AlOHSO4
is favoured around pH 3.0 - 4.0. It is proposed that these solubility inflexions are
responsible for the strong pH buffering effect observed in the pH sensing
experiments and the lower pH results in enhanced cathodic current density on
the steel. By comparison, precipitation of insoluble Zn2+ species (Zn5(OH)8Cl2
and ZnO) occurs around pH 6 - 7 at the concentrations used in our work.
121
It has been reported that Al3+ may be used as passivating species for steel
surfaces.137-138 The passive effect purportedly arises from precipitation of Al3+
hydroxides at cathodic sites on the steel. This may be one of the reasons for the
declining I(t) transient observed for polarisation of the steel substrate in
electrolyte containing Al3+ and it raises the question of whether continued
cathodic polarisation of steel in Al3+ containing electrolyte, or longer term cyclic
cut edge corrosion of 55% Al-Zn coating would result in passivation of the steel
electrode over time due to precipitation of aluminium hydroxides and oxides . In
addition, during corrosion of galvanised steel, Zn2+ have been reported to
precipitate as oxides and hydroxides and inhibit the cathodic processes on
steel.66 It is not well known whether this effect occurs on the cut edge of 55%
Al-Zn metal coated steel in the presence of both Zn2+ and Al3+ ions.
5.3.4 Comparison of BME arrays to commercial cut edge samples
The data comparing the polarisation behaviour of commercial cut edges with
the BME arrays (Figure 5.10) indicated that the BME arrays provide a
reasonable approximation of the cut edge, especially considering that these
data are from individual polarisation curves. Experimental variation in
polarisation measurements can be larger than the variation between these
measurements.
The more slightly positive Ecorr (20-40 mV) exhibited by the BME arrays
compared to the commercial cut edges appeared to be a consistent for all
samples. Given the shape of the individual polarisation curves on steel and
metal coatings, this result reflects a difference in the anodic behaviour of the
metal coatings in the array compared to the commercial cut edge samples. The
most likely explanation is that the gap between the electrodes of the BME array
(ca. 10 µm) is sufficient for the metal coating electrodes to experience a lower
concentration of OH- and hence display more positive dissolution potentials.
This is consistent with the observations that the 55% Al-Zn alloys display a
larger shift in Ecorr.
122
5.4 CONCLUSIONS
The use of BME arrays with simultaneous polarisation and pH sensing
experiments allowed the effects of the metal ions from the metal coatings and
OH- ions from the steel to be observed. It can be concluded from this work that
these ions play a large role in the galvanic cell behaviour. It was shown that the
α- and β-phases of the 55% Al-Zn display distinctly different behaviour when
coupled with steel and both are strongly influenced by the presence of SO42-
and Cl- ions. These factors must be taken into account when constructing a
mechanistic model for the galvanic behaviour.
The galvanic couple results presented here show that 55% Al-Zn alloy
galvanically protects steel in Cl- and SO42- electrolytes. In Cl- electrolyte, both
the α- and β-phases were active, however in SO42- electrolyte, the galvanic
ability of the coating was reliant on the zinc rich β-phase. The 55% Al-Zn
coating and the Al-40% Zn alloy underwent localised dissolution, producing an
acidic near surface pH. It is plausible, but unverified, that the acidic pH will
inhibit repassivation and sustain active pits on the surface and create pores
within the microstructure.
The generation of Al3+ and Zn2+ from the metal coating and OH- from the steel
has been shown to significantly influence the short term corrosion behaviour of
the galvanic cell. The Al3+ and Zn2+ ions serve to buffer the pH, enhancing the
cathodic current density, while the OH- ions from the steel shift the corrosion
potential of the α-phase more negative. Both of these mechanisms increase the
galvanic corrosion rate. The effect of corrosion product precipitation, particularly
during wet-dry cycles in a real environment, is not accounted for in this study
but remains crucial in understanding the galvanic corrosion mechanism and
predicting the long term corrosion performance.
Finally, the polarisation curves indicate that the cell is under cathodic control.
The flat cathodic Tafel slope on the steel is of greater practical relevance
regarding the identification of effective corrosion inhibitors.
Chapter 6 | Characterisation of the
properties and influence of the passive
oxide on electrochemical corrosion
behaviour of Al-Zn alloys
123
6.1 INTRODUCTION
In this Chapter, electrochemical techniques and X-ray photoelectron
spectroscopy (XPS) are used to probe the metal-oxide-electrolyte interfaces on
Al-Zn alloys.
Information regarding the properties, characteristics and role of the passive film
on the surface of Al-Zn alloys is a critical aspect in the understanding the
corrosion behaviour of the alpha phase of 55% Al-Zn alloy. Additionally,
understanding the influence of zinc in aluminium-zinc alloys may, in principle,
aid the design of new cost effective and fit for purpose Al-Zn based alloys.
Detailed knowledge of the passive film is required to predict the in-service
performance, allowing Al-Zn metal coatings to be tailored for certain
environments based on fundamental principles. For instance, the passive
properties of 55% Al-Zn alloy coating is responsible for failure of the coating to
provide adequate galvanic protection in some environments, however the
mechanism of this failure is unknown and design of a suitable alternative is not
obvious.70
The polarisation data on Al-40% Zn alloys presented in Chapter 3 revealed that
zinc precipitation within the alloy matrix influences the electrochemical response
in SO42- and Cl- electrolytes. These results showed that, in SO4
2- electrolyte, the
solid solution alloy displayed passive anodic behaviour, while the rolled alloy
exhibiting marked zinc precipitation behaved somewhat like zinc. It was
proposed that the passive film on the surface was responsible for the lower
current densities in SO42- electrolyte, without limiting the current in Cl-
electrolytes.
Results of galvanic coupling of Al-Zn alloys with steel in Chapter 5 highlight the
importance of the constituent phases of a sacrificial coating to maintain
sufficient current density for polarisation and protection of the steel. Thus, the
composition, electrochemical behaviour and the interaction of the passive film of
Al-Zn alloys with SO42- and Cl- is the focus of this chapter. Herein, results of
electrochemical and surface characterisation experiments conducted on a
124
series of binary Al-Zn alloys of variable composition are presented. The series
of compositions facilitates understanding of the anodic behaviour by way of
controlling the microstructure.
Native oxide composition and anodic dissolution processes are the primary
focus given the metals are sacrificial. The XPS instrumentation required
macroscopic electrodes to be used, so XPS and impedance data were recorded
on 2 mm disc electrodes instead of BME used for the rest of this thesis work.
A section of this chapter is devoted to the use of electrochemical impedance
spectroscopy (EIS) to interrogate relaxation phenomena associated with the
metal-oxide-electrolyte interfaces during anodic dissolution at a current density
not unlike that when polarised by steel in the prepainted cut edge physical
model. These results reveal insights into the nature of the passive film on the
alloys and the influence of Cl- and SO42- anions to affect the anodic dissolution
mechanism. Finally, as a summation of the thesis work, a model is presented
that rationalises the formation and behaviour of the passive film on these alloys
in Cl- and SO42- electrolytes and its role during anodic dissolution. Consistent
with the results in the rest of this thesis, these experiments were short term
experiments, most relevant to the initiation of atmospheric corrosion of 55% Al-
Zn alloy coated steel and its main constituent phase (α-phase).
6.2 RESULTS
6.2.1 Electrochemical polarisation of solid solution Al=x% Zn binary alloys
Electrochemical polarisation experiments were conducted on BME’s of heat
treated, solid-solution Al-x% Zn alloys (x = 2, 10, 30) to explore the effect of
composition on the electrochemical behaviour. These experiments were
conducted in SO42- and Cl- electrolytes at pH 4, 7 and pH 10 and the results are
shown in Figure 6.1.
The electrochemical polarisation data of Al-x% Zn alloys were qualitatively
similar to the polarisation data presented for the heat treated Al-40% Zn alloys
125
(Chapter 3). Varying the composition of zinc from 2% to 40% had negligible
influence on the cathodic behaviour and only minor influence on the anodic
polarisation behaviour.
In Cl- electrolyte, limiting anodic current densities around 0.5 A cm-2 were
observed for the Al-10% Zn and the Al-30% Zn positive of 0.90 V at all pH
values. The rapid increase in current is characteristic of passive film breakdown
and pitting on aluminium.139-141 and is also characteristic of active dissolution on
zinc.67-68 The Tafel slope for this process was a small value (lβa| = 6 - 35 mV
dec-1), similar to the results on heat treated Al-40% Zn alloy. The Al-2% Zn alloy
also displayed a rapid increase in current density during anodic polarisation,
however this process required a higher overpotential (50 mV to 100 mV) and
the limiting current densities were slightly lower (0.1 A cm-1). Furthermore, the
anodic polarisation curves on the Al-2% Zn alloy displayed fluctuations in the
current, typical of pit initiation and repassivation. In pH 10, Cl- electrolyte, all the
alloys exhibited an Ecorr around -1.2 V, which was 300 – 400 mV more negative
than the active dissolution / pitting potential.
In SO42- electrolyte, the anodic behaviour of all alloys was relatively passive,
also qualitatively like the results reported for the heat treated Al-40% Zn alloy
(Chapter 3). Limiting anodic current densities were around 10-4 to 10-5 A cm-2
and varied little with increasing polarisation. The Al-30% Zn alloy displayed a
current peak of 10-4 A cm-2 at 50 - 100 mV overpotential in neutral SO42-
electrolyte, which was also observed on the Al-40% Zn alloy (Chapter 3). The
Ecorr values ranged from -0.60 V to -0.80 V in pH 4 and neutral SO42-
electrolytes and were close to -1.2 V in pH 10 SO42- electrolyte. The values in
pH 4 and neutral SO42- were more positive than those in Cl- electrolyte, while at
pH 10, the Ecorr in Cl- and SO42- were similar. This behaviour was analogous to
the Al-40% Zn alloy in SO42- electrolytes.
The pH affected the cathodic polarisation behaviour similarly to the results
reported on Al-40% Zn alloy. That is, pH 4 electrolytes displayed higher current
densities (10-4 A cm-2) compared to the current densities in neutral electrolyte
(10-5 A cm-2) from the Ecorr to ca. -1.2 V. Negative of -1.2 V, the cathodic current
126
densities were similar in all the electrolytes at ca. 10-3 A cm-2. In pH 4 and
neutral electrolytes, the cathodic current densities did not vary with composition.
At pH 10, however, the Tafel slope for the Al-2% Zn alloy (|βa|=80 mv dec-1) was
larger than observed for the Al-10% Zn and Al-30% Zn alloys (|βa|=40 mv dec-1).
Furthermore, the cathodic polarisation curves appear activation limited for the
Al-2% Zn alloy and diffusion limited for the Al-30% Zn alloy.
Prior to electrochemical polarisation, the Al-x% Zn alloys were subject to a 10
minute OCP period. E(t) data from this OCP period in pH 4 SO42- electrolyte are
presented Figure 6.2 as the OCP of the Al-x% Zn alloys exhibited transient
behaviour. It was found that in pH 4 SO42- electrolyte, the initial OCP (Einit) and
the change in potential (ΔEOCP) were dependent upon the alloy composition.
The Einit for the alloys was -0.75 V, -0.89 V and -1.02 V for the 2%, 10% and
30% Zn alloys respectively, while the ΔEOCP (0 - 400 s) was 140 mV, 250 mV
and 320 mV. In neutral and pH 10 SO42- electrolytes ΔEOCP was close to zero,
so these results have not been shown. There was a large variation (no trend)
between repeat measurements for all alloys at pH 7. This arose presumably
from the OCP fluctuating and drifting due to transient surface processes and
slow kinetics. In Cl- electrolyte at all pH values, the ΔEOCP was close to zero and
the transients were stable.
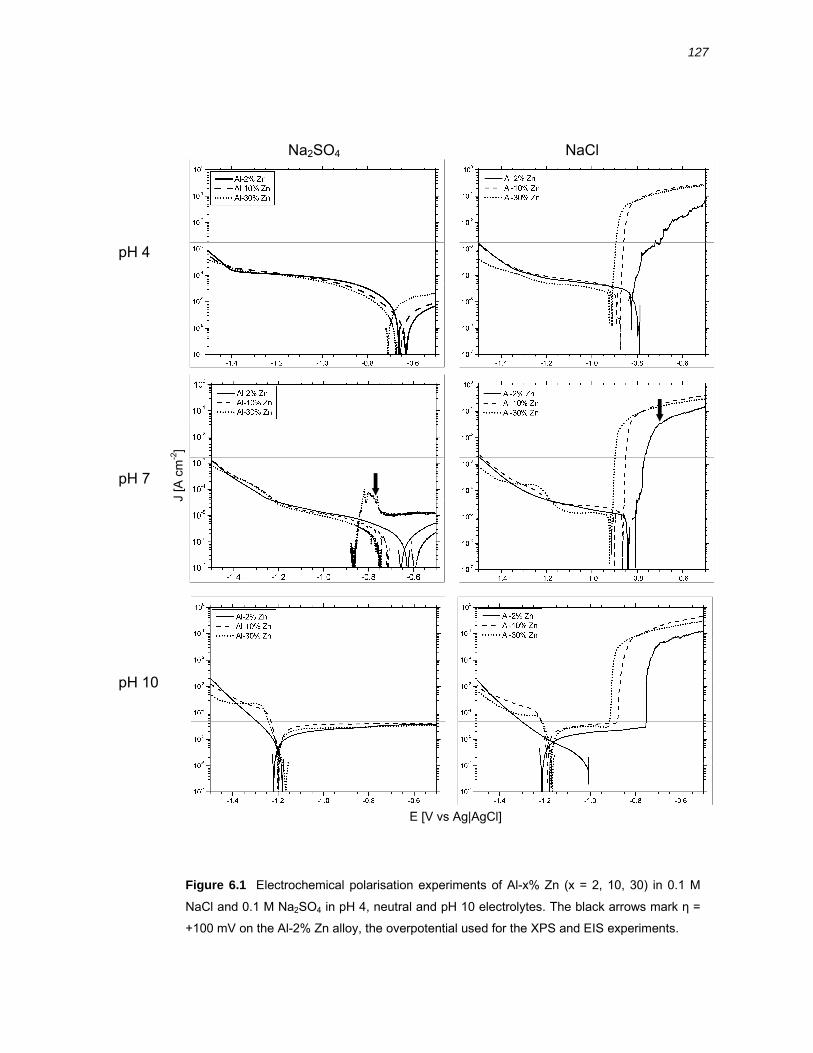
127
Figure 6.1 Electrochemical polarisation experiments of Al-x% Zn (x = 2, 10, 30) in 0.1 M
NaCl and 0.1 M Na2SO4 in pH 4, neutral and pH 10 electrolytes. The black arrows mark η =
+100 mV on the Al-2% Zn alloy, the overpotential used for the XPS and EIS experiments.
Na2SO4 NaCl
pH 4
pH 7
pH 10
E [V vs Ag|AgCl]
J [A
cm
-2]
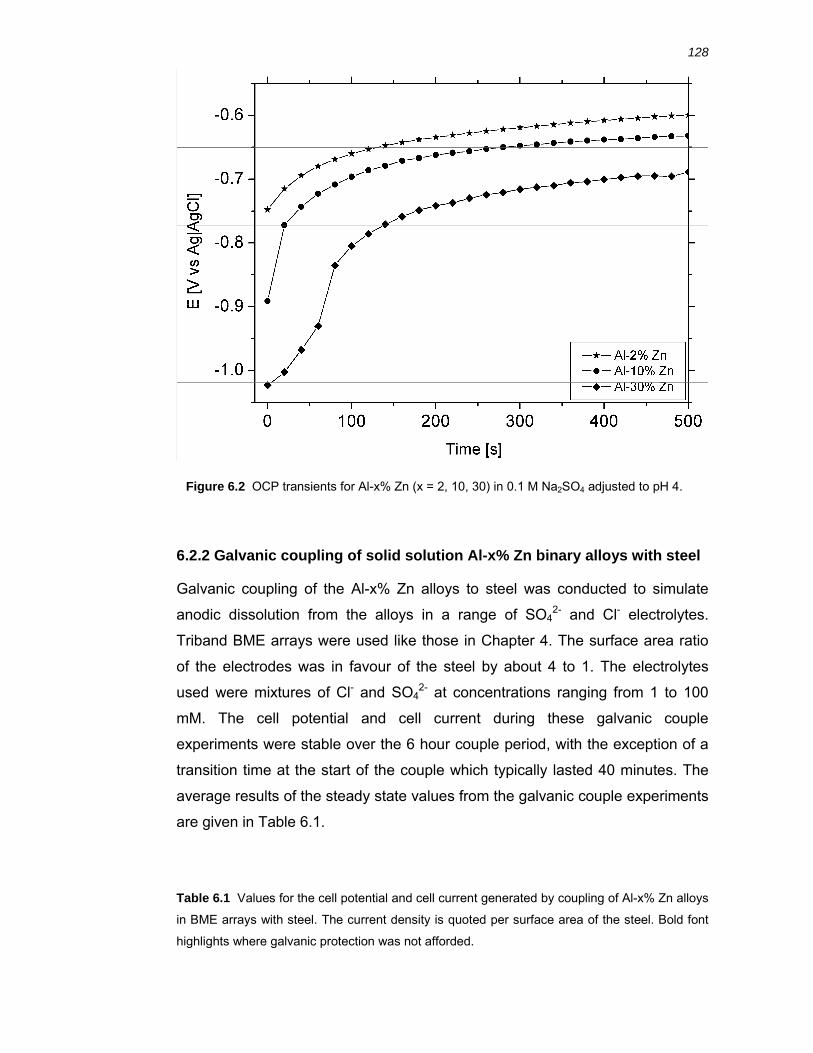
128
6.2.2 Galvanic coupling of solid solution Al-x% Zn binary alloys with steel
Galvanic coupling of the Al-x% Zn alloys to steel was conducted to simulate
anodic dissolution from the alloys in a range of SO42- and Cl- electrolytes.
Triband BME arrays were used like those in Chapter 4. The surface area ratio
of the electrodes was in favour of the steel by about 4 to 1. The electrolytes
used were mixtures of Cl- and SO42- at concentrations ranging from 1 to 100
mM. The cell potential and cell current during these galvanic couple
experiments were stable over the 6 hour couple period, with the exception of a
transition time at the start of the couple which typically lasted 40 minutes. The
average results of the steady state values from the galvanic couple experiments
are given in Table 6.1.
Table 6.1 Values for the cell potential and cell current generated by coupling of Al-x% Zn alloys
in BME arrays with steel. The current density is quoted per surface area of the steel. Bold font
highlights where galvanic protection was not afforded.
Figure 6.2 OCP transients for Al-x% Zn (x = 2, 10, 30) in 0.1 M Na2SO4 adjusted to pH 4.
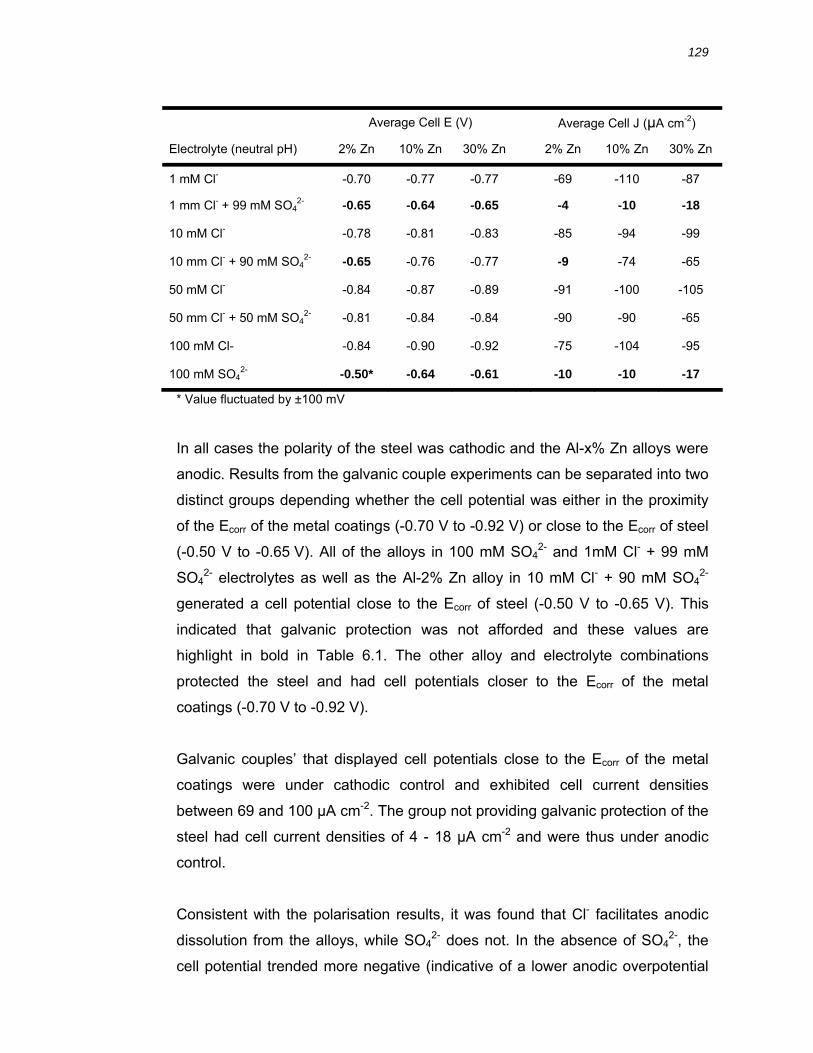
129
Average Cell E (V) Average Cell J (µA cm-2)
Electrolyte (neutral pH) 2% Zn 10% Zn 30% Zn 2% Zn 10% Zn 30% Zn
1 mM Cl- -0.70 -0.77 -0.77 -69 -110 -87
1 mm Cl- + 99 mM SO42- -0.65 -0.64 -0.65 -4 -10 -18
10 mM Cl- -0.78 -0.81 -0.83 -85 -94 -99
10 mm Cl- + 90 mM SO42- -0.65 -0.76 -0.77 -9 -74 -65
50 mM Cl- -0.84 -0.87 -0.89 -91 -100 -105
50 mm Cl- + 50 mM SO42- -0.81 -0.84 -0.84 -90 -90 -65
100 mM Cl- -0.84 -0.90 -0.92 -75 -104 -95
100 mM SO42- -0.50* -0.64 -0.61 -10 -10 -17
* Value fluctuated by ±100 mV
In all cases the polarity of the steel was cathodic and the Al-x% Zn alloys were
anodic. Results from the galvanic couple experiments can be separated into two
distinct groups depending whether the cell potential was either in the proximity
of the Ecorr of the metal coatings (-0.70 V to -0.92 V) or close to the Ecorr of steel
(-0.50 V to -0.65 V). All of the alloys in 100 mM SO42- and 1mM Cl- + 99 mM
SO42- electrolytes as well as the Al-2% Zn alloy in 10 mM Cl- + 90 mM SO4
2-
generated a cell potential close to the Ecorr of steel (-0.50 V to -0.65 V). This
indicated that galvanic protection was not afforded and these values are
highlight in bold in Table 6.1. The other alloy and electrolyte combinations
protected the steel and had cell potentials closer to the Ecorr of the metal
coatings (-0.70 V to -0.92 V).
Galvanic couples’ that displayed cell potentials close to the Ecorr of the metal
coatings were under cathodic control and exhibited cell current densities
between 69 and 100 µA cm-2. The group not providing galvanic protection of the
steel had cell current densities of 4 - 18 µA cm-2 and were thus under anodic
control.
Consistent with the polarisation results, it was found that Cl- facilitates anodic
dissolution from the alloys, while SO42- does not. In the absence of SO4
2-, the
cell potential trended more negative (indicative of a lower anodic overpotential
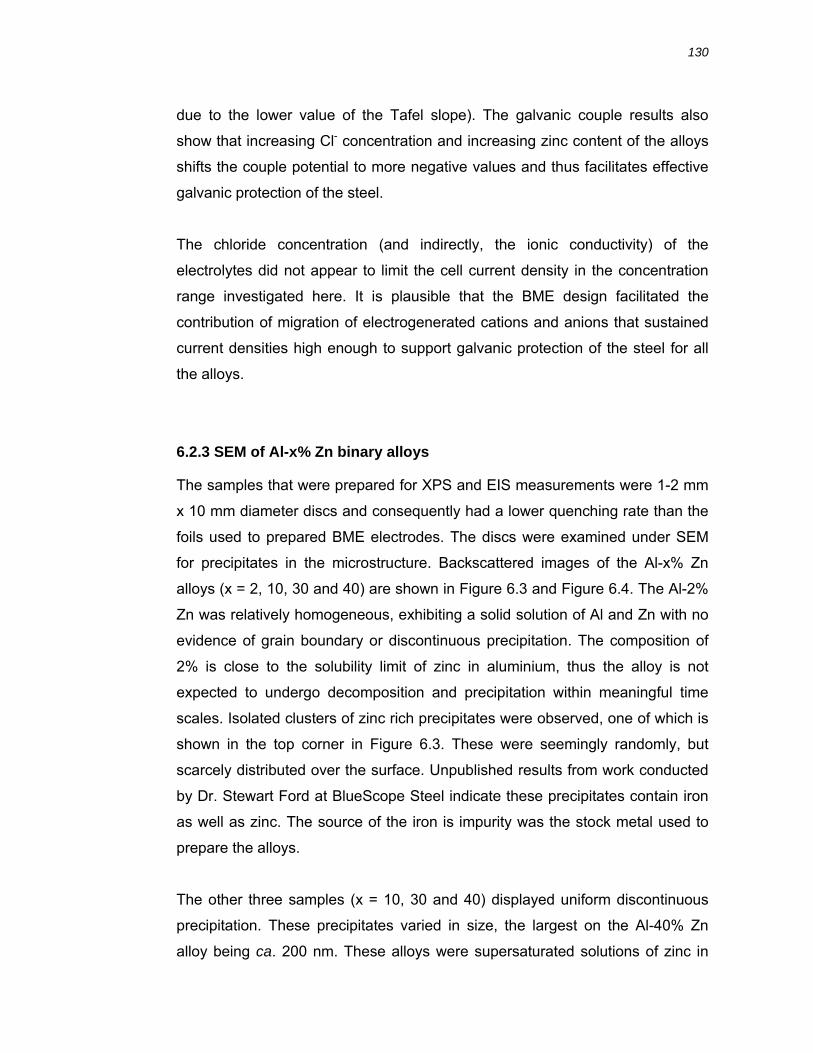
130
due to the lower value of the Tafel slope). The galvanic couple results also
show that increasing Cl- concentration and increasing zinc content of the alloys
shifts the couple potential to more negative values and thus facilitates effective
galvanic protection of the steel.
The chloride concentration (and indirectly, the ionic conductivity) of the
electrolytes did not appear to limit the cell current density in the concentration
range investigated here. It is plausible that the BME design facilitated the
contribution of migration of electrogenerated cations and anions that sustained
current densities high enough to support galvanic protection of the steel for all
the alloys.
6.2.3 SEM of Al-x% Zn binary alloys
The samples that were prepared for XPS and EIS measurements were 1-2 mm
x 10 mm diameter discs and consequently had a lower quenching rate than the
foils used to prepared BME electrodes. The discs were examined under SEM
for precipitates in the microstructure. Backscattered images of the Al-x% Zn
alloys (x = 2, 10, 30 and 40) are shown in Figure 6.3 and Figure 6.4. The Al-2%
Zn was relatively homogeneous, exhibiting a solid solution of Al and Zn with no
evidence of grain boundary or discontinuous precipitation. The composition of
2% is close to the solubility limit of zinc in aluminium, thus the alloy is not
expected to undergo decomposition and precipitation within meaningful time
scales. Isolated clusters of zinc rich precipitates were observed, one of which is
shown in the top corner in Figure 6.3. These were seemingly randomly, but
scarcely distributed over the surface. Unpublished results from work conducted
by Dr. Stewart Ford at BlueScope Steel indicate these precipitates contain iron
as well as zinc. The source of the iron is impurity was the stock metal used to
prepare the alloys.
The other three samples (x = 10, 30 and 40) displayed uniform discontinuous
precipitation. These precipitates varied in size, the largest on the Al-40% Zn
alloy being ca. 200 nm. These alloys were supersaturated solutions of zinc in

131
aluminium and thus there is a driving force for precipitation. The population of
precipitates increased as the zinc content of the alloy increased. The slower
quench rate of the discs samples compared to foils (used for BME electrodes) is
the reason for precipitate formation compared to the precipitate free SEM image
of the Al-40% Zn alloy in Chapter 3.
132
Figure 6.3 SEM image (backscattered) of (top) heat treated Al-2% Zn alloy and (bottom)
heat treated Al-10% Zn alloy. An intermetallic was included in the top image for illustrative
purposes.
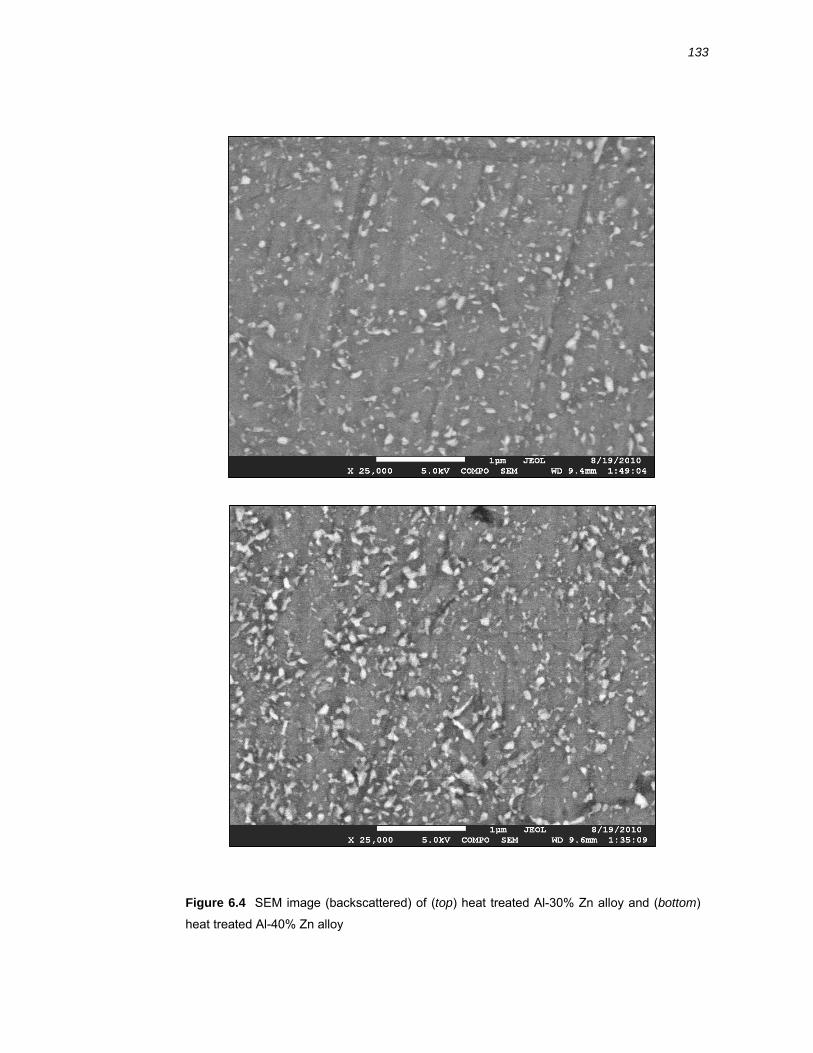
133
Figure 6.4 SEM image (backscattered) of (top) heat treated Al-30% Zn alloy and (bottom)
heat treated Al-40% Zn alloy
134
6.2.4 Chemical composition of the oxide film on Al-40% Zn alloy by XPS
Data arising from depth profiling of the oxide film with XPS (Physical Electronics
PHI-550) was collected on samples of Al-40% Zn alloy that had been polished
as well as those that had been polarised to +100 mV for 20 minutes in Cl- and
SO42- electrolytes. The relative compositions of Al, Al3+, Zn and O calculated
from the XPS data for Al-40% Zn alloys are shown in Figure 6.5. For clarity, the
position of +100 mV overpotential is shown by the black arrows in Figure 6.1.
The elemental compositions of the polished and anodically polarised Al-40% Zn
alloys were similar (Figure 6.5). The composition at the surface was estimated
as 65 at% oxygen and 35 at% aluminium, predominantly in the +3 oxidation
state. Negligible zinc was detected at the surface. During sputtering for 105
minutes, the oxygen composition reduced from 70 to 20 at%, while the
aluminium composition changed from 30 to 60 at% and the zinc composition
increased from 0 to 20 at%. The rate of change was approximately linear with
sputtering time for all the elements.
The Al(2s) and Al(2p) peaks were doublets due to the contribution of aluminium
in both its metallic (Al) and oxidised (Al3+) forms. The relative intensities for the
Al and Al3+ lines (2s) versus sputtering time are also shown in Figure 6.5. At the
surface, the ratio was 3:1 in favour of the oxide for all Al-40% Zn samples. Over
105 minutes of sputtering, the ratio changed to 3:1 in favour of the metal for the
polished Al-40% Zn sample. The samples that had been polarised anodically
displayed a higher intensities for the Al3+ line and lower intensities for the Al0
line after 105 minutes of sputtering. A number of Al3+ chemical species such as
Al2O3, AlO(OH) and Al(OH)3 may all contribute to the Al3+ line as their emission
lines are closely spaced (0.1 eV) and could not be resolved with this instrument.
The L4M45M45 Auger electron line for zinc was observed at 250.2 eV, resulting
in a calculated Auger parameter of 2015.2 eV. The Auger parameter is used to
identify chemical state.91 Values for Zn, ZnO, ZnCl2 and ZnSO4 have been
reported as 2013.8 eV, 2009.8 eV, 2009.2 eV and 2009.2 eV respectively .142-
135
146 The value obtained in this work (2015.2) for zinc in the Al-Zn oxide film was
higher than that reported in literature. To investigate this further, the calculated
Auger parameter for zinc and zinc oxide was obtained using a high purity zinc
standard. Calculated Auger parameters of 2010.9 eV for the native oxide and
2015.2 eV for metallic zinc were obtained. These results indicate that zinc is
present primarily in the metallic state. It appears that the deviation from reported
values was related to the instrument binding energy scale.
Compositional depth profiling of a series of Al-x% Zn alloys (x = 2, 10, 30) was
conducted using a different XPS instrument (Thermo Scientific ESCALAB
250Xi) that had a faster sputtering rate (Figure 6.6). The higher rate was suited
for analysing completely through the thickness of the oxide film. The results
show that the surface of the alloys had a similar composition to each other of
approximately 60 at% oxygen and 40 at% aluminium (predominantly in the
oxide form) and negligible zinc. Sputtering resulted in the Al metal peak rising to
a plateau at 99.3, 97.7 and 89.8 at% for the x = 2, 10 and 30 samples
respectively. The oxygen and Al3+ line intensities dropped to zero in this time
period while the zinc metal line intensity increased. The time to sputter entirely
through the oxide (O < 1 at%) decreased with increasing zinc content and was
550 s, 380 s and 260 s for the x = 2, 10 and 30 samples respectively. The
composition of the alloys as determined from the line intensities by XPS
underestimated the bulk composition. The values were 0.7 at% (1.7wt%), 2.2
at% (5.2wt%), 10.2 at% (21.6wt%) and 19 at% (36.2wt%) for the x = 2, 10, 30
and 40 samples respectively.
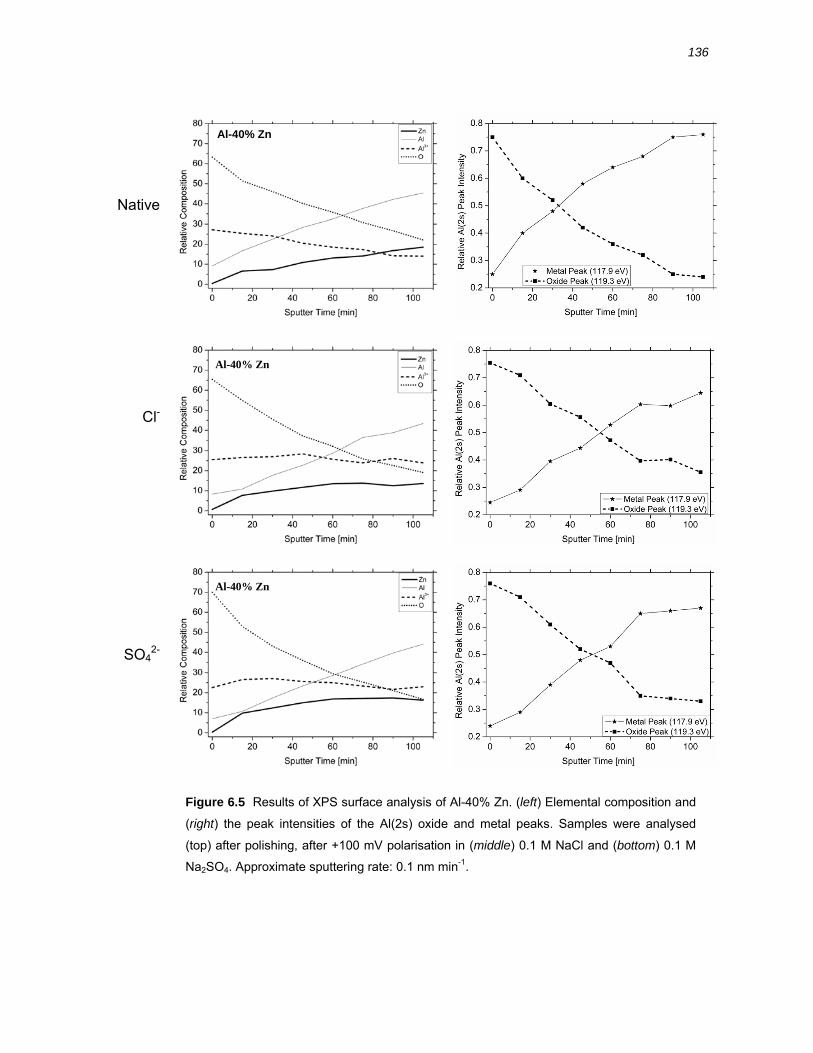
136
Figure 6.5 Results of XPS surface analysis of Al-40% Zn. (left) Elemental composition and
(right) the peak intensities of the Al(2s) oxide and metal peaks. Samples were analysed
(top) after polishing, after +100 mV polarisation in (middle) 0.1 M NaCl and (bottom) 0.1 M
Na2SO4. Approximate sputtering rate: 0.1 nm min-1.
Native
Cl-
SO42-
Al-40% Zn
Al-40% Zn
Al-40% Zn
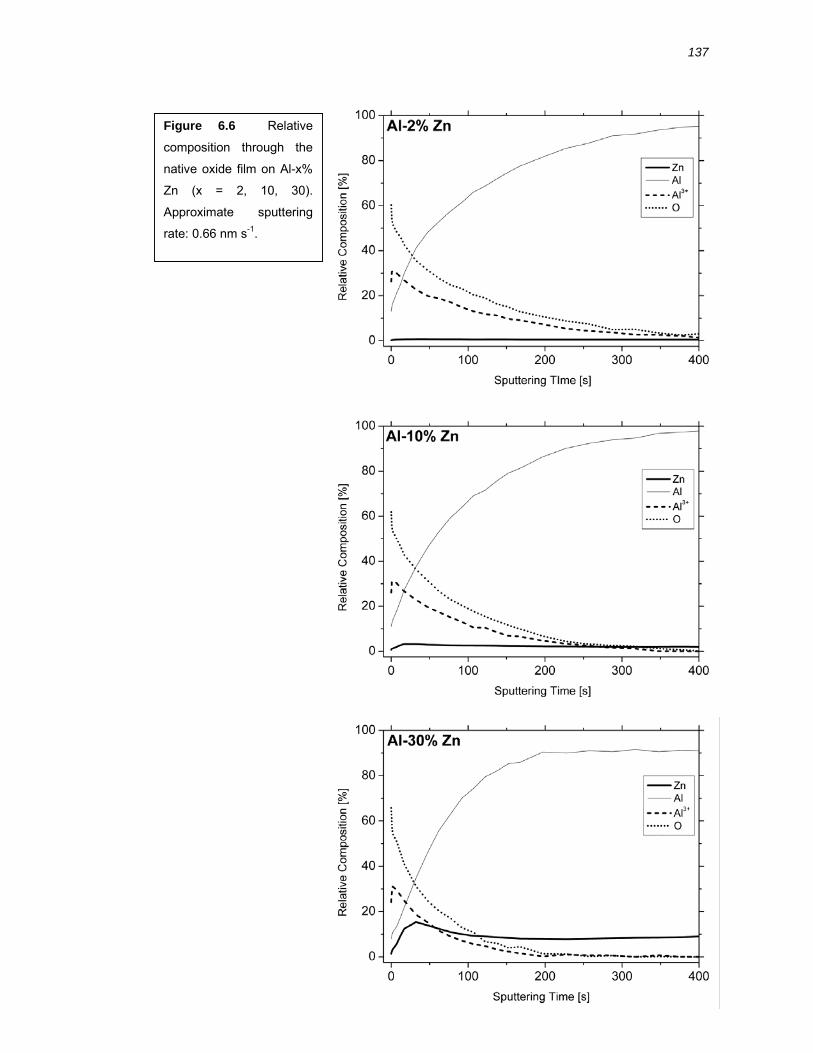
137
Figure 6.6 Relative
composition through the
native oxide film on Al-x%
Zn (x = 2, 10, 30).
Approximate sputtering
rate: 0.66 nm s-1.
138
6.2.5 EIS of Al-x% Zn binary alloys
Electrochemical impedance spectroscopy was conducted on disc electrodes
(diameter = 2.75 mm) of heat treated Al-x% Zn alloys (x = 2, 10, 30, 40) while
under anodic polarisation (η = +100 mV) in an attempt to interrogate the
impedance response of the passive film during active dissolution. These
experiments were conducted in 0.1 M NaCl and 0.1 M Na2SO4 electrolyte. The
position of this overpotential in the DC polarisation data is shown by the black
arrows for the Al-2% Zn sample in Figure 6.1.
The Bode, Nyquist and Phase plots are shown in Figure 6.7 for Cl- electrolyte
and Figure 6.8 for SO42- electrolyte. In Cl- electrolyte, the alloys of different
composition displayed similar qualitative behaviour as each other in the Nyquist,
Bode and Phase plots. The magnitude of the impedance varied, although there
was no discernable trend with composition
The data recorded on the Al-2% Zn alloy exhibited significant scatter at low
frequencies. The DC current density transient for this alloy revealed that the DC
current increases with time and hence not displaying steady state behaviour.
This makes meaningful interpretation of the EIS data difficult and so results on
this alloy are excluded from discussion. The other three compositions
maintained relatively stable DC current transients under polarisation.
The EIS data of 10%, 30% and 40% alloys in Cl- electrolyte show a depressed
semi-circle in the frequency domain from ca. 100 Hz to 20 kHz in the Nyquist
plots. The high frequency end of the semi circles all started close to Re(Z) = 13
Ω cm2. Intersection of the Re(Z) axis at lower frequency (ca. 100 Hz) varied for
the alloys from 31 to 64 Ω cm2. At frequencies below 100 Hz, inductive
behaviour was observed. Two inductive loops can be distinguished in the data
from the Al-30% Zn and Al-40% Zn alloys. Inflections and maxima in the phase
angle plot indicate multiple time constants across the whole frequency domain
for all of the alloys.
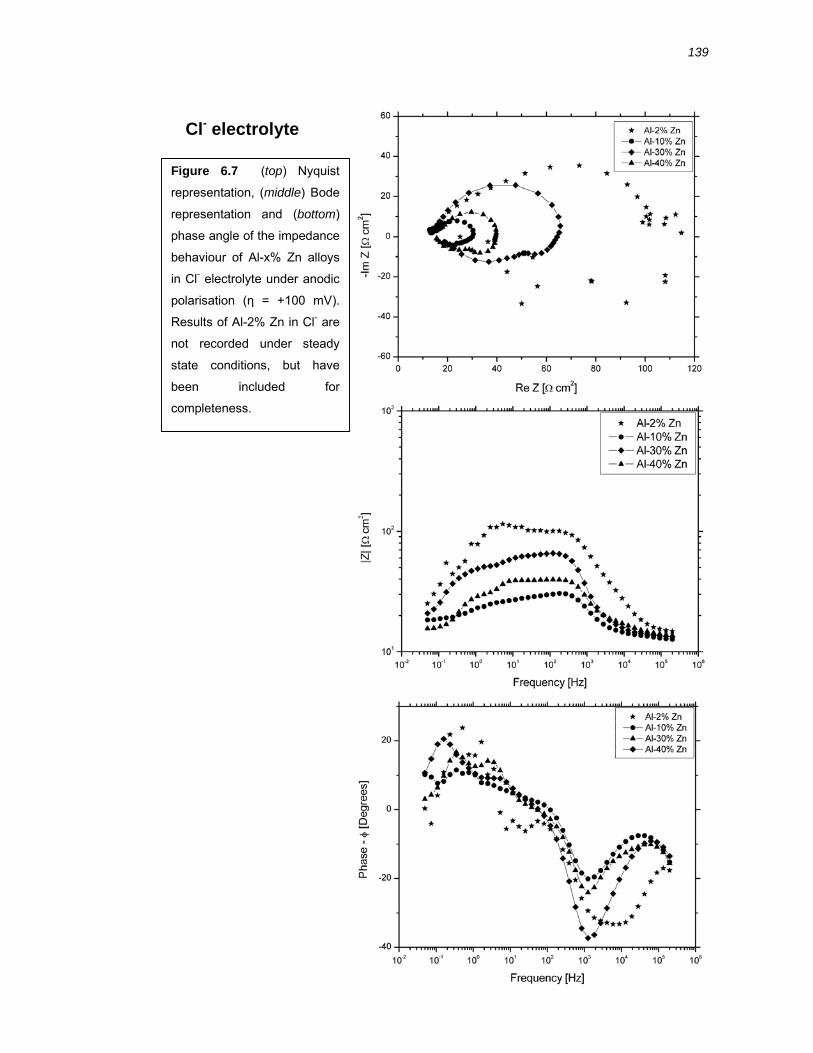
139
Figure 6.7 (top) Nyquist
representation, (middle) Bode
representation and (bottom)
phase angle of the impedance
behaviour of Al-x% Zn alloys
in Cl- electrolyte under anodic
polarisation (η = +100 mV).
Results of Al-2% Zn in Cl- are
not recorded under steady
state conditions, but have
been included for
completeness.
Cl- electrolyte
140
The Bode, Nyquist and Phase plots are shown in Figure 6.8 for data recorded in
SO42- electrolyte. The alloys of different composition displayed similar qualitative
behaviour as each other in the Nyquist, Bode and Phase plots.
The Nyquist plots for the Al-x% Zn (x = 2, 10 ,30, 40) alloys in SO42- electrolyte
show arcs that cover the frequency spectrum.. The overall impedance
measured during perturbation was over three orders of magnitude higher than
measured in Cl- electrolyte. The high frequency end of the arcs all started close
to Re(Z) = 9 Ω cm2. In contrast to the alloys in Cl- electrolyte, the Bode plots
reveal few obvious processes, apart from capacitive impedance.
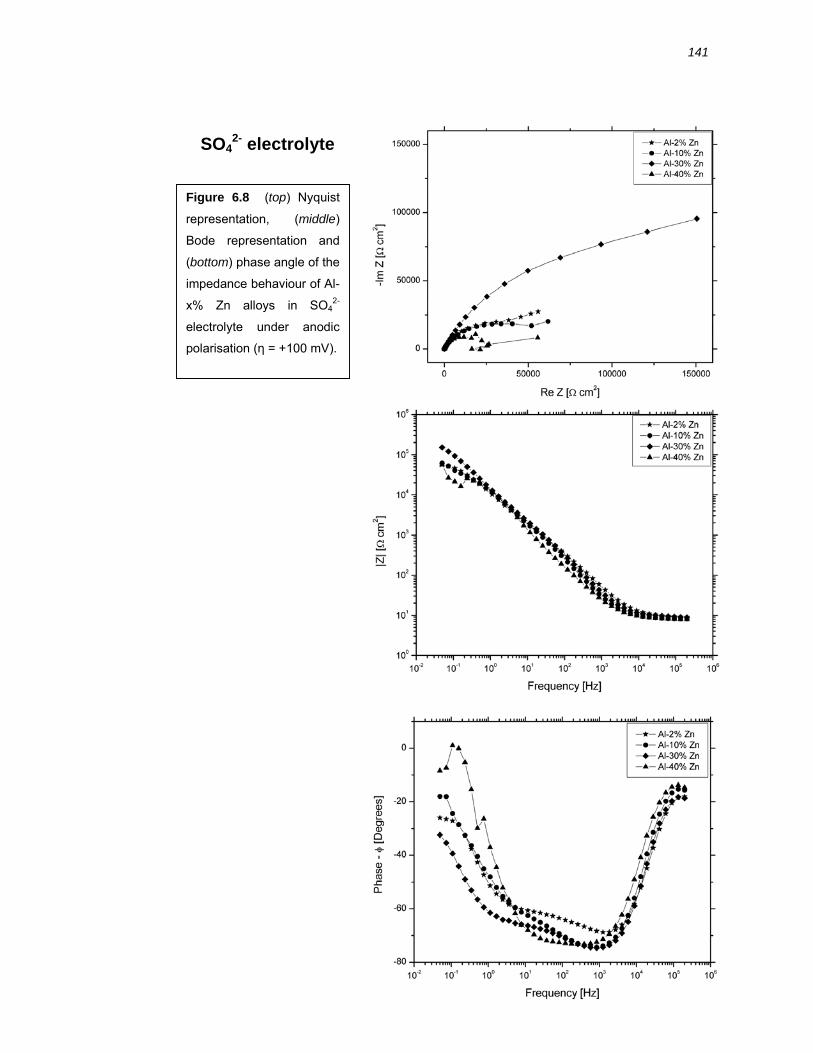
141
Figure 6.8 (top) Nyquist
representation, (middle)
Bode representation and
(bottom) phase angle of the
impedance behaviour of Al-
x% Zn alloys in SO42-
electrolyte under anodic
polarisation (η = +100 mV).
SO42- electrolyte
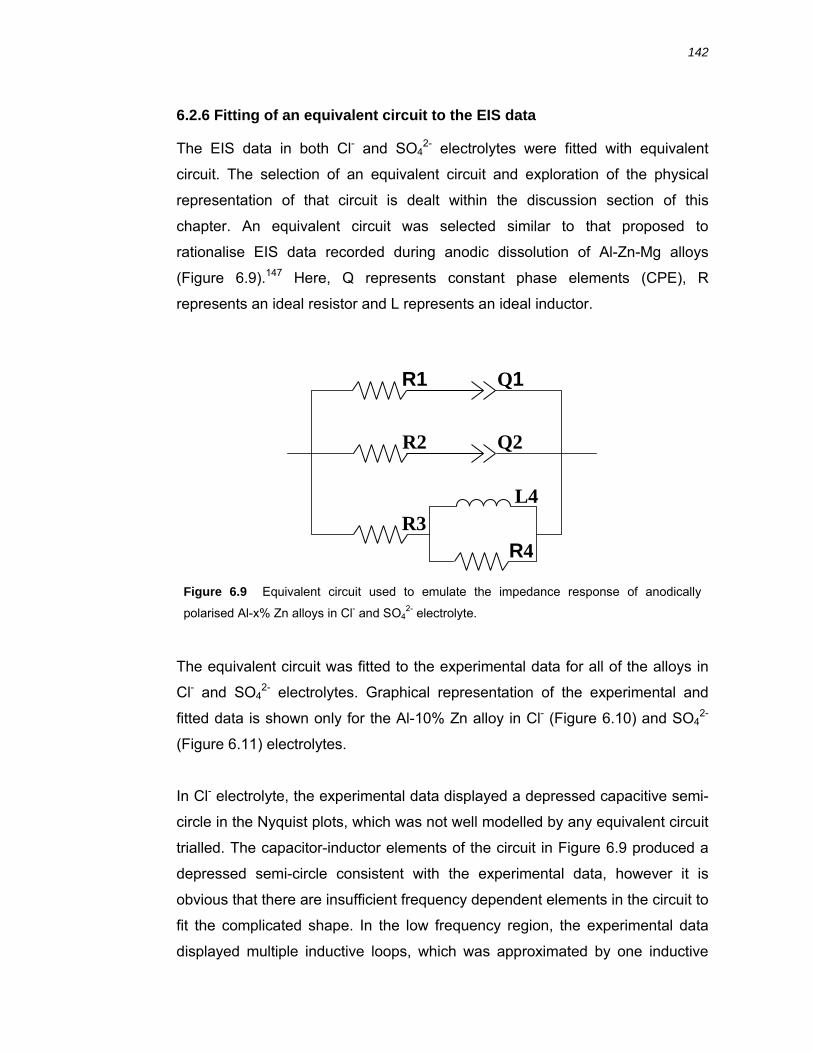
142
6.2.6 Fitting of an equivalent circuit to the EIS data
The EIS data in both Cl- and SO42- electrolytes were fitted with equivalent
circuit. The selection of an equivalent circuit and exploration of the physical
representation of that circuit is dealt within the discussion section of this
chapter. An equivalent circuit was selected similar to that proposed to
rationalise EIS data recorded during anodic dissolution of Al-Zn-Mg alloys
(Figure 6.9).147 Here, Q represents constant phase elements (CPE), R
represents an ideal resistor and L represents an ideal inductor.
The equivalent circuit was fitted to the experimental data for all of the alloys in
Cl- and SO42- electrolytes. Graphical representation of the experimental and
fitted data is shown only for the Al-10% Zn alloy in Cl- (Figure 6.10) and SO42-
(Figure 6.11) electrolytes.
In Cl- electrolyte, the experimental data displayed a depressed capacitive semi-
circle in the Nyquist plots, which was not well modelled by any equivalent circuit
trialled. The capacitor-inductor elements of the circuit in Figure 6.9 produced a
depressed semi-circle consistent with the experimental data, however it is
obvious that there are insufficient frequency dependent elements in the circuit to
fit the complicated shape. In the low frequency region, the experimental data
displayed multiple inductive loops, which was approximated by one inductive
Figure 6.9 Equivalent circuit used to emulate the impedance response of anodically
polarised Al-x% Zn alloys in Cl- and SO42- electrolyte.
R1
R2
R3 R4
Q1
L4
Q2
143
element in the equivalent circuit. The Bode-phase plots reveal deviations in the
mid – low frequency domain due to more time constants than the three
frequency dependent elements in the circuit.
It is common for equivalent circuits to possess resistive elements that represent
the solution resistance and polarisation resistance. The design of the equivalent
circuit in Figure 6.9 prevents such extrapolations. Instead, estimations of the
electrolyte resistance and polarisation resistance were obtained from abscises
of the Nyquist plots. This resulted in solution resistance values of 12 to 17 Ω
cm2 and polarisation resistance values of 18 to 50 Ω cm2.
In SO42- electrolyte, the data presented in Nyquist form shows a semi-circular
arc with a relatively large radius. The poorly defined inflections in the phase plot
around 1 Hz and 1 kHz may be evidence of relaxations with overlapping time
constants and these were approximated by the two capacitive elements in the
equivalent circuit, although the fit is not perfect. There was no indication of
inductive processes in the SO42- electrolyte. The solution resistance was in the
range 8 to 10 Ω cm2. An estimation of the polarisation resistance was not
possible.
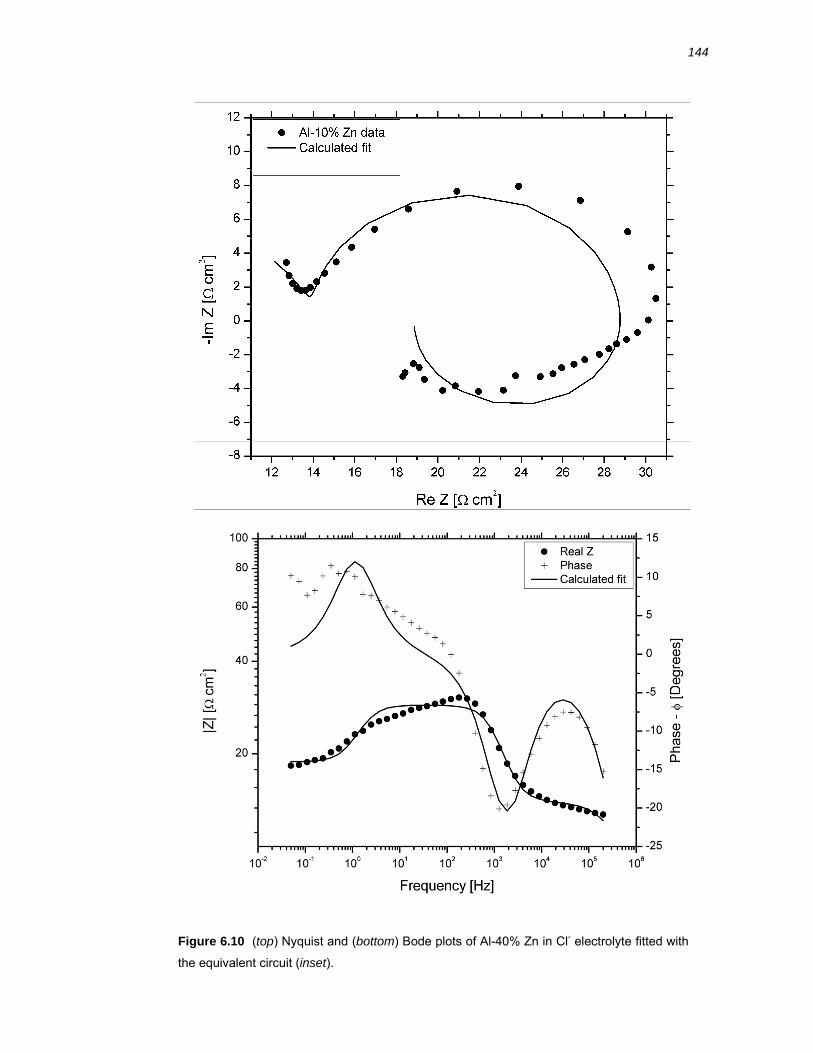
144
Figure 6.10 (top) Nyquist and (bottom) Bode plots of Al-40% Zn in Cl- electrolyte fitted with
the equivalent circuit (inset).
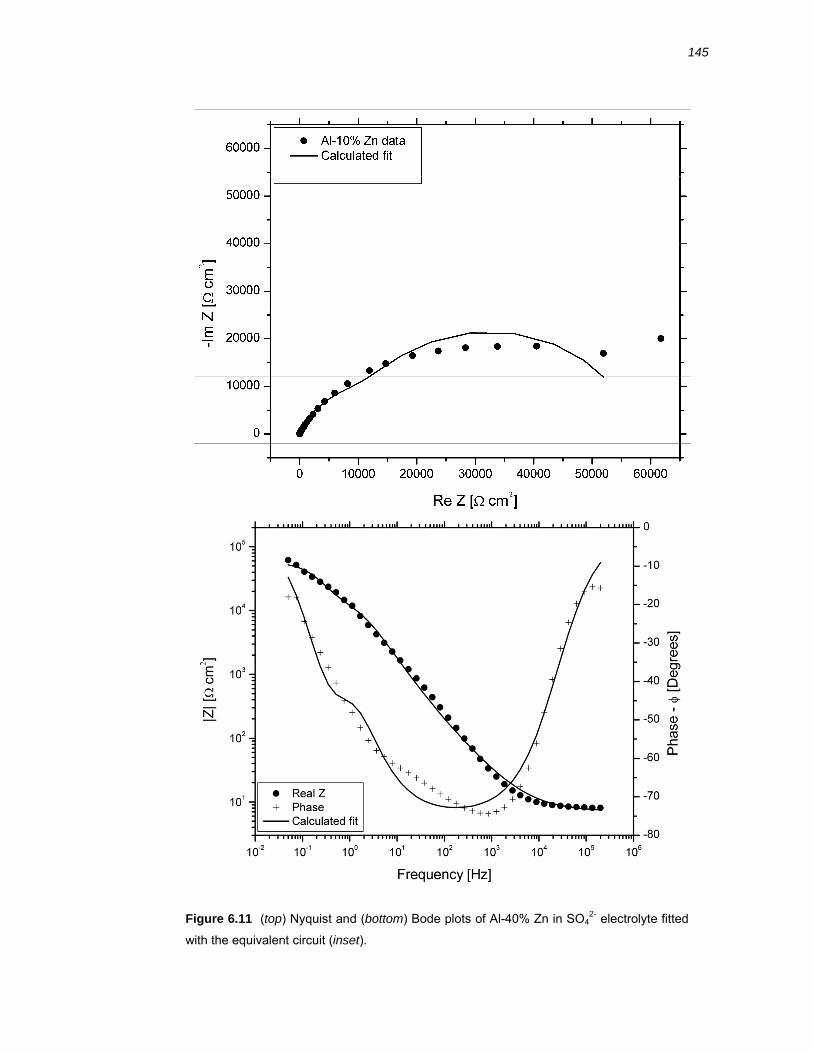
145
Figure 6.11 (top) Nyquist and (bottom) Bode plots of Al-40% Zn in SO42- electrolyte fitted
with the equivalent circuit (inset).
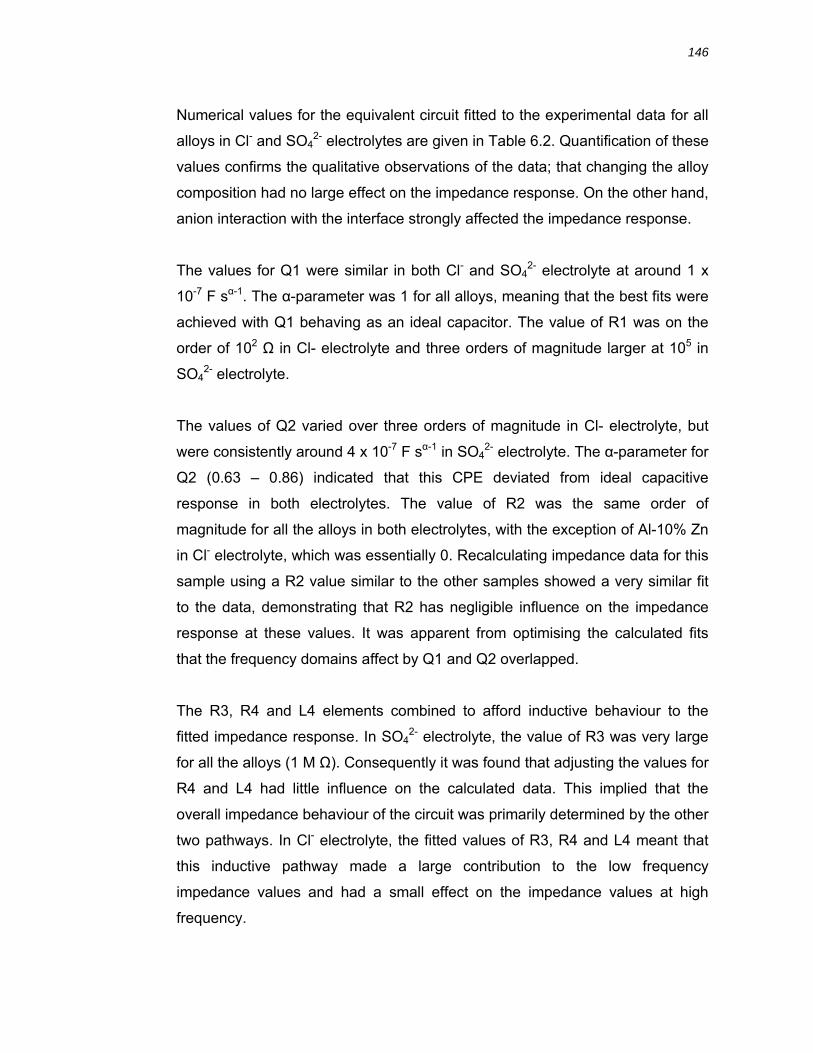
146
Numerical values for the equivalent circuit fitted to the experimental data for all
alloys in Cl- and SO42- electrolytes are given in Table 6.2. Quantification of these
values confirms the qualitative observations of the data; that changing the alloy
composition had no large effect on the impedance response. On the other hand,
anion interaction with the interface strongly affected the impedance response.
The values for Q1 were similar in both Cl- and SO42- electrolyte at around 1 x
10-7 F sα-1. The α-parameter was 1 for all alloys, meaning that the best fits were
achieved with Q1 behaving as an ideal capacitor. The value of R1 was on the
order of 102 Ω in Cl- electrolyte and three orders of magnitude larger at 105 in
SO42- electrolyte.
The values of Q2 varied over three orders of magnitude in Cl- electrolyte, but
were consistently around 4 x 10⁻⁷ F sα-1 in SO42- electrolyte. The α-parameter for
Q2 (0.63 – 0.86) indicated that this CPE deviated from ideal capacitive
response in both electrolytes. The value of R2 was the same order of
magnitude for all the alloys in both electrolytes, with the exception of Al-10% Zn
in Cl- electrolyte, which was essentially 0. Recalculating impedance data for this
sample using a R2 value similar to the other samples showed a very similar fit
to the data, demonstrating that R2 has negligible influence on the impedance
response at these values. It was apparent from optimising the calculated fits
that the frequency domains affect by Q1 and Q2 overlapped.
The R3, R4 and L4 elements combined to afford inductive behaviour to the
fitted impedance response. In SO42- electrolyte, the value of R3 was very large
for all the alloys (1 M Ω). Consequently it was found that adjusting the values for
R4 and L4 had little influence on the calculated data. This implied that the
overall impedance behaviour of the circuit was primarily determined by the other
two pathways. In Cl- electrolyte, the fitted values of R3, R4 and L4 meant that
this inductive pathway made a large contribution to the low frequency
impedance values and had a small effect on the impedance values at high
frequency.
147
Table 6.2 Values for the electrical elements of the equivalent circuit analysis fitted to the EIS
data of Al-x% Zn (x = 2, 10, 30, 40) alloys in Cl- and SO42- electrolyte.
Cl- electrolyte SO42- electrolyte
2% Zna 10% Zn 30% Zn 40% Zn 2% Zn 10% Zn 30% Zn 40% Zn
Q1 - 1.3x10⁻⁷ 1.2x10⁻⁷ 1.2x10⁻⁷ 1.4x10⁻⁷ 3.0x10⁻⁷ 1.2x10⁻⁷ 3.0x10⁻⁸
Α1 - 1 1 1 1 1 1 1
R1 - 466 342 527 573k 749k 802k 192k
Q2 - 8.9x10⁻⁹ 2.5x10⁻⁸ 2.2x10⁻⁷ 5.4x10⁻⁷ 4.2x10⁻⁷ 3.0x10⁻⁷ 4.1x10⁻⁷
Α2 - 0.85 0.77 0.63 0.77 0.83 0.83 0.86
R2 - 3.6x10⁻¹⁰ 51.1 57.6 125.3 120.9 134.5 128.0
R3 - 317 392 287 1063k 964k 3268k 386k
L4 - 18.6 229 52.8 4.0x10¹³ 1.3x10¹⁰ 1.469 11714
R4 - 167 601 360 0.020 2.6x10⁻³ 1.5x10⁻⁵ 1.8x10⁻¹⁰ a EIS data was recorded during transient dc behaviour
6.3 DISCUSSION
6.3.1 Effect of composition of solid solution Al-Zn binary alloys on the electrochemical behaviour
The XPS data shows that the Al-x% Zn alloys (x = 2, 10, 30, 40) are covered
with an aluminium rich native oxide that increased in zinc and aluminium
content and decreased oxygen content with depth. The amount of zinc at the
surface of the films was low (< 1%). The calculated Auger parameter indicated
that the chemical state of zinc throughout the oxide was metallic zinc (Zn) and
this was supported by the absence of multiple photoelectron emission lines. The
low abundance of zinc at the surface and the low amount of zinc oxide in the
film both result from the fast kinetics and thermodynamic stability aluminium
oxidation reaction in the presence of air.100 Furthermore the polarisation data on
high purity zinc and aluminium presented in Chapter 3 indicated that the oxides
on zinc do not render it passive. It is therefore likely that any zinc and zinc
148
oxides that are present dissolve preferentially to aluminium oxides in the
passive film on Al-Zn alloys upon immersion in electrolyte.
The increasing time required to sputter through the oxide films on alloys with
higher zinc content indicates that the oxide film is thicker or the sputtering is
slower on these alloys. A thicker oxide may be related to the integrity of the
aluminium rich passive film and the disruptions caused by higher zinc content. It
is plausible that these disruptions enable oxygen transport into the surface. The
depth profiles of the Al metal and Al oxide line intensities for the Al-40% Zn
alloys indicate that the population of aluminium in oxidised forms is higher
following anodic polarisation. The low abundance of Zn2+ chemical species
following polarisation suggests that ions and oxide complexes resulting from
zinc oxidation were soluble and transported from the surface.
Electrochemical polarisation of the Al-x% Zn alloys (x = 2, 10, 30, 40) shows
that the composition of zinc in the binary alloy has only subtle influence on the
polarisation behaviour. The reason for this appears to be the preferential
formation of an aluminium rich oxide on the surface of these alloys and lack of
zinc in the near surface region. The OCP transients indicate that there is trace
amounts of zinc at the surface following polishing. This is evidenced by the
more negative OCP of the alloys upon immediately immersion due to the zinc
dissolution reaction; however the potential shifts more positive as zinc dissolves
preferentially from the passive film.
Under anodic polarisation in chloride, transport of metal ions through the oxide
is more restricted on the Al-2% Zn alloy compared to the alloys with higher zinc
compositions. The apparent noise in the anodic polarisation data on the Al-2%
Zn alloy (Figure 6.1) is characteristic of local repassivation events, indicating an
enhanced passivity of the surface compared to the alloys with higher zinc
compositions.
The galvanic coupling experiments are consistent with the anodic polarisation
data in that the composition of the Al-Zn alloys had a small influence on the
alloy behaviour whereas Cl- and SO42- ions have a significant effect. The anodic
149
polarisation data shows that the Al-2% Zn alloys exhibited lower limiting anodic
current densities and a less steep Tafel slope. The trend in cell potential during
galvanic coupling demonstrates that the ability of the Al-Zn binary alloys to
protect the steel and the degree of overpotential required to do this is
dependent upon both the alloy composition as well as the Cl- content of the
electrolyte. It is postulated that this is due to penetration of the oxide film by Cl-
and solubilisation of adsorbed intermediates and products during anodic
dissolution, although the details of the anodic dissolution mechanism require
further work.
The cathodic polarisation curves on the Al-Zn alloys from 2% to 40% zinc in
both chloride and SO42- electrolytes were similar to each other, with the
exception of pH 10. The cathodic polarisation curves of the Al-x% Zn alloys (x =
2, 10, 30) at neutral and pH 4 were similar in magnitude to the Al-40% Zn alloy
and the cathodic processes are likely to be oxygen reduction close to the Ecorr
and water reduction at more negative potentials. The cathodic polarisation
curves at pH 10 show that the current is typical of activation controlled
processes for the Al-2% Zn alloy and diffusion limited processes for the Al-30%
Zn alloy. This may be explained by considering that the native oxide is soluble
at pH 10, accelerating water reduction on the aluminium rich domains and
oxygen reduction on the zinc rich domains. It is proposed that the alloys that are
low in zinc content display net activation controlled current from water reduction
on the aluminium and the higher zinc alloys display net diffusion controlled
current from oxygen reduction on the zinc.
6.3.2 EIS of anodic dissolution of Al-Zn alloys
EIS has become one of the primary tools to interrogate the mechanistic and
kinetic properties of processes occurring at the metal-oxide-electrolyte
interfaces.148 When applied to anodic dissolution processes, the most insightful
and thorough approach to interpretation of EIS data involves the process of
proposing a number of kinetic dissolution models, fitting of these to
experimental data and selecting one based on elimination. This approach has
150
been notably applied to aluminium149, iron150-153 and zinc96-97, 154-155. Most
researchers are, however, discouraged from data interpretation in this manner
due to the level of mathematics involved, the complexity of the mechanistic
pathway (even for simple reactions with few intermediates) and the time
investment required. Thorough investigations have thus focussed on metals of
homogeneous microstructures and simple electrolyte composition rather than
multiphase alloys in complex environments. Kinetic modelling of the dissolution
processes on Al-Zn alloys is beyond the scope of this PhD work; however these
references on zinc and aluminium are mentioned because of their value for
correlating features in the EIS data to mechanistic processes.
The alternative and more widely used approach to data interpretation, and the
one used in this thesis, is the fitting of equivalent circuit models to rationalise
the impedance response observed experimentally. This approach provides
quantitative values to describe the impedance behaviour and allows useful
comparisons between samples and electrolytes to be made.
6.3.3 Validation of the experimental impedance data
EIS data may only be meaningfully interpreted if the system satisfies four main
criteria. (1) Causality - the impedance response of the system arises only from
the input perturbations. (2) Linearity - the current response is linearly
proportional to the input potential perturbation. (3) Stability - the system returns
to its initial state after each perturbation. (4) Infinity - the impedance must be
finite when the frequency tends to zero.8, 156 One of the inherent problems with
applying EIS to an interface undergoing metal dissolution is that the surface is
changing over time. This makes stability a critical condition. Thus, the legitimacy
of EIS data in corrosion studies may not be intuitively obvious and needs to be
verified.
Under anodic polarisation conditions used in this work, DC current transients
were measured. As previously mentioned in section 6.2.5, the DC current
transients of all the alloys were stable, except for Al-2% Zn in Cl- electrolyte.
151
The current increased over time, meaning a larger proportion of the area was
becoming active over time, most likely due to pit initiation. This sample does not
fit the stability criteria for meaningful EIS data and accounts for the scatter in the
low frequency data on this alloy. The polarisation and galvanic couple data
shows that the Al-2% Zn alloy has the lowest anodic current due to the passive
nature of the aluminium oxide and this could account for the transient DC
response during the EIS experiments. It should be noted that the polarisation
and galvanic couple data was obtained on BME that were solid-solution alloys,
whereas the EIS on the Al-x% Zn (x = 10, 30, 40) alloys contained zinc
precipitation. The homogeneous, solid solution microstructure of the Al-2% Zn
alloys compared to the other alloys which displayed zinc rich phases may have
inhibited or changed the mechanism of the dissolution process by comparison.
Electrochemical polarisation results from Chapter 3 show that zinc precipitation
can lower the overpotential and enhance the dissolution current density,
although the size and composition of these precipitates are not comparable to
those shown in Figure 6.3 and Figure 6.4.
A second test of data integrity is to apply the Kramers-Kronig (KK) transform to
the results.157-160 This transformation involves calculating the imaginary
component of the impedance (Im(Z)) from the real component of the impedance
(Re(Z)) and comparing the result to the data. Deviation of the KK data points
from the experimental data indicates that at least one of the four
aforementioned criteria were not being met. Deviations for the EIS data in
Figure 6.7 and Figure 6.8 are reported as the average difference in Re(Z),
Im(Z), |Z| and Φ(Z) components of the data and are shown in Table 6.3.
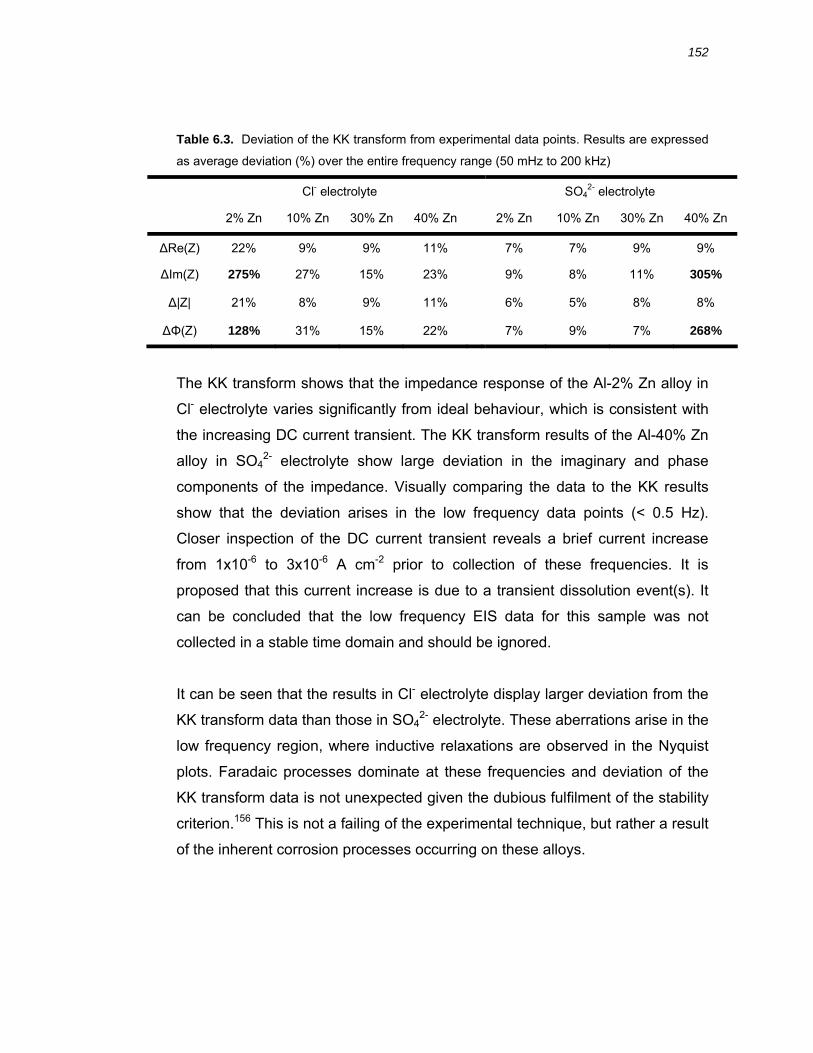
152
Table 6.3. Deviation of the KK transform from experimental data points. Results are expressed
as average deviation (%) over the entire frequency range (50 mHz to 200 kHz)
Cl- electrolyte SO42- electrolyte
2% Zn 10% Zn 30% Zn 40% Zn 2% Zn 10% Zn 30% Zn 40% Zn
ΔRe(Z) 22% 9% 9% 11% 7% 7% 9% 9%
ΔIm(Z) 275% 27% 15% 23% 9% 8% 11% 305%
Δ|Z| 21% 8% 9% 11% 6% 5% 8% 8%
ΔΦ(Z) 128% 31% 15% 22% 7% 9% 7% 268%
The KK transform shows that the impedance response of the Al-2% Zn alloy in
Cl- electrolyte varies significantly from ideal behaviour, which is consistent with
the increasing DC current transient. The KK transform results of the Al-40% Zn
alloy in SO42- electrolyte show large deviation in the imaginary and phase
components of the impedance. Visually comparing the data to the KK results
show that the deviation arises in the low frequency data points (< 0.5 Hz).
Closer inspection of the DC current transient reveals a brief current increase
from 1x10⁻⁶ to 3x10⁻⁶ A cm-2 prior to collection of these frequencies. It is
proposed that this current increase is due to a transient dissolution event(s). It
can be concluded that the low frequency EIS data for this sample was not
collected in a stable time domain and should be ignored.
It can be seen that the results in Cl- electrolyte display larger deviation from the
KK transform data than those in SO42- electrolyte. These aberrations arise in the
low frequency region, where inductive relaxations are observed in the Nyquist
plots. Faradaic processes dominate at these frequencies and deviation of the
KK transform data is not unexpected given the dubious fulfilment of the stability
criterion.156 This is not a failing of the experimental technique, but rather a result
of the inherent corrosion processes occurring on these alloys.
153
6.3.4 Selection of an equivalent circuit to interpret EIS data on Al-x% Zn alloys
A series of equivalent circuits were fitted to the EIS data on Al-x% Zn alloys in
Cl- and SO42- electrolyte. These are shown in Figure 6.12. There is no literature
precedence for the analysis of impedance data during anodic dissolution of Al-
Zn alloys, so suitable equivalent circuits from other systems are considered in
this section.
The electrochemical polarisation data on Al-x% Zn alloys in Cl- electrolyte show
that during anodic polarisation, active dissolution occurs and very high current
densities result. In SO42- electrolyte, however, the dissolution process is
hindered from the aluminium oxide passive film on the surface. The active
dissolution behaviour of the Al-x% Zn alloys in Cl- electrolyte is qualitatively
similar to the anodic behaviour of zinc, while the passive behaviour in SO42- is
like the electrochemical behaviour of high purity aluminium alloys. Thus the
equivalent circuits selected to model the dissolution behaviour of Al-x% Zn
alloys are based on those published on aluminium, zinc and aluminium-zinc
alloys.103, 147, 161-164
Equivalent circuit (1) is a simple circuit containing a resistive element R1 that
represents the electrolyte impedance, in series with a parallel capacitor/resistor
Q2/R2 that purportedly represents the oxide film and double layer capacitance
in series with the charge transfer resistance (Rp or RCT). This circuit has been
used by Martin et al. to fit the EIS data of high purity aluminium in the passive
anodic potential region in Cl- electrolyte.163 Cabot et al. have also used this
equivalent circuit to model the anodic behaviour of Al-Zn-Mg alloys with varying
secondary phase size, also in the passive anodic potential region.147 100 mV
overpotential on the Al-x% Zn alloys in SO42- represents a passive anodic
potential region, however this equivalent circuit was unsuitable, being out of
phase at low frequency (50 mHz – 1 Hz) and at high frequency (10 kHz – 100
kHz). There are clearly a number of processes in this system that cannot be
incorporated by such a simple circuit. The impedance response of equivalent
circuit (1) was also unsuited to the data from Al-x% Zn alloys in Cl- electrolyte.
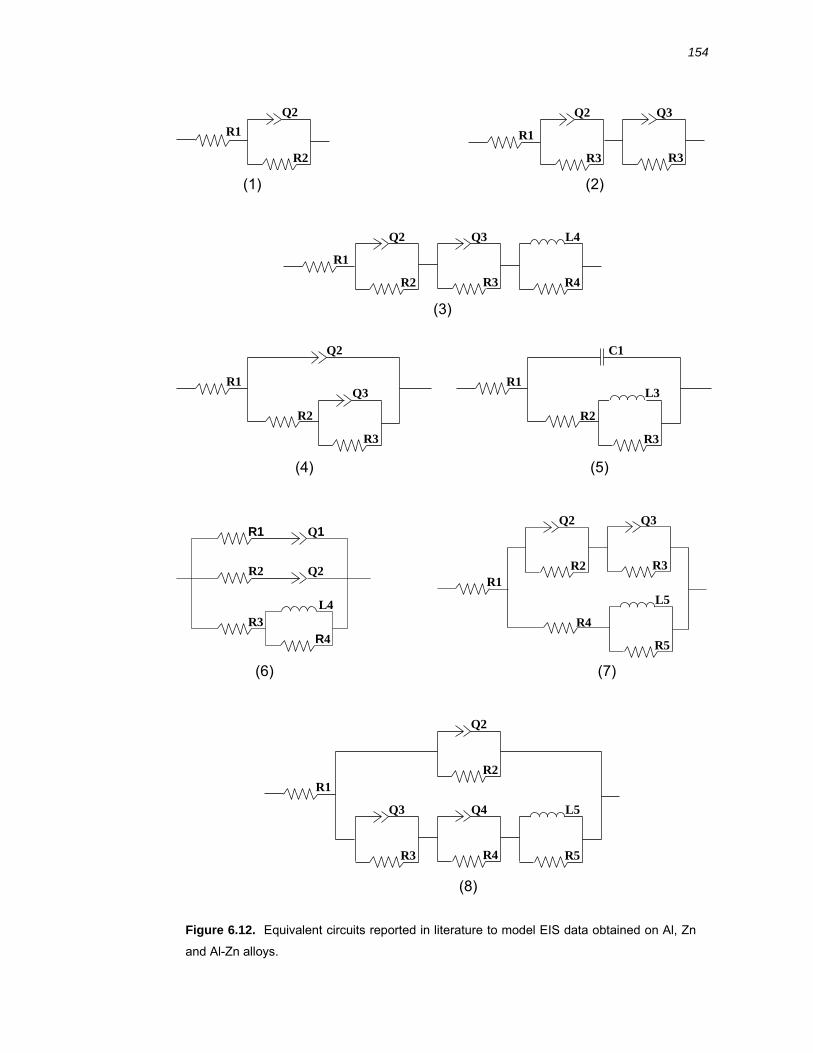
154
R1 Q2
R2
R1 Q3
R3
Q2
R2
R3 R3
R1
Q3 Q2
R1
R3
R2
L3
C1
R1
R2
R3 R4
Q1
L4
Q2
R2 R3 R4
R1
Q3 L4 Q2
R2 R3
Q3 Q2
R5
L5
R4
R1
R3 R4 R5
Q4 L5 Q3
R2
Q2
R1
(1) (2)
(3)
(8)
(6) (7)
(5) (4)
Figure 6.12. Equivalent circuits reported in literature to model EIS data obtained on Al, Zn
and Al-Zn alloys.
155
Equivalent circuit (2) is similar to circuit (1) with the addition of a parallel
capacitor/resistor pair. Equivalent circuit (2) has been proposed by a number of
authors to account for the impedance behaviour of high purity aluminium; the
two capacitive elements Q2 and Q3 representing the capacitive behaviour of
the compact anhydrous inner oxide film and the hydrated outer oxide film
separately. Lee and Pyun show that this model is useful to describe the
impedance behaviour of aluminium in the presence of chloride while in the
passive potential region.103 The circuit was unsuitable to fit the impedance data
on Al-x% Zn alloys in SO42- or Cl- electrolytes.
Equivalent circuit (3) is an extension of equivalent circuit (2) adding a parallel
inductor/resistor (L4/R4) circuit in series. The capacitors describe the passive
film and double layer capacitance respectively, while the inductor circuit has
been included to emulate the impedance response of adsorbed intermediates
during anodic metal dissolution. Circuit (3) has been successfully fitted to data
of pure zinc during anodic polarisation in carbonate electrolytes.164 In work by
different authors, this equivalent circuit corresponds to a physical model
describing a double layer capacitance and a salt layer capacitance on actively
pitting aluminium.162 The inductive elements represent the impedance response
of active pitting. The Nyquist plots of circuit (3) resemble those of the Al-x% Zn
alloys in Cl- electrolyte. However, circuit (3) did not account for an additional
capacitive time constant shown in the phase plots at high frequencies and an
inductive time constant shown in the Nyquist plots at low frequencies. A
modification of the circuit to include an extra inductive element
(Q1/R1+Q2/R2+L3/R3+L4/R4) provides a suitable fit to the data, although we
feel it is difficult to ascribe a physical process to this arbitrary modification. The
fit of this modified circuit demonstrates that there are a number of relaxations
present with different time constants during anodic dissolution. This indicates
that the passive film is unlike the simple bilayer model reported for
aluminium.163
Equivalent circuit (4) is similar to circuit (1), with the addition of a parallel
capacitor/resistor to represent an additional time constant in the oxide film. This
156
circuit has been used by Martin et al. to model the EIS behaviour of aluminium
at anodic overpotentials just prior to pitting.163 Data from this circuit resemble
the impedance data in SO42- electrolyte better than the simple model (1),
however there is deviation in the fit at both low and high frequencies. This circuit
was not suitable for the data recorded in Cl- electrolytes.
In alkaline Cl- electrolyte, Lee and Pyun’s data on anodically polarised
aluminium fitted the impedance of equivalent circuit (5).103 Cabot et al. have
used circuits (5), (6) and (7) to fit the EIS data of Al-5% Zn-1.7% Mg alloys with
different sized Zn-Mg precipitates polarised to the pitting potential region.147
Closer inspection these circuits show that (6) and (7) may reduce down to
circuit (5) during fitting. Circuit (5) was used by Cabot et al. for solid solution
alloys, circuit (7) was used when the precipitates were 0.05 µm in size and
circuit (6) when the precipitates were 0.5 µm. The Nyquist plots for all of these
alloys exhibited a capacitive semi-circle at higher frequency domain and a low
frequency inductive loop, a pattern that was qualitatively similar to the results of
Al-Zn alloys in Cl- presented in this chapter. The authors showed that
depression of the capacitive semi circle occurred when the sized of the
precipitates were increased due to overlapping time constants. The results
reported here on Al-x% Zn alloys in Cl- electrolyte also displayed depressed
capacitive semi-circles.
All three of these equivalent circuits (5, 6 and 7) were suitable to fit the
impedance data of Al-Zn alloys in both SO42- and Cl- electrolytes. Equivalent
circuit (6) provided the lowest average deviation of these three and was used to
interpret the data (section 6.3.5 ). The relationship of these three circuits to
impedance processes is discussed in the remainder of this section.
Equivalent circuit (5) in Figure 6.12 has been used to fit data from solid solution
Al-Zn-Mg alloys in neutral Cl- electrolyte and aluminium undergoing uniform
corrosion in alkaline electrolyte.103, 147 The capacitor C1 appears to represent
the film and double layer capacitance, while the inductive pathway (R2 + L3/R3)
the Faradaic dissolution process.
157
The fit of equivalent circuit (6) to EIS data of anodically polarised Al-Zn-Mg alloy
exhibiting Zn-Mg precipitates was rationalised by considering that there are
different domains on the alloys, namely the precipitated domains which are Zn
and Mg rich and the aluminium matrix which is passive. One capacitive circuit
was assigned to the native film on each of the phases, while the inductive circuit
was assigned to pit formation and Faradaic processes. The authors report that
the CPE which represented the native film on the Zn-Mg phase had a frequency
power (α-parameter value) of 0.5. A CPE with an α-parameter of 0.5 is
analogous to a Warburg element. This circuit, with different values for the
elements, was used as a fit for the Al-x% Zn alloys used in this work and is
discussed in more detail in the next section.
Equivalent circuit (7) was applied to the alloys with very small precipitates and
rationalised by a physical model such that the size of the Mg-Zn rich inclusions
do not exceed the thickness of the passive film. This film is represented by two
R/Q elements in series, the first on the Al, the second on the Zn-Mg
precipitates. The inductive pathway represents dissolution processes at defects
in the film resulting from distribution of the Zn-Mg precipitates.
Equivalent circuit (8) was used by Barbucci et al. to fit the EIS behaviour of Al-
Mg-Zn alloy undergoing anodic polarisation into the pitting region.161 Their data
displayed two depressed capacitive loops at med to high frequencies (1 Hz to
100 kHz) and an inductive loop at low frequencies (<1 Hz). The inductive loop
was ascribed by the authors to faradic pitting process, without excluding
possible contribution from surface area modulation (relaxation), salt film
modulation or adsorbed intermediates. This equivalent circuit model is
composed of two main pathways. The first (Q2/R2) describes the capacitive
behaviour of the oxide film where pitting is not occurring, denoted the free oxide
area. The second is identical to circuit (3) with three pairs of elements in series
representing capacitive and inductive response of the metal/oxide interface. In
this case, the inductive behaviour is attributed by these authors to adsorption of
oxygen anion (O2-) to the surface. This was unique, inductive behaviour is
usually ascribed to adsorbed intermediates, Cl- adsorption or pit formation. This
circuit fit offered a poor fit to the data obtained on Al-x% Zn alloys in SO42-
158
electrolyte, being out of phase and incorrect impedance and at high
frequencies.
6.3.5 Equivalent circuit (R1+Q1)/(R2+Q2)/(R3+L4/R4) used to model the EIS behaviour of anodically polarised Al-x% Zn alloys
The equivalent circuit used to model the anodic EIS behaviour of Al-x% Zn
alloys is equivalent circuit (6) in Figure 6.12 and is shown by itself in Figure 6.9.
This circuit is composed of three parallel pathways: two capacitive circuits and
an inductive one. The Q1 element of the first capacitive circuit (R1 + Q1) may
emulate the double layer and film capacitance of the aluminium oxide on matrix
of the alloys. The resistor in series reflects the polarisation resistance through
this passive film. The α-value of 1 for the constant phase element Q1 indicates
that the data is best fitted with an ideal capacitor, which is typical of the native
oxide on aluminium. A capacitor could be used in place of the CPE in the
equivalent circuit, however the CPE was retained to demonstrate that an α-
value of 1 was optimal. Given the matrix / precipitate nature of the 10%, 30%
and 40% Zn alloys, this first circuit probably reflects the behaviour of the
aluminium rich matrix. The difference in the value of the R1 resistor between the
SO42- and Cl- electrolytes may reflect the ability for Cl- to penetrate the passive
film as opposed to SO42- that adsorbs on the surface.
The second capacitive circuit (R2 + Q2) may represent capacitive processes on
the zinc rich domains/precipitates and associated charge transfer resistance.
The α-value of <1 is reflective of non-ideal capacitive behaviour, which could be
due to non-ideal dielectric behaviour and the influence of ionic and electronic
migration in the film. The significantly lower resistor value compared to R1 may
be reflective the higher rate of ion transport on the zinc rich domains compared
to the aluminium rich domains.
The inductive circuit (R3 + L4/R4) models the faradaic dissolution processes on
the alloys. Theoretical models of the impedance response on iron, zinc and
aluminium show that inductive behaviour may arise from the adsorption of
intermediates during the dissolution process as well as the marked increase in
159
active sites arising during passive film break down and pitting.73, 149-151, 163, 165 It
is difficult to unambiguously assign which of these processes is responsible for
the inductive behaviour on Al-x% Zn alloys without other evidence. In SO42-
electrolyte, the value of R3 is very large, reflecting a much slower dissolution
rate and consequently much higher impedance compared to Cl- electrolyte.
By considering the impedance response of each pathway, it can be seen that in
Cl- electrolyte all three pathways contribute to the impedance response of the
electrode. In SO42- electrolyte, the pathway representing capacitive and charge
migration on the zinc rich regions (R2 + Q2) displays lower impedance values
than the other two pathways (R2 << R1 & R3). This is consistent with the zinc
rich domains dominating overall electrode response in SO42- electrolyte.
In conclusion, this circuit in Figure 6.9 provided the best fit of the candidates
that were trialled. The structure of this circuit is consistent with a surface where
the zinc rich precipitates / domains dominate the impedance response due to
the relatively passive nature of the oxide film on the aluminium matrix in SO42-
electrolyte. In Cl- electrolyte, both the matrix and the precipitates contribute to
the impedance response due to the aggressive nature of the Cl- anion. A
pathway representing inductive behaviour demonstrates that active dissolution /
pitting dominates the impedance response at low frequencies.
6.3.6 Limitations of the (R1+Q1)/(R2+Q2)/(R3+L4/R4) equivalent circuit fit
There were some consistent variations between the calculated impedance
values from the equivalent circuit (Figure 6.9) and the experimental data. In Cl-
electrolyte, there were multiple low frequency inductive loops in Nyquist plot and
corresponding maxima in the phase plot. Multiple inductive loops are typical of
adsorbed intermediates with relaxations of different time constants and it is
plausible that such a mechanism is present here. Extra inductive circuit in series
with R3+L4/R4 could be included to simulate this. The capacitive semi-circle in
the Nyquist plots of the Al-Zn alloys in Cl- electrolyte is compressed from ideal.
This is indicative of series capacitive processes with overlapping time constants
160
and could reflect a number of processes such as a multilayer oxide structure,
establishment of a salt film or simply different oxides on the surface due to the
binary composition of the alloy. An extra capacitive circuit in parallel with R1 +
Q1 and R2+Q2 could be used to for a better fit.
The EIS data on Al-Zn alloys in SO42- electrolyte exhibit impedance values in
the low frequency domain that deviated significantly from the fitted equivalent
circuit. The phase plot also shows evidence of a number of extra processes in
the middle frequency domain (1 Hz to 1 kHz) which were not accounted for by
the equivalent circuit. Without further information on the dissolution mechanism,
it is difficult to establish the source of these.
In summary, the equivalent circuit used to fit the EIS data was rationalised
based on different capacities and time constants due to variable oxide structure
on the aluminium rich and zinc rich domains. It could be expected that then the
solid solution Al-2% Zn alloy would display distinct EIS response from the alloys
containing zinc precipitates, however this is not the case. This example reflects
the inherent limitation of the equivalent circuit approach to EIS data
interpretation: that the circuit elements are loosely assigned to physio-chemical
properties of the electrode-electrolyte interface with no reference to the
mechanism or kinetics of the dissolution process.
6.3.7 Cl- and SO42- to affect the anodic behaviour of Al-x% Zn alloys
Results in this thesis show that Cl- and SO42- have a significant influence on the
corrosion behaviour of Al-Zn alloys. The polarisation data, the galvanic couple
data and the EIS data show that metal ion transport across the interface is
impeded in SO42- electrolyte and facile in Cl- electrolyte. The XPS data reveals
the surface oxide composition following anodic polarisation in Cl- and SO42-
electrolytes is the same. The EIS data are consistent with these results;
specifically, the same equivalent circuit may be used for both electrolytes, but
the relative contribution from each pathway varies. The low frequency domain,
where pitting and Faradaic processes dominate the response, have large
161
differences in the impedance values between SO42- and Cl-. The high frequency
domain, where double layer and oxide film capacitance contribute to the
impedance response, the behaviour is similar in Cl- and SO42-. Thus the XPS
and EIS results suggest that the difference in behaviour of the Al-Zn alloys in Cl-
and SO42- electrolyte is not due to large differences in composition of the
passive film, as such, but rather a consequence of the dissolution mechanism.
The high anodic current densities, low interfacial impedance and inductive EIS
behaviour suggest that Cl- and SO42- ions may interact with the surface in a
similar way as they do to aluminium.102 It is plausible that Cl- ions penetrates
into the native oxide film, lowering impedance and facilitating charge transfer,
whereas SO42- ions adsorb on the surface and are thus unable to facilitate metal
dissolution. Work in this area is ongoing to determine the relative contribution of
zinc and aluminium to the dissolution process and eventually the kinetic details
of the dissolution mechanism. It is clear from this data that the physical and
chemical interaction of the anion needs to be considered in any mechanistic
study.
Results of galvanic coupling in mixed Cl- and SO42- electrolytes indicate that Cl-
and SO42- compete for adsorption sites on the surface. For instance, galvanic
protection of the steel is afforded by Al-2% Zn alloy in 1mm Cl- electrolyte,
however in 10 mM Cl electrolyte with 90 mM SO42- added the alloy provides
little sacrificial current. Competition between Cl- and SO42- anions has been
reported on Al-Zn-Mg alloys and although SO42- inhibits pit initiation, it has been
shown to aid pit propagation and hinder pit repassivation.166
The situation where the electrolyte conductivity limits the galvanic corrosion is
known as ohmic control.67 The galvanic couple results reported here show that
1 mM Cl- provides sufficient conductivity to support the cell, provided there is an
absence of competing ions. This occurs for a number of reasons: the separation
distance in the BME arrays small, the current is limited by diffusion at the
cathode. Most importantly, once corrosion has commenced the ion
concentration (and thus electrolyte conductivity) near the surface increases,
162
meaning that ion migration in the bulk electrolyte makes a negligible
contribution to the current.
6.3.8 A model for the electrochemical behaviour of the passive film on Al-x% Zn binary alloys
The results presented in this chapter, combined with those from the rest of this
thesis, allow the construction of a simple physio-chemical model which
accounts for the observed DC and AC electrochemical behaviour and the
compositional information of solid solution Al-Zn alloys. The model is shown
schematically in Figure 6.13.
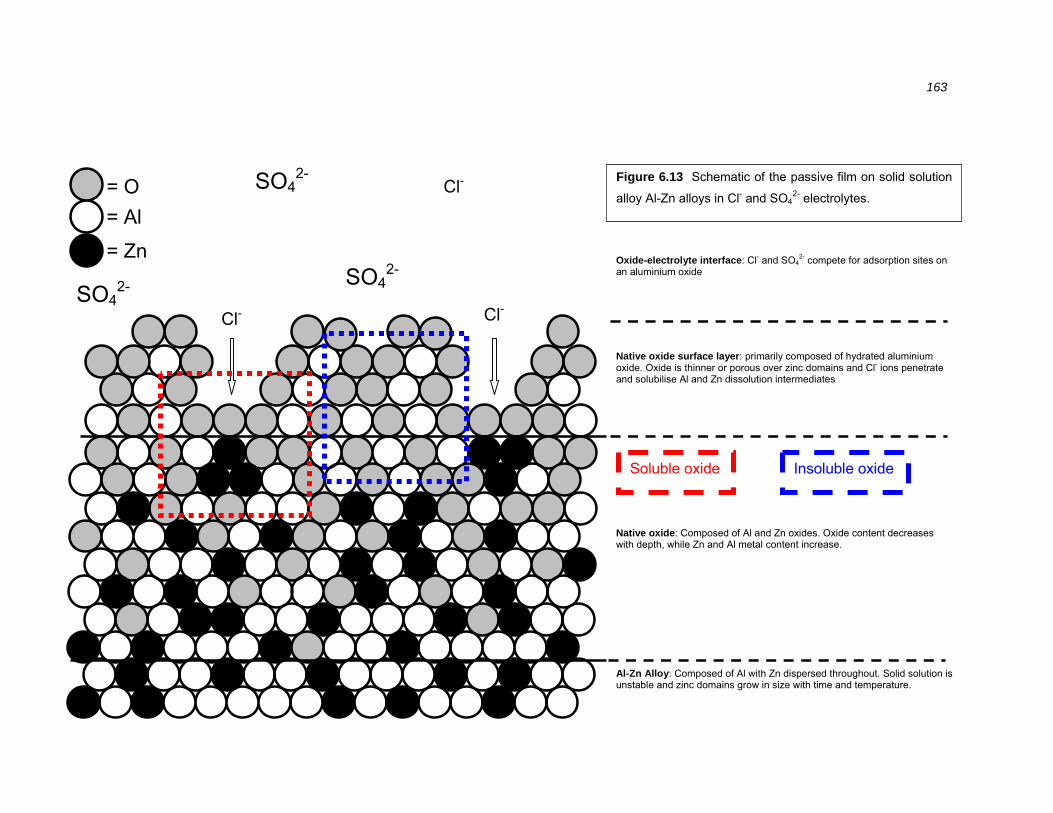
163
Figure 6.13 Schematic of the passive film on solid solution
alloy Al-Zn alloys in Cl- and SO42- electrolytes.
= O = Al
= Zn
Cl- SO4
2-
Cl-
Cl-
SO42-
SO42-
Oxide-electrolyte interface: Cl- and SO42- compete for adsorption sites on
an aluminium oxide
Native oxide surface layer: primarily composed of hydrated aluminium oxide. Oxide is thinner or porous over zinc domains and Cl- ions penetrate and solubilise Al and Zn dissolution intermediates
Native oxide: Composed of Al and Zn oxides. Oxide content decreases with depth, while Zn and Al metal content increase.
Al-Zn Alloy: Composed of Al with Zn dispersed throughout. Solid solution is unstable and zinc domains grow in size with time and temperature.
Soluble oxide Insoluble oxide
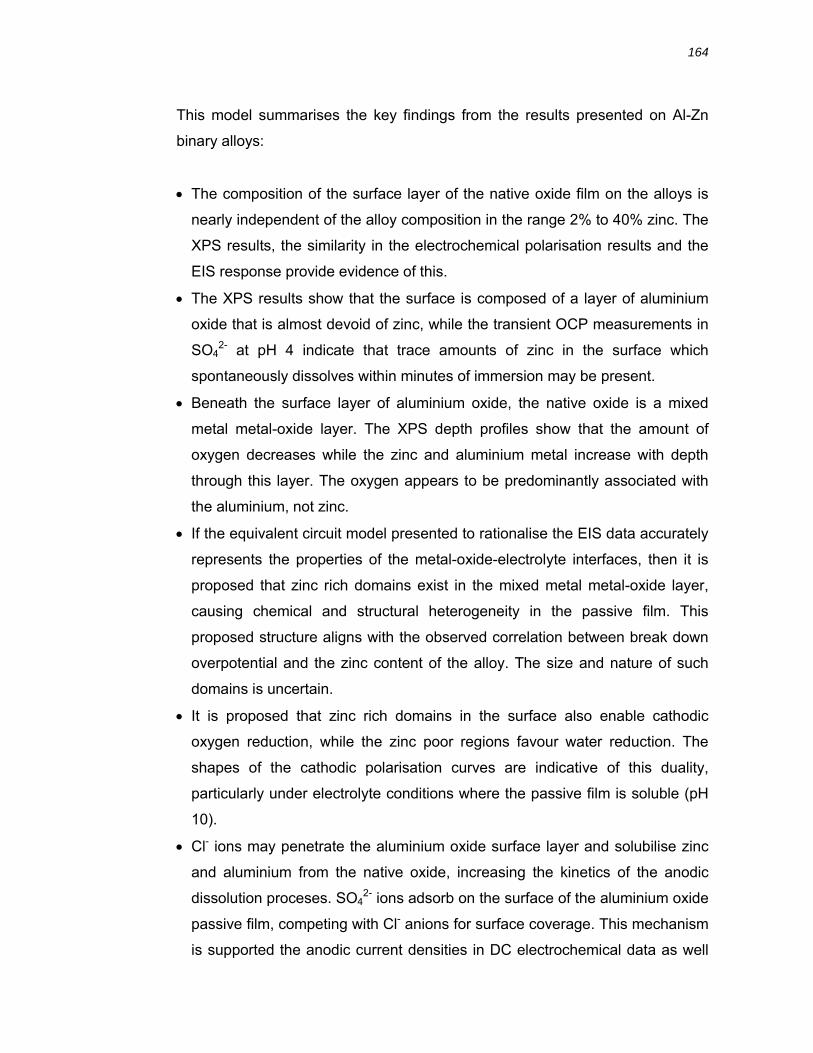
164
This model summarises the key findings from the results presented on Al-Zn
binary alloys:
• The composition of the surface layer of the native oxide film on the alloys is
nearly independent of the alloy composition in the range 2% to 40% zinc. The
XPS results, the similarity in the electrochemical polarisation results and the
EIS response provide evidence of this.
• The XPS results show that the surface is composed of a layer of aluminium
oxide that is almost devoid of zinc, while the transient OCP measurements in
SO42- at pH 4 indicate that trace amounts of zinc in the surface which
spontaneously dissolves within minutes of immersion may be present.
• Beneath the surface layer of aluminium oxide, the native oxide is a mixed
metal metal-oxide layer. The XPS depth profiles show that the amount of
oxygen decreases while the zinc and aluminium metal increase with depth
through this layer. The oxygen appears to be predominantly associated with
the aluminium, not zinc.
• If the equivalent circuit model presented to rationalise the EIS data accurately
represents the properties of the metal-oxide-electrolyte interfaces, then it is
proposed that zinc rich domains exist in the mixed metal metal-oxide layer,
causing chemical and structural heterogeneity in the passive film. This
proposed structure aligns with the observed correlation between break down
overpotential and the zinc content of the alloy. The size and nature of such
domains is uncertain.
• It is proposed that zinc rich domains in the surface also enable cathodic
oxygen reduction, while the zinc poor regions favour water reduction. The
shapes of the cathodic polarisation curves are indicative of this duality,
particularly under electrolyte conditions where the passive film is soluble (pH
10).
• Cl- ions may penetrate the aluminium oxide surface layer and solubilise zinc
and aluminium from the native oxide, increasing the kinetics of the anodic
dissolution proceses. SO42- ions adsorb on the surface of the aluminium oxide
passive film, competing with Cl- anions for surface coverage. This mechanism
is supported the anodic current densities in DC electrochemical data as well
165
as the EIS data which shows significantly lower impedance from 50 mHz to
200 Hz.
• Results in this thesis work show that pH has a strong influence on both the
cathodic and anodic behaviour of Al-Zn alloys, increasing the aluminium
dissolution rate at pH 10 and affecting the cathodic processes at all pH
values. The mechanistic connection of pH to electrochemical response is via
the chemical interaction of OH- and H+ with the native oxide film, allowing and
solid solution Al-Zn alloys to exhibit electrochemical properties of both Zn and
Al.
6.4 CONCLUSIONS
In this chapter, Al-Zn alloys were prepared with compositions ranging from 2%
to 40% Zn exhibiting solid solution microstructure to eliminate the localised
electrochemical effects arising due to zinc precipitation. An experimental regime
was undertaken with the goals of understanding the influence of composition to
affect the electrochemical behaviour Al-Zn alloys and to develop a foundation
for understanding the dissolution mechanisms in marine and industrial
electrolytes. An understanding of these dissolution mechanisms would have
wide ranging implications for modelling the corrosion behaviour of current Al-Zn
alloys, predicting the behaviour of existing and theoretical phases in Al-Zn
alloys and the design of new Al-Zn based alloys.
DC electrochemical polarisation behaviour of Al-x% Zn alloys was similar from
2% Zn through to 40% Zn composition. The apparent similarity in behaviour
arises from the surface layer of aluminium oxide which spontaneously forms
due to the fast reaction kinetics of aluminium with oxygen. Zinc and zinc oxides
which are present in this layer in trace amount spontaneous deplete during
immersion. The presence of this oxide means that the anodic dissolution
processes are strongly dependant on the nature of the anion in the electrolyte.
Cl- ions facilitate anodic dissolution, presumably by via a penetration and
solubilisation mechanism, while SO42- ions compete with Cl- for surface
adsorption, but do not penetrate the native oxide and aid metal dissolution.
166
The cathodic current densities recorded on the Al-Zn alloys were found to be
independent of the zinc content of the alloys or the anion composition of the
electrolyte. It was proposed that the facile cathodic kinetics may be a
consequence electronic conduction through the aluminium oxide layer or due to
disruption of the continuity of the aluminium oxide by zinc rich domains.
The anodic overpotential of Al-Zn alloys during galvanic coupling with steel was
dependant on the zinc content of the alloys and the chloride content of the
electrolyte. SO42- ions may inhibit galvanic protection via the aforementioned
displacement process. The magnitude of the galvanic current between steel and
Al-Zn alloys is determined by the steel and it can be concluded that
homogeneous Al-Zn alloys of 2% to 40% zinc provide galvanic protection only
in Cl- electrolytes. Results from this work reveal that size and close spacing of
the electrodes in a cut edge galvanic cell means that ohmic limitation of the
current is unlikely to occur.
The interfacial impedance during anodic polarisation is strongly affected by the
presence of Cl- and SO42- anions and unaffected by the zinc content of the
alloys. A dissolution mechanism that is developed for Al-Zn alloys must account
for the physio-chemical interaction of anions with the metal-oxide-electrolyte
interface. The dissolution mechanism is complex and involves a number of
adsorbed intermediates and EIS shows that multiple capacitive loops are
present, suggesting the oxide structure is heterogeneous, exhibiting multiple
surface relaxations with overlapping time constants.
The results in this chapter allow the presentation of a simplistic model for the
structure and electrochemical behaviour of the native oxide on Al-Zn alloys.
This model may be used to assist in the interpretation of electrochemical results
on Al-Zn alloys and discrete phases in Al-Zn alloys, however mechanistic and
kinetic details of the dissolution pathways were beyond the scope of this work.
The results presented here provide a good conceptual platform for the kinetic
investigation of the dissolution mechanisms and further investigation into the

167
importance of surface-anion interaction for the corrosion behaviour of Al-Zn
alloys.

Chapter 7 | Conclusions
168
7.1 OVERVIEW OF CONCLUSIONS
7.1.1 Electrochemical polarisation behaviour of Al-40% Zn alloys
At the start of this thesis work, the use of BME’s was chosen to allow fabrication
of arrays that reproduce the interaction of closely spaced electroactive
materials. An unforseen advantage was that the relative thinness of the foils
used to fabricate BME’s permitted rapid quenching and thus enabled the
production of homogeneous microstructures from otherwise multiphase Al-Zn
alloys. A quasi solid solution Al-40% Zn alloy was produced whose composition
and microstructure resembled that of the α-phase of the 55% Al-Zn coating.
Electrochemical polarisation experiments have shown that anodic dissolution
processes on Al-40% Zn alloys are significantly enhanced in Cl- compared to
SO42- based electrolytes. Electrolyte pH directly affected the solubility of the
native oxide and indirectly the electrochemical processes. In alkaline
electrolytes, water reduction and aluminium oxidation was enhanced whereas in
acidic electrolytes proton reduction was enhanced. Large precipitates present in
microstructure of the rolled Al-40% Zn alloy served to act as local islands of
zinc, which dominated the electrochemical polarisation response.
7.1.2 Bare corrosion behaviour of 55% Al-Zn metal coating
The bare corrosion behaviour of 55% Al-Zn coating was simulated using BME
arrays composed of Al-40% Zn alloy and Zn for the α- and β-phases
respectively. The main conclusions from this work were that the Al-40% Zn alloy
and zinc have a weak galvanic interaction and close proximity of the Al-40% Zn
alloy and zinc induces a change in the net galvanic polarity. The reasons for this
were due to the interaction of corrosion products via mass transport, but the
exact mechanism is unclear. The alkaline pH generated by the cathodic
processes on the zinc electrodes may have activated the Al-40% Zn alloy
towards anodic polarity. Alternatively the position of the zinc electrodes may
have enhanced the flux of oxygen, promoting the zinc to be cathodic.
169
Fluctuating polarity and current during galvanic interaction between zinc and Al-
40% Zn alloy were observed. This was a function of the stochastic nature of the
galvanic process and not a drawback of the experimental design. The BME
array design enabled measurement of the net galvanic current between the
electrodes. Significant current would also have passed as self corrosion of the
electrodes, which could not be measured. In future work, electrochemical noise
experiments may be a worthwhile approach to overcome this limitation.
These results imply that, in real exposure conditions, activation of the α-phase
is possible in certain environments such as alkaline pH. Furthermore, the small
galvanic interaction measured between the phases explains the preferential
attack of the β-phase that is often observed. The experiments in this thesis were
limited to corrosion initiation conditions and could readily be extended to longer
term tests to provide insight into the mechanistic behaviour at medium to long
terms.
7.1.3 Cut-edge corrosion behaviour of 55% Al-Zn metal coating
Results of the cut-edge corrosion work show that Zn2+ and Al3+ metal ions buffer
the near surface pH to acidic values. In close proximity to the steel, the resulting
low pH enhanced the hydrogen evolution reaction by over an order of
magnitude. It was shown that OH- ions generated at the steel electrode caused
the sacrificial metal coatings to exhibit a negative Ecorr. It can be concluded from
these results that electro-generated products can have a large effect on the
behaviour of neighbouring sites.
Of practical relevance was the observation that in Cl- electrolyte, both the α- and
β-phases may provide galvanic protection. In SO42- electrolyte, however, the
galvanic ability of the 55% Al-Zn coating was reliant on the zinc rich β-phase.
The cathodic processes appear to be distributed over the surface of the iron,
while the anodic processes occur in localised regions. It is plausible, but
unverified that the acidic pH resulting from anodic processes will inhibit
repassivation and sustain active pits at sites of anodic dissolution.
170
The results in this thesis show that improved galvanic protection may be
achieved in Cl- rich environments where the α-phase is activated. Furthermore,
the presence of both SO42- and Cl- results in competitive dissolution processes.
Further work investigating the competitive adsorption of species in electrolytes
where multiple active anions are present is encouraged given the results in this
thesis.
7.1.4 Composition and behaviour of the passive film on Al-Zn alloys
The chemical composition of the native oxide film was an important outcome of
the work on Al-x% Zn alloys (x = 2, 10, 30, 40). This data shows that aluminium
scavenges the oxygen in the oxide film, leaving zinc in its metallic state. Trace
amounts of zinc were present in the surface layers of the oxide, which dissolved
quickly upon immersion. These results may be extrapolated to the behaviour of
Al-Zn intermetallics and alloys of a range of compositions.
Varying the electrolyte composition showed that the galvanic ability of Al-Zn
alloys was related to both the Cl- content of the electrolyte and the Zn content of
the alloy. In the absence of any competing ions, galvanic protection was
provided by Al-Zn alloys in Cl- electrolytes of low conductivity.
The ability of Cl- and SO42- anions to influence the anodic dissolution behaviour
appeared was related to their interaction with the surface. A simplistic model
that describes the native oxide film on Al-Zn alloys and interaction of Cl- and
SO42- ions with this film was proposed. This model represents an important
platform for more detailed studies into the dissolution mechanisms of Al-Zn
alloys.

Chapter 8 | References
171
1. Puigdomenech I. HYDRA MEDUSA; Make Equilibrium Diagrams Using Sophisticated Algorithms. 17th ed: Royal Institute of Technology, Stockholm, Sweden; 2001.
2. Townsend HE. Atmospheric corrosion resistance of skyward- and
groundward-exposed surfaces of zinc- and 55% Al-Zn alloy-coated steel sheet. Corrosion 1998;54(7):561-65.
3. Moreira AR, Panossian Z, Camargo PL, Moreira MF, Silva ICd, de
Carvalho JER. Zn/55Al coating microstructure and corrosion mechanism. Corrosion Science 2006;48(3):564-76.
4. Elvins J, Spittle JA, Worsley DA. Relationship between microstructure
and corrosion resistance in Zn-Al alloy coated galvanised steels. Corrosion Engineering Science and Technology 2003;38(3):197-204.
5. Nogueira TMC, Cruz MAS, Rios PR. Influence of an annealing heat
treatment on the microstructure, ductility, and corrosion resistance of a chromated 55 wt.% Al-Zn coated steel sheet. Journal of Materials Engineering and Performance 2001;10(3):314-19.
6. Marder AR. The metallurgy of zinc-coated steel. Progress in Materials
Science 2000;45(3):191-271. 7. Aoki K. Theory of Ultramicroelectrodes. Electroanalysis 1993;5(8):627-
39. 8. Bard AJ, Faulkner LR. Electrochemical Methods. Fundamentals and
Applications. 2nd ed. Hoboken, NJ (United States): John Wiley & Sons; 2001.
9. Heinze J. Ultramicroelectrodes in Electrochemistry. Angewandte
Chemie-International Edition in English 1993;32(9):1268-88. 10. Basame SB, White HS. Scanning Electrochemical Microscopy:
Measurement of the Current Density at Microscopic Redox-Active Sites on Titanium. J. Phys. Chem. B 1998;102(49):9812-19.
11. Birbilis N, Buchheit RG. Electrochemical characteristics of intermetallic
phases in aluminum alloys - An experimental survey and discussion. Journal of the Electrochemical Society 2005;152(4):B140-B51.
12. Krawiec H, Lelito J, Tyrala E, Banas J. Relationships between
microstructure and pitting corrosion of ADI in sodium chloride solution. Journal of Solid State Electrochemistry 2009;13(6):935-42.
13. Zoski CG, Bond AM, Allinson ET, Oldham KB. How long does it take a
microelectrode to reach a voltammetric steady state? Analytical Chemistry 1990;62(1):37-45.
172
14. Kovach PM, Caudill WL, Peters DG, Wightman RM. Faradaic
electrochemistry at microcylinder, band, and tubular band electrodes. Journal of Electroanalytical Chemistry 1985;185(2):285-95.
15. Coen S, Cope DK, Tallman DE. Diffusion Current at a Band Electrode by
an Integral-Equation Method. Journal of Electroanalytical Chemistry 1986;215(1-2):29-48.
16. Aoki K. Approximate models of interdigitated array electrodes for
evaluating steady-state currents. Journal of Electroanalytical Chemistry 1990;284(1):35-42.
17. Cope DK, Scott CH, Kalapathy U, Tallman DE. Transient-Behavior at
Planar Microelectrodes - Diffusion Current at a Band Electrode by an Integral-Equation Method .2. Journal of Electroanalytical Chemistry 1990;280(1):27-35.
18. Cope DK, Tallman DE. Transient-Behavior at Planar Microelectrodes - a
Comparison of Diffusion Current at Ring, Band and Disk Electrodes. Journal of Electroanalytical Chemistry 1990;285(1-2):85-92.
19. Britz D, Poulsen K, Strutwolf J. Reference values of the diffusion-limited
chronoamperometric current at a microband electrode. Electrochimica Acta 2005;51(2):333-39.
20. Morf WE, Koudelka-Hep M, de Rooij NF. Theoretical treatment and
computer simulation of microelectrode arrays. Journal of Electroanalytical Chemistry 2006;590(1):47-56.
21. Oldham KB. Edge effects in semiinfinite diffusion. Journal of
Electroanalytical Chemistry 1981;122:1-17. 22. Bond AM. Past, Present and Future Contributions of Microelectrodes to
Analytical Studies Employing Voltammetric Detection. Analyst 1994;119(11):R1-R21.
23. Horrocks BR, Mirkin MV, Pierce DT, Bard AJ, Nagy G, Toth K. Scanning
Electrochemical Microscopy .19. Ion-Selective Potentiometric Microscopy. Analytical Chemistry 1993;65(9):1213-24.
24. Pourbaix M. Atlas of electrochemical equilibria in aqueous solutions. 2nd
English ed. Houston, Texas: National Association of Corrosion Engineers; 1974.
25. El-Giar E, Wipf DO. Microparticle-based iridium oxide
ultramicroelectrodes for pH sensing and imaging. Journal of Electroanalytical Chemistry 2007;609(2):147-54.
173
26. Boldt FM, Baltes N, Borgwarth K, Heinze J. Investigation of carboxylic-functionalized and n-alkanethiol self-assembled monolayers on gold and their application as pH-sensitive probes using scanning electrochemical microscopy. Paper presented at: Conference on Fundamentals of Electrochemical Nanotechnology; Jul 21-25, 2003; Munchen, Germany.
27. Park JO, Paik C-H, Alkire RC. Scanning Microsensors for Measurement
of Local pH Distributions at the Microscale. Journal of The Electrochemical Society 1996;143(8):L174-L76.
28. Kriksunov LB, Macdonald DD, Millett PJ. Tungsten tungsten-oxide pH
sensing electrode for high temperature aqueous environments. Journal of the Electrochemical Society 1994;141(11):3002-05.
29. Kreider KG, Tarlov MJ, Cline JP. Sputtered thin film pH electrodes of
platinum, palladium, ruthenium and iridium oxides. Sensors and Actuators B-Chemical 1995;28(3):167-72.
30. Burke LD, Mulcahy JK, Whelan DP. Preparation of an oxidized iridium
electrode and the variation of its potential with pH. Journal of Electroanalytical Chemistry 1984;163(1-2):117-28.
31. Papeschi G, Bordi S, Beni C, Ventura L. Use of an iridium electrode for
direct measurement of pH of proteins after isoelectric focussing in polyacrylamide gel. Biochimica et Biophysica Acta 1976;453(1):192-99.
32. Hitchman ML, Ramanathan S. Evaluation of iridium oxide electrodes
formed by potential cycling as pH probes. Analyst 1988;113(1):35-39. 33. Ha Y, Wang M. Capillary melt method for micro antimony oxide pH
electrode. Electroanalysis 2006;18(11):1121-25. 34. Baghdady NH, Sommer K. Improved construction of antimony
microelectrodes for measuring pH changes as the soil-root interface. Journal of Plant Nutrition 1987;10(9-16):1231-38.
35. Niedrach LW. Oxygen ion conducting ceramics - new application in high
temperature high pressure pH sensors. Science 1980;207(4436):1200-02.
36. Eftekhari A. pH sensor based on deposited film of lead oxide on
aluminum substrate electrode. Sensors and Actuators B-Chemical 2003;88(3):234-38.
37. Wang M, Yao S, Madou M. A long-term stable iridium oxide pH
electrode. Sensors and Actuators B-Chemical 2002;81(2-3):313-15. 38. Yao S, Wang M, Madou M. A pH electrode based on melt-oxidized
iridium oxide. Journal of the Electrochemical Society 2001;148(4):H29-H36.
174
39. Ardizzone S, Carugati A, Trasatti S. Properties of thermally prepared
iridium dioxide electrodes. Journal of Electroanalytical Chemistry 1981;126(1-3):287-92.
40. Augustynski J, Koudelka M, Sanchez J, Conway BE. ESCA study of the
state of iridium and oxygen in electrochemically and thermally formed iridium oxide films. Journal of Electroanalytical Chemistry 1984;160(1-2):233-48.
41. O'Hare D, Parker KH, Winlove CP. Metal-metal oxide pH sensors for
physiological application. Medical Engineering & Physics 2006;28(10):982-88.
42. Lewandowski Z, Funk T, Roe F, Little BJ. Spatial distribution of pH at
mild steel surfaces using an iridium microelectrode. Paper presented at: Symposium on Microbiologically Influenced Corrosion Testing; Nov 16-17, 1992; Miami, Fl.
43. Vanhoudt P, Lewandowski Z, Little B. Iridium Oxide pH Microelectrode.
Biotechnology and Bioengineering 1992;40(5):601-08. 44. Li JP, Du YL, Fang C. Developing an iridium oxide film modified
microelectrode for microscale measurement of pH. Electroanalysis 2007;19(5):608-11.
45. Hitchman ML, Ramanathan S. Considerations of the pH-dependence of
hydrous oxide-films formed on iridium by voltammetric cycling. Electroanalysis 1992;4(3):291-97.
46. Chrisanti S. A pH electrode based on melt-oxidized iridium oxide
(Masters Thesis) [Columbus, Ohio: The Ohio State University; 2003. 47. Huppauff M, Lengeler B. Valency and structure of iridium in anodic
iridium oxide films. Journal of the Electrochemical Society 1993;140(3):598-602.
48. Palma E, Puente JM, Morcillo M. The atmospheric corrosion mechanism
of 55%Al-Zn coating on steel. Corrosion Science 1998;40(1):61-68. 49. Huafei L, Jiashen Z, Dunyi Y. Behavior of hot-dip 55% Al-Zn alloy coating
in salt water containing hydrogen sulfide. Materials Performance 2001;40(5):32.
50. El-Mahdy GA, Nishikata A, Tsuru T. AC impedance study on corrosion of
55%Al-Zn alloy-coated steel under thin electrolyte layers. Corrosion Science 2000;42(9):1509-21.
175
51. Yadav AP, Katayama H, Noda K, Masuda H, Nishikata A, Tsuru T. Effect of Al on the galvanic ability of Zn-Al coating under thin layer of electrolyte. Electrochimica Acta 2007;52(7):2411-22.
52. McMurray HN. Localized corrosion behavior in aluminum-zinc alloy
coatings investigated using the scanning reference electrode technique. Corrosion 2001;57(4):313-22.
53. Worsley DA, McMurray HN, Sullivan JH, Williams IP. Quantitative
assessment of localized corrosion occurring on galvanized steel samples using the scanning vibrating electrode technique. Corrosion 2004;60(5):437-47.
54. Boto KG, Williams LFG. Rotating-Disk Electrode Studies of Zinc
Corrosion. Journal of Electroanalytical Chemistry 1977;77(1):1-20. 55. McMurray HN, Parry G, Jeffs BD. Corrosion resistance of Zn-Al alloy
coated steels investigated using electrochemical impedance spectroscopy. Ironmaking & Steelmaking 1998;25(3):210-15.
56. Dafydd H, Worsley DA, McMurray HN. The kinetics and mechanism of
cathodic oxygen reduction on zinc and zinc-aluminium alloy galvanized coatings. Corrosion Science 2005;47(12):3006-18.
57. Miao W, Cole IS, Neufeld AK, Furman S. Pitting corrosion of Zn and Zn-
Al coated steels in pH 2 to 12 NaCl solutions. Journal of The Electrochemical Society 2007;154(1):C7-C15.
58. Yadav AP, Nishikata A, Tsuru T. Oxygen reduction mechanism on
corroded zinc. Journal of Electroanalytical Chemistry 2005;585(1):142-49.
59. Deslouis C, Duprat M, Tulet-Tournillon C. The cathodic mass transport
process during zinc corrosion in neutral aerated sodium sulphate solutions. Journal of Electroanalytical Chemistry 1984;181(1-2):119-36.
60. Dražić DM, Popić JP. Corrosion rates and negative difference effects for
Al and some Al alloys. Journal of Applied Electrochemistry 1999;29(1):43-50.
61. Song GL, Atrens A, Wu XL, Zhang B. Corrosion behaviour of AZ21,
AZ501 and AZ91 in sodium chloride. Corrosion Science 1998;40(10):1769-91.
62. Sakairi M, Uchida Y, Kikuchi T, Takahashi H. Influence of zinc ions on
initial stage of localized corrosion of Zn and Zn-Al alloy coated steels with photon rupture method. ISIJ International 2008;48(7):988-93.
176
63. Watkins KG, Jones RD, Beahan PG. Electrochemical investigation of the corrosion rate of 55 aluminium-zinc alloy coated steel. Materials Letters 1989;8(1-2):26-30.
64. Ogle K, Baudu V, Garrigues L, Philippe X. Localized electrochemical
methods applied to cut edge corrosion. Journal of the Electrochemical Society 2000;147(10):3654-60.
65. Ogle K, Morel S, Jacquet D. Observation of self-healing functions on the
cut edge of galvanized steel using SVET and pH microscopy. Journal of the Electrochemical Society 2006;153(1):B1-B5.
66. Thebault F, Vuillemin B, Oltra R, Ogle K, Allely C. Investigation of self-
healing mechanism on galvanized steels cut edges by coupling SVET and numerical modeling. Electrochimica Acta 2008;53(16):5226-34.
67. Zhang XG. Corrosion and Electrochemistry of Zinc. 1st Ed. ed. New
York: Plenum Press; 1996. 68. Zhang XG. Galvanic corrosion of zinc and its alloys. Journal of the
Electrochemical Society 1996;143(4):1472-84. 69. Zin IM, Pokhmurskii VI, Scantlebury JD, Lyon SB. Model electrochemical
cell study of cut-edge corrosion inhibition on coil-coated steel sheet by chromate-, phosphate-, and calcium-containing pigments. Journal of the Electrochemical Society 2001;148(8):B293-B98.
70. Panossian Z, Mariaca L, Morcillo M, Flores S, Rocha J, Pena JJ, et al.
Steel cathodic protection afforded by zinc, aluminium and zinc/aluminium alloy coatings in the atmosphere. Surface & Coatings Technology 2005;190(2-3):244-48.
71. Matsumoto M, Okada N, Nishihara K, Kimoto M, Kudo T. Effect of
Environmental Cation Species on Corrosion near Shear Cut Edge of 55%Al-Zn Alloy Coated Steel Sheet. ISIJ International 2009;49(4):574-81.
72. Cachet C, Wiart R. Reaction-Mechanism for Zinc Dissolution in Chloride
Electrolytes. Journal of Electroanalytical Chemistry 1981;129(1-2):103-14.
73. Ahlberg E, Anderson H. Simulating impedance spectra from a
mechanistic point of view - Application to zinc dissolution. Acta Chemica Scandinavica 1992;46(1):15-24.
74. Bockris JO, Minevski LV. On The Mehcanism Of The Passivity Of
Aluminum And Aluminum-Alloys. Journal of Electroanalytical Chemistry 1993;349(1-2):375-414.
177
75. Yu SY, O'Grady WE, Ramaker DE, Natishan PM. Chloride ingress into aluminum prior to pitting corrosion - An investigation by XANES and XPS. Journal of The Electrochemical Society 2000;147(8):2952-58.
76. McCafferty E. Sequence of steps in the pitting of aluminum by chloride
ions. Corrosion Science 2003;45(7):1421-38. 77. Mansfeld F, Hong S. Detection of pitting with electrochemical impedance
spectroscopy. Journal of the Electrochemical Society 1988;135(5):1171-72.
78. Oltra R, Keddam M. Application of impedance technique to localized
corrosion. Corrosion Science 1988;28(1):1-&. 79. Mansfeld F, Shih H. Detection of pitting with electrochemical impedance
spectroscopy - reply. Journal of the Electrochemical Society 1990;137(1):352-52.
80. Oltra R, Keddam M. Application of EIS to localized corrosion.
Electrochimica Acta 1990;35(10):1619-29. 81. Amin MA, El-Rehim SSA, El-Sherbini EEF, Mahmoud SR, Abbas MN.
Pitting corrosion studies on Al and Al-Zn alloys in SCN- solutions. Electrochimica Acta 2009;54(18):4288-96.
82. Osorio WR, Souza MEP, Freire CM, Garcia A. The application of
electrochemical impedance spectroscopy to investigate the effect of as-cast structures on the corrosion resistance of hypereutectic Zn-Al alloys. Journal of New Materials for Electrochemical Systems 2008;11(1):37-42.
83. Osorio WR, Freire CM, Garcia A. The effect of the dendritic
microstructure on the corrosion resistance of Zn–Al alloys. Journal of Alloys and Compounds 2005;397:179-91.
84. Salinas DR, Garcia SG, Bessone JB. Influence of alloying elements and
microstructure on aluminium sacrificial anode performance: case of Al-Zn. Journal of Applied Electrochemistry 1999;29(9):1063-71.
85. Budiansky ND, Bocher F, Cong H, Hurley MF, Scully JR. Use of Coupled
Multi-Electrode Arrays to Advance the Understanding of Selected Corrosion Phenomena. Corrosion 2007;63(6):537.
86. Budiansky ND, Hudson JL, Scully JR. Origins of Persistent Interaction
among Localized Corrosion Sites on Stainless Steel. Journal of The Electrochemical Society 2004;151(4):B233-B43.
87. Scully JR, Knight TO, Buchheit RG, Peebles DE. Electrochemical
characteristics of the Al2Cu, Al3Ta and Al3Zr intermetallic phases and their relevance to the localized corrosion of Al-alloys. Corrosion Science 1993;35(1-4):185-95.
178
88. Liao CM, Wei RP. Galvanic coupling of model alloys to aluminum - a
foundation for understanding particle-induced pitting in aluminum alloys. Electrochimica Acta 1999;45(6):881-88.
89. Sawyer DT, Sobkowiak A, Roberts JL. Electrochemistry for chemists.
2nd edition ed: J. Wiley and Sons Inc; 1995. 90. Bard AJ, Mirkin MV. Scanning Electrochemical Microscopy. New York:
Marcel Dekker Inc; 2001. 91. Briggs D, Seah MP. Practical Surface Analysis. 2nd Edn ed. NJ: John
Wiley and Sons Ltd; 1992. 92. Van Gheem E, Vereecken J, Le Pen C. Influence of different anions on
the behaviour of aluminium in aqueous solutions. Journal of Applied Electrochemistry 2002;32(11):1193-200.
93. Muralidharan VS, Rajagopalan KS. Kinetics and mechanism of corrosion
of zinc in sodium-hydroxide solutions by steady-state and transient methods. Journal of Electroanalytical Chemistry 1978;94(1):21-36.
94. Wroblowa HS, Qaderi SB. The mechanism of oxygen reduction on zinc.
Journal of Electroanalytical Chemistry 1990;295(1-2):153-61. 95. Uhlig HH, Revie RW. Corrosion and Corrosion Control - An Introduction
to Corrosion Science and Engineering. 3rd Edition ed. New york: John Wiley and Sons; 1985.
96. Cachet C, Ganne F, Maurin G, Petitjean J, Vivier V, Wiart R. EIS
investigation of zinc dissolution in aerated sulfate medium. Part I: bulk zinc. Electrochimica Acta 2001;47(3):509-18.
97. Cachet C, Ganne F, Joiret S, Maurin G, Petitjean J, Vivier V, et al. EIS
investigation of zinc dissolution in aerated sulphate medium. Part II: zinc coatings. Electrochimica Acta 2002;47(21):3409-22.
98. Gouda VK, Khedr MGA, Eldin AMS. Role of anions in corrosion and
corrosion inhibition of zinc in aqueous solutions. Corrosion Science 1967;7(4):221-&.
99. Hassan HH. Perchlorate and oxygen reduction during Zn corrosion in a
neutral medium. Electrochimica Acta 2006;51(26):5966-72. 100. Gulbransen EA, Wysong WS. Thin Oxide Films on Aluminum. J. Phys.
Chem. 1947;51(5):1087-103. 101. Schmuki P. From Bacon to barriers: a review on the passivity of metals
and alloys. Journal of Solid State Electrochemistry 2002;V6(3):145-64.
179
102. Kolics A, Polkinghorne JC, Wieckowski A. Adsorption of sulfate and chloride ions on aluminum. Electrochimica Acta 1998;43(18):2605-18.
103. Lee WJ, Pyun SI. Effects of hydroxide ion addition on anodic dissolution
of pure aluminium in chloride ion-containing solution. Electrochimica Acta 1999;44(23):4041-49.
104. Suter T, Muller Y, Schmutz P, von Trzebiatowski O.
Microelectrochemical studies of pit initiation on high purity and ultra high purity aluminum. Advanced Engineering Materials 2005;7(5):339-48.
105. Moon S-M, Pyun S-I. Effects of applied anodic potential and pH on the
repassivation kinetics of pure aluminium in aqueous alkaline solution. Journal of Solid State Electrochemistry 1999;3(2):104-10.
106. Pyun SI, Moon SM. Corrosion mechanism of pure aluminium in aqueous
alkaline solution. Journal of Solid State Electrochemistry 2000;4(5):267-72.
107. Kim JD, Pyun SI. Effects of electrolyte composition and applied potential
on the repassivation kinetics of pure aluminum. Electrochimica Acta 1995;40(12):1863-69.
108. Popovic S, Grzeta B. Precipitation and dissolution phenomena in Al-Zn
alloys. Croatica Chemica Acta 1999;72(2-3):621-43. 109. Kita H. Periodic variation of exchange current density of hydrogen
electrode reaction with atomic number and reaction mechanism. Journal of the Electrochemical Society 1966;113(11):1095-&.
110. Gmytryk M, Sedzimir J. Corrosion of Zn in Deaerated Sulphate Solutions
at Different Ph Values. Corrosion Science 1967;7(10):683-&. 111. Kuhn AT, Lindley J, Bond GC, Mortimer CJ. Critical analysis of
correlations between rate of electrochemical hydrogen evolution reaction and physical properties of elements. Journal of Electroanalytical Chemistry 1972;34(1):1-14.
112. CRC Handbook of Chemistry and Physics. 90th Edition ed. Boca Raton,
FL: CRC Press; 2009-2010. 113. Sato F, Newman RC. Mechanism of activation of aluminum by low-
melting point elements: Part 2--Effect of zinc on activation of aluminum in pitting corrosion. Corrosion 1999;55(1):3.
114. Aoki K, Tokuda K, Matsuda H. Derivation of an approximate equation for
chronoamperometric curves at microband electrodes and its experimental verification. Journal of Electroanalytical Chemistry 1987;230(1-2):61-67.

180
115. Aoki K, Tokuda K, Matsuda H. Theory of chronoamperometric curves at microband electrodes. Journal of Electroanalytical Chemistry 1987;225(1-2):19-32.
116. Saito Y. A Theoretical Study on the Diffusion Current at the Stationary
Electrodes of Circular and Narrow Band Types. Review of Polarography 1968;15(6):177-87.
117. Alden JA, Booth J, Compton RG, Dryfe RAW, Sanders GHW. Diffusional
Mass-Transport to Microband Electrodes of Practical Geometries - a Simulation Study Using the Strongly Implicit Procedure. Journal of Electroanalytical Chemistry 1995;389(1-2):45-54.
118. Deakin MR, Wightman RM, Amatore CA. Electrochemical kinetics at
microelectrodes : Part II. Cyclic voltammetry at band electrodes. Journal of Electroanalytical Chemistry 1986;215(1-2):49-61.
119. Aoki K, Tanaka M. Time-dependence of diffusion-controlled currents of a
soluble redox couple at interdigitated microarray electrodes. Journal of Electroanalytical Chemistry 1989;266(1):11-20.
120. Seddon BJ, Girault HH. Interdigitated microband electrodes:
chronoamperometry and steady state currents. Journal of Electroanalytical Chemistry 1989;266:227.
121. Fosset B, Amatore C, Bartelt J, Wightman RM. Theory and experiment
for the collector-generator triple-band electrode. Anal. Chem. 1991;63(14):1403-08.
122. Arkoub IA, Amatore C, Sella C, Thouin L, Warkocz JS. Diffusion at
double microband electrodes operated within a thin film coating. Theory and experimental illustration. Journal of Physical Chemistry B 2001;105(37):8694-703.
123. Ferrigno R, Josserand J, F. Brevet P, H. Girault H. Coplanar
interdigitated band electrodes for electrosynthesis. Part 5: finite element simulation of paired reactions. Electrochimica Acta 1998;44(4):587-95.
124. Harriman K, Gavaghan DJ, Houston P, Suli E. Adaptive finite element
simulation of currents at microelectrodes to a guaranteed accuracy. An E reaction at a channel microband electrode. Electrochemistry Communications 2000;2(8):567-75.
125. Amatore C, Oleinick AI, Svir IB. Simulation of the double hemicylinder
generator-collector assembly through conformal mapping technique. Journal of Electroanalytical Chemistry 2003;553:49-61.
126. Streeter I, Fietkau N, delCampo J, Mas R, Munoz FX, Compton RG.
Voltammetry at Regular Microband Electrode Arrays: Theory and Experiment. J. Phys. Chem. C 2007;111(32):12058-66.
181
127. Szabo A, Cope DK, Tallman DE, Kovach PM, Wightman RM.
Chronoamperometric current at hemicylinder and band microelectrodes: Theory and experiment. Journal of Electroanalytical Chemistry 1987;217(2):417-23.
128. Turnbull A, Gardner MK. Electrochemical polarization studies of BS 4360
50D steel in 3.5% NaCl. Corrosion Science 1982;22(7):661-73. 129. Lowe TA, Wallace GG, Neufeld AK. Electrochemical polarisation and
galvanic couple behaviour of the primary phase of 55% Al-Zn coating investigated using band microelectrodes (BME) and band microelectrode arrays. Journal of Solid State Electrochemistry 2009;13(4):619-31.
130. Baugh LM. Corrosion and polarization characteristics of zinc in neutral--
acid media -- I. Pure zinc in solutions of various sodium salts. Electrochimica Acta 1979;24(6):657-67.
131. Friel JJ. Atmospheric corrosion products on Al, Zn and Al-Zn metallic
coatings. Corrosion 1986;42(7):422-26. 132. Hurlen T, Gunvaldsen S, Blaker F. Effects of buffers on hydrogen
evolution at iron electrodes. Electrochimica Acta 1984;29(8):1163-64. 133. Nylen L, Gustavsson J, Cornell A. Cathodic reactions on an iron RDE in
the presence of Y(III). Journal of the Electrochemical Society 2008;155(10):E136-E42.
134. Park JO, Paik CH, Huang YH, Alkire RC. Influence of Fe-rich
intermetallic inclusions on pit initiation on aluminum alloys in aerated NaCl. Journal of the Electrochemical Society 1999;146(2):517-23.
135. Tada E, Sugawara K, Kaneko H. Distribution of pH during galvanic
corrosion of a Zn/steel couple. Electrochimica Acta 2004;49(7):1019-26. 136. Peulon S, Lincot D. Mechanistic study of cathodic electrodeposition of
zinc oxide and zinc hydroxychloride films from oxygenated aqueous zinc chloride solutions. Journal of the Electrochemical Society 1998;145(3):864-74.
137. Mayne JEO. Inhibition of corrosion of iron and aluminium. British
Corrosion Journal 1996;31(3):233-34. 138. Prozorov VV, Sergienko MA, Gusarov VI, Doil'nitsyn VA, Lysenko AA,
Pavlenko VI. Peculiarities of the passivation of pearlitic steels in solutions containing aluminum ions. Protection of Metals 2003;39(5):499-501.
139. Szklarska-Smialowska Z. Pitting corrosion of aluminum. Corrosion
Science 1999;41(9):1743-67.
182
140. Boxley CJ, White HS. Relationship between Al2O3 film dissolution rate and the pitting potential of aluminum in NaCl solution. Journal of the Electrochemical Society 2004;151(5):B265-B70.
141. Zaid B, Saidi D, Benzaid A, Hadji S. Effects of pH and chloride
concentration on pitting corrosion of AA6061 aluminum alloy. Corrosion Science 2008;50(7):1841-47.
142. Gaarenstroom SW, Winograd N. Initial and final state effects in ESCA
spectra of cadmium and silver oxides. Journal of Chemical Physics 1977;67(8):3500-06.
143. Hoogewijs R, Fiermans L, Vennik J. Electronic relaxation processes in
KLL' Auger-spectra of free magnesium atom, solid magnesium and MgO. Journal of Electron Spectroscopy and related Phenomena 1977;11(2):171-83.
144. Wagner CD, Gale LH, Raymond RH. Two-dimensional chemical state
plots: a standardized data set for use in identifying chemical states by X-ray photoelectron spectroscopy. Analytical Chemistry 1979;51(4):466-82.
145. Strohmeier BR, Hercules DM. Surface spectroscopic characterization of
the interaction between zinc ions and gamma-alumina. Journal of Catalysis 1984;86(2):266-79.
146. Evans S. Energy calibration standards for X-ray photoelectron
spectrometers. Surface and Interface Analysis 1985;7(6):299-302. 147. Cabot PL, Garrido JA, Perez E, Moreira AH, Sumodjo PTA, Proud W.
EIS study of heat-treated Al-Zn-Mg alloys inb the passive and transpassive potential regions. Electrochimica Acta 1995;40(4):447-54.
148. Gabrielli C, Keddam M. Review of applications of impedance and noise
analysis to uniform and localized corrosion. Corrosion 1992;48(10):794-811.
149. Macdonald DD. Review of mechanistic analysis by electrochemical
impedance spectroscopy. Electrochimica Acta 1990;35(10):1509-25. 150. Keddam M, Mattos OR, Takenouti H. Reaction model for iron dissolution
studied by electrode impedance. 1. Experimental results and reaction model. Journal of the Electrochemical Society 1981;128(2):257-66.
151. Keddam M, Mattos OR, Takenouti H. Reaction model for iron dissolution
studied by electrode impedance. 2. Determination of the reaction model. Journal of the Electrochemical Society 1981;128(2):266-74.
152. Barcia OE, Mattos OR. Reaction model simulating the role of sulfate and
chloride in anodic-dissolution of iron. Electrochimica Acta 1990;35(10):1601-08.
183
153. Barcia OE, Mattos OR. The role of chloride and sulfate anions in the iron
dissolution mechanism studied by impedance measurements. Electrochimica Acta 1990;35(6):1003-09.
154. Cachet C, Wiart R. The Kinetics of Zinc Dissolution in Chloride
Electrolytes - Impedance Measurements and Electrode Morphology. Journal of Electroanalytical Chemistry 1980;111(2-3):235-46.
155. Gimenez-Romero D, Garcia-Jareno JJ, Vicente F. Kinetics of zinc anodic
dissolution from the EIS characteristic points. Electrochemistry Communications 2003;5(8):722-27.
156. Macdonald DD, Urquidi-Macdonald M. Application of Kramers-Kronig
Transforms in the Analysis of Electrochemical Systems. Journal of the Electrochemical Society 1985;132(10):2316-19.
157. Macdonald DD, Urquidimacdonald M, Real S. Application of Kramers-
Kronig transforms in the validation of electrochemical impedance spectroscopy. Journal of the Electrochemical Society 1987;134(8B):C419-C20.
158. Shih H, Mansfeld F. Concerning the use of the Kramers-Kronig
transforms for the validation of impedance data. Corrosion Science 1988;28(9):933-38.
159. Macdonald DD, Urquidimacdonald M. Should the Kramers-Kronig
transforms be used for the validation of experimental impedance data - comment. Corrosion 1989;45(4):327-28.
160. Shih H, Mansfeld F. Should the Kramers-Kronig transforms be used for
the validation of experimental impedance data. Corrosion 1989;45(4):325-27.
161. Barbucci A, Bruzzone G, Delucchi M, Panizza M, Cerisola G. Breakdown
of passivity of aluminium alloys by intermetallic phases in neutral chloride solution. Intermetallics 2000;8(3):305-12.
162. Bessone JB, Salinas DR, Mayer CE, Ebert M, Lorenz WJ. An EIS study
of aluminum barrier type oxide films formed in different media. Electrochimica Acta 1992;37(12):2283-90.
163. Martin FJ, Cheek GT, O'Grady WE, Natishan PM. Impedance studies of
the passive film on aluminium. Corrosion Science 2005;47(12):3187-201. 164. Rangel CM, Cruz LF. Zinc dissolution in lisbon tap water. Corrosion
Science 1992;33(9):1479-93.
184
165. Ahlberg E, Anderson H. Simulating impedance spectra from a mechanistic point of view - Theory and simulations. Acta Chemica Scandinavica 1992;46(1):1-14.
166. Moreira AH, Benedetti AV, Sumodjo PTA, Garrido JA, Cabot PL.
Electrochemical behaviour of heat-treated Al-Zn-Mg alloys in chloride solutions containing sulphate. Electrochimica Acta 2002;47(17):2823-31.